Frankfort, IL Map & Demographics
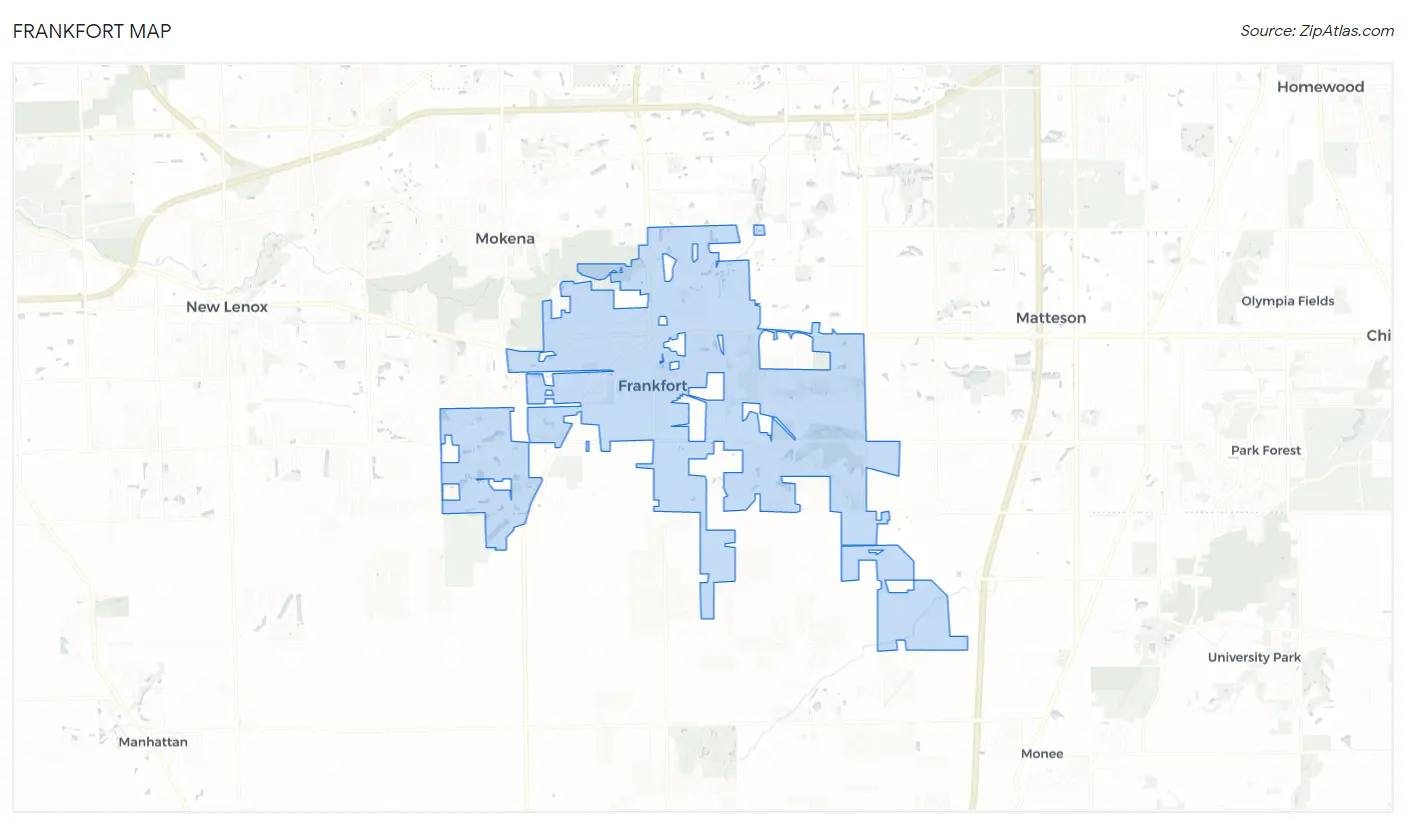
Frankfort Map
Frankfort Overview
$60,328
PER CAPITA INCOME
$174,391
AVG FAMILY INCOME
$157,615
AVG HOUSEHOLD INCOME
44.1%
WAGE / INCOME GAP [ % ]
55.9¢/ $1
WAGE / INCOME GAP [ $ ]
$9,226
FAMILY INCOME DEFICIT
0.38
INEQUALITY / GINI INDEX
20,260
TOTAL POPULATION
10,357
MALE POPULATION
9,903
FEMALE POPULATION
104.58
MALES / 100 FEMALES
95.62
FEMALES / 100 MALES
42.6
MEDIAN AGE
3.4
AVG FAMILY SIZE
3.1
AVG HOUSEHOLD SIZE
10,721
LABOR FORCE [ PEOPLE ]
69.1%
PERCENT IN LABOR FORCE
3.8%
UNEMPLOYMENT RATE
Frankfort Zip Codes
Income in Frankfort
Income Overview in Frankfort
Per Capita Income in Frankfort is $60,328, while median incomes of families and households are $174,391 and $157,615 respectively.
| Characteristic | Number | Measure |
| Per Capita Income | 20,260 | $60,328 |
| Median Family Income | 5,556 | $174,391 |
| Mean Family Income | 5,556 | $197,963 |
| Median Household Income | 6,579 | $157,615 |
| Mean Household Income | 6,579 | $181,543 |
| Income Deficit | 5,556 | $9,226 |
| Wage / Income Gap (%) | 20,260 | 44.10% |
| Wage / Income Gap ($) | 20,260 | 55.90¢ per $1 |
| Gini / Inequality Index | 20,260 | 0.38 |
Earnings by Sex in Frankfort
Average Earnings in Frankfort are $68,803, $93,886 for men and $52,481 for women, a difference of 44.1%.
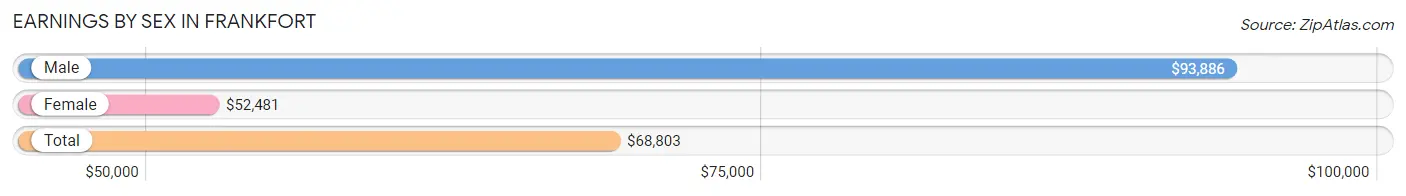
| Sex | Number | Average Earnings |
| Male | 6,217 (55.4%) | $93,886 |
| Female | 4,994 (44.6%) | $52,481 |
| Total | 11,211 (100.0%) | $68,803 |
Earnings by Sex by Income Bracket in Frankfort
The most common earnings brackets in Frankfort are $100,000+ for men (2,931 | 47.1%) and $100,000+ for women (1,196 | 23.9%).
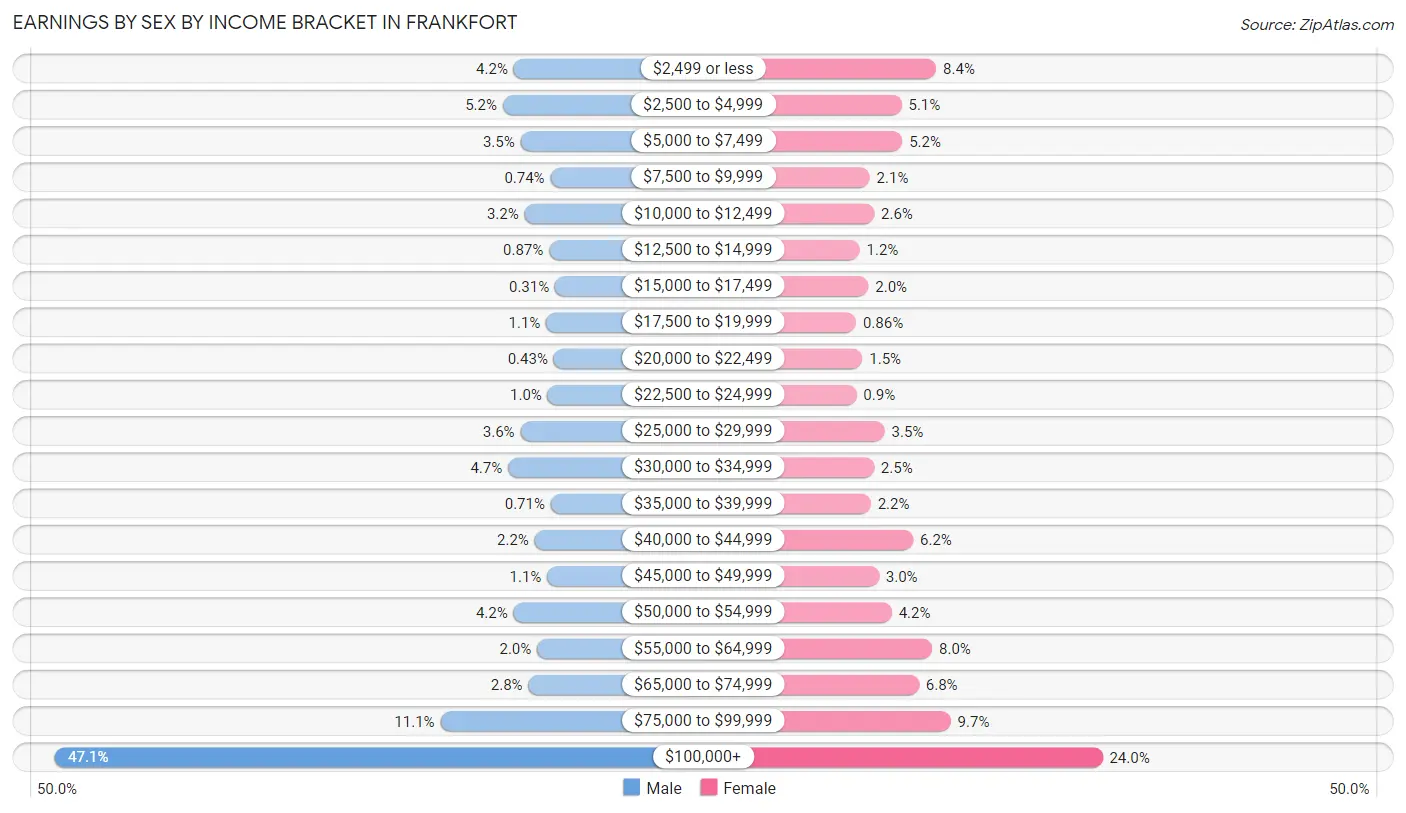
| Income | Male | Female |
| $2,499 or less | 260 (4.2%) | 418 (8.4%) |
| $2,500 to $4,999 | 323 (5.2%) | 256 (5.1%) |
| $5,000 to $7,499 | 220 (3.5%) | 259 (5.2%) |
| $7,500 to $9,999 | 46 (0.7%) | 107 (2.1%) |
| $10,000 to $12,499 | 197 (3.2%) | 128 (2.6%) |
| $12,500 to $14,999 | 54 (0.9%) | 60 (1.2%) |
| $15,000 to $17,499 | 19 (0.3%) | 101 (2.0%) |
| $17,500 to $19,999 | 71 (1.1%) | 43 (0.9%) |
| $20,000 to $22,499 | 27 (0.4%) | 73 (1.5%) |
| $22,500 to $24,999 | 62 (1.0%) | 45 (0.9%) |
| $25,000 to $29,999 | 221 (3.5%) | 177 (3.5%) |
| $30,000 to $34,999 | 293 (4.7%) | 127 (2.5%) |
| $35,000 to $39,999 | 44 (0.7%) | 112 (2.2%) |
| $40,000 to $44,999 | 138 (2.2%) | 310 (6.2%) |
| $45,000 to $49,999 | 65 (1.1%) | 150 (3.0%) |
| $50,000 to $54,999 | 261 (4.2%) | 210 (4.2%) |
| $55,000 to $64,999 | 124 (2.0%) | 399 (8.0%) |
| $65,000 to $74,999 | 174 (2.8%) | 337 (6.8%) |
| $75,000 to $99,999 | 687 (11.1%) | 486 (9.7%) |
| $100,000+ | 2,931 (47.1%) | 1,196 (23.9%) |
| Total | 6,217 (100.0%) | 4,994 (100.0%) |
Earnings by Sex by Educational Attainment in Frankfort
Average earnings in Frankfort are $107,766 for men and $61,108 for women, a difference of 43.3%. Men with an educational attainment of bachelor's degree enjoy the highest average annual earnings of $139,977, while those with high school diploma education earn the least with $42,917. Women with an educational attainment of graduate degree earn the most with the average annual earnings of $83,710, while those with college or associate's degree education have the smallest earnings of $42,647.
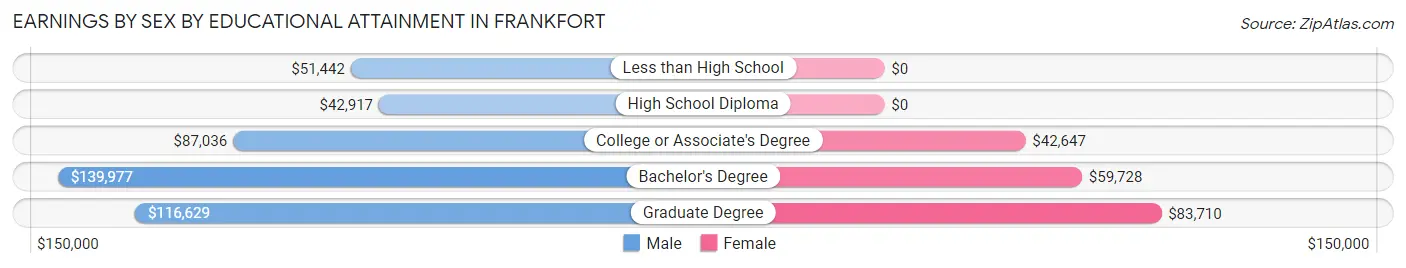
| Educational Attainment | Male Income | Female Income |
| Less than High School | $51,442 | $0 |
| High School Diploma | $42,917 | $0 |
| College or Associate's Degree | $87,036 | $42,647 |
| Bachelor's Degree | $139,977 | $59,728 |
| Graduate Degree | $116,629 | $83,710 |
| Total | $107,766 | $61,108 |
Family Income in Frankfort
Family Income Brackets in Frankfort
According to the Frankfort family income data, there are 2,195 families falling into the $200,000+ income range, which is the most common income bracket and makes up 39.5% of all families.
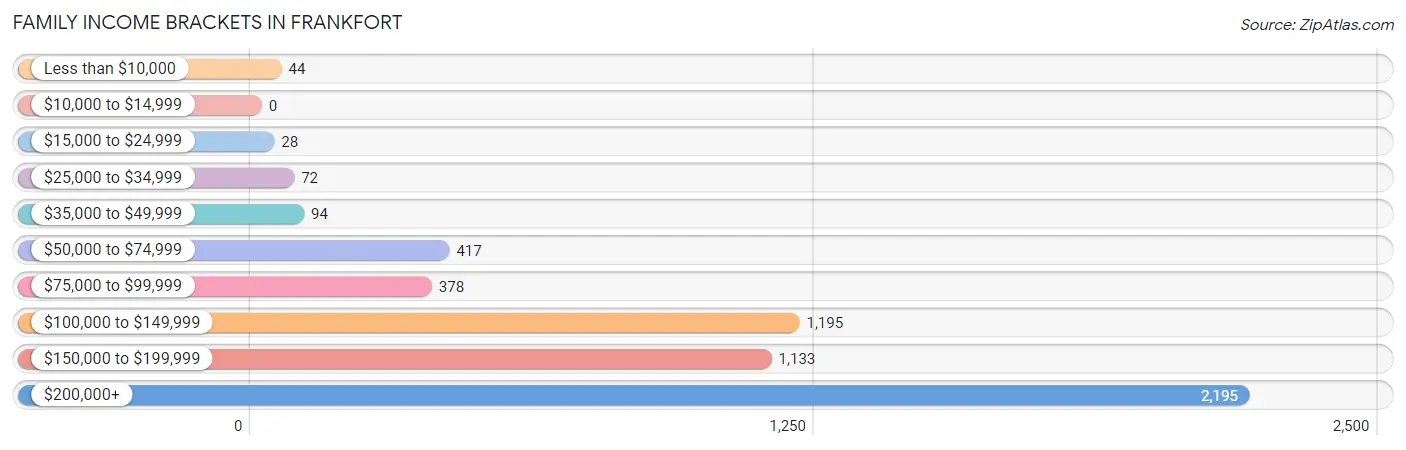
| Income Bracket | # Families | % Families |
| Less than $10,000 | 44 | 0.8% |
| $10,000 to $14,999 | 0 | 0.0% |
| $15,000 to $24,999 | 28 | 0.5% |
| $25,000 to $34,999 | 72 | 1.3% |
| $35,000 to $49,999 | 94 | 1.7% |
| $50,000 to $74,999 | 417 | 7.5% |
| $75,000 to $99,999 | 378 | 6.8% |
| $100,000 to $149,999 | 1,195 | 21.5% |
| $150,000 to $199,999 | 1,133 | 20.4% |
| $200,000+ | 2,195 | 39.5% |
Family Income by Famaliy Size in Frankfort
6-person families (106 | 1.9%) account for the highest median family income in Frankfort with $250,001 per family, while 2-person families (2,198 | 39.6%) have the highest median income of $67,204 per family member.
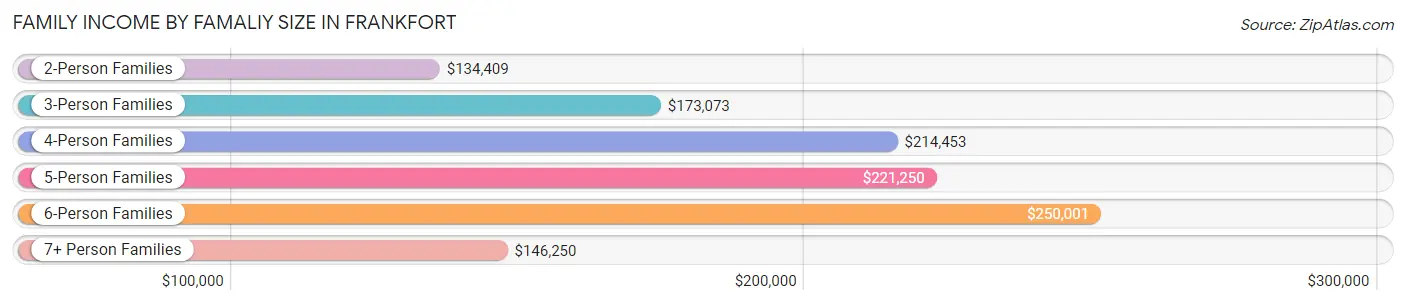
| Income Bracket | # Families | Median Income |
| 2-Person Families | 2,198 (39.6%) | $134,409 |
| 3-Person Families | 891 (16.0%) | $173,073 |
| 4-Person Families | 1,461 (26.3%) | $214,453 |
| 5-Person Families | 857 (15.4%) | $221,250 |
| 6-Person Families | 106 (1.9%) | $250,001 |
| 7+ Person Families | 43 (0.8%) | $146,250 |
| Total | 5,556 (100.0%) | $174,391 |
Family Income by Number of Earners in Frankfort
The median family income in Frankfort is $174,391, with families comprising 3+ earners (1,046) having the highest median family income of $207,076, while families with 1 earner (1,263) have the lowest median family income of $116,513, accounting for 18.8% and 22.7% of families, respectively.
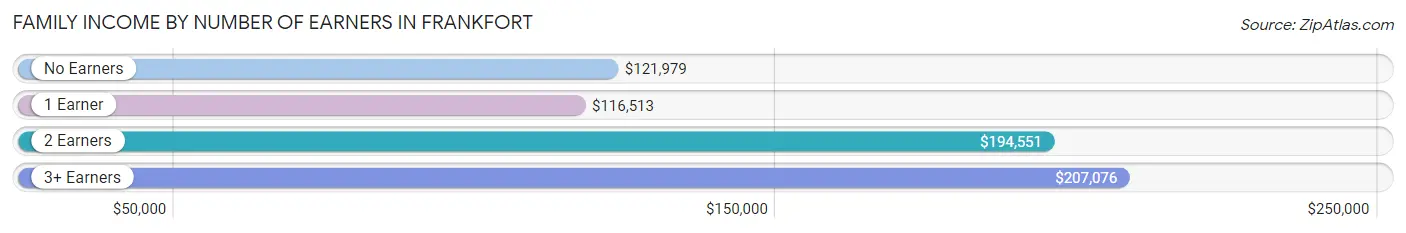
| Number of Earners | # Families | Median Income |
| No Earners | 625 (11.3%) | $121,979 |
| 1 Earner | 1,263 (22.7%) | $116,513 |
| 2 Earners | 2,622 (47.2%) | $194,551 |
| 3+ Earners | 1,046 (18.8%) | $207,076 |
| Total | 5,556 (100.0%) | $174,391 |
Household Income in Frankfort
Household Income Brackets in Frankfort
With 2,309 households falling in the category, the $200,000+ income range is the most frequent in Frankfort, accounting for 35.1% of all households. In contrast, only 53 households (0.8%) fall into the $10,000 to $14,999 income bracket, making it the least populous group.
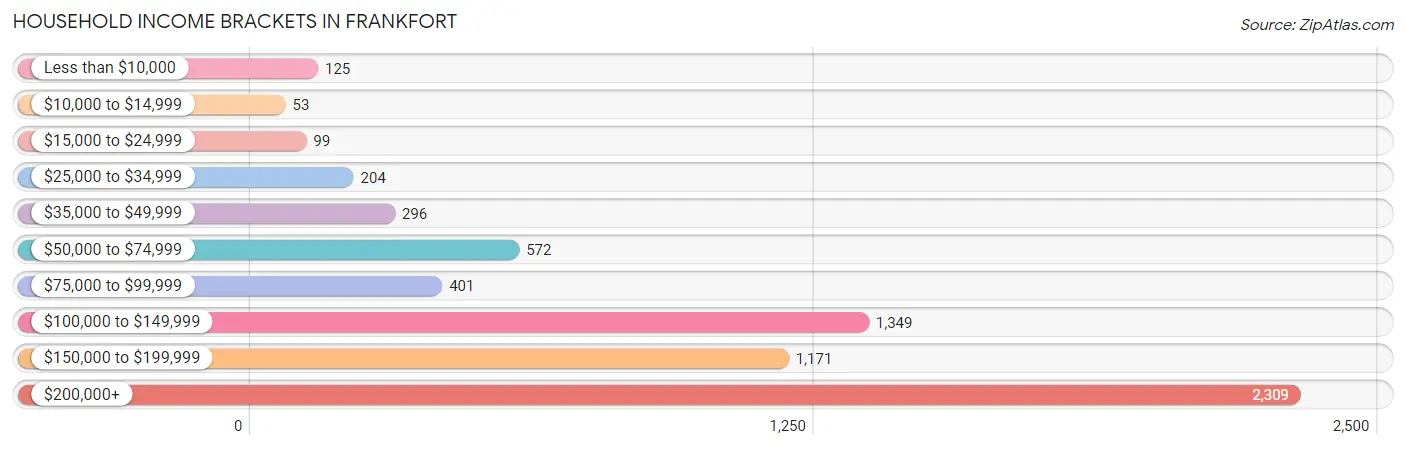
| Income Bracket | # Households | % Households |
| Less than $10,000 | 125 | 1.9% |
| $10,000 to $14,999 | 53 | 0.8% |
| $15,000 to $24,999 | 99 | 1.5% |
| $25,000 to $34,999 | 204 | 3.1% |
| $35,000 to $49,999 | 296 | 4.5% |
| $50,000 to $74,999 | 572 | 8.7% |
| $75,000 to $99,999 | 401 | 6.1% |
| $100,000 to $149,999 | 1,349 | 20.5% |
| $150,000 to $199,999 | 1,171 | 17.8% |
| $200,000+ | 2,309 | 35.1% |
Household Income by Householder Age in Frankfort
The median household income in Frankfort is $157,615, with the highest median household income of $230,120 found in the 25 to 44 years age bracket for the primary householder. A total of 1,445 households (22.0%) fall into this category. Meanwhile, the 15 to 24 years age bracket for the primary householder has the lowest median household income of $0, with 23 households (0.4%) in this group.
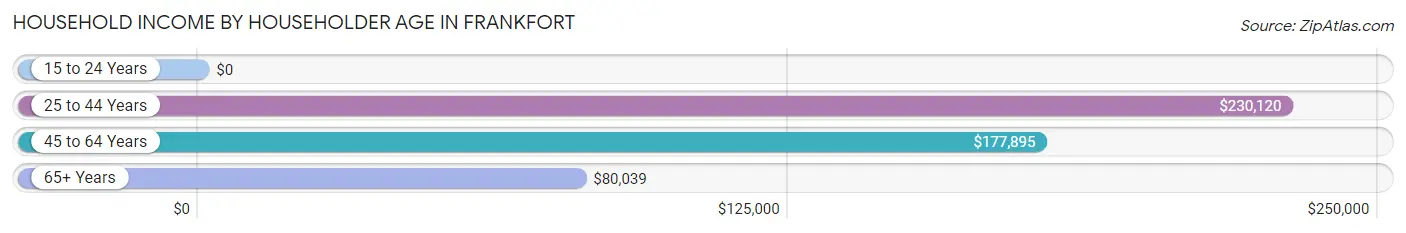
| Income Bracket | # Households | Median Income |
| 15 to 24 Years | 23 (0.4%) | $0 |
| 25 to 44 Years | 1,445 (22.0%) | $230,120 |
| 45 to 64 Years | 3,304 (50.2%) | $177,895 |
| 65+ Years | 1,807 (27.5%) | $80,039 |
| Total | 6,579 (100.0%) | $157,615 |
Poverty in Frankfort
Income Below Poverty by Sex and Age in Frankfort
With 2.0% poverty level for males and 4.1% for females among the residents of Frankfort, 6 to 11 year old males and 15 year old females are the most vulnerable to poverty, with 50 males (4.4%) and 42 females (18.2%) in their respective age groups living below the poverty level.
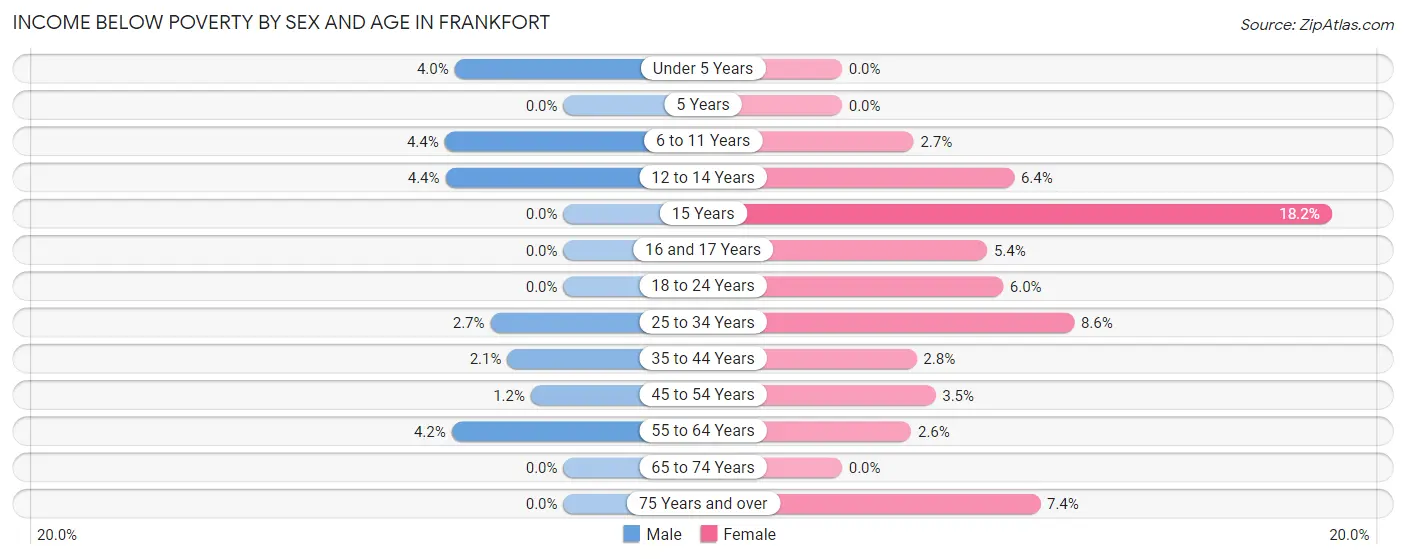
| Age Bracket | Male | Female |
| Under 5 Years | 23 (4.0%) | 0 (0.0%) |
| 5 Years | 0 (0.0%) | 0 (0.0%) |
| 6 to 11 Years | 50 (4.4%) | 21 (2.7%) |
| 12 to 14 Years | 23 (4.4%) | 40 (6.4%) |
| 15 Years | 0 (0.0%) | 42 (18.2%) |
| 16 and 17 Years | 0 (0.0%) | 27 (5.4%) |
| 18 to 24 Years | 0 (0.0%) | 38 (6.0%) |
| 25 to 34 Years | 21 (2.7%) | 55 (8.6%) |
| 35 to 44 Years | 21 (2.1%) | 32 (2.8%) |
| 45 to 54 Years | 22 (1.2%) | 62 (3.5%) |
| 55 to 64 Years | 50 (4.2%) | 38 (2.6%) |
| 65 to 74 Years | 0 (0.0%) | 0 (0.0%) |
| 75 Years and over | 0 (0.0%) | 43 (7.4%) |
| Total | 210 (2.0%) | 398 (4.1%) |
Income Above Poverty by Sex and Age in Frankfort
According to the poverty statistics in Frankfort, males aged 5 years and females aged under 5 years are the age groups that are most secure financially, with 100.0% of males and 100.0% of females in these age groups living above the poverty line.
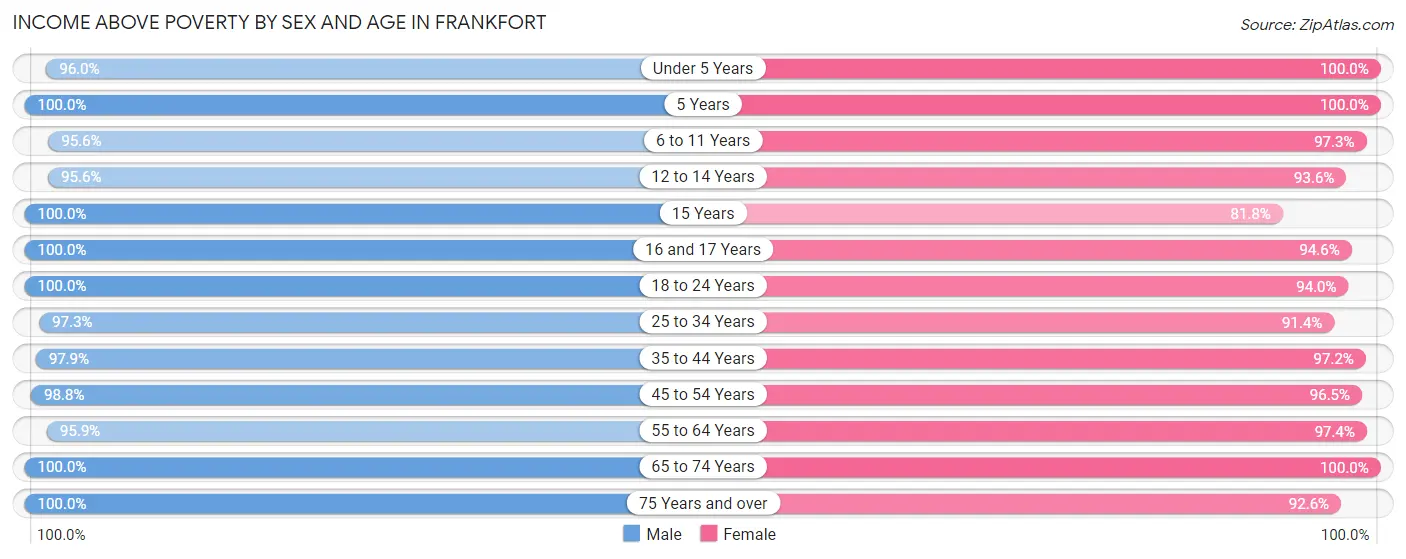
| Age Bracket | Male | Female |
| Under 5 Years | 547 (96.0%) | 394 (100.0%) |
| 5 Years | 178 (100.0%) | 119 (100.0%) |
| 6 to 11 Years | 1,083 (95.6%) | 768 (97.3%) |
| 12 to 14 Years | 502 (95.6%) | 586 (93.6%) |
| 15 Years | 170 (100.0%) | 189 (81.8%) |
| 16 and 17 Years | 493 (100.0%) | 474 (94.6%) |
| 18 to 24 Years | 691 (100.0%) | 597 (94.0%) |
| 25 to 34 Years | 753 (97.3%) | 583 (91.4%) |
| 35 to 44 Years | 991 (97.9%) | 1,123 (97.2%) |
| 45 to 54 Years | 1,799 (98.8%) | 1,723 (96.5%) |
| 55 to 64 Years | 1,155 (95.9%) | 1,438 (97.4%) |
| 65 to 74 Years | 1,129 (100.0%) | 898 (100.0%) |
| 75 Years and over | 607 (100.0%) | 541 (92.6%) |
| Total | 10,098 (98.0%) | 9,433 (96.0%) |
Income Below Poverty Among Married-Couple Families in Frankfort
The poverty statistics for married-couple families in Frankfort show that 1.3% or 63 of the total 5,021 families live below the poverty line. Families with 3 or 4 children have the highest poverty rate of 3.5%, comprising of 21 families. On the other hand, families with no children have the lowest poverty rate of 0.0%, which includes 0 families.
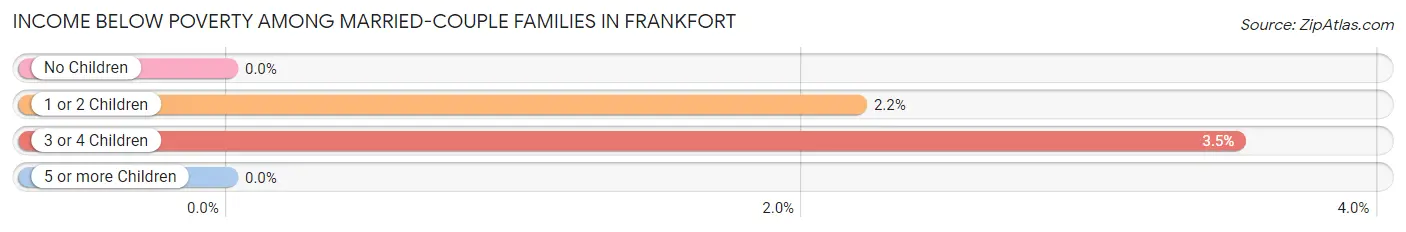
| Children | Above Poverty | Below Poverty |
| No Children | 2,495 (100.0%) | 0 (0.0%) |
| 1 or 2 Children | 1,875 (97.8%) | 42 (2.2%) |
| 3 or 4 Children | 578 (96.5%) | 21 (3.5%) |
| 5 or more Children | 10 (100.0%) | 0 (0.0%) |
| Total | 4,958 (98.8%) | 63 (1.3%) |
Income Below Poverty Among Single-Parent Households in Frankfort
| Children | Single Father | Single Mother |
| No Children | 0 (0.0%) | 0 (0.0%) |
| 1 or 2 Children | 0 (0.0%) | 49 (20.8%) |
| 3 or 4 Children | 0 (0.0%) | 0 (0.0%) |
| 5 or more Children | 0 (0.0%) | 0 (0.0%) |
| Total | 0 (0.0%) | 49 (12.4%) |
Income Below Poverty Among Married-Couple vs Single-Parent Households in Frankfort
The poverty data for Frankfort shows that 63 of the married-couple family households (1.3%) and 49 of the single-parent households (9.2%) are living below the poverty level. Within the married-couple family households, those with 3 or 4 children have the highest poverty rate, with 21 households (3.5%) falling below the poverty line. Among the single-parent households, those with 1 or 2 children have the highest poverty rate, with 49 household (16.1%) living below poverty.
| Children | Married-Couple Families | Single-Parent Households |
| No Children | 0 (0.0%) | 0 (0.0%) |
| 1 or 2 Children | 42 (2.2%) | 49 (16.1%) |
| 3 or 4 Children | 21 (3.5%) | 0 (0.0%) |
| 5 or more Children | 0 (0.0%) | 0 (0.0%) |
| Total | 63 (1.3%) | 49 (9.2%) |
Race in Frankfort
The most populous races in Frankfort are White / Caucasian (16,512 | 81.5%), Black / African American (1,971 | 9.7%), and Hispanic or Latino (1,143 | 5.6%).
| Race | # Population | % Population |
| Asian | 636 | 3.1% |
| Black / African American | 1,971 | 9.7% |
| Hawaiian / Pacific | 0 | 0.0% |
| Hispanic or Latino | 1,143 | 5.6% |
| Native / Alaskan | 0 | 0.0% |
| White / Caucasian | 16,512 | 81.5% |
| Two or more Races | 1,005 | 5.0% |
| Some other Race | 136 | 0.7% |
| Total | 20,260 | 100.0% |
Ancestry in Frankfort
The most populous ancestries reported in Frankfort are German (4,415 | 21.8%), Irish (4,144 | 20.4%), Italian (2,547 | 12.6%), Polish (2,489 | 12.3%), and English (1,433 | 7.1%), together accounting for 74.2% of all Frankfort residents.
| Ancestry | # Population | % Population |
| African | 370 | 1.8% |
| American | 726 | 3.6% |
| Arab | 156 | 0.8% |
| Australian | 11 | 0.1% |
| Austrian | 89 | 0.4% |
| Brazilian | 58 | 0.3% |
| British | 102 | 0.5% |
| Bulgarian | 105 | 0.5% |
| Burmese | 77 | 0.4% |
| Canadian | 82 | 0.4% |
| Chilean | 44 | 0.2% |
| Colombian | 52 | 0.3% |
| Croatian | 122 | 0.6% |
| Czech | 230 | 1.1% |
| Czechoslovakian | 42 | 0.2% |
| Danish | 139 | 0.7% |
| Dutch | 581 | 2.9% |
| English | 1,433 | 7.1% |
| European | 107 | 0.5% |
| French | 246 | 1.2% |
| French Canadian | 31 | 0.2% |
| German | 4,415 | 21.8% |
| Greek | 199 | 1.0% |
| Haitian | 62 | 0.3% |
| Hungarian | 630 | 3.1% |
| Indian (Asian) | 75 | 0.4% |
| Irish | 4,144 | 20.4% |
| Italian | 2,547 | 12.6% |
| Korean | 334 | 1.7% |
| Latvian | 94 | 0.5% |
| Lebanese | 45 | 0.2% |
| Lithuanian | 438 | 2.2% |
| Luxembourger | 46 | 0.2% |
| Macedonian | 122 | 0.6% |
| Mexican | 934 | 4.6% |
| Nigerian | 83 | 0.4% |
| Northern European | 26 | 0.1% |
| Norwegian | 253 | 1.3% |
| Pakistani | 20 | 0.1% |
| Palestinian | 59 | 0.3% |
| Polish | 2,489 | 12.3% |
| Puerto Rican | 113 | 0.6% |
| Romanian | 86 | 0.4% |
| Russian | 105 | 0.5% |
| Scandinavian | 11 | 0.1% |
| Scotch-Irish | 130 | 0.6% |
| Scottish | 374 | 1.8% |
| Serbian | 62 | 0.3% |
| Slavic | 9 | 0.0% |
| Slovak | 189 | 0.9% |
| Slovene | 83 | 0.4% |
| South American | 96 | 0.5% |
| Subsaharan African | 453 | 2.2% |
| Swedish | 307 | 1.5% |
| Swiss | 73 | 0.4% |
| Thai | 213 | 1.1% |
| Trinidadian and Tobagonian | 49 | 0.2% |
| Ukrainian | 39 | 0.2% |
| Welsh | 26 | 0.1% | View All 59 Rows |
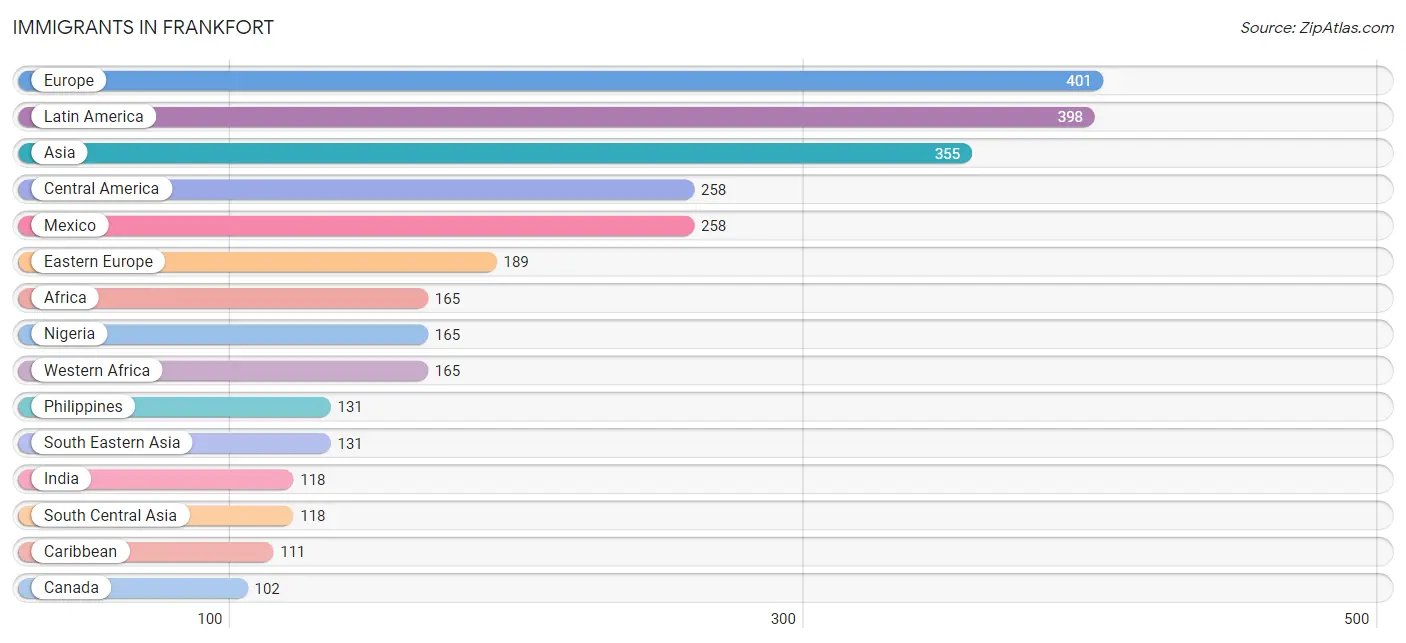
Immigrants in Frankfort
The most numerous immigrant groups reported in Frankfort came from Europe (401 | 2.0%), Latin America (398 | 2.0%), Asia (355 | 1.8%), Central America (258 | 1.3%), and Mexico (258 | 1.3%), together accounting for 8.2% of all Frankfort residents.
| Immigration Origin | # Population | % Population |
| Africa | 165 | 0.8% |
| Asia | 355 | 1.8% |
| Australia | 11 | 0.1% |
| Bulgaria | 66 | 0.3% |
| Canada | 102 | 0.5% |
| Caribbean | 111 | 0.5% |
| Central America | 258 | 1.3% |
| Chile | 9 | 0.0% |
| China | 30 | 0.2% |
| Colombia | 20 | 0.1% |
| Eastern Asia | 86 | 0.4% |
| Eastern Europe | 189 | 0.9% |
| Europe | 401 | 2.0% |
| Germany | 26 | 0.1% |
| Greece | 22 | 0.1% |
| Haiti | 62 | 0.3% |
| Hungary | 21 | 0.1% |
| India | 118 | 0.6% |
| Ireland | 79 | 0.4% |
| Italy | 55 | 0.3% |
| Korea | 56 | 0.3% |
| Latin America | 398 | 2.0% |
| Lithuania | 23 | 0.1% |
| Mexico | 258 | 1.3% |
| Netherlands | 7 | 0.0% |
| Nigeria | 165 | 0.8% |
| Northern Europe | 102 | 0.5% |
| Oceania | 11 | 0.1% |
| Philippines | 131 | 0.6% |
| Poland | 79 | 0.4% |
| South America | 29 | 0.1% |
| South Central Asia | 118 | 0.6% |
| South Eastern Asia | 131 | 0.6% |
| Southern Europe | 77 | 0.4% |
| Trinidad and Tobago | 49 | 0.2% |
| Western Africa | 165 | 0.8% |
| Western Europe | 33 | 0.2% | View All 37 Rows |
Sex and Age in Frankfort
Sex and Age in Frankfort
The most populous age groups in Frankfort are 50 to 54 Years (963 | 9.3%) for men and 50 to 54 Years (1,025 | 10.3%) for women.
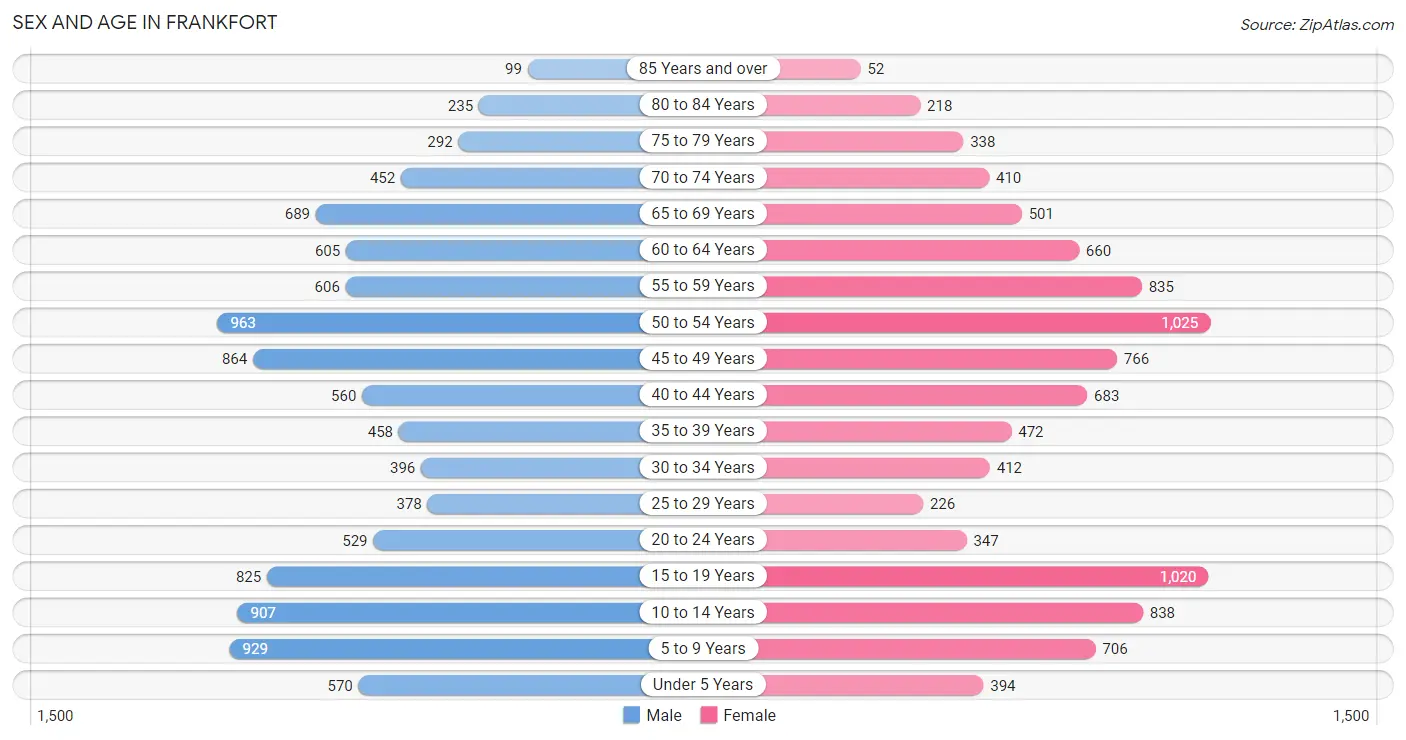
| Age Bracket | Male | Female |
| Under 5 Years | 570 (5.5%) | 394 (4.0%) |
| 5 to 9 Years | 929 (9.0%) | 706 (7.1%) |
| 10 to 14 Years | 907 (8.8%) | 838 (8.5%) |
| 15 to 19 Years | 825 (8.0%) | 1,020 (10.3%) |
| 20 to 24 Years | 529 (5.1%) | 347 (3.5%) |
| 25 to 29 Years | 378 (3.6%) | 226 (2.3%) |
| 30 to 34 Years | 396 (3.8%) | 412 (4.2%) |
| 35 to 39 Years | 458 (4.4%) | 472 (4.8%) |
| 40 to 44 Years | 560 (5.4%) | 683 (6.9%) |
| 45 to 49 Years | 864 (8.3%) | 766 (7.7%) |
| 50 to 54 Years | 963 (9.3%) | 1,025 (10.3%) |
| 55 to 59 Years | 606 (5.9%) | 835 (8.4%) |
| 60 to 64 Years | 605 (5.8%) | 660 (6.7%) |
| 65 to 69 Years | 689 (6.7%) | 501 (5.1%) |
| 70 to 74 Years | 452 (4.4%) | 410 (4.1%) |
| 75 to 79 Years | 292 (2.8%) | 338 (3.4%) |
| 80 to 84 Years | 235 (2.3%) | 218 (2.2%) |
| 85 Years and over | 99 (1.0%) | 52 (0.5%) |
| Total | 10,357 (100.0%) | 9,903 (100.0%) |
Families and Households in Frankfort
Median Family Size in Frankfort
The median family size in Frankfort is 3.39 persons per family, with married-couple families (5,021 | 90.4%) accounting for the largest median family size of 3.45 persons per family. On the other hand, single female/mother families (395 | 7.1%) represent the smallest median family size with 2.72 persons per family.
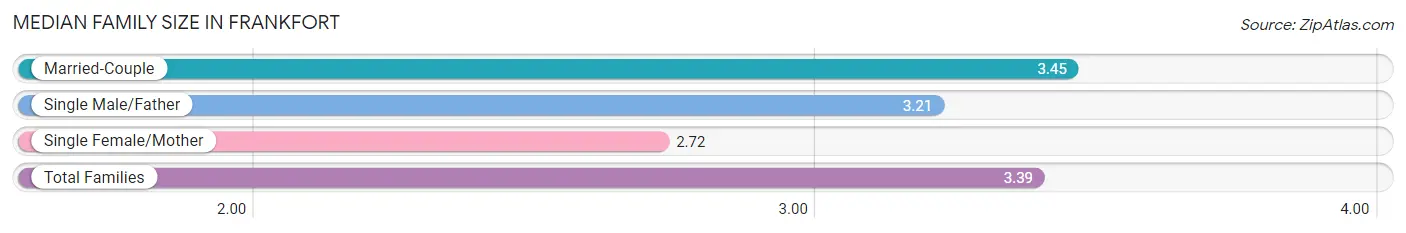
| Family Type | # Families | Family Size |
| Married-Couple | 5,021 (90.4%) | 3.45 |
| Single Male/Father | 140 (2.5%) | 3.21 |
| Single Female/Mother | 395 (7.1%) | 2.72 |
| Total Families | 5,556 (100.0%) | 3.39 |
Median Household Size in Frankfort
The median household size in Frankfort is 3.06 persons per household, with single male/father households (140 | 2.1%) accounting for the largest median household size of 3.8 persons per household. non-family households (1,023 | 15.5%) represent the smallest median household size with 1.08 persons per household.
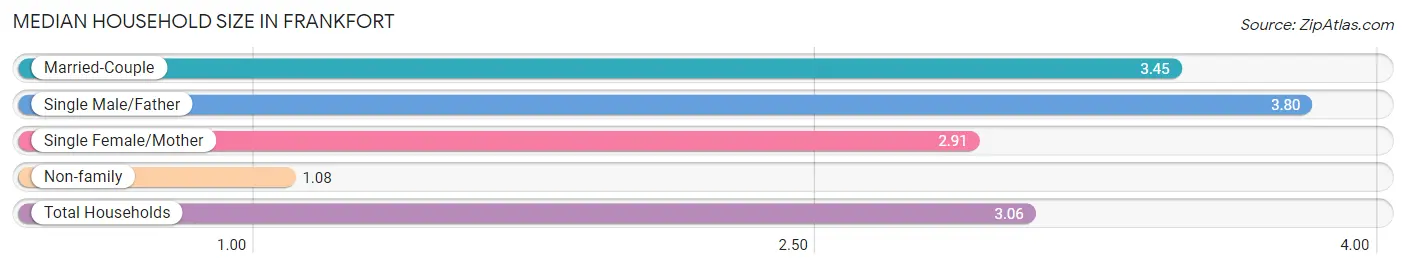
| Household Type | # Households | Household Size |
| Married-Couple | 5,021 (76.3%) | 3.45 |
| Single Male/Father | 140 (2.1%) | 3.80 |
| Single Female/Mother | 395 (6.0%) | 2.91 |
| Non-family | 1,023 (15.5%) | 1.08 |
| Total Households | 6,579 (100.0%) | 3.06 |
Household Size by Marriage Status in Frankfort
Out of a total of 6,579 households in Frankfort, 5,556 (84.5%) are family households, while 1,023 (15.5%) are nonfamily households. The most numerous type of family households are 2-person households, comprising 2,120, and the most common type of nonfamily households are 1-person households, comprising 961.
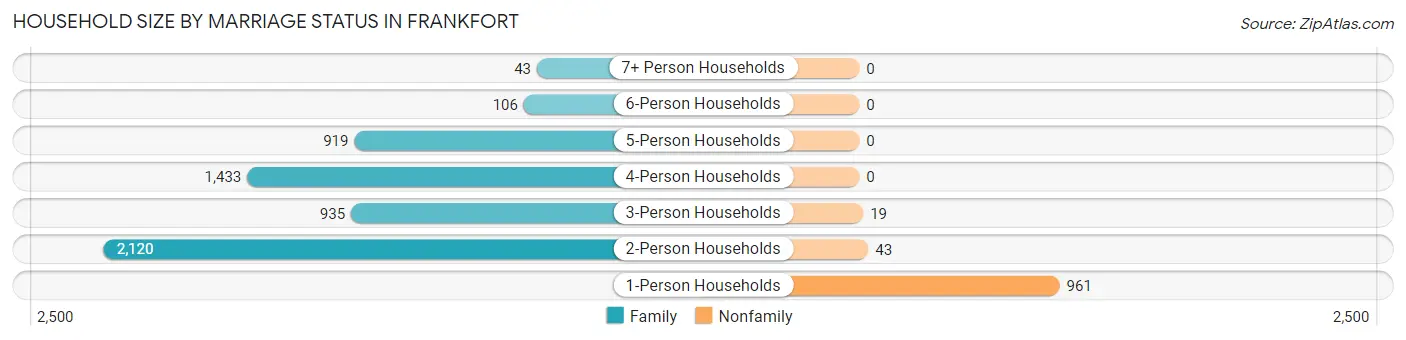
| Household Size | Family Households | Nonfamily Households |
| 1-Person Households | - | 961 (14.6%) |
| 2-Person Households | 2,120 (32.2%) | 43 (0.6%) |
| 3-Person Households | 935 (14.2%) | 19 (0.3%) |
| 4-Person Households | 1,433 (21.8%) | 0 (0.0%) |
| 5-Person Households | 919 (14.0%) | 0 (0.0%) |
| 6-Person Households | 106 (1.6%) | 0 (0.0%) |
| 7+ Person Households | 43 (0.6%) | 0 (0.0%) |
| Total | 5,556 (84.5%) | 1,023 (15.5%) |
Female Fertility in Frankfort
Fertility by Age in Frankfort
Average fertility rate in Frankfort is 48.0 births per 1,000 women. Women in the age bracket of 20 to 34 years have the highest fertility rate with 101.0 births per 1,000 women. Women in the age bracket of 35 to 50 years acount for 51.5% of all women with births.
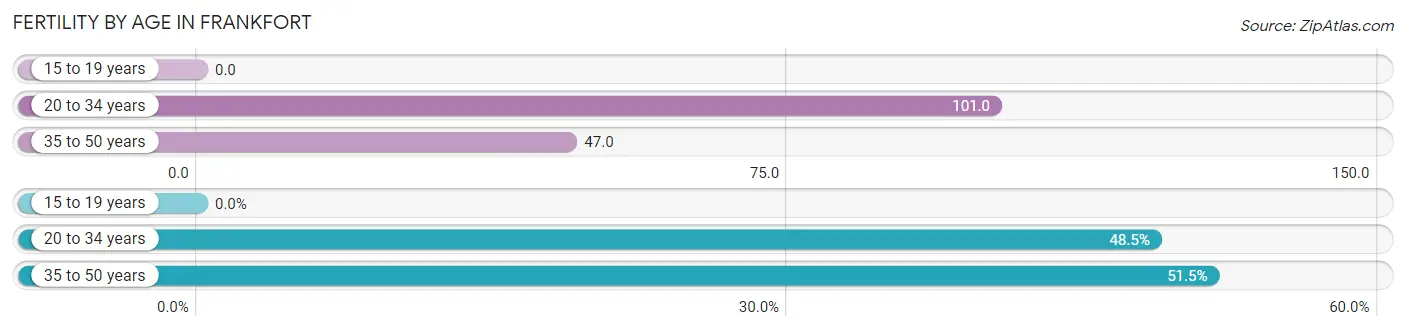
| Age Bracket | Women with Births | Births / 1,000 Women |
| 15 to 19 years | 0 (0.0%) | 0.0 |
| 20 to 34 years | 99 (48.5%) | 101.0 |
| 35 to 50 years | 105 (51.5%) | 47.0 |
| Total | 204 (100.0%) | 48.0 |
Fertility by Age by Marriage Status in Frankfort
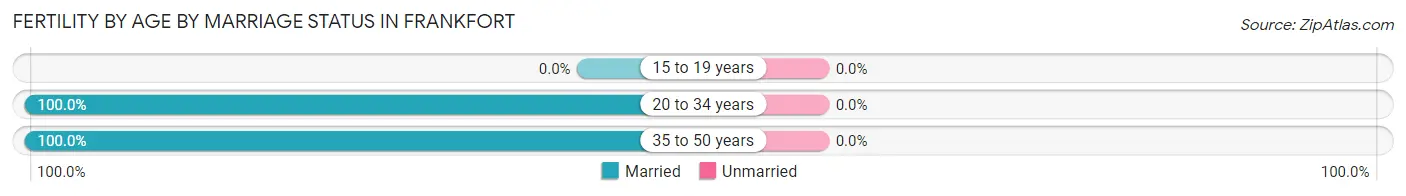
| Age Bracket | Married | Unmarried |
| 15 to 19 years | 0 (0.0%) | 0 (0.0%) |
| 20 to 34 years | 99 (100.0%) | 0 (0.0%) |
| 35 to 50 years | 105 (100.0%) | 0 (0.0%) |
| Total | 204 (100.0%) | 0 (0.0%) |
Fertility by Education in Frankfort
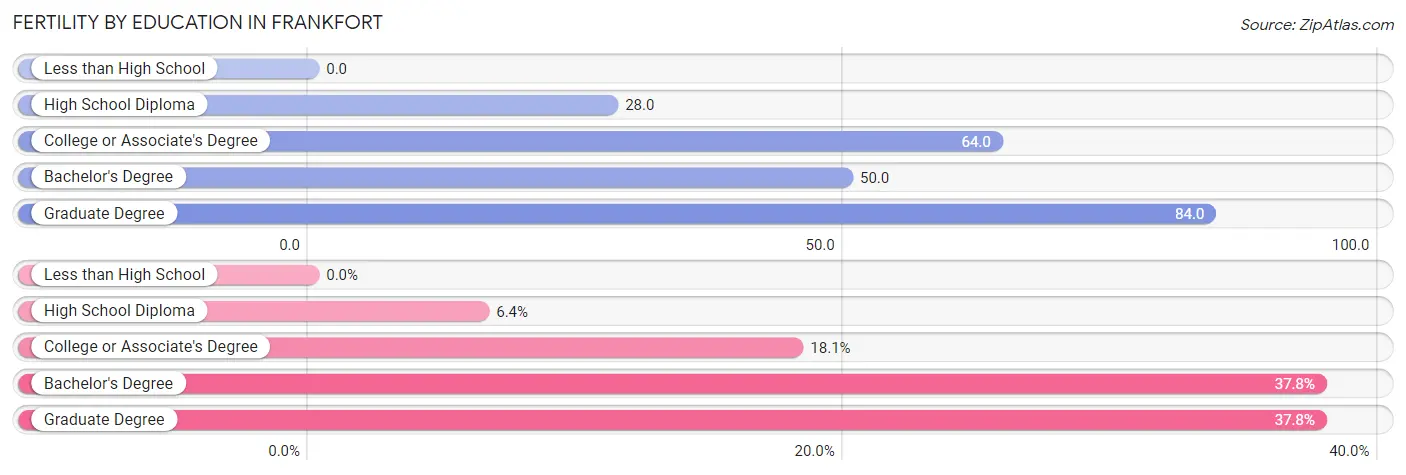
| Educational Attainment | Women with Births | Births / 1,000 Women |
| Less than High School | 0 (0.0%) | 0.0 |
| High School Diploma | 13 (6.4%) | 28.0 |
| College or Associate's Degree | 37 (18.1%) | 64.0 |
| Bachelor's Degree | 77 (37.8%) | 50.0 |
| Graduate Degree | 77 (37.8%) | 84.0 |
| Total | 204 (100.0%) | 48.0 |
Fertility by Education by Marriage Status in Frankfort
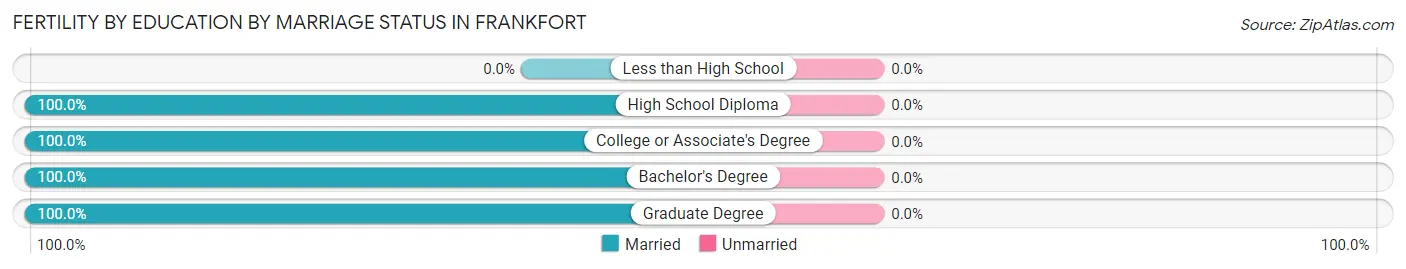
| Educational Attainment | Married | Unmarried |
| Less than High School | 0 (0.0%) | 0 (0.0%) |
| High School Diploma | 13 (100.0%) | 0 (0.0%) |
| College or Associate's Degree | 37 (100.0%) | 0 (0.0%) |
| Bachelor's Degree | 77 (100.0%) | 0 (0.0%) |
| Graduate Degree | 77 (100.0%) | 0 (0.0%) |
| Total | 204 (100.0%) | 0 (0.0%) |
Employment Characteristics in Frankfort
Employment by Class of Employer in Frankfort
Among the 9,993 employed individuals in Frankfort, private company employees (6,258 | 62.6%), self-employed (incorporated) (1,047 | 10.5%), and local government employees (880 | 8.8%) make up the most common classes of employment.
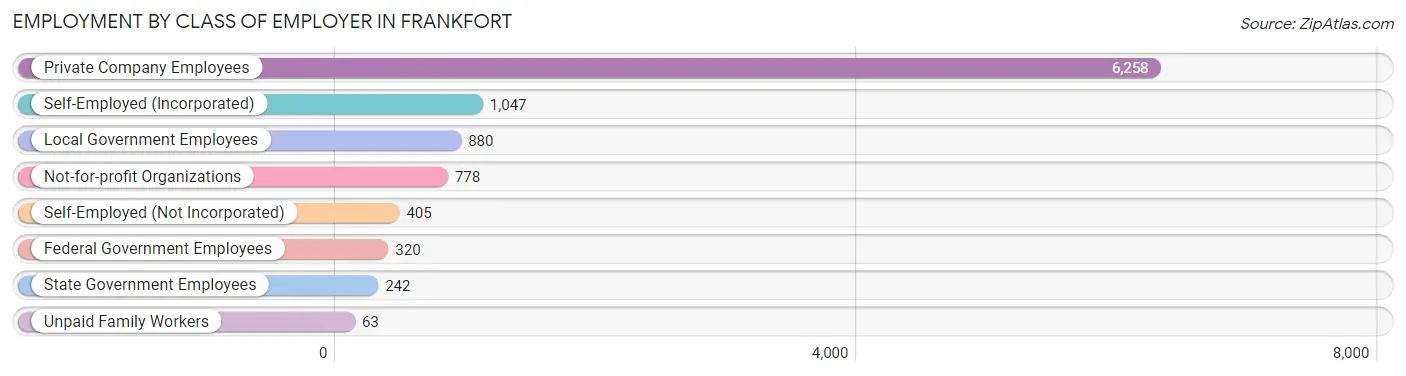
| Employer Class | # Employees | % Employees |
| Private Company Employees | 6,258 | 62.6% |
| Self-Employed (Incorporated) | 1,047 | 10.5% |
| Self-Employed (Not Incorporated) | 405 | 4.1% |
| Not-for-profit Organizations | 778 | 7.8% |
| Local Government Employees | 880 | 8.8% |
| State Government Employees | 242 | 2.4% |
| Federal Government Employees | 320 | 3.2% |
| Unpaid Family Workers | 63 | 0.6% |
| Total | 9,993 | 100.0% |
Employment Status by Age in Frankfort
According to the labor force statistics for Frankfort, out of the total population over 16 years of age (15,515), 69.1% or 10,721 individuals are in the labor force, with 3.8% or 407 of them unemployed. The age group with the highest labor force participation rate is 35 to 44 years, with 90.9% or 1,975 individuals in the labor force. Within the labor force, the 16 to 19 years age range has the highest percentage of unemployed individuals, with 21.2% or 181 of them being unemployed.
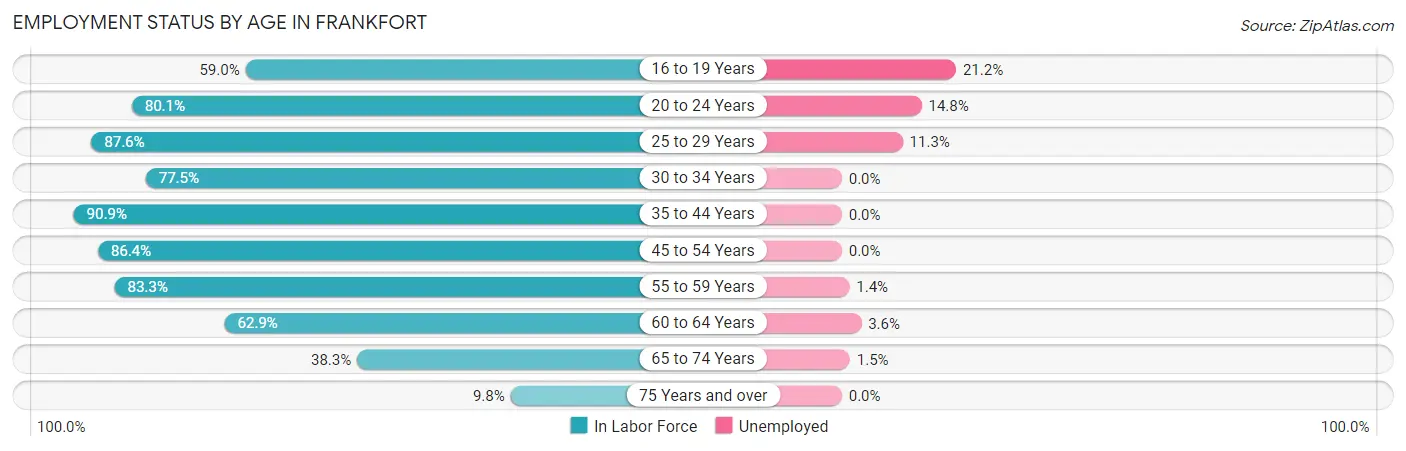
| Age Bracket | In Labor Force | Unemployed |
| 16 to 19 Years | 852 (59.0%) | 181 (21.2%) |
| 20 to 24 Years | 702 (80.1%) | 104 (14.8%) |
| 25 to 29 Years | 529 (87.6%) | 60 (11.3%) |
| 30 to 34 Years | 626 (77.5%) | 0 (0.0%) |
| 35 to 44 Years | 1,975 (90.9%) | 0 (0.0%) |
| 45 to 54 Years | 3,126 (86.4%) | 0 (0.0%) |
| 55 to 59 Years | 1,200 (83.3%) | 17 (1.4%) |
| 60 to 64 Years | 796 (62.9%) | 29 (3.6%) |
| 65 to 74 Years | 786 (38.3%) | 12 (1.5%) |
| 75 Years and over | 121 (9.8%) | 0 (0.0%) |
| Total | 10,721 (69.1%) | 407 (3.8%) |
Employment Status by Educational Attainment in Frankfort
According to labor force statistics for Frankfort, 83.3% of individuals (8,254) out of the total population between 25 and 64 years of age (9,909) are in the labor force, with 1.3% or 107 of them being unemployed. The group with the highest labor force participation rate are those with the educational attainment of bachelor's degree or higher, with 87.5% or 5,634 individuals in the labor force. Within the labor force, individuals with less than high school education have the highest percentage of unemployment, with 17.1% or 14 of them being unemployed.
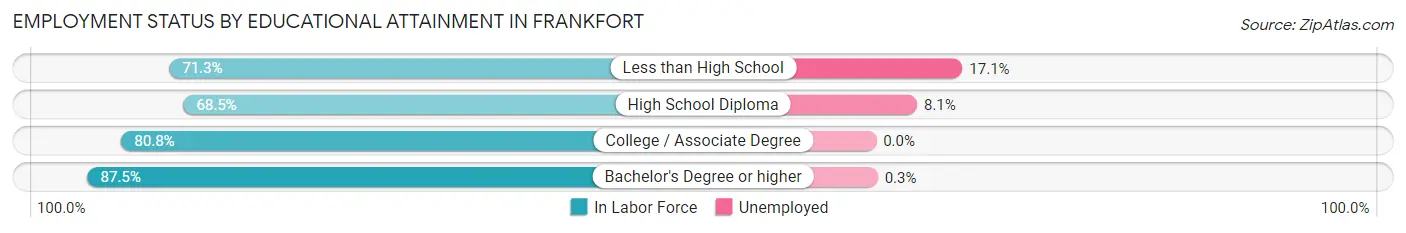
| Educational Attainment | In Labor Force | Unemployed |
| Less than High School | 82 (71.3%) | 20 (17.1%) |
| High School Diploma | 954 (68.5%) | 113 (8.1%) |
| College / Associate Degree | 1,586 (80.8%) | 0 (0.0%) |
| Bachelor's Degree or higher | 5,634 (87.5%) | 19 (0.3%) |
| Total | 8,254 (83.3%) | 129 (1.3%) |
Employment Occupations by Sex in Frankfort
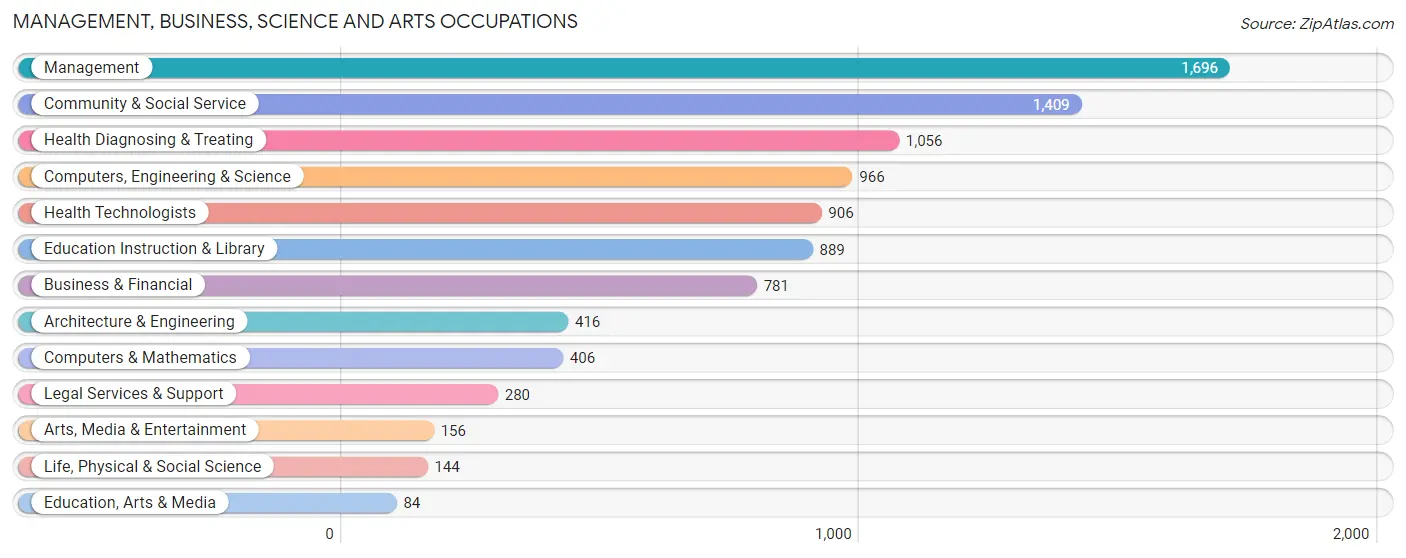
Management, Business, Science and Arts Occupations
The most common Management, Business, Science and Arts occupations in Frankfort are Management (1,696 | 16.5%), Community & Social Service (1,409 | 13.7%), Health Diagnosing & Treating (1,056 | 10.2%), Computers, Engineering & Science (966 | 9.4%), and Health Technologists (906 | 8.8%).
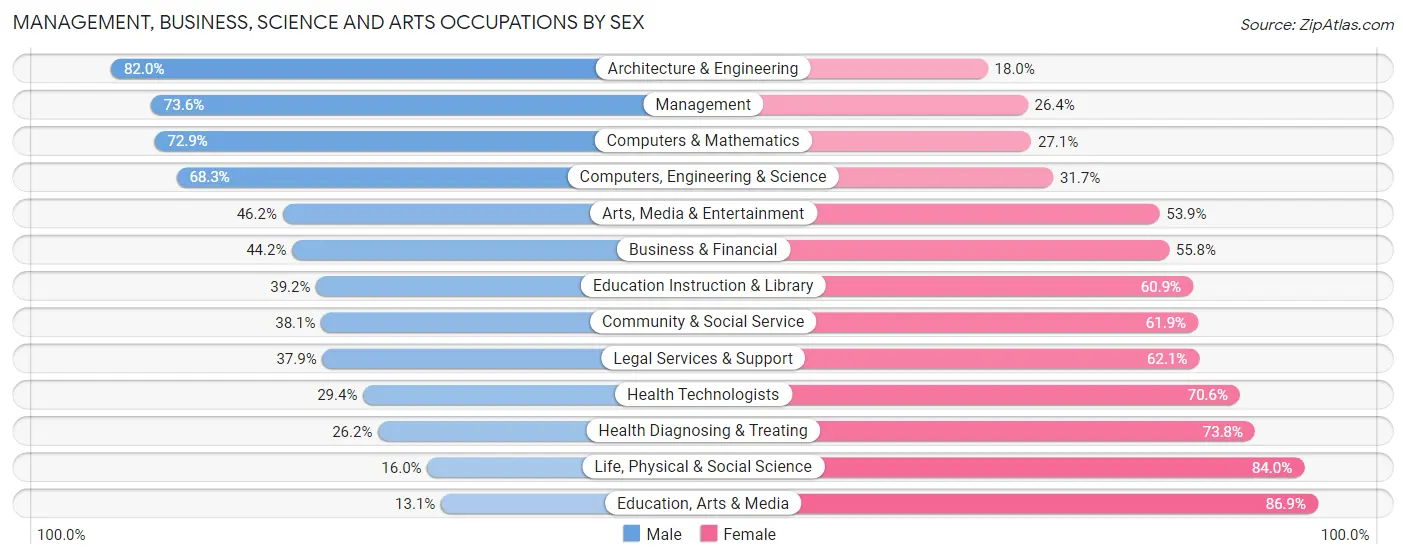
Management, Business, Science and Arts Occupations by Sex
Within the Management, Business, Science and Arts occupations in Frankfort, the most male-oriented occupations are Architecture & Engineering (82.0%), Management (73.6%), and Computers & Mathematics (72.9%), while the most female-oriented occupations are Education, Arts & Media (86.9%), Life, Physical & Social Science (84.0%), and Health Diagnosing & Treating (73.8%).
| Occupation | Male | Female |
| Management | 1,249 (73.6%) | 447 (26.4%) |
| Business & Financial | 345 (44.2%) | 436 (55.8%) |
| Computers, Engineering & Science | 660 (68.3%) | 306 (31.7%) |
| Computers & Mathematics | 296 (72.9%) | 110 (27.1%) |
| Architecture & Engineering | 341 (82.0%) | 75 (18.0%) |
| Life, Physical & Social Science | 23 (16.0%) | 121 (84.0%) |
| Community & Social Service | 537 (38.1%) | 872 (61.9%) |
| Education, Arts & Media | 11 (13.1%) | 73 (86.9%) |
| Legal Services & Support | 106 (37.9%) | 174 (62.1%) |
| Education Instruction & Library | 348 (39.2%) | 541 (60.9%) |
| Arts, Media & Entertainment | 72 (46.2%) | 84 (53.8%) |
| Health Diagnosing & Treating | 277 (26.2%) | 779 (73.8%) |
| Health Technologists | 266 (29.4%) | 640 (70.6%) |
| Total (Category) | 3,068 (51.9%) | 2,840 (48.1%) |
| Total (Overall) | 5,806 (56.3%) | 4,506 (43.7%) |
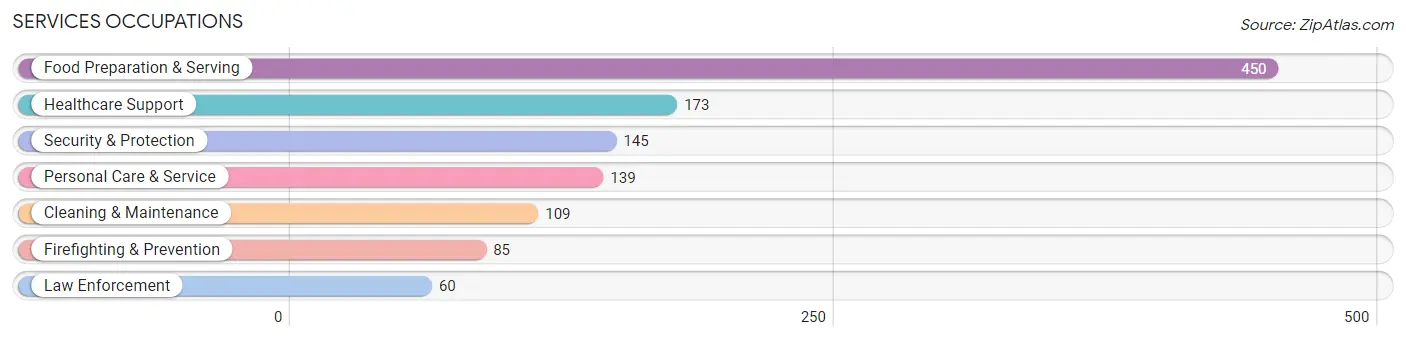
Services Occupations
The most common Services occupations in Frankfort are Food Preparation & Serving (450 | 4.4%), Healthcare Support (173 | 1.7%), Security & Protection (145 | 1.4%), Personal Care & Service (139 | 1.3%), and Cleaning & Maintenance (109 | 1.1%).
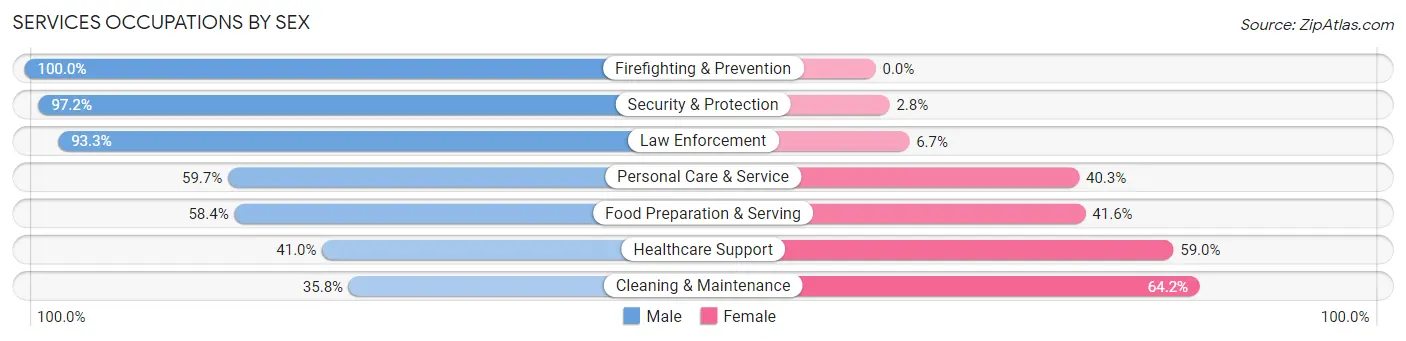
Services Occupations by Sex
Within the Services occupations in Frankfort, the most male-oriented occupations are Firefighting & Prevention (100.0%), Security & Protection (97.2%), and Law Enforcement (93.3%), while the most female-oriented occupations are Cleaning & Maintenance (64.2%), Healthcare Support (59.0%), and Food Preparation & Serving (41.6%).
| Occupation | Male | Female |
| Healthcare Support | 71 (41.0%) | 102 (59.0%) |
| Security & Protection | 141 (97.2%) | 4 (2.8%) |
| Firefighting & Prevention | 85 (100.0%) | 0 (0.0%) |
| Law Enforcement | 56 (93.3%) | 4 (6.7%) |
| Food Preparation & Serving | 263 (58.4%) | 187 (41.6%) |
| Cleaning & Maintenance | 39 (35.8%) | 70 (64.2%) |
| Personal Care & Service | 83 (59.7%) | 56 (40.3%) |
| Total (Category) | 597 (58.8%) | 419 (41.2%) |
| Total (Overall) | 5,806 (56.3%) | 4,506 (43.7%) |
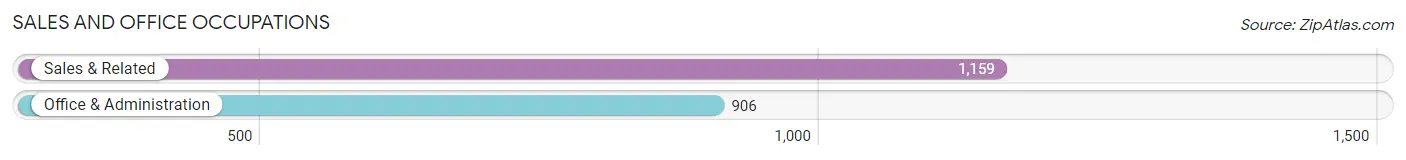
Sales and Office Occupations
The most common Sales and Office occupations in Frankfort are Sales & Related (1,159 | 11.2%), and Office & Administration (906 | 8.8%).
Sales and Office Occupations by Sex
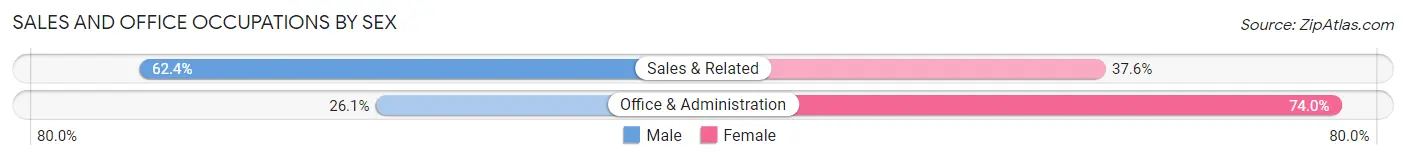
| Occupation | Male | Female |
| Sales & Related | 723 (62.4%) | 436 (37.6%) |
| Office & Administration | 236 (26.1%) | 670 (74.0%) |
| Total (Category) | 959 (46.4%) | 1,106 (53.6%) |
| Total (Overall) | 5,806 (56.3%) | 4,506 (43.7%) |
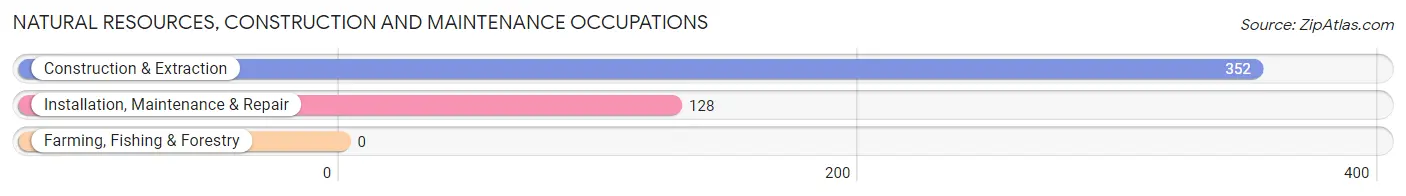
Natural Resources, Construction and Maintenance Occupations
The most common Natural Resources, Construction and Maintenance occupations in Frankfort are Construction & Extraction (352 | 3.4%), and Installation, Maintenance & Repair (128 | 1.2%).
Natural Resources, Construction and Maintenance Occupations by Sex
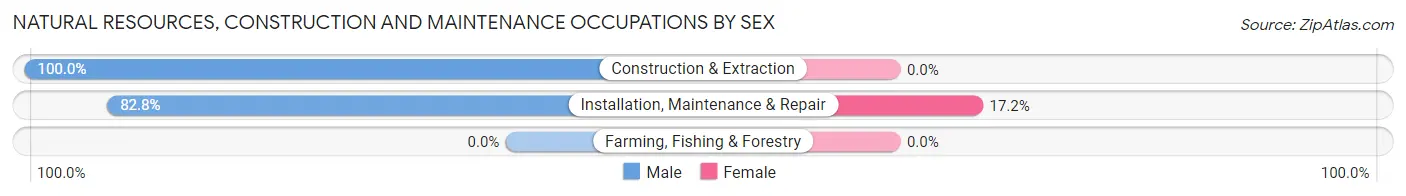
| Occupation | Male | Female |
| Farming, Fishing & Forestry | 0 (0.0%) | 0 (0.0%) |
| Construction & Extraction | 352 (100.0%) | 0 (0.0%) |
| Installation, Maintenance & Repair | 106 (82.8%) | 22 (17.2%) |
| Total (Category) | 458 (95.4%) | 22 (4.6%) |
| Total (Overall) | 5,806 (56.3%) | 4,506 (43.7%) |
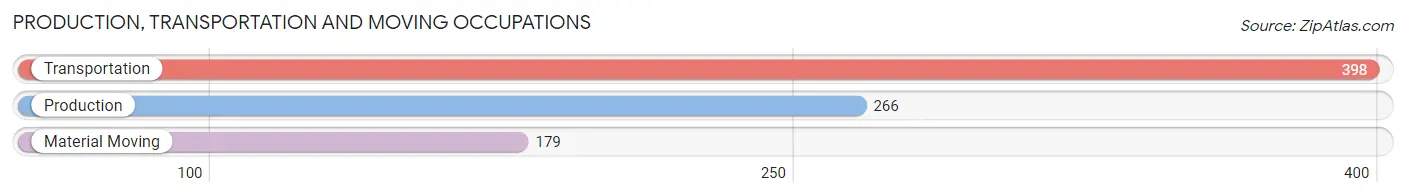
Production, Transportation and Moving Occupations
The most common Production, Transportation and Moving occupations in Frankfort are Transportation (398 | 3.9%), Production (266 | 2.6%), and Material Moving (179 | 1.7%).
Production, Transportation and Moving Occupations by Sex
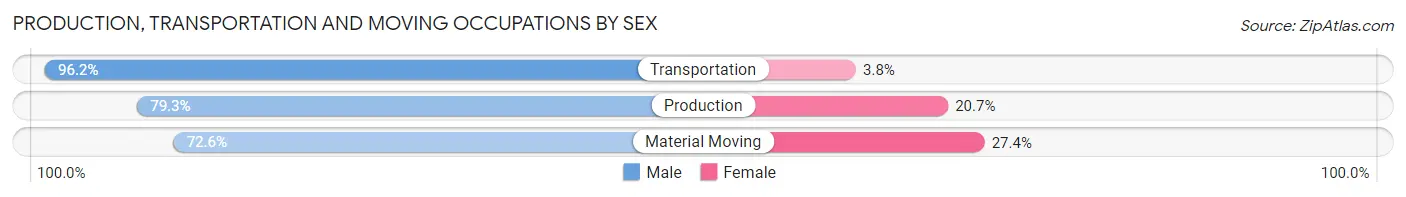
| Occupation | Male | Female |
| Production | 211 (79.3%) | 55 (20.7%) |
| Transportation | 383 (96.2%) | 15 (3.8%) |
| Material Moving | 130 (72.6%) | 49 (27.4%) |
| Total (Category) | 724 (85.9%) | 119 (14.1%) |
| Total (Overall) | 5,806 (56.3%) | 4,506 (43.7%) |
Employment Industries by Sex in Frankfort
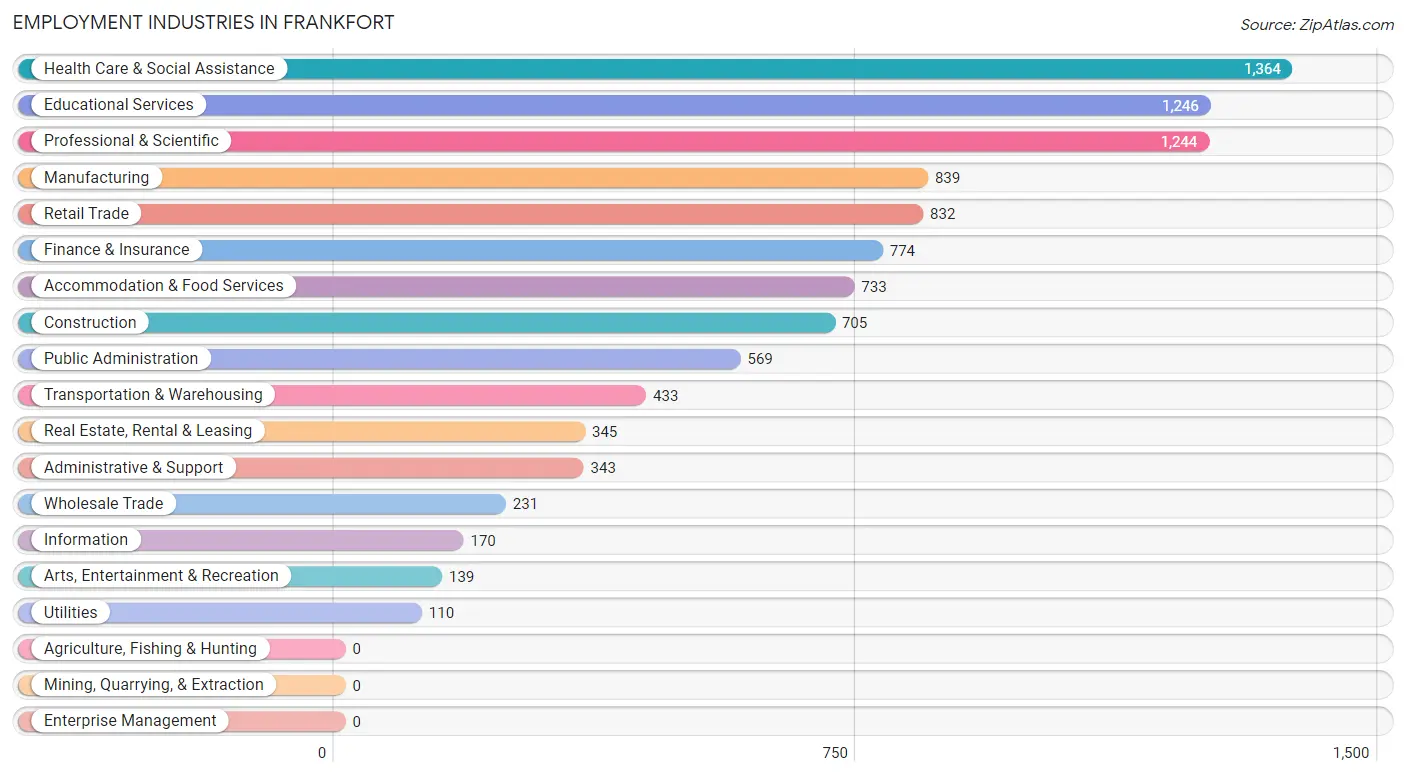
Employment Industries in Frankfort
The major employment industries in Frankfort include Health Care & Social Assistance (1,364 | 13.2%), Educational Services (1,246 | 12.1%), Professional & Scientific (1,244 | 12.1%), Manufacturing (839 | 8.1%), and Retail Trade (832 | 8.1%).
Employment Industries by Sex in Frankfort
The Frankfort industries that see more men than women are Utilities (100.0%), Transportation & Warehousing (92.1%), and Wholesale Trade (87.9%), whereas the industries that tend to have a higher number of women are Health Care & Social Assistance (67.9%), Educational Services (66.6%), and Administrative & Support (57.4%).
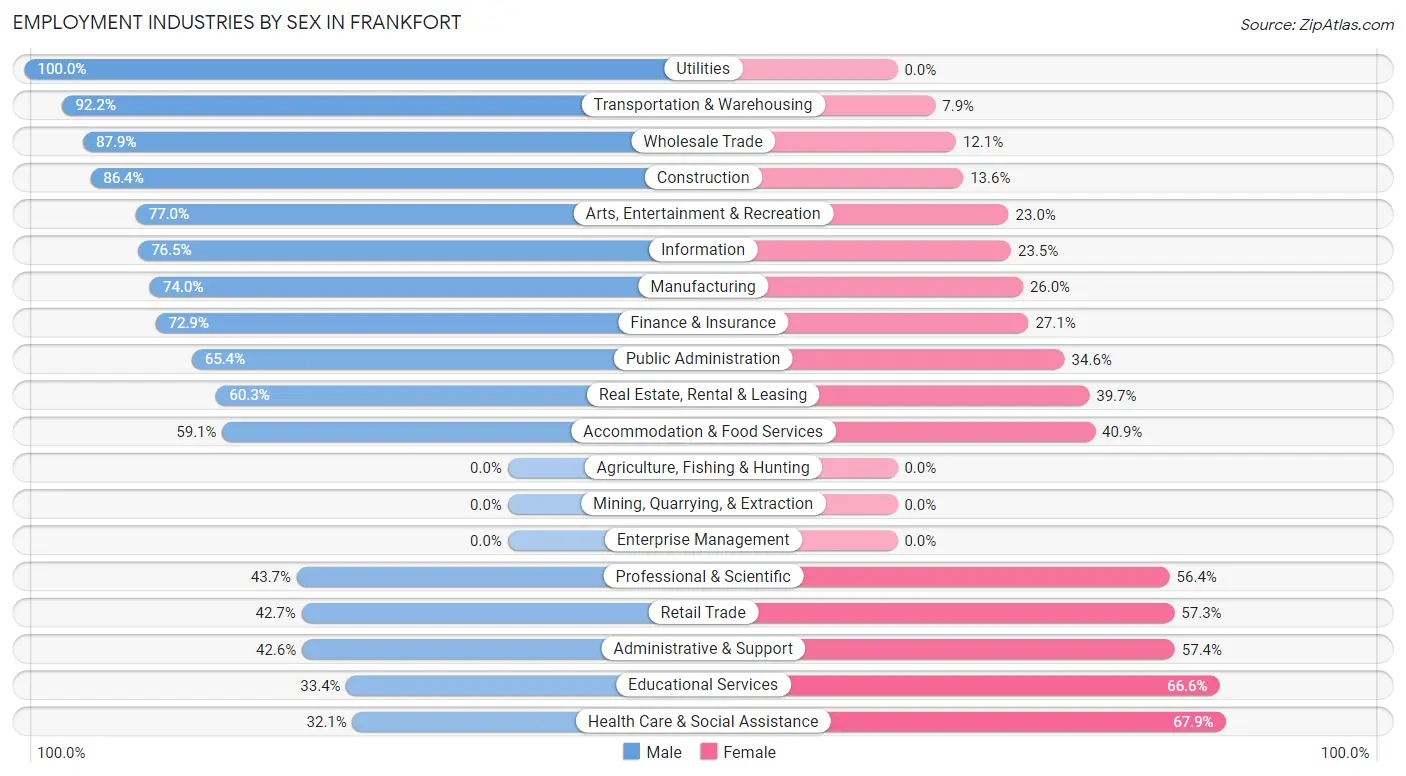
| Industry | Male | Female |
| Agriculture, Fishing & Hunting | 0 (0.0%) | 0 (0.0%) |
| Mining, Quarrying, & Extraction | 0 (0.0%) | 0 (0.0%) |
| Construction | 609 (86.4%) | 96 (13.6%) |
| Manufacturing | 621 (74.0%) | 218 (26.0%) |
| Wholesale Trade | 203 (87.9%) | 28 (12.1%) |
| Retail Trade | 355 (42.7%) | 477 (57.3%) |
| Transportation & Warehousing | 399 (92.1%) | 34 (7.9%) |
| Utilities | 110 (100.0%) | 0 (0.0%) |
| Information | 130 (76.5%) | 40 (23.5%) |
| Finance & Insurance | 564 (72.9%) | 210 (27.1%) |
| Real Estate, Rental & Leasing | 208 (60.3%) | 137 (39.7%) |
| Professional & Scientific | 543 (43.6%) | 701 (56.4%) |
| Enterprise Management | 0 (0.0%) | 0 (0.0%) |
| Administrative & Support | 146 (42.6%) | 197 (57.4%) |
| Educational Services | 416 (33.4%) | 830 (66.6%) |
| Health Care & Social Assistance | 438 (32.1%) | 926 (67.9%) |
| Arts, Entertainment & Recreation | 107 (77.0%) | 32 (23.0%) |
| Accommodation & Food Services | 433 (59.1%) | 300 (40.9%) |
| Public Administration | 372 (65.4%) | 197 (34.6%) |
| Total | 5,806 (56.3%) | 4,506 (43.7%) |
Education in Frankfort
School Enrollment in Frankfort
The most common levels of schooling among the 6,211 students in Frankfort are high school (1,753 | 28.2%), middle school (1,332 | 21.4%), and elementary school (1,311 | 21.1%).
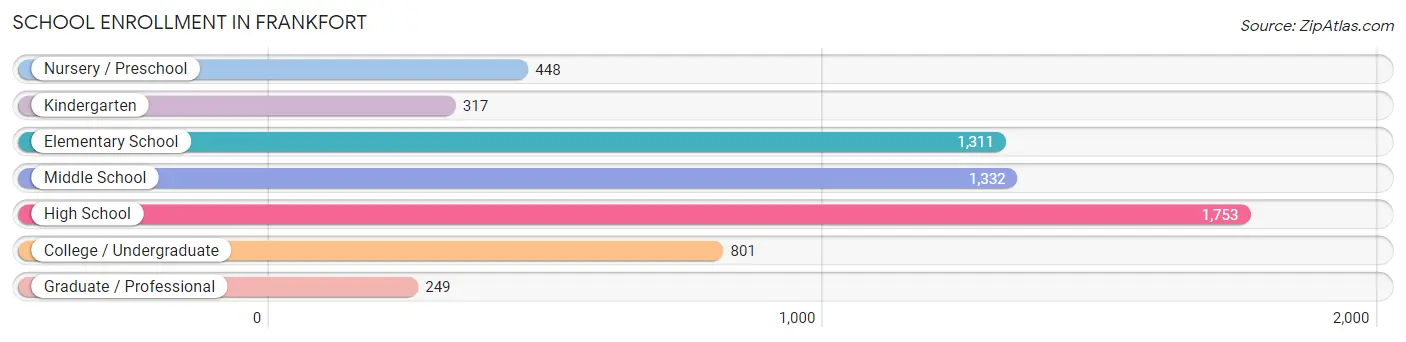
| School Level | # Students | % Students |
| Nursery / Preschool | 448 | 7.2% |
| Kindergarten | 317 | 5.1% |
| Elementary School | 1,311 | 21.1% |
| Middle School | 1,332 | 21.4% |
| High School | 1,753 | 28.2% |
| College / Undergraduate | 801 | 12.9% |
| Graduate / Professional | 249 | 4.0% |
| Total | 6,211 | 100.0% |
School Enrollment by Age by Funding Source in Frankfort
Out of a total of 6,211 students who are enrolled in schools in Frankfort, 907 (14.6%) attend a private institution, while the remaining 5,304 (85.4%) are enrolled in public schools. The age group of 25 to 34 year olds has the highest likelihood of being enrolled in private schools, with 37 (41.6% in the age bracket) enrolled. Conversely, the age group of 10 to 14 year olds has the lowest likelihood of being enrolled in a private school, with 1,657 (95.6% in the age bracket) attending a public institution.
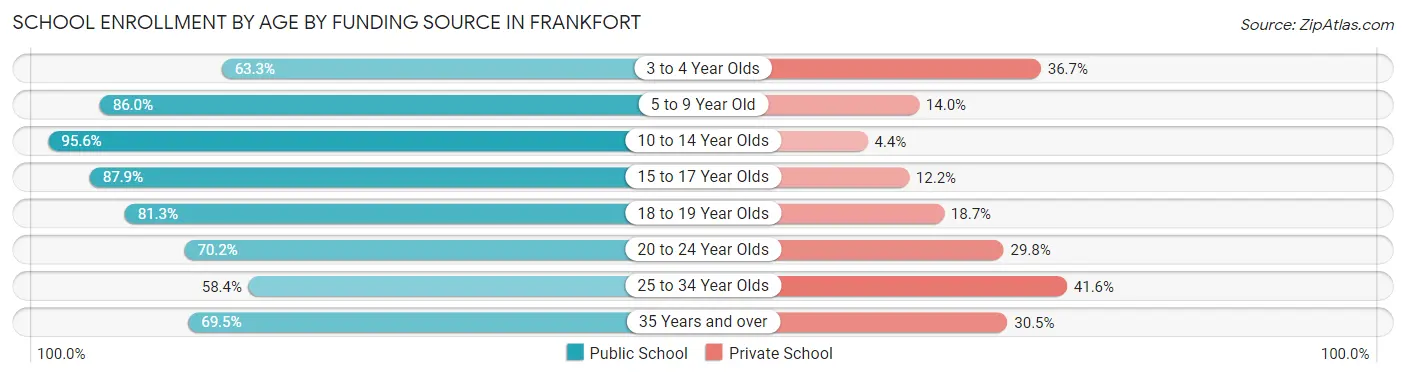
| Age Bracket | Public School | Private School |
| 3 to 4 Year Olds | 193 (63.3%) | 112 (36.7%) |
| 5 to 9 Year Old | 1,338 (86.0%) | 218 (14.0%) |
| 10 to 14 Year Olds | 1,657 (95.6%) | 77 (4.4%) |
| 15 to 17 Year Olds | 1,215 (87.8%) | 168 (12.1%) |
| 18 to 19 Year Olds | 366 (81.3%) | 84 (18.7%) |
| 20 to 24 Year Olds | 257 (70.2%) | 109 (29.8%) |
| 25 to 34 Year Olds | 52 (58.4%) | 37 (41.6%) |
| 35 Years and over | 228 (69.5%) | 100 (30.5%) |
| Total | 5,304 (85.4%) | 907 (14.6%) |
Educational Attainment by Field of Study in Frankfort
Business (2,002 | 23.9%), education (1,120 | 13.4%), science & technology (998 | 11.9%), engineering (958 | 11.5%), and communications (481 | 5.8%) are the most common fields of study among 8,366 individuals in Frankfort who have obtained a bachelor's degree or higher.
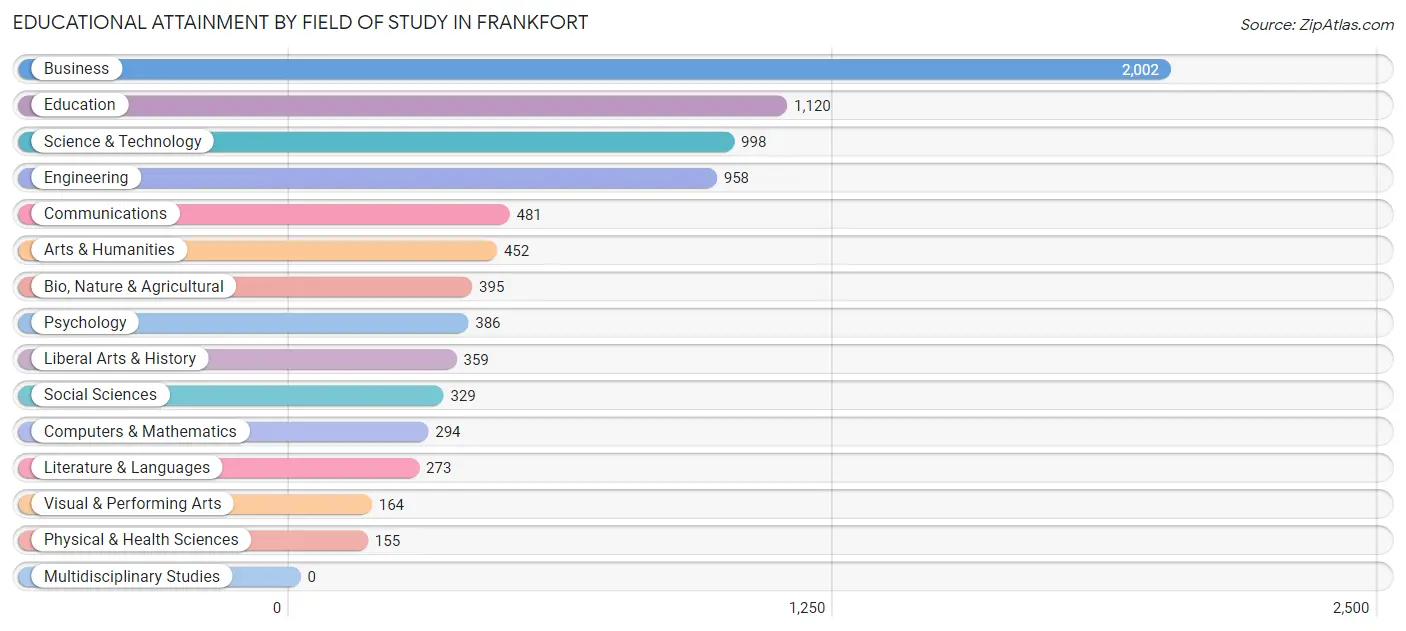
| Field of Study | # Graduates | % Graduates |
| Computers & Mathematics | 294 | 3.5% |
| Bio, Nature & Agricultural | 395 | 4.7% |
| Physical & Health Sciences | 155 | 1.8% |
| Psychology | 386 | 4.6% |
| Social Sciences | 329 | 3.9% |
| Engineering | 958 | 11.5% |
| Multidisciplinary Studies | 0 | 0.0% |
| Science & Technology | 998 | 11.9% |
| Business | 2,002 | 23.9% |
| Education | 1,120 | 13.4% |
| Literature & Languages | 273 | 3.3% |
| Liberal Arts & History | 359 | 4.3% |
| Visual & Performing Arts | 164 | 2.0% |
| Communications | 481 | 5.8% |
| Arts & Humanities | 452 | 5.4% |
| Total | 8,366 | 100.0% |
Transportation & Commute in Frankfort
Vehicle Availability by Sex in Frankfort
The most prevalent vehicle ownership categories in Frankfort are males with 2 vehicles (2,509, accounting for 44.4%) and females with 2 vehicles (2,023, making up 57.9%).
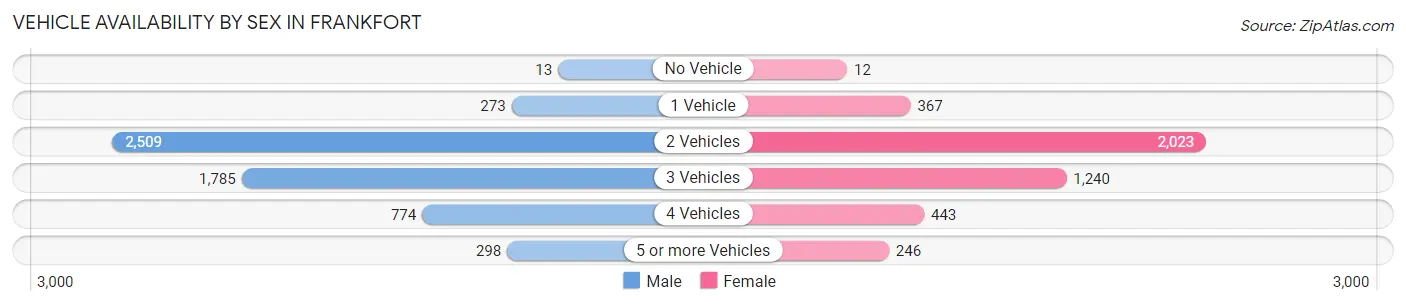
| Vehicles Available | Male | Female |
| No Vehicle | 13 (0.2%) | 12 (0.3%) |
| 1 Vehicle | 273 (4.8%) | 367 (8.5%) |
| 2 Vehicles | 2,509 (44.4%) | 2,023 (46.7%) |
| 3 Vehicles | 1,785 (31.6%) | 1,240 (28.6%) |
| 4 Vehicles | 774 (13.7%) | 443 (10.2%) |
| 5 or more Vehicles | 298 (5.3%) | 246 (5.7%) |
| Total | 5,652 (100.0%) | 4,331 (100.0%) |
Commute Time in Frankfort
The most frequently occuring commute durations in Frankfort are 30 to 34 minutes (1,354 commuters, 16.7%), 45 to 59 minutes (1,189 commuters, 14.6%), and 60 to 89 minutes (1,149 commuters, 14.1%).
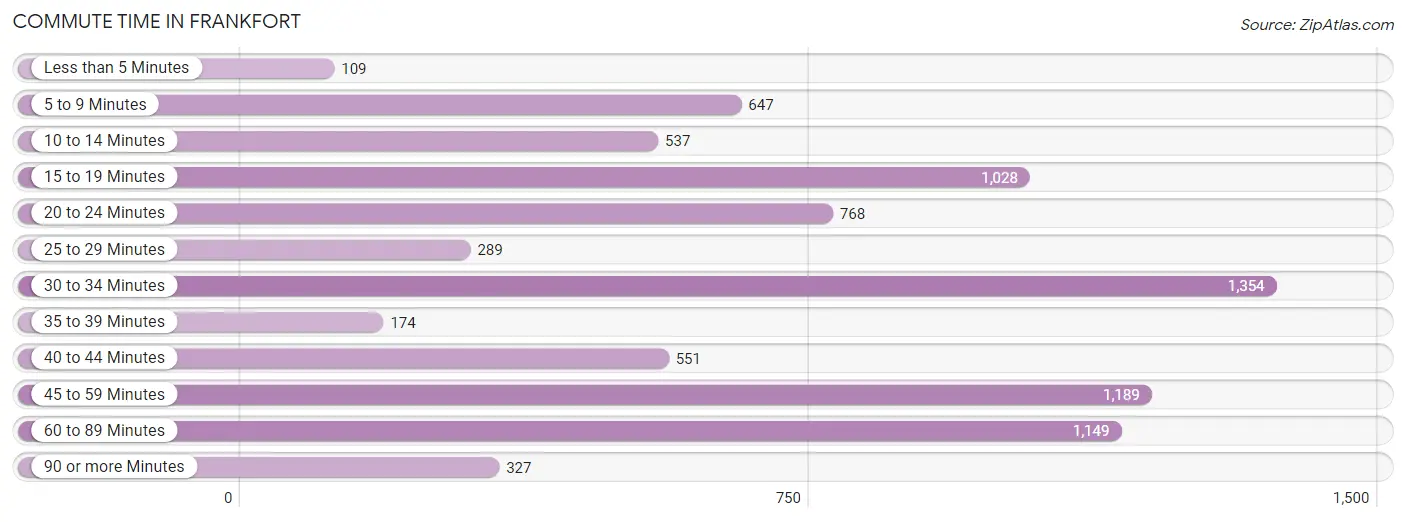
| Commute Time | # Commuters | % Commuters |
| Less than 5 Minutes | 109 | 1.3% |
| 5 to 9 Minutes | 647 | 8.0% |
| 10 to 14 Minutes | 537 | 6.6% |
| 15 to 19 Minutes | 1,028 | 12.7% |
| 20 to 24 Minutes | 768 | 9.5% |
| 25 to 29 Minutes | 289 | 3.6% |
| 30 to 34 Minutes | 1,354 | 16.7% |
| 35 to 39 Minutes | 174 | 2.1% |
| 40 to 44 Minutes | 551 | 6.8% |
| 45 to 59 Minutes | 1,189 | 14.6% |
| 60 to 89 Minutes | 1,149 | 14.1% |
| 90 or more Minutes | 327 | 4.0% |
Commute Time by Sex in Frankfort
The most common commute times in Frankfort are 30 to 34 minutes (895 commuters, 19.3%) for males and 15 to 19 minutes (559 commuters, 16.1%) for females.
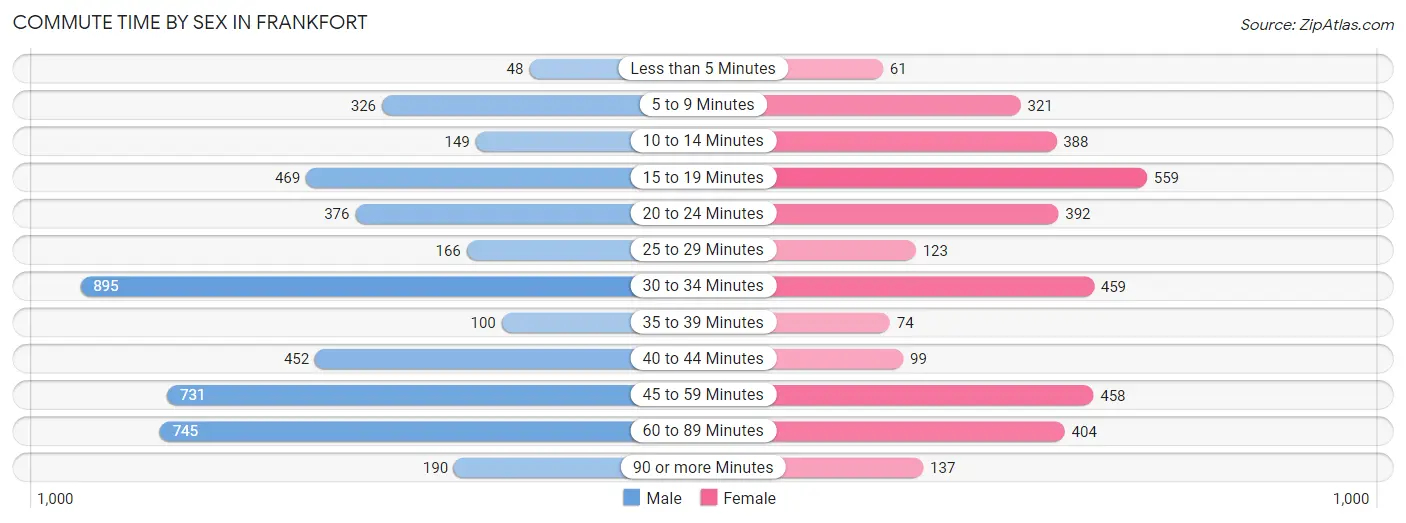
| Commute Time | Male | Female |
| Less than 5 Minutes | 48 (1.0%) | 61 (1.8%) |
| 5 to 9 Minutes | 326 (7.0%) | 321 (9.2%) |
| 10 to 14 Minutes | 149 (3.2%) | 388 (11.2%) |
| 15 to 19 Minutes | 469 (10.1%) | 559 (16.1%) |
| 20 to 24 Minutes | 376 (8.1%) | 392 (11.3%) |
| 25 to 29 Minutes | 166 (3.6%) | 123 (3.5%) |
| 30 to 34 Minutes | 895 (19.3%) | 459 (13.2%) |
| 35 to 39 Minutes | 100 (2.1%) | 74 (2.1%) |
| 40 to 44 Minutes | 452 (9.7%) | 99 (2.9%) |
| 45 to 59 Minutes | 731 (15.7%) | 458 (13.2%) |
| 60 to 89 Minutes | 745 (16.0%) | 404 (11.6%) |
| 90 or more Minutes | 190 (4.1%) | 137 (3.9%) |
Time of Departure to Work by Sex in Frankfort
The most frequent times of departure to work in Frankfort are 7:00 AM to 7:29 AM (833, 17.9%) for males and 7:30 AM to 7:59 AM (644, 18.5%) for females.
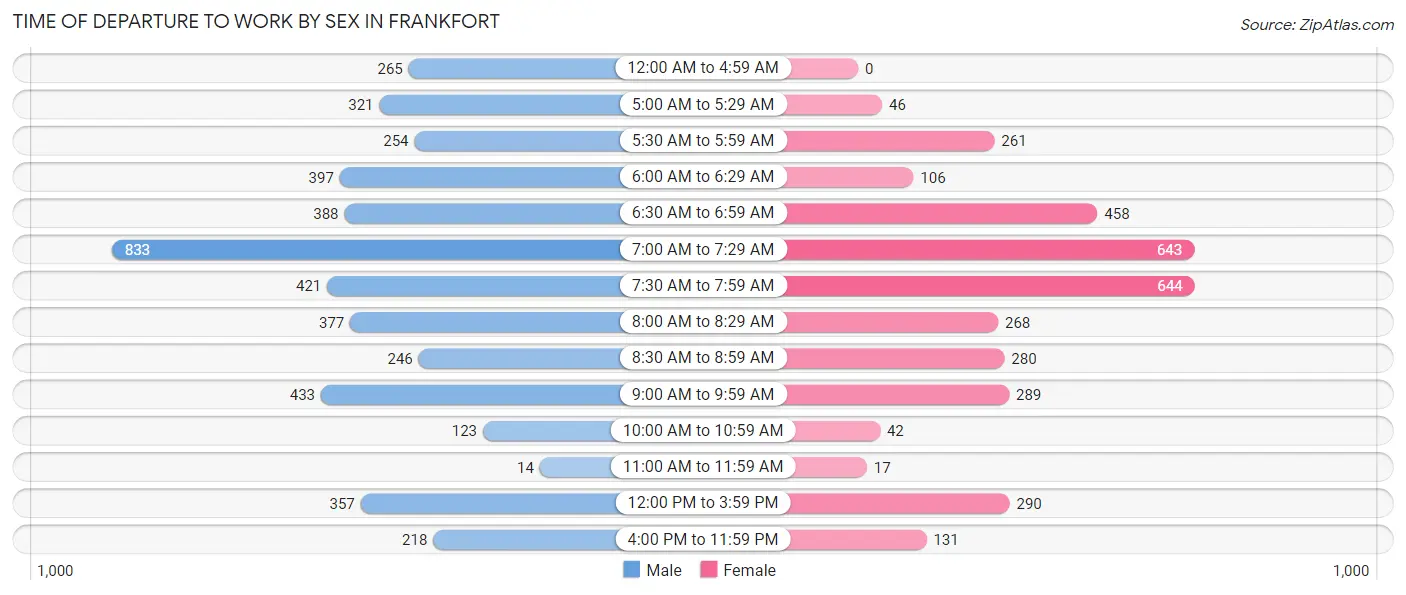
| Time of Departure | Male | Female |
| 12:00 AM to 4:59 AM | 265 (5.7%) | 0 (0.0%) |
| 5:00 AM to 5:29 AM | 321 (6.9%) | 46 (1.3%) |
| 5:30 AM to 5:59 AM | 254 (5.5%) | 261 (7.5%) |
| 6:00 AM to 6:29 AM | 397 (8.5%) | 106 (3.0%) |
| 6:30 AM to 6:59 AM | 388 (8.4%) | 458 (13.2%) |
| 7:00 AM to 7:29 AM | 833 (17.9%) | 643 (18.5%) |
| 7:30 AM to 7:59 AM | 421 (9.1%) | 644 (18.5%) |
| 8:00 AM to 8:29 AM | 377 (8.1%) | 268 (7.7%) |
| 8:30 AM to 8:59 AM | 246 (5.3%) | 280 (8.1%) |
| 9:00 AM to 9:59 AM | 433 (9.3%) | 289 (8.3%) |
| 10:00 AM to 10:59 AM | 123 (2.6%) | 42 (1.2%) |
| 11:00 AM to 11:59 AM | 14 (0.3%) | 17 (0.5%) |
| 12:00 PM to 3:59 PM | 357 (7.7%) | 290 (8.4%) |
| 4:00 PM to 11:59 PM | 218 (4.7%) | 131 (3.8%) |
| Total | 4,647 (100.0%) | 3,475 (100.0%) |
Housing Occupancy in Frankfort
Occupancy by Ownership in Frankfort
Of the total 6,579 dwellings in Frankfort, owner-occupied units account for 6,189 (94.1%), while renter-occupied units make up 390 (5.9%).
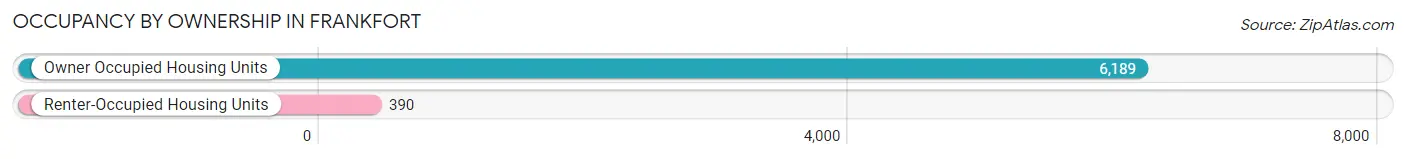
| Occupancy | # Housing Units | % Housing Units |
| Owner Occupied Housing Units | 6,189 | 94.1% |
| Renter-Occupied Housing Units | 390 | 5.9% |
| Total Occupied Housing Units | 6,579 | 100.0% |
Occupancy by Household Size in Frankfort
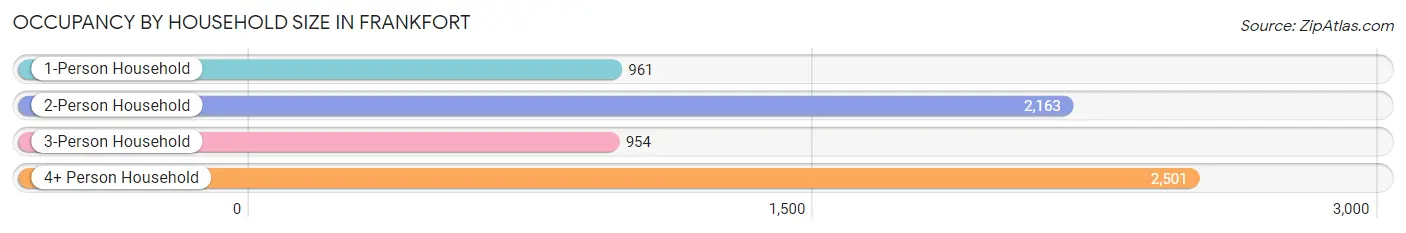
| Household Size | # Housing Units | % Housing Units |
| 1-Person Household | 961 | 14.6% |
| 2-Person Household | 2,163 | 32.9% |
| 3-Person Household | 954 | 14.5% |
| 4+ Person Household | 2,501 | 38.0% |
| Total Housing Units | 6,579 | 100.0% |
Occupancy by Ownership by Household Size in Frankfort
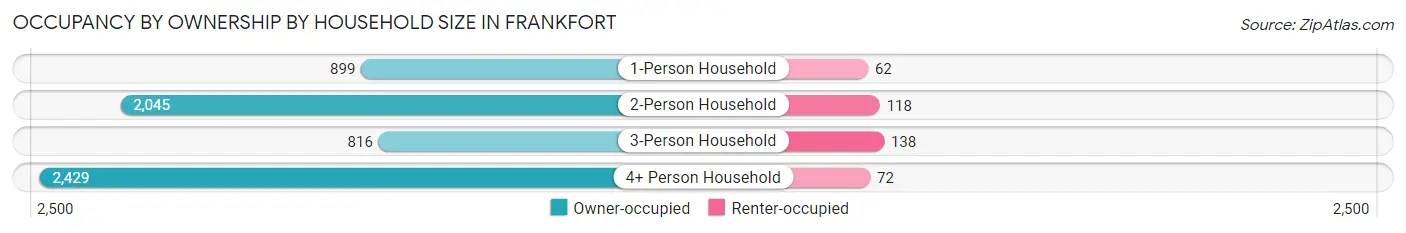
| Household Size | Owner-occupied | Renter-occupied |
| 1-Person Household | 899 (93.5%) | 62 (6.5%) |
| 2-Person Household | 2,045 (94.5%) | 118 (5.5%) |
| 3-Person Household | 816 (85.5%) | 138 (14.5%) |
| 4+ Person Household | 2,429 (97.1%) | 72 (2.9%) |
| Total Housing Units | 6,189 (94.1%) | 390 (5.9%) |
Occupancy by Educational Attainment in Frankfort
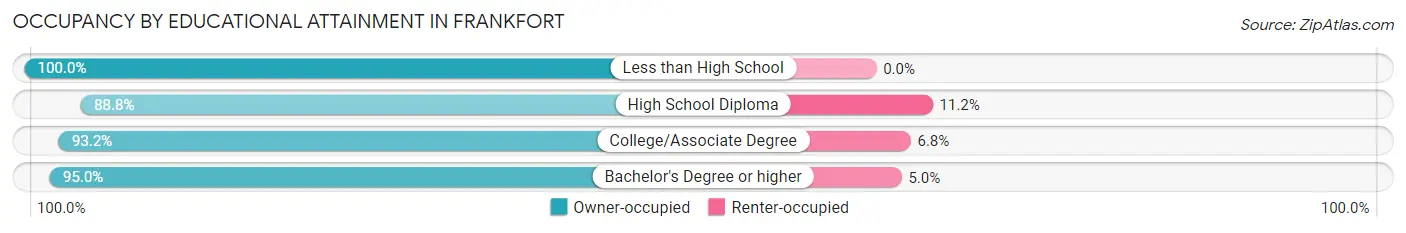
| Household Size | Owner-occupied | Renter-occupied |
| Less than High School | 189 (100.0%) | 0 (0.0%) |
| High School Diploma | 643 (88.8%) | 81 (11.2%) |
| College/Associate Degree | 1,287 (93.2%) | 94 (6.8%) |
| Bachelor's Degree or higher | 4,070 (95.0%) | 215 (5.0%) |
Occupancy by Age of Householder in Frankfort
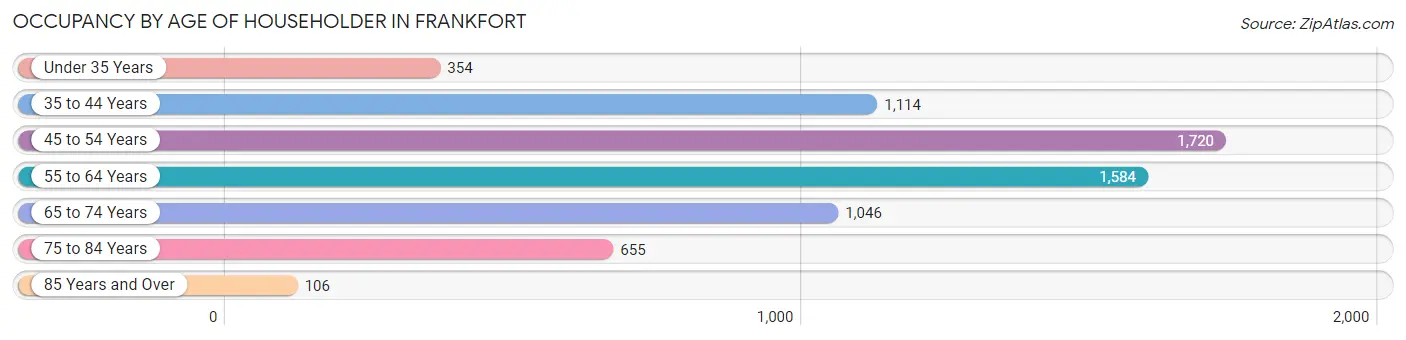
| Age Bracket | # Households | % Households |
| Under 35 Years | 354 | 5.4% |
| 35 to 44 Years | 1,114 | 16.9% |
| 45 to 54 Years | 1,720 | 26.1% |
| 55 to 64 Years | 1,584 | 24.1% |
| 65 to 74 Years | 1,046 | 15.9% |
| 75 to 84 Years | 655 | 10.0% |
| 85 Years and Over | 106 | 1.6% |
| Total | 6,579 | 100.0% |
Housing Finances in Frankfort
Median Income by Occupancy in Frankfort
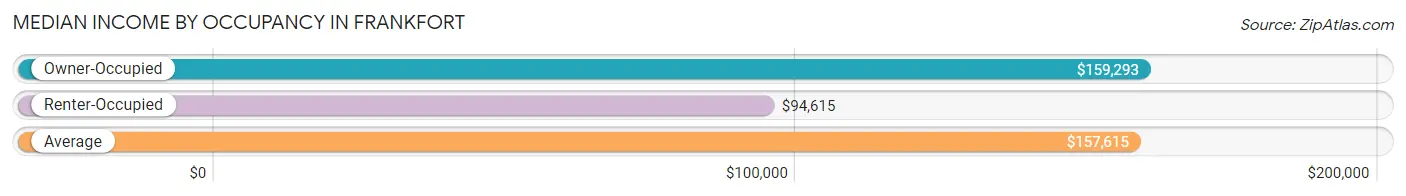
| Occupancy Type | # Households | Median Income |
| Owner-Occupied | 6,189 (94.1%) | $159,293 |
| Renter-Occupied | 390 (5.9%) | $94,615 |
| Average | 6,579 (100.0%) | $157,615 |
Occupancy by Householder Income Bracket in Frankfort
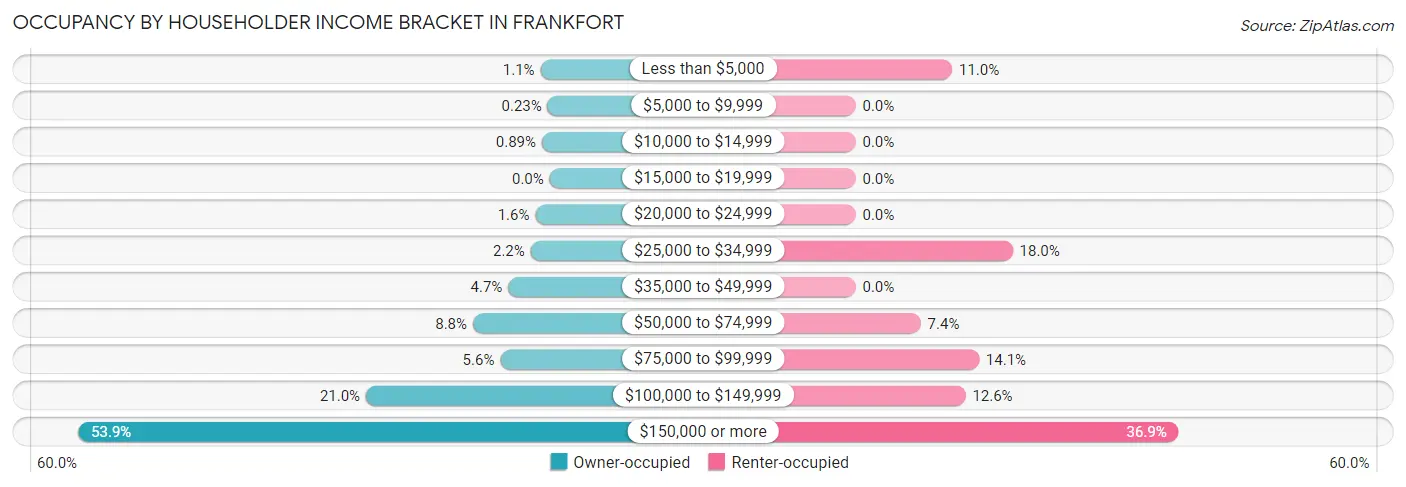
| Income Bracket | Owner-occupied | Renter-occupied |
| Less than $5,000 | 65 (1.1%) | 43 (11.0%) |
| $5,000 to $9,999 | 14 (0.2%) | 0 (0.0%) |
| $10,000 to $14,999 | 55 (0.9%) | 0 (0.0%) |
| $15,000 to $19,999 | 0 (0.0%) | 0 (0.0%) |
| $20,000 to $24,999 | 101 (1.6%) | 0 (0.0%) |
| $25,000 to $34,999 | 134 (2.2%) | 70 (17.9%) |
| $35,000 to $49,999 | 293 (4.7%) | 0 (0.0%) |
| $50,000 to $74,999 | 543 (8.8%) | 29 (7.4%) |
| $75,000 to $99,999 | 349 (5.6%) | 55 (14.1%) |
| $100,000 to $149,999 | 1,299 (21.0%) | 49 (12.6%) |
| $150,000 or more | 3,336 (53.9%) | 144 (36.9%) |
| Total | 6,189 (100.0%) | 390 (100.0%) |
Monthly Housing Cost Tiers in Frankfort
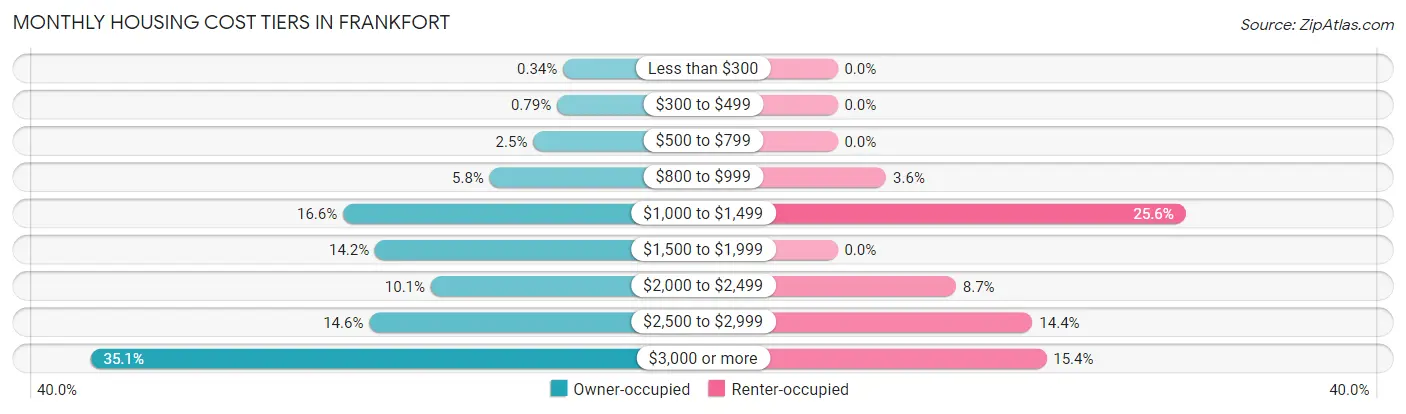
| Monthly Cost | Owner-occupied | Renter-occupied |
| Less than $300 | 21 (0.3%) | 0 (0.0%) |
| $300 to $499 | 49 (0.8%) | 0 (0.0%) |
| $500 to $799 | 157 (2.5%) | 0 (0.0%) |
| $800 to $999 | 356 (5.8%) | 14 (3.6%) |
| $1,000 to $1,499 | 1,024 (16.6%) | 100 (25.6%) |
| $1,500 to $1,999 | 878 (14.2%) | 0 (0.0%) |
| $2,000 to $2,499 | 624 (10.1%) | 34 (8.7%) |
| $2,500 to $2,999 | 905 (14.6%) | 56 (14.4%) |
| $3,000 or more | 2,175 (35.1%) | 60 (15.4%) |
| Total | 6,189 (100.0%) | 390 (100.0%) |
Physical Housing Characteristics in Frankfort
Housing Structures in Frankfort
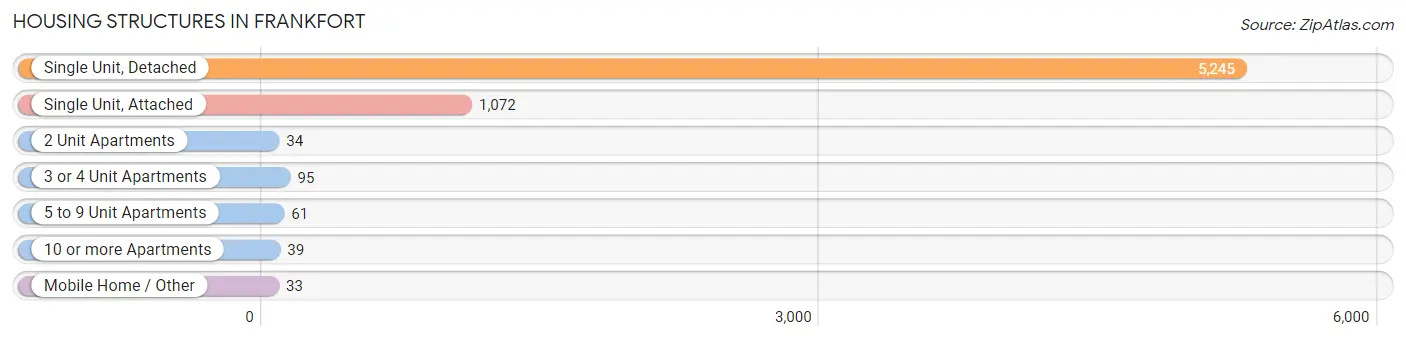
| Structure Type | # Housing Units | % Housing Units |
| Single Unit, Detached | 5,245 | 79.7% |
| Single Unit, Attached | 1,072 | 16.3% |
| 2 Unit Apartments | 34 | 0.5% |
| 3 or 4 Unit Apartments | 95 | 1.4% |
| 5 to 9 Unit Apartments | 61 | 0.9% |
| 10 or more Apartments | 39 | 0.6% |
| Mobile Home / Other | 33 | 0.5% |
| Total | 6,579 | 100.0% |
Housing Structures by Occupancy in Frankfort
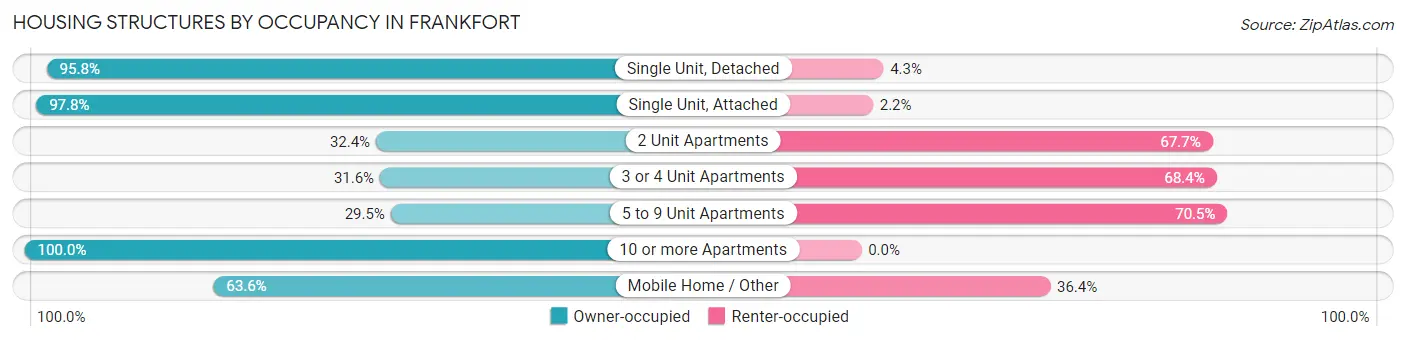
| Structure Type | Owner-occupied | Renter-occupied |
| Single Unit, Detached | 5,022 (95.8%) | 223 (4.3%) |
| Single Unit, Attached | 1,048 (97.8%) | 24 (2.2%) |
| 2 Unit Apartments | 11 (32.4%) | 23 (67.6%) |
| 3 or 4 Unit Apartments | 30 (31.6%) | 65 (68.4%) |
| 5 to 9 Unit Apartments | 18 (29.5%) | 43 (70.5%) |
| 10 or more Apartments | 39 (100.0%) | 0 (0.0%) |
| Mobile Home / Other | 21 (63.6%) | 12 (36.4%) |
| Total | 6,189 (94.1%) | 390 (5.9%) |
Housing Structures by Number of Rooms in Frankfort
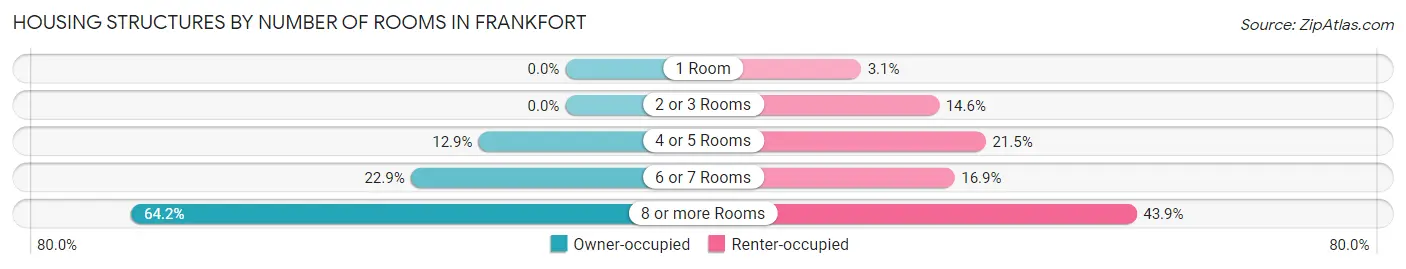
| Number of Rooms | Owner-occupied | Renter-occupied |
| 1 Room | 0 (0.0%) | 12 (3.1%) |
| 2 or 3 Rooms | 0 (0.0%) | 57 (14.6%) |
| 4 or 5 Rooms | 796 (12.9%) | 84 (21.5%) |
| 6 or 7 Rooms | 1,417 (22.9%) | 66 (16.9%) |
| 8 or more Rooms | 3,976 (64.2%) | 171 (43.9%) |
| Total | 6,189 (100.0%) | 390 (100.0%) |
Housing Structure by Heating Type in Frankfort
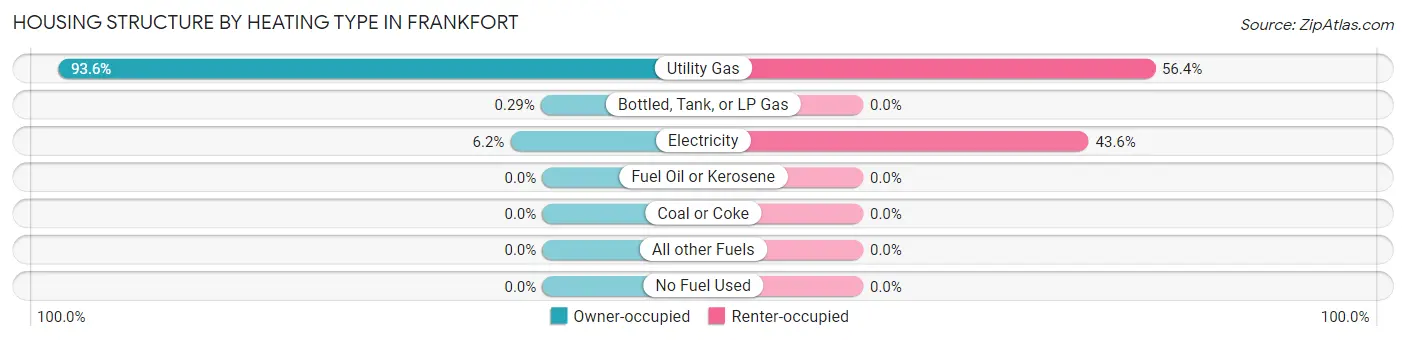
| Heating Type | Owner-occupied | Renter-occupied |
| Utility Gas | 5,790 (93.5%) | 220 (56.4%) |
| Bottled, Tank, or LP Gas | 18 (0.3%) | 0 (0.0%) |
| Electricity | 381 (6.2%) | 170 (43.6%) |
| Fuel Oil or Kerosene | 0 (0.0%) | 0 (0.0%) |
| Coal or Coke | 0 (0.0%) | 0 (0.0%) |
| All other Fuels | 0 (0.0%) | 0 (0.0%) |
| No Fuel Used | 0 (0.0%) | 0 (0.0%) |
| Total | 6,189 (100.0%) | 390 (100.0%) |
Household Vehicle Usage in Frankfort
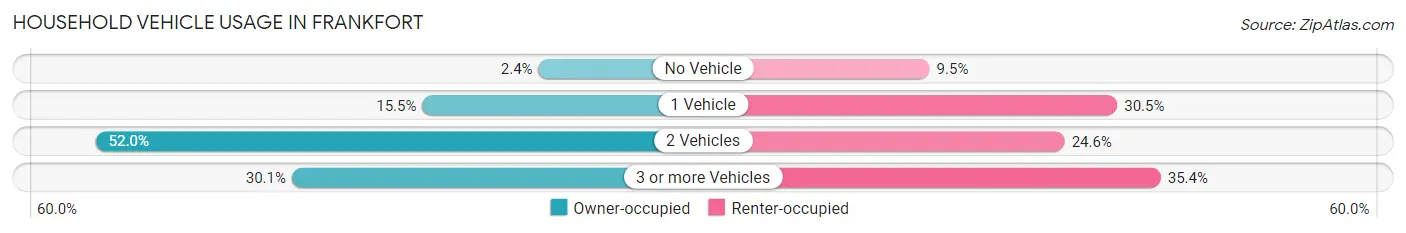
| Vehicles per Household | Owner-occupied | Renter-occupied |
| No Vehicle | 151 (2.4%) | 37 (9.5%) |
| 1 Vehicle | 956 (15.4%) | 119 (30.5%) |
| 2 Vehicles | 3,221 (52.0%) | 96 (24.6%) |
| 3 or more Vehicles | 1,861 (30.1%) | 138 (35.4%) |
| Total | 6,189 (100.0%) | 390 (100.0%) |
Real Estate & Mortgages in Frankfort
Real Estate and Mortgage Overview in Frankfort
| Characteristic | Without Mortgage | With Mortgage |
| Housing Units | 2,123 | 4,066 |
| Median Property Value | $399,000 | $453,500 |
| Median Household Income | $122,821 | $2,527 |
| Monthly Housing Costs | $1,260 | $2,105 |
| Real Estate Taxes | $9,946 | $96 |
Property Value by Mortgage Status in Frankfort
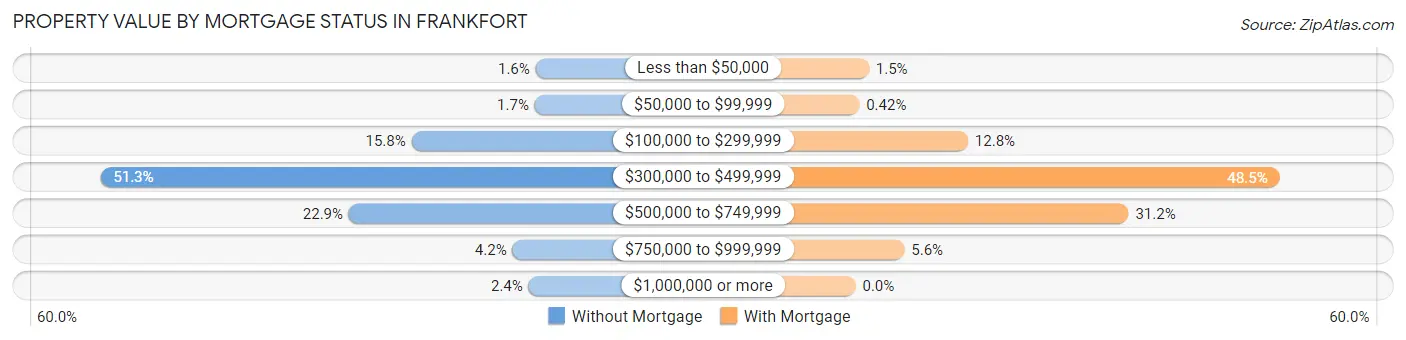
| Property Value | Without Mortgage | With Mortgage |
| Less than $50,000 | 34 (1.6%) | 62 (1.5%) |
| $50,000 to $99,999 | 36 (1.7%) | 17 (0.4%) |
| $100,000 to $299,999 | 335 (15.8%) | 522 (12.8%) |
| $300,000 to $499,999 | 1,090 (51.3%) | 1,970 (48.4%) |
| $500,000 to $749,999 | 487 (22.9%) | 1,268 (31.2%) |
| $750,000 to $999,999 | 90 (4.2%) | 227 (5.6%) |
| $1,000,000 or more | 51 (2.4%) | 0 (0.0%) |
| Total | 2,123 (100.0%) | 4,066 (100.0%) |
Household Income by Mortgage Status in Frankfort
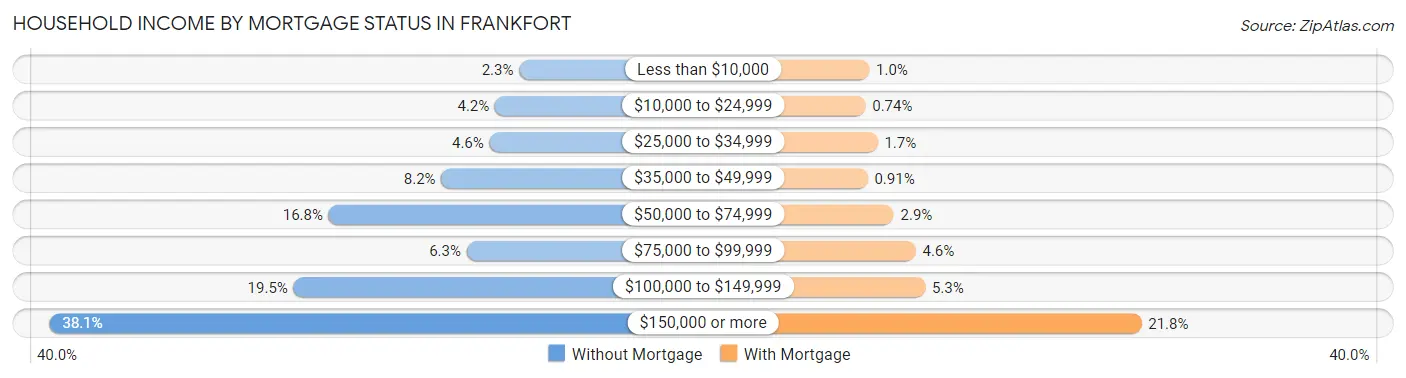
| Household Income | Without Mortgage | With Mortgage |
| Less than $10,000 | 49 (2.3%) | 42 (1.0%) |
| $10,000 to $24,999 | 88 (4.2%) | 30 (0.7%) |
| $25,000 to $34,999 | 97 (4.6%) | 68 (1.7%) |
| $35,000 to $49,999 | 175 (8.2%) | 37 (0.9%) |
| $50,000 to $74,999 | 357 (16.8%) | 118 (2.9%) |
| $75,000 to $99,999 | 134 (6.3%) | 186 (4.6%) |
| $100,000 to $149,999 | 414 (19.5%) | 215 (5.3%) |
| $150,000 or more | 809 (38.1%) | 885 (21.8%) |
| Total | 2,123 (100.0%) | 4,066 (100.0%) |
Property Value to Household Income Ratio in Frankfort
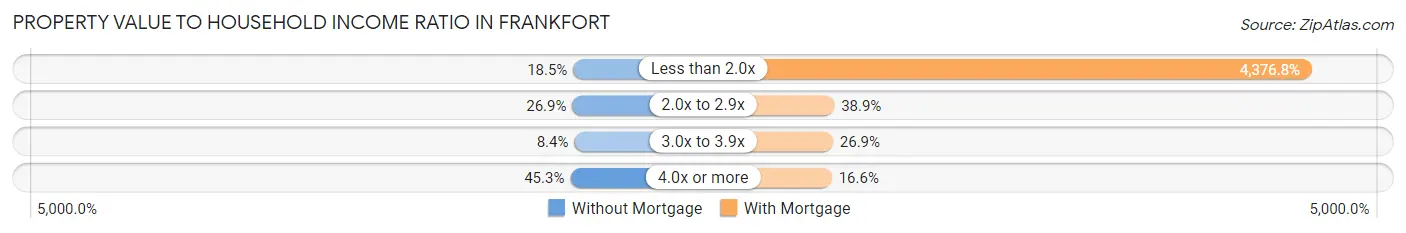
| Value-to-Income Ratio | Without Mortgage | With Mortgage |
| Less than 2.0x | 393 (18.5%) | 177,961 (4,376.8%) |
| 2.0x to 2.9x | 572 (26.9%) | 1,582 (38.9%) |
| 3.0x to 3.9x | 178 (8.4%) | 1,094 (26.9%) |
| 4.0x or more | 962 (45.3%) | 673 (16.6%) |
| Total | 2,123 (100.0%) | 4,066 (100.0%) |
Real Estate Taxes by Mortgage Status in Frankfort
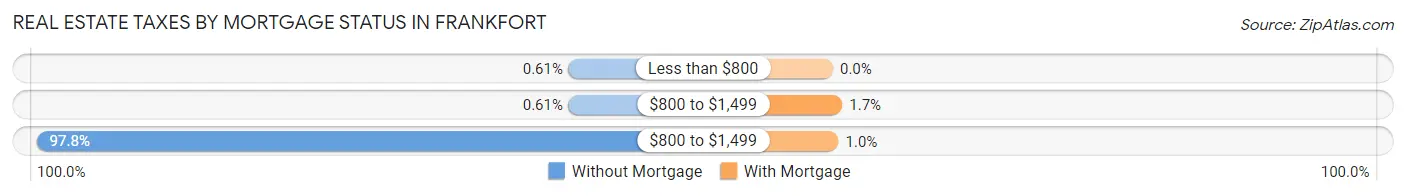
| Property Taxes | Without Mortgage | With Mortgage |
| Less than $800 | 13 (0.6%) | 0 (0.0%) |
| $800 to $1,499 | 13 (0.6%) | 69 (1.7%) |
| $800 to $1,499 | 2,076 (97.8%) | 41 (1.0%) |
| Total | 2,123 (100.0%) | 4,066 (100.0%) |
Health & Disability in Frankfort
Health Insurance Coverage by Age in Frankfort
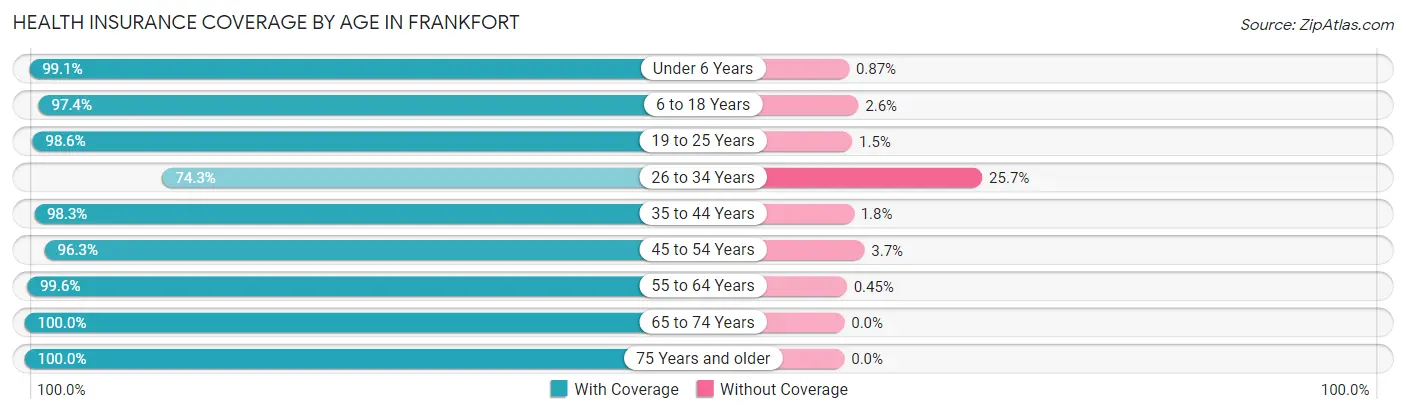
| Age Bracket | With Coverage | Without Coverage |
| Under 6 Years | 1,250 (99.1%) | 11 (0.9%) |
| 6 to 18 Years | 4,648 (97.4%) | 125 (2.6%) |
| 19 to 25 Years | 1,154 (98.6%) | 17 (1.5%) |
| 26 to 34 Years | 945 (74.3%) | 327 (25.7%) |
| 35 to 44 Years | 2,129 (98.3%) | 38 (1.8%) |
| 45 to 54 Years | 3,471 (96.3%) | 135 (3.7%) |
| 55 to 64 Years | 2,669 (99.6%) | 12 (0.4%) |
| 65 to 74 Years | 2,027 (100.0%) | 0 (0.0%) |
| 75 Years and older | 1,191 (100.0%) | 0 (0.0%) |
| Total | 19,484 (96.7%) | 665 (3.3%) |
Health Insurance Coverage by Citizenship Status in Frankfort
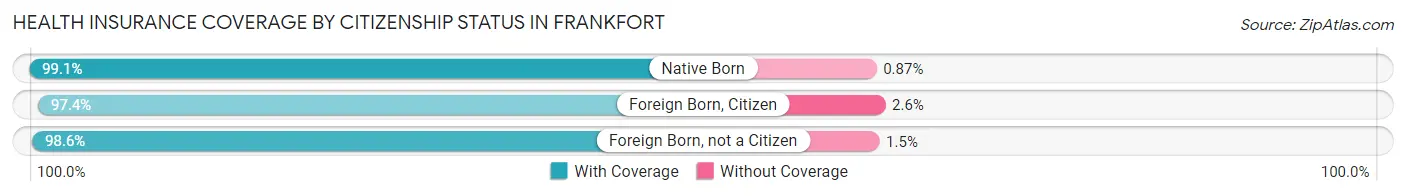
| Citizenship Status | With Coverage | Without Coverage |
| Native Born | 1,250 (99.1%) | 11 (0.9%) |
| Foreign Born, Citizen | 4,648 (97.4%) | 125 (2.6%) |
| Foreign Born, not a Citizen | 1,154 (98.6%) | 17 (1.5%) |
Health Insurance Coverage by Household Income in Frankfort
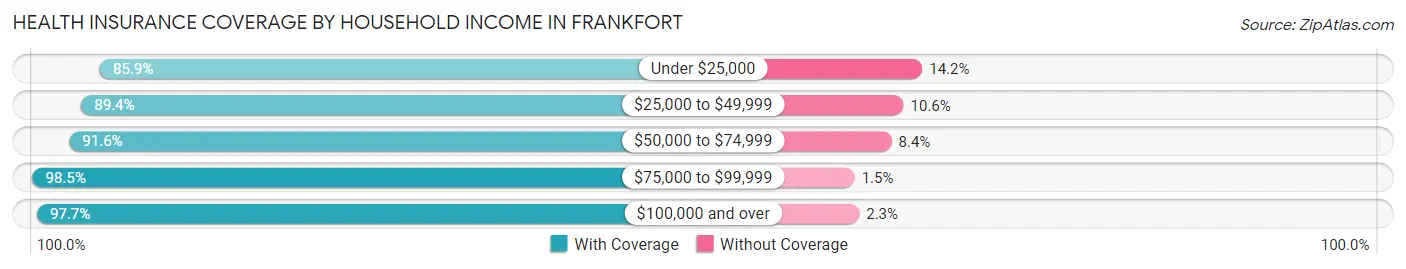
| Household Income | With Coverage | Without Coverage |
| Under $25,000 | 358 (85.9%) | 59 (14.1%) |
| $25,000 to $49,999 | 714 (89.4%) | 85 (10.6%) |
| $50,000 to $74,999 | 1,178 (91.6%) | 108 (8.4%) |
| $75,000 to $99,999 | 1,134 (98.5%) | 17 (1.5%) |
| $100,000 and over | 16,083 (97.7%) | 386 (2.3%) |
Public vs Private Health Insurance Coverage by Age in Frankfort
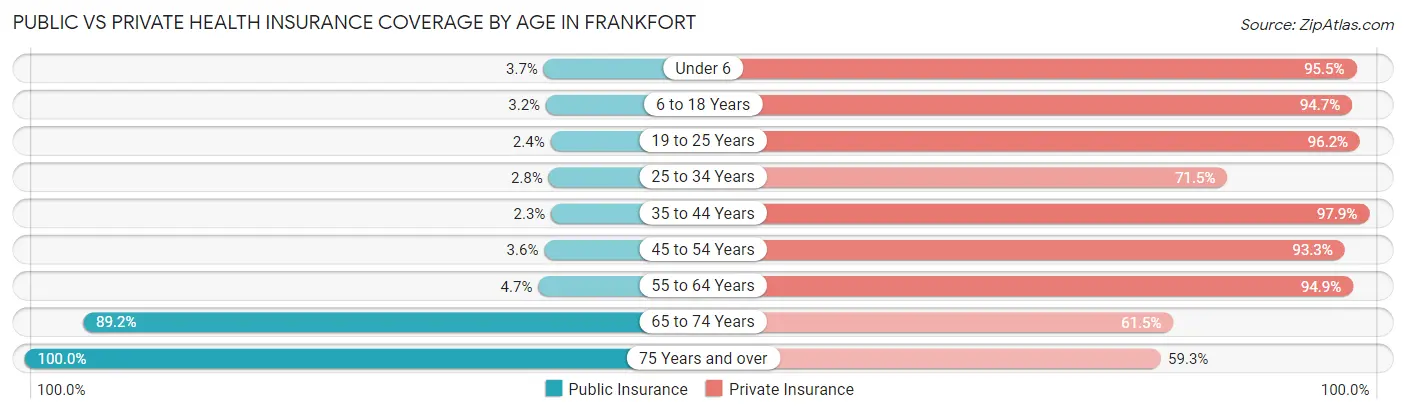
| Age Bracket | Public Insurance | Private Insurance |
| Under 6 | 46 (3.6%) | 1,204 (95.5%) |
| 6 to 18 Years | 154 (3.2%) | 4,520 (94.7%) |
| 19 to 25 Years | 28 (2.4%) | 1,126 (96.2%) |
| 25 to 34 Years | 35 (2.8%) | 910 (71.5%) |
| 35 to 44 Years | 49 (2.3%) | 2,121 (97.9%) |
| 45 to 54 Years | 128 (3.5%) | 3,365 (93.3%) |
| 55 to 64 Years | 125 (4.7%) | 2,544 (94.9%) |
| 65 to 74 Years | 1,807 (89.1%) | 1,247 (61.5%) |
| 75 Years and over | 1,191 (100.0%) | 706 (59.3%) |
| Total | 3,563 (17.7%) | 17,743 (88.1%) |
Disability Status by Sex by Age in Frankfort
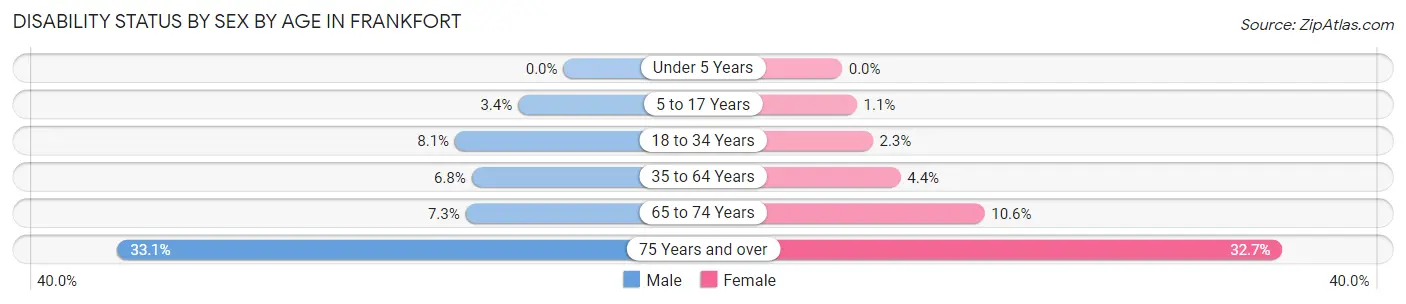
| Age Bracket | Male | Female |
| Under 5 Years | 0 (0.0%) | 0 (0.0%) |
| 5 to 17 Years | 84 (3.4%) | 25 (1.1%) |
| 18 to 34 Years | 118 (8.1%) | 29 (2.3%) |
| 35 to 64 Years | 275 (6.8%) | 192 (4.3%) |
| 65 to 74 Years | 82 (7.3%) | 95 (10.6%) |
| 75 Years and over | 201 (33.1%) | 191 (32.7%) |
Disability Class by Sex by Age in Frankfort
Disability Class: Hearing Difficulty
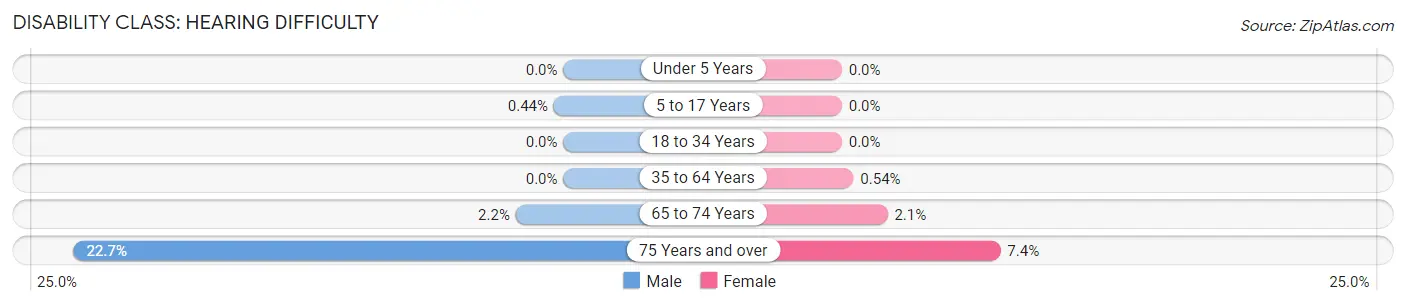
| Age Bracket | Male | Female |
| Under 5 Years | 0 (0.0%) | 0 (0.0%) |
| 5 to 17 Years | 11 (0.4%) | 0 (0.0%) |
| 18 to 34 Years | 0 (0.0%) | 0 (0.0%) |
| 35 to 64 Years | 0 (0.0%) | 24 (0.5%) |
| 65 to 74 Years | 25 (2.2%) | 19 (2.1%) |
| 75 Years and over | 138 (22.7%) | 43 (7.4%) |
Disability Class: Vision Difficulty
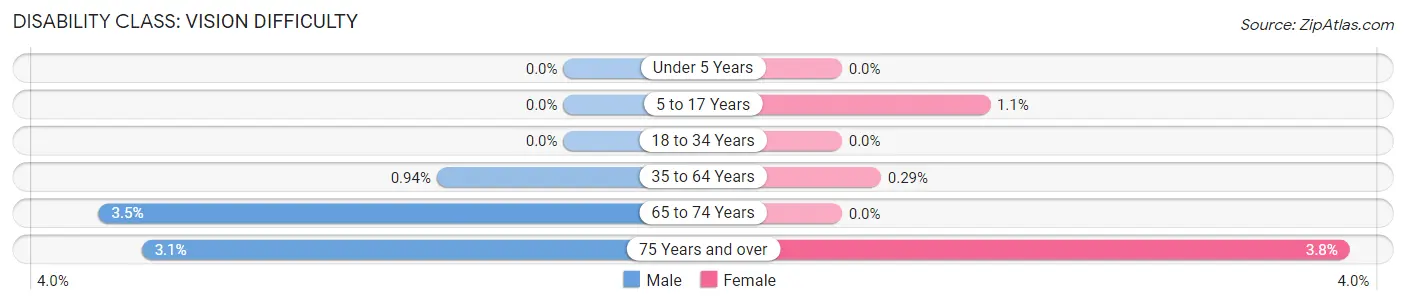
| Age Bracket | Male | Female |
| Under 5 Years | 0 (0.0%) | 0 (0.0%) |
| 5 to 17 Years | 0 (0.0%) | 25 (1.1%) |
| 18 to 34 Years | 0 (0.0%) | 0 (0.0%) |
| 35 to 64 Years | 38 (0.9%) | 13 (0.3%) |
| 65 to 74 Years | 39 (3.5%) | 0 (0.0%) |
| 75 Years and over | 19 (3.1%) | 22 (3.8%) |
Disability Class: Cognitive Difficulty
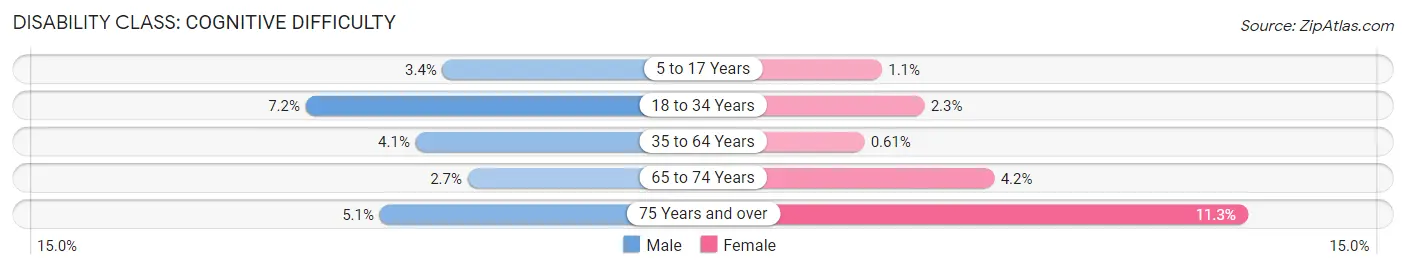
| Age Bracket | Male | Female |
| 5 to 17 Years | 84 (3.4%) | 25 (1.1%) |
| 18 to 34 Years | 105 (7.2%) | 29 (2.3%) |
| 35 to 64 Years | 166 (4.1%) | 27 (0.6%) |
| 65 to 74 Years | 30 (2.7%) | 38 (4.2%) |
| 75 Years and over | 31 (5.1%) | 66 (11.3%) |
Disability Class: Ambulatory Difficulty
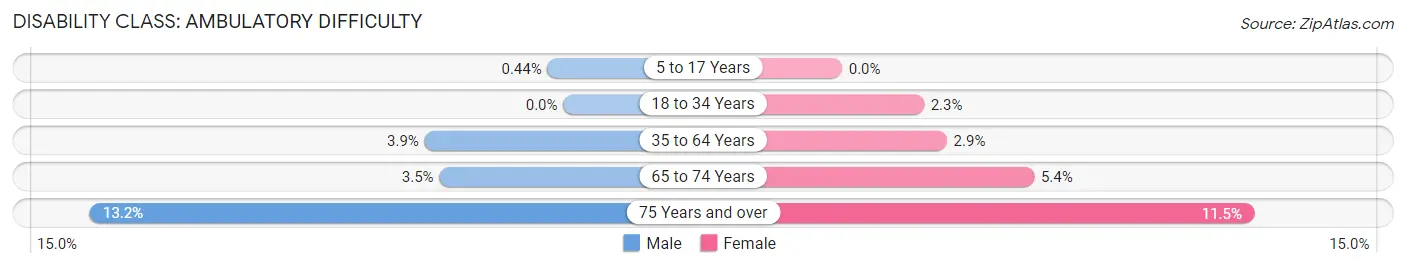
| Age Bracket | Male | Female |
| 5 to 17 Years | 11 (0.4%) | 0 (0.0%) |
| 18 to 34 Years | 0 (0.0%) | 29 (2.3%) |
| 35 to 64 Years | 156 (3.9%) | 129 (2.9%) |
| 65 to 74 Years | 39 (3.5%) | 48 (5.3%) |
| 75 Years and over | 80 (13.2%) | 67 (11.5%) |
Disability Class: Self-Care Difficulty
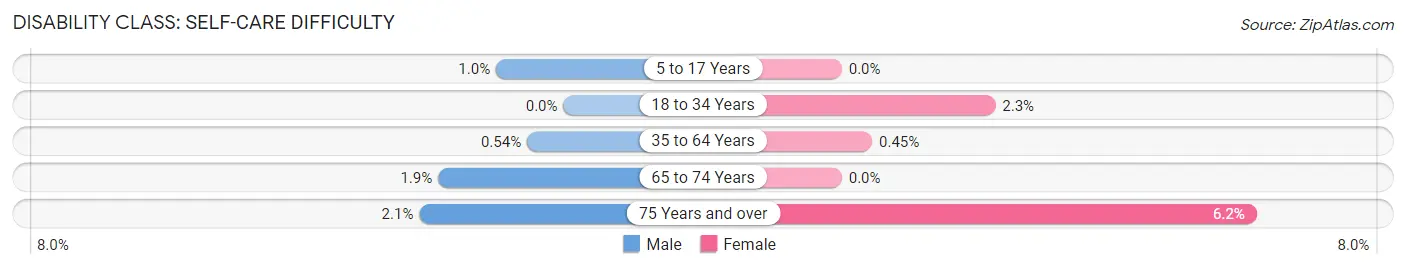
| Age Bracket | Male | Female |
| 5 to 17 Years | 25 (1.0%) | 0 (0.0%) |
| 18 to 34 Years | 0 (0.0%) | 29 (2.3%) |
| 35 to 64 Years | 22 (0.5%) | 20 (0.4%) |
| 65 to 74 Years | 21 (1.9%) | 0 (0.0%) |
| 75 Years and over | 13 (2.1%) | 36 (6.2%) |
Technology Access in Frankfort
Computing Device Access in Frankfort
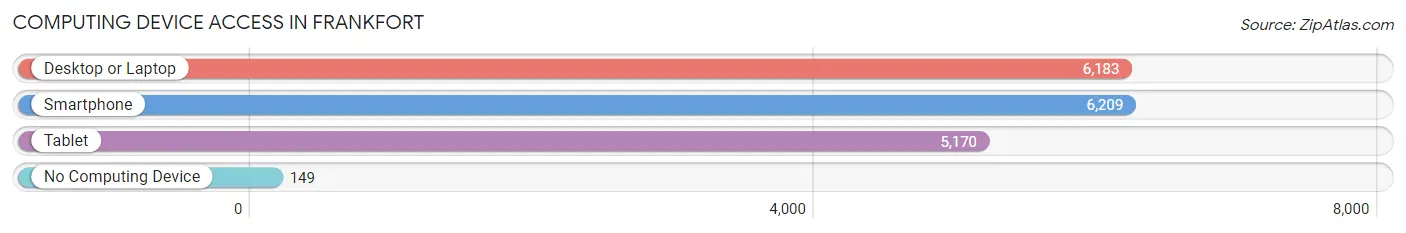
| Device Type | # Households | % Households |
| Desktop or Laptop | 6,183 | 94.0% |
| Smartphone | 6,209 | 94.4% |
| Tablet | 5,170 | 78.6% |
| No Computing Device | 149 | 2.3% |
| Total | 6,579 | 100.0% |
Internet Access in Frankfort
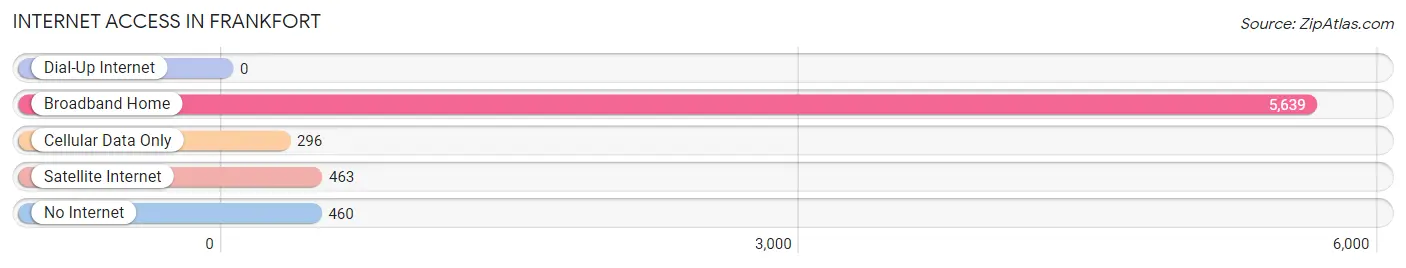
| Internet Type | # Households | % Households |
| Dial-Up Internet | 0 | 0.0% |
| Broadband Home | 5,639 | 85.7% |
| Cellular Data Only | 296 | 4.5% |
| Satellite Internet | 463 | 7.0% |
| No Internet | 460 | 7.0% |
| Total | 6,579 | 100.0% |
Frankfort Summary
Frankfort, Illinois is a village located in Will County, Illinois, United States. The population was 17,782 at the 2010 census, up from 10,391 in 2000. The village is a southwest suburb of Chicago and is part of the Chicago metropolitan area.
History
Frankfort was first settled in 1831 by German immigrants. The village was originally named Frankfort Station, after the town of Frankfurt, Germany. The village was incorporated in 1879.
Geography
Frankfort is located at 41°30'25" North, 87°51'17" West (41.506944, -87.854722). According to the 2010 census, Frankfort has a total area of 8.9 square miles, of which 8.8 square miles is land and 0.1 square miles is water.
Economy
Frankfort is home to several large employers, including the Frankfort Square Shopping Center, the Frankfort Public Library, and the Frankfort Park District. The village is also home to several small businesses, including restaurants, retail stores, and professional services.
Demographics
As of the 2010 census, there were 17,782 people, 6,717 households, and 4,845 families residing in the village. The population density was 2,019.3 people per square mile. The racial makeup of the village was 87.2% White, 4.3% African American, 0.2% Native American, 4.7% Asian, 0.1% Pacific Islander, 1.7% from other races, and 2.0% from two or more races. Hispanic or Latino of any race were 6.7% of the population.
The median income for a household in the village was $76,845, and the median income for a family was $90,945. The per capita income for the village was $33,945. About 2.3% of families and 3.2% of the population were below the poverty line, including 3.7% of those under age 18 and 4.2% of those age 65 or over.
Conclusion
Frankfort, Illinois is a village located in Will County, Illinois, United States. The village is a southwest suburb of Chicago and is part of the Chicago metropolitan area. It was first settled in 1831 by German immigrants and was incorporated in 1879. The village has a total area of 8.9 square miles, of which 8.8 square miles is land and 0.1 square miles is water. The population was 17,782 at the 2010 census, up from 10,391 in 2000. The village is home to several large employers, including the Frankfort Square Shopping Center, the Frankfort Public Library, and the Frankfort Park District. The median income for a household in the village was $76,845, and the median income for a family was $90,945. The racial makeup of the village was 87.2% White, 4.3% African American, 0.2% Native American, 4.7% Asian, 0.1% Pacific Islander, 1.7% from other races, and 2.0% from two or more races. Hispanic or Latino of any race were 6.7% of the population.
Common Questions
What is Per Capita Income in Frankfort?
Per Capita income in Frankfort is $60,328.
What is the Median Family Income in Frankfort?
Median Family Income in Frankfort is $174,391.
What is the Median Household income in Frankfort?
Median Household Income in Frankfort is $157,615.
What is Income or Wage Gap in Frankfort?
Income or Wage Gap in Frankfort is 44.1%.
Women in Frankfort earn 55.9 cents for every dollar earned by a man.
What is Family Income Deficit in Frankfort?
Family Income Deficit in Frankfort is $9,226.
Families that are below poverty line in Frankfort earn $9,226 less on average than the poverty threshold level.
What is Inequality or Gini Index in Frankfort?
Inequality or Gini Index in Frankfort is 0.38.
What is the Total Population of Frankfort?
Total Population of Frankfort is 20,260.
What is the Total Male Population of Frankfort?
Total Male Population of Frankfort is 10,357.
What is the Total Female Population of Frankfort?
Total Female Population of Frankfort is 9,903.
What is the Ratio of Males per 100 Females in Frankfort?
There are 104.58 Males per 100 Females in Frankfort.
What is the Ratio of Females per 100 Males in Frankfort?
There are 95.62 Females per 100 Males in Frankfort.
What is the Median Population Age in Frankfort?
Median Population Age in Frankfort is 42.6 Years.
What is the Average Family Size in Frankfort
Average Family Size in Frankfort is 3.4 People.
What is the Average Household Size in Frankfort
Average Household Size in Frankfort is 3.1 People.
How Large is the Labor Force in Frankfort?
There are 10,721 People in the Labor Forcein in Frankfort.
What is the Percentage of People in the Labor Force in Frankfort?
69.1% of People are in the Labor Force in Frankfort.
What is the Unemployment Rate in Frankfort?
Unemployment Rate in Frankfort is 3.8%.