Park Ridge, IL Map & Demographics
Park Ridge Map
Park Ridge Overview
$69,765
PER CAPITA INCOME
$172,255
AVG FAMILY INCOME
$137,964
AVG HOUSEHOLD INCOME
34.6%
WAGE / INCOME GAP [ % ]
65.4¢/ $1
WAGE / INCOME GAP [ $ ]
0.45
INEQUALITY / GINI INDEX
39,368
TOTAL POPULATION
19,620
MALE POPULATION
19,748
FEMALE POPULATION
99.35
MALES / 100 FEMALES
100.65
FEMALES / 100 MALES
45.1
MEDIAN AGE
3.1
AVG FAMILY SIZE
2.5
AVG HOUSEHOLD SIZE
20,435
LABOR FORCE [ PEOPLE ]
65.7%
PERCENT IN LABOR FORCE
3.5%
UNEMPLOYMENT RATE
Park Ridge Zip Codes
Income in Park Ridge
Income Overview in Park Ridge
Per Capita Income in Park Ridge is $69,765, while median incomes of families and households are $172,255 and $137,964 respectively.
| Characteristic | Number | Measure |
| Per Capita Income | 39,368 | $69,765 |
| Median Family Income | 11,110 | $172,255 |
| Mean Family Income | 11,110 | $209,392 |
| Median Household Income | 15,234 | $137,964 |
| Mean Household Income | 15,234 | $178,577 |
| Income Deficit | 11,110 | $0 |
| Wage / Income Gap (%) | 39,368 | 34.57% |
| Wage / Income Gap ($) | 39,368 | 65.43¢ per $1 |
| Gini / Inequality Index | 39,368 | 0.45 |
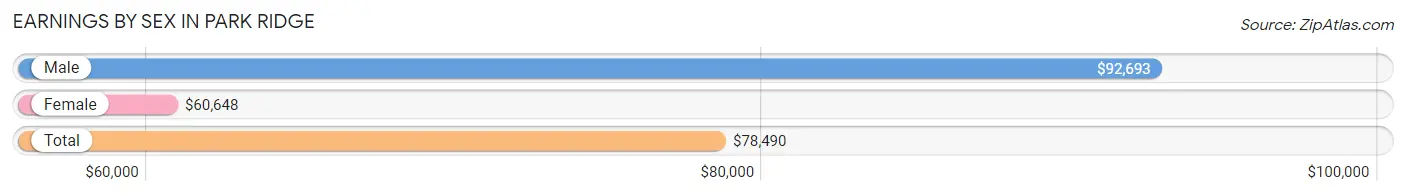
Earnings by Sex in Park Ridge
Average Earnings in Park Ridge are $78,490, $92,693 for men and $60,648 for women, a difference of 34.6%.
| Sex | Number | Average Earnings |
| Male | 11,295 (53.1%) | $92,693 |
| Female | 9,984 (46.9%) | $60,648 |
| Total | 21,279 (100.0%) | $78,490 |
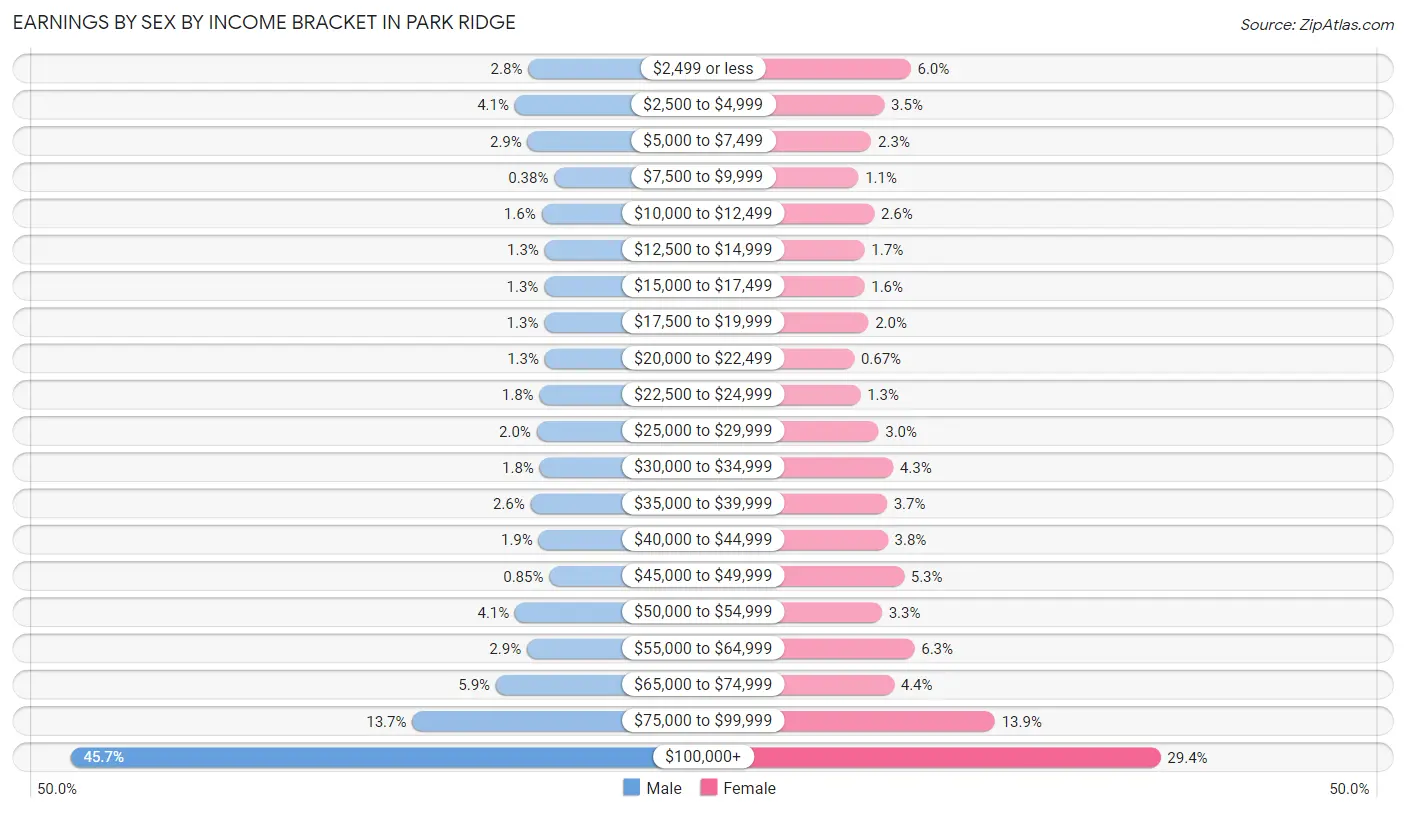
Earnings by Sex by Income Bracket in Park Ridge
The most common earnings brackets in Park Ridge are $100,000+ for men (5,162 | 45.7%) and $100,000+ for women (2,933 | 29.4%).
| Income | Male | Female |
| $2,499 or less | 318 (2.8%) | 596 (6.0%) |
| $2,500 to $4,999 | 461 (4.1%) | 349 (3.5%) |
| $5,000 to $7,499 | 325 (2.9%) | 228 (2.3%) |
| $7,500 to $9,999 | 43 (0.4%) | 107 (1.1%) |
| $10,000 to $12,499 | 178 (1.6%) | 255 (2.5%) |
| $12,500 to $14,999 | 145 (1.3%) | 165 (1.7%) |
| $15,000 to $17,499 | 150 (1.3%) | 164 (1.6%) |
| $17,500 to $19,999 | 149 (1.3%) | 201 (2.0%) |
| $20,000 to $22,499 | 143 (1.3%) | 67 (0.7%) |
| $22,500 to $24,999 | 200 (1.8%) | 126 (1.3%) |
| $25,000 to $29,999 | 229 (2.0%) | 295 (2.9%) |
| $30,000 to $34,999 | 198 (1.8%) | 431 (4.3%) |
| $35,000 to $39,999 | 294 (2.6%) | 373 (3.7%) |
| $40,000 to $44,999 | 209 (1.8%) | 381 (3.8%) |
| $45,000 to $49,999 | 96 (0.9%) | 533 (5.3%) |
| $50,000 to $54,999 | 457 (4.1%) | 326 (3.3%) |
| $55,000 to $64,999 | 332 (2.9%) | 631 (6.3%) |
| $65,000 to $74,999 | 661 (5.9%) | 439 (4.4%) |
| $75,000 to $99,999 | 1,545 (13.7%) | 1,384 (13.9%) |
| $100,000+ | 5,162 (45.7%) | 2,933 (29.4%) |
| Total | 11,295 (100.0%) | 9,984 (100.0%) |
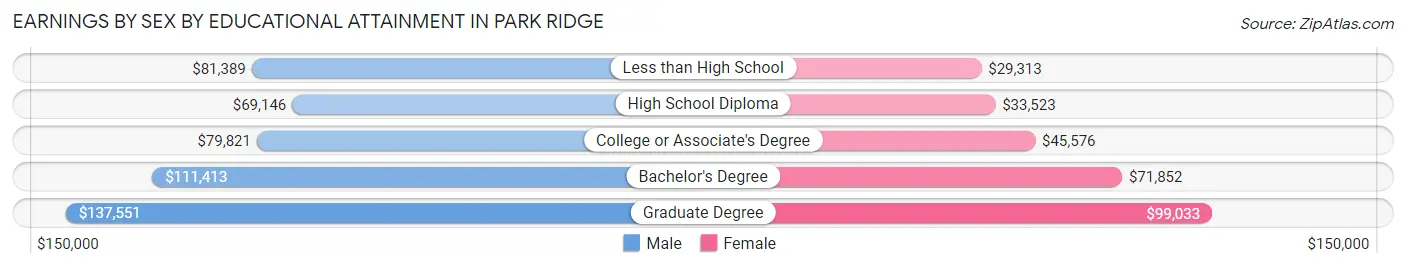
Earnings by Sex by Educational Attainment in Park Ridge
Average earnings in Park Ridge are $101,276 for men and $70,613 for women, a difference of 30.3%. Men with an educational attainment of graduate degree enjoy the highest average annual earnings of $137,551, while those with high school diploma education earn the least with $69,146. Women with an educational attainment of graduate degree earn the most with the average annual earnings of $99,033, while those with less than high school education have the smallest earnings of $29,313.
| Educational Attainment | Male Income | Female Income |
| Less than High School | $81,389 | $29,313 |
| High School Diploma | $69,146 | $33,523 |
| College or Associate's Degree | $79,821 | $45,576 |
| Bachelor's Degree | $111,413 | $71,852 |
| Graduate Degree | $137,551 | $99,033 |
| Total | $101,276 | $70,613 |
Family Income in Park Ridge
Family Income Brackets in Park Ridge
According to the Park Ridge family income data, there are 4,822 families falling into the $200,000+ income range, which is the most common income bracket and makes up 43.4% of all families. Conversely, the $10,000 to $14,999 income bracket is the least frequent group with only 67 families (0.6%) belonging to this category.
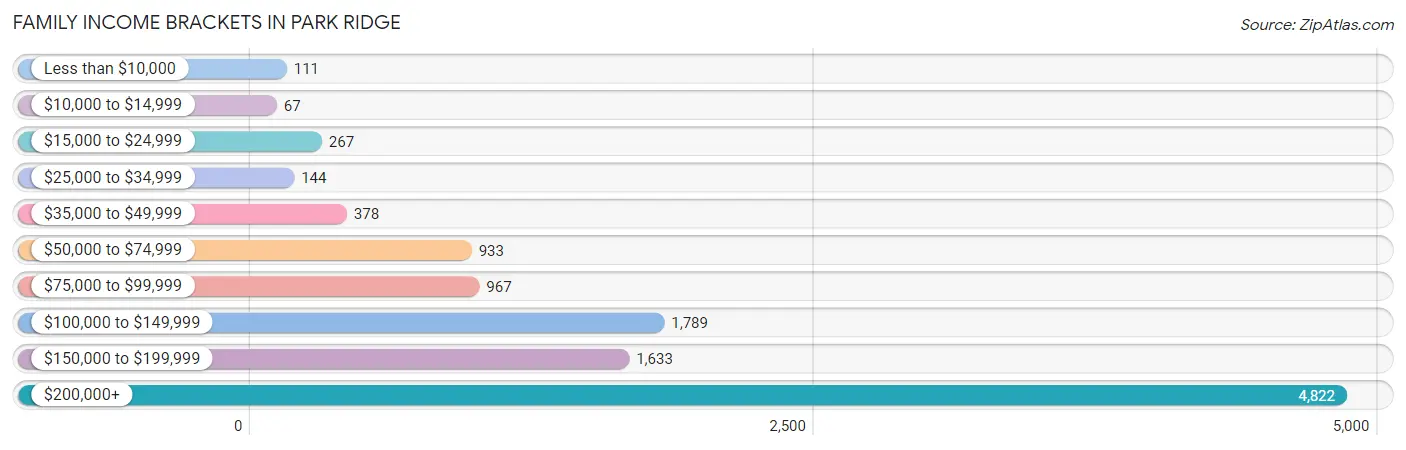
| Income Bracket | # Families | % Families |
| Less than $10,000 | 111 | 1.0% |
| $10,000 to $14,999 | 67 | 0.6% |
| $15,000 to $24,999 | 267 | 2.4% |
| $25,000 to $34,999 | 144 | 1.3% |
| $35,000 to $49,999 | 378 | 3.4% |
| $50,000 to $74,999 | 933 | 8.4% |
| $75,000 to $99,999 | 967 | 8.7% |
| $100,000 to $149,999 | 1,789 | 16.1% |
| $150,000 to $199,999 | 1,633 | 14.7% |
| $200,000+ | 4,822 | 43.4% |
Family Income by Famaliy Size in Park Ridge
5-person families (668 | 6.0%) account for the highest median family income in Park Ridge with $250,001 per family, while 2-person families (4,892 | 44.0%) have the highest median income of $65,000 per family member.
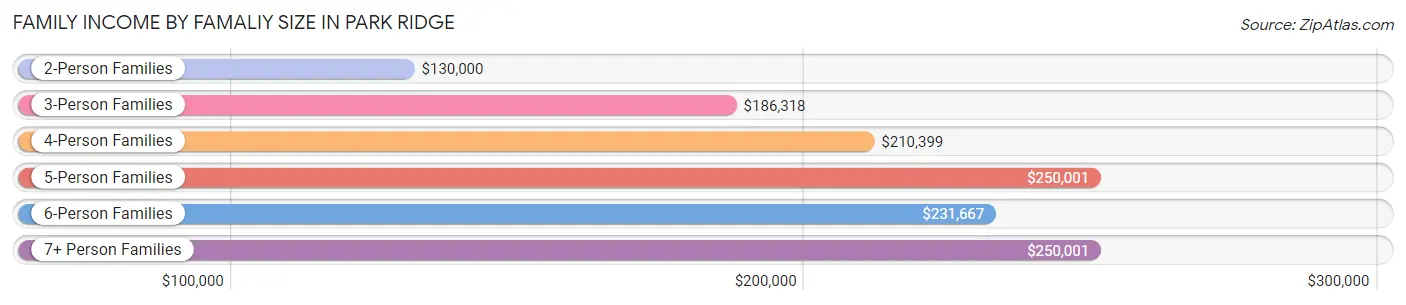
| Income Bracket | # Families | Median Income |
| 2-Person Families | 4,892 (44.0%) | $130,000 |
| 3-Person Families | 2,469 (22.2%) | $186,318 |
| 4-Person Families | 2,849 (25.6%) | $210,399 |
| 5-Person Families | 668 (6.0%) | $250,001 |
| 6-Person Families | 152 (1.4%) | $231,667 |
| 7+ Person Families | 80 (0.7%) | $250,001 |
| Total | 11,110 (100.0%) | $172,255 |
Family Income by Number of Earners in Park Ridge
The median family income in Park Ridge is $172,255, with families comprising 2 earners (5,230) having the highest median family income of $224,955, while families with no earners (1,422) have the lowest median family income of $83,698, accounting for 47.1% and 12.8% of families, respectively.
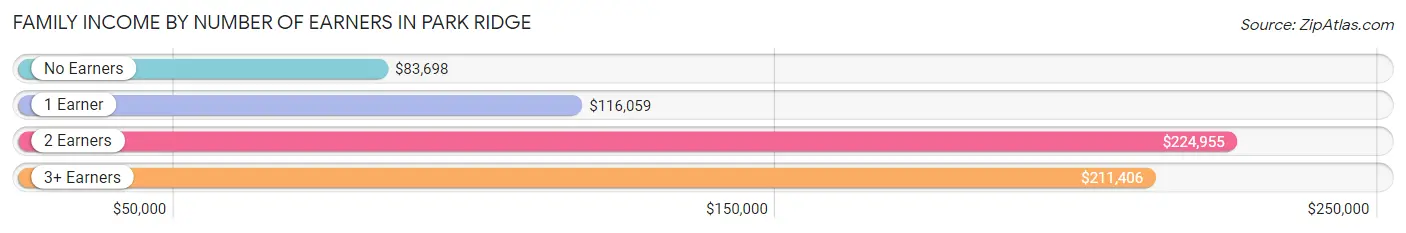
| Number of Earners | # Families | Median Income |
| No Earners | 1,422 (12.8%) | $83,698 |
| 1 Earner | 2,989 (26.9%) | $116,059 |
| 2 Earners | 5,230 (47.1%) | $224,955 |
| 3+ Earners | 1,469 (13.2%) | $211,406 |
| Total | 11,110 (100.0%) | $172,255 |
Household Income in Park Ridge
Household Income Brackets in Park Ridge
With 5,301 households falling in the category, the $200,000+ income range is the most frequent in Park Ridge, accounting for 34.8% of all households. In contrast, only 198 households (1.3%) fall into the $10,000 to $14,999 income bracket, making it the least populous group.
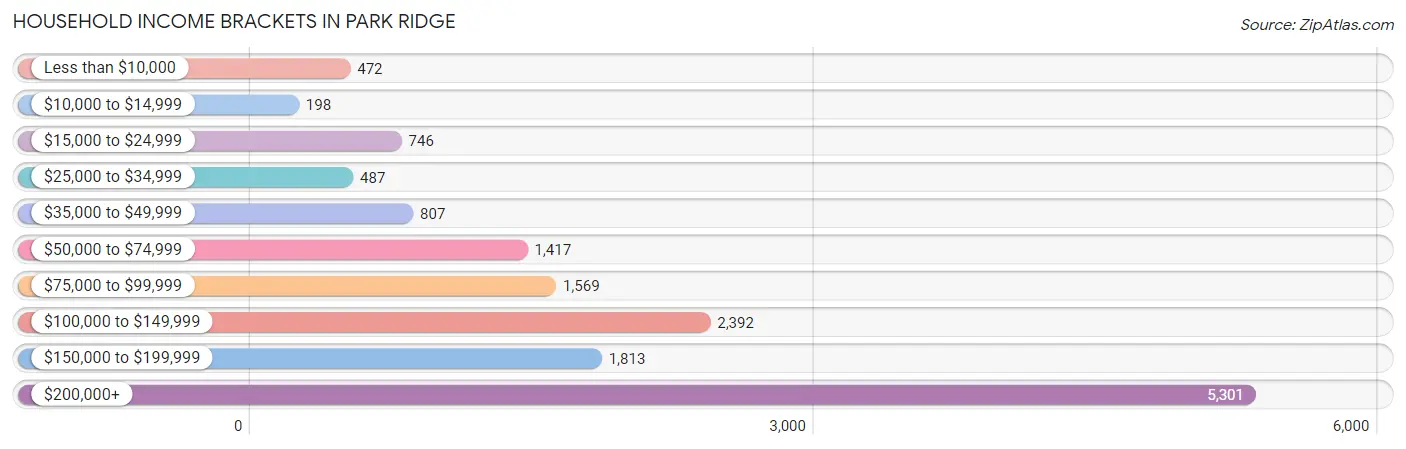
| Income Bracket | # Households | % Households |
| Less than $10,000 | 472 | 3.1% |
| $10,000 to $14,999 | 198 | 1.3% |
| $15,000 to $24,999 | 746 | 4.9% |
| $25,000 to $34,999 | 487 | 3.2% |
| $35,000 to $49,999 | 807 | 5.3% |
| $50,000 to $74,999 | 1,417 | 9.3% |
| $75,000 to $99,999 | 1,569 | 10.3% |
| $100,000 to $149,999 | 2,392 | 15.7% |
| $150,000 to $199,999 | 1,813 | 11.9% |
| $200,000+ | 5,301 | 34.8% |
Household Income by Householder Age in Park Ridge
The median household income in Park Ridge is $137,964, with the highest median household income of $202,377 found in the 25 to 44 years age bracket for the primary householder. A total of 3,456 households (22.7%) fall into this category. Meanwhile, the 15 to 24 years age bracket for the primary householder has the lowest median household income of $0, with 56 households (0.4%) in this group.
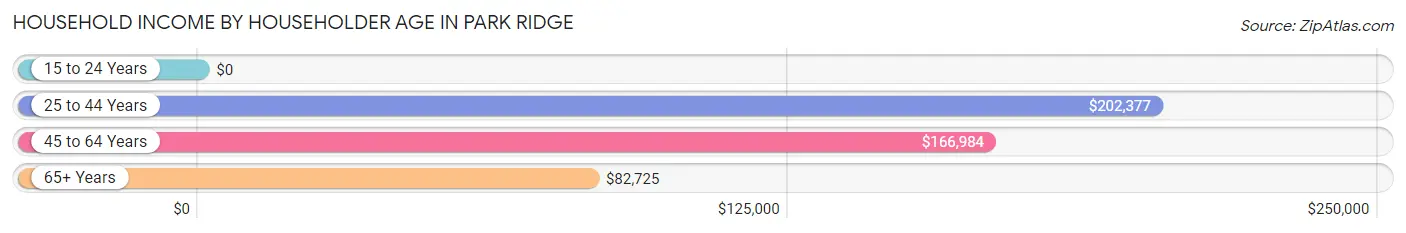
| Income Bracket | # Households | Median Income |
| 15 to 24 Years | 56 (0.4%) | $0 |
| 25 to 44 Years | 3,456 (22.7%) | $202,377 |
| 45 to 64 Years | 6,752 (44.3%) | $166,984 |
| 65+ Years | 4,970 (32.6%) | $82,725 |
| Total | 15,234 (100.0%) | $137,964 |
Poverty in Park Ridge
Income Below Poverty by Sex and Age in Park Ridge
With 3.3% poverty level for males and 5.3% for females among the residents of Park Ridge, 15 year old males and 45 to 54 year old females are the most vulnerable to poverty, with 22 males (11.2%) and 349 females (11.8%) in their respective age groups living below the poverty level.
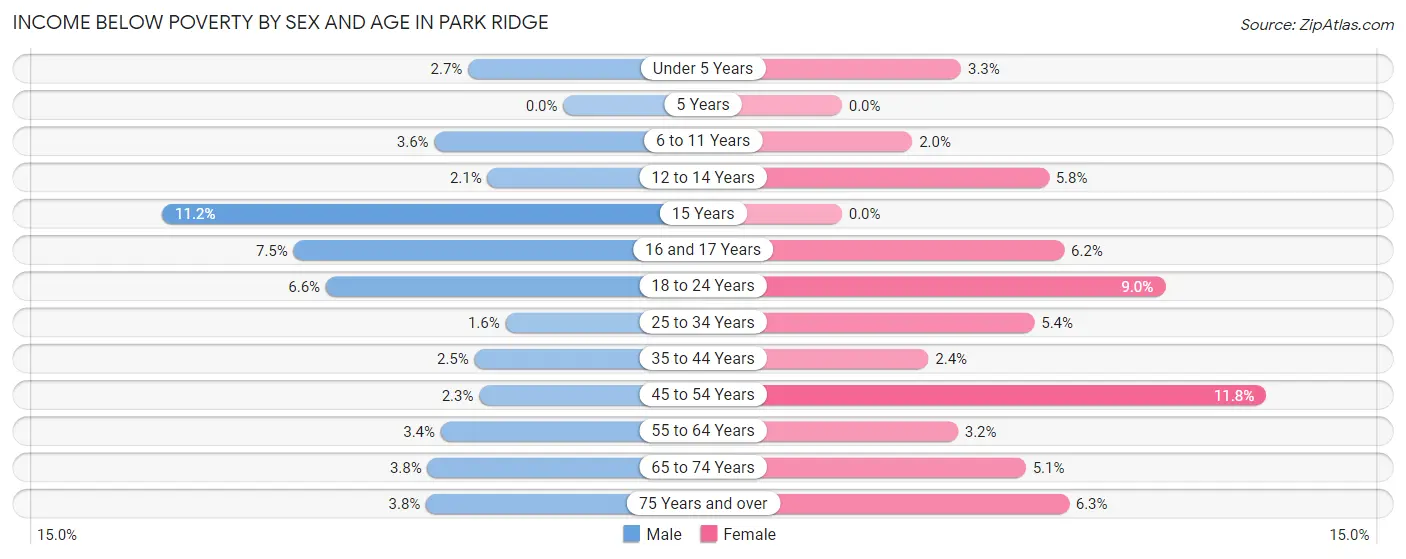
| Age Bracket | Male | Female |
| Under 5 Years | 33 (2.6%) | 33 (3.3%) |
| 5 Years | 0 (0.0%) | 0 (0.0%) |
| 6 to 11 Years | 66 (3.6%) | 31 (2.0%) |
| 12 to 14 Years | 21 (2.1%) | 26 (5.8%) |
| 15 Years | 22 (11.2%) | 0 (0.0%) |
| 16 and 17 Years | 26 (7.5%) | 38 (6.2%) |
| 18 to 24 Years | 92 (6.6%) | 88 (9.0%) |
| 25 to 34 Years | 23 (1.6%) | 66 (5.4%) |
| 35 to 44 Years | 66 (2.5%) | 65 (2.4%) |
| 45 to 54 Years | 55 (2.3%) | 349 (11.8%) |
| 55 to 64 Years | 104 (3.4%) | 104 (3.2%) |
| 65 to 74 Years | 82 (3.8%) | 103 (5.1%) |
| 75 Years and over | 54 (3.8%) | 136 (6.3%) |
| Total | 644 (3.3%) | 1,039 (5.3%) |
Income Above Poverty by Sex and Age in Park Ridge
According to the poverty statistics in Park Ridge, males aged 5 years and females aged 5 years are the age groups that are most secure financially, with 100.0% of males and 100.0% of females in these age groups living above the poverty line.
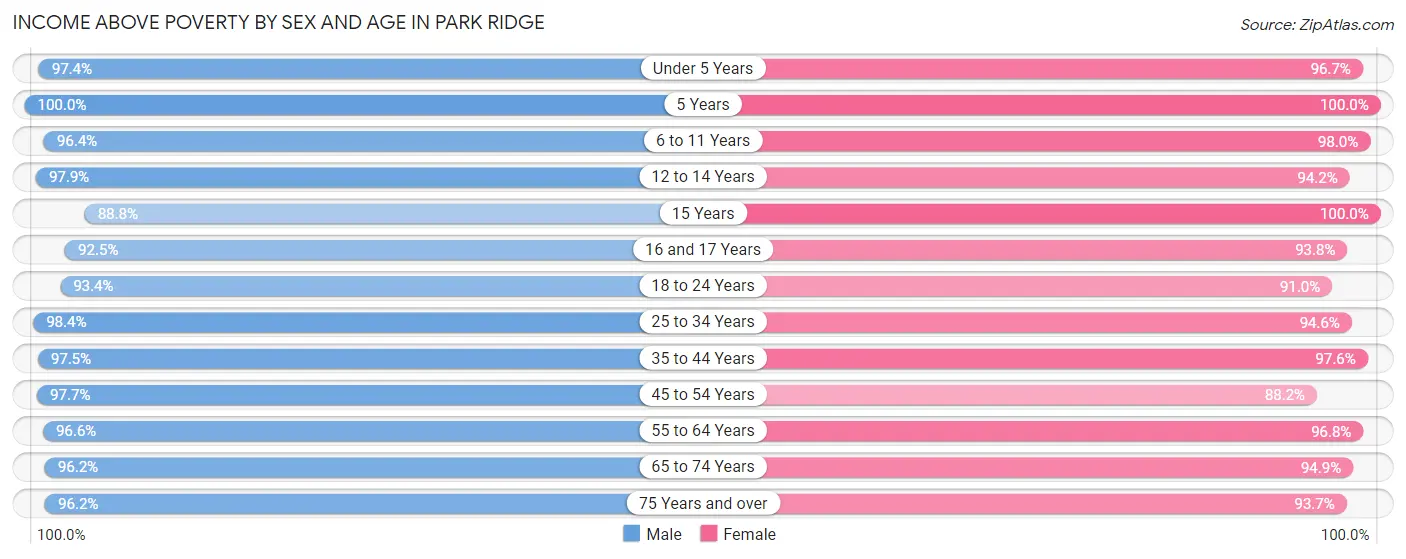
| Age Bracket | Male | Female |
| Under 5 Years | 1,210 (97.4%) | 960 (96.7%) |
| 5 Years | 354 (100.0%) | 293 (100.0%) |
| 6 to 11 Years | 1,774 (96.4%) | 1,547 (98.0%) |
| 12 to 14 Years | 973 (97.9%) | 425 (94.2%) |
| 15 Years | 175 (88.8%) | 316 (100.0%) |
| 16 and 17 Years | 320 (92.5%) | 576 (93.8%) |
| 18 to 24 Years | 1,299 (93.4%) | 890 (91.0%) |
| 25 to 34 Years | 1,405 (98.4%) | 1,165 (94.6%) |
| 35 to 44 Years | 2,603 (97.5%) | 2,635 (97.6%) |
| 45 to 54 Years | 2,300 (97.7%) | 2,606 (88.2%) |
| 55 to 64 Years | 2,945 (96.6%) | 3,111 (96.8%) |
| 65 to 74 Years | 2,085 (96.2%) | 1,907 (94.9%) |
| 75 Years and over | 1,359 (96.2%) | 2,017 (93.7%) |
| Total | 18,802 (96.7%) | 18,448 (94.7%) |
Income Below Poverty Among Married-Couple Families in Park Ridge
The poverty statistics for married-couple families in Park Ridge show that 1.7% or 159 of the total 9,186 families live below the poverty line. Families with 1 or 2 children have the highest poverty rate of 2.0%, comprising of 68 families. On the other hand, families with 5 or more children have the lowest poverty rate of 0.0%, which includes 0 families.
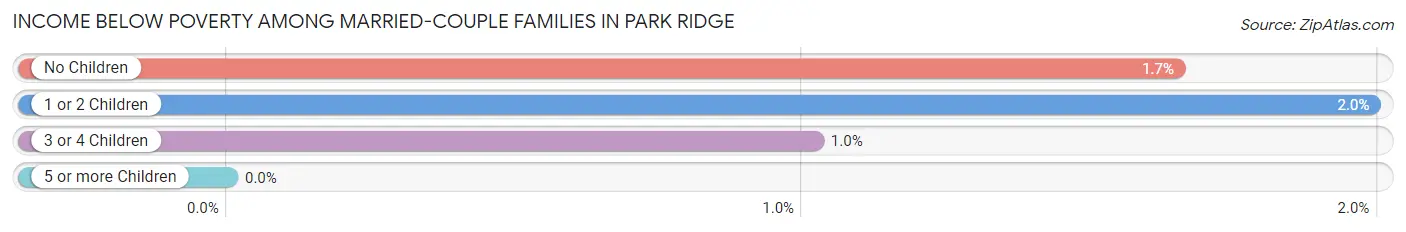
| Children | Above Poverty | Below Poverty |
| No Children | 5,062 (98.4%) | 85 (1.7%) |
| 1 or 2 Children | 3,341 (98.0%) | 68 (2.0%) |
| 3 or 4 Children | 585 (99.0%) | 6 (1.0%) |
| 5 or more Children | 39 (100.0%) | 0 (0.0%) |
| Total | 9,027 (98.3%) | 159 (1.7%) |
Income Below Poverty Among Single-Parent Households in Park Ridge
According to the poverty data in Park Ridge, 2.4% or 10 single-father households and 8.5% or 127 single-mother households are living below the poverty line. Among single-father households, those with 1 or 2 children have the highest poverty rate, with 10 households (4.8%) experiencing poverty. Likewise, among single-mother households, those with 3 or 4 children have the highest poverty rate, with 10 households (83.3%) falling below the poverty line.
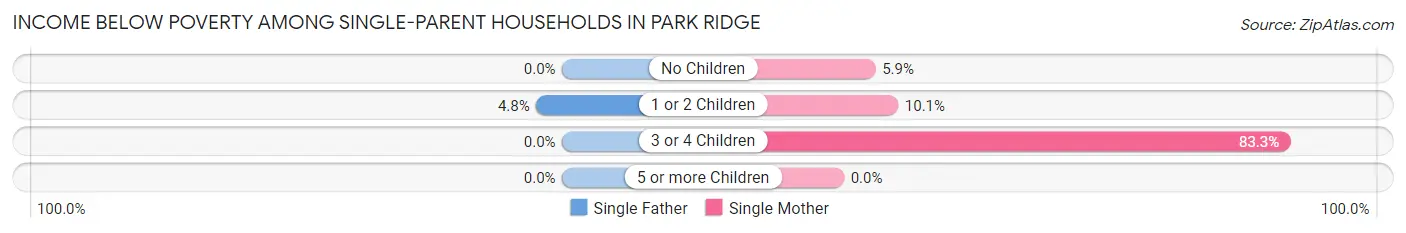
| Children | Single Father | Single Mother |
| No Children | 0 (0.0%) | 46 (5.9%) |
| 1 or 2 Children | 10 (4.8%) | 71 (10.1%) |
| 3 or 4 Children | 0 (0.0%) | 10 (83.3%) |
| 5 or more Children | 0 (0.0%) | 0 (0.0%) |
| Total | 10 (2.4%) | 127 (8.5%) |
Income Below Poverty Among Married-Couple vs Single-Parent Households in Park Ridge
The poverty data for Park Ridge shows that 159 of the married-couple family households (1.7%) and 137 of the single-parent households (7.1%) are living below the poverty level. Within the married-couple family households, those with 1 or 2 children have the highest poverty rate, with 68 households (2.0%) falling below the poverty line. Among the single-parent households, those with 3 or 4 children have the highest poverty rate, with 10 household (33.3%) living below poverty.
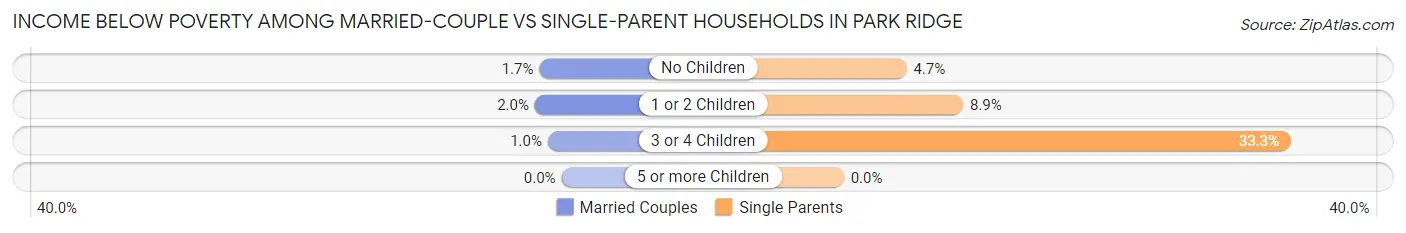
| Children | Married-Couple Families | Single-Parent Households |
| No Children | 85 (1.7%) | 46 (4.7%) |
| 1 or 2 Children | 68 (2.0%) | 81 (8.9%) |
| 3 or 4 Children | 6 (1.0%) | 10 (33.3%) |
| 5 or more Children | 0 (0.0%) | 0 (0.0%) |
| Total | 159 (1.7%) | 137 (7.1%) |
Race in Park Ridge
The most populous races in Park Ridge are White / Caucasian (33,529 | 85.2%), Asian (2,505 | 6.4%), and Hispanic or Latino (2,477 | 6.3%).
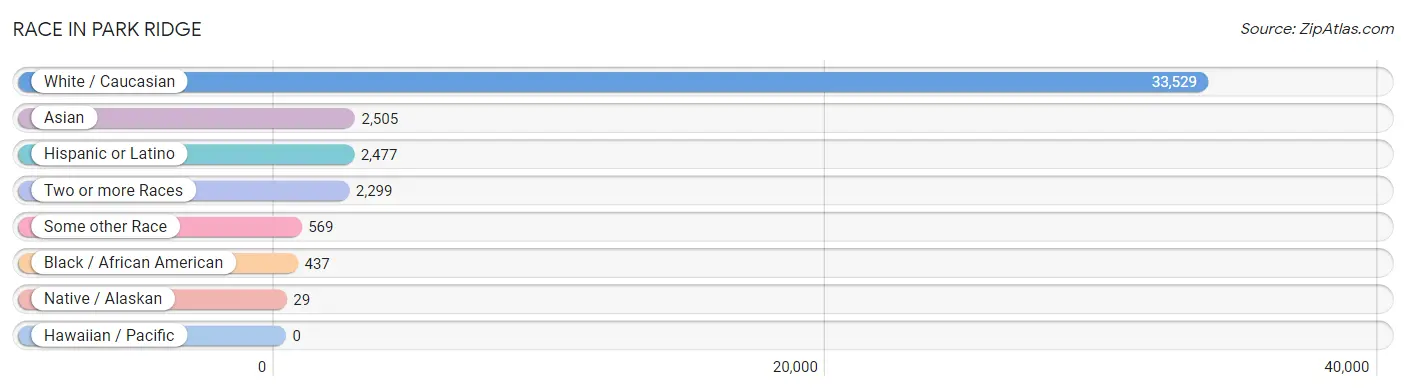
| Race | # Population | % Population |
| Asian | 2,505 | 6.4% |
| Black / African American | 437 | 1.1% |
| Hawaiian / Pacific | 0 | 0.0% |
| Hispanic or Latino | 2,477 | 6.3% |
| Native / Alaskan | 29 | 0.1% |
| White / Caucasian | 33,529 | 85.2% |
| Two or more Races | 2,299 | 5.8% |
| Some other Race | 569 | 1.5% |
| Total | 39,368 | 100.0% |
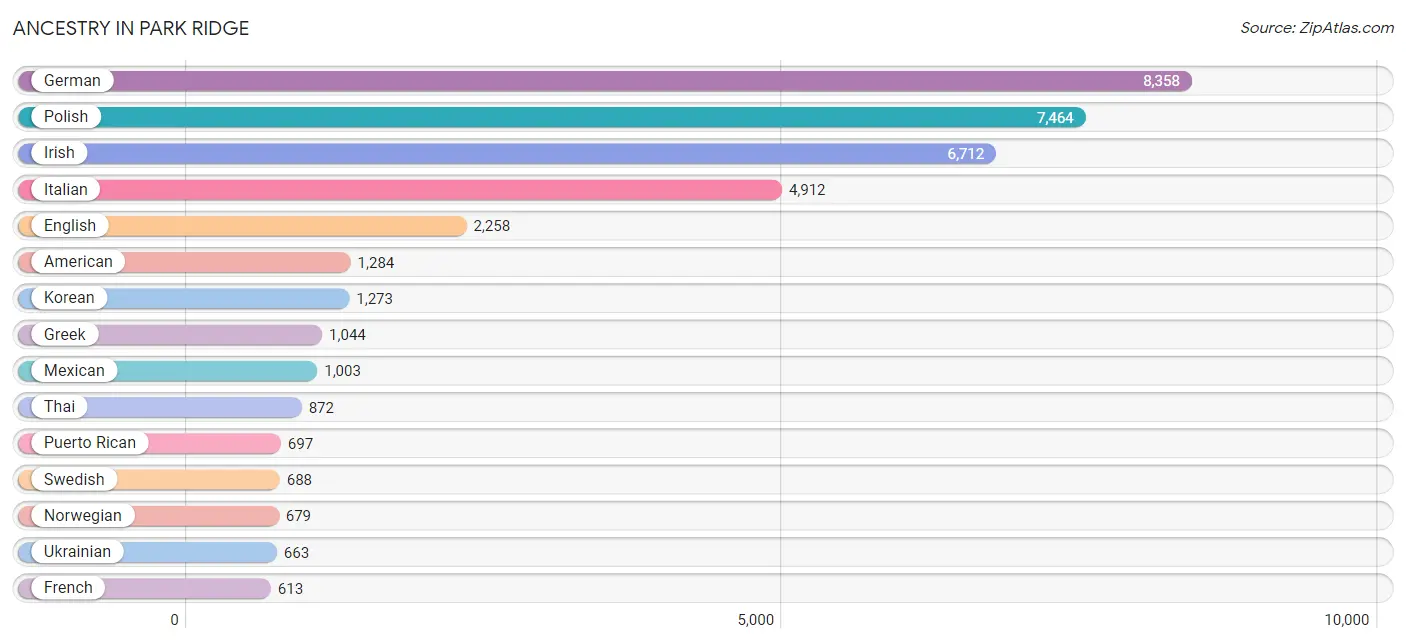
Ancestry in Park Ridge
The most populous ancestries reported in Park Ridge are German (8,358 | 21.2%), Polish (7,464 | 19.0%), Irish (6,712 | 17.1%), Italian (4,912 | 12.5%), and English (2,258 | 5.7%), together accounting for 75.5% of all Park Ridge residents.
| Ancestry | # Population | % Population |
| African | 60 | 0.2% |
| Albanian | 84 | 0.2% |
| American | 1,284 | 3.3% |
| Arab | 290 | 0.7% |
| Argentinean | 24 | 0.1% |
| Armenian | 134 | 0.3% |
| Assyrian / Chaldean / Syriac | 206 | 0.5% |
| Australian | 3 | 0.0% |
| Austrian | 341 | 0.9% |
| Belgian | 434 | 1.1% |
| Bhutanese | 350 | 0.9% |
| Brazilian | 21 | 0.1% |
| British | 72 | 0.2% |
| Bulgarian | 91 | 0.2% |
| Burmese | 231 | 0.6% |
| Cambodian | 32 | 0.1% |
| Canadian | 24 | 0.1% |
| Central American | 48 | 0.1% |
| Central American Indian | 11 | 0.0% |
| Cherokee | 25 | 0.1% |
| Choctaw | 51 | 0.1% |
| Colombian | 156 | 0.4% |
| Croatian | 221 | 0.6% |
| Cuban | 141 | 0.4% |
| Czech | 457 | 1.2% |
| Czechoslovakian | 179 | 0.4% |
| Danish | 153 | 0.4% |
| Dominican | 110 | 0.3% |
| Dutch | 397 | 1.0% |
| Eastern European | 151 | 0.4% |
| Ecuadorian | 108 | 0.3% |
| Egyptian | 44 | 0.1% |
| English | 2,258 | 5.7% |
| European | 538 | 1.4% |
| Filipino | 24 | 0.1% |
| Finnish | 69 | 0.2% |
| French | 613 | 1.6% |
| French Canadian | 75 | 0.2% |
| German | 8,358 | 21.2% |
| Greek | 1,044 | 2.6% |
| Guatemalan | 10 | 0.0% |
| Honduran | 30 | 0.1% |
| Hungarian | 138 | 0.4% |
| Indian (Asian) | 296 | 0.7% |
| Iranian | 111 | 0.3% |
| Iraqi | 135 | 0.3% |
| Irish | 6,712 | 17.1% |
| Israeli | 4 | 0.0% |
| Italian | 4,912 | 12.5% |
| Japanese | 62 | 0.2% |
| Korean | 1,273 | 3.2% |
| Latvian | 71 | 0.2% |
| Lebanese | 63 | 0.2% |
| Lithuanian | 216 | 0.5% |
| Luxembourger | 39 | 0.1% |
| Macedonian | 83 | 0.2% |
| Malaysian | 36 | 0.1% |
| Mexican | 1,003 | 2.5% |
| Mexican American Indian | 64 | 0.2% |
| Mongolian | 8 | 0.0% |
| Navajo | 45 | 0.1% |
| Nigerian | 1 | 0.0% |
| Northern European | 12 | 0.0% |
| Norwegian | 679 | 1.7% |
| Pakistani | 193 | 0.5% |
| Palestinian | 9 | 0.0% |
| Panamanian | 8 | 0.0% |
| Pennsylvania German | 14 | 0.0% |
| Polish | 7,464 | 19.0% |
| Portuguese | 11 | 0.0% |
| Puerto Rican | 697 | 1.8% |
| Romanian | 362 | 0.9% |
| Russian | 310 | 0.8% |
| Scandinavian | 204 | 0.5% |
| Scotch-Irish | 175 | 0.4% |
| Scottish | 355 | 0.9% |
| Serbian | 483 | 1.2% |
| Slavic | 9 | 0.0% |
| Slovak | 234 | 0.6% |
| Slovene | 84 | 0.2% |
| South American | 342 | 0.9% |
| Spaniard | 91 | 0.2% |
| Sri Lankan | 71 | 0.2% |
| Subsaharan African | 61 | 0.2% |
| Swedish | 688 | 1.8% |
| Swiss | 179 | 0.4% |
| Syrian | 28 | 0.1% |
| Thai | 872 | 2.2% |
| Ukrainian | 663 | 1.7% |
| Venezuelan | 54 | 0.1% |
| Welsh | 118 | 0.3% |
| Yugoslavian | 80 | 0.2% | View All 92 Rows |
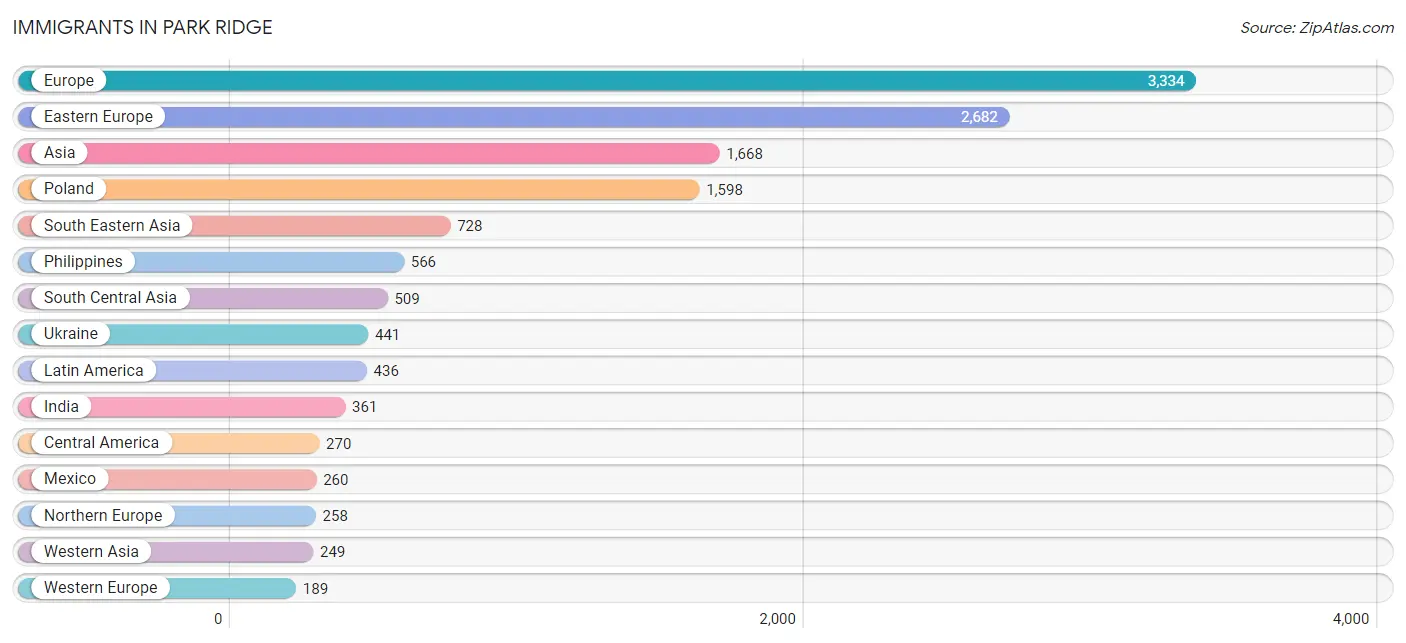
Immigrants in Park Ridge
The most numerous immigrant groups reported in Park Ridge came from Europe (3,334 | 8.5%), Eastern Europe (2,682 | 6.8%), Asia (1,668 | 4.2%), Poland (1,598 | 4.1%), and South Eastern Asia (728 | 1.8%), together accounting for 25.4% of all Park Ridge residents.
| Immigration Origin | # Population | % Population |
| Africa | 74 | 0.2% |
| Albania | 10 | 0.0% |
| Argentina | 24 | 0.1% |
| Asia | 1,668 | 4.2% |
| Austria | 38 | 0.1% |
| Belarus | 9 | 0.0% |
| Bosnia and Herzegovina | 94 | 0.2% |
| Brazil | 10 | 0.0% |
| Bulgaria | 83 | 0.2% |
| Cambodia | 48 | 0.1% |
| Canada | 82 | 0.2% |
| Caribbean | 49 | 0.1% |
| Central America | 270 | 0.7% |
| China | 57 | 0.1% |
| Colombia | 61 | 0.2% |
| Croatia | 53 | 0.1% |
| Cuba | 41 | 0.1% |
| Czechoslovakia | 17 | 0.0% |
| Denmark | 7 | 0.0% |
| Dominican Republic | 8 | 0.0% |
| Eastern Africa | 11 | 0.0% |
| Eastern Asia | 182 | 0.5% |
| Eastern Europe | 2,682 | 6.8% |
| Ecuador | 6 | 0.0% |
| Egypt | 32 | 0.1% |
| England | 16 | 0.0% |
| Europe | 3,334 | 8.5% |
| France | 18 | 0.1% |
| Germany | 133 | 0.3% |
| Greece | 79 | 0.2% |
| Guatemala | 10 | 0.0% |
| India | 361 | 0.9% |
| Iran | 61 | 0.2% |
| Iraq | 161 | 0.4% |
| Ireland | 139 | 0.4% |
| Israel | 41 | 0.1% |
| Italy | 107 | 0.3% |
| Japan | 84 | 0.2% |
| Jordan | 11 | 0.0% |
| Kenya | 11 | 0.0% |
| Korea | 30 | 0.1% |
| Laos | 12 | 0.0% |
| Latin America | 436 | 1.1% |
| Lebanon | 7 | 0.0% |
| Lithuania | 26 | 0.1% |
| Malaysia | 8 | 0.0% |
| Mexico | 260 | 0.7% |
| Morocco | 2 | 0.0% |
| Nepal | 39 | 0.1% |
| Nigeria | 24 | 0.1% |
| North Macedonia | 17 | 0.0% |
| Northern Africa | 39 | 0.1% |
| Northern Europe | 258 | 0.7% |
| Norway | 64 | 0.2% |
| Pakistan | 47 | 0.1% |
| Philippines | 566 | 1.4% |
| Poland | 1,598 | 4.1% |
| Romania | 93 | 0.2% |
| Russia | 19 | 0.1% |
| Scotland | 7 | 0.0% |
| Serbia | 141 | 0.4% |
| Singapore | 13 | 0.0% |
| South America | 117 | 0.3% |
| South Central Asia | 509 | 1.3% |
| South Eastern Asia | 728 | 1.8% |
| Southern Europe | 187 | 0.5% |
| Spain | 1 | 0.0% |
| Sweden | 5 | 0.0% |
| Syria | 18 | 0.1% |
| Taiwan | 36 | 0.1% |
| Thailand | 81 | 0.2% |
| Ukraine | 441 | 1.1% |
| Uzbekistan | 1 | 0.0% |
| Venezuela | 16 | 0.0% |
| Western Africa | 24 | 0.1% |
| Western Asia | 249 | 0.6% |
| Western Europe | 189 | 0.5% | View All 77 Rows |
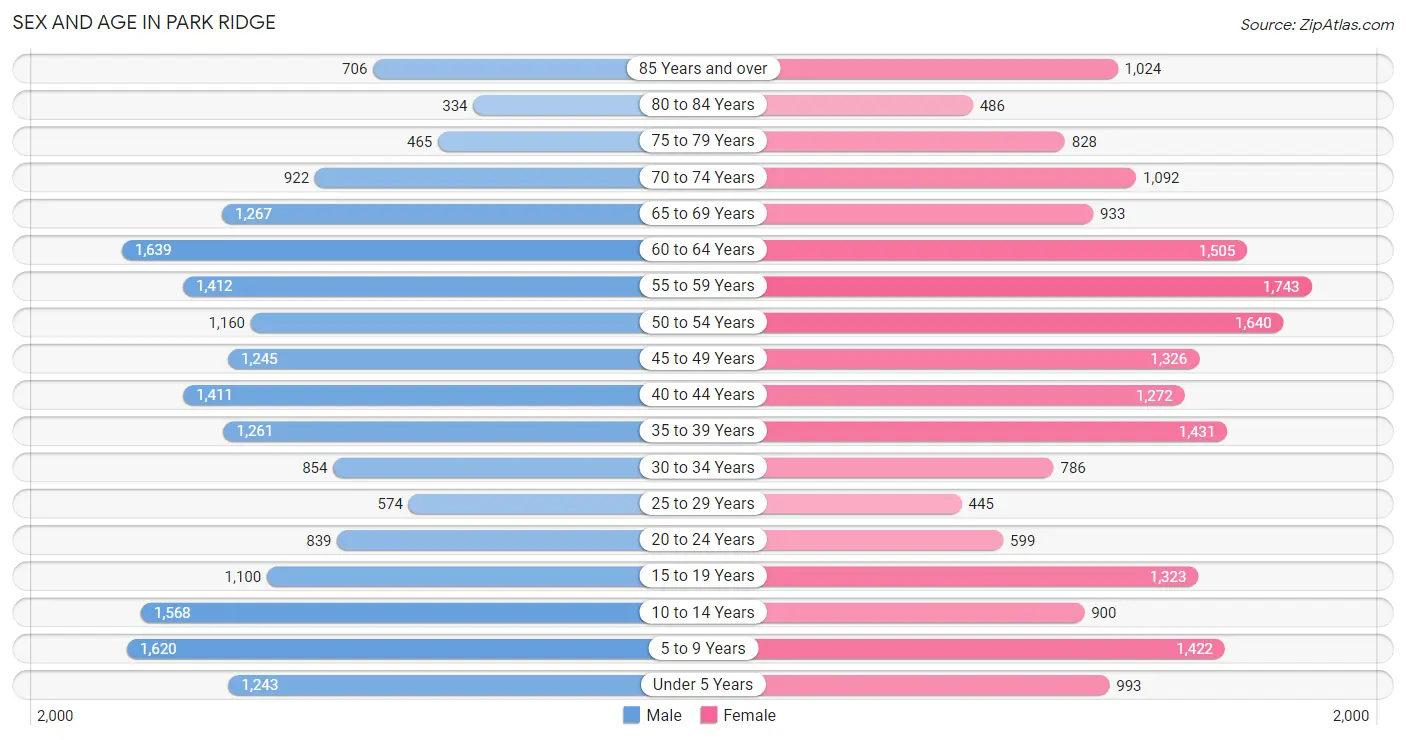
Sex and Age in Park Ridge
Sex and Age in Park Ridge
The most populous age groups in Park Ridge are 60 to 64 Years (1,639 | 8.4%) for men and 55 to 59 Years (1,743 | 8.8%) for women.
| Age Bracket | Male | Female |
| Under 5 Years | 1,243 (6.3%) | 993 (5.0%) |
| 5 to 9 Years | 1,620 (8.3%) | 1,422 (7.2%) |
| 10 to 14 Years | 1,568 (8.0%) | 900 (4.6%) |
| 15 to 19 Years | 1,100 (5.6%) | 1,323 (6.7%) |
| 20 to 24 Years | 839 (4.3%) | 599 (3.0%) |
| 25 to 29 Years | 574 (2.9%) | 445 (2.2%) |
| 30 to 34 Years | 854 (4.3%) | 786 (4.0%) |
| 35 to 39 Years | 1,261 (6.4%) | 1,431 (7.2%) |
| 40 to 44 Years | 1,411 (7.2%) | 1,272 (6.4%) |
| 45 to 49 Years | 1,245 (6.4%) | 1,326 (6.7%) |
| 50 to 54 Years | 1,160 (5.9%) | 1,640 (8.3%) |
| 55 to 59 Years | 1,412 (7.2%) | 1,743 (8.8%) |
| 60 to 64 Years | 1,639 (8.4%) | 1,505 (7.6%) |
| 65 to 69 Years | 1,267 (6.5%) | 933 (4.7%) |
| 70 to 74 Years | 922 (4.7%) | 1,092 (5.5%) |
| 75 to 79 Years | 465 (2.4%) | 828 (4.2%) |
| 80 to 84 Years | 334 (1.7%) | 486 (2.5%) |
| 85 Years and over | 706 (3.6%) | 1,024 (5.2%) |
| Total | 19,620 (100.0%) | 19,748 (100.0%) |
Families and Households in Park Ridge
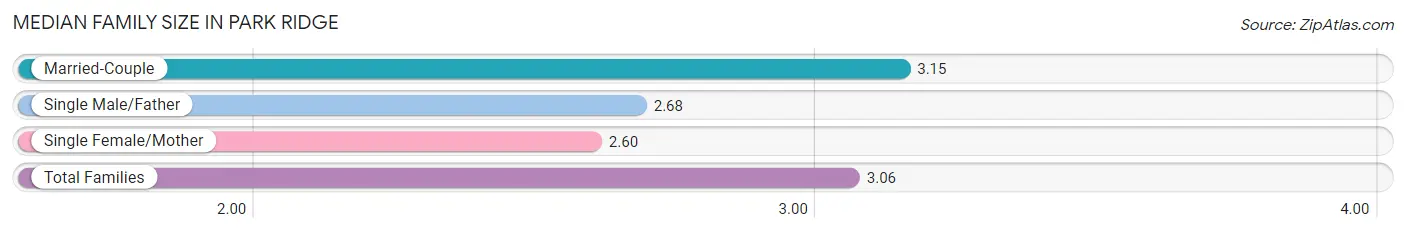
Median Family Size in Park Ridge
The median family size in Park Ridge is 3.06 persons per family, with married-couple families (9,186 | 82.7%) accounting for the largest median family size of 3.15 persons per family. On the other hand, single female/mother families (1,498 | 13.5%) represent the smallest median family size with 2.60 persons per family.
| Family Type | # Families | Family Size |
| Married-Couple | 9,186 (82.7%) | 3.15 |
| Single Male/Father | 426 (3.8%) | 2.68 |
| Single Female/Mother | 1,498 (13.5%) | 2.60 |
| Total Families | 11,110 (100.0%) | 3.06 |
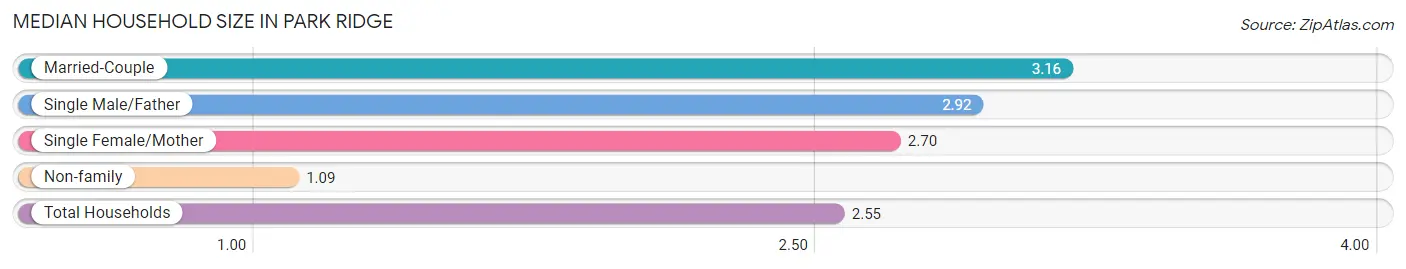
Median Household Size in Park Ridge
The median household size in Park Ridge is 2.55 persons per household, with married-couple households (9,186 | 60.3%) accounting for the largest median household size of 3.16 persons per household. non-family households (4,124 | 27.1%) represent the smallest median household size with 1.09 persons per household.
| Household Type | # Households | Household Size |
| Married-Couple | 9,186 (60.3%) | 3.16 |
| Single Male/Father | 426 (2.8%) | 2.92 |
| Single Female/Mother | 1,498 (9.8%) | 2.70 |
| Non-family | 4,124 (27.1%) | 1.09 |
| Total Households | 15,234 (100.0%) | 2.55 |
Household Size by Marriage Status in Park Ridge
Out of a total of 15,234 households in Park Ridge, 11,110 (72.9%) are family households, while 4,124 (27.1%) are nonfamily households. The most numerous type of family households are 2-person households, comprising 4,764, and the most common type of nonfamily households are 1-person households, comprising 3,814.
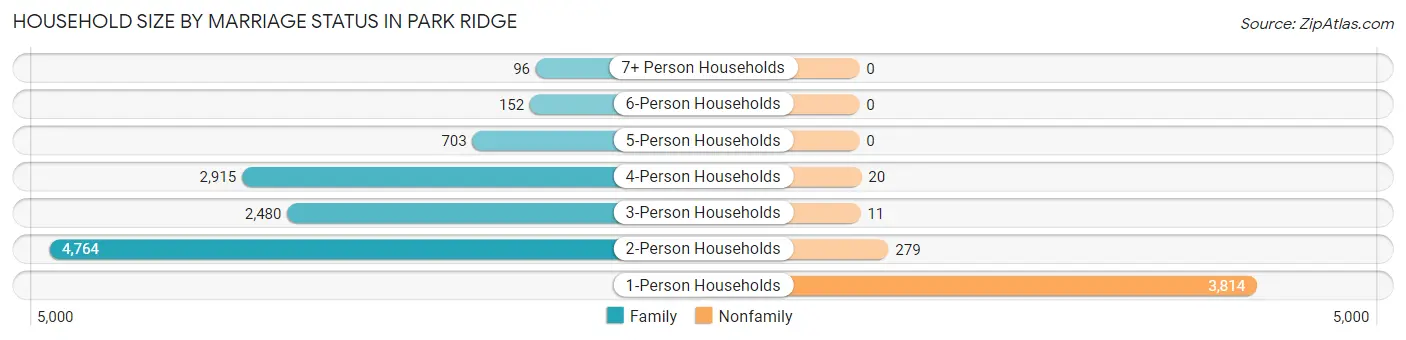
| Household Size | Family Households | Nonfamily Households |
| 1-Person Households | - | 3,814 (25.0%) |
| 2-Person Households | 4,764 (31.3%) | 279 (1.8%) |
| 3-Person Households | 2,480 (16.3%) | 11 (0.1%) |
| 4-Person Households | 2,915 (19.1%) | 20 (0.1%) |
| 5-Person Households | 703 (4.6%) | 0 (0.0%) |
| 6-Person Households | 152 (1.0%) | 0 (0.0%) |
| 7+ Person Households | 96 (0.6%) | 0 (0.0%) |
| Total | 11,110 (72.9%) | 4,124 (27.1%) |
Female Fertility in Park Ridge
Fertility by Age in Park Ridge
Average fertility rate in Park Ridge is 41.0 births per 1,000 women. Women in the age bracket of 20 to 34 years have the highest fertility rate with 66.0 births per 1,000 women. Women in the age bracket of 35 to 50 years acount for 61.0% of all women with births.
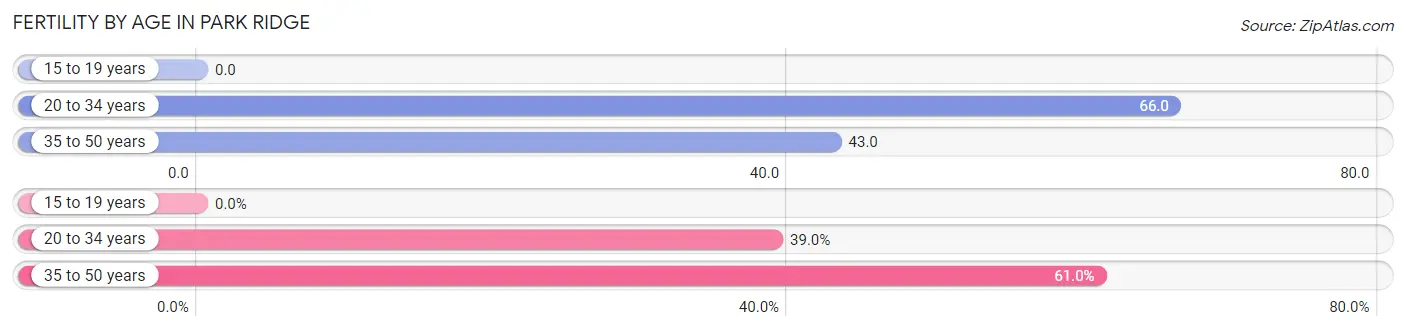
| Age Bracket | Women with Births | Births / 1,000 Women |
| 15 to 19 years | 0 (0.0%) | 0.0 |
| 20 to 34 years | 121 (39.0%) | 66.0 |
| 35 to 50 years | 189 (61.0%) | 43.0 |
| Total | 310 (100.0%) | 41.0 |
Fertility by Age by Marriage Status in Park Ridge
97.4% of women with births (310) in Park Ridge are married. The highest percentage of unmarried women with births falls into 35 to 50 years age bracket with 3.7% of them unmarried at the time of birth, while the lowest percentage of unmarried women with births belong to 20 to 34 years age bracket with 0.8% of them unmarried.
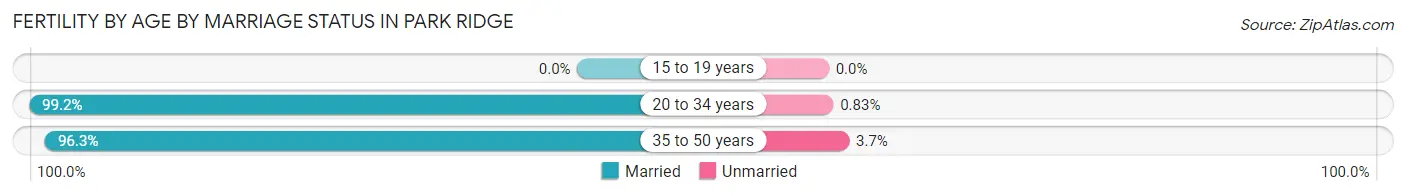
| Age Bracket | Married | Unmarried |
| 15 to 19 years | 0 (0.0%) | 0 (0.0%) |
| 20 to 34 years | 120 (99.2%) | 1 (0.8%) |
| 35 to 50 years | 182 (96.3%) | 7 (3.7%) |
| Total | 302 (97.4%) | 8 (2.6%) |
Fertility by Education in Park Ridge
Average fertility rate in Park Ridge is 41.0 births per 1,000 women. Women with the education attainment of graduate degree have the highest fertility rate of 89.0 births per 1,000 women, while women with the education attainment of high school diploma have the lowest fertility at 2.0 births per 1,000 women. Women with the education attainment of graduate degree represent 53.9% of all women with births.
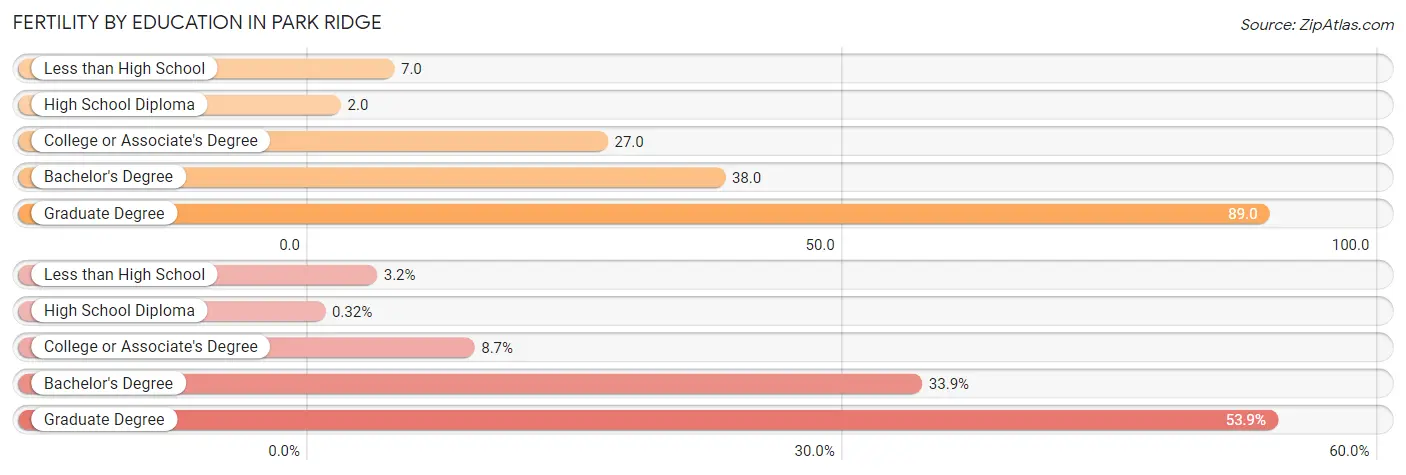
| Educational Attainment | Women with Births | Births / 1,000 Women |
| Less than High School | 10 (3.2%) | 7.0 |
| High School Diploma | 1 (0.3%) | 2.0 |
| College or Associate's Degree | 27 (8.7%) | 27.0 |
| Bachelor's Degree | 105 (33.9%) | 38.0 |
| Graduate Degree | 167 (53.9%) | 89.0 |
| Total | 310 (100.0%) | 41.0 |
Fertility by Education by Marriage Status in Park Ridge
2.6% of women with births in Park Ridge are unmarried. Women with the educational attainment of less than high school are most likely to be married with 100.0% of them married at childbirth, while women with the educational attainment of high school diploma are least likely to be married with 100.0% of them unmarried at childbirth.
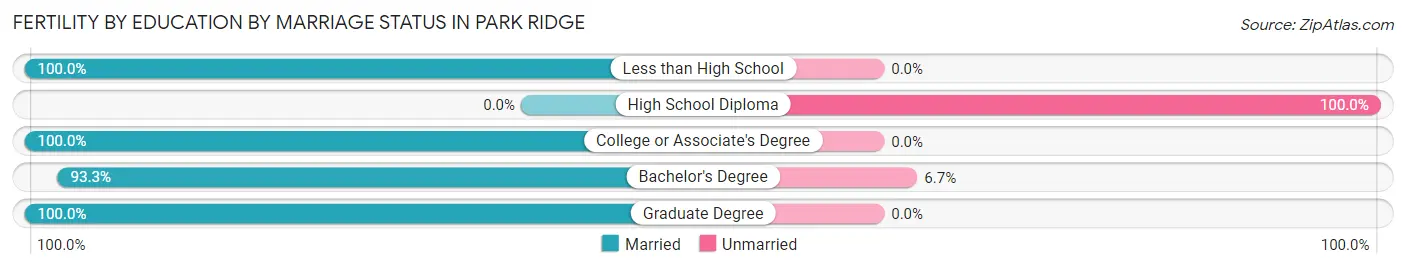
| Educational Attainment | Married | Unmarried |
| Less than High School | 10 (100.0%) | 0 (0.0%) |
| High School Diploma | 0 (0.0%) | 1 (100.0%) |
| College or Associate's Degree | 27 (100.0%) | 0 (0.0%) |
| Bachelor's Degree | 98 (93.3%) | 7 (6.7%) |
| Graduate Degree | 167 (100.0%) | 0 (0.0%) |
| Total | 302 (97.4%) | 8 (2.6%) |
Employment Characteristics in Park Ridge
Employment by Class of Employer in Park Ridge
Among the 19,492 employed individuals in Park Ridge, private company employees (12,722 | 65.3%), not-for-profit organizations (2,275 | 11.7%), and self-employed (incorporated) (1,641 | 8.4%) make up the most common classes of employment.
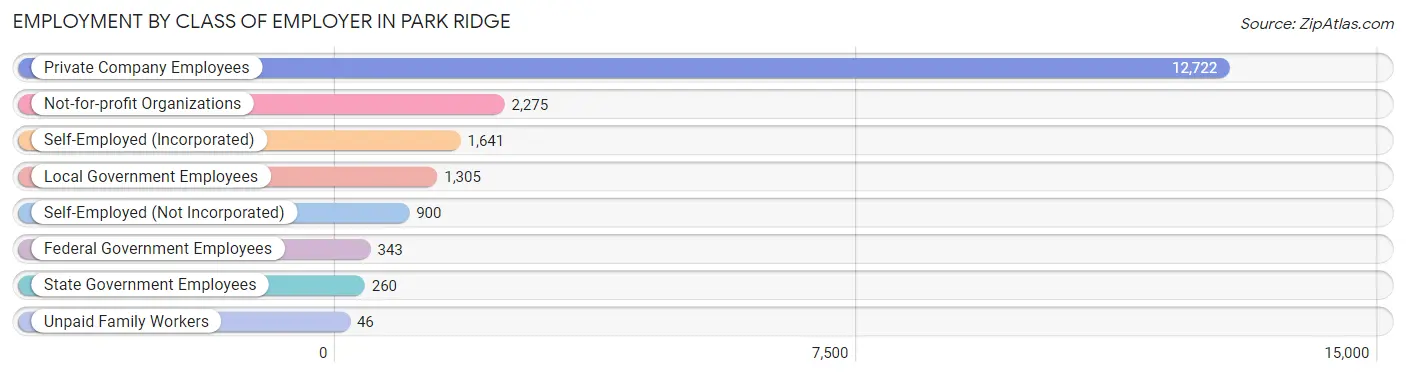
| Employer Class | # Employees | % Employees |
| Private Company Employees | 12,722 | 65.3% |
| Self-Employed (Incorporated) | 1,641 | 8.4% |
| Self-Employed (Not Incorporated) | 900 | 4.6% |
| Not-for-profit Organizations | 2,275 | 11.7% |
| Local Government Employees | 1,305 | 6.7% |
| State Government Employees | 260 | 1.3% |
| Federal Government Employees | 343 | 1.8% |
| Unpaid Family Workers | 46 | 0.2% |
| Total | 19,492 | 100.0% |
Employment Status by Age in Park Ridge
According to the labor force statistics for Park Ridge, out of the total population over 16 years of age (31,104), 65.7% or 20,435 individuals are in the labor force, with 3.5% or 715 of them unemployed. The age group with the highest labor force participation rate is 30 to 34 years, with 94.5% or 1,550 individuals in the labor force. Within the labor force, the 55 to 59 years age range has the highest percentage of unemployed individuals, with 7.2% or 194 of them being unemployed.
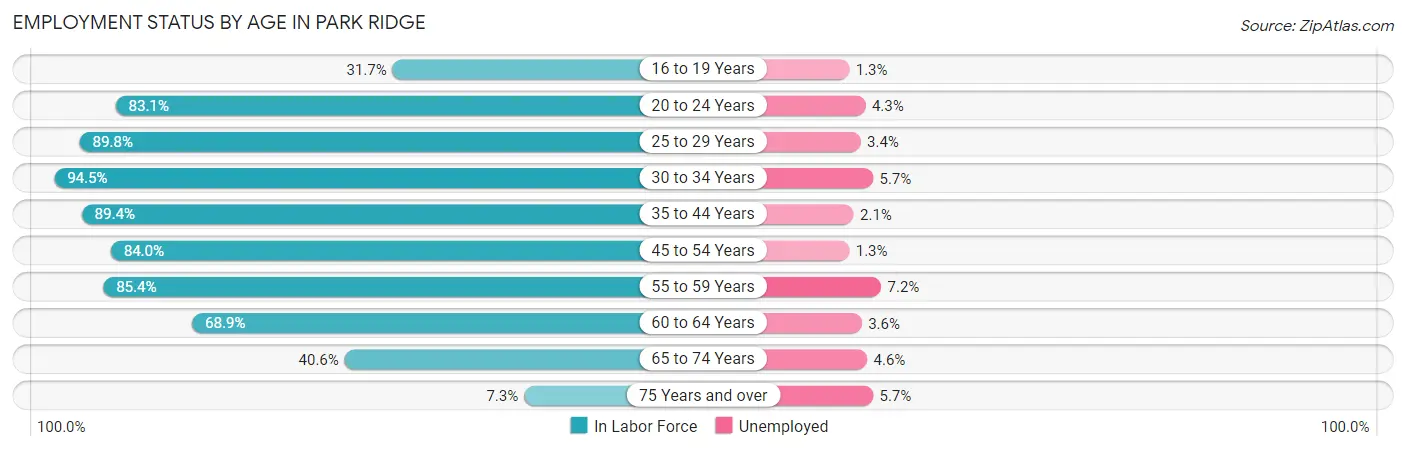
| Age Bracket | In Labor Force | Unemployed |
| 16 to 19 Years | 604 (31.7%) | 8 (1.3%) |
| 20 to 24 Years | 1,195 (83.1%) | 51 (4.3%) |
| 25 to 29 Years | 915 (89.8%) | 31 (3.4%) |
| 30 to 34 Years | 1,550 (94.5%) | 88 (5.7%) |
| 35 to 44 Years | 4,805 (89.4%) | 101 (2.1%) |
| 45 to 54 Years | 4,512 (84.0%) | 59 (1.3%) |
| 55 to 59 Years | 2,694 (85.4%) | 194 (7.2%) |
| 60 to 64 Years | 2,166 (68.9%) | 78 (3.6%) |
| 65 to 74 Years | 1,711 (40.6%) | 79 (4.6%) |
| 75 Years and over | 281 (7.3%) | 16 (5.7%) |
| Total | 20,435 (65.7%) | 715 (3.5%) |
Employment Status by Educational Attainment in Park Ridge
According to labor force statistics for Park Ridge, 84.4% of individuals (16,630) out of the total population between 25 and 64 years of age (19,704) are in the labor force, with 3.3% or 549 of them being unemployed. The group with the highest labor force participation rate are those with the educational attainment of bachelor's degree or higher, with 88.2% or 12,153 individuals in the labor force. Within the labor force, individuals with high school diploma education have the highest percentage of unemployment, with 5.8% or 78 of them being unemployed.
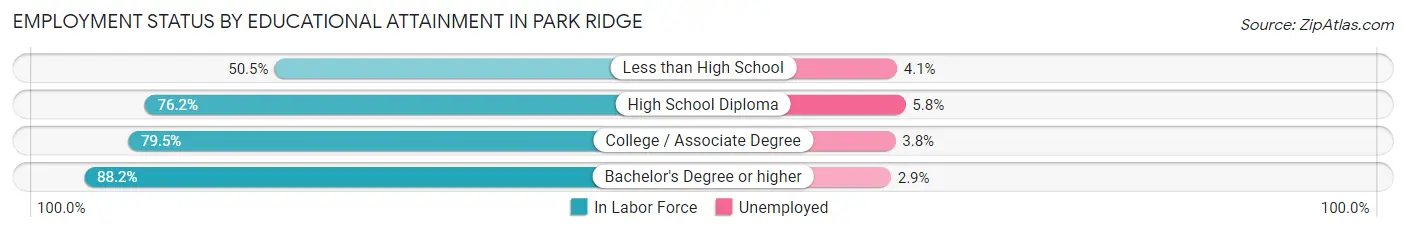
| Educational Attainment | In Labor Force | Unemployed |
| Less than High School | 290 (50.5%) | 24 (4.1%) |
| High School Diploma | 1,353 (76.2%) | 103 (5.8%) |
| College / Associate Degree | 2,842 (79.5%) | 136 (3.8%) |
| Bachelor's Degree or higher | 12,153 (88.2%) | 400 (2.9%) |
| Total | 16,630 (84.4%) | 650 (3.3%) |
Employment Occupations by Sex in Park Ridge
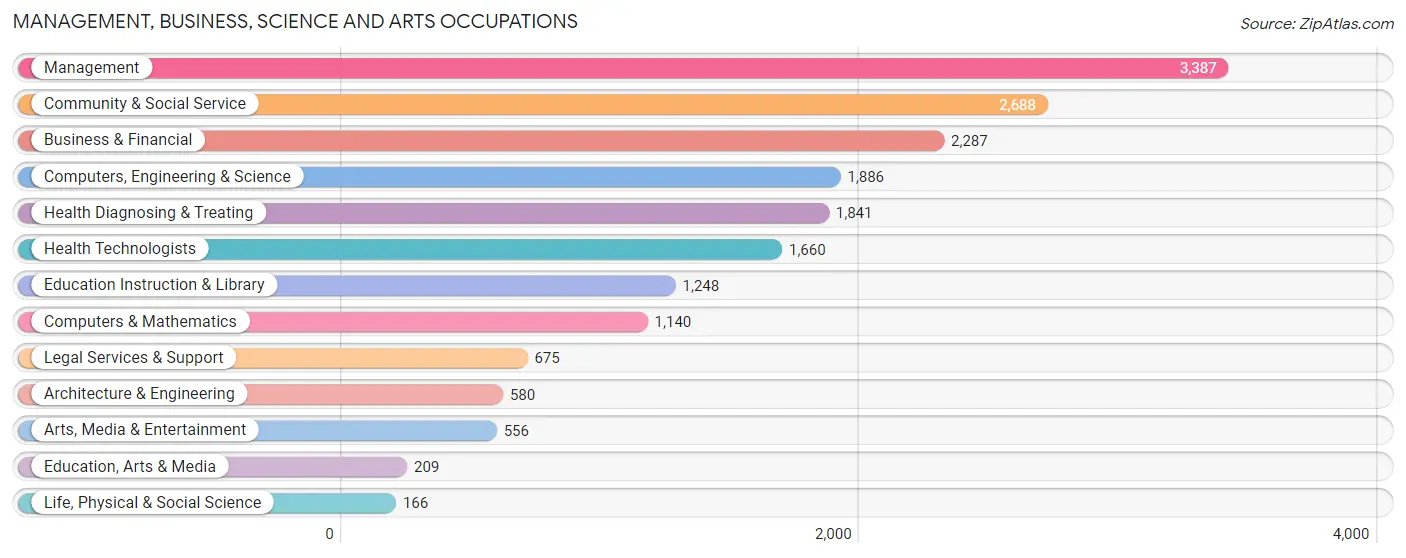
Management, Business, Science and Arts Occupations
The most common Management, Business, Science and Arts occupations in Park Ridge are Management (3,387 | 17.2%), Community & Social Service (2,688 | 13.6%), Business & Financial (2,287 | 11.6%), Computers, Engineering & Science (1,886 | 9.6%), and Health Diagnosing & Treating (1,841 | 9.3%).
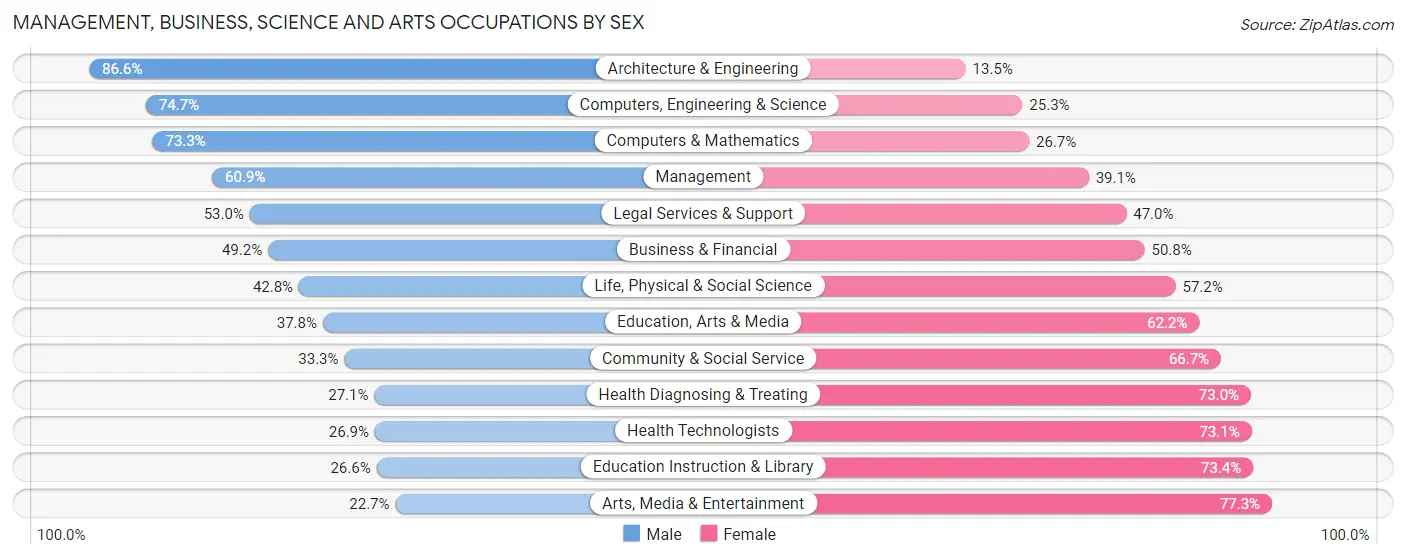
Management, Business, Science and Arts Occupations by Sex
Within the Management, Business, Science and Arts occupations in Park Ridge, the most male-oriented occupations are Architecture & Engineering (86.6%), Computers, Engineering & Science (74.7%), and Computers & Mathematics (73.3%), while the most female-oriented occupations are Arts, Media & Entertainment (77.3%), Education Instruction & Library (73.4%), and Health Technologists (73.1%).
| Occupation | Male | Female |
| Management | 2,062 (60.9%) | 1,325 (39.1%) |
| Business & Financial | 1,126 (49.2%) | 1,161 (50.8%) |
| Computers, Engineering & Science | 1,409 (74.7%) | 477 (25.3%) |
| Computers & Mathematics | 836 (73.3%) | 304 (26.7%) |
| Architecture & Engineering | 502 (86.6%) | 78 (13.5%) |
| Life, Physical & Social Science | 71 (42.8%) | 95 (57.2%) |
| Community & Social Service | 895 (33.3%) | 1,793 (66.7%) |
| Education, Arts & Media | 79 (37.8%) | 130 (62.2%) |
| Legal Services & Support | 358 (53.0%) | 317 (47.0%) |
| Education Instruction & Library | 332 (26.6%) | 916 (73.4%) |
| Arts, Media & Entertainment | 126 (22.7%) | 430 (77.3%) |
| Health Diagnosing & Treating | 498 (27.1%) | 1,343 (73.0%) |
| Health Technologists | 447 (26.9%) | 1,213 (73.1%) |
| Total (Category) | 5,990 (49.5%) | 6,099 (50.4%) |
| Total (Overall) | 10,542 (53.4%) | 9,180 (46.6%) |
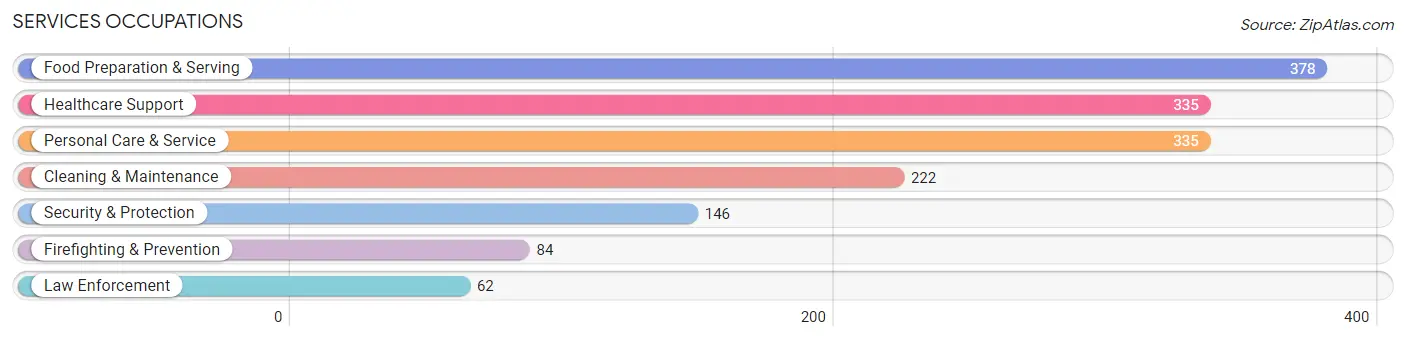
Services Occupations
The most common Services occupations in Park Ridge are Food Preparation & Serving (378 | 1.9%), Healthcare Support (335 | 1.7%), Personal Care & Service (335 | 1.7%), Cleaning & Maintenance (222 | 1.1%), and Security & Protection (146 | 0.7%).
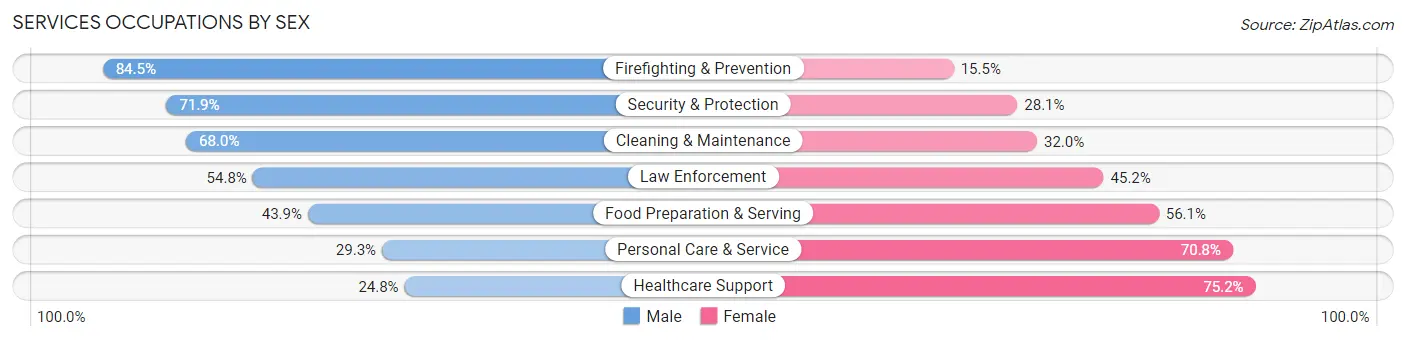
Services Occupations by Sex
Within the Services occupations in Park Ridge, the most male-oriented occupations are Firefighting & Prevention (84.5%), Security & Protection (71.9%), and Cleaning & Maintenance (68.0%), while the most female-oriented occupations are Healthcare Support (75.2%), Personal Care & Service (70.8%), and Food Preparation & Serving (56.1%).
| Occupation | Male | Female |
| Healthcare Support | 83 (24.8%) | 252 (75.2%) |
| Security & Protection | 105 (71.9%) | 41 (28.1%) |
| Firefighting & Prevention | 71 (84.5%) | 13 (15.5%) |
| Law Enforcement | 34 (54.8%) | 28 (45.2%) |
| Food Preparation & Serving | 166 (43.9%) | 212 (56.1%) |
| Cleaning & Maintenance | 151 (68.0%) | 71 (32.0%) |
| Personal Care & Service | 98 (29.2%) | 237 (70.8%) |
| Total (Category) | 603 (42.6%) | 813 (57.4%) |
| Total (Overall) | 10,542 (53.4%) | 9,180 (46.6%) |
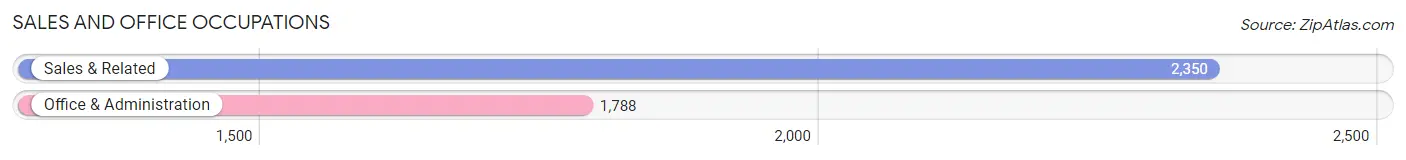
Sales and Office Occupations
The most common Sales and Office occupations in Park Ridge are Sales & Related (2,350 | 11.9%), and Office & Administration (1,788 | 9.1%).
Sales and Office Occupations by Sex
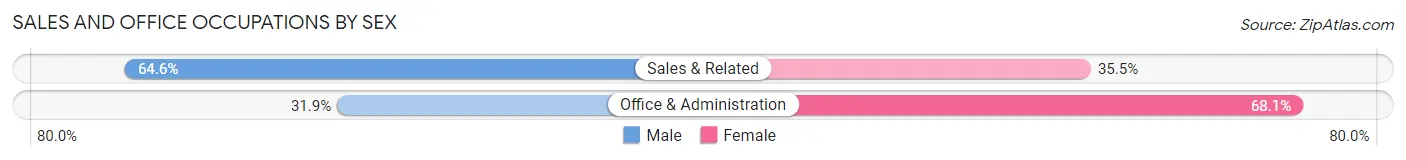
| Occupation | Male | Female |
| Sales & Related | 1,517 (64.5%) | 833 (35.4%) |
| Office & Administration | 571 (31.9%) | 1,217 (68.1%) |
| Total (Category) | 2,088 (50.5%) | 2,050 (49.5%) |
| Total (Overall) | 10,542 (53.4%) | 9,180 (46.6%) |
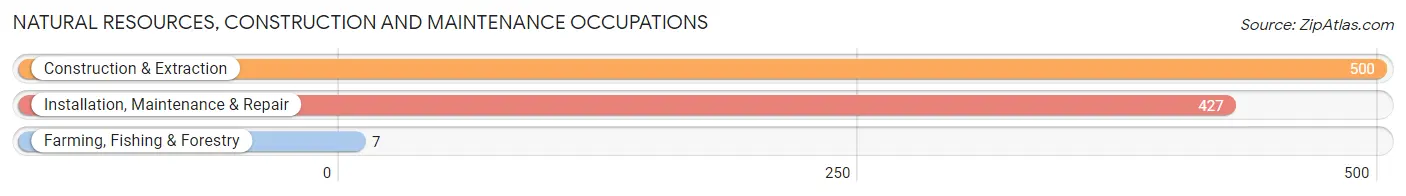
Natural Resources, Construction and Maintenance Occupations
The most common Natural Resources, Construction and Maintenance occupations in Park Ridge are Construction & Extraction (500 | 2.5%), Installation, Maintenance & Repair (427 | 2.2%), and Farming, Fishing & Forestry (7 | 0.0%).
Natural Resources, Construction and Maintenance Occupations by Sex
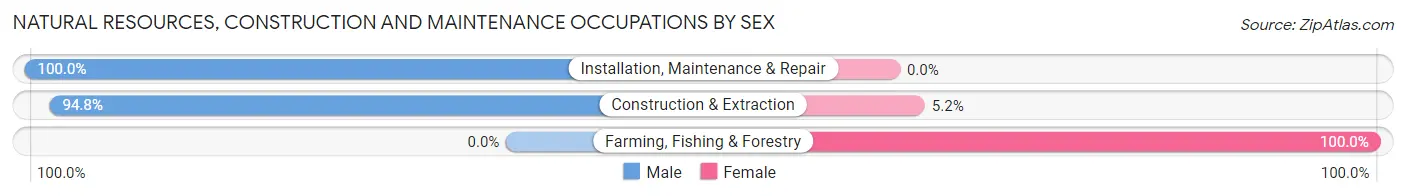
| Occupation | Male | Female |
| Farming, Fishing & Forestry | 0 (0.0%) | 7 (100.0%) |
| Construction & Extraction | 474 (94.8%) | 26 (5.2%) |
| Installation, Maintenance & Repair | 427 (100.0%) | 0 (0.0%) |
| Total (Category) | 901 (96.5%) | 33 (3.5%) |
| Total (Overall) | 10,542 (53.4%) | 9,180 (46.6%) |
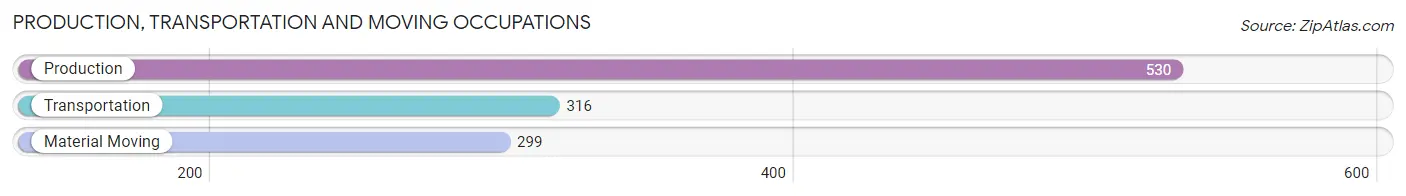
Production, Transportation and Moving Occupations
The most common Production, Transportation and Moving occupations in Park Ridge are Production (530 | 2.7%), Transportation (316 | 1.6%), and Material Moving (299 | 1.5%).
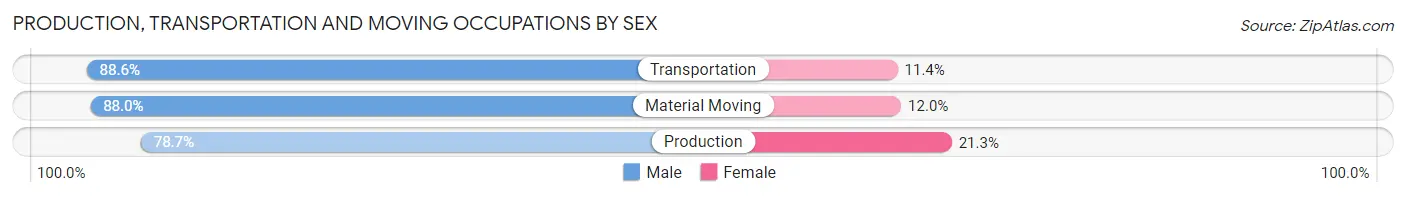
Production, Transportation and Moving Occupations by Sex
| Occupation | Male | Female |
| Production | 417 (78.7%) | 113 (21.3%) |
| Transportation | 280 (88.6%) | 36 (11.4%) |
| Material Moving | 263 (88.0%) | 36 (12.0%) |
| Total (Category) | 960 (83.8%) | 185 (16.2%) |
| Total (Overall) | 10,542 (53.4%) | 9,180 (46.6%) |
Employment Industries by Sex in Park Ridge
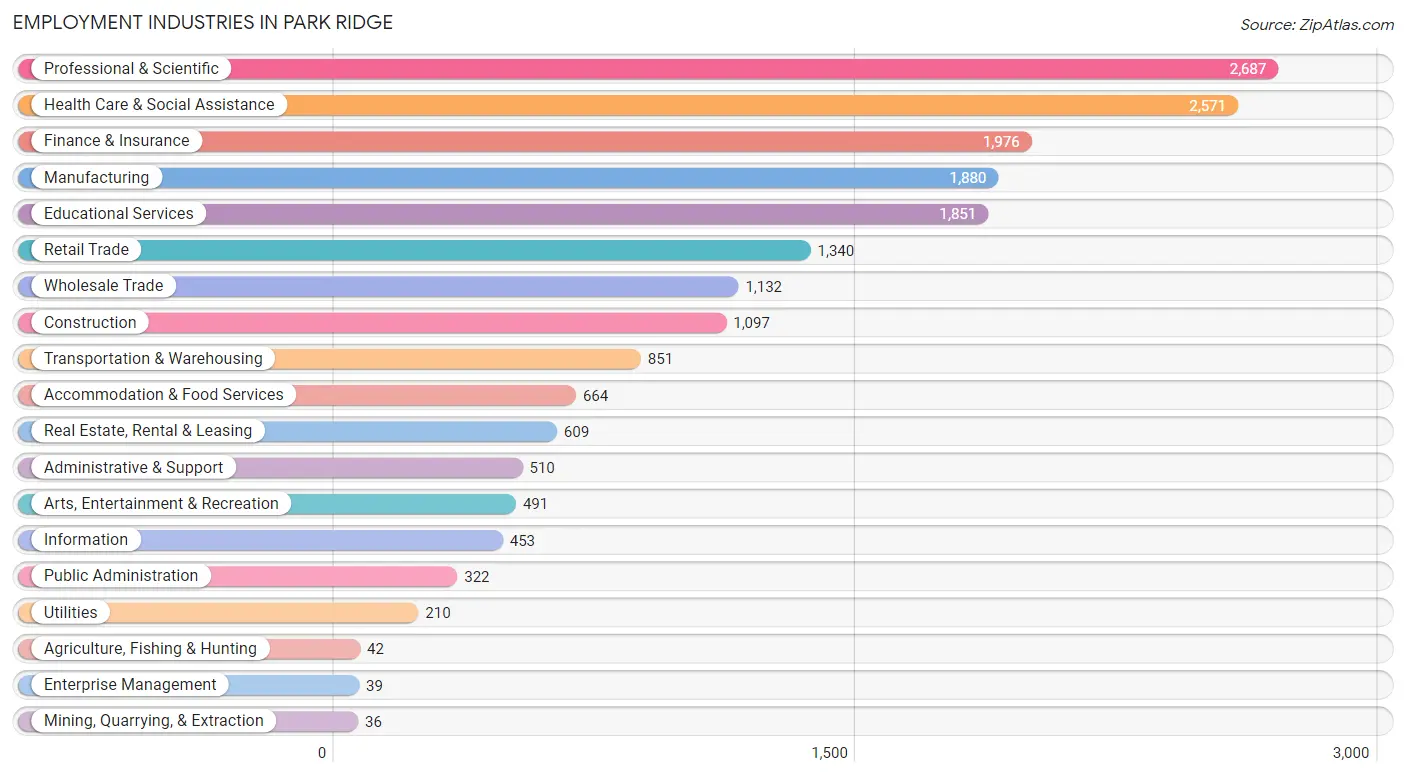
Employment Industries in Park Ridge
The major employment industries in Park Ridge include Professional & Scientific (2,687 | 13.6%), Health Care & Social Assistance (2,571 | 13.0%), Finance & Insurance (1,976 | 10.0%), Manufacturing (1,880 | 9.5%), and Educational Services (1,851 | 9.4%).
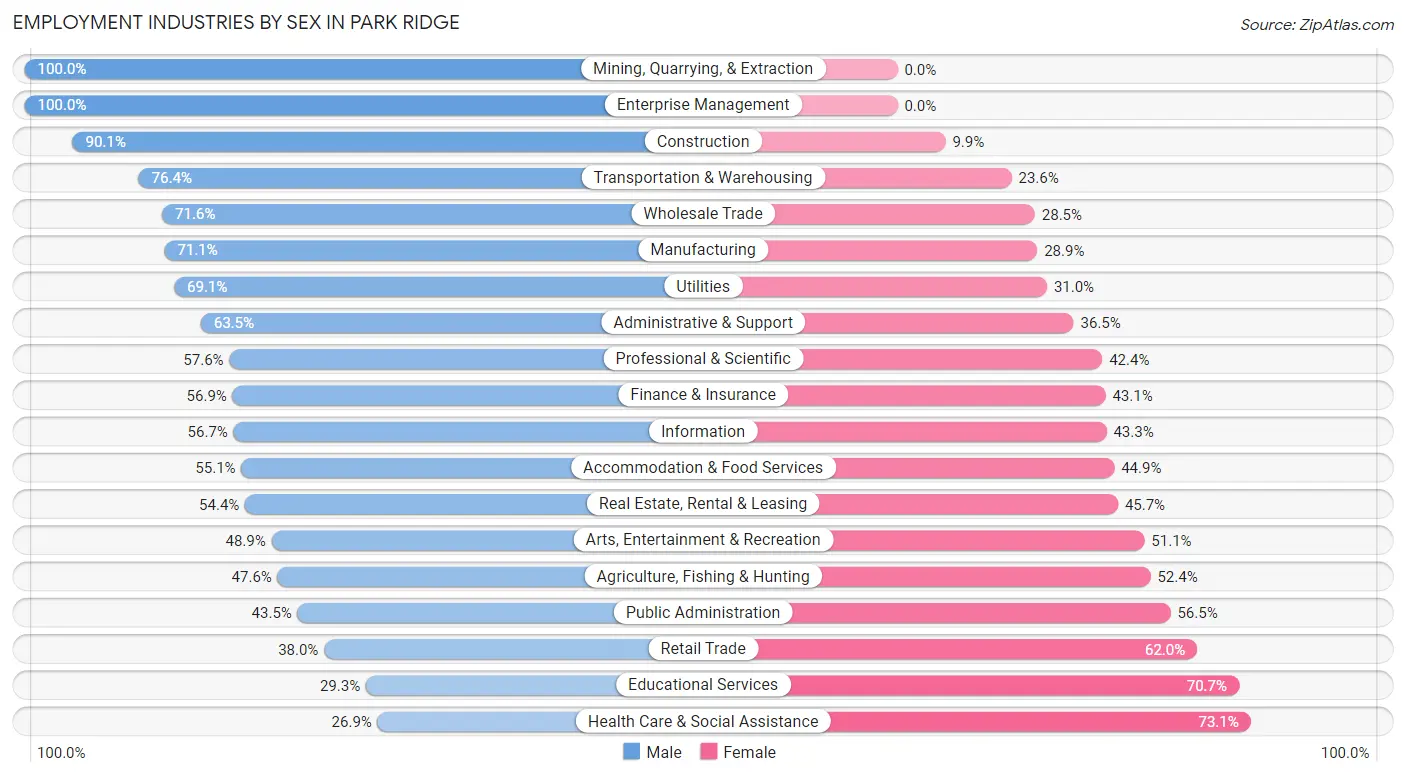
Employment Industries by Sex in Park Ridge
The Park Ridge industries that see more men than women are Mining, Quarrying, & Extraction (100.0%), Enterprise Management (100.0%), and Construction (90.1%), whereas the industries that tend to have a higher number of women are Health Care & Social Assistance (73.1%), Educational Services (70.7%), and Retail Trade (62.0%).
| Industry | Male | Female |
| Agriculture, Fishing & Hunting | 20 (47.6%) | 22 (52.4%) |
| Mining, Quarrying, & Extraction | 36 (100.0%) | 0 (0.0%) |
| Construction | 988 (90.1%) | 109 (9.9%) |
| Manufacturing | 1,336 (71.1%) | 544 (28.9%) |
| Wholesale Trade | 810 (71.6%) | 322 (28.4%) |
| Retail Trade | 509 (38.0%) | 831 (62.0%) |
| Transportation & Warehousing | 650 (76.4%) | 201 (23.6%) |
| Utilities | 145 (69.1%) | 65 (30.9%) |
| Information | 257 (56.7%) | 196 (43.3%) |
| Finance & Insurance | 1,125 (56.9%) | 851 (43.1%) |
| Real Estate, Rental & Leasing | 331 (54.3%) | 278 (45.7%) |
| Professional & Scientific | 1,548 (57.6%) | 1,139 (42.4%) |
| Enterprise Management | 39 (100.0%) | 0 (0.0%) |
| Administrative & Support | 324 (63.5%) | 186 (36.5%) |
| Educational Services | 543 (29.3%) | 1,308 (70.7%) |
| Health Care & Social Assistance | 692 (26.9%) | 1,879 (73.1%) |
| Arts, Entertainment & Recreation | 240 (48.9%) | 251 (51.1%) |
| Accommodation & Food Services | 366 (55.1%) | 298 (44.9%) |
| Public Administration | 140 (43.5%) | 182 (56.5%) |
| Total | 10,542 (53.4%) | 9,180 (46.6%) |
Education in Park Ridge
School Enrollment in Park Ridge
The most common levels of schooling among the 9,656 students in Park Ridge are elementary school (2,229 | 23.1%), high school (2,209 | 22.9%), and middle school (1,992 | 20.6%).
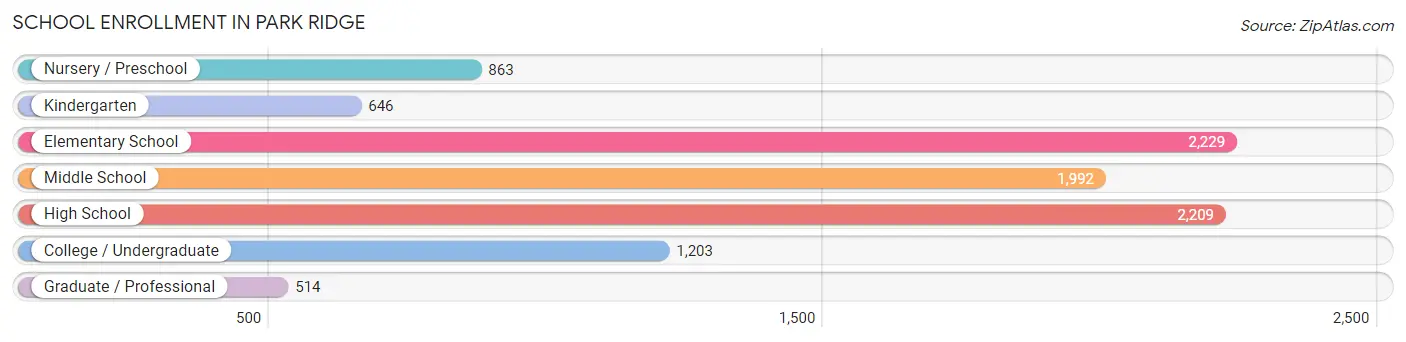
| School Level | # Students | % Students |
| Nursery / Preschool | 863 | 8.9% |
| Kindergarten | 646 | 6.7% |
| Elementary School | 2,229 | 23.1% |
| Middle School | 1,992 | 20.6% |
| High School | 2,209 | 22.9% |
| College / Undergraduate | 1,203 | 12.5% |
| Graduate / Professional | 514 | 5.3% |
| Total | 9,656 | 100.0% |
School Enrollment by Age by Funding Source in Park Ridge
Out of a total of 9,656 students who are enrolled in schools in Park Ridge, 2,173 (22.5%) attend a private institution, while the remaining 7,483 (77.5%) are enrolled in public schools. The age group of 25 to 34 year olds has the highest likelihood of being enrolled in private schools, with 128 (60.4% in the age bracket) enrolled. Conversely, the age group of 15 to 17 year olds has the lowest likelihood of being enrolled in a private school, with 1,291 (89.3% in the age bracket) attending a public institution.
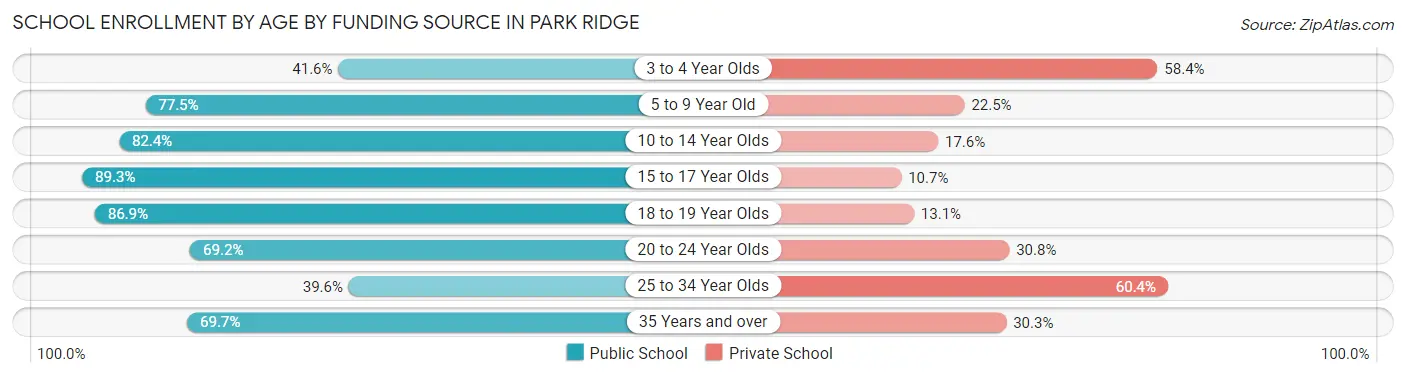
| Age Bracket | Public School | Private School |
| 3 to 4 Year Olds | 229 (41.6%) | 322 (58.4%) |
| 5 to 9 Year Old | 2,280 (77.5%) | 662 (22.5%) |
| 10 to 14 Year Olds | 2,016 (82.4%) | 430 (17.6%) |
| 15 to 17 Year Olds | 1,291 (89.3%) | 155 (10.7%) |
| 18 to 19 Year Olds | 791 (86.9%) | 119 (13.1%) |
| 20 to 24 Year Olds | 500 (69.2%) | 223 (30.8%) |
| 25 to 34 Year Olds | 84 (39.6%) | 128 (60.4%) |
| 35 Years and over | 297 (69.7%) | 129 (30.3%) |
| Total | 7,483 (77.5%) | 2,173 (22.5%) |
Educational Attainment by Field of Study in Park Ridge
Business (5,028 | 26.5%), engineering (1,907 | 10.0%), education (1,586 | 8.4%), science & technology (1,583 | 8.3%), and social sciences (1,520 | 8.0%) are the most common fields of study among 19,000 individuals in Park Ridge who have obtained a bachelor's degree or higher.
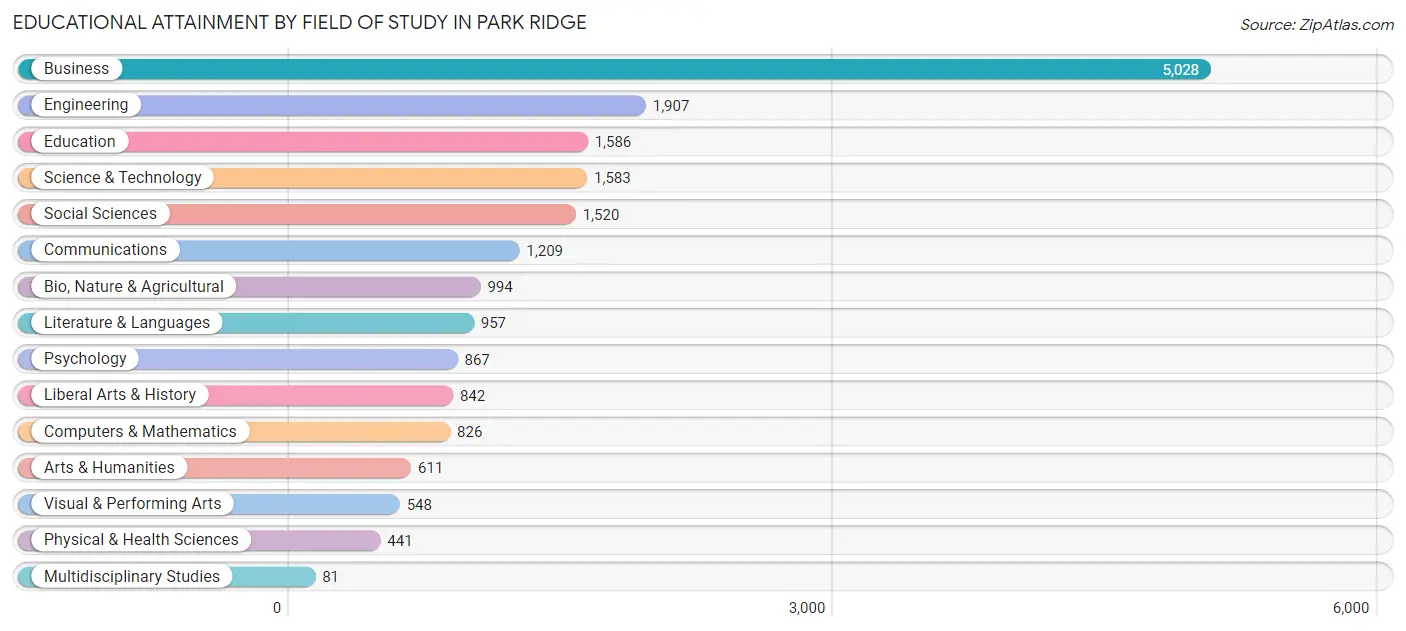
| Field of Study | # Graduates | % Graduates |
| Computers & Mathematics | 826 | 4.3% |
| Bio, Nature & Agricultural | 994 | 5.2% |
| Physical & Health Sciences | 441 | 2.3% |
| Psychology | 867 | 4.6% |
| Social Sciences | 1,520 | 8.0% |
| Engineering | 1,907 | 10.0% |
| Multidisciplinary Studies | 81 | 0.4% |
| Science & Technology | 1,583 | 8.3% |
| Business | 5,028 | 26.5% |
| Education | 1,586 | 8.4% |
| Literature & Languages | 957 | 5.0% |
| Liberal Arts & History | 842 | 4.4% |
| Visual & Performing Arts | 548 | 2.9% |
| Communications | 1,209 | 6.4% |
| Arts & Humanities | 611 | 3.2% |
| Total | 19,000 | 100.0% |
Transportation & Commute in Park Ridge
Vehicle Availability by Sex in Park Ridge
The most prevalent vehicle ownership categories in Park Ridge are males with 2 vehicles (5,270, accounting for 50.3%) and females with 2 vehicles (4,558, making up 58.5%).
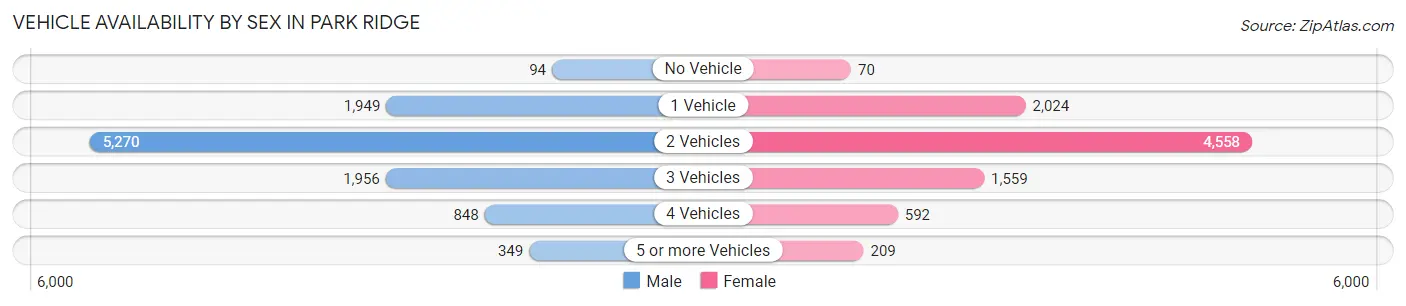
| Vehicles Available | Male | Female |
| No Vehicle | 94 (0.9%) | 70 (0.8%) |
| 1 Vehicle | 1,949 (18.6%) | 2,024 (22.5%) |
| 2 Vehicles | 5,270 (50.3%) | 4,558 (50.6%) |
| 3 Vehicles | 1,956 (18.7%) | 1,559 (17.3%) |
| 4 Vehicles | 848 (8.1%) | 592 (6.6%) |
| 5 or more Vehicles | 349 (3.3%) | 209 (2.3%) |
| Total | 10,466 (100.0%) | 9,012 (100.0%) |
Commute Time in Park Ridge
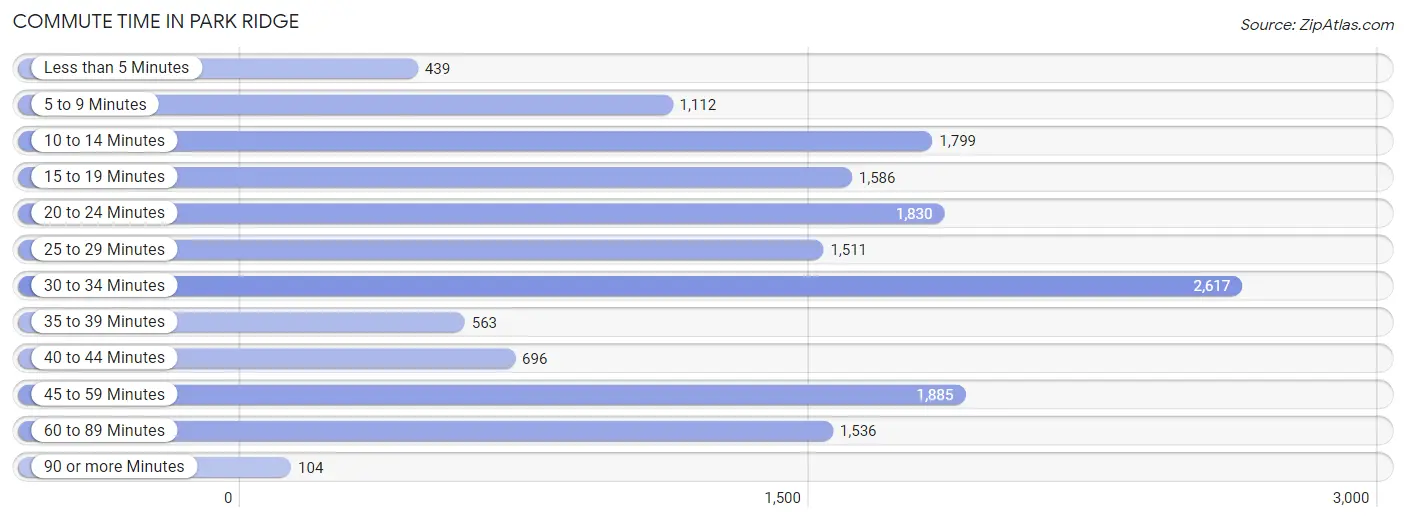
The most frequently occuring commute durations in Park Ridge are 30 to 34 minutes (2,617 commuters, 16.7%), 45 to 59 minutes (1,885 commuters, 12.0%), and 20 to 24 minutes (1,830 commuters, 11.7%).
| Commute Time | # Commuters | % Commuters |
| Less than 5 Minutes | 439 | 2.8% |
| 5 to 9 Minutes | 1,112 | 7.1% |
| 10 to 14 Minutes | 1,799 | 11.5% |
| 15 to 19 Minutes | 1,586 | 10.1% |
| 20 to 24 Minutes | 1,830 | 11.7% |
| 25 to 29 Minutes | 1,511 | 9.6% |
| 30 to 34 Minutes | 2,617 | 16.7% |
| 35 to 39 Minutes | 563 | 3.6% |
| 40 to 44 Minutes | 696 | 4.4% |
| 45 to 59 Minutes | 1,885 | 12.0% |
| 60 to 89 Minutes | 1,536 | 9.8% |
| 90 or more Minutes | 104 | 0.7% |
Commute Time by Sex in Park Ridge
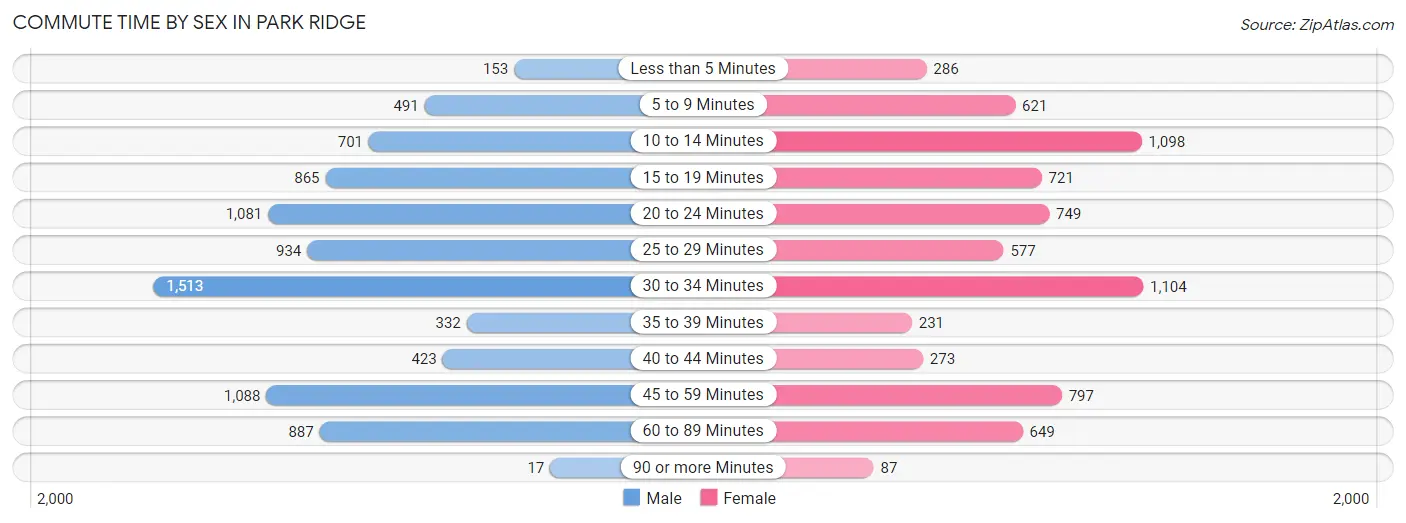
The most common commute times in Park Ridge are 30 to 34 minutes (1,513 commuters, 17.8%) for males and 30 to 34 minutes (1,104 commuters, 15.3%) for females.
| Commute Time | Male | Female |
| Less than 5 Minutes | 153 (1.8%) | 286 (4.0%) |
| 5 to 9 Minutes | 491 (5.8%) | 621 (8.6%) |
| 10 to 14 Minutes | 701 (8.3%) | 1,098 (15.3%) |
| 15 to 19 Minutes | 865 (10.2%) | 721 (10.0%) |
| 20 to 24 Minutes | 1,081 (12.7%) | 749 (10.4%) |
| 25 to 29 Minutes | 934 (11.0%) | 577 (8.0%) |
| 30 to 34 Minutes | 1,513 (17.8%) | 1,104 (15.3%) |
| 35 to 39 Minutes | 332 (3.9%) | 231 (3.2%) |
| 40 to 44 Minutes | 423 (5.0%) | 273 (3.8%) |
| 45 to 59 Minutes | 1,088 (12.8%) | 797 (11.1%) |
| 60 to 89 Minutes | 887 (10.4%) | 649 (9.0%) |
| 90 or more Minutes | 17 (0.2%) | 87 (1.2%) |
Time of Departure to Work by Sex in Park Ridge
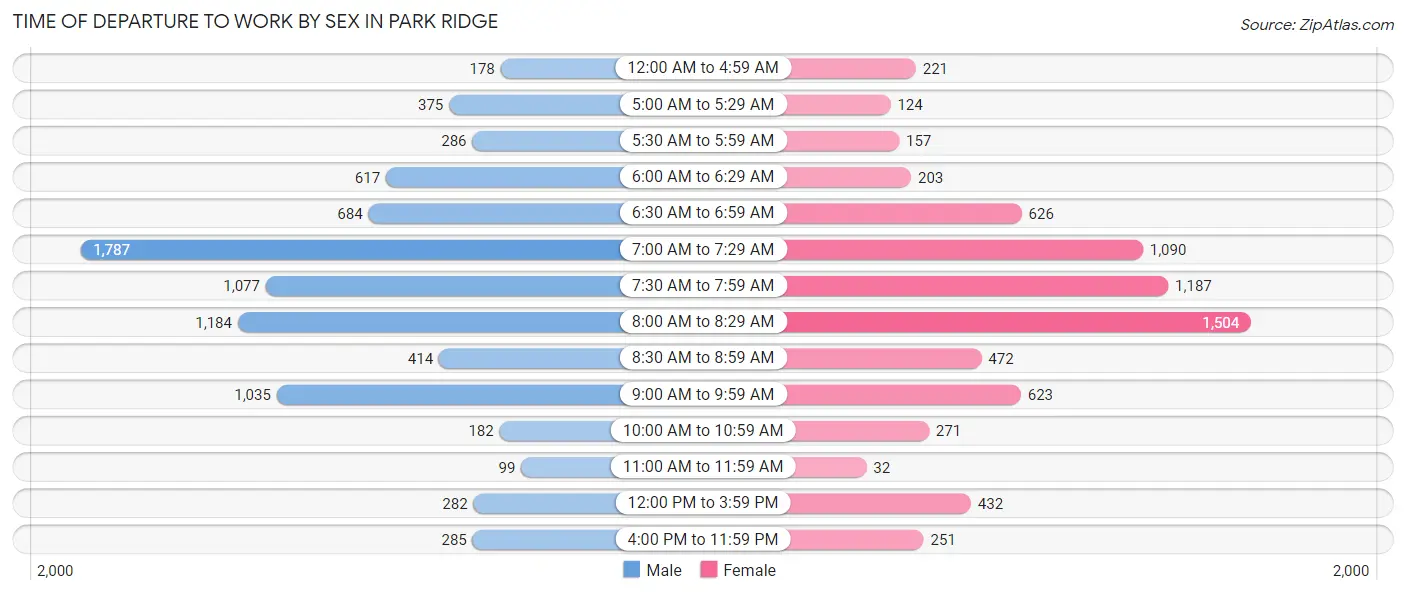
The most frequent times of departure to work in Park Ridge are 7:00 AM to 7:29 AM (1,787, 21.1%) for males and 8:00 AM to 8:29 AM (1,504, 20.9%) for females.
| Time of Departure | Male | Female |
| 12:00 AM to 4:59 AM | 178 (2.1%) | 221 (3.1%) |
| 5:00 AM to 5:29 AM | 375 (4.4%) | 124 (1.7%) |
| 5:30 AM to 5:59 AM | 286 (3.4%) | 157 (2.2%) |
| 6:00 AM to 6:29 AM | 617 (7.3%) | 203 (2.8%) |
| 6:30 AM to 6:59 AM | 684 (8.1%) | 626 (8.7%) |
| 7:00 AM to 7:29 AM | 1,787 (21.1%) | 1,090 (15.1%) |
| 7:30 AM to 7:59 AM | 1,077 (12.7%) | 1,187 (16.5%) |
| 8:00 AM to 8:29 AM | 1,184 (14.0%) | 1,504 (20.9%) |
| 8:30 AM to 8:59 AM | 414 (4.9%) | 472 (6.6%) |
| 9:00 AM to 9:59 AM | 1,035 (12.2%) | 623 (8.7%) |
| 10:00 AM to 10:59 AM | 182 (2.1%) | 271 (3.8%) |
| 11:00 AM to 11:59 AM | 99 (1.2%) | 32 (0.4%) |
| 12:00 PM to 3:59 PM | 282 (3.3%) | 432 (6.0%) |
| 4:00 PM to 11:59 PM | 285 (3.4%) | 251 (3.5%) |
| Total | 8,485 (100.0%) | 7,193 (100.0%) |
Housing Occupancy in Park Ridge
Occupancy by Ownership in Park Ridge
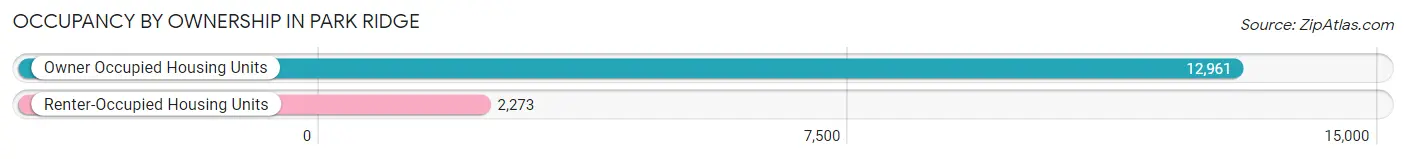
Of the total 15,234 dwellings in Park Ridge, owner-occupied units account for 12,961 (85.1%), while renter-occupied units make up 2,273 (14.9%).
| Occupancy | # Housing Units | % Housing Units |
| Owner Occupied Housing Units | 12,961 | 85.1% |
| Renter-Occupied Housing Units | 2,273 | 14.9% |
| Total Occupied Housing Units | 15,234 | 100.0% |
Occupancy by Household Size in Park Ridge
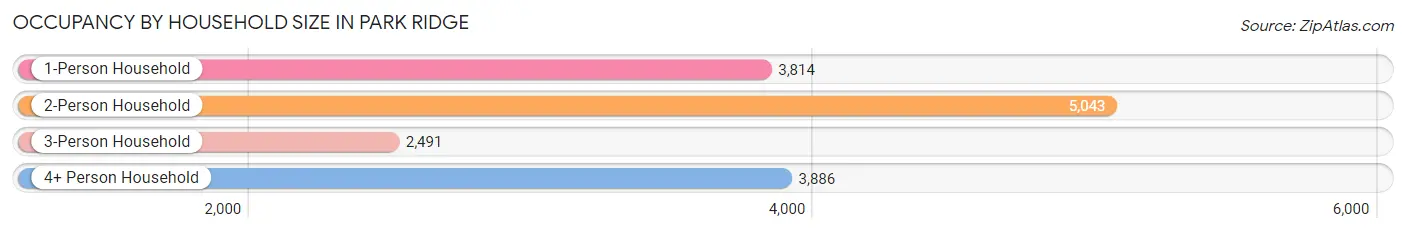
| Household Size | # Housing Units | % Housing Units |
| 1-Person Household | 3,814 | 25.0% |
| 2-Person Household | 5,043 | 33.1% |
| 3-Person Household | 2,491 | 16.4% |
| 4+ Person Household | 3,886 | 25.5% |
| Total Housing Units | 15,234 | 100.0% |
Occupancy by Ownership by Household Size in Park Ridge
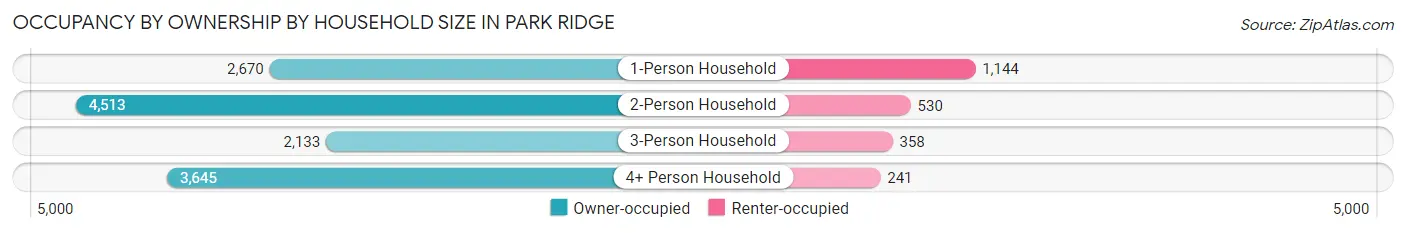
| Household Size | Owner-occupied | Renter-occupied |
| 1-Person Household | 2,670 (70.0%) | 1,144 (30.0%) |
| 2-Person Household | 4,513 (89.5%) | 530 (10.5%) |
| 3-Person Household | 2,133 (85.6%) | 358 (14.4%) |
| 4+ Person Household | 3,645 (93.8%) | 241 (6.2%) |
| Total Housing Units | 12,961 (85.1%) | 2,273 (14.9%) |
Occupancy by Educational Attainment in Park Ridge
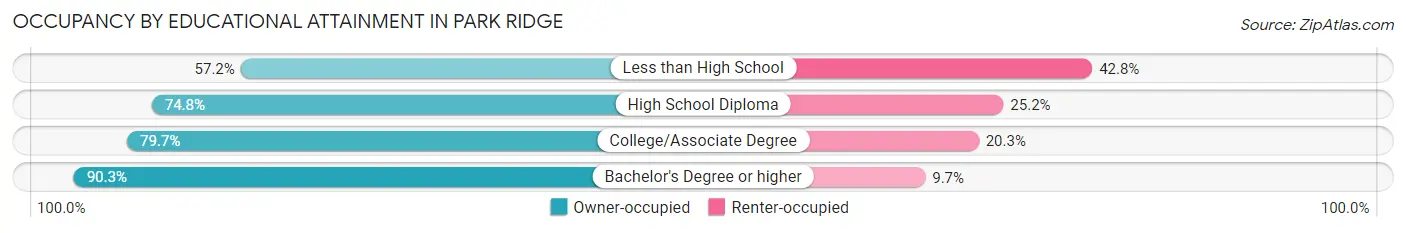
| Household Size | Owner-occupied | Renter-occupied |
| Less than High School | 315 (57.2%) | 236 (42.8%) |
| High School Diploma | 1,408 (74.8%) | 475 (25.2%) |
| College/Associate Degree | 2,375 (79.7%) | 606 (20.3%) |
| Bachelor's Degree or higher | 8,863 (90.3%) | 956 (9.7%) |
Occupancy by Age of Householder in Park Ridge
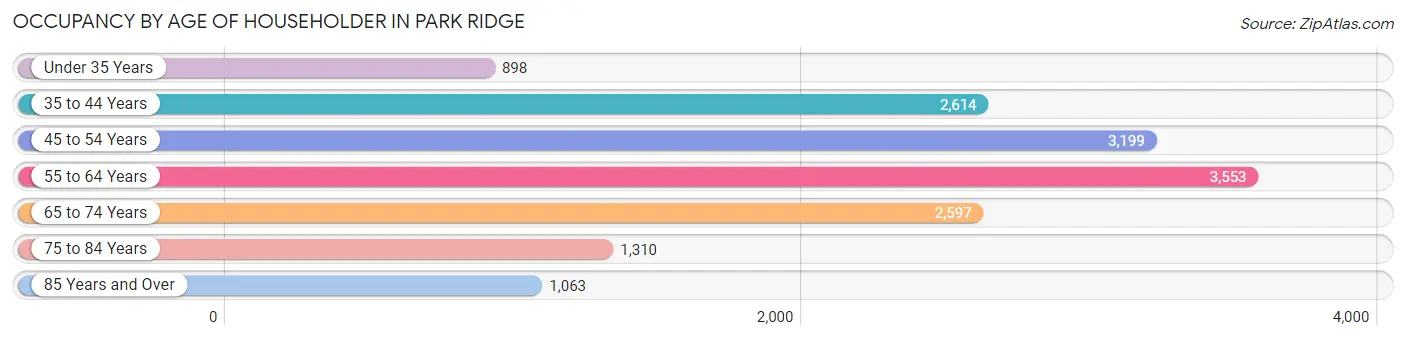
| Age Bracket | # Households | % Households |
| Under 35 Years | 898 | 5.9% |
| 35 to 44 Years | 2,614 | 17.2% |
| 45 to 54 Years | 3,199 | 21.0% |
| 55 to 64 Years | 3,553 | 23.3% |
| 65 to 74 Years | 2,597 | 17.1% |
| 75 to 84 Years | 1,310 | 8.6% |
| 85 Years and Over | 1,063 | 7.0% |
| Total | 15,234 | 100.0% |
Housing Finances in Park Ridge
Median Income by Occupancy in Park Ridge
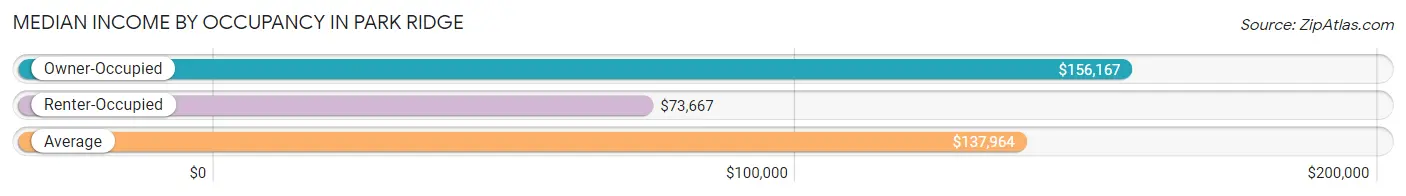
| Occupancy Type | # Households | Median Income |
| Owner-Occupied | 12,961 (85.1%) | $156,167 |
| Renter-Occupied | 2,273 (14.9%) | $73,667 |
| Average | 15,234 (100.0%) | $137,964 |
Occupancy by Householder Income Bracket in Park Ridge
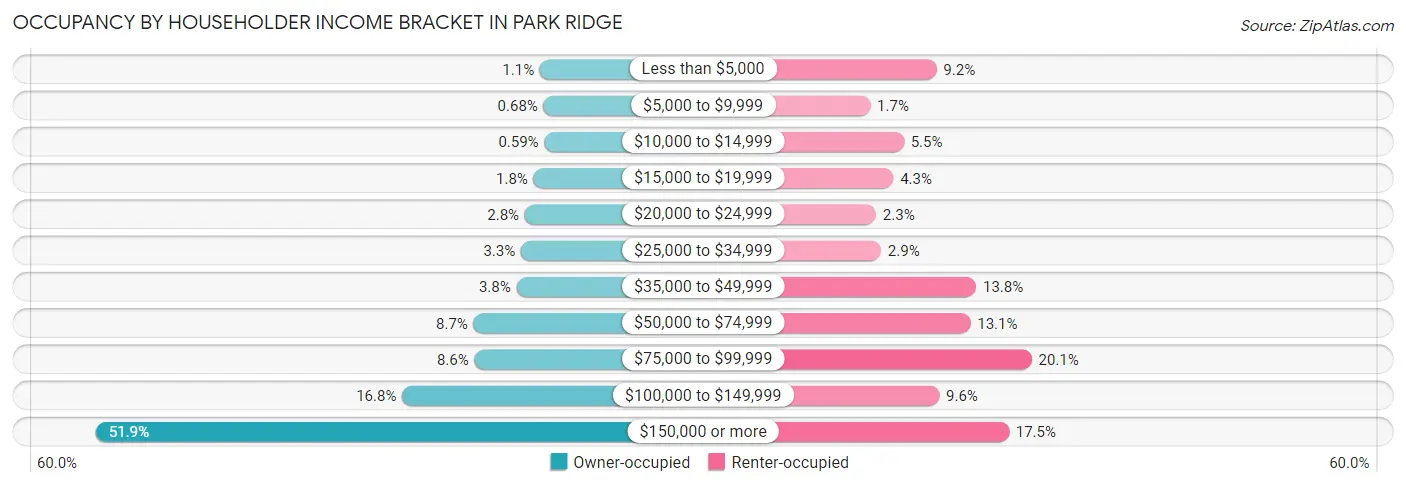
| Income Bracket | Owner-occupied | Renter-occupied |
| Less than $5,000 | 143 (1.1%) | 210 (9.2%) |
| $5,000 to $9,999 | 88 (0.7%) | 38 (1.7%) |
| $10,000 to $14,999 | 76 (0.6%) | 125 (5.5%) |
| $15,000 to $19,999 | 236 (1.8%) | 98 (4.3%) |
| $20,000 to $24,999 | 365 (2.8%) | 53 (2.3%) |
| $25,000 to $34,999 | 422 (3.3%) | 66 (2.9%) |
| $35,000 to $49,999 | 490 (3.8%) | 313 (13.8%) |
| $50,000 to $74,999 | 1,125 (8.7%) | 298 (13.1%) |
| $75,000 to $99,999 | 1,112 (8.6%) | 457 (20.1%) |
| $100,000 to $149,999 | 2,182 (16.8%) | 217 (9.6%) |
| $150,000 or more | 6,722 (51.9%) | 398 (17.5%) |
| Total | 12,961 (100.0%) | 2,273 (100.0%) |
Monthly Housing Cost Tiers in Park Ridge
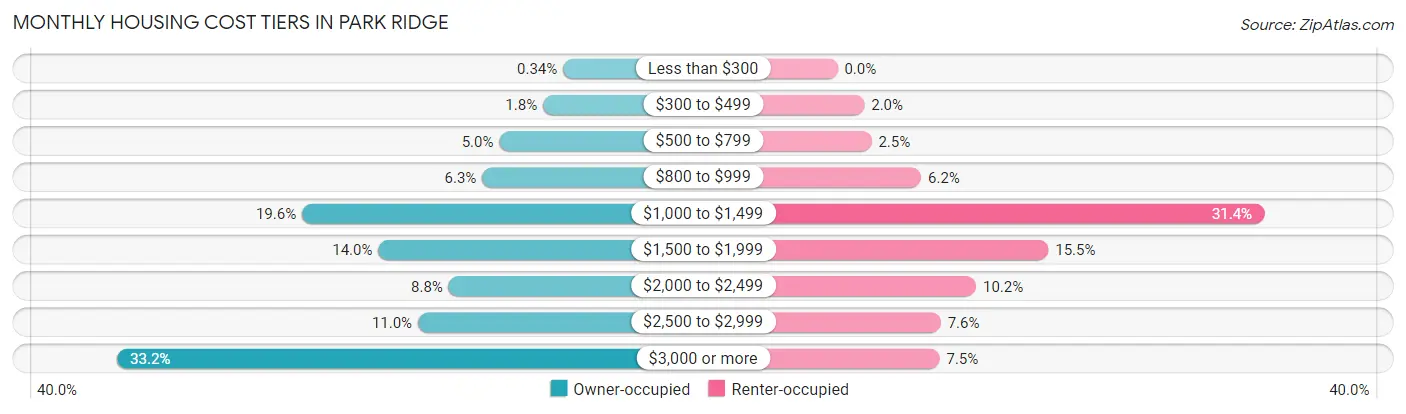
| Monthly Cost | Owner-occupied | Renter-occupied |
| Less than $300 | 44 (0.3%) | 0 (0.0%) |
| $300 to $499 | 236 (1.8%) | 45 (2.0%) |
| $500 to $799 | 653 (5.0%) | 57 (2.5%) |
| $800 to $999 | 817 (6.3%) | 140 (6.2%) |
| $1,000 to $1,499 | 2,536 (19.6%) | 714 (31.4%) |
| $1,500 to $1,999 | 1,808 (14.0%) | 353 (15.5%) |
| $2,000 to $2,499 | 1,137 (8.8%) | 232 (10.2%) |
| $2,500 to $2,999 | 1,429 (11.0%) | 173 (7.6%) |
| $3,000 or more | 4,301 (33.2%) | 171 (7.5%) |
| Total | 12,961 (100.0%) | 2,273 (100.0%) |
Physical Housing Characteristics in Park Ridge
Housing Structures in Park Ridge
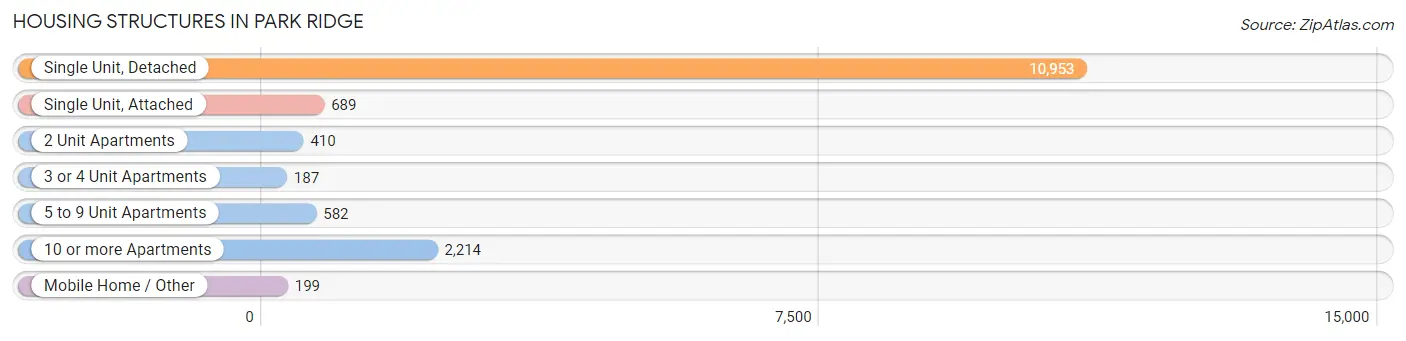
| Structure Type | # Housing Units | % Housing Units |
| Single Unit, Detached | 10,953 | 71.9% |
| Single Unit, Attached | 689 | 4.5% |
| 2 Unit Apartments | 410 | 2.7% |
| 3 or 4 Unit Apartments | 187 | 1.2% |
| 5 to 9 Unit Apartments | 582 | 3.8% |
| 10 or more Apartments | 2,214 | 14.5% |
| Mobile Home / Other | 199 | 1.3% |
| Total | 15,234 | 100.0% |
Housing Structures by Occupancy in Park Ridge
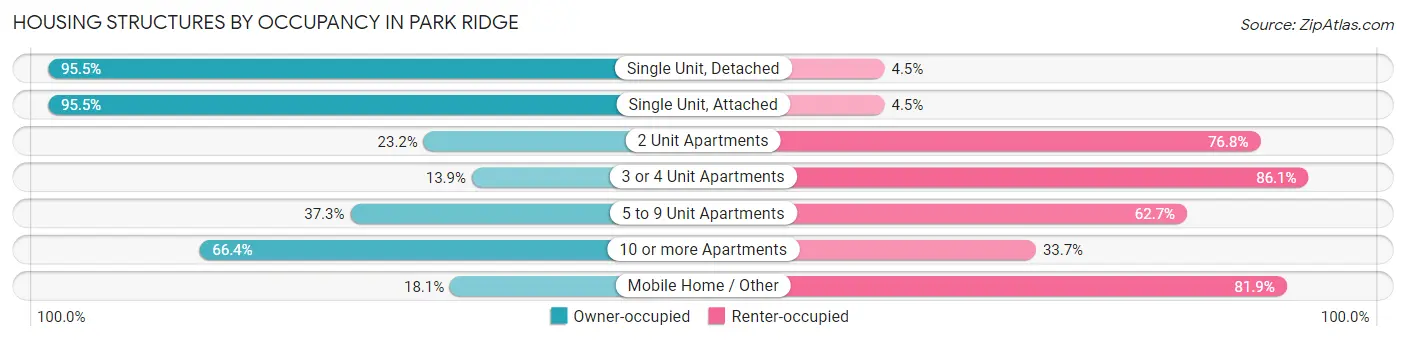
| Structure Type | Owner-occupied | Renter-occupied |
| Single Unit, Detached | 10,460 (95.5%) | 493 (4.5%) |
| Single Unit, Attached | 658 (95.5%) | 31 (4.5%) |
| 2 Unit Apartments | 95 (23.2%) | 315 (76.8%) |
| 3 or 4 Unit Apartments | 26 (13.9%) | 161 (86.1%) |
| 5 to 9 Unit Apartments | 217 (37.3%) | 365 (62.7%) |
| 10 or more Apartments | 1,469 (66.3%) | 745 (33.7%) |
| Mobile Home / Other | 36 (18.1%) | 163 (81.9%) |
| Total | 12,961 (85.1%) | 2,273 (14.9%) |
Housing Structures by Number of Rooms in Park Ridge
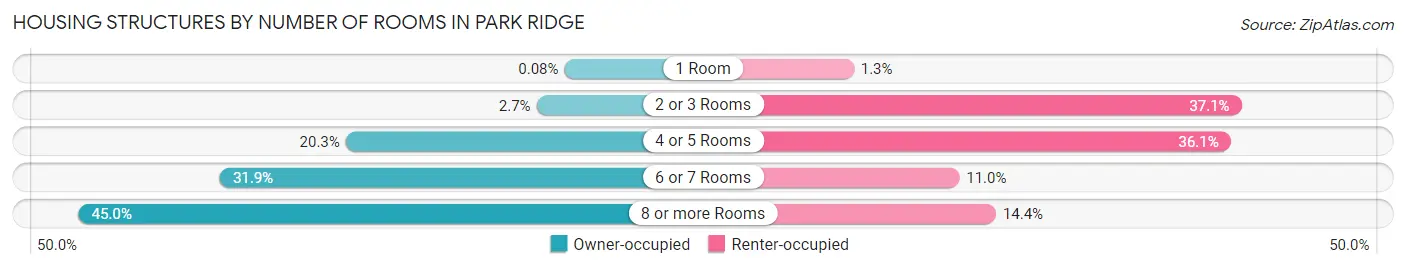
| Number of Rooms | Owner-occupied | Renter-occupied |
| 1 Room | 11 (0.1%) | 29 (1.3%) |
| 2 or 3 Rooms | 345 (2.7%) | 844 (37.1%) |
| 4 or 5 Rooms | 2,633 (20.3%) | 821 (36.1%) |
| 6 or 7 Rooms | 4,138 (31.9%) | 251 (11.0%) |
| 8 or more Rooms | 5,834 (45.0%) | 328 (14.4%) |
| Total | 12,961 (100.0%) | 2,273 (100.0%) |
Housing Structure by Heating Type in Park Ridge
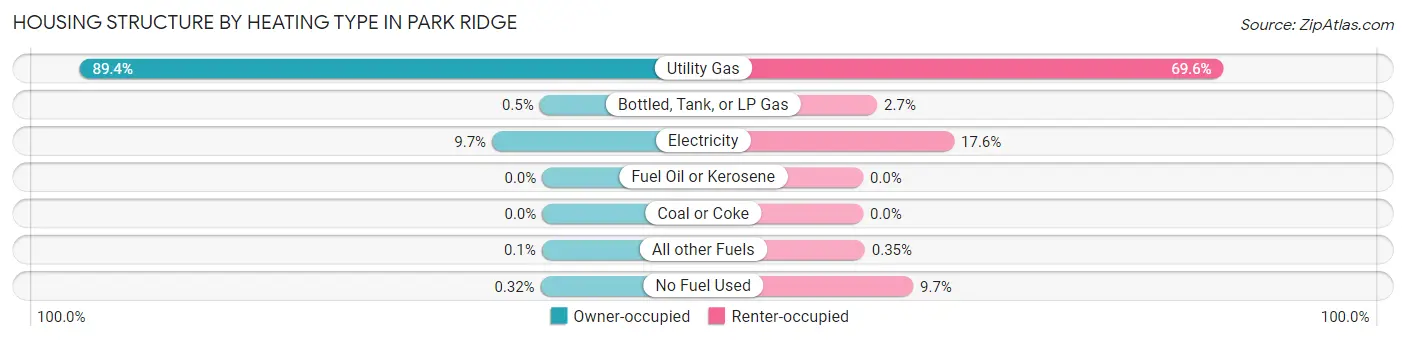
| Heating Type | Owner-occupied | Renter-occupied |
| Utility Gas | 11,585 (89.4%) | 1,583 (69.6%) |
| Bottled, Tank, or LP Gas | 65 (0.5%) | 62 (2.7%) |
| Electricity | 1,257 (9.7%) | 400 (17.6%) |
| Fuel Oil or Kerosene | 0 (0.0%) | 0 (0.0%) |
| Coal or Coke | 0 (0.0%) | 0 (0.0%) |
| All other Fuels | 13 (0.1%) | 8 (0.4%) |
| No Fuel Used | 41 (0.3%) | 220 (9.7%) |
| Total | 12,961 (100.0%) | 2,273 (100.0%) |
Household Vehicle Usage in Park Ridge
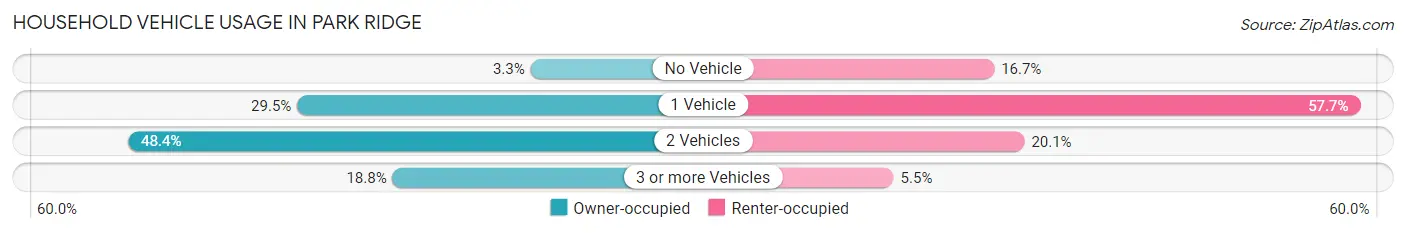
| Vehicles per Household | Owner-occupied | Renter-occupied |
| No Vehicle | 430 (3.3%) | 380 (16.7%) |
| 1 Vehicle | 3,820 (29.5%) | 1,312 (57.7%) |
| 2 Vehicles | 6,275 (48.4%) | 457 (20.1%) |
| 3 or more Vehicles | 2,436 (18.8%) | 124 (5.5%) |
| Total | 12,961 (100.0%) | 2,273 (100.0%) |
Real Estate & Mortgages in Park Ridge
Real Estate and Mortgage Overview in Park Ridge
| Characteristic | Without Mortgage | With Mortgage |
| Housing Units | 5,481 | 7,480 |
| Median Property Value | $459,000 | $579,000 |
| Median Household Income | $102,934 | $4,816 |
| Monthly Housing Costs | $1,212 | $4,176 |
| Real Estate Taxes | $9,450 | $28 |
Property Value by Mortgage Status in Park Ridge
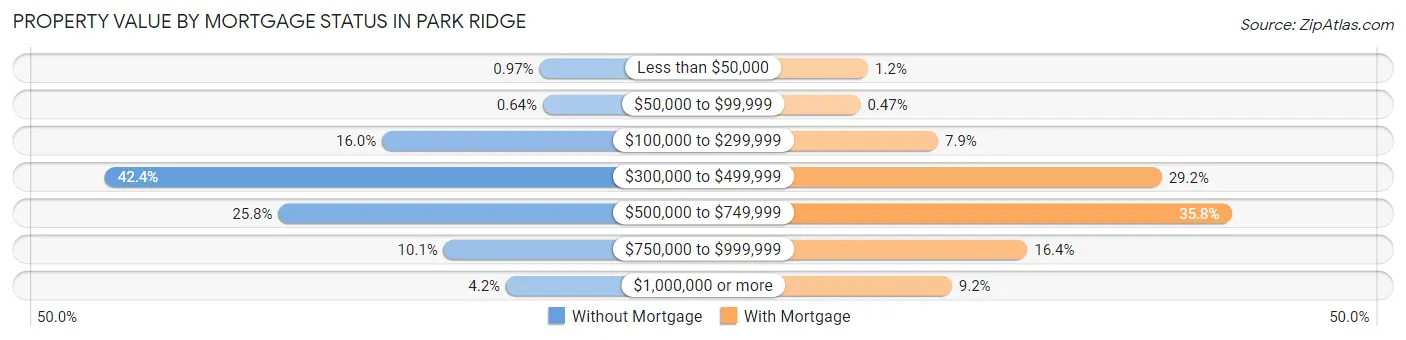
| Property Value | Without Mortgage | With Mortgage |
| Less than $50,000 | 53 (1.0%) | 90 (1.2%) |
| $50,000 to $99,999 | 35 (0.6%) | 35 (0.5%) |
| $100,000 to $299,999 | 875 (16.0%) | 588 (7.9%) |
| $300,000 to $499,999 | 2,321 (42.3%) | 2,181 (29.2%) |
| $500,000 to $749,999 | 1,416 (25.8%) | 2,676 (35.8%) |
| $750,000 to $999,999 | 553 (10.1%) | 1,224 (16.4%) |
| $1,000,000 or more | 228 (4.2%) | 686 (9.2%) |
| Total | 5,481 (100.0%) | 7,480 (100.0%) |
Household Income by Mortgage Status in Park Ridge
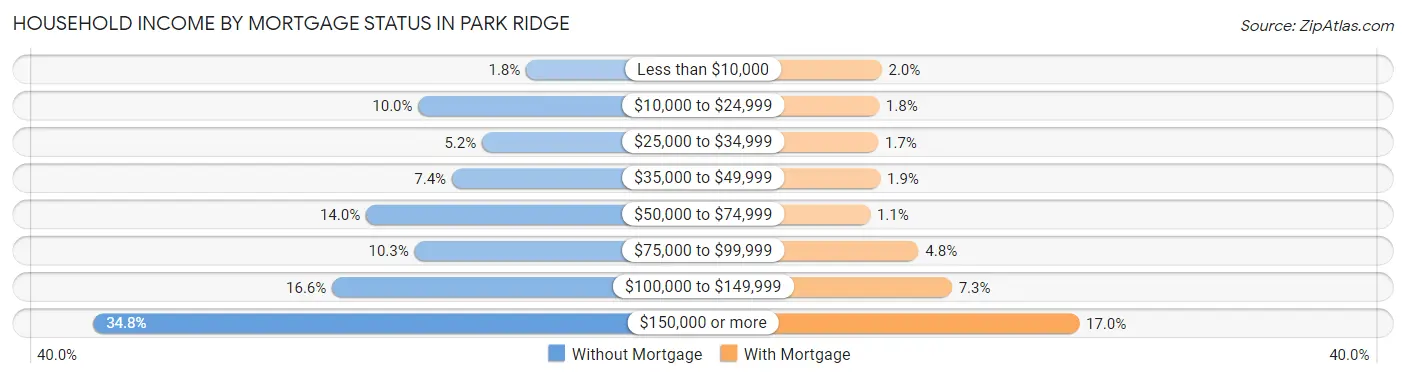
| Household Income | Without Mortgage | With Mortgage |
| Less than $10,000 | 98 (1.8%) | 148 (2.0%) |
| $10,000 to $24,999 | 548 (10.0%) | 133 (1.8%) |
| $25,000 to $34,999 | 282 (5.1%) | 129 (1.7%) |
| $35,000 to $49,999 | 408 (7.4%) | 140 (1.9%) |
| $50,000 to $74,999 | 767 (14.0%) | 82 (1.1%) |
| $75,000 to $99,999 | 564 (10.3%) | 358 (4.8%) |
| $100,000 to $149,999 | 908 (16.6%) | 548 (7.3%) |
| $150,000 or more | 1,906 (34.8%) | 1,274 (17.0%) |
| Total | 5,481 (100.0%) | 7,480 (100.0%) |
Property Value to Household Income Ratio in Park Ridge
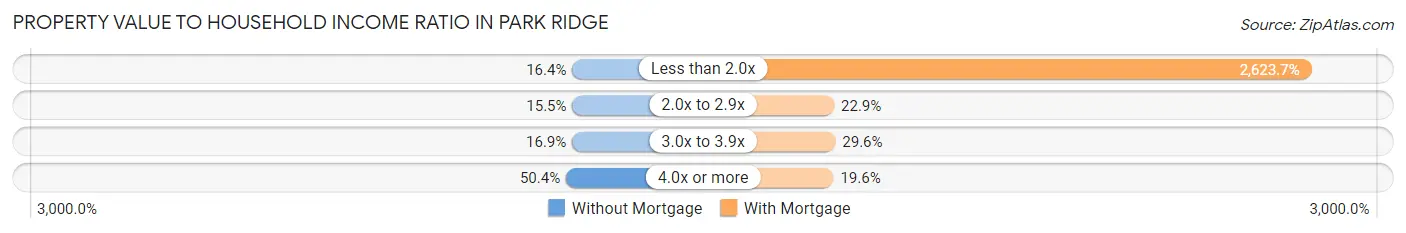
| Value-to-Income Ratio | Without Mortgage | With Mortgage |
| Less than 2.0x | 897 (16.4%) | 196,250 (2,623.7%) |
| 2.0x to 2.9x | 851 (15.5%) | 1,710 (22.9%) |
| 3.0x to 3.9x | 924 (16.9%) | 2,212 (29.6%) |
| 4.0x or more | 2,763 (50.4%) | 1,463 (19.6%) |
| Total | 5,481 (100.0%) | 7,480 (100.0%) |
Real Estate Taxes by Mortgage Status in Park Ridge
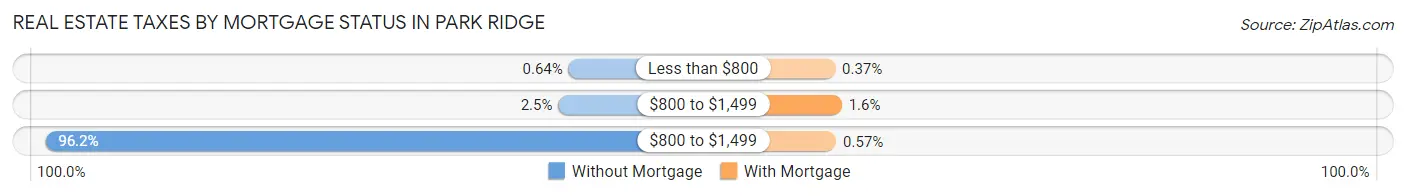
| Property Taxes | Without Mortgage | With Mortgage |
| Less than $800 | 35 (0.6%) | 28 (0.4%) |
| $800 to $1,499 | 138 (2.5%) | 119 (1.6%) |
| $800 to $1,499 | 5,274 (96.2%) | 43 (0.6%) |
| Total | 5,481 (100.0%) | 7,480 (100.0%) |
Health & Disability in Park Ridge
Health Insurance Coverage by Age in Park Ridge
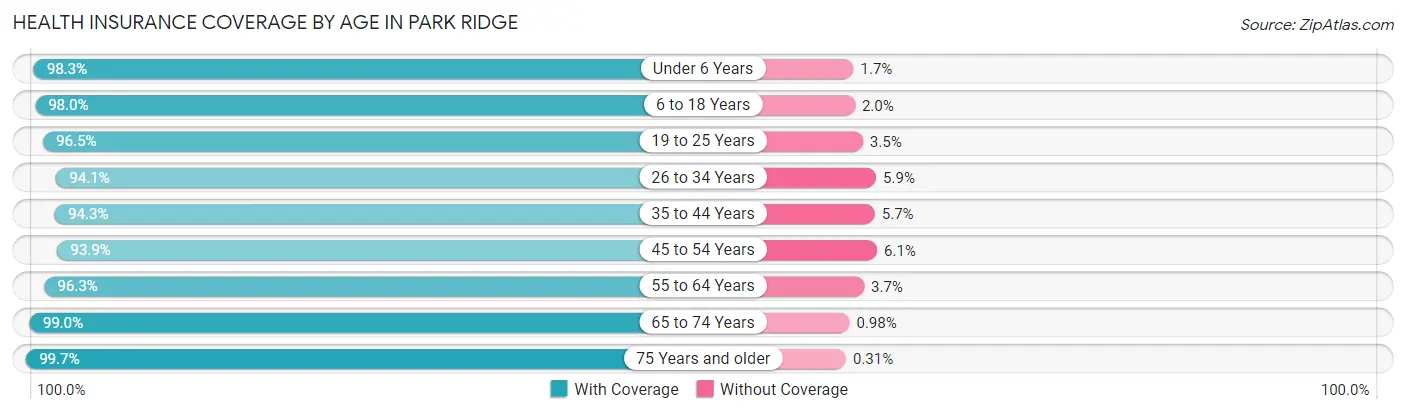
| Age Bracket | With Coverage | Without Coverage |
| Under 6 Years | 2,833 (98.3%) | 50 (1.7%) |
| 6 to 18 Years | 6,884 (98.0%) | 140 (2.0%) |
| 19 to 25 Years | 1,783 (96.5%) | 64 (3.5%) |
| 26 to 34 Years | 2,345 (94.1%) | 148 (5.9%) |
| 35 to 44 Years | 5,063 (94.3%) | 306 (5.7%) |
| 45 to 54 Years | 4,985 (93.9%) | 325 (6.1%) |
| 55 to 64 Years | 6,032 (96.3%) | 232 (3.7%) |
| 65 to 74 Years | 4,136 (99.0%) | 41 (1.0%) |
| 75 Years and older | 3,555 (99.7%) | 11 (0.3%) |
| Total | 37,616 (96.6%) | 1,317 (3.4%) |
Health Insurance Coverage by Citizenship Status in Park Ridge
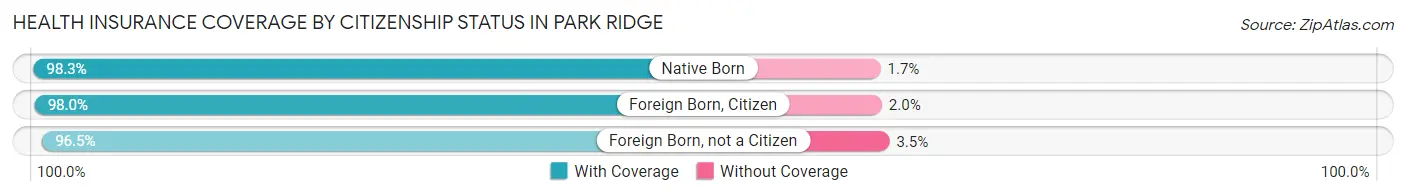
| Citizenship Status | With Coverage | Without Coverage |
| Native Born | 2,833 (98.3%) | 50 (1.7%) |
| Foreign Born, Citizen | 6,884 (98.0%) | 140 (2.0%) |
| Foreign Born, not a Citizen | 1,783 (96.5%) | 64 (3.5%) |
Health Insurance Coverage by Household Income in Park Ridge
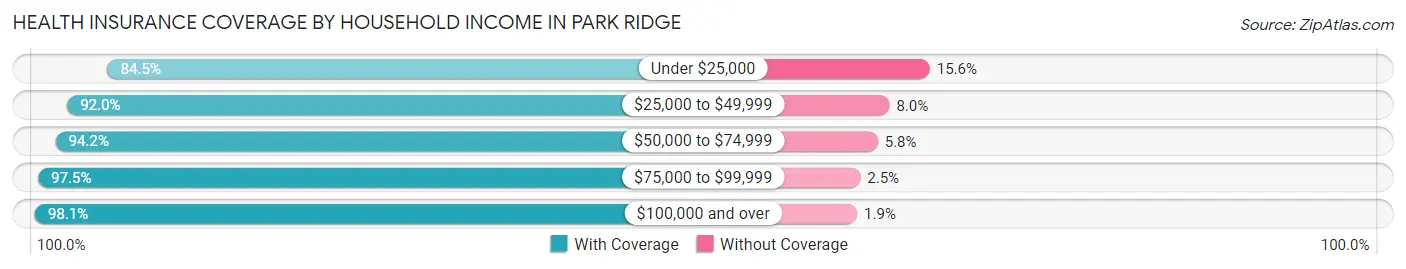
| Household Income | With Coverage | Without Coverage |
| Under $25,000 | 1,863 (84.5%) | 343 (15.5%) |
| $25,000 to $49,999 | 1,842 (92.0%) | 160 (8.0%) |
| $50,000 to $74,999 | 2,843 (94.2%) | 175 (5.8%) |
| $75,000 to $99,999 | 3,143 (97.5%) | 82 (2.5%) |
| $100,000 and over | 27,823 (98.1%) | 551 (1.9%) |
Public vs Private Health Insurance Coverage by Age in Park Ridge
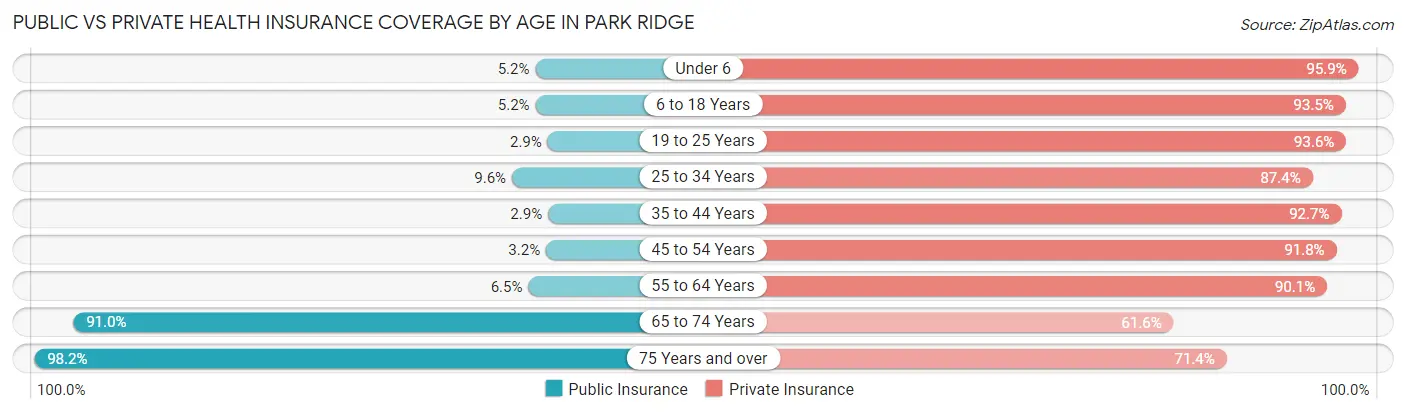
| Age Bracket | Public Insurance | Private Insurance |
| Under 6 | 150 (5.2%) | 2,765 (95.9%) |
| 6 to 18 Years | 364 (5.2%) | 6,569 (93.5%) |
| 19 to 25 Years | 54 (2.9%) | 1,729 (93.6%) |
| 25 to 34 Years | 238 (9.6%) | 2,178 (87.4%) |
| 35 to 44 Years | 153 (2.9%) | 4,977 (92.7%) |
| 45 to 54 Years | 171 (3.2%) | 4,875 (91.8%) |
| 55 to 64 Years | 408 (6.5%) | 5,642 (90.1%) |
| 65 to 74 Years | 3,800 (91.0%) | 2,572 (61.6%) |
| 75 Years and over | 3,502 (98.2%) | 2,547 (71.4%) |
| Total | 8,840 (22.7%) | 33,854 (87.0%) |
Disability Status by Sex by Age in Park Ridge
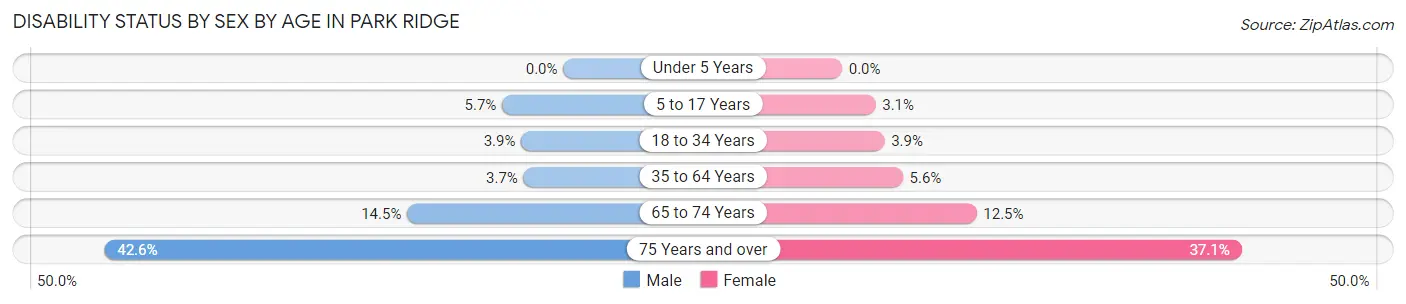
| Age Bracket | Male | Female |
| Under 5 Years | 0 (0.0%) | 0 (0.0%) |
| 5 to 17 Years | 212 (5.7%) | 101 (3.1%) |
| 18 to 34 Years | 110 (3.9%) | 87 (3.9%) |
| 35 to 64 Years | 297 (3.7%) | 500 (5.6%) |
| 65 to 74 Years | 314 (14.5%) | 251 (12.5%) |
| 75 Years and over | 602 (42.6%) | 799 (37.1%) |
Disability Class by Sex by Age in Park Ridge
Disability Class: Hearing Difficulty
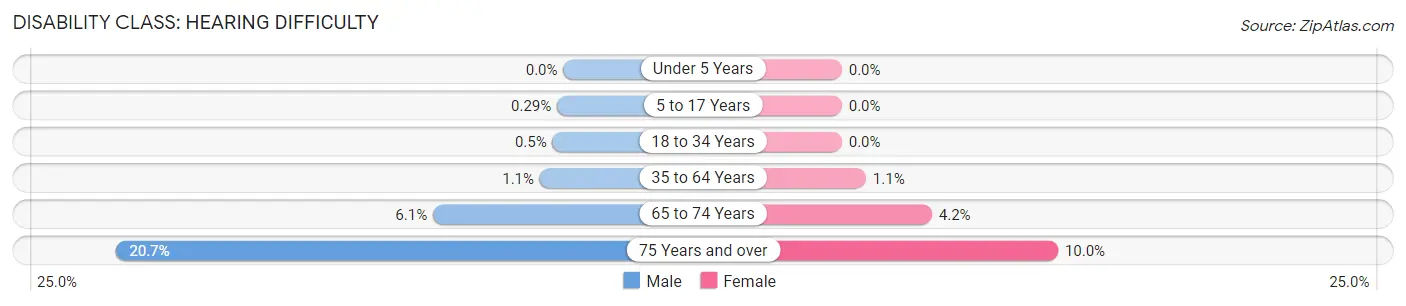
| Age Bracket | Male | Female |
| Under 5 Years | 0 (0.0%) | 0 (0.0%) |
| 5 to 17 Years | 11 (0.3%) | 0 (0.0%) |
| 18 to 34 Years | 14 (0.5%) | 0 (0.0%) |
| 35 to 64 Years | 88 (1.1%) | 99 (1.1%) |
| 65 to 74 Years | 131 (6.0%) | 84 (4.2%) |
| 75 Years and over | 293 (20.7%) | 216 (10.0%) |
Disability Class: Vision Difficulty
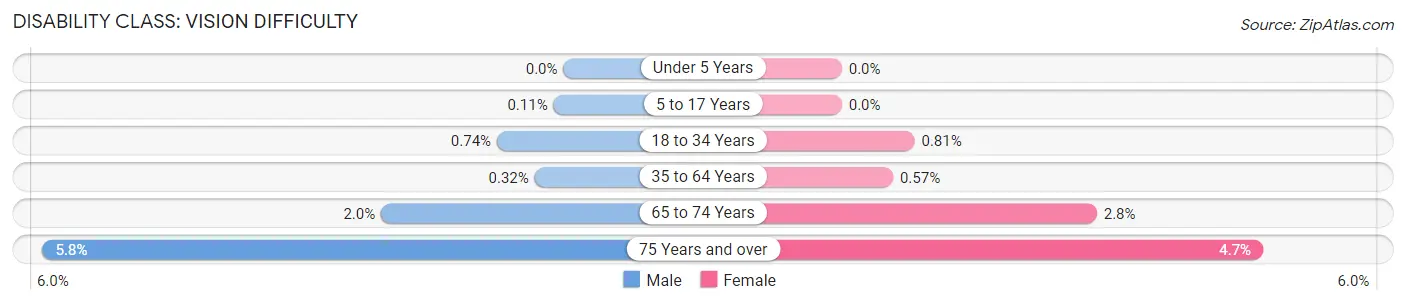
| Age Bracket | Male | Female |
| Under 5 Years | 0 (0.0%) | 0 (0.0%) |
| 5 to 17 Years | 4 (0.1%) | 0 (0.0%) |
| 18 to 34 Years | 21 (0.7%) | 18 (0.8%) |
| 35 to 64 Years | 26 (0.3%) | 51 (0.6%) |
| 65 to 74 Years | 44 (2.0%) | 57 (2.8%) |
| 75 Years and over | 82 (5.8%) | 101 (4.7%) |
Disability Class: Cognitive Difficulty
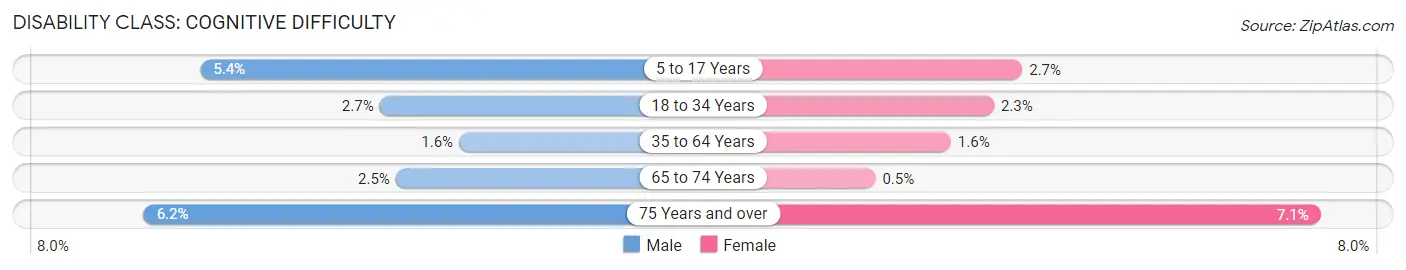
| Age Bracket | Male | Female |
| 5 to 17 Years | 201 (5.4%) | 87 (2.7%) |
| 18 to 34 Years | 77 (2.7%) | 50 (2.3%) |
| 35 to 64 Years | 125 (1.5%) | 144 (1.6%) |
| 65 to 74 Years | 54 (2.5%) | 10 (0.5%) |
| 75 Years and over | 88 (6.2%) | 153 (7.1%) |
Disability Class: Ambulatory Difficulty
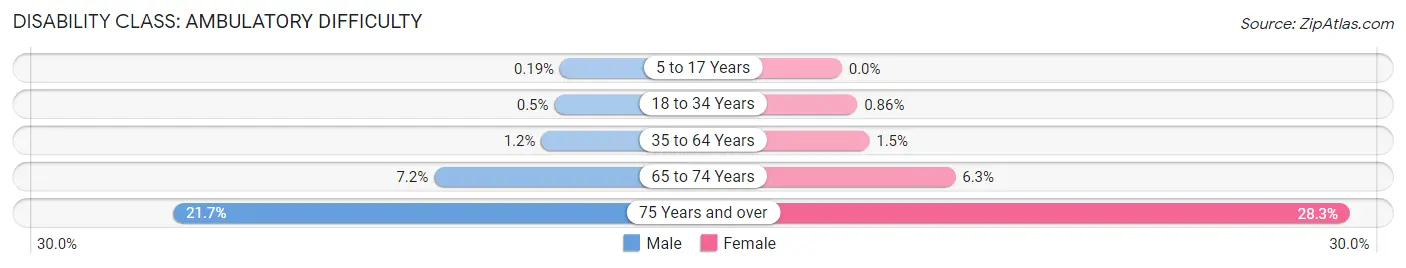
| Age Bracket | Male | Female |
| 5 to 17 Years | 7 (0.2%) | 0 (0.0%) |
| 18 to 34 Years | 14 (0.5%) | 19 (0.9%) |
| 35 to 64 Years | 99 (1.2%) | 136 (1.5%) |
| 65 to 74 Years | 156 (7.2%) | 127 (6.3%) |
| 75 Years and over | 307 (21.7%) | 609 (28.3%) |
Disability Class: Self-Care Difficulty
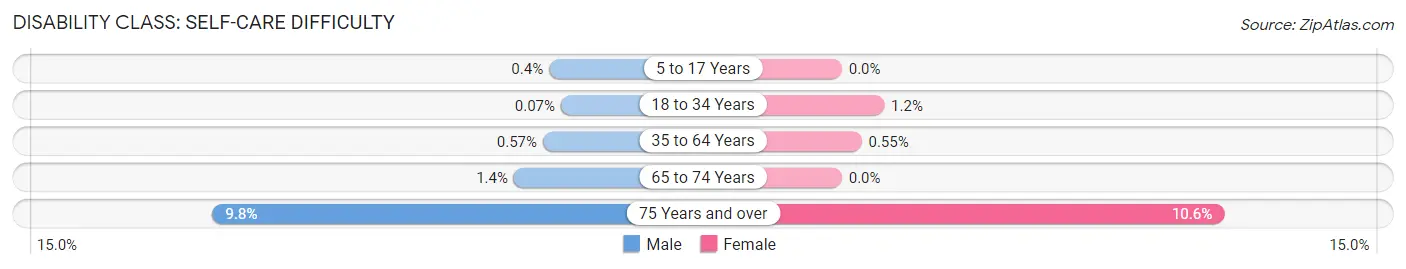
| Age Bracket | Male | Female |
| 5 to 17 Years | 15 (0.4%) | 0 (0.0%) |
| 18 to 34 Years | 2 (0.1%) | 26 (1.2%) |
| 35 to 64 Years | 46 (0.6%) | 49 (0.5%) |
| 65 to 74 Years | 30 (1.4%) | 0 (0.0%) |
| 75 Years and over | 138 (9.8%) | 229 (10.6%) |
Technology Access in Park Ridge
Computing Device Access in Park Ridge
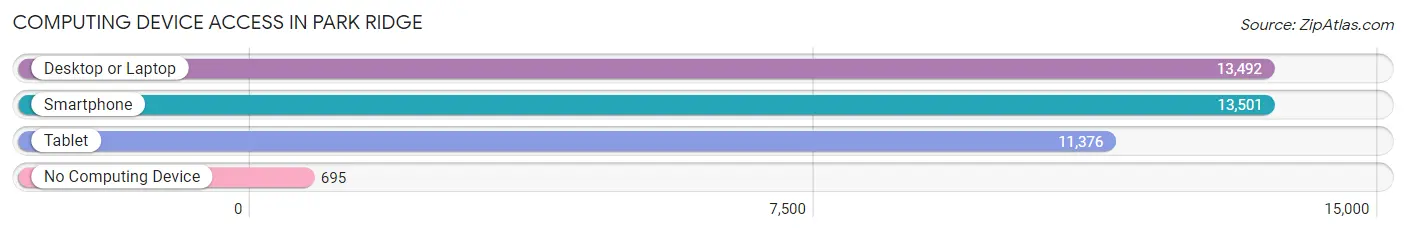
| Device Type | # Households | % Households |
| Desktop or Laptop | 13,492 | 88.6% |
| Smartphone | 13,501 | 88.6% |
| Tablet | 11,376 | 74.7% |
| No Computing Device | 695 | 4.6% |
| Total | 15,234 | 100.0% |
Internet Access in Park Ridge
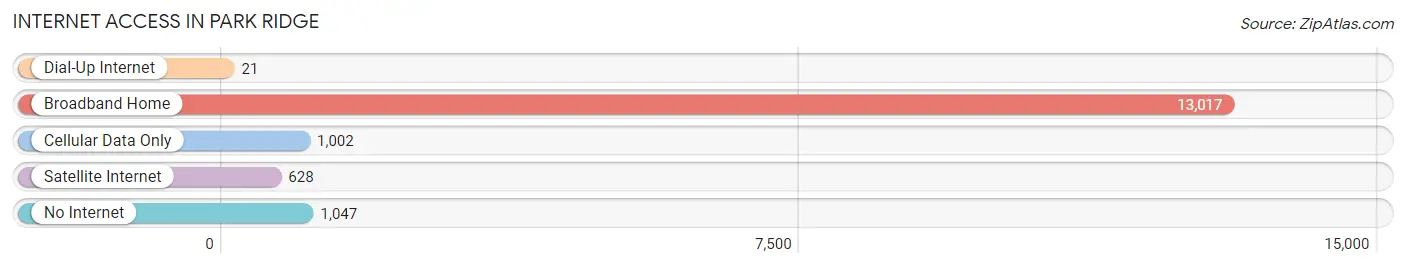
| Internet Type | # Households | % Households |
| Dial-Up Internet | 21 | 0.1% |
| Broadband Home | 13,017 | 85.5% |
| Cellular Data Only | 1,002 | 6.6% |
| Satellite Internet | 628 | 4.1% |
| No Internet | 1,047 | 6.9% |
| Total | 15,234 | 100.0% |
Park Ridge Summary
History
Park Ridge, Illinois is a city located in Cook County, approximately 15 miles northwest of downtown Chicago. It is a suburb of Chicago and is part of the Chicago metropolitan area. The city was first settled in the early 19th century and was incorporated as a village in 1873. Park Ridge has a rich history and has been home to many notable people, including former President Barack Obama.
The area that is now Park Ridge was first settled in the early 19th century by German and Dutch immigrants. The first settlers were farmers who grew crops such as wheat, corn, and oats. The area was known as Pennyville until 1873 when it was incorporated as a village and renamed Park Ridge. The name was chosen because of the area’s hilly terrain and its proximity to the Des Plaines River.
In the late 19th century, Park Ridge began to grow and develop as a residential suburb of Chicago. The area was served by the Chicago and Northwestern Railway, which provided easy access to the city. The population of Park Ridge grew steadily throughout the early 20th century, reaching a peak of nearly 40,000 in the 1950s.
In the 1950s, Park Ridge was home to many notable people, including former President Barack Obama. Obama lived in Park Ridge from the age of four until he graduated from high school. He attended the local public schools and was active in the community.
Geography
Park Ridge is located in Cook County, Illinois, approximately 15 miles northwest of downtown Chicago. It is part of the Chicago metropolitan area and is bordered by the cities of Niles, Des Plaines, and Chicago. The city covers an area of 5.2 square miles and has a population of 37,480 as of the 2010 census.
The terrain of Park Ridge is hilly and is located on the Des Plaines River. The city is divided into two distinct areas: the north side and the south side. The north side is more residential and is home to many single-family homes, while the south side is more commercial and is home to many businesses and shopping centers.
Economy
Park Ridge has a strong and diverse economy. The city is home to many businesses, including manufacturing, retail, and healthcare. The city is also home to several corporate headquarters, including the headquarters of the American Academy of Pediatrics and the American College of Radiology.
The city’s largest employer is Advocate Lutheran General Hospital, which employs over 4,000 people. Other major employers include the Park Ridge Public Library, the Park Ridge Park District, and the Park Ridge-Niles School District.
Demographics
As of the 2010 census, Park Ridge had a population of 37,480. The racial makeup of the city was 87.3% White, 4.2% African American, 0.2% Native American, 4.7% Asian, and 3.6% from other races. Hispanic or Latino of any race were 8.3% of the population.
The median household income in Park Ridge was $77,890, and the median family income was $97,813. The per capita income was $41,945. About 4.3% of families and 5.7% of the population were below the poverty line, including 6.7% of those under age 18 and 4.2% of those age 65 or over.
Common Questions
What is Per Capita Income in Park Ridge?
Per Capita income in Park Ridge is $69,765.
What is the Median Family Income in Park Ridge?
Median Family Income in Park Ridge is $172,255.
What is the Median Household income in Park Ridge?
Median Household Income in Park Ridge is $137,964.
What is Income or Wage Gap in Park Ridge?
Income or Wage Gap in Park Ridge is 34.6%.
Women in Park Ridge earn 65.4 cents for every dollar earned by a man.
What is Inequality or Gini Index in Park Ridge?
Inequality or Gini Index in Park Ridge is 0.45.
What is the Total Population of Park Ridge?
Total Population of Park Ridge is 39,368.
What is the Total Male Population of Park Ridge?
Total Male Population of Park Ridge is 19,620.
What is the Total Female Population of Park Ridge?
Total Female Population of Park Ridge is 19,748.
What is the Ratio of Males per 100 Females in Park Ridge?
There are 99.35 Males per 100 Females in Park Ridge.
What is the Ratio of Females per 100 Males in Park Ridge?
There are 100.65 Females per 100 Males in Park Ridge.
What is the Median Population Age in Park Ridge?
Median Population Age in Park Ridge is 45.1 Years.
What is the Average Family Size in Park Ridge
Average Family Size in Park Ridge is 3.1 People.
What is the Average Household Size in Park Ridge
Average Household Size in Park Ridge is 2.5 People.
How Large is the Labor Force in Park Ridge?
There are 20,435 People in the Labor Forcein in Park Ridge.
What is the Percentage of People in the Labor Force in Park Ridge?
65.7% of People are in the Labor Force in Park Ridge.
What is the Unemployment Rate in Park Ridge?
Unemployment Rate in Park Ridge is 3.5%.