Zip Codes with the Highest Percentage of Families with Income Above $200,000 in Illinois
RELATED REPORTS & OPTIONS
Family Income | $200k+
Illinois
Compare Zip Codes
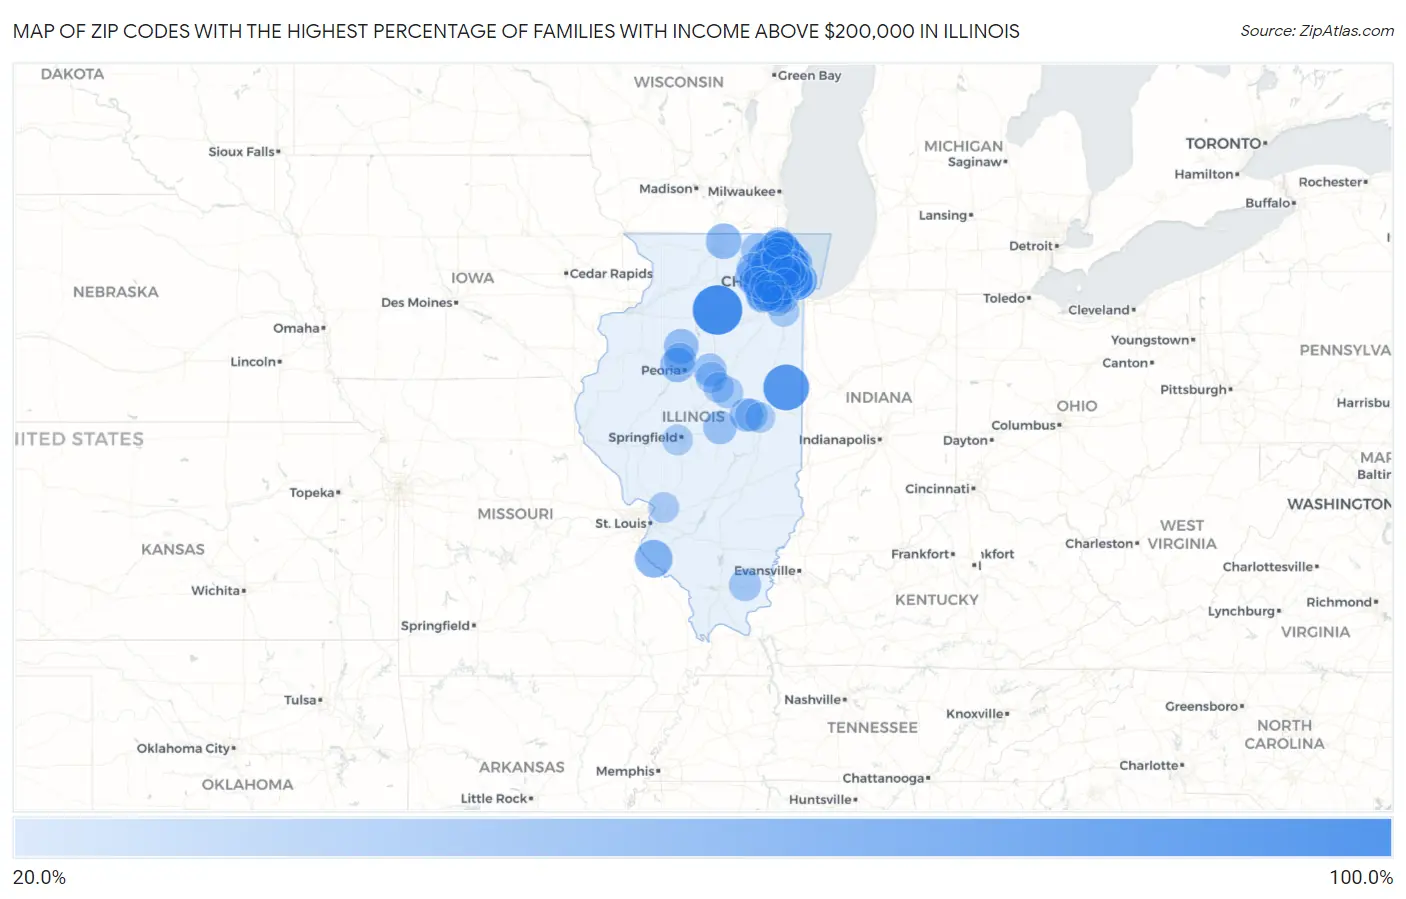
Map of Zip Codes with the Highest Percentage of Families with Income Above $200,000 in Illinois
20.0%
100.0%
Zip Codes with the Highest Percentage of Families with Income Above $200,000 in Illinois
| Zip Code | Families with Income > $200k | vs State | vs National | |
| 1. | 61371 | 100.0% | 16.3%(+83.7)#1 | 14.8%(+85.2)#25 |
| 2. | 60932 | 85.3% | 16.3%(+69.0)#2 | 14.8%(+70.5)#59 |
| 3. | 60029 | 71.3% | 16.3%(+55.0)#3 | 14.8%(+56.5)#108 |
| 4. | 60043 | 71.1% | 16.3%(+54.8)#4 | 14.8%(+56.3)#109 |
| 5. | 60603 | 64.8% | 16.3%(+48.5)#5 | 14.8%(+50.0)#190 |
| 6. | 60521 | 64.3% | 16.3%(+48.0)#6 | 14.8%(+49.5)#200 |
| 7. | 60093 | 63.4% | 16.3%(+47.1)#7 | 14.8%(+48.6)#214 |
| 8. | 60654 | 62.7% | 16.3%(+46.4)#8 | 14.8%(+47.9)#230 |
| 9. | 60614 | 62.2% | 16.3%(+45.9)#9 | 14.8%(+47.4)#239 |
| 10. | 60022 | 60.6% | 16.3%(+44.3)#10 | 14.8%(+45.8)#286 |
| 11. | 60604 | 60.5% | 16.3%(+44.2)#11 | 14.8%(+45.7)#291 |
| 12. | 60611 | 60.1% | 16.3%(+43.8)#12 | 14.8%(+45.3)#297 |
| 13. | 60045 | 58.8% | 16.3%(+42.5)#13 | 14.8%(+44.0)#330 |
| 14. | 60091 | 56.8% | 16.3%(+40.5)#14 | 14.8%(+42.0)#388 |
| 15. | 60558 | 55.4% | 16.3%(+39.1)#15 | 14.8%(+40.6)#445 |
| 16. | 60305 | 54.8% | 16.3%(+38.5)#16 | 14.8%(+40.0)#463 |
| 17. | 62279 | 53.8% | 16.3%(+37.5)#17 | 14.8%(+39.0)#506 |
| 18. | 60657 | 53.4% | 16.3%(+37.1)#18 | 14.8%(+38.6)#519 |
| 19. | 60610 | 53.1% | 16.3%(+36.8)#19 | 14.8%(+38.3)#530 |
| 20. | 60015 | 52.3% | 16.3%(+36.0)#20 | 14.8%(+37.5)#560 |
| 21. | 60048 | 51.9% | 16.3%(+35.6)#21 | 14.8%(+37.1)#576 |
| 22. | 60035 | 51.7% | 16.3%(+35.4)#22 | 14.8%(+36.9)#583 |
| 23. | 60661 | 49.9% | 16.3%(+33.6)#23 | 14.8%(+35.1)#676 |
| 24. | 60606 | 49.0% | 16.3%(+32.7)#24 | 14.8%(+34.2)#716 |
| 25. | 60010 | 48.7% | 16.3%(+32.4)#25 | 14.8%(+33.9)#724 |
| 26. | 60026 | 48.1% | 16.3%(+31.8)#26 | 14.8%(+33.3)#754 |
| 27. | 60069 | 48.0% | 16.3%(+31.7)#27 | 14.8%(+33.2)#761 |
| 28. | 60047 | 46.5% | 16.3%(+30.2)#28 | 14.8%(+31.7)#839 |
| 29. | 61011 | 46.2% | 16.3%(+29.9)#29 | 14.8%(+31.4)#856 |
| 30. | 60062 | 45.9% | 16.3%(+29.6)#30 | 14.8%(+31.1)#873 |
| 31. | 60601 | 45.4% | 16.3%(+29.1)#31 | 14.8%(+30.6)#916 |
| 32. | 60201 | 44.5% | 16.3%(+28.2)#32 | 14.8%(+29.7)#956 |
| 33. | 60605 | 44.4% | 16.3%(+28.1)#33 | 14.8%(+29.6)#963 |
| 34. | 60564 | 43.9% | 16.3%(+27.6)#34 | 14.8%(+29.1)#994 |
| 35. | 60203 | 43.8% | 16.3%(+27.5)#35 | 14.8%(+29.0)#1,003 |
| 36. | 60068 | 43.4% | 16.3%(+27.1)#36 | 14.8%(+28.6)#1,028 |
| 37. | 60175 | 43.2% | 16.3%(+26.9)#37 | 14.8%(+28.4)#1,038 |
| 38. | 60523 | 43.1% | 16.3%(+26.8)#38 | 14.8%(+28.3)#1,046 |
| 39. | 60126 | 43.0% | 16.3%(+26.7)#39 | 14.8%(+28.2)#1,052 |
| 40. | 61479 | 42.9% | 16.3%(+26.6)#40 | 14.8%(+28.1)#1,064 |
| 41. | 60514 | 42.5% | 16.3%(+26.2)#41 | 14.8%(+27.7)#1,095 |
| 42. | 61528 | 42.3% | 16.3%(+26.0)#42 | 14.8%(+27.5)#1,117 |
| 43. | 60642 | 42.2% | 16.3%(+25.9)#43 | 14.8%(+27.4)#1,121 |
| 44. | 60607 | 42.1% | 16.3%(+25.8)#44 | 14.8%(+27.3)#1,126 |
| 45. | 60540 | 42.0% | 16.3%(+25.7)#45 | 14.8%(+27.2)#1,132 |
| 46. | 60622 | 41.7% | 16.3%(+25.4)#46 | 14.8%(+26.9)#1,164 |
| 47. | 60044 | 41.0% | 16.3%(+24.7)#47 | 14.8%(+26.2)#1,226 |
| 48. | 60137 | 40.6% | 16.3%(+24.3)#48 | 14.8%(+25.8)#1,259 |
| 49. | 60565 | 40.5% | 16.3%(+24.2)#49 | 14.8%(+25.7)#1,269 |
| 50. | 60134 | 39.4% | 16.3%(+23.1)#50 | 14.8%(+24.6)#1,370 |
| 51. | 60515 | 38.8% | 16.3%(+22.5)#51 | 14.8%(+24.0)#1,431 |
| 52. | 60613 | 38.4% | 16.3%(+22.1)#52 | 14.8%(+23.6)#1,469 |
| 53. | 60302 | 38.4% | 16.3%(+22.1)#53 | 14.8%(+23.6)#1,471 |
| 54. | 62535 | 38.4% | 16.3%(+22.1)#54 | 14.8%(+23.6)#1,476 |
| 55. | 60602 | 38.3% | 16.3%(+22.0)#55 | 14.8%(+23.5)#1,485 |
| 56. | 60464 | 37.7% | 16.3%(+21.4)#56 | 14.8%(+22.9)#1,530 |
| 57. | 61884 | 37.6% | 16.3%(+21.3)#57 | 14.8%(+22.8)#1,550 |
| 58. | 61771 | 36.4% | 16.3%(+20.1)#58 | 14.8%(+21.6)#1,694 |
| 59. | 60304 | 36.3% | 16.3%(+20.0)#59 | 14.8%(+21.5)#1,702 |
| 60. | 60025 | 36.0% | 16.3%(+19.7)#60 | 14.8%(+21.2)#1,726 |
| 61. | 60012 | 36.0% | 16.3%(+19.7)#61 | 14.8%(+21.2)#1,730 |
| 62. | 60502 | 35.9% | 16.3%(+19.6)#62 | 14.8%(+21.1)#1,740 |
| 63. | 60067 | 35.6% | 16.3%(+19.3)#63 | 14.8%(+20.8)#1,767 |
| 64. | 60527 | 34.8% | 16.3%(+18.5)#64 | 14.8%(+20.0)#1,860 |
| 65. | 61875 | 34.8% | 16.3%(+18.5)#65 | 14.8%(+20.0)#1,869 |
| 66. | 60585 | 34.7% | 16.3%(+18.4)#66 | 14.8%(+19.9)#1,875 |
| 67. | 60525 | 34.0% | 16.3%(+17.7)#67 | 14.8%(+19.2)#1,958 |
| 68. | 60184 | 33.9% | 16.3%(+17.6)#68 | 14.8%(+19.1)#1,980 |
| 69. | 60189 | 33.5% | 16.3%(+17.2)#69 | 14.8%(+18.7)#2,018 |
| 70. | 61525 | 33.4% | 16.3%(+17.1)#70 | 14.8%(+18.6)#2,036 |
| 71. | 62965 | 33.3% | 16.3%(+17.0)#71 | 14.8%(+18.5)#2,075 |
| 72. | 60646 | 33.2% | 16.3%(+16.9)#72 | 14.8%(+18.4)#2,079 |
| 73. | 60124 | 31.8% | 16.3%(+15.5)#73 | 14.8%(+17.0)#2,255 |
| 74. | 60004 | 31.3% | 16.3%(+15.0)#74 | 14.8%(+16.5)#2,317 |
| 75. | 60187 | 31.2% | 16.3%(+14.9)#75 | 14.8%(+16.4)#2,339 |
| 76. | 60061 | 30.8% | 16.3%(+14.5)#76 | 14.8%(+16.0)#2,399 |
| 77. | 60190 | 30.8% | 16.3%(+14.5)#77 | 14.8%(+16.0)#2,404 |
| 78. | 61736 | 30.8% | 16.3%(+14.5)#78 | 14.8%(+16.0)#2,409 |
| 79. | 60647 | 29.8% | 16.3%(+13.5)#79 | 14.8%(+15.0)#2,533 |
| 80. | 61725 | 29.8% | 16.3%(+13.5)#80 | 14.8%(+15.0)#2,549 |
| 81. | 60192 | 29.5% | 16.3%(+13.2)#81 | 14.8%(+14.7)#2,593 |
| 82. | 60526 | 29.5% | 16.3%(+13.2)#82 | 14.8%(+14.7)#2,595 |
| 83. | 60618 | 29.3% | 16.3%(+13.0)#83 | 14.8%(+14.5)#2,615 |
| 84. | 60712 | 29.0% | 16.3%(+12.7)#84 | 14.8%(+14.2)#2,672 |
| 85. | 60089 | 28.9% | 16.3%(+12.6)#85 | 14.8%(+14.1)#2,685 |
| 86. | 60423 | 28.9% | 16.3%(+12.6)#86 | 14.8%(+14.1)#2,689 |
| 87. | 60510 | 28.9% | 16.3%(+12.6)#87 | 14.8%(+14.1)#2,691 |
| 88. | 61705 | 28.9% | 16.3%(+12.6)#88 | 14.8%(+14.1)#2,696 |
| 89. | 60516 | 28.6% | 16.3%(+12.3)#89 | 14.8%(+13.8)#2,748 |
| 90. | 60563 | 28.4% | 16.3%(+12.1)#90 | 14.8%(+13.6)#2,793 |
| 91. | 60631 | 28.4% | 16.3%(+12.1)#91 | 14.8%(+13.6)#2,794 |
| 92. | 60439 | 28.4% | 16.3%(+12.1)#92 | 14.8%(+13.6)#2,796 |
| 93. | 62025 | 28.3% | 16.3%(+12.0)#93 | 14.8%(+13.5)#2,811 |
| 94. | 62711 | 27.5% | 16.3%(+11.2)#94 | 14.8%(+12.7)#2,951 |
| 95. | 60546 | 27.3% | 16.3%(+11.0)#95 | 14.8%(+12.5)#3,000 |
| 96. | 60491 | 27.2% | 16.3%(+10.9)#96 | 14.8%(+12.4)#3,023 |
| 97. | 60490 | 27.1% | 16.3%(+10.8)#97 | 14.8%(+12.3)#3,032 |
| 98. | 60031 | 26.9% | 16.3%(+10.6)#98 | 14.8%(+12.1)#3,063 |
| 99. | 61874 | 26.9% | 16.3%(+10.6)#99 | 14.8%(+12.1)#3,068 |
| 100. | 60532 | 26.4% | 16.3%(+10.1)#100 | 14.8%(+11.6)#3,160 |
Common Questions
What are the Top 10 Zip Codes with the Highest Percentage of Families with Income Above $200,000 in Illinois?
Top 10 Zip Codes with the Highest Percentage of Families with Income Above $200,000 in Illinois are:
What zip code has the Highest Percentage of Families with Income Above $200,000 in Illinois?
61371 has the Highest Percentage of Families with Income Above $200,000 in Illinois with 100.0%.
What is the Percentage of Families with Income Above $200,000 in the State of Illinois?
Percentage of Families with Income Above $200,000 in Illinois is 16.3%.
What is the Percentage of Families with Income Above $200,000 in the United States?
Percentage of Families with Income Above $200,000 in the United States is 14.8%.