Knollwood, IL Map & Demographics
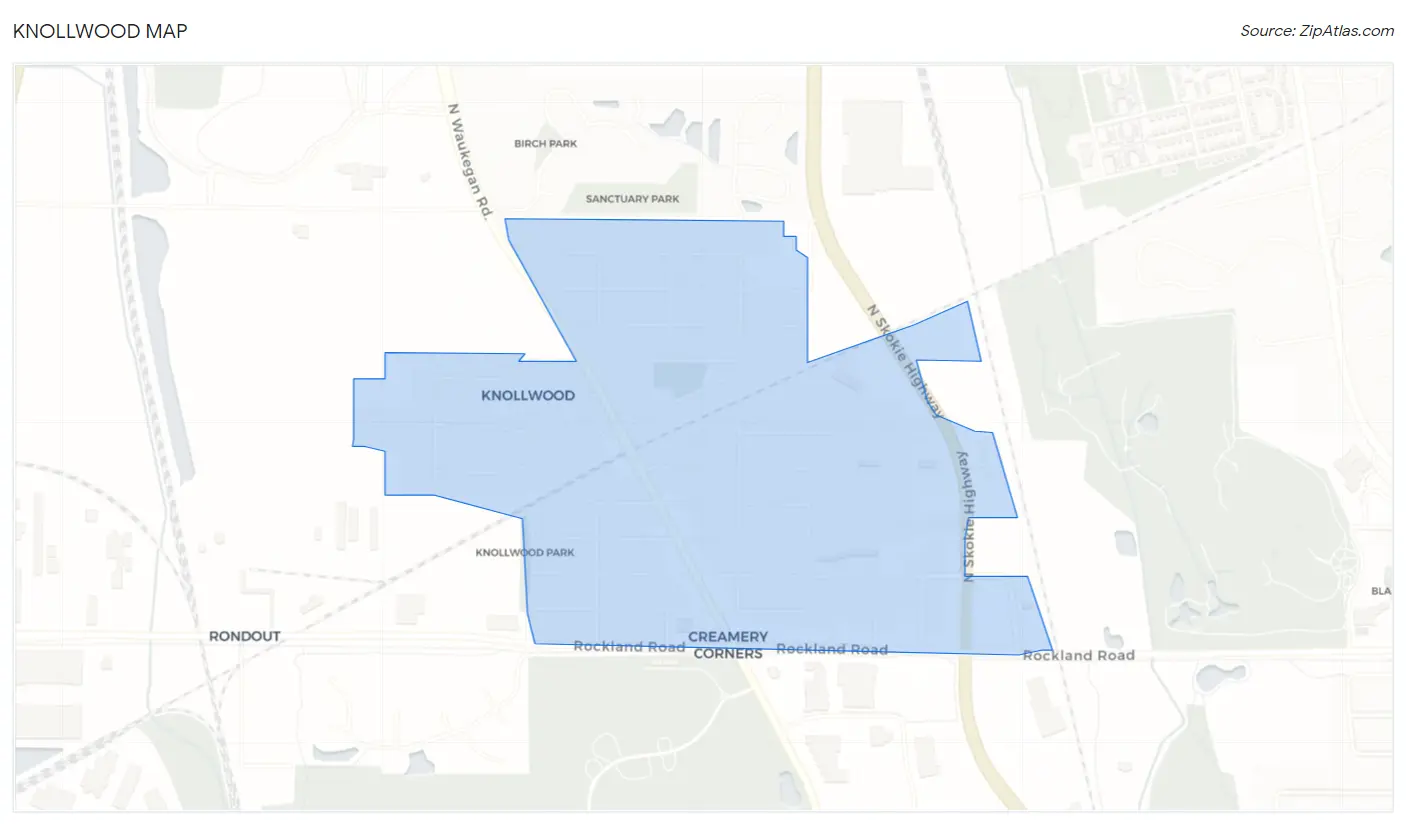
Knollwood Map
Knollwood Overview
$47,964
PER CAPITA INCOME
$185,439
AVG FAMILY INCOME
$157,396
AVG HOUSEHOLD INCOME
0.38
INEQUALITY / GINI INDEX
1,763
TOTAL POPULATION
772
MALE POPULATION
991
FEMALE POPULATION
77.90
MALES / 100 FEMALES
128.37
FEMALES / 100 MALES
38.7
MEDIAN AGE
3.4
AVG FAMILY SIZE
2.9
AVG HOUSEHOLD SIZE
619
LABOR FORCE [ PEOPLE ]
50.6%
PERCENT IN LABOR FORCE
Income in Knollwood
Income Overview in Knollwood
Per Capita Income in Knollwood is $47,964, while median incomes of families and households are $185,439 and $157,396 respectively.
| Characteristic | Number | Measure |
| Per Capita Income | 1,763 | $47,964 |
| Median Family Income | 445 | $185,439 |
| Mean Family Income | 445 | $157,397 |
| Median Household Income | 577 | $157,396 |
| Mean Household Income | 577 | $144,282 |
| Income Deficit | 445 | $0 |
| Wage / Income Gap (%) | 1,763 | 0.00% |
| Wage / Income Gap ($) | 1,763 | 100.00¢ per $1 |
| Gini / Inequality Index | 1,763 | 0.38 |
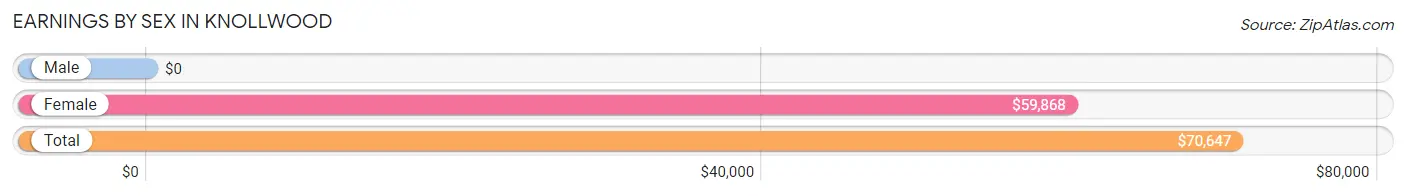
Earnings by Sex in Knollwood
| Sex | Number | Average Earnings |
| Male | 313 (46.5%) | $0 |
| Female | 360 (53.5%) | $59,868 |
| Total | 673 (100.0%) | $70,647 |
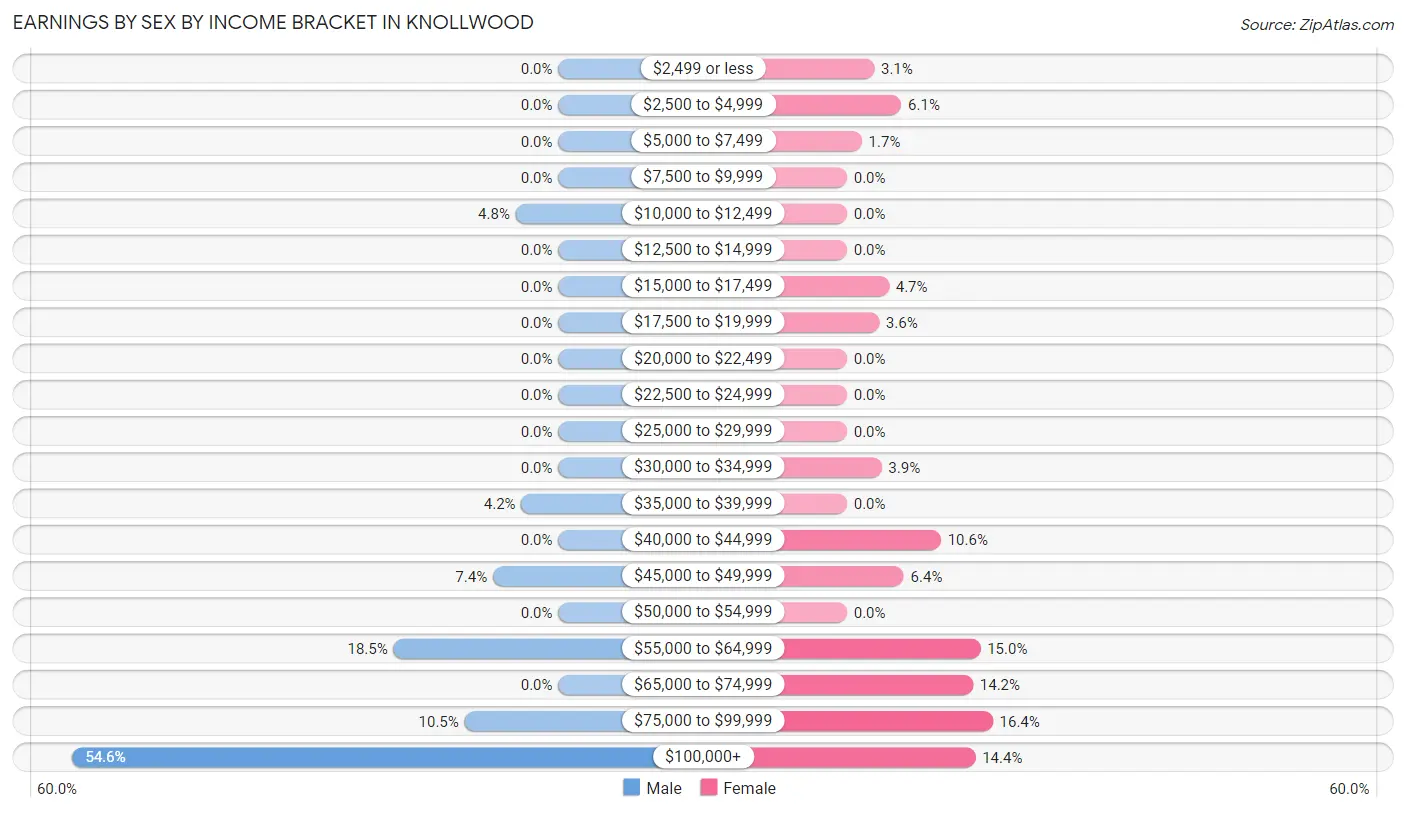
Earnings by Sex by Income Bracket in Knollwood
The most common earnings brackets in Knollwood are $100,000+ for men (171 | 54.6%) and $75,000 to $99,999 for women (59 | 16.4%).
| Income | Male | Female |
| $2,499 or less | 0 (0.0%) | 11 (3.1%) |
| $2,500 to $4,999 | 0 (0.0%) | 22 (6.1%) |
| $5,000 to $7,499 | 0 (0.0%) | 6 (1.7%) |
| $7,500 to $9,999 | 0 (0.0%) | 0 (0.0%) |
| $10,000 to $12,499 | 15 (4.8%) | 0 (0.0%) |
| $12,500 to $14,999 | 0 (0.0%) | 0 (0.0%) |
| $15,000 to $17,499 | 0 (0.0%) | 17 (4.7%) |
| $17,500 to $19,999 | 0 (0.0%) | 13 (3.6%) |
| $20,000 to $22,499 | 0 (0.0%) | 0 (0.0%) |
| $22,500 to $24,999 | 0 (0.0%) | 0 (0.0%) |
| $25,000 to $29,999 | 0 (0.0%) | 0 (0.0%) |
| $30,000 to $34,999 | 0 (0.0%) | 14 (3.9%) |
| $35,000 to $39,999 | 13 (4.2%) | 0 (0.0%) |
| $40,000 to $44,999 | 0 (0.0%) | 38 (10.6%) |
| $45,000 to $49,999 | 23 (7.3%) | 23 (6.4%) |
| $50,000 to $54,999 | 0 (0.0%) | 0 (0.0%) |
| $55,000 to $64,999 | 58 (18.5%) | 54 (15.0%) |
| $65,000 to $74,999 | 0 (0.0%) | 51 (14.2%) |
| $75,000 to $99,999 | 33 (10.5%) | 59 (16.4%) |
| $100,000+ | 171 (54.6%) | 52 (14.4%) |
| Total | 313 (100.0%) | 360 (100.0%) |
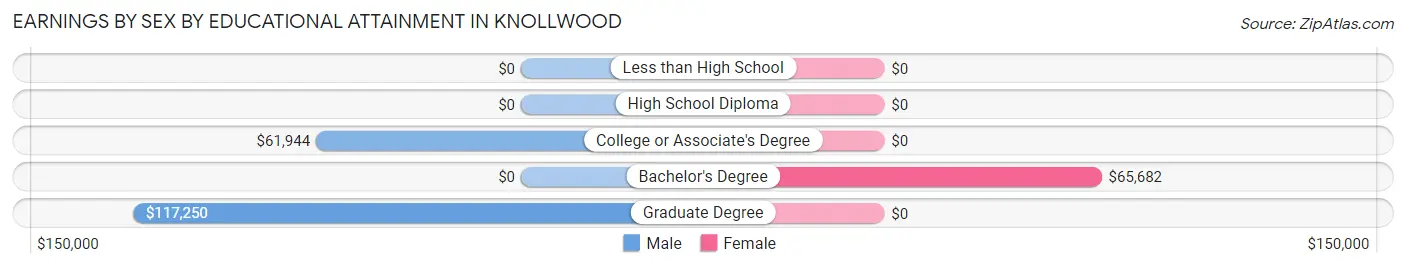
Earnings by Sex by Educational Attainment in Knollwood
| Educational Attainment | Male Income | Female Income |
| Less than High School | - | - |
| High School Diploma | - | - |
| College or Associate's Degree | $61,944 | $0 |
| Bachelor's Degree | - | - |
| Graduate Degree | $117,250 | $0 |
| Total | - | - |
Family Income in Knollwood
Family Income Brackets in Knollwood
According to the Knollwood family income data, there are 145 families falling into the $150,000 to $199,999 income range, which is the most common income bracket and makes up 32.6% of all families.
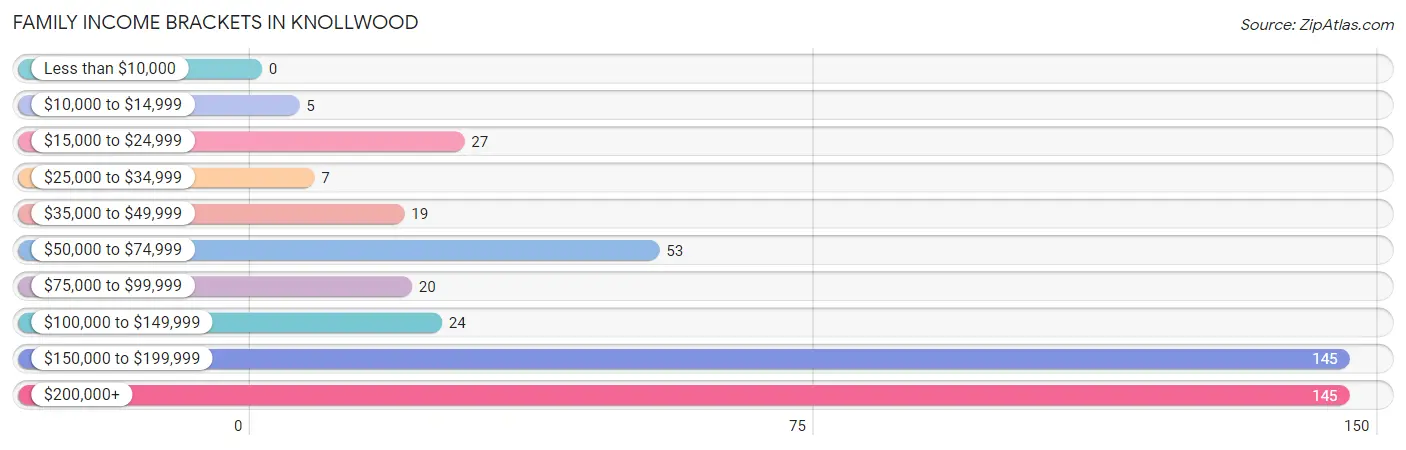
| Income Bracket | # Families | % Families |
| Less than $10,000 | 0 | 0.0% |
| $10,000 to $14,999 | 5 | 1.1% |
| $15,000 to $24,999 | 27 | 6.1% |
| $25,000 to $34,999 | 7 | 1.6% |
| $35,000 to $49,999 | 19 | 4.3% |
| $50,000 to $74,999 | 53 | 11.9% |
| $75,000 to $99,999 | 20 | 4.5% |
| $100,000 to $149,999 | 24 | 5.4% |
| $150,000 to $199,999 | 145 | 32.6% |
| $200,000+ | 145 | 32.6% |
Family Income by Famaliy Size in Knollwood
3-person families (88 | 19.8%) account for the highest median family income in Knollwood with $201,875 per family, while 3-person families (88 | 19.8%) have the highest median income of $67,292 per family member.
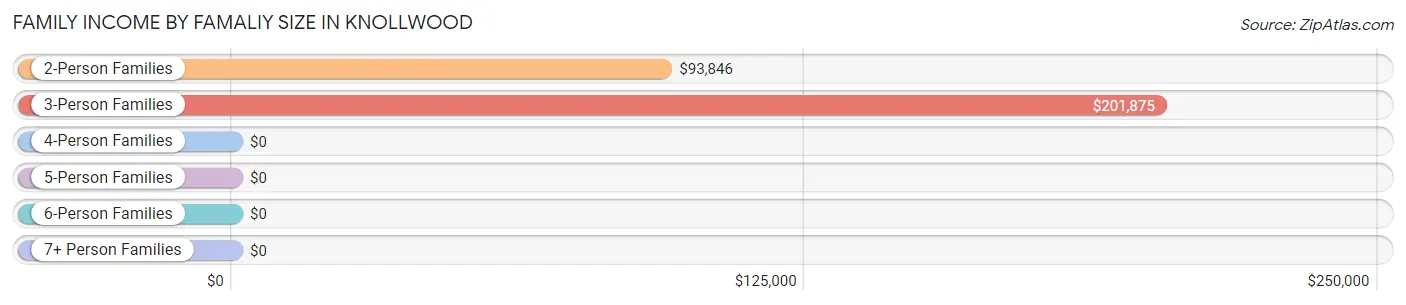
| Income Bracket | # Families | Median Income |
| 2-Person Families | 148 (33.3%) | $93,846 |
| 3-Person Families | 88 (19.8%) | $201,875 |
| 4-Person Families | 106 (23.8%) | $0 |
| 5-Person Families | 94 (21.1%) | $0 |
| 6-Person Families | 9 (2.0%) | $0 |
| 7+ Person Families | 0 (0.0%) | $0 |
| Total | 445 (100.0%) | $185,439 |
Family Income by Number of Earners in Knollwood
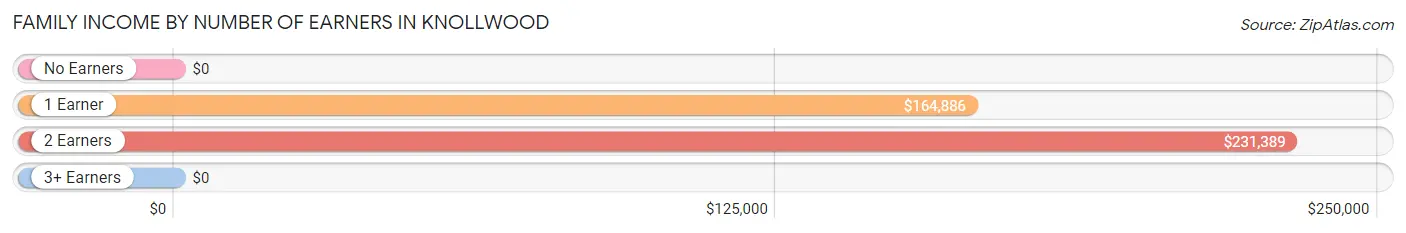
| Number of Earners | # Families | Median Income |
| No Earners | 85 (19.1%) | $0 |
| 1 Earner | 220 (49.4%) | $164,886 |
| 2 Earners | 126 (28.3%) | $231,389 |
| 3+ Earners | 14 (3.2%) | $0 |
| Total | 445 (100.0%) | $185,439 |
Household Income in Knollwood
Household Income Brackets in Knollwood
With 155 households falling in the category, the $200,000+ income range is the most frequent in Knollwood, accounting for 26.9% of all households.
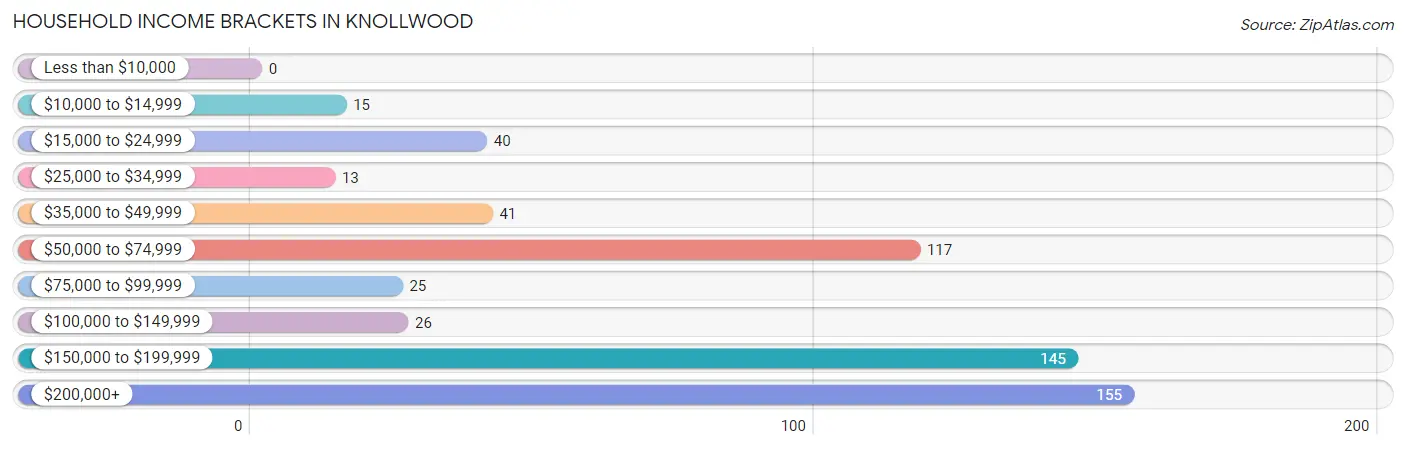
| Income Bracket | # Households | % Households |
| Less than $10,000 | 0 | 0.0% |
| $10,000 to $14,999 | 15 | 2.6% |
| $15,000 to $24,999 | 40 | 6.9% |
| $25,000 to $34,999 | 13 | 2.3% |
| $35,000 to $49,999 | 41 | 7.1% |
| $50,000 to $74,999 | 117 | 20.3% |
| $75,000 to $99,999 | 25 | 4.3% |
| $100,000 to $149,999 | 26 | 4.5% |
| $150,000 to $199,999 | 145 | 25.1% |
| $200,000+ | 155 | 26.9% |
Household Income by Householder Age in Knollwood
The median household income in Knollwood is $157,396, with the highest median household income of $185,944 found in the 45 to 64 years age bracket for the primary householder. A total of 251 households (43.5%) fall into this category.
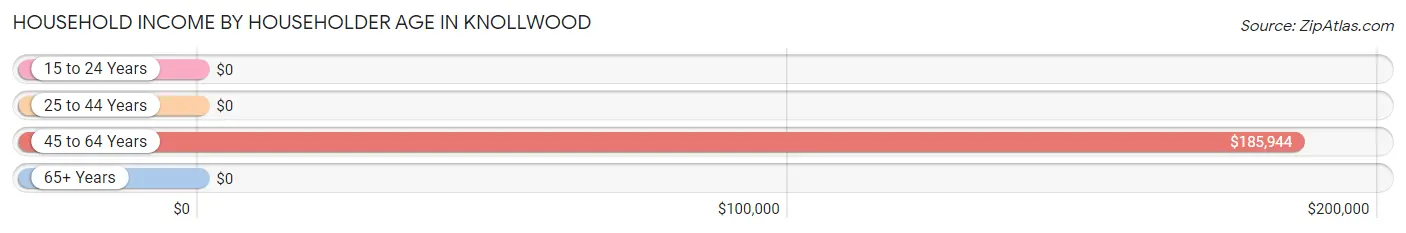
| Income Bracket | # Households | Median Income |
| 15 to 24 Years | 0 (0.0%) | $0 |
| 25 to 44 Years | 163 (28.2%) | $0 |
| 45 to 64 Years | 251 (43.5%) | $185,944 |
| 65+ Years | 163 (28.2%) | $0 |
| Total | 577 (100.0%) | $157,396 |
Poverty in Knollwood
Income Below Poverty by Sex and Age in Knollwood
With 7.9% poverty level for males and 6.1% for females among the residents of Knollwood, 12 to 14 year old males and 35 to 44 year old females are the most vulnerable to poverty, with 40 males (52.6%) and 28 females (32.9%) in their respective age groups living below the poverty level.
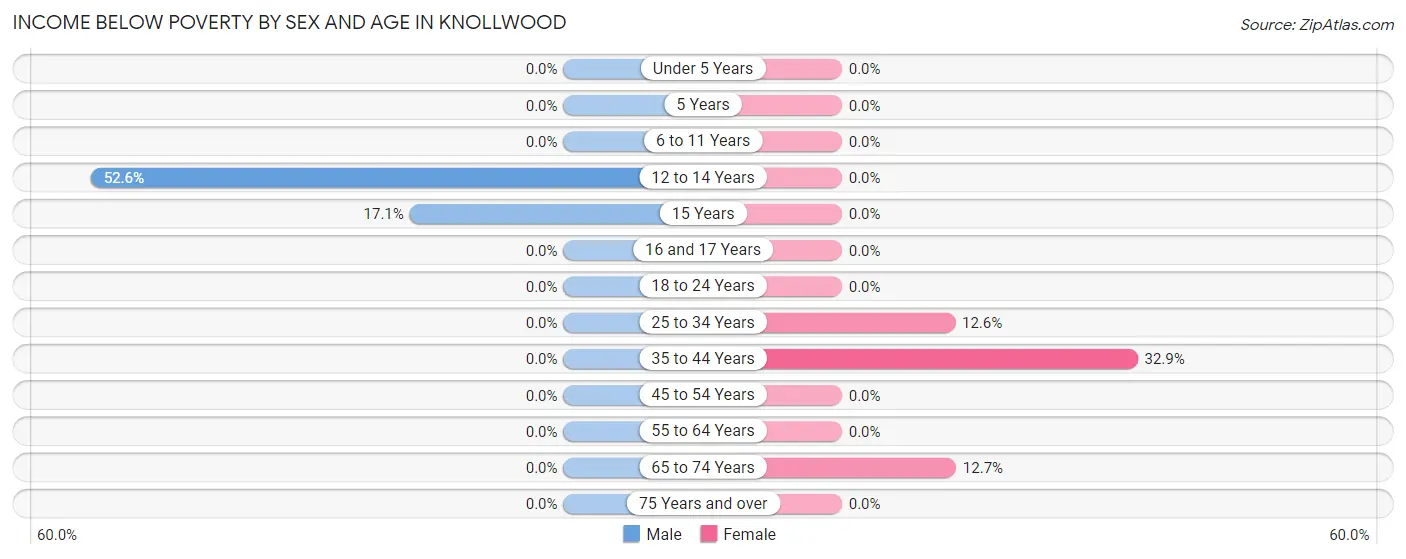
| Age Bracket | Male | Female |
| Under 5 Years | 0 (0.0%) | 0 (0.0%) |
| 5 Years | 0 (0.0%) | 0 (0.0%) |
| 6 to 11 Years | 0 (0.0%) | 0 (0.0%) |
| 12 to 14 Years | 40 (52.6%) | 0 (0.0%) |
| 15 Years | 19 (17.1%) | 0 (0.0%) |
| 16 and 17 Years | 0 (0.0%) | 0 (0.0%) |
| 18 to 24 Years | 0 (0.0%) | 0 (0.0%) |
| 25 to 34 Years | 0 (0.0%) | 14 (12.6%) |
| 35 to 44 Years | 0 (0.0%) | 28 (32.9%) |
| 45 to 54 Years | 0 (0.0%) | 0 (0.0%) |
| 55 to 64 Years | 0 (0.0%) | 0 (0.0%) |
| 65 to 74 Years | 0 (0.0%) | 15 (12.7%) |
| 75 Years and over | 0 (0.0%) | 0 (0.0%) |
| Total | 59 (7.9%) | 57 (6.1%) |
Income Above Poverty by Sex and Age in Knollwood
According to the poverty statistics in Knollwood, males aged under 5 years and females aged under 5 years are the age groups that are most secure financially, with 100.0% of males and 100.0% of females in these age groups living above the poverty line.
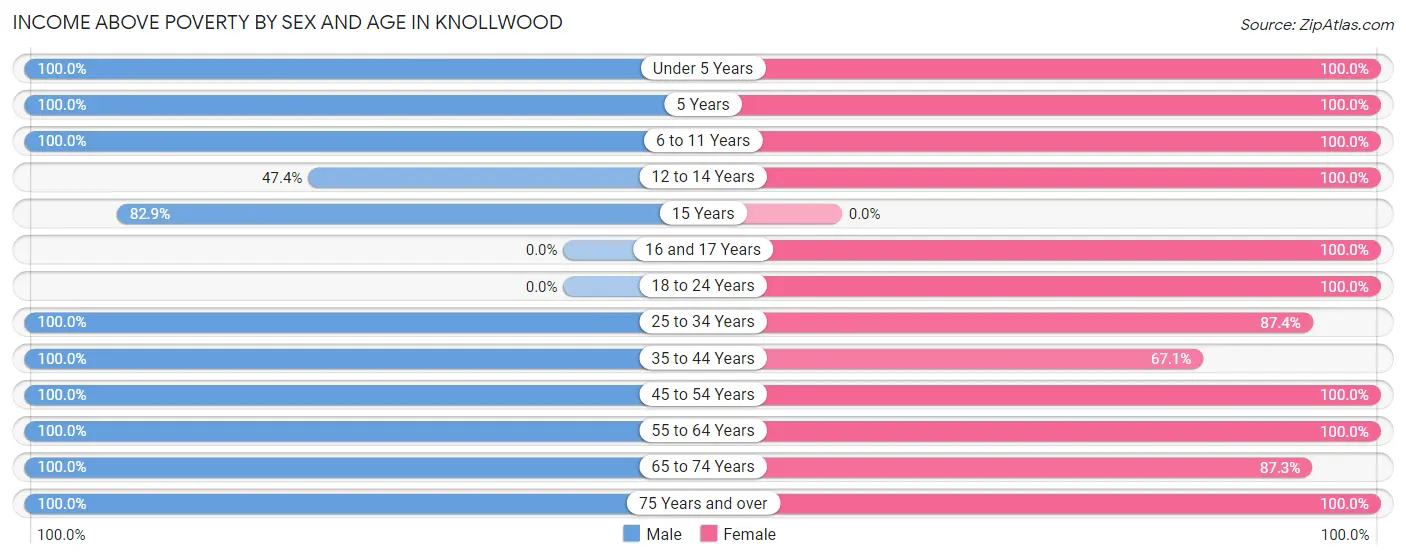
| Age Bracket | Male | Female |
| Under 5 Years | 74 (100.0%) | 20 (100.0%) |
| 5 Years | 7 (100.0%) | 23 (100.0%) |
| 6 to 11 Years | 80 (100.0%) | 50 (100.0%) |
| 12 to 14 Years | 36 (47.4%) | 98 (100.0%) |
| 15 Years | 92 (82.9%) | 0 (0.0%) |
| 16 and 17 Years | 0 (0.0%) | 67 (100.0%) |
| 18 to 24 Years | 0 (0.0%) | 37 (100.0%) |
| 25 to 34 Years | 36 (100.0%) | 97 (87.4%) |
| 35 to 44 Years | 68 (100.0%) | 57 (67.1%) |
| 45 to 54 Years | 123 (100.0%) | 211 (100.0%) |
| 55 to 64 Years | 65 (100.0%) | 48 (100.0%) |
| 65 to 74 Years | 82 (100.0%) | 103 (87.3%) |
| 75 Years and over | 23 (100.0%) | 60 (100.0%) |
| Total | 686 (92.1%) | 871 (93.9%) |
Income Below Poverty Among Married-Couple Families in Knollwood
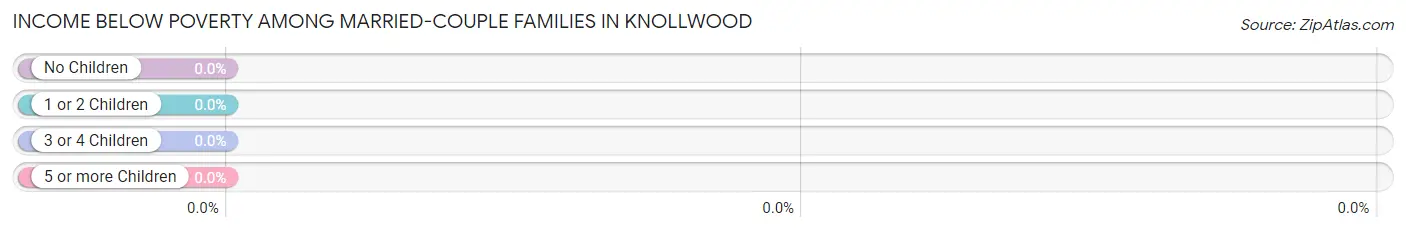
| Children | Above Poverty | Below Poverty |
| No Children | 130 (100.0%) | 0 (0.0%) |
| 1 or 2 Children | 116 (100.0%) | 0 (0.0%) |
| 3 or 4 Children | 103 (100.0%) | 0 (0.0%) |
| 5 or more Children | 0 (0.0%) | 0 (0.0%) |
| Total | 349 (100.0%) | 0 (0.0%) |
Income Below Poverty Among Single-Parent Households in Knollwood
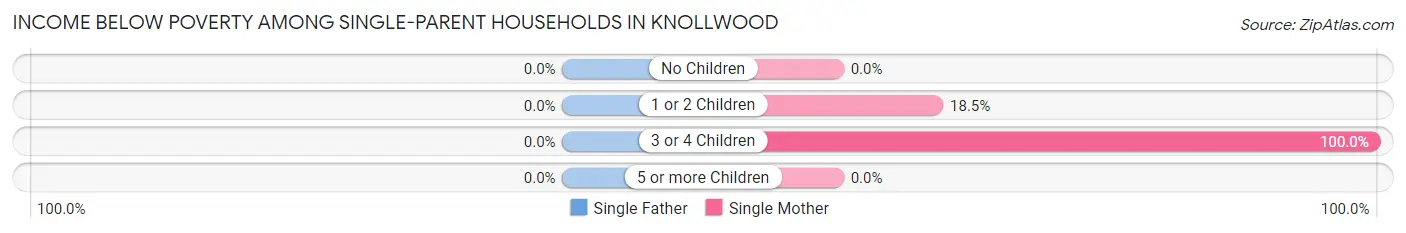
| Children | Single Father | Single Mother |
| No Children | 0 (0.0%) | 0 (0.0%) |
| 1 or 2 Children | 0 (0.0%) | 5 (18.5%) |
| 3 or 4 Children | 0 (0.0%) | 17 (100.0%) |
| 5 or more Children | 0 (0.0%) | 0 (0.0%) |
| Total | 0 (0.0%) | 22 (25.3%) |
Income Below Poverty Among Married-Couple vs Single-Parent Households in Knollwood
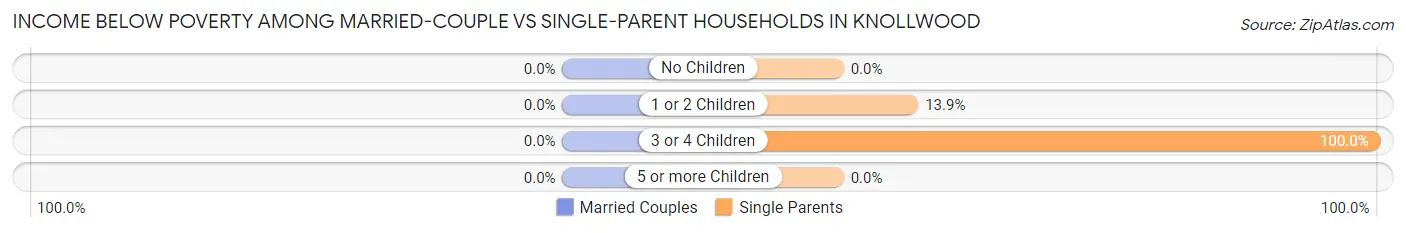
| Children | Married-Couple Families | Single-Parent Households |
| No Children | 0 (0.0%) | 0 (0.0%) |
| 1 or 2 Children | 0 (0.0%) | 5 (13.9%) |
| 3 or 4 Children | 0 (0.0%) | 17 (100.0%) |
| 5 or more Children | 0 (0.0%) | 0 (0.0%) |
| Total | 0 (0.0%) | 22 (22.9%) |
Race in Knollwood
The most populous races in Knollwood are White / Caucasian (1,505 | 85.4%), Hispanic or Latino (300 | 17.0%), and Two or more Races (130 | 7.4%).
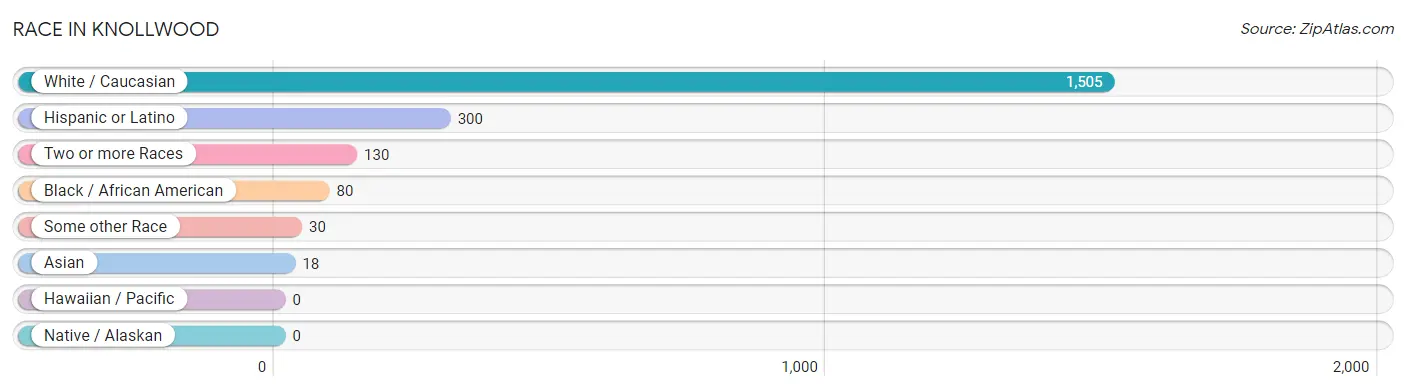
| Race | # Population | % Population |
| Asian | 18 | 1.0% |
| Black / African American | 80 | 4.5% |
| Hawaiian / Pacific | 0 | 0.0% |
| Hispanic or Latino | 300 | 17.0% |
| Native / Alaskan | 0 | 0.0% |
| White / Caucasian | 1,505 | 85.4% |
| Two or more Races | 130 | 7.4% |
| Some other Race | 30 | 1.7% |
| Total | 1,763 | 100.0% |
Ancestry in Knollwood
The most populous ancestries reported in Knollwood are Irish (337 | 19.1%), Mexican (243 | 13.8%), German (212 | 12.0%), English (109 | 6.2%), and Italian (90 | 5.1%), together accounting for 56.2% of all Knollwood residents.
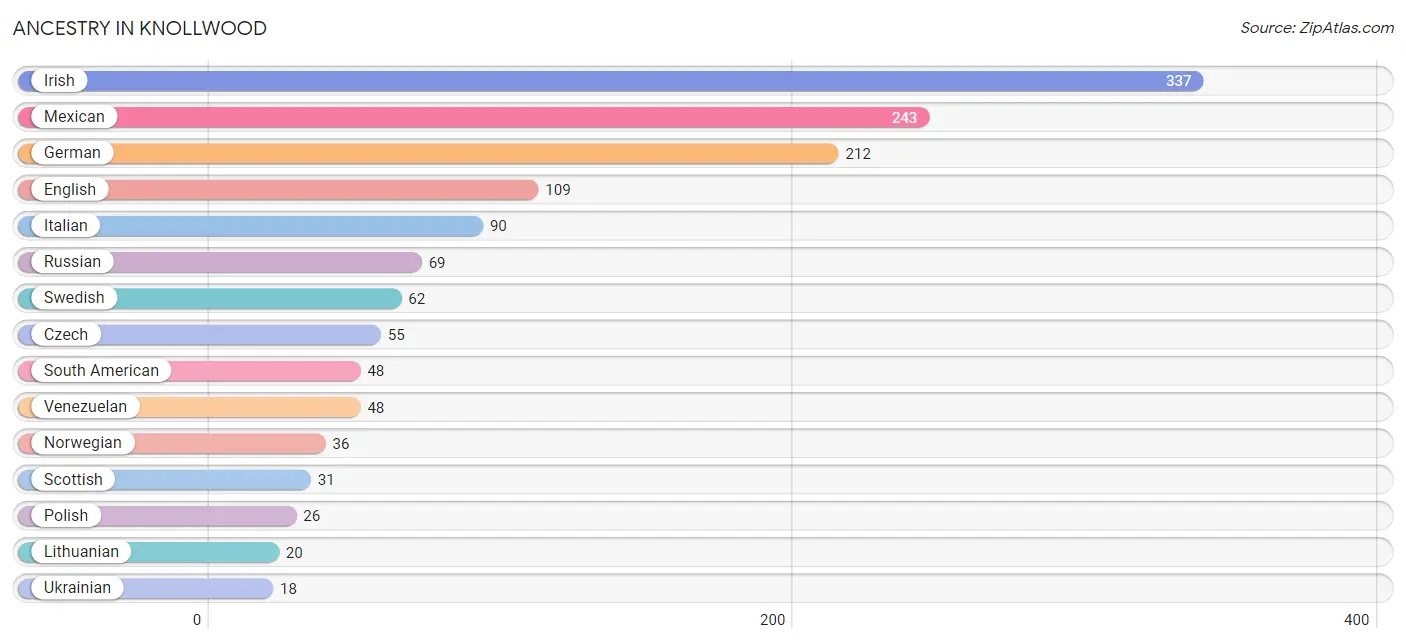
| Ancestry | # Population | % Population |
| American | 10 | 0.6% |
| Belgian | 15 | 0.9% |
| Cherokee | 8 | 0.4% |
| Czech | 55 | 3.1% |
| Dutch | 14 | 0.8% |
| English | 109 | 6.2% |
| European | 11 | 0.6% |
| French | 16 | 0.9% |
| German | 212 | 12.0% |
| Irish | 337 | 19.1% |
| Italian | 90 | 5.1% |
| Lithuanian | 20 | 1.1% |
| Mexican | 243 | 13.8% |
| Norwegian | 36 | 2.0% |
| Pakistani | 12 | 0.7% |
| Polish | 26 | 1.5% |
| Puerto Rican | 9 | 0.5% |
| Russian | 69 | 3.9% |
| Scotch-Irish | 6 | 0.3% |
| Scottish | 31 | 1.8% |
| South American | 48 | 2.7% |
| Sri Lankan | 6 | 0.3% |
| Swedish | 62 | 3.5% |
| Ukrainian | 18 | 1.0% |
| Venezuelan | 48 | 2.7% | View All 25 Rows |
Immigrants in Knollwood
The most numerous immigrant groups reported in Knollwood came from Europe (93 | 5.3%), Czechoslovakia (44 | 2.5%), Eastern Europe (44 | 2.5%), Latin America (36 | 2.0%), and Central America (20 | 1.1%), together accounting for 13.5% of all Knollwood residents.
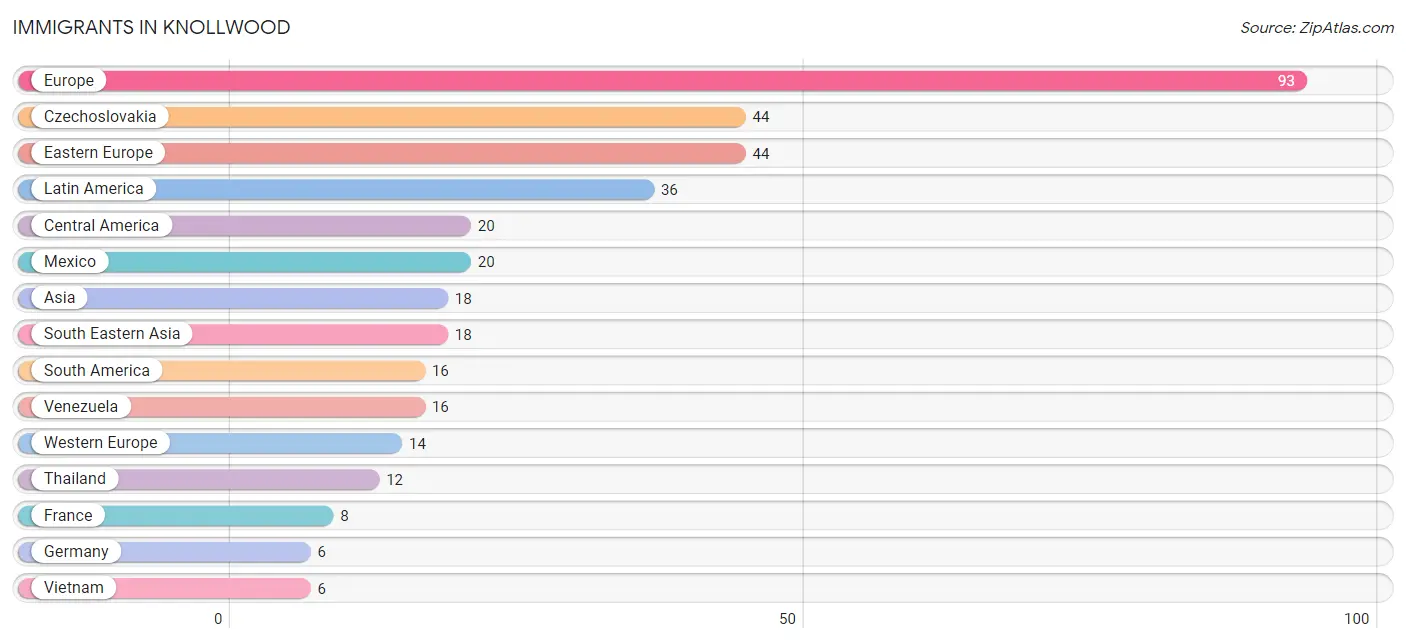
| Immigration Origin | # Population | % Population |
| Asia | 18 | 1.0% |
| Central America | 20 | 1.1% |
| Czechoslovakia | 44 | 2.5% |
| Eastern Europe | 44 | 2.5% |
| Europe | 93 | 5.3% |
| France | 8 | 0.4% |
| Germany | 6 | 0.3% |
| Latin America | 36 | 2.0% |
| Mexico | 20 | 1.1% |
| South America | 16 | 0.9% |
| South Eastern Asia | 18 | 1.0% |
| Thailand | 12 | 0.7% |
| Venezuela | 16 | 0.9% |
| Vietnam | 6 | 0.3% |
| Western Europe | 14 | 0.8% | View All 15 Rows |
Sex and Age in Knollwood
Sex and Age in Knollwood
The most populous age groups in Knollwood are 50 to 54 Years (121 | 15.7%) for men and 45 to 49 Years (107 | 10.8%) for women.
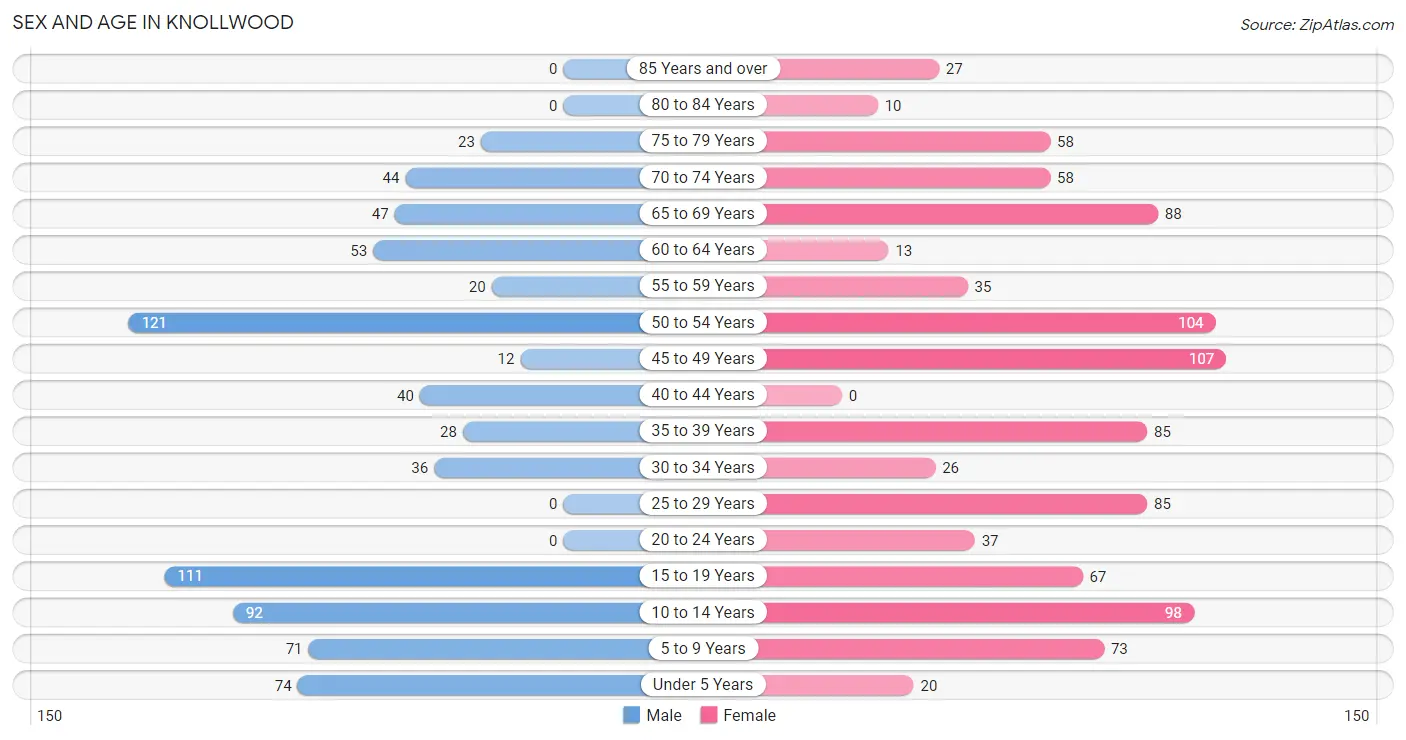
| Age Bracket | Male | Female |
| Under 5 Years | 74 (9.6%) | 20 (2.0%) |
| 5 to 9 Years | 71 (9.2%) | 73 (7.4%) |
| 10 to 14 Years | 92 (11.9%) | 98 (9.9%) |
| 15 to 19 Years | 111 (14.4%) | 67 (6.8%) |
| 20 to 24 Years | 0 (0.0%) | 37 (3.7%) |
| 25 to 29 Years | 0 (0.0%) | 85 (8.6%) |
| 30 to 34 Years | 36 (4.7%) | 26 (2.6%) |
| 35 to 39 Years | 28 (3.6%) | 85 (8.6%) |
| 40 to 44 Years | 40 (5.2%) | 0 (0.0%) |
| 45 to 49 Years | 12 (1.5%) | 107 (10.8%) |
| 50 to 54 Years | 121 (15.7%) | 104 (10.5%) |
| 55 to 59 Years | 20 (2.6%) | 35 (3.5%) |
| 60 to 64 Years | 53 (6.9%) | 13 (1.3%) |
| 65 to 69 Years | 47 (6.1%) | 88 (8.9%) |
| 70 to 74 Years | 44 (5.7%) | 58 (5.9%) |
| 75 to 79 Years | 23 (3.0%) | 58 (5.9%) |
| 80 to 84 Years | 0 (0.0%) | 10 (1.0%) |
| 85 Years and over | 0 (0.0%) | 27 (2.7%) |
| Total | 772 (100.0%) | 991 (100.0%) |
Families and Households in Knollwood
Median Family Size in Knollwood
The median family size in Knollwood is 3.38 persons per family, with married-couple families (349 | 78.4%) accounting for the largest median family size of 3.54 persons per family. On the other hand, single male/father families (9 | 2.0%) represent the smallest median family size with 2.00 persons per family.
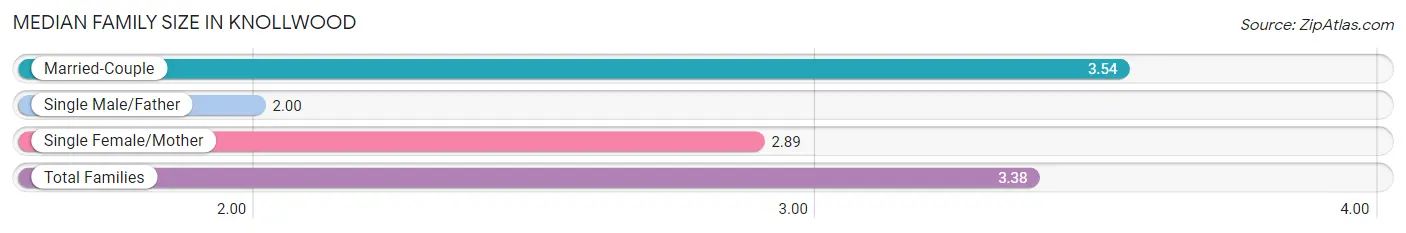
| Family Type | # Families | Family Size |
| Married-Couple | 349 (78.4%) | 3.54 |
| Single Male/Father | 9 (2.0%) | 2.00 |
| Single Female/Mother | 87 (19.6%) | 2.89 |
| Total Families | 445 (100.0%) | 3.38 |
Median Household Size in Knollwood
The median household size in Knollwood is 2.90 persons per household, with married-couple households (349 | 60.5%) accounting for the largest median household size of 3.54 persons per household. non-family households (132 | 22.9%) represent the smallest median household size with 1.27 persons per household.
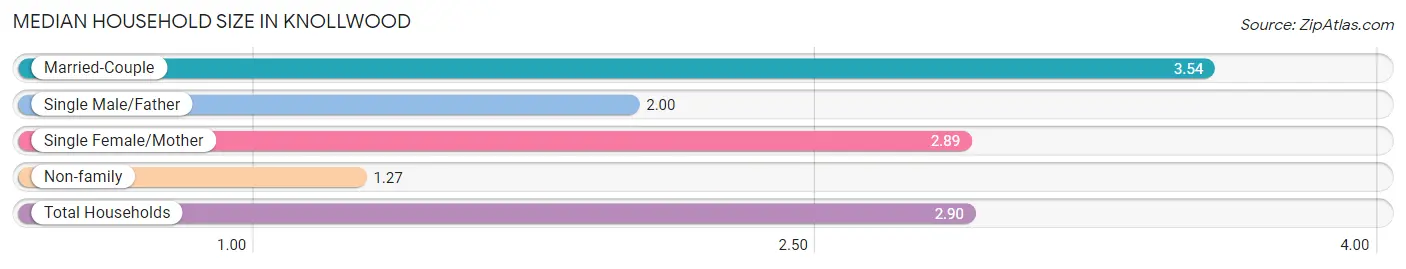
| Household Type | # Households | Household Size |
| Married-Couple | 349 (60.5%) | 3.54 |
| Single Male/Father | 9 (1.6%) | 2.00 |
| Single Female/Mother | 87 (15.1%) | 2.89 |
| Non-family | 132 (22.9%) | 1.27 |
| Total Households | 577 (100.0%) | 2.90 |
Household Size by Marriage Status in Knollwood
Out of a total of 577 households in Knollwood, 445 (77.1%) are family households, while 132 (22.9%) are nonfamily households. The most numerous type of family households are 2-person households, comprising 148, and the most common type of nonfamily households are 1-person households, comprising 101.
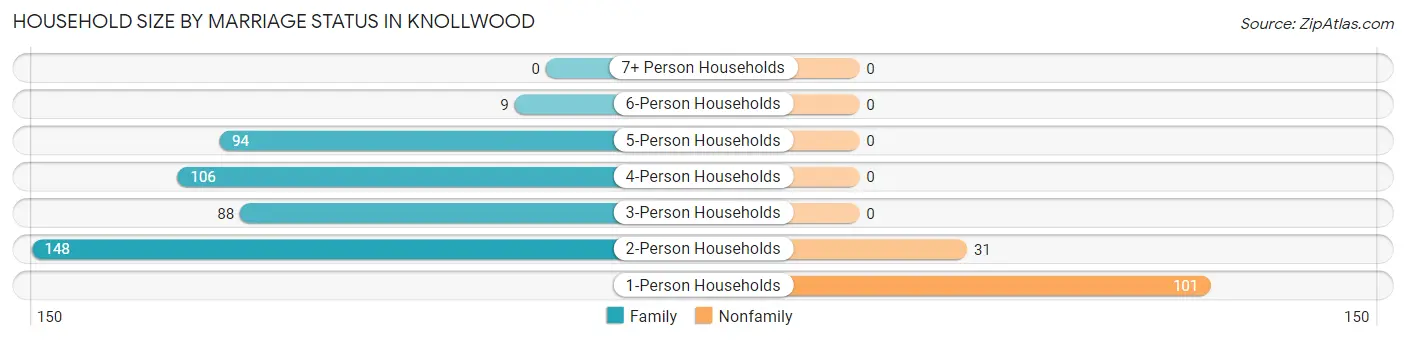
| Household Size | Family Households | Nonfamily Households |
| 1-Person Households | - | 101 (17.5%) |
| 2-Person Households | 148 (25.7%) | 31 (5.4%) |
| 3-Person Households | 88 (15.2%) | 0 (0.0%) |
| 4-Person Households | 106 (18.4%) | 0 (0.0%) |
| 5-Person Households | 94 (16.3%) | 0 (0.0%) |
| 6-Person Households | 9 (1.6%) | 0 (0.0%) |
| 7+ Person Households | 0 (0.0%) | 0 (0.0%) |
| Total | 445 (77.1%) | 132 (22.9%) |
Female Fertility in Knollwood
Fertility by Age in Knollwood
Average fertility rate in Knollwood is 25.0 births per 1,000 women. Women in the age bracket of 35 to 50 years have the highest fertility rate with 52.0 births per 1,000 women. Women in the age bracket of 35 to 50 years acount for 100.0% of all women with births.
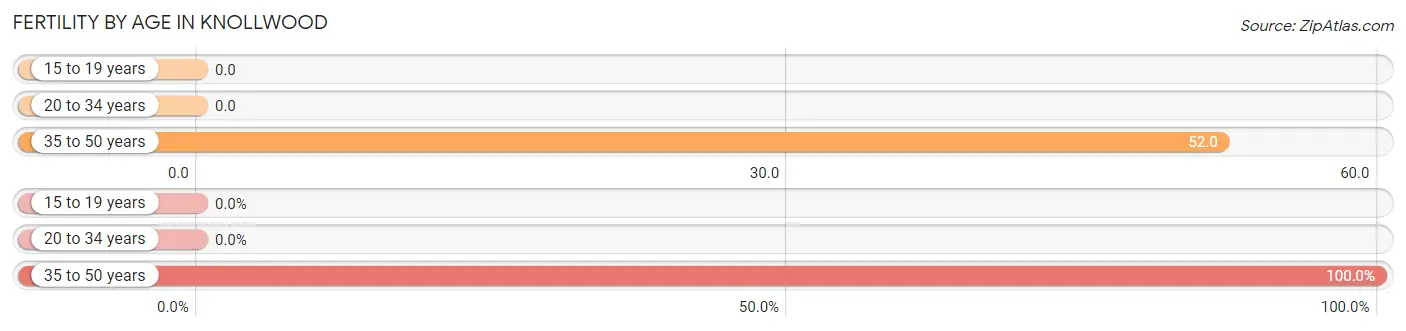
| Age Bracket | Women with Births | Births / 1,000 Women |
| 15 to 19 years | 0 (0.0%) | 0.0 |
| 20 to 34 years | 0 (0.0%) | 0.0 |
| 35 to 50 years | 10 (100.0%) | 52.0 |
| Total | 10 (100.0%) | 25.0 |
Fertility by Age by Marriage Status in Knollwood
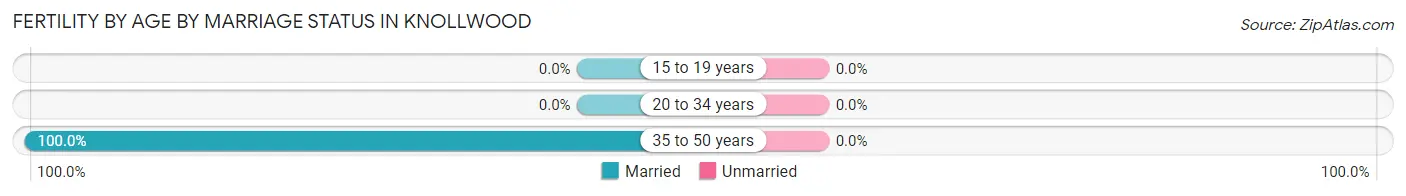
| Age Bracket | Married | Unmarried |
| 15 to 19 years | 0 (0.0%) | 0 (0.0%) |
| 20 to 34 years | 0 (0.0%) | 0 (0.0%) |
| 35 to 50 years | 10 (100.0%) | 0 (0.0%) |
| Total | 10 (100.0%) | 0 (0.0%) |
Fertility by Education in Knollwood
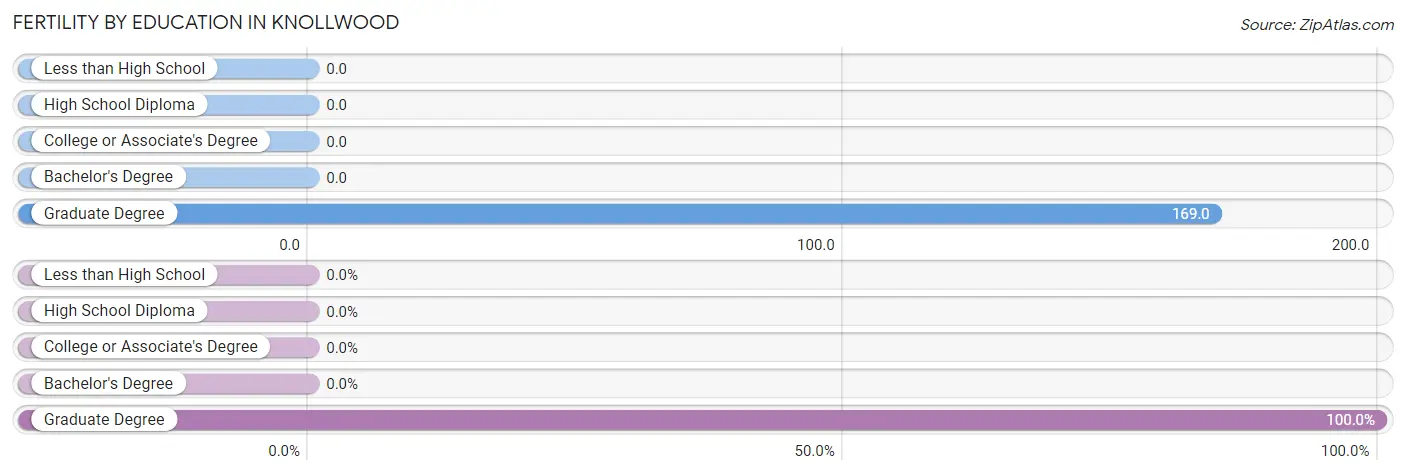
| Educational Attainment | Women with Births | Births / 1,000 Women |
| Less than High School | 0 (0.0%) | 0.0 |
| High School Diploma | 0 (0.0%) | 0.0 |
| College or Associate's Degree | 0 (0.0%) | 0.0 |
| Bachelor's Degree | 0 (0.0%) | 0.0 |
| Graduate Degree | 10 (100.0%) | 169.0 |
| Total | 10 (100.0%) | 25.0 |
Fertility by Education by Marriage Status in Knollwood
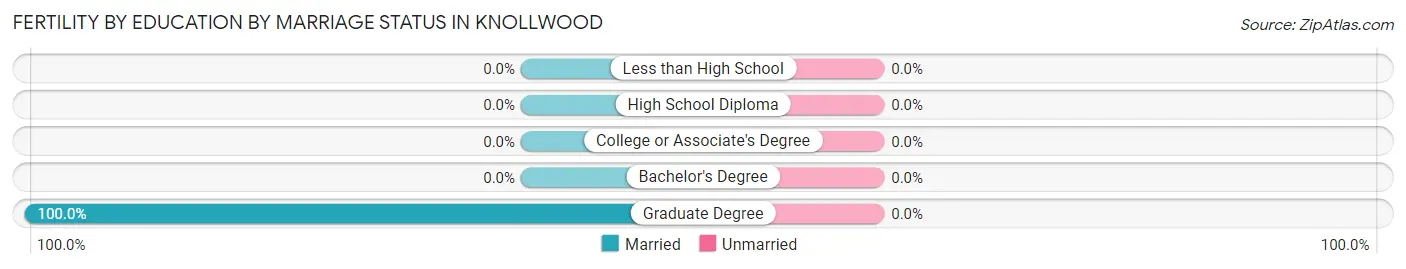
| Educational Attainment | Married | Unmarried |
| Less than High School | 0 (0.0%) | 0 (0.0%) |
| High School Diploma | 0 (0.0%) | 0 (0.0%) |
| College or Associate's Degree | 0 (0.0%) | 0 (0.0%) |
| Bachelor's Degree | 0 (0.0%) | 0 (0.0%) |
| Graduate Degree | 10 (100.0%) | 0 (0.0%) |
| Total | 10 (100.0%) | 0 (0.0%) |
Employment Characteristics in Knollwood
Employment by Class of Employer in Knollwood
Among the 619 employed individuals in Knollwood, private company employees (293 | 47.3%), federal government employees (122 | 19.7%), and local government employees (101 | 16.3%) make up the most common classes of employment.
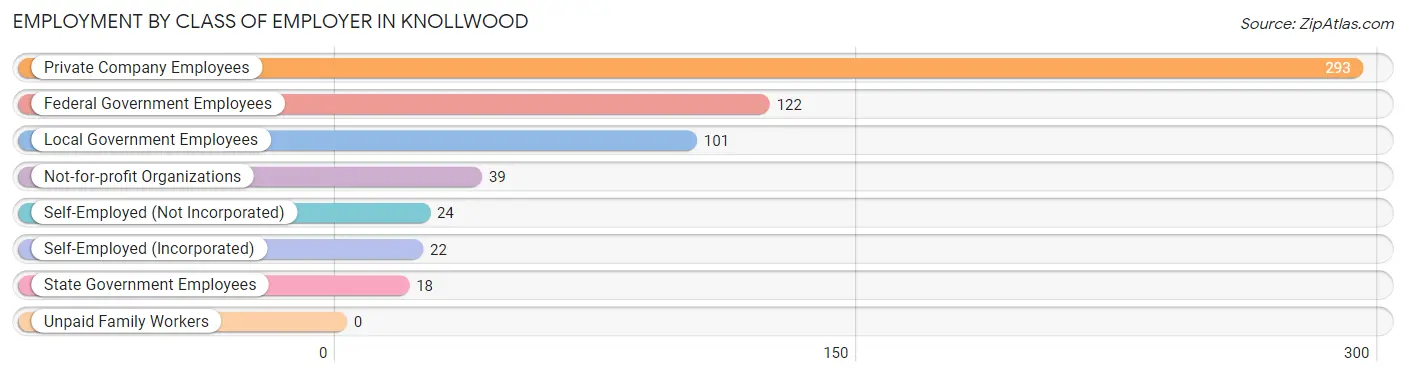
| Employer Class | # Employees | % Employees |
| Private Company Employees | 293 | 47.3% |
| Self-Employed (Incorporated) | 22 | 3.5% |
| Self-Employed (Not Incorporated) | 24 | 3.9% |
| Not-for-profit Organizations | 39 | 6.3% |
| Local Government Employees | 101 | 16.3% |
| State Government Employees | 18 | 2.9% |
| Federal Government Employees | 122 | 19.7% |
| Unpaid Family Workers | 0 | 0.0% |
| Total | 619 | 100.0% |
Employment Status by Age in Knollwood
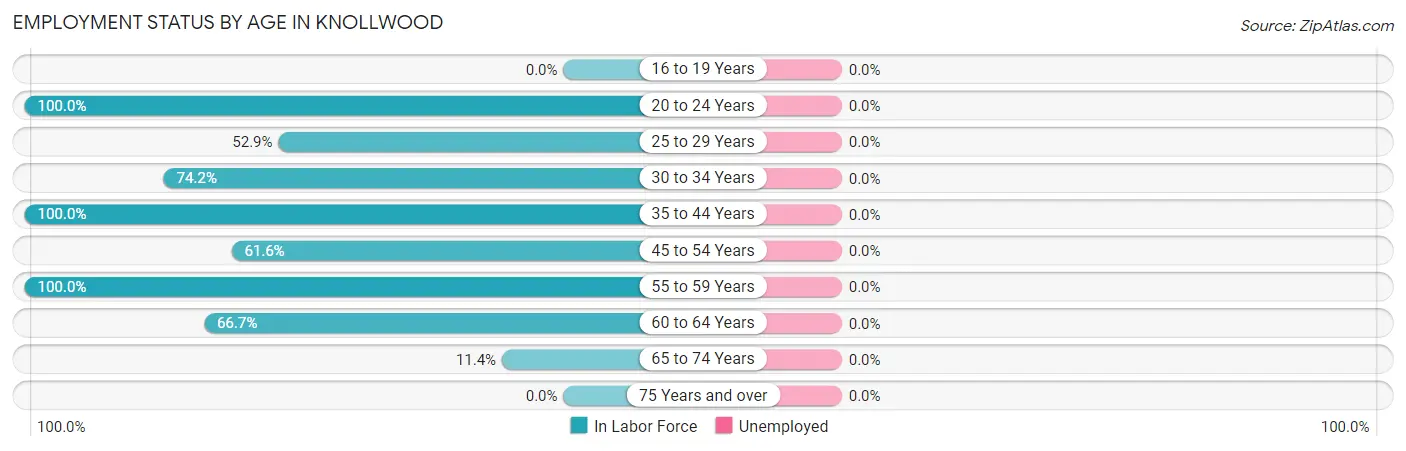
| Age Bracket | In Labor Force | Unemployed |
| 16 to 19 Years | 0 (0.0%) | 0 (0.0%) |
| 20 to 24 Years | 37 (100.0%) | 0 (0.0%) |
| 25 to 29 Years | 45 (52.9%) | 0 (0.0%) |
| 30 to 34 Years | 46 (74.2%) | 0 (0.0%) |
| 35 to 44 Years | 153 (100.0%) | 0 (0.0%) |
| 45 to 54 Years | 212 (61.6%) | 0 (0.0%) |
| 55 to 59 Years | 55 (100.0%) | 0 (0.0%) |
| 60 to 64 Years | 44 (66.7%) | 0 (0.0%) |
| 65 to 74 Years | 27 (11.4%) | 0 (0.0%) |
| 75 Years and over | 0 (0.0%) | 0 (0.0%) |
| Total | 619 (50.6%) | 0 (0.0%) |
Employment Status by Educational Attainment in Knollwood
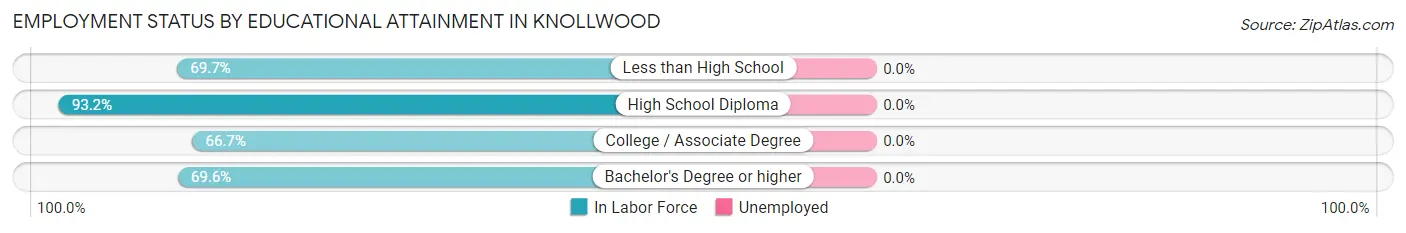
| Educational Attainment | In Labor Force | Unemployed |
| Less than High School | 23 (69.7%) | 0 (0.0%) |
| High School Diploma | 110 (93.2%) | 0 (0.0%) |
| College / Associate Degree | 120 (66.7%) | 0 (0.0%) |
| Bachelor's Degree or higher | 302 (69.6%) | 0 (0.0%) |
| Total | 555 (72.5%) | 0 (0.0%) |
Employment Occupations by Sex in Knollwood
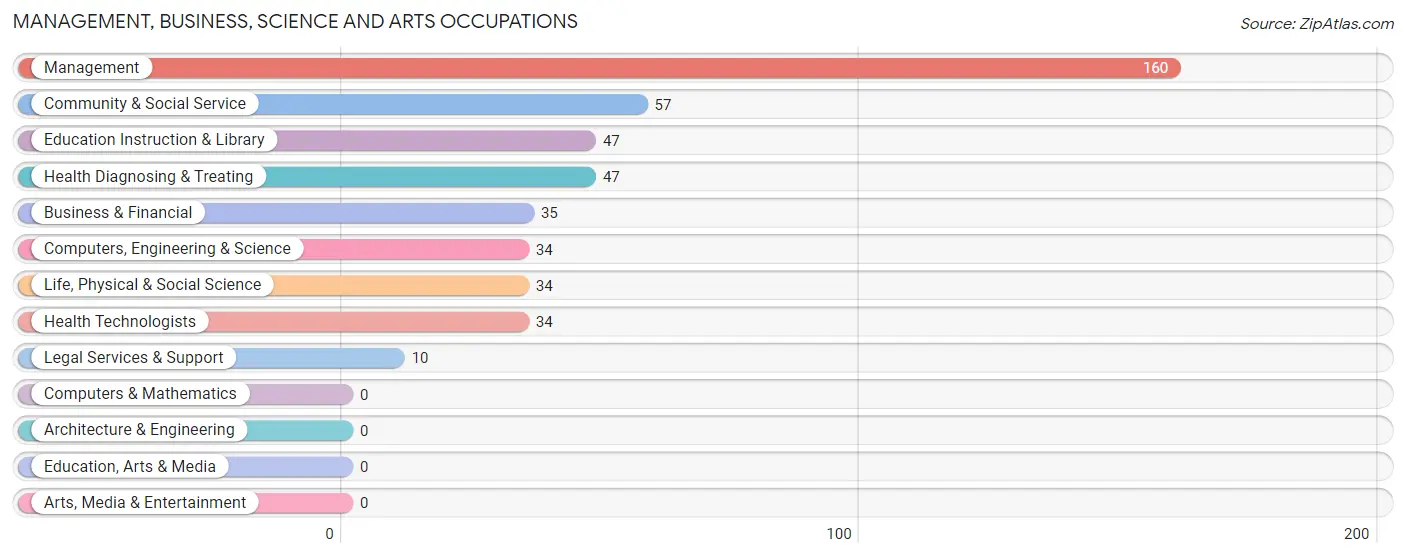
Management, Business, Science and Arts Occupations
The most common Management, Business, Science and Arts occupations in Knollwood are Management (160 | 30.8%), Community & Social Service (57 | 11.0%), Education Instruction & Library (47 | 9.1%), Health Diagnosing & Treating (47 | 9.1%), and Business & Financial (35 | 6.7%).
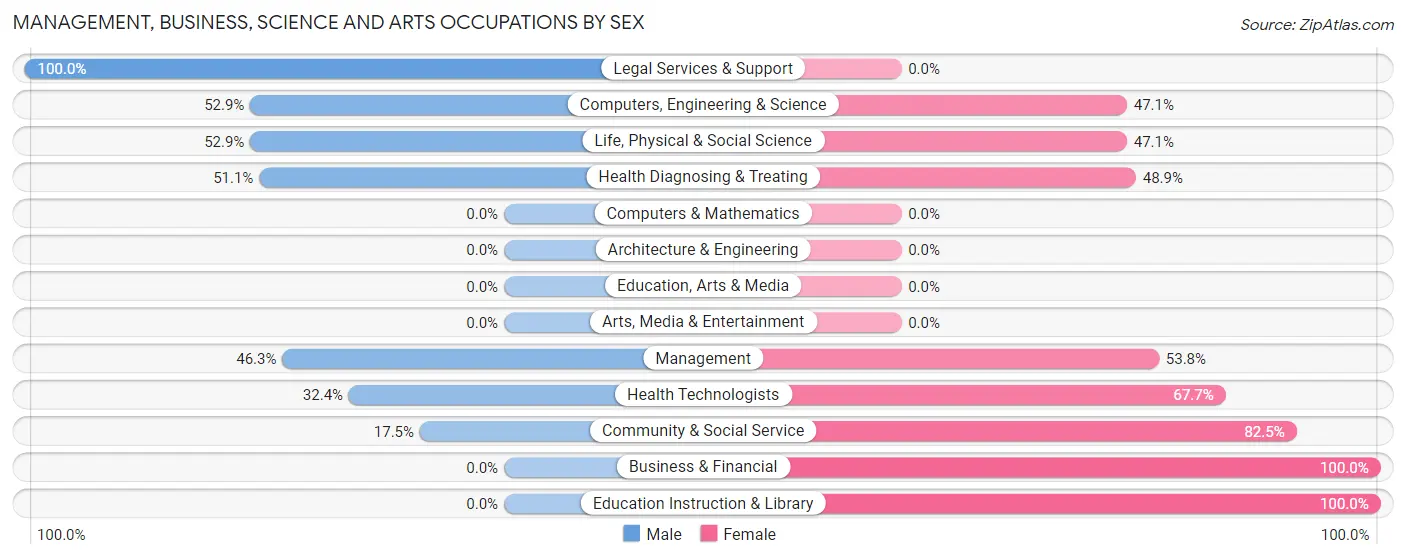
Management, Business, Science and Arts Occupations by Sex
Within the Management, Business, Science and Arts occupations in Knollwood, the most male-oriented occupations are Legal Services & Support (100.0%), Computers, Engineering & Science (52.9%), and Life, Physical & Social Science (52.9%), while the most female-oriented occupations are Business & Financial (100.0%), Education Instruction & Library (100.0%), and Community & Social Service (82.5%).
| Occupation | Male | Female |
| Management | 74 (46.3%) | 86 (53.7%) |
| Business & Financial | 0 (0.0%) | 35 (100.0%) |
| Computers, Engineering & Science | 18 (52.9%) | 16 (47.1%) |
| Computers & Mathematics | 0 (0.0%) | 0 (0.0%) |
| Architecture & Engineering | 0 (0.0%) | 0 (0.0%) |
| Life, Physical & Social Science | 18 (52.9%) | 16 (47.1%) |
| Community & Social Service | 10 (17.5%) | 47 (82.5%) |
| Education, Arts & Media | 0 (0.0%) | 0 (0.0%) |
| Legal Services & Support | 10 (100.0%) | 0 (0.0%) |
| Education Instruction & Library | 0 (0.0%) | 47 (100.0%) |
| Arts, Media & Entertainment | 0 (0.0%) | 0 (0.0%) |
| Health Diagnosing & Treating | 24 (51.1%) | 23 (48.9%) |
| Health Technologists | 11 (32.4%) | 23 (67.6%) |
| Total (Category) | 126 (37.8%) | 207 (62.2%) |
| Total (Overall) | 200 (38.5%) | 319 (61.5%) |
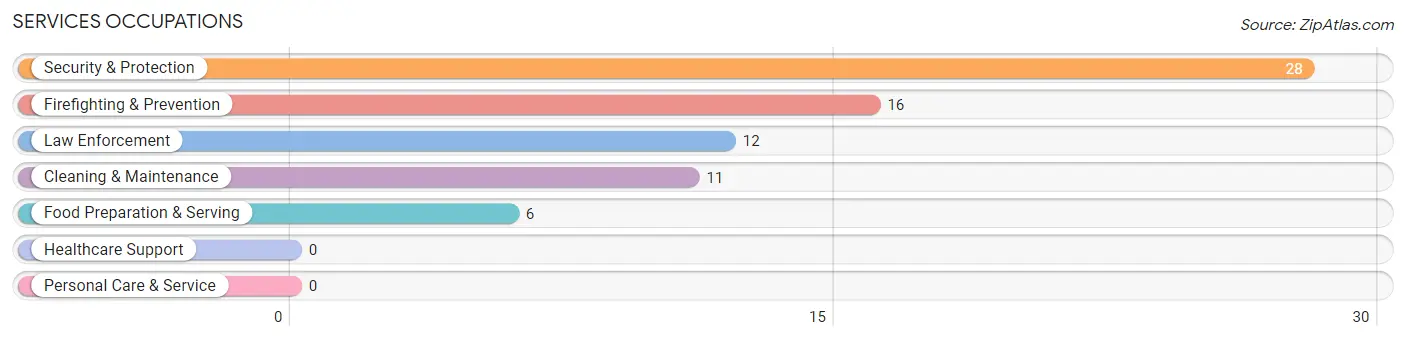
Services Occupations
The most common Services occupations in Knollwood are Security & Protection (28 | 5.4%), Firefighting & Prevention (16 | 3.1%), Law Enforcement (12 | 2.3%), Cleaning & Maintenance (11 | 2.1%), and Food Preparation & Serving (6 | 1.2%).
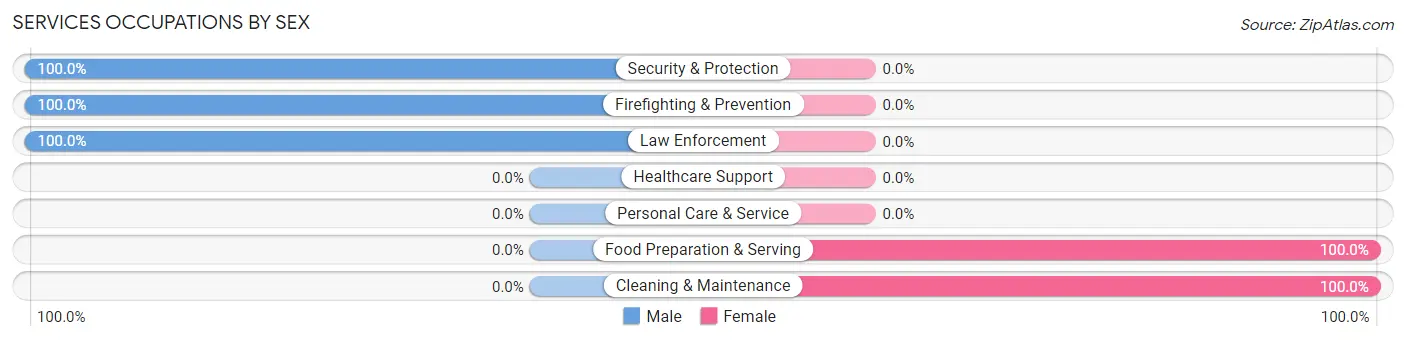
Services Occupations by Sex
Within the Services occupations in Knollwood, the most male-oriented occupations are Security & Protection (100.0%), Firefighting & Prevention (100.0%), and Law Enforcement (100.0%), while the most female-oriented occupations are Food Preparation & Serving (100.0%), and Cleaning & Maintenance (100.0%).
| Occupation | Male | Female |
| Healthcare Support | 0 (0.0%) | 0 (0.0%) |
| Security & Protection | 28 (100.0%) | 0 (0.0%) |
| Firefighting & Prevention | 16 (100.0%) | 0 (0.0%) |
| Law Enforcement | 12 (100.0%) | 0 (0.0%) |
| Food Preparation & Serving | 0 (0.0%) | 6 (100.0%) |
| Cleaning & Maintenance | 0 (0.0%) | 11 (100.0%) |
| Personal Care & Service | 0 (0.0%) | 0 (0.0%) |
| Total (Category) | 28 (62.2%) | 17 (37.8%) |
| Total (Overall) | 200 (38.5%) | 319 (61.5%) |
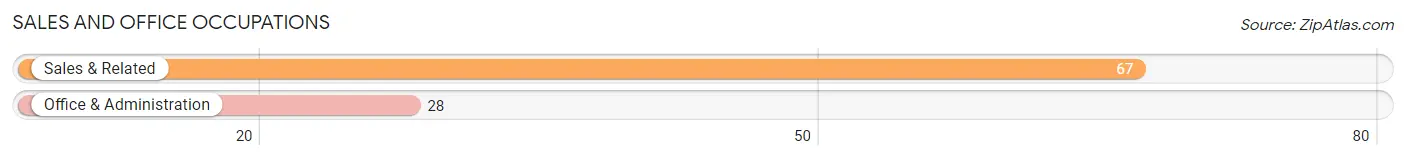
Sales and Office Occupations
The most common Sales and Office occupations in Knollwood are Sales & Related (67 | 12.9%), and Office & Administration (28 | 5.4%).
Sales and Office Occupations by Sex
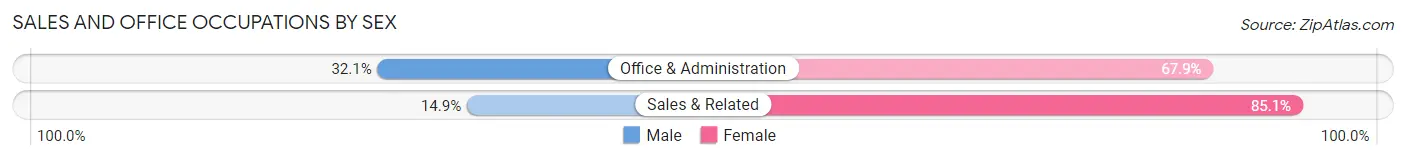
| Occupation | Male | Female |
| Sales & Related | 10 (14.9%) | 57 (85.1%) |
| Office & Administration | 9 (32.1%) | 19 (67.9%) |
| Total (Category) | 19 (20.0%) | 76 (80.0%) |
| Total (Overall) | 200 (38.5%) | 319 (61.5%) |
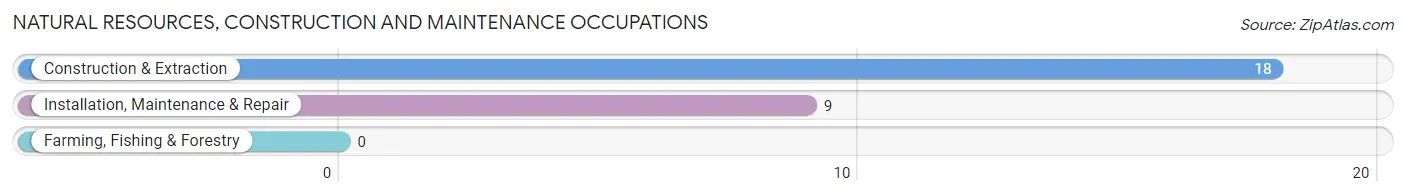
Natural Resources, Construction and Maintenance Occupations
The most common Natural Resources, Construction and Maintenance occupations in Knollwood are Construction & Extraction (18 | 3.5%), and Installation, Maintenance & Repair (9 | 1.7%).
Natural Resources, Construction and Maintenance Occupations by Sex
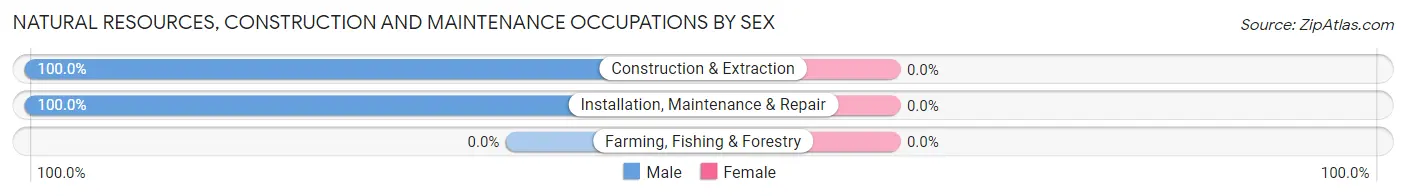
| Occupation | Male | Female |
| Farming, Fishing & Forestry | 0 (0.0%) | 0 (0.0%) |
| Construction & Extraction | 18 (100.0%) | 0 (0.0%) |
| Installation, Maintenance & Repair | 9 (100.0%) | 0 (0.0%) |
| Total (Category) | 27 (100.0%) | 0 (0.0%) |
| Total (Overall) | 200 (38.5%) | 319 (61.5%) |
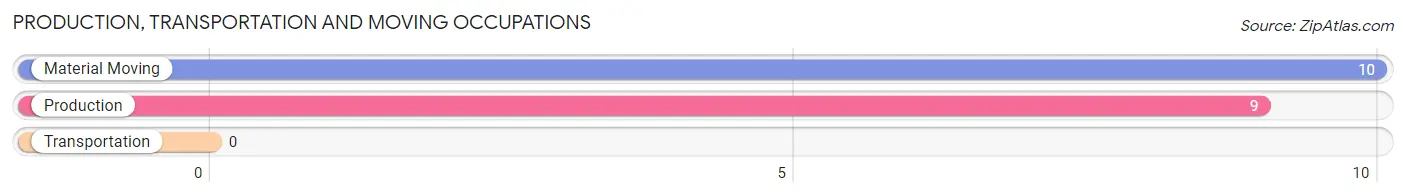
Production, Transportation and Moving Occupations
The most common Production, Transportation and Moving occupations in Knollwood are Material Moving (10 | 1.9%), and Production (9 | 1.7%).
Production, Transportation and Moving Occupations by Sex
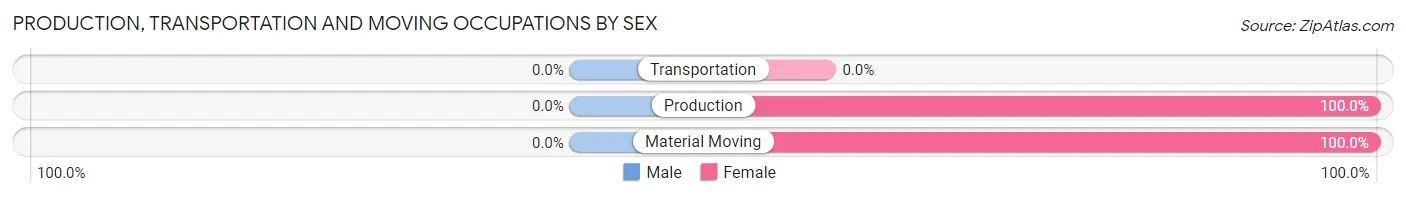
| Occupation | Male | Female |
| Production | 0 (0.0%) | 9 (100.0%) |
| Transportation | 0 (0.0%) | 0 (0.0%) |
| Material Moving | 0 (0.0%) | 10 (100.0%) |
| Total (Category) | 0 (0.0%) | 19 (100.0%) |
| Total (Overall) | 200 (38.5%) | 319 (61.5%) |
Employment Industries by Sex in Knollwood
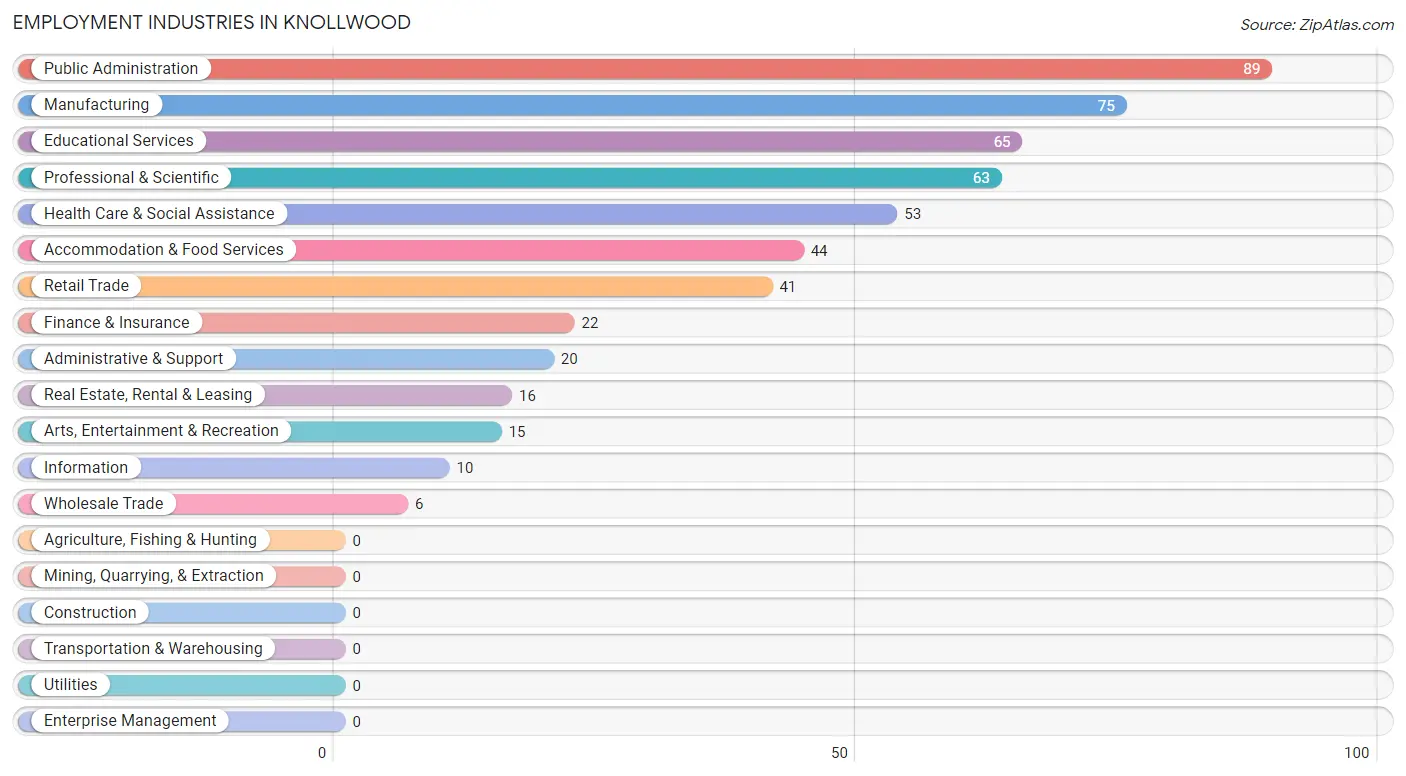
Employment Industries in Knollwood
The major employment industries in Knollwood include Public Administration (89 | 17.2%), Manufacturing (75 | 14.4%), Educational Services (65 | 12.5%), Professional & Scientific (63 | 12.1%), and Health Care & Social Assistance (53 | 10.2%).
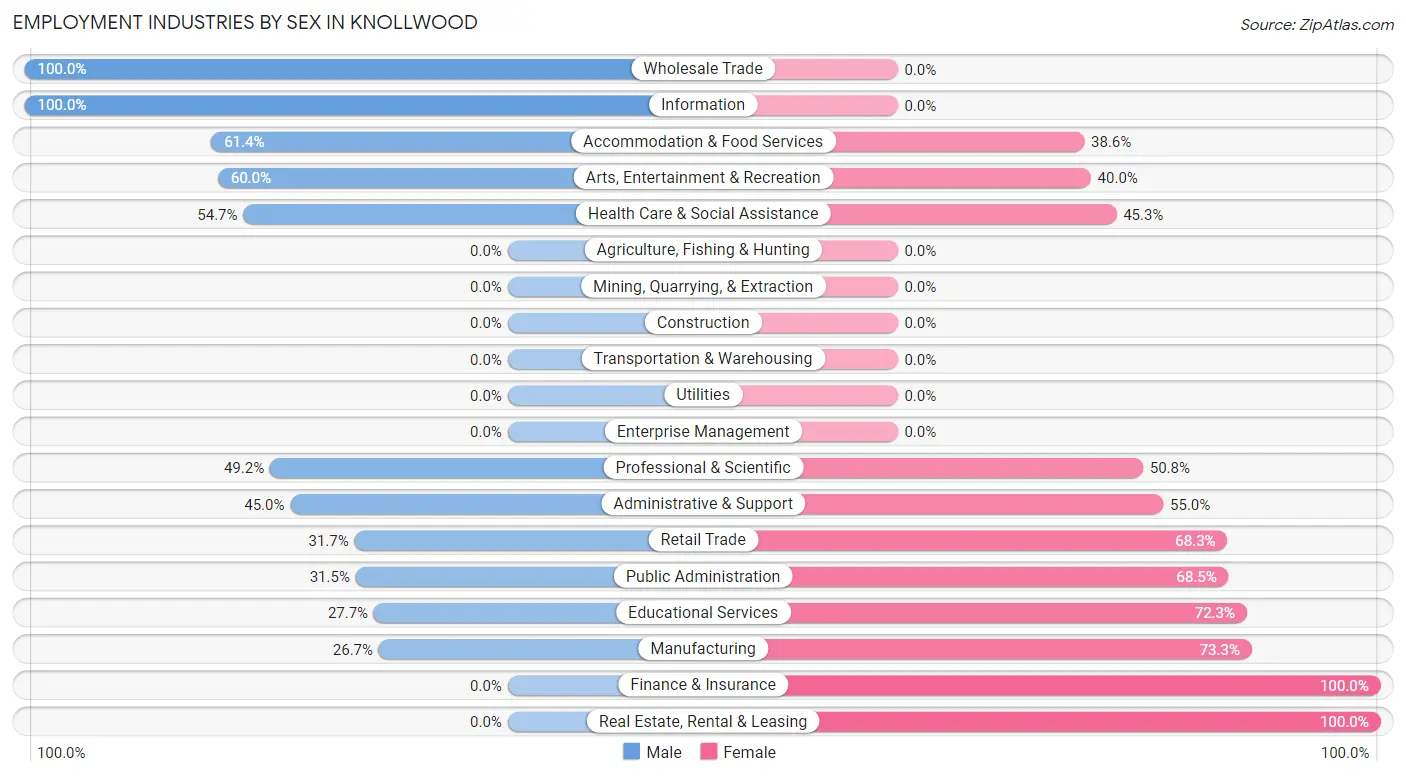
Employment Industries by Sex in Knollwood
The Knollwood industries that see more men than women are Wholesale Trade (100.0%), Information (100.0%), and Accommodation & Food Services (61.4%), whereas the industries that tend to have a higher number of women are Finance & Insurance (100.0%), Real Estate, Rental & Leasing (100.0%), and Manufacturing (73.3%).
| Industry | Male | Female |
| Agriculture, Fishing & Hunting | 0 (0.0%) | 0 (0.0%) |
| Mining, Quarrying, & Extraction | 0 (0.0%) | 0 (0.0%) |
| Construction | 0 (0.0%) | 0 (0.0%) |
| Manufacturing | 20 (26.7%) | 55 (73.3%) |
| Wholesale Trade | 6 (100.0%) | 0 (0.0%) |
| Retail Trade | 13 (31.7%) | 28 (68.3%) |
| Transportation & Warehousing | 0 (0.0%) | 0 (0.0%) |
| Utilities | 0 (0.0%) | 0 (0.0%) |
| Information | 10 (100.0%) | 0 (0.0%) |
| Finance & Insurance | 0 (0.0%) | 22 (100.0%) |
| Real Estate, Rental & Leasing | 0 (0.0%) | 16 (100.0%) |
| Professional & Scientific | 31 (49.2%) | 32 (50.8%) |
| Enterprise Management | 0 (0.0%) | 0 (0.0%) |
| Administrative & Support | 9 (45.0%) | 11 (55.0%) |
| Educational Services | 18 (27.7%) | 47 (72.3%) |
| Health Care & Social Assistance | 29 (54.7%) | 24 (45.3%) |
| Arts, Entertainment & Recreation | 9 (60.0%) | 6 (40.0%) |
| Accommodation & Food Services | 27 (61.4%) | 17 (38.6%) |
| Public Administration | 28 (31.5%) | 61 (68.5%) |
| Total | 200 (38.5%) | 319 (61.5%) |
Education in Knollwood
School Enrollment in Knollwood
The most common levels of schooling among the 535 students in Knollwood are high school (196 | 36.6%), middle school (156 | 29.2%), and elementary school (77 | 14.4%).
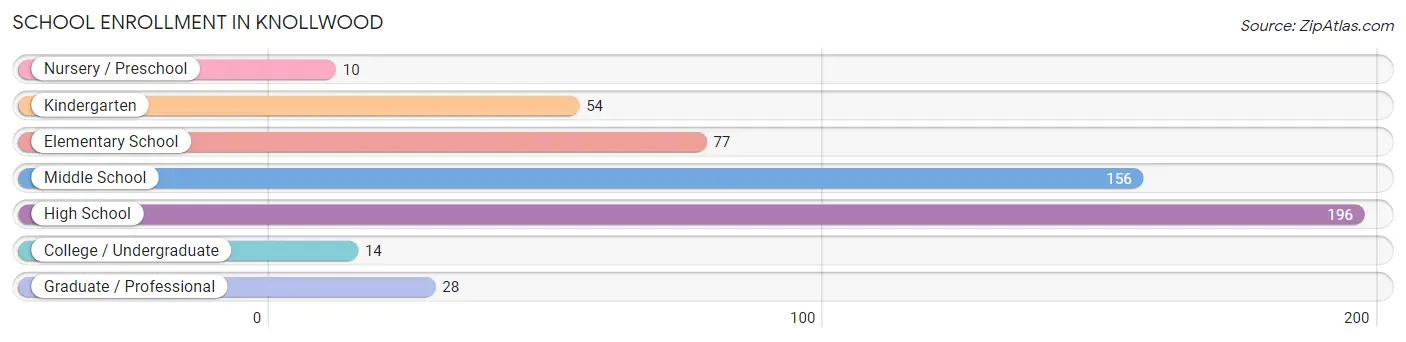
| School Level | # Students | % Students |
| Nursery / Preschool | 10 | 1.9% |
| Kindergarten | 54 | 10.1% |
| Elementary School | 77 | 14.4% |
| Middle School | 156 | 29.2% |
| High School | 196 | 36.6% |
| College / Undergraduate | 14 | 2.6% |
| Graduate / Professional | 28 | 5.2% |
| Total | 535 | 100.0% |
School Enrollment by Age by Funding Source in Knollwood
Out of a total of 535 students who are enrolled in schools in Knollwood, 88 (16.4%) attend a private institution, while the remaining 447 (83.6%) are enrolled in public schools. The age group of 35 years and over has the highest likelihood of being enrolled in private schools, with 28 (100.0% in the age bracket) enrolled. Conversely, the age group of 3 to 4 year olds has the lowest likelihood of being enrolled in a private school, with 10 (100.0% in the age bracket) attending a public institution.
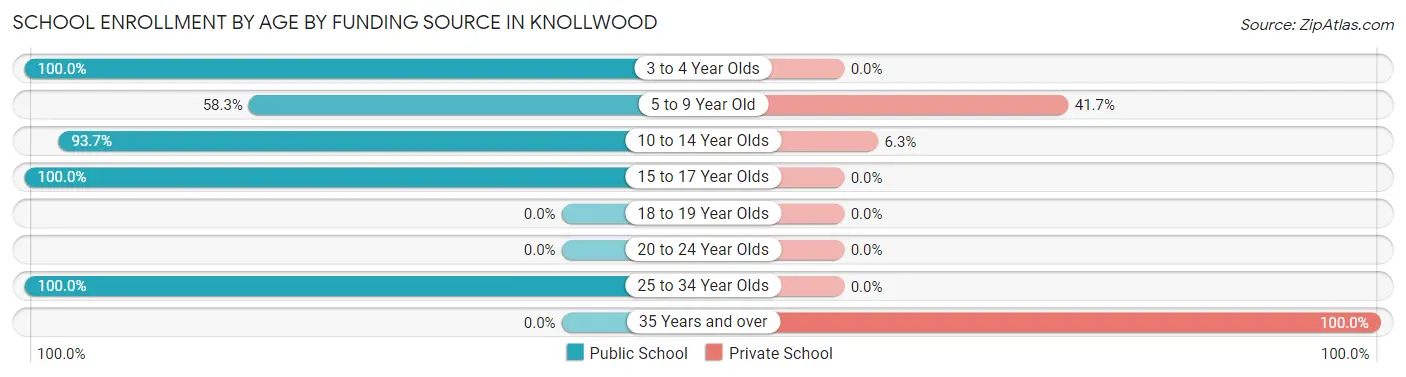
| Age Bracket | Public School | Private School |
| 3 to 4 Year Olds | 10 (100.0%) | 0 (0.0%) |
| 5 to 9 Year Old | 67 (58.3%) | 48 (41.7%) |
| 10 to 14 Year Olds | 178 (93.7%) | 12 (6.3%) |
| 15 to 17 Year Olds | 178 (100.0%) | 0 (0.0%) |
| 18 to 19 Year Olds | 0 (0.0%) | 0 (0.0%) |
| 20 to 24 Year Olds | 0 (0.0%) | 0 (0.0%) |
| 25 to 34 Year Olds | 14 (100.0%) | 0 (0.0%) |
| 35 Years and over | 0 (0.0%) | 28 (100.0%) |
| Total | 447 (83.6%) | 88 (16.4%) |
Educational Attainment by Field of Study in Knollwood
Education (129 | 20.6%), business (122 | 19.5%), science & technology (71 | 11.4%), psychology (55 | 8.8%), and communications (35 | 5.6%) are the most common fields of study among 625 individuals in Knollwood who have obtained a bachelor's degree or higher.
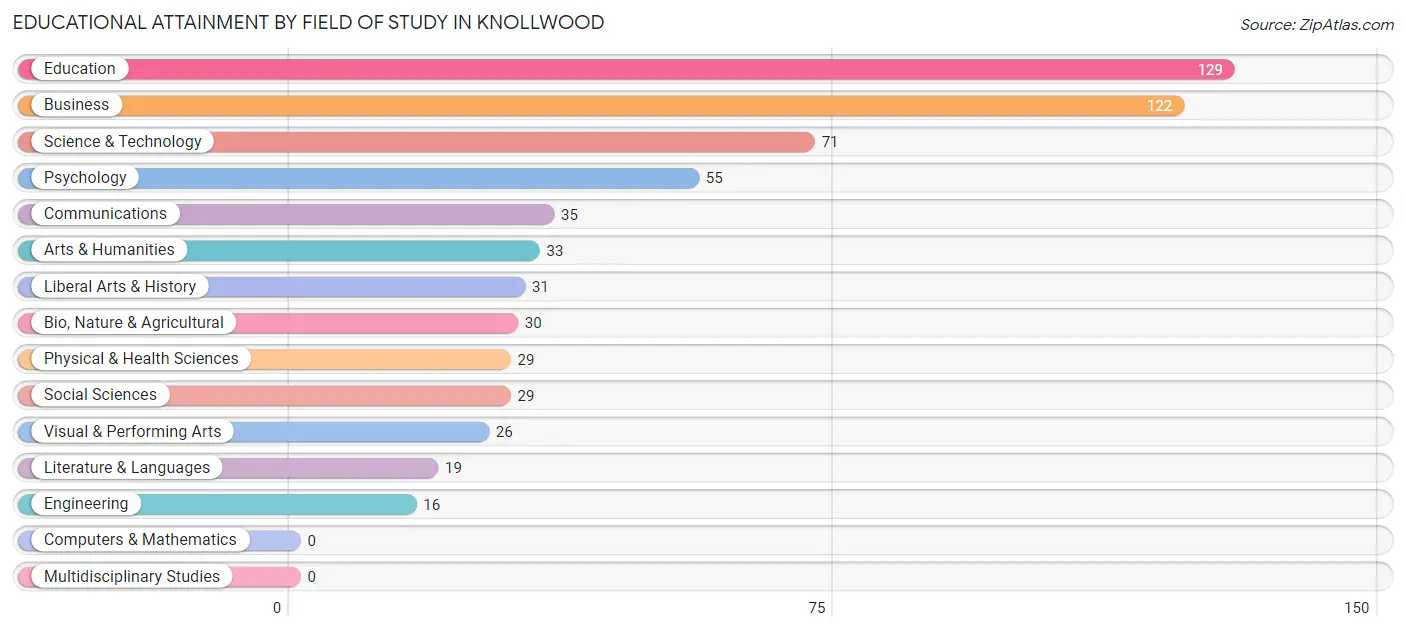
| Field of Study | # Graduates | % Graduates |
| Computers & Mathematics | 0 | 0.0% |
| Bio, Nature & Agricultural | 30 | 4.8% |
| Physical & Health Sciences | 29 | 4.6% |
| Psychology | 55 | 8.8% |
| Social Sciences | 29 | 4.6% |
| Engineering | 16 | 2.6% |
| Multidisciplinary Studies | 0 | 0.0% |
| Science & Technology | 71 | 11.4% |
| Business | 122 | 19.5% |
| Education | 129 | 20.6% |
| Literature & Languages | 19 | 3.0% |
| Liberal Arts & History | 31 | 5.0% |
| Visual & Performing Arts | 26 | 4.2% |
| Communications | 35 | 5.6% |
| Arts & Humanities | 33 | 5.3% |
| Total | 625 | 100.0% |
Transportation & Commute in Knollwood
Vehicle Availability by Sex in Knollwood
The most prevalent vehicle ownership categories in Knollwood are males with 2 vehicles (150, accounting for 52.8%) and females with 2 vehicles (143, making up 44.8%).
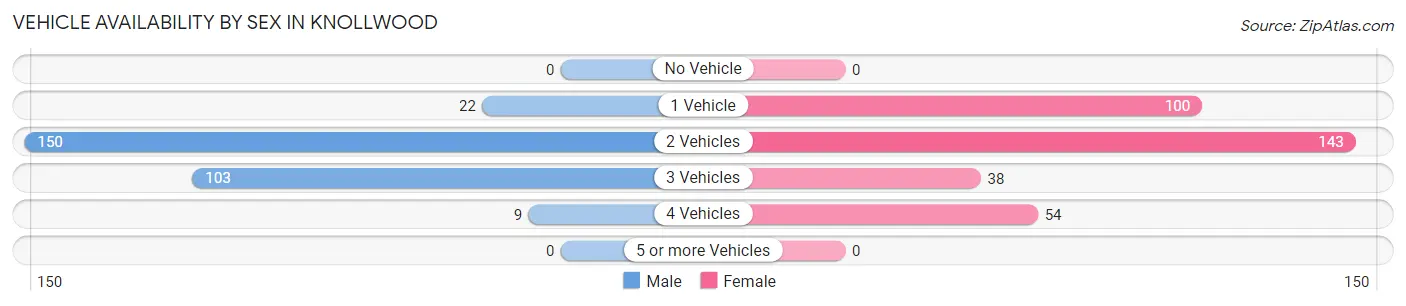
| Vehicles Available | Male | Female |
| No Vehicle | 0 (0.0%) | 0 (0.0%) |
| 1 Vehicle | 22 (7.7%) | 100 (29.8%) |
| 2 Vehicles | 150 (52.8%) | 143 (42.7%) |
| 3 Vehicles | 103 (36.3%) | 38 (11.3%) |
| 4 Vehicles | 9 (3.2%) | 54 (16.1%) |
| 5 or more Vehicles | 0 (0.0%) | 0 (0.0%) |
| Total | 284 (100.0%) | 335 (100.0%) |
Commute Time in Knollwood
The most frequently occuring commute durations in Knollwood are 10 to 14 minutes (161 commuters, 34.1%), 45 to 59 minutes (72 commuters, 15.2%), and 20 to 24 minutes (57 commuters, 12.1%).
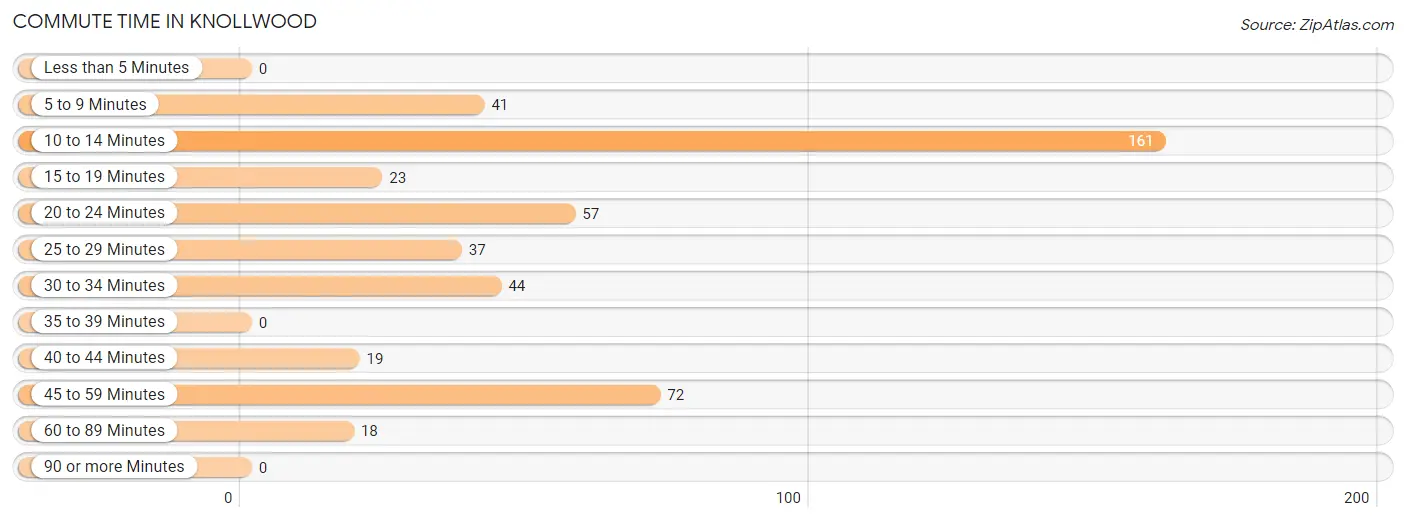
| Commute Time | # Commuters | % Commuters |
| Less than 5 Minutes | 0 | 0.0% |
| 5 to 9 Minutes | 41 | 8.7% |
| 10 to 14 Minutes | 161 | 34.1% |
| 15 to 19 Minutes | 23 | 4.9% |
| 20 to 24 Minutes | 57 | 12.1% |
| 25 to 29 Minutes | 37 | 7.8% |
| 30 to 34 Minutes | 44 | 9.3% |
| 35 to 39 Minutes | 0 | 0.0% |
| 40 to 44 Minutes | 19 | 4.0% |
| 45 to 59 Minutes | 72 | 15.2% |
| 60 to 89 Minutes | 18 | 3.8% |
| 90 or more Minutes | 0 | 0.0% |
Commute Time by Sex in Knollwood
The most common commute times in Knollwood are 10 to 14 minutes (84 commuters, 42.0%) for males and 10 to 14 minutes (77 commuters, 28.3%) for females.
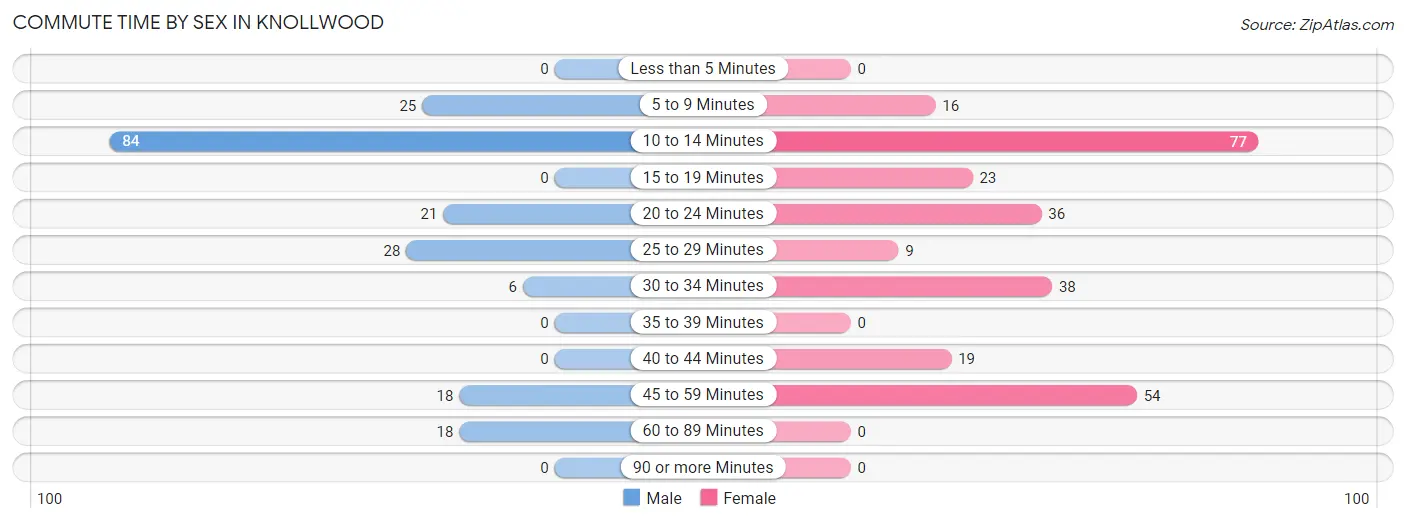
| Commute Time | Male | Female |
| Less than 5 Minutes | 0 (0.0%) | 0 (0.0%) |
| 5 to 9 Minutes | 25 (12.5%) | 16 (5.9%) |
| 10 to 14 Minutes | 84 (42.0%) | 77 (28.3%) |
| 15 to 19 Minutes | 0 (0.0%) | 23 (8.5%) |
| 20 to 24 Minutes | 21 (10.5%) | 36 (13.2%) |
| 25 to 29 Minutes | 28 (14.0%) | 9 (3.3%) |
| 30 to 34 Minutes | 6 (3.0%) | 38 (14.0%) |
| 35 to 39 Minutes | 0 (0.0%) | 0 (0.0%) |
| 40 to 44 Minutes | 0 (0.0%) | 19 (7.0%) |
| 45 to 59 Minutes | 18 (9.0%) | 54 (19.9%) |
| 60 to 89 Minutes | 18 (9.0%) | 0 (0.0%) |
| 90 or more Minutes | 0 (0.0%) | 0 (0.0%) |
Time of Departure to Work by Sex in Knollwood
The most frequent times of departure to work in Knollwood are 7:30 AM to 7:59 AM (50, 25.0%) for males and 7:30 AM to 7:59 AM (58, 21.3%) for females.
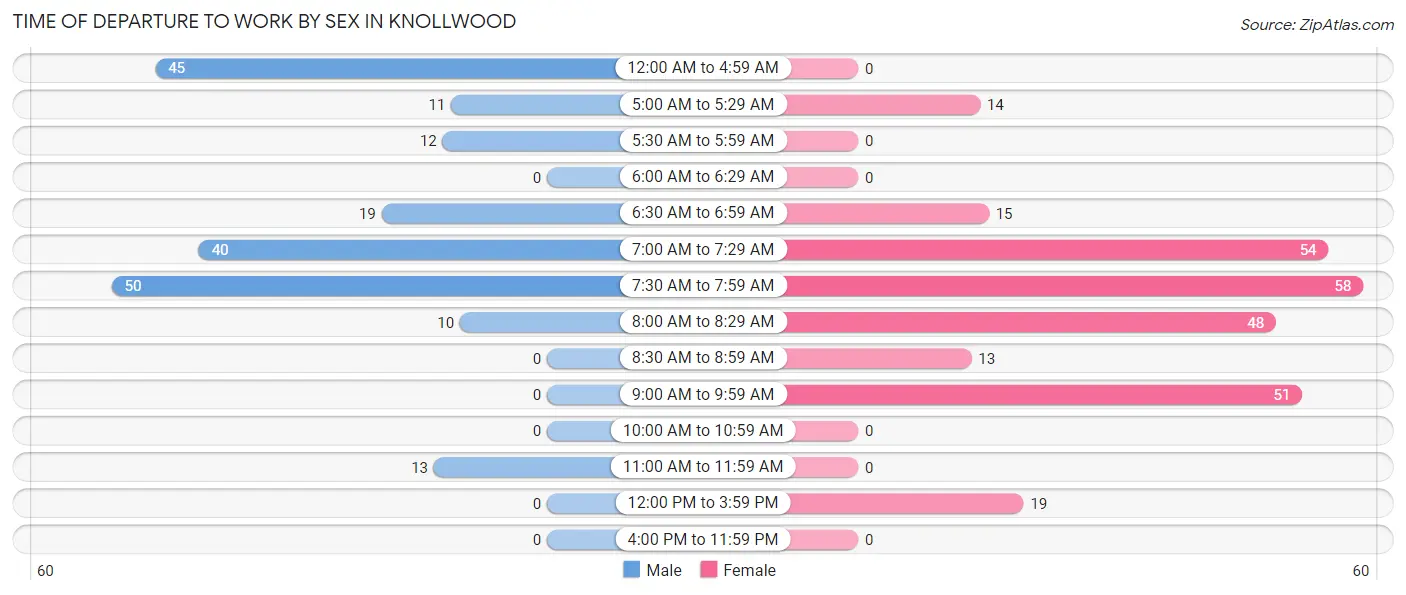
| Time of Departure | Male | Female |
| 12:00 AM to 4:59 AM | 45 (22.5%) | 0 (0.0%) |
| 5:00 AM to 5:29 AM | 11 (5.5%) | 14 (5.1%) |
| 5:30 AM to 5:59 AM | 12 (6.0%) | 0 (0.0%) |
| 6:00 AM to 6:29 AM | 0 (0.0%) | 0 (0.0%) |
| 6:30 AM to 6:59 AM | 19 (9.5%) | 15 (5.5%) |
| 7:00 AM to 7:29 AM | 40 (20.0%) | 54 (19.9%) |
| 7:30 AM to 7:59 AM | 50 (25.0%) | 58 (21.3%) |
| 8:00 AM to 8:29 AM | 10 (5.0%) | 48 (17.6%) |
| 8:30 AM to 8:59 AM | 0 (0.0%) | 13 (4.8%) |
| 9:00 AM to 9:59 AM | 0 (0.0%) | 51 (18.8%) |
| 10:00 AM to 10:59 AM | 0 (0.0%) | 0 (0.0%) |
| 11:00 AM to 11:59 AM | 13 (6.5%) | 0 (0.0%) |
| 12:00 PM to 3:59 PM | 0 (0.0%) | 19 (7.0%) |
| 4:00 PM to 11:59 PM | 0 (0.0%) | 0 (0.0%) |
| Total | 200 (100.0%) | 272 (100.0%) |
Housing Occupancy in Knollwood
Occupancy by Ownership in Knollwood
Of the total 577 dwellings in Knollwood, owner-occupied units account for 410 (71.1%), while renter-occupied units make up 167 (28.9%).
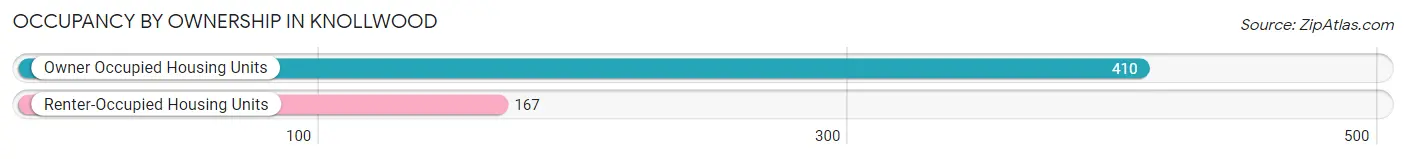
| Occupancy | # Housing Units | % Housing Units |
| Owner Occupied Housing Units | 410 | 71.1% |
| Renter-Occupied Housing Units | 167 | 28.9% |
| Total Occupied Housing Units | 577 | 100.0% |
Occupancy by Household Size in Knollwood
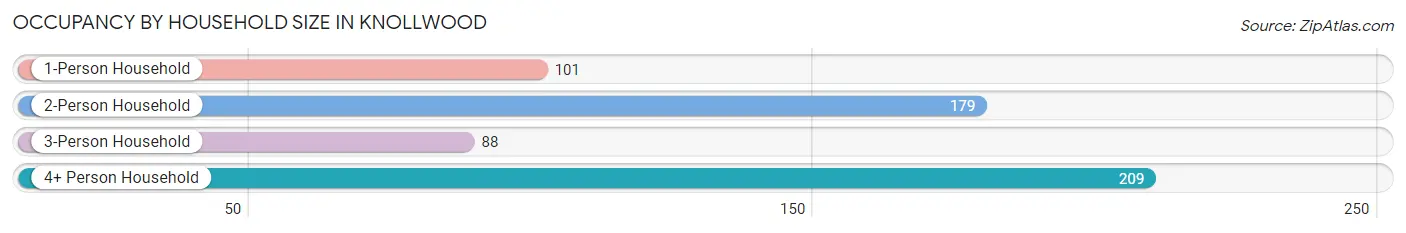
| Household Size | # Housing Units | % Housing Units |
| 1-Person Household | 101 | 17.5% |
| 2-Person Household | 179 | 31.0% |
| 3-Person Household | 88 | 15.2% |
| 4+ Person Household | 209 | 36.2% |
| Total Housing Units | 577 | 100.0% |
Occupancy by Ownership by Household Size in Knollwood
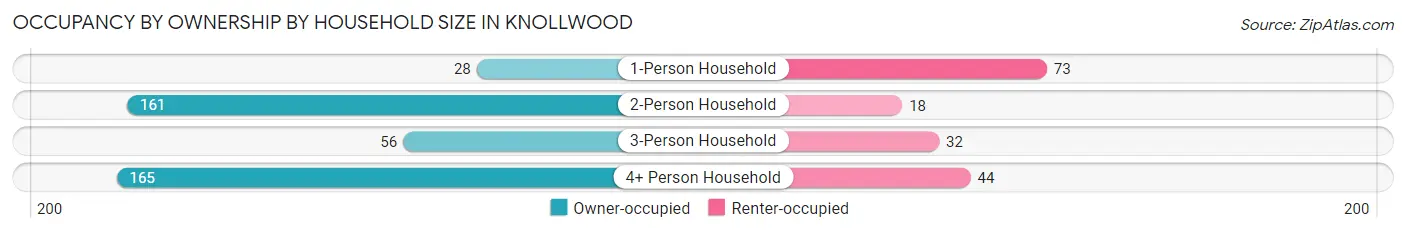
| Household Size | Owner-occupied | Renter-occupied |
| 1-Person Household | 28 (27.7%) | 73 (72.3%) |
| 2-Person Household | 161 (89.9%) | 18 (10.1%) |
| 3-Person Household | 56 (63.6%) | 32 (36.4%) |
| 4+ Person Household | 165 (78.9%) | 44 (21.0%) |
| Total Housing Units | 410 (71.1%) | 167 (28.9%) |
Occupancy by Educational Attainment in Knollwood
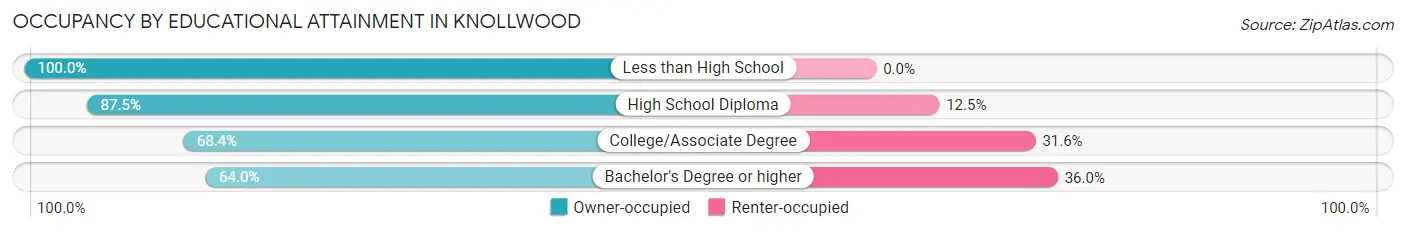
| Household Size | Owner-occupied | Renter-occupied |
| Less than High School | 8 (100.0%) | 0 (0.0%) |
| High School Diploma | 119 (87.5%) | 17 (12.5%) |
| College/Associate Degree | 91 (68.4%) | 42 (31.6%) |
| Bachelor's Degree or higher | 192 (64.0%) | 108 (36.0%) |
Occupancy by Age of Householder in Knollwood
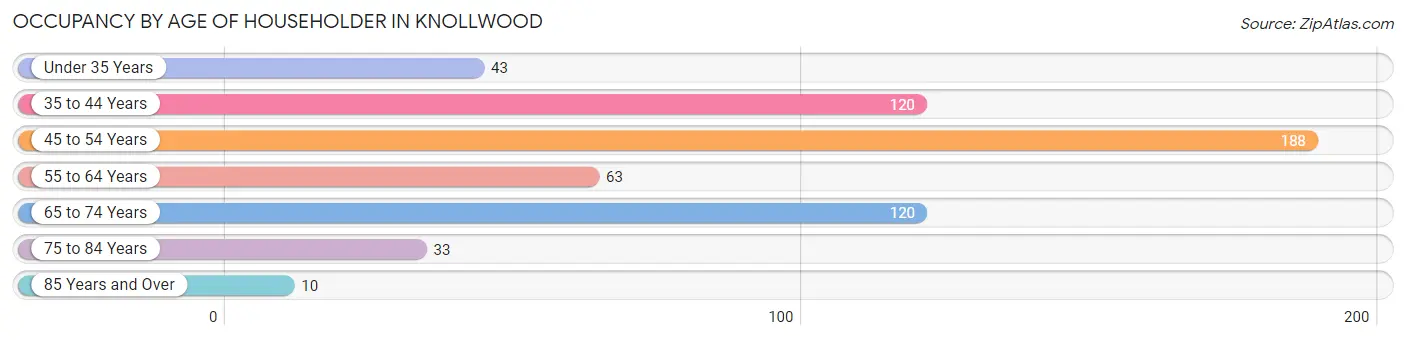
| Age Bracket | # Households | % Households |
| Under 35 Years | 43 | 7.4% |
| 35 to 44 Years | 120 | 20.8% |
| 45 to 54 Years | 188 | 32.6% |
| 55 to 64 Years | 63 | 10.9% |
| 65 to 74 Years | 120 | 20.8% |
| 75 to 84 Years | 33 | 5.7% |
| 85 Years and Over | 10 | 1.7% |
| Total | 577 | 100.0% |
Housing Finances in Knollwood
Median Income by Occupancy in Knollwood
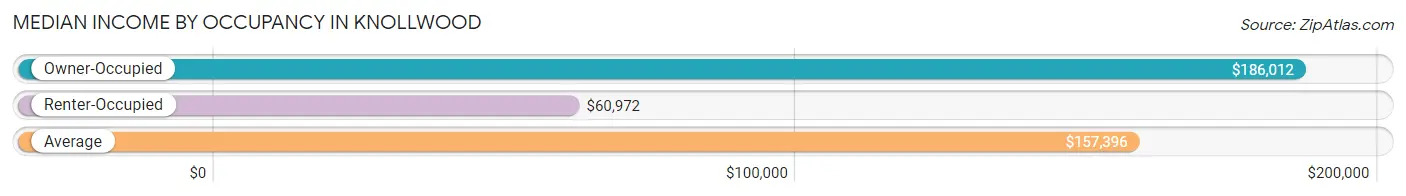
| Occupancy Type | # Households | Median Income |
| Owner-Occupied | 410 (71.1%) | $186,012 |
| Renter-Occupied | 167 (28.9%) | $60,972 |
| Average | 577 (100.0%) | $157,396 |
Occupancy by Householder Income Bracket in Knollwood
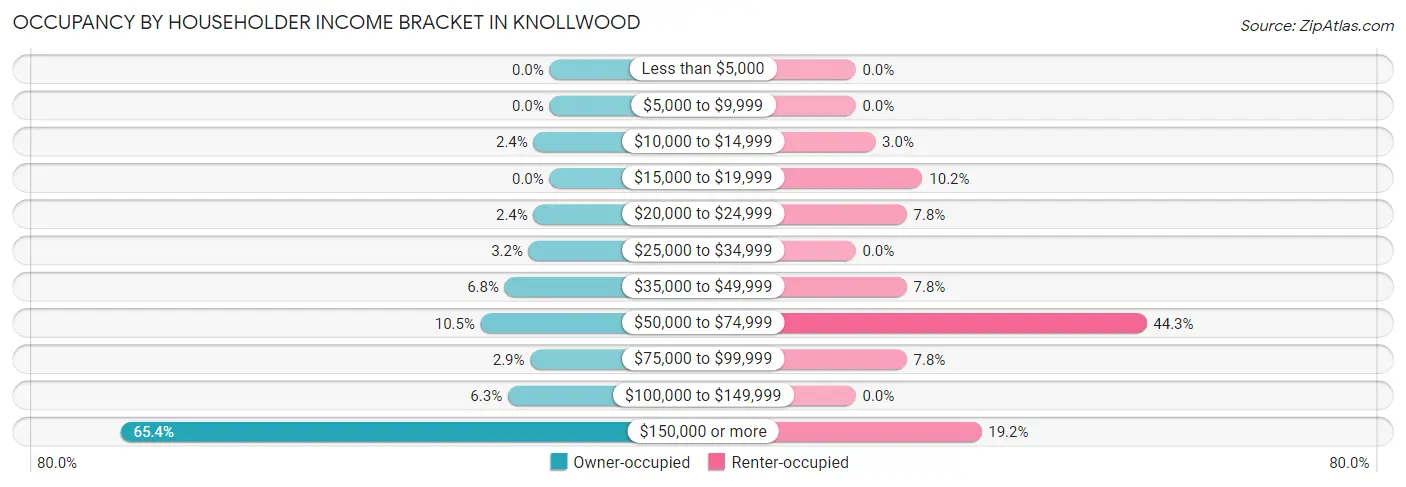
| Income Bracket | Owner-occupied | Renter-occupied |
| Less than $5,000 | 0 (0.0%) | 0 (0.0%) |
| $5,000 to $9,999 | 0 (0.0%) | 0 (0.0%) |
| $10,000 to $14,999 | 10 (2.4%) | 5 (3.0%) |
| $15,000 to $19,999 | 0 (0.0%) | 17 (10.2%) |
| $20,000 to $24,999 | 10 (2.4%) | 13 (7.8%) |
| $25,000 to $34,999 | 13 (3.2%) | 0 (0.0%) |
| $35,000 to $49,999 | 28 (6.8%) | 13 (7.8%) |
| $50,000 to $74,999 | 43 (10.5%) | 74 (44.3%) |
| $75,000 to $99,999 | 12 (2.9%) | 13 (7.8%) |
| $100,000 to $149,999 | 26 (6.3%) | 0 (0.0%) |
| $150,000 or more | 268 (65.4%) | 32 (19.2%) |
| Total | 410 (100.0%) | 167 (100.0%) |
Monthly Housing Cost Tiers in Knollwood
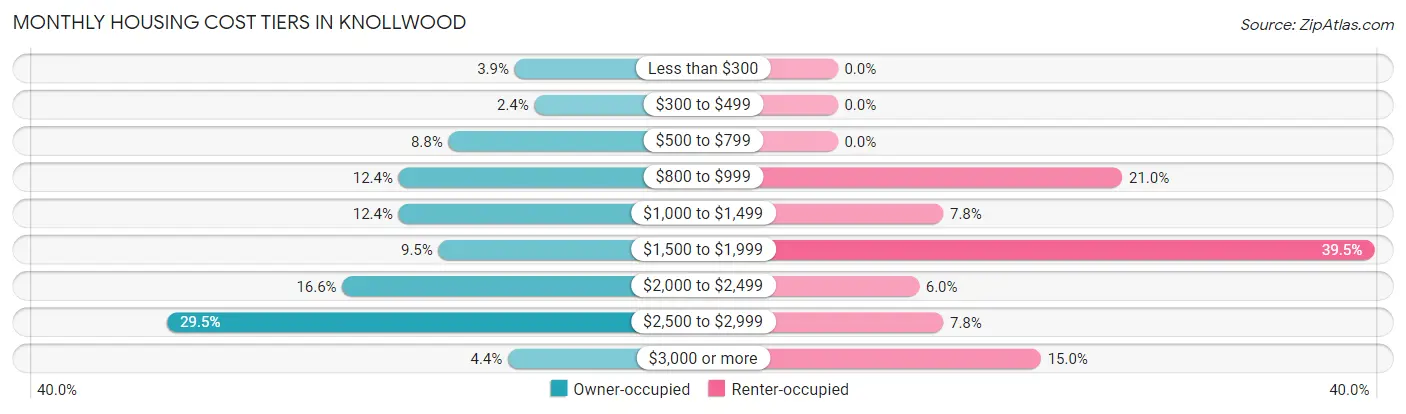
| Monthly Cost | Owner-occupied | Renter-occupied |
| Less than $300 | 16 (3.9%) | 0 (0.0%) |
| $300 to $499 | 10 (2.4%) | 0 (0.0%) |
| $500 to $799 | 36 (8.8%) | 0 (0.0%) |
| $800 to $999 | 51 (12.4%) | 35 (21.0%) |
| $1,000 to $1,499 | 51 (12.4%) | 13 (7.8%) |
| $1,500 to $1,999 | 39 (9.5%) | 66 (39.5%) |
| $2,000 to $2,499 | 68 (16.6%) | 10 (6.0%) |
| $2,500 to $2,999 | 121 (29.5%) | 13 (7.8%) |
| $3,000 or more | 18 (4.4%) | 25 (15.0%) |
| Total | 410 (100.0%) | 167 (100.0%) |
Physical Housing Characteristics in Knollwood
Housing Structures in Knollwood
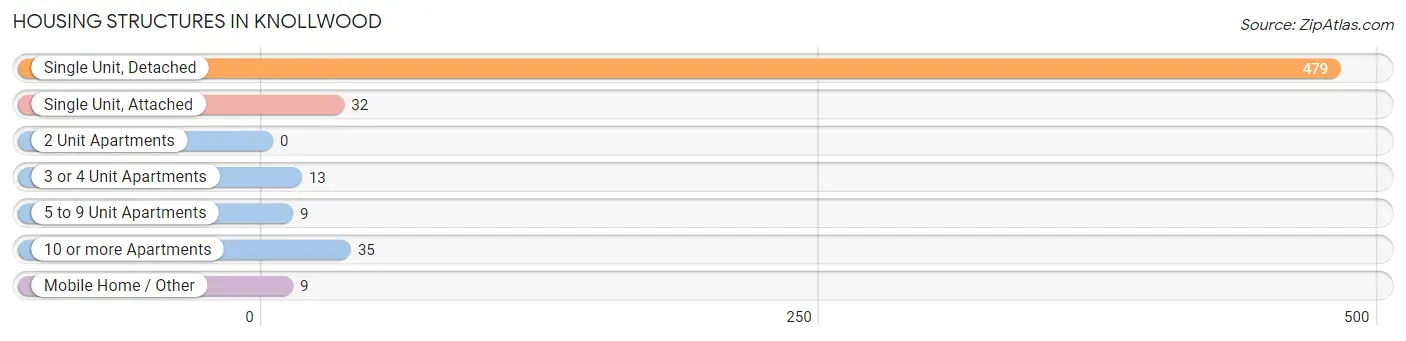
| Structure Type | # Housing Units | % Housing Units |
| Single Unit, Detached | 479 | 83.0% |
| Single Unit, Attached | 32 | 5.6% |
| 2 Unit Apartments | 0 | 0.0% |
| 3 or 4 Unit Apartments | 13 | 2.2% |
| 5 to 9 Unit Apartments | 9 | 1.6% |
| 10 or more Apartments | 35 | 6.1% |
| Mobile Home / Other | 9 | 1.6% |
| Total | 577 | 100.0% |
Housing Structures by Occupancy in Knollwood
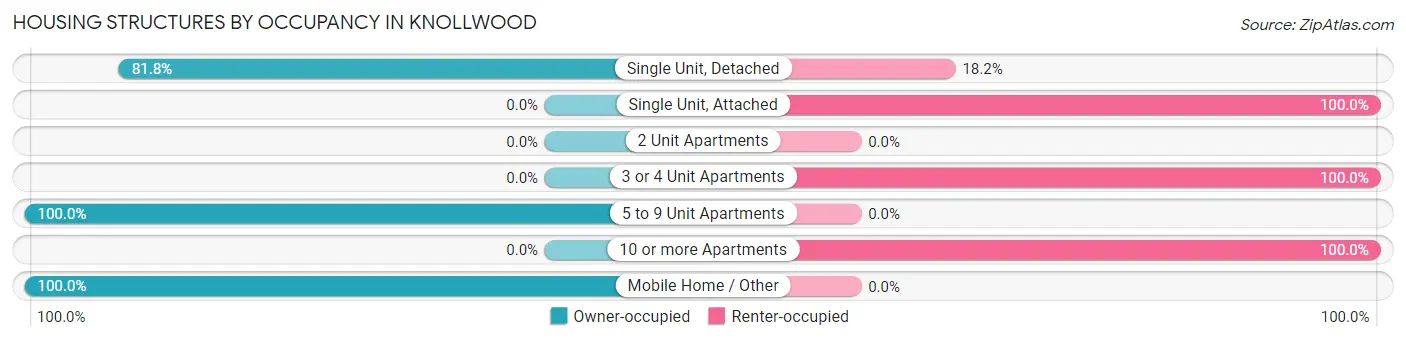
| Structure Type | Owner-occupied | Renter-occupied |
| Single Unit, Detached | 392 (81.8%) | 87 (18.2%) |
| Single Unit, Attached | 0 (0.0%) | 32 (100.0%) |
| 2 Unit Apartments | 0 (0.0%) | 0 (0.0%) |
| 3 or 4 Unit Apartments | 0 (0.0%) | 13 (100.0%) |
| 5 to 9 Unit Apartments | 9 (100.0%) | 0 (0.0%) |
| 10 or more Apartments | 0 (0.0%) | 35 (100.0%) |
| Mobile Home / Other | 9 (100.0%) | 0 (0.0%) |
| Total | 410 (71.1%) | 167 (28.9%) |
Housing Structures by Number of Rooms in Knollwood
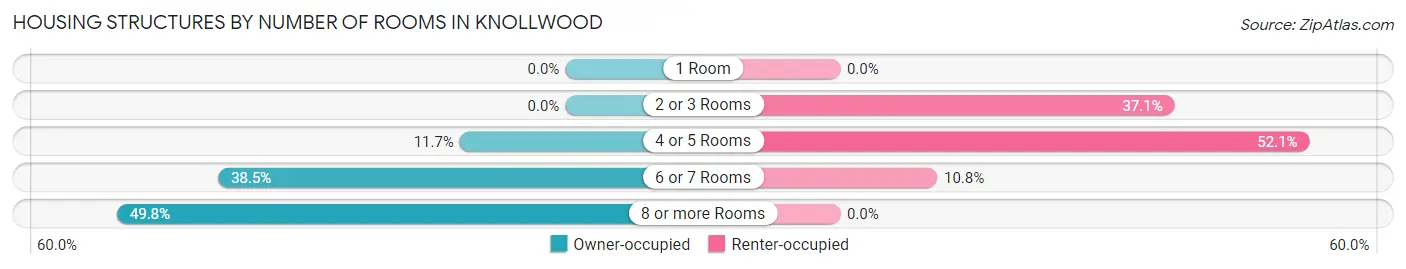
| Number of Rooms | Owner-occupied | Renter-occupied |
| 1 Room | 0 (0.0%) | 0 (0.0%) |
| 2 or 3 Rooms | 0 (0.0%) | 62 (37.1%) |
| 4 or 5 Rooms | 48 (11.7%) | 87 (52.1%) |
| 6 or 7 Rooms | 158 (38.5%) | 18 (10.8%) |
| 8 or more Rooms | 204 (49.8%) | 0 (0.0%) |
| Total | 410 (100.0%) | 167 (100.0%) |
Housing Structure by Heating Type in Knollwood
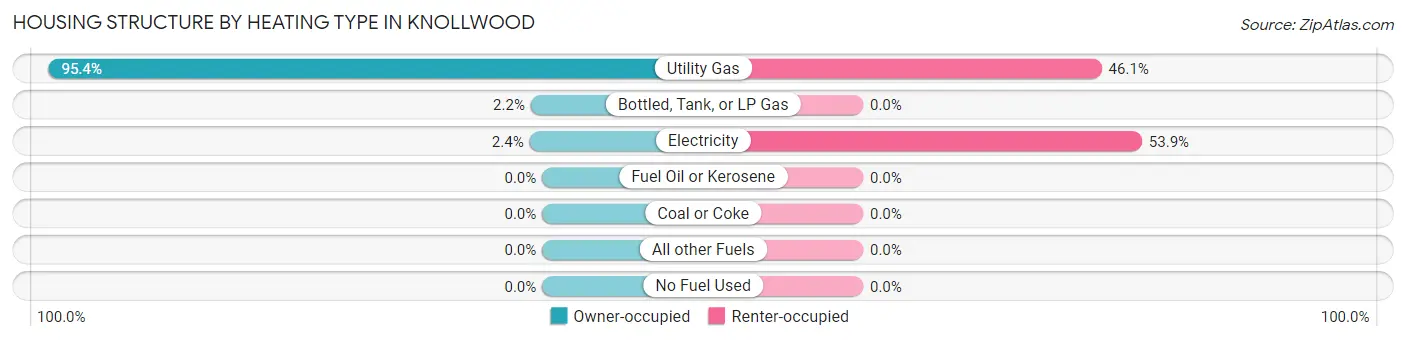
| Heating Type | Owner-occupied | Renter-occupied |
| Utility Gas | 391 (95.4%) | 77 (46.1%) |
| Bottled, Tank, or LP Gas | 9 (2.2%) | 0 (0.0%) |
| Electricity | 10 (2.4%) | 90 (53.9%) |
| Fuel Oil or Kerosene | 0 (0.0%) | 0 (0.0%) |
| Coal or Coke | 0 (0.0%) | 0 (0.0%) |
| All other Fuels | 0 (0.0%) | 0 (0.0%) |
| No Fuel Used | 0 (0.0%) | 0 (0.0%) |
| Total | 410 (100.0%) | 167 (100.0%) |
Household Vehicle Usage in Knollwood
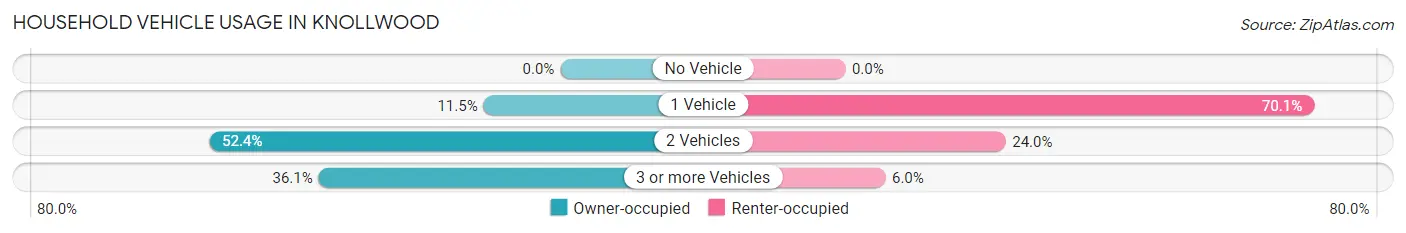
| Vehicles per Household | Owner-occupied | Renter-occupied |
| No Vehicle | 0 (0.0%) | 0 (0.0%) |
| 1 Vehicle | 47 (11.5%) | 117 (70.1%) |
| 2 Vehicles | 215 (52.4%) | 40 (23.9%) |
| 3 or more Vehicles | 148 (36.1%) | 10 (6.0%) |
| Total | 410 (100.0%) | 167 (100.0%) |
Real Estate & Mortgages in Knollwood
Real Estate and Mortgage Overview in Knollwood
| Characteristic | Without Mortgage | With Mortgage |
| Housing Units | 139 | 271 |
| Median Property Value | $294,200 | $375,200 |
| Median Household Income | - | - |
| Monthly Housing Costs | $942 | $18 |
| Real Estate Taxes | $7,602 | $0 |
Property Value by Mortgage Status in Knollwood
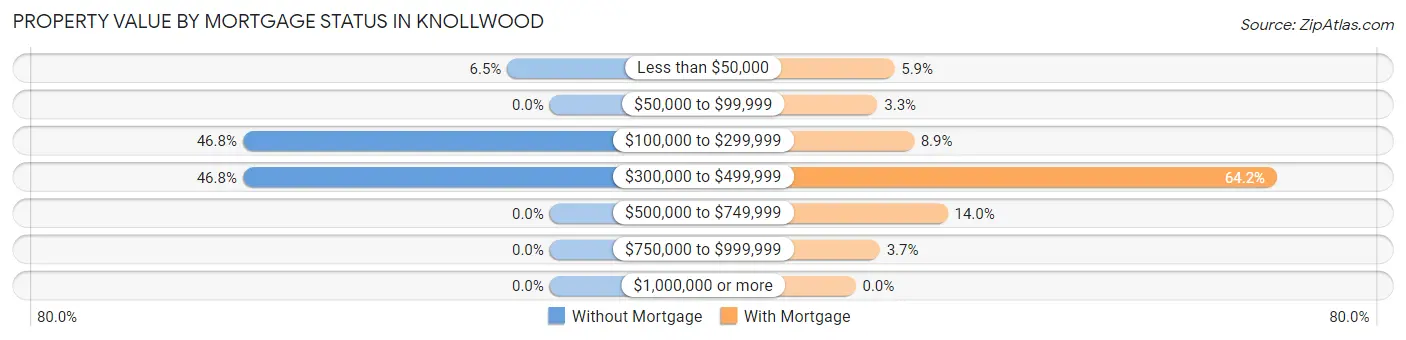
| Property Value | Without Mortgage | With Mortgage |
| Less than $50,000 | 9 (6.5%) | 16 (5.9%) |
| $50,000 to $99,999 | 0 (0.0%) | 9 (3.3%) |
| $100,000 to $299,999 | 65 (46.8%) | 24 (8.9%) |
| $300,000 to $499,999 | 65 (46.8%) | 174 (64.2%) |
| $500,000 to $749,999 | 0 (0.0%) | 38 (14.0%) |
| $750,000 to $999,999 | 0 (0.0%) | 10 (3.7%) |
| $1,000,000 or more | 0 (0.0%) | 0 (0.0%) |
| Total | 139 (100.0%) | 271 (100.0%) |
Household Income by Mortgage Status in Knollwood
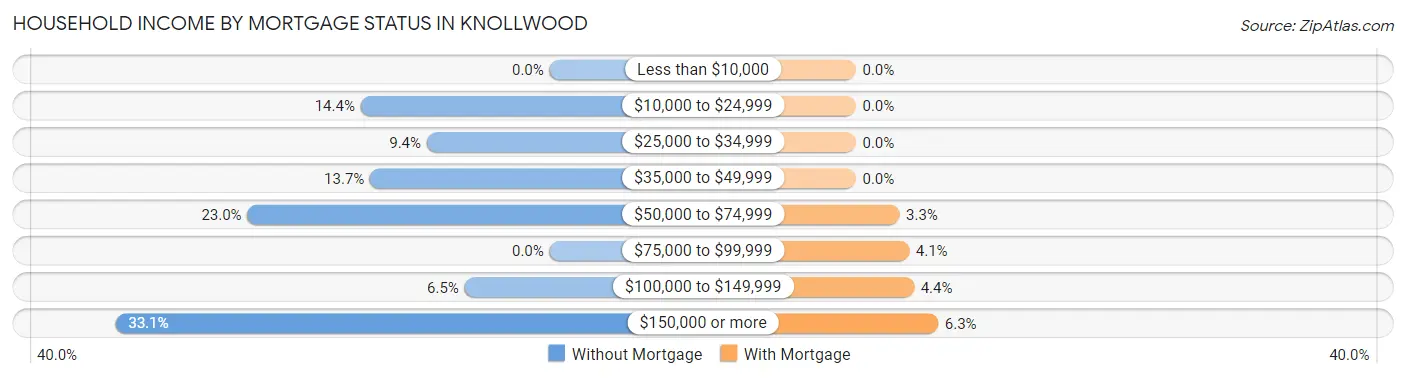
| Household Income | Without Mortgage | With Mortgage |
| Less than $10,000 | 0 (0.0%) | 0 (0.0%) |
| $10,000 to $24,999 | 20 (14.4%) | 0 (0.0%) |
| $25,000 to $34,999 | 13 (9.3%) | 0 (0.0%) |
| $35,000 to $49,999 | 19 (13.7%) | 0 (0.0%) |
| $50,000 to $74,999 | 32 (23.0%) | 9 (3.3%) |
| $75,000 to $99,999 | 0 (0.0%) | 11 (4.1%) |
| $100,000 to $149,999 | 9 (6.5%) | 12 (4.4%) |
| $150,000 or more | 46 (33.1%) | 17 (6.3%) |
| Total | 139 (100.0%) | 271 (100.0%) |
Property Value to Household Income Ratio in Knollwood
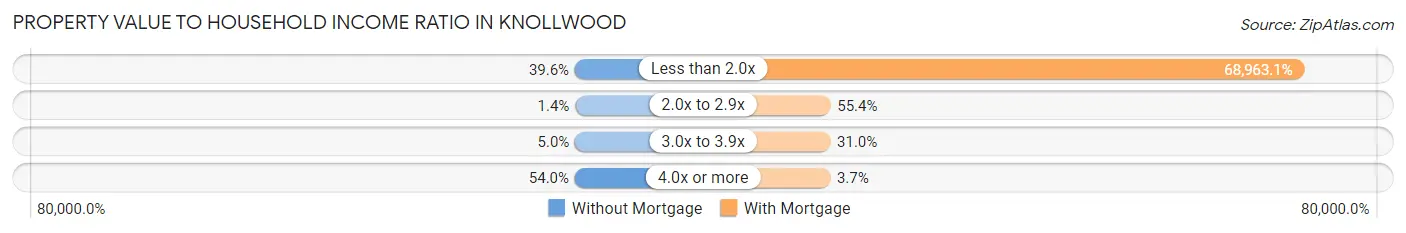
| Value-to-Income Ratio | Without Mortgage | With Mortgage |
| Less than 2.0x | 55 (39.6%) | 186,890 (68,963.1%) |
| 2.0x to 2.9x | 2 (1.4%) | 150 (55.3%) |
| 3.0x to 3.9x | 7 (5.0%) | 84 (31.0%) |
| 4.0x or more | 75 (54.0%) | 10 (3.7%) |
| Total | 139 (100.0%) | 271 (100.0%) |
Real Estate Taxes by Mortgage Status in Knollwood
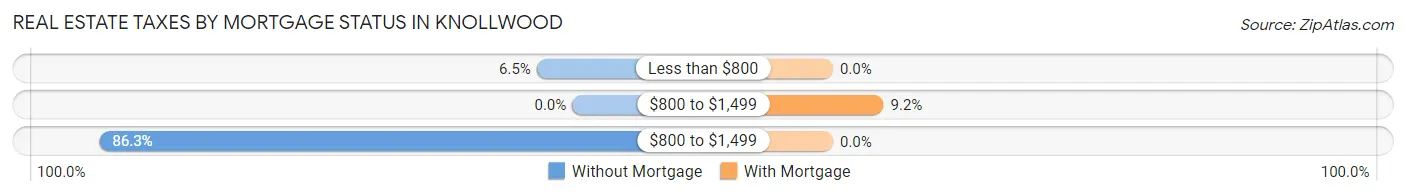
| Property Taxes | Without Mortgage | With Mortgage |
| Less than $800 | 9 (6.5%) | 0 (0.0%) |
| $800 to $1,499 | 0 (0.0%) | 25 (9.2%) |
| $800 to $1,499 | 120 (86.3%) | 0 (0.0%) |
| Total | 139 (100.0%) | 271 (100.0%) |
Health & Disability in Knollwood
Health Insurance Coverage by Age in Knollwood
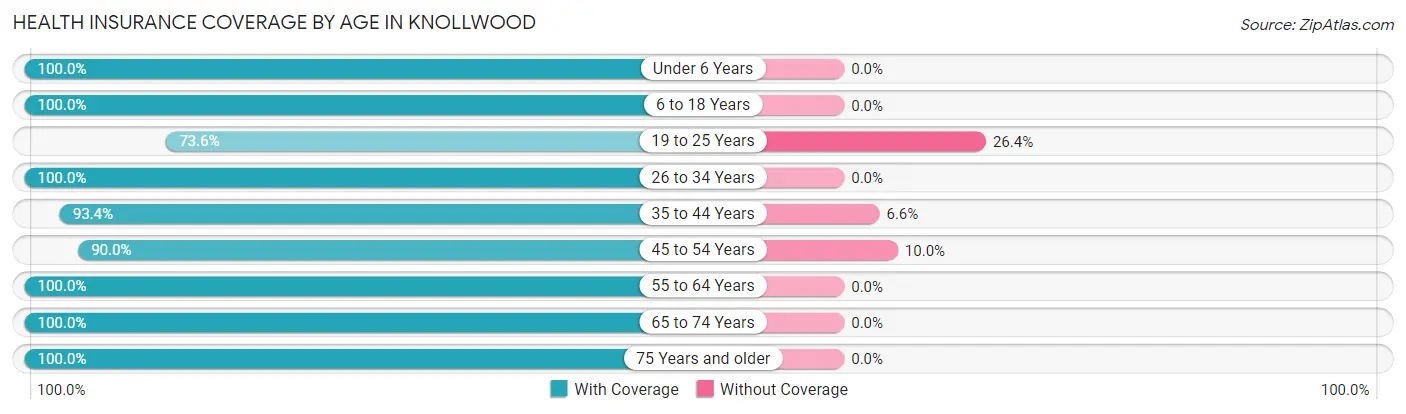
| Age Bracket | With Coverage | Without Coverage |
| Under 6 Years | 124 (100.0%) | 0 (0.0%) |
| 6 to 18 Years | 482 (100.0%) | 0 (0.0%) |
| 19 to 25 Years | 39 (73.6%) | 14 (26.4%) |
| 26 to 34 Years | 131 (100.0%) | 0 (0.0%) |
| 35 to 44 Years | 128 (93.4%) | 9 (6.6%) |
| 45 to 54 Years | 225 (90.0%) | 25 (10.0%) |
| 55 to 64 Years | 113 (100.0%) | 0 (0.0%) |
| 65 to 74 Years | 200 (100.0%) | 0 (0.0%) |
| 75 Years and older | 83 (100.0%) | 0 (0.0%) |
| Total | 1,525 (97.0%) | 48 (3.0%) |
Health Insurance Coverage by Citizenship Status in Knollwood
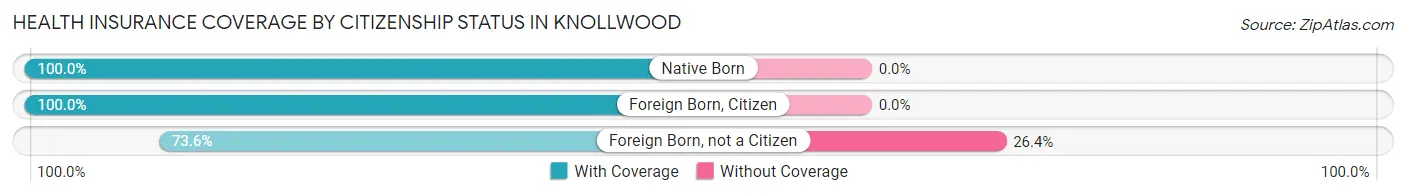
| Citizenship Status | With Coverage | Without Coverage |
| Native Born | 124 (100.0%) | 0 (0.0%) |
| Foreign Born, Citizen | 482 (100.0%) | 0 (0.0%) |
| Foreign Born, not a Citizen | 39 (73.6%) | 14 (26.4%) |
Health Insurance Coverage by Household Income in Knollwood
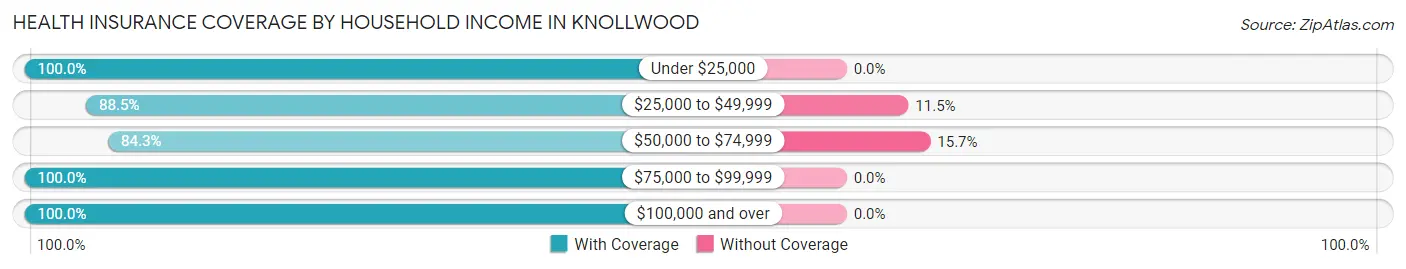
| Household Income | With Coverage | Without Coverage |
| Under $25,000 | 138 (100.0%) | 0 (0.0%) |
| $25,000 to $49,999 | 69 (88.5%) | 9 (11.5%) |
| $50,000 to $74,999 | 210 (84.3%) | 39 (15.7%) |
| $75,000 to $99,999 | 69 (100.0%) | 0 (0.0%) |
| $100,000 and over | 1,039 (100.0%) | 0 (0.0%) |
Public vs Private Health Insurance Coverage by Age in Knollwood
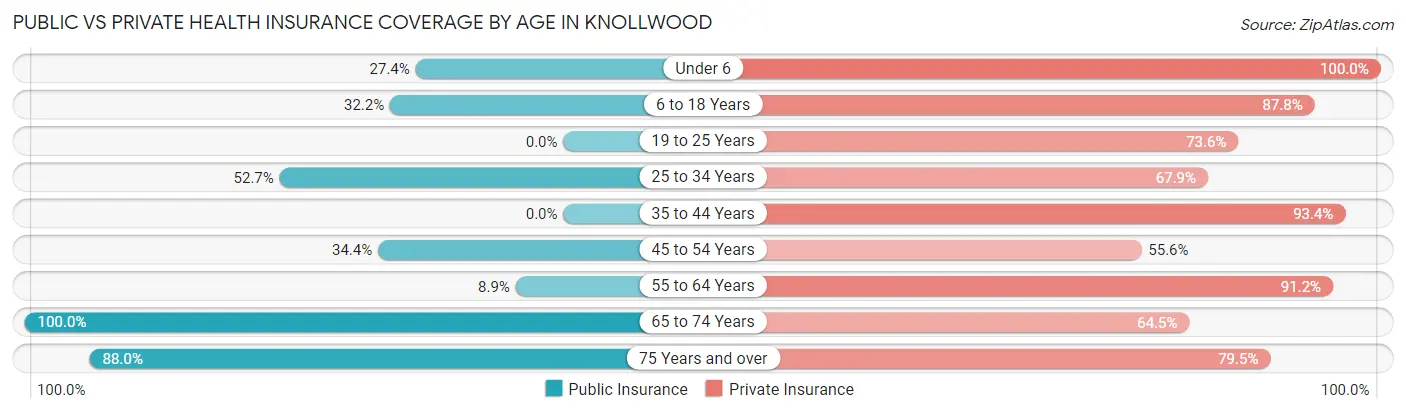
| Age Bracket | Public Insurance | Private Insurance |
| Under 6 | 34 (27.4%) | 124 (100.0%) |
| 6 to 18 Years | 155 (32.2%) | 423 (87.8%) |
| 19 to 25 Years | 0 (0.0%) | 39 (73.6%) |
| 25 to 34 Years | 69 (52.7%) | 89 (67.9%) |
| 35 to 44 Years | 0 (0.0%) | 128 (93.4%) |
| 45 to 54 Years | 86 (34.4%) | 139 (55.6%) |
| 55 to 64 Years | 10 (8.8%) | 103 (91.1%) |
| 65 to 74 Years | 200 (100.0%) | 129 (64.5%) |
| 75 Years and over | 73 (87.9%) | 66 (79.5%) |
| Total | 627 (39.9%) | 1,240 (78.8%) |
Disability Status by Sex by Age in Knollwood
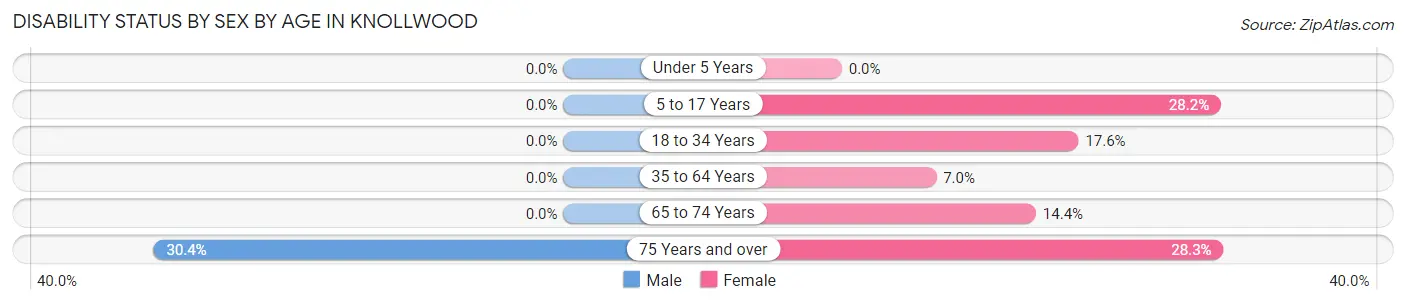
| Age Bracket | Male | Female |
| Under 5 Years | 0 (0.0%) | 0 (0.0%) |
| 5 to 17 Years | 0 (0.0%) | 67 (28.1%) |
| 18 to 34 Years | 0 (0.0%) | 26 (17.6%) |
| 35 to 64 Years | 0 (0.0%) | 23 (7.0%) |
| 65 to 74 Years | 0 (0.0%) | 17 (14.4%) |
| 75 Years and over | 7 (30.4%) | 17 (28.3%) |
Disability Class by Sex by Age in Knollwood
Disability Class: Hearing Difficulty
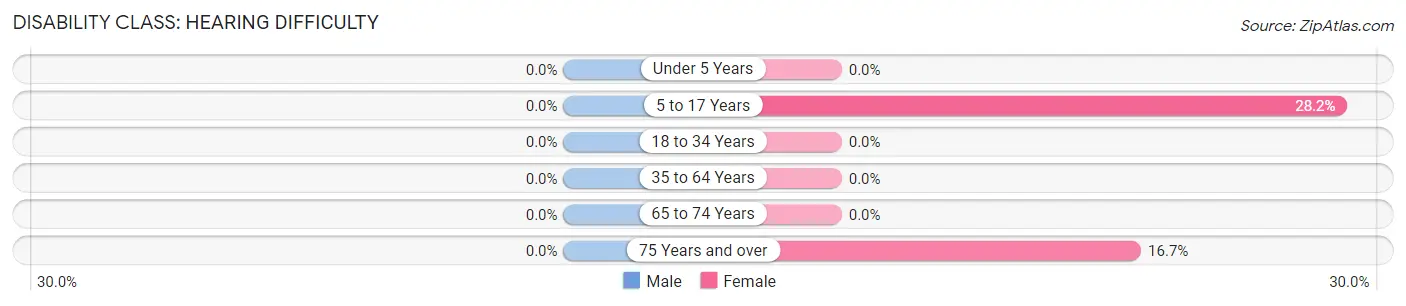
| Age Bracket | Male | Female |
| Under 5 Years | 0 (0.0%) | 0 (0.0%) |
| 5 to 17 Years | 0 (0.0%) | 67 (28.1%) |
| 18 to 34 Years | 0 (0.0%) | 0 (0.0%) |
| 35 to 64 Years | 0 (0.0%) | 0 (0.0%) |
| 65 to 74 Years | 0 (0.0%) | 0 (0.0%) |
| 75 Years and over | 0 (0.0%) | 10 (16.7%) |
Disability Class: Vision Difficulty
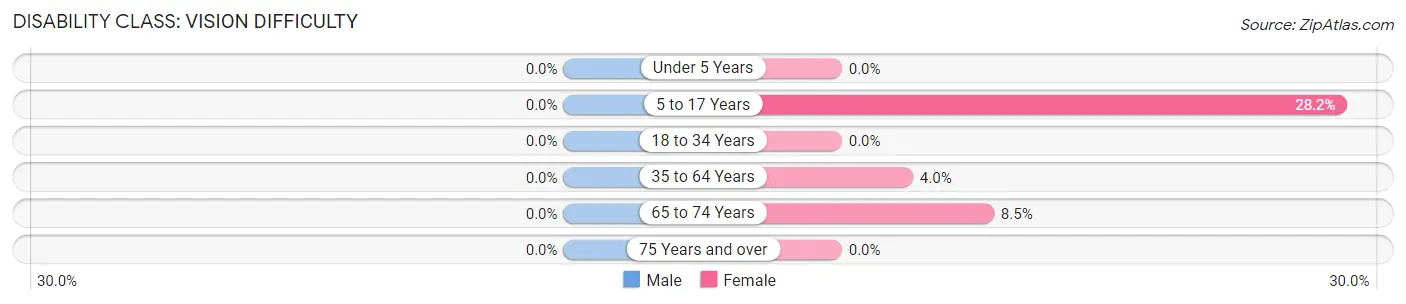
| Age Bracket | Male | Female |
| Under 5 Years | 0 (0.0%) | 0 (0.0%) |
| 5 to 17 Years | 0 (0.0%) | 67 (28.1%) |
| 18 to 34 Years | 0 (0.0%) | 0 (0.0%) |
| 35 to 64 Years | 0 (0.0%) | 13 (4.0%) |
| 65 to 74 Years | 0 (0.0%) | 10 (8.5%) |
| 75 Years and over | 0 (0.0%) | 0 (0.0%) |
Disability Class: Cognitive Difficulty
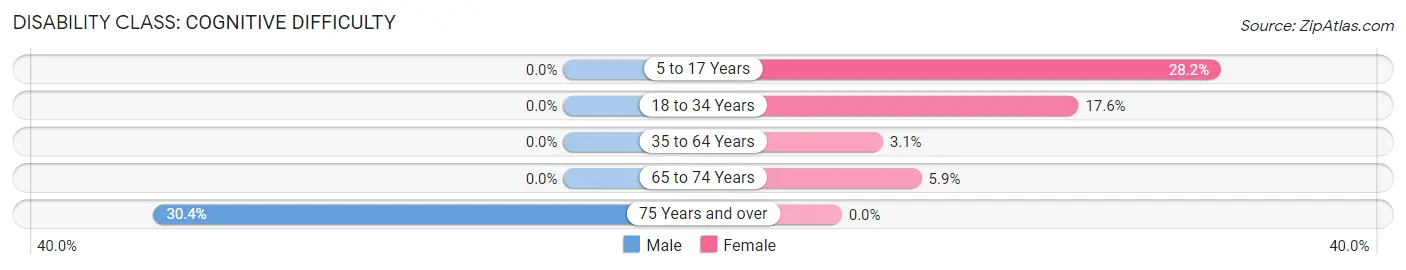
| Age Bracket | Male | Female |
| 5 to 17 Years | 0 (0.0%) | 67 (28.1%) |
| 18 to 34 Years | 0 (0.0%) | 26 (17.6%) |
| 35 to 64 Years | 0 (0.0%) | 10 (3.0%) |
| 65 to 74 Years | 0 (0.0%) | 7 (5.9%) |
| 75 Years and over | 7 (30.4%) | 0 (0.0%) |
Disability Class: Ambulatory Difficulty
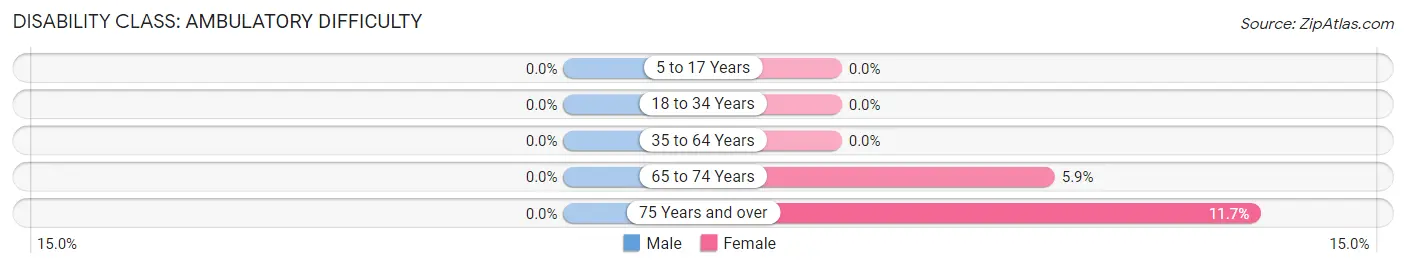
| Age Bracket | Male | Female |
| 5 to 17 Years | 0 (0.0%) | 0 (0.0%) |
| 18 to 34 Years | 0 (0.0%) | 0 (0.0%) |
| 35 to 64 Years | 0 (0.0%) | 0 (0.0%) |
| 65 to 74 Years | 0 (0.0%) | 7 (5.9%) |
| 75 Years and over | 0 (0.0%) | 7 (11.7%) |
Disability Class: Self-Care Difficulty
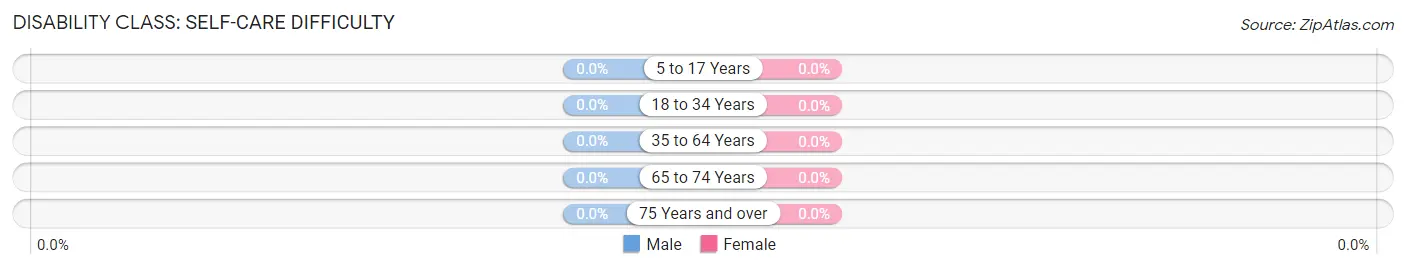
| Age Bracket | Male | Female |
| 5 to 17 Years | 0 (0.0%) | 0 (0.0%) |
| 18 to 34 Years | 0 (0.0%) | 0 (0.0%) |
| 35 to 64 Years | 0 (0.0%) | 0 (0.0%) |
| 65 to 74 Years | 0 (0.0%) | 0 (0.0%) |
| 75 Years and over | 0 (0.0%) | 0 (0.0%) |
Technology Access in Knollwood
Computing Device Access in Knollwood
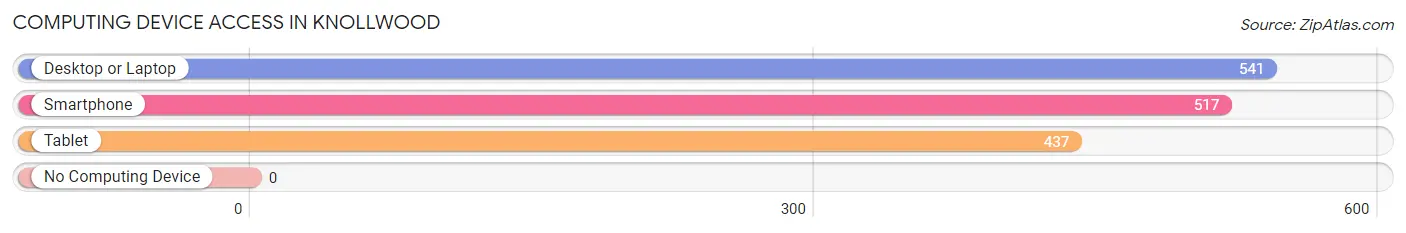
| Device Type | # Households | % Households |
| Desktop or Laptop | 541 | 93.8% |
| Smartphone | 517 | 89.6% |
| Tablet | 437 | 75.7% |
| No Computing Device | 0 | 0.0% |
| Total | 577 | 100.0% |
Internet Access in Knollwood
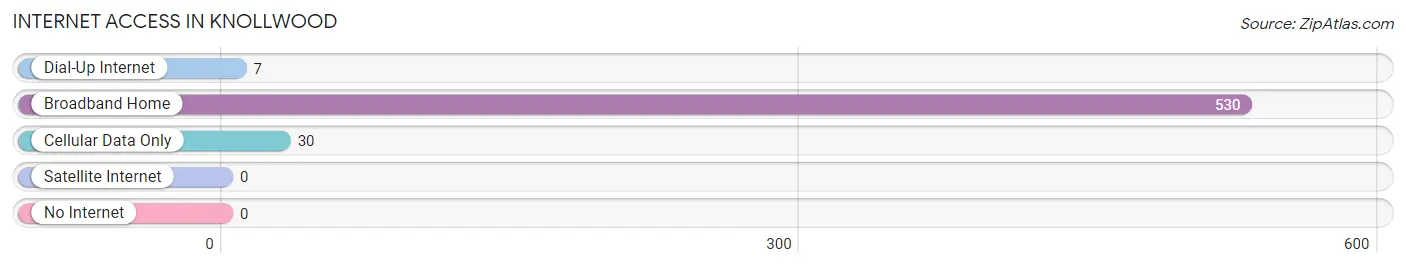
| Internet Type | # Households | % Households |
| Dial-Up Internet | 7 | 1.2% |
| Broadband Home | 530 | 91.8% |
| Cellular Data Only | 30 | 5.2% |
| Satellite Internet | 0 | 0.0% |
| No Internet | 0 | 0.0% |
| Total | 577 | 100.0% |
Knollwood Summary
Knollwood is a small village located in Lake County, Illinois, United States. It is situated in the northern part of the state, about 25 miles north of Chicago. The village has a population of approximately 1,500 people and is part of the North Shore area.
History
Knollwood was founded in the late 1800s by a group of German immigrants who were looking for a place to settle and start a new life. The village was originally called “Knoppenwald”, which means “wood of knobs” in German. The name was changed to Knollwood in the early 1900s.
The village was incorporated in 1921 and has remained relatively unchanged since then. The village has a rich history of German culture and traditions, which are still celebrated today.
Geography
Knollwood is located in Lake County, Illinois, about 25 miles north of Chicago. The village is situated on the shores of Lake Michigan and is surrounded by forested areas. The village is located in the North Shore area, which is known for its beautiful beaches and scenic views.
The village is located in a temperate climate, with hot summers and cold winters. The average temperature in the summer is around 75 degrees Fahrenheit, while the average temperature in the winter is around 25 degrees Fahrenheit.
Economy
Knollwood’s economy is largely based on tourism and retail. The village is home to several small businesses, including restaurants, shops, and galleries. The village also has a few larger businesses, such as a grocery store and a gas station.
The village is also home to several small manufacturing companies, which produce a variety of products, including furniture, clothing, and electronics.
Demographics
As of the 2010 census, the population of Knollwood was 1,500 people. The village is predominantly white, with a small percentage of African Americans and Hispanics. The median household income is $60,000, and the median age is 44 years old.
Knollwood is a small village with a rich history and a vibrant culture. The village is home to a diverse population and a thriving economy. The village is a great place to live, work, and visit, and is a great example of the beauty and charm of the North Shore area.
Common Questions
What is Per Capita Income in Knollwood?
Per Capita income in Knollwood is $47,964.
What is the Median Family Income in Knollwood?
Median Family Income in Knollwood is $185,439.
What is the Median Household income in Knollwood?
Median Household Income in Knollwood is $157,396.
What is Inequality or Gini Index in Knollwood?
Inequality or Gini Index in Knollwood is 0.38.
What is the Total Population of Knollwood?
Total Population of Knollwood is 1,763.
What is the Total Male Population of Knollwood?
Total Male Population of Knollwood is 772.
What is the Total Female Population of Knollwood?
Total Female Population of Knollwood is 991.
What is the Ratio of Males per 100 Females in Knollwood?
There are 77.90 Males per 100 Females in Knollwood.
What is the Ratio of Females per 100 Males in Knollwood?
There are 128.37 Females per 100 Males in Knollwood.
What is the Median Population Age in Knollwood?
Median Population Age in Knollwood is 38.7 Years.
What is the Average Family Size in Knollwood
Average Family Size in Knollwood is 3.4 People.
What is the Average Household Size in Knollwood
Average Household Size in Knollwood is 2.9 People.
How Large is the Labor Force in Knollwood?
There are 619 People in the Labor Forcein in Knollwood.
What is the Percentage of People in the Labor Force in Knollwood?
50.6% of People are in the Labor Force in Knollwood.