Burr Ridge, IL Map & Demographics
Burr Ridge Map
Burr Ridge Overview
$112,170
PER CAPITA INCOME
$213,077
AVG FAMILY INCOME
$174,342
AVG HOUSEHOLD INCOME
40.7%
WAGE / INCOME GAP [ % ]
59.3¢/ $1
WAGE / INCOME GAP [ $ ]
0.52
INEQUALITY / GINI INDEX
11,131
TOTAL POPULATION
5,795
MALE POPULATION
5,336
FEMALE POPULATION
108.60
MALES / 100 FEMALES
92.08
FEMALES / 100 MALES
56.7
MEDIAN AGE
2.9
AVG FAMILY SIZE
2.5
AVG HOUSEHOLD SIZE
5,405
LABOR FORCE [ PEOPLE ]
58.0%
PERCENT IN LABOR FORCE
3.4%
UNEMPLOYMENT RATE
Income in Burr Ridge
Income Overview in Burr Ridge
Per Capita Income in Burr Ridge is $112,170, while median incomes of families and households are $213,077 and $174,342 respectively.
| Characteristic | Number | Measure |
| Per Capita Income | 11,131 | $112,170 |
| Median Family Income | 3,326 | $213,077 |
| Mean Family Income | 3,326 | $323,359 |
| Median Household Income | 4,460 | $174,342 |
| Mean Household Income | 4,460 | $279,997 |
| Income Deficit | 3,326 | $0 |
| Wage / Income Gap (%) | 11,131 | 40.72% |
| Wage / Income Gap ($) | 11,131 | 59.28¢ per $1 |
| Gini / Inequality Index | 11,131 | 0.52 |
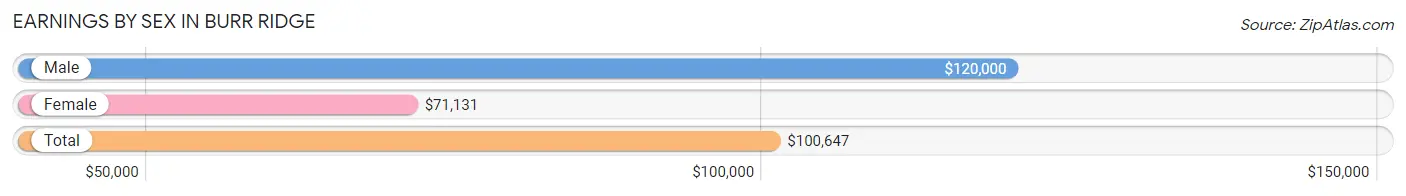
Earnings by Sex in Burr Ridge
Average Earnings in Burr Ridge are $100,647, $120,000 for men and $71,131 for women, a difference of 40.7%.
| Sex | Number | Average Earnings |
| Male | 3,066 (55.1%) | $120,000 |
| Female | 2,497 (44.9%) | $71,131 |
| Total | 5,563 (100.0%) | $100,647 |
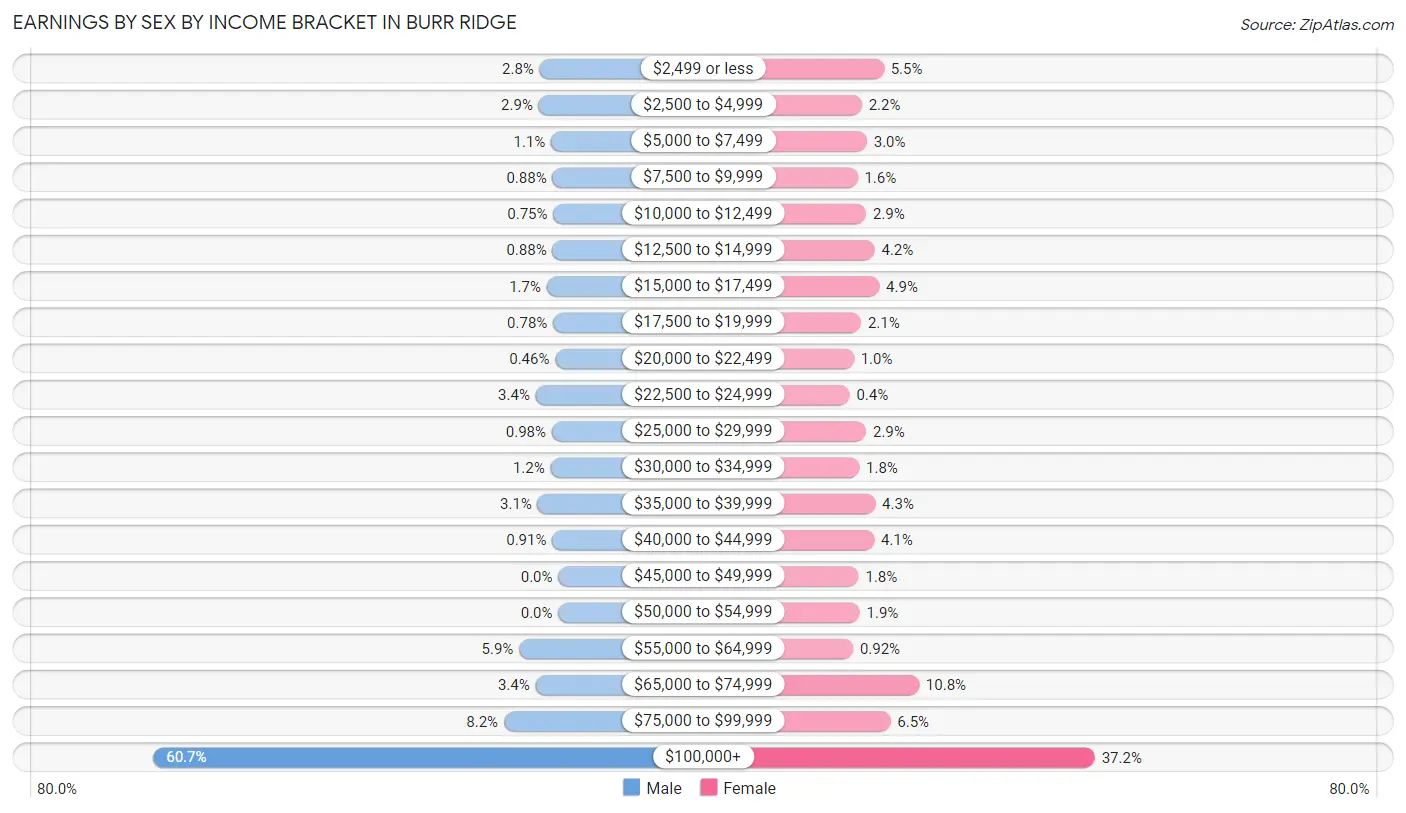
Earnings by Sex by Income Bracket in Burr Ridge
The most common earnings brackets in Burr Ridge are $100,000+ for men (1,861 | 60.7%) and $100,000+ for women (928 | 37.2%).
| Income | Male | Female |
| $2,499 or less | 86 (2.8%) | 138 (5.5%) |
| $2,500 to $4,999 | 90 (2.9%) | 56 (2.2%) |
| $5,000 to $7,499 | 33 (1.1%) | 75 (3.0%) |
| $7,500 to $9,999 | 27 (0.9%) | 40 (1.6%) |
| $10,000 to $12,499 | 23 (0.7%) | 72 (2.9%) |
| $12,500 to $14,999 | 27 (0.9%) | 104 (4.2%) |
| $15,000 to $17,499 | 53 (1.7%) | 121 (4.9%) |
| $17,500 to $19,999 | 24 (0.8%) | 53 (2.1%) |
| $20,000 to $22,499 | 14 (0.5%) | 26 (1.0%) |
| $22,500 to $24,999 | 104 (3.4%) | 10 (0.4%) |
| $25,000 to $29,999 | 30 (1.0%) | 72 (2.9%) |
| $30,000 to $34,999 | 36 (1.2%) | 46 (1.8%) |
| $35,000 to $39,999 | 95 (3.1%) | 106 (4.3%) |
| $40,000 to $44,999 | 28 (0.9%) | 102 (4.1%) |
| $45,000 to $49,999 | 0 (0.0%) | 44 (1.8%) |
| $50,000 to $54,999 | 0 (0.0%) | 48 (1.9%) |
| $55,000 to $64,999 | 180 (5.9%) | 23 (0.9%) |
| $65,000 to $74,999 | 105 (3.4%) | 270 (10.8%) |
| $75,000 to $99,999 | 250 (8.2%) | 163 (6.5%) |
| $100,000+ | 1,861 (60.7%) | 928 (37.2%) |
| Total | 3,066 (100.0%) | 2,497 (100.0%) |
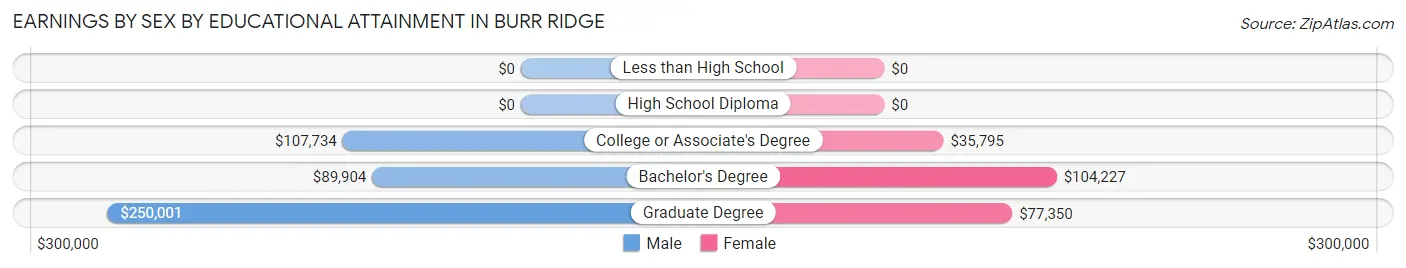
Earnings by Sex by Educational Attainment in Burr Ridge
Average earnings in Burr Ridge are $128,600 for men and $72,050 for women, a difference of 44.0%. Men with an educational attainment of graduate degree enjoy the highest average annual earnings of $250,001, while those with bachelor's degree education earn the least with $89,904. Women with an educational attainment of bachelor's degree earn the most with the average annual earnings of $104,227, while those with college or associate's degree education have the smallest earnings of $35,795.
| Educational Attainment | Male Income | Female Income |
| Less than High School | - | - |
| High School Diploma | - | - |
| College or Associate's Degree | $107,734 | $35,795 |
| Bachelor's Degree | $89,904 | $104,227 |
| Graduate Degree | $250,001 | $77,350 |
| Total | $128,600 | $72,050 |
Family Income in Burr Ridge
Family Income Brackets in Burr Ridge
According to the Burr Ridge family income data, there are 1,743 families falling into the $200,000+ income range, which is the most common income bracket and makes up 52.4% of all families.
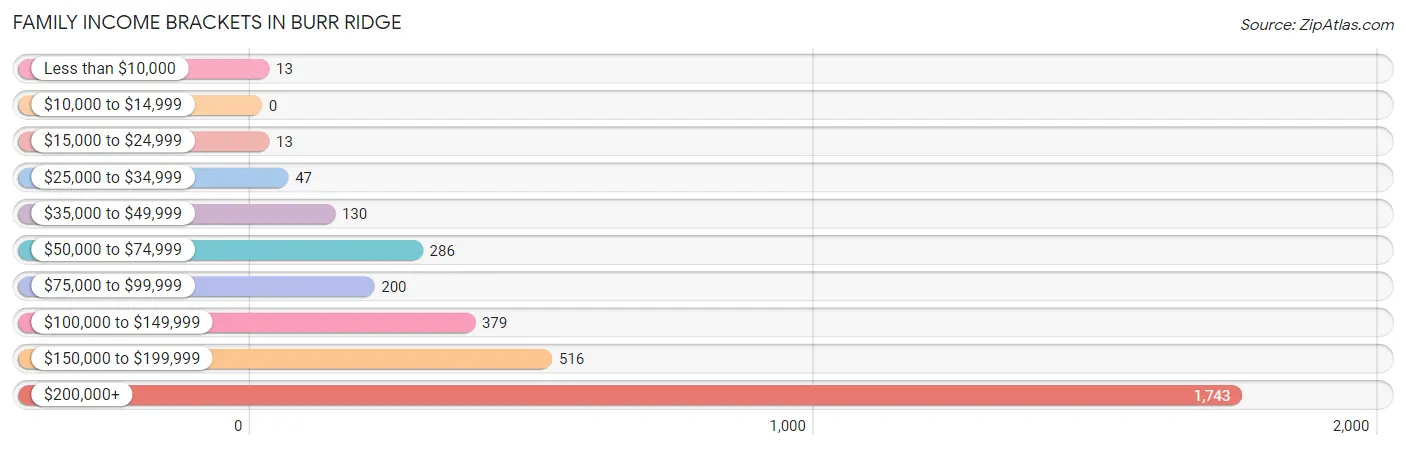
| Income Bracket | # Families | % Families |
| Less than $10,000 | 13 | 0.4% |
| $10,000 to $14,999 | 0 | 0.0% |
| $15,000 to $24,999 | 13 | 0.4% |
| $25,000 to $34,999 | 47 | 1.4% |
| $35,000 to $49,999 | 130 | 3.9% |
| $50,000 to $74,999 | 286 | 8.6% |
| $75,000 to $99,999 | 200 | 6.0% |
| $100,000 to $149,999 | 379 | 11.4% |
| $150,000 to $199,999 | 516 | 15.5% |
| $200,000+ | 1,743 | 52.4% |
Family Income by Famaliy Size in Burr Ridge
4-person families (420 | 12.6%) account for the highest median family income in Burr Ridge with $250,001 per family, while 2-person families (1,902 | 57.2%) have the highest median income of $104,500 per family member.
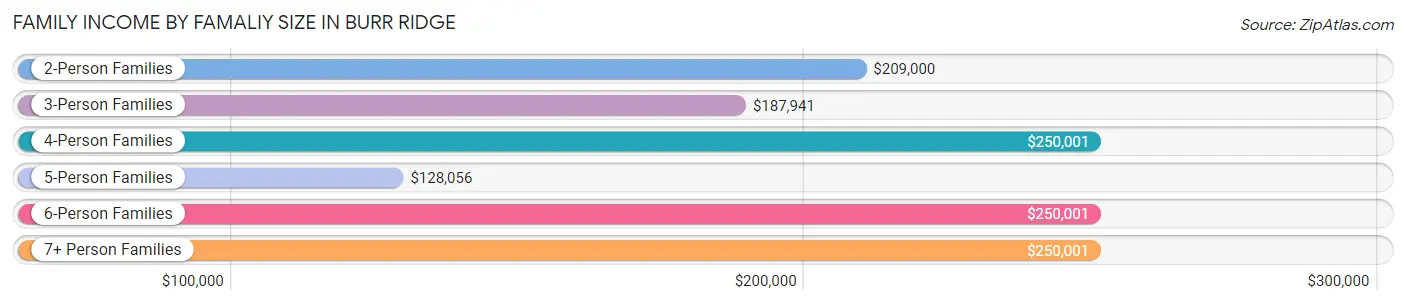
| Income Bracket | # Families | Median Income |
| 2-Person Families | 1,902 (57.2%) | $209,000 |
| 3-Person Families | 614 (18.5%) | $187,941 |
| 4-Person Families | 420 (12.6%) | $250,001 |
| 5-Person Families | 270 (8.1%) | $128,056 |
| 6-Person Families | 66 (2.0%) | $250,001 |
| 7+ Person Families | 54 (1.6%) | $250,001 |
| Total | 3,326 (100.0%) | $213,077 |
Family Income by Number of Earners in Burr Ridge
The median family income in Burr Ridge is $213,077, with families comprising 3+ earners (252) having the highest median family income of $250,001, while families with no earners (567) have the lowest median family income of $90,991, accounting for 7.6% and 17.1% of families, respectively.
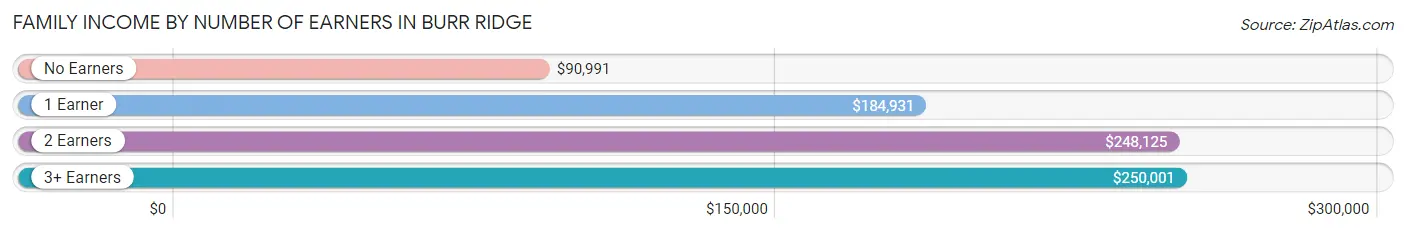
| Number of Earners | # Families | Median Income |
| No Earners | 567 (17.1%) | $90,991 |
| 1 Earner | 929 (27.9%) | $184,931 |
| 2 Earners | 1,578 (47.4%) | $248,125 |
| 3+ Earners | 252 (7.6%) | $250,001 |
| Total | 3,326 (100.0%) | $213,077 |
Household Income in Burr Ridge
Household Income Brackets in Burr Ridge
With 1,949 households falling in the category, the $200,000+ income range is the most frequent in Burr Ridge, accounting for 43.7% of all households. In contrast, only 76 households (1.7%) fall into the less than $10,000 income bracket, making it the least populous group.
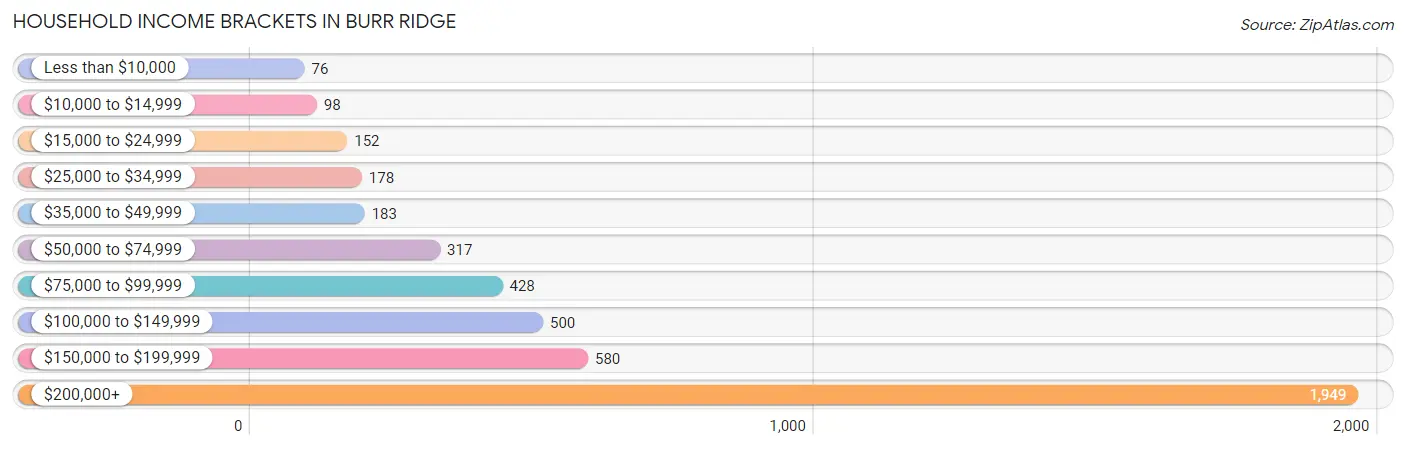
| Income Bracket | # Households | % Households |
| Less than $10,000 | 76 | 1.7% |
| $10,000 to $14,999 | 98 | 2.2% |
| $15,000 to $24,999 | 152 | 3.4% |
| $25,000 to $34,999 | 178 | 4.0% |
| $35,000 to $49,999 | 183 | 4.1% |
| $50,000 to $74,999 | 317 | 7.1% |
| $75,000 to $99,999 | 428 | 9.6% |
| $100,000 to $149,999 | 500 | 11.2% |
| $150,000 to $199,999 | 580 | 13.0% |
| $200,000+ | 1,949 | 43.7% |
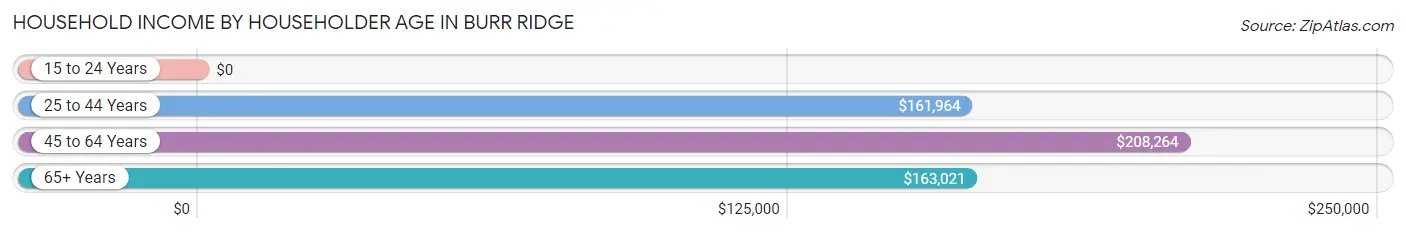
Household Income by Householder Age in Burr Ridge
The median household income in Burr Ridge is $174,342, with the highest median household income of $208,264 found in the 45 to 64 years age bracket for the primary householder. A total of 1,624 households (36.4%) fall into this category. Meanwhile, the 15 to 24 years age bracket for the primary householder has the lowest median household income of $0, with 11 households (0.3%) in this group.
| Income Bracket | # Households | Median Income |
| 15 to 24 Years | 11 (0.3%) | $0 |
| 25 to 44 Years | 601 (13.5%) | $161,964 |
| 45 to 64 Years | 1,624 (36.4%) | $208,264 |
| 65+ Years | 2,224 (49.9%) | $163,021 |
| Total | 4,460 (100.0%) | $174,342 |
Poverty in Burr Ridge
Income Below Poverty by Sex and Age in Burr Ridge
With 1.5% poverty level for males and 5.4% for females among the residents of Burr Ridge, 25 to 34 year old males and 18 to 24 year old females are the most vulnerable to poverty, with 19 males (6.3%) and 34 females (25.4%) in their respective age groups living below the poverty level.
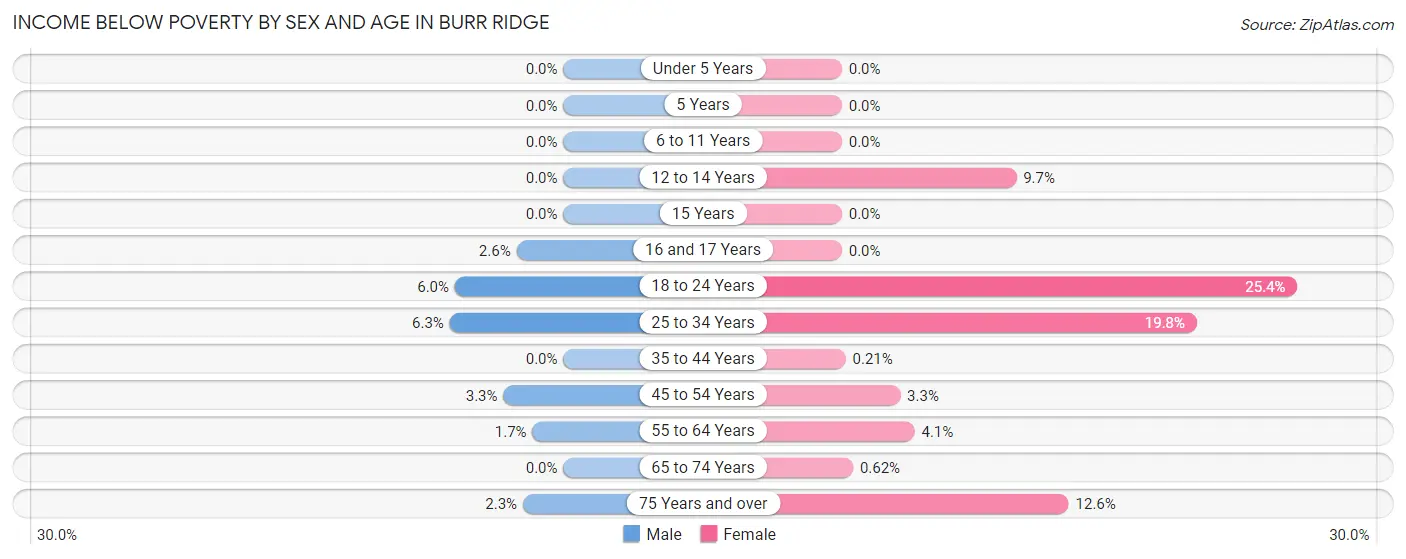
| Age Bracket | Male | Female |
| Under 5 Years | 0 (0.0%) | 0 (0.0%) |
| 5 Years | 0 (0.0%) | 0 (0.0%) |
| 6 to 11 Years | 0 (0.0%) | 0 (0.0%) |
| 12 to 14 Years | 0 (0.0%) | 10 (9.7%) |
| 15 Years | 0 (0.0%) | 0 (0.0%) |
| 16 and 17 Years | 3 (2.6%) | 0 (0.0%) |
| 18 to 24 Years | 18 (6.0%) | 34 (25.4%) |
| 25 to 34 Years | 19 (6.3%) | 69 (19.8%) |
| 35 to 44 Years | 0 (0.0%) | 1 (0.2%) |
| 45 to 54 Years | 18 (3.3%) | 16 (3.3%) |
| 55 to 64 Years | 15 (1.7%) | 50 (4.1%) |
| 65 to 74 Years | 0 (0.0%) | 7 (0.6%) |
| 75 Years and over | 14 (2.2%) | 98 (12.6%) |
| Total | 87 (1.5%) | 285 (5.4%) |
Income Above Poverty by Sex and Age in Burr Ridge
According to the poverty statistics in Burr Ridge, males aged under 5 years and females aged under 5 years are the age groups that are most secure financially, with 100.0% of males and 100.0% of females in these age groups living above the poverty line.
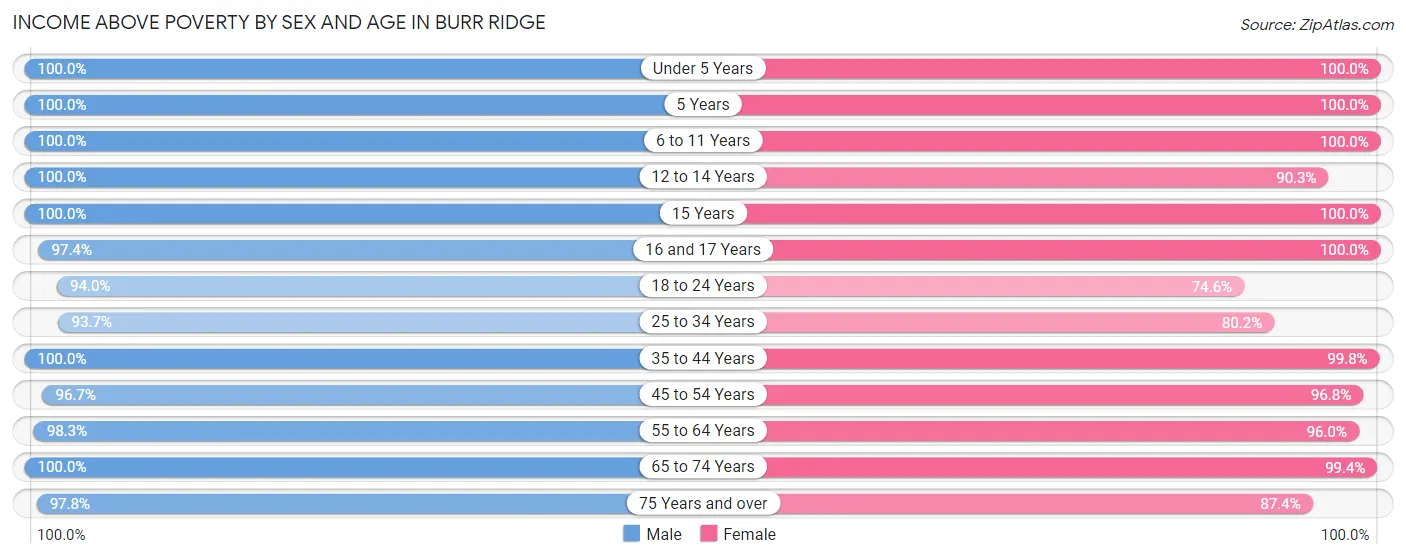
| Age Bracket | Male | Female |
| Under 5 Years | 230 (100.0%) | 196 (100.0%) |
| 5 Years | 47 (100.0%) | 30 (100.0%) |
| 6 to 11 Years | 507 (100.0%) | 203 (100.0%) |
| 12 to 14 Years | 375 (100.0%) | 93 (90.3%) |
| 15 Years | 57 (100.0%) | 62 (100.0%) |
| 16 and 17 Years | 112 (97.4%) | 116 (100.0%) |
| 18 to 24 Years | 280 (94.0%) | 100 (74.6%) |
| 25 to 34 Years | 281 (93.7%) | 280 (80.2%) |
| 35 to 44 Years | 585 (100.0%) | 472 (99.8%) |
| 45 to 54 Years | 521 (96.7%) | 476 (96.8%) |
| 55 to 64 Years | 856 (98.3%) | 1,186 (96.0%) |
| 65 to 74 Years | 1,207 (100.0%) | 1,124 (99.4%) |
| 75 Years and over | 607 (97.8%) | 678 (87.4%) |
| Total | 5,665 (98.5%) | 5,016 (94.6%) |
Income Below Poverty Among Married-Couple Families in Burr Ridge
The poverty statistics for married-couple families in Burr Ridge show that 0.7% or 22 of the total 3,038 families live below the poverty line. Families with 1 or 2 children have the highest poverty rate of 1.4%, comprising of 10 families. On the other hand, families with 3 or 4 children have the lowest poverty rate of 0.0%, which includes 0 families.
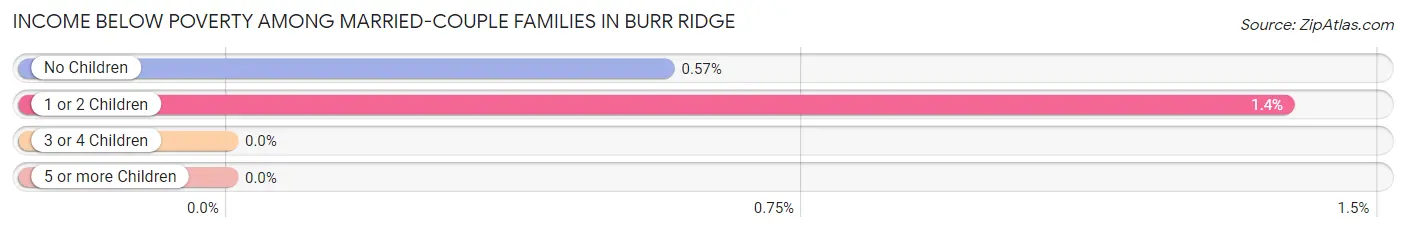
| Children | Above Poverty | Below Poverty |
| No Children | 2,082 (99.4%) | 12 (0.6%) |
| 1 or 2 Children | 713 (98.6%) | 10 (1.4%) |
| 3 or 4 Children | 211 (100.0%) | 0 (0.0%) |
| 5 or more Children | 10 (100.0%) | 0 (0.0%) |
| Total | 3,016 (99.3%) | 22 (0.7%) |
Income Below Poverty Among Single-Parent Households in Burr Ridge
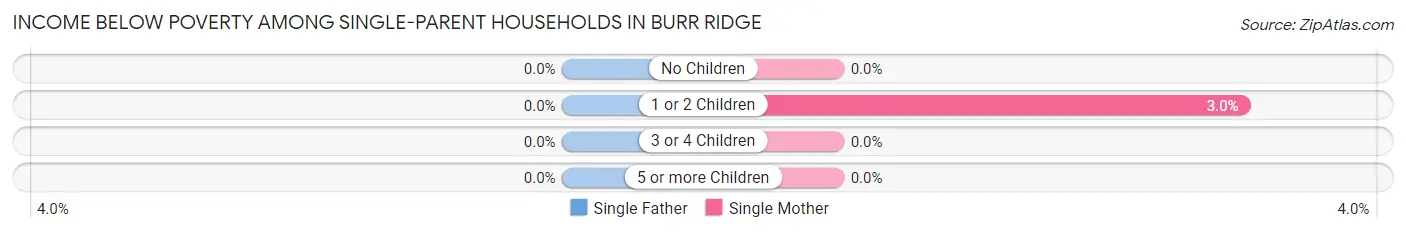
| Children | Single Father | Single Mother |
| No Children | 0 (0.0%) | 0 (0.0%) |
| 1 or 2 Children | 0 (0.0%) | 2 (3.0%) |
| 3 or 4 Children | 0 (0.0%) | 0 (0.0%) |
| 5 or more Children | 0 (0.0%) | 0 (0.0%) |
| Total | 0 (0.0%) | 2 (1.0%) |
Income Below Poverty Among Married-Couple vs Single-Parent Households in Burr Ridge
The poverty data for Burr Ridge shows that 22 of the married-couple family households (0.7%) and 2 of the single-parent households (0.7%) are living below the poverty level. Within the married-couple family households, those with 1 or 2 children have the highest poverty rate, with 10 households (1.4%) falling below the poverty line. Among the single-parent households, those with 1 or 2 children have the highest poverty rate, with 2 household (2.4%) living below poverty.
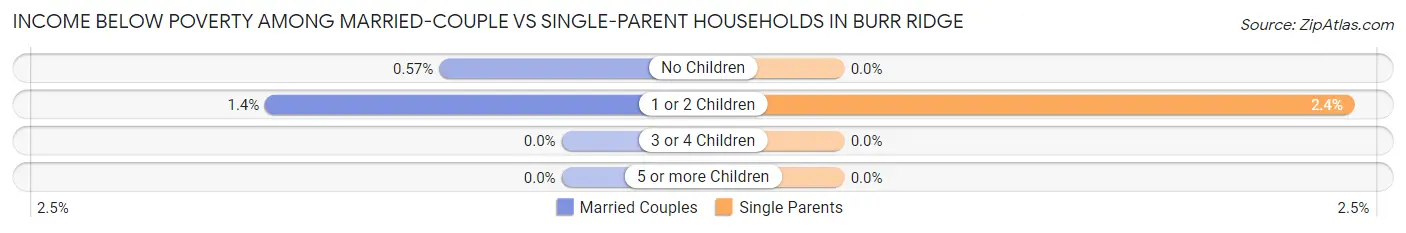
| Children | Married-Couple Families | Single-Parent Households |
| No Children | 12 (0.6%) | 0 (0.0%) |
| 1 or 2 Children | 10 (1.4%) | 2 (2.4%) |
| 3 or 4 Children | 0 (0.0%) | 0 (0.0%) |
| 5 or more Children | 0 (0.0%) | 0 (0.0%) |
| Total | 22 (0.7%) | 2 (0.7%) |
Race in Burr Ridge
The most populous races in Burr Ridge are White / Caucasian (8,257 | 74.2%), Asian (1,645 | 14.8%), and Two or more Races (743 | 6.7%).
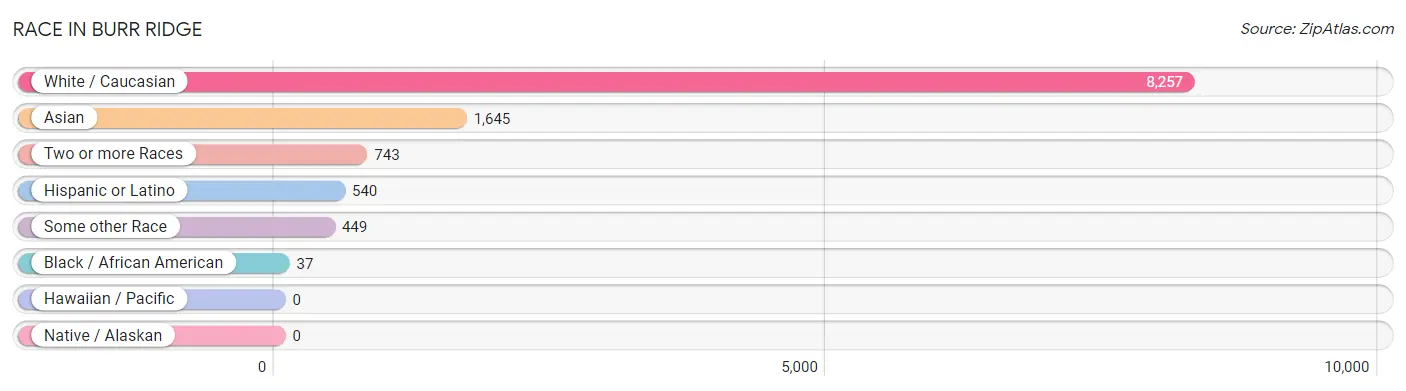
| Race | # Population | % Population |
| Asian | 1,645 | 14.8% |
| Black / African American | 37 | 0.3% |
| Hawaiian / Pacific | 0 | 0.0% |
| Hispanic or Latino | 540 | 4.9% |
| Native / Alaskan | 0 | 0.0% |
| White / Caucasian | 8,257 | 74.2% |
| Two or more Races | 743 | 6.7% |
| Some other Race | 449 | 4.0% |
| Total | 11,131 | 100.0% |
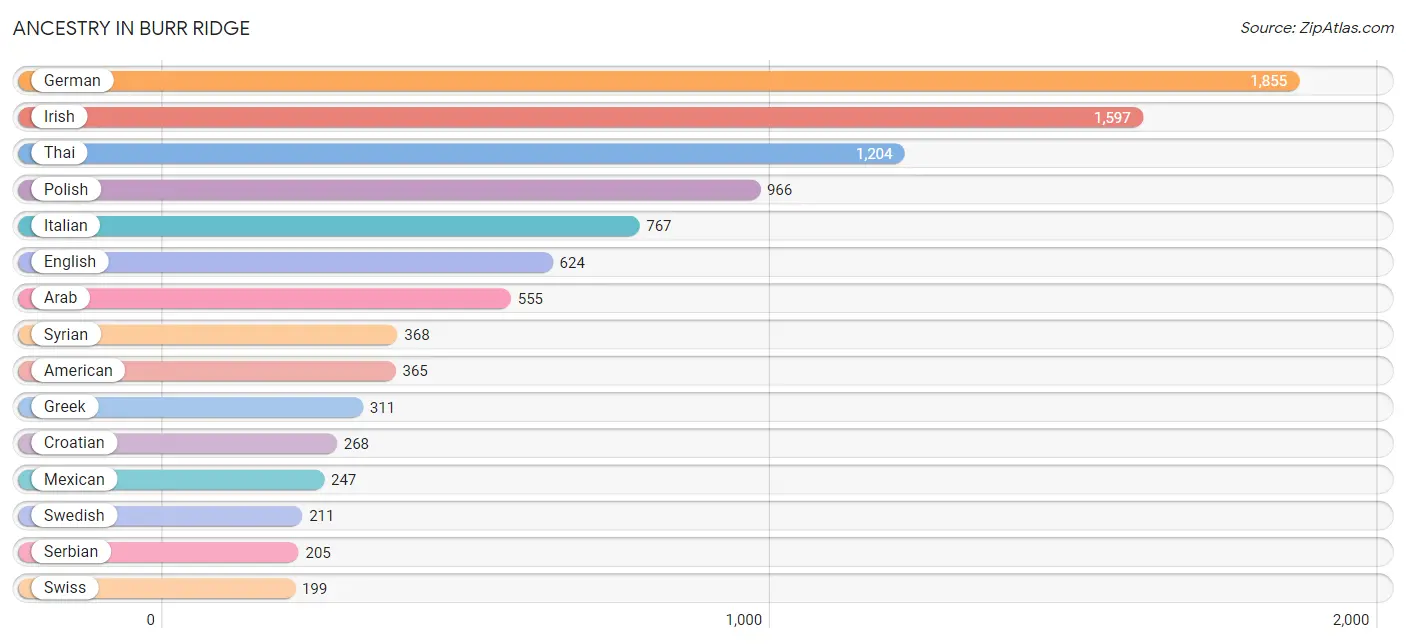
Ancestry in Burr Ridge
The most populous ancestries reported in Burr Ridge are German (1,855 | 16.7%), Irish (1,597 | 14.3%), Thai (1,204 | 10.8%), Polish (966 | 8.7%), and Italian (767 | 6.9%), together accounting for 57.4% of all Burr Ridge residents.
| Ancestry | # Population | % Population |
| African | 7 | 0.1% |
| Albanian | 157 | 1.4% |
| American | 365 | 3.3% |
| Arab | 555 | 5.0% |
| Argentinean | 6 | 0.1% |
| Australian | 16 | 0.1% |
| Austrian | 129 | 1.2% |
| Belgian | 15 | 0.1% |
| Bhutanese | 40 | 0.4% |
| Brazilian | 14 | 0.1% |
| British | 18 | 0.2% |
| Burmese | 34 | 0.3% |
| Canadian | 35 | 0.3% |
| Central American | 8 | 0.1% |
| Cherokee | 107 | 1.0% |
| Colombian | 143 | 1.3% |
| Croatian | 268 | 2.4% |
| Cuban | 21 | 0.2% |
| Czech | 197 | 1.8% |
| Czechoslovakian | 157 | 1.4% |
| Danish | 81 | 0.7% |
| Dutch | 122 | 1.1% |
| Eastern European | 135 | 1.2% |
| Egyptian | 119 | 1.1% |
| English | 624 | 5.6% |
| European | 82 | 0.7% |
| Filipino | 8 | 0.1% |
| French | 148 | 1.3% |
| German | 1,855 | 16.7% |
| Greek | 311 | 2.8% |
| Guatemalan | 8 | 0.1% |
| Hungarian | 80 | 0.7% |
| Indian (Asian) | 46 | 0.4% |
| Iranian | 159 | 1.4% |
| Irish | 1,597 | 14.3% |
| Italian | 767 | 6.9% |
| Korean | 189 | 1.7% |
| Lithuanian | 112 | 1.0% |
| Mexican | 247 | 2.2% |
| Northern European | 40 | 0.4% |
| Norwegian | 126 | 1.1% |
| Pakistani | 29 | 0.3% |
| Palestinian | 22 | 0.2% |
| Polish | 966 | 8.7% |
| Portuguese | 34 | 0.3% |
| Puerto Rican | 37 | 0.3% |
| Romanian | 82 | 0.7% |
| Russian | 75 | 0.7% |
| Scandinavian | 16 | 0.1% |
| Scotch-Irish | 25 | 0.2% |
| Scottish | 132 | 1.2% |
| Serbian | 205 | 1.8% |
| Slovak | 108 | 1.0% |
| Slovene | 32 | 0.3% |
| South American | 149 | 1.3% |
| Spaniard | 52 | 0.5% |
| Spanish | 26 | 0.2% |
| Sri Lankan | 87 | 0.8% |
| Subsaharan African | 7 | 0.1% |
| Swedish | 211 | 1.9% |
| Swiss | 199 | 1.8% |
| Syrian | 368 | 3.3% |
| Thai | 1,204 | 10.8% |
| Ukrainian | 22 | 0.2% |
| Welsh | 8 | 0.1% |
| Yugoslavian | 27 | 0.2% | View All 66 Rows |
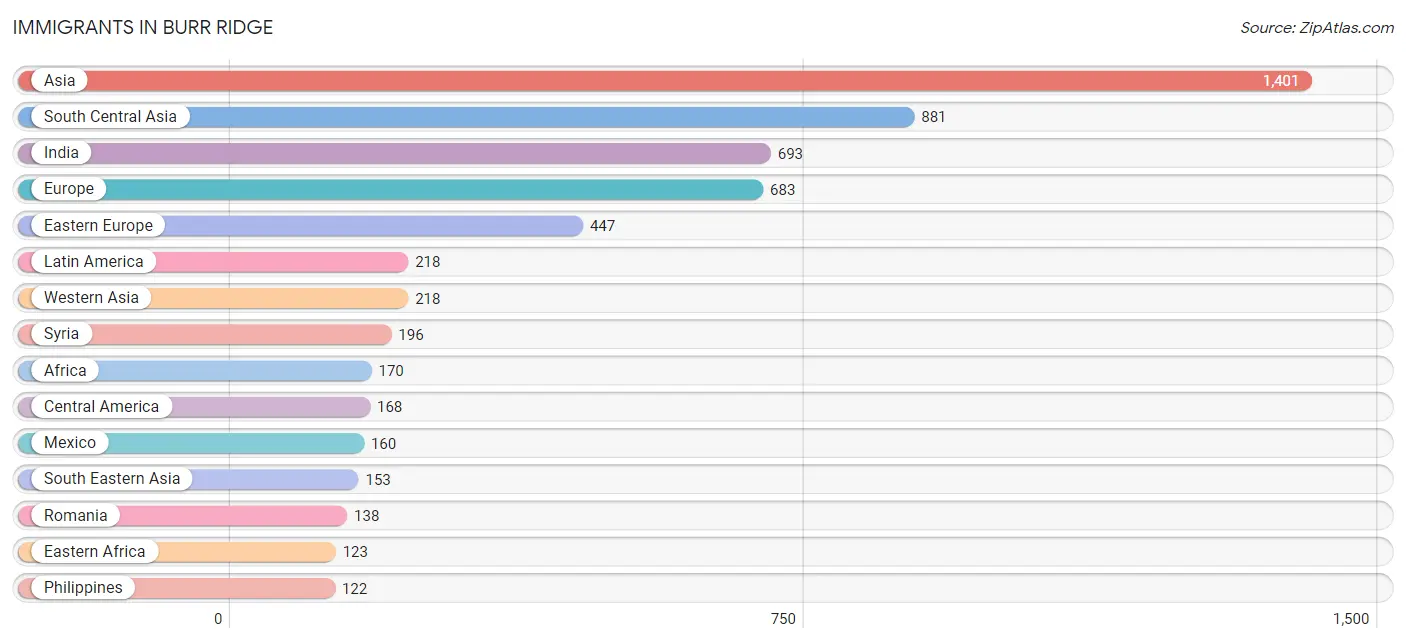
Immigrants in Burr Ridge
The most numerous immigrant groups reported in Burr Ridge came from Asia (1,401 | 12.6%), South Central Asia (881 | 7.9%), India (693 | 6.2%), Europe (683 | 6.1%), and Eastern Europe (447 | 4.0%), together accounting for 36.9% of all Burr Ridge residents.
| Immigration Origin | # Population | % Population |
| Africa | 170 | 1.5% |
| Argentina | 6 | 0.1% |
| Asia | 1,401 | 12.6% |
| Austria | 39 | 0.4% |
| Belgium | 15 | 0.1% |
| Bosnia and Herzegovina | 12 | 0.1% |
| Brazil | 23 | 0.2% |
| Cambodia | 6 | 0.1% |
| Canada | 25 | 0.2% |
| Caribbean | 21 | 0.2% |
| Central America | 168 | 1.5% |
| China | 79 | 0.7% |
| Cuba | 21 | 0.2% |
| Czechoslovakia | 73 | 0.7% |
| Eastern Africa | 123 | 1.1% |
| Eastern Asia | 102 | 0.9% |
| Eastern Europe | 447 | 4.0% |
| Egypt | 40 | 0.4% |
| England | 44 | 0.4% |
| Europe | 683 | 6.1% |
| France | 6 | 0.1% |
| Germany | 56 | 0.5% |
| Ghana | 7 | 0.1% |
| Greece | 51 | 0.5% |
| Guatemala | 8 | 0.1% |
| India | 693 | 6.2% |
| Iran | 92 | 0.8% |
| Ireland | 6 | 0.1% |
| Japan | 2 | 0.0% |
| Kenya | 46 | 0.4% |
| Korea | 21 | 0.2% |
| Latin America | 218 | 2.0% |
| Mexico | 160 | 1.4% |
| Northern Africa | 40 | 0.4% |
| Northern Europe | 50 | 0.4% |
| Pakistan | 96 | 0.9% |
| Philippines | 122 | 1.1% |
| Poland | 1 | 0.0% |
| Portugal | 19 | 0.2% |
| Romania | 138 | 1.2% |
| Russia | 19 | 0.2% |
| Saudi Arabia | 22 | 0.2% |
| Serbia | 25 | 0.2% |
| South America | 29 | 0.3% |
| South Central Asia | 881 | 7.9% |
| South Eastern Asia | 153 | 1.4% |
| Southern Europe | 70 | 0.6% |
| Syria | 196 | 1.8% |
| Taiwan | 8 | 0.1% |
| Uganda | 32 | 0.3% |
| Ukraine | 22 | 0.2% |
| Vietnam | 12 | 0.1% |
| Western Africa | 7 | 0.1% |
| Western Asia | 218 | 2.0% |
| Western Europe | 116 | 1.0% | View All 55 Rows |
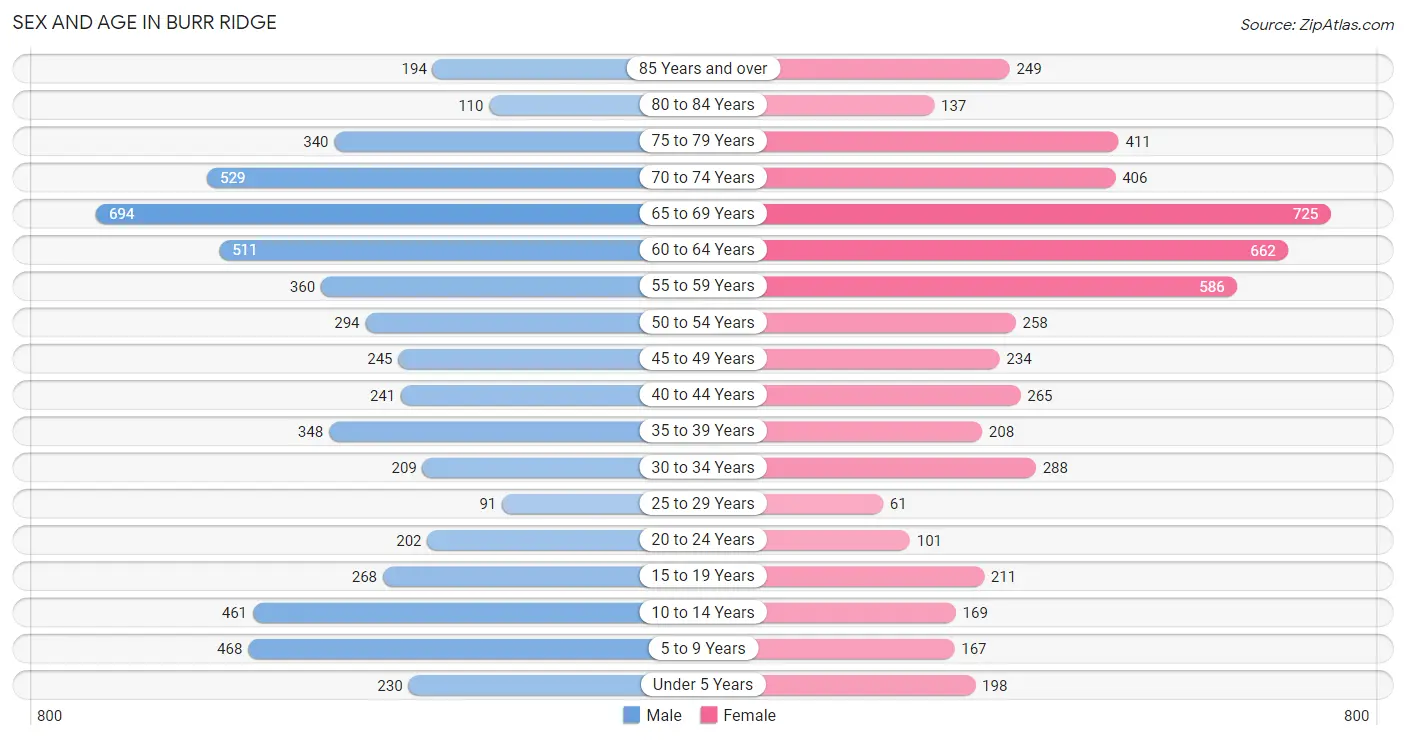
Sex and Age in Burr Ridge
Sex and Age in Burr Ridge
The most populous age groups in Burr Ridge are 65 to 69 Years (694 | 12.0%) for men and 65 to 69 Years (725 | 13.6%) for women.
| Age Bracket | Male | Female |
| Under 5 Years | 230 (4.0%) | 198 (3.7%) |
| 5 to 9 Years | 468 (8.1%) | 167 (3.1%) |
| 10 to 14 Years | 461 (8.0%) | 169 (3.2%) |
| 15 to 19 Years | 268 (4.6%) | 211 (4.0%) |
| 20 to 24 Years | 202 (3.5%) | 101 (1.9%) |
| 25 to 29 Years | 91 (1.6%) | 61 (1.1%) |
| 30 to 34 Years | 209 (3.6%) | 288 (5.4%) |
| 35 to 39 Years | 348 (6.0%) | 208 (3.9%) |
| 40 to 44 Years | 241 (4.2%) | 265 (5.0%) |
| 45 to 49 Years | 245 (4.2%) | 234 (4.4%) |
| 50 to 54 Years | 294 (5.1%) | 258 (4.8%) |
| 55 to 59 Years | 360 (6.2%) | 586 (11.0%) |
| 60 to 64 Years | 511 (8.8%) | 662 (12.4%) |
| 65 to 69 Years | 694 (12.0%) | 725 (13.6%) |
| 70 to 74 Years | 529 (9.1%) | 406 (7.6%) |
| 75 to 79 Years | 340 (5.9%) | 411 (7.7%) |
| 80 to 84 Years | 110 (1.9%) | 137 (2.6%) |
| 85 Years and over | 194 (3.4%) | 249 (4.7%) |
| Total | 5,795 (100.0%) | 5,336 (100.0%) |
Families and Households in Burr Ridge
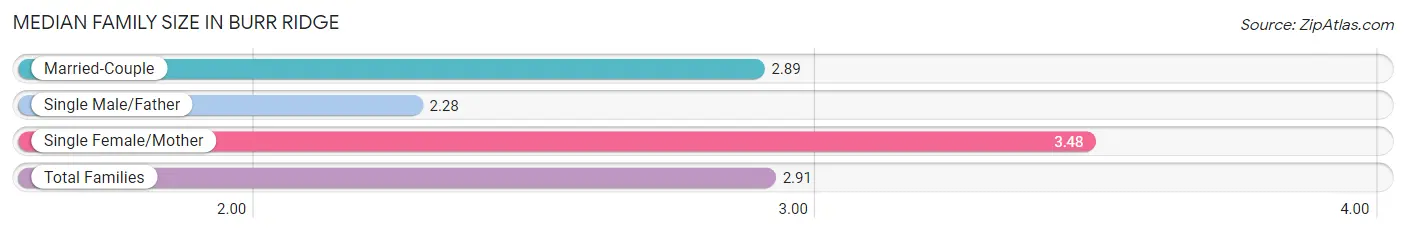
Median Family Size in Burr Ridge
The median family size in Burr Ridge is 2.91 persons per family, with single female/mother families (206 | 6.2%) accounting for the largest median family size of 3.48 persons per family. On the other hand, single male/father families (82 | 2.5%) represent the smallest median family size with 2.28 persons per family.
| Family Type | # Families | Family Size |
| Married-Couple | 3,038 (91.3%) | 2.89 |
| Single Male/Father | 82 (2.5%) | 2.28 |
| Single Female/Mother | 206 (6.2%) | 3.48 |
| Total Families | 3,326 (100.0%) | 2.91 |
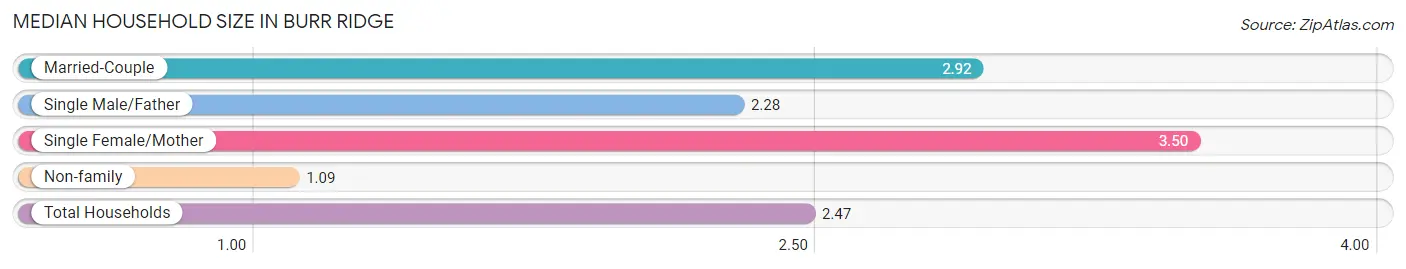
Median Household Size in Burr Ridge
The median household size in Burr Ridge is 2.47 persons per household, with single female/mother households (206 | 4.6%) accounting for the largest median household size of 3.5 persons per household. non-family households (1,134 | 25.4%) represent the smallest median household size with 1.09 persons per household.
| Household Type | # Households | Household Size |
| Married-Couple | 3,038 (68.1%) | 2.92 |
| Single Male/Father | 82 (1.8%) | 2.28 |
| Single Female/Mother | 206 (4.6%) | 3.50 |
| Non-family | 1,134 (25.4%) | 1.09 |
| Total Households | 4,460 (100.0%) | 2.47 |
Household Size by Marriage Status in Burr Ridge
Out of a total of 4,460 households in Burr Ridge, 3,326 (74.6%) are family households, while 1,134 (25.4%) are nonfamily households. The most numerous type of family households are 2-person households, comprising 1,896, and the most common type of nonfamily households are 1-person households, comprising 1,029.
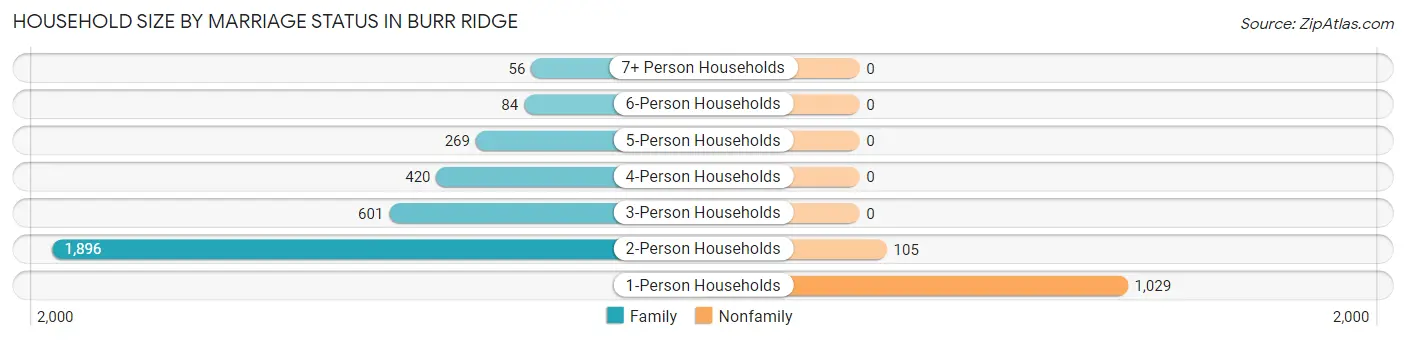
| Household Size | Family Households | Nonfamily Households |
| 1-Person Households | - | 1,029 (23.1%) |
| 2-Person Households | 1,896 (42.5%) | 105 (2.4%) |
| 3-Person Households | 601 (13.5%) | 0 (0.0%) |
| 4-Person Households | 420 (9.4%) | 0 (0.0%) |
| 5-Person Households | 269 (6.0%) | 0 (0.0%) |
| 6-Person Households | 84 (1.9%) | 0 (0.0%) |
| 7+ Person Households | 56 (1.3%) | 0 (0.0%) |
| Total | 3,326 (74.6%) | 1,134 (25.4%) |
Female Fertility in Burr Ridge
Fertility by Age in Burr Ridge
Average fertility rate in Burr Ridge is 172.0 births per 1,000 women. Women in the age bracket of 20 to 34 years have the highest fertility rate with 260.0 births per 1,000 women. Women in the age bracket of 35 to 50 years acount for 50.4% of all women with births.
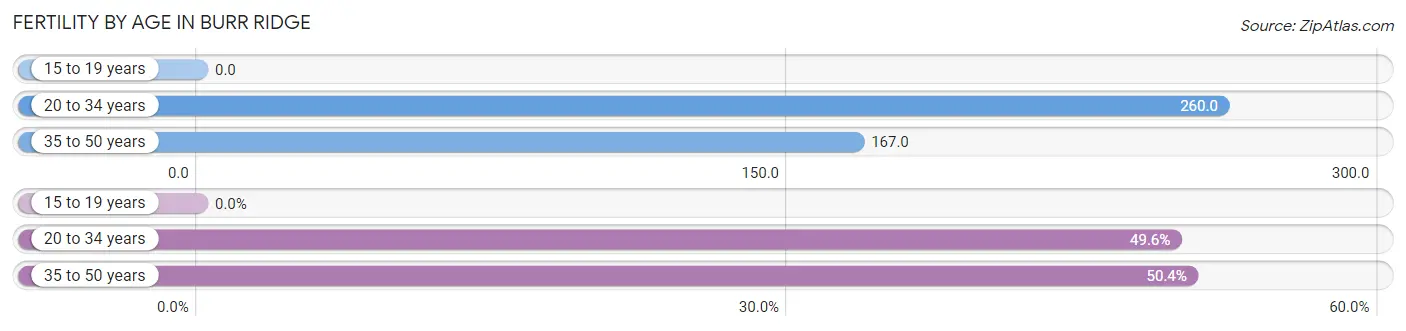
| Age Bracket | Women with Births | Births / 1,000 Women |
| 15 to 19 years | 0 (0.0%) | 0.0 |
| 20 to 34 years | 117 (49.6%) | 260.0 |
| 35 to 50 years | 119 (50.4%) | 167.0 |
| Total | 236 (100.0%) | 172.0 |
Fertility by Age by Marriage Status in Burr Ridge
93.6% of women with births (236) in Burr Ridge are married. The highest percentage of unmarried women with births falls into 35 to 50 years age bracket with 12.6% of them unmarried at the time of birth, while the lowest percentage of unmarried women with births belong to 20 to 34 years age bracket with 0.0% of them unmarried.
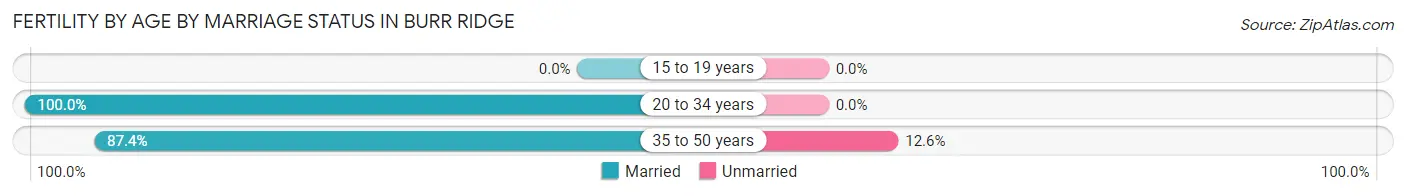
| Age Bracket | Married | Unmarried |
| 15 to 19 years | 0 (0.0%) | 0 (0.0%) |
| 20 to 34 years | 117 (100.0%) | 0 (0.0%) |
| 35 to 50 years | 104 (87.4%) | 15 (12.6%) |
| Total | 221 (93.6%) | 15 (6.4%) |
Fertility by Education in Burr Ridge
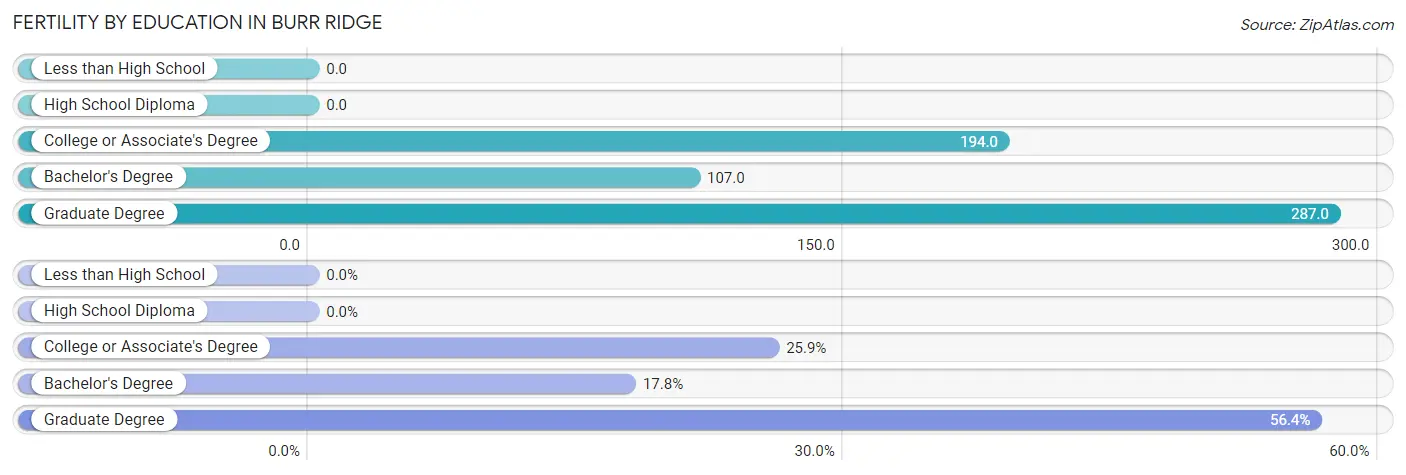
| Educational Attainment | Women with Births | Births / 1,000 Women |
| Less than High School | 0 (0.0%) | 0.0 |
| High School Diploma | 0 (0.0%) | 0.0 |
| College or Associate's Degree | 61 (25.9%) | 194.0 |
| Bachelor's Degree | 42 (17.8%) | 107.0 |
| Graduate Degree | 133 (56.4%) | 287.0 |
| Total | 236 (100.0%) | 172.0 |
Fertility by Education by Marriage Status in Burr Ridge
6.4% of women with births in Burr Ridge are unmarried. Women with the educational attainment of college or associate's degree are most likely to be married with 100.0% of them married at childbirth, while women with the educational attainment of graduate degree are least likely to be married with 11.3% of them unmarried at childbirth.
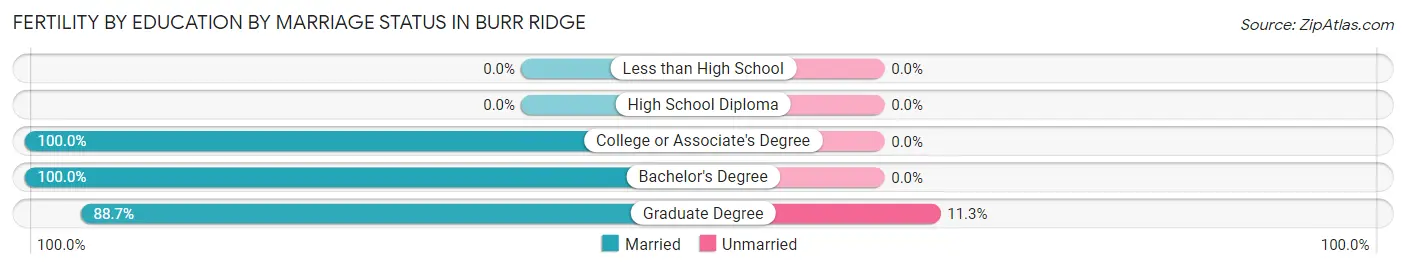
| Educational Attainment | Married | Unmarried |
| Less than High School | 0 (0.0%) | 0 (0.0%) |
| High School Diploma | 0 (0.0%) | 0 (0.0%) |
| College or Associate's Degree | 61 (100.0%) | 0 (0.0%) |
| Bachelor's Degree | 42 (100.0%) | 0 (0.0%) |
| Graduate Degree | 118 (88.7%) | 15 (11.3%) |
| Total | 221 (93.6%) | 15 (6.4%) |
Employment Characteristics in Burr Ridge
Employment by Class of Employer in Burr Ridge
Among the 5,134 employed individuals in Burr Ridge, private company employees (3,269 | 63.7%), self-employed (incorporated) (795 | 15.5%), and self-employed (not incorporated) (407 | 7.9%) make up the most common classes of employment.
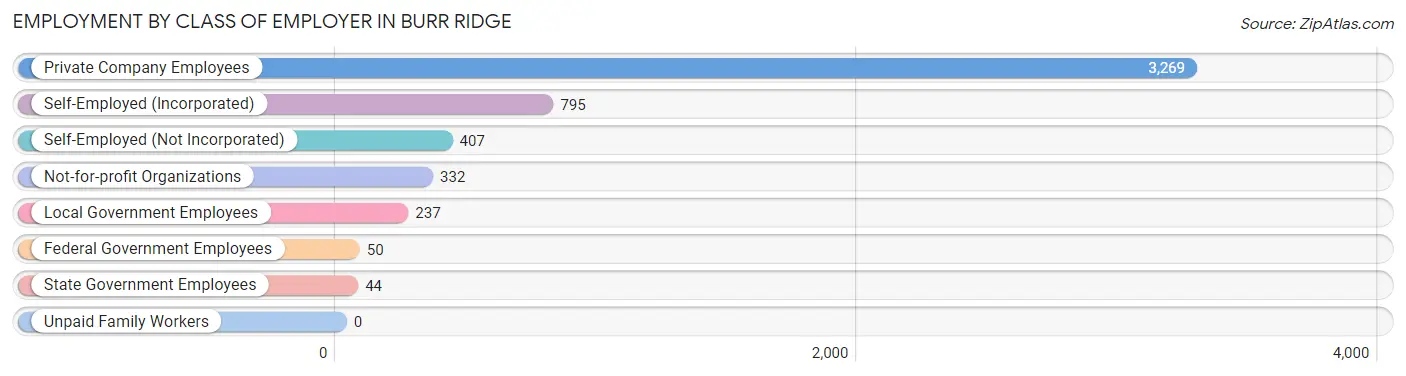
| Employer Class | # Employees | % Employees |
| Private Company Employees | 3,269 | 63.7% |
| Self-Employed (Incorporated) | 795 | 15.5% |
| Self-Employed (Not Incorporated) | 407 | 7.9% |
| Not-for-profit Organizations | 332 | 6.5% |
| Local Government Employees | 237 | 4.6% |
| State Government Employees | 44 | 0.9% |
| Federal Government Employees | 50 | 1.0% |
| Unpaid Family Workers | 0 | 0.0% |
| Total | 5,134 | 100.0% |
Employment Status by Age in Burr Ridge
According to the labor force statistics for Burr Ridge, out of the total population over 16 years of age (9,319), 58.0% or 5,405 individuals are in the labor force, with 3.4% or 184 of them unemployed. The age group with the highest labor force participation rate is 45 to 54 years, with 89.1% or 919 individuals in the labor force. Within the labor force, the 16 to 19 years age range has the highest percentage of unemployed individuals, with 33.7% or 34 of them being unemployed.
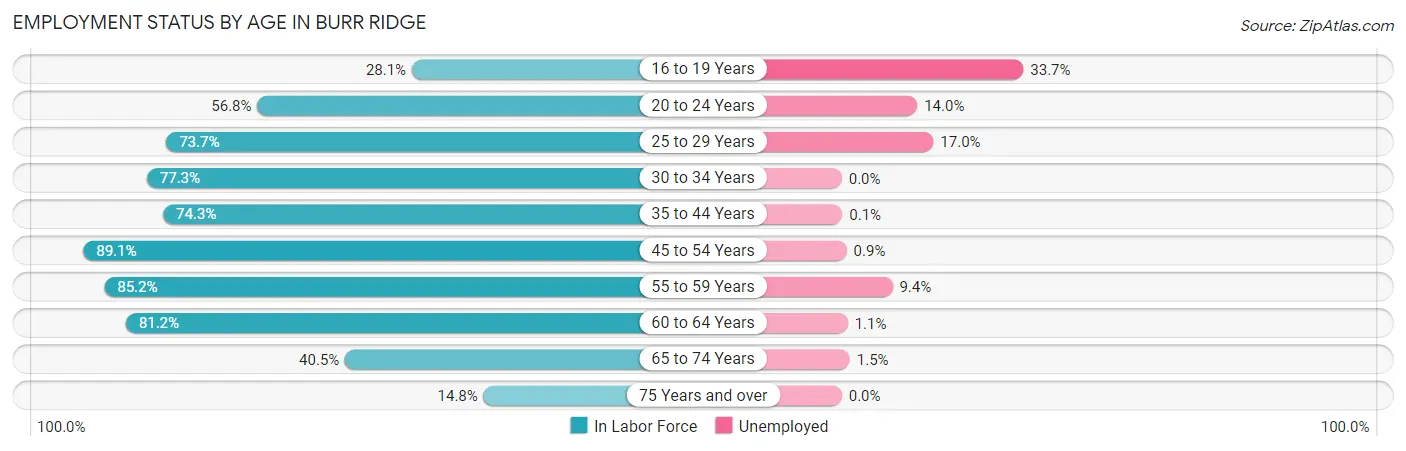
| Age Bracket | In Labor Force | Unemployed |
| 16 to 19 Years | 101 (28.1%) | 34 (33.7%) |
| 20 to 24 Years | 172 (56.8%) | 24 (14.0%) |
| 25 to 29 Years | 112 (73.7%) | 19 (17.0%) |
| 30 to 34 Years | 384 (77.3%) | 0 (0.0%) |
| 35 to 44 Years | 789 (74.3%) | 1 (0.1%) |
| 45 to 54 Years | 919 (89.1%) | 8 (0.9%) |
| 55 to 59 Years | 806 (85.2%) | 76 (9.4%) |
| 60 to 64 Years | 952 (81.2%) | 10 (1.1%) |
| 65 to 74 Years | 953 (40.5%) | 14 (1.5%) |
| 75 Years and over | 213 (14.8%) | 0 (0.0%) |
| Total | 5,405 (58.0%) | 184 (3.4%) |
Employment Status by Educational Attainment in Burr Ridge
According to labor force statistics for Burr Ridge, 81.5% of individuals (3,962) out of the total population between 25 and 64 years of age (4,861) are in the labor force, with 2.9% or 115 of them being unemployed. The group with the highest labor force participation rate are those with the educational attainment of bachelor's degree or higher, with 84.6% or 3,105 individuals in the labor force. Within the labor force, individuals with less than high school education have the highest percentage of unemployment, with 25.0% or 4 of them being unemployed.
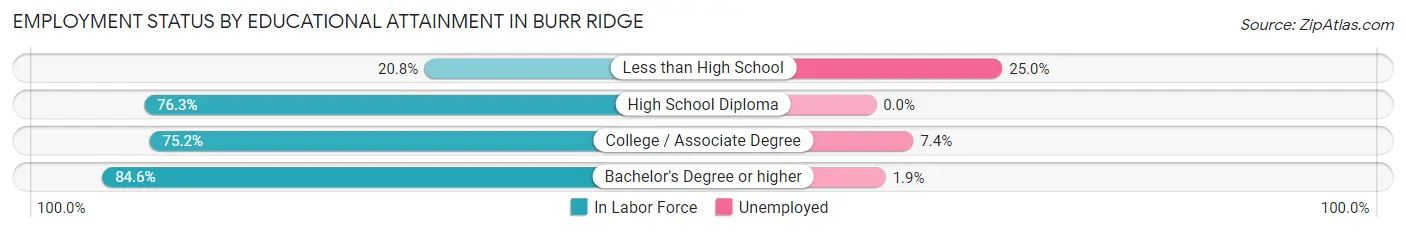
| Educational Attainment | In Labor Force | Unemployed |
| Less than High School | 16 (20.8%) | 19 (25.0%) |
| High School Diploma | 135 (76.3%) | 0 (0.0%) |
| College / Associate Degree | 705 (75.2%) | 69 (7.4%) |
| Bachelor's Degree or higher | 3,105 (84.6%) | 70 (1.9%) |
| Total | 3,962 (81.5%) | 141 (2.9%) |
Employment Occupations by Sex in Burr Ridge
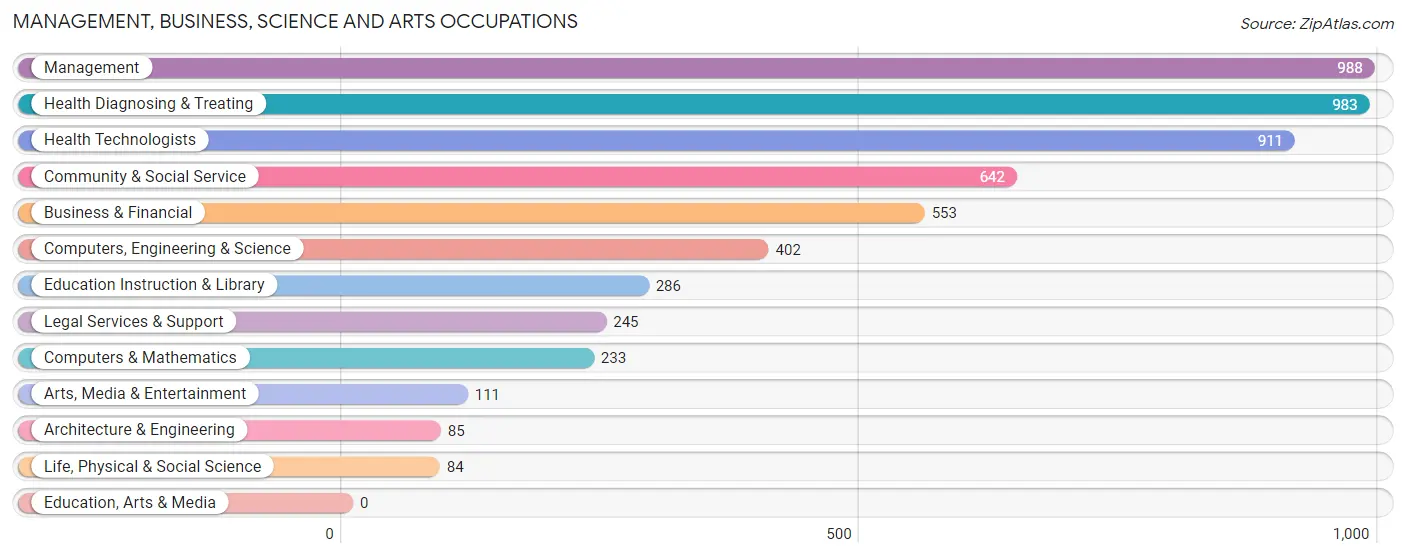
Management, Business, Science and Arts Occupations
The most common Management, Business, Science and Arts occupations in Burr Ridge are Management (988 | 19.0%), Health Diagnosing & Treating (983 | 18.9%), Health Technologists (911 | 17.5%), Community & Social Service (642 | 12.3%), and Business & Financial (553 | 10.6%).
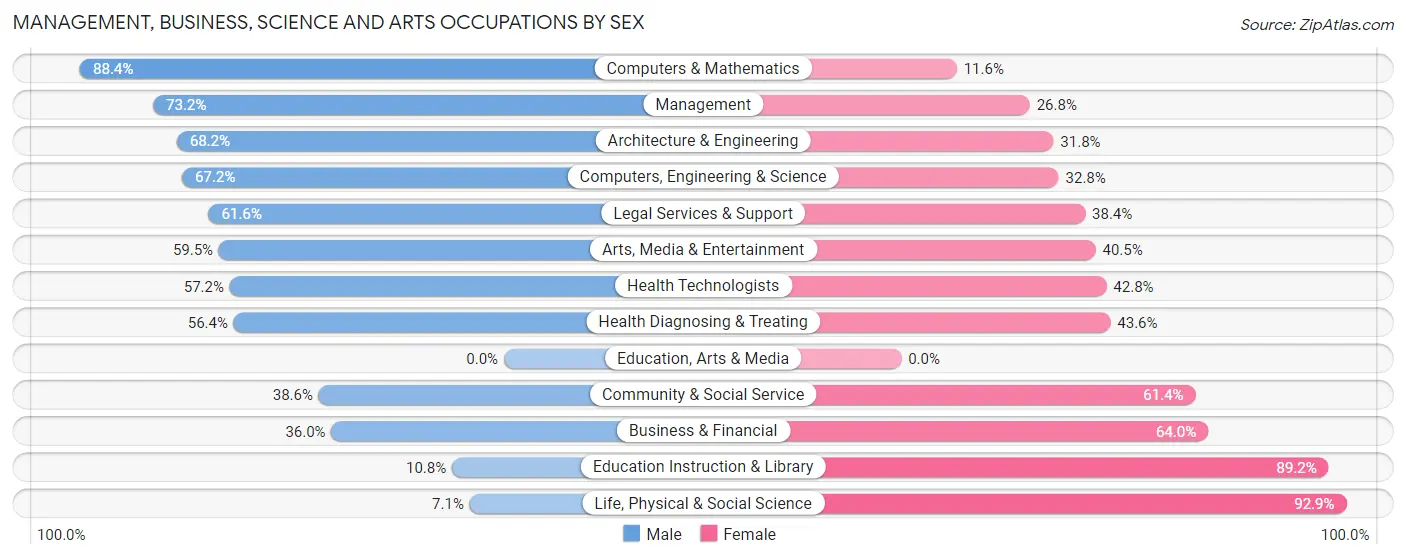
Management, Business, Science and Arts Occupations by Sex
Within the Management, Business, Science and Arts occupations in Burr Ridge, the most male-oriented occupations are Computers & Mathematics (88.4%), Management (73.2%), and Architecture & Engineering (68.2%), while the most female-oriented occupations are Life, Physical & Social Science (92.9%), Education Instruction & Library (89.2%), and Business & Financial (64.0%).
| Occupation | Male | Female |
| Management | 723 (73.2%) | 265 (26.8%) |
| Business & Financial | 199 (36.0%) | 354 (64.0%) |
| Computers, Engineering & Science | 270 (67.2%) | 132 (32.8%) |
| Computers & Mathematics | 206 (88.4%) | 27 (11.6%) |
| Architecture & Engineering | 58 (68.2%) | 27 (31.8%) |
| Life, Physical & Social Science | 6 (7.1%) | 78 (92.9%) |
| Community & Social Service | 248 (38.6%) | 394 (61.4%) |
| Education, Arts & Media | 0 (0.0%) | 0 (0.0%) |
| Legal Services & Support | 151 (61.6%) | 94 (38.4%) |
| Education Instruction & Library | 31 (10.8%) | 255 (89.2%) |
| Arts, Media & Entertainment | 66 (59.5%) | 45 (40.5%) |
| Health Diagnosing & Treating | 554 (56.4%) | 429 (43.6%) |
| Health Technologists | 521 (57.2%) | 390 (42.8%) |
| Total (Category) | 1,994 (55.9%) | 1,574 (44.1%) |
| Total (Overall) | 2,896 (55.5%) | 2,319 (44.5%) |
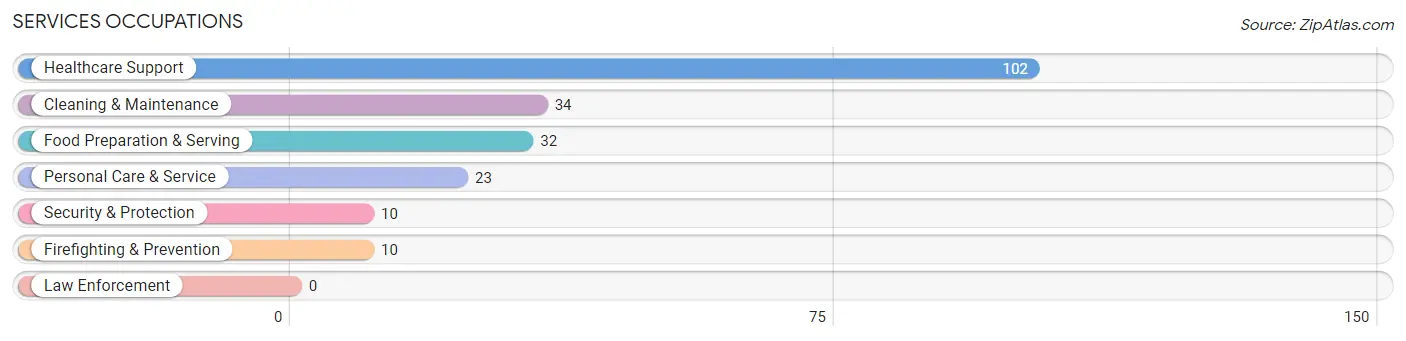
Services Occupations
The most common Services occupations in Burr Ridge are Healthcare Support (102 | 2.0%), Cleaning & Maintenance (34 | 0.6%), Food Preparation & Serving (32 | 0.6%), Personal Care & Service (23 | 0.4%), and Security & Protection (10 | 0.2%).
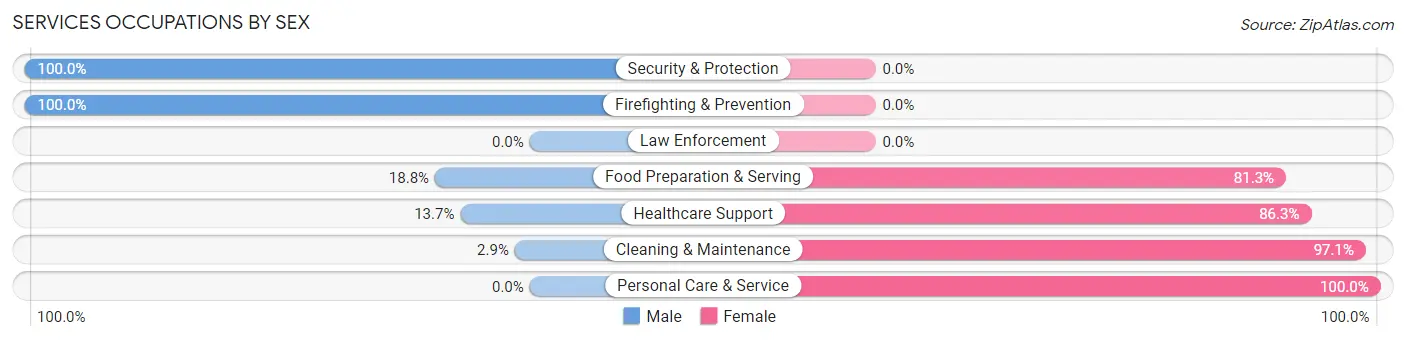
Services Occupations by Sex
Within the Services occupations in Burr Ridge, the most male-oriented occupations are Security & Protection (100.0%), Firefighting & Prevention (100.0%), and Food Preparation & Serving (18.8%), while the most female-oriented occupations are Personal Care & Service (100.0%), Cleaning & Maintenance (97.1%), and Healthcare Support (86.3%).
| Occupation | Male | Female |
| Healthcare Support | 14 (13.7%) | 88 (86.3%) |
| Security & Protection | 10 (100.0%) | 0 (0.0%) |
| Firefighting & Prevention | 10 (100.0%) | 0 (0.0%) |
| Law Enforcement | 0 (0.0%) | 0 (0.0%) |
| Food Preparation & Serving | 6 (18.8%) | 26 (81.2%) |
| Cleaning & Maintenance | 1 (2.9%) | 33 (97.1%) |
| Personal Care & Service | 0 (0.0%) | 23 (100.0%) |
| Total (Category) | 31 (15.4%) | 170 (84.6%) |
| Total (Overall) | 2,896 (55.5%) | 2,319 (44.5%) |
Sales and Office Occupations
The most common Sales and Office occupations in Burr Ridge are Sales & Related (595 | 11.4%), and Office & Administration (327 | 6.3%).
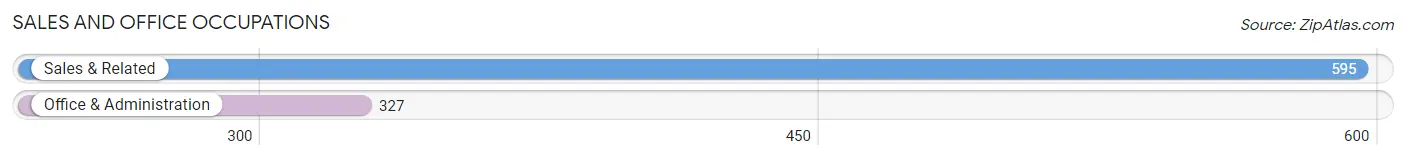
Sales and Office Occupations by Sex

| Occupation | Male | Female |
| Sales & Related | 339 (57.0%) | 256 (43.0%) |
| Office & Administration | 58 (17.7%) | 269 (82.3%) |
| Total (Category) | 397 (43.1%) | 525 (56.9%) |
| Total (Overall) | 2,896 (55.5%) | 2,319 (44.5%) |
Natural Resources, Construction and Maintenance Occupations
The most common Natural Resources, Construction and Maintenance occupations in Burr Ridge are Construction & Extraction (93 | 1.8%), and Installation, Maintenance & Repair (50 | 1.0%).
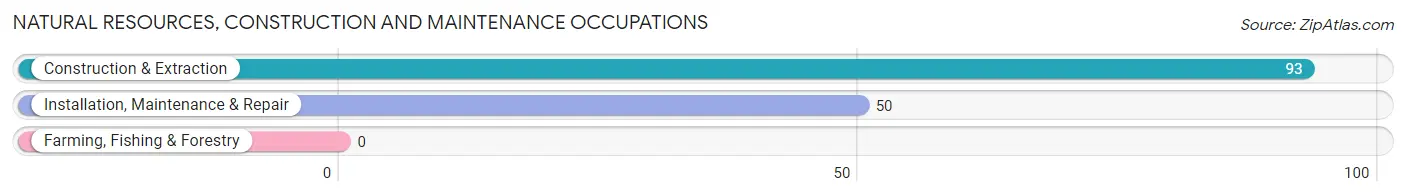
Natural Resources, Construction and Maintenance Occupations by Sex
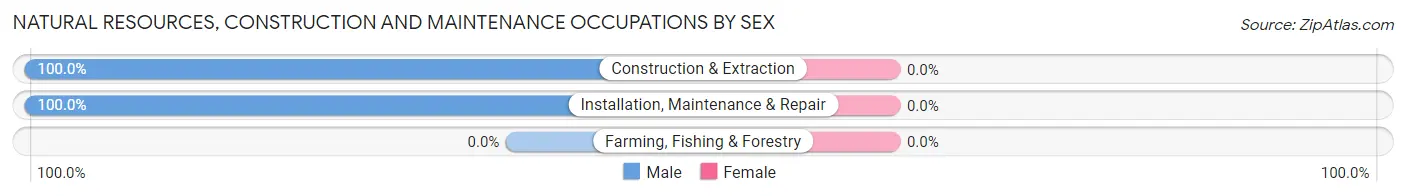
| Occupation | Male | Female |
| Farming, Fishing & Forestry | 0 (0.0%) | 0 (0.0%) |
| Construction & Extraction | 93 (100.0%) | 0 (0.0%) |
| Installation, Maintenance & Repair | 50 (100.0%) | 0 (0.0%) |
| Total (Category) | 143 (100.0%) | 0 (0.0%) |
| Total (Overall) | 2,896 (55.5%) | 2,319 (44.5%) |
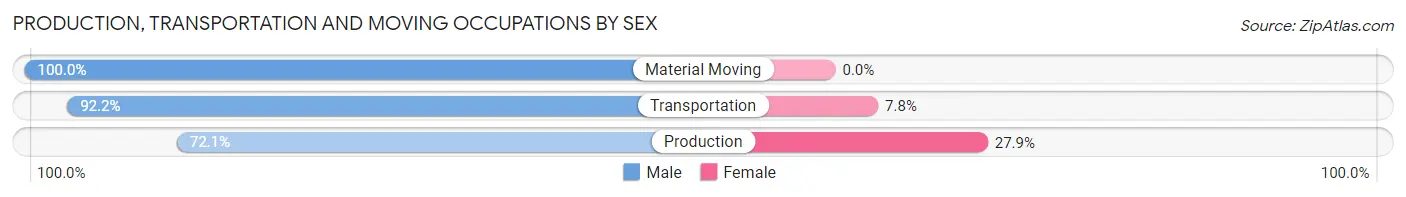
Production, Transportation and Moving Occupations
The most common Production, Transportation and Moving occupations in Burr Ridge are Transportation (243 | 4.7%), Production (111 | 2.1%), and Material Moving (27 | 0.5%).
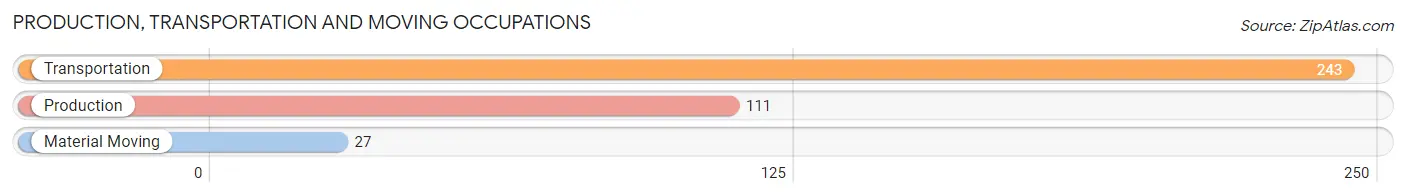
Production, Transportation and Moving Occupations by Sex
| Occupation | Male | Female |
| Production | 80 (72.1%) | 31 (27.9%) |
| Transportation | 224 (92.2%) | 19 (7.8%) |
| Material Moving | 27 (100.0%) | 0 (0.0%) |
| Total (Category) | 331 (86.9%) | 50 (13.1%) |
| Total (Overall) | 2,896 (55.5%) | 2,319 (44.5%) |
Employment Industries by Sex in Burr Ridge
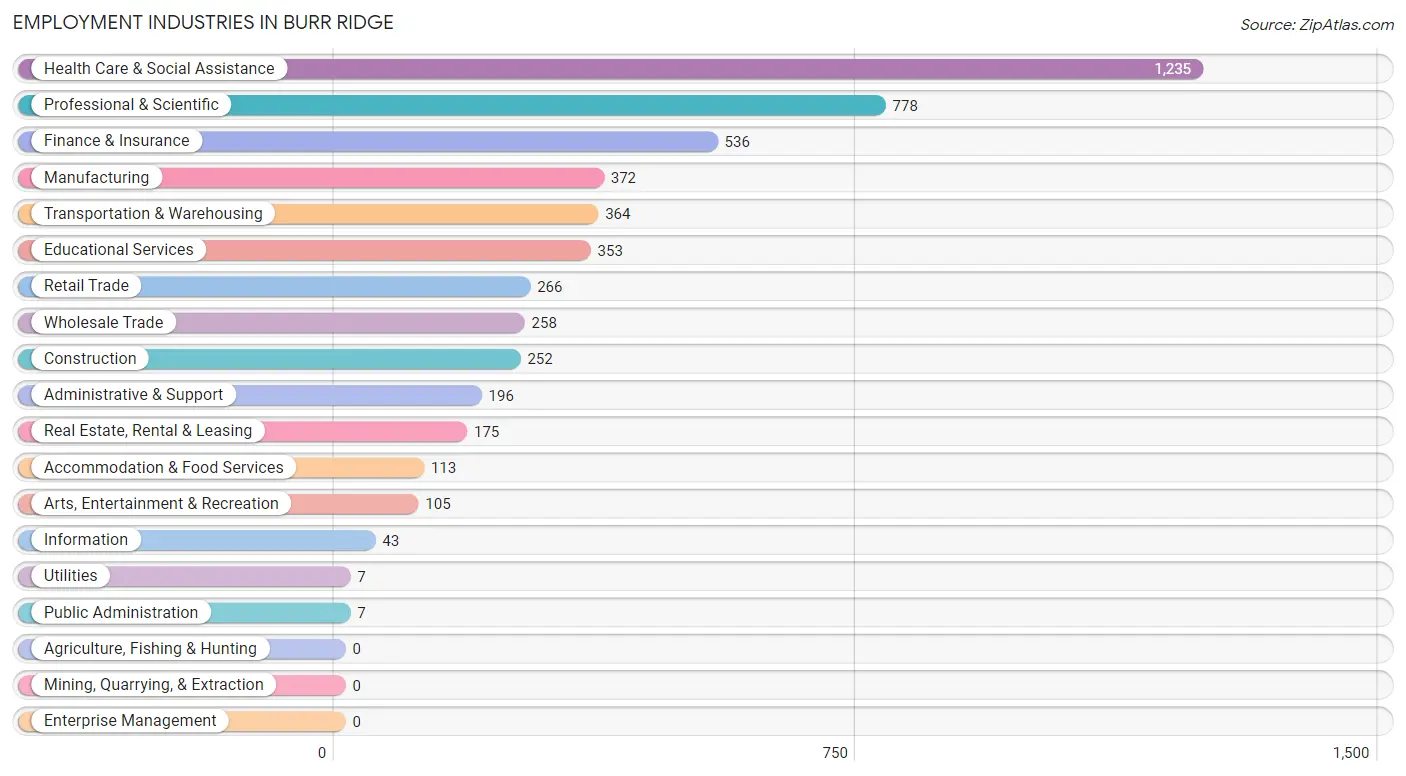
Employment Industries in Burr Ridge
The major employment industries in Burr Ridge include Health Care & Social Assistance (1,235 | 23.7%), Professional & Scientific (778 | 14.9%), Finance & Insurance (536 | 10.3%), Manufacturing (372 | 7.1%), and Transportation & Warehousing (364 | 7.0%).
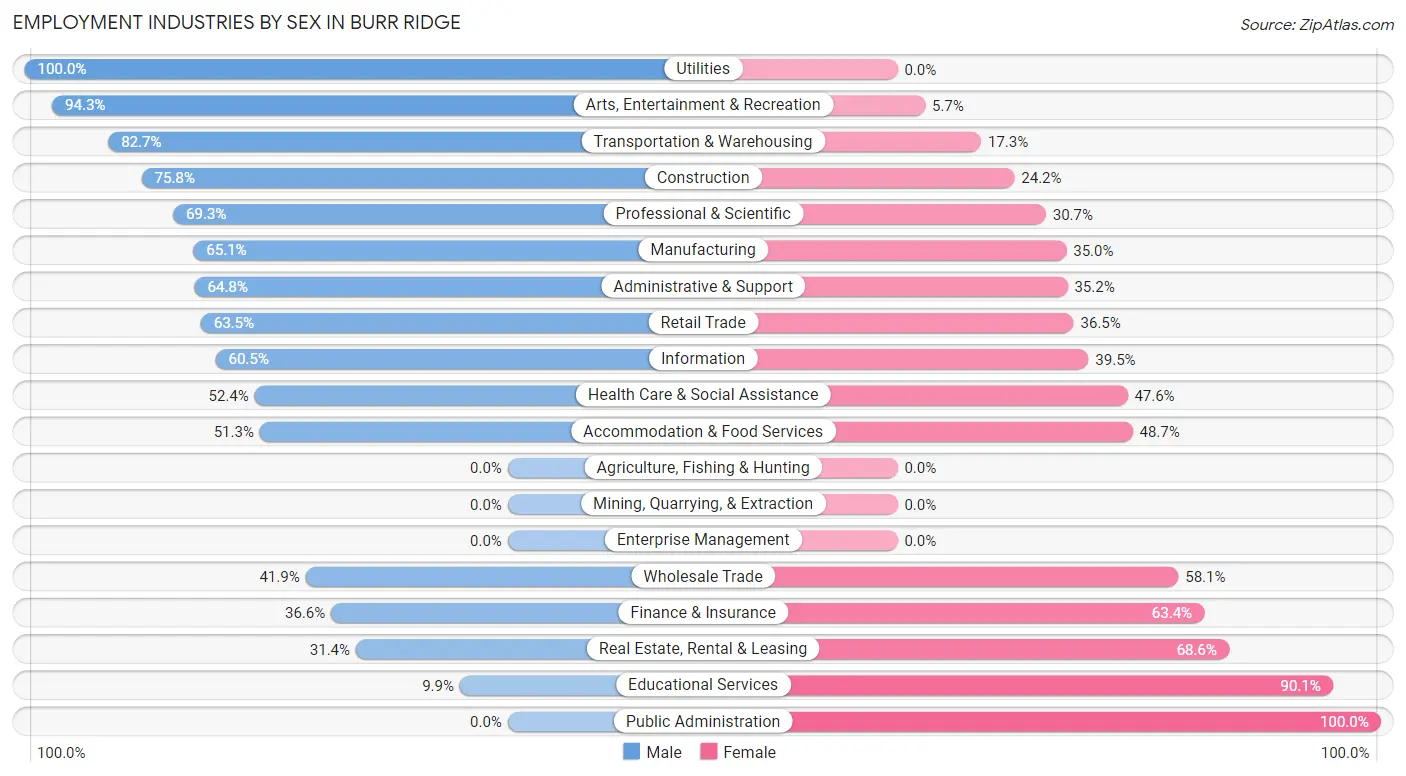
Employment Industries by Sex in Burr Ridge
The Burr Ridge industries that see more men than women are Utilities (100.0%), Arts, Entertainment & Recreation (94.3%), and Transportation & Warehousing (82.7%), whereas the industries that tend to have a higher number of women are Public Administration (100.0%), Educational Services (90.1%), and Real Estate, Rental & Leasing (68.6%).
| Industry | Male | Female |
| Agriculture, Fishing & Hunting | 0 (0.0%) | 0 (0.0%) |
| Mining, Quarrying, & Extraction | 0 (0.0%) | 0 (0.0%) |
| Construction | 191 (75.8%) | 61 (24.2%) |
| Manufacturing | 242 (65.0%) | 130 (34.9%) |
| Wholesale Trade | 108 (41.9%) | 150 (58.1%) |
| Retail Trade | 169 (63.5%) | 97 (36.5%) |
| Transportation & Warehousing | 301 (82.7%) | 63 (17.3%) |
| Utilities | 7 (100.0%) | 0 (0.0%) |
| Information | 26 (60.5%) | 17 (39.5%) |
| Finance & Insurance | 196 (36.6%) | 340 (63.4%) |
| Real Estate, Rental & Leasing | 55 (31.4%) | 120 (68.6%) |
| Professional & Scientific | 539 (69.3%) | 239 (30.7%) |
| Enterprise Management | 0 (0.0%) | 0 (0.0%) |
| Administrative & Support | 127 (64.8%) | 69 (35.2%) |
| Educational Services | 35 (9.9%) | 318 (90.1%) |
| Health Care & Social Assistance | 647 (52.4%) | 588 (47.6%) |
| Arts, Entertainment & Recreation | 99 (94.3%) | 6 (5.7%) |
| Accommodation & Food Services | 58 (51.3%) | 55 (48.7%) |
| Public Administration | 0 (0.0%) | 7 (100.0%) |
| Total | 2,896 (55.5%) | 2,319 (44.5%) |
Education in Burr Ridge
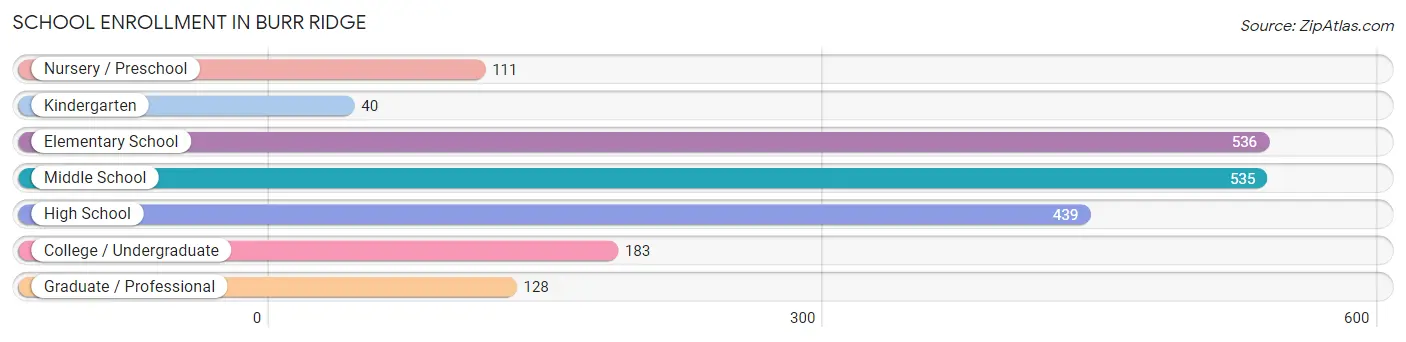
School Enrollment in Burr Ridge
The most common levels of schooling among the 1,972 students in Burr Ridge are elementary school (536 | 27.2%), middle school (535 | 27.1%), and high school (439 | 22.3%).
| School Level | # Students | % Students |
| Nursery / Preschool | 111 | 5.6% |
| Kindergarten | 40 | 2.0% |
| Elementary School | 536 | 27.2% |
| Middle School | 535 | 27.1% |
| High School | 439 | 22.3% |
| College / Undergraduate | 183 | 9.3% |
| Graduate / Professional | 128 | 6.5% |
| Total | 1,972 | 100.0% |
School Enrollment by Age by Funding Source in Burr Ridge
Out of a total of 1,972 students who are enrolled in schools in Burr Ridge, 507 (25.7%) attend a private institution, while the remaining 1,465 (74.3%) are enrolled in public schools. The age group of 35 years and over has the highest likelihood of being enrolled in private schools, with 37 (77.1% in the age bracket) enrolled. Conversely, the age group of 10 to 14 year olds has the lowest likelihood of being enrolled in a private school, with 611 (97.0% in the age bracket) attending a public institution.
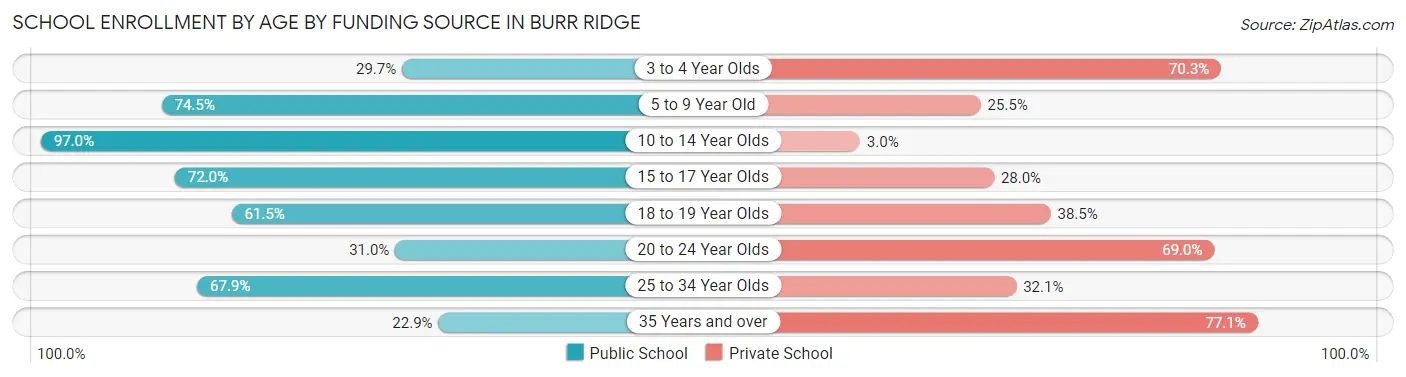
| Age Bracket | Public School | Private School |
| 3 to 4 Year Olds | 19 (29.7%) | 45 (70.3%) |
| 5 to 9 Year Old | 432 (74.5%) | 148 (25.5%) |
| 10 to 14 Year Olds | 611 (97.0%) | 19 (3.0%) |
| 15 to 17 Year Olds | 247 (72.0%) | 96 (28.0%) |
| 18 to 19 Year Olds | 59 (61.5%) | 37 (38.5%) |
| 20 to 24 Year Olds | 48 (31.0%) | 107 (69.0%) |
| 25 to 34 Year Olds | 38 (67.9%) | 18 (32.1%) |
| 35 Years and over | 11 (22.9%) | 37 (77.1%) |
| Total | 1,465 (74.3%) | 507 (25.7%) |
Educational Attainment by Field of Study in Burr Ridge
Business (1,537 | 22.9%), science & technology (1,016 | 15.1%), bio, nature & agricultural (818 | 12.2%), education (581 | 8.6%), and engineering (409 | 6.1%) are the most common fields of study among 6,723 individuals in Burr Ridge who have obtained a bachelor's degree or higher.
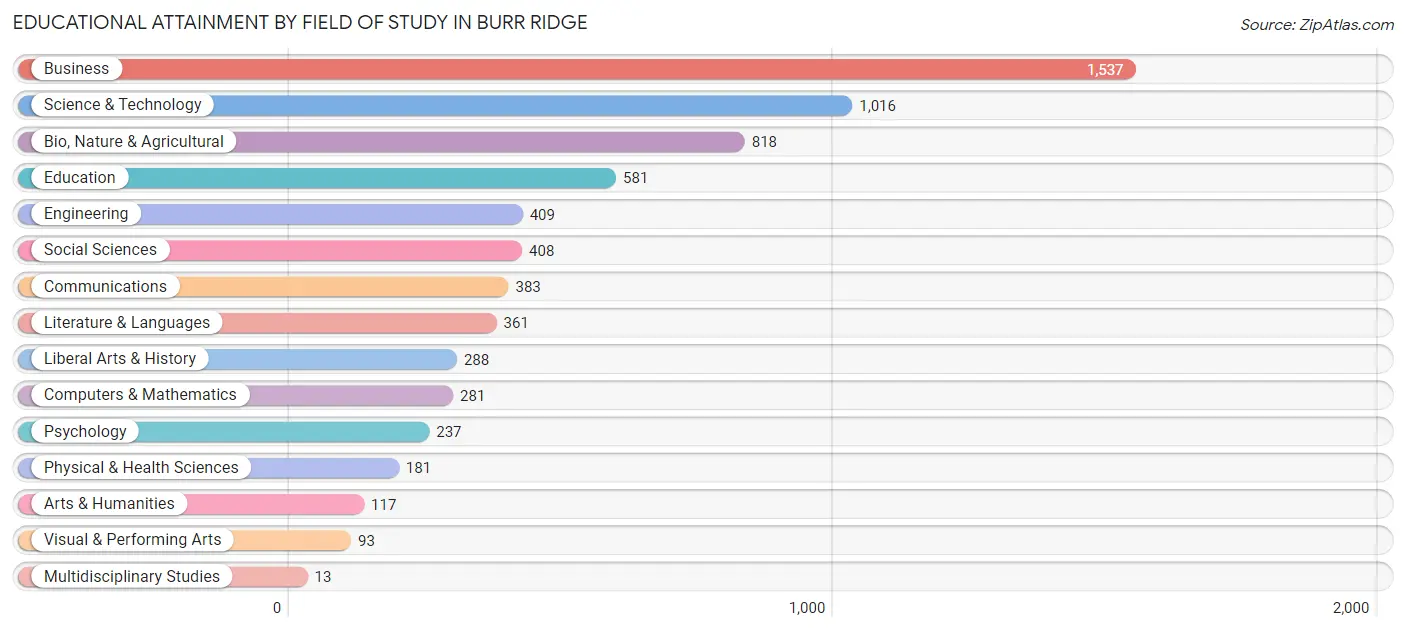
| Field of Study | # Graduates | % Graduates |
| Computers & Mathematics | 281 | 4.2% |
| Bio, Nature & Agricultural | 818 | 12.2% |
| Physical & Health Sciences | 181 | 2.7% |
| Psychology | 237 | 3.5% |
| Social Sciences | 408 | 6.1% |
| Engineering | 409 | 6.1% |
| Multidisciplinary Studies | 13 | 0.2% |
| Science & Technology | 1,016 | 15.1% |
| Business | 1,537 | 22.9% |
| Education | 581 | 8.6% |
| Literature & Languages | 361 | 5.4% |
| Liberal Arts & History | 288 | 4.3% |
| Visual & Performing Arts | 93 | 1.4% |
| Communications | 383 | 5.7% |
| Arts & Humanities | 117 | 1.7% |
| Total | 6,723 | 100.0% |
Transportation & Commute in Burr Ridge
Vehicle Availability by Sex in Burr Ridge
The most prevalent vehicle ownership categories in Burr Ridge are males with 2 vehicles (1,470, accounting for 52.0%) and females with 2 vehicles (907, making up 63.8%).
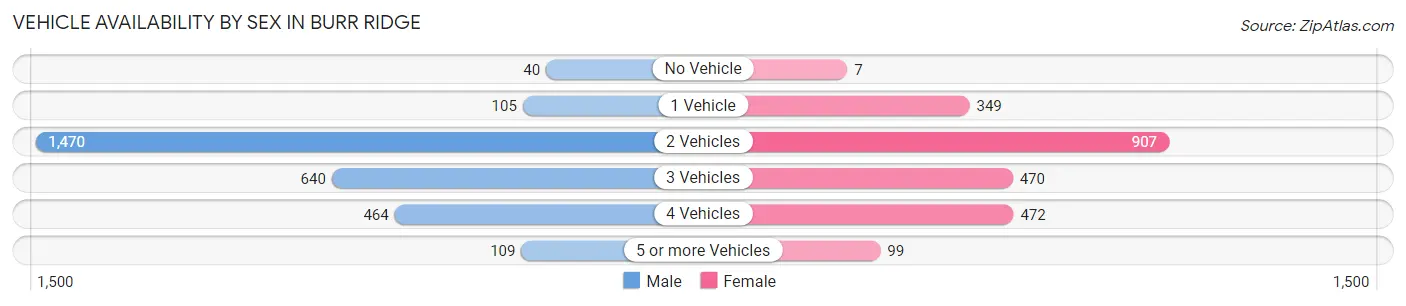
| Vehicles Available | Male | Female |
| No Vehicle | 40 (1.4%) | 7 (0.3%) |
| 1 Vehicle | 105 (3.7%) | 349 (15.1%) |
| 2 Vehicles | 1,470 (52.0%) | 907 (39.4%) |
| 3 Vehicles | 640 (22.6%) | 470 (20.4%) |
| 4 Vehicles | 464 (16.4%) | 472 (20.5%) |
| 5 or more Vehicles | 109 (3.8%) | 99 (4.3%) |
| Total | 2,828 (100.0%) | 2,304 (100.0%) |
Commute Time in Burr Ridge
The most frequently occuring commute durations in Burr Ridge are 30 to 34 minutes (577 commuters, 15.1%), 20 to 24 minutes (518 commuters, 13.6%), and 60 to 89 minutes (498 commuters, 13.0%).
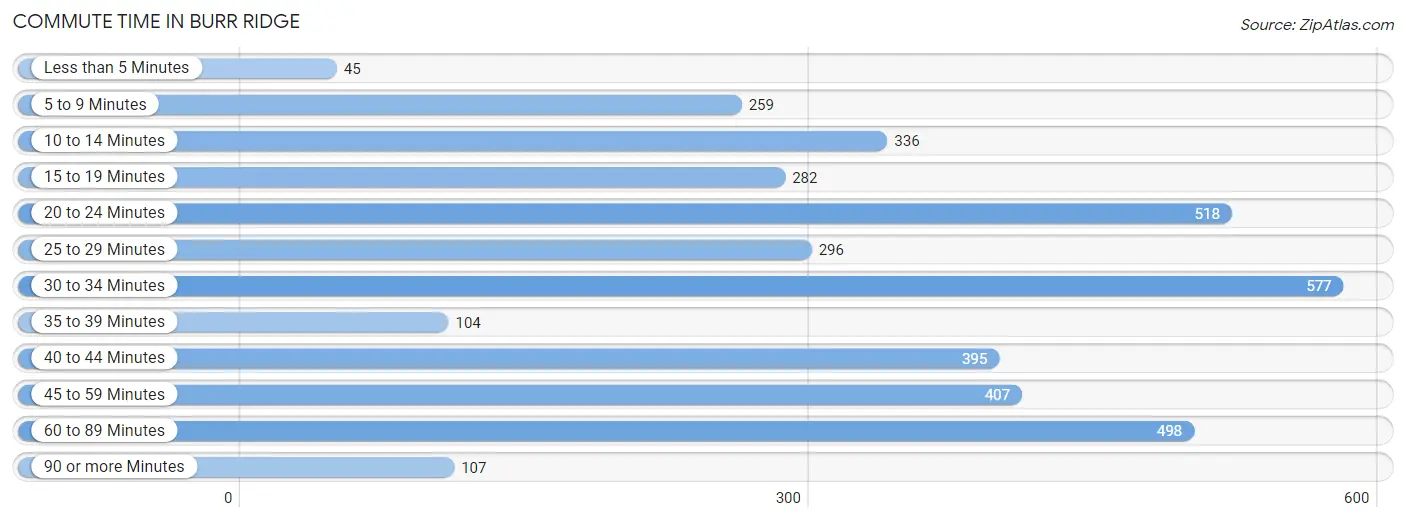
| Commute Time | # Commuters | % Commuters |
| Less than 5 Minutes | 45 | 1.2% |
| 5 to 9 Minutes | 259 | 6.8% |
| 10 to 14 Minutes | 336 | 8.8% |
| 15 to 19 Minutes | 282 | 7.4% |
| 20 to 24 Minutes | 518 | 13.6% |
| 25 to 29 Minutes | 296 | 7.7% |
| 30 to 34 Minutes | 577 | 15.1% |
| 35 to 39 Minutes | 104 | 2.7% |
| 40 to 44 Minutes | 395 | 10.3% |
| 45 to 59 Minutes | 407 | 10.6% |
| 60 to 89 Minutes | 498 | 13.0% |
| 90 or more Minutes | 107 | 2.8% |
Commute Time by Sex in Burr Ridge
The most common commute times in Burr Ridge are 30 to 34 minutes (373 commuters, 18.7%) for males and 60 to 89 minutes (355 commuters, 19.4%) for females.
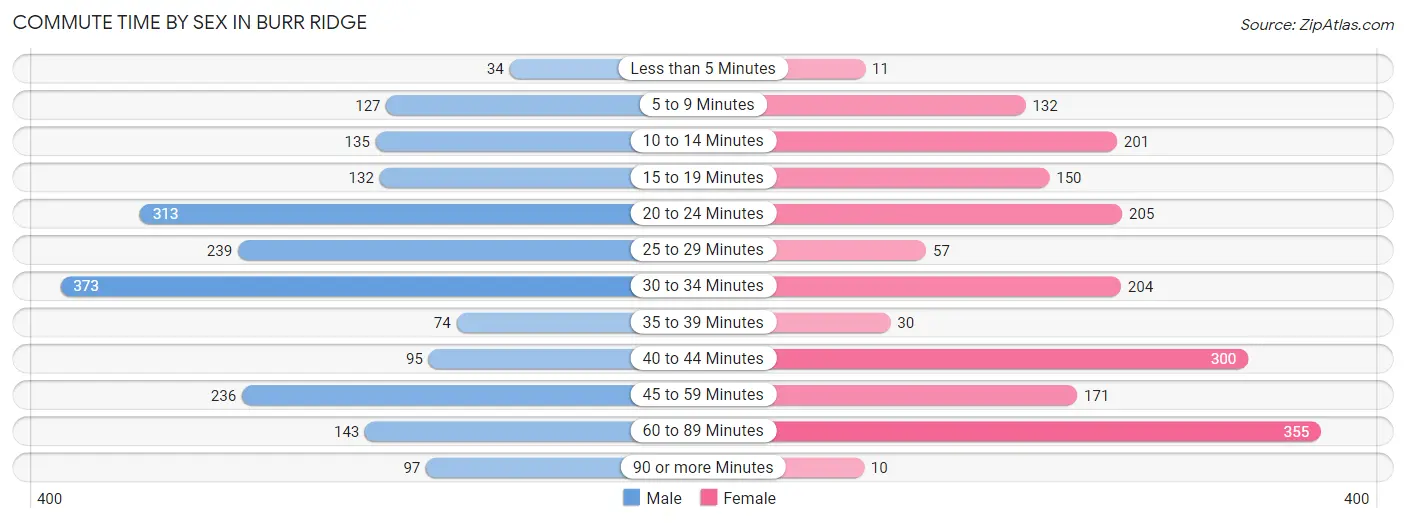
| Commute Time | Male | Female |
| Less than 5 Minutes | 34 (1.7%) | 11 (0.6%) |
| 5 to 9 Minutes | 127 (6.4%) | 132 (7.2%) |
| 10 to 14 Minutes | 135 (6.8%) | 201 (11.0%) |
| 15 to 19 Minutes | 132 (6.6%) | 150 (8.2%) |
| 20 to 24 Minutes | 313 (15.7%) | 205 (11.2%) |
| 25 to 29 Minutes | 239 (12.0%) | 57 (3.1%) |
| 30 to 34 Minutes | 373 (18.7%) | 204 (11.2%) |
| 35 to 39 Minutes | 74 (3.7%) | 30 (1.6%) |
| 40 to 44 Minutes | 95 (4.8%) | 300 (16.4%) |
| 45 to 59 Minutes | 236 (11.8%) | 171 (9.4%) |
| 60 to 89 Minutes | 143 (7.2%) | 355 (19.4%) |
| 90 or more Minutes | 97 (4.9%) | 10 (0.5%) |
Time of Departure to Work by Sex in Burr Ridge
The most frequent times of departure to work in Burr Ridge are 8:00 AM to 8:29 AM (454, 22.7%) for males and 8:00 AM to 8:29 AM (404, 22.1%) for females.

| Time of Departure | Male | Female |
| 12:00 AM to 4:59 AM | 135 (6.8%) | 33 (1.8%) |
| 5:00 AM to 5:29 AM | 24 (1.2%) | 192 (10.5%) |
| 5:30 AM to 5:59 AM | 56 (2.8%) | 50 (2.7%) |
| 6:00 AM to 6:29 AM | 146 (7.3%) | 188 (10.3%) |
| 6:30 AM to 6:59 AM | 318 (15.9%) | 136 (7.4%) |
| 7:00 AM to 7:29 AM | 266 (13.3%) | 171 (9.4%) |
| 7:30 AM to 7:59 AM | 181 (9.1%) | 138 (7.6%) |
| 8:00 AM to 8:29 AM | 454 (22.7%) | 404 (22.1%) |
| 8:30 AM to 8:59 AM | 153 (7.7%) | 108 (5.9%) |
| 9:00 AM to 9:59 AM | 185 (9.3%) | 259 (14.2%) |
| 10:00 AM to 10:59 AM | 0 (0.0%) | 55 (3.0%) |
| 11:00 AM to 11:59 AM | 57 (2.9%) | 32 (1.8%) |
| 12:00 PM to 3:59 PM | 5 (0.3%) | 60 (3.3%) |
| 4:00 PM to 11:59 PM | 18 (0.9%) | 0 (0.0%) |
| Total | 1,998 (100.0%) | 1,826 (100.0%) |
Housing Occupancy in Burr Ridge
Occupancy by Ownership in Burr Ridge
Of the total 4,460 dwellings in Burr Ridge, owner-occupied units account for 4,254 (95.4%), while renter-occupied units make up 206 (4.6%).
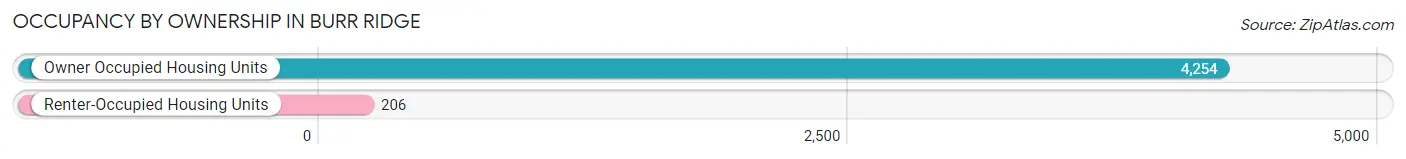
| Occupancy | # Housing Units | % Housing Units |
| Owner Occupied Housing Units | 4,254 | 95.4% |
| Renter-Occupied Housing Units | 206 | 4.6% |
| Total Occupied Housing Units | 4,460 | 100.0% |
Occupancy by Household Size in Burr Ridge
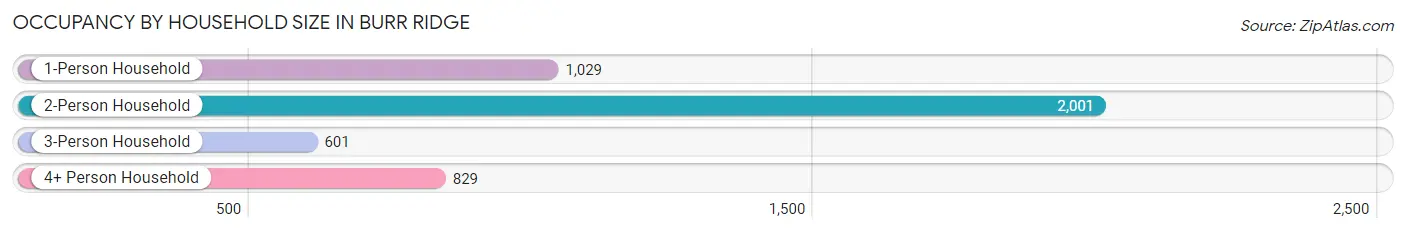
| Household Size | # Housing Units | % Housing Units |
| 1-Person Household | 1,029 | 23.1% |
| 2-Person Household | 2,001 | 44.9% |
| 3-Person Household | 601 | 13.5% |
| 4+ Person Household | 829 | 18.6% |
| Total Housing Units | 4,460 | 100.0% |
Occupancy by Ownership by Household Size in Burr Ridge
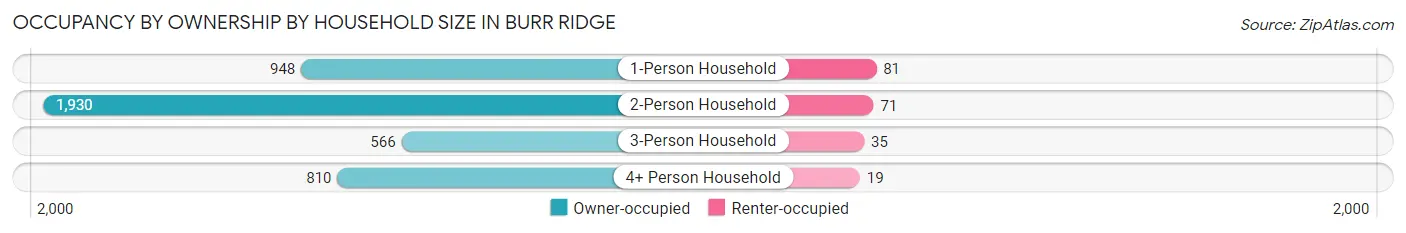
| Household Size | Owner-occupied | Renter-occupied |
| 1-Person Household | 948 (92.1%) | 81 (7.9%) |
| 2-Person Household | 1,930 (96.5%) | 71 (3.5%) |
| 3-Person Household | 566 (94.2%) | 35 (5.8%) |
| 4+ Person Household | 810 (97.7%) | 19 (2.3%) |
| Total Housing Units | 4,254 (95.4%) | 206 (4.6%) |
Occupancy by Educational Attainment in Burr Ridge
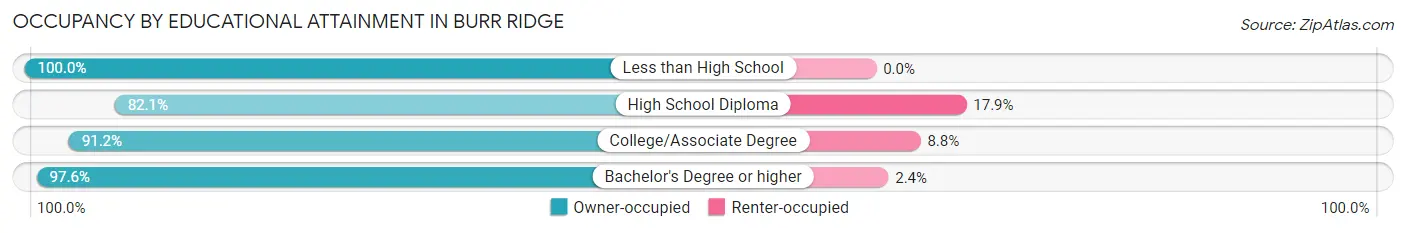
| Household Size | Owner-occupied | Renter-occupied |
| Less than High School | 39 (100.0%) | 0 (0.0%) |
| High School Diploma | 248 (82.1%) | 54 (17.9%) |
| College/Associate Degree | 758 (91.2%) | 73 (8.8%) |
| Bachelor's Degree or higher | 3,209 (97.6%) | 79 (2.4%) |
Occupancy by Age of Householder in Burr Ridge
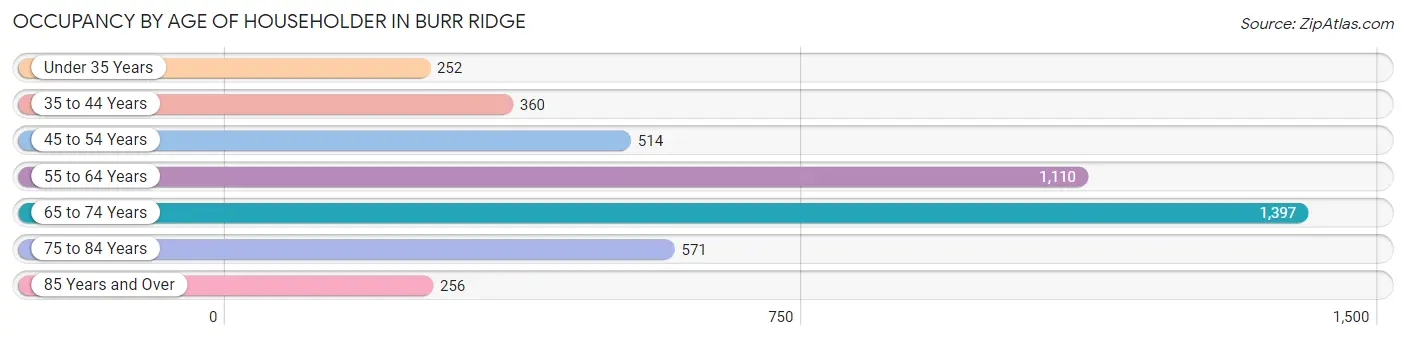
| Age Bracket | # Households | % Households |
| Under 35 Years | 252 | 5.7% |
| 35 to 44 Years | 360 | 8.1% |
| 45 to 54 Years | 514 | 11.5% |
| 55 to 64 Years | 1,110 | 24.9% |
| 65 to 74 Years | 1,397 | 31.3% |
| 75 to 84 Years | 571 | 12.8% |
| 85 Years and Over | 256 | 5.7% |
| Total | 4,460 | 100.0% |
Housing Finances in Burr Ridge
Median Income by Occupancy in Burr Ridge
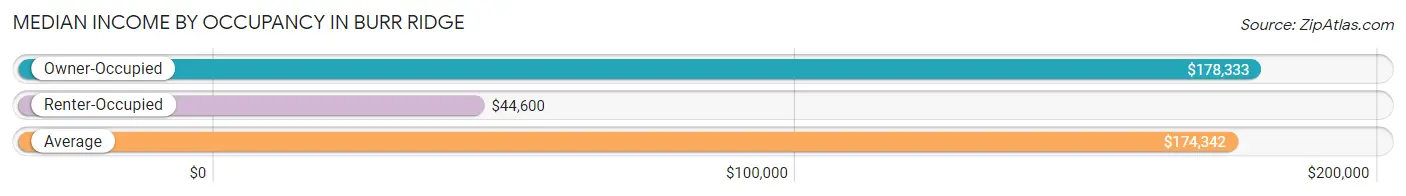
| Occupancy Type | # Households | Median Income |
| Owner-Occupied | 4,254 (95.4%) | $178,333 |
| Renter-Occupied | 206 (4.6%) | $44,600 |
| Average | 4,460 (100.0%) | $174,342 |
Occupancy by Householder Income Bracket in Burr Ridge
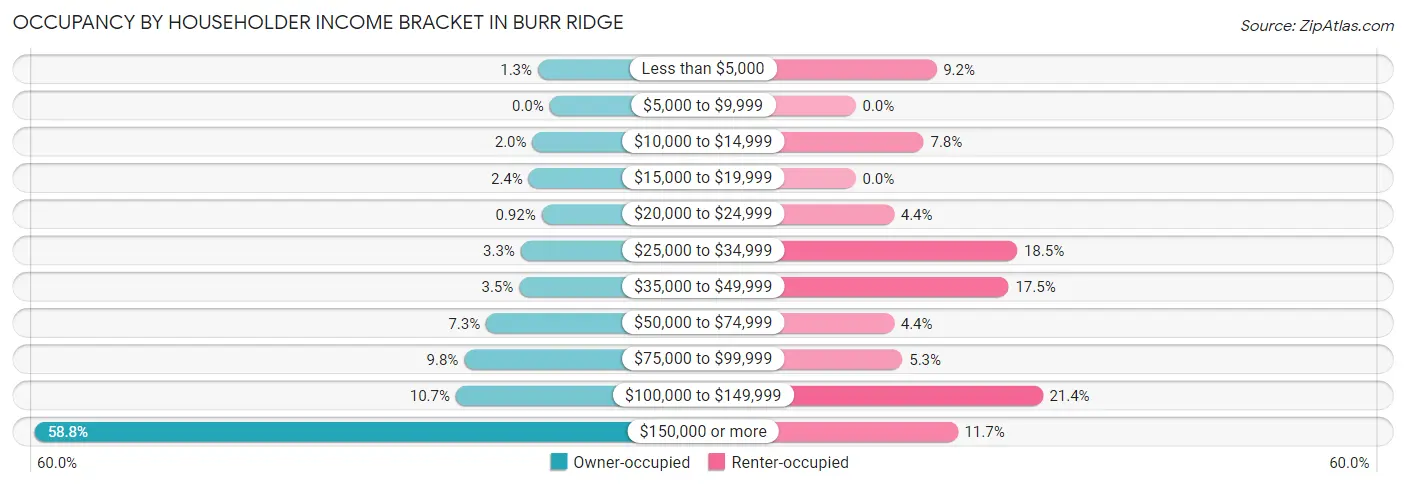
| Income Bracket | Owner-occupied | Renter-occupied |
| Less than $5,000 | 57 (1.3%) | 19 (9.2%) |
| $5,000 to $9,999 | 0 (0.0%) | 0 (0.0%) |
| $10,000 to $14,999 | 84 (2.0%) | 16 (7.8%) |
| $15,000 to $19,999 | 102 (2.4%) | 0 (0.0%) |
| $20,000 to $24,999 | 39 (0.9%) | 9 (4.4%) |
| $25,000 to $34,999 | 141 (3.3%) | 38 (18.4%) |
| $35,000 to $49,999 | 148 (3.5%) | 36 (17.5%) |
| $50,000 to $74,999 | 309 (7.3%) | 9 (4.4%) |
| $75,000 to $99,999 | 415 (9.8%) | 11 (5.3%) |
| $100,000 to $149,999 | 456 (10.7%) | 44 (21.4%) |
| $150,000 or more | 2,503 (58.8%) | 24 (11.7%) |
| Total | 4,254 (100.0%) | 206 (100.0%) |
Monthly Housing Cost Tiers in Burr Ridge
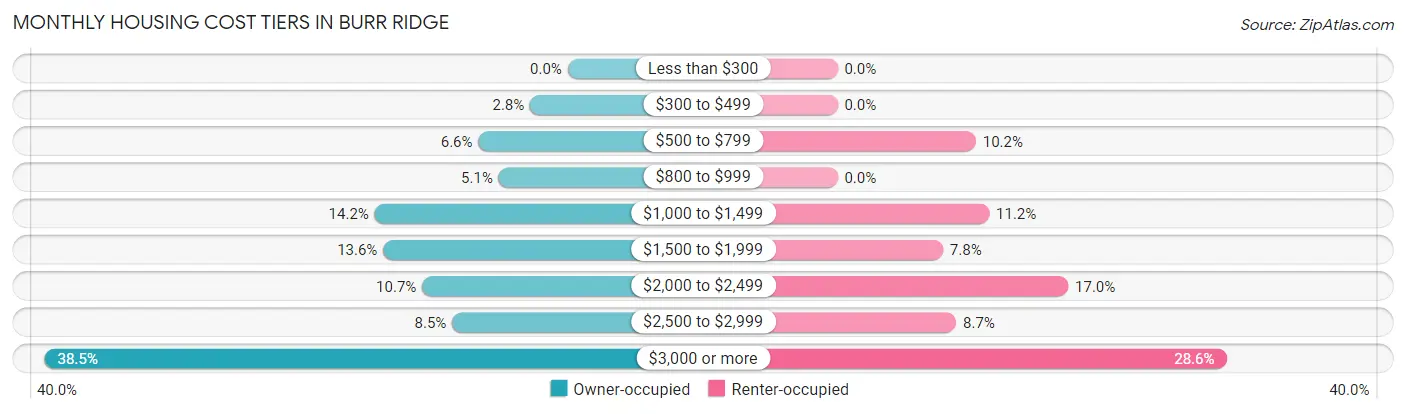
| Monthly Cost | Owner-occupied | Renter-occupied |
| Less than $300 | 0 (0.0%) | 0 (0.0%) |
| $300 to $499 | 118 (2.8%) | 0 (0.0%) |
| $500 to $799 | 280 (6.6%) | 21 (10.2%) |
| $800 to $999 | 216 (5.1%) | 0 (0.0%) |
| $1,000 to $1,499 | 605 (14.2%) | 23 (11.2%) |
| $1,500 to $1,999 | 578 (13.6%) | 16 (7.8%) |
| $2,000 to $2,499 | 456 (10.7%) | 35 (17.0%) |
| $2,500 to $2,999 | 362 (8.5%) | 18 (8.7%) |
| $3,000 or more | 1,639 (38.5%) | 59 (28.6%) |
| Total | 4,254 (100.0%) | 206 (100.0%) |
Physical Housing Characteristics in Burr Ridge
Housing Structures in Burr Ridge
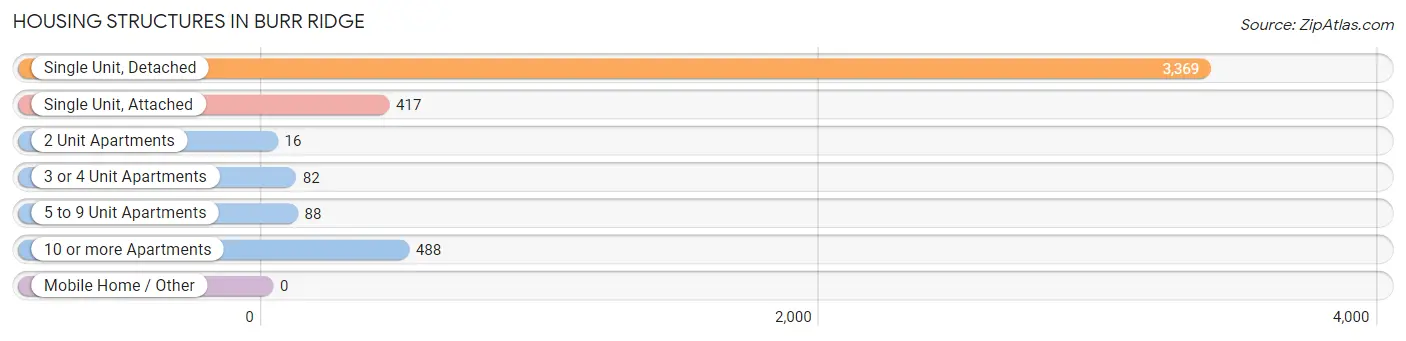
| Structure Type | # Housing Units | % Housing Units |
| Single Unit, Detached | 3,369 | 75.5% |
| Single Unit, Attached | 417 | 9.3% |
| 2 Unit Apartments | 16 | 0.4% |
| 3 or 4 Unit Apartments | 82 | 1.8% |
| 5 to 9 Unit Apartments | 88 | 2.0% |
| 10 or more Apartments | 488 | 10.9% |
| Mobile Home / Other | 0 | 0.0% |
| Total | 4,460 | 100.0% |
Housing Structures by Occupancy in Burr Ridge
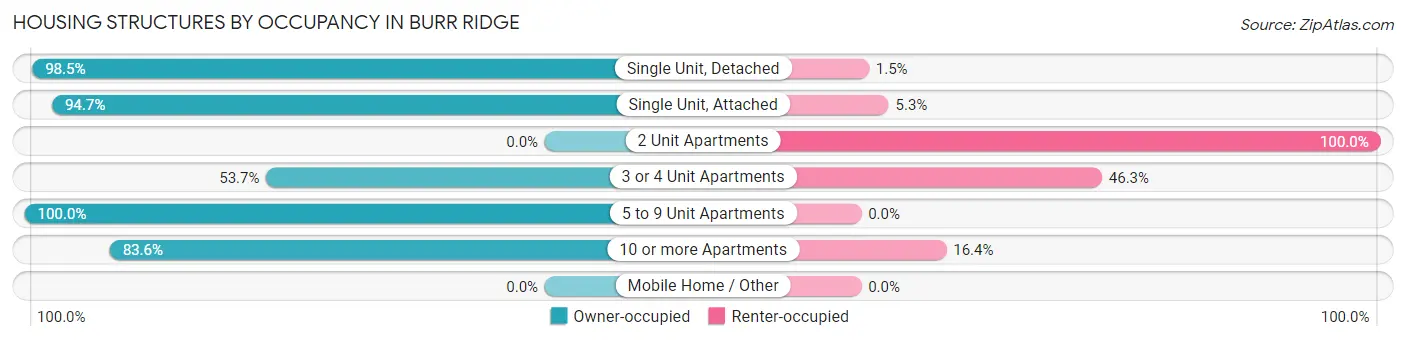
| Structure Type | Owner-occupied | Renter-occupied |
| Single Unit, Detached | 3,319 (98.5%) | 50 (1.5%) |
| Single Unit, Attached | 395 (94.7%) | 22 (5.3%) |
| 2 Unit Apartments | 0 (0.0%) | 16 (100.0%) |
| 3 or 4 Unit Apartments | 44 (53.7%) | 38 (46.3%) |
| 5 to 9 Unit Apartments | 88 (100.0%) | 0 (0.0%) |
| 10 or more Apartments | 408 (83.6%) | 80 (16.4%) |
| Mobile Home / Other | 0 (0.0%) | 0 (0.0%) |
| Total | 4,254 (95.4%) | 206 (4.6%) |
Housing Structures by Number of Rooms in Burr Ridge
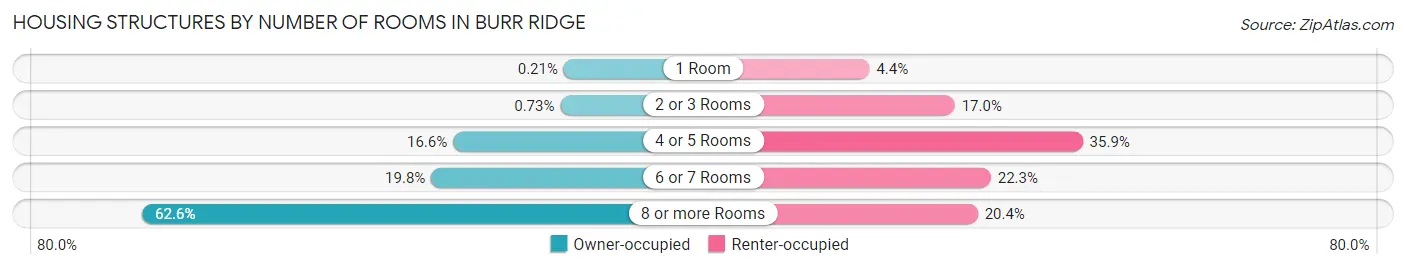
| Number of Rooms | Owner-occupied | Renter-occupied |
| 1 Room | 9 (0.2%) | 9 (4.4%) |
| 2 or 3 Rooms | 31 (0.7%) | 35 (17.0%) |
| 4 or 5 Rooms | 706 (16.6%) | 74 (35.9%) |
| 6 or 7 Rooms | 844 (19.8%) | 46 (22.3%) |
| 8 or more Rooms | 2,664 (62.6%) | 42 (20.4%) |
| Total | 4,254 (100.0%) | 206 (100.0%) |
Housing Structure by Heating Type in Burr Ridge
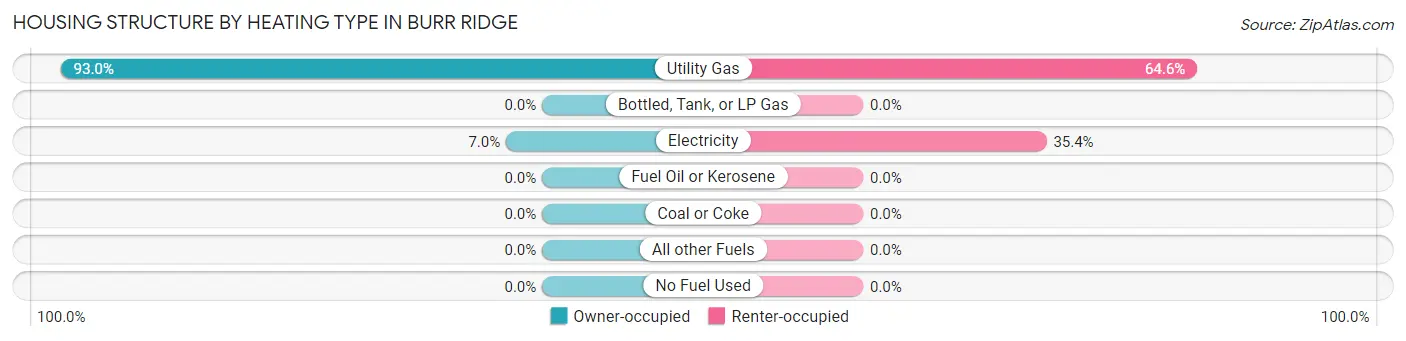
| Heating Type | Owner-occupied | Renter-occupied |
| Utility Gas | 3,958 (93.0%) | 133 (64.6%) |
| Bottled, Tank, or LP Gas | 0 (0.0%) | 0 (0.0%) |
| Electricity | 296 (7.0%) | 73 (35.4%) |
| Fuel Oil or Kerosene | 0 (0.0%) | 0 (0.0%) |
| Coal or Coke | 0 (0.0%) | 0 (0.0%) |
| All other Fuels | 0 (0.0%) | 0 (0.0%) |
| No Fuel Used | 0 (0.0%) | 0 (0.0%) |
| Total | 4,254 (100.0%) | 206 (100.0%) |
Household Vehicle Usage in Burr Ridge
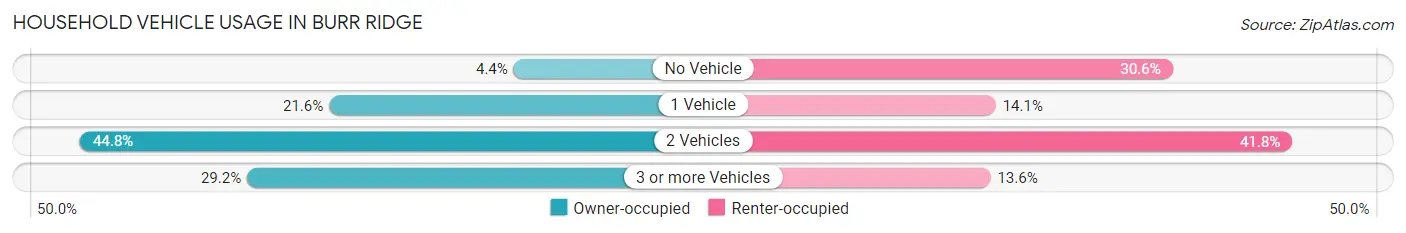
| Vehicles per Household | Owner-occupied | Renter-occupied |
| No Vehicle | 185 (4.3%) | 63 (30.6%) |
| 1 Vehicle | 918 (21.6%) | 29 (14.1%) |
| 2 Vehicles | 1,907 (44.8%) | 86 (41.7%) |
| 3 or more Vehicles | 1,244 (29.2%) | 28 (13.6%) |
| Total | 4,254 (100.0%) | 206 (100.0%) |
Real Estate & Mortgages in Burr Ridge
Real Estate and Mortgage Overview in Burr Ridge
| Characteristic | Without Mortgage | With Mortgage |
| Housing Units | 2,129 | 2,125 |
| Median Property Value | $681,300 | $737,100 |
| Median Household Income | $165,368 | $1,399 |
| Monthly Housing Costs | $1,451 | $1,469 |
| Real Estate Taxes | $10,001 | $31 |
Property Value by Mortgage Status in Burr Ridge
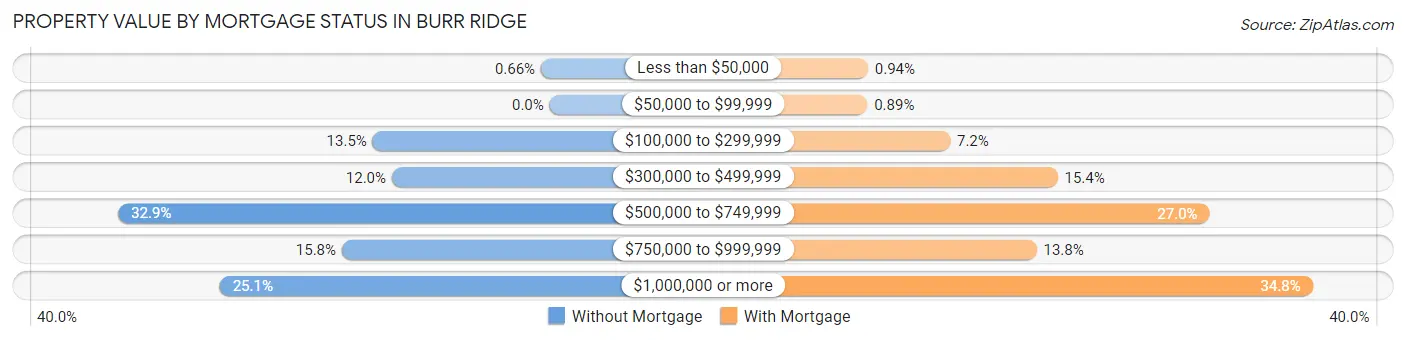
| Property Value | Without Mortgage | With Mortgage |
| Less than $50,000 | 14 (0.7%) | 20 (0.9%) |
| $50,000 to $99,999 | 0 (0.0%) | 19 (0.9%) |
| $100,000 to $299,999 | 287 (13.5%) | 153 (7.2%) |
| $300,000 to $499,999 | 256 (12.0%) | 327 (15.4%) |
| $500,000 to $749,999 | 700 (32.9%) | 573 (27.0%) |
| $750,000 to $999,999 | 337 (15.8%) | 293 (13.8%) |
| $1,000,000 or more | 535 (25.1%) | 740 (34.8%) |
| Total | 2,129 (100.0%) | 2,125 (100.0%) |
Household Income by Mortgage Status in Burr Ridge
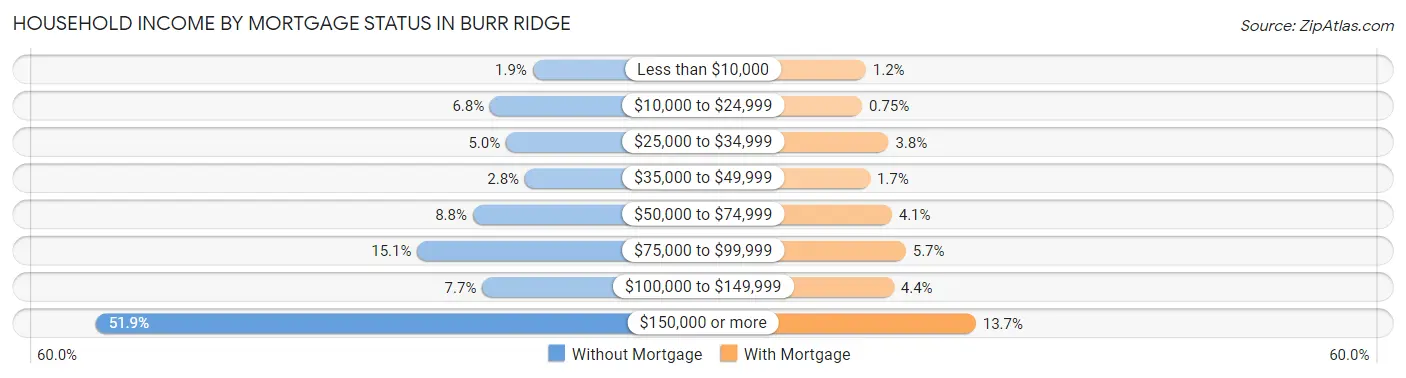
| Household Income | Without Mortgage | With Mortgage |
| Less than $10,000 | 41 (1.9%) | 25 (1.2%) |
| $10,000 to $24,999 | 145 (6.8%) | 16 (0.7%) |
| $25,000 to $34,999 | 106 (5.0%) | 80 (3.8%) |
| $35,000 to $49,999 | 60 (2.8%) | 35 (1.7%) |
| $50,000 to $74,999 | 187 (8.8%) | 88 (4.1%) |
| $75,000 to $99,999 | 322 (15.1%) | 122 (5.7%) |
| $100,000 to $149,999 | 164 (7.7%) | 93 (4.4%) |
| $150,000 or more | 1,104 (51.9%) | 292 (13.7%) |
| Total | 2,129 (100.0%) | 2,125 (100.0%) |
Property Value to Household Income Ratio in Burr Ridge
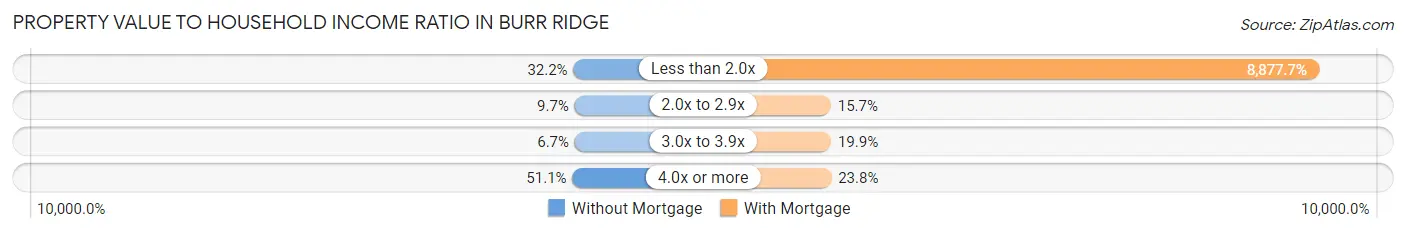
| Value-to-Income Ratio | Without Mortgage | With Mortgage |
| Less than 2.0x | 685 (32.2%) | 188,650 (8,877.6%) |
| 2.0x to 2.9x | 206 (9.7%) | 334 (15.7%) |
| 3.0x to 3.9x | 143 (6.7%) | 422 (19.9%) |
| 4.0x or more | 1,088 (51.1%) | 506 (23.8%) |
| Total | 2,129 (100.0%) | 2,125 (100.0%) |
Real Estate Taxes by Mortgage Status in Burr Ridge
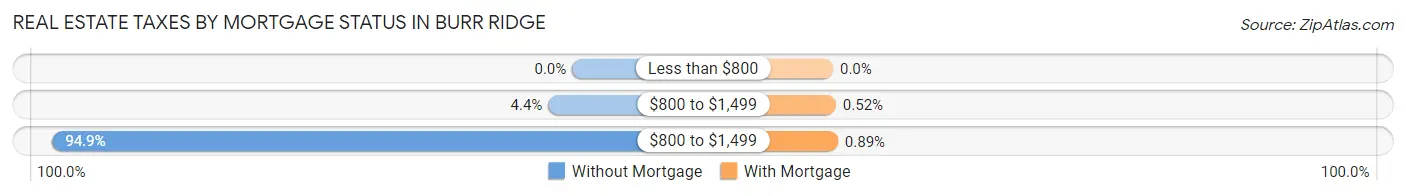
| Property Taxes | Without Mortgage | With Mortgage |
| Less than $800 | 0 (0.0%) | 0 (0.0%) |
| $800 to $1,499 | 93 (4.4%) | 11 (0.5%) |
| $800 to $1,499 | 2,021 (94.9%) | 19 (0.9%) |
| Total | 2,129 (100.0%) | 2,125 (100.0%) |
Health & Disability in Burr Ridge
Health Insurance Coverage by Age in Burr Ridge
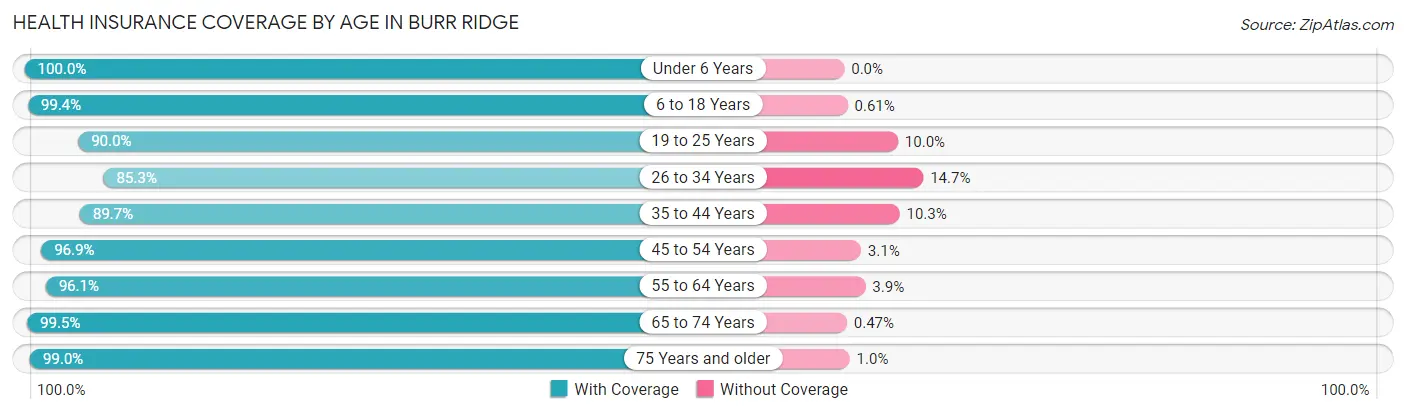
| Age Bracket | With Coverage | Without Coverage |
| Under 6 Years | 505 (100.0%) | 0 (0.0%) |
| 6 to 18 Years | 1,621 (99.4%) | 10 (0.6%) |
| 19 to 25 Years | 351 (90.0%) | 39 (10.0%) |
| 26 to 34 Years | 510 (85.3%) | 88 (14.7%) |
| 35 to 44 Years | 949 (89.7%) | 109 (10.3%) |
| 45 to 54 Years | 999 (96.9%) | 32 (3.1%) |
| 55 to 64 Years | 2,024 (96.1%) | 83 (3.9%) |
| 65 to 74 Years | 2,327 (99.5%) | 11 (0.5%) |
| 75 Years and older | 1,383 (99.0%) | 14 (1.0%) |
| Total | 10,669 (96.5%) | 386 (3.5%) |
Health Insurance Coverage by Citizenship Status in Burr Ridge
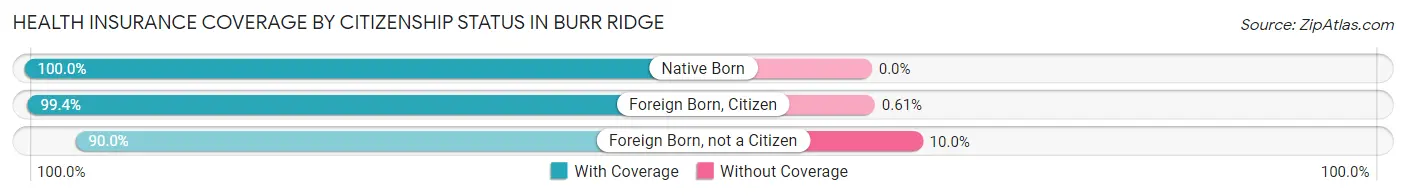
| Citizenship Status | With Coverage | Without Coverage |
| Native Born | 505 (100.0%) | 0 (0.0%) |
| Foreign Born, Citizen | 1,621 (99.4%) | 10 (0.6%) |
| Foreign Born, not a Citizen | 351 (90.0%) | 39 (10.0%) |
Health Insurance Coverage by Household Income in Burr Ridge
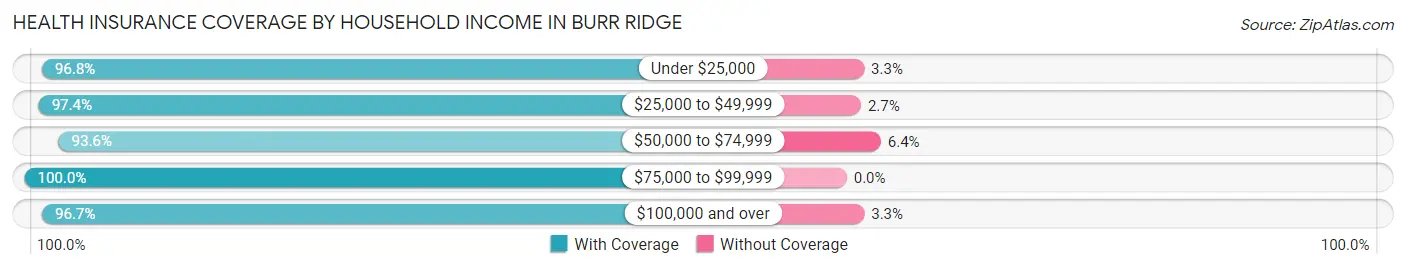
| Household Income | With Coverage | Without Coverage |
| Under $25,000 | 357 (96.8%) | 12 (3.3%) |
| $25,000 to $49,999 | 587 (97.4%) | 16 (2.6%) |
| $50,000 to $74,999 | 983 (93.6%) | 67 (6.4%) |
| $75,000 to $99,999 | 701 (100.0%) | 0 (0.0%) |
| $100,000 and over | 8,009 (96.7%) | 272 (3.3%) |
Public vs Private Health Insurance Coverage by Age in Burr Ridge
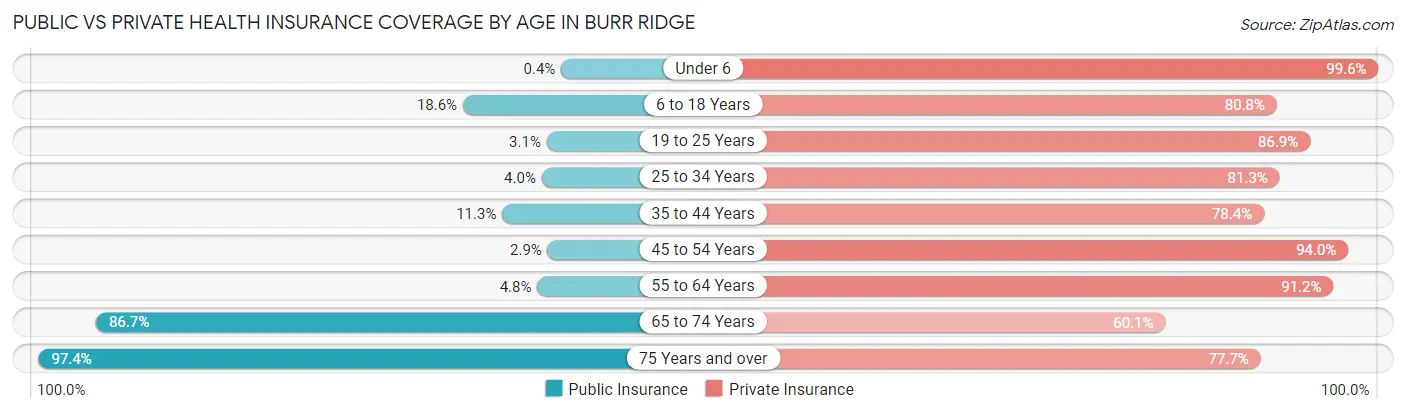
| Age Bracket | Public Insurance | Private Insurance |
| Under 6 | 2 (0.4%) | 503 (99.6%) |
| 6 to 18 Years | 304 (18.6%) | 1,317 (80.7%) |
| 19 to 25 Years | 12 (3.1%) | 339 (86.9%) |
| 25 to 34 Years | 24 (4.0%) | 486 (81.3%) |
| 35 to 44 Years | 120 (11.3%) | 829 (78.4%) |
| 45 to 54 Years | 30 (2.9%) | 969 (94.0%) |
| 55 to 64 Years | 102 (4.8%) | 1,922 (91.2%) |
| 65 to 74 Years | 2,028 (86.7%) | 1,404 (60.1%) |
| 75 Years and over | 1,361 (97.4%) | 1,086 (77.7%) |
| Total | 3,983 (36.0%) | 8,855 (80.1%) |
Disability Status by Sex by Age in Burr Ridge
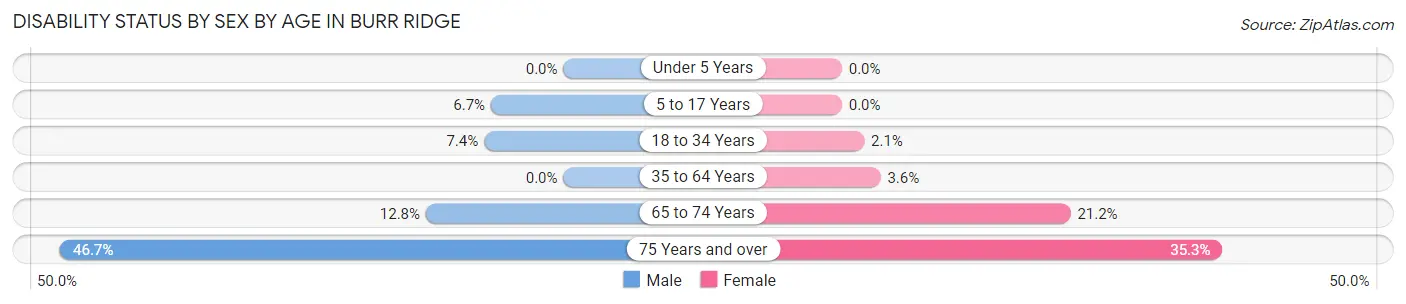
| Age Bracket | Male | Female |
| Under 5 Years | 0 (0.0%) | 0 (0.0%) |
| 5 to 17 Years | 74 (6.7%) | 0 (0.0%) |
| 18 to 34 Years | 44 (7.4%) | 10 (2.1%) |
| 35 to 64 Years | 0 (0.0%) | 79 (3.6%) |
| 65 to 74 Years | 154 (12.8%) | 240 (21.2%) |
| 75 Years and over | 290 (46.7%) | 274 (35.3%) |
Disability Class by Sex by Age in Burr Ridge
Disability Class: Hearing Difficulty
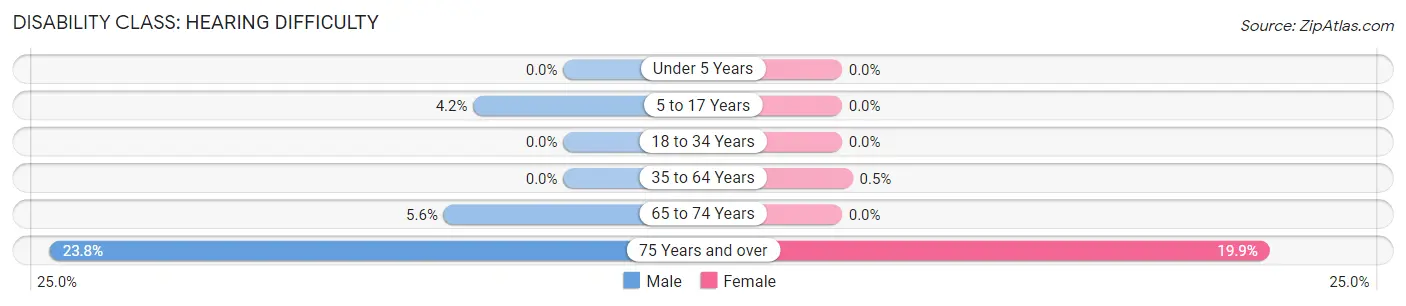
| Age Bracket | Male | Female |
| Under 5 Years | 0 (0.0%) | 0 (0.0%) |
| 5 to 17 Years | 46 (4.2%) | 0 (0.0%) |
| 18 to 34 Years | 0 (0.0%) | 0 (0.0%) |
| 35 to 64 Years | 0 (0.0%) | 11 (0.5%) |
| 65 to 74 Years | 67 (5.6%) | 0 (0.0%) |
| 75 Years and over | 148 (23.8%) | 154 (19.9%) |
Disability Class: Vision Difficulty
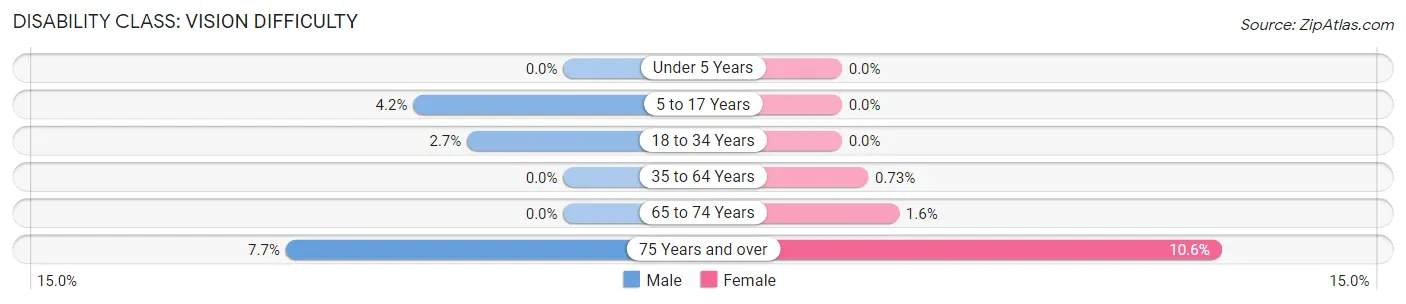
| Age Bracket | Male | Female |
| Under 5 Years | 0 (0.0%) | 0 (0.0%) |
| 5 to 17 Years | 46 (4.2%) | 0 (0.0%) |
| 18 to 34 Years | 16 (2.7%) | 0 (0.0%) |
| 35 to 64 Years | 0 (0.0%) | 16 (0.7%) |
| 65 to 74 Years | 0 (0.0%) | 18 (1.6%) |
| 75 Years and over | 48 (7.7%) | 82 (10.6%) |
Disability Class: Cognitive Difficulty
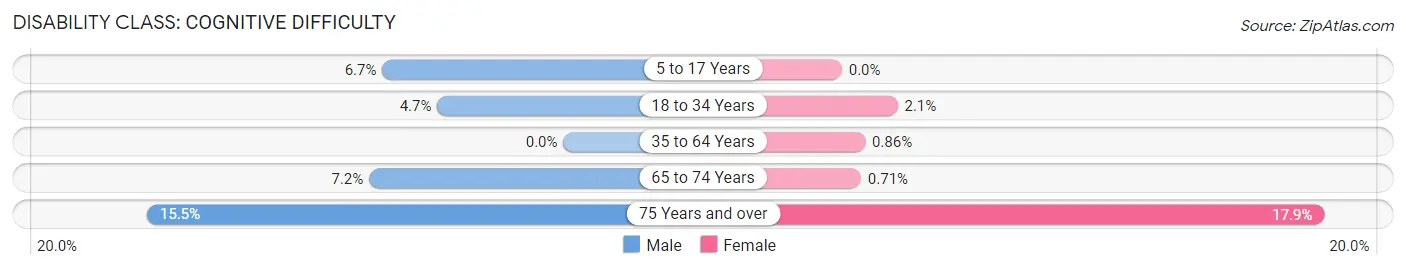
| Age Bracket | Male | Female |
| 5 to 17 Years | 74 (6.7%) | 0 (0.0%) |
| 18 to 34 Years | 28 (4.7%) | 10 (2.1%) |
| 35 to 64 Years | 0 (0.0%) | 19 (0.9%) |
| 65 to 74 Years | 87 (7.2%) | 8 (0.7%) |
| 75 Years and over | 96 (15.5%) | 139 (17.9%) |
Disability Class: Ambulatory Difficulty
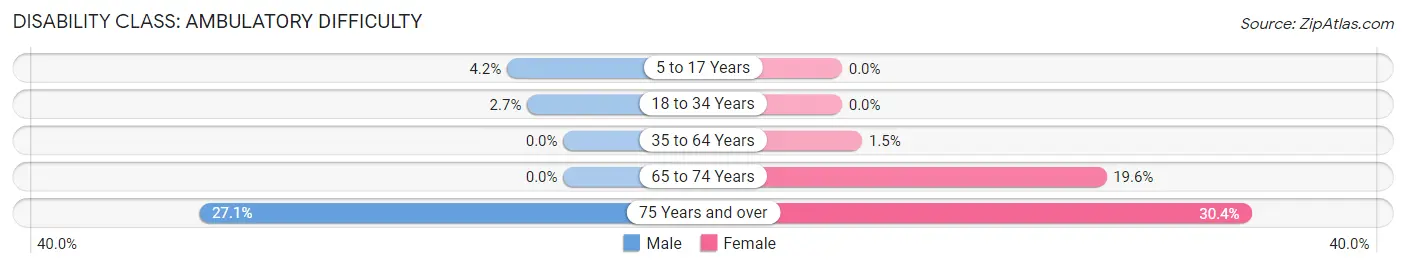
| Age Bracket | Male | Female |
| 5 to 17 Years | 46 (4.2%) | 0 (0.0%) |
| 18 to 34 Years | 16 (2.7%) | 0 (0.0%) |
| 35 to 64 Years | 0 (0.0%) | 33 (1.5%) |
| 65 to 74 Years | 0 (0.0%) | 222 (19.6%) |
| 75 Years and over | 168 (27.1%) | 236 (30.4%) |
Disability Class: Self-Care Difficulty
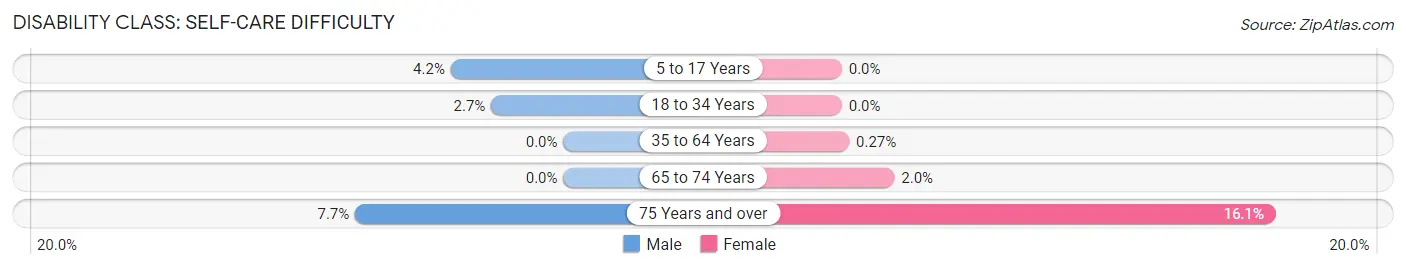
| Age Bracket | Male | Female |
| 5 to 17 Years | 46 (4.2%) | 0 (0.0%) |
| 18 to 34 Years | 16 (2.7%) | 0 (0.0%) |
| 35 to 64 Years | 0 (0.0%) | 6 (0.3%) |
| 65 to 74 Years | 0 (0.0%) | 22 (1.9%) |
| 75 Years and over | 48 (7.7%) | 125 (16.1%) |
Technology Access in Burr Ridge
Computing Device Access in Burr Ridge
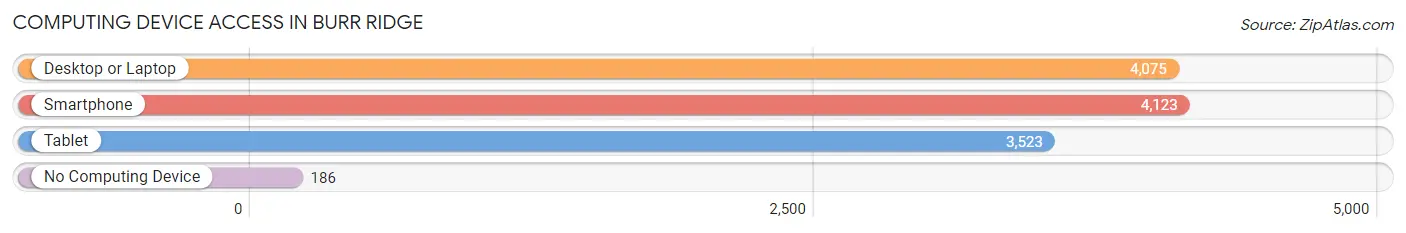
| Device Type | # Households | % Households |
| Desktop or Laptop | 4,075 | 91.4% |
| Smartphone | 4,123 | 92.4% |
| Tablet | 3,523 | 79.0% |
| No Computing Device | 186 | 4.2% |
| Total | 4,460 | 100.0% |
Internet Access in Burr Ridge
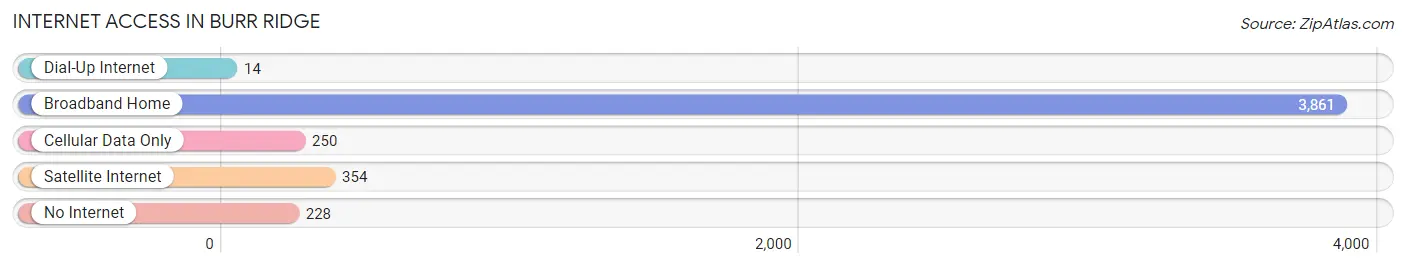
| Internet Type | # Households | % Households |
| Dial-Up Internet | 14 | 0.3% |
| Broadband Home | 3,861 | 86.6% |
| Cellular Data Only | 250 | 5.6% |
| Satellite Internet | 354 | 7.9% |
| No Internet | 228 | 5.1% |
| Total | 4,460 | 100.0% |
Burr Ridge Summary
Burr Ridge, Illinois is a village located in both DuPage and Cook counties in the state of Illinois. It is a suburb of Chicago, located approximately 20 miles southwest of the city. The village has a population of 10,559 as of the 2010 census, and is known for its affluent population and high quality of life.
History
The area that is now Burr Ridge was originally inhabited by the Potawatomi Native American tribe. The first European settlers arrived in the area in the early 19th century, and the village was officially incorporated in 1956. The village was named after the Burr Ridge, a ridge that runs through the area and is part of the Des Plaines River watershed.
Geography
Burr Ridge is located in both DuPage and Cook counties in the state of Illinois. It is situated on the Burr Ridge, a ridge that runs through the area and is part of the Des Plaines River watershed. The village is located approximately 20 miles southwest of Chicago, and is bordered by the villages of Willowbrook, Hinsdale, Clarendon Hills, and Indian Head Park.
The village has a total area of 5.2 square miles, of which 5.1 square miles is land and 0.1 square miles is water. The village is located in the Chicago metropolitan area, and is part of the Chicago metropolitan statistical area.
Economy
Burr Ridge is a wealthy village, with a median household income of $125,000 as of the 2010 census. The village is home to a number of corporate headquarters, including the headquarters of the McDonald's Corporation, the Kraft Heinz Company, and the Sara Lee Corporation. The village is also home to a number of retail stores, restaurants, and other businesses.
Demographics
As of the 2010 census, the village had a population of 10,559. The racial makeup of the village was 87.3% White, 4.2% Asian, 3.2% African American, 0.2% Native American, 0.1% Pacific Islander, and 4.9% from other races. Hispanic or Latino of any race were 8.3% of the population.
The median age in the village was 44.2 years, with 25.2% of the population under the age of 18, and 8.2% over the age of 65. The median household income was $125,000, and the median family income was $150,000. The per capita income was $68,000.
Common Questions
What is Per Capita Income in Burr Ridge?
Per Capita income in Burr Ridge is $112,170.
What is the Median Family Income in Burr Ridge?
Median Family Income in Burr Ridge is $213,077.
What is the Median Household income in Burr Ridge?
Median Household Income in Burr Ridge is $174,342.
What is Income or Wage Gap in Burr Ridge?
Income or Wage Gap in Burr Ridge is 40.7%.
Women in Burr Ridge earn 59.3 cents for every dollar earned by a man.
What is Inequality or Gini Index in Burr Ridge?
Inequality or Gini Index in Burr Ridge is 0.52.
What is the Total Population of Burr Ridge?
Total Population of Burr Ridge is 11,131.
What is the Total Male Population of Burr Ridge?
Total Male Population of Burr Ridge is 5,795.
What is the Total Female Population of Burr Ridge?
Total Female Population of Burr Ridge is 5,336.
What is the Ratio of Males per 100 Females in Burr Ridge?
There are 108.60 Males per 100 Females in Burr Ridge.
What is the Ratio of Females per 100 Males in Burr Ridge?
There are 92.08 Females per 100 Males in Burr Ridge.
What is the Median Population Age in Burr Ridge?
Median Population Age in Burr Ridge is 56.7 Years.
What is the Average Family Size in Burr Ridge
Average Family Size in Burr Ridge is 2.9 People.
What is the Average Household Size in Burr Ridge
Average Household Size in Burr Ridge is 2.5 People.
How Large is the Labor Force in Burr Ridge?
There are 5,405 People in the Labor Forcein in Burr Ridge.
What is the Percentage of People in the Labor Force in Burr Ridge?
58.0% of People are in the Labor Force in Burr Ridge.
What is the Unemployment Rate in Burr Ridge?
Unemployment Rate in Burr Ridge is 3.4%.