Homer Glen, IL Map & Demographics
Homer Glen Map
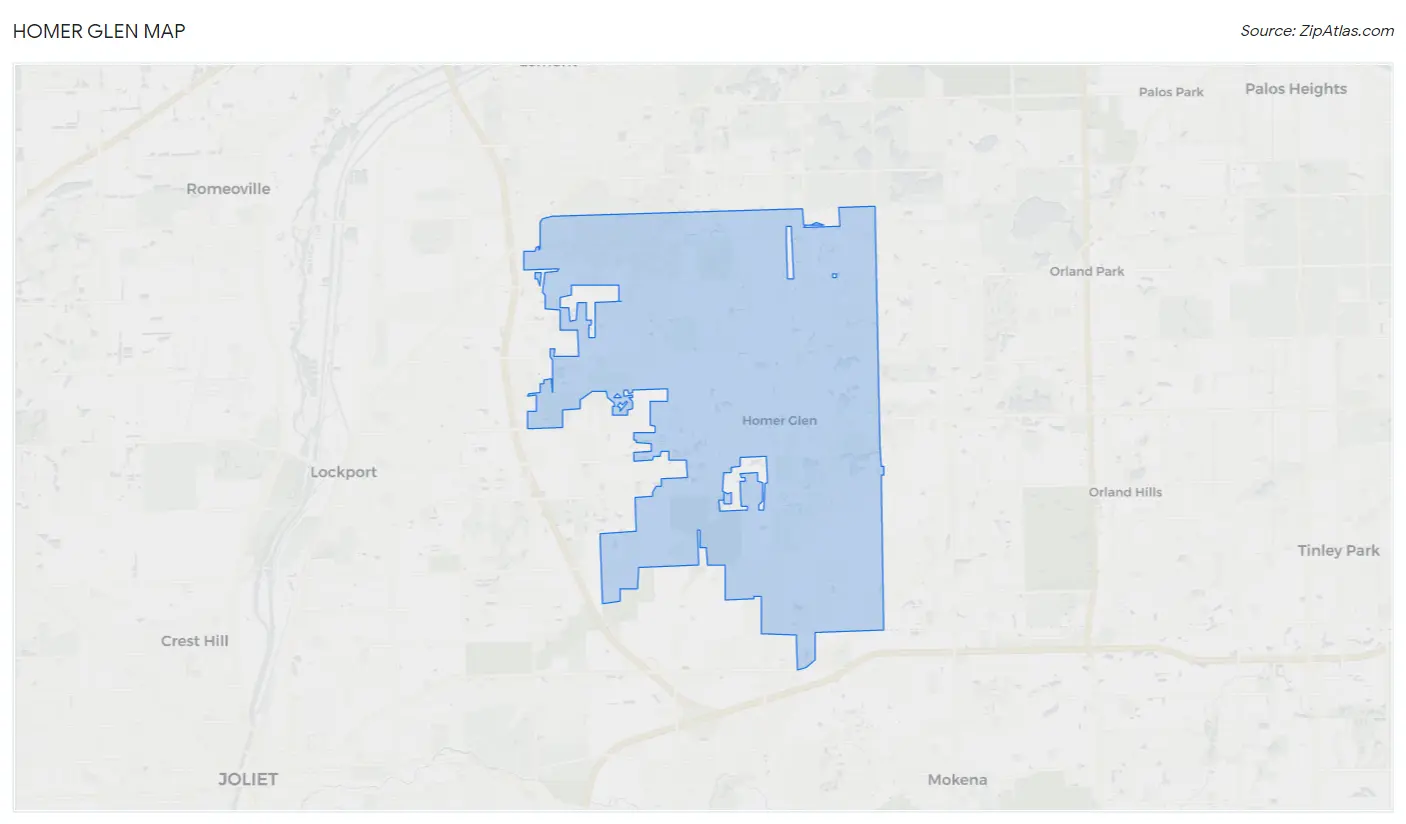
Homer Glen Overview
$49,558
PER CAPITA INCOME
$144,023
AVG FAMILY INCOME
$130,235
AVG HOUSEHOLD INCOME
41.6%
WAGE / INCOME GAP [ % ]
58.4¢/ $1
WAGE / INCOME GAP [ $ ]
$8,573
FAMILY INCOME DEFICIT
0.38
INEQUALITY / GINI INDEX
24,507
TOTAL POPULATION
12,221
MALE POPULATION
12,286
FEMALE POPULATION
99.47
MALES / 100 FEMALES
100.53
FEMALES / 100 MALES
42.3
MEDIAN AGE
3.4
AVG FAMILY SIZE
3.0
AVG HOUSEHOLD SIZE
12,516
LABOR FORCE [ PEOPLE ]
65.4%
PERCENT IN LABOR FORCE
5.0%
UNEMPLOYMENT RATE
Homer Glen Zip Codes
Income in Homer Glen
Income Overview in Homer Glen
Per Capita Income in Homer Glen is $49,558, while median incomes of families and households are $144,023 and $130,235 respectively.
| Characteristic | Number | Measure |
| Per Capita Income | 24,507 | $49,558 |
| Median Family Income | 6,475 | $144,023 |
| Mean Family Income | 6,475 | $164,996 |
| Median Household Income | 7,981 | $130,235 |
| Mean Household Income | 7,981 | $148,741 |
| Income Deficit | 6,475 | $8,573 |
| Wage / Income Gap (%) | 24,507 | 41.61% |
| Wage / Income Gap ($) | 24,507 | 58.39¢ per $1 |
| Gini / Inequality Index | 24,507 | 0.38 |
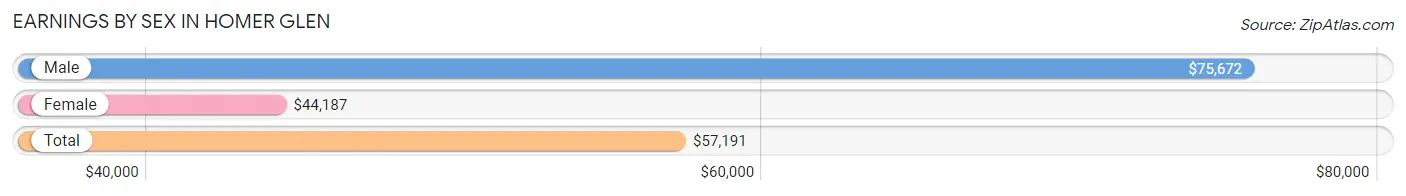
Earnings by Sex in Homer Glen
Average Earnings in Homer Glen are $57,191, $75,672 for men and $44,187 for women, a difference of 41.6%.
| Sex | Number | Average Earnings |
| Male | 6,657 (51.9%) | $75,672 |
| Female | 6,164 (48.1%) | $44,187 |
| Total | 12,821 (100.0%) | $57,191 |
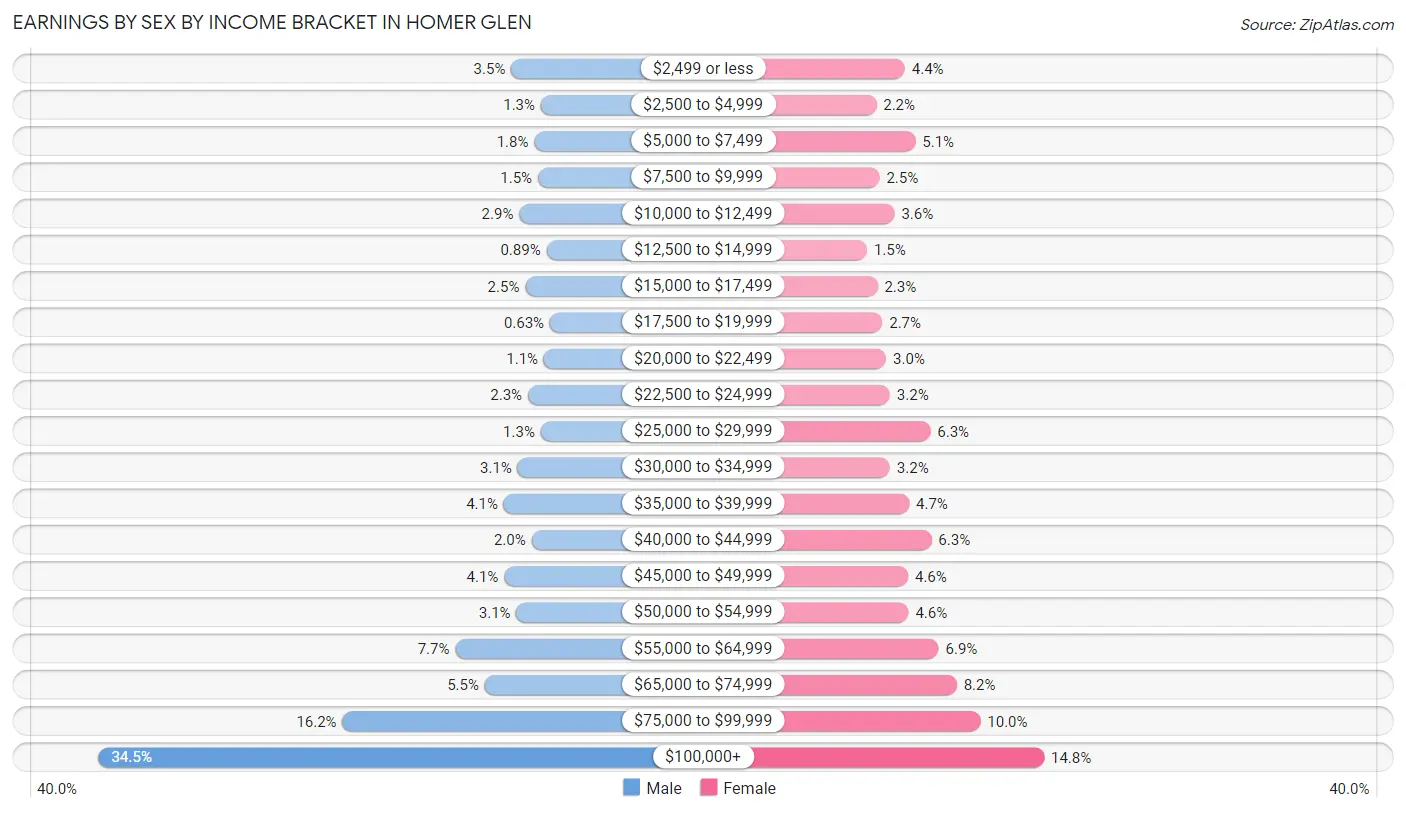
Earnings by Sex by Income Bracket in Homer Glen
The most common earnings brackets in Homer Glen are $100,000+ for men (2,294 | 34.5%) and $100,000+ for women (911 | 14.8%).
| Income | Male | Female |
| $2,499 or less | 235 (3.5%) | 268 (4.3%) |
| $2,500 to $4,999 | 87 (1.3%) | 136 (2.2%) |
| $5,000 to $7,499 | 120 (1.8%) | 317 (5.1%) |
| $7,500 to $9,999 | 102 (1.5%) | 151 (2.5%) |
| $10,000 to $12,499 | 195 (2.9%) | 220 (3.6%) |
| $12,500 to $14,999 | 59 (0.9%) | 93 (1.5%) |
| $15,000 to $17,499 | 165 (2.5%) | 142 (2.3%) |
| $17,500 to $19,999 | 42 (0.6%) | 164 (2.7%) |
| $20,000 to $22,499 | 72 (1.1%) | 182 (2.9%) |
| $22,500 to $24,999 | 152 (2.3%) | 199 (3.2%) |
| $25,000 to $29,999 | 88 (1.3%) | 386 (6.3%) |
| $30,000 to $34,999 | 203 (3.0%) | 199 (3.2%) |
| $35,000 to $39,999 | 272 (4.1%) | 288 (4.7%) |
| $40,000 to $44,999 | 134 (2.0%) | 391 (6.3%) |
| $45,000 to $49,999 | 270 (4.1%) | 283 (4.6%) |
| $50,000 to $54,999 | 209 (3.1%) | 285 (4.6%) |
| $55,000 to $64,999 | 514 (7.7%) | 424 (6.9%) |
| $65,000 to $74,999 | 367 (5.5%) | 508 (8.2%) |
| $75,000 to $99,999 | 1,077 (16.2%) | 617 (10.0%) |
| $100,000+ | 2,294 (34.5%) | 911 (14.8%) |
| Total | 6,657 (100.0%) | 6,164 (100.0%) |
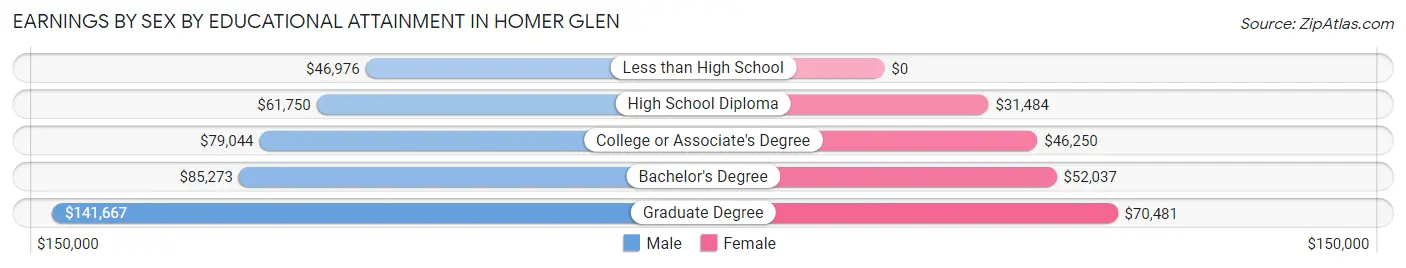
Earnings by Sex by Educational Attainment in Homer Glen
Average earnings in Homer Glen are $80,419 for men and $49,673 for women, a difference of 38.2%. Men with an educational attainment of graduate degree enjoy the highest average annual earnings of $141,667, while those with less than high school education earn the least with $46,976. Women with an educational attainment of graduate degree earn the most with the average annual earnings of $70,481, while those with high school diploma education have the smallest earnings of $31,484.
| Educational Attainment | Male Income | Female Income |
| Less than High School | $46,976 | $0 |
| High School Diploma | $61,750 | $31,484 |
| College or Associate's Degree | $79,044 | $46,250 |
| Bachelor's Degree | $85,273 | $52,037 |
| Graduate Degree | $141,667 | $70,481 |
| Total | $80,419 | $49,673 |
Family Income in Homer Glen
Family Income Brackets in Homer Glen
According to the Homer Glen family income data, there are 1,800 families falling into the $200,000+ income range, which is the most common income bracket and makes up 27.8% of all families. Conversely, the less than $10,000 income bracket is the least frequent group with only 32 families (0.5%) belonging to this category.
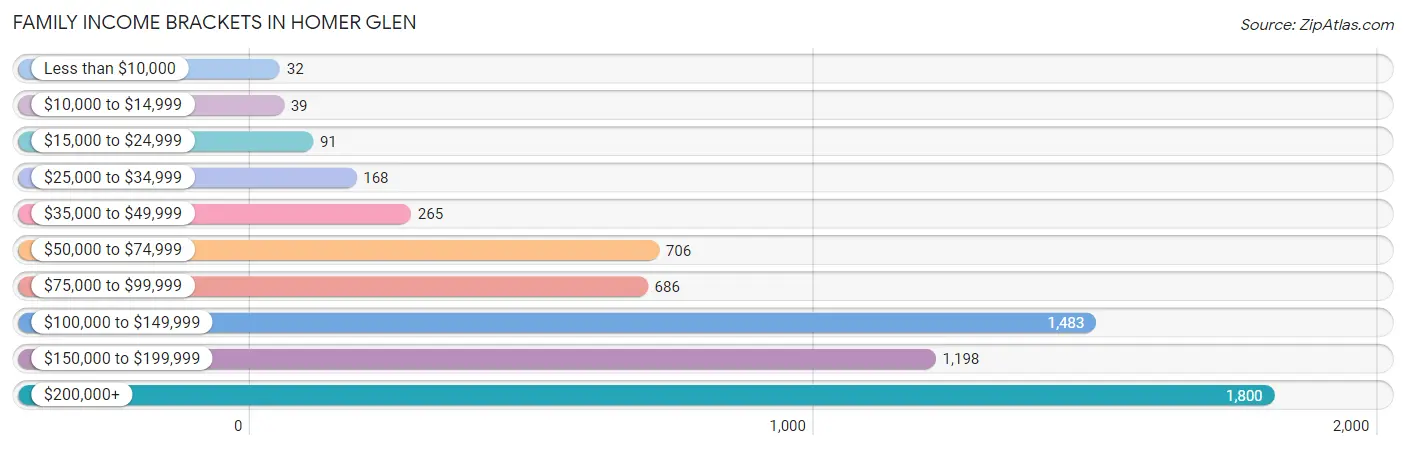
| Income Bracket | # Families | % Families |
| Less than $10,000 | 32 | 0.5% |
| $10,000 to $14,999 | 39 | 0.6% |
| $15,000 to $24,999 | 91 | 1.4% |
| $25,000 to $34,999 | 168 | 2.6% |
| $35,000 to $49,999 | 265 | 4.1% |
| $50,000 to $74,999 | 706 | 10.9% |
| $75,000 to $99,999 | 686 | 10.6% |
| $100,000 to $149,999 | 1,483 | 22.9% |
| $150,000 to $199,999 | 1,198 | 18.5% |
| $200,000+ | 1,800 | 27.8% |
Family Income by Famaliy Size in Homer Glen
7+ person families (228 | 3.5%) account for the highest median family income in Homer Glen with $213,750 per family, while 2-person families (2,658 | 41.0%) have the highest median income of $56,562 per family member.
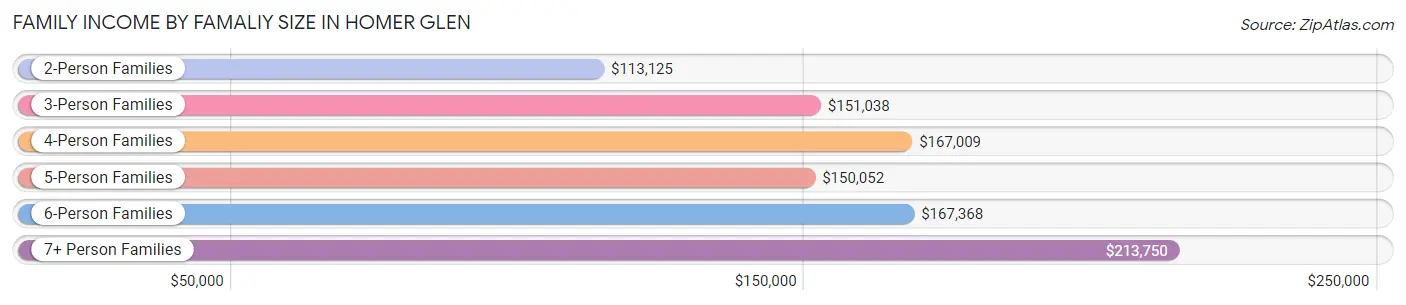
| Income Bracket | # Families | Median Income |
| 2-Person Families | 2,658 (41.0%) | $113,125 |
| 3-Person Families | 1,233 (19.0%) | $151,038 |
| 4-Person Families | 1,535 (23.7%) | $167,009 |
| 5-Person Families | 609 (9.4%) | $150,052 |
| 6-Person Families | 212 (3.3%) | $167,368 |
| 7+ Person Families | 228 (3.5%) | $213,750 |
| Total | 6,475 (100.0%) | $144,023 |
Family Income by Number of Earners in Homer Glen
The median family income in Homer Glen is $144,023, with families comprising 3+ earners (1,126) having the highest median family income of $198,750, while families with no earners (855) have the lowest median family income of $72,695, accounting for 17.4% and 13.2% of families, respectively.
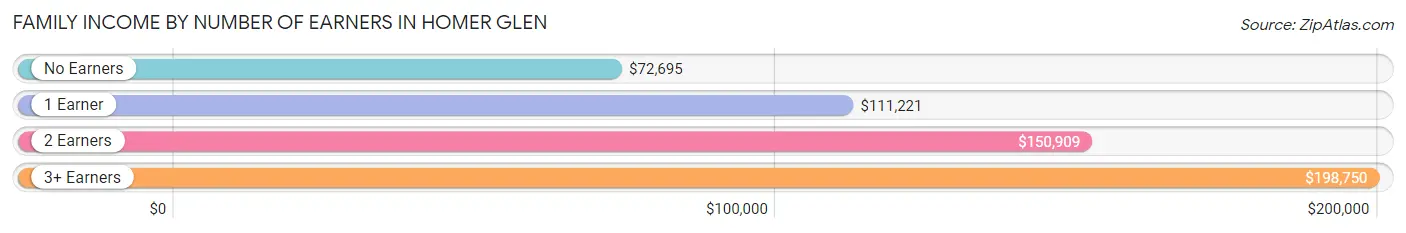
| Number of Earners | # Families | Median Income |
| No Earners | 855 (13.2%) | $72,695 |
| 1 Earner | 1,558 (24.1%) | $111,221 |
| 2 Earners | 2,936 (45.3%) | $150,909 |
| 3+ Earners | 1,126 (17.4%) | $198,750 |
| Total | 6,475 (100.0%) | $144,023 |
Household Income in Homer Glen
Household Income Brackets in Homer Glen
With 1,852 households falling in the category, the $200,000+ income range is the most frequent in Homer Glen, accounting for 23.2% of all households. In contrast, only 72 households (0.9%) fall into the $10,000 to $14,999 income bracket, making it the least populous group.
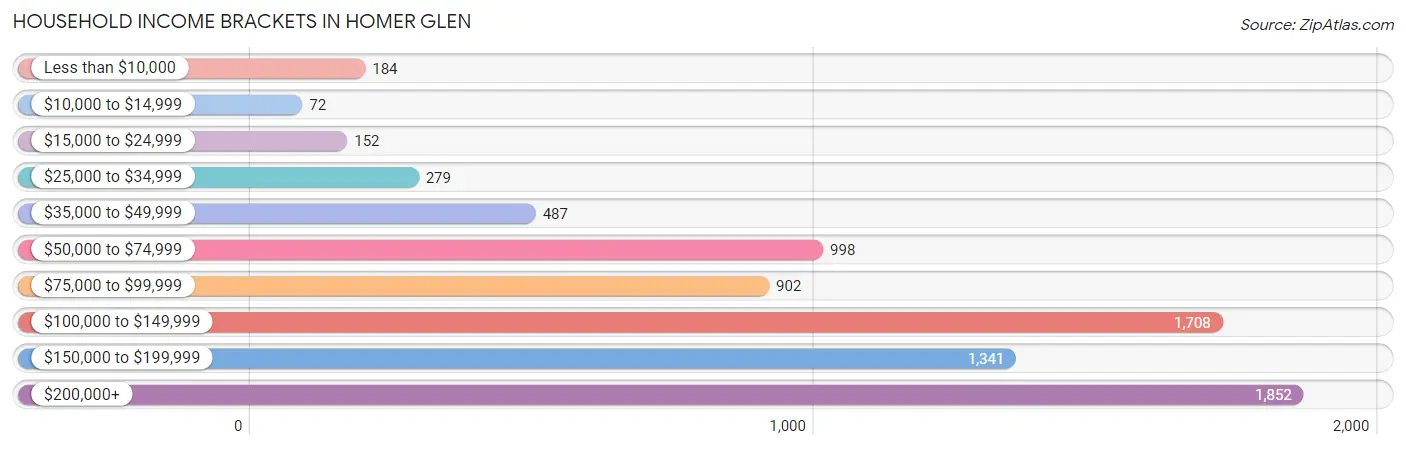
| Income Bracket | # Households | % Households |
| Less than $10,000 | 184 | 2.3% |
| $10,000 to $14,999 | 72 | 0.9% |
| $15,000 to $24,999 | 152 | 1.9% |
| $25,000 to $34,999 | 279 | 3.5% |
| $35,000 to $49,999 | 487 | 6.1% |
| $50,000 to $74,999 | 998 | 12.5% |
| $75,000 to $99,999 | 902 | 11.3% |
| $100,000 to $149,999 | 1,708 | 21.4% |
| $150,000 to $199,999 | 1,341 | 16.8% |
| $200,000+ | 1,852 | 23.2% |
Household Income by Householder Age in Homer Glen
The median household income in Homer Glen is $130,235, with the highest median household income of $165,107 found in the 45 to 64 years age bracket for the primary householder. A total of 3,069 households (38.5%) fall into this category. Meanwhile, the 15 to 24 years age bracket for the primary householder has the lowest median household income of $47,115, with 44 households (0.5%) in this group.
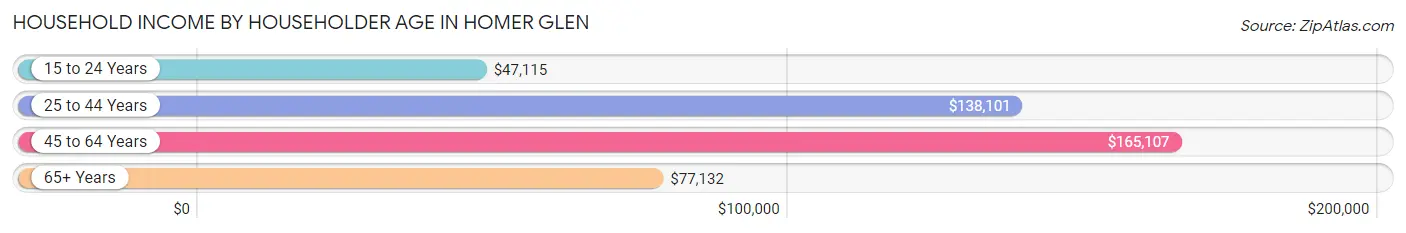
| Income Bracket | # Households | Median Income |
| 15 to 24 Years | 44 (0.5%) | $47,115 |
| 25 to 44 Years | 2,241 (28.1%) | $138,101 |
| 45 to 64 Years | 3,069 (38.5%) | $165,107 |
| 65+ Years | 2,627 (32.9%) | $77,132 |
| Total | 7,981 (100.0%) | $130,235 |
Poverty in Homer Glen
Income Below Poverty by Sex and Age in Homer Glen
With 2.8% poverty level for males and 4.4% for females among the residents of Homer Glen, 5 year old males and 75 year old and over females are the most vulnerable to poverty, with 41 males (17.7%) and 76 females (8.3%) in their respective age groups living below the poverty level.
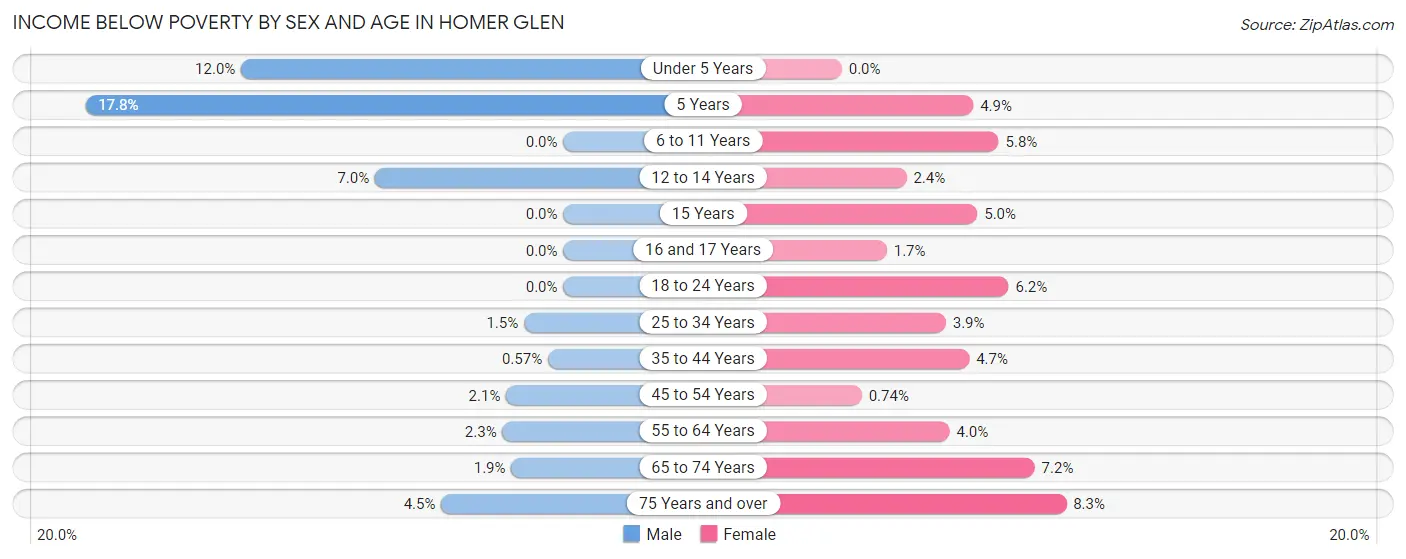
| Age Bracket | Male | Female |
| Under 5 Years | 86 (12.0%) | 0 (0.0%) |
| 5 Years | 41 (17.7%) | 6 (4.9%) |
| 6 to 11 Years | 0 (0.0%) | 61 (5.8%) |
| 12 to 14 Years | 45 (7.0%) | 14 (2.4%) |
| 15 Years | 0 (0.0%) | 9 (5.0%) |
| 16 and 17 Years | 0 (0.0%) | 3 (1.7%) |
| 18 to 24 Years | 0 (0.0%) | 48 (6.2%) |
| 25 to 34 Years | 18 (1.5%) | 48 (3.9%) |
| 35 to 44 Years | 9 (0.6%) | 77 (4.7%) |
| 45 to 54 Years | 28 (2.1%) | 9 (0.7%) |
| 55 to 64 Years | 44 (2.3%) | 90 (4.0%) |
| 65 to 74 Years | 28 (1.9%) | 100 (7.2%) |
| 75 Years and over | 37 (4.5%) | 76 (8.3%) |
| Total | 336 (2.8%) | 541 (4.4%) |
Income Above Poverty by Sex and Age in Homer Glen
According to the poverty statistics in Homer Glen, males aged 6 to 11 years and females aged under 5 years are the age groups that are most secure financially, with 100.0% of males and 100.0% of females in these age groups living above the poverty line.
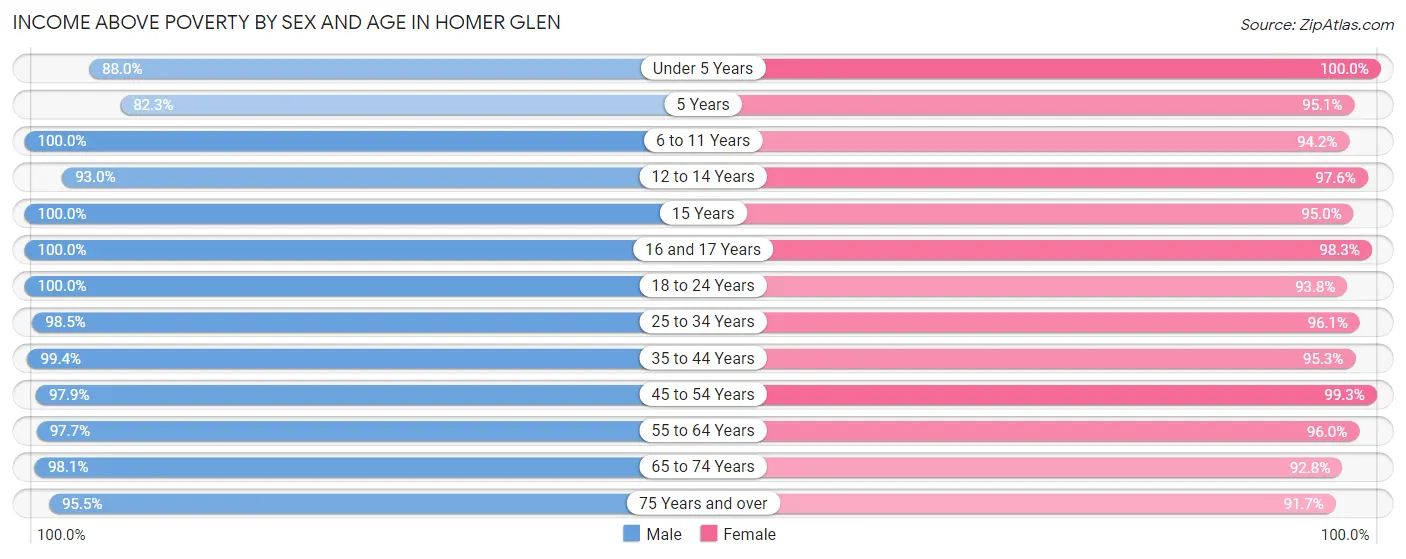
| Age Bracket | Male | Female |
| Under 5 Years | 633 (88.0%) | 660 (100.0%) |
| 5 Years | 190 (82.3%) | 117 (95.1%) |
| 6 to 11 Years | 959 (100.0%) | 988 (94.2%) |
| 12 to 14 Years | 599 (93.0%) | 569 (97.6%) |
| 15 Years | 196 (100.0%) | 170 (95.0%) |
| 16 and 17 Years | 237 (100.0%) | 177 (98.3%) |
| 18 to 24 Years | 819 (100.0%) | 728 (93.8%) |
| 25 to 34 Years | 1,217 (98.5%) | 1,197 (96.1%) |
| 35 to 44 Years | 1,576 (99.4%) | 1,551 (95.3%) |
| 45 to 54 Years | 1,290 (97.9%) | 1,207 (99.3%) |
| 55 to 64 Years | 1,904 (97.7%) | 2,161 (96.0%) |
| 65 to 74 Years | 1,426 (98.1%) | 1,297 (92.8%) |
| 75 Years and over | 780 (95.5%) | 836 (91.7%) |
| Total | 11,826 (97.2%) | 11,658 (95.6%) |
Income Below Poverty Among Married-Couple Families in Homer Glen
The poverty statistics for married-couple families in Homer Glen show that 1.5% or 85 of the total 5,852 families live below the poverty line. Families with no children have the highest poverty rate of 2.1%, comprising of 73 families. On the other hand, families with 3 or 4 children have the lowest poverty rate of 0.0%, which includes 0 families.
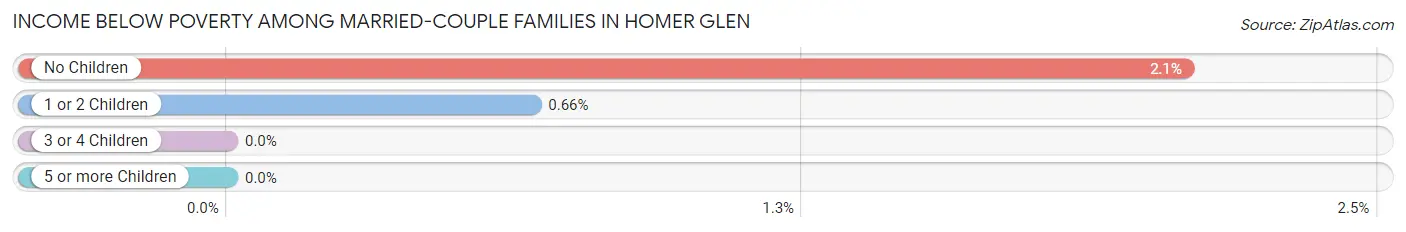
| Children | Above Poverty | Below Poverty |
| No Children | 3,437 (97.9%) | 73 (2.1%) |
| 1 or 2 Children | 1,799 (99.3%) | 12 (0.7%) |
| 3 or 4 Children | 492 (100.0%) | 0 (0.0%) |
| 5 or more Children | 39 (100.0%) | 0 (0.0%) |
| Total | 5,767 (98.6%) | 85 (1.5%) |
Income Below Poverty Among Single-Parent Households in Homer Glen
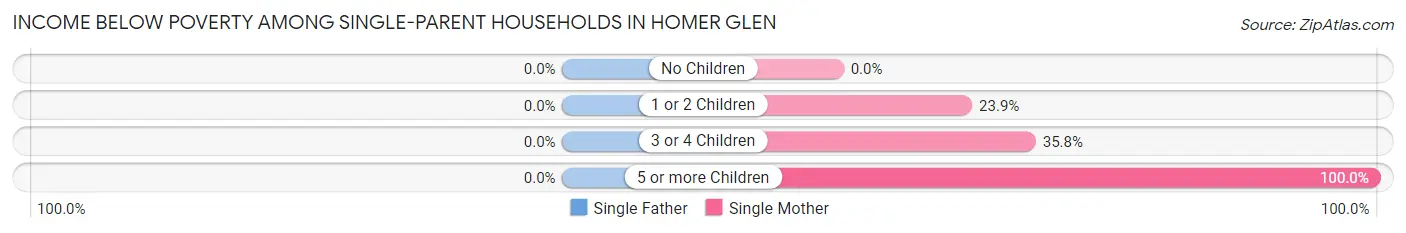
| Children | Single Father | Single Mother |
| No Children | 0 (0.0%) | 0 (0.0%) |
| 1 or 2 Children | 0 (0.0%) | 28 (23.9%) |
| 3 or 4 Children | 0 (0.0%) | 34 (35.8%) |
| 5 or more Children | 0 (0.0%) | 14 (100.0%) |
| Total | 0 (0.0%) | 76 (15.4%) |
Income Below Poverty Among Married-Couple vs Single-Parent Households in Homer Glen
The poverty data for Homer Glen shows that 85 of the married-couple family households (1.5%) and 76 of the single-parent households (12.2%) are living below the poverty level. Within the married-couple family households, those with no children have the highest poverty rate, with 73 households (2.1%) falling below the poverty line. Among the single-parent households, those with 5 or more children have the highest poverty rate, with 14 household (100.0%) living below poverty.
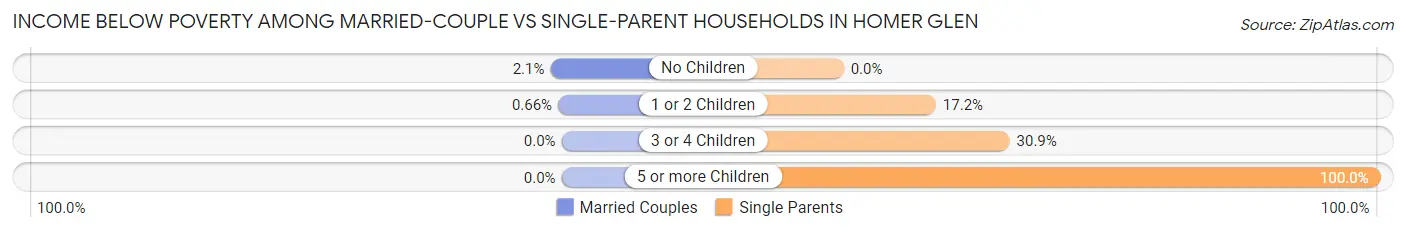
| Children | Married-Couple Families | Single-Parent Households |
| No Children | 73 (2.1%) | 0 (0.0%) |
| 1 or 2 Children | 12 (0.7%) | 28 (17.2%) |
| 3 or 4 Children | 0 (0.0%) | 34 (30.9%) |
| 5 or more Children | 0 (0.0%) | 14 (100.0%) |
| Total | 85 (1.5%) | 76 (12.2%) |
Race in Homer Glen
The most populous races in Homer Glen are White / Caucasian (22,151 | 90.4%), Hispanic or Latino (1,834 | 7.5%), and Two or more Races (1,043 | 4.3%).
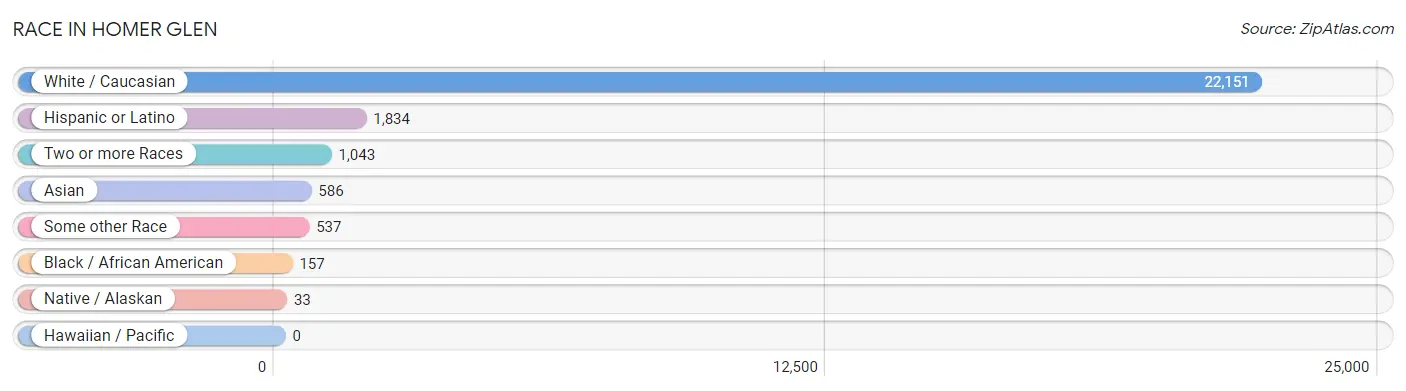
| Race | # Population | % Population |
| Asian | 586 | 2.4% |
| Black / African American | 157 | 0.6% |
| Hawaiian / Pacific | 0 | 0.0% |
| Hispanic or Latino | 1,834 | 7.5% |
| Native / Alaskan | 33 | 0.1% |
| White / Caucasian | 22,151 | 90.4% |
| Two or more Races | 1,043 | 4.3% |
| Some other Race | 537 | 2.2% |
| Total | 24,507 | 100.0% |
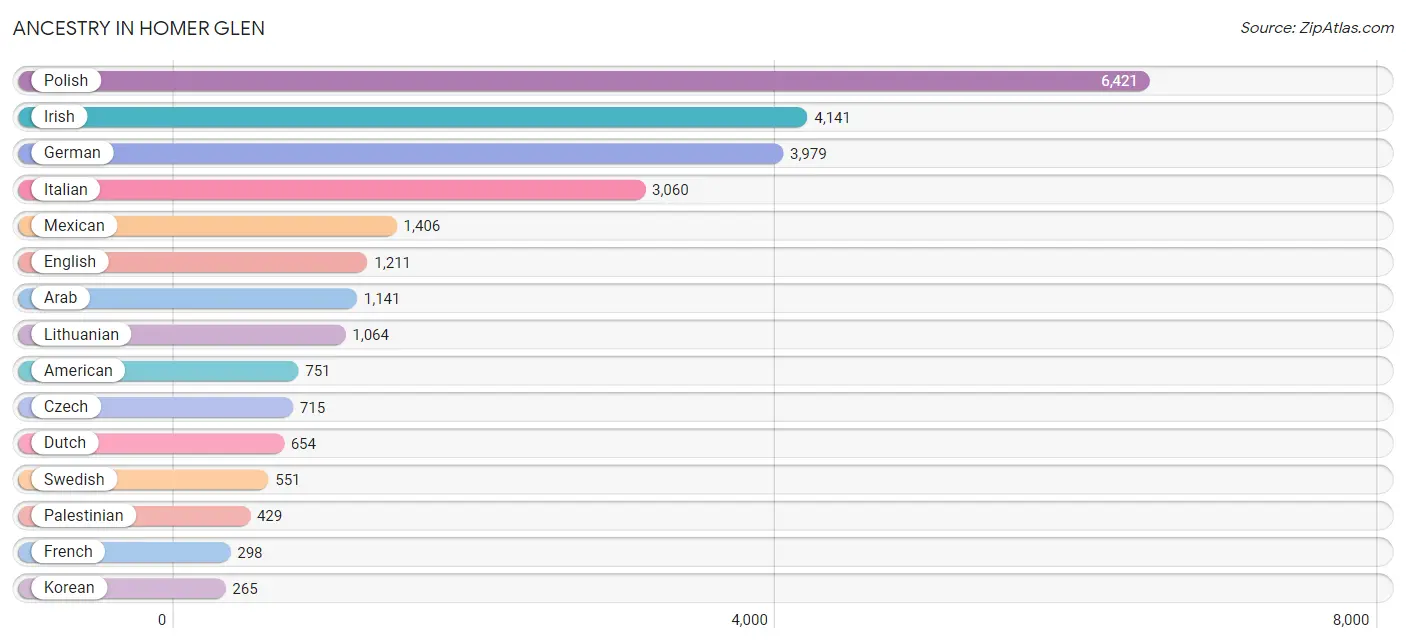
Ancestry in Homer Glen
The most populous ancestries reported in Homer Glen are Polish (6,421 | 26.2%), Irish (4,141 | 16.9%), German (3,979 | 16.2%), Italian (3,060 | 12.5%), and Mexican (1,406 | 5.7%), together accounting for 77.6% of all Homer Glen residents.
| Ancestry | # Population | % Population |
| Albanian | 26 | 0.1% |
| American | 751 | 3.1% |
| Arab | 1,141 | 4.7% |
| Argentinean | 19 | 0.1% |
| Armenian | 76 | 0.3% |
| Assyrian / Chaldean / Syriac | 20 | 0.1% |
| Austrian | 154 | 0.6% |
| Belgian | 93 | 0.4% |
| Bhutanese | 5 | 0.0% |
| British | 34 | 0.1% |
| Burmese | 103 | 0.4% |
| Central American | 40 | 0.2% |
| Central American Indian | 34 | 0.1% |
| Cherokee | 2 | 0.0% |
| Colombian | 6 | 0.0% |
| Croatian | 212 | 0.9% |
| Cuban | 59 | 0.2% |
| Czech | 715 | 2.9% |
| Czechoslovakian | 65 | 0.3% |
| Danish | 90 | 0.4% |
| Dutch | 654 | 2.7% |
| Eastern European | 98 | 0.4% |
| Ecuadorian | 46 | 0.2% |
| English | 1,211 | 4.9% |
| Ethiopian | 3 | 0.0% |
| European | 186 | 0.8% |
| French | 298 | 1.2% |
| French Canadian | 80 | 0.3% |
| German | 3,979 | 16.2% |
| Greek | 198 | 0.8% |
| Guatemalan | 25 | 0.1% |
| Hungarian | 126 | 0.5% |
| Indian (Asian) | 244 | 1.0% |
| Irish | 4,141 | 16.9% |
| Israeli | 23 | 0.1% |
| Italian | 3,060 | 12.5% |
| Jordanian | 181 | 0.7% |
| Korean | 265 | 1.1% |
| Latvian | 22 | 0.1% |
| Lithuanian | 1,064 | 4.3% |
| Luxembourger | 6 | 0.0% |
| Mexican | 1,406 | 5.7% |
| Nicaraguan | 15 | 0.1% |
| Nigerian | 21 | 0.1% |
| Northern European | 13 | 0.1% |
| Norwegian | 82 | 0.3% |
| Pakistani | 2 | 0.0% |
| Palestinian | 429 | 1.8% |
| Polish | 6,421 | 26.2% |
| Puerto Rican | 197 | 0.8% |
| Russian | 117 | 0.5% |
| Scandinavian | 19 | 0.1% |
| Scotch-Irish | 183 | 0.7% |
| Scottish | 263 | 1.1% |
| Serbian | 106 | 0.4% |
| Slavic | 3 | 0.0% |
| Slovak | 114 | 0.5% |
| Slovene | 97 | 0.4% |
| South American | 71 | 0.3% |
| Spaniard | 21 | 0.1% |
| Spanish | 33 | 0.1% |
| Sri Lankan | 16 | 0.1% |
| Subsaharan African | 24 | 0.1% |
| Swedish | 551 | 2.2% |
| Syrian | 103 | 0.4% |
| Thai | 95 | 0.4% |
| Ukrainian | 165 | 0.7% |
| Welsh | 32 | 0.1% |
| Yugoslavian | 19 | 0.1% | View All 69 Rows |
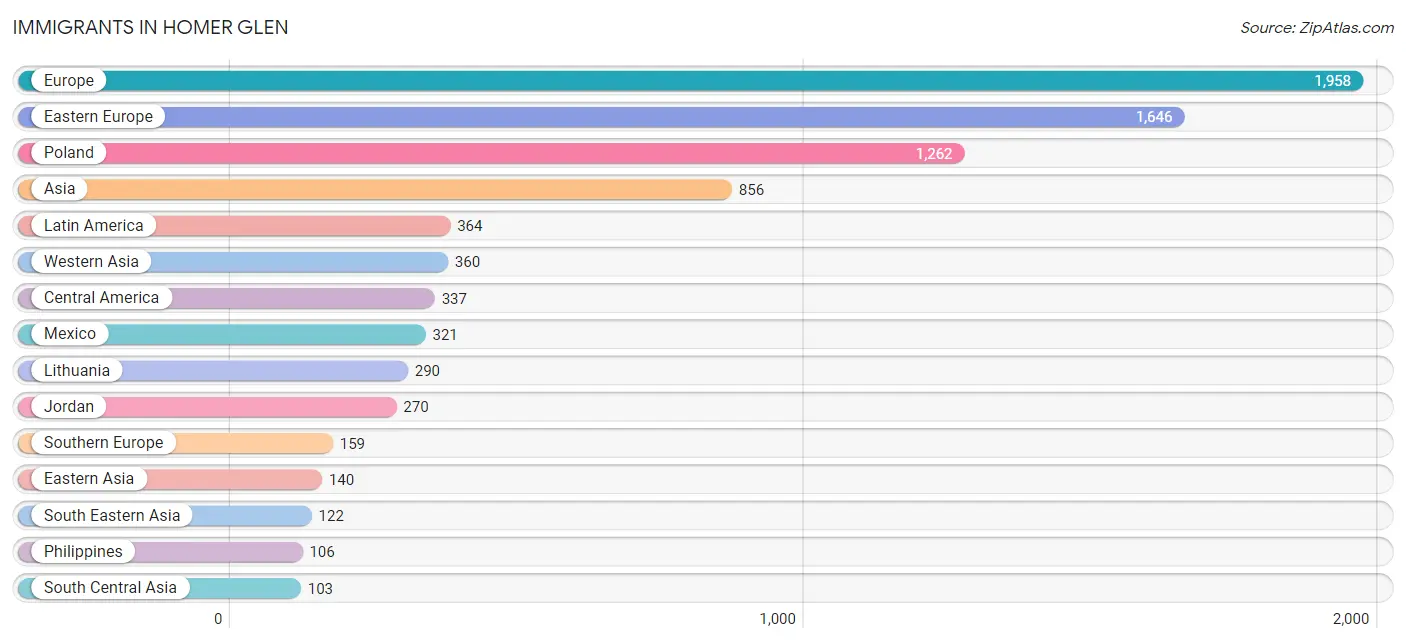
Immigrants in Homer Glen
The most numerous immigrant groups reported in Homer Glen came from Europe (1,958 | 8.0%), Eastern Europe (1,646 | 6.7%), Poland (1,262 | 5.1%), Asia (856 | 3.5%), and Latin America (364 | 1.5%), together accounting for 24.8% of all Homer Glen residents.
| Immigration Origin | # Population | % Population |
| Africa | 16 | 0.1% |
| Argentina | 9 | 0.0% |
| Asia | 856 | 3.5% |
| Austria | 11 | 0.0% |
| Bosnia and Herzegovina | 7 | 0.0% |
| Canada | 10 | 0.0% |
| Central America | 337 | 1.4% |
| China | 97 | 0.4% |
| Colombia | 6 | 0.0% |
| Croatia | 24 | 0.1% |
| Czechoslovakia | 6 | 0.0% |
| Eastern Africa | 3 | 0.0% |
| Eastern Asia | 140 | 0.6% |
| Eastern Europe | 1,646 | 6.7% |
| Ecuador | 12 | 0.1% |
| England | 43 | 0.2% |
| Ethiopia | 3 | 0.0% |
| Europe | 1,958 | 8.0% |
| Germany | 66 | 0.3% |
| Greece | 60 | 0.2% |
| India | 75 | 0.3% |
| Ireland | 2 | 0.0% |
| Israel | 31 | 0.1% |
| Italy | 99 | 0.4% |
| Jordan | 270 | 1.1% |
| Korea | 43 | 0.2% |
| Kuwait | 14 | 0.1% |
| Latin America | 364 | 1.5% |
| Lithuania | 290 | 1.2% |
| Mexico | 321 | 1.3% |
| Netherlands | 10 | 0.0% |
| Northern Africa | 13 | 0.1% |
| Northern Europe | 66 | 0.3% |
| Pakistan | 28 | 0.1% |
| Panama | 16 | 0.1% |
| Philippines | 106 | 0.4% |
| Poland | 1,262 | 5.1% |
| Russia | 2 | 0.0% |
| Serbia | 7 | 0.0% |
| South America | 27 | 0.1% |
| South Central Asia | 103 | 0.4% |
| South Eastern Asia | 122 | 0.5% |
| Southern Europe | 159 | 0.6% |
| Syria | 45 | 0.2% |
| Ukraine | 19 | 0.1% |
| Vietnam | 16 | 0.1% |
| Western Asia | 360 | 1.5% |
| Western Europe | 87 | 0.4% | View All 48 Rows |
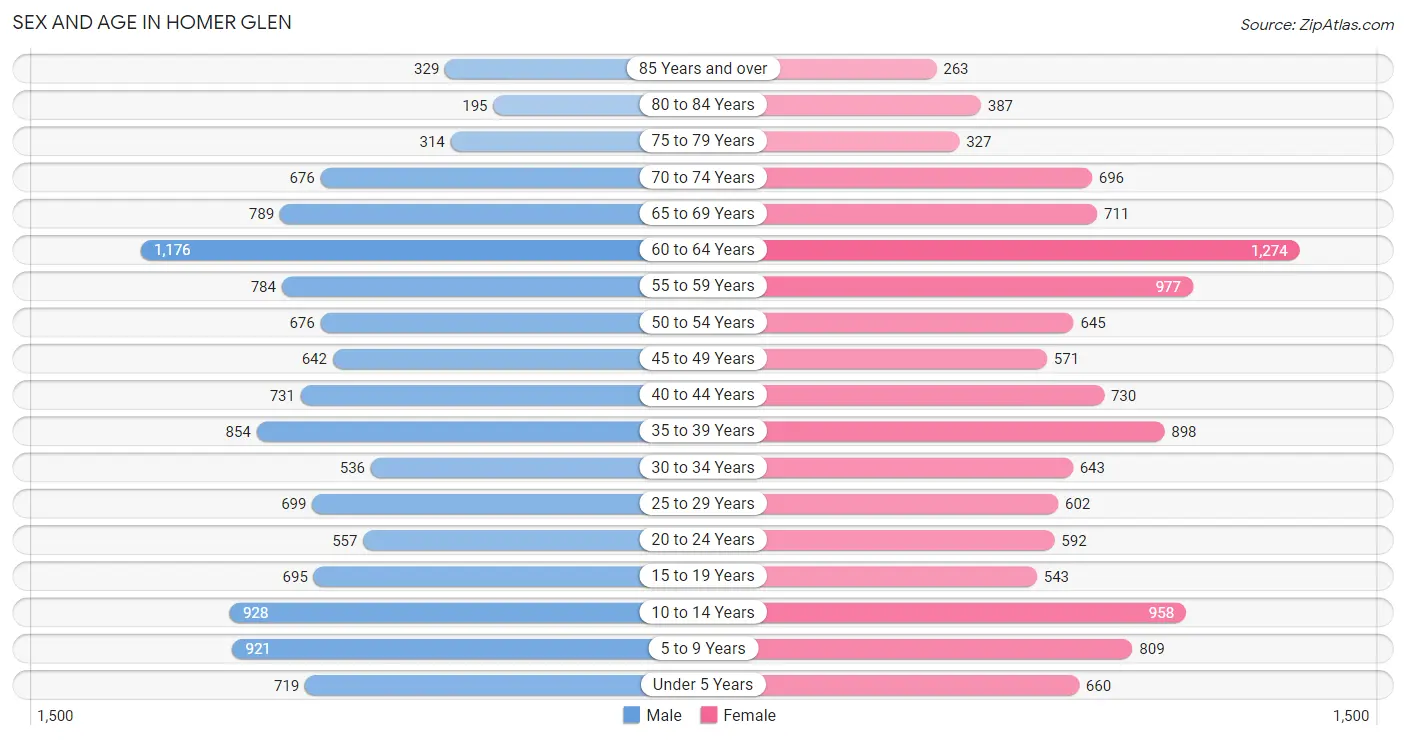
Sex and Age in Homer Glen
Sex and Age in Homer Glen
The most populous age groups in Homer Glen are 60 to 64 Years (1,176 | 9.6%) for men and 60 to 64 Years (1,274 | 10.4%) for women.
| Age Bracket | Male | Female |
| Under 5 Years | 719 (5.9%) | 660 (5.4%) |
| 5 to 9 Years | 921 (7.5%) | 809 (6.6%) |
| 10 to 14 Years | 928 (7.6%) | 958 (7.8%) |
| 15 to 19 Years | 695 (5.7%) | 543 (4.4%) |
| 20 to 24 Years | 557 (4.6%) | 592 (4.8%) |
| 25 to 29 Years | 699 (5.7%) | 602 (4.9%) |
| 30 to 34 Years | 536 (4.4%) | 643 (5.2%) |
| 35 to 39 Years | 854 (7.0%) | 898 (7.3%) |
| 40 to 44 Years | 731 (6.0%) | 730 (5.9%) |
| 45 to 49 Years | 642 (5.2%) | 571 (4.6%) |
| 50 to 54 Years | 676 (5.5%) | 645 (5.2%) |
| 55 to 59 Years | 784 (6.4%) | 977 (8.0%) |
| 60 to 64 Years | 1,176 (9.6%) | 1,274 (10.4%) |
| 65 to 69 Years | 789 (6.5%) | 711 (5.8%) |
| 70 to 74 Years | 676 (5.5%) | 696 (5.7%) |
| 75 to 79 Years | 314 (2.6%) | 327 (2.7%) |
| 80 to 84 Years | 195 (1.6%) | 387 (3.2%) |
| 85 Years and over | 329 (2.7%) | 263 (2.1%) |
| Total | 12,221 (100.0%) | 12,286 (100.0%) |
Families and Households in Homer Glen
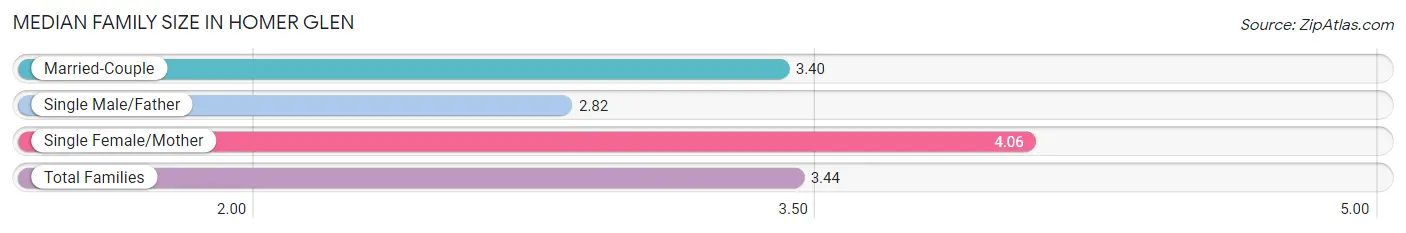
Median Family Size in Homer Glen
The median family size in Homer Glen is 3.44 persons per family, with single female/mother families (494 | 7.6%) accounting for the largest median family size of 4.06 persons per family. On the other hand, single male/father families (129 | 2.0%) represent the smallest median family size with 2.82 persons per family.
| Family Type | # Families | Family Size |
| Married-Couple | 5,852 (90.4%) | 3.40 |
| Single Male/Father | 129 (2.0%) | 2.82 |
| Single Female/Mother | 494 (7.6%) | 4.06 |
| Total Families | 6,475 (100.0%) | 3.44 |
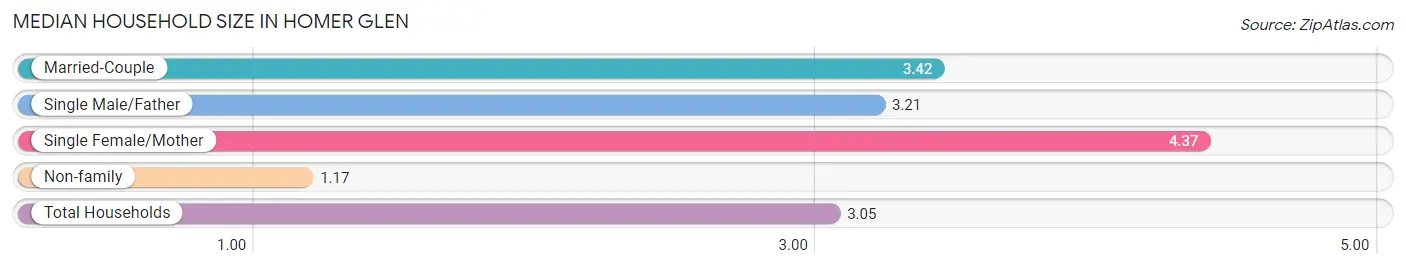
Median Household Size in Homer Glen
The median household size in Homer Glen is 3.05 persons per household, with single female/mother households (494 | 6.2%) accounting for the largest median household size of 4.37 persons per household. non-family households (1,506 | 18.9%) represent the smallest median household size with 1.17 persons per household.
| Household Type | # Households | Household Size |
| Married-Couple | 5,852 (73.3%) | 3.42 |
| Single Male/Father | 129 (1.6%) | 3.21 |
| Single Female/Mother | 494 (6.2%) | 4.37 |
| Non-family | 1,506 (18.9%) | 1.17 |
| Total Households | 7,981 (100.0%) | 3.05 |
Household Size by Marriage Status in Homer Glen
Out of a total of 7,981 households in Homer Glen, 6,475 (81.1%) are family households, while 1,506 (18.9%) are nonfamily households. The most numerous type of family households are 2-person households, comprising 2,598, and the most common type of nonfamily households are 1-person households, comprising 1,310.
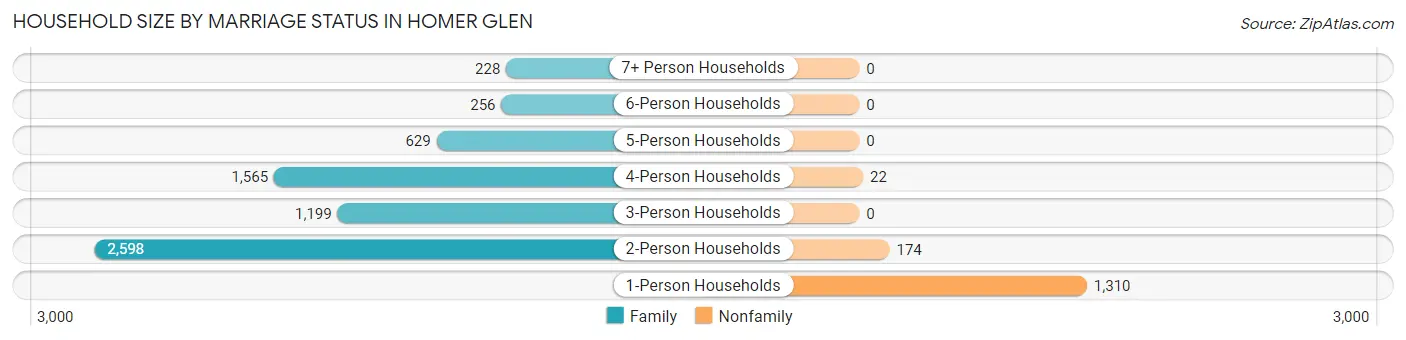
| Household Size | Family Households | Nonfamily Households |
| 1-Person Households | - | 1,310 (16.4%) |
| 2-Person Households | 2,598 (32.6%) | 174 (2.2%) |
| 3-Person Households | 1,199 (15.0%) | 0 (0.0%) |
| 4-Person Households | 1,565 (19.6%) | 22 (0.3%) |
| 5-Person Households | 629 (7.9%) | 0 (0.0%) |
| 6-Person Households | 256 (3.2%) | 0 (0.0%) |
| 7+ Person Households | 228 (2.9%) | 0 (0.0%) |
| Total | 6,475 (81.1%) | 1,506 (18.9%) |
Female Fertility in Homer Glen
Fertility by Age in Homer Glen
Average fertility rate in Homer Glen is 70.0 births per 1,000 women. Women in the age bracket of 20 to 34 years have the highest fertility rate with 112.0 births per 1,000 women. Women in the age bracket of 20 to 34 years acount for 62.5% of all women with births.
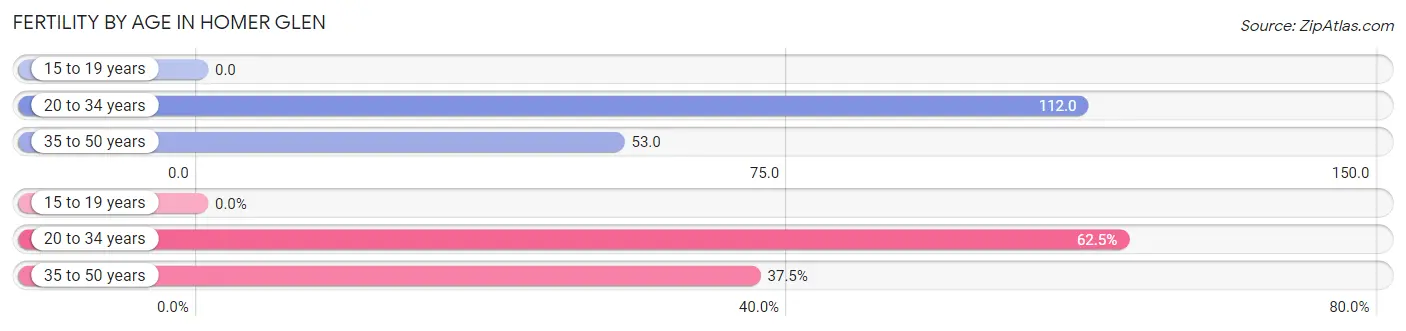
| Age Bracket | Women with Births | Births / 1,000 Women |
| 15 to 19 years | 0 (0.0%) | 0.0 |
| 20 to 34 years | 205 (62.5%) | 112.0 |
| 35 to 50 years | 123 (37.5%) | 53.0 |
| Total | 328 (100.0%) | 70.0 |
Fertility by Age by Marriage Status in Homer Glen
93.0% of women with births (328) in Homer Glen are married. The highest percentage of unmarried women with births falls into 35 to 50 years age bracket with 18.7% of them unmarried at the time of birth, while the lowest percentage of unmarried women with births belong to 20 to 34 years age bracket with 0.0% of them unmarried.
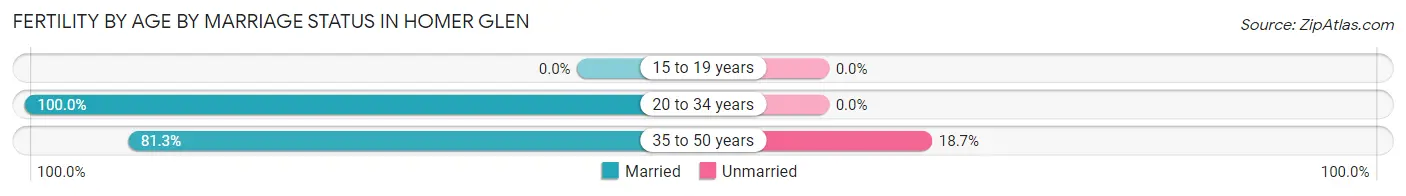
| Age Bracket | Married | Unmarried |
| 15 to 19 years | 0 (0.0%) | 0 (0.0%) |
| 20 to 34 years | 205 (100.0%) | 0 (0.0%) |
| 35 to 50 years | 100 (81.3%) | 23 (18.7%) |
| Total | 305 (93.0%) | 23 (7.0%) |
Fertility by Education in Homer Glen
Average fertility rate in Homer Glen is 70.0 births per 1,000 women. Women with the education attainment of graduate degree have the highest fertility rate of 134.0 births per 1,000 women, while women with the education attainment of less than high school have the lowest fertility at 6.0 births per 1,000 women. Women with the education attainment of graduate degree represent 32.9% of all women with births.
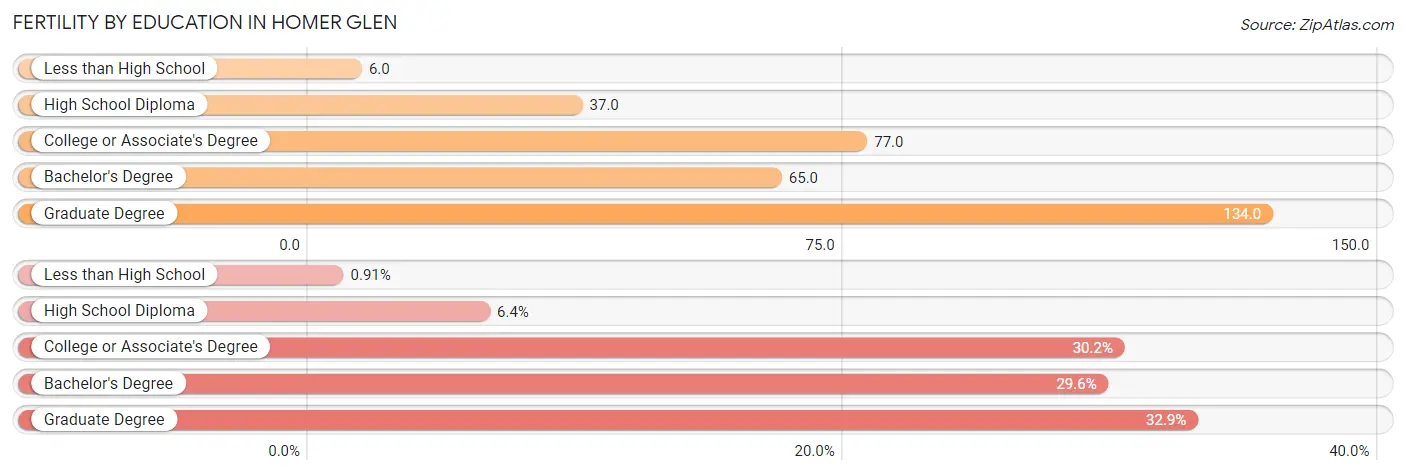
| Educational Attainment | Women with Births | Births / 1,000 Women |
| Less than High School | 3 (0.9%) | 6.0 |
| High School Diploma | 21 (6.4%) | 37.0 |
| College or Associate's Degree | 99 (30.2%) | 77.0 |
| Bachelor's Degree | 97 (29.6%) | 65.0 |
| Graduate Degree | 108 (32.9%) | 134.0 |
| Total | 328 (100.0%) | 70.0 |
Fertility by Education by Marriage Status in Homer Glen
7.0% of women with births in Homer Glen are unmarried. Women with the educational attainment of less than high school are most likely to be married with 100.0% of them married at childbirth, while women with the educational attainment of college or associate's degree are least likely to be married with 23.2% of them unmarried at childbirth.
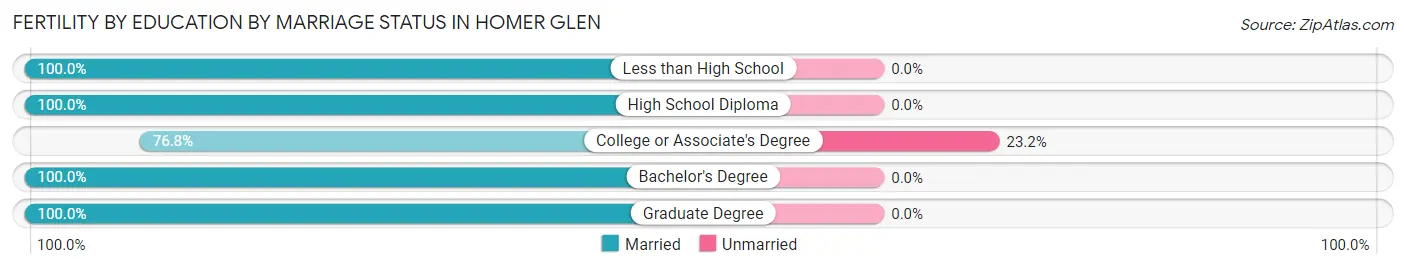
| Educational Attainment | Married | Unmarried |
| Less than High School | 3 (100.0%) | 0 (0.0%) |
| High School Diploma | 21 (100.0%) | 0 (0.0%) |
| College or Associate's Degree | 76 (76.8%) | 23 (23.2%) |
| Bachelor's Degree | 97 (100.0%) | 0 (0.0%) |
| Graduate Degree | 108 (100.0%) | 0 (0.0%) |
| Total | 305 (93.0%) | 23 (7.0%) |
Employment Characteristics in Homer Glen
Employment by Class of Employer in Homer Glen
Among the 11,680 employed individuals in Homer Glen, private company employees (8,283 | 70.9%), local government employees (1,004 | 8.6%), and not-for-profit organizations (853 | 7.3%) make up the most common classes of employment.
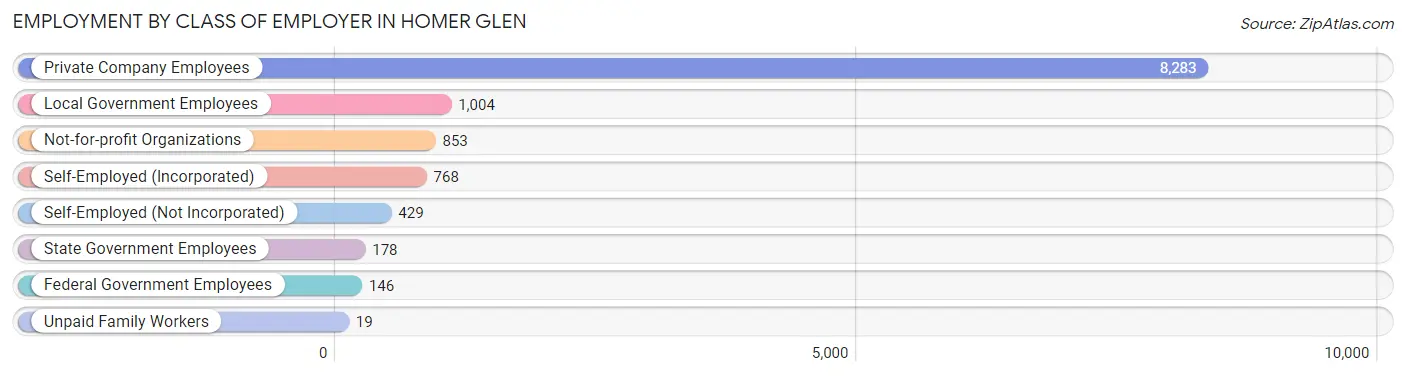
| Employer Class | # Employees | % Employees |
| Private Company Employees | 8,283 | 70.9% |
| Self-Employed (Incorporated) | 768 | 6.6% |
| Self-Employed (Not Incorporated) | 429 | 3.7% |
| Not-for-profit Organizations | 853 | 7.3% |
| Local Government Employees | 1,004 | 8.6% |
| State Government Employees | 178 | 1.5% |
| Federal Government Employees | 146 | 1.3% |
| Unpaid Family Workers | 19 | 0.2% |
| Total | 11,680 | 100.0% |
Employment Status by Age in Homer Glen
According to the labor force statistics for Homer Glen, out of the total population over 16 years of age (19,137), 65.4% or 12,516 individuals are in the labor force, with 5.0% or 626 of them unemployed. The age group with the highest labor force participation rate is 35 to 44 years, with 90.3% or 2,901 individuals in the labor force. Within the labor force, the 75 years and over age range has the highest percentage of unemployed individuals, with 19.0% or 22 of them being unemployed.
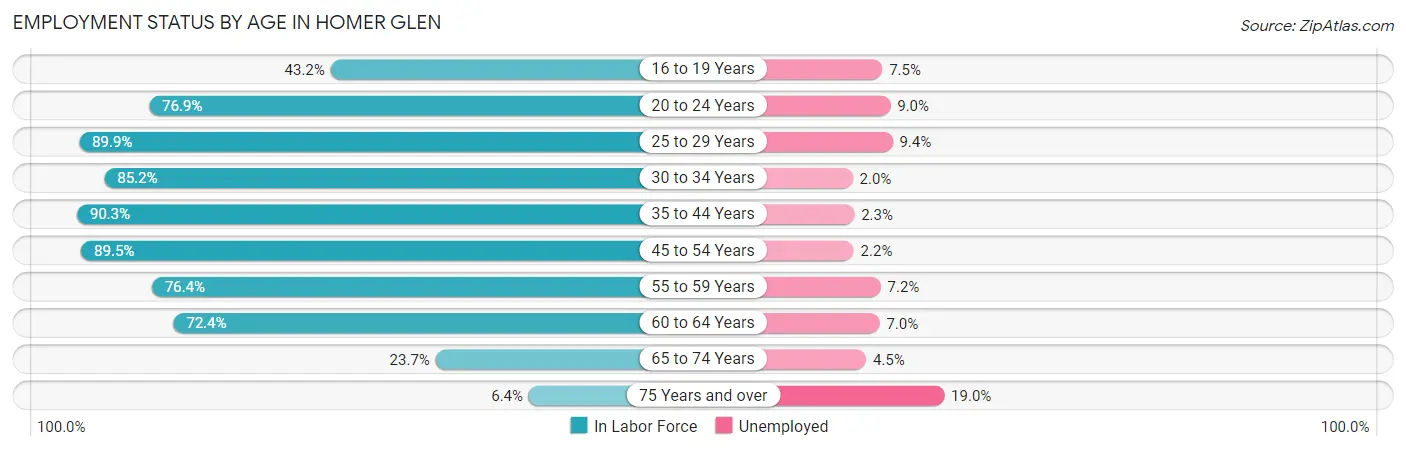
| Age Bracket | In Labor Force | Unemployed |
| 16 to 19 Years | 373 (43.2%) | 28 (7.5%) |
| 20 to 24 Years | 884 (76.9%) | 80 (9.0%) |
| 25 to 29 Years | 1,170 (89.9%) | 110 (9.4%) |
| 30 to 34 Years | 1,005 (85.2%) | 20 (2.0%) |
| 35 to 44 Years | 2,901 (90.3%) | 67 (2.3%) |
| 45 to 54 Years | 2,268 (89.5%) | 50 (2.2%) |
| 55 to 59 Years | 1,345 (76.4%) | 97 (7.2%) |
| 60 to 64 Years | 1,774 (72.4%) | 124 (7.0%) |
| 65 to 74 Years | 681 (23.7%) | 31 (4.5%) |
| 75 Years and over | 116 (6.4%) | 22 (19.0%) |
| Total | 12,516 (65.4%) | 626 (5.0%) |
Employment Status by Educational Attainment in Homer Glen
According to labor force statistics for Homer Glen, 84.1% of individuals (10,460) out of the total population between 25 and 64 years of age (12,438) are in the labor force, with 4.5% or 471 of them being unemployed. The group with the highest labor force participation rate are those with the educational attainment of bachelor's degree or higher, with 88.7% or 4,805 individuals in the labor force. Within the labor force, individuals with less than high school education have the highest percentage of unemployment, with 8.8% or 41 of them being unemployed.
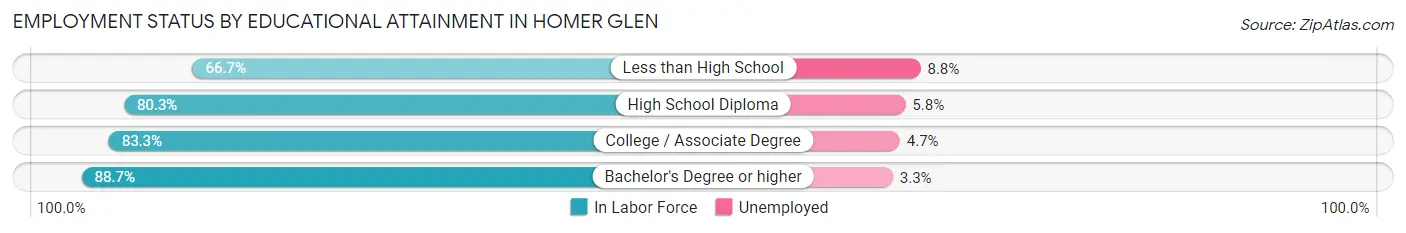
| Educational Attainment | In Labor Force | Unemployed |
| Less than High School | 467 (66.7%) | 62 (8.8%) |
| High School Diploma | 1,990 (80.3%) | 144 (5.8%) |
| College / Associate Degree | 3,201 (83.3%) | 181 (4.7%) |
| Bachelor's Degree or higher | 4,805 (88.7%) | 179 (3.3%) |
| Total | 10,460 (84.1%) | 560 (4.5%) |
Employment Occupations by Sex in Homer Glen
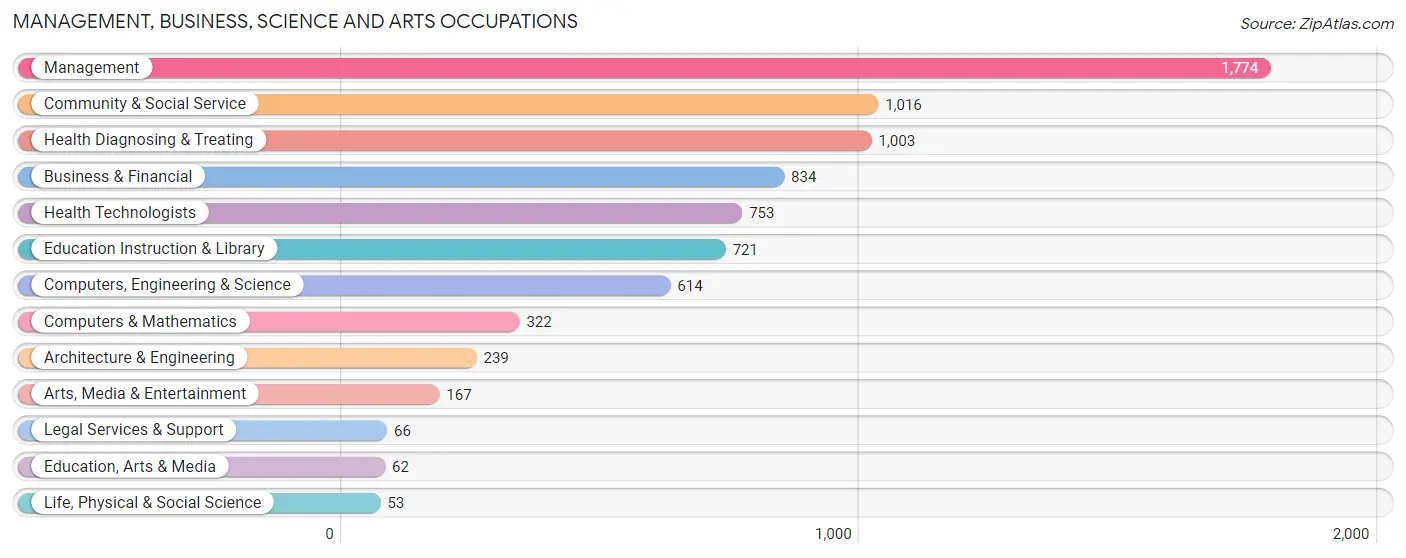
Management, Business, Science and Arts Occupations
The most common Management, Business, Science and Arts occupations in Homer Glen are Management (1,774 | 14.9%), Community & Social Service (1,016 | 8.6%), Health Diagnosing & Treating (1,003 | 8.4%), Business & Financial (834 | 7.0%), and Health Technologists (753 | 6.3%).
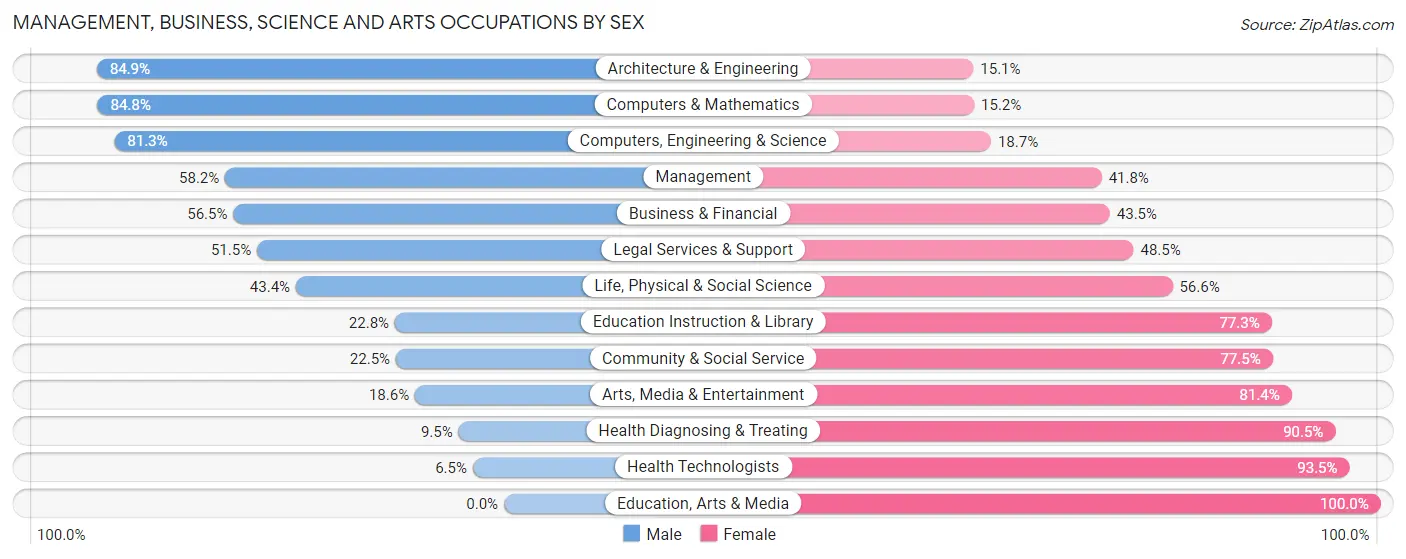
Management, Business, Science and Arts Occupations by Sex
Within the Management, Business, Science and Arts occupations in Homer Glen, the most male-oriented occupations are Architecture & Engineering (84.9%), Computers & Mathematics (84.8%), and Computers, Engineering & Science (81.3%), while the most female-oriented occupations are Education, Arts & Media (100.0%), Health Technologists (93.5%), and Health Diagnosing & Treating (90.5%).
| Occupation | Male | Female |
| Management | 1,032 (58.2%) | 742 (41.8%) |
| Business & Financial | 471 (56.5%) | 363 (43.5%) |
| Computers, Engineering & Science | 499 (81.3%) | 115 (18.7%) |
| Computers & Mathematics | 273 (84.8%) | 49 (15.2%) |
| Architecture & Engineering | 203 (84.9%) | 36 (15.1%) |
| Life, Physical & Social Science | 23 (43.4%) | 30 (56.6%) |
| Community & Social Service | 229 (22.5%) | 787 (77.5%) |
| Education, Arts & Media | 0 (0.0%) | 62 (100.0%) |
| Legal Services & Support | 34 (51.5%) | 32 (48.5%) |
| Education Instruction & Library | 164 (22.8%) | 557 (77.2%) |
| Arts, Media & Entertainment | 31 (18.6%) | 136 (81.4%) |
| Health Diagnosing & Treating | 95 (9.5%) | 908 (90.5%) |
| Health Technologists | 49 (6.5%) | 704 (93.5%) |
| Total (Category) | 2,326 (44.4%) | 2,915 (55.6%) |
| Total (Overall) | 6,170 (51.9%) | 5,712 (48.1%) |
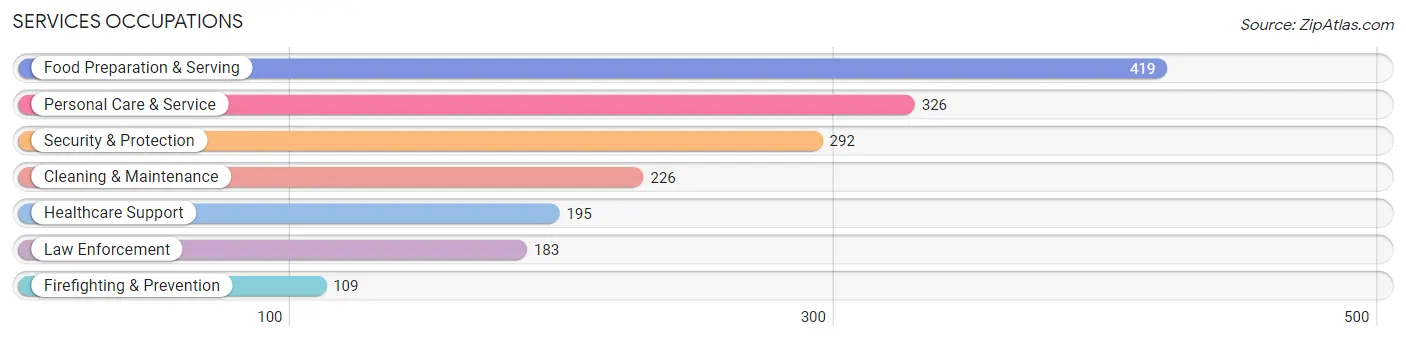
Services Occupations
The most common Services occupations in Homer Glen are Food Preparation & Serving (419 | 3.5%), Personal Care & Service (326 | 2.7%), Security & Protection (292 | 2.5%), Cleaning & Maintenance (226 | 1.9%), and Healthcare Support (195 | 1.6%).
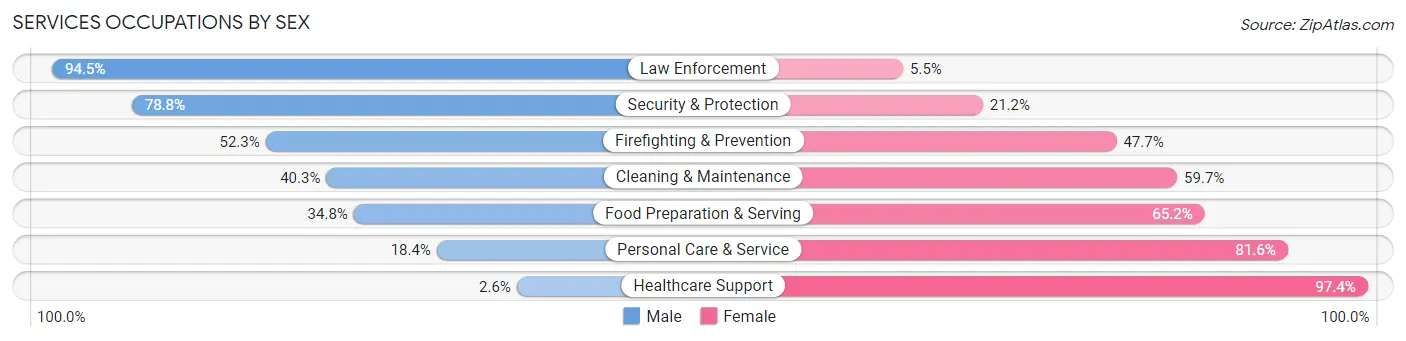
Services Occupations by Sex
Within the Services occupations in Homer Glen, the most male-oriented occupations are Law Enforcement (94.5%), Security & Protection (78.8%), and Firefighting & Prevention (52.3%), while the most female-oriented occupations are Healthcare Support (97.4%), Personal Care & Service (81.6%), and Food Preparation & Serving (65.2%).
| Occupation | Male | Female |
| Healthcare Support | 5 (2.6%) | 190 (97.4%) |
| Security & Protection | 230 (78.8%) | 62 (21.2%) |
| Firefighting & Prevention | 57 (52.3%) | 52 (47.7%) |
| Law Enforcement | 173 (94.5%) | 10 (5.5%) |
| Food Preparation & Serving | 146 (34.8%) | 273 (65.2%) |
| Cleaning & Maintenance | 91 (40.3%) | 135 (59.7%) |
| Personal Care & Service | 60 (18.4%) | 266 (81.6%) |
| Total (Category) | 532 (36.5%) | 926 (63.5%) |
| Total (Overall) | 6,170 (51.9%) | 5,712 (48.1%) |
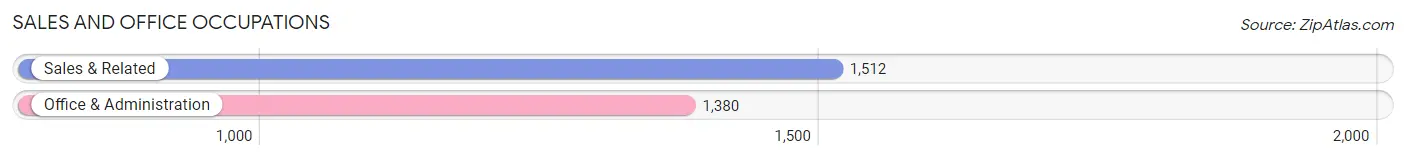
Sales and Office Occupations
The most common Sales and Office occupations in Homer Glen are Sales & Related (1,512 | 12.7%), and Office & Administration (1,380 | 11.6%).
Sales and Office Occupations by Sex
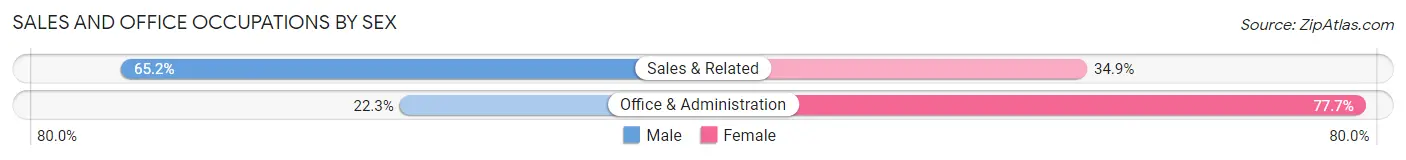
| Occupation | Male | Female |
| Sales & Related | 985 (65.1%) | 527 (34.8%) |
| Office & Administration | 308 (22.3%) | 1,072 (77.7%) |
| Total (Category) | 1,293 (44.7%) | 1,599 (55.3%) |
| Total (Overall) | 6,170 (51.9%) | 5,712 (48.1%) |
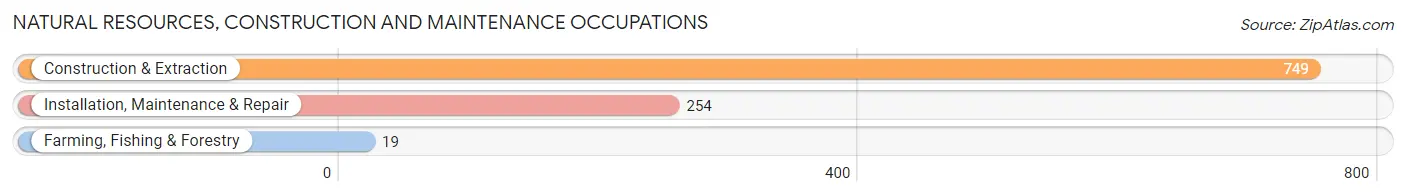
Natural Resources, Construction and Maintenance Occupations
The most common Natural Resources, Construction and Maintenance occupations in Homer Glen are Construction & Extraction (749 | 6.3%), Installation, Maintenance & Repair (254 | 2.1%), and Farming, Fishing & Forestry (19 | 0.2%).
Natural Resources, Construction and Maintenance Occupations by Sex
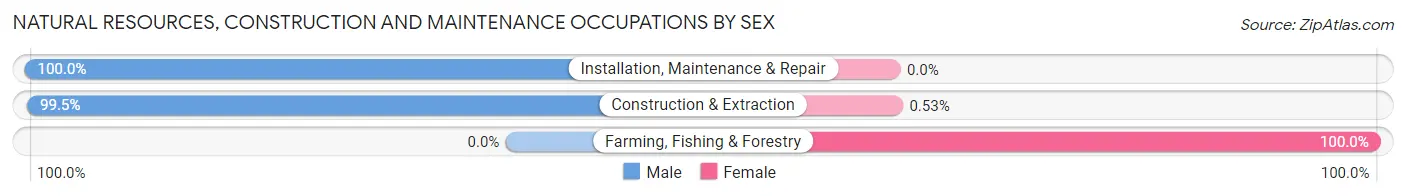
| Occupation | Male | Female |
| Farming, Fishing & Forestry | 0 (0.0%) | 19 (100.0%) |
| Construction & Extraction | 745 (99.5%) | 4 (0.5%) |
| Installation, Maintenance & Repair | 254 (100.0%) | 0 (0.0%) |
| Total (Category) | 999 (97.8%) | 23 (2.2%) |
| Total (Overall) | 6,170 (51.9%) | 5,712 (48.1%) |
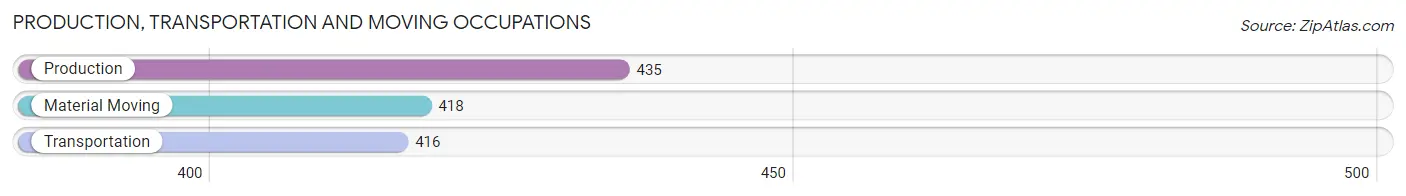
Production, Transportation and Moving Occupations
The most common Production, Transportation and Moving occupations in Homer Glen are Production (435 | 3.7%), Material Moving (418 | 3.5%), and Transportation (416 | 3.5%).
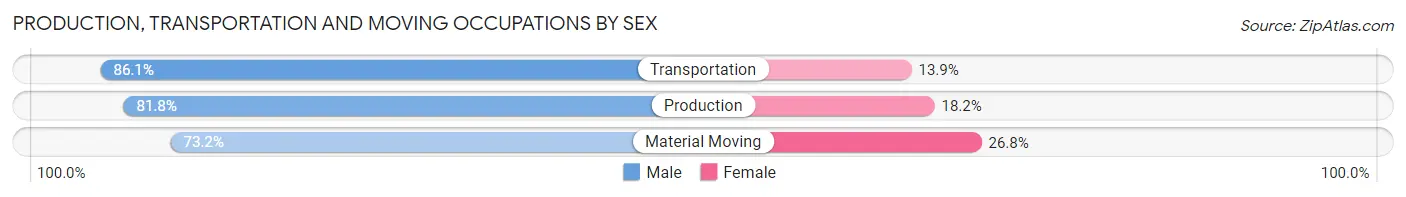
Production, Transportation and Moving Occupations by Sex
| Occupation | Male | Female |
| Production | 356 (81.8%) | 79 (18.2%) |
| Transportation | 358 (86.1%) | 58 (13.9%) |
| Material Moving | 306 (73.2%) | 112 (26.8%) |
| Total (Category) | 1,020 (80.4%) | 249 (19.6%) |
| Total (Overall) | 6,170 (51.9%) | 5,712 (48.1%) |
Employment Industries by Sex in Homer Glen
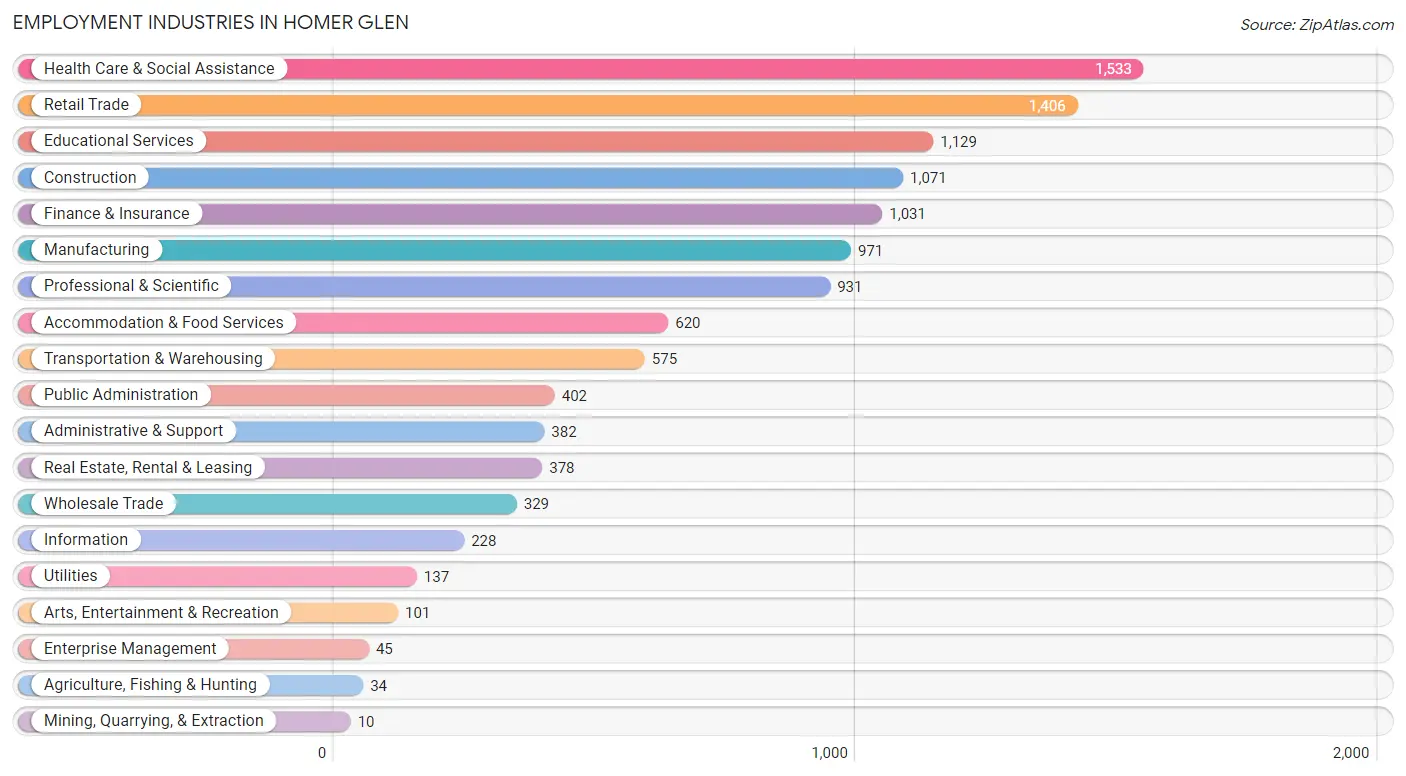
Employment Industries in Homer Glen
The major employment industries in Homer Glen include Health Care & Social Assistance (1,533 | 12.9%), Retail Trade (1,406 | 11.8%), Educational Services (1,129 | 9.5%), Construction (1,071 | 9.0%), and Finance & Insurance (1,031 | 8.7%).
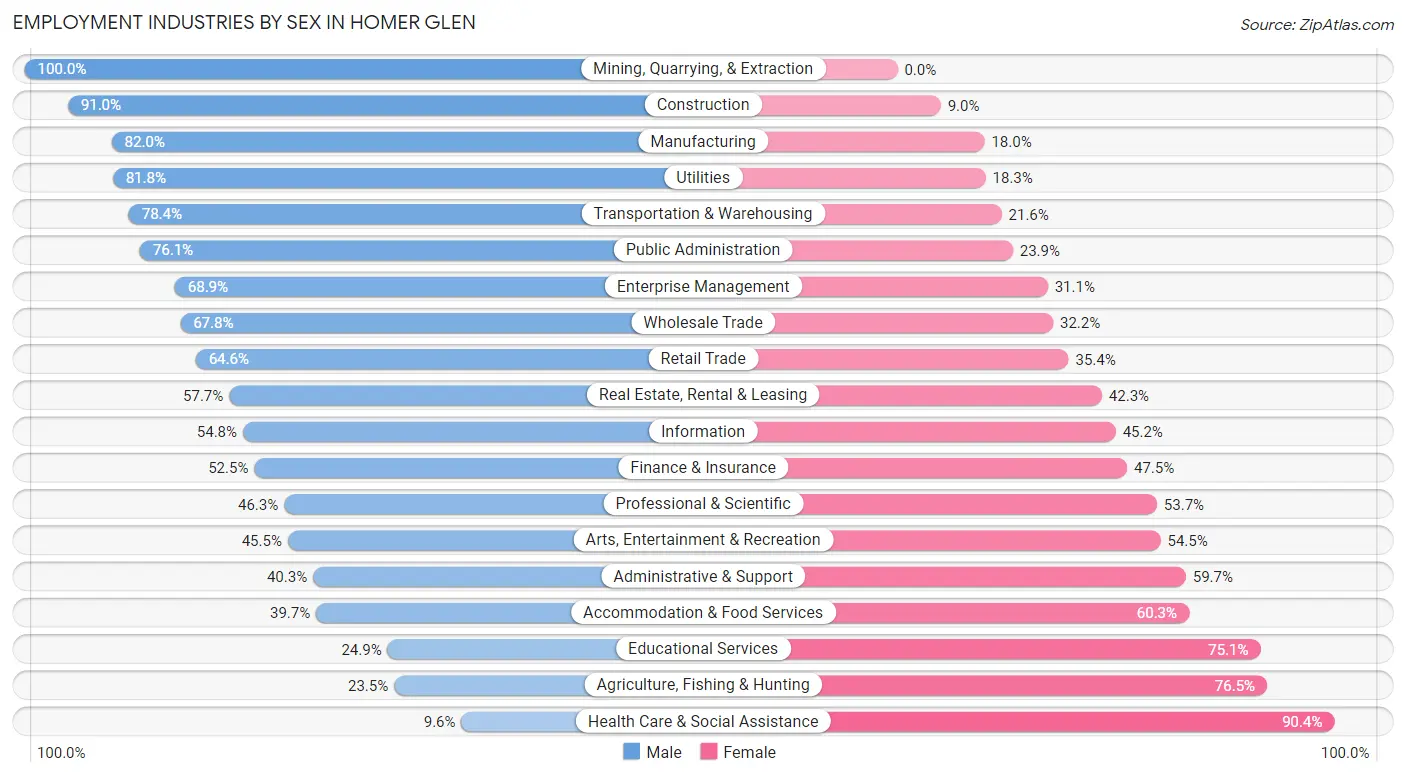
Employment Industries by Sex in Homer Glen
The Homer Glen industries that see more men than women are Mining, Quarrying, & Extraction (100.0%), Construction (91.0%), and Manufacturing (82.0%), whereas the industries that tend to have a higher number of women are Health Care & Social Assistance (90.4%), Agriculture, Fishing & Hunting (76.5%), and Educational Services (75.1%).
| Industry | Male | Female |
| Agriculture, Fishing & Hunting | 8 (23.5%) | 26 (76.5%) |
| Mining, Quarrying, & Extraction | 10 (100.0%) | 0 (0.0%) |
| Construction | 975 (91.0%) | 96 (9.0%) |
| Manufacturing | 796 (82.0%) | 175 (18.0%) |
| Wholesale Trade | 223 (67.8%) | 106 (32.2%) |
| Retail Trade | 908 (64.6%) | 498 (35.4%) |
| Transportation & Warehousing | 451 (78.4%) | 124 (21.6%) |
| Utilities | 112 (81.8%) | 25 (18.2%) |
| Information | 125 (54.8%) | 103 (45.2%) |
| Finance & Insurance | 541 (52.5%) | 490 (47.5%) |
| Real Estate, Rental & Leasing | 218 (57.7%) | 160 (42.3%) |
| Professional & Scientific | 431 (46.3%) | 500 (53.7%) |
| Enterprise Management | 31 (68.9%) | 14 (31.1%) |
| Administrative & Support | 154 (40.3%) | 228 (59.7%) |
| Educational Services | 281 (24.9%) | 848 (75.1%) |
| Health Care & Social Assistance | 147 (9.6%) | 1,386 (90.4%) |
| Arts, Entertainment & Recreation | 46 (45.5%) | 55 (54.5%) |
| Accommodation & Food Services | 246 (39.7%) | 374 (60.3%) |
| Public Administration | 306 (76.1%) | 96 (23.9%) |
| Total | 6,170 (51.9%) | 5,712 (48.1%) |
Education in Homer Glen
School Enrollment in Homer Glen
The most common levels of schooling among the 5,951 students in Homer Glen are middle school (1,559 | 26.2%), elementary school (1,332 | 22.4%), and high school (1,110 | 18.6%).
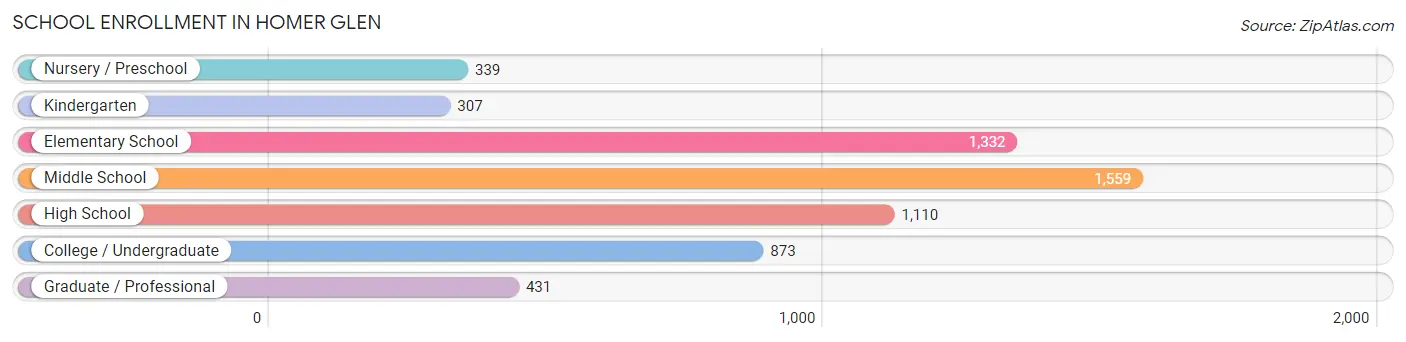
| School Level | # Students | % Students |
| Nursery / Preschool | 339 | 5.7% |
| Kindergarten | 307 | 5.2% |
| Elementary School | 1,332 | 22.4% |
| Middle School | 1,559 | 26.2% |
| High School | 1,110 | 18.6% |
| College / Undergraduate | 873 | 14.7% |
| Graduate / Professional | 431 | 7.2% |
| Total | 5,951 | 100.0% |
School Enrollment by Age by Funding Source in Homer Glen
Out of a total of 5,951 students who are enrolled in schools in Homer Glen, 881 (14.8%) attend a private institution, while the remaining 5,070 (85.2%) are enrolled in public schools. The age group of 3 to 4 year olds has the highest likelihood of being enrolled in private schools, with 117 (44.3% in the age bracket) enrolled. Conversely, the age group of 15 to 17 year olds has the lowest likelihood of being enrolled in a private school, with 737 (95.2% in the age bracket) attending a public institution.
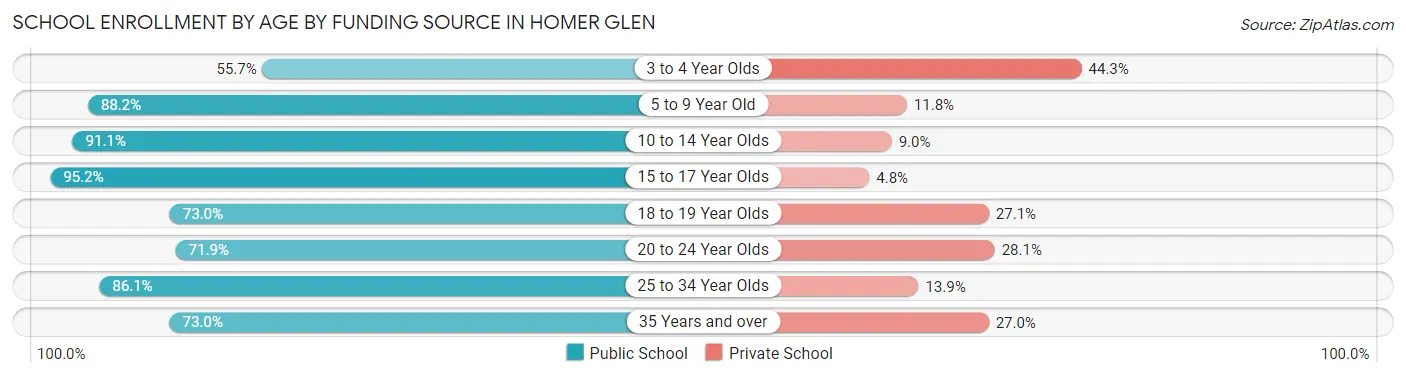
| Age Bracket | Public School | Private School |
| 3 to 4 Year Olds | 147 (55.7%) | 117 (44.3%) |
| 5 to 9 Year Old | 1,415 (88.2%) | 189 (11.8%) |
| 10 to 14 Year Olds | 1,688 (91.0%) | 166 (8.9%) |
| 15 to 17 Year Olds | 737 (95.2%) | 37 (4.8%) |
| 18 to 19 Year Olds | 240 (73.0%) | 89 (27.1%) |
| 20 to 24 Year Olds | 383 (71.9%) | 150 (28.1%) |
| 25 to 34 Year Olds | 179 (86.1%) | 29 (13.9%) |
| 35 Years and over | 281 (73.0%) | 104 (27.0%) |
| Total | 5,070 (85.2%) | 881 (14.8%) |
Educational Attainment by Field of Study in Homer Glen
Business (1,872 | 27.0%), science & technology (1,046 | 15.1%), education (925 | 13.4%), engineering (665 | 9.6%), and communications (388 | 5.6%) are the most common fields of study among 6,922 individuals in Homer Glen who have obtained a bachelor's degree or higher.
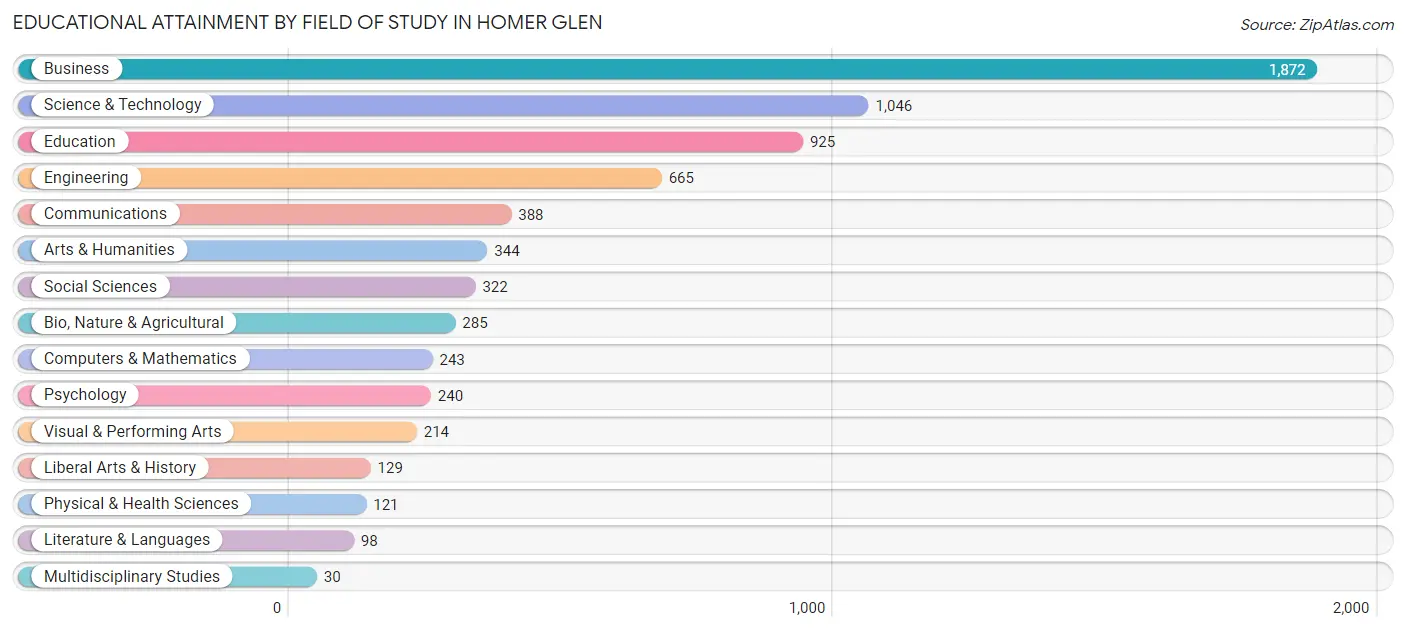
| Field of Study | # Graduates | % Graduates |
| Computers & Mathematics | 243 | 3.5% |
| Bio, Nature & Agricultural | 285 | 4.1% |
| Physical & Health Sciences | 121 | 1.8% |
| Psychology | 240 | 3.5% |
| Social Sciences | 322 | 4.6% |
| Engineering | 665 | 9.6% |
| Multidisciplinary Studies | 30 | 0.4% |
| Science & Technology | 1,046 | 15.1% |
| Business | 1,872 | 27.0% |
| Education | 925 | 13.4% |
| Literature & Languages | 98 | 1.4% |
| Liberal Arts & History | 129 | 1.9% |
| Visual & Performing Arts | 214 | 3.1% |
| Communications | 388 | 5.6% |
| Arts & Humanities | 344 | 5.0% |
| Total | 6,922 | 100.0% |
Transportation & Commute in Homer Glen
Vehicle Availability by Sex in Homer Glen
The most prevalent vehicle ownership categories in Homer Glen are males with 2 vehicles (2,641, accounting for 43.4%) and females with 2 vehicles (2,306, making up 47.3%).
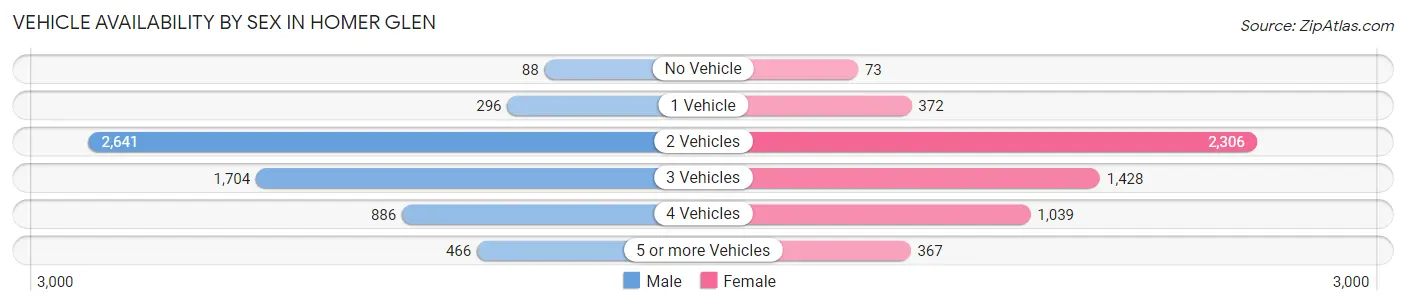
| Vehicles Available | Male | Female |
| No Vehicle | 88 (1.5%) | 73 (1.3%) |
| 1 Vehicle | 296 (4.9%) | 372 (6.7%) |
| 2 Vehicles | 2,641 (43.4%) | 2,306 (41.3%) |
| 3 Vehicles | 1,704 (28.0%) | 1,428 (25.6%) |
| 4 Vehicles | 886 (14.6%) | 1,039 (18.6%) |
| 5 or more Vehicles | 466 (7.7%) | 367 (6.6%) |
| Total | 6,081 (100.0%) | 5,585 (100.0%) |
Commute Time in Homer Glen
The most frequently occuring commute durations in Homer Glen are 45 to 59 minutes (1,696 commuters, 16.4%), 30 to 34 minutes (1,678 commuters, 16.3%), and 60 to 89 minutes (1,151 commuters, 11.2%).
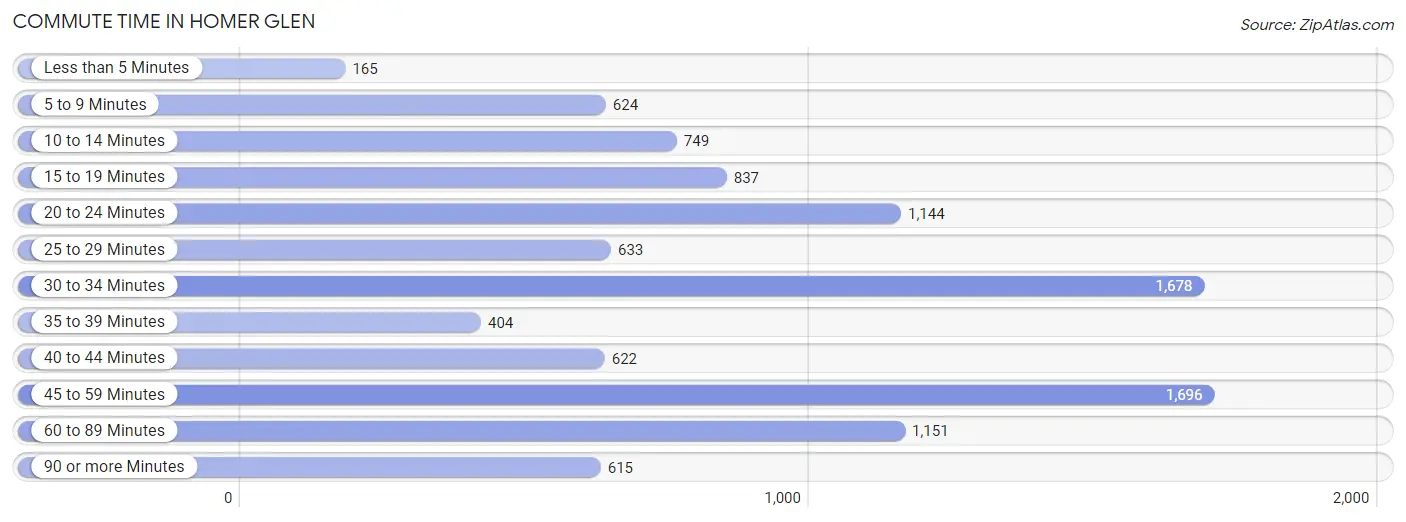
| Commute Time | # Commuters | % Commuters |
| Less than 5 Minutes | 165 | 1.6% |
| 5 to 9 Minutes | 624 | 6.0% |
| 10 to 14 Minutes | 749 | 7.3% |
| 15 to 19 Minutes | 837 | 8.1% |
| 20 to 24 Minutes | 1,144 | 11.1% |
| 25 to 29 Minutes | 633 | 6.1% |
| 30 to 34 Minutes | 1,678 | 16.3% |
| 35 to 39 Minutes | 404 | 3.9% |
| 40 to 44 Minutes | 622 | 6.0% |
| 45 to 59 Minutes | 1,696 | 16.4% |
| 60 to 89 Minutes | 1,151 | 11.2% |
| 90 or more Minutes | 615 | 6.0% |
Commute Time by Sex in Homer Glen
The most common commute times in Homer Glen are 45 to 59 minutes (1,115 commuters, 20.3%) for males and 30 to 34 minutes (818 commuters, 17.0%) for females.
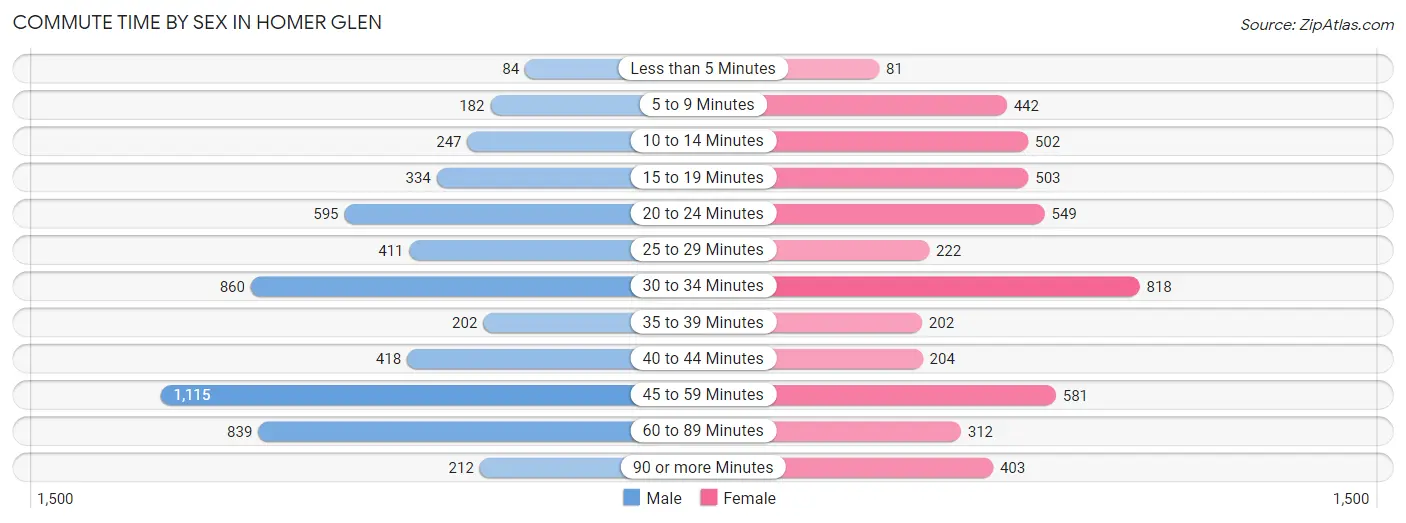
| Commute Time | Male | Female |
| Less than 5 Minutes | 84 (1.5%) | 81 (1.7%) |
| 5 to 9 Minutes | 182 (3.3%) | 442 (9.2%) |
| 10 to 14 Minutes | 247 (4.5%) | 502 (10.4%) |
| 15 to 19 Minutes | 334 (6.1%) | 503 (10.4%) |
| 20 to 24 Minutes | 595 (10.8%) | 549 (11.4%) |
| 25 to 29 Minutes | 411 (7.5%) | 222 (4.6%) |
| 30 to 34 Minutes | 860 (15.6%) | 818 (17.0%) |
| 35 to 39 Minutes | 202 (3.7%) | 202 (4.2%) |
| 40 to 44 Minutes | 418 (7.6%) | 204 (4.2%) |
| 45 to 59 Minutes | 1,115 (20.3%) | 581 (12.1%) |
| 60 to 89 Minutes | 839 (15.3%) | 312 (6.5%) |
| 90 or more Minutes | 212 (3.9%) | 403 (8.4%) |
Time of Departure to Work by Sex in Homer Glen
The most frequent times of departure to work in Homer Glen are 7:00 AM to 7:29 AM (834, 15.2%) for males and 7:00 AM to 7:29 AM (873, 18.1%) for females.
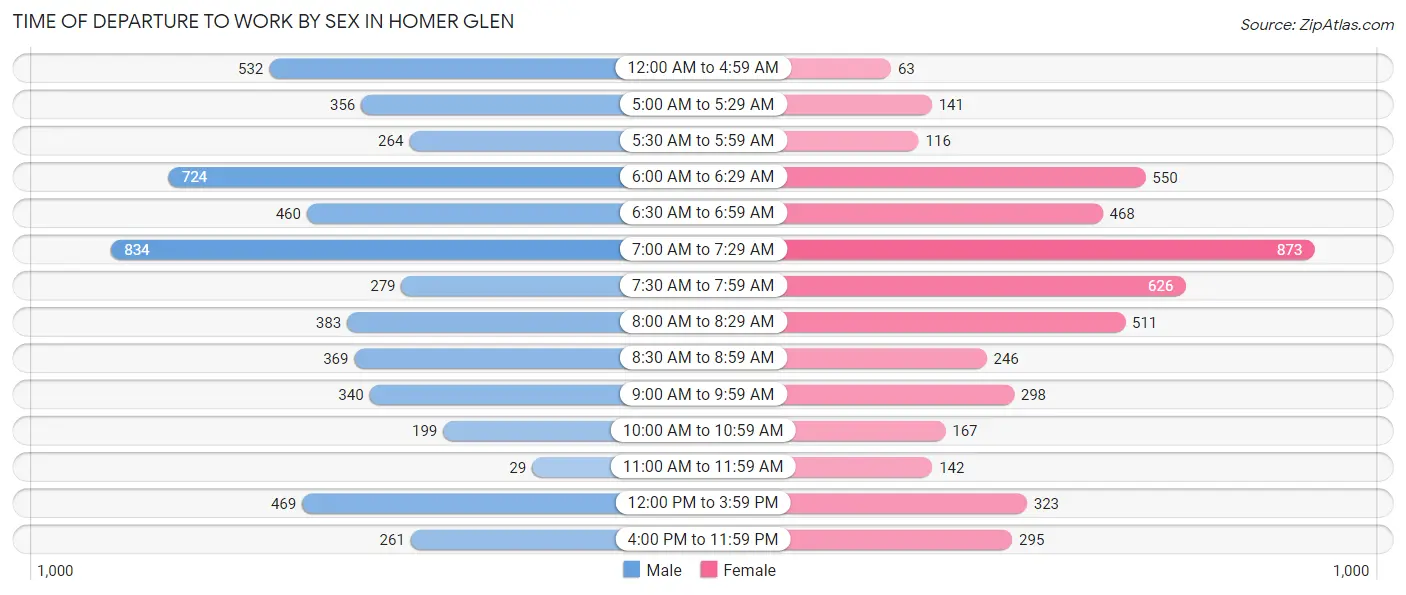
| Time of Departure | Male | Female |
| 12:00 AM to 4:59 AM | 532 (9.7%) | 63 (1.3%) |
| 5:00 AM to 5:29 AM | 356 (6.5%) | 141 (2.9%) |
| 5:30 AM to 5:59 AM | 264 (4.8%) | 116 (2.4%) |
| 6:00 AM to 6:29 AM | 724 (13.2%) | 550 (11.4%) |
| 6:30 AM to 6:59 AM | 460 (8.4%) | 468 (9.7%) |
| 7:00 AM to 7:29 AM | 834 (15.2%) | 873 (18.1%) |
| 7:30 AM to 7:59 AM | 279 (5.1%) | 626 (13.0%) |
| 8:00 AM to 8:29 AM | 383 (7.0%) | 511 (10.6%) |
| 8:30 AM to 8:59 AM | 369 (6.7%) | 246 (5.1%) |
| 9:00 AM to 9:59 AM | 340 (6.2%) | 298 (6.2%) |
| 10:00 AM to 10:59 AM | 199 (3.6%) | 167 (3.5%) |
| 11:00 AM to 11:59 AM | 29 (0.5%) | 142 (2.9%) |
| 12:00 PM to 3:59 PM | 469 (8.5%) | 323 (6.7%) |
| 4:00 PM to 11:59 PM | 261 (4.8%) | 295 (6.1%) |
| Total | 5,499 (100.0%) | 4,819 (100.0%) |
Housing Occupancy in Homer Glen
Occupancy by Ownership in Homer Glen
Of the total 7,981 dwellings in Homer Glen, owner-occupied units account for 7,521 (94.2%), while renter-occupied units make up 460 (5.8%).
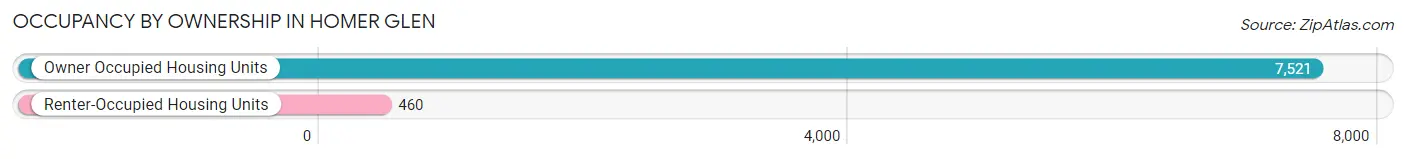
| Occupancy | # Housing Units | % Housing Units |
| Owner Occupied Housing Units | 7,521 | 94.2% |
| Renter-Occupied Housing Units | 460 | 5.8% |
| Total Occupied Housing Units | 7,981 | 100.0% |
Occupancy by Household Size in Homer Glen
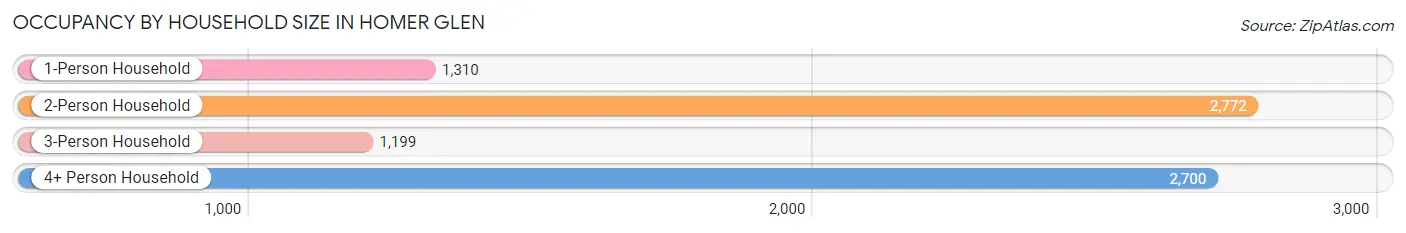
| Household Size | # Housing Units | % Housing Units |
| 1-Person Household | 1,310 | 16.4% |
| 2-Person Household | 2,772 | 34.7% |
| 3-Person Household | 1,199 | 15.0% |
| 4+ Person Household | 2,700 | 33.8% |
| Total Housing Units | 7,981 | 100.0% |
Occupancy by Ownership by Household Size in Homer Glen
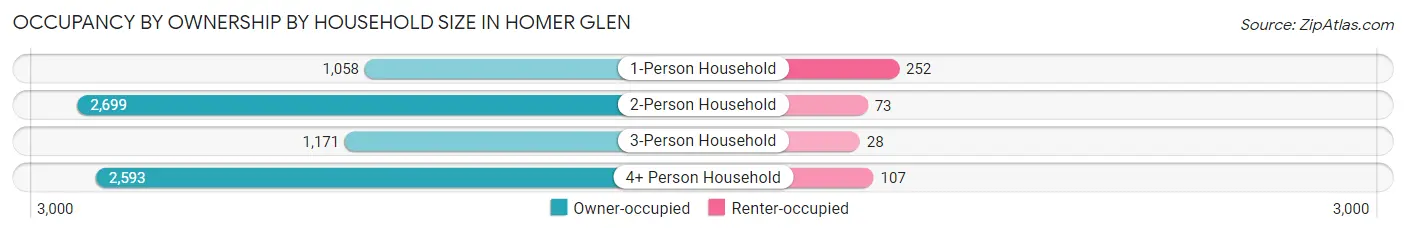
| Household Size | Owner-occupied | Renter-occupied |
| 1-Person Household | 1,058 (80.8%) | 252 (19.2%) |
| 2-Person Household | 2,699 (97.4%) | 73 (2.6%) |
| 3-Person Household | 1,171 (97.7%) | 28 (2.3%) |
| 4+ Person Household | 2,593 (96.0%) | 107 (4.0%) |
| Total Housing Units | 7,521 (94.2%) | 460 (5.8%) |
Occupancy by Educational Attainment in Homer Glen
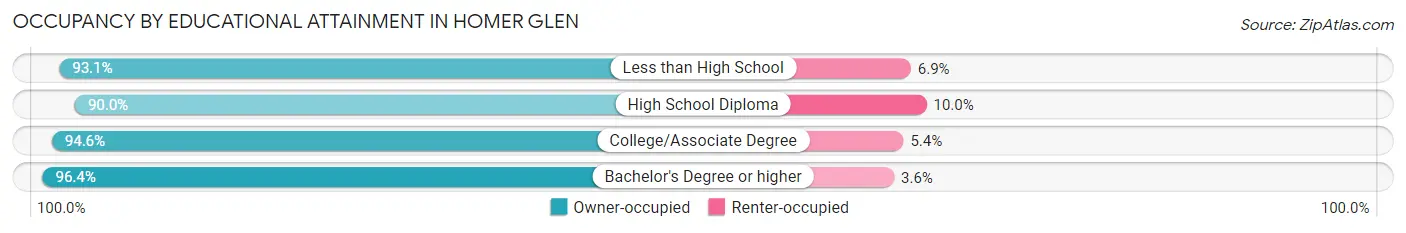
| Household Size | Owner-occupied | Renter-occupied |
| Less than High School | 230 (93.1%) | 17 (6.9%) |
| High School Diploma | 1,639 (90.0%) | 182 (10.0%) |
| College/Associate Degree | 2,568 (94.6%) | 147 (5.4%) |
| Bachelor's Degree or higher | 3,084 (96.4%) | 114 (3.6%) |
Occupancy by Age of Householder in Homer Glen
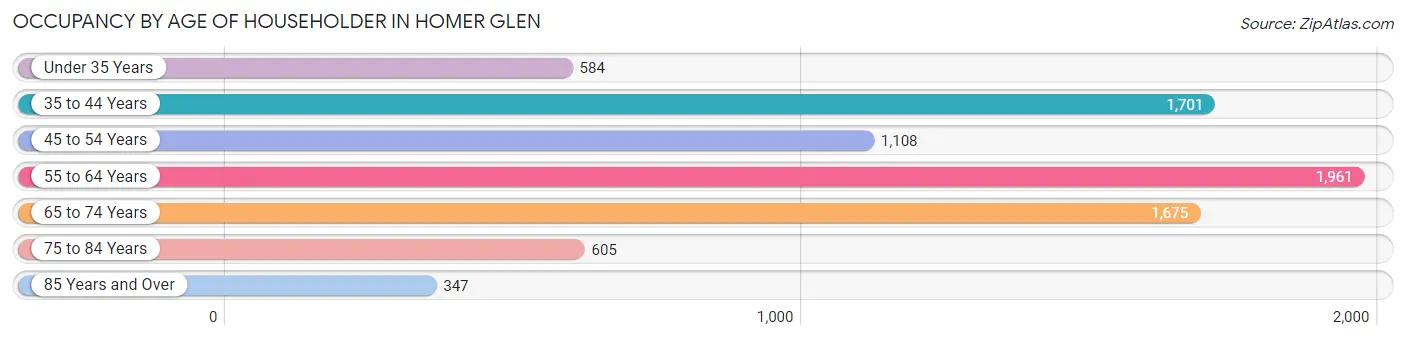
| Age Bracket | # Households | % Households |
| Under 35 Years | 584 | 7.3% |
| 35 to 44 Years | 1,701 | 21.3% |
| 45 to 54 Years | 1,108 | 13.9% |
| 55 to 64 Years | 1,961 | 24.6% |
| 65 to 74 Years | 1,675 | 21.0% |
| 75 to 84 Years | 605 | 7.6% |
| 85 Years and Over | 347 | 4.3% |
| Total | 7,981 | 100.0% |
Housing Finances in Homer Glen
Median Income by Occupancy in Homer Glen
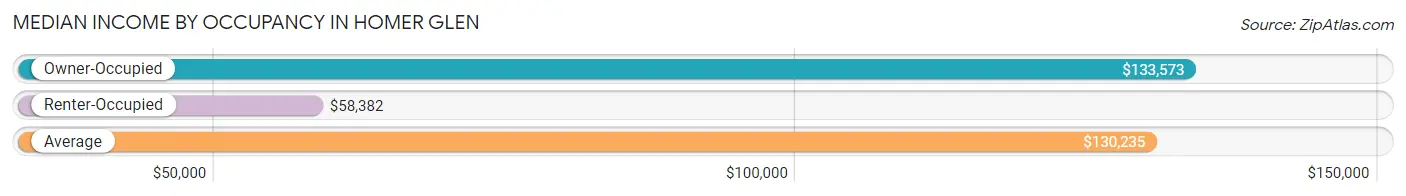
| Occupancy Type | # Households | Median Income |
| Owner-Occupied | 7,521 (94.2%) | $133,573 |
| Renter-Occupied | 460 (5.8%) | $58,382 |
| Average | 7,981 (100.0%) | $130,235 |
Occupancy by Householder Income Bracket in Homer Glen
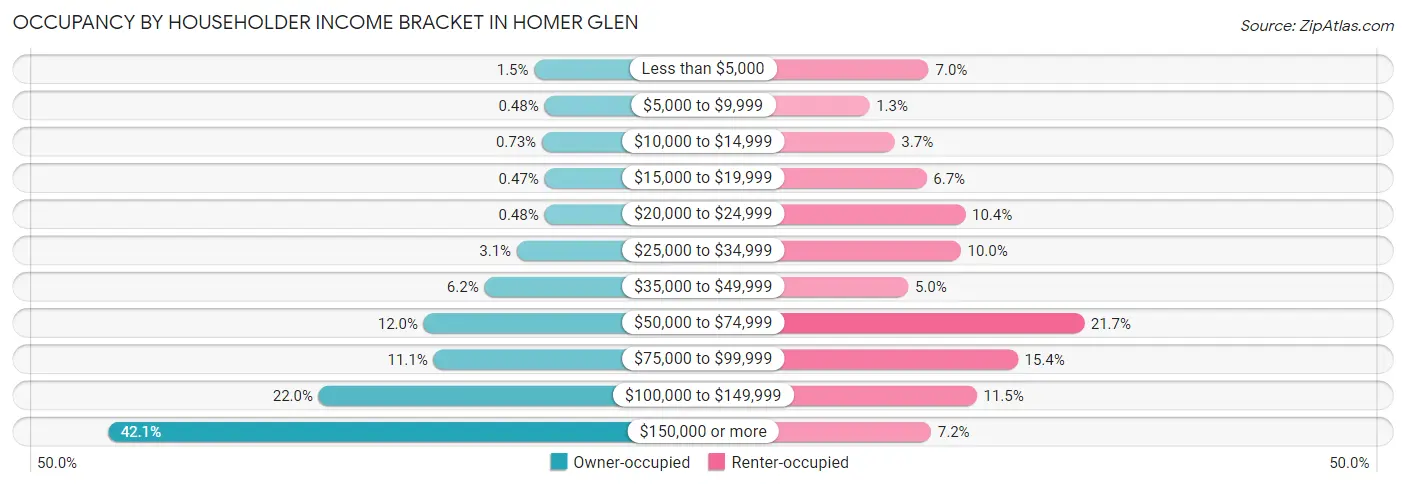
| Income Bracket | Owner-occupied | Renter-occupied |
| Less than $5,000 | 109 (1.5%) | 32 (7.0%) |
| $5,000 to $9,999 | 36 (0.5%) | 6 (1.3%) |
| $10,000 to $14,999 | 55 (0.7%) | 17 (3.7%) |
| $15,000 to $19,999 | 35 (0.5%) | 31 (6.7%) |
| $20,000 to $24,999 | 36 (0.5%) | 48 (10.4%) |
| $25,000 to $34,999 | 234 (3.1%) | 46 (10.0%) |
| $35,000 to $49,999 | 466 (6.2%) | 23 (5.0%) |
| $50,000 to $74,999 | 901 (12.0%) | 100 (21.7%) |
| $75,000 to $99,999 | 831 (11.1%) | 71 (15.4%) |
| $100,000 to $149,999 | 1,653 (22.0%) | 53 (11.5%) |
| $150,000 or more | 3,165 (42.1%) | 33 (7.2%) |
| Total | 7,521 (100.0%) | 460 (100.0%) |
Monthly Housing Cost Tiers in Homer Glen
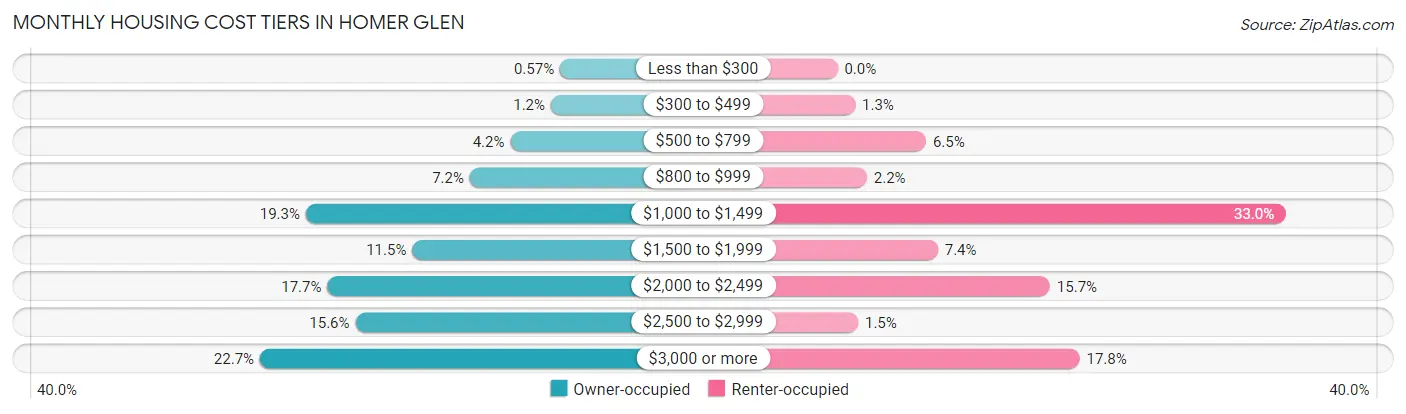
| Monthly Cost | Owner-occupied | Renter-occupied |
| Less than $300 | 43 (0.6%) | 0 (0.0%) |
| $300 to $499 | 93 (1.2%) | 6 (1.3%) |
| $500 to $799 | 318 (4.2%) | 30 (6.5%) |
| $800 to $999 | 542 (7.2%) | 10 (2.2%) |
| $1,000 to $1,499 | 1,451 (19.3%) | 152 (33.0%) |
| $1,500 to $1,999 | 861 (11.5%) | 34 (7.4%) |
| $2,000 to $2,499 | 1,332 (17.7%) | 72 (15.7%) |
| $2,500 to $2,999 | 1,176 (15.6%) | 7 (1.5%) |
| $3,000 or more | 1,705 (22.7%) | 82 (17.8%) |
| Total | 7,521 (100.0%) | 460 (100.0%) |
Physical Housing Characteristics in Homer Glen
Housing Structures in Homer Glen
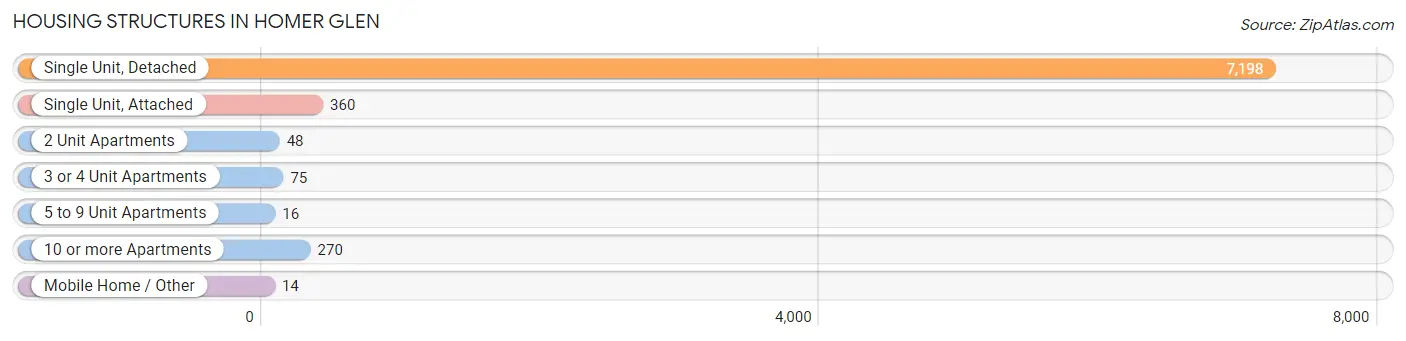
| Structure Type | # Housing Units | % Housing Units |
| Single Unit, Detached | 7,198 | 90.2% |
| Single Unit, Attached | 360 | 4.5% |
| 2 Unit Apartments | 48 | 0.6% |
| 3 or 4 Unit Apartments | 75 | 0.9% |
| 5 to 9 Unit Apartments | 16 | 0.2% |
| 10 or more Apartments | 270 | 3.4% |
| Mobile Home / Other | 14 | 0.2% |
| Total | 7,981 | 100.0% |
Housing Structures by Occupancy in Homer Glen
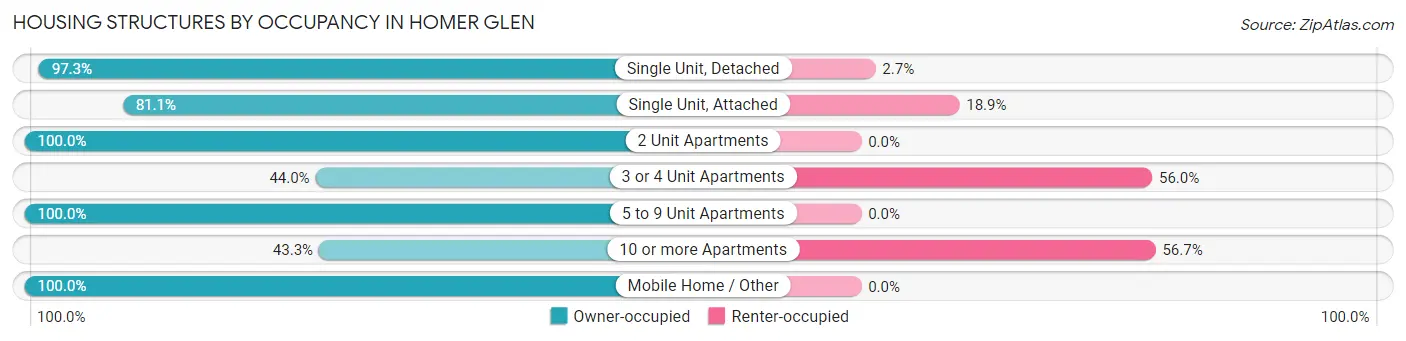
| Structure Type | Owner-occupied | Renter-occupied |
| Single Unit, Detached | 7,001 (97.3%) | 197 (2.7%) |
| Single Unit, Attached | 292 (81.1%) | 68 (18.9%) |
| 2 Unit Apartments | 48 (100.0%) | 0 (0.0%) |
| 3 or 4 Unit Apartments | 33 (44.0%) | 42 (56.0%) |
| 5 to 9 Unit Apartments | 16 (100.0%) | 0 (0.0%) |
| 10 or more Apartments | 117 (43.3%) | 153 (56.7%) |
| Mobile Home / Other | 14 (100.0%) | 0 (0.0%) |
| Total | 7,521 (94.2%) | 460 (5.8%) |
Housing Structures by Number of Rooms in Homer Glen
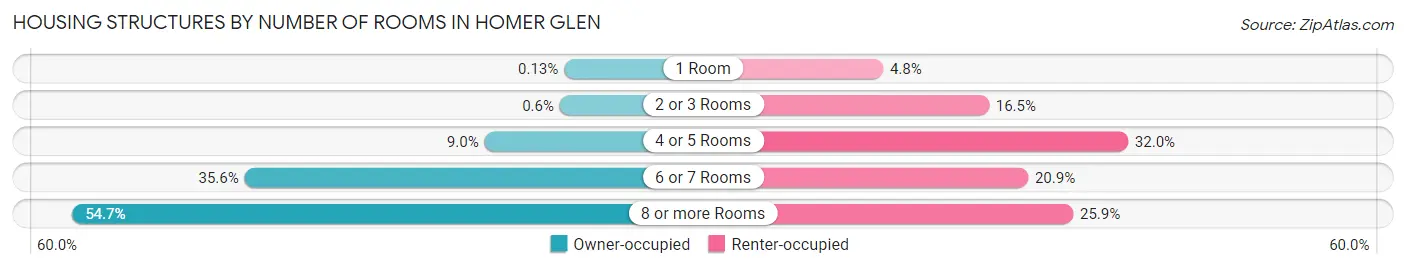
| Number of Rooms | Owner-occupied | Renter-occupied |
| 1 Room | 10 (0.1%) | 22 (4.8%) |
| 2 or 3 Rooms | 45 (0.6%) | 76 (16.5%) |
| 4 or 5 Rooms | 674 (9.0%) | 147 (32.0%) |
| 6 or 7 Rooms | 2,677 (35.6%) | 96 (20.9%) |
| 8 or more Rooms | 4,115 (54.7%) | 119 (25.9%) |
| Total | 7,521 (100.0%) | 460 (100.0%) |
Housing Structure by Heating Type in Homer Glen
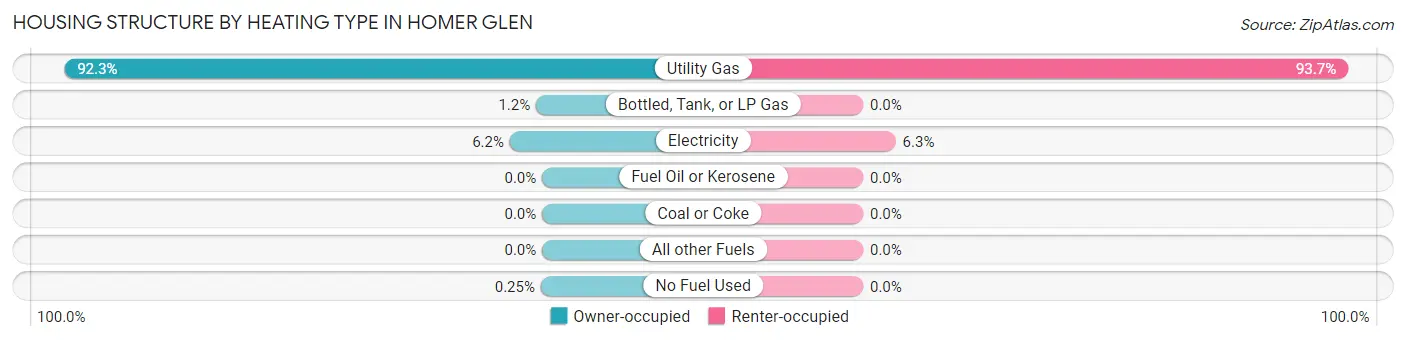
| Heating Type | Owner-occupied | Renter-occupied |
| Utility Gas | 6,945 (92.3%) | 431 (93.7%) |
| Bottled, Tank, or LP Gas | 88 (1.2%) | 0 (0.0%) |
| Electricity | 469 (6.2%) | 29 (6.3%) |
| Fuel Oil or Kerosene | 0 (0.0%) | 0 (0.0%) |
| Coal or Coke | 0 (0.0%) | 0 (0.0%) |
| All other Fuels | 0 (0.0%) | 0 (0.0%) |
| No Fuel Used | 19 (0.3%) | 0 (0.0%) |
| Total | 7,521 (100.0%) | 460 (100.0%) |
Household Vehicle Usage in Homer Glen
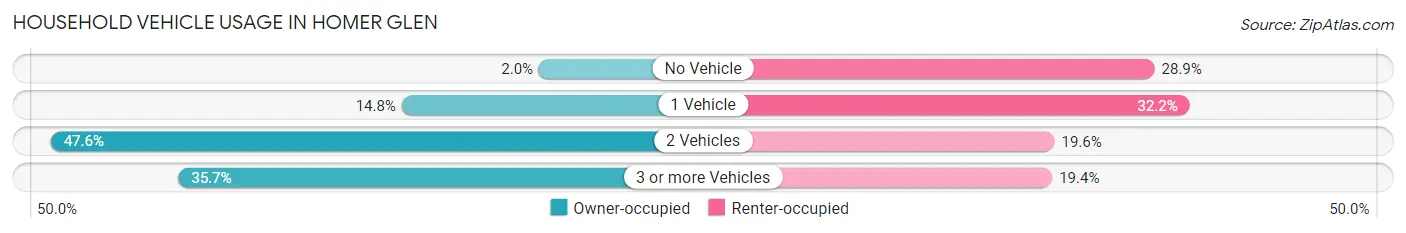
| Vehicles per Household | Owner-occupied | Renter-occupied |
| No Vehicle | 150 (2.0%) | 133 (28.9%) |
| 1 Vehicle | 1,113 (14.8%) | 148 (32.2%) |
| 2 Vehicles | 3,577 (47.6%) | 90 (19.6%) |
| 3 or more Vehicles | 2,681 (35.6%) | 89 (19.4%) |
| Total | 7,521 (100.0%) | 460 (100.0%) |
Real Estate & Mortgages in Homer Glen
Real Estate and Mortgage Overview in Homer Glen
| Characteristic | Without Mortgage | With Mortgage |
| Housing Units | 2,658 | 4,863 |
| Median Property Value | $367,200 | $390,100 |
| Median Household Income | $91,974 | $2,464 |
| Monthly Housing Costs | $1,103 | $1,692 |
| Real Estate Taxes | $8,271 | $31 |
Property Value by Mortgage Status in Homer Glen
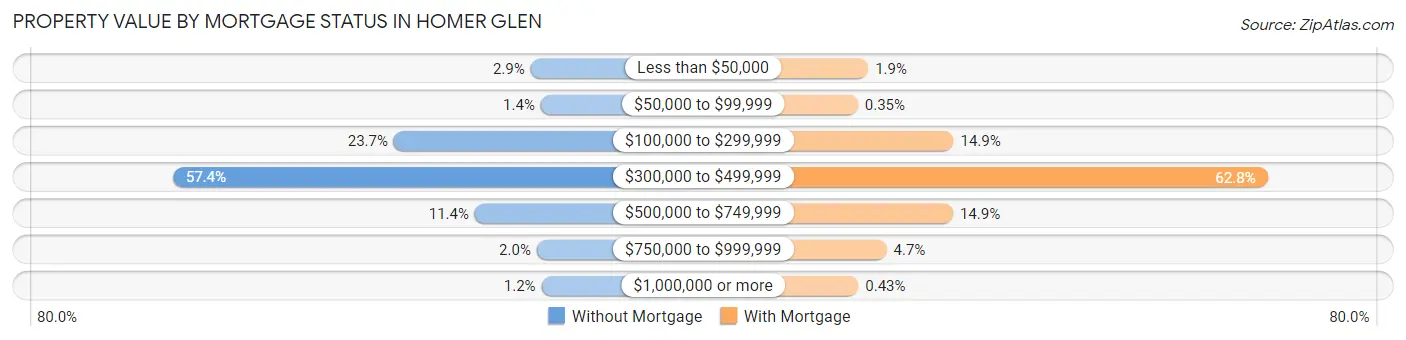
| Property Value | Without Mortgage | With Mortgage |
| Less than $50,000 | 77 (2.9%) | 94 (1.9%) |
| $50,000 to $99,999 | 36 (1.3%) | 17 (0.4%) |
| $100,000 to $299,999 | 631 (23.7%) | 726 (14.9%) |
| $300,000 to $499,999 | 1,526 (57.4%) | 3,053 (62.8%) |
| $500,000 to $749,999 | 303 (11.4%) | 722 (14.8%) |
| $750,000 to $999,999 | 52 (2.0%) | 230 (4.7%) |
| $1,000,000 or more | 33 (1.2%) | 21 (0.4%) |
| Total | 2,658 (100.0%) | 4,863 (100.0%) |
Household Income by Mortgage Status in Homer Glen
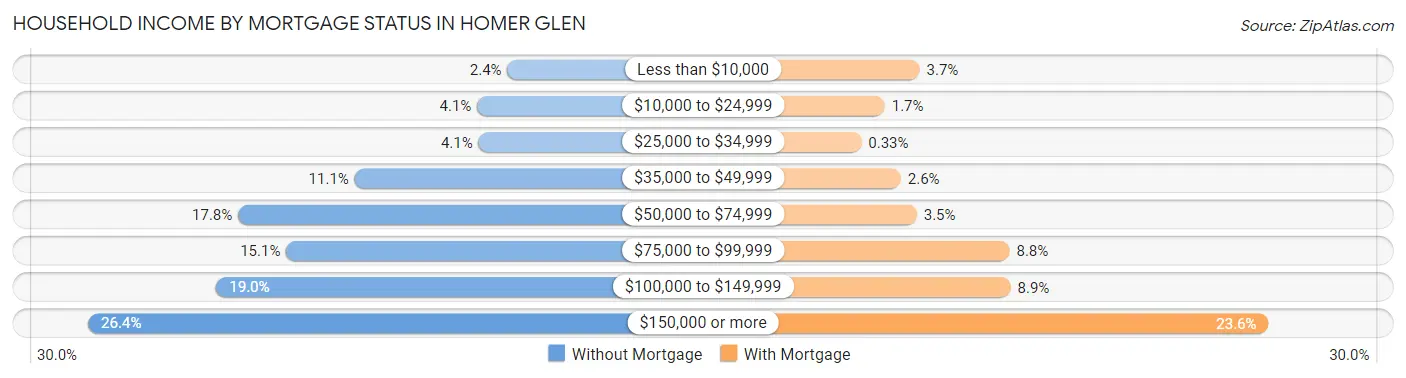
| Household Income | Without Mortgage | With Mortgage |
| Less than $10,000 | 64 (2.4%) | 178 (3.7%) |
| $10,000 to $24,999 | 110 (4.1%) | 81 (1.7%) |
| $25,000 to $34,999 | 108 (4.1%) | 16 (0.3%) |
| $35,000 to $49,999 | 296 (11.1%) | 126 (2.6%) |
| $50,000 to $74,999 | 473 (17.8%) | 170 (3.5%) |
| $75,000 to $99,999 | 400 (15.0%) | 428 (8.8%) |
| $100,000 to $149,999 | 506 (19.0%) | 431 (8.9%) |
| $150,000 or more | 701 (26.4%) | 1,147 (23.6%) |
| Total | 2,658 (100.0%) | 4,863 (100.0%) |
Property Value to Household Income Ratio in Homer Glen
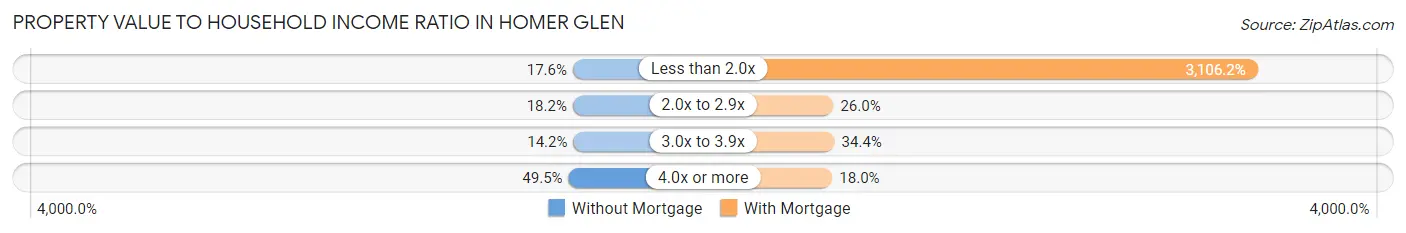
| Value-to-Income Ratio | Without Mortgage | With Mortgage |
| Less than 2.0x | 469 (17.6%) | 151,055 (3,106.2%) |
| 2.0x to 2.9x | 483 (18.2%) | 1,264 (26.0%) |
| 3.0x to 3.9x | 378 (14.2%) | 1,671 (34.4%) |
| 4.0x or more | 1,315 (49.5%) | 875 (18.0%) |
| Total | 2,658 (100.0%) | 4,863 (100.0%) |
Real Estate Taxes by Mortgage Status in Homer Glen
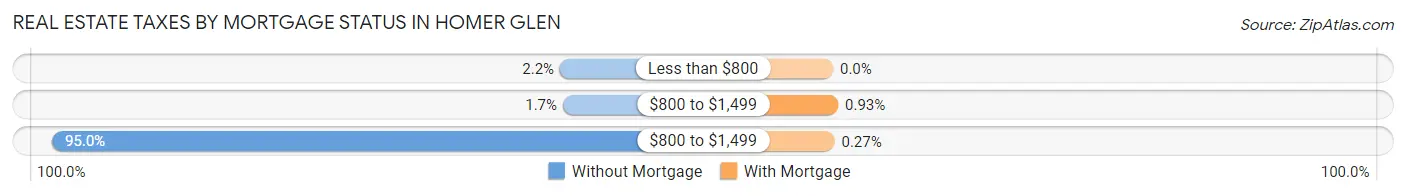
| Property Taxes | Without Mortgage | With Mortgage |
| Less than $800 | 59 (2.2%) | 0 (0.0%) |
| $800 to $1,499 | 45 (1.7%) | 45 (0.9%) |
| $800 to $1,499 | 2,525 (95.0%) | 13 (0.3%) |
| Total | 2,658 (100.0%) | 4,863 (100.0%) |
Health & Disability in Homer Glen
Health Insurance Coverage by Age in Homer Glen
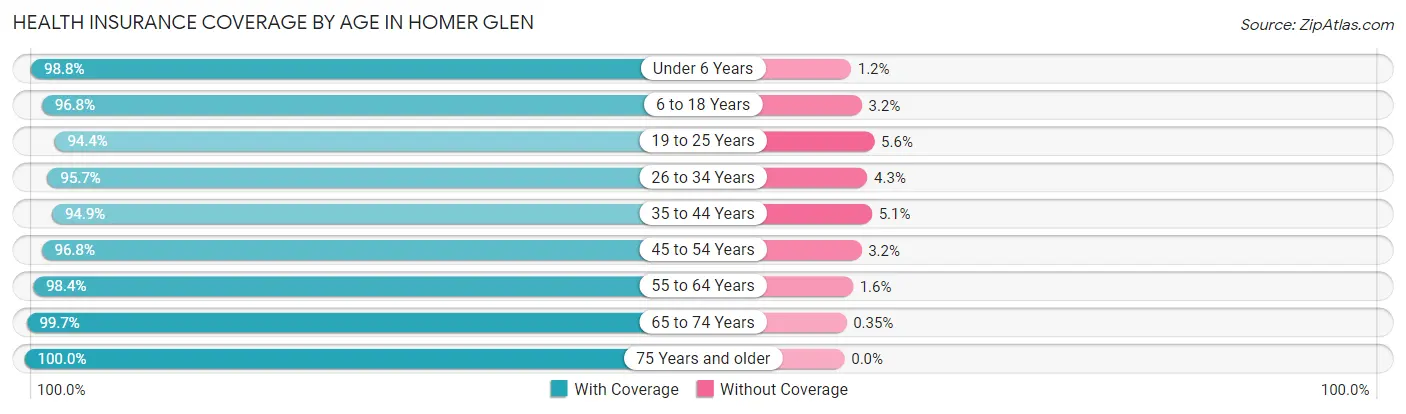
| Age Bracket | With Coverage | Without Coverage |
| Under 6 Years | 1,720 (98.8%) | 21 (1.2%) |
| 6 to 18 Years | 4,224 (96.8%) | 140 (3.2%) |
| 19 to 25 Years | 1,373 (94.4%) | 81 (5.6%) |
| 26 to 34 Years | 2,205 (95.7%) | 98 (4.3%) |
| 35 to 44 Years | 3,043 (94.9%) | 164 (5.1%) |
| 45 to 54 Years | 2,454 (96.8%) | 80 (3.2%) |
| 55 to 64 Years | 4,133 (98.4%) | 66 (1.6%) |
| 65 to 74 Years | 2,841 (99.7%) | 10 (0.4%) |
| 75 Years and older | 1,729 (100.0%) | 0 (0.0%) |
| Total | 23,722 (97.3%) | 660 (2.7%) |
Health Insurance Coverage by Citizenship Status in Homer Glen
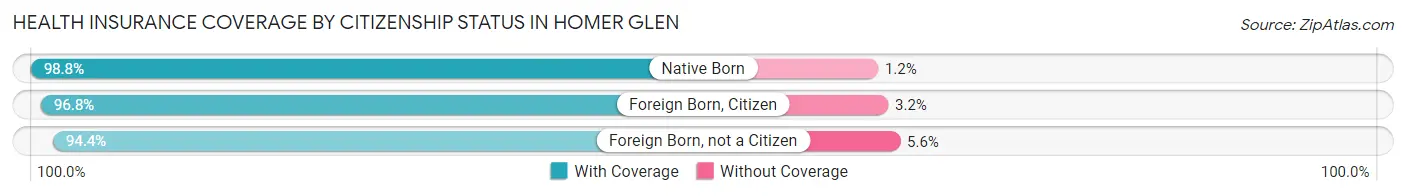
| Citizenship Status | With Coverage | Without Coverage |
| Native Born | 1,720 (98.8%) | 21 (1.2%) |
| Foreign Born, Citizen | 4,224 (96.8%) | 140 (3.2%) |
| Foreign Born, not a Citizen | 1,373 (94.4%) | 81 (5.6%) |
Health Insurance Coverage by Household Income in Homer Glen
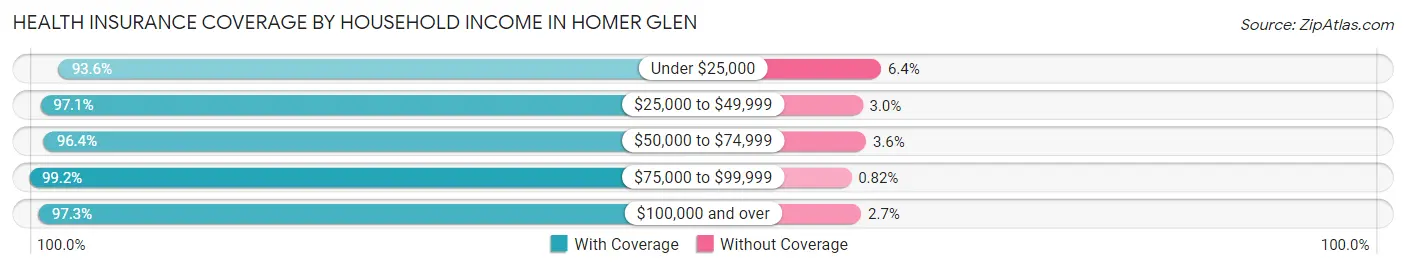
| Household Income | With Coverage | Without Coverage |
| Under $25,000 | 541 (93.6%) | 37 (6.4%) |
| $25,000 to $49,999 | 1,480 (97.1%) | 45 (2.9%) |
| $50,000 to $74,999 | 2,305 (96.4%) | 86 (3.6%) |
| $75,000 to $99,999 | 2,406 (99.2%) | 20 (0.8%) |
| $100,000 and over | 16,950 (97.3%) | 467 (2.7%) |
Public vs Private Health Insurance Coverage by Age in Homer Glen
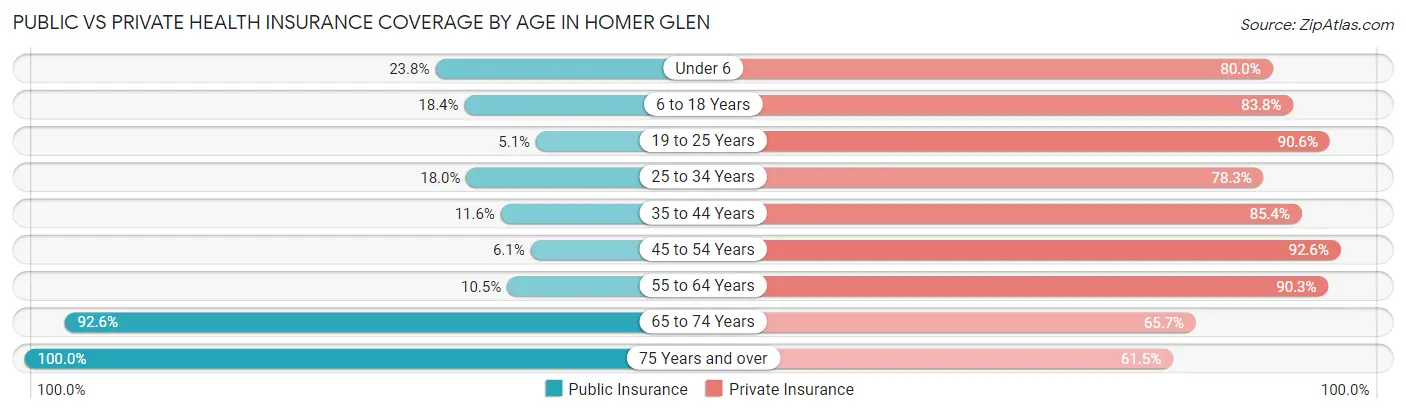
| Age Bracket | Public Insurance | Private Insurance |
| Under 6 | 414 (23.8%) | 1,392 (79.9%) |
| 6 to 18 Years | 802 (18.4%) | 3,657 (83.8%) |
| 19 to 25 Years | 74 (5.1%) | 1,317 (90.6%) |
| 25 to 34 Years | 415 (18.0%) | 1,803 (78.3%) |
| 35 to 44 Years | 373 (11.6%) | 2,738 (85.4%) |
| 45 to 54 Years | 154 (6.1%) | 2,347 (92.6%) |
| 55 to 64 Years | 439 (10.4%) | 3,792 (90.3%) |
| 65 to 74 Years | 2,639 (92.6%) | 1,874 (65.7%) |
| 75 Years and over | 1,729 (100.0%) | 1,063 (61.5%) |
| Total | 7,039 (28.9%) | 19,983 (82.0%) |
Disability Status by Sex by Age in Homer Glen
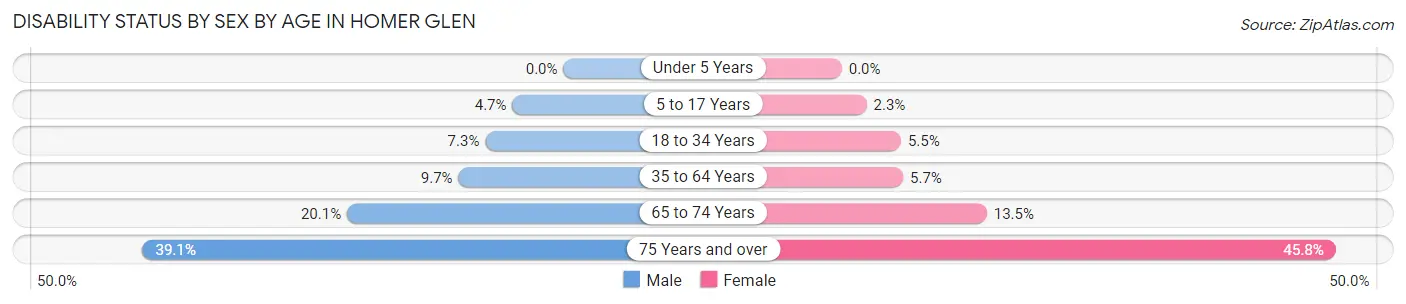
| Age Bracket | Male | Female |
| Under 5 Years | 0 (0.0%) | 0 (0.0%) |
| 5 to 17 Years | 108 (4.7%) | 49 (2.3%) |
| 18 to 34 Years | 149 (7.2%) | 111 (5.5%) |
| 35 to 64 Years | 472 (9.7%) | 290 (5.7%) |
| 65 to 74 Years | 292 (20.1%) | 188 (13.5%) |
| 75 Years and over | 319 (39.1%) | 418 (45.8%) |
Disability Class by Sex by Age in Homer Glen
Disability Class: Hearing Difficulty
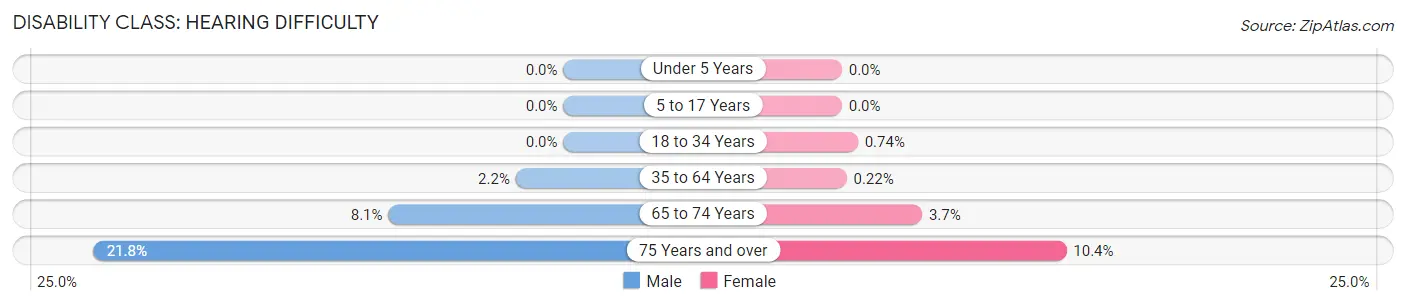
| Age Bracket | Male | Female |
| Under 5 Years | 0 (0.0%) | 0 (0.0%) |
| 5 to 17 Years | 0 (0.0%) | 0 (0.0%) |
| 18 to 34 Years | 0 (0.0%) | 15 (0.7%) |
| 35 to 64 Years | 107 (2.2%) | 11 (0.2%) |
| 65 to 74 Years | 118 (8.1%) | 52 (3.7%) |
| 75 Years and over | 178 (21.8%) | 95 (10.4%) |
Disability Class: Vision Difficulty
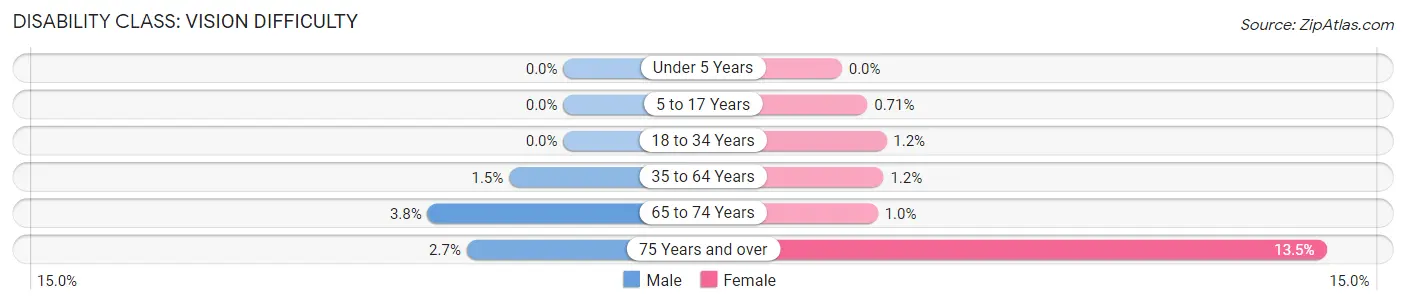
| Age Bracket | Male | Female |
| Under 5 Years | 0 (0.0%) | 0 (0.0%) |
| 5 to 17 Years | 0 (0.0%) | 15 (0.7%) |
| 18 to 34 Years | 0 (0.0%) | 25 (1.2%) |
| 35 to 64 Years | 73 (1.5%) | 59 (1.2%) |
| 65 to 74 Years | 55 (3.8%) | 14 (1.0%) |
| 75 Years and over | 22 (2.7%) | 123 (13.5%) |
Disability Class: Cognitive Difficulty
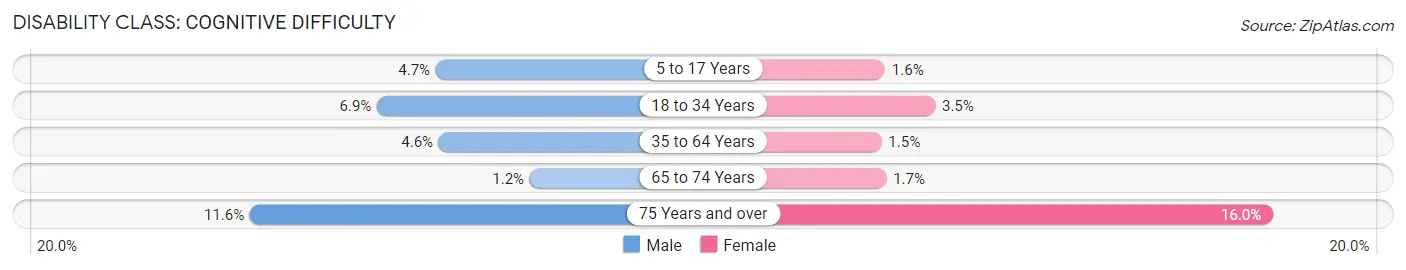
| Age Bracket | Male | Female |
| 5 to 17 Years | 108 (4.7%) | 34 (1.6%) |
| 18 to 34 Years | 142 (6.9%) | 70 (3.5%) |
| 35 to 64 Years | 224 (4.6%) | 75 (1.5%) |
| 65 to 74 Years | 18 (1.2%) | 23 (1.7%) |
| 75 Years and over | 95 (11.6%) | 146 (16.0%) |
Disability Class: Ambulatory Difficulty
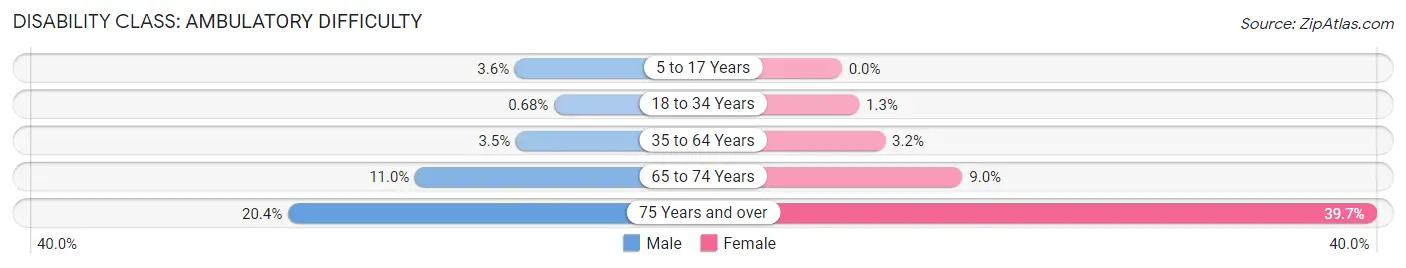
| Age Bracket | Male | Female |
| 5 to 17 Years | 82 (3.6%) | 0 (0.0%) |
| 18 to 34 Years | 14 (0.7%) | 26 (1.3%) |
| 35 to 64 Years | 170 (3.5%) | 164 (3.2%) |
| 65 to 74 Years | 160 (11.0%) | 125 (8.9%) |
| 75 Years and over | 167 (20.4%) | 362 (39.7%) |
Disability Class: Self-Care Difficulty
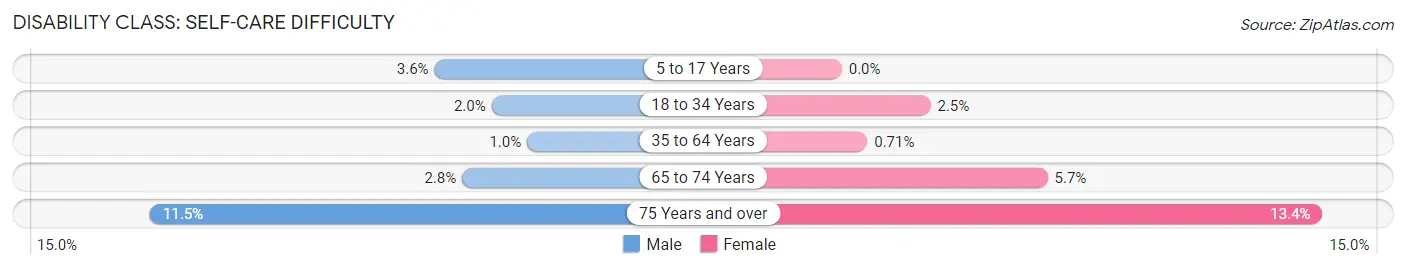
| Age Bracket | Male | Female |
| 5 to 17 Years | 82 (3.6%) | 0 (0.0%) |
| 18 to 34 Years | 41 (2.0%) | 50 (2.5%) |
| 35 to 64 Years | 49 (1.0%) | 36 (0.7%) |
| 65 to 74 Years | 41 (2.8%) | 80 (5.7%) |
| 75 Years and over | 94 (11.5%) | 122 (13.4%) |
Technology Access in Homer Glen
Computing Device Access in Homer Glen
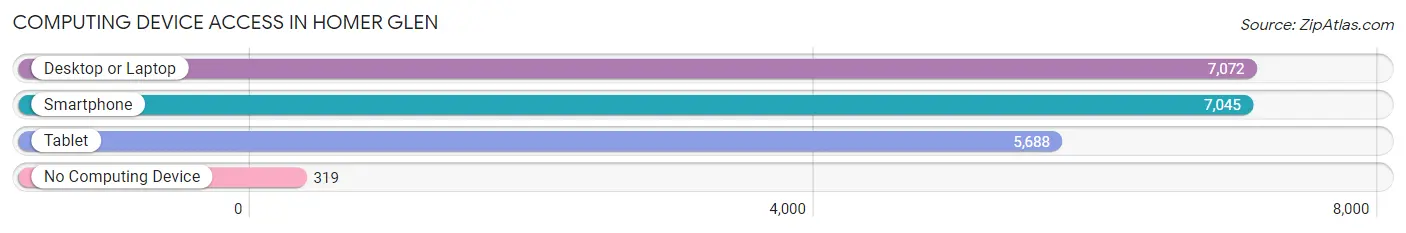
| Device Type | # Households | % Households |
| Desktop or Laptop | 7,072 | 88.6% |
| Smartphone | 7,045 | 88.3% |
| Tablet | 5,688 | 71.3% |
| No Computing Device | 319 | 4.0% |
| Total | 7,981 | 100.0% |
Internet Access in Homer Glen
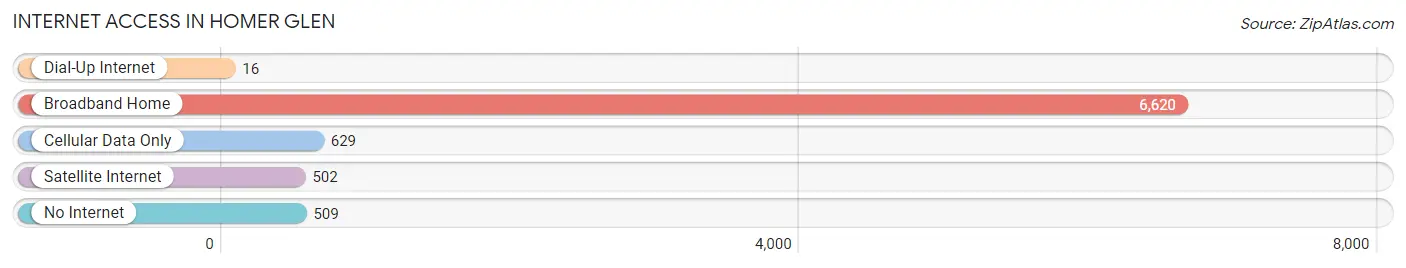
| Internet Type | # Households | % Households |
| Dial-Up Internet | 16 | 0.2% |
| Broadband Home | 6,620 | 83.0% |
| Cellular Data Only | 629 | 7.9% |
| Satellite Internet | 502 | 6.3% |
| No Internet | 509 | 6.4% |
| Total | 7,981 | 100.0% |
Homer Glen Summary
Homer Glen is a village located in Will County, Illinois, United States. The population was 24,220 at the 2010 census, up from 11,482 at the 2000 census. The village is located in the southwest corner of Will County, and is a southwest suburb of Chicago.
History
Homer Glen was first settled in the 1830s by German immigrants. The village was originally known as Homer, and was incorporated in 1892. The village was named after Homer Township, which was named after the Greek poet Homer. In the late 19th century, the village was a farming community, and the main crops were corn, wheat, and oats.
In the 1950s, the village began to experience rapid growth due to the construction of the nearby Interstate Highway 55. This led to an influx of new residents and businesses, and the village was officially incorporated as Homer Glen in 2001.
Geography
Homer Glen is located at 41°35′17″N 87°59′45″W (41.587950, -87.995917). According to the 2010 census, the village has a total area of 16.9 square miles (43.7 km2), of which 16.8 square miles (43.5 km2) is land and 0.1 square miles (0.2 km2) (0.59%) is water.
Economy
Homer Glen is a rapidly growing community, and the village has seen an influx of new businesses in recent years. The village is home to a variety of retail stores, restaurants, and other businesses. The village is also home to several industrial parks, which provide employment opportunities for local residents.
Demographics
As of the 2010 census, there were 24,220 people, 8,845 households, and 6,845 families residing in the village. The population density was 1,443.2 people per square mile (557.7/km2). There were 9,093 housing units at an average density of 541.3 per square mile (209.2/km2). The racial makeup of the village was 87.2% White, 4.2% African American, 0.2% Native American, 4.7% Asian, 0.1% Pacific Islander, 1.7% from other races, and 2.0% from two or more races. Hispanic or Latino of any race were 6.7% of the population.
There were 8,845 households, out of which 37.2% had children under the age of 18 living with them, 65.2% were married couples living together, 8.2% had a female householder with no husband present, and 23.2% were non-families. 19.2% of all households were made up of individuals, and 6.2% had someone living alone who was 65 years of age or older. The average household size was 2.72 and the average family size was 3.14.
In the village, the population was spread out, with 26.2% under the age of 18, 6.7% from 18 to 24, 28.7% from 25 to 44, 28.2% from 45 to 64, and 10.2% who were 65 years of age or older. The median age was 38 years. For every 100 females, there were 97.2 males. For every 100 females age 18 and over, there were 94.2 males.
The median income for a household in the village was $80,945, and the median income for a family was $90,945. Males had a median income of $60,945 versus $41,945 for females. The per capita income for the village was $32,945. About 2.2% of families and 3.2% of the population were below the poverty line, including 3.7% of those under age 18 and 4.2% of those age 65 or over.
Common Questions
What is Per Capita Income in Homer Glen?
Per Capita income in Homer Glen is $49,558.
What is the Median Family Income in Homer Glen?
Median Family Income in Homer Glen is $144,023.
What is the Median Household income in Homer Glen?
Median Household Income in Homer Glen is $130,235.
What is Income or Wage Gap in Homer Glen?
Income or Wage Gap in Homer Glen is 41.6%.
Women in Homer Glen earn 58.4 cents for every dollar earned by a man.
What is Family Income Deficit in Homer Glen?
Family Income Deficit in Homer Glen is $8,573.
Families that are below poverty line in Homer Glen earn $8,573 less on average than the poverty threshold level.
What is Inequality or Gini Index in Homer Glen?
Inequality or Gini Index in Homer Glen is 0.38.
What is the Total Population of Homer Glen?
Total Population of Homer Glen is 24,507.
What is the Total Male Population of Homer Glen?
Total Male Population of Homer Glen is 12,221.
What is the Total Female Population of Homer Glen?
Total Female Population of Homer Glen is 12,286.
What is the Ratio of Males per 100 Females in Homer Glen?
There are 99.47 Males per 100 Females in Homer Glen.
What is the Ratio of Females per 100 Males in Homer Glen?
There are 100.53 Females per 100 Males in Homer Glen.
What is the Median Population Age in Homer Glen?
Median Population Age in Homer Glen is 42.3 Years.
What is the Average Family Size in Homer Glen
Average Family Size in Homer Glen is 3.4 People.
What is the Average Household Size in Homer Glen
Average Household Size in Homer Glen is 3.0 People.
How Large is the Labor Force in Homer Glen?
There are 12,516 People in the Labor Forcein in Homer Glen.
What is the Percentage of People in the Labor Force in Homer Glen?
65.4% of People are in the Labor Force in Homer Glen.
What is the Unemployment Rate in Homer Glen?
Unemployment Rate in Homer Glen is 5.0%.