Libertyville, IL Map & Demographics
Libertyville Map
Libertyville Overview
$81,231
PER CAPITA INCOME
$203,078
AVG FAMILY INCOME
$161,302
AVG HOUSEHOLD INCOME
47.6%
WAGE / INCOME GAP [ % ]
52.4¢/ $1
WAGE / INCOME GAP [ $ ]
0.45
INEQUALITY / GINI INDEX
20,555
TOTAL POPULATION
9,692
MALE POPULATION
10,863
FEMALE POPULATION
89.22
MALES / 100 FEMALES
112.08
FEMALES / 100 MALES
42.4
MEDIAN AGE
3.2
AVG FAMILY SIZE
2.6
AVG HOUSEHOLD SIZE
10,332
LABOR FORCE [ PEOPLE ]
64.7%
PERCENT IN LABOR FORCE
3.2%
UNEMPLOYMENT RATE
Libertyville Zip Codes
Income in Libertyville
Income Overview in Libertyville
Per Capita Income in Libertyville is $81,231, while median incomes of families and households are $203,078 and $161,302 respectively.
| Characteristic | Number | Measure |
| Per Capita Income | 20,555 | $81,231 |
| Median Family Income | 5,525 | $203,078 |
| Mean Family Income | 5,525 | $255,938 |
| Median Household Income | 7,608 | $161,302 |
| Mean Household Income | 7,608 | $215,274 |
| Income Deficit | 5,525 | $0 |
| Wage / Income Gap (%) | 20,555 | 47.60% |
| Wage / Income Gap ($) | 20,555 | 52.40¢ per $1 |
| Gini / Inequality Index | 20,555 | 0.45 |
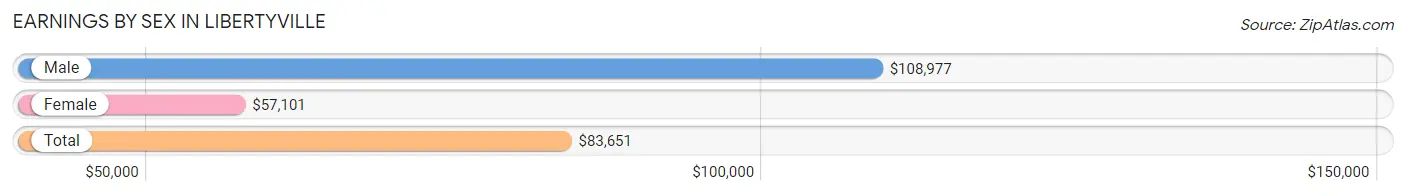
Earnings by Sex in Libertyville
Average Earnings in Libertyville are $83,651, $108,977 for men and $57,101 for women, a difference of 47.6%.
| Sex | Number | Average Earnings |
| Male | 6,021 (54.8%) | $108,977 |
| Female | 4,962 (45.2%) | $57,101 |
| Total | 10,983 (100.0%) | $83,651 |
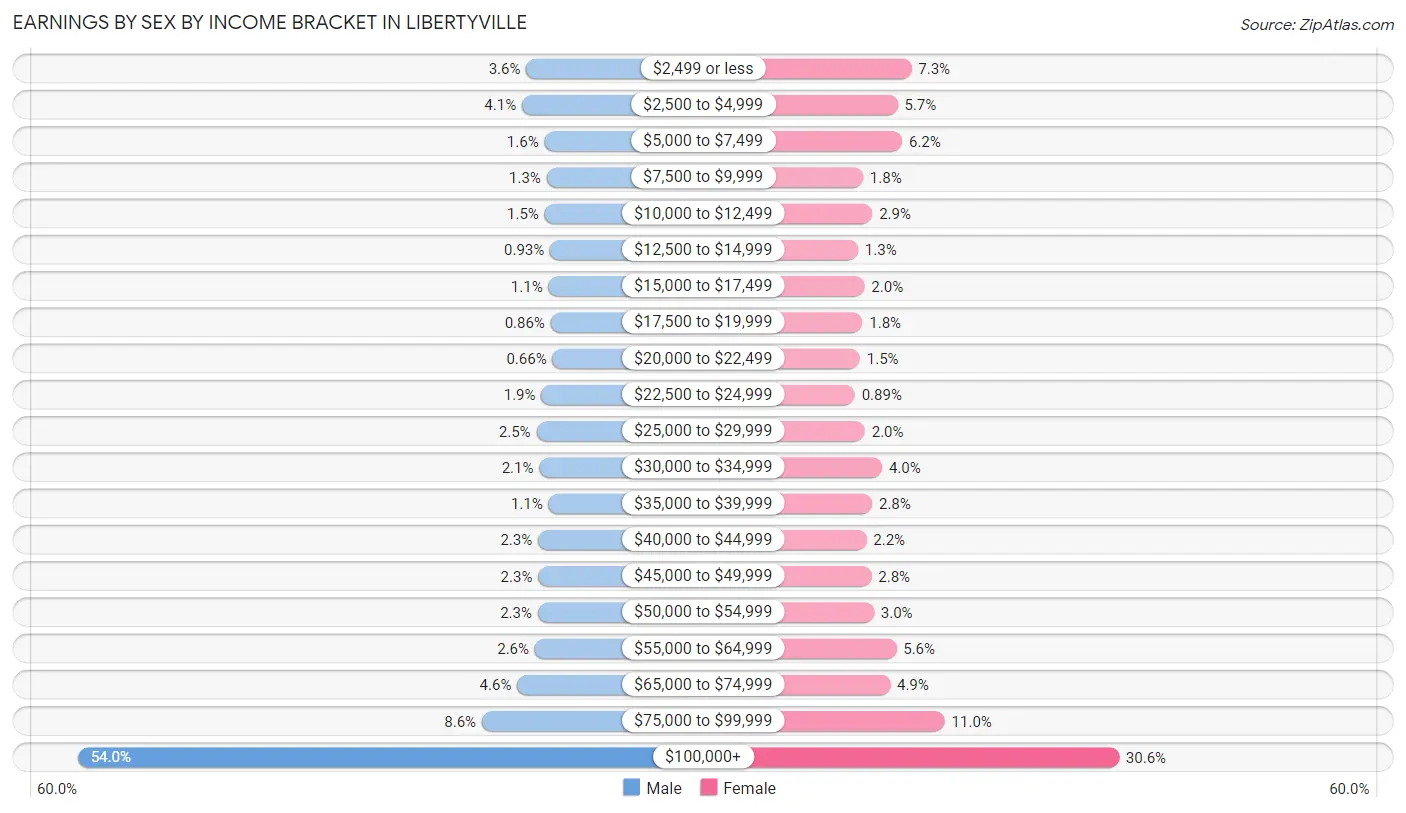
Earnings by Sex by Income Bracket in Libertyville
The most common earnings brackets in Libertyville are $100,000+ for men (3,253 | 54.0%) and $100,000+ for women (1,518 | 30.6%).
| Income | Male | Female |
| $2,499 or less | 217 (3.6%) | 360 (7.3%) |
| $2,500 to $4,999 | 246 (4.1%) | 283 (5.7%) |
| $5,000 to $7,499 | 94 (1.6%) | 308 (6.2%) |
| $7,500 to $9,999 | 79 (1.3%) | 90 (1.8%) |
| $10,000 to $12,499 | 93 (1.5%) | 142 (2.9%) |
| $12,500 to $14,999 | 56 (0.9%) | 62 (1.3%) |
| $15,000 to $17,499 | 67 (1.1%) | 98 (2.0%) |
| $17,500 to $19,999 | 52 (0.9%) | 87 (1.8%) |
| $20,000 to $22,499 | 40 (0.7%) | 73 (1.5%) |
| $22,500 to $24,999 | 115 (1.9%) | 44 (0.9%) |
| $25,000 to $29,999 | 148 (2.5%) | 100 (2.0%) |
| $30,000 to $34,999 | 129 (2.1%) | 196 (4.0%) |
| $35,000 to $39,999 | 66 (1.1%) | 141 (2.8%) |
| $40,000 to $44,999 | 137 (2.3%) | 109 (2.2%) |
| $45,000 to $49,999 | 136 (2.3%) | 137 (2.8%) |
| $50,000 to $54,999 | 139 (2.3%) | 151 (3.0%) |
| $55,000 to $64,999 | 159 (2.6%) | 276 (5.6%) |
| $65,000 to $74,999 | 278 (4.6%) | 241 (4.9%) |
| $75,000 to $99,999 | 517 (8.6%) | 546 (11.0%) |
| $100,000+ | 3,253 (54.0%) | 1,518 (30.6%) |
| Total | 6,021 (100.0%) | 4,962 (100.0%) |
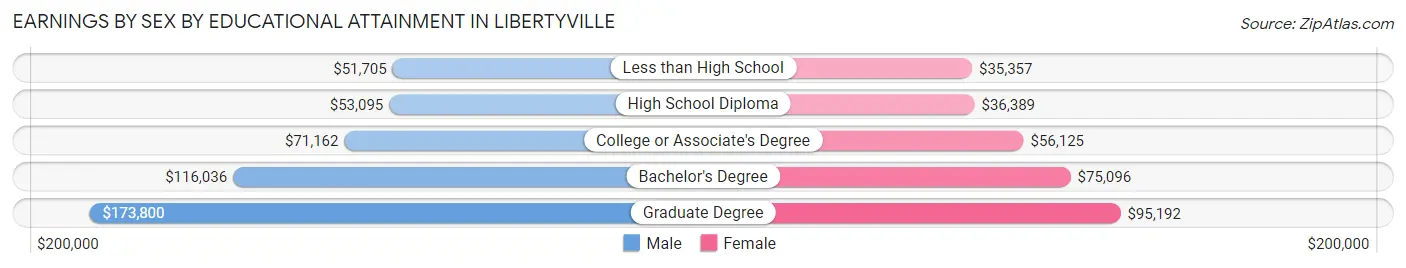
Earnings by Sex by Educational Attainment in Libertyville
Average earnings in Libertyville are $122,771 for men and $69,906 for women, a difference of 43.1%. Men with an educational attainment of graduate degree enjoy the highest average annual earnings of $173,800, while those with less than high school education earn the least with $51,705. Women with an educational attainment of graduate degree earn the most with the average annual earnings of $95,192, while those with less than high school education have the smallest earnings of $35,357.
| Educational Attainment | Male Income | Female Income |
| Less than High School | $51,705 | $35,357 |
| High School Diploma | $53,095 | $36,389 |
| College or Associate's Degree | $71,162 | $56,125 |
| Bachelor's Degree | $116,036 | $75,096 |
| Graduate Degree | $173,800 | $95,192 |
| Total | $122,771 | $69,906 |
Family Income in Libertyville
Family Income Brackets in Libertyville
According to the Libertyville family income data, there are 2,807 families falling into the $200,000+ income range, which is the most common income bracket and makes up 50.8% of all families. Conversely, the $10,000 to $14,999 income bracket is the least frequent group with only 22 families (0.4%) belonging to this category.
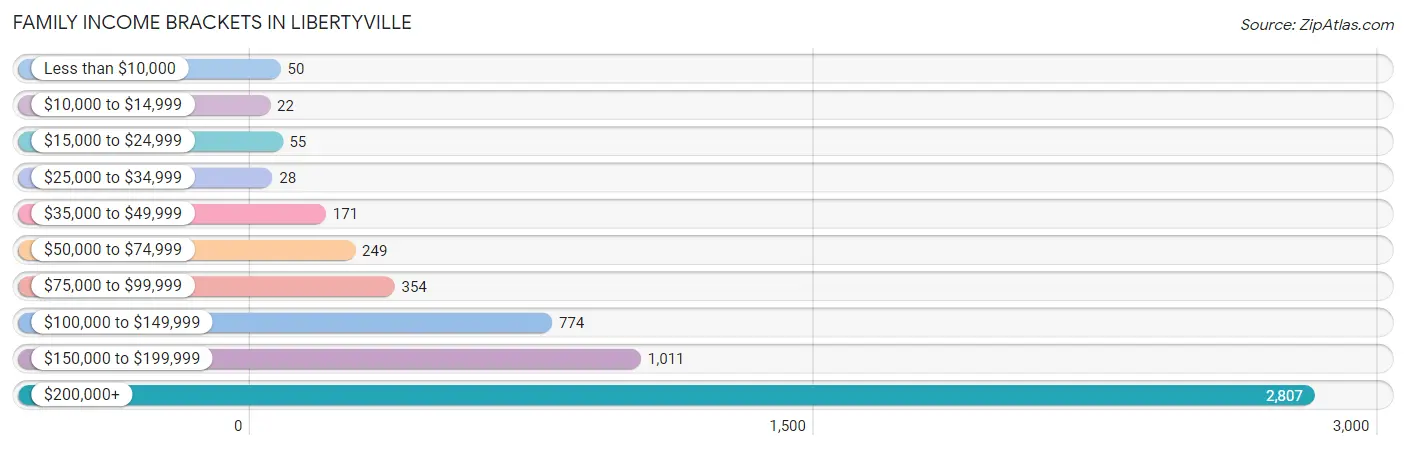
| Income Bracket | # Families | % Families |
| Less than $10,000 | 50 | 0.9% |
| $10,000 to $14,999 | 22 | 0.4% |
| $15,000 to $24,999 | 55 | 1.0% |
| $25,000 to $34,999 | 28 | 0.5% |
| $35,000 to $49,999 | 171 | 3.1% |
| $50,000 to $74,999 | 249 | 4.5% |
| $75,000 to $99,999 | 354 | 6.4% |
| $100,000 to $149,999 | 774 | 14.0% |
| $150,000 to $199,999 | 1,011 | 18.3% |
| $200,000+ | 2,807 | 50.8% |
Family Income by Famaliy Size in Libertyville
4-person families (1,383 | 25.0%) account for the highest median family income in Libertyville with $250,001 per family, while 2-person families (2,458 | 44.5%) have the highest median income of $80,364 per family member.
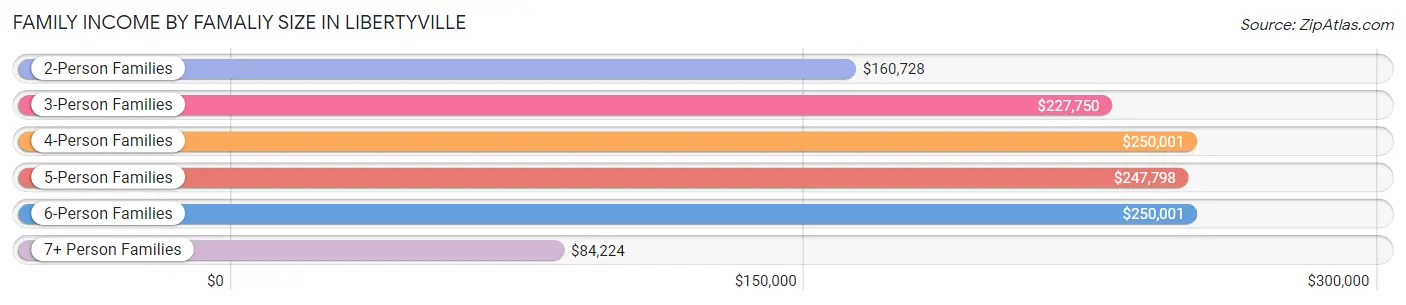
| Income Bracket | # Families | Median Income |
| 2-Person Families | 2,458 (44.5%) | $160,728 |
| 3-Person Families | 1,094 (19.8%) | $227,750 |
| 4-Person Families | 1,383 (25.0%) | $250,001 |
| 5-Person Families | 501 (9.1%) | $247,798 |
| 6-Person Families | 49 (0.9%) | $250,001 |
| 7+ Person Families | 40 (0.7%) | $84,224 |
| Total | 5,525 (100.0%) | $203,078 |
Family Income by Number of Earners in Libertyville
The median family income in Libertyville is $203,078, with families comprising 3+ earners (559) having the highest median family income of $250,001, while families with no earners (557) have the lowest median family income of $120,938, accounting for 10.1% and 10.1% of families, respectively.
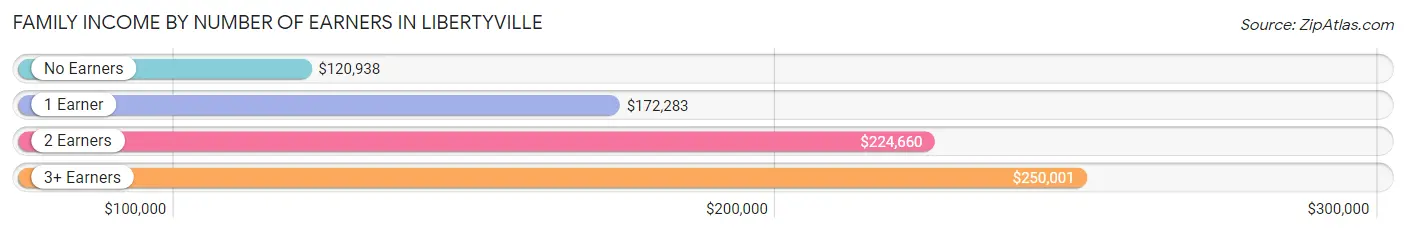
| Number of Earners | # Families | Median Income |
| No Earners | 557 (10.1%) | $120,938 |
| 1 Earner | 1,776 (32.1%) | $172,283 |
| 2 Earners | 2,633 (47.7%) | $224,660 |
| 3+ Earners | 559 (10.1%) | $250,001 |
| Total | 5,525 (100.0%) | $203,078 |
Household Income in Libertyville
Household Income Brackets in Libertyville
With 3,013 households falling in the category, the $200,000+ income range is the most frequent in Libertyville, accounting for 39.6% of all households. In contrast, only 91 households (1.2%) fall into the less than $10,000 income bracket, making it the least populous group.
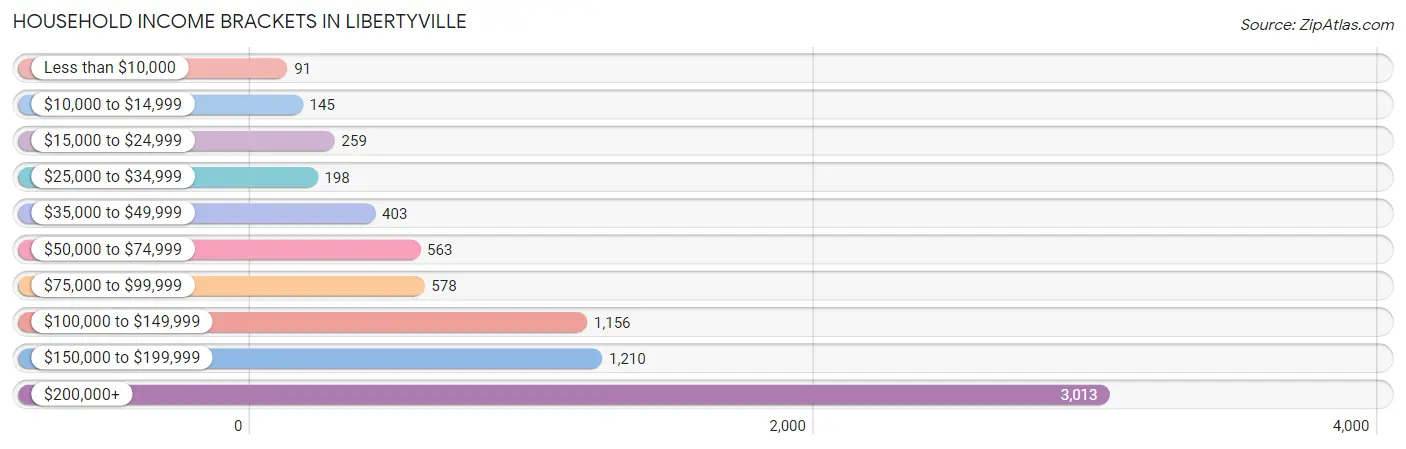
| Income Bracket | # Households | % Households |
| Less than $10,000 | 91 | 1.2% |
| $10,000 to $14,999 | 145 | 1.9% |
| $15,000 to $24,999 | 259 | 3.4% |
| $25,000 to $34,999 | 198 | 2.6% |
| $35,000 to $49,999 | 403 | 5.3% |
| $50,000 to $74,999 | 563 | 7.4% |
| $75,000 to $99,999 | 578 | 7.6% |
| $100,000 to $149,999 | 1,156 | 15.2% |
| $150,000 to $199,999 | 1,210 | 15.9% |
| $200,000+ | 3,013 | 39.6% |
Household Income by Householder Age in Libertyville
The median household income in Libertyville is $161,302, with the highest median household income of $225,789 found in the 45 to 64 years age bracket for the primary householder. A total of 3,350 households (44.0%) fall into this category. Meanwhile, the 15 to 24 years age bracket for the primary householder has the lowest median household income of $0, with 90 households (1.2%) in this group.
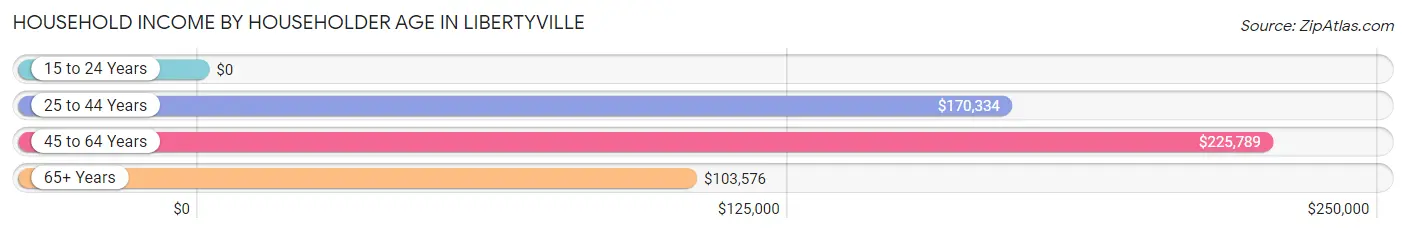
| Income Bracket | # Households | Median Income |
| 15 to 24 Years | 90 (1.2%) | $0 |
| 25 to 44 Years | 2,137 (28.1%) | $170,334 |
| 45 to 64 Years | 3,350 (44.0%) | $225,789 |
| 65+ Years | 2,031 (26.7%) | $103,576 |
| Total | 7,608 (100.0%) | $161,302 |
Poverty in Libertyville
Income Below Poverty by Sex and Age in Libertyville
With 2.3% poverty level for males and 3.8% for females among the residents of Libertyville, 15 year old males and 75 year old and over females are the most vulnerable to poverty, with 14 males (10.3%) and 122 females (15.7%) in their respective age groups living below the poverty level.
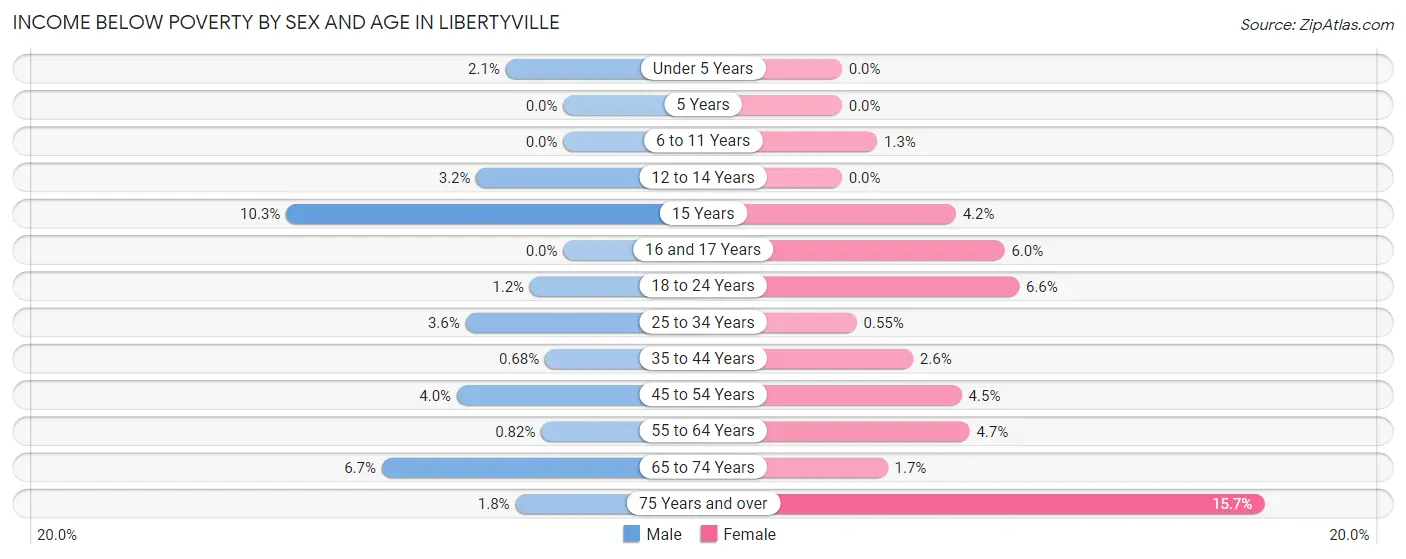
| Age Bracket | Male | Female |
| Under 5 Years | 9 (2.1%) | 0 (0.0%) |
| 5 Years | 0 (0.0%) | 0 (0.0%) |
| 6 to 11 Years | 0 (0.0%) | 15 (1.3%) |
| 12 to 14 Years | 16 (3.2%) | 0 (0.0%) |
| 15 Years | 14 (10.3%) | 8 (4.2%) |
| 16 and 17 Years | 0 (0.0%) | 22 (6.0%) |
| 18 to 24 Years | 8 (1.2%) | 45 (6.6%) |
| 25 to 34 Years | 37 (3.6%) | 4 (0.5%) |
| 35 to 44 Years | 8 (0.7%) | 35 (2.6%) |
| 45 to 54 Years | 59 (4.0%) | 79 (4.4%) |
| 55 to 64 Years | 13 (0.8%) | 60 (4.7%) |
| 65 to 74 Years | 49 (6.7%) | 19 (1.7%) |
| 75 Years and over | 12 (1.8%) | 122 (15.7%) |
| Total | 225 (2.3%) | 409 (3.8%) |
Income Above Poverty by Sex and Age in Libertyville
According to the poverty statistics in Libertyville, males aged 5 years and females aged under 5 years are the age groups that are most secure financially, with 100.0% of males and 100.0% of females in these age groups living above the poverty line.
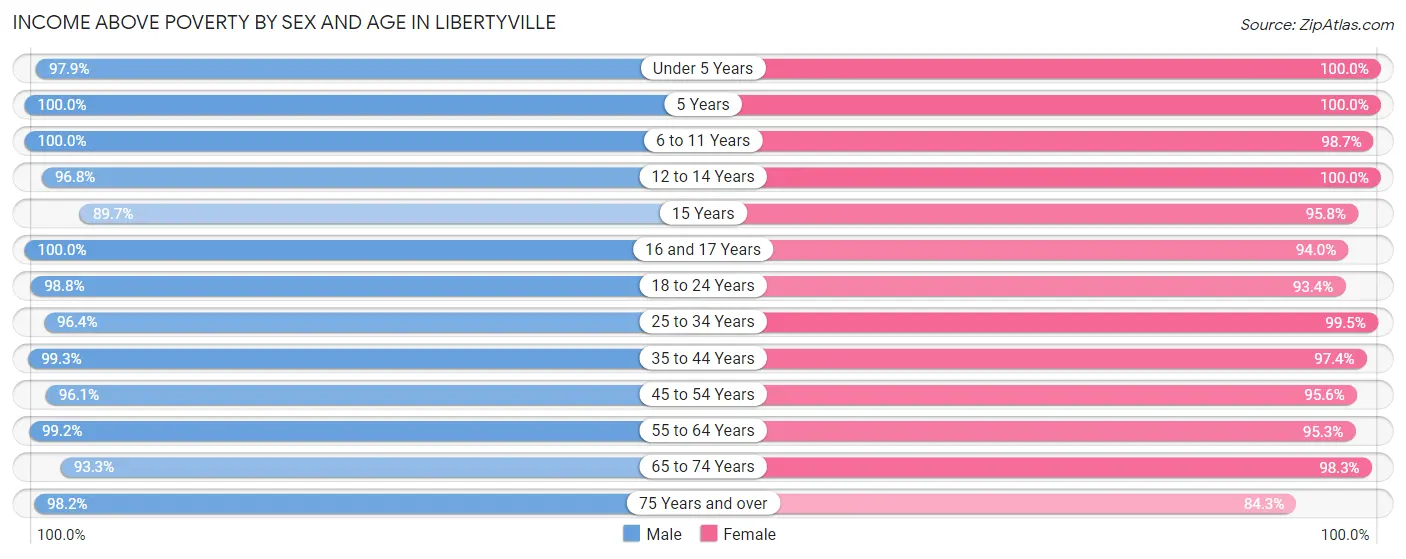
| Age Bracket | Male | Female |
| Under 5 Years | 411 (97.9%) | 702 (100.0%) |
| 5 Years | 66 (100.0%) | 69 (100.0%) |
| 6 to 11 Years | 843 (100.0%) | 1,131 (98.7%) |
| 12 to 14 Years | 480 (96.8%) | 501 (100.0%) |
| 15 Years | 122 (89.7%) | 181 (95.8%) |
| 16 and 17 Years | 319 (100.0%) | 342 (94.0%) |
| 18 to 24 Years | 639 (98.8%) | 639 (93.4%) |
| 25 to 34 Years | 981 (96.4%) | 729 (99.5%) |
| 35 to 44 Years | 1,162 (99.3%) | 1,289 (97.4%) |
| 45 to 54 Years | 1,435 (96.1%) | 1,695 (95.6%) |
| 55 to 64 Years | 1,577 (99.2%) | 1,205 (95.3%) |
| 65 to 74 Years | 678 (93.3%) | 1,099 (98.3%) |
| 75 Years and over | 662 (98.2%) | 656 (84.3%) |
| Total | 9,375 (97.7%) | 10,238 (96.2%) |
Income Below Poverty Among Married-Couple Families in Libertyville
The poverty statistics for married-couple families in Libertyville show that 1.4% or 69 of the total 4,945 families live below the poverty line. Families with 3 or 4 children have the highest poverty rate of 3.1%, comprising of 14 families. On the other hand, families with 5 or more children have the lowest poverty rate of 0.0%, which includes 0 families.
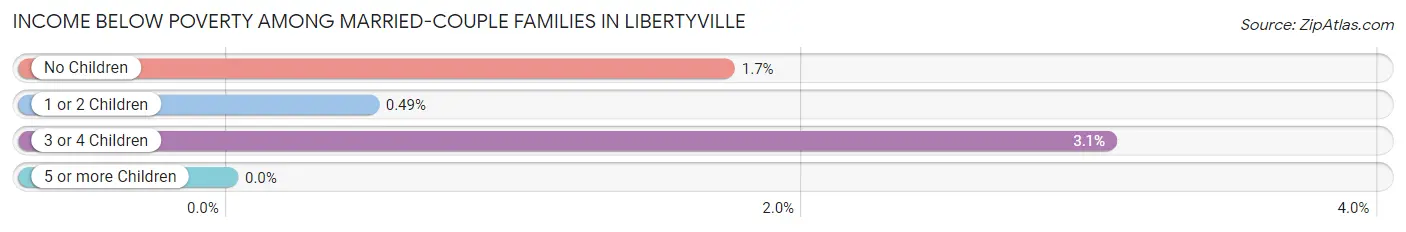
| Children | Above Poverty | Below Poverty |
| No Children | 2,606 (98.3%) | 46 (1.7%) |
| 1 or 2 Children | 1,819 (99.5%) | 9 (0.5%) |
| 3 or 4 Children | 444 (96.9%) | 14 (3.1%) |
| 5 or more Children | 7 (100.0%) | 0 (0.0%) |
| Total | 4,876 (98.6%) | 69 (1.4%) |
Income Below Poverty Among Single-Parent Households in Libertyville
According to the poverty data in Libertyville, 5.2% or 8 single-father households and 1.9% or 8 single-mother households are living below the poverty line. Among single-father households, those with 1 or 2 children have the highest poverty rate, with 8 households (14.8%) experiencing poverty. Likewise, among single-mother households, those with 1 or 2 children have the highest poverty rate, with 8 households (2.8%) falling below the poverty line.
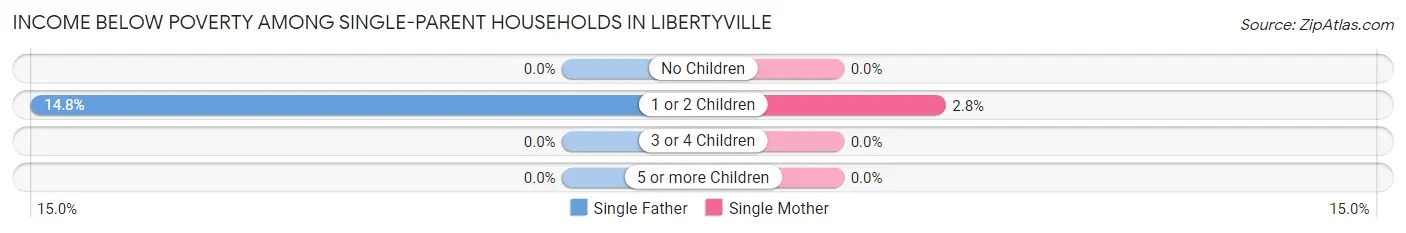
| Children | Single Father | Single Mother |
| No Children | 0 (0.0%) | 0 (0.0%) |
| 1 or 2 Children | 8 (14.8%) | 8 (2.8%) |
| 3 or 4 Children | 0 (0.0%) | 0 (0.0%) |
| 5 or more Children | 0 (0.0%) | 0 (0.0%) |
| Total | 8 (5.2%) | 8 (1.9%) |
Income Below Poverty Among Married-Couple vs Single-Parent Households in Libertyville
The poverty data for Libertyville shows that 69 of the married-couple family households (1.4%) and 16 of the single-parent households (2.8%) are living below the poverty level. Within the married-couple family households, those with 3 or 4 children have the highest poverty rate, with 14 households (3.1%) falling below the poverty line. Among the single-parent households, those with 1 or 2 children have the highest poverty rate, with 16 household (4.8%) living below poverty.
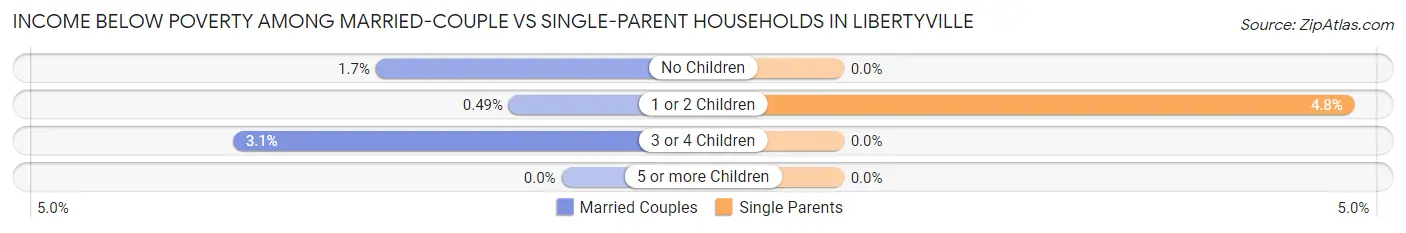
| Children | Married-Couple Families | Single-Parent Households |
| No Children | 46 (1.7%) | 0 (0.0%) |
| 1 or 2 Children | 9 (0.5%) | 16 (4.8%) |
| 3 or 4 Children | 14 (3.1%) | 0 (0.0%) |
| 5 or more Children | 0 (0.0%) | 0 (0.0%) |
| Total | 69 (1.4%) | 16 (2.8%) |
Race in Libertyville
The most populous races in Libertyville are White / Caucasian (17,429 | 84.8%), Hispanic or Latino (1,493 | 7.3%), and Asian (1,347 | 6.6%).
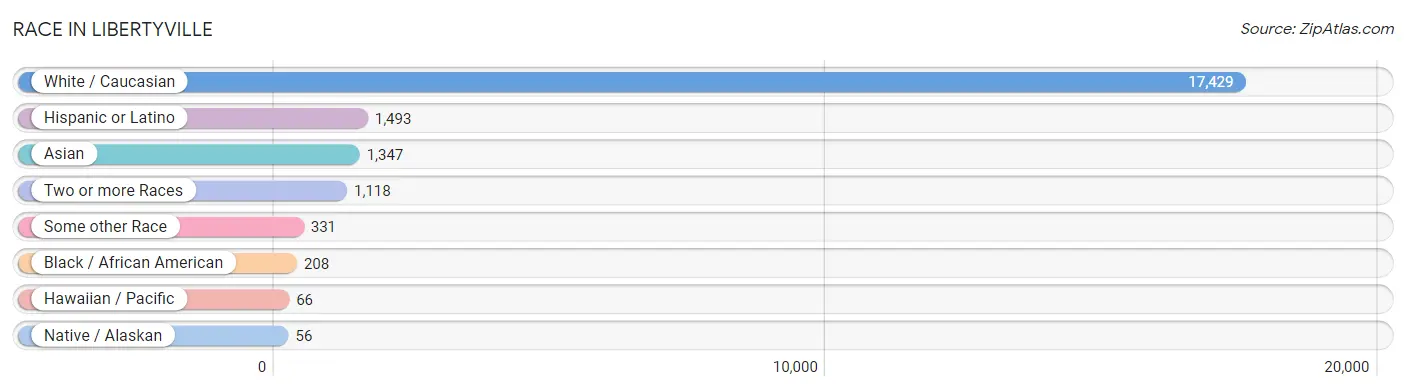
| Race | # Population | % Population |
| Asian | 1,347 | 6.6% |
| Black / African American | 208 | 1.0% |
| Hawaiian / Pacific | 66 | 0.3% |
| Hispanic or Latino | 1,493 | 7.3% |
| Native / Alaskan | 56 | 0.3% |
| White / Caucasian | 17,429 | 84.8% |
| Two or more Races | 1,118 | 5.4% |
| Some other Race | 331 | 1.6% |
| Total | 20,555 | 100.0% |
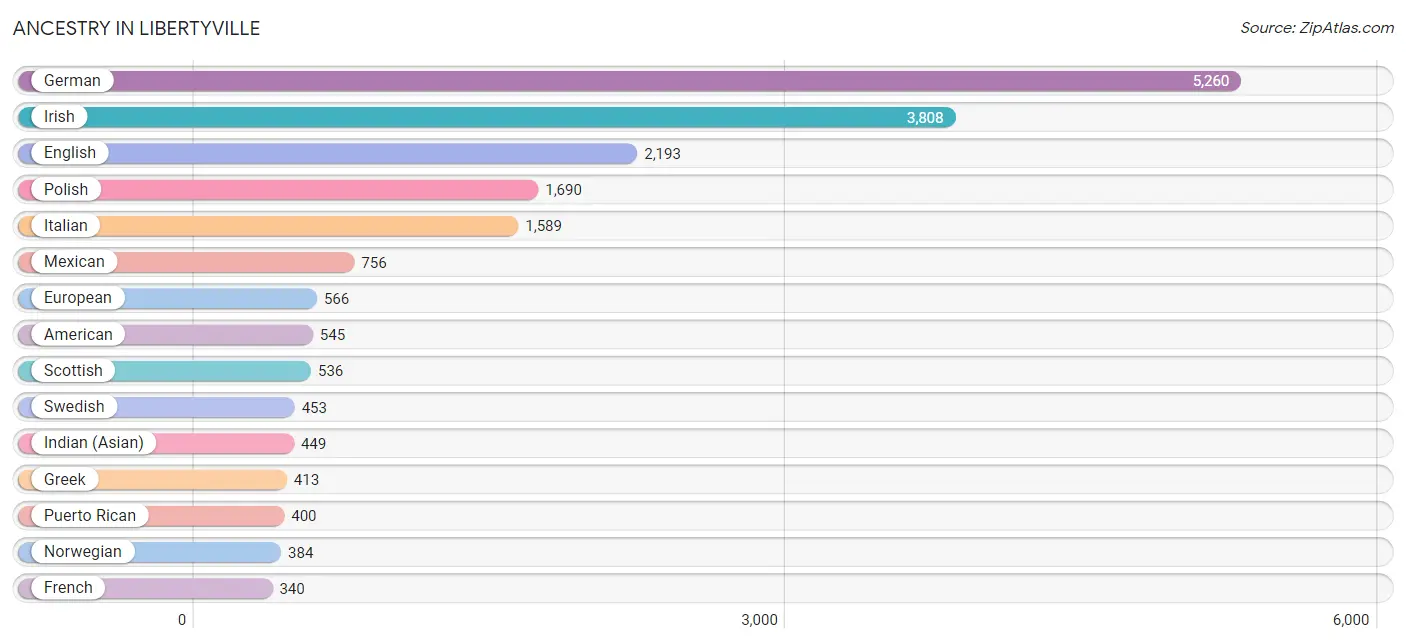
Ancestry in Libertyville
The most populous ancestries reported in Libertyville are German (5,260 | 25.6%), Irish (3,808 | 18.5%), English (2,193 | 10.7%), Polish (1,690 | 8.2%), and Italian (1,589 | 7.7%), together accounting for 70.7% of all Libertyville residents.
| Ancestry | # Population | % Population |
| Albanian | 32 | 0.2% |
| American | 545 | 2.6% |
| Arab | 176 | 0.9% |
| Argentinean | 23 | 0.1% |
| Armenian | 38 | 0.2% |
| Assyrian / Chaldean / Syriac | 57 | 0.3% |
| Australian | 32 | 0.2% |
| Austrian | 218 | 1.1% |
| Belgian | 14 | 0.1% |
| Bhutanese | 88 | 0.4% |
| British | 136 | 0.7% |
| Burmese | 78 | 0.4% |
| Canadian | 48 | 0.2% |
| Central American | 34 | 0.2% |
| Cherokee | 14 | 0.1% |
| Chickasaw | 16 | 0.1% |
| Chilean | 15 | 0.1% |
| Colombian | 45 | 0.2% |
| Croatian | 54 | 0.3% |
| Cuban | 92 | 0.4% |
| Czech | 207 | 1.0% |
| Czechoslovakian | 29 | 0.1% |
| Danish | 125 | 0.6% |
| Dutch | 331 | 1.6% |
| Eastern European | 157 | 0.8% |
| Egyptian | 57 | 0.3% |
| English | 2,193 | 10.7% |
| Estonian | 9 | 0.0% |
| Ethiopian | 12 | 0.1% |
| European | 566 | 2.8% |
| Filipino | 26 | 0.1% |
| Finnish | 90 | 0.4% |
| French | 340 | 1.7% |
| French Canadian | 100 | 0.5% |
| German | 5,260 | 25.6% |
| Greek | 413 | 2.0% |
| Hungarian | 142 | 0.7% |
| Icelander | 11 | 0.1% |
| Indian (Asian) | 449 | 2.2% |
| Iranian | 7 | 0.0% |
| Irish | 3,808 | 18.5% |
| Iroquois | 7 | 0.0% |
| Israeli | 53 | 0.3% |
| Italian | 1,589 | 7.7% |
| Jamaican | 37 | 0.2% |
| Japanese | 20 | 0.1% |
| Jordanian | 22 | 0.1% |
| Korean | 149 | 0.7% |
| Lebanese | 45 | 0.2% |
| Lithuanian | 185 | 0.9% |
| Luxembourger | 54 | 0.3% |
| Malaysian | 49 | 0.2% |
| Mexican | 756 | 3.7% |
| Mexican American Indian | 43 | 0.2% |
| Nigerian | 10 | 0.1% |
| Northern European | 173 | 0.8% |
| Norwegian | 384 | 1.9% |
| Osage | 26 | 0.1% |
| Palestinian | 12 | 0.1% |
| Panamanian | 6 | 0.0% |
| Peruvian | 28 | 0.1% |
| Polish | 1,690 | 8.2% |
| Portuguese | 30 | 0.2% |
| Pueblo | 8 | 0.0% |
| Puerto Rican | 400 | 1.9% |
| Romanian | 46 | 0.2% |
| Russian | 339 | 1.7% |
| Salvadoran | 28 | 0.1% |
| Samoan | 66 | 0.3% |
| Scandinavian | 90 | 0.4% |
| Scotch-Irish | 184 | 0.9% |
| Scottish | 536 | 2.6% |
| Serbian | 129 | 0.6% |
| Slavic | 8 | 0.0% |
| Slovak | 64 | 0.3% |
| Slovene | 18 | 0.1% |
| South African | 32 | 0.2% |
| South American | 111 | 0.5% |
| Soviet Union | 13 | 0.1% |
| Spanish | 86 | 0.4% |
| Subsaharan African | 54 | 0.3% |
| Swedish | 453 | 2.2% |
| Swiss | 75 | 0.4% |
| Syrian | 14 | 0.1% |
| Thai | 335 | 1.6% |
| Trinidadian and Tobagonian | 47 | 0.2% |
| Ukrainian | 164 | 0.8% |
| Welsh | 124 | 0.6% | View All 88 Rows |
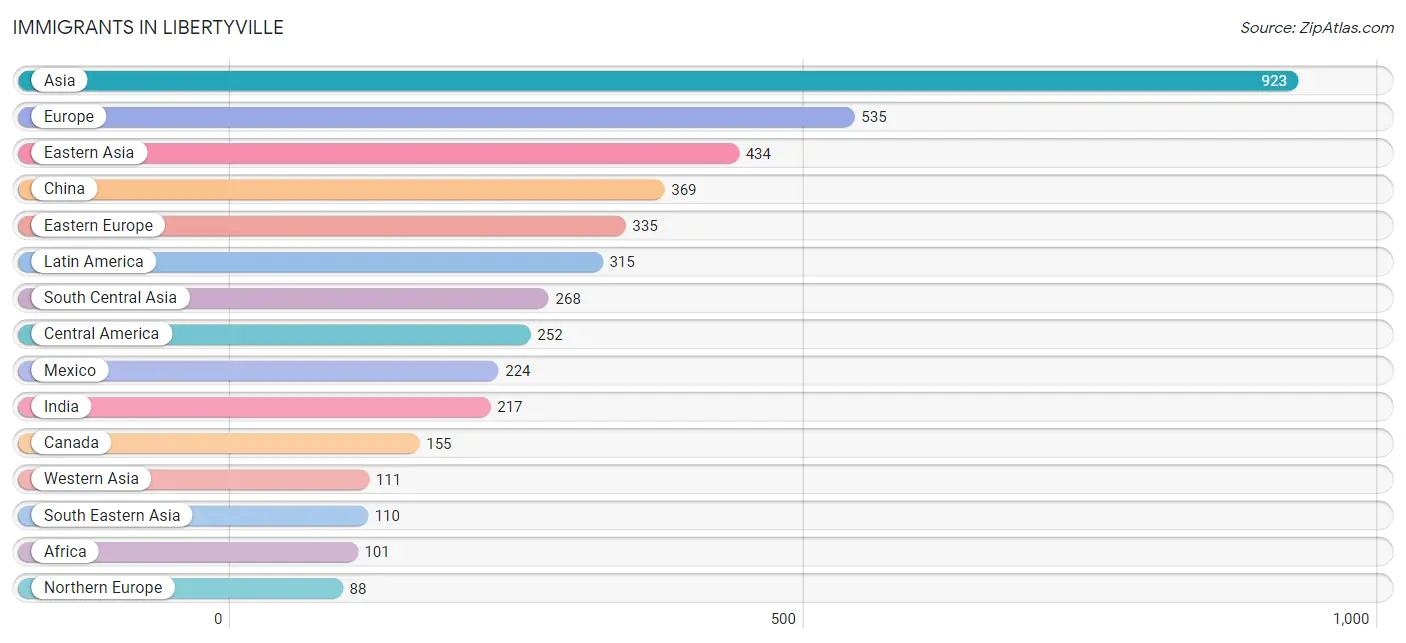
Immigrants in Libertyville
The most numerous immigrant groups reported in Libertyville came from Asia (923 | 4.5%), Europe (535 | 2.6%), Eastern Asia (434 | 2.1%), China (369 | 1.8%), and Eastern Europe (335 | 1.6%), together accounting for 12.6% of all Libertyville residents.
| Immigration Origin | # Population | % Population |
| Africa | 101 | 0.5% |
| Argentina | 11 | 0.1% |
| Asia | 923 | 4.5% |
| Australia | 16 | 0.1% |
| Austria | 9 | 0.0% |
| Bangladesh | 3 | 0.0% |
| Belarus | 7 | 0.0% |
| Bosnia and Herzegovina | 7 | 0.0% |
| Brazil | 32 | 0.2% |
| Canada | 155 | 0.7% |
| Caribbean | 11 | 0.1% |
| Central America | 252 | 1.2% |
| Chile | 9 | 0.0% |
| China | 369 | 1.8% |
| Cuba | 11 | 0.1% |
| Denmark | 6 | 0.0% |
| Eastern Africa | 12 | 0.1% |
| Eastern Asia | 434 | 2.1% |
| Eastern Europe | 335 | 1.6% |
| Egypt | 47 | 0.2% |
| El Salvador | 28 | 0.1% |
| England | 11 | 0.1% |
| Ethiopia | 12 | 0.1% |
| Europe | 535 | 2.6% |
| Germany | 51 | 0.3% |
| Greece | 24 | 0.1% |
| Hong Kong | 40 | 0.2% |
| Hungary | 14 | 0.1% |
| India | 217 | 1.1% |
| Iran | 10 | 0.1% |
| Ireland | 33 | 0.2% |
| Israel | 23 | 0.1% |
| Italy | 21 | 0.1% |
| Japan | 4 | 0.0% |
| Jordan | 4 | 0.0% |
| Korea | 61 | 0.3% |
| Kuwait | 4 | 0.0% |
| Latin America | 315 | 1.5% |
| Lebanon | 8 | 0.0% |
| Lithuania | 28 | 0.1% |
| Mexico | 224 | 1.1% |
| Moldova | 24 | 0.1% |
| Nigeria | 10 | 0.1% |
| North Macedonia | 10 | 0.1% |
| Northern Africa | 47 | 0.2% |
| Northern Europe | 88 | 0.4% |
| Oceania | 33 | 0.2% |
| Pakistan | 29 | 0.1% |
| Philippines | 77 | 0.4% |
| Poland | 62 | 0.3% |
| Romania | 35 | 0.2% |
| Russia | 50 | 0.2% |
| Saudi Arabia | 10 | 0.1% |
| Scotland | 21 | 0.1% |
| Serbia | 29 | 0.1% |
| Singapore | 27 | 0.1% |
| South Africa | 32 | 0.2% |
| South America | 52 | 0.3% |
| South Central Asia | 268 | 1.3% |
| South Eastern Asia | 110 | 0.5% |
| Southern Europe | 52 | 0.3% |
| Spain | 7 | 0.0% |
| Sweden | 11 | 0.1% |
| Syria | 41 | 0.2% |
| Taiwan | 13 | 0.1% |
| Ukraine | 49 | 0.2% |
| Vietnam | 6 | 0.0% |
| Western Africa | 10 | 0.1% |
| Western Asia | 111 | 0.5% |
| Western Europe | 60 | 0.3% | View All 70 Rows |
Sex and Age in Libertyville
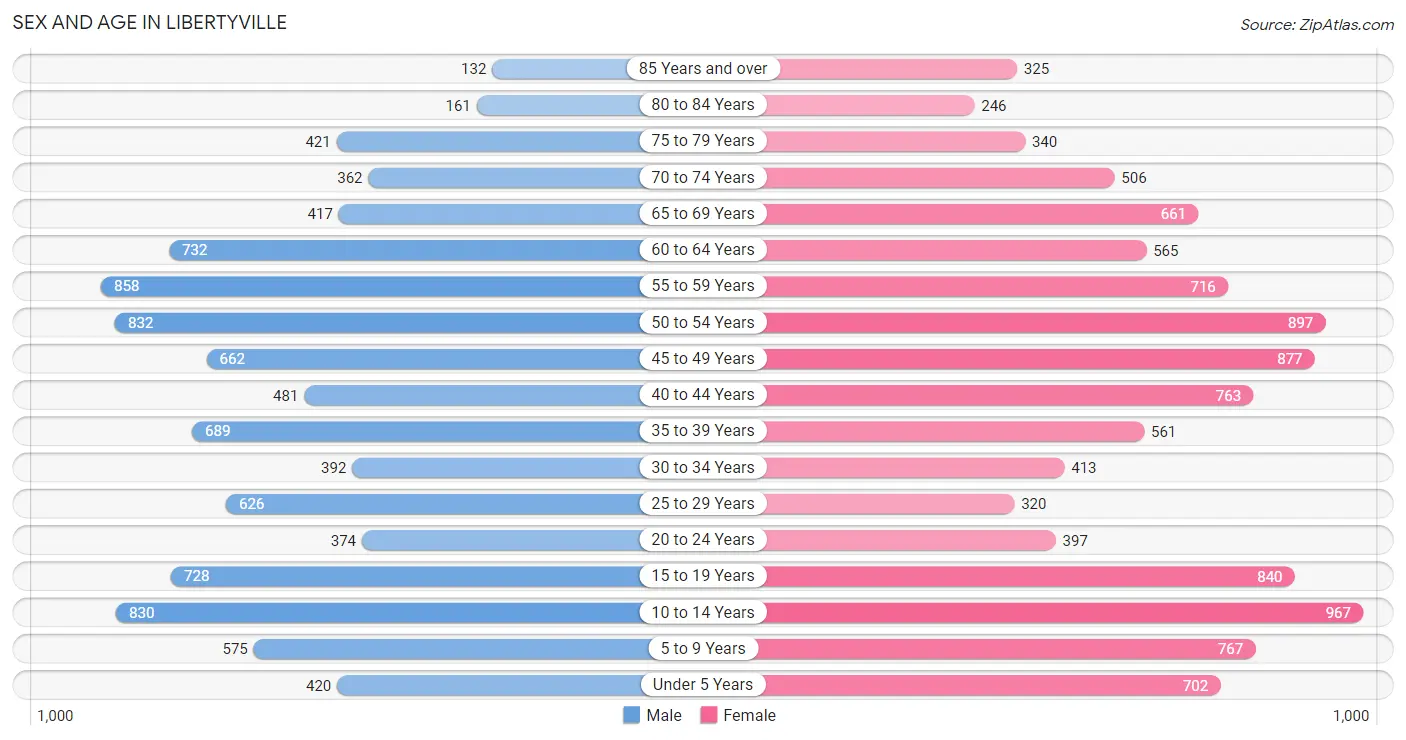
Sex and Age in Libertyville
The most populous age groups in Libertyville are 55 to 59 Years (858 | 8.8%) for men and 10 to 14 Years (967 | 8.9%) for women.
| Age Bracket | Male | Female |
| Under 5 Years | 420 (4.3%) | 702 (6.5%) |
| 5 to 9 Years | 575 (5.9%) | 767 (7.1%) |
| 10 to 14 Years | 830 (8.6%) | 967 (8.9%) |
| 15 to 19 Years | 728 (7.5%) | 840 (7.7%) |
| 20 to 24 Years | 374 (3.9%) | 397 (3.6%) |
| 25 to 29 Years | 626 (6.5%) | 320 (2.9%) |
| 30 to 34 Years | 392 (4.0%) | 413 (3.8%) |
| 35 to 39 Years | 689 (7.1%) | 561 (5.2%) |
| 40 to 44 Years | 481 (5.0%) | 763 (7.0%) |
| 45 to 49 Years | 662 (6.8%) | 877 (8.1%) |
| 50 to 54 Years | 832 (8.6%) | 897 (8.3%) |
| 55 to 59 Years | 858 (8.8%) | 716 (6.6%) |
| 60 to 64 Years | 732 (7.5%) | 565 (5.2%) |
| 65 to 69 Years | 417 (4.3%) | 661 (6.1%) |
| 70 to 74 Years | 362 (3.7%) | 506 (4.7%) |
| 75 to 79 Years | 421 (4.3%) | 340 (3.1%) |
| 80 to 84 Years | 161 (1.7%) | 246 (2.3%) |
| 85 Years and over | 132 (1.4%) | 325 (3.0%) |
| Total | 9,692 (100.0%) | 10,863 (100.0%) |
Families and Households in Libertyville
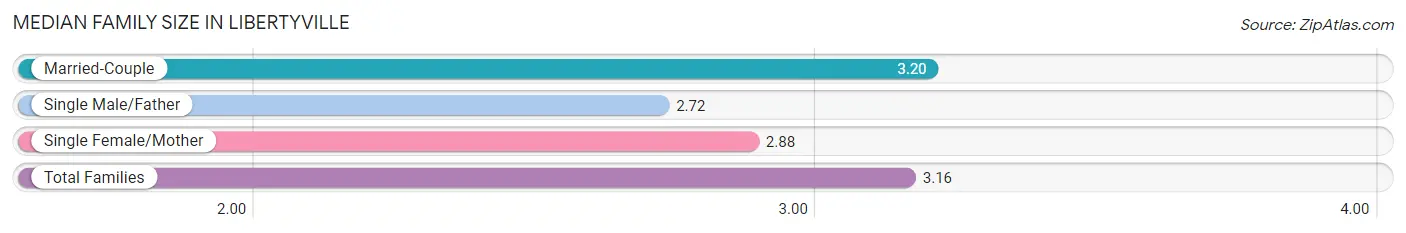
Median Family Size in Libertyville
The median family size in Libertyville is 3.16 persons per family, with married-couple families (4,945 | 89.5%) accounting for the largest median family size of 3.2 persons per family. On the other hand, single male/father families (153 | 2.8%) represent the smallest median family size with 2.72 persons per family.
| Family Type | # Families | Family Size |
| Married-Couple | 4,945 (89.5%) | 3.20 |
| Single Male/Father | 153 (2.8%) | 2.72 |
| Single Female/Mother | 427 (7.7%) | 2.88 |
| Total Families | 5,525 (100.0%) | 3.16 |
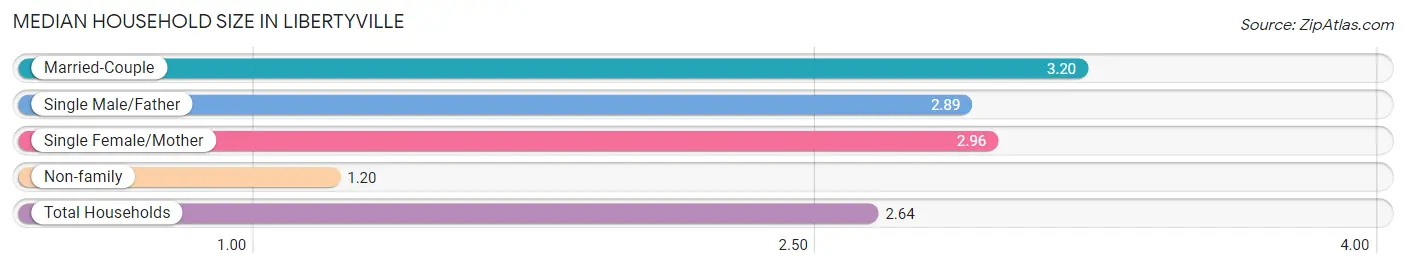
Median Household Size in Libertyville
The median household size in Libertyville is 2.64 persons per household, with married-couple households (4,945 | 65.0%) accounting for the largest median household size of 3.2 persons per household. non-family households (2,083 | 27.4%) represent the smallest median household size with 1.20 persons per household.
| Household Type | # Households | Household Size |
| Married-Couple | 4,945 (65.0%) | 3.20 |
| Single Male/Father | 153 (2.0%) | 2.89 |
| Single Female/Mother | 427 (5.6%) | 2.96 |
| Non-family | 2,083 (27.4%) | 1.20 |
| Total Households | 7,608 (100.0%) | 2.64 |
Household Size by Marriage Status in Libertyville
Out of a total of 7,608 households in Libertyville, 5,525 (72.6%) are family households, while 2,083 (27.4%) are nonfamily households. The most numerous type of family households are 2-person households, comprising 2,407, and the most common type of nonfamily households are 1-person households, comprising 1,754.
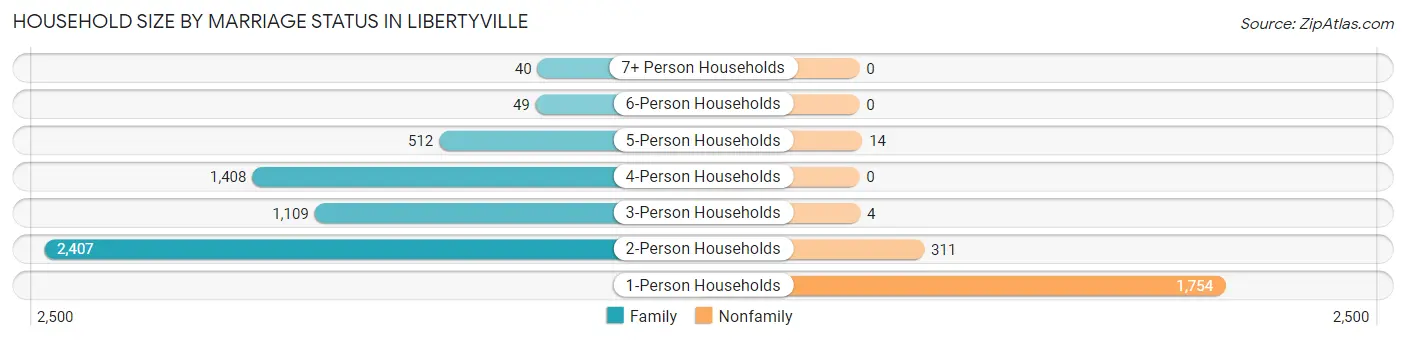
| Household Size | Family Households | Nonfamily Households |
| 1-Person Households | - | 1,754 (23.1%) |
| 2-Person Households | 2,407 (31.6%) | 311 (4.1%) |
| 3-Person Households | 1,109 (14.6%) | 4 (0.1%) |
| 4-Person Households | 1,408 (18.5%) | 0 (0.0%) |
| 5-Person Households | 512 (6.7%) | 14 (0.2%) |
| 6-Person Households | 49 (0.6%) | 0 (0.0%) |
| 7+ Person Households | 40 (0.5%) | 0 (0.0%) |
| Total | 5,525 (72.6%) | 2,083 (27.4%) |
Female Fertility in Libertyville
Fertility by Age in Libertyville
Average fertility rate in Libertyville is 37.0 births per 1,000 women. Women in the age bracket of 20 to 34 years have the highest fertility rate with 91.0 births per 1,000 women. Women in the age bracket of 20 to 34 years acount for 64.8% of all women with births.
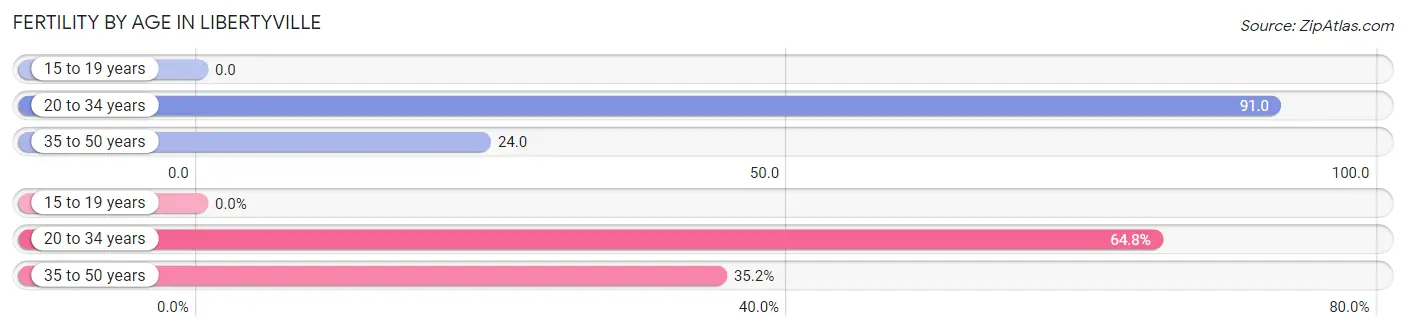
| Age Bracket | Women with Births | Births / 1,000 Women |
| 15 to 19 years | 0 (0.0%) | 0.0 |
| 20 to 34 years | 103 (64.8%) | 91.0 |
| 35 to 50 years | 56 (35.2%) | 24.0 |
| Total | 159 (100.0%) | 37.0 |
Fertility by Age by Marriage Status in Libertyville
79.2% of women with births (159) in Libertyville are married. The highest percentage of unmarried women with births falls into 20 to 34 years age bracket with 22.3% of them unmarried at the time of birth, while the lowest percentage of unmarried women with births belong to 35 to 50 years age bracket with 17.9% of them unmarried.
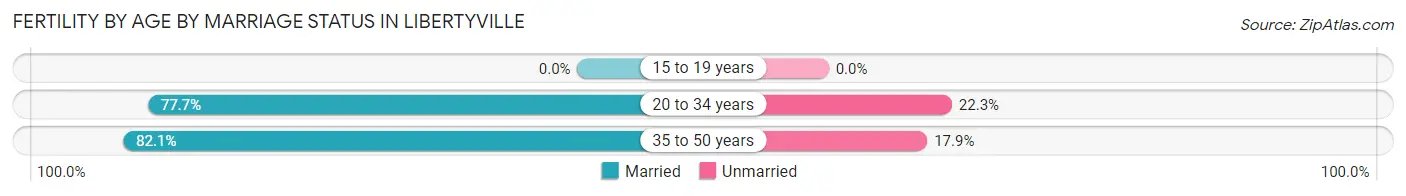
| Age Bracket | Married | Unmarried |
| 15 to 19 years | 0 (0.0%) | 0 (0.0%) |
| 20 to 34 years | 80 (77.7%) | 23 (22.3%) |
| 35 to 50 years | 46 (82.1%) | 10 (17.9%) |
| Total | 126 (79.2%) | 33 (20.7%) |
Fertility by Education in Libertyville
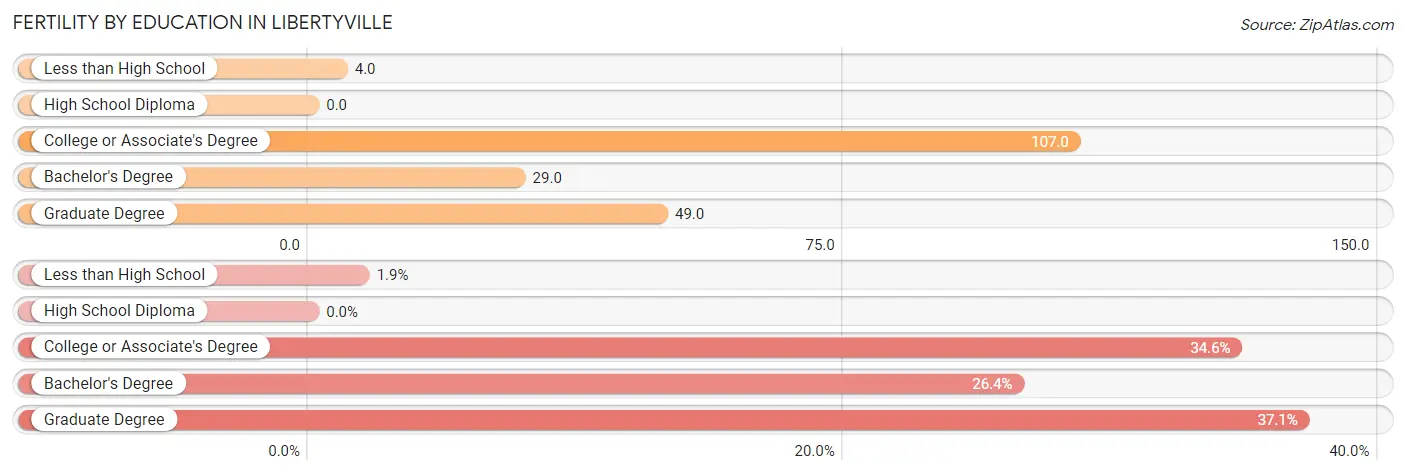
| Educational Attainment | Women with Births | Births / 1,000 Women |
| Less than High School | 3 (1.9%) | 4.0 |
| High School Diploma | 0 (0.0%) | 0.0 |
| College or Associate's Degree | 55 (34.6%) | 107.0 |
| Bachelor's Degree | 42 (26.4%) | 29.0 |
| Graduate Degree | 59 (37.1%) | 49.0 |
| Total | 159 (100.0%) | 37.0 |
Fertility by Education by Marriage Status in Libertyville
20.7% of women with births in Libertyville are unmarried. Women with the educational attainment of bachelor's degree are most likely to be married with 100.0% of them married at childbirth, while women with the educational attainment of less than high school are least likely to be married with 100.0% of them unmarried at childbirth.
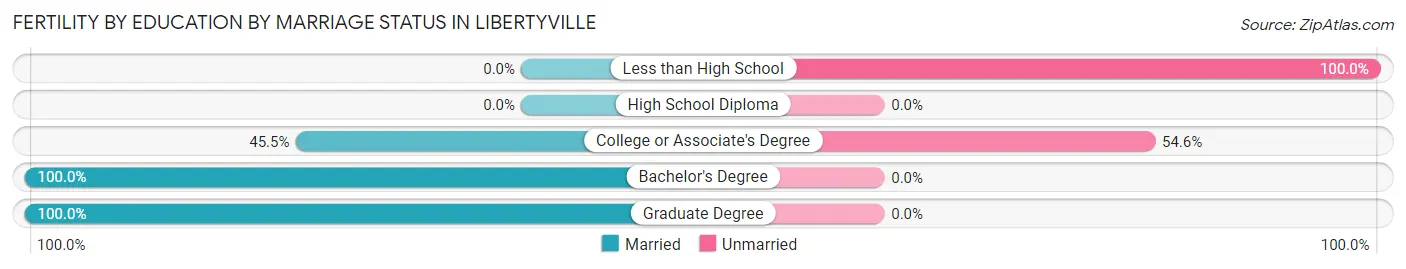
| Educational Attainment | Married | Unmarried |
| Less than High School | 0 (0.0%) | 3 (100.0%) |
| High School Diploma | 0 (0.0%) | 0 (0.0%) |
| College or Associate's Degree | 25 (45.5%) | 30 (54.5%) |
| Bachelor's Degree | 42 (100.0%) | 0 (0.0%) |
| Graduate Degree | 59 (100.0%) | 0 (0.0%) |
| Total | 126 (79.2%) | 33 (20.7%) |
Employment Characteristics in Libertyville
Employment by Class of Employer in Libertyville
Among the 9,856 employed individuals in Libertyville, private company employees (7,103 | 72.1%), local government employees (845 | 8.6%), and self-employed (incorporated) (686 | 7.0%) make up the most common classes of employment.
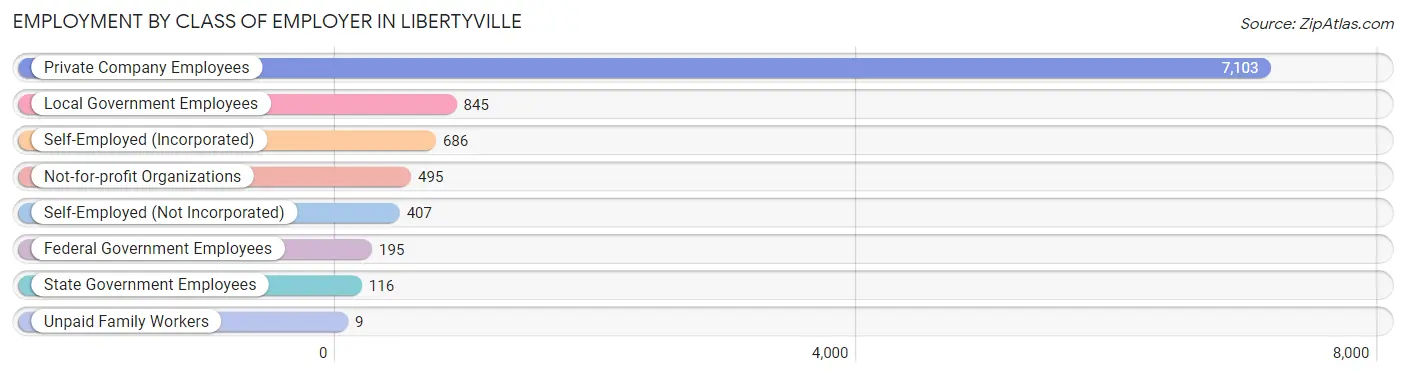
| Employer Class | # Employees | % Employees |
| Private Company Employees | 7,103 | 72.1% |
| Self-Employed (Incorporated) | 686 | 7.0% |
| Self-Employed (Not Incorporated) | 407 | 4.1% |
| Not-for-profit Organizations | 495 | 5.0% |
| Local Government Employees | 845 | 8.6% |
| State Government Employees | 116 | 1.2% |
| Federal Government Employees | 195 | 2.0% |
| Unpaid Family Workers | 9 | 0.1% |
| Total | 9,856 | 100.0% |
Employment Status by Age in Libertyville
According to the labor force statistics for Libertyville, out of the total population over 16 years of age (15,969), 64.7% or 10,332 individuals are in the labor force, with 3.2% or 331 of them unemployed. The age group with the highest labor force participation rate is 25 to 29 years, with 92.9% or 879 individuals in the labor force. Within the labor force, the 75 years and over age range has the highest percentage of unemployed individuals, with 16.4% or 28 of them being unemployed.
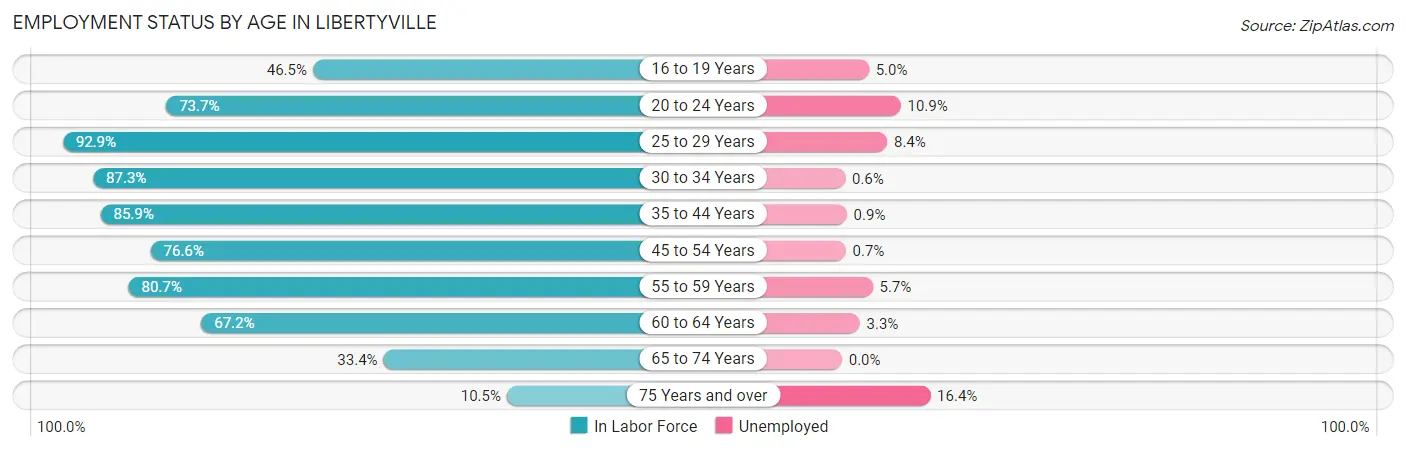
| Age Bracket | In Labor Force | Unemployed |
| 16 to 19 Years | 578 (46.5%) | 29 (5.0%) |
| 20 to 24 Years | 568 (73.7%) | 62 (10.9%) |
| 25 to 29 Years | 879 (92.9%) | 74 (8.4%) |
| 30 to 34 Years | 703 (87.3%) | 4 (0.6%) |
| 35 to 44 Years | 2,142 (85.9%) | 19 (0.9%) |
| 45 to 54 Years | 2,503 (76.6%) | 18 (0.7%) |
| 55 to 59 Years | 1,270 (80.7%) | 72 (5.7%) |
| 60 to 64 Years | 872 (67.2%) | 29 (3.3%) |
| 65 to 74 Years | 650 (33.4%) | 0 (0.0%) |
| 75 Years and over | 171 (10.5%) | 28 (16.4%) |
| Total | 10,332 (64.7%) | 331 (3.2%) |
Employment Status by Educational Attainment in Libertyville
According to labor force statistics for Libertyville, 80.6% of individuals (8,370) out of the total population between 25 and 64 years of age (10,384) are in the labor force, with 2.6% or 218 of them being unemployed. The group with the highest labor force participation rate are those with the educational attainment of bachelor's degree or higher, with 82.4% or 6,702 individuals in the labor force. Within the labor force, individuals with college / associate degree education have the highest percentage of unemployment, with 6.0% or 66 of them being unemployed.
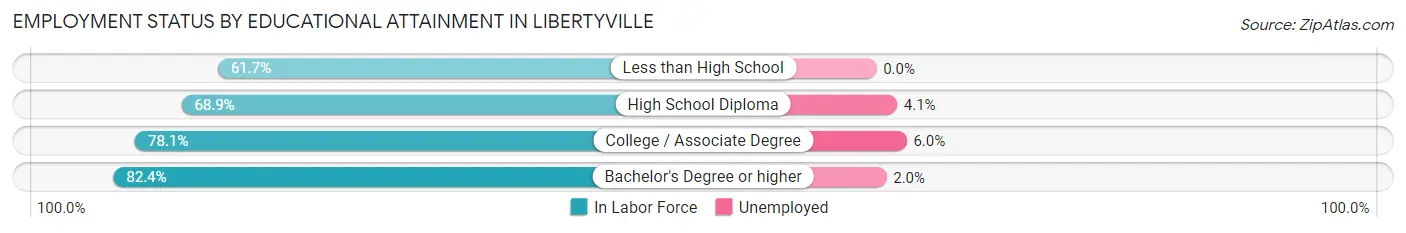
| Educational Attainment | In Labor Force | Unemployed |
| Less than High School | 129 (61.7%) | 0 (0.0%) |
| High School Diploma | 436 (68.9%) | 26 (4.1%) |
| College / Associate Degree | 1,100 (78.1%) | 84 (6.0%) |
| Bachelor's Degree or higher | 6,702 (82.4%) | 163 (2.0%) |
| Total | 8,370 (80.6%) | 270 (2.6%) |
Employment Occupations by Sex in Libertyville
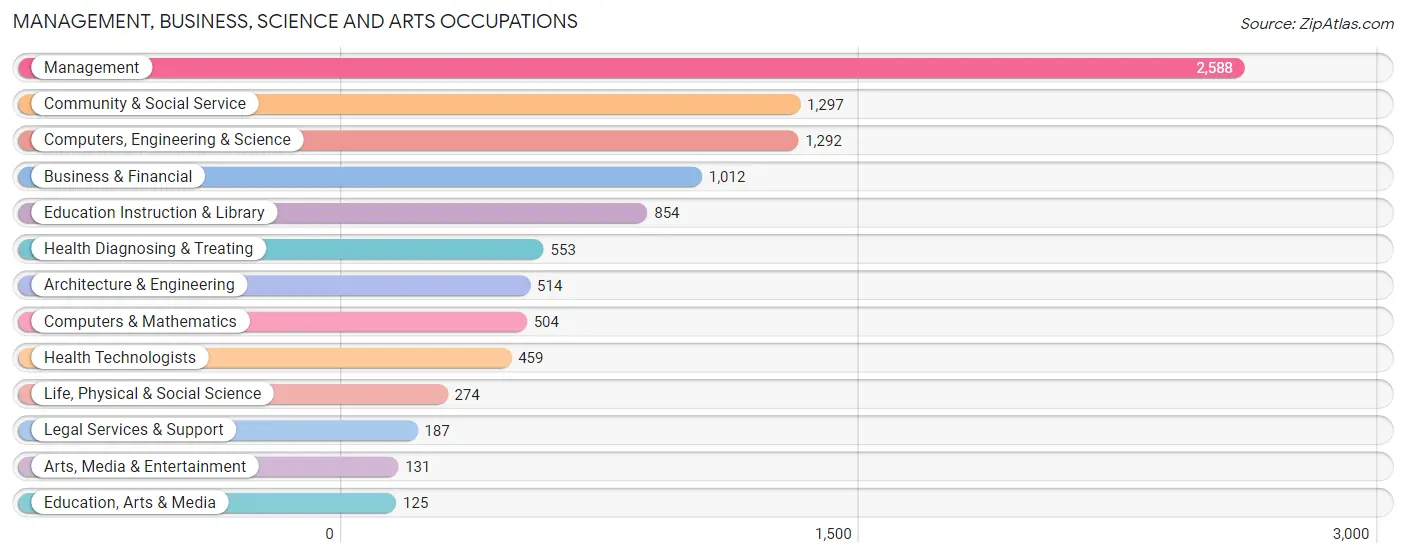
Management, Business, Science and Arts Occupations
The most common Management, Business, Science and Arts occupations in Libertyville are Management (2,588 | 25.9%), Community & Social Service (1,297 | 13.0%), Computers, Engineering & Science (1,292 | 12.9%), Business & Financial (1,012 | 10.1%), and Education Instruction & Library (854 | 8.6%).
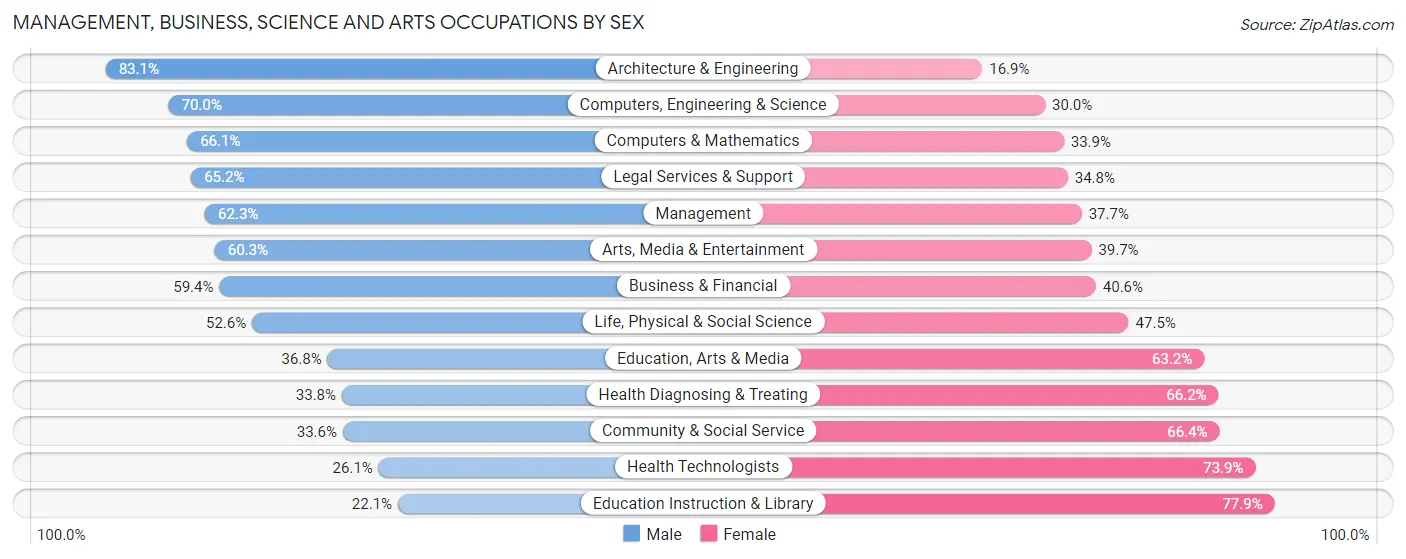
Management, Business, Science and Arts Occupations by Sex
Within the Management, Business, Science and Arts occupations in Libertyville, the most male-oriented occupations are Architecture & Engineering (83.1%), Computers, Engineering & Science (70.0%), and Computers & Mathematics (66.1%), while the most female-oriented occupations are Education Instruction & Library (77.9%), Health Technologists (73.9%), and Community & Social Service (66.4%).
| Occupation | Male | Female |
| Management | 1,613 (62.3%) | 975 (37.7%) |
| Business & Financial | 601 (59.4%) | 411 (40.6%) |
| Computers, Engineering & Science | 904 (70.0%) | 388 (30.0%) |
| Computers & Mathematics | 333 (66.1%) | 171 (33.9%) |
| Architecture & Engineering | 427 (83.1%) | 87 (16.9%) |
| Life, Physical & Social Science | 144 (52.5%) | 130 (47.4%) |
| Community & Social Service | 436 (33.6%) | 861 (66.4%) |
| Education, Arts & Media | 46 (36.8%) | 79 (63.2%) |
| Legal Services & Support | 122 (65.2%) | 65 (34.8%) |
| Education Instruction & Library | 189 (22.1%) | 665 (77.9%) |
| Arts, Media & Entertainment | 79 (60.3%) | 52 (39.7%) |
| Health Diagnosing & Treating | 187 (33.8%) | 366 (66.2%) |
| Health Technologists | 120 (26.1%) | 339 (73.9%) |
| Total (Category) | 3,741 (55.5%) | 3,001 (44.5%) |
| Total (Overall) | 5,513 (55.2%) | 4,468 (44.8%) |
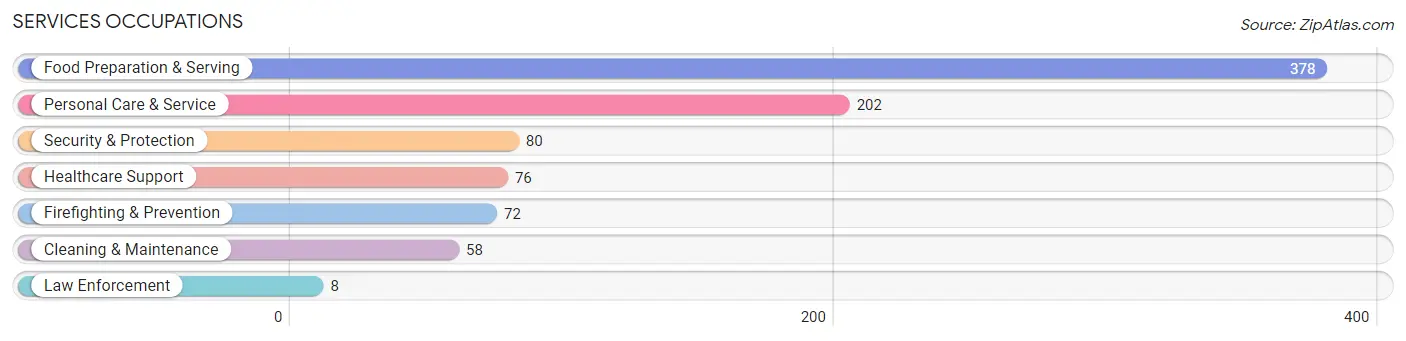
Services Occupations
The most common Services occupations in Libertyville are Food Preparation & Serving (378 | 3.8%), Personal Care & Service (202 | 2.0%), Security & Protection (80 | 0.8%), Healthcare Support (76 | 0.8%), and Firefighting & Prevention (72 | 0.7%).
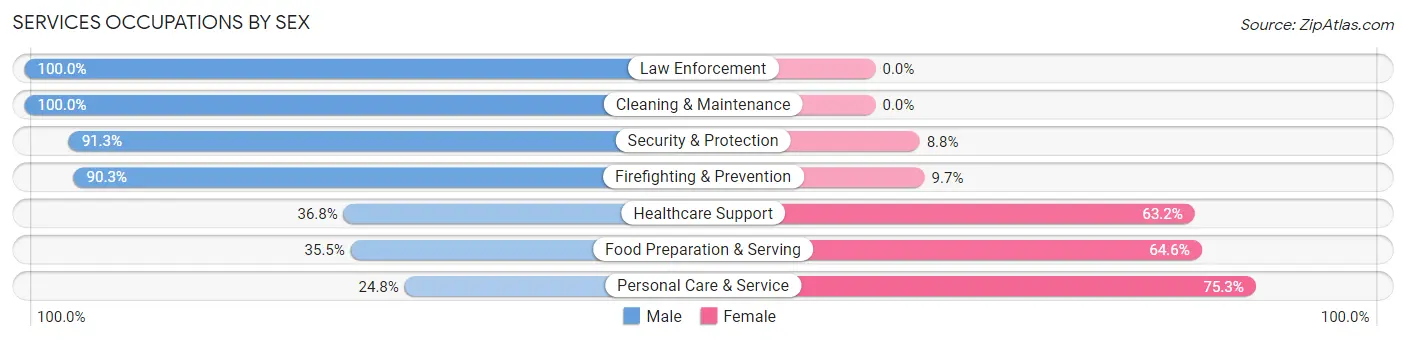
Services Occupations by Sex
Within the Services occupations in Libertyville, the most male-oriented occupations are Law Enforcement (100.0%), Cleaning & Maintenance (100.0%), and Security & Protection (91.2%), while the most female-oriented occupations are Personal Care & Service (75.2%), Food Preparation & Serving (64.5%), and Healthcare Support (63.2%).
| Occupation | Male | Female |
| Healthcare Support | 28 (36.8%) | 48 (63.2%) |
| Security & Protection | 73 (91.2%) | 7 (8.7%) |
| Firefighting & Prevention | 65 (90.3%) | 7 (9.7%) |
| Law Enforcement | 8 (100.0%) | 0 (0.0%) |
| Food Preparation & Serving | 134 (35.4%) | 244 (64.5%) |
| Cleaning & Maintenance | 58 (100.0%) | 0 (0.0%) |
| Personal Care & Service | 50 (24.7%) | 152 (75.2%) |
| Total (Category) | 343 (43.2%) | 451 (56.8%) |
| Total (Overall) | 5,513 (55.2%) | 4,468 (44.8%) |
Sales and Office Occupations
The most common Sales and Office occupations in Libertyville are Sales & Related (1,120 | 11.2%), and Office & Administration (678 | 6.8%).

Sales and Office Occupations by Sex
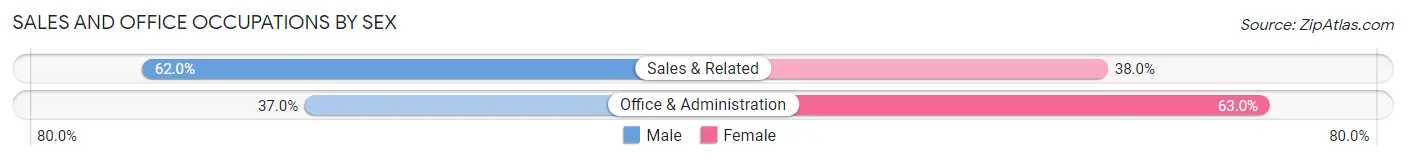
| Occupation | Male | Female |
| Sales & Related | 694 (62.0%) | 426 (38.0%) |
| Office & Administration | 251 (37.0%) | 427 (63.0%) |
| Total (Category) | 945 (52.6%) | 853 (47.4%) |
| Total (Overall) | 5,513 (55.2%) | 4,468 (44.8%) |
Natural Resources, Construction and Maintenance Occupations
The most common Natural Resources, Construction and Maintenance occupations in Libertyville are Installation, Maintenance & Repair (161 | 1.6%), and Construction & Extraction (89 | 0.9%).

Natural Resources, Construction and Maintenance Occupations by Sex

| Occupation | Male | Female |
| Farming, Fishing & Forestry | 0 (0.0%) | 0 (0.0%) |
| Construction & Extraction | 89 (100.0%) | 0 (0.0%) |
| Installation, Maintenance & Repair | 153 (95.0%) | 8 (5.0%) |
| Total (Category) | 242 (96.8%) | 8 (3.2%) |
| Total (Overall) | 5,513 (55.2%) | 4,468 (44.8%) |
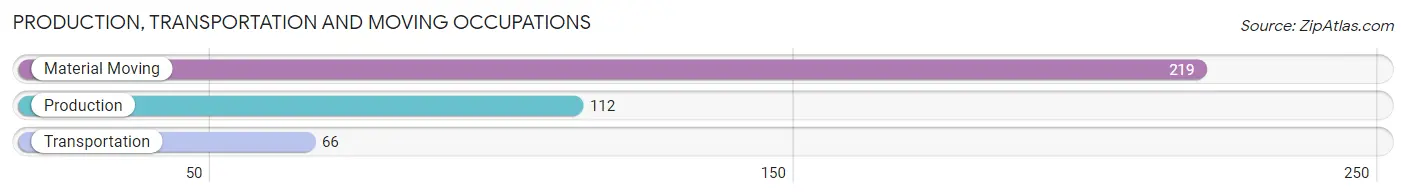
Production, Transportation and Moving Occupations
The most common Production, Transportation and Moving occupations in Libertyville are Material Moving (219 | 2.2%), Production (112 | 1.1%), and Transportation (66 | 0.7%).
Production, Transportation and Moving Occupations by Sex
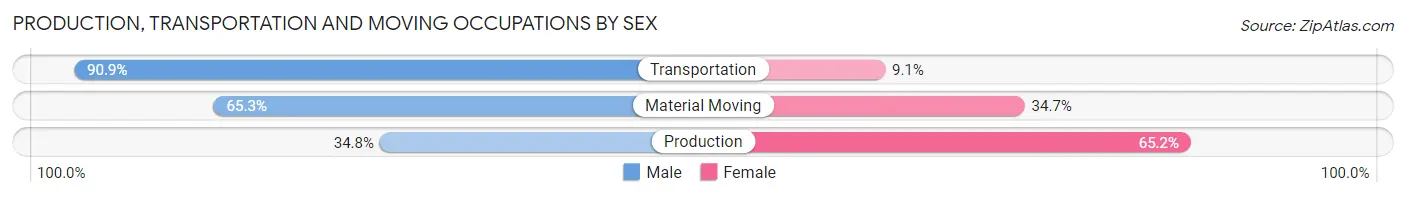
| Occupation | Male | Female |
| Production | 39 (34.8%) | 73 (65.2%) |
| Transportation | 60 (90.9%) | 6 (9.1%) |
| Material Moving | 143 (65.3%) | 76 (34.7%) |
| Total (Category) | 242 (61.0%) | 155 (39.0%) |
| Total (Overall) | 5,513 (55.2%) | 4,468 (44.8%) |
Employment Industries by Sex in Libertyville
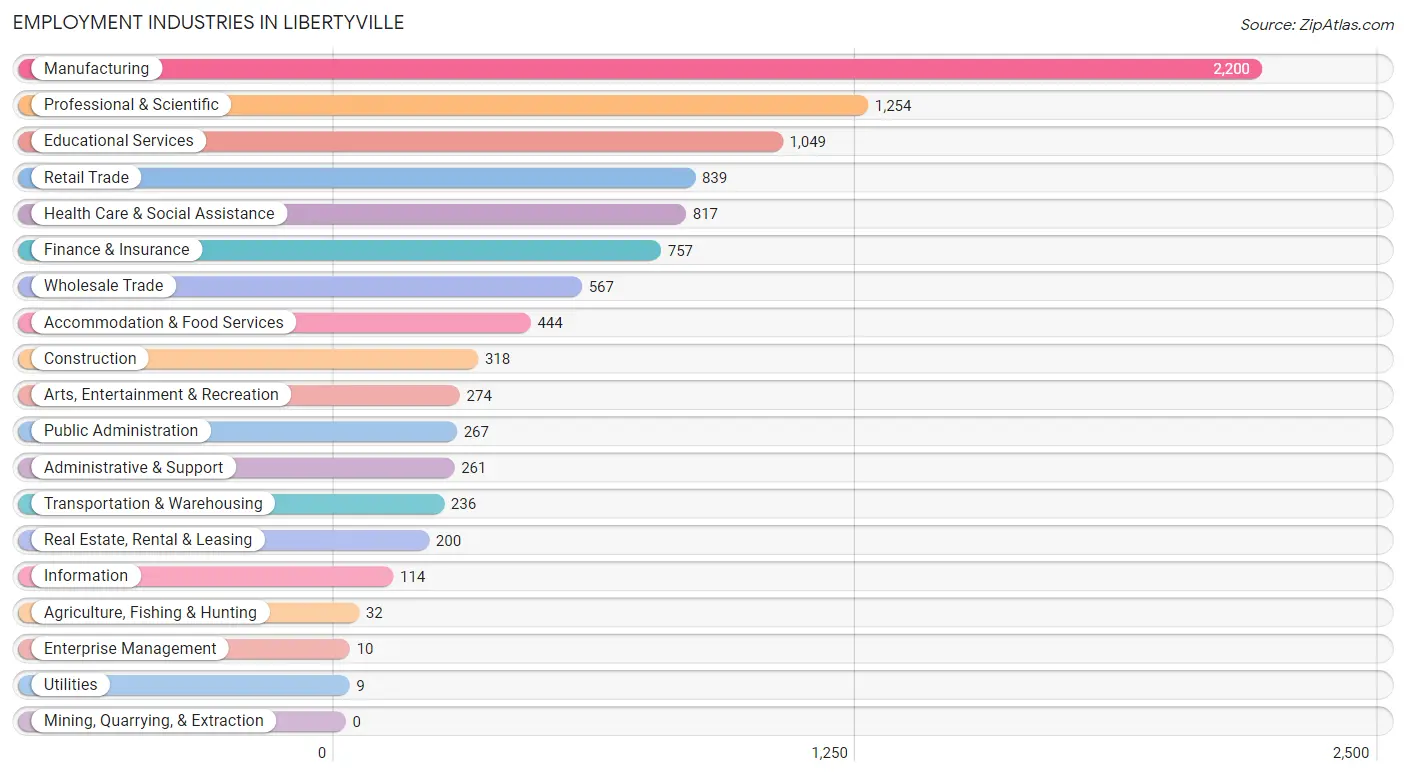
Employment Industries in Libertyville
The major employment industries in Libertyville include Manufacturing (2,200 | 22.0%), Professional & Scientific (1,254 | 12.6%), Educational Services (1,049 | 10.5%), Retail Trade (839 | 8.4%), and Health Care & Social Assistance (817 | 8.2%).
Employment Industries by Sex in Libertyville
The Libertyville industries that see more men than women are Utilities (100.0%), Construction (90.6%), and Transportation & Warehousing (68.6%), whereas the industries that tend to have a higher number of women are Enterprise Management (100.0%), Educational Services (78.7%), and Arts, Entertainment & Recreation (58.8%).
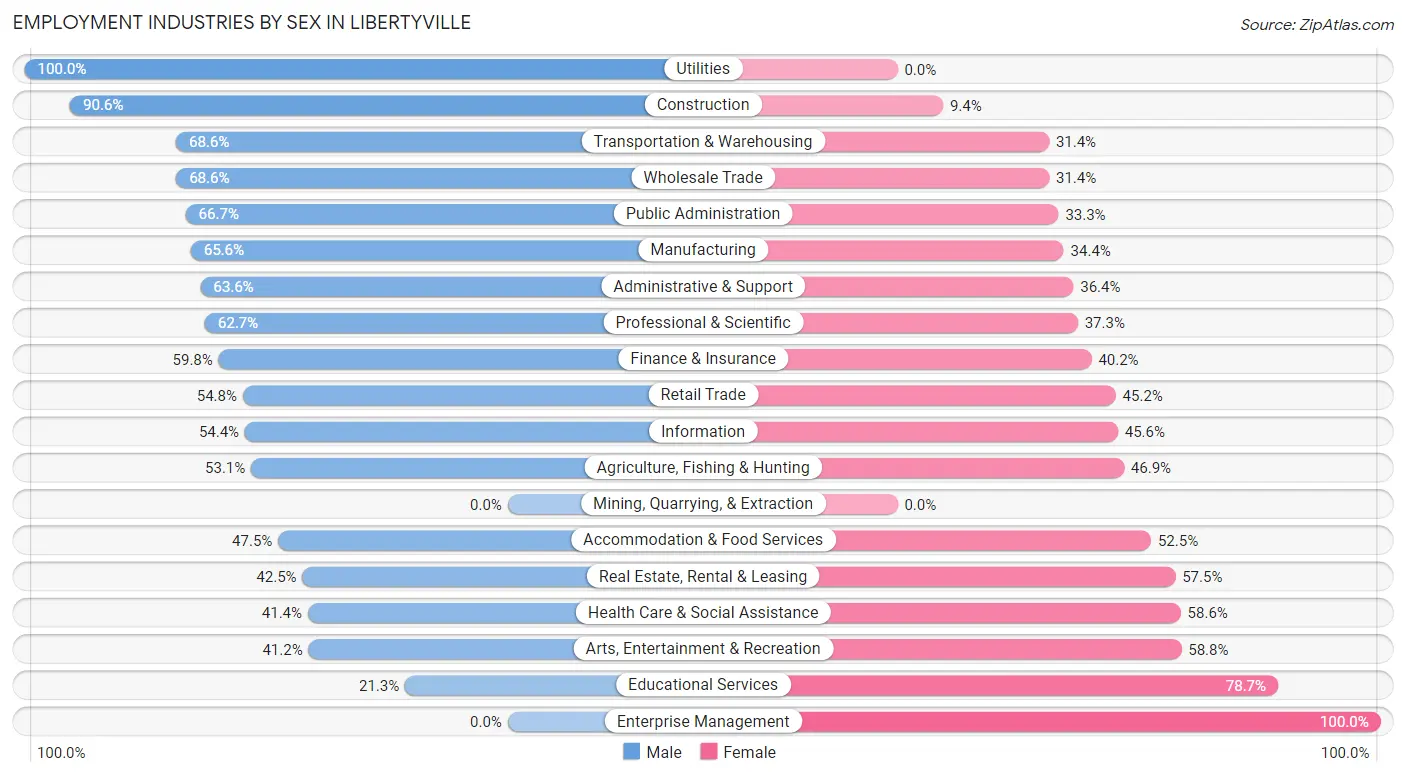
| Industry | Male | Female |
| Agriculture, Fishing & Hunting | 17 (53.1%) | 15 (46.9%) |
| Mining, Quarrying, & Extraction | 0 (0.0%) | 0 (0.0%) |
| Construction | 288 (90.6%) | 30 (9.4%) |
| Manufacturing | 1,443 (65.6%) | 757 (34.4%) |
| Wholesale Trade | 389 (68.6%) | 178 (31.4%) |
| Retail Trade | 460 (54.8%) | 379 (45.2%) |
| Transportation & Warehousing | 162 (68.6%) | 74 (31.4%) |
| Utilities | 9 (100.0%) | 0 (0.0%) |
| Information | 62 (54.4%) | 52 (45.6%) |
| Finance & Insurance | 453 (59.8%) | 304 (40.2%) |
| Real Estate, Rental & Leasing | 85 (42.5%) | 115 (57.5%) |
| Professional & Scientific | 786 (62.7%) | 468 (37.3%) |
| Enterprise Management | 0 (0.0%) | 10 (100.0%) |
| Administrative & Support | 166 (63.6%) | 95 (36.4%) |
| Educational Services | 223 (21.3%) | 826 (78.7%) |
| Health Care & Social Assistance | 338 (41.4%) | 479 (58.6%) |
| Arts, Entertainment & Recreation | 113 (41.2%) | 161 (58.8%) |
| Accommodation & Food Services | 211 (47.5%) | 233 (52.5%) |
| Public Administration | 178 (66.7%) | 89 (33.3%) |
| Total | 5,513 (55.2%) | 4,468 (44.8%) |
Education in Libertyville
School Enrollment in Libertyville
The most common levels of schooling among the 5,763 students in Libertyville are high school (1,448 | 25.1%), elementary school (1,311 | 22.8%), and middle school (1,273 | 22.1%).
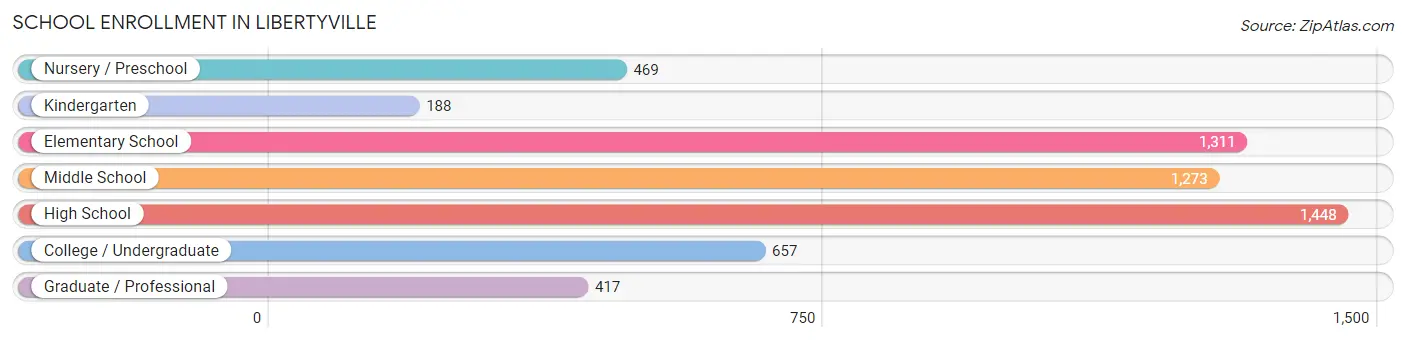
| School Level | # Students | % Students |
| Nursery / Preschool | 469 | 8.1% |
| Kindergarten | 188 | 3.3% |
| Elementary School | 1,311 | 22.8% |
| Middle School | 1,273 | 22.1% |
| High School | 1,448 | 25.1% |
| College / Undergraduate | 657 | 11.4% |
| Graduate / Professional | 417 | 7.2% |
| Total | 5,763 | 100.0% |
School Enrollment by Age by Funding Source in Libertyville
Out of a total of 5,763 students who are enrolled in schools in Libertyville, 1,060 (18.4%) attend a private institution, while the remaining 4,703 (81.6%) are enrolled in public schools. The age group of 3 to 4 year olds has the highest likelihood of being enrolled in private schools, with 259 (66.6% in the age bracket) enrolled. Conversely, the age group of 10 to 14 year olds has the lowest likelihood of being enrolled in a private school, with 1,562 (90.7% in the age bracket) attending a public institution.
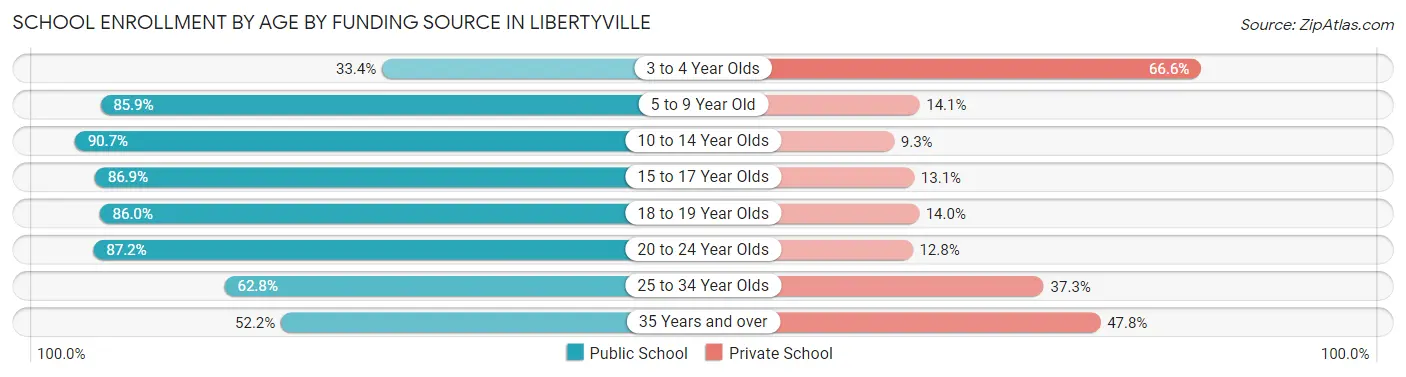
| Age Bracket | Public School | Private School |
| 3 to 4 Year Olds | 130 (33.4%) | 259 (66.6%) |
| 5 to 9 Year Old | 1,134 (85.9%) | 186 (14.1%) |
| 10 to 14 Year Olds | 1,562 (90.7%) | 161 (9.3%) |
| 15 to 17 Year Olds | 804 (86.9%) | 121 (13.1%) |
| 18 to 19 Year Olds | 437 (86.0%) | 71 (14.0%) |
| 20 to 24 Year Olds | 374 (87.2%) | 55 (12.8%) |
| 25 to 34 Year Olds | 96 (62.7%) | 57 (37.2%) |
| 35 Years and over | 165 (52.2%) | 151 (47.8%) |
| Total | 4,703 (81.6%) | 1,060 (18.4%) |
Educational Attainment by Field of Study in Libertyville
Business (2,593 | 23.4%), education (1,006 | 9.1%), science & technology (995 | 9.0%), engineering (904 | 8.2%), and social sciences (830 | 7.5%) are the most common fields of study among 11,092 individuals in Libertyville who have obtained a bachelor's degree or higher.
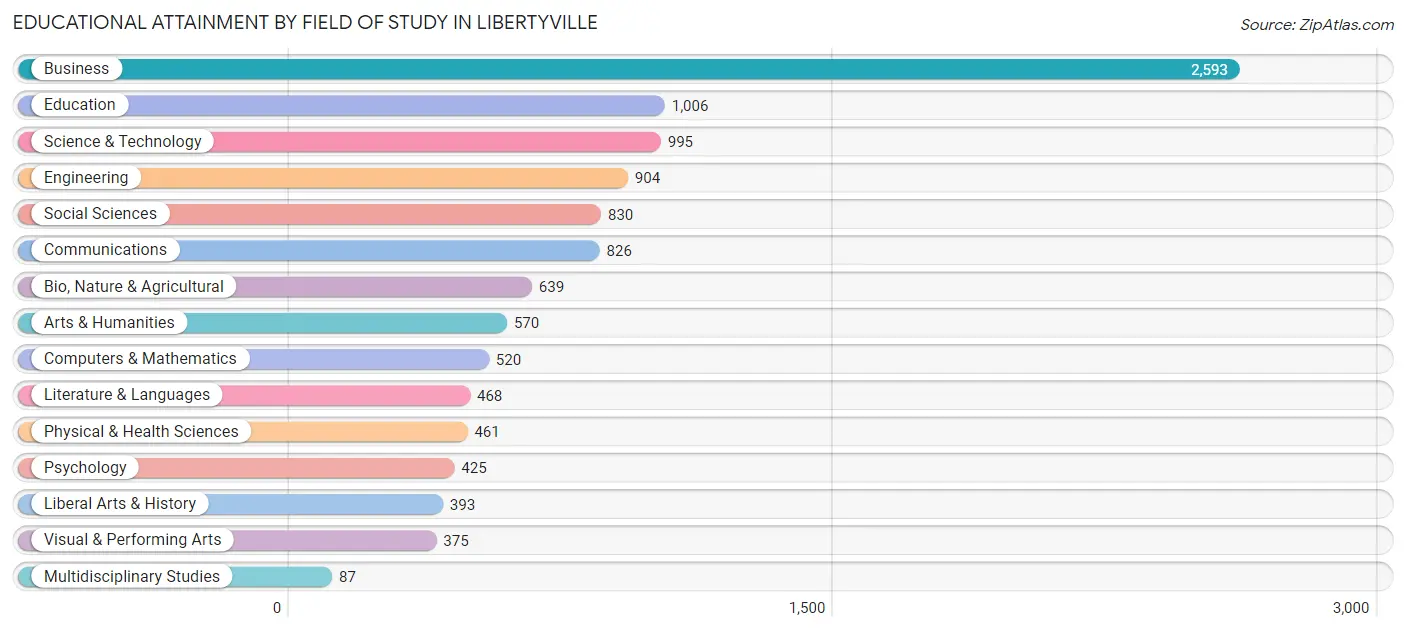
| Field of Study | # Graduates | % Graduates |
| Computers & Mathematics | 520 | 4.7% |
| Bio, Nature & Agricultural | 639 | 5.8% |
| Physical & Health Sciences | 461 | 4.2% |
| Psychology | 425 | 3.8% |
| Social Sciences | 830 | 7.5% |
| Engineering | 904 | 8.2% |
| Multidisciplinary Studies | 87 | 0.8% |
| Science & Technology | 995 | 9.0% |
| Business | 2,593 | 23.4% |
| Education | 1,006 | 9.1% |
| Literature & Languages | 468 | 4.2% |
| Liberal Arts & History | 393 | 3.5% |
| Visual & Performing Arts | 375 | 3.4% |
| Communications | 826 | 7.4% |
| Arts & Humanities | 570 | 5.1% |
| Total | 11,092 | 100.0% |
Transportation & Commute in Libertyville
Vehicle Availability by Sex in Libertyville
The most prevalent vehicle ownership categories in Libertyville are males with 2 vehicles (3,086, accounting for 56.6%) and females with 2 vehicles (2,126, making up 70.8%).
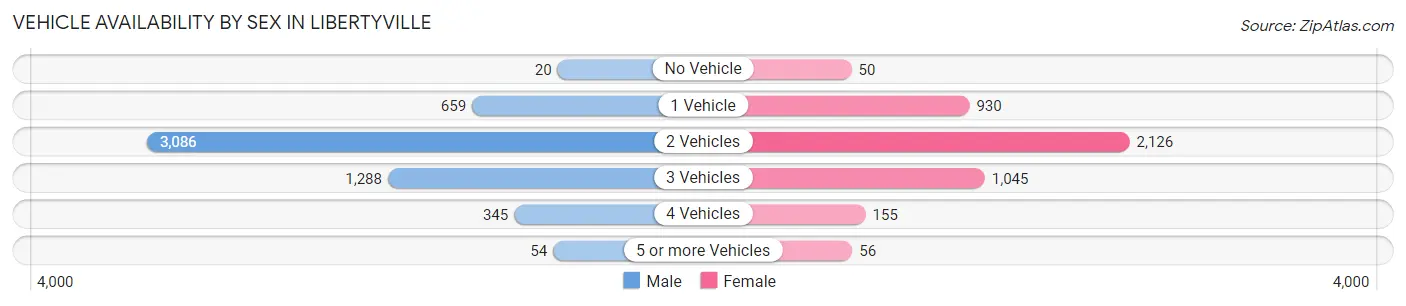
| Vehicles Available | Male | Female |
| No Vehicle | 20 (0.4%) | 50 (1.1%) |
| 1 Vehicle | 659 (12.1%) | 930 (21.3%) |
| 2 Vehicles | 3,086 (56.6%) | 2,126 (48.7%) |
| 3 Vehicles | 1,288 (23.6%) | 1,045 (24.0%) |
| 4 Vehicles | 345 (6.3%) | 155 (3.5%) |
| 5 or more Vehicles | 54 (1.0%) | 56 (1.3%) |
| Total | 5,452 (100.0%) | 4,362 (100.0%) |
Commute Time in Libertyville
The most frequently occuring commute durations in Libertyville are 15 to 19 minutes (1,205 commuters, 15.8%), 10 to 14 minutes (1,173 commuters, 15.3%), and 20 to 24 minutes (955 commuters, 12.5%).
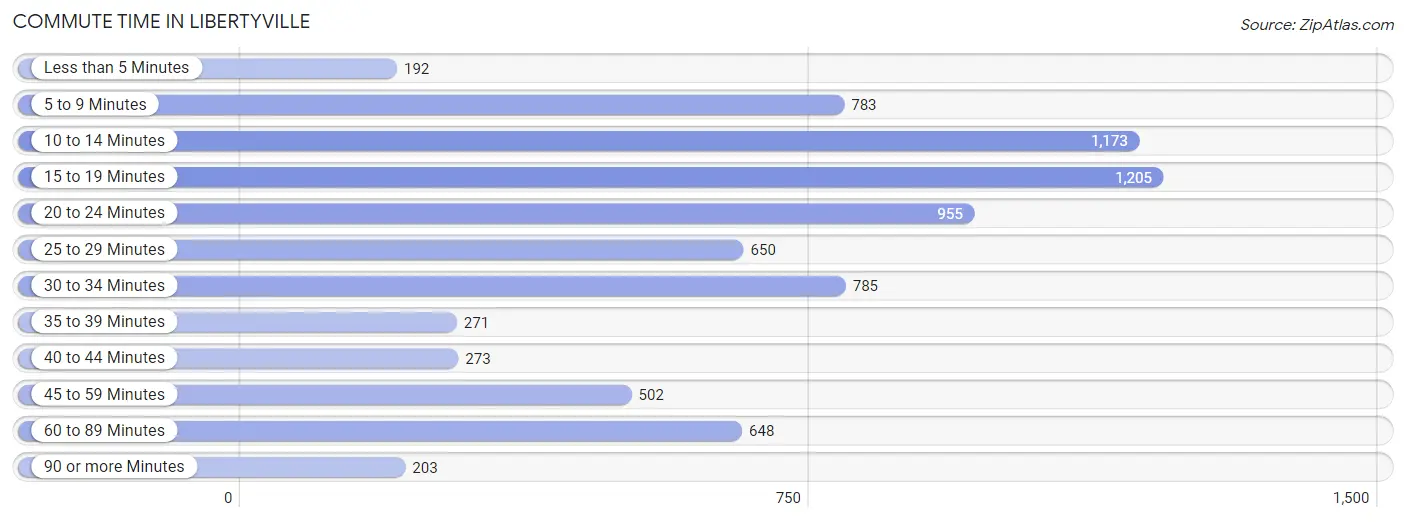
| Commute Time | # Commuters | % Commuters |
| Less than 5 Minutes | 192 | 2.5% |
| 5 to 9 Minutes | 783 | 10.2% |
| 10 to 14 Minutes | 1,173 | 15.3% |
| 15 to 19 Minutes | 1,205 | 15.8% |
| 20 to 24 Minutes | 955 | 12.5% |
| 25 to 29 Minutes | 650 | 8.5% |
| 30 to 34 Minutes | 785 | 10.3% |
| 35 to 39 Minutes | 271 | 3.5% |
| 40 to 44 Minutes | 273 | 3.6% |
| 45 to 59 Minutes | 502 | 6.6% |
| 60 to 89 Minutes | 648 | 8.5% |
| 90 or more Minutes | 203 | 2.7% |
Commute Time by Sex in Libertyville
The most common commute times in Libertyville are 20 to 24 minutes (580 commuters, 13.6%) for males and 15 to 19 minutes (652 commuters, 19.3%) for females.
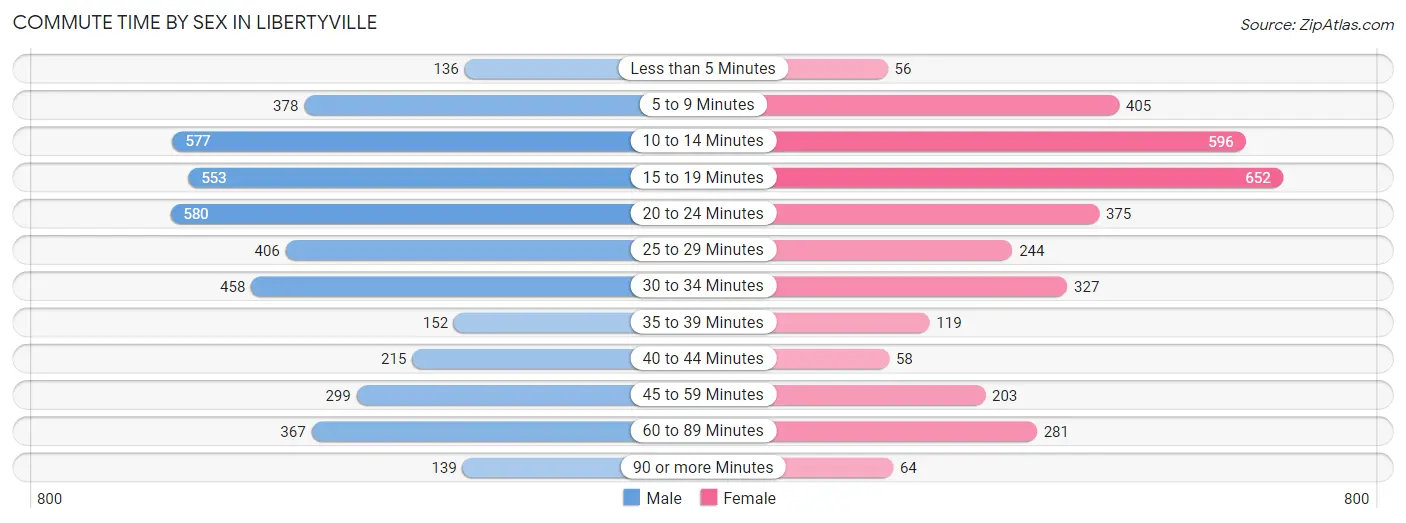
| Commute Time | Male | Female |
| Less than 5 Minutes | 136 (3.2%) | 56 (1.7%) |
| 5 to 9 Minutes | 378 (8.9%) | 405 (12.0%) |
| 10 to 14 Minutes | 577 (13.5%) | 596 (17.6%) |
| 15 to 19 Minutes | 553 (13.0%) | 652 (19.3%) |
| 20 to 24 Minutes | 580 (13.6%) | 375 (11.1%) |
| 25 to 29 Minutes | 406 (9.5%) | 244 (7.2%) |
| 30 to 34 Minutes | 458 (10.7%) | 327 (9.7%) |
| 35 to 39 Minutes | 152 (3.6%) | 119 (3.5%) |
| 40 to 44 Minutes | 215 (5.1%) | 58 (1.7%) |
| 45 to 59 Minutes | 299 (7.0%) | 203 (6.0%) |
| 60 to 89 Minutes | 367 (8.6%) | 281 (8.3%) |
| 90 or more Minutes | 139 (3.3%) | 64 (1.9%) |
Time of Departure to Work by Sex in Libertyville
The most frequent times of departure to work in Libertyville are 7:30 AM to 7:59 AM (706, 16.6%) for males and 7:30 AM to 7:59 AM (791, 23.4%) for females.
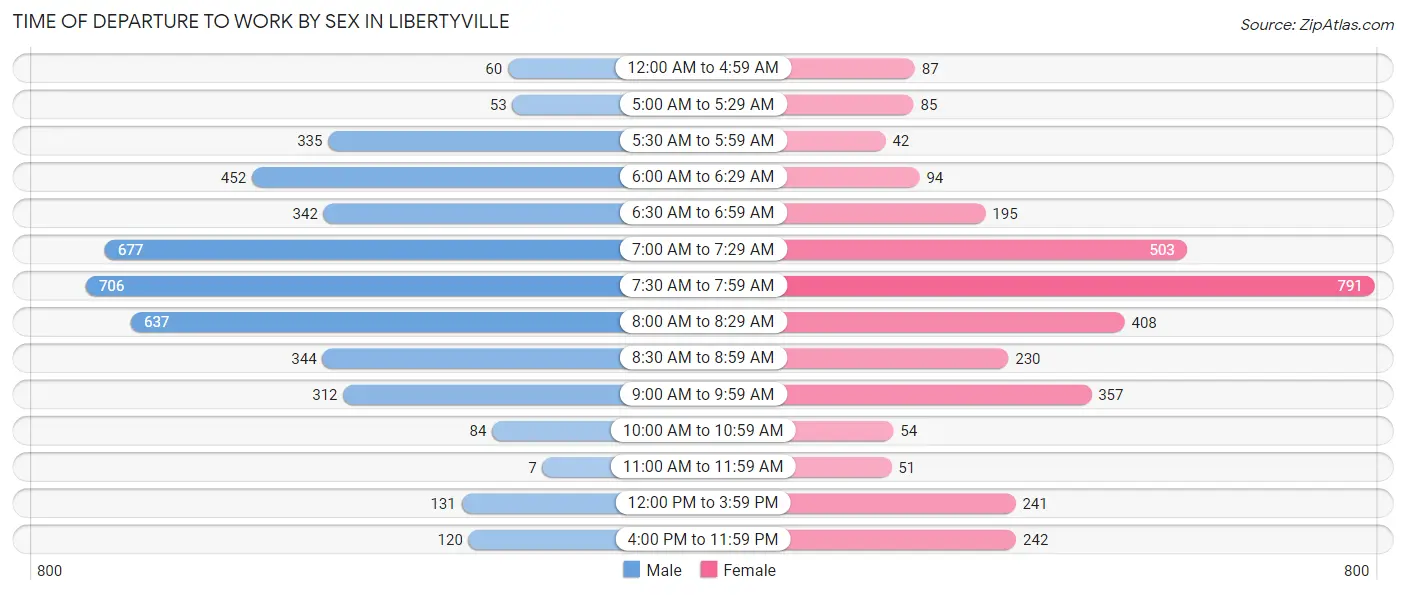
| Time of Departure | Male | Female |
| 12:00 AM to 4:59 AM | 60 (1.4%) | 87 (2.6%) |
| 5:00 AM to 5:29 AM | 53 (1.2%) | 85 (2.5%) |
| 5:30 AM to 5:59 AM | 335 (7.9%) | 42 (1.2%) |
| 6:00 AM to 6:29 AM | 452 (10.6%) | 94 (2.8%) |
| 6:30 AM to 6:59 AM | 342 (8.0%) | 195 (5.8%) |
| 7:00 AM to 7:29 AM | 677 (15.9%) | 503 (14.9%) |
| 7:30 AM to 7:59 AM | 706 (16.6%) | 791 (23.4%) |
| 8:00 AM to 8:29 AM | 637 (14.9%) | 408 (12.1%) |
| 8:30 AM to 8:59 AM | 344 (8.1%) | 230 (6.8%) |
| 9:00 AM to 9:59 AM | 312 (7.3%) | 357 (10.6%) |
| 10:00 AM to 10:59 AM | 84 (2.0%) | 54 (1.6%) |
| 11:00 AM to 11:59 AM | 7 (0.2%) | 51 (1.5%) |
| 12:00 PM to 3:59 PM | 131 (3.1%) | 241 (7.1%) |
| 4:00 PM to 11:59 PM | 120 (2.8%) | 242 (7.2%) |
| Total | 4,260 (100.0%) | 3,380 (100.0%) |
Housing Occupancy in Libertyville
Occupancy by Ownership in Libertyville
Of the total 7,608 dwellings in Libertyville, owner-occupied units account for 6,169 (81.1%), while renter-occupied units make up 1,439 (18.9%).
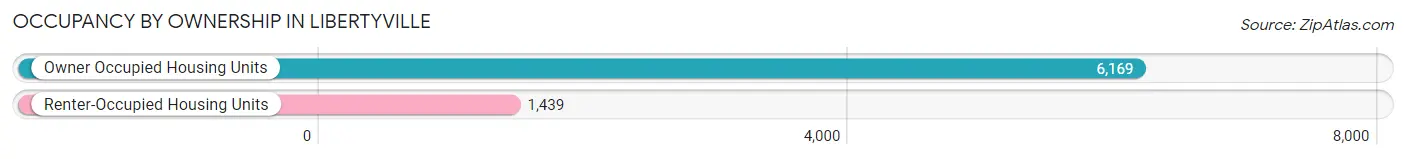
| Occupancy | # Housing Units | % Housing Units |
| Owner Occupied Housing Units | 6,169 | 81.1% |
| Renter-Occupied Housing Units | 1,439 | 18.9% |
| Total Occupied Housing Units | 7,608 | 100.0% |
Occupancy by Household Size in Libertyville
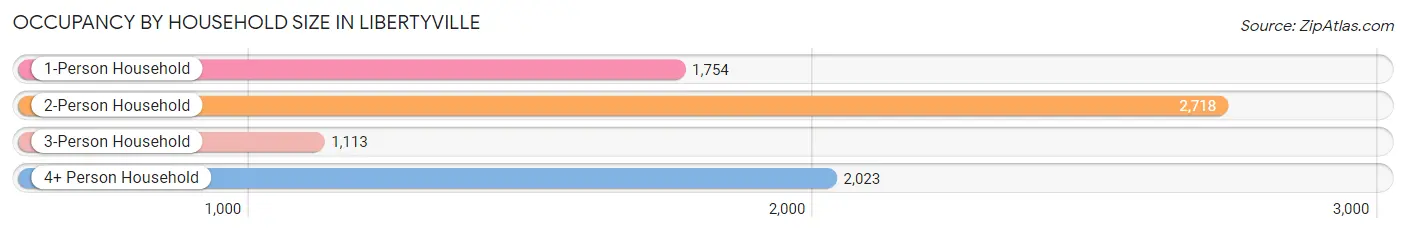
| Household Size | # Housing Units | % Housing Units |
| 1-Person Household | 1,754 | 23.1% |
| 2-Person Household | 2,718 | 35.7% |
| 3-Person Household | 1,113 | 14.6% |
| 4+ Person Household | 2,023 | 26.6% |
| Total Housing Units | 7,608 | 100.0% |
Occupancy by Ownership by Household Size in Libertyville
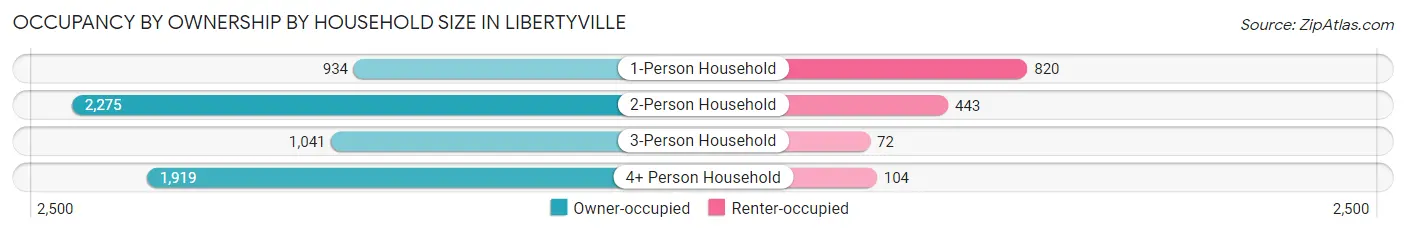
| Household Size | Owner-occupied | Renter-occupied |
| 1-Person Household | 934 (53.2%) | 820 (46.8%) |
| 2-Person Household | 2,275 (83.7%) | 443 (16.3%) |
| 3-Person Household | 1,041 (93.5%) | 72 (6.5%) |
| 4+ Person Household | 1,919 (94.9%) | 104 (5.1%) |
| Total Housing Units | 6,169 (81.1%) | 1,439 (18.9%) |
Occupancy by Educational Attainment in Libertyville
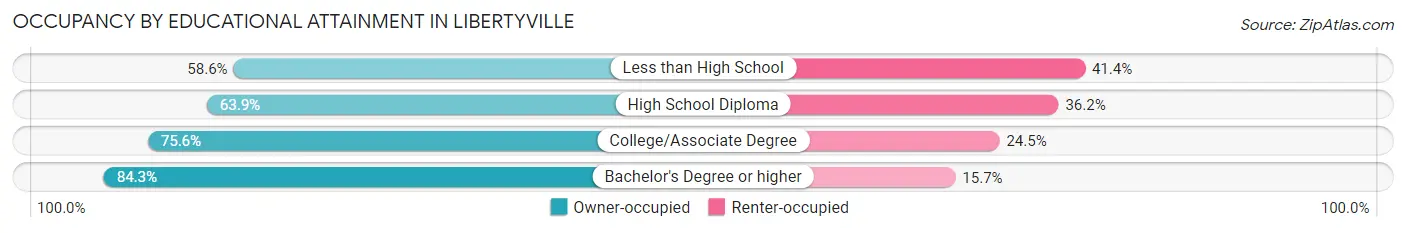
| Household Size | Owner-occupied | Renter-occupied |
| Less than High School | 92 (58.6%) | 65 (41.4%) |
| High School Diploma | 348 (63.8%) | 197 (36.1%) |
| College/Associate Degree | 794 (75.5%) | 257 (24.4%) |
| Bachelor's Degree or higher | 4,935 (84.3%) | 920 (15.7%) |
Occupancy by Age of Householder in Libertyville
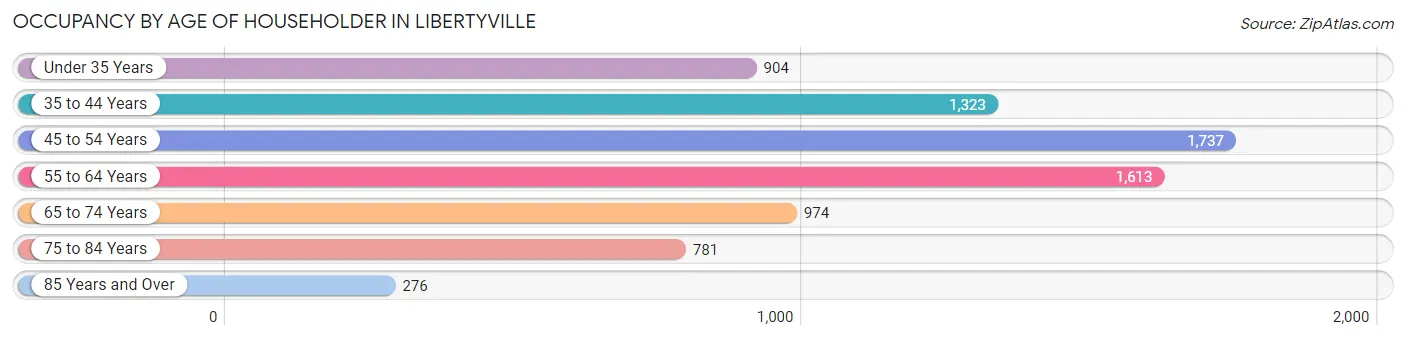
| Age Bracket | # Households | % Households |
| Under 35 Years | 904 | 11.9% |
| 35 to 44 Years | 1,323 | 17.4% |
| 45 to 54 Years | 1,737 | 22.8% |
| 55 to 64 Years | 1,613 | 21.2% |
| 65 to 74 Years | 974 | 12.8% |
| 75 to 84 Years | 781 | 10.3% |
| 85 Years and Over | 276 | 3.6% |
| Total | 7,608 | 100.0% |
Housing Finances in Libertyville
Median Income by Occupancy in Libertyville
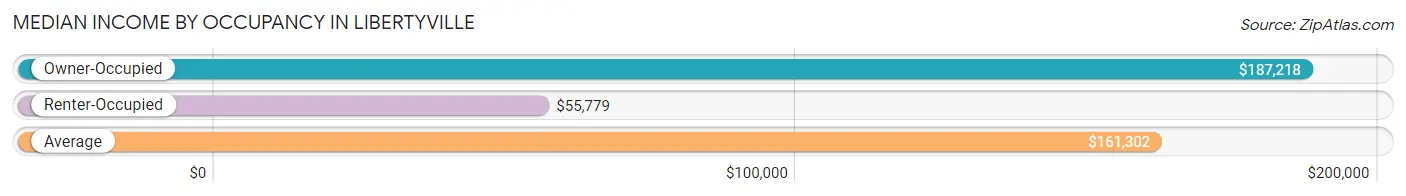
| Occupancy Type | # Households | Median Income |
| Owner-Occupied | 6,169 (81.1%) | $187,218 |
| Renter-Occupied | 1,439 (18.9%) | $55,779 |
| Average | 7,608 (100.0%) | $161,302 |
Occupancy by Householder Income Bracket in Libertyville
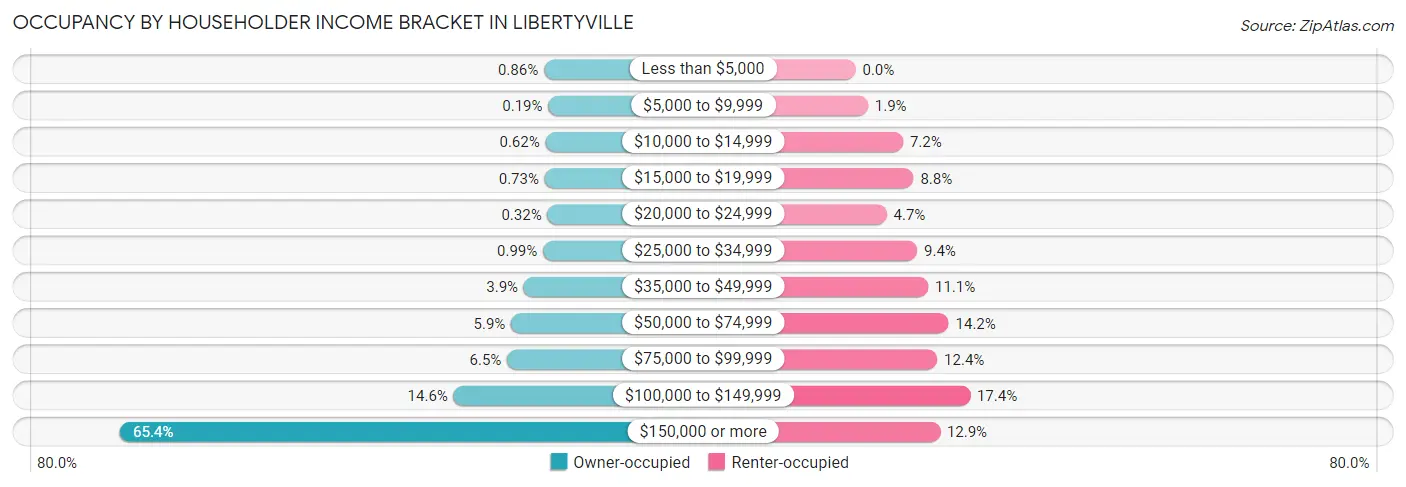
| Income Bracket | Owner-occupied | Renter-occupied |
| Less than $5,000 | 53 (0.9%) | 0 (0.0%) |
| $5,000 to $9,999 | 12 (0.2%) | 27 (1.9%) |
| $10,000 to $14,999 | 38 (0.6%) | 104 (7.2%) |
| $15,000 to $19,999 | 45 (0.7%) | 127 (8.8%) |
| $20,000 to $24,999 | 20 (0.3%) | 68 (4.7%) |
| $25,000 to $34,999 | 61 (1.0%) | 135 (9.4%) |
| $35,000 to $49,999 | 241 (3.9%) | 159 (11.1%) |
| $50,000 to $74,999 | 361 (5.9%) | 204 (14.2%) |
| $75,000 to $99,999 | 399 (6.5%) | 179 (12.4%) |
| $100,000 to $149,999 | 902 (14.6%) | 251 (17.4%) |
| $150,000 or more | 4,037 (65.4%) | 185 (12.9%) |
| Total | 6,169 (100.0%) | 1,439 (100.0%) |
Monthly Housing Cost Tiers in Libertyville
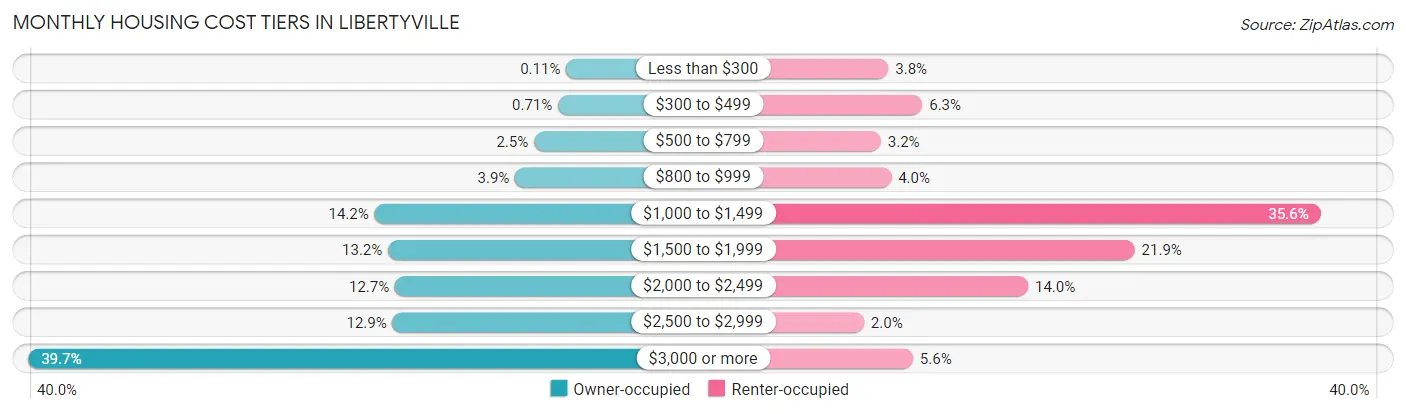
| Monthly Cost | Owner-occupied | Renter-occupied |
| Less than $300 | 7 (0.1%) | 54 (3.7%) |
| $300 to $499 | 44 (0.7%) | 90 (6.2%) |
| $500 to $799 | 153 (2.5%) | 46 (3.2%) |
| $800 to $999 | 239 (3.9%) | 57 (4.0%) |
| $1,000 to $1,499 | 878 (14.2%) | 512 (35.6%) |
| $1,500 to $1,999 | 816 (13.2%) | 315 (21.9%) |
| $2,000 to $2,499 | 785 (12.7%) | 202 (14.0%) |
| $2,500 to $2,999 | 796 (12.9%) | 28 (1.9%) |
| $3,000 or more | 2,451 (39.7%) | 80 (5.6%) |
| Total | 6,169 (100.0%) | 1,439 (100.0%) |
Physical Housing Characteristics in Libertyville
Housing Structures in Libertyville
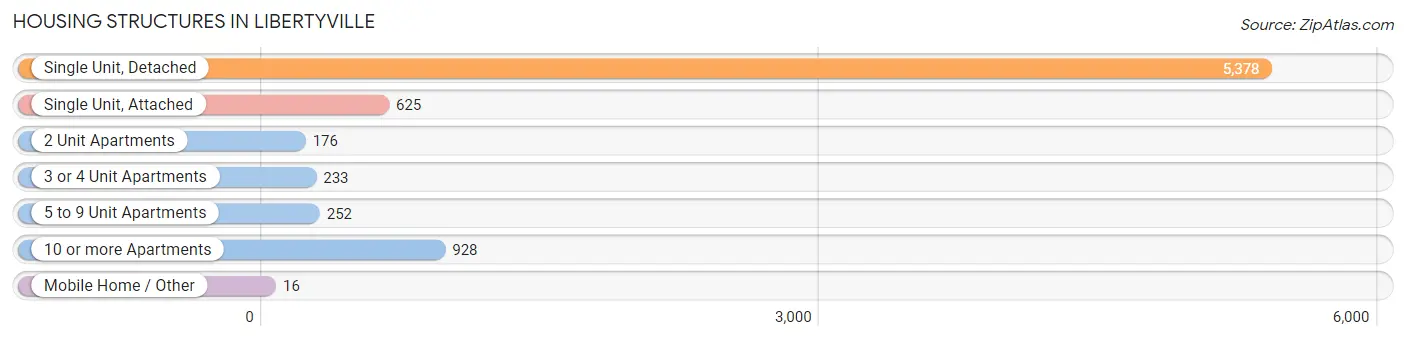
| Structure Type | # Housing Units | % Housing Units |
| Single Unit, Detached | 5,378 | 70.7% |
| Single Unit, Attached | 625 | 8.2% |
| 2 Unit Apartments | 176 | 2.3% |
| 3 or 4 Unit Apartments | 233 | 3.1% |
| 5 to 9 Unit Apartments | 252 | 3.3% |
| 10 or more Apartments | 928 | 12.2% |
| Mobile Home / Other | 16 | 0.2% |
| Total | 7,608 | 100.0% |
Housing Structures by Occupancy in Libertyville
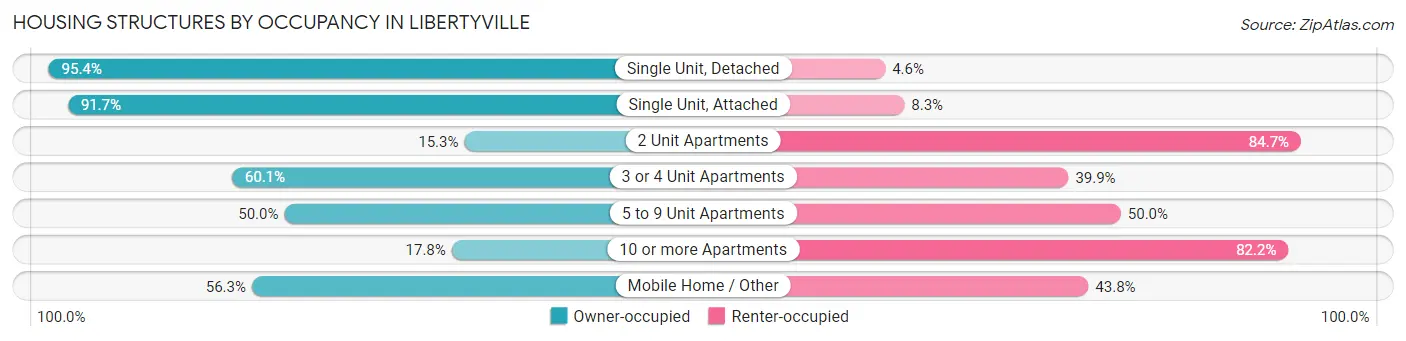
| Structure Type | Owner-occupied | Renter-occupied |
| Single Unit, Detached | 5,129 (95.4%) | 249 (4.6%) |
| Single Unit, Attached | 573 (91.7%) | 52 (8.3%) |
| 2 Unit Apartments | 27 (15.3%) | 149 (84.7%) |
| 3 or 4 Unit Apartments | 140 (60.1%) | 93 (39.9%) |
| 5 to 9 Unit Apartments | 126 (50.0%) | 126 (50.0%) |
| 10 or more Apartments | 165 (17.8%) | 763 (82.2%) |
| Mobile Home / Other | 9 (56.2%) | 7 (43.8%) |
| Total | 6,169 (81.1%) | 1,439 (18.9%) |
Housing Structures by Number of Rooms in Libertyville
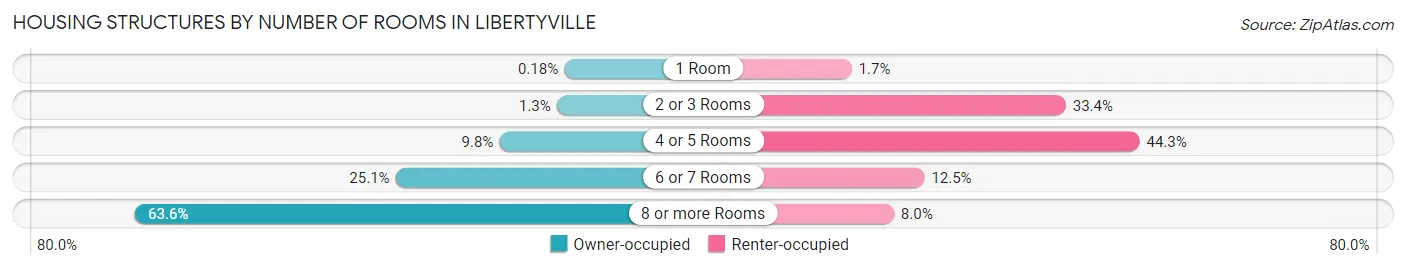
| Number of Rooms | Owner-occupied | Renter-occupied |
| 1 Room | 11 (0.2%) | 25 (1.7%) |
| 2 or 3 Rooms | 79 (1.3%) | 481 (33.4%) |
| 4 or 5 Rooms | 603 (9.8%) | 638 (44.3%) |
| 6 or 7 Rooms | 1,550 (25.1%) | 180 (12.5%) |
| 8 or more Rooms | 3,926 (63.6%) | 115 (8.0%) |
| Total | 6,169 (100.0%) | 1,439 (100.0%) |
Housing Structure by Heating Type in Libertyville
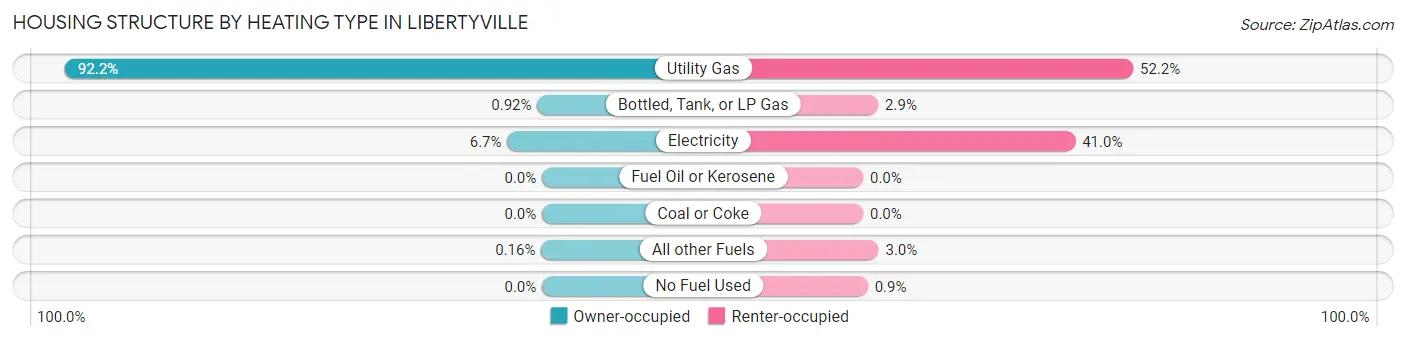
| Heating Type | Owner-occupied | Renter-occupied |
| Utility Gas | 5,688 (92.2%) | 751 (52.2%) |
| Bottled, Tank, or LP Gas | 57 (0.9%) | 42 (2.9%) |
| Electricity | 414 (6.7%) | 590 (41.0%) |
| Fuel Oil or Kerosene | 0 (0.0%) | 0 (0.0%) |
| Coal or Coke | 0 (0.0%) | 0 (0.0%) |
| All other Fuels | 10 (0.2%) | 43 (3.0%) |
| No Fuel Used | 0 (0.0%) | 13 (0.9%) |
| Total | 6,169 (100.0%) | 1,439 (100.0%) |
Household Vehicle Usage in Libertyville
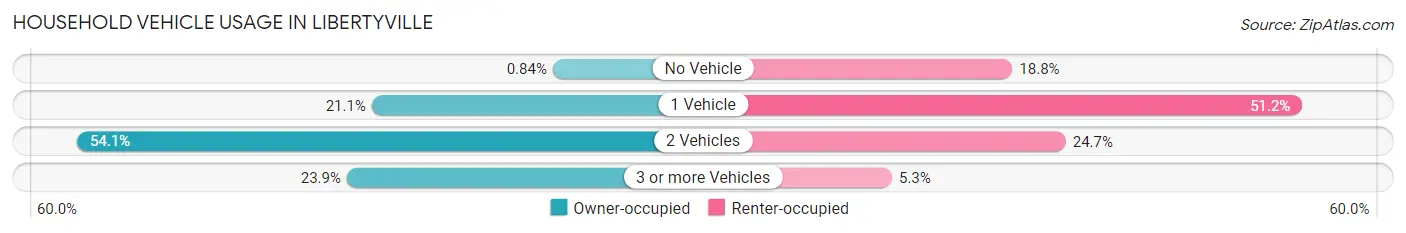
| Vehicles per Household | Owner-occupied | Renter-occupied |
| No Vehicle | 52 (0.8%) | 270 (18.8%) |
| 1 Vehicle | 1,303 (21.1%) | 737 (51.2%) |
| 2 Vehicles | 3,339 (54.1%) | 356 (24.7%) |
| 3 or more Vehicles | 1,475 (23.9%) | 76 (5.3%) |
| Total | 6,169 (100.0%) | 1,439 (100.0%) |
Real Estate & Mortgages in Libertyville
Real Estate and Mortgage Overview in Libertyville
| Characteristic | Without Mortgage | With Mortgage |
| Housing Units | 1,904 | 4,265 |
| Median Property Value | $467,400 | $497,800 |
| Median Household Income | $142,500 | $3,143 |
| Monthly Housing Costs | $1,380 | $2,409 |
| Real Estate Taxes | $10,001 | $7 |
Property Value by Mortgage Status in Libertyville
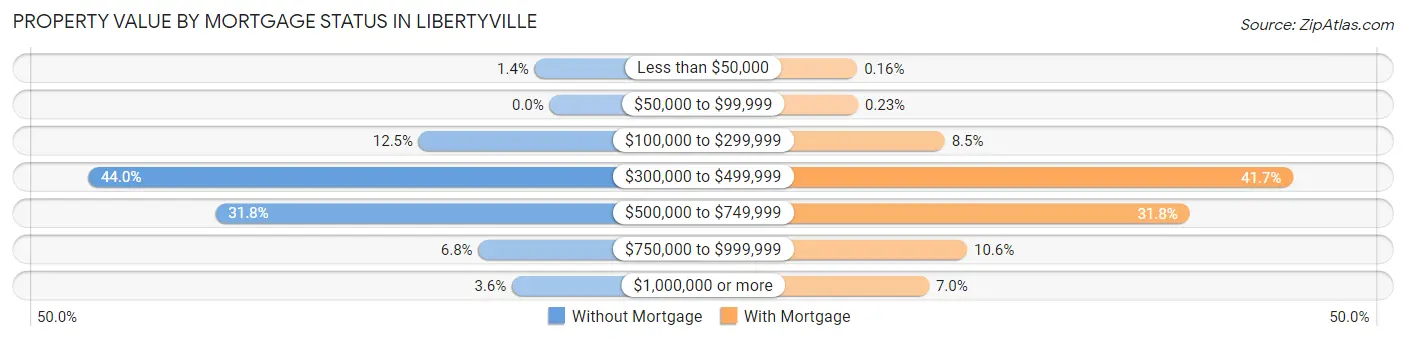
| Property Value | Without Mortgage | With Mortgage |
| Less than $50,000 | 27 (1.4%) | 7 (0.2%) |
| $50,000 to $99,999 | 0 (0.0%) | 10 (0.2%) |
| $100,000 to $299,999 | 237 (12.4%) | 362 (8.5%) |
| $300,000 to $499,999 | 837 (44.0%) | 1,778 (41.7%) |
| $500,000 to $749,999 | 606 (31.8%) | 1,357 (31.8%) |
| $750,000 to $999,999 | 129 (6.8%) | 453 (10.6%) |
| $1,000,000 or more | 68 (3.6%) | 298 (7.0%) |
| Total | 1,904 (100.0%) | 4,265 (100.0%) |
Household Income by Mortgage Status in Libertyville
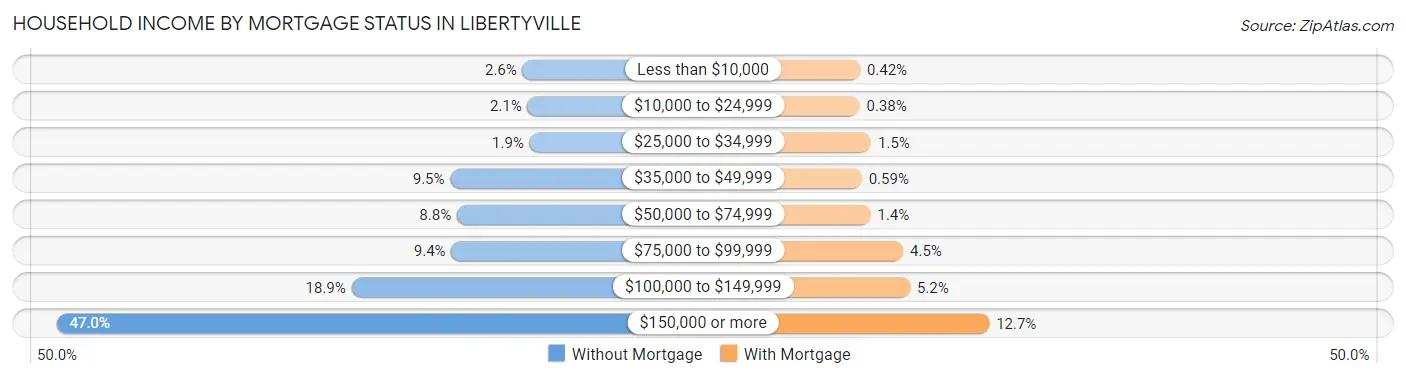
| Household Income | Without Mortgage | With Mortgage |
| Less than $10,000 | 49 (2.6%) | 18 (0.4%) |
| $10,000 to $24,999 | 40 (2.1%) | 16 (0.4%) |
| $25,000 to $34,999 | 36 (1.9%) | 63 (1.5%) |
| $35,000 to $49,999 | 180 (9.5%) | 25 (0.6%) |
| $50,000 to $74,999 | 168 (8.8%) | 61 (1.4%) |
| $75,000 to $99,999 | 178 (9.3%) | 193 (4.5%) |
| $100,000 to $149,999 | 359 (18.9%) | 221 (5.2%) |
| $150,000 or more | 894 (46.9%) | 543 (12.7%) |
| Total | 1,904 (100.0%) | 4,265 (100.0%) |
Property Value to Household Income Ratio in Libertyville
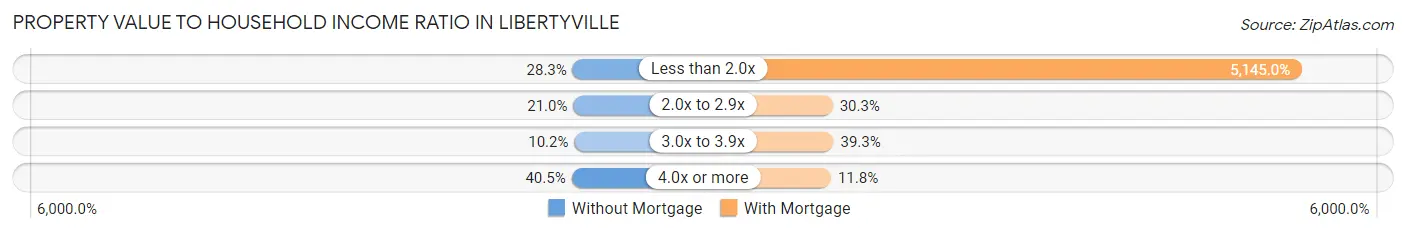
| Value-to-Income Ratio | Without Mortgage | With Mortgage |
| Less than 2.0x | 539 (28.3%) | 219,436 (5,145.0%) |
| 2.0x to 2.9x | 400 (21.0%) | 1,294 (30.3%) |
| 3.0x to 3.9x | 194 (10.2%) | 1,677 (39.3%) |
| 4.0x or more | 771 (40.5%) | 505 (11.8%) |
| Total | 1,904 (100.0%) | 4,265 (100.0%) |
Real Estate Taxes by Mortgage Status in Libertyville

| Property Taxes | Without Mortgage | With Mortgage |
| Less than $800 | 18 (0.9%) | 0 (0.0%) |
| $800 to $1,499 | 21 (1.1%) | 8 (0.2%) |
| $800 to $1,499 | 1,843 (96.8%) | 12 (0.3%) |
| Total | 1,904 (100.0%) | 4,265 (100.0%) |
Health & Disability in Libertyville
Health Insurance Coverage by Age in Libertyville
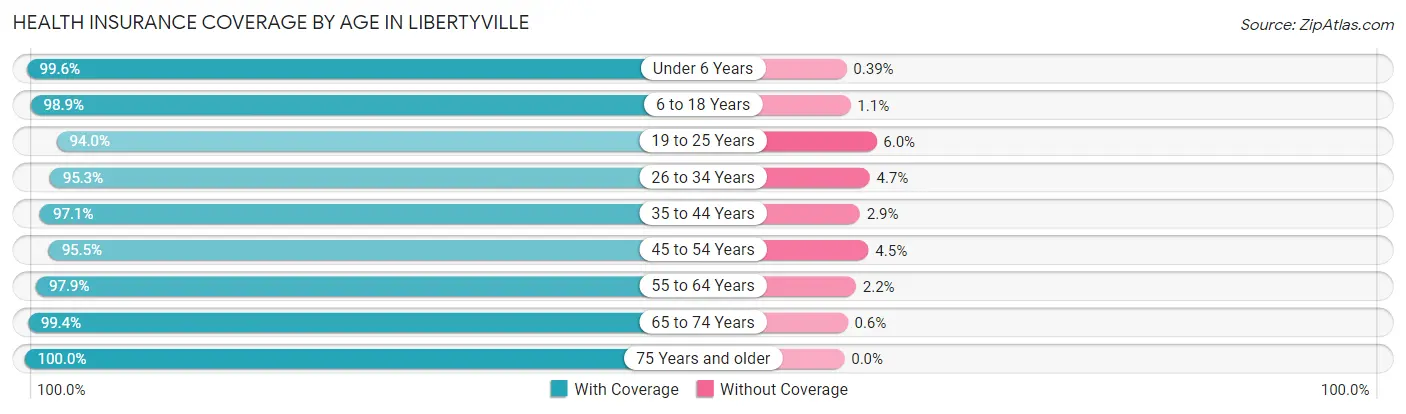
| Age Bracket | With Coverage | Without Coverage |
| Under 6 Years | 1,262 (99.6%) | 5 (0.4%) |
| 6 to 18 Years | 4,319 (98.9%) | 50 (1.1%) |
| 19 to 25 Years | 975 (94.0%) | 62 (6.0%) |
| 26 to 34 Years | 1,599 (95.3%) | 79 (4.7%) |
| 35 to 44 Years | 2,417 (97.1%) | 72 (2.9%) |
| 45 to 54 Years | 3,121 (95.5%) | 147 (4.5%) |
| 55 to 64 Years | 2,779 (97.9%) | 61 (2.1%) |
| 65 to 74 Years | 1,834 (99.4%) | 11 (0.6%) |
| 75 Years and older | 1,452 (100.0%) | 0 (0.0%) |
| Total | 19,758 (97.6%) | 487 (2.4%) |
Health Insurance Coverage by Citizenship Status in Libertyville

| Citizenship Status | With Coverage | Without Coverage |
| Native Born | 1,262 (99.6%) | 5 (0.4%) |
| Foreign Born, Citizen | 4,319 (98.9%) | 50 (1.1%) |
| Foreign Born, not a Citizen | 975 (94.0%) | 62 (6.0%) |
Health Insurance Coverage by Household Income in Libertyville
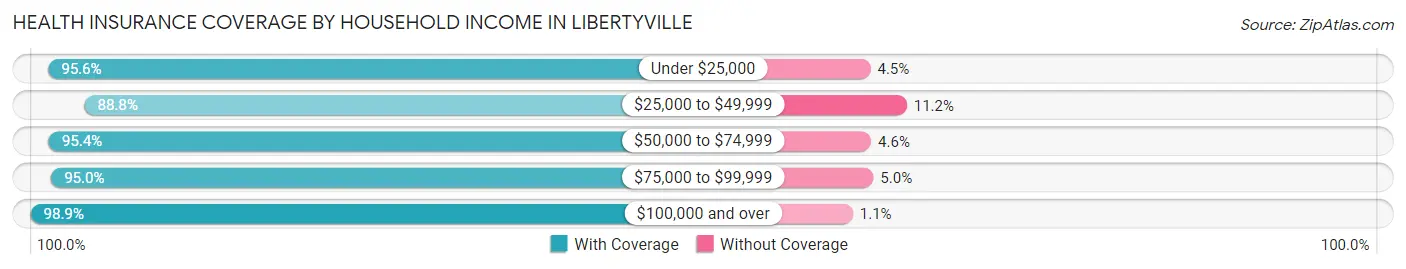
| Household Income | With Coverage | Without Coverage |
| Under $25,000 | 666 (95.6%) | 31 (4.4%) |
| $25,000 to $49,999 | 916 (88.8%) | 116 (11.2%) |
| $50,000 to $74,999 | 1,025 (95.4%) | 49 (4.6%) |
| $75,000 to $99,999 | 1,427 (95.0%) | 75 (5.0%) |
| $100,000 and over | 15,563 (98.9%) | 178 (1.1%) |
Public vs Private Health Insurance Coverage by Age in Libertyville
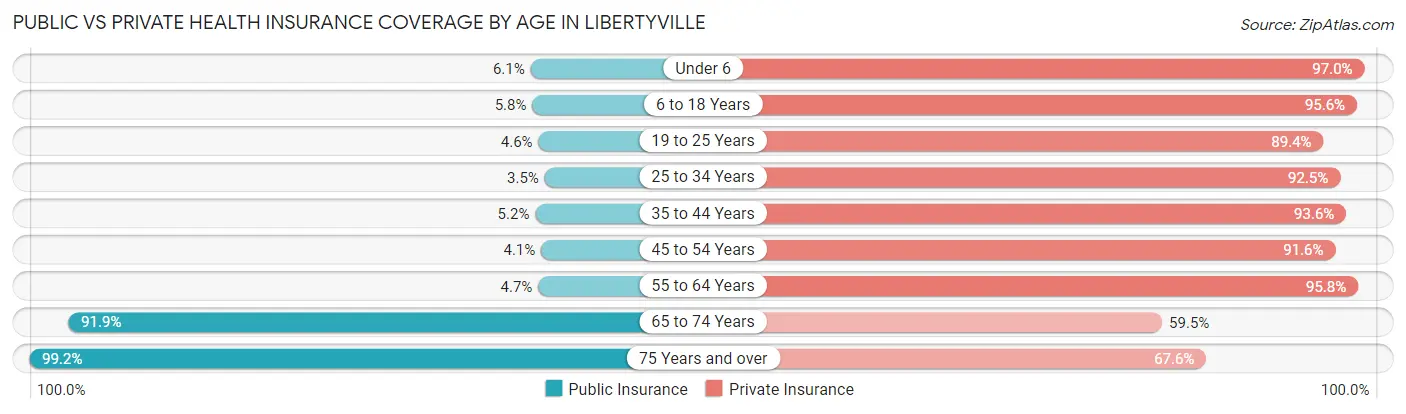
| Age Bracket | Public Insurance | Private Insurance |
| Under 6 | 77 (6.1%) | 1,229 (97.0%) |
| 6 to 18 Years | 252 (5.8%) | 4,177 (95.6%) |
| 19 to 25 Years | 48 (4.6%) | 927 (89.4%) |
| 25 to 34 Years | 58 (3.5%) | 1,552 (92.5%) |
| 35 to 44 Years | 130 (5.2%) | 2,330 (93.6%) |
| 45 to 54 Years | 135 (4.1%) | 2,993 (91.6%) |
| 55 to 64 Years | 133 (4.7%) | 2,721 (95.8%) |
| 65 to 74 Years | 1,696 (91.9%) | 1,097 (59.5%) |
| 75 Years and over | 1,440 (99.2%) | 982 (67.6%) |
| Total | 3,969 (19.6%) | 18,008 (88.9%) |
Disability Status by Sex by Age in Libertyville
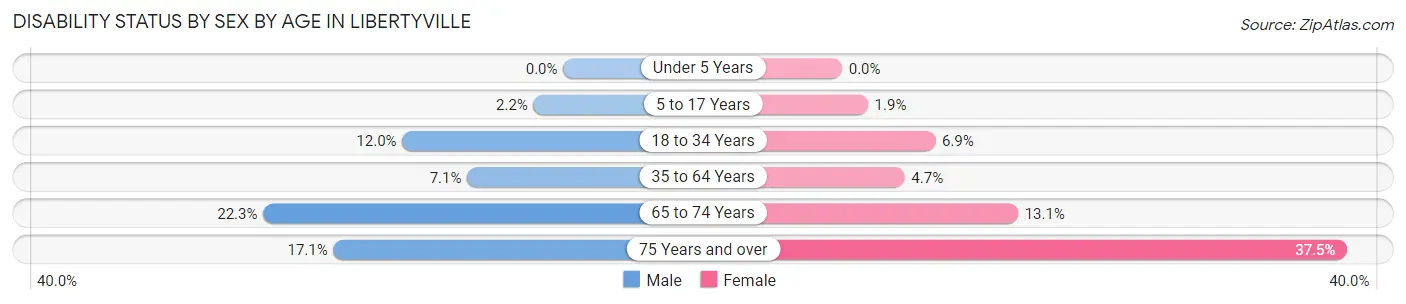
| Age Bracket | Male | Female |
| Under 5 Years | 0 (0.0%) | 0 (0.0%) |
| 5 to 17 Years | 41 (2.2%) | 44 (1.9%) |
| 18 to 34 Years | 199 (11.9%) | 98 (6.9%) |
| 35 to 64 Years | 302 (7.1%) | 203 (4.6%) |
| 65 to 74 Years | 162 (22.3%) | 146 (13.1%) |
| 75 Years and over | 115 (17.1%) | 292 (37.5%) |
Disability Class by Sex by Age in Libertyville
Disability Class: Hearing Difficulty
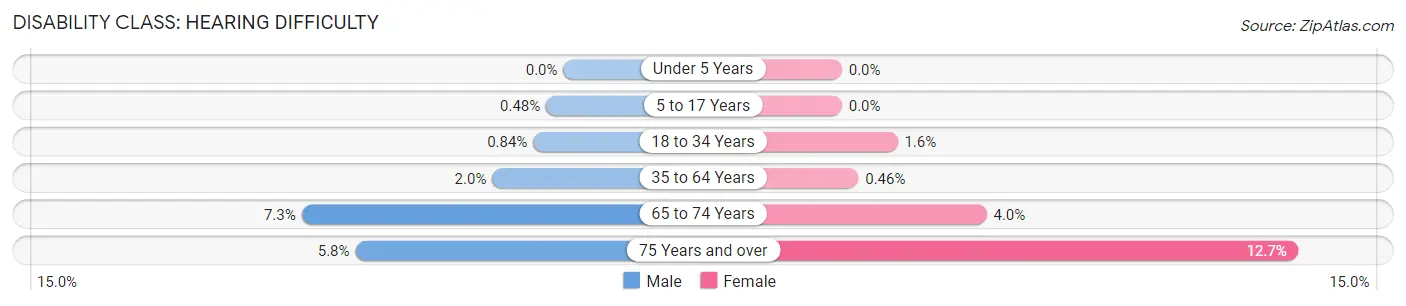
| Age Bracket | Male | Female |
| Under 5 Years | 0 (0.0%) | 0 (0.0%) |
| 5 to 17 Years | 9 (0.5%) | 0 (0.0%) |
| 18 to 34 Years | 14 (0.8%) | 22 (1.5%) |
| 35 to 64 Years | 84 (2.0%) | 20 (0.5%) |
| 65 to 74 Years | 53 (7.3%) | 45 (4.0%) |
| 75 Years and over | 39 (5.8%) | 99 (12.7%) |
Disability Class: Vision Difficulty
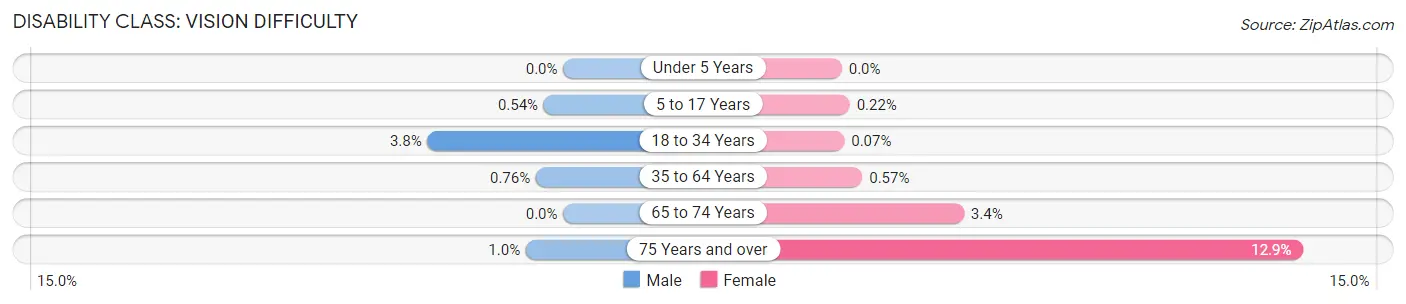
| Age Bracket | Male | Female |
| Under 5 Years | 0 (0.0%) | 0 (0.0%) |
| 5 to 17 Years | 10 (0.5%) | 5 (0.2%) |
| 18 to 34 Years | 63 (3.8%) | 1 (0.1%) |
| 35 to 64 Years | 32 (0.8%) | 25 (0.6%) |
| 65 to 74 Years | 0 (0.0%) | 38 (3.4%) |
| 75 Years and over | 7 (1.0%) | 100 (12.9%) |
Disability Class: Cognitive Difficulty
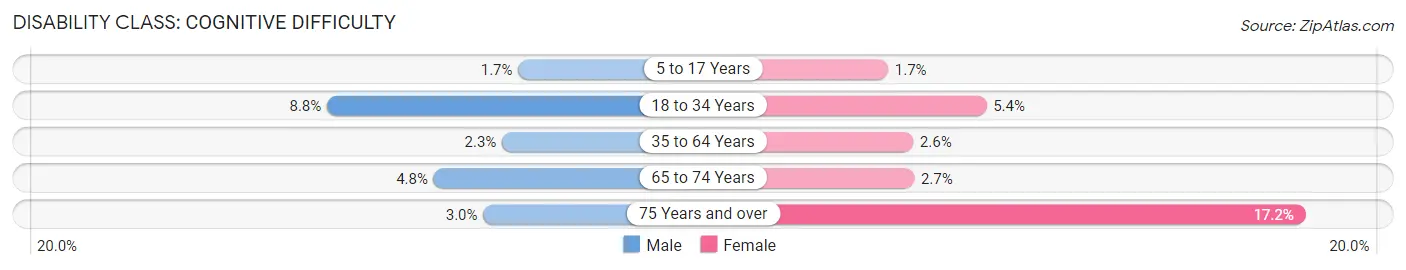
| Age Bracket | Male | Female |
| 5 to 17 Years | 31 (1.7%) | 39 (1.7%) |
| 18 to 34 Years | 146 (8.8%) | 76 (5.4%) |
| 35 to 64 Years | 96 (2.3%) | 115 (2.6%) |
| 65 to 74 Years | 35 (4.8%) | 30 (2.7%) |
| 75 Years and over | 20 (3.0%) | 134 (17.2%) |
Disability Class: Ambulatory Difficulty
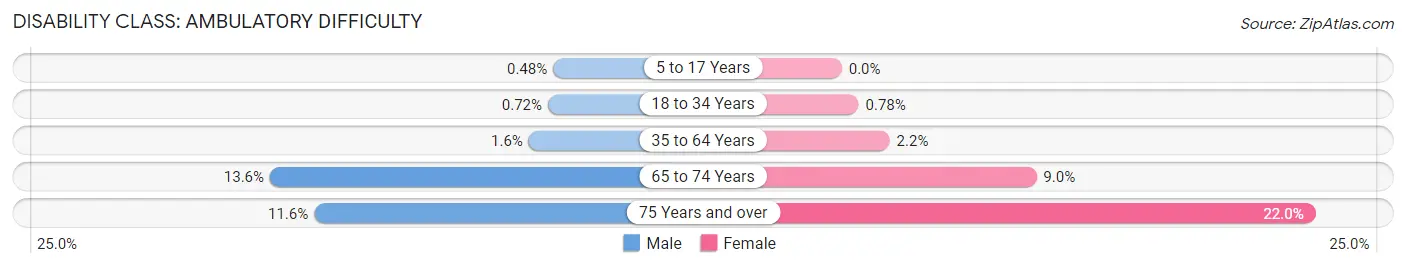
| Age Bracket | Male | Female |
| 5 to 17 Years | 9 (0.5%) | 0 (0.0%) |
| 18 to 34 Years | 12 (0.7%) | 11 (0.8%) |
| 35 to 64 Years | 68 (1.6%) | 97 (2.2%) |
| 65 to 74 Years | 99 (13.6%) | 101 (9.0%) |
| 75 Years and over | 78 (11.6%) | 171 (22.0%) |
Disability Class: Self-Care Difficulty
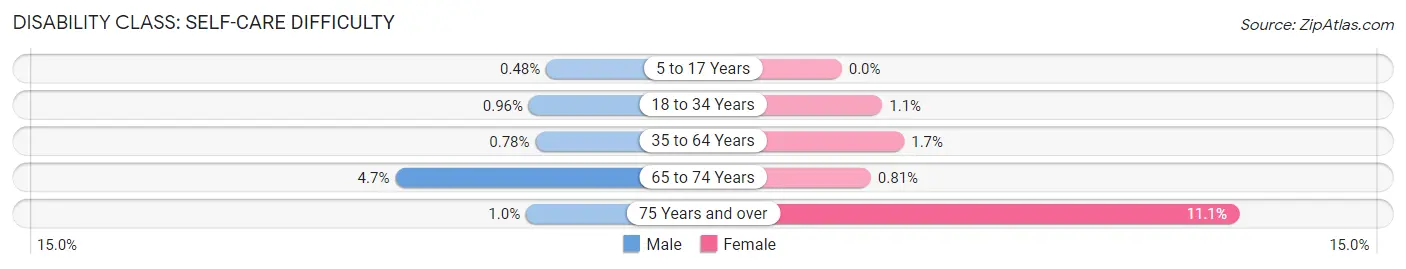
| Age Bracket | Male | Female |
| 5 to 17 Years | 9 (0.5%) | 0 (0.0%) |
| 18 to 34 Years | 16 (1.0%) | 16 (1.1%) |
| 35 to 64 Years | 33 (0.8%) | 76 (1.7%) |
| 65 to 74 Years | 34 (4.7%) | 9 (0.8%) |
| 75 Years and over | 7 (1.0%) | 86 (11.1%) |
Technology Access in Libertyville
Computing Device Access in Libertyville
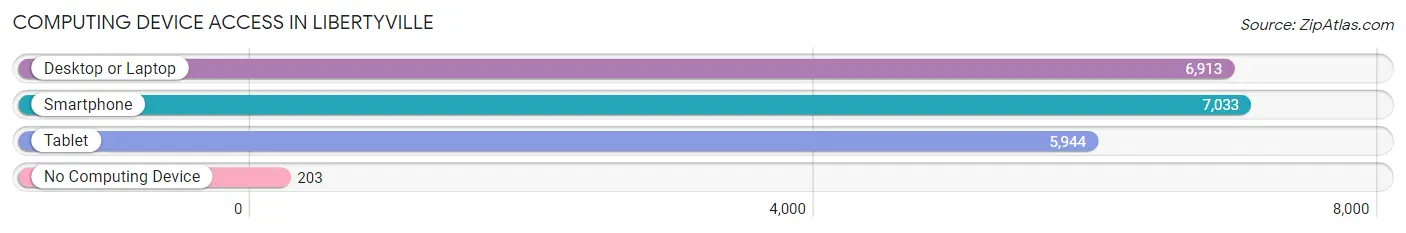
| Device Type | # Households | % Households |
| Desktop or Laptop | 6,913 | 90.9% |
| Smartphone | 7,033 | 92.4% |
| Tablet | 5,944 | 78.1% |
| No Computing Device | 203 | 2.7% |
| Total | 7,608 | 100.0% |
Internet Access in Libertyville
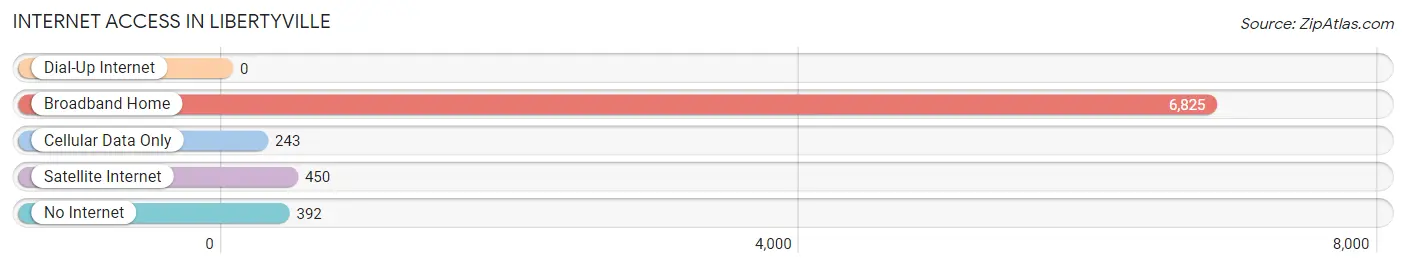
| Internet Type | # Households | % Households |
| Dial-Up Internet | 0 | 0.0% |
| Broadband Home | 6,825 | 89.7% |
| Cellular Data Only | 243 | 3.2% |
| Satellite Internet | 450 | 5.9% |
| No Internet | 392 | 5.1% |
| Total | 7,608 | 100.0% |
Libertyville Summary
Libertyville is a village in Lake County, Illinois, United States. It is located about 30 miles north of Chicago and is part of the Chicago metropolitan area. The population was 20,315 at the 2010 census.
History
The area now known as Libertyville was first settled in the 1830s by European immigrants. The first settler was George Vardin, who arrived in 1834 and built a log cabin near what is now known as the intersection of Milwaukee Avenue and Church Street. The area was originally known as Vardin’s Grove.
In 1836, the first post office was established in the area and the village was officially named Libertyville. The name was chosen to honor the American Revolution and the fight for freedom.
In 1837, the first school was built in Libertyville. The school was a one-room log cabin and was located on the corner of Milwaukee Avenue and Church Street.
In 1845, the first church was built in Libertyville. The church was a Methodist Episcopal Church and was located on the corner of Milwaukee Avenue and Church Street.
In 1848, the first newspaper was established in Libertyville. The newspaper was called the Libertyville Gazette and was published weekly.
In 1849, the first bank was established in Libertyville. The bank was called the Libertyville Bank and was located on the corner of Milwaukee Avenue and Church Street.
In 1851, the first railroad was built in Libertyville. The railroad was called the Chicago and Milwaukee Railroad and ran from Chicago to Milwaukee.
In 1855, the first library was established in Libertyville. The library was called the Libertyville Library and was located on the corner of Milwaukee Avenue and Church Street.
In 1871, the first fire department was established in Libertyville. The fire department was called the Libertyville Fire Department and was located on the corner of Milwaukee Avenue and Church Street.
In 1872, the first hospital was established in Libertyville. The hospital was called the Libertyville Hospital and was located on the corner of Milwaukee Avenue and Church Street.
In 1873, the first telephone was installed in Libertyville. The telephone was installed in the Libertyville Bank and was used to communicate with other businesses in the area.
In 1875, the first electric lights were installed in Libertyville. The electric lights were installed in the Libertyville Bank and were used to light the streets of Libertyville.
In 1876, the first public park was established in Libertyville. The park was called the Libertyville Park and was located on the corner of Milwaukee Avenue and Church Street.
In 1877, the first public library was established in Libertyville. The library was called the Libertyville Public Library and was located on the corner of Milwaukee Avenue and Church Street.
In 1878, the first public school was established in Libertyville. The school was called the Libertyville High School and was located on the corner of Milwaukee Avenue and Church Street.
In 1879, the first public water system was established in Libertyville. The water system was called the Libertyville Water Works and was located on the corner of Milwaukee Avenue and Church Street.
Geography
Libertyville is located in Lake County, Illinois, about 30 miles north of Chicago. The village is situated on the Des Plaines River and is bordered by the villages of Mundelein to the north, Vernon Hills to the east, Green Oaks to the south, and Gurnee to the west.
The village has a total area of 8.3 square miles, of which 8.2 square miles is land and 0.1 square miles is water.
Economy
The economy of Libertyville is largely based on the service industry. The village is home to a variety of businesses, including restaurants, retail stores, banks, and professional services.
The village is also home to several large employers, including Abbott Laboratories, Baxter International, and W.W. Grainger.
Demographics
As of the 2010 census, the population of Libertyville was 20,315. The racial makeup of the village was 87.3% White, 4.2% Asian, 3.2% African American, 0.3% Native American, 0.1% Pacific Islander, and 4.9% from other races.
The median household income in Libertyville was $90,945 in 2017. The median age of residents was 42.7 years.
Conclusion
Libertyville is a village in Lake County, Illinois, located about 30 miles north of Chicago. The village has a rich history, dating back to the 1830s when it was first settled by European immigrants. The village has a strong economy based on the service industry, and its population is diverse and growing. Libertyville is a great place to live, work, and play.
Common Questions
What is Per Capita Income in Libertyville?
Per Capita income in Libertyville is $81,231.
What is the Median Family Income in Libertyville?
Median Family Income in Libertyville is $203,078.
What is the Median Household income in Libertyville?
Median Household Income in Libertyville is $161,302.
What is Income or Wage Gap in Libertyville?
Income or Wage Gap in Libertyville is 47.6%.
Women in Libertyville earn 52.4 cents for every dollar earned by a man.
What is Inequality or Gini Index in Libertyville?
Inequality or Gini Index in Libertyville is 0.45.
What is the Total Population of Libertyville?
Total Population of Libertyville is 20,555.
What is the Total Male Population of Libertyville?
Total Male Population of Libertyville is 9,692.
What is the Total Female Population of Libertyville?
Total Female Population of Libertyville is 10,863.
What is the Ratio of Males per 100 Females in Libertyville?
There are 89.22 Males per 100 Females in Libertyville.
What is the Ratio of Females per 100 Males in Libertyville?
There are 112.08 Females per 100 Males in Libertyville.
What is the Median Population Age in Libertyville?
Median Population Age in Libertyville is 42.4 Years.
What is the Average Family Size in Libertyville
Average Family Size in Libertyville is 3.2 People.
What is the Average Household Size in Libertyville
Average Household Size in Libertyville is 2.6 People.
How Large is the Labor Force in Libertyville?
There are 10,332 People in the Labor Forcein in Libertyville.
What is the Percentage of People in the Labor Force in Libertyville?
64.7% of People are in the Labor Force in Libertyville.
What is the Unemployment Rate in Libertyville?
Unemployment Rate in Libertyville is 3.2%.