Oak Brook, IL Map & Demographics
Oak Brook Map
Oak Brook Overview
$90,630
PER CAPITA INCOME
$178,977
AVG FAMILY INCOME
$158,663
AVG HOUSEHOLD INCOME
52.6%
WAGE / INCOME GAP [ % ]
47.4¢/ $1
WAGE / INCOME GAP [ $ ]
0.53
INEQUALITY / GINI INDEX
8,065
TOTAL POPULATION
3,749
MALE POPULATION
4,316
FEMALE POPULATION
86.86
MALES / 100 FEMALES
115.12
FEMALES / 100 MALES
52.5
MEDIAN AGE
3.2
AVG FAMILY SIZE
2.7
AVG HOUSEHOLD SIZE
3,132
LABOR FORCE [ PEOPLE ]
48.0%
PERCENT IN LABOR FORCE
10.4%
UNEMPLOYMENT RATE
Oak Brook Zip Codes
Income in Oak Brook
Income Overview in Oak Brook
Per Capita Income in Oak Brook is $90,630, while median incomes of families and households are $178,977 and $158,663 respectively.
| Characteristic | Number | Measure |
| Per Capita Income | 8,065 | $90,630 |
| Median Family Income | 2,277 | $178,977 |
| Mean Family Income | 2,277 | $276,196 |
| Median Household Income | 2,983 | $158,663 |
| Mean Household Income | 2,983 | $239,666 |
| Income Deficit | 2,277 | $0 |
| Wage / Income Gap (%) | 8,065 | 52.56% |
| Wage / Income Gap ($) | 8,065 | 47.44¢ per $1 |
| Gini / Inequality Index | 8,065 | 0.53 |
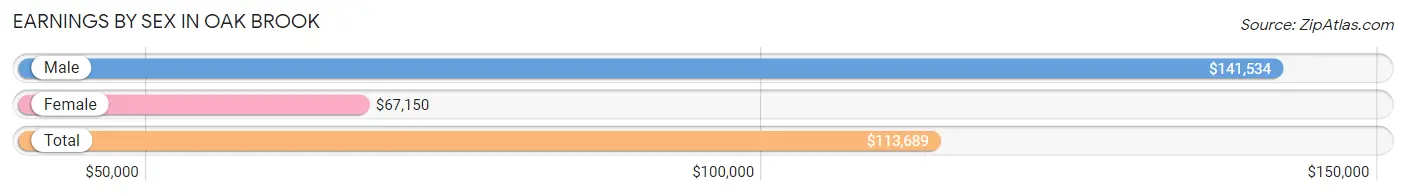
Earnings by Sex in Oak Brook
Average Earnings in Oak Brook are $113,689, $141,534 for men and $67,150 for women, a difference of 52.6%.
| Sex | Number | Average Earnings |
| Male | 1,750 (56.5%) | $141,534 |
| Female | 1,347 (43.5%) | $67,150 |
| Total | 3,097 (100.0%) | $113,689 |
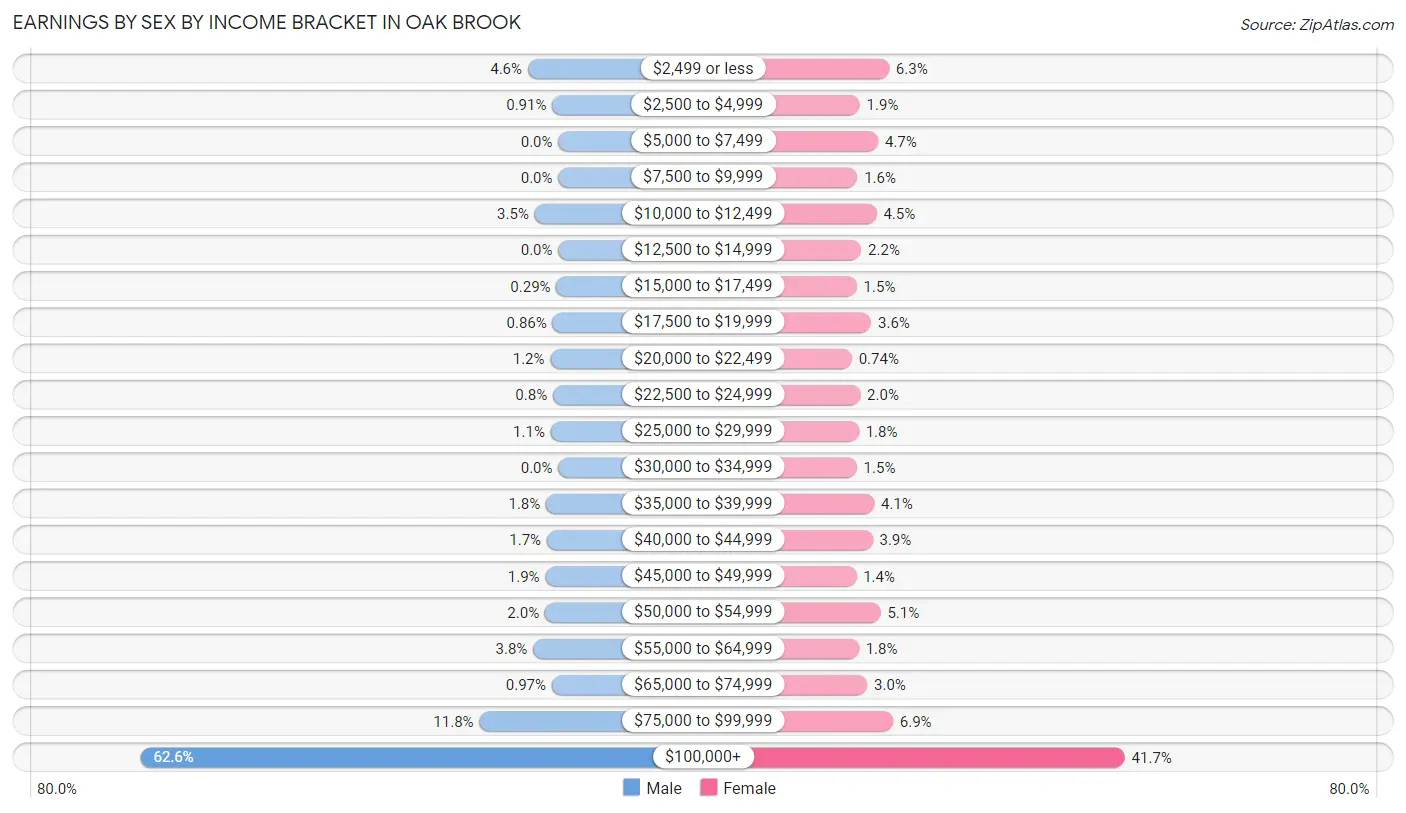
Earnings by Sex by Income Bracket in Oak Brook
The most common earnings brackets in Oak Brook are $100,000+ for men (1,096 | 62.6%) and $100,000+ for women (561 | 41.6%).
| Income | Male | Female |
| $2,499 or less | 80 (4.6%) | 85 (6.3%) |
| $2,500 to $4,999 | 16 (0.9%) | 26 (1.9%) |
| $5,000 to $7,499 | 0 (0.0%) | 63 (4.7%) |
| $7,500 to $9,999 | 0 (0.0%) | 21 (1.6%) |
| $10,000 to $12,499 | 62 (3.5%) | 60 (4.4%) |
| $12,500 to $14,999 | 0 (0.0%) | 29 (2.1%) |
| $15,000 to $17,499 | 5 (0.3%) | 20 (1.5%) |
| $17,500 to $19,999 | 15 (0.9%) | 49 (3.6%) |
| $20,000 to $22,499 | 21 (1.2%) | 10 (0.7%) |
| $22,500 to $24,999 | 14 (0.8%) | 27 (2.0%) |
| $25,000 to $29,999 | 20 (1.1%) | 24 (1.8%) |
| $30,000 to $34,999 | 0 (0.0%) | 20 (1.5%) |
| $35,000 to $39,999 | 32 (1.8%) | 55 (4.1%) |
| $40,000 to $44,999 | 30 (1.7%) | 52 (3.9%) |
| $45,000 to $49,999 | 34 (1.9%) | 19 (1.4%) |
| $50,000 to $54,999 | 35 (2.0%) | 68 (5.1%) |
| $55,000 to $64,999 | 66 (3.8%) | 24 (1.8%) |
| $65,000 to $74,999 | 17 (1.0%) | 41 (3.0%) |
| $75,000 to $99,999 | 207 (11.8%) | 93 (6.9%) |
| $100,000+ | 1,096 (62.6%) | 561 (41.6%) |
| Total | 1,750 (100.0%) | 1,347 (100.0%) |
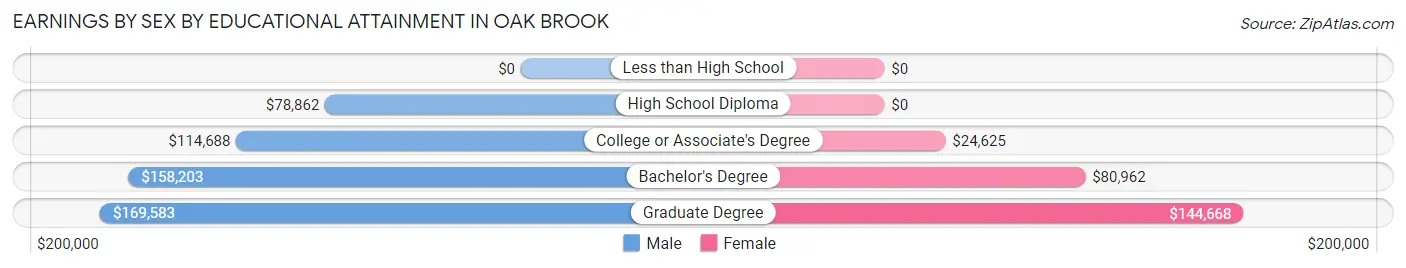
Earnings by Sex by Educational Attainment in Oak Brook
Average earnings in Oak Brook are $147,344 for men and $85,085 for women, a difference of 42.2%. Men with an educational attainment of graduate degree enjoy the highest average annual earnings of $169,583, while those with high school diploma education earn the least with $78,862. Women with an educational attainment of graduate degree earn the most with the average annual earnings of $144,668, while those with college or associate's degree education have the smallest earnings of $24,625.
| Educational Attainment | Male Income | Female Income |
| Less than High School | - | - |
| High School Diploma | $78,862 | $0 |
| College or Associate's Degree | $114,688 | $24,625 |
| Bachelor's Degree | $158,203 | $80,962 |
| Graduate Degree | $169,583 | $144,668 |
| Total | $147,344 | $85,085 |
Family Income in Oak Brook
Family Income Brackets in Oak Brook
According to the Oak Brook family income data, there are 1,054 families falling into the $200,000+ income range, which is the most common income bracket and makes up 46.3% of all families. Conversely, the $10,000 to $14,999 income bracket is the least frequent group with only 9 families (0.4%) belonging to this category.
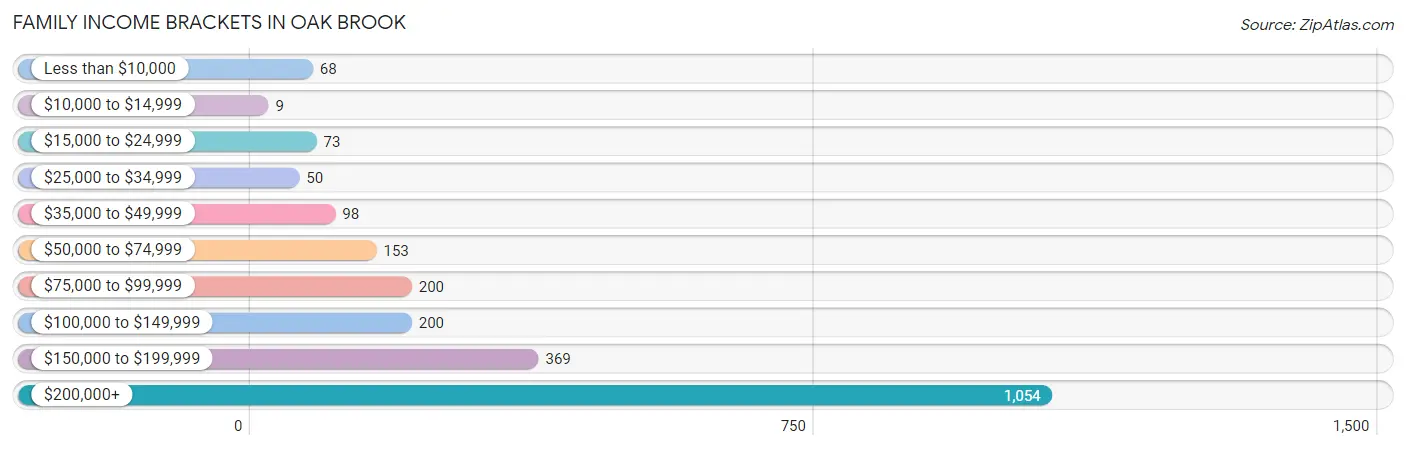
| Income Bracket | # Families | % Families |
| Less than $10,000 | 68 | 3.0% |
| $10,000 to $14,999 | 9 | 0.4% |
| $15,000 to $24,999 | 73 | 3.2% |
| $25,000 to $34,999 | 50 | 2.2% |
| $35,000 to $49,999 | 98 | 4.3% |
| $50,000 to $74,999 | 153 | 6.7% |
| $75,000 to $99,999 | 200 | 8.8% |
| $100,000 to $149,999 | 200 | 8.8% |
| $150,000 to $199,999 | 369 | 16.2% |
| $200,000+ | 1,054 | 46.3% |
Family Income by Famaliy Size in Oak Brook
4-person families (411 | 18.0%) account for the highest median family income in Oak Brook with $250,001 per family, while 2-person families (1,046 | 45.9%) have the highest median income of $86,000 per family member.
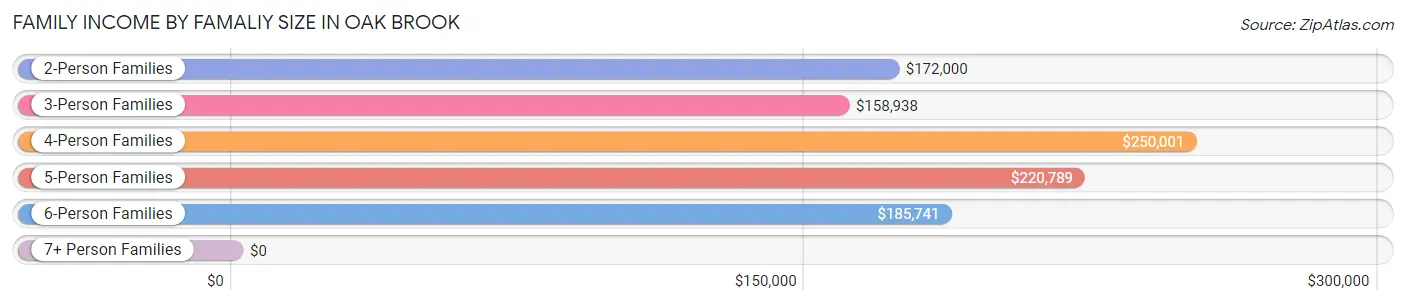
| Income Bracket | # Families | Median Income |
| 2-Person Families | 1,046 (45.9%) | $172,000 |
| 3-Person Families | 565 (24.8%) | $158,938 |
| 4-Person Families | 411 (18.0%) | $250,001 |
| 5-Person Families | 168 (7.4%) | $220,789 |
| 6-Person Families | 74 (3.3%) | $185,741 |
| 7+ Person Families | 13 (0.6%) | $0 |
| Total | 2,277 (100.0%) | $178,977 |
Family Income by Number of Earners in Oak Brook
The median family income in Oak Brook is $178,977, with families comprising 2 earners (851) having the highest median family income of $250,001, while families with no earners (580) have the lowest median family income of $76,574, accounting for 37.4% and 25.5% of families, respectively.
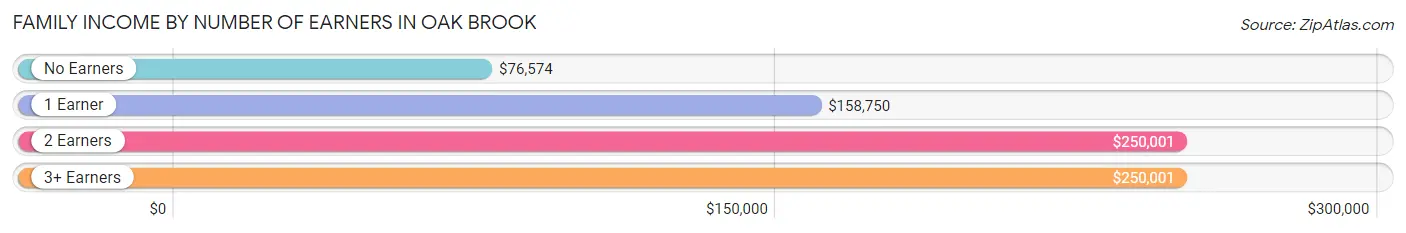
| Number of Earners | # Families | Median Income |
| No Earners | 580 (25.5%) | $76,574 |
| 1 Earner | 741 (32.5%) | $158,750 |
| 2 Earners | 851 (37.4%) | $250,001 |
| 3+ Earners | 105 (4.6%) | $250,001 |
| Total | 2,277 (100.0%) | $178,977 |
Household Income in Oak Brook
Household Income Brackets in Oak Brook
With 1,205 households falling in the category, the $200,000+ income range is the most frequent in Oak Brook, accounting for 40.4% of all households. In contrast, only 18 households (0.6%) fall into the $10,000 to $14,999 income bracket, making it the least populous group.
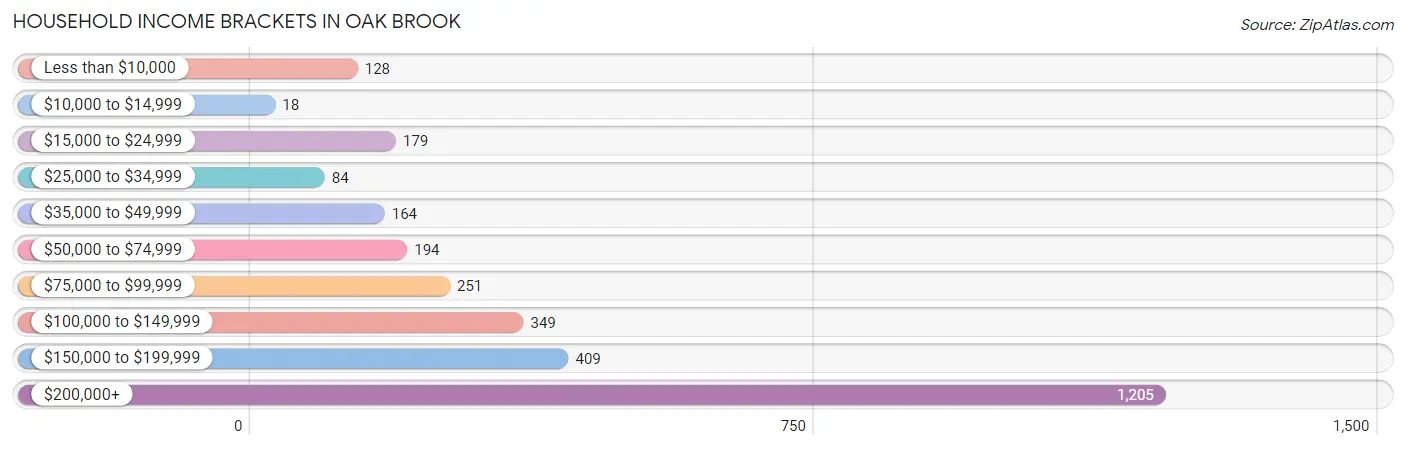
| Income Bracket | # Households | % Households |
| Less than $10,000 | 128 | 4.3% |
| $10,000 to $14,999 | 18 | 0.6% |
| $15,000 to $24,999 | 179 | 6.0% |
| $25,000 to $34,999 | 84 | 2.8% |
| $35,000 to $49,999 | 164 | 5.5% |
| $50,000 to $74,999 | 194 | 6.5% |
| $75,000 to $99,999 | 251 | 8.4% |
| $100,000 to $149,999 | 349 | 11.7% |
| $150,000 to $199,999 | 409 | 13.7% |
| $200,000+ | 1,205 | 40.4% |
Household Income by Householder Age in Oak Brook
The median household income in Oak Brook is $158,663, with the highest median household income of $186,111 found in the 25 to 44 years age bracket for the primary householder. A total of 464 households (15.5%) fall into this category.
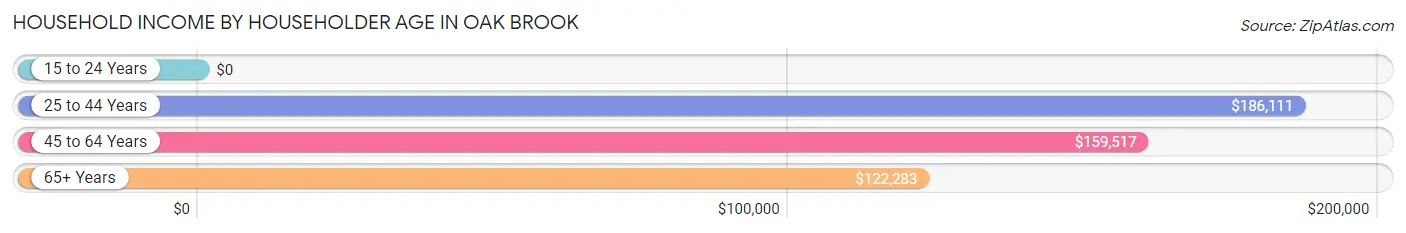
| Income Bracket | # Households | Median Income |
| 15 to 24 Years | 0 (0.0%) | $0 |
| 25 to 44 Years | 464 (15.5%) | $186,111 |
| 45 to 64 Years | 901 (30.2%) | $159,517 |
| 65+ Years | 1,618 (54.2%) | $122,283 |
| Total | 2,983 (100.0%) | $158,663 |
Poverty in Oak Brook
Income Below Poverty by Sex and Age in Oak Brook
With 6.7% poverty level for males and 6.7% for females among the residents of Oak Brook, 12 to 14 year old males and 16 and 17 year old females are the most vulnerable to poverty, with 31 males (23.7%) and 32 females (21.3%) in their respective age groups living below the poverty level.
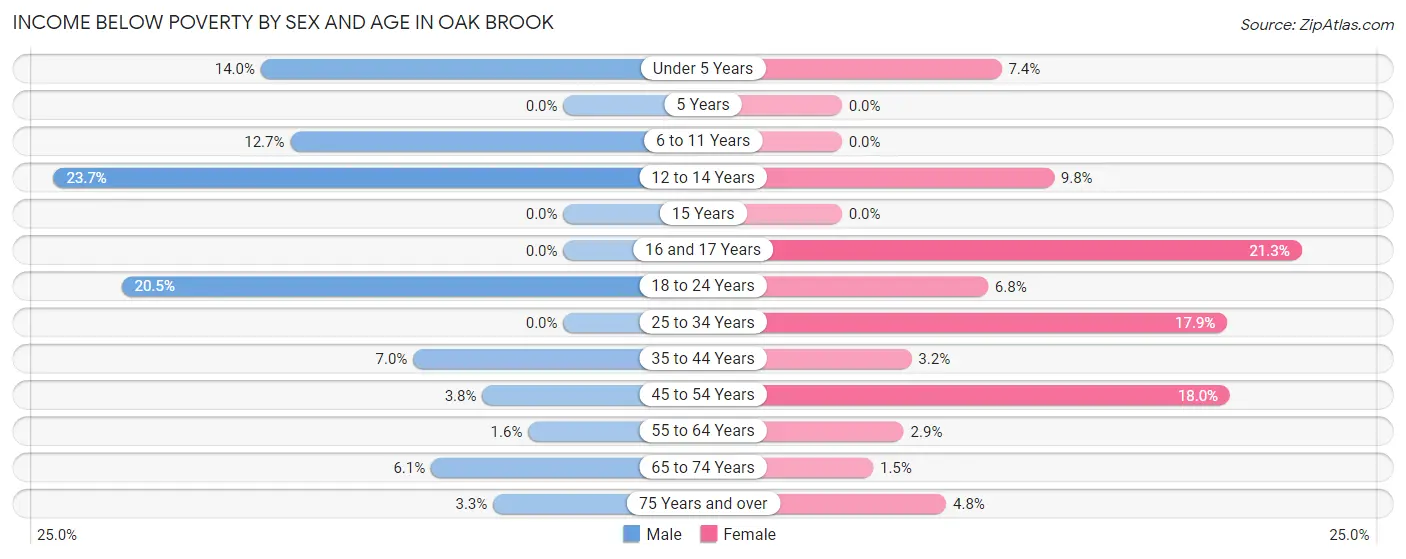
| Age Bracket | Male | Female |
| Under 5 Years | 16 (14.0%) | 16 (7.4%) |
| 5 Years | 0 (0.0%) | 0 (0.0%) |
| 6 to 11 Years | 28 (12.7%) | 0 (0.0%) |
| 12 to 14 Years | 31 (23.7%) | 31 (9.8%) |
| 15 Years | 0 (0.0%) | 0 (0.0%) |
| 16 and 17 Years | 0 (0.0%) | 32 (21.3%) |
| 18 to 24 Years | 66 (20.5%) | 16 (6.8%) |
| 25 to 34 Years | 0 (0.0%) | 27 (17.9%) |
| 35 to 44 Years | 26 (7.0%) | 14 (3.2%) |
| 45 to 54 Years | 14 (3.8%) | 87 (18.0%) |
| 55 to 64 Years | 10 (1.6%) | 10 (2.9%) |
| 65 to 74 Years | 42 (6.1%) | 10 (1.5%) |
| 75 Years and over | 17 (3.3%) | 39 (4.8%) |
| Total | 250 (6.7%) | 282 (6.7%) |
Income Above Poverty by Sex and Age in Oak Brook
According to the poverty statistics in Oak Brook, males aged 5 years and females aged 5 years are the age groups that are most secure financially, with 100.0% of males and 100.0% of females in these age groups living above the poverty line.
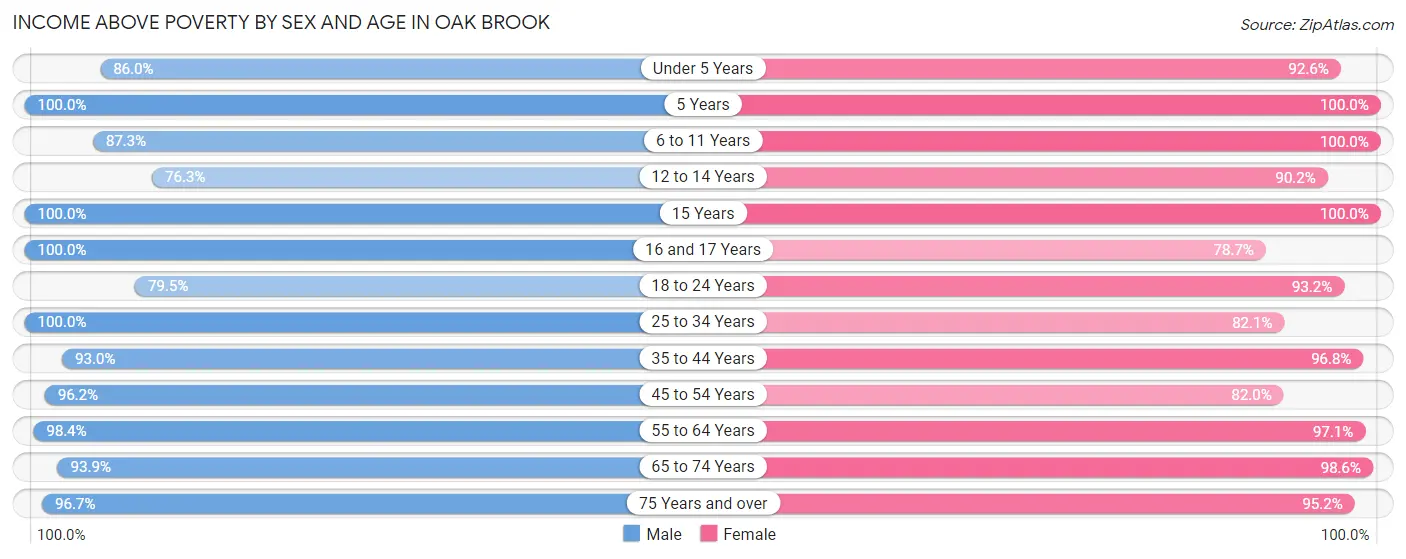
| Age Bracket | Male | Female |
| Under 5 Years | 98 (86.0%) | 200 (92.6%) |
| 5 Years | 84 (100.0%) | 36 (100.0%) |
| 6 to 11 Years | 193 (87.3%) | 342 (100.0%) |
| 12 to 14 Years | 100 (76.3%) | 284 (90.2%) |
| 15 Years | 56 (100.0%) | 24 (100.0%) |
| 16 and 17 Years | 112 (100.0%) | 118 (78.7%) |
| 18 to 24 Years | 256 (79.5%) | 220 (93.2%) |
| 25 to 34 Years | 139 (100.0%) | 124 (82.1%) |
| 35 to 44 Years | 347 (93.0%) | 419 (96.8%) |
| 45 to 54 Years | 358 (96.2%) | 396 (82.0%) |
| 55 to 64 Years | 602 (98.4%) | 338 (97.1%) |
| 65 to 74 Years | 642 (93.9%) | 681 (98.6%) |
| 75 Years and over | 505 (96.7%) | 767 (95.2%) |
| Total | 3,492 (93.3%) | 3,949 (93.3%) |
Income Below Poverty Among Married-Couple Families in Oak Brook
The poverty statistics for married-couple families in Oak Brook show that 2.8% or 51 of the total 1,819 families live below the poverty line. Families with no children have the highest poverty rate of 3.4%, comprising of 37 families. On the other hand, families with 3 or 4 children have the lowest poverty rate of 0.0%, which includes 0 families.
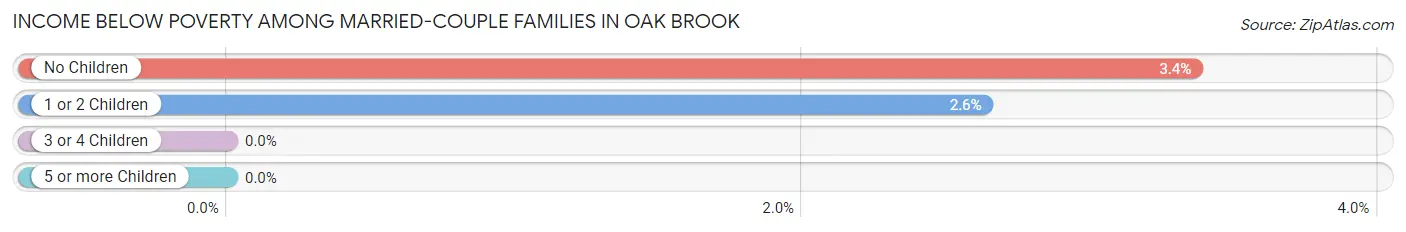
| Children | Above Poverty | Below Poverty |
| No Children | 1,064 (96.6%) | 37 (3.4%) |
| 1 or 2 Children | 519 (97.4%) | 14 (2.6%) |
| 3 or 4 Children | 185 (100.0%) | 0 (0.0%) |
| 5 or more Children | 0 (0.0%) | 0 (0.0%) |
| Total | 1,768 (97.2%) | 51 (2.8%) |
Income Below Poverty Among Single-Parent Households in Oak Brook
According to the poverty data in Oak Brook, 6.6% or 14 single-father households and 35.4% or 87 single-mother households are living below the poverty line. Among single-father households, those with no children have the highest poverty rate, with 14 households (13.7%) experiencing poverty. Likewise, among single-mother households, those with 1 or 2 children have the highest poverty rate, with 60 households (100.0%) falling below the poverty line.
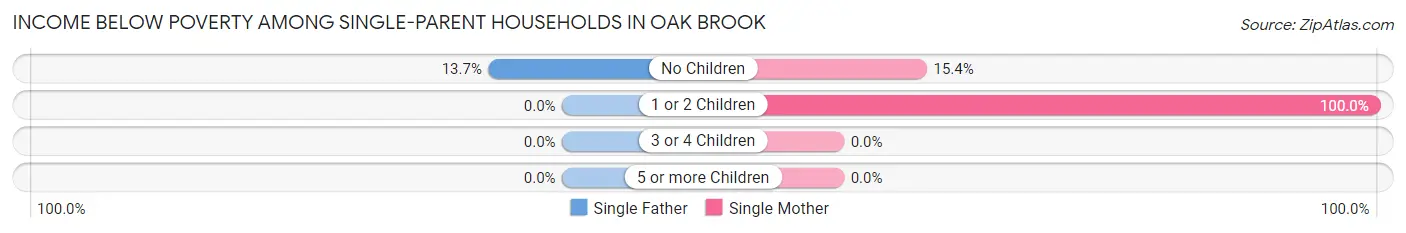
| Children | Single Father | Single Mother |
| No Children | 14 (13.7%) | 27 (15.4%) |
| 1 or 2 Children | 0 (0.0%) | 60 (100.0%) |
| 3 or 4 Children | 0 (0.0%) | 0 (0.0%) |
| 5 or more Children | 0 (0.0%) | 0 (0.0%) |
| Total | 14 (6.6%) | 87 (35.4%) |
Income Below Poverty Among Married-Couple vs Single-Parent Households in Oak Brook
The poverty data for Oak Brook shows that 51 of the married-couple family households (2.8%) and 101 of the single-parent households (22.1%) are living below the poverty level. Within the married-couple family households, those with no children have the highest poverty rate, with 37 households (3.4%) falling below the poverty line. Among the single-parent households, those with 1 or 2 children have the highest poverty rate, with 60 household (35.3%) living below poverty.
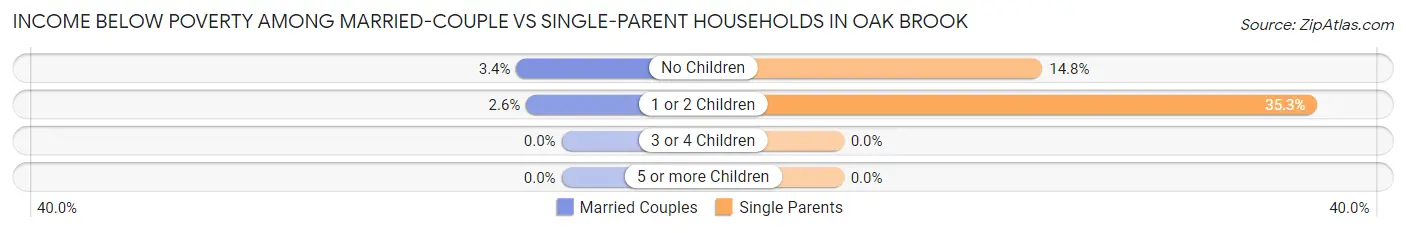
| Children | Married-Couple Families | Single-Parent Households |
| No Children | 37 (3.4%) | 41 (14.8%) |
| 1 or 2 Children | 14 (2.6%) | 60 (35.3%) |
| 3 or 4 Children | 0 (0.0%) | 0 (0.0%) |
| 5 or more Children | 0 (0.0%) | 0 (0.0%) |
| Total | 51 (2.8%) | 101 (22.1%) |
Race in Oak Brook
The most populous races in Oak Brook are White / Caucasian (5,074 | 62.9%), Asian (2,371 | 29.4%), and Two or more Races (472 | 5.9%).
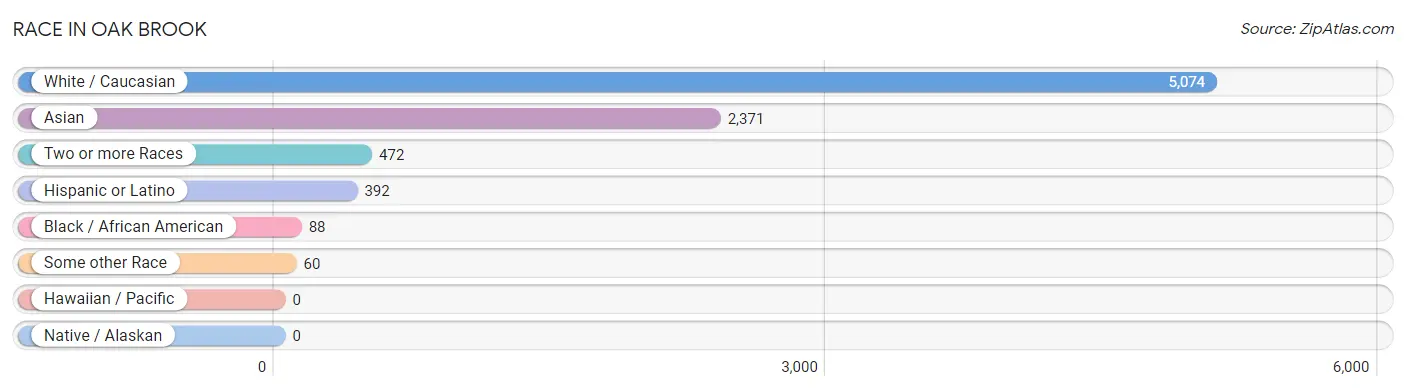
| Race | # Population | % Population |
| Asian | 2,371 | 29.4% |
| Black / African American | 88 | 1.1% |
| Hawaiian / Pacific | 0 | 0.0% |
| Hispanic or Latino | 392 | 4.9% |
| Native / Alaskan | 0 | 0.0% |
| White / Caucasian | 5,074 | 62.9% |
| Two or more Races | 472 | 5.9% |
| Some other Race | 60 | 0.7% |
| Total | 8,065 | 100.0% |
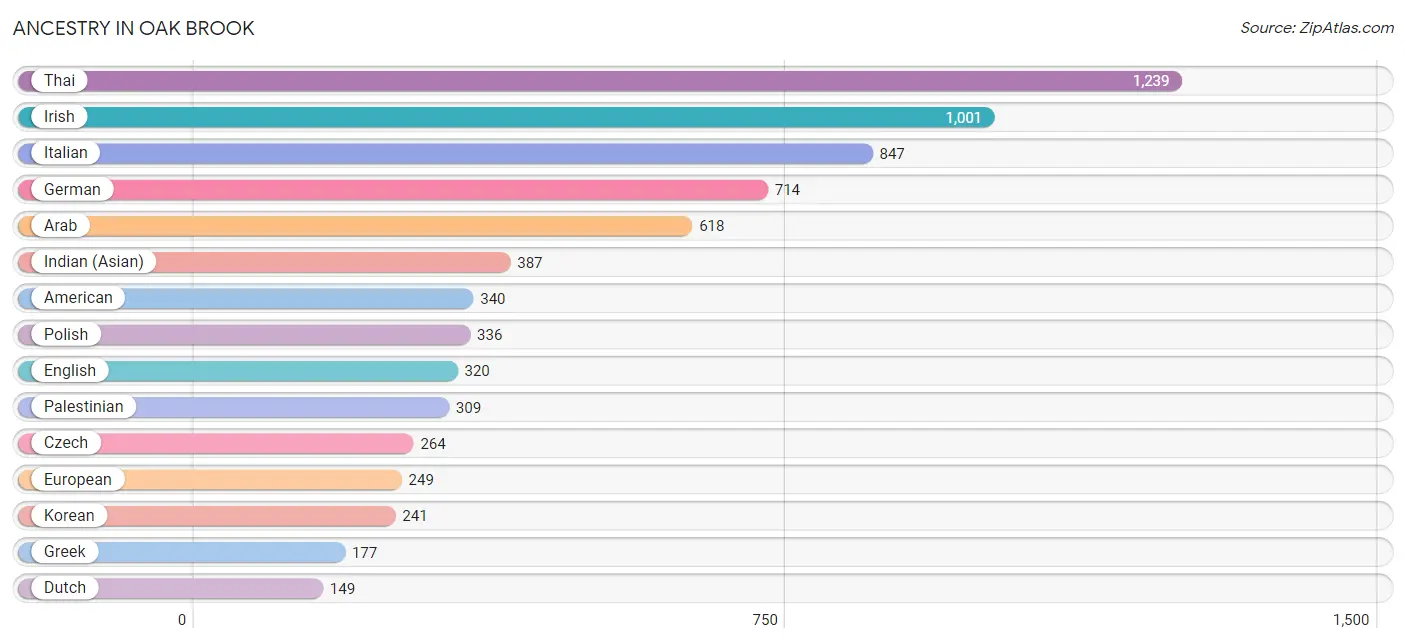
Ancestry in Oak Brook
The most populous ancestries reported in Oak Brook are Thai (1,239 | 15.4%), Irish (1,001 | 12.4%), Italian (847 | 10.5%), German (714 | 8.8%), and Arab (618 | 7.7%), together accounting for 54.8% of all Oak Brook residents.
| Ancestry | # Population | % Population |
| American | 340 | 4.2% |
| Arab | 618 | 7.7% |
| Argentinean | 101 | 1.3% |
| Austrian | 9 | 0.1% |
| Belgian | 37 | 0.5% |
| Bolivian | 20 | 0.3% |
| Burmese | 39 | 0.5% |
| Central American | 10 | 0.1% |
| Chilean | 7 | 0.1% |
| Chippewa | 8 | 0.1% |
| Colombian | 15 | 0.2% |
| Costa Rican | 10 | 0.1% |
| Cuban | 59 | 0.7% |
| Czech | 264 | 3.3% |
| Dominican | 6 | 0.1% |
| Dutch | 149 | 1.8% |
| Eastern European | 14 | 0.2% |
| English | 320 | 4.0% |
| European | 249 | 3.1% |
| Filipino | 60 | 0.7% |
| French | 106 | 1.3% |
| German | 714 | 8.8% |
| Greek | 177 | 2.2% |
| Hungarian | 20 | 0.3% |
| Indian (Asian) | 387 | 4.8% |
| Iranian | 96 | 1.2% |
| Iraqi | 53 | 0.7% |
| Irish | 1,001 | 12.4% |
| Italian | 847 | 10.5% |
| Korean | 241 | 3.0% |
| Laotian | 82 | 1.0% |
| Latvian | 21 | 0.3% |
| Lithuanian | 58 | 0.7% |
| Mexican | 89 | 1.1% |
| Moroccan | 26 | 0.3% |
| Northern European | 59 | 0.7% |
| Norwegian | 18 | 0.2% |
| Palestinian | 309 | 3.8% |
| Polish | 336 | 4.2% |
| Puerto Rican | 85 | 1.1% |
| Russian | 73 | 0.9% |
| Scotch-Irish | 57 | 0.7% |
| Scottish | 106 | 1.3% |
| Slovak | 22 | 0.3% |
| Slovene | 40 | 0.5% |
| South American | 143 | 1.8% |
| Swedish | 126 | 1.6% |
| Swiss | 22 | 0.3% |
| Syrian | 65 | 0.8% |
| Thai | 1,239 | 15.4% |
| Ukrainian | 6 | 0.1% |
| Yugoslavian | 18 | 0.2% | View All 52 Rows |
Immigrants in Oak Brook
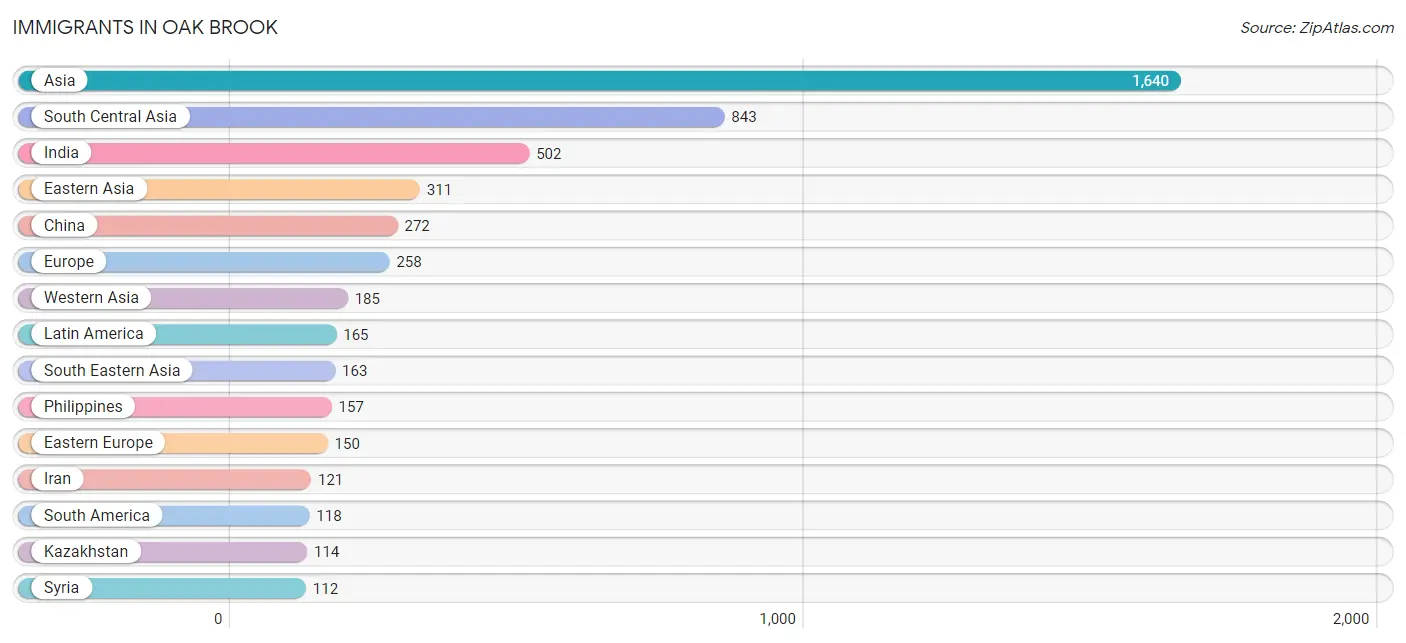
The most numerous immigrant groups reported in Oak Brook came from Asia (1,640 | 20.3%), South Central Asia (843 | 10.4%), India (502 | 6.2%), Eastern Asia (311 | 3.9%), and China (272 | 3.4%), together accounting for 44.2% of all Oak Brook residents.
| Immigration Origin | # Population | % Population |
| Africa | 66 | 0.8% |
| Argentina | 101 | 1.3% |
| Asia | 1,640 | 20.3% |
| Belgium | 10 | 0.1% |
| Bolivia | 10 | 0.1% |
| Canada | 9 | 0.1% |
| Caribbean | 26 | 0.3% |
| Central America | 21 | 0.3% |
| China | 272 | 3.4% |
| Colombia | 7 | 0.1% |
| Cuba | 20 | 0.3% |
| Czechoslovakia | 47 | 0.6% |
| Dominican Republic | 6 | 0.1% |
| Eastern Africa | 66 | 0.8% |
| Eastern Asia | 311 | 3.9% |
| Eastern Europe | 150 | 1.9% |
| England | 8 | 0.1% |
| Europe | 258 | 3.2% |
| Greece | 9 | 0.1% |
| Hong Kong | 5 | 0.1% |
| India | 502 | 6.2% |
| Iran | 121 | 1.5% |
| Iraq | 27 | 0.3% |
| Israel | 20 | 0.3% |
| Italy | 38 | 0.5% |
| Jordan | 26 | 0.3% |
| Kazakhstan | 114 | 1.4% |
| Kenya | 33 | 0.4% |
| Korea | 39 | 0.5% |
| Latin America | 165 | 2.1% |
| Latvia | 22 | 0.3% |
| Lithuania | 10 | 0.1% |
| Mexico | 21 | 0.3% |
| Northern Europe | 51 | 0.6% |
| Pakistan | 106 | 1.3% |
| Philippines | 157 | 1.9% |
| Poland | 53 | 0.7% |
| Russia | 18 | 0.2% |
| South America | 118 | 1.5% |
| South Central Asia | 843 | 10.4% |
| South Eastern Asia | 163 | 2.0% |
| Southern Europe | 47 | 0.6% |
| Syria | 112 | 1.4% |
| Taiwan | 88 | 1.1% |
| Uganda | 33 | 0.4% |
| Vietnam | 6 | 0.1% |
| Western Asia | 185 | 2.3% |
| Western Europe | 10 | 0.1% | View All 48 Rows |
Sex and Age in Oak Brook
Sex and Age in Oak Brook
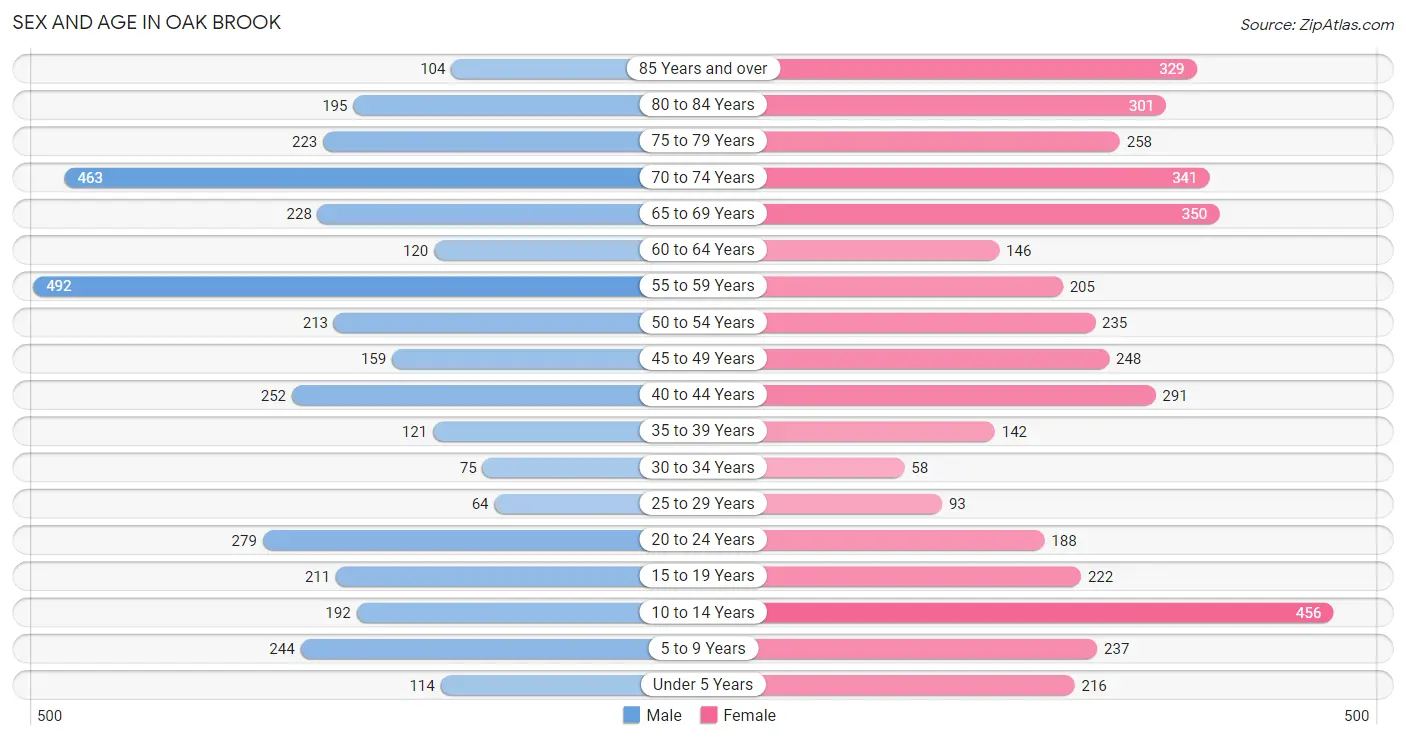
The most populous age groups in Oak Brook are 55 to 59 Years (492 | 13.1%) for men and 10 to 14 Years (456 | 10.6%) for women.
| Age Bracket | Male | Female |
| Under 5 Years | 114 (3.0%) | 216 (5.0%) |
| 5 to 9 Years | 244 (6.5%) | 237 (5.5%) |
| 10 to 14 Years | 192 (5.1%) | 456 (10.6%) |
| 15 to 19 Years | 211 (5.6%) | 222 (5.1%) |
| 20 to 24 Years | 279 (7.4%) | 188 (4.4%) |
| 25 to 29 Years | 64 (1.7%) | 93 (2.1%) |
| 30 to 34 Years | 75 (2.0%) | 58 (1.3%) |
| 35 to 39 Years | 121 (3.2%) | 142 (3.3%) |
| 40 to 44 Years | 252 (6.7%) | 291 (6.7%) |
| 45 to 49 Years | 159 (4.2%) | 248 (5.8%) |
| 50 to 54 Years | 213 (5.7%) | 235 (5.4%) |
| 55 to 59 Years | 492 (13.1%) | 205 (4.8%) |
| 60 to 64 Years | 120 (3.2%) | 146 (3.4%) |
| 65 to 69 Years | 228 (6.1%) | 350 (8.1%) |
| 70 to 74 Years | 463 (12.3%) | 341 (7.9%) |
| 75 to 79 Years | 223 (5.9%) | 258 (6.0%) |
| 80 to 84 Years | 195 (5.2%) | 301 (7.0%) |
| 85 Years and over | 104 (2.8%) | 329 (7.6%) |
| Total | 3,749 (100.0%) | 4,316 (100.0%) |
Families and Households in Oak Brook
Median Family Size in Oak Brook
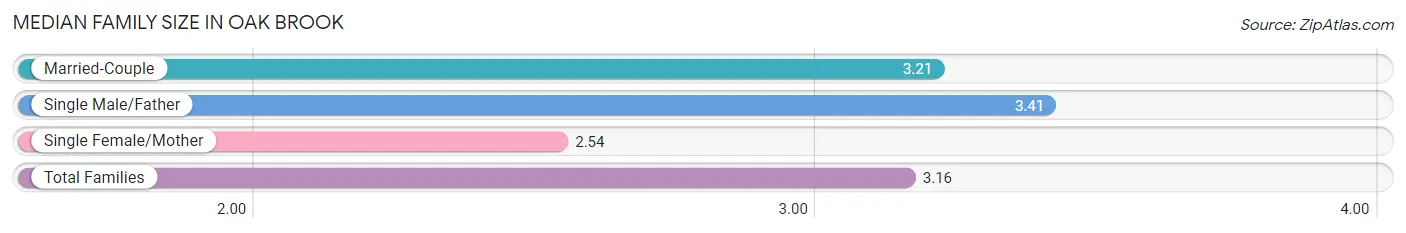
The median family size in Oak Brook is 3.16 persons per family, with single male/father families (212 | 9.3%) accounting for the largest median family size of 3.41 persons per family. On the other hand, single female/mother families (246 | 10.8%) represent the smallest median family size with 2.54 persons per family.
| Family Type | # Families | Family Size |
| Married-Couple | 1,819 (79.9%) | 3.21 |
| Single Male/Father | 212 (9.3%) | 3.41 |
| Single Female/Mother | 246 (10.8%) | 2.54 |
| Total Families | 2,277 (100.0%) | 3.16 |
Median Household Size in Oak Brook
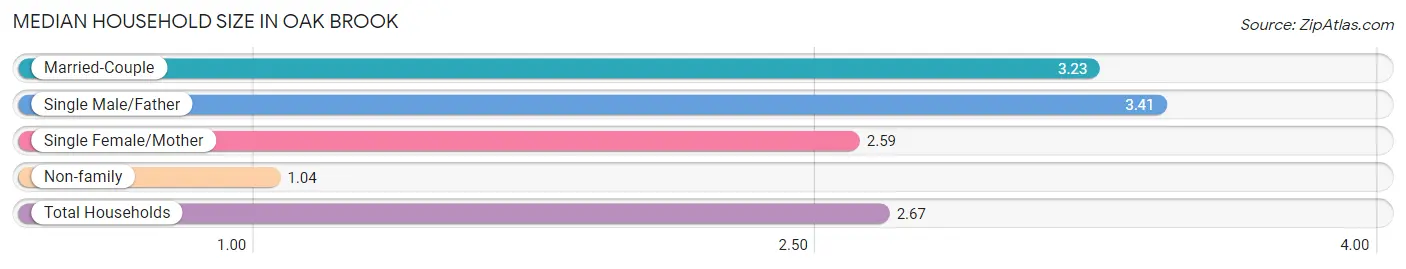
The median household size in Oak Brook is 2.67 persons per household, with single male/father households (212 | 7.1%) accounting for the largest median household size of 3.41 persons per household. non-family households (706 | 23.7%) represent the smallest median household size with 1.04 persons per household.
| Household Type | # Households | Household Size |
| Married-Couple | 1,819 (61.0%) | 3.23 |
| Single Male/Father | 212 (7.1%) | 3.41 |
| Single Female/Mother | 246 (8.3%) | 2.59 |
| Non-family | 706 (23.7%) | 1.04 |
| Total Households | 2,983 (100.0%) | 2.67 |
Household Size by Marriage Status in Oak Brook
Out of a total of 2,983 households in Oak Brook, 2,277 (76.3%) are family households, while 706 (23.7%) are nonfamily households. The most numerous type of family households are 2-person households, comprising 1,036, and the most common type of nonfamily households are 1-person households, comprising 678.
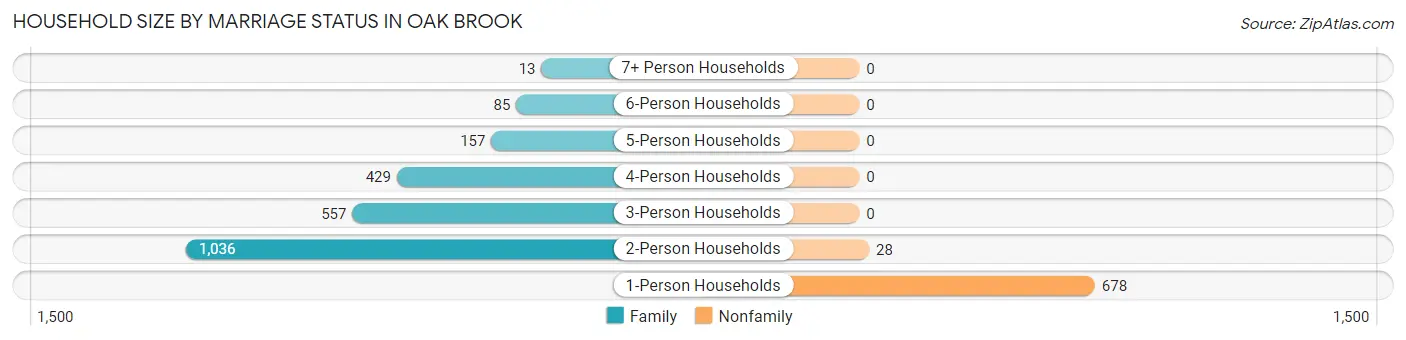
| Household Size | Family Households | Nonfamily Households |
| 1-Person Households | - | 678 (22.7%) |
| 2-Person Households | 1,036 (34.7%) | 28 (0.9%) |
| 3-Person Households | 557 (18.7%) | 0 (0.0%) |
| 4-Person Households | 429 (14.4%) | 0 (0.0%) |
| 5-Person Households | 157 (5.3%) | 0 (0.0%) |
| 6-Person Households | 85 (2.9%) | 0 (0.0%) |
| 7+ Person Households | 13 (0.4%) | 0 (0.0%) |
| Total | 2,277 (76.3%) | 706 (23.7%) |
Female Fertility in Oak Brook
Fertility by Age in Oak Brook
Average fertility rate in Oak Brook is 72.0 births per 1,000 women. Women in the age bracket of 20 to 34 years have the highest fertility rate with 156.0 births per 1,000 women. Women in the age bracket of 20 to 34 years acount for 58.9% of all women with births.
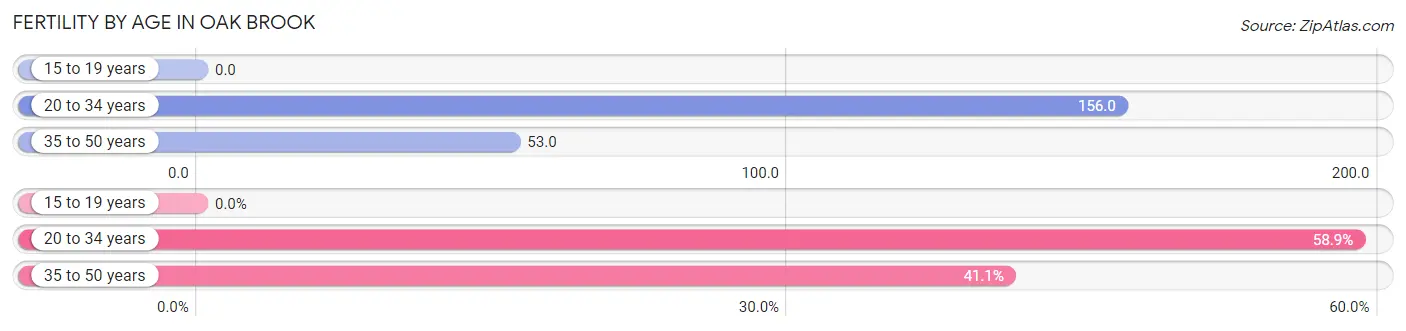
| Age Bracket | Women with Births | Births / 1,000 Women |
| 15 to 19 years | 0 (0.0%) | 0.0 |
| 20 to 34 years | 53 (58.9%) | 156.0 |
| 35 to 50 years | 37 (41.1%) | 53.0 |
| Total | 90 (100.0%) | 72.0 |
Fertility by Age by Marriage Status in Oak Brook
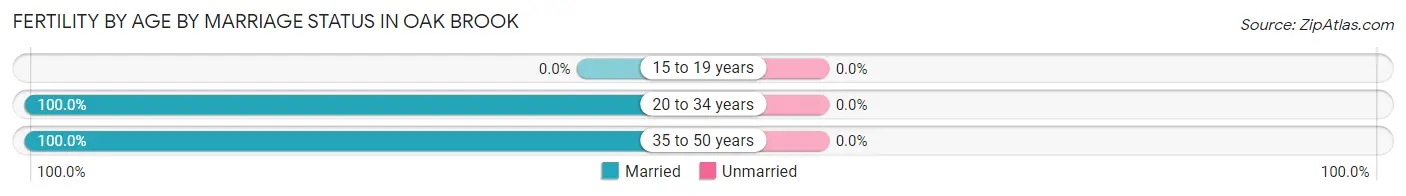
| Age Bracket | Married | Unmarried |
| 15 to 19 years | 0 (0.0%) | 0 (0.0%) |
| 20 to 34 years | 53 (100.0%) | 0 (0.0%) |
| 35 to 50 years | 37 (100.0%) | 0 (0.0%) |
| Total | 90 (100.0%) | 0 (0.0%) |
Fertility by Education in Oak Brook
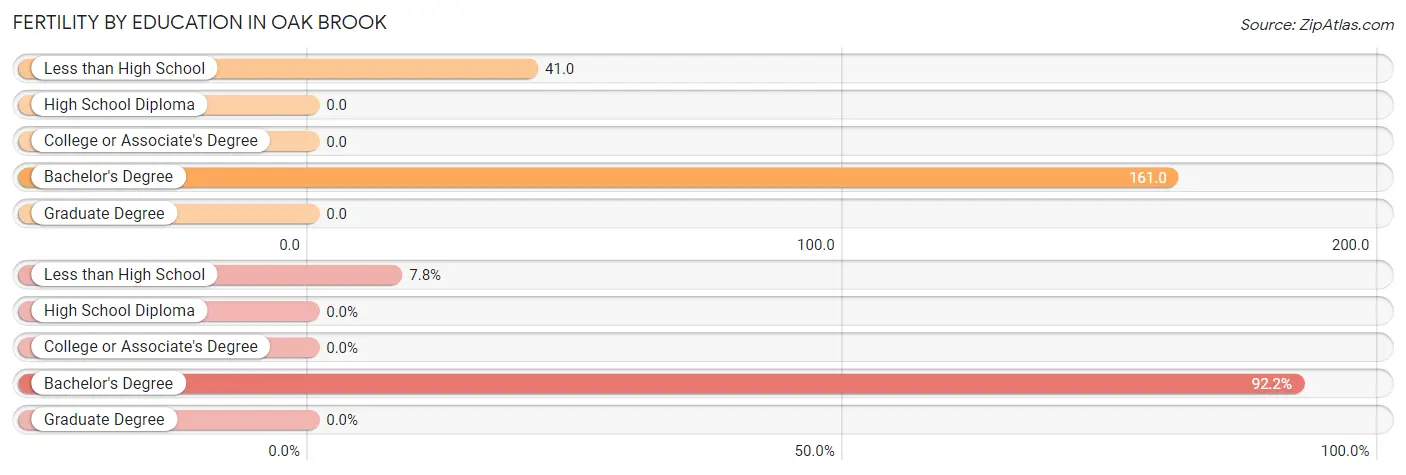
| Educational Attainment | Women with Births | Births / 1,000 Women |
| Less than High School | 7 (7.8%) | 41.0 |
| High School Diploma | 0 (0.0%) | 0.0 |
| College or Associate's Degree | 0 (0.0%) | 0.0 |
| Bachelor's Degree | 83 (92.2%) | 161.0 |
| Graduate Degree | 0 (0.0%) | 0.0 |
| Total | 90 (100.0%) | 72.0 |
Fertility by Education by Marriage Status in Oak Brook
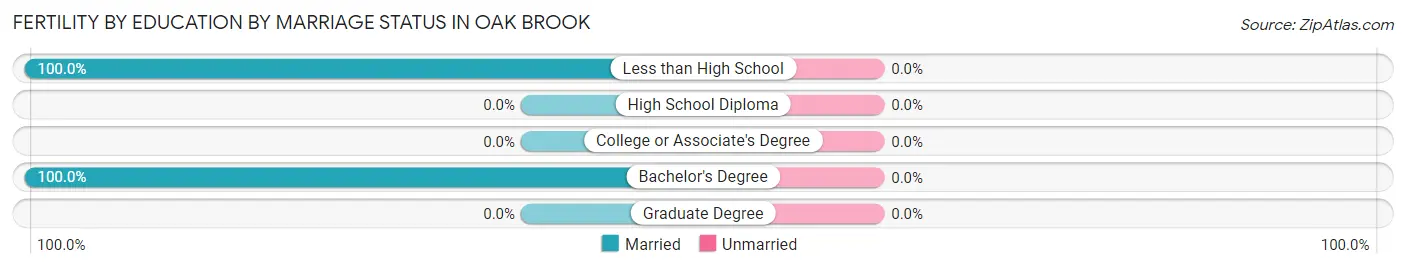
| Educational Attainment | Married | Unmarried |
| Less than High School | 7 (100.0%) | 0 (0.0%) |
| High School Diploma | 0 (0.0%) | 0 (0.0%) |
| College or Associate's Degree | 0 (0.0%) | 0 (0.0%) |
| Bachelor's Degree | 83 (100.0%) | 0 (0.0%) |
| Graduate Degree | 0 (0.0%) | 0 (0.0%) |
| Total | 90 (100.0%) | 0 (0.0%) |
Employment Characteristics in Oak Brook
Employment by Class of Employer in Oak Brook
Among the 2,766 employed individuals in Oak Brook, private company employees (1,641 | 59.3%), self-employed (incorporated) (553 | 20.0%), and not-for-profit organizations (219 | 7.9%) make up the most common classes of employment.
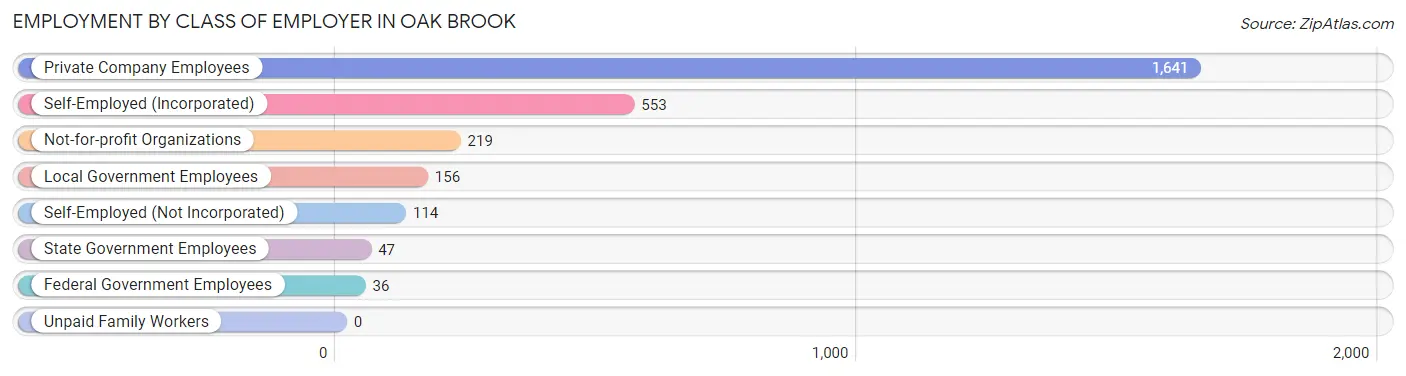
| Employer Class | # Employees | % Employees |
| Private Company Employees | 1,641 | 59.3% |
| Self-Employed (Incorporated) | 553 | 20.0% |
| Self-Employed (Not Incorporated) | 114 | 4.1% |
| Not-for-profit Organizations | 219 | 7.9% |
| Local Government Employees | 156 | 5.6% |
| State Government Employees | 47 | 1.7% |
| Federal Government Employees | 36 | 1.3% |
| Unpaid Family Workers | 0 | 0.0% |
| Total | 2,766 | 100.0% |
Employment Status by Age in Oak Brook
According to the labor force statistics for Oak Brook, out of the total population over 16 years of age (6,526), 48.0% or 3,132 individuals are in the labor force, with 10.4% or 326 of them unemployed. The age group with the highest labor force participation rate is 35 to 44 years, with 85.5% or 689 individuals in the labor force. Within the labor force, the 20 to 24 years age range has the highest percentage of unemployed individuals, with 68.7% or 114 of them being unemployed.
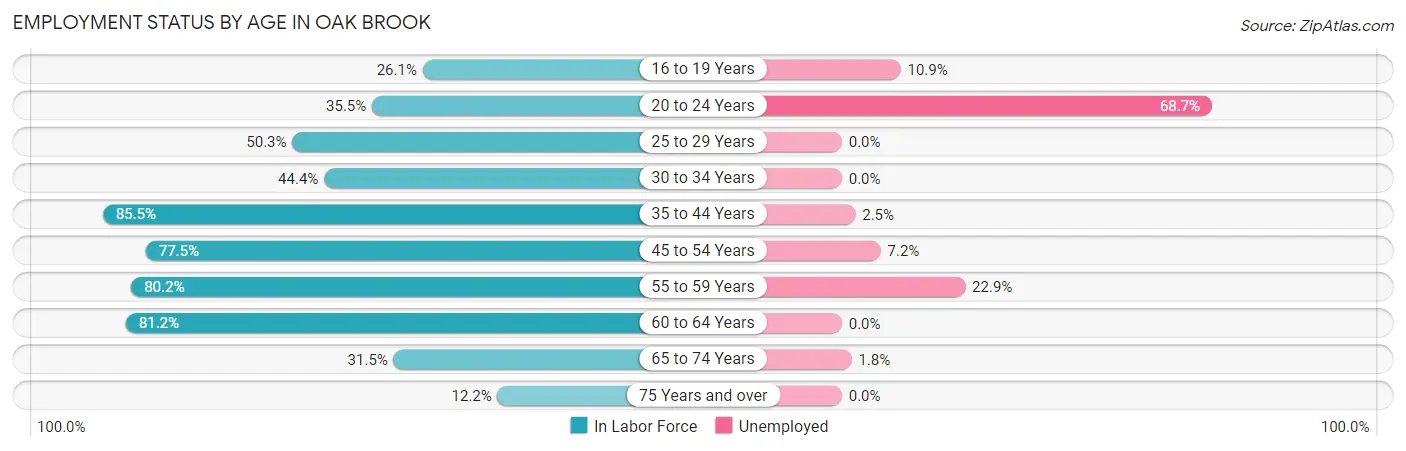
| Age Bracket | In Labor Force | Unemployed |
| 16 to 19 Years | 92 (26.1%) | 10 (10.9%) |
| 20 to 24 Years | 166 (35.5%) | 114 (68.7%) |
| 25 to 29 Years | 79 (50.3%) | 0 (0.0%) |
| 30 to 34 Years | 59 (44.4%) | 0 (0.0%) |
| 35 to 44 Years | 689 (85.5%) | 17 (2.5%) |
| 45 to 54 Years | 663 (77.5%) | 48 (7.2%) |
| 55 to 59 Years | 559 (80.2%) | 128 (22.9%) |
| 60 to 64 Years | 216 (81.2%) | 0 (0.0%) |
| 65 to 74 Years | 435 (31.5%) | 8 (1.8%) |
| 75 Years and over | 172 (12.2%) | 0 (0.0%) |
| Total | 3,132 (48.0%) | 326 (10.4%) |
Employment Status by Educational Attainment in Oak Brook
According to labor force statistics for Oak Brook, 77.7% of individuals (2,264) out of the total population between 25 and 64 years of age (2,914) are in the labor force, with 8.5% or 192 of them being unemployed. The group with the highest labor force participation rate are those with the educational attainment of bachelor's degree or higher, with 78.2% or 1,682 individuals in the labor force. Within the labor force, individuals with high school diploma education have the highest percentage of unemployment, with 31.1% or 71 of them being unemployed.
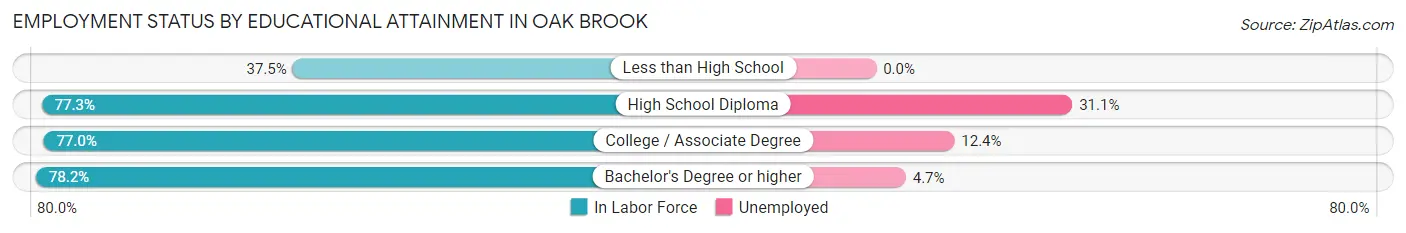
| Educational Attainment | In Labor Force | Unemployed |
| Less than High School | 6 (37.5%) | 0 (0.0%) |
| High School Diploma | 228 (77.3%) | 92 (31.1%) |
| College / Associate Degree | 348 (77.0%) | 56 (12.4%) |
| Bachelor's Degree or higher | 1,682 (78.2%) | 101 (4.7%) |
| Total | 2,264 (77.7%) | 248 (8.5%) |
Employment Occupations by Sex in Oak Brook
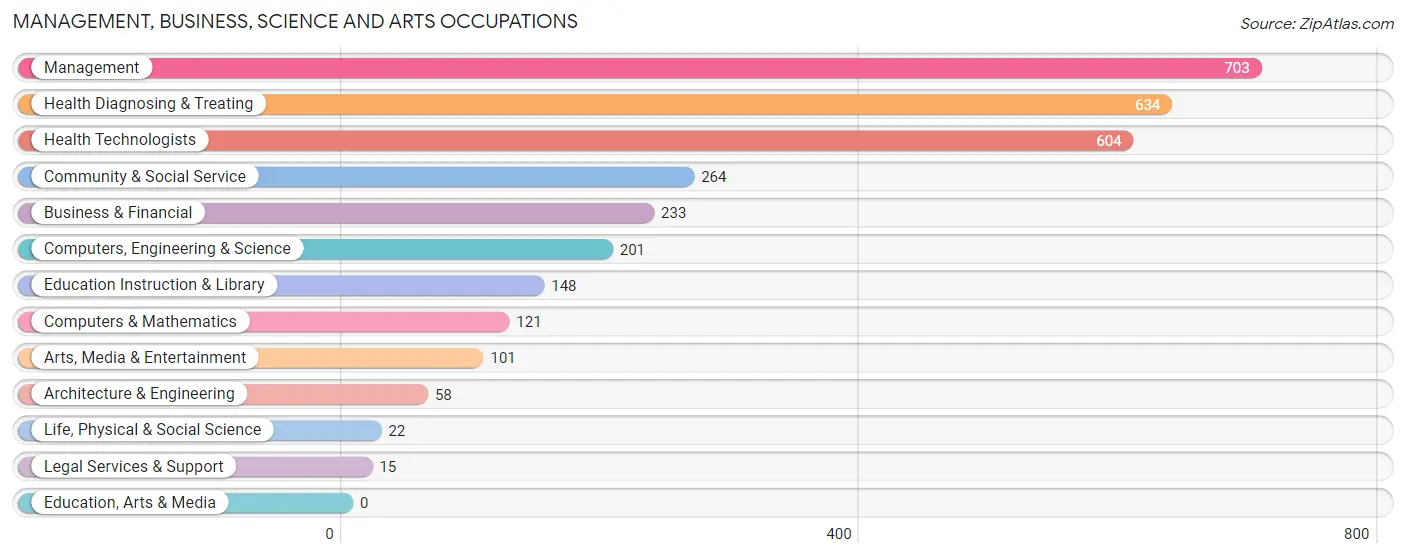
Management, Business, Science and Arts Occupations
The most common Management, Business, Science and Arts occupations in Oak Brook are Management (703 | 25.1%), Health Diagnosing & Treating (634 | 22.6%), Health Technologists (604 | 21.5%), Community & Social Service (264 | 9.4%), and Business & Financial (233 | 8.3%).
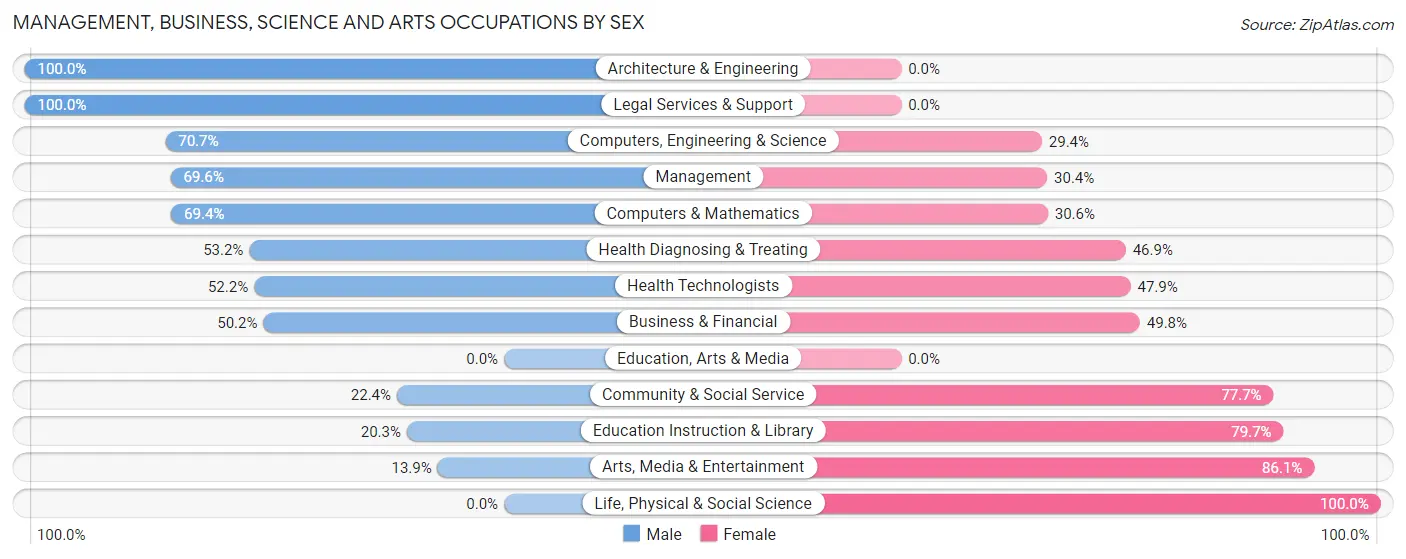
Management, Business, Science and Arts Occupations by Sex
Within the Management, Business, Science and Arts occupations in Oak Brook, the most male-oriented occupations are Architecture & Engineering (100.0%), Legal Services & Support (100.0%), and Computers, Engineering & Science (70.7%), while the most female-oriented occupations are Life, Physical & Social Science (100.0%), Arts, Media & Entertainment (86.1%), and Education Instruction & Library (79.7%).
| Occupation | Male | Female |
| Management | 489 (69.6%) | 214 (30.4%) |
| Business & Financial | 117 (50.2%) | 116 (49.8%) |
| Computers, Engineering & Science | 142 (70.7%) | 59 (29.3%) |
| Computers & Mathematics | 84 (69.4%) | 37 (30.6%) |
| Architecture & Engineering | 58 (100.0%) | 0 (0.0%) |
| Life, Physical & Social Science | 0 (0.0%) | 22 (100.0%) |
| Community & Social Service | 59 (22.4%) | 205 (77.6%) |
| Education, Arts & Media | 0 (0.0%) | 0 (0.0%) |
| Legal Services & Support | 15 (100.0%) | 0 (0.0%) |
| Education Instruction & Library | 30 (20.3%) | 118 (79.7%) |
| Arts, Media & Entertainment | 14 (13.9%) | 87 (86.1%) |
| Health Diagnosing & Treating | 337 (53.1%) | 297 (46.9%) |
| Health Technologists | 315 (52.1%) | 289 (47.8%) |
| Total (Category) | 1,144 (56.2%) | 891 (43.8%) |
| Total (Overall) | 1,539 (54.9%) | 1,266 (45.1%) |
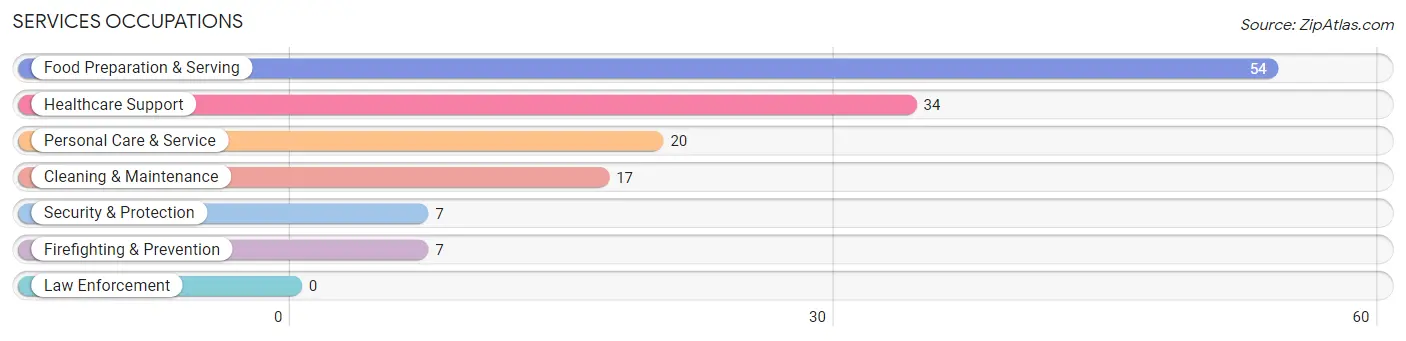
Services Occupations
The most common Services occupations in Oak Brook are Food Preparation & Serving (54 | 1.9%), Healthcare Support (34 | 1.2%), Personal Care & Service (20 | 0.7%), Cleaning & Maintenance (17 | 0.6%), and Security & Protection (7 | 0.3%).
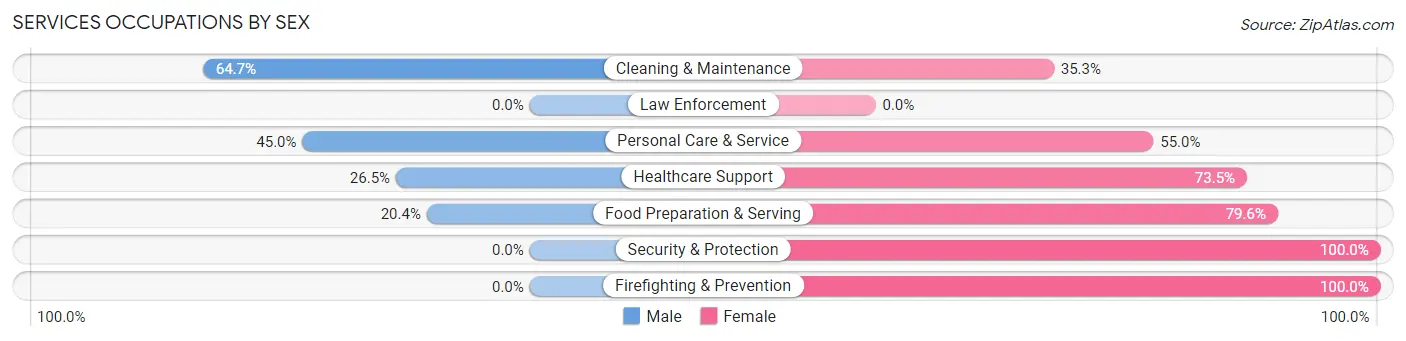
Services Occupations by Sex
Within the Services occupations in Oak Brook, the most male-oriented occupations are Cleaning & Maintenance (64.7%), Personal Care & Service (45.0%), and Healthcare Support (26.5%), while the most female-oriented occupations are Security & Protection (100.0%), Firefighting & Prevention (100.0%), and Food Preparation & Serving (79.6%).
| Occupation | Male | Female |
| Healthcare Support | 9 (26.5%) | 25 (73.5%) |
| Security & Protection | 0 (0.0%) | 7 (100.0%) |
| Firefighting & Prevention | 0 (0.0%) | 7 (100.0%) |
| Law Enforcement | 0 (0.0%) | 0 (0.0%) |
| Food Preparation & Serving | 11 (20.4%) | 43 (79.6%) |
| Cleaning & Maintenance | 11 (64.7%) | 6 (35.3%) |
| Personal Care & Service | 9 (45.0%) | 11 (55.0%) |
| Total (Category) | 40 (30.3%) | 92 (69.7%) |
| Total (Overall) | 1,539 (54.9%) | 1,266 (45.1%) |
Sales and Office Occupations
The most common Sales and Office occupations in Oak Brook are Sales & Related (220 | 7.8%), and Office & Administration (193 | 6.9%).

Sales and Office Occupations by Sex

| Occupation | Male | Female |
| Sales & Related | 136 (61.8%) | 84 (38.2%) |
| Office & Administration | 23 (11.9%) | 170 (88.1%) |
| Total (Category) | 159 (38.5%) | 254 (61.5%) |
| Total (Overall) | 1,539 (54.9%) | 1,266 (45.1%) |
Natural Resources, Construction and Maintenance Occupations
The most common Natural Resources, Construction and Maintenance occupations in Oak Brook are Farming, Fishing & Forestry (13 | 0.5%), and Construction & Extraction (13 | 0.5%).
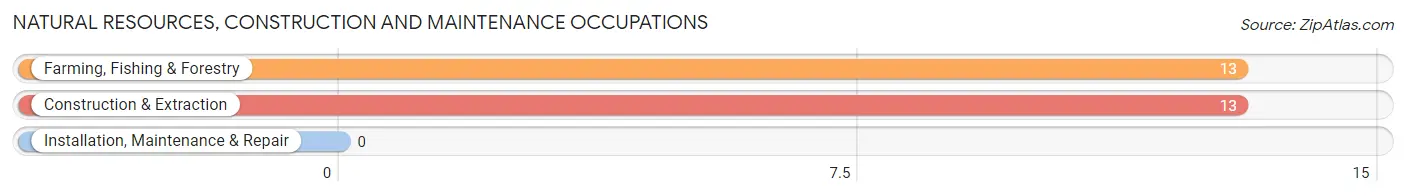
Natural Resources, Construction and Maintenance Occupations by Sex
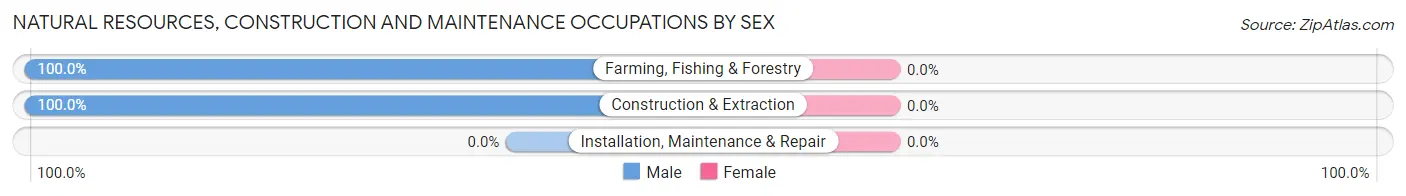
| Occupation | Male | Female |
| Farming, Fishing & Forestry | 13 (100.0%) | 0 (0.0%) |
| Construction & Extraction | 13 (100.0%) | 0 (0.0%) |
| Installation, Maintenance & Repair | 0 (0.0%) | 0 (0.0%) |
| Total (Category) | 26 (100.0%) | 0 (0.0%) |
| Total (Overall) | 1,539 (54.9%) | 1,266 (45.1%) |
Production, Transportation and Moving Occupations
The most common Production, Transportation and Moving occupations in Oak Brook are Transportation (106 | 3.8%), Production (78 | 2.8%), and Material Moving (15 | 0.5%).
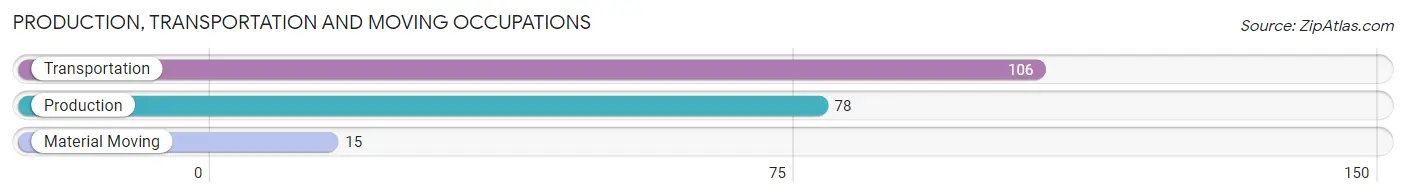
Production, Transportation and Moving Occupations by Sex
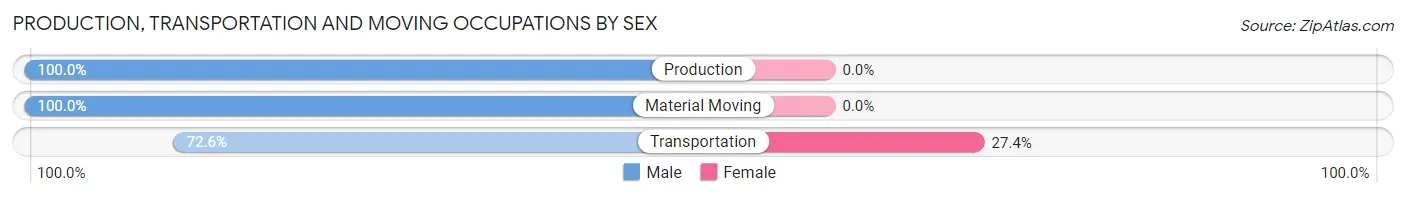
| Occupation | Male | Female |
| Production | 78 (100.0%) | 0 (0.0%) |
| Transportation | 77 (72.6%) | 29 (27.4%) |
| Material Moving | 15 (100.0%) | 0 (0.0%) |
| Total (Category) | 170 (85.4%) | 29 (14.6%) |
| Total (Overall) | 1,539 (54.9%) | 1,266 (45.1%) |
Employment Industries by Sex in Oak Brook
Employment Industries in Oak Brook
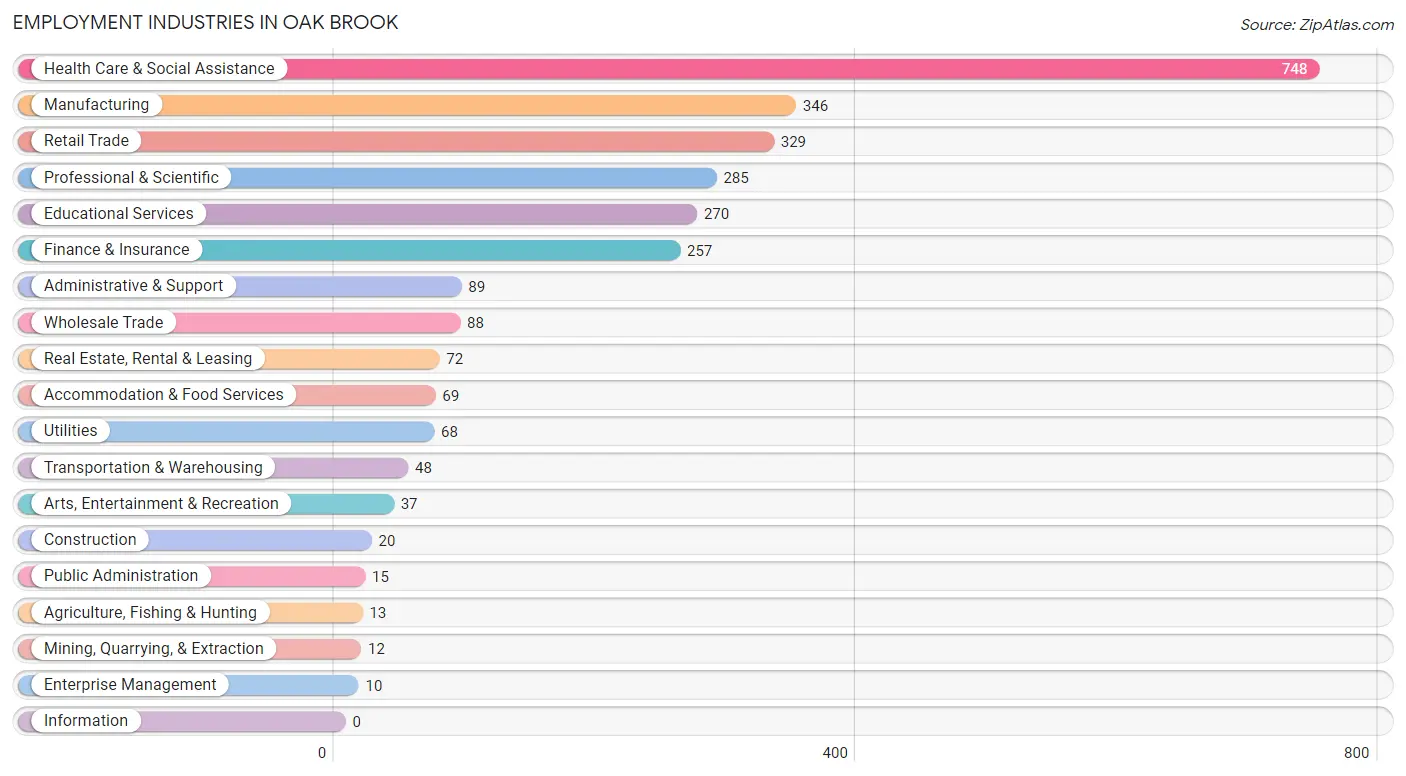
The major employment industries in Oak Brook include Health Care & Social Assistance (748 | 26.7%), Manufacturing (346 | 12.3%), Retail Trade (329 | 11.7%), Professional & Scientific (285 | 10.2%), and Educational Services (270 | 9.6%).
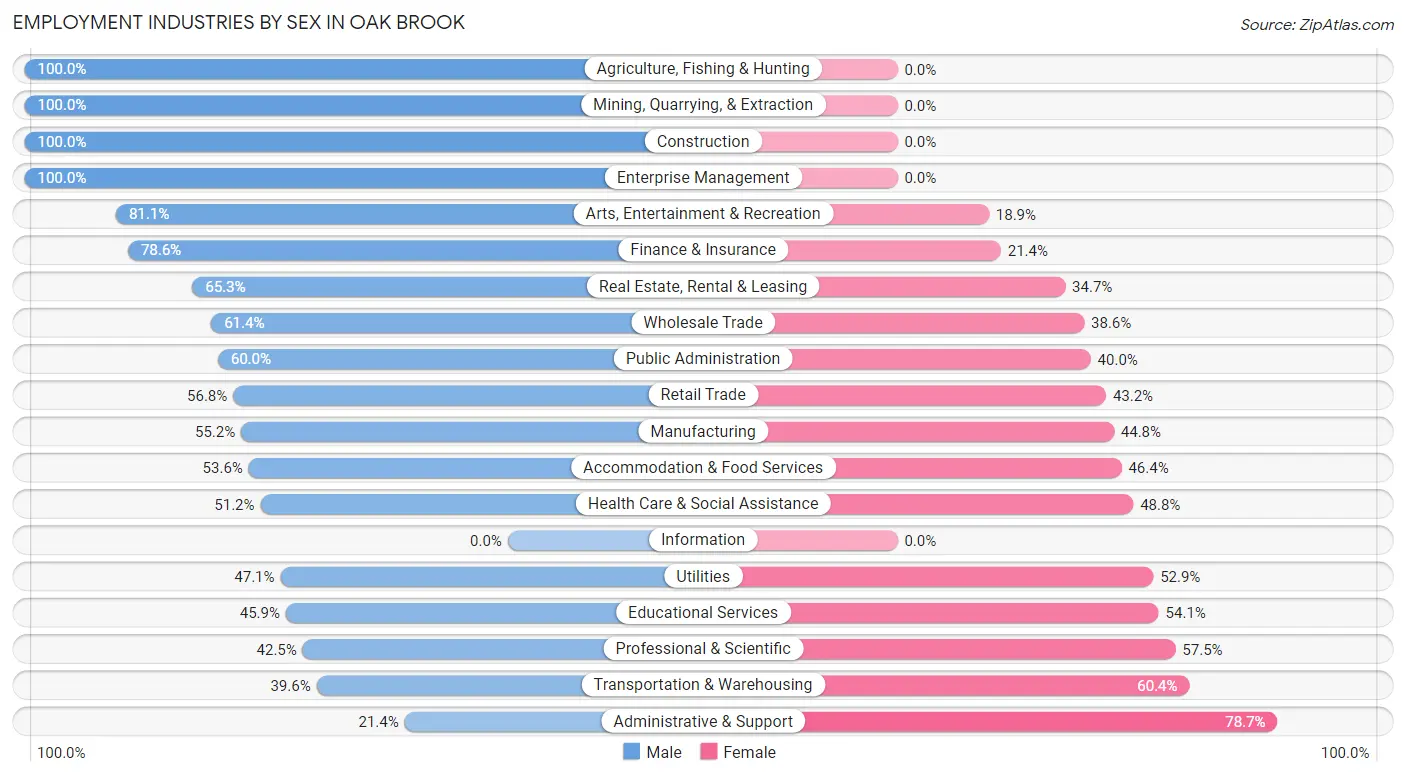
Employment Industries by Sex in Oak Brook
The Oak Brook industries that see more men than women are Agriculture, Fishing & Hunting (100.0%), Mining, Quarrying, & Extraction (100.0%), and Construction (100.0%), whereas the industries that tend to have a higher number of women are Administrative & Support (78.6%), Transportation & Warehousing (60.4%), and Professional & Scientific (57.5%).
| Industry | Male | Female |
| Agriculture, Fishing & Hunting | 13 (100.0%) | 0 (0.0%) |
| Mining, Quarrying, & Extraction | 12 (100.0%) | 0 (0.0%) |
| Construction | 20 (100.0%) | 0 (0.0%) |
| Manufacturing | 191 (55.2%) | 155 (44.8%) |
| Wholesale Trade | 54 (61.4%) | 34 (38.6%) |
| Retail Trade | 187 (56.8%) | 142 (43.2%) |
| Transportation & Warehousing | 19 (39.6%) | 29 (60.4%) |
| Utilities | 32 (47.1%) | 36 (52.9%) |
| Information | 0 (0.0%) | 0 (0.0%) |
| Finance & Insurance | 202 (78.6%) | 55 (21.4%) |
| Real Estate, Rental & Leasing | 47 (65.3%) | 25 (34.7%) |
| Professional & Scientific | 121 (42.5%) | 164 (57.5%) |
| Enterprise Management | 10 (100.0%) | 0 (0.0%) |
| Administrative & Support | 19 (21.3%) | 70 (78.6%) |
| Educational Services | 124 (45.9%) | 146 (54.1%) |
| Health Care & Social Assistance | 383 (51.2%) | 365 (48.8%) |
| Arts, Entertainment & Recreation | 30 (81.1%) | 7 (18.9%) |
| Accommodation & Food Services | 37 (53.6%) | 32 (46.4%) |
| Public Administration | 9 (60.0%) | 6 (40.0%) |
| Total | 1,539 (54.9%) | 1,266 (45.1%) |
Education in Oak Brook
School Enrollment in Oak Brook
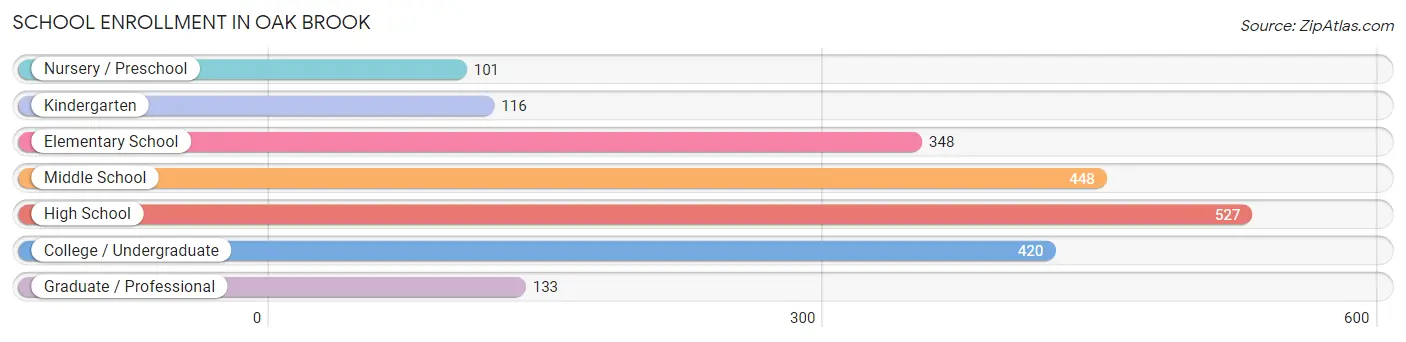
The most common levels of schooling among the 2,093 students in Oak Brook are high school (527 | 25.2%), middle school (448 | 21.4%), and college / undergraduate (420 | 20.1%).
| School Level | # Students | % Students |
| Nursery / Preschool | 101 | 4.8% |
| Kindergarten | 116 | 5.5% |
| Elementary School | 348 | 16.6% |
| Middle School | 448 | 21.4% |
| High School | 527 | 25.2% |
| College / Undergraduate | 420 | 20.1% |
| Graduate / Professional | 133 | 6.4% |
| Total | 2,093 | 100.0% |
School Enrollment by Age by Funding Source in Oak Brook
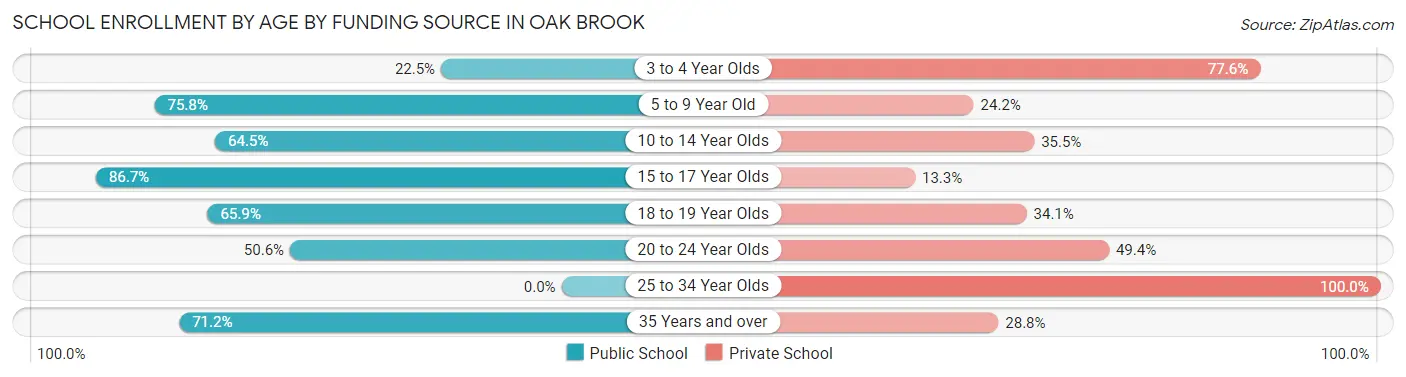
Out of a total of 2,093 students who are enrolled in schools in Oak Brook, 712 (34.0%) attend a private institution, while the remaining 1,381 (66.0%) are enrolled in public schools. The age group of 25 to 34 year olds has the highest likelihood of being enrolled in private schools, with 19 (100.0% in the age bracket) enrolled. Conversely, the age group of 15 to 17 year olds has the lowest likelihood of being enrolled in a private school, with 287 (86.7% in the age bracket) attending a public institution.
| Age Bracket | Public School | Private School |
| 3 to 4 Year Olds | 22 (22.5%) | 76 (77.5%) |
| 5 to 9 Year Old | 335 (75.8%) | 107 (24.2%) |
| 10 to 14 Year Olds | 418 (64.5%) | 230 (35.5%) |
| 15 to 17 Year Olds | 287 (86.7%) | 44 (13.3%) |
| 18 to 19 Year Olds | 60 (65.9%) | 31 (34.1%) |
| 20 to 24 Year Olds | 175 (50.6%) | 171 (49.4%) |
| 25 to 34 Year Olds | 0 (0.0%) | 19 (100.0%) |
| 35 Years and over | 84 (71.2%) | 34 (28.8%) |
| Total | 1,381 (66.0%) | 712 (34.0%) |
Educational Attainment by Field of Study in Oak Brook
Business (793 | 19.3%), bio, nature & agricultural (490 | 11.9%), science & technology (438 | 10.6%), social sciences (431 | 10.5%), and education (421 | 10.2%) are the most common fields of study among 4,115 individuals in Oak Brook who have obtained a bachelor's degree or higher.
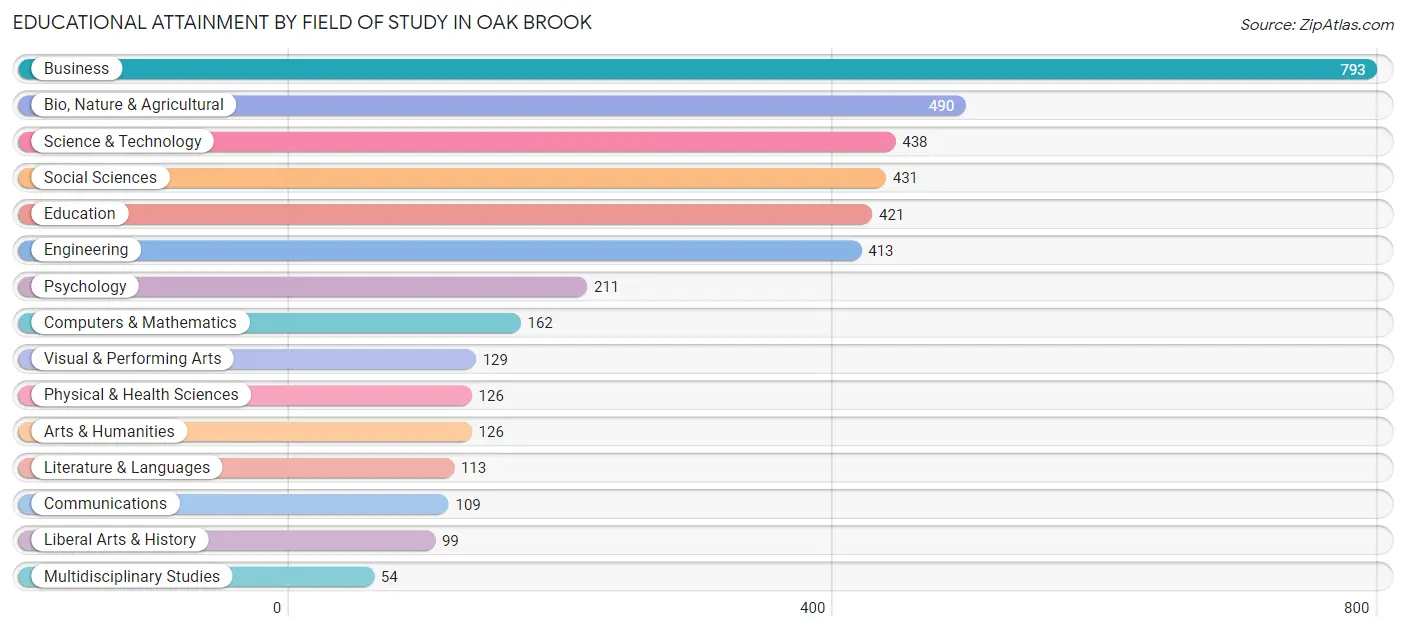
| Field of Study | # Graduates | % Graduates |
| Computers & Mathematics | 162 | 3.9% |
| Bio, Nature & Agricultural | 490 | 11.9% |
| Physical & Health Sciences | 126 | 3.1% |
| Psychology | 211 | 5.1% |
| Social Sciences | 431 | 10.5% |
| Engineering | 413 | 10.0% |
| Multidisciplinary Studies | 54 | 1.3% |
| Science & Technology | 438 | 10.6% |
| Business | 793 | 19.3% |
| Education | 421 | 10.2% |
| Literature & Languages | 113 | 2.8% |
| Liberal Arts & History | 99 | 2.4% |
| Visual & Performing Arts | 129 | 3.1% |
| Communications | 109 | 2.6% |
| Arts & Humanities | 126 | 3.1% |
| Total | 4,115 | 100.0% |
Transportation & Commute in Oak Brook
Vehicle Availability by Sex in Oak Brook
The most prevalent vehicle ownership categories in Oak Brook are males with 2 vehicles (713, accounting for 46.9%) and females with 2 vehicles (548, making up 57.3%).
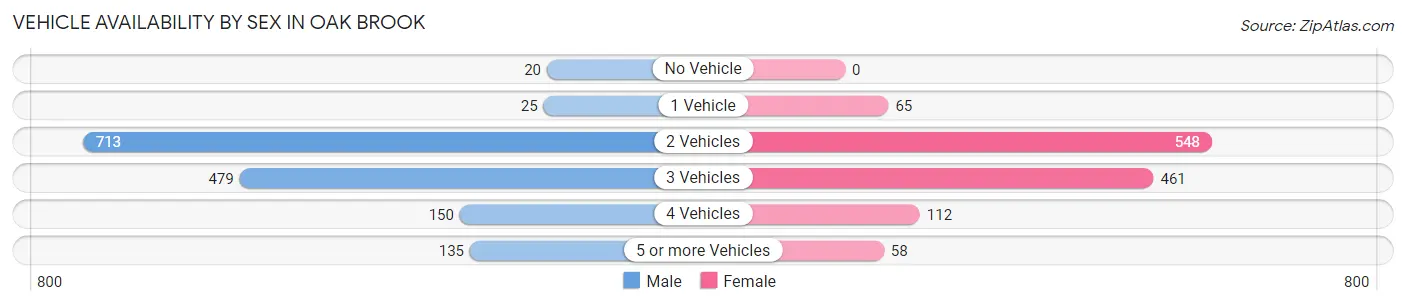
| Vehicles Available | Male | Female |
| No Vehicle | 20 (1.3%) | 0 (0.0%) |
| 1 Vehicle | 25 (1.6%) | 65 (5.2%) |
| 2 Vehicles | 713 (46.9%) | 548 (44.1%) |
| 3 Vehicles | 479 (31.5%) | 461 (37.1%) |
| 4 Vehicles | 150 (9.9%) | 112 (9.0%) |
| 5 or more Vehicles | 135 (8.9%) | 58 (4.7%) |
| Total | 1,522 (100.0%) | 1,244 (100.0%) |
Commute Time in Oak Brook
The most frequently occuring commute durations in Oak Brook are 15 to 19 minutes (392 commuters, 16.9%), 20 to 24 minutes (334 commuters, 14.4%), and 30 to 34 minutes (317 commuters, 13.6%).
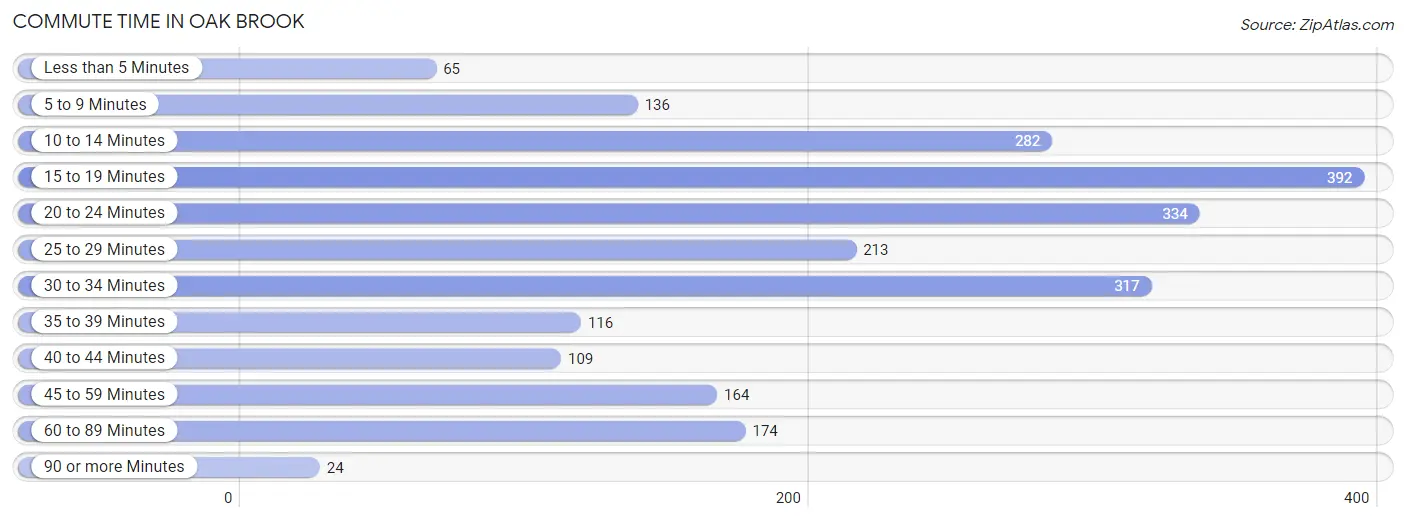
| Commute Time | # Commuters | % Commuters |
| Less than 5 Minutes | 65 | 2.8% |
| 5 to 9 Minutes | 136 | 5.9% |
| 10 to 14 Minutes | 282 | 12.1% |
| 15 to 19 Minutes | 392 | 16.9% |
| 20 to 24 Minutes | 334 | 14.4% |
| 25 to 29 Minutes | 213 | 9.2% |
| 30 to 34 Minutes | 317 | 13.6% |
| 35 to 39 Minutes | 116 | 5.0% |
| 40 to 44 Minutes | 109 | 4.7% |
| 45 to 59 Minutes | 164 | 7.0% |
| 60 to 89 Minutes | 174 | 7.5% |
| 90 or more Minutes | 24 | 1.0% |
Commute Time by Sex in Oak Brook
The most common commute times in Oak Brook are 20 to 24 minutes (244 commuters, 20.2%) for males and 15 to 19 minutes (205 commuters, 18.3%) for females.
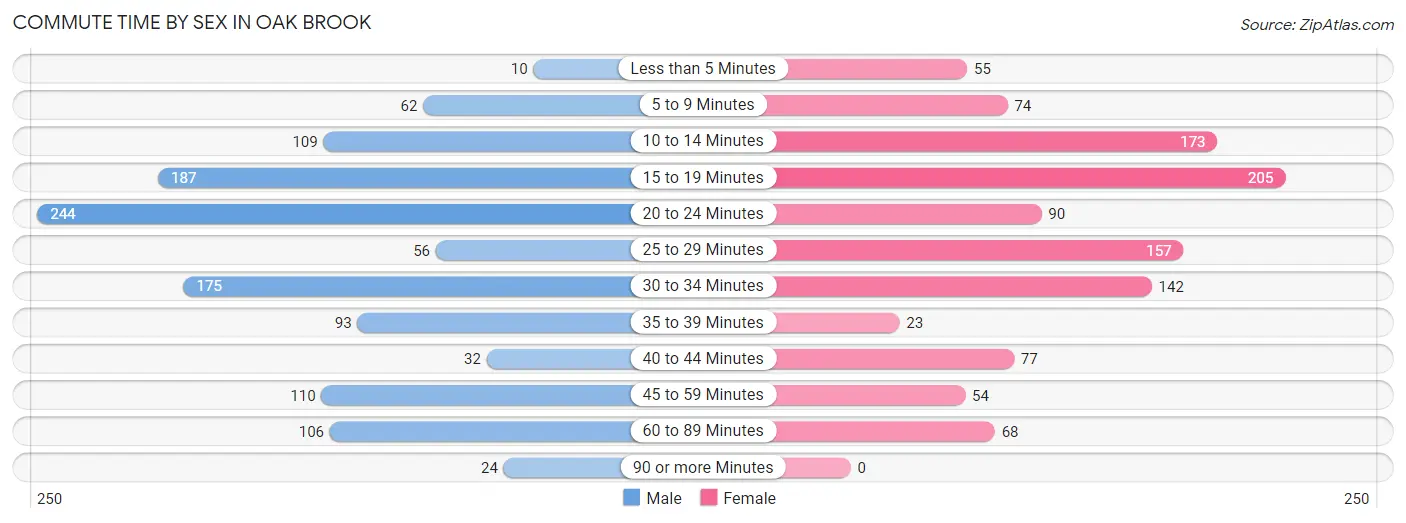
| Commute Time | Male | Female |
| Less than 5 Minutes | 10 (0.8%) | 55 (4.9%) |
| 5 to 9 Minutes | 62 (5.1%) | 74 (6.6%) |
| 10 to 14 Minutes | 109 (9.0%) | 173 (15.5%) |
| 15 to 19 Minutes | 187 (15.5%) | 205 (18.3%) |
| 20 to 24 Minutes | 244 (20.2%) | 90 (8.1%) |
| 25 to 29 Minutes | 56 (4.6%) | 157 (14.0%) |
| 30 to 34 Minutes | 175 (14.5%) | 142 (12.7%) |
| 35 to 39 Minutes | 93 (7.7%) | 23 (2.1%) |
| 40 to 44 Minutes | 32 (2.6%) | 77 (6.9%) |
| 45 to 59 Minutes | 110 (9.1%) | 54 (4.8%) |
| 60 to 89 Minutes | 106 (8.8%) | 68 (6.1%) |
| 90 or more Minutes | 24 (2.0%) | 0 (0.0%) |
Time of Departure to Work by Sex in Oak Brook
The most frequent times of departure to work in Oak Brook are 7:00 AM to 7:29 AM (202, 16.7%) for males and 8:00 AM to 8:29 AM (254, 22.7%) for females.
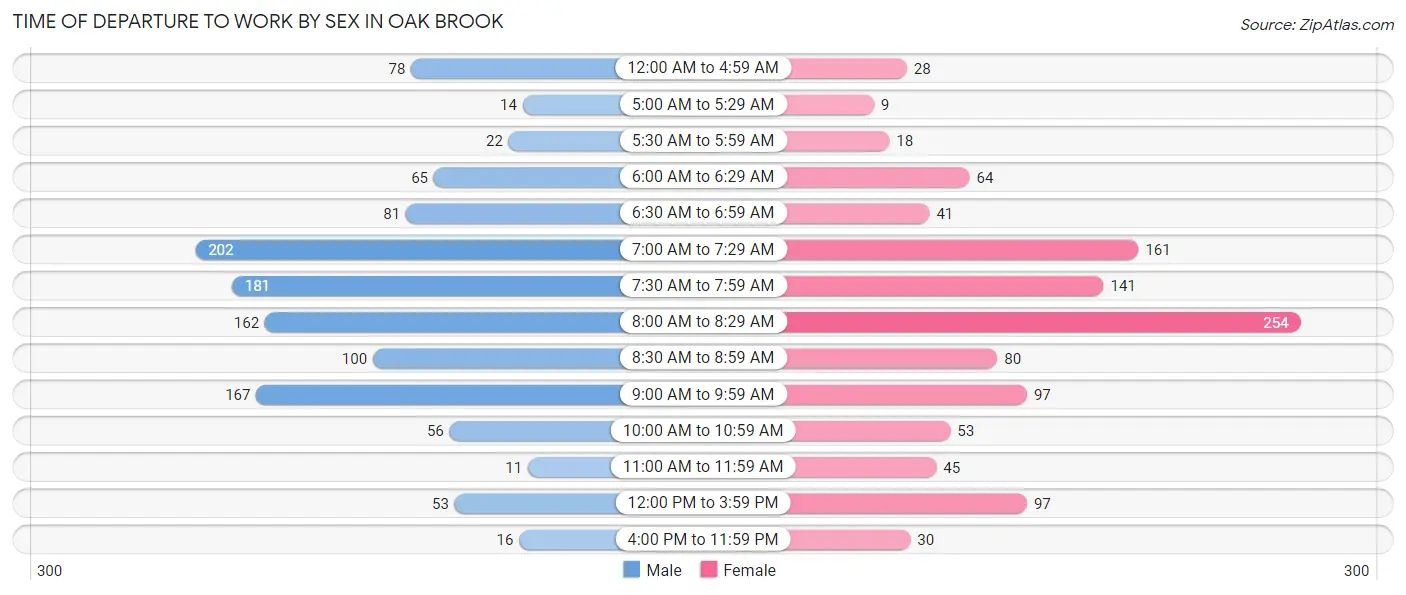
| Time of Departure | Male | Female |
| 12:00 AM to 4:59 AM | 78 (6.5%) | 28 (2.5%) |
| 5:00 AM to 5:29 AM | 14 (1.2%) | 9 (0.8%) |
| 5:30 AM to 5:59 AM | 22 (1.8%) | 18 (1.6%) |
| 6:00 AM to 6:29 AM | 65 (5.4%) | 64 (5.7%) |
| 6:30 AM to 6:59 AM | 81 (6.7%) | 41 (3.7%) |
| 7:00 AM to 7:29 AM | 202 (16.7%) | 161 (14.4%) |
| 7:30 AM to 7:59 AM | 181 (15.0%) | 141 (12.6%) |
| 8:00 AM to 8:29 AM | 162 (13.4%) | 254 (22.7%) |
| 8:30 AM to 8:59 AM | 100 (8.3%) | 80 (7.2%) |
| 9:00 AM to 9:59 AM | 167 (13.8%) | 97 (8.7%) |
| 10:00 AM to 10:59 AM | 56 (4.6%) | 53 (4.7%) |
| 11:00 AM to 11:59 AM | 11 (0.9%) | 45 (4.0%) |
| 12:00 PM to 3:59 PM | 53 (4.4%) | 97 (8.7%) |
| 4:00 PM to 11:59 PM | 16 (1.3%) | 30 (2.7%) |
| Total | 1,208 (100.0%) | 1,118 (100.0%) |
Housing Occupancy in Oak Brook
Occupancy by Ownership in Oak Brook
Of the total 2,983 dwellings in Oak Brook, owner-occupied units account for 2,845 (95.4%), while renter-occupied units make up 138 (4.6%).
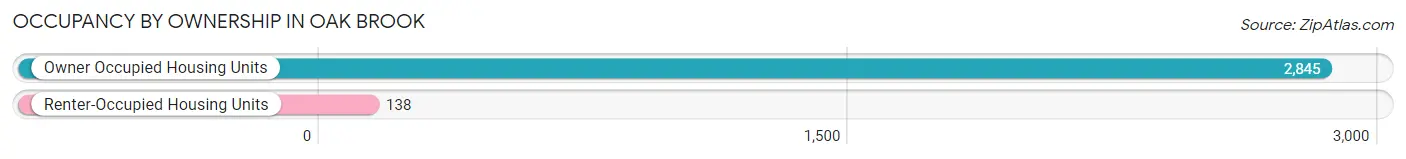
| Occupancy | # Housing Units | % Housing Units |
| Owner Occupied Housing Units | 2,845 | 95.4% |
| Renter-Occupied Housing Units | 138 | 4.6% |
| Total Occupied Housing Units | 2,983 | 100.0% |
Occupancy by Household Size in Oak Brook
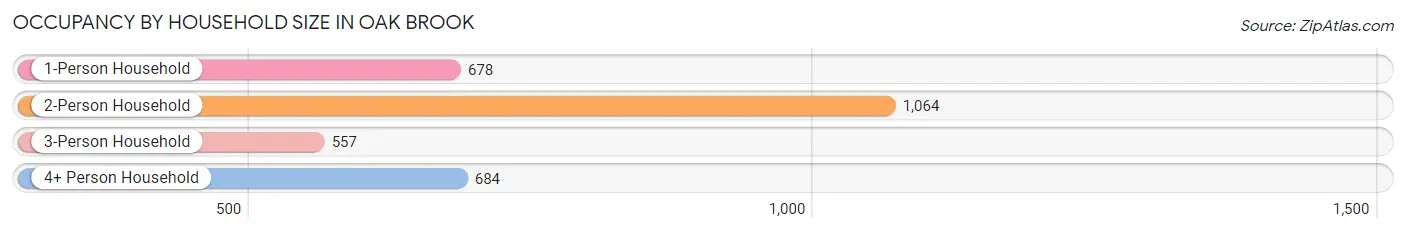
| Household Size | # Housing Units | % Housing Units |
| 1-Person Household | 678 | 22.7% |
| 2-Person Household | 1,064 | 35.7% |
| 3-Person Household | 557 | 18.7% |
| 4+ Person Household | 684 | 22.9% |
| Total Housing Units | 2,983 | 100.0% |
Occupancy by Ownership by Household Size in Oak Brook
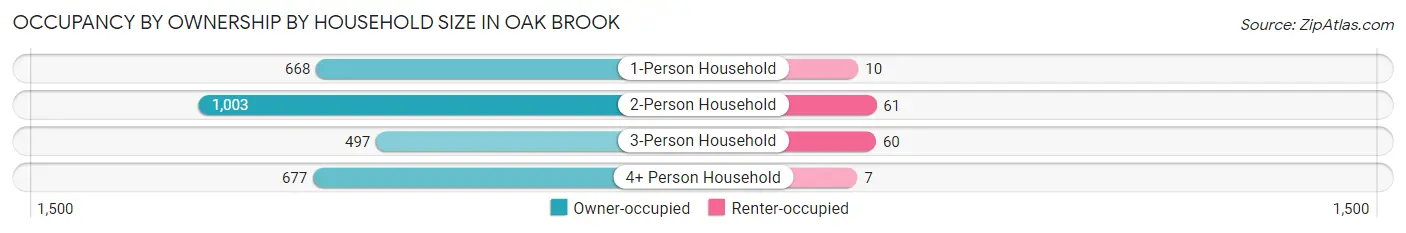
| Household Size | Owner-occupied | Renter-occupied |
| 1-Person Household | 668 (98.5%) | 10 (1.5%) |
| 2-Person Household | 1,003 (94.3%) | 61 (5.7%) |
| 3-Person Household | 497 (89.2%) | 60 (10.8%) |
| 4+ Person Household | 677 (99.0%) | 7 (1.0%) |
| Total Housing Units | 2,845 (95.4%) | 138 (4.6%) |
Occupancy by Educational Attainment in Oak Brook
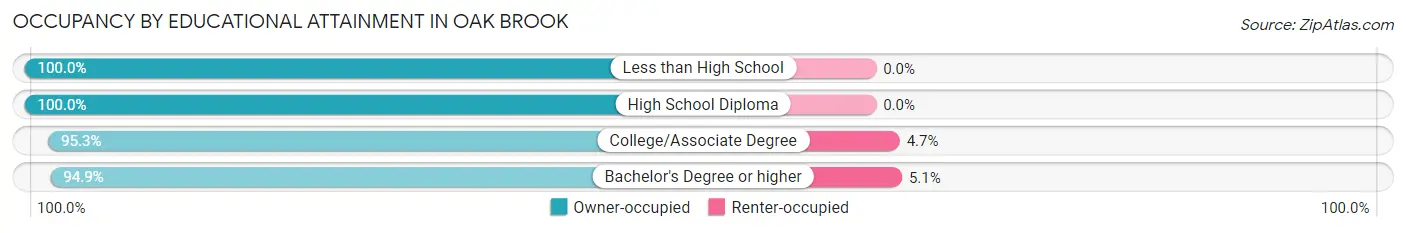
| Household Size | Owner-occupied | Renter-occupied |
| Less than High School | 67 (100.0%) | 0 (0.0%) |
| High School Diploma | 175 (100.0%) | 0 (0.0%) |
| College/Associate Degree | 470 (95.3%) | 23 (4.7%) |
| Bachelor's Degree or higher | 2,133 (94.9%) | 115 (5.1%) |
Occupancy by Age of Householder in Oak Brook
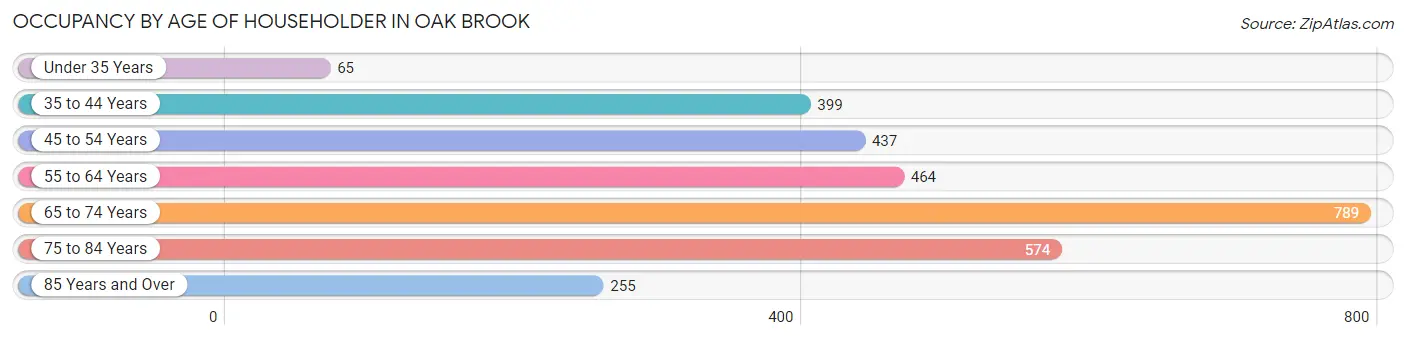
| Age Bracket | # Households | % Households |
| Under 35 Years | 65 | 2.2% |
| 35 to 44 Years | 399 | 13.4% |
| 45 to 54 Years | 437 | 14.6% |
| 55 to 64 Years | 464 | 15.5% |
| 65 to 74 Years | 789 | 26.5% |
| 75 to 84 Years | 574 | 19.2% |
| 85 Years and Over | 255 | 8.6% |
| Total | 2,983 | 100.0% |
Housing Finances in Oak Brook
Median Income by Occupancy in Oak Brook
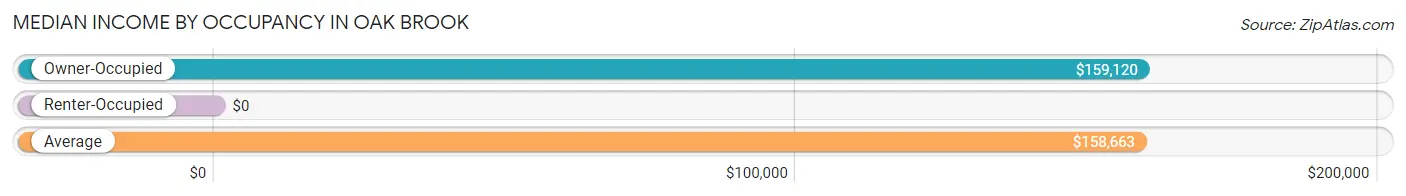
| Occupancy Type | # Households | Median Income |
| Owner-Occupied | 2,845 (95.4%) | $159,120 |
| Renter-Occupied | 138 (4.6%) | $0 |
| Average | 2,983 (100.0%) | $158,663 |
Occupancy by Householder Income Bracket in Oak Brook
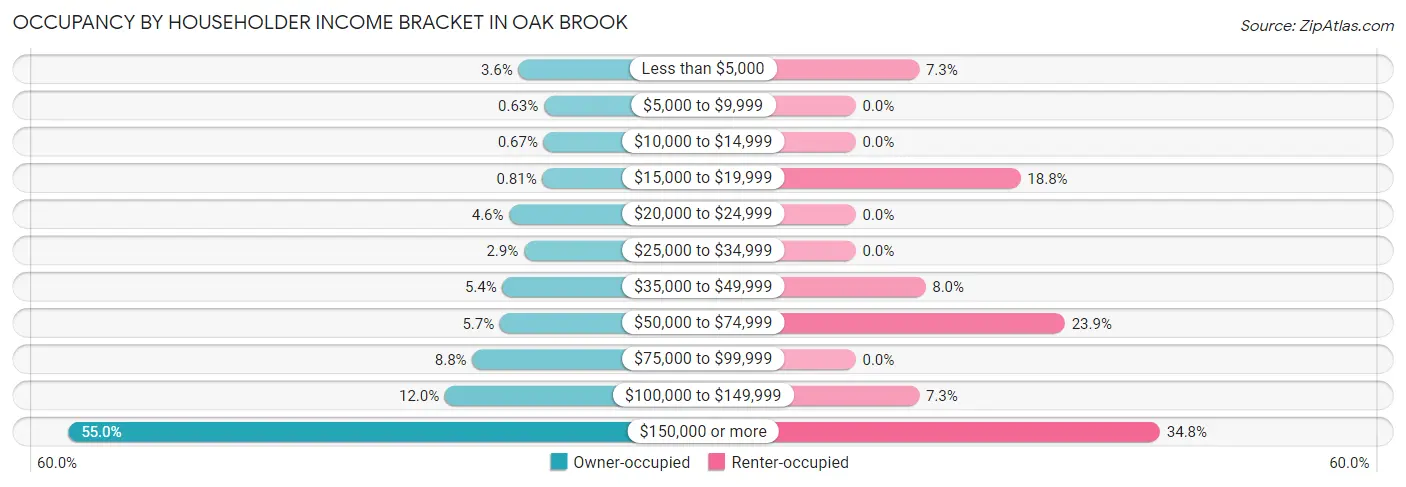
| Income Bracket | Owner-occupied | Renter-occupied |
| Less than $5,000 | 101 (3.5%) | 10 (7.2%) |
| $5,000 to $9,999 | 18 (0.6%) | 0 (0.0%) |
| $10,000 to $14,999 | 19 (0.7%) | 0 (0.0%) |
| $15,000 to $19,999 | 23 (0.8%) | 26 (18.8%) |
| $20,000 to $24,999 | 131 (4.6%) | 0 (0.0%) |
| $25,000 to $34,999 | 83 (2.9%) | 0 (0.0%) |
| $35,000 to $49,999 | 153 (5.4%) | 11 (8.0%) |
| $50,000 to $74,999 | 161 (5.7%) | 33 (23.9%) |
| $75,000 to $99,999 | 251 (8.8%) | 0 (0.0%) |
| $100,000 to $149,999 | 340 (11.9%) | 10 (7.2%) |
| $150,000 or more | 1,565 (55.0%) | 48 (34.8%) |
| Total | 2,845 (100.0%) | 138 (100.0%) |
Monthly Housing Cost Tiers in Oak Brook
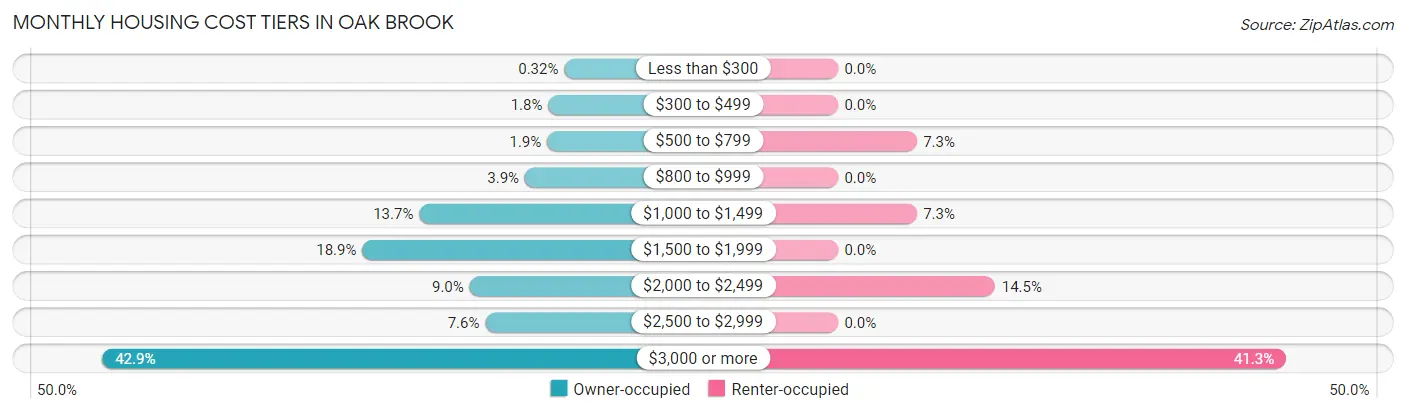
| Monthly Cost | Owner-occupied | Renter-occupied |
| Less than $300 | 9 (0.3%) | 0 (0.0%) |
| $300 to $499 | 51 (1.8%) | 0 (0.0%) |
| $500 to $799 | 54 (1.9%) | 10 (7.2%) |
| $800 to $999 | 112 (3.9%) | 0 (0.0%) |
| $1,000 to $1,499 | 389 (13.7%) | 10 (7.2%) |
| $1,500 to $1,999 | 538 (18.9%) | 0 (0.0%) |
| $2,000 to $2,499 | 257 (9.0%) | 20 (14.5%) |
| $2,500 to $2,999 | 216 (7.6%) | 0 (0.0%) |
| $3,000 or more | 1,219 (42.8%) | 57 (41.3%) |
| Total | 2,845 (100.0%) | 138 (100.0%) |
Physical Housing Characteristics in Oak Brook
Housing Structures in Oak Brook
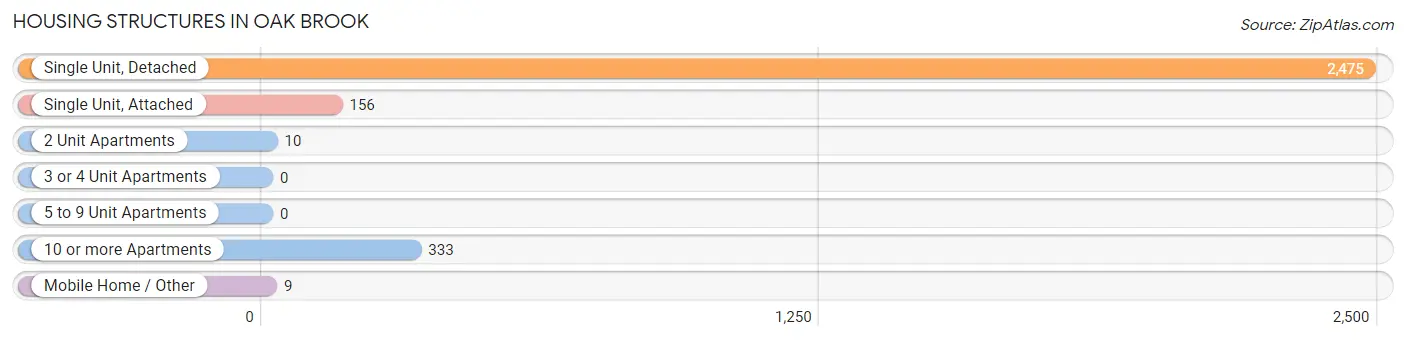
| Structure Type | # Housing Units | % Housing Units |
| Single Unit, Detached | 2,475 | 83.0% |
| Single Unit, Attached | 156 | 5.2% |
| 2 Unit Apartments | 10 | 0.3% |
| 3 or 4 Unit Apartments | 0 | 0.0% |
| 5 to 9 Unit Apartments | 0 | 0.0% |
| 10 or more Apartments | 333 | 11.2% |
| Mobile Home / Other | 9 | 0.3% |
| Total | 2,983 | 100.0% |
Housing Structures by Occupancy in Oak Brook
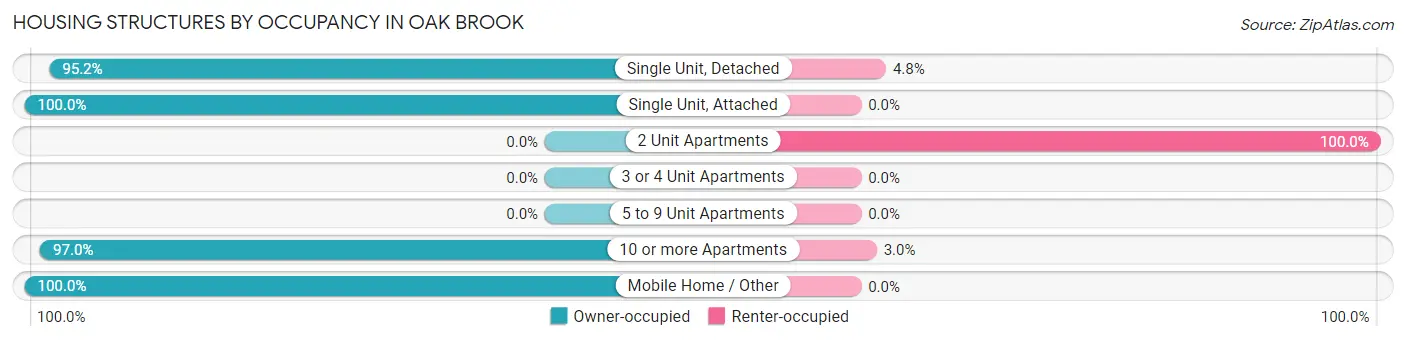
| Structure Type | Owner-occupied | Renter-occupied |
| Single Unit, Detached | 2,357 (95.2%) | 118 (4.8%) |
| Single Unit, Attached | 156 (100.0%) | 0 (0.0%) |
| 2 Unit Apartments | 0 (0.0%) | 10 (100.0%) |
| 3 or 4 Unit Apartments | 0 (0.0%) | 0 (0.0%) |
| 5 to 9 Unit Apartments | 0 (0.0%) | 0 (0.0%) |
| 10 or more Apartments | 323 (97.0%) | 10 (3.0%) |
| Mobile Home / Other | 9 (100.0%) | 0 (0.0%) |
| Total | 2,845 (95.4%) | 138 (4.6%) |
Housing Structures by Number of Rooms in Oak Brook
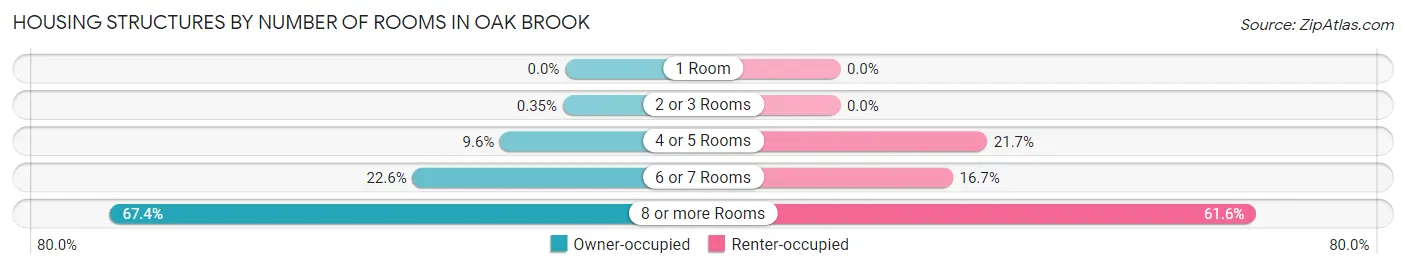
| Number of Rooms | Owner-occupied | Renter-occupied |
| 1 Room | 0 (0.0%) | 0 (0.0%) |
| 2 or 3 Rooms | 10 (0.4%) | 0 (0.0%) |
| 4 or 5 Rooms | 274 (9.6%) | 30 (21.7%) |
| 6 or 7 Rooms | 643 (22.6%) | 23 (16.7%) |
| 8 or more Rooms | 1,918 (67.4%) | 85 (61.6%) |
| Total | 2,845 (100.0%) | 138 (100.0%) |
Housing Structure by Heating Type in Oak Brook
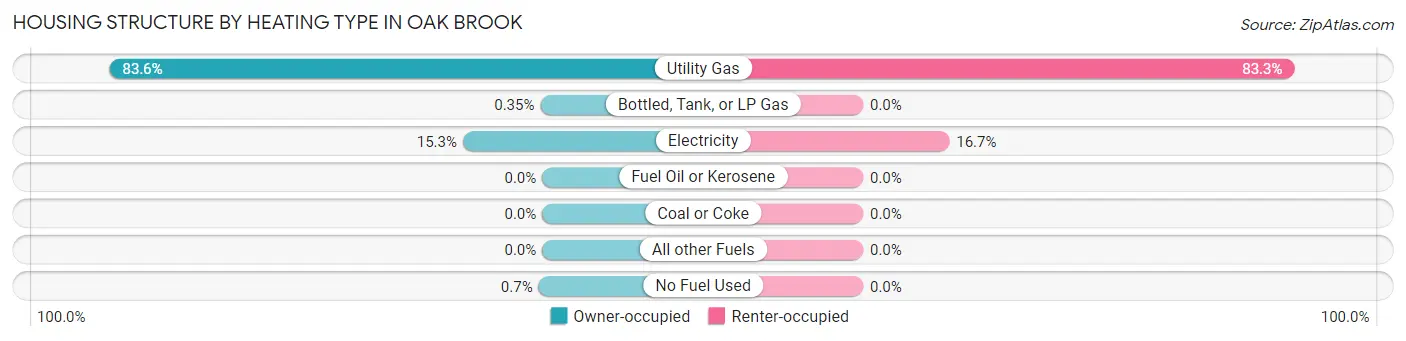
| Heating Type | Owner-occupied | Renter-occupied |
| Utility Gas | 2,379 (83.6%) | 115 (83.3%) |
| Bottled, Tank, or LP Gas | 10 (0.4%) | 0 (0.0%) |
| Electricity | 436 (15.3%) | 23 (16.7%) |
| Fuel Oil or Kerosene | 0 (0.0%) | 0 (0.0%) |
| Coal or Coke | 0 (0.0%) | 0 (0.0%) |
| All other Fuels | 0 (0.0%) | 0 (0.0%) |
| No Fuel Used | 20 (0.7%) | 0 (0.0%) |
| Total | 2,845 (100.0%) | 138 (100.0%) |
Household Vehicle Usage in Oak Brook
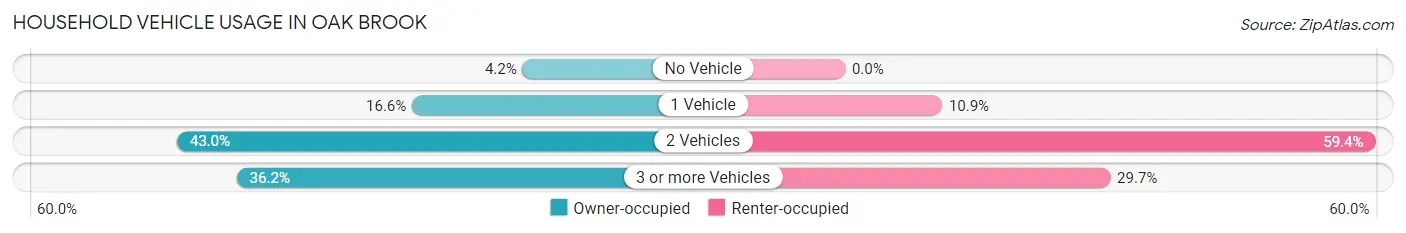
| Vehicles per Household | Owner-occupied | Renter-occupied |
| No Vehicle | 120 (4.2%) | 0 (0.0%) |
| 1 Vehicle | 472 (16.6%) | 15 (10.9%) |
| 2 Vehicles | 1,222 (42.9%) | 82 (59.4%) |
| 3 or more Vehicles | 1,031 (36.2%) | 41 (29.7%) |
| Total | 2,845 (100.0%) | 138 (100.0%) |
Real Estate & Mortgages in Oak Brook
Real Estate and Mortgage Overview in Oak Brook
| Characteristic | Without Mortgage | With Mortgage |
| Housing Units | 1,390 | 1,455 |
| Median Property Value | $821,400 | $829,000 |
| Median Household Income | $158,737 | $784 |
| Monthly Housing Costs | $1,501 | $1,114 |
| Real Estate Taxes | $10,001 | $0 |
Property Value by Mortgage Status in Oak Brook
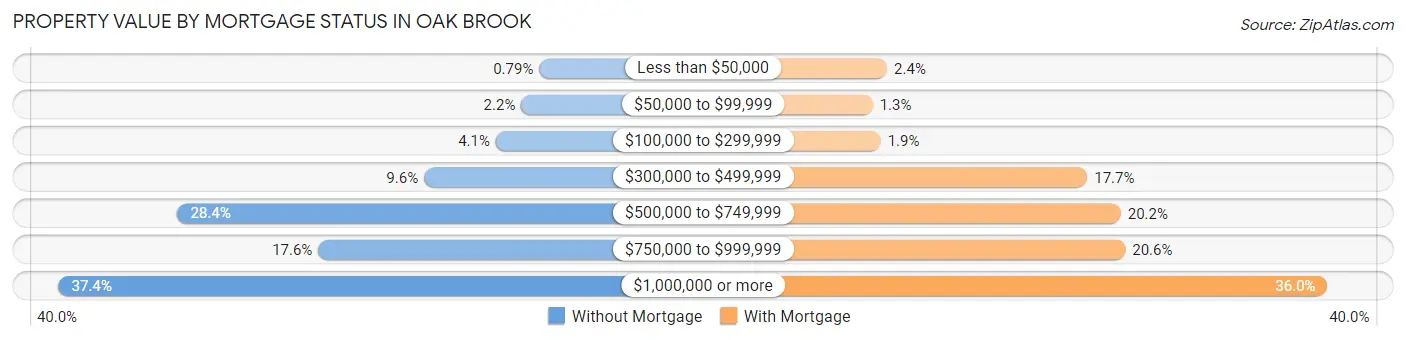
| Property Value | Without Mortgage | With Mortgage |
| Less than $50,000 | 11 (0.8%) | 35 (2.4%) |
| $50,000 to $99,999 | 30 (2.2%) | 19 (1.3%) |
| $100,000 to $299,999 | 57 (4.1%) | 28 (1.9%) |
| $300,000 to $499,999 | 133 (9.6%) | 257 (17.7%) |
| $500,000 to $749,999 | 394 (28.3%) | 294 (20.2%) |
| $750,000 to $999,999 | 245 (17.6%) | 299 (20.5%) |
| $1,000,000 or more | 520 (37.4%) | 523 (35.9%) |
| Total | 1,390 (100.0%) | 1,455 (100.0%) |
Household Income by Mortgage Status in Oak Brook
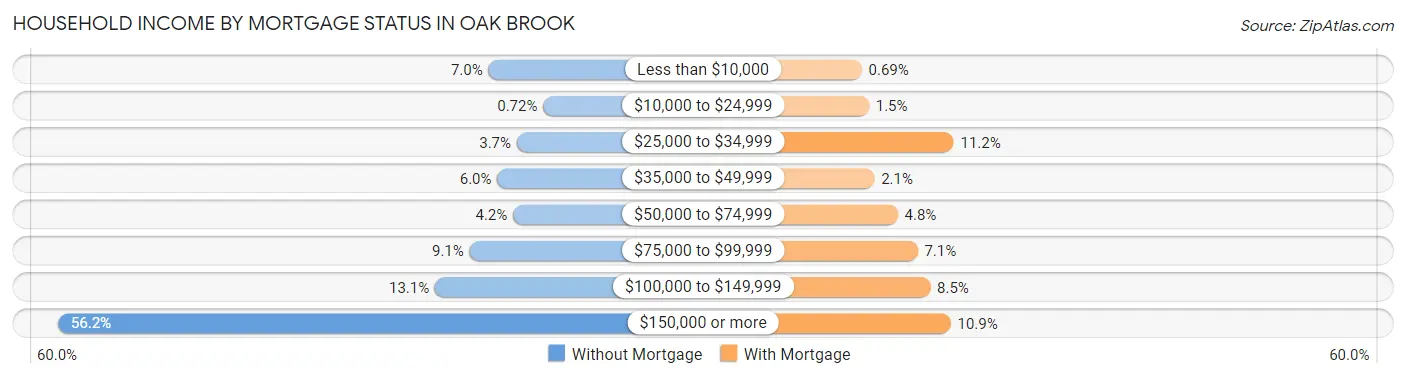
| Household Income | Without Mortgage | With Mortgage |
| Less than $10,000 | 97 (7.0%) | 10 (0.7%) |
| $10,000 to $24,999 | 10 (0.7%) | 22 (1.5%) |
| $25,000 to $34,999 | 52 (3.7%) | 163 (11.2%) |
| $35,000 to $49,999 | 83 (6.0%) | 31 (2.1%) |
| $50,000 to $74,999 | 58 (4.2%) | 70 (4.8%) |
| $75,000 to $99,999 | 127 (9.1%) | 103 (7.1%) |
| $100,000 to $149,999 | 182 (13.1%) | 124 (8.5%) |
| $150,000 or more | 781 (56.2%) | 158 (10.9%) |
| Total | 1,390 (100.0%) | 1,455 (100.0%) |
Property Value to Household Income Ratio in Oak Brook
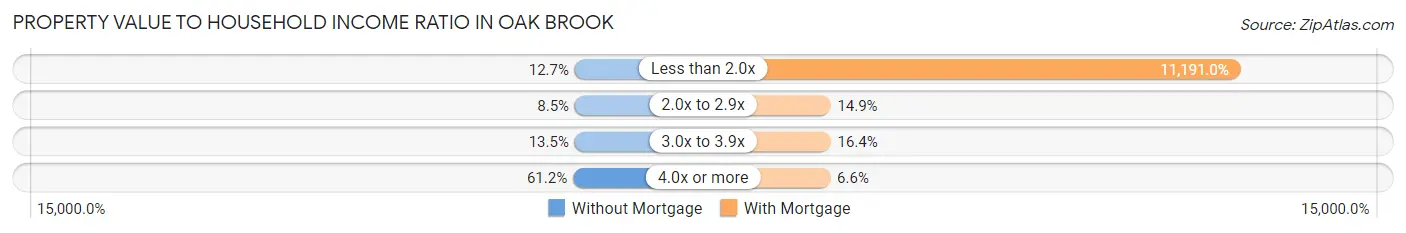
| Value-to-Income Ratio | Without Mortgage | With Mortgage |
| Less than 2.0x | 176 (12.7%) | 162,829 (11,191.0%) |
| 2.0x to 2.9x | 118 (8.5%) | 216 (14.8%) |
| 3.0x to 3.9x | 188 (13.5%) | 239 (16.4%) |
| 4.0x or more | 851 (61.2%) | 96 (6.6%) |
| Total | 1,390 (100.0%) | 1,455 (100.0%) |
Real Estate Taxes by Mortgage Status in Oak Brook
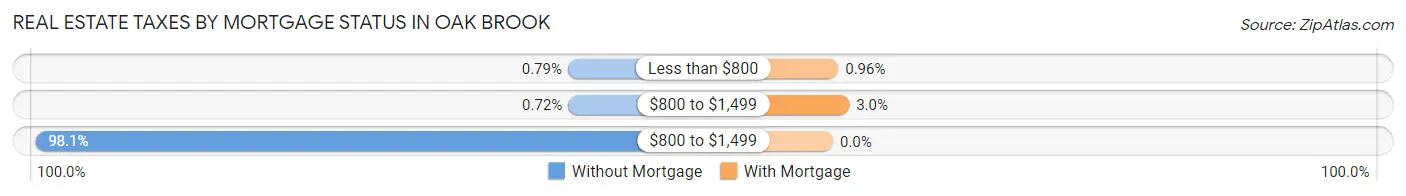
| Property Taxes | Without Mortgage | With Mortgage |
| Less than $800 | 11 (0.8%) | 14 (1.0%) |
| $800 to $1,499 | 10 (0.7%) | 43 (3.0%) |
| $800 to $1,499 | 1,363 (98.1%) | 0 (0.0%) |
| Total | 1,390 (100.0%) | 1,455 (100.0%) |
Health & Disability in Oak Brook
Health Insurance Coverage by Age in Oak Brook
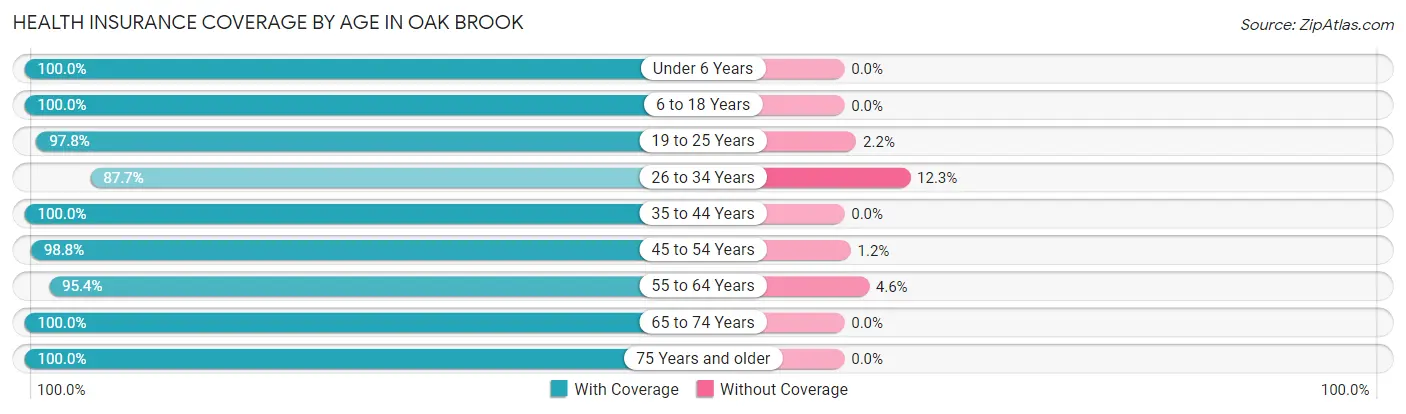
| Age Bracket | With Coverage | Without Coverage |
| Under 6 Years | 450 (100.0%) | 0 (0.0%) |
| 6 to 18 Years | 1,391 (100.0%) | 0 (0.0%) |
| 19 to 25 Years | 575 (97.8%) | 13 (2.2%) |
| 26 to 34 Years | 193 (87.7%) | 27 (12.3%) |
| 35 to 44 Years | 806 (100.0%) | 0 (0.0%) |
| 45 to 54 Years | 845 (98.8%) | 10 (1.2%) |
| 55 to 64 Years | 916 (95.4%) | 44 (4.6%) |
| 65 to 74 Years | 1,375 (100.0%) | 0 (0.0%) |
| 75 Years and older | 1,328 (100.0%) | 0 (0.0%) |
| Total | 7,879 (98.8%) | 94 (1.2%) |
Health Insurance Coverage by Citizenship Status in Oak Brook
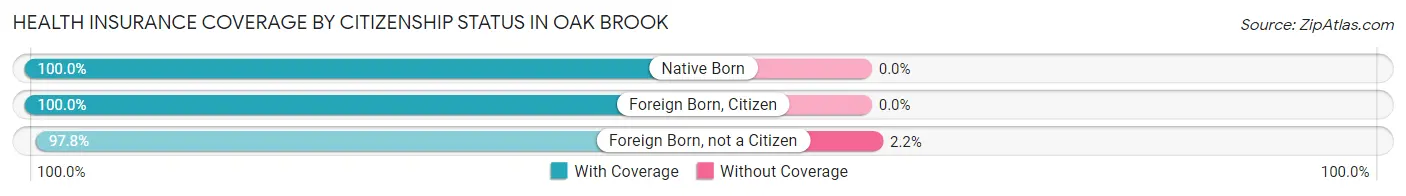
| Citizenship Status | With Coverage | Without Coverage |
| Native Born | 450 (100.0%) | 0 (0.0%) |
| Foreign Born, Citizen | 1,391 (100.0%) | 0 (0.0%) |
| Foreign Born, not a Citizen | 575 (97.8%) | 13 (2.2%) |
Health Insurance Coverage by Household Income in Oak Brook
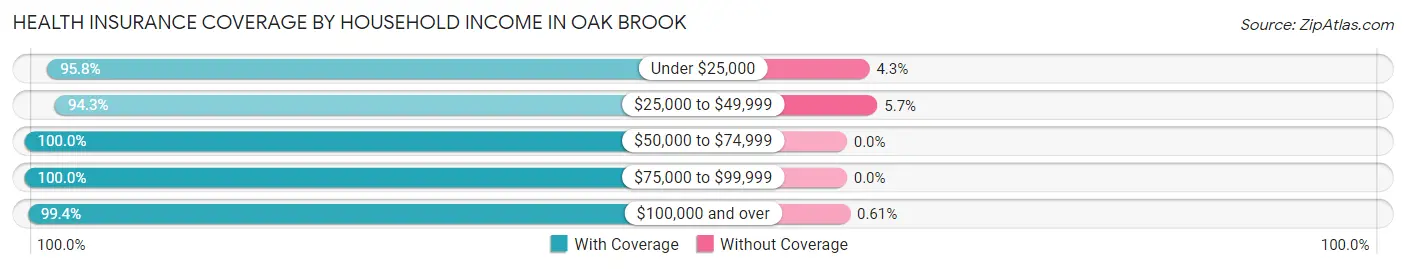
| Household Income | With Coverage | Without Coverage |
| Under $25,000 | 608 (95.8%) | 27 (4.3%) |
| $25,000 to $49,999 | 543 (94.3%) | 33 (5.7%) |
| $50,000 to $74,999 | 512 (100.0%) | 0 (0.0%) |
| $75,000 to $99,999 | 656 (100.0%) | 0 (0.0%) |
| $100,000 and over | 5,560 (99.4%) | 34 (0.6%) |
Public vs Private Health Insurance Coverage by Age in Oak Brook
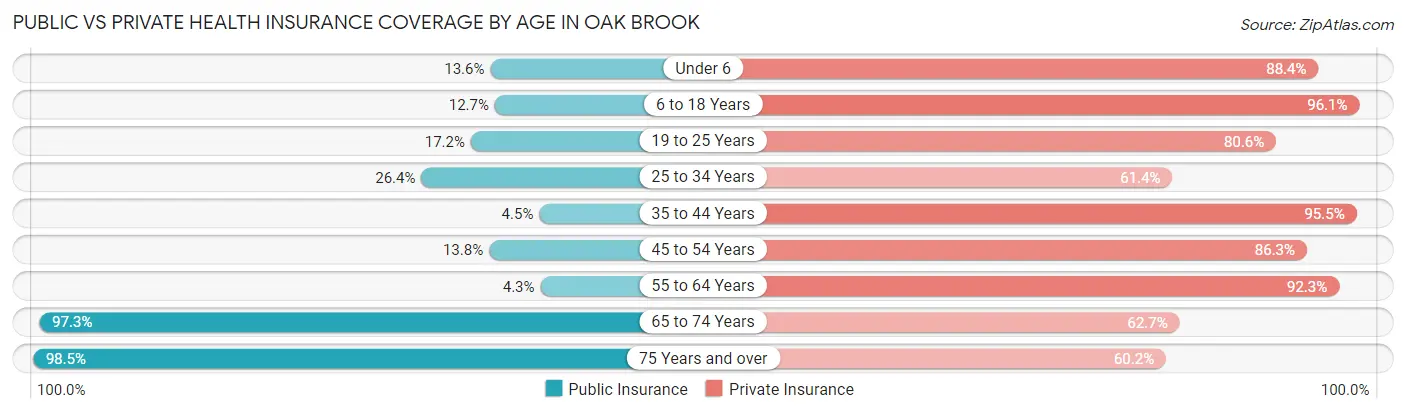
| Age Bracket | Public Insurance | Private Insurance |
| Under 6 | 61 (13.6%) | 398 (88.4%) |
| 6 to 18 Years | 177 (12.7%) | 1,336 (96.1%) |
| 19 to 25 Years | 101 (17.2%) | 474 (80.6%) |
| 25 to 34 Years | 58 (26.4%) | 135 (61.4%) |
| 35 to 44 Years | 36 (4.5%) | 770 (95.5%) |
| 45 to 54 Years | 118 (13.8%) | 738 (86.3%) |
| 55 to 64 Years | 41 (4.3%) | 886 (92.3%) |
| 65 to 74 Years | 1,338 (97.3%) | 862 (62.7%) |
| 75 Years and over | 1,308 (98.5%) | 799 (60.2%) |
| Total | 3,238 (40.6%) | 6,398 (80.2%) |
Disability Status by Sex by Age in Oak Brook
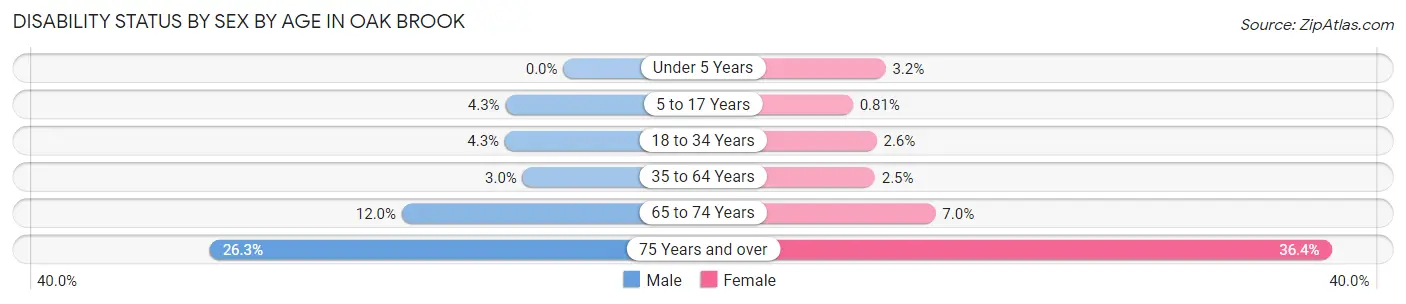
| Age Bracket | Male | Female |
| Under 5 Years | 0 (0.0%) | 7 (3.2%) |
| 5 to 17 Years | 26 (4.3%) | 7 (0.8%) |
| 18 to 34 Years | 20 (4.3%) | 10 (2.6%) |
| 35 to 64 Years | 41 (3.0%) | 31 (2.5%) |
| 65 to 74 Years | 82 (12.0%) | 48 (7.0%) |
| 75 Years and over | 137 (26.3%) | 293 (36.3%) |
Disability Class by Sex by Age in Oak Brook
Disability Class: Hearing Difficulty
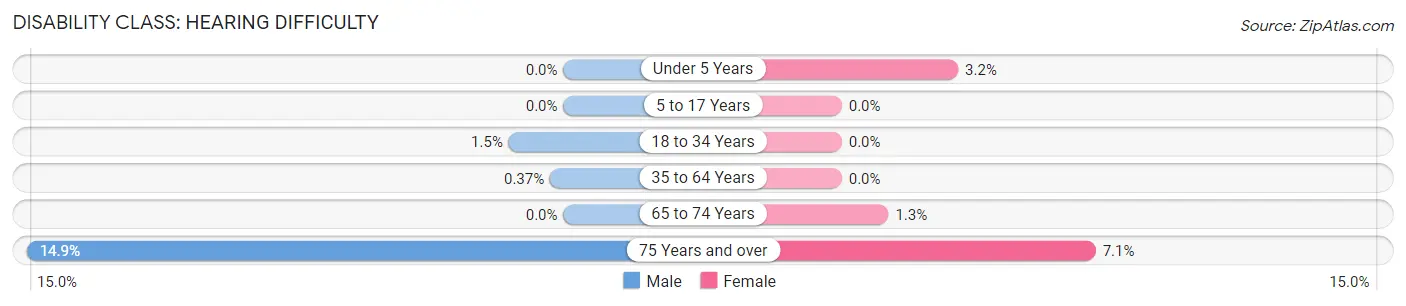
| Age Bracket | Male | Female |
| Under 5 Years | 0 (0.0%) | 7 (3.2%) |
| 5 to 17 Years | 0 (0.0%) | 0 (0.0%) |
| 18 to 34 Years | 7 (1.5%) | 0 (0.0%) |
| 35 to 64 Years | 5 (0.4%) | 0 (0.0%) |
| 65 to 74 Years | 0 (0.0%) | 9 (1.3%) |
| 75 Years and over | 78 (14.9%) | 57 (7.1%) |
Disability Class: Vision Difficulty
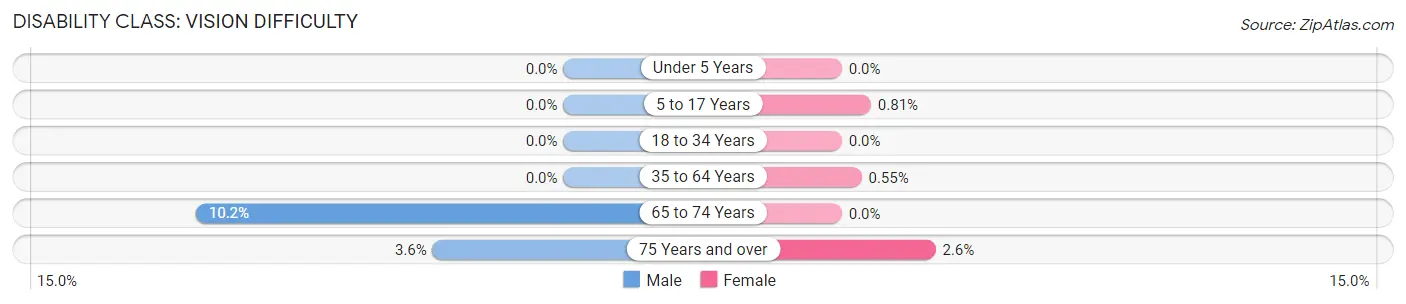
| Age Bracket | Male | Female |
| Under 5 Years | 0 (0.0%) | 0 (0.0%) |
| 5 to 17 Years | 0 (0.0%) | 7 (0.8%) |
| 18 to 34 Years | 0 (0.0%) | 0 (0.0%) |
| 35 to 64 Years | 0 (0.0%) | 7 (0.5%) |
| 65 to 74 Years | 70 (10.2%) | 0 (0.0%) |
| 75 Years and over | 19 (3.6%) | 21 (2.6%) |
Disability Class: Cognitive Difficulty
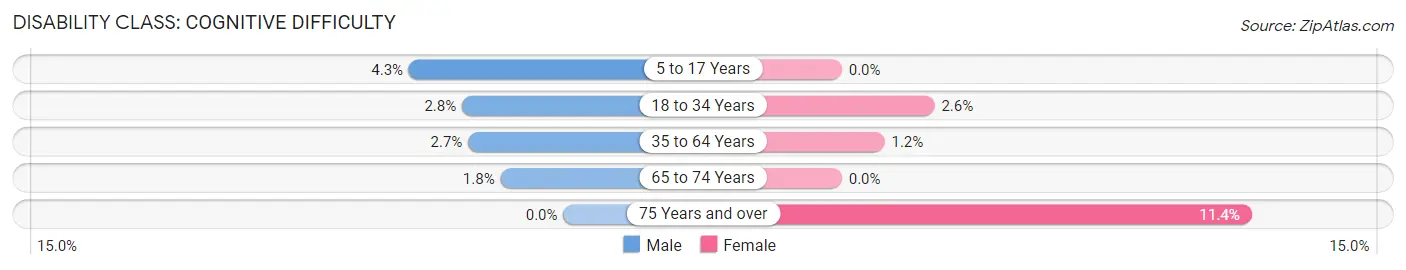
| Age Bracket | Male | Female |
| 5 to 17 Years | 26 (4.3%) | 0 (0.0%) |
| 18 to 34 Years | 13 (2.8%) | 10 (2.6%) |
| 35 to 64 Years | 36 (2.6%) | 15 (1.2%) |
| 65 to 74 Years | 12 (1.8%) | 0 (0.0%) |
| 75 Years and over | 0 (0.0%) | 92 (11.4%) |
Disability Class: Ambulatory Difficulty
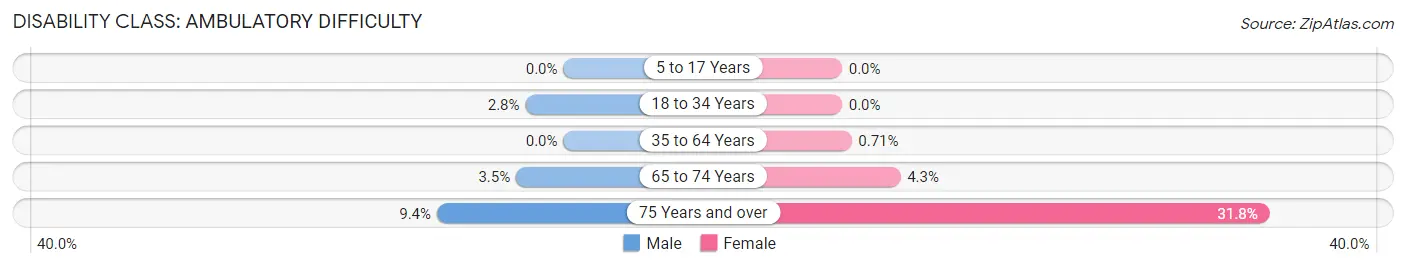
| Age Bracket | Male | Female |
| 5 to 17 Years | 0 (0.0%) | 0 (0.0%) |
| 18 to 34 Years | 13 (2.8%) | 0 (0.0%) |
| 35 to 64 Years | 0 (0.0%) | 9 (0.7%) |
| 65 to 74 Years | 24 (3.5%) | 30 (4.3%) |
| 75 Years and over | 49 (9.4%) | 256 (31.8%) |
Disability Class: Self-Care Difficulty
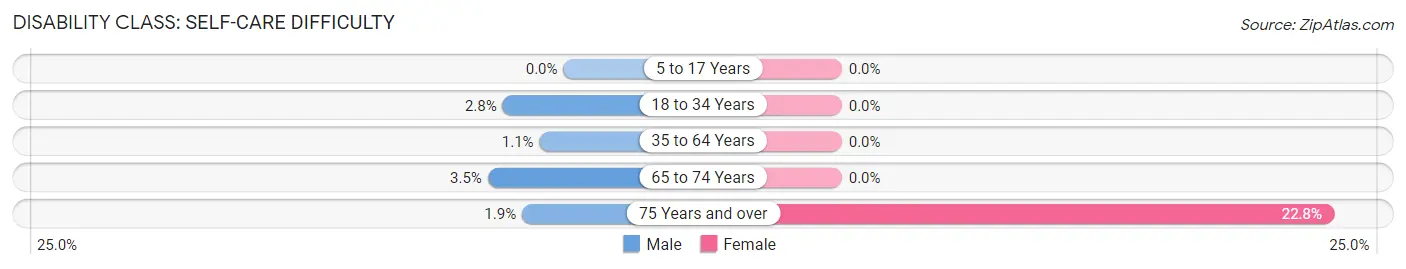
| Age Bracket | Male | Female |
| 5 to 17 Years | 0 (0.0%) | 0 (0.0%) |
| 18 to 34 Years | 13 (2.8%) | 0 (0.0%) |
| 35 to 64 Years | 15 (1.1%) | 0 (0.0%) |
| 65 to 74 Years | 24 (3.5%) | 0 (0.0%) |
| 75 Years and over | 10 (1.9%) | 184 (22.8%) |
Technology Access in Oak Brook
Computing Device Access in Oak Brook
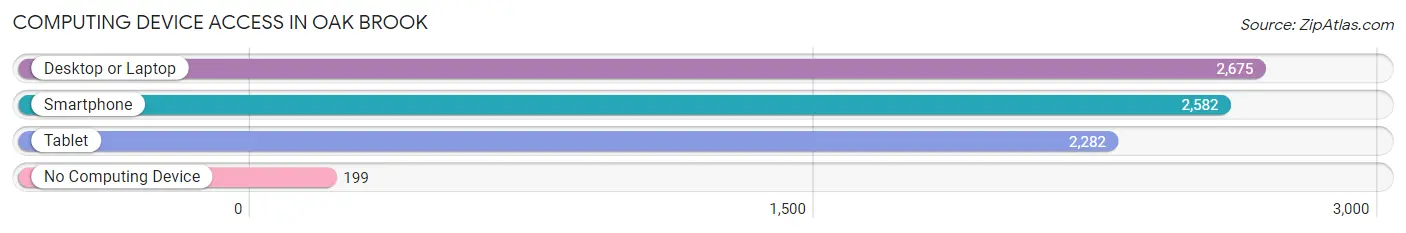
| Device Type | # Households | % Households |
| Desktop or Laptop | 2,675 | 89.7% |
| Smartphone | 2,582 | 86.6% |
| Tablet | 2,282 | 76.5% |
| No Computing Device | 199 | 6.7% |
| Total | 2,983 | 100.0% |
Internet Access in Oak Brook
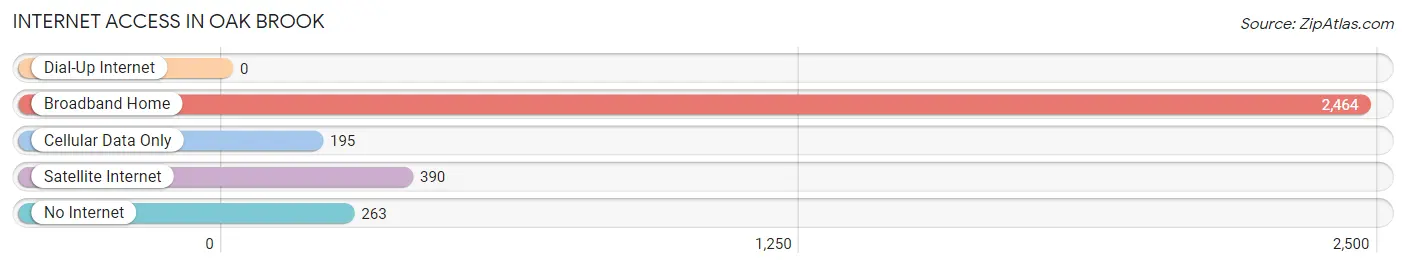
| Internet Type | # Households | % Households |
| Dial-Up Internet | 0 | 0.0% |
| Broadband Home | 2,464 | 82.6% |
| Cellular Data Only | 195 | 6.5% |
| Satellite Internet | 390 | 13.1% |
| No Internet | 263 | 8.8% |
| Total | 2,983 | 100.0% |
Oak Brook Summary
Oak Brook, Illinois is a village located in DuPage County, approximately 22 miles west of downtown Chicago. It is a wealthy, affluent suburb of Chicago, and is home to many corporate headquarters, including McDonald’s, Ace Hardware, and Blistex. The village has a population of 7,883 as of the 2010 census, and is known for its high quality of life and excellent schools.
History
The area that is now Oak Brook was originally inhabited by the Potawatomi Native American tribe. The first European settlers arrived in the area in the 1830s, and the village was officially incorporated in 1958. The village was named after the Oak Brook Creek, which runs through the area.
In the 1960s, Oak Brook became a popular destination for wealthy Chicagoans looking to escape the city. The village was home to many large estates, and was known for its high quality of life. In the 1970s, Oak Brook began to attract corporate headquarters, and the village quickly became a major business center.
Geography
Oak Brook is located in DuPage County, approximately 22 miles west of downtown Chicago. The village is bordered by the villages of Hinsdale, Elmhurst, and Oakbrook Terrace. The village is situated on the Oak Brook Creek, and is surrounded by rolling hills and wooded areas.
Economy
Oak Brook is home to many corporate headquarters, including McDonald’s, Ace Hardware, and Blistex. The village is also home to several shopping centers, including Oakbrook Center and Oakbrook Promenade. The village is also home to several golf courses, including the Oak Brook Golf Club and the Oak Brook Country Club.
Demographics
As of the 2010 census, Oak Brook had a population of 7,883. The racial makeup of the village was 87.3% White, 4.2% Asian, 3.2% African American, and 2.3% Hispanic or Latino. The median household income was $150,000, and the median home value was $1,000,000.
Oak Brook is a wealthy, affluent suburb of Chicago, and is known for its high quality of life and excellent schools. The village is home to many corporate headquarters, and is a popular destination for wealthy Chicagoans looking to escape the city. The village has a diverse population, and is a great place to live and work.
Common Questions
What is Per Capita Income in Oak Brook?
Per Capita income in Oak Brook is $90,630.
What is the Median Family Income in Oak Brook?
Median Family Income in Oak Brook is $178,977.
What is the Median Household income in Oak Brook?
Median Household Income in Oak Brook is $158,663.
What is Income or Wage Gap in Oak Brook?
Income or Wage Gap in Oak Brook is 52.6%.
Women in Oak Brook earn 47.4 cents for every dollar earned by a man.
What is Inequality or Gini Index in Oak Brook?
Inequality or Gini Index in Oak Brook is 0.53.
What is the Total Population of Oak Brook?
Total Population of Oak Brook is 8,065.
What is the Total Male Population of Oak Brook?
Total Male Population of Oak Brook is 3,749.
What is the Total Female Population of Oak Brook?
Total Female Population of Oak Brook is 4,316.
What is the Ratio of Males per 100 Females in Oak Brook?
There are 86.86 Males per 100 Females in Oak Brook.
What is the Ratio of Females per 100 Males in Oak Brook?
There are 115.12 Females per 100 Males in Oak Brook.
What is the Median Population Age in Oak Brook?
Median Population Age in Oak Brook is 52.5 Years.
What is the Average Family Size in Oak Brook
Average Family Size in Oak Brook is 3.2 People.
What is the Average Household Size in Oak Brook
Average Household Size in Oak Brook is 2.7 People.
How Large is the Labor Force in Oak Brook?
There are 3,132 People in the Labor Forcein in Oak Brook.
What is the Percentage of People in the Labor Force in Oak Brook?
48.0% of People are in the Labor Force in Oak Brook.
What is the Unemployment Rate in Oak Brook?
Unemployment Rate in Oak Brook is 10.4%.