Lake Barrington, IL Map & Demographics
Lake Barrington Map
Lake Barrington Overview
$75,469
PER CAPITA INCOME
$195,231
AVG FAMILY INCOME
$126,316
AVG HOUSEHOLD INCOME
67.0%
WAGE / INCOME GAP [ % ]
33.0¢/ $1
WAGE / INCOME GAP [ $ ]
0.46
INEQUALITY / GINI INDEX
5,377
TOTAL POPULATION
2,532
MALE POPULATION
2,845
FEMALE POPULATION
89.00
MALES / 100 FEMALES
112.36
FEMALES / 100 MALES
56.0
MEDIAN AGE
2.8
AVG FAMILY SIZE
2.2
AVG HOUSEHOLD SIZE
2,443
LABOR FORCE [ PEOPLE ]
53.0%
PERCENT IN LABOR FORCE
6.4%
UNEMPLOYMENT RATE
Income in Lake Barrington
Income Overview in Lake Barrington
Per Capita Income in Lake Barrington is $75,469, while median incomes of families and households are $195,231 and $126,316 respectively.
| Characteristic | Number | Measure |
| Per Capita Income | 5,377 | $75,469 |
| Median Family Income | 1,541 | $195,231 |
| Mean Family Income | 1,541 | $216,448 |
| Median Household Income | 2,414 | $126,316 |
| Mean Household Income | 2,414 | $166,987 |
| Income Deficit | 1,541 | $0 |
| Wage / Income Gap (%) | 5,377 | 67.03% |
| Wage / Income Gap ($) | 5,377 | 32.97¢ per $1 |
| Gini / Inequality Index | 5,377 | 0.46 |
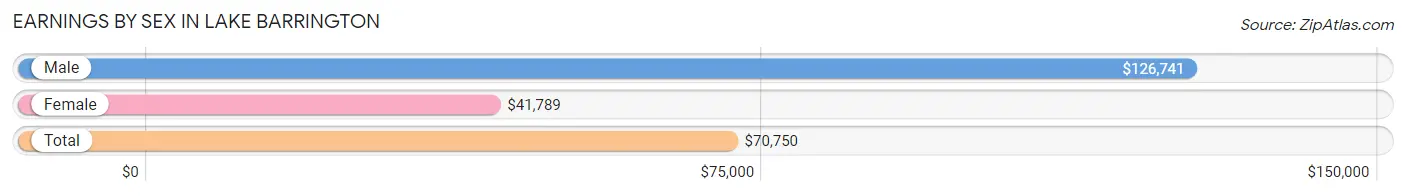
Earnings by Sex in Lake Barrington
Average Earnings in Lake Barrington are $70,750, $126,741 for men and $41,789 for women, a difference of 67.0%.
| Sex | Number | Average Earnings |
| Male | 1,325 (51.5%) | $126,741 |
| Female | 1,249 (48.5%) | $41,789 |
| Total | 2,574 (100.0%) | $70,750 |
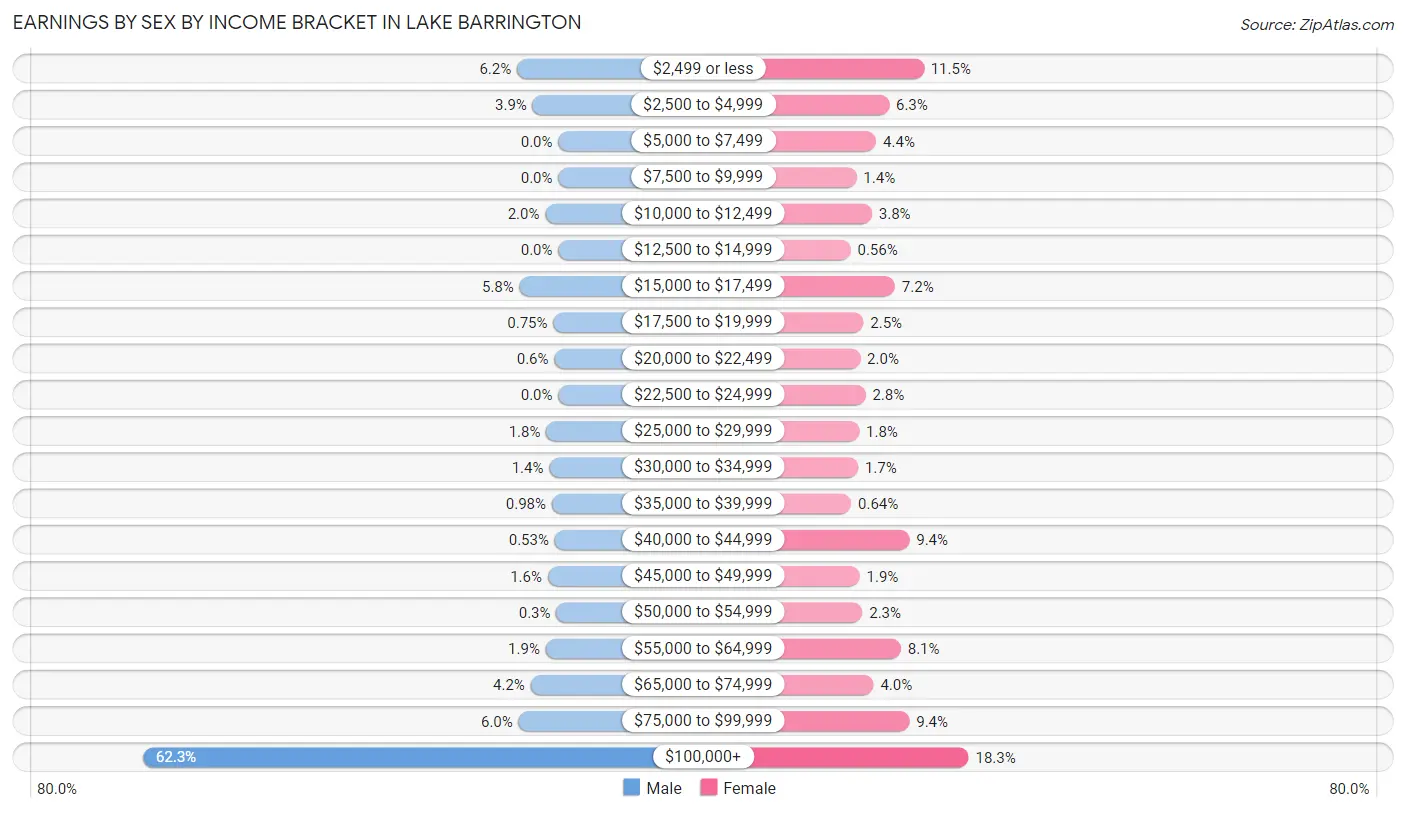
Earnings by Sex by Income Bracket in Lake Barrington
The most common earnings brackets in Lake Barrington are $100,000+ for men (825 | 62.3%) and $100,000+ for women (228 | 18.2%).
| Income | Male | Female |
| $2,499 or less | 82 (6.2%) | 144 (11.5%) |
| $2,500 to $4,999 | 51 (3.8%) | 79 (6.3%) |
| $5,000 to $7,499 | 0 (0.0%) | 55 (4.4%) |
| $7,500 to $9,999 | 0 (0.0%) | 18 (1.4%) |
| $10,000 to $12,499 | 26 (2.0%) | 47 (3.8%) |
| $12,500 to $14,999 | 0 (0.0%) | 7 (0.6%) |
| $15,000 to $17,499 | 77 (5.8%) | 90 (7.2%) |
| $17,500 to $19,999 | 10 (0.7%) | 31 (2.5%) |
| $20,000 to $22,499 | 8 (0.6%) | 25 (2.0%) |
| $22,500 to $24,999 | 0 (0.0%) | 35 (2.8%) |
| $25,000 to $29,999 | 24 (1.8%) | 23 (1.8%) |
| $30,000 to $34,999 | 18 (1.4%) | 21 (1.7%) |
| $35,000 to $39,999 | 13 (1.0%) | 8 (0.6%) |
| $40,000 to $44,999 | 7 (0.5%) | 117 (9.4%) |
| $45,000 to $49,999 | 21 (1.6%) | 24 (1.9%) |
| $50,000 to $54,999 | 4 (0.3%) | 29 (2.3%) |
| $55,000 to $64,999 | 25 (1.9%) | 101 (8.1%) |
| $65,000 to $74,999 | 55 (4.2%) | 50 (4.0%) |
| $75,000 to $99,999 | 79 (6.0%) | 117 (9.4%) |
| $100,000+ | 825 (62.3%) | 228 (18.2%) |
| Total | 1,325 (100.0%) | 1,249 (100.0%) |
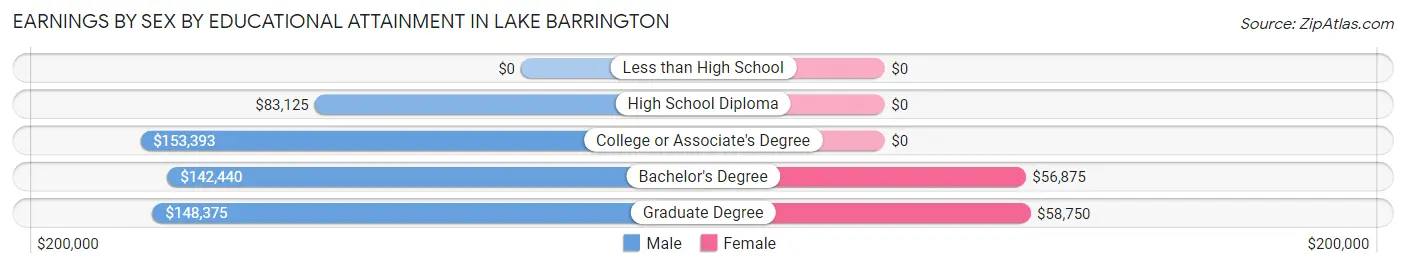
Earnings by Sex by Educational Attainment in Lake Barrington
Average earnings in Lake Barrington are $142,340 for men and $50,461 for women, a difference of 64.5%. Men with an educational attainment of college or associate's degree enjoy the highest average annual earnings of $153,393, while those with high school diploma education earn the least with $83,125. Women with an educational attainment of graduate degree earn the most with the average annual earnings of $58,750, while those with bachelor's degree education have the smallest earnings of $56,875.
| Educational Attainment | Male Income | Female Income |
| Less than High School | - | - |
| High School Diploma | $83,125 | $0 |
| College or Associate's Degree | $153,393 | $0 |
| Bachelor's Degree | $142,440 | $56,875 |
| Graduate Degree | $148,375 | $58,750 |
| Total | $142,340 | $50,461 |
Family Income in Lake Barrington
Family Income Brackets in Lake Barrington
According to the Lake Barrington family income data, there are 729 families falling into the $200,000+ income range, which is the most common income bracket and makes up 47.3% of all families. Conversely, the $25,000 to $34,999 income bracket is the least frequent group with only 9 families (0.6%) belonging to this category.
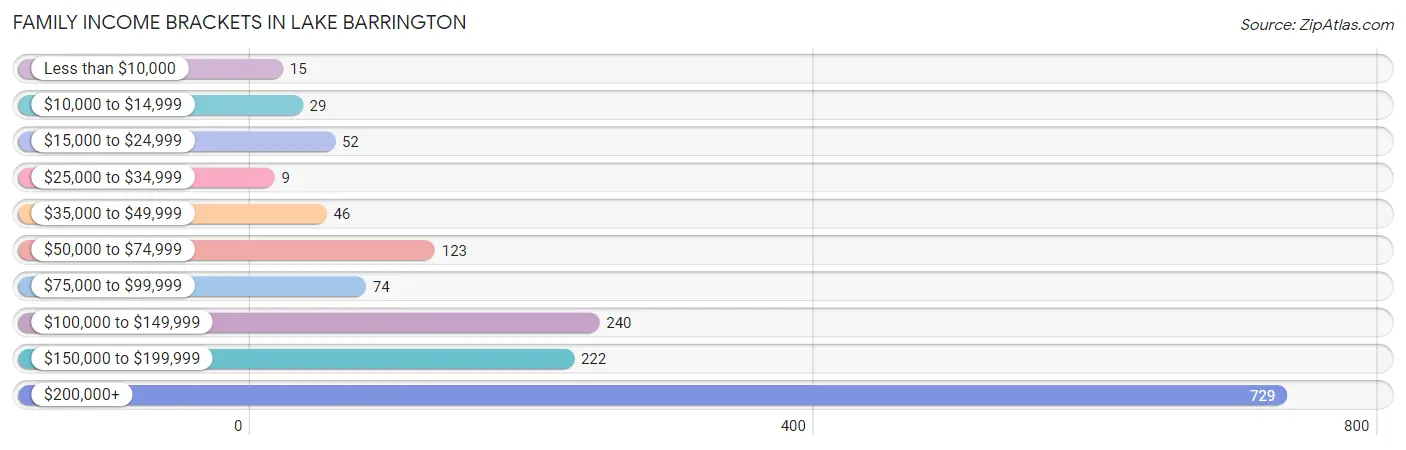
| Income Bracket | # Families | % Families |
| Less than $10,000 | 15 | 1.0% |
| $10,000 to $14,999 | 29 | 1.9% |
| $15,000 to $24,999 | 52 | 3.4% |
| $25,000 to $34,999 | 9 | 0.6% |
| $35,000 to $49,999 | 46 | 3.0% |
| $50,000 to $74,999 | 123 | 8.0% |
| $75,000 to $99,999 | 74 | 4.8% |
| $100,000 to $149,999 | 240 | 15.6% |
| $150,000 to $199,999 | 222 | 14.4% |
| $200,000+ | 729 | 47.3% |
Family Income by Famaliy Size in Lake Barrington
4-person families (207 | 13.4%) account for the highest median family income in Lake Barrington with $221,958 per family, while 2-person families (871 | 56.5%) have the highest median income of $71,640 per family member.
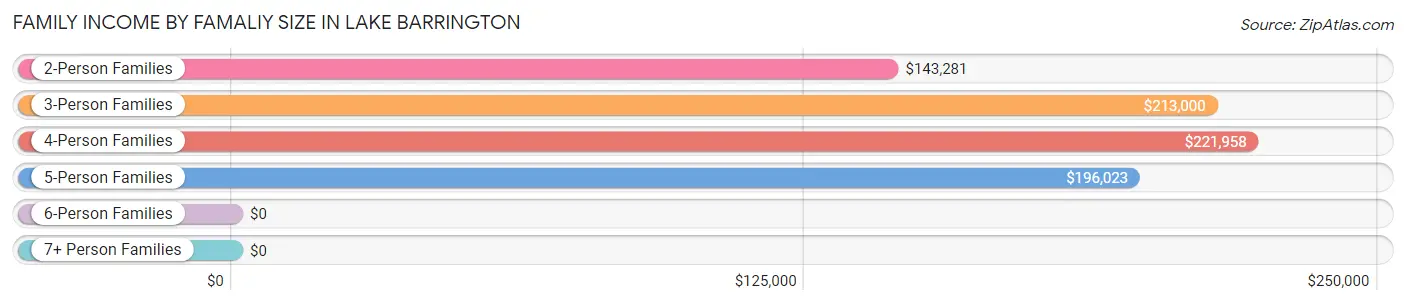
| Income Bracket | # Families | Median Income |
| 2-Person Families | 871 (56.5%) | $143,281 |
| 3-Person Families | 352 (22.8%) | $213,000 |
| 4-Person Families | 207 (13.4%) | $221,958 |
| 5-Person Families | 105 (6.8%) | $196,023 |
| 6-Person Families | 6 (0.4%) | $0 |
| 7+ Person Families | 0 (0.0%) | $0 |
| Total | 1,541 (100.0%) | $195,231 |
Family Income by Number of Earners in Lake Barrington
The median family income in Lake Barrington is $195,231, with families comprising 3+ earners (151) having the highest median family income of $250,001, while families with no earners (315) have the lowest median family income of $112,292, accounting for 9.8% and 20.4% of families, respectively.
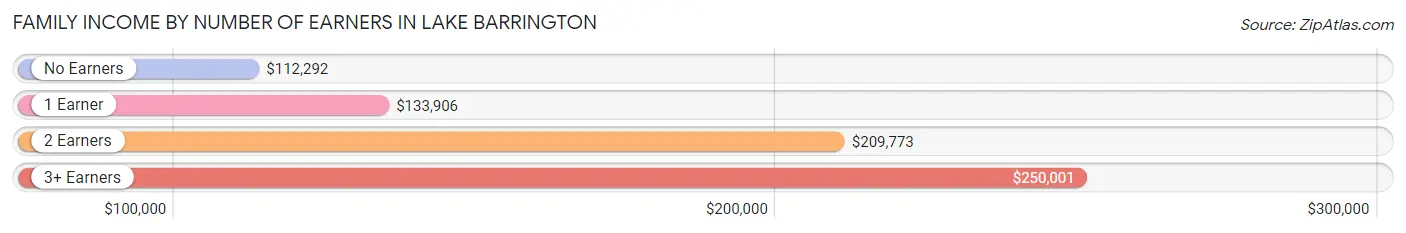
| Number of Earners | # Families | Median Income |
| No Earners | 315 (20.4%) | $112,292 |
| 1 Earner | 489 (31.7%) | $133,906 |
| 2 Earners | 586 (38.0%) | $209,773 |
| 3+ Earners | 151 (9.8%) | $250,001 |
| Total | 1,541 (100.0%) | $195,231 |
Household Income in Lake Barrington
Household Income Brackets in Lake Barrington
With 804 households falling in the category, the $200,000+ income range is the most frequent in Lake Barrington, accounting for 33.3% of all households. In contrast, only 51 households (2.1%) fall into the $10,000 to $14,999 income bracket, making it the least populous group.
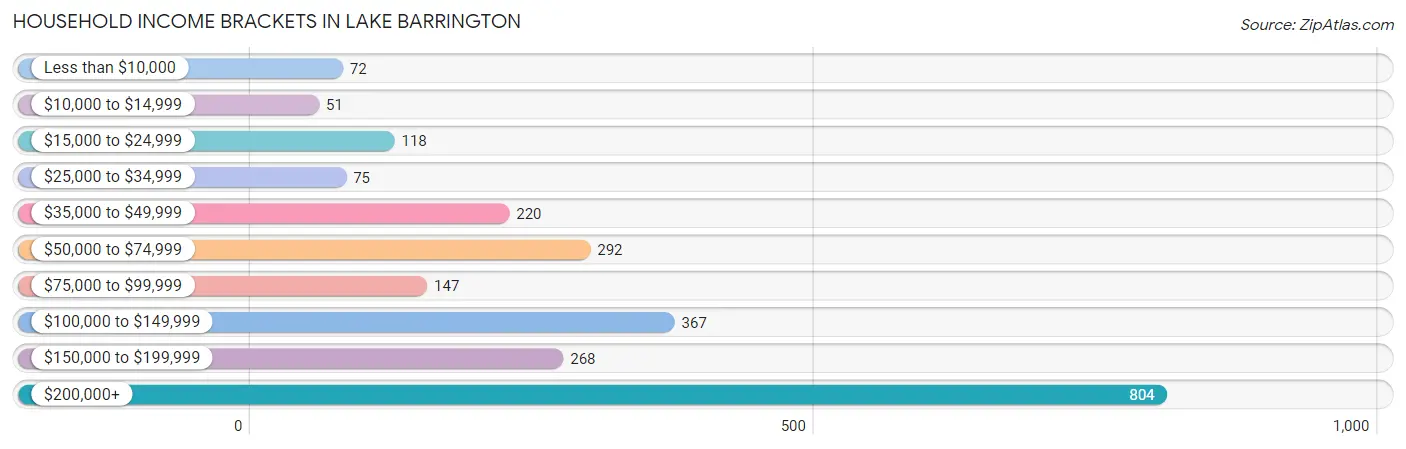
| Income Bracket | # Households | % Households |
| Less than $10,000 | 72 | 3.0% |
| $10,000 to $14,999 | 51 | 2.1% |
| $15,000 to $24,999 | 118 | 4.9% |
| $25,000 to $34,999 | 75 | 3.1% |
| $35,000 to $49,999 | 220 | 9.1% |
| $50,000 to $74,999 | 292 | 12.1% |
| $75,000 to $99,999 | 147 | 6.1% |
| $100,000 to $149,999 | 367 | 15.2% |
| $150,000 to $199,999 | 268 | 11.1% |
| $200,000+ | 804 | 33.3% |
Household Income by Householder Age in Lake Barrington
The median household income in Lake Barrington is $126,316, with the highest median household income of $207,386 found in the 45 to 64 years age bracket for the primary householder. A total of 873 households (36.2%) fall into this category.
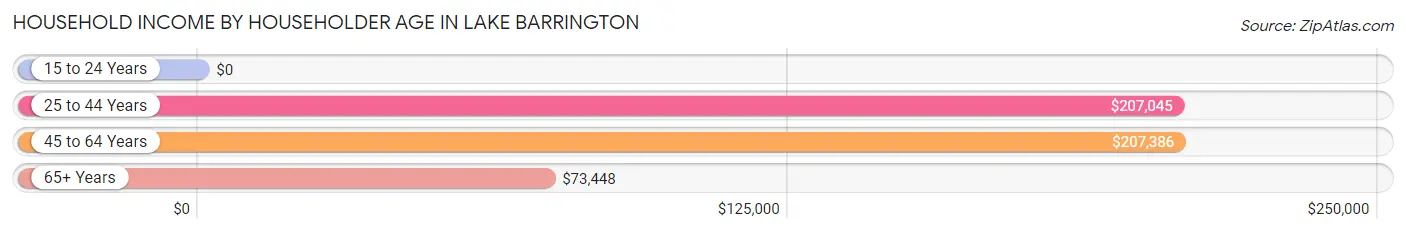
| Income Bracket | # Households | Median Income |
| 15 to 24 Years | 0 (0.0%) | $0 |
| 25 to 44 Years | 296 (12.3%) | $207,045 |
| 45 to 64 Years | 873 (36.2%) | $207,386 |
| 65+ Years | 1,245 (51.6%) | $73,448 |
| Total | 2,414 (100.0%) | $126,316 |
Poverty in Lake Barrington
Income Below Poverty by Sex and Age in Lake Barrington
With 3.5% poverty level for males and 6.6% for females among the residents of Lake Barrington, 16 and 17 year old males and 75 year old and over females are the most vulnerable to poverty, with 19 males (31.1%) and 74 females (14.6%) in their respective age groups living below the poverty level.
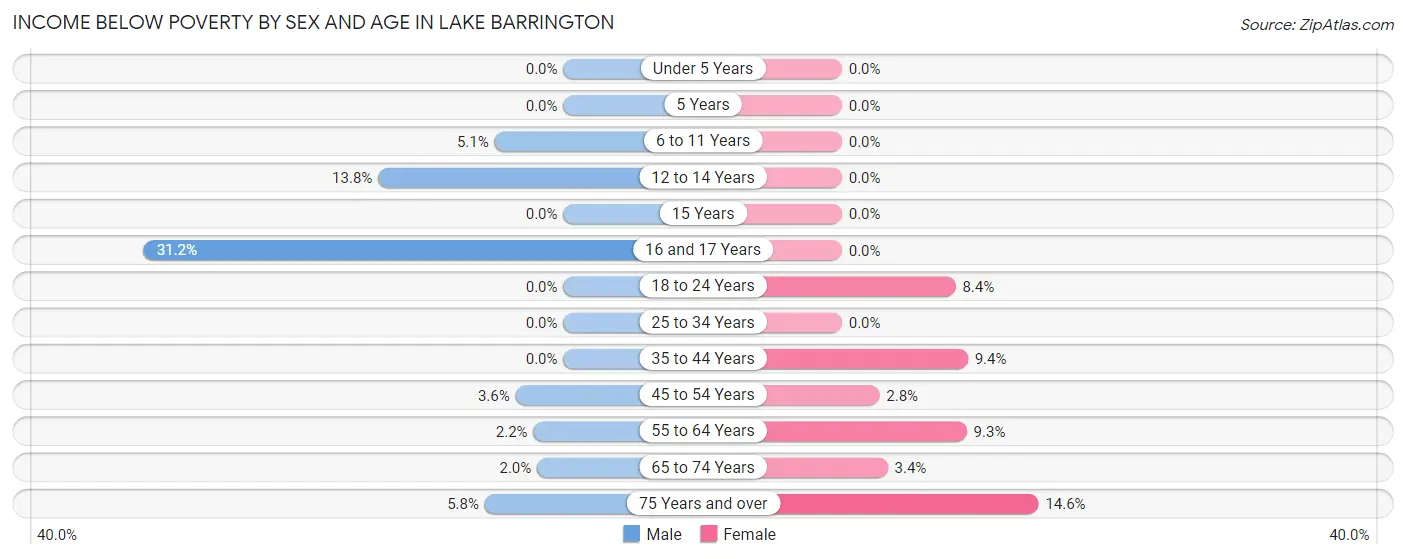
| Age Bracket | Male | Female |
| Under 5 Years | 0 (0.0%) | 0 (0.0%) |
| 5 Years | 0 (0.0%) | 0 (0.0%) |
| 6 to 11 Years | 7 (5.1%) | 0 (0.0%) |
| 12 to 14 Years | 11 (13.8%) | 0 (0.0%) |
| 15 Years | 0 (0.0%) | 0 (0.0%) |
| 16 and 17 Years | 19 (31.1%) | 0 (0.0%) |
| 18 to 24 Years | 0 (0.0%) | 19 (8.4%) |
| 25 to 34 Years | 0 (0.0%) | 0 (0.0%) |
| 35 to 44 Years | 0 (0.0%) | 20 (9.3%) |
| 45 to 54 Years | 10 (3.5%) | 11 (2.8%) |
| 55 to 64 Years | 11 (2.2%) | 43 (9.3%) |
| 65 to 74 Years | 6 (1.9%) | 18 (3.4%) |
| 75 Years and over | 24 (5.8%) | 74 (14.6%) |
| Total | 88 (3.5%) | 185 (6.6%) |
Income Above Poverty by Sex and Age in Lake Barrington
According to the poverty statistics in Lake Barrington, males aged under 5 years and females aged under 5 years are the age groups that are most secure financially, with 100.0% of males and 100.0% of females in these age groups living above the poverty line.
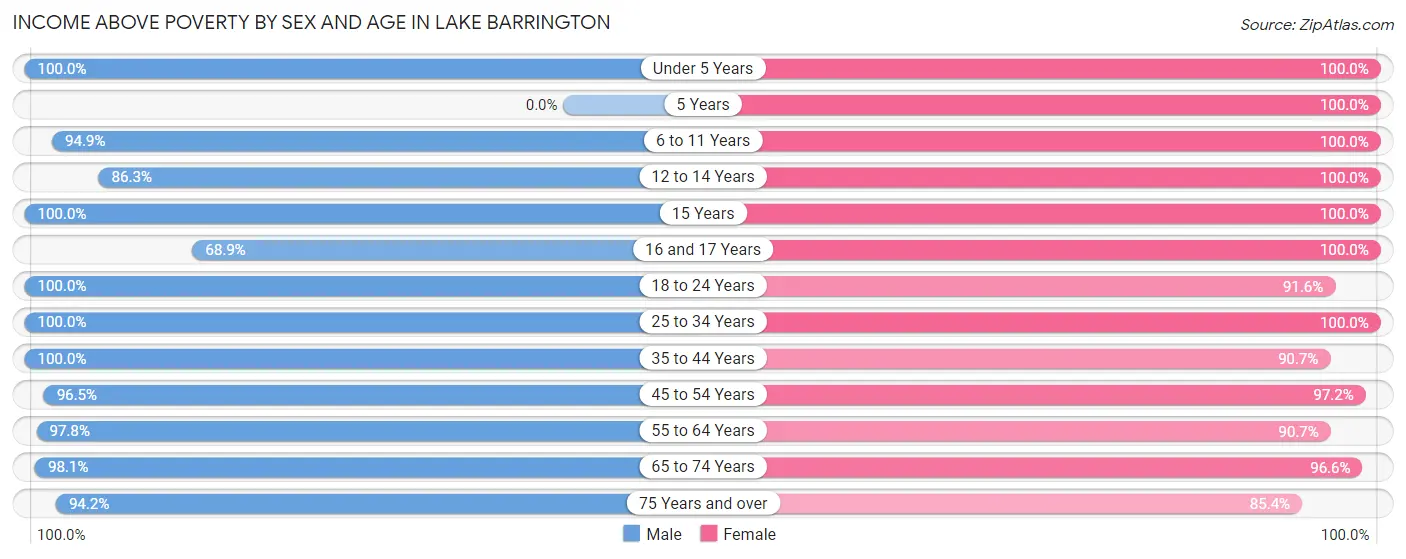
| Age Bracket | Male | Female |
| Under 5 Years | 119 (100.0%) | 65 (100.0%) |
| 5 Years | 0 (0.0%) | 10 (100.0%) |
| 6 to 11 Years | 130 (94.9%) | 178 (100.0%) |
| 12 to 14 Years | 69 (86.3%) | 79 (100.0%) |
| 15 Years | 55 (100.0%) | 44 (100.0%) |
| 16 and 17 Years | 42 (68.9%) | 25 (100.0%) |
| 18 to 24 Years | 275 (100.0%) | 206 (91.6%) |
| 25 to 34 Years | 162 (100.0%) | 74 (100.0%) |
| 35 to 44 Years | 146 (100.0%) | 194 (90.6%) |
| 45 to 54 Years | 272 (96.5%) | 383 (97.2%) |
| 55 to 64 Years | 484 (97.8%) | 421 (90.7%) |
| 65 to 74 Years | 302 (98.1%) | 511 (96.6%) |
| 75 Years and over | 388 (94.2%) | 433 (85.4%) |
| Total | 2,444 (96.5%) | 2,623 (93.4%) |
Income Below Poverty Among Married-Couple Families in Lake Barrington
The poverty statistics for married-couple families in Lake Barrington show that 2.0% or 27 of the total 1,372 families live below the poverty line. Families with 1 or 2 children have the highest poverty rate of 3.1%, comprising of 11 families. On the other hand, families with 3 or 4 children have the lowest poverty rate of 0.0%, which includes 0 families.
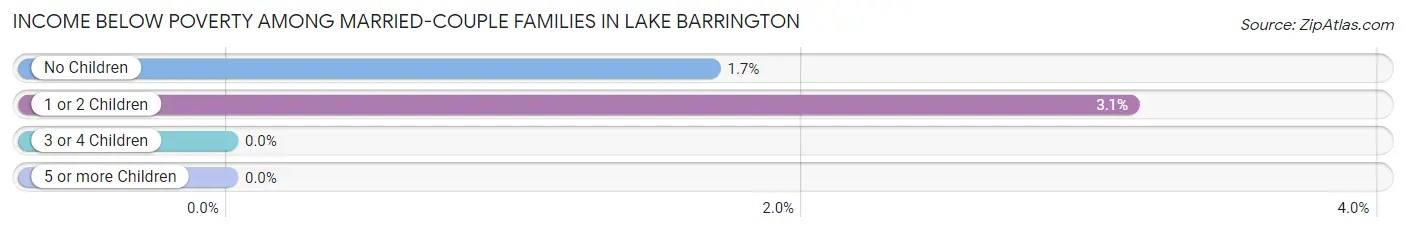
| Children | Above Poverty | Below Poverty |
| No Children | 938 (98.3%) | 16 (1.7%) |
| 1 or 2 Children | 339 (96.9%) | 11 (3.1%) |
| 3 or 4 Children | 68 (100.0%) | 0 (0.0%) |
| 5 or more Children | 0 (0.0%) | 0 (0.0%) |
| Total | 1,345 (98.0%) | 27 (2.0%) |
Income Below Poverty Among Single-Parent Households in Lake Barrington
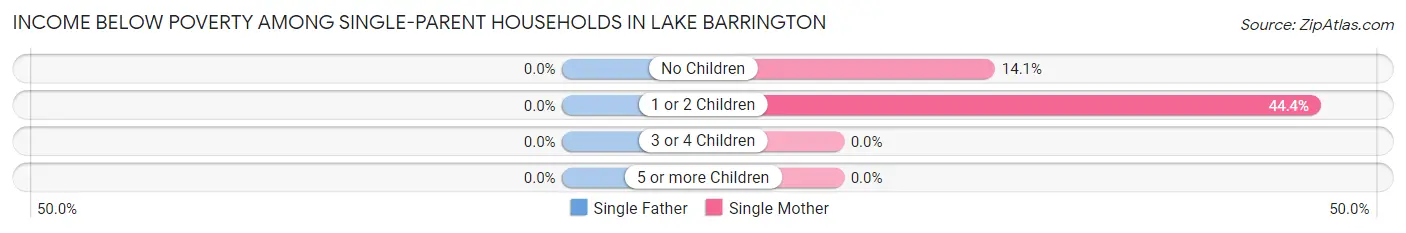
| Children | Single Father | Single Mother |
| No Children | 0 (0.0%) | 10 (14.1%) |
| 1 or 2 Children | 0 (0.0%) | 24 (44.4%) |
| 3 or 4 Children | 0 (0.0%) | 0 (0.0%) |
| 5 or more Children | 0 (0.0%) | 0 (0.0%) |
| Total | 0 (0.0%) | 34 (27.2%) |
Income Below Poverty Among Married-Couple vs Single-Parent Households in Lake Barrington
The poverty data for Lake Barrington shows that 27 of the married-couple family households (2.0%) and 34 of the single-parent households (20.1%) are living below the poverty level. Within the married-couple family households, those with 1 or 2 children have the highest poverty rate, with 11 households (3.1%) falling below the poverty line. Among the single-parent households, those with 1 or 2 children have the highest poverty rate, with 24 household (24.5%) living below poverty.
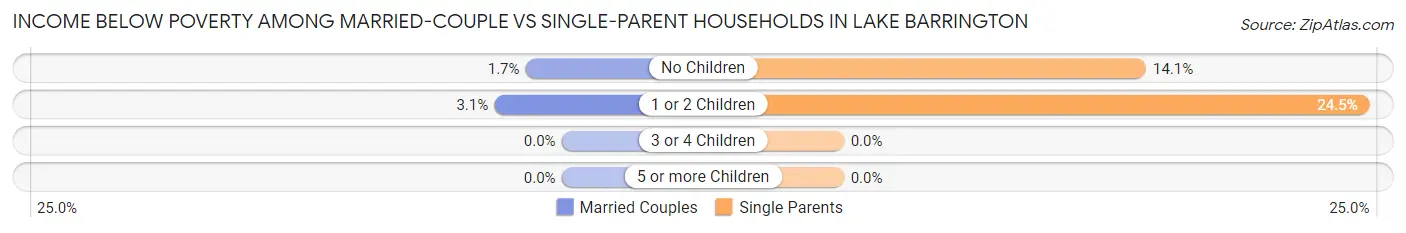
| Children | Married-Couple Families | Single-Parent Households |
| No Children | 16 (1.7%) | 10 (14.1%) |
| 1 or 2 Children | 11 (3.1%) | 24 (24.5%) |
| 3 or 4 Children | 0 (0.0%) | 0 (0.0%) |
| 5 or more Children | 0 (0.0%) | 0 (0.0%) |
| Total | 27 (2.0%) | 34 (20.1%) |
Race in Lake Barrington
The most populous races in Lake Barrington are White / Caucasian (4,929 | 91.7%), Asian (202 | 3.8%), and Two or more Races (189 | 3.5%).
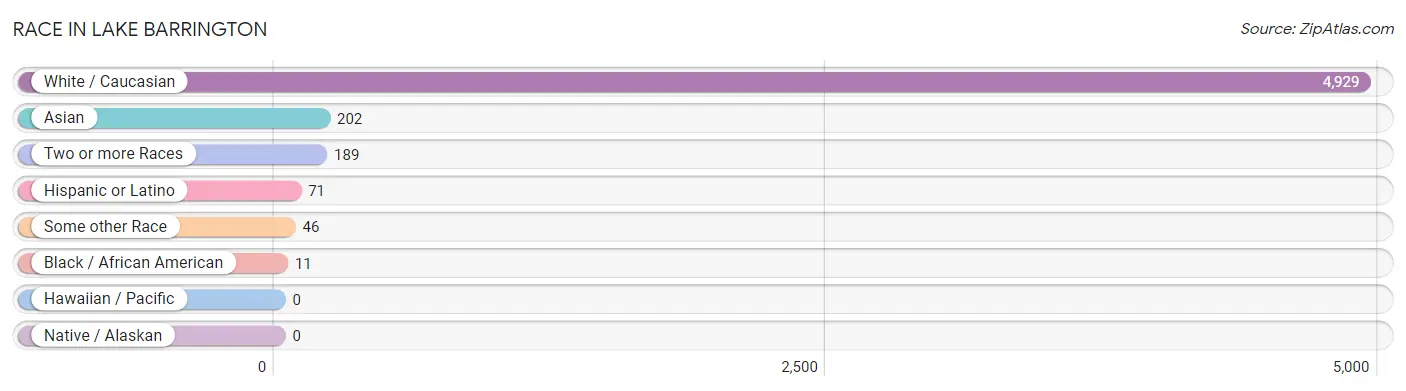
| Race | # Population | % Population |
| Asian | 202 | 3.8% |
| Black / African American | 11 | 0.2% |
| Hawaiian / Pacific | 0 | 0.0% |
| Hispanic or Latino | 71 | 1.3% |
| Native / Alaskan | 0 | 0.0% |
| White / Caucasian | 4,929 | 91.7% |
| Two or more Races | 189 | 3.5% |
| Some other Race | 46 | 0.9% |
| Total | 5,377 | 100.0% |
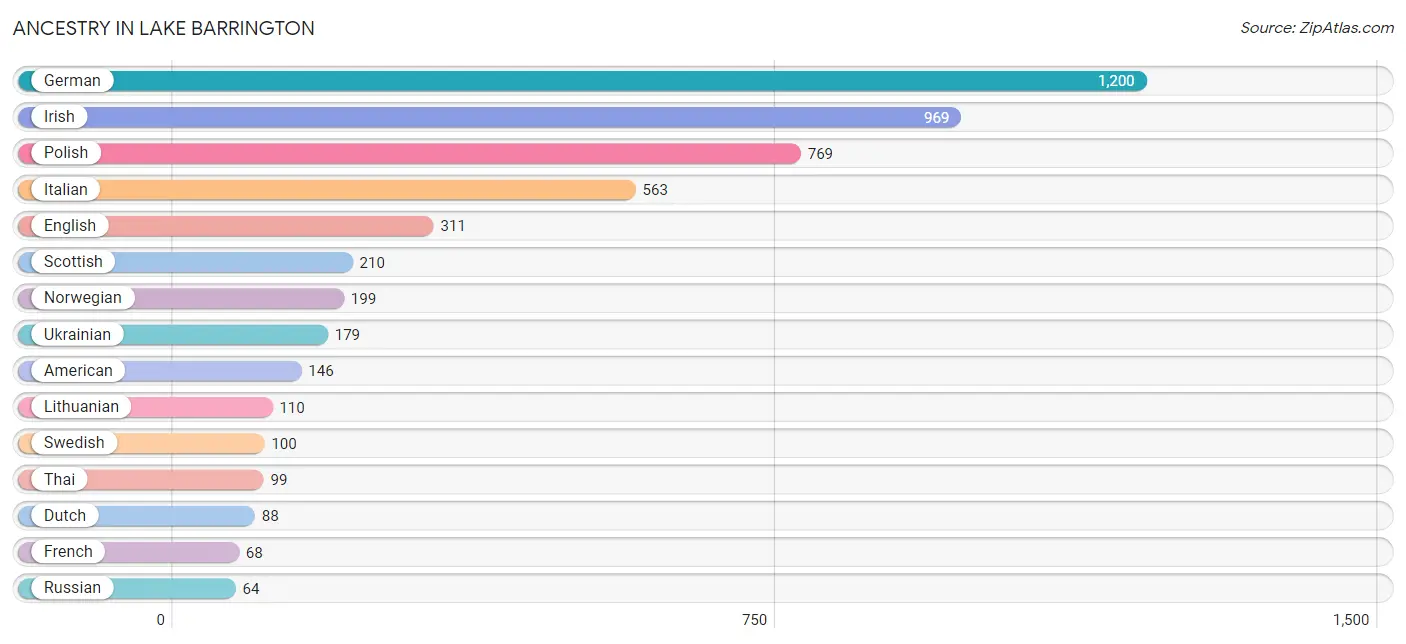
Ancestry in Lake Barrington
The most populous ancestries reported in Lake Barrington are German (1,200 | 22.3%), Irish (969 | 18.0%), Polish (769 | 14.3%), Italian (563 | 10.5%), and English (311 | 5.8%), together accounting for 70.9% of all Lake Barrington residents.
| Ancestry | # Population | % Population |
| Afghan | 12 | 0.2% |
| American | 146 | 2.7% |
| Arab | 14 | 0.3% |
| Austrian | 35 | 0.6% |
| Bhutanese | 49 | 0.9% |
| British | 37 | 0.7% |
| Burmese | 46 | 0.9% |
| Cambodian | 15 | 0.3% |
| Canadian | 18 | 0.3% |
| Central American Indian | 7 | 0.1% |
| Colombian | 11 | 0.2% |
| Croatian | 6 | 0.1% |
| Czech | 50 | 0.9% |
| Danish | 62 | 1.1% |
| Dutch | 88 | 1.6% |
| Eastern European | 41 | 0.8% |
| English | 311 | 5.8% |
| European | 48 | 0.9% |
| Finnish | 33 | 0.6% |
| French | 68 | 1.3% |
| French Canadian | 8 | 0.2% |
| German | 1,200 | 22.3% |
| Greek | 54 | 1.0% |
| Hungarian | 43 | 0.8% |
| Indian (Asian) | 3 | 0.1% |
| Irish | 969 | 18.0% |
| Italian | 563 | 10.5% |
| Jordanian | 9 | 0.2% |
| Laotian | 17 | 0.3% |
| Lithuanian | 110 | 2.1% |
| Luxembourger | 2 | 0.0% |
| Mexican | 11 | 0.2% |
| Nigerian | 11 | 0.2% |
| Norwegian | 199 | 3.7% |
| Pakistani | 6 | 0.1% |
| Peruvian | 8 | 0.2% |
| Polish | 769 | 14.3% |
| Puerto Rican | 21 | 0.4% |
| Russian | 64 | 1.2% |
| Scandinavian | 51 | 0.9% |
| Scotch-Irish | 17 | 0.3% |
| Scottish | 210 | 3.9% |
| Serbian | 38 | 0.7% |
| Slavic | 6 | 0.1% |
| Slovak | 30 | 0.6% |
| Slovene | 5 | 0.1% |
| South American | 28 | 0.5% |
| Spaniard | 11 | 0.2% |
| Sri Lankan | 24 | 0.4% |
| Subsaharan African | 11 | 0.2% |
| Swedish | 100 | 1.9% |
| Swiss | 4 | 0.1% |
| Syrian | 5 | 0.1% |
| Thai | 99 | 1.8% |
| Ukrainian | 179 | 3.3% |
| Venezuelan | 9 | 0.2% |
| Welsh | 9 | 0.2% |
| Yugoslavian | 9 | 0.2% | View All 58 Rows |
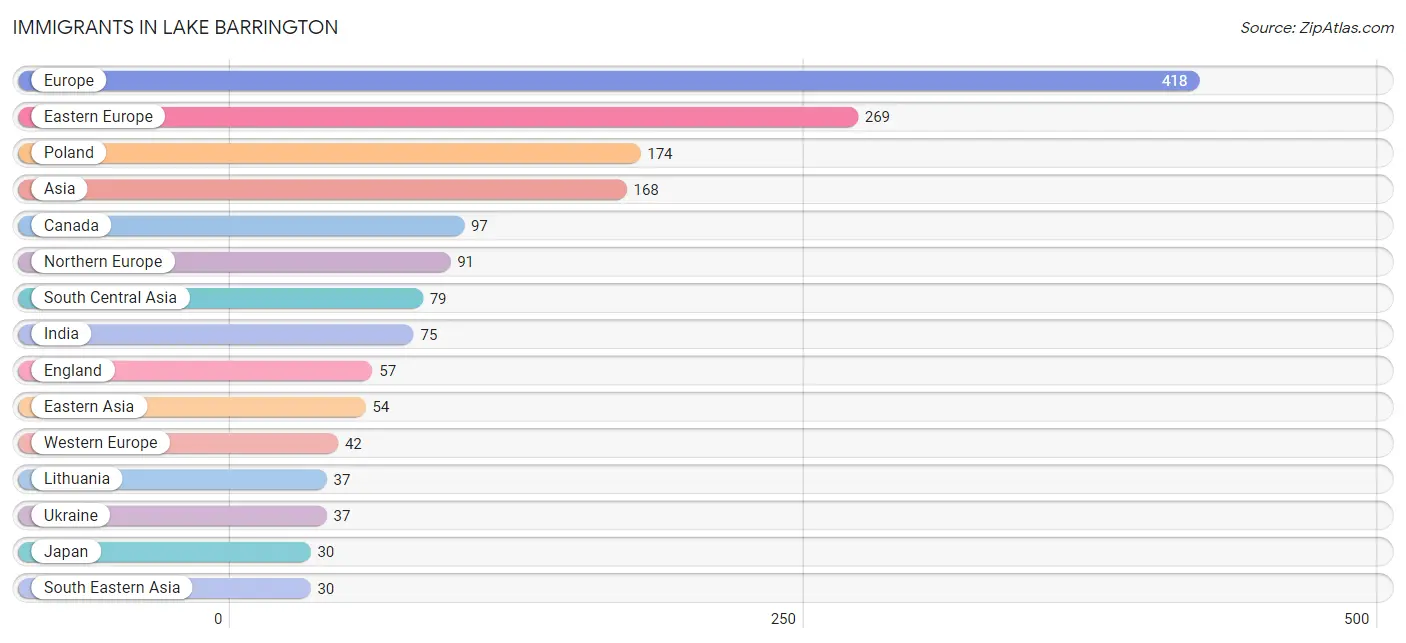
Immigrants in Lake Barrington
The most numerous immigrant groups reported in Lake Barrington came from Europe (418 | 7.8%), Eastern Europe (269 | 5.0%), Poland (174 | 3.2%), Asia (168 | 3.1%), and Canada (97 | 1.8%), together accounting for 20.9% of all Lake Barrington residents.
| Immigration Origin | # Population | % Population |
| Afghanistan | 4 | 0.1% |
| Africa | 11 | 0.2% |
| Asia | 168 | 3.1% |
| Australia | 9 | 0.2% |
| Belgium | 15 | 0.3% |
| Bosnia and Herzegovina | 5 | 0.1% |
| Canada | 97 | 1.8% |
| Central America | 20 | 0.4% |
| China | 3 | 0.1% |
| Czechoslovakia | 16 | 0.3% |
| Denmark | 17 | 0.3% |
| Eastern Asia | 54 | 1.0% |
| Eastern Europe | 269 | 5.0% |
| El Salvador | 20 | 0.4% |
| England | 57 | 1.1% |
| Europe | 418 | 7.8% |
| Germany | 27 | 0.5% |
| India | 75 | 1.4% |
| Ireland | 6 | 0.1% |
| Italy | 16 | 0.3% |
| Japan | 30 | 0.6% |
| Korea | 6 | 0.1% |
| Latin America | 20 | 0.4% |
| Lithuania | 37 | 0.7% |
| Nigeria | 11 | 0.2% |
| Northern Europe | 91 | 1.7% |
| Oceania | 9 | 0.2% |
| Poland | 174 | 3.2% |
| South Central Asia | 79 | 1.5% |
| South Eastern Asia | 30 | 0.6% |
| Southern Europe | 16 | 0.3% |
| Syria | 5 | 0.1% |
| Thailand | 6 | 0.1% |
| Ukraine | 37 | 0.7% |
| Vietnam | 24 | 0.4% |
| Western Africa | 11 | 0.2% |
| Western Asia | 5 | 0.1% |
| Western Europe | 42 | 0.8% | View All 38 Rows |
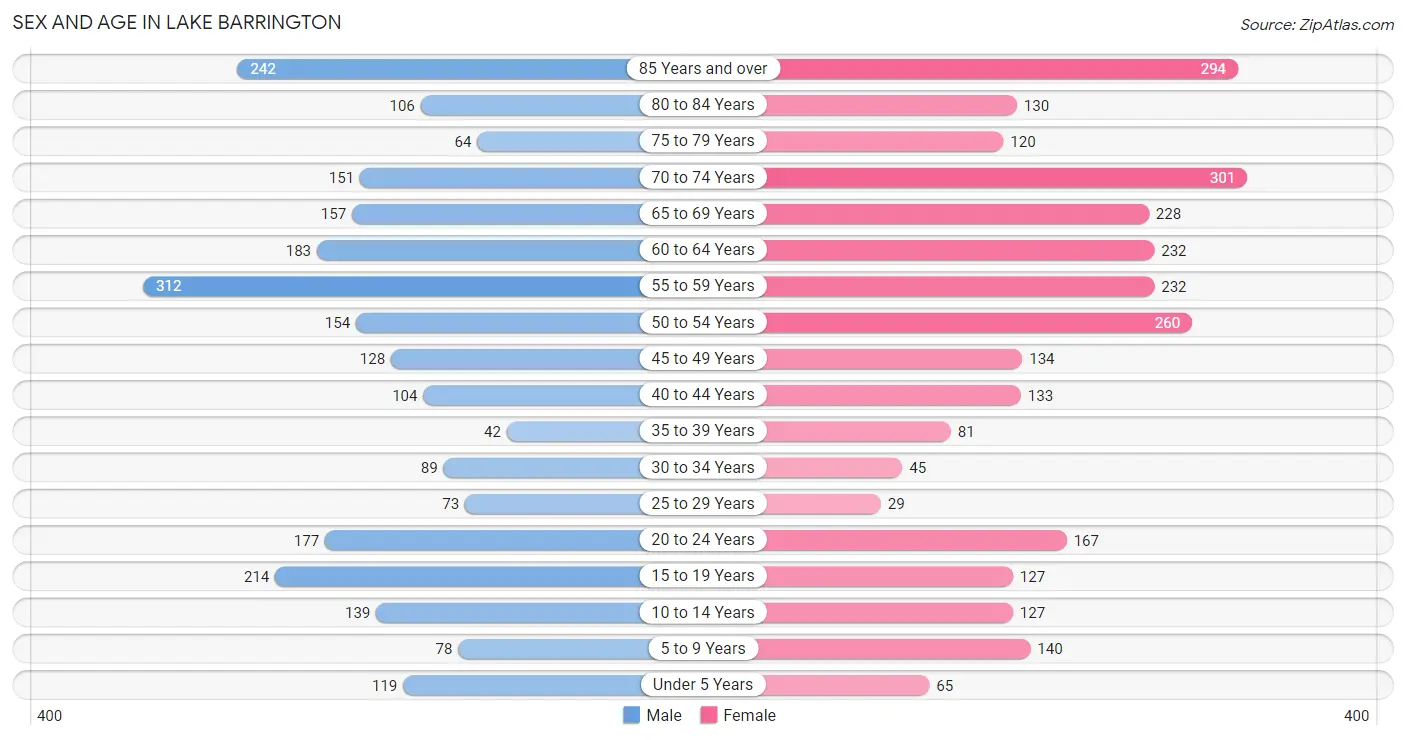
Sex and Age in Lake Barrington
Sex and Age in Lake Barrington
The most populous age groups in Lake Barrington are 55 to 59 Years (312 | 12.3%) for men and 70 to 74 Years (301 | 10.6%) for women.
| Age Bracket | Male | Female |
| Under 5 Years | 119 (4.7%) | 65 (2.3%) |
| 5 to 9 Years | 78 (3.1%) | 140 (4.9%) |
| 10 to 14 Years | 139 (5.5%) | 127 (4.5%) |
| 15 to 19 Years | 214 (8.5%) | 127 (4.5%) |
| 20 to 24 Years | 177 (7.0%) | 167 (5.9%) |
| 25 to 29 Years | 73 (2.9%) | 29 (1.0%) |
| 30 to 34 Years | 89 (3.5%) | 45 (1.6%) |
| 35 to 39 Years | 42 (1.7%) | 81 (2.9%) |
| 40 to 44 Years | 104 (4.1%) | 133 (4.7%) |
| 45 to 49 Years | 128 (5.1%) | 134 (4.7%) |
| 50 to 54 Years | 154 (6.1%) | 260 (9.1%) |
| 55 to 59 Years | 312 (12.3%) | 232 (8.2%) |
| 60 to 64 Years | 183 (7.2%) | 232 (8.2%) |
| 65 to 69 Years | 157 (6.2%) | 228 (8.0%) |
| 70 to 74 Years | 151 (6.0%) | 301 (10.6%) |
| 75 to 79 Years | 64 (2.5%) | 120 (4.2%) |
| 80 to 84 Years | 106 (4.2%) | 130 (4.6%) |
| 85 Years and over | 242 (9.6%) | 294 (10.3%) |
| Total | 2,532 (100.0%) | 2,845 (100.0%) |
Families and Households in Lake Barrington
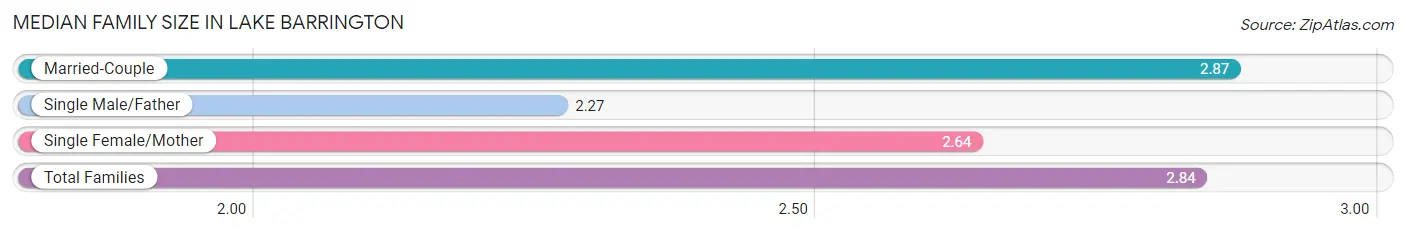
Median Family Size in Lake Barrington
The median family size in Lake Barrington is 2.84 persons per family, with married-couple families (1,372 | 89.0%) accounting for the largest median family size of 2.87 persons per family. On the other hand, single male/father families (44 | 2.9%) represent the smallest median family size with 2.27 persons per family.
| Family Type | # Families | Family Size |
| Married-Couple | 1,372 (89.0%) | 2.87 |
| Single Male/Father | 44 (2.9%) | 2.27 |
| Single Female/Mother | 125 (8.1%) | 2.64 |
| Total Families | 1,541 (100.0%) | 2.84 |
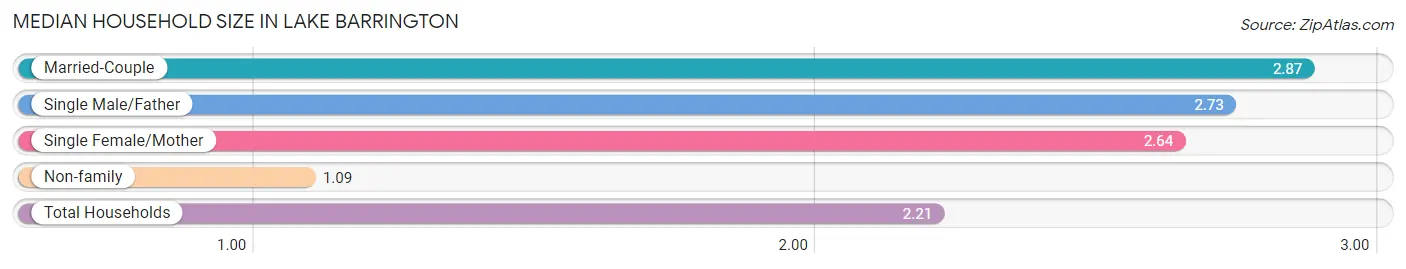
Median Household Size in Lake Barrington
The median household size in Lake Barrington is 2.21 persons per household, with married-couple households (1,372 | 56.8%) accounting for the largest median household size of 2.87 persons per household. non-family households (873 | 36.2%) represent the smallest median household size with 1.09 persons per household.
| Household Type | # Households | Household Size |
| Married-Couple | 1,372 (56.8%) | 2.87 |
| Single Male/Father | 44 (1.8%) | 2.73 |
| Single Female/Mother | 125 (5.2%) | 2.64 |
| Non-family | 873 (36.2%) | 1.09 |
| Total Households | 2,414 (100.0%) | 2.21 |
Household Size by Marriage Status in Lake Barrington
Out of a total of 2,414 households in Lake Barrington, 1,541 (63.8%) are family households, while 873 (36.2%) are nonfamily households. The most numerous type of family households are 2-person households, comprising 850, and the most common type of nonfamily households are 1-person households, comprising 788.
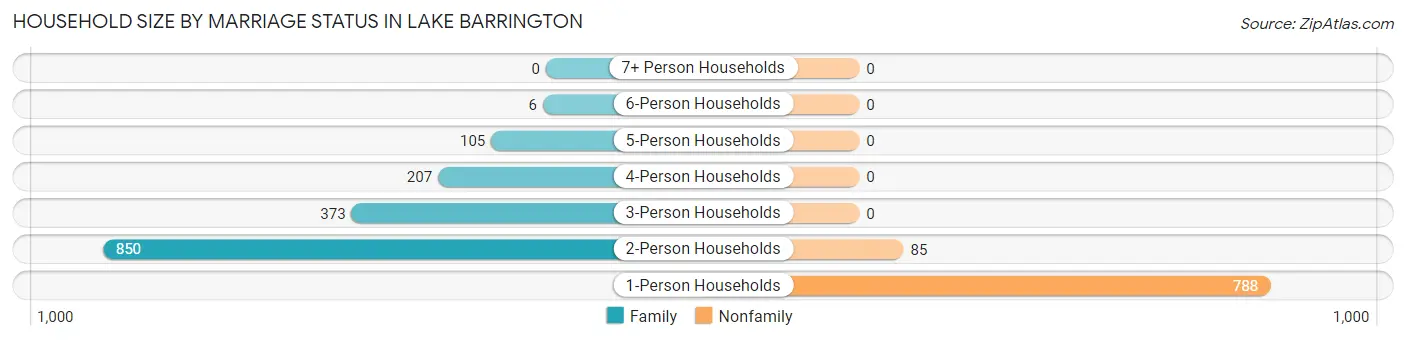
| Household Size | Family Households | Nonfamily Households |
| 1-Person Households | - | 788 (32.6%) |
| 2-Person Households | 850 (35.2%) | 85 (3.5%) |
| 3-Person Households | 373 (15.4%) | 0 (0.0%) |
| 4-Person Households | 207 (8.6%) | 0 (0.0%) |
| 5-Person Households | 105 (4.3%) | 0 (0.0%) |
| 6-Person Households | 6 (0.3%) | 0 (0.0%) |
| 7+ Person Households | 0 (0.0%) | 0 (0.0%) |
| Total | 1,541 (63.8%) | 873 (36.2%) |
Female Fertility in Lake Barrington
Fertility by Age in Lake Barrington
Average fertility rate in Lake Barrington is 133.0 births per 1,000 women. Women in the age bracket of 20 to 34 years have the highest fertility rate with 394.0 births per 1,000 women. Women in the age bracket of 20 to 34 years acount for 100.0% of all women with births.
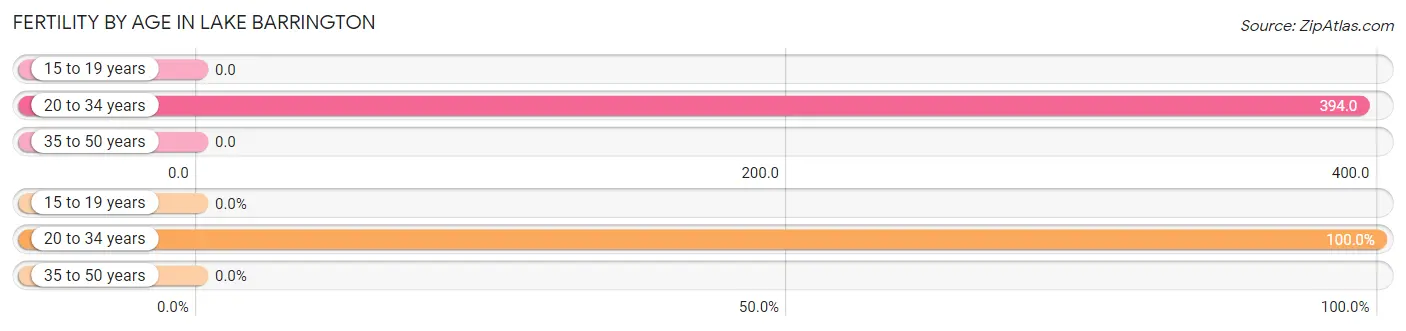
| Age Bracket | Women with Births | Births / 1,000 Women |
| 15 to 19 years | 0 (0.0%) | 0.0 |
| 20 to 34 years | 95 (100.0%) | 394.0 |
| 35 to 50 years | 0 (0.0%) | 0.0 |
| Total | 95 (100.0%) | 133.0 |
Fertility by Age by Marriage Status in Lake Barrington
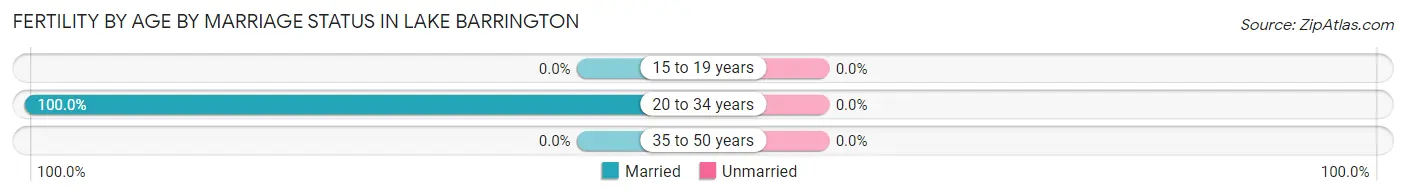
| Age Bracket | Married | Unmarried |
| 15 to 19 years | 0 (0.0%) | 0 (0.0%) |
| 20 to 34 years | 95 (100.0%) | 0 (0.0%) |
| 35 to 50 years | 0 (0.0%) | 0 (0.0%) |
| Total | 95 (100.0%) | 0 (0.0%) |
Fertility by Education in Lake Barrington
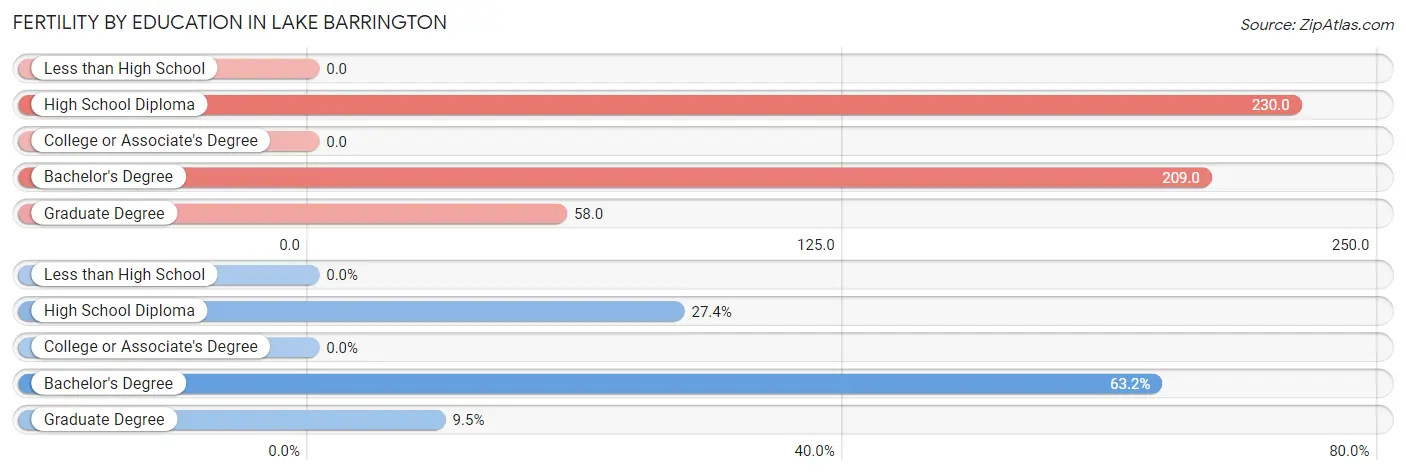
| Educational Attainment | Women with Births | Births / 1,000 Women |
| Less than High School | 0 (0.0%) | 0.0 |
| High School Diploma | 26 (27.4%) | 230.0 |
| College or Associate's Degree | 0 (0.0%) | 0.0 |
| Bachelor's Degree | 60 (63.2%) | 209.0 |
| Graduate Degree | 9 (9.5%) | 58.0 |
| Total | 95 (100.0%) | 133.0 |
Fertility by Education by Marriage Status in Lake Barrington
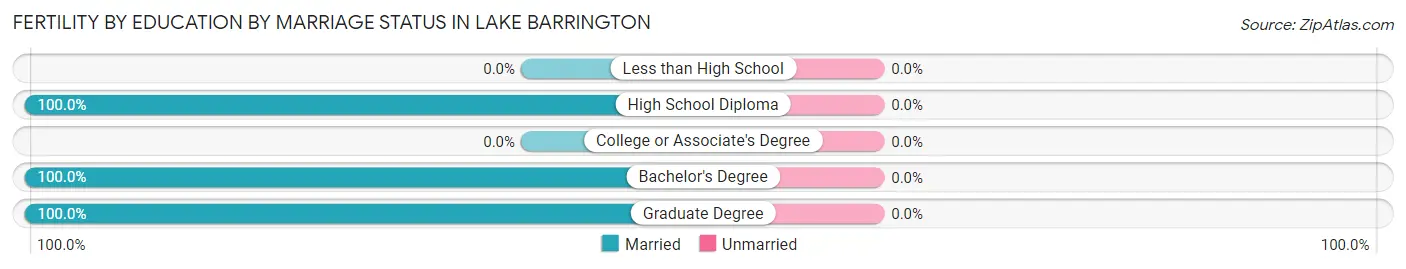
| Educational Attainment | Married | Unmarried |
| Less than High School | 0 (0.0%) | 0 (0.0%) |
| High School Diploma | 26 (100.0%) | 0 (0.0%) |
| College or Associate's Degree | 0 (0.0%) | 0 (0.0%) |
| Bachelor's Degree | 60 (100.0%) | 0 (0.0%) |
| Graduate Degree | 9 (100.0%) | 0 (0.0%) |
| Total | 95 (100.0%) | 0 (0.0%) |
Employment Characteristics in Lake Barrington
Employment by Class of Employer in Lake Barrington
Among the 2,256 employed individuals in Lake Barrington, private company employees (1,290 | 57.2%), self-employed (incorporated) (362 | 16.1%), and self-employed (not incorporated) (187 | 8.3%) make up the most common classes of employment.
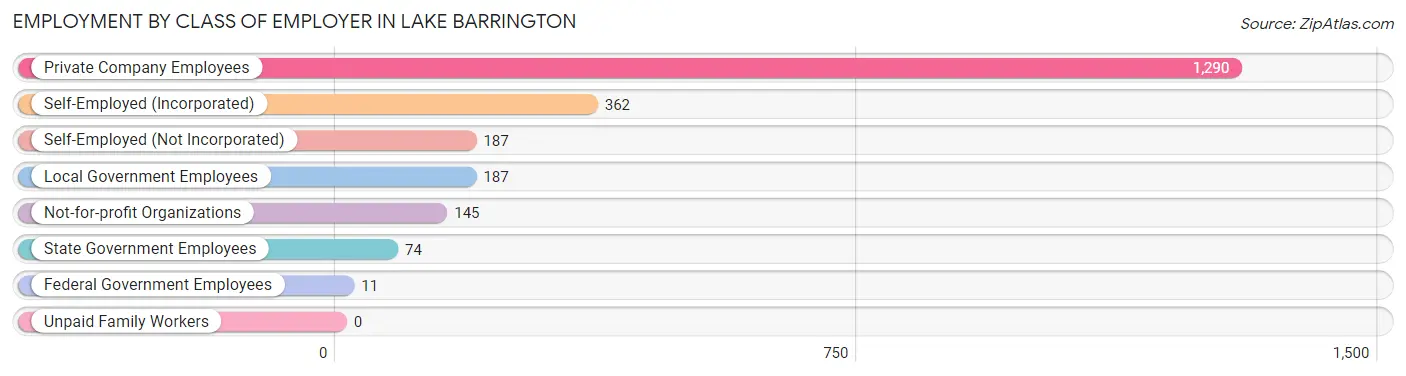
| Employer Class | # Employees | % Employees |
| Private Company Employees | 1,290 | 57.2% |
| Self-Employed (Incorporated) | 362 | 16.1% |
| Self-Employed (Not Incorporated) | 187 | 8.3% |
| Not-for-profit Organizations | 145 | 6.4% |
| Local Government Employees | 187 | 8.3% |
| State Government Employees | 74 | 3.3% |
| Federal Government Employees | 11 | 0.5% |
| Unpaid Family Workers | 0 | 0.0% |
| Total | 2,256 | 100.0% |
Employment Status by Age in Lake Barrington
According to the labor force statistics for Lake Barrington, out of the total population over 16 years of age (4,610), 53.0% or 2,443 individuals are in the labor force, with 6.4% or 156 of them unemployed. The age group with the highest labor force participation rate is 45 to 54 years, with 91.3% or 617 individuals in the labor force. Within the labor force, the 16 to 19 years age range has the highest percentage of unemployed individuals, with 36.4% or 39 of them being unemployed.
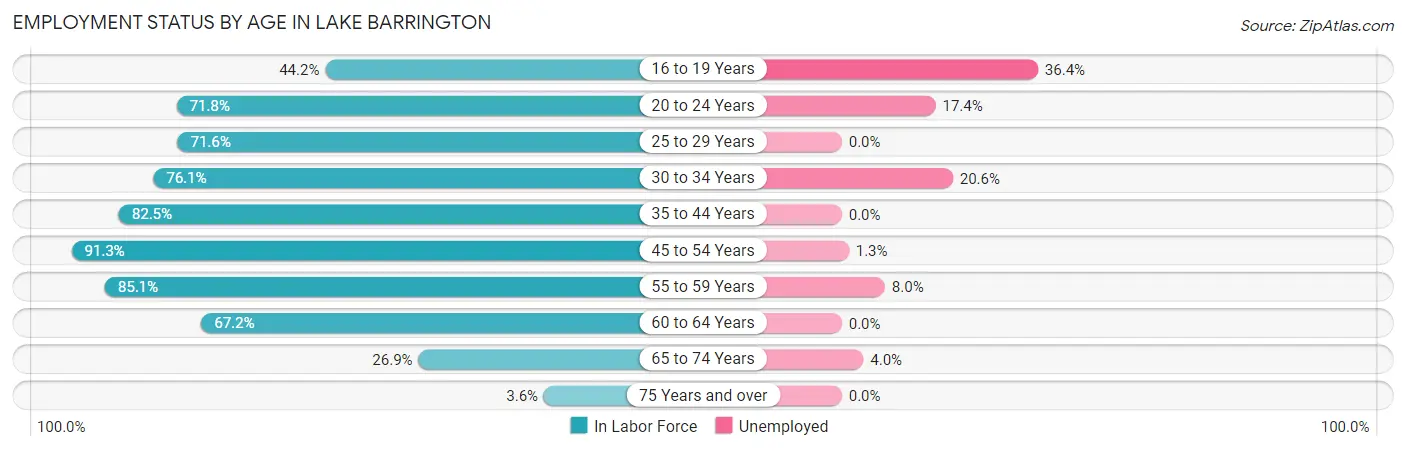
| Age Bracket | In Labor Force | Unemployed |
| 16 to 19 Years | 107 (44.2%) | 39 (36.4%) |
| 20 to 24 Years | 247 (71.8%) | 43 (17.4%) |
| 25 to 29 Years | 73 (71.6%) | 0 (0.0%) |
| 30 to 34 Years | 102 (76.1%) | 21 (20.6%) |
| 35 to 44 Years | 297 (82.5%) | 0 (0.0%) |
| 45 to 54 Years | 617 (91.3%) | 8 (1.3%) |
| 55 to 59 Years | 463 (85.1%) | 37 (8.0%) |
| 60 to 64 Years | 279 (67.2%) | 0 (0.0%) |
| 65 to 74 Years | 225 (26.9%) | 9 (4.0%) |
| 75 Years and over | 34 (3.6%) | 0 (0.0%) |
| Total | 2,443 (53.0%) | 156 (6.4%) |
Employment Status by Educational Attainment in Lake Barrington
According to labor force statistics for Lake Barrington, 82.1% of individuals (1,832) out of the total population between 25 and 64 years of age (2,231) are in the labor force, with 3.6% or 66 of them being unemployed. The group with the highest labor force participation rate are those with the educational attainment of bachelor's degree or higher, with 87.0% or 1,365 individuals in the labor force. Within the labor force, individuals with bachelor's degree or higher education have the highest percentage of unemployment, with 4.8% or 66 of them being unemployed.
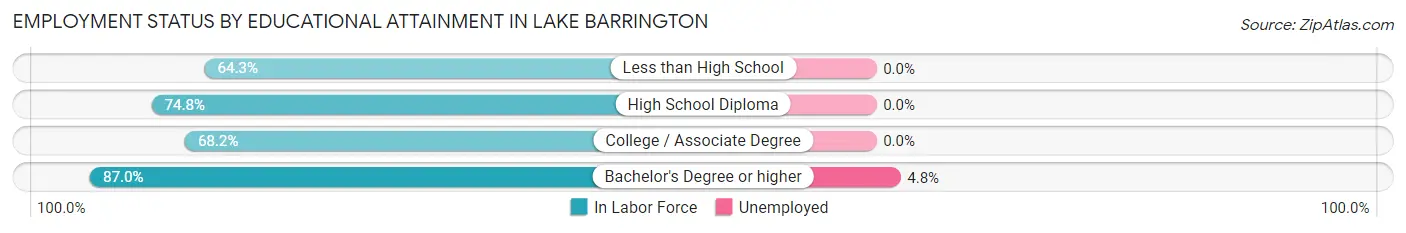
| Educational Attainment | In Labor Force | Unemployed |
| Less than High School | 36 (64.3%) | 0 (0.0%) |
| High School Diploma | 190 (74.8%) | 0 (0.0%) |
| College / Associate Degree | 240 (68.2%) | 0 (0.0%) |
| Bachelor's Degree or higher | 1,365 (87.0%) | 75 (4.8%) |
| Total | 1,832 (82.1%) | 80 (3.6%) |
Employment Occupations by Sex in Lake Barrington
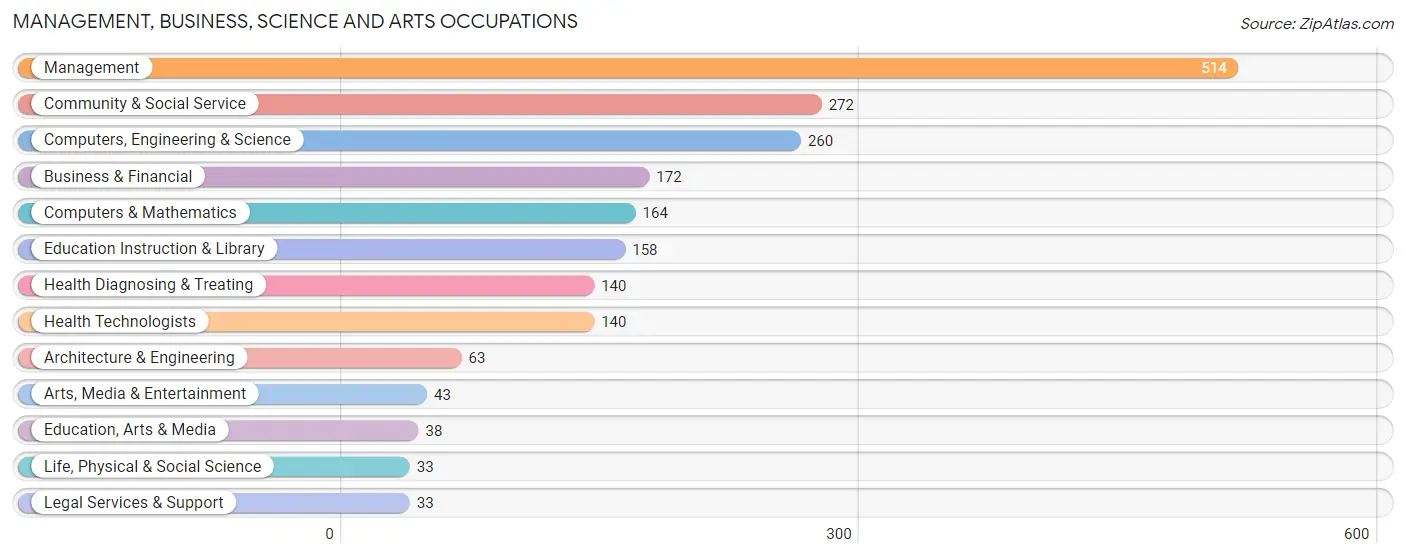
Management, Business, Science and Arts Occupations
The most common Management, Business, Science and Arts occupations in Lake Barrington are Management (514 | 22.5%), Community & Social Service (272 | 11.9%), Computers, Engineering & Science (260 | 11.4%), Business & Financial (172 | 7.5%), and Computers & Mathematics (164 | 7.2%).
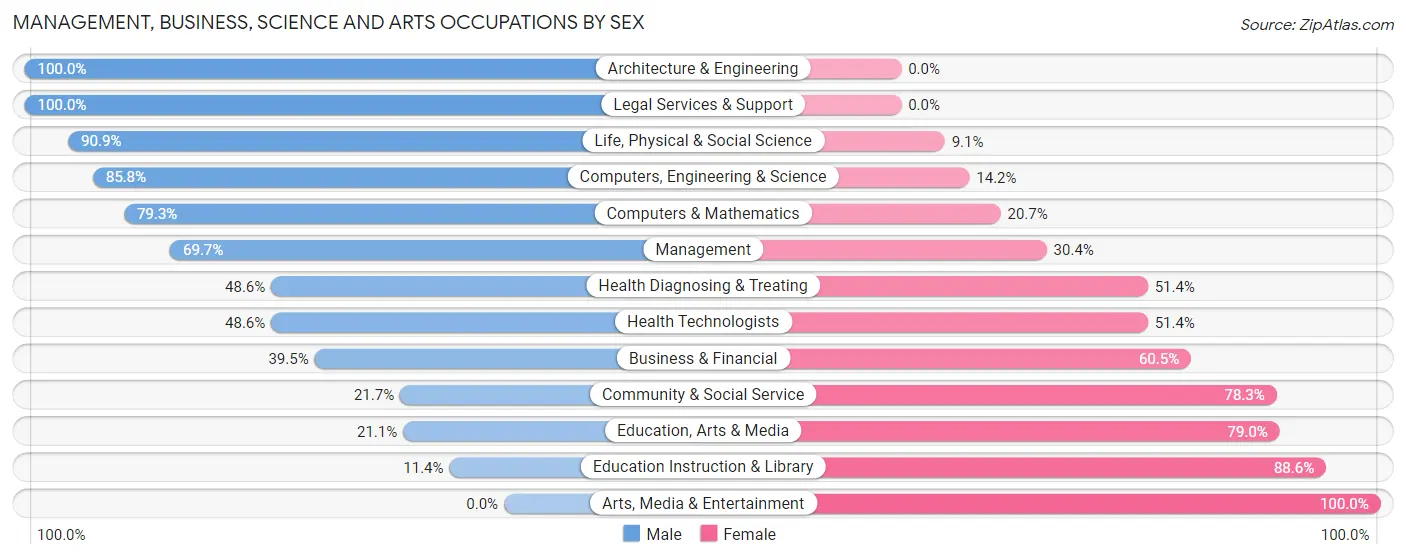
Management, Business, Science and Arts Occupations by Sex
Within the Management, Business, Science and Arts occupations in Lake Barrington, the most male-oriented occupations are Architecture & Engineering (100.0%), Legal Services & Support (100.0%), and Life, Physical & Social Science (90.9%), while the most female-oriented occupations are Arts, Media & Entertainment (100.0%), Education Instruction & Library (88.6%), and Education, Arts & Media (78.9%).
| Occupation | Male | Female |
| Management | 358 (69.7%) | 156 (30.3%) |
| Business & Financial | 68 (39.5%) | 104 (60.5%) |
| Computers, Engineering & Science | 223 (85.8%) | 37 (14.2%) |
| Computers & Mathematics | 130 (79.3%) | 34 (20.7%) |
| Architecture & Engineering | 63 (100.0%) | 0 (0.0%) |
| Life, Physical & Social Science | 30 (90.9%) | 3 (9.1%) |
| Community & Social Service | 59 (21.7%) | 213 (78.3%) |
| Education, Arts & Media | 8 (21.0%) | 30 (78.9%) |
| Legal Services & Support | 33 (100.0%) | 0 (0.0%) |
| Education Instruction & Library | 18 (11.4%) | 140 (88.6%) |
| Arts, Media & Entertainment | 0 (0.0%) | 43 (100.0%) |
| Health Diagnosing & Treating | 68 (48.6%) | 72 (51.4%) |
| Health Technologists | 68 (48.6%) | 72 (51.4%) |
| Total (Category) | 776 (57.1%) | 582 (42.9%) |
| Total (Overall) | 1,205 (52.7%) | 1,082 (47.3%) |
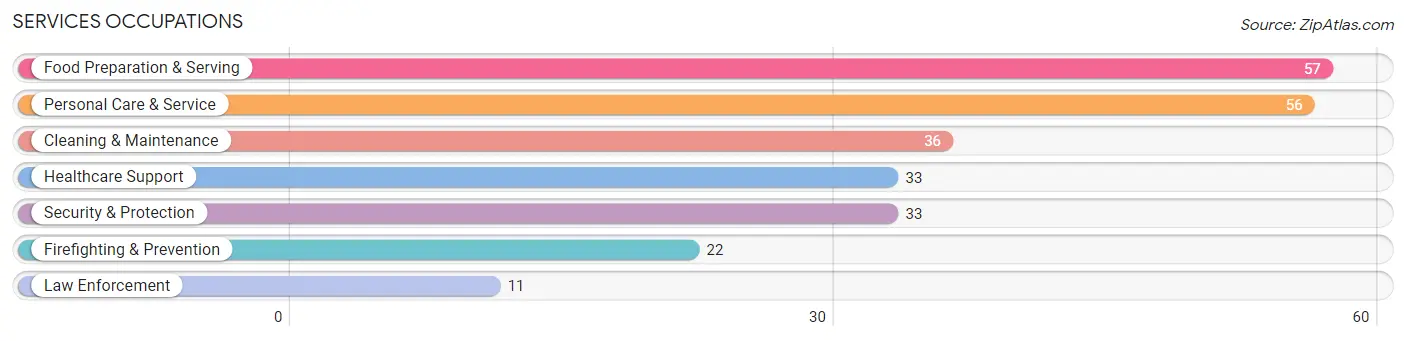
Services Occupations
The most common Services occupations in Lake Barrington are Food Preparation & Serving (57 | 2.5%), Personal Care & Service (56 | 2.5%), Cleaning & Maintenance (36 | 1.6%), Healthcare Support (33 | 1.4%), and Security & Protection (33 | 1.4%).
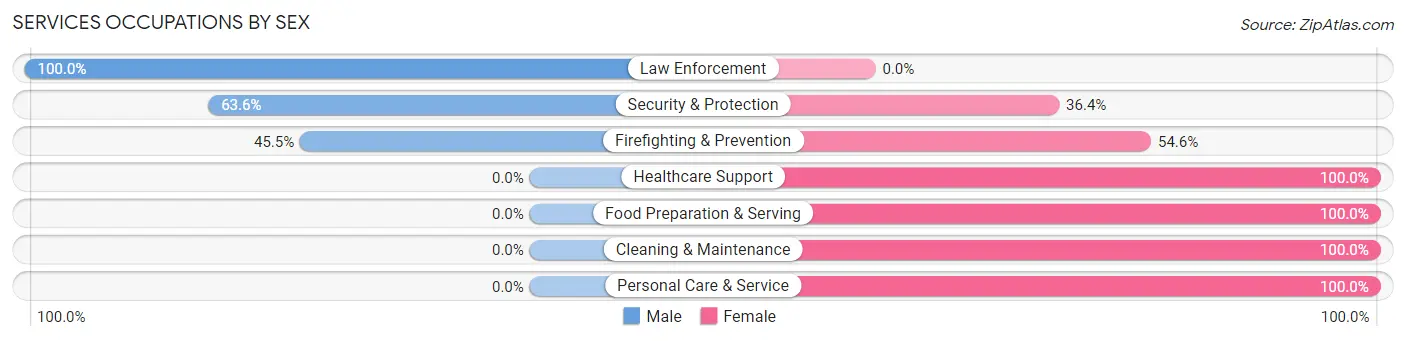
Services Occupations by Sex
Within the Services occupations in Lake Barrington, the most male-oriented occupations are Law Enforcement (100.0%), Security & Protection (63.6%), and Firefighting & Prevention (45.5%), while the most female-oriented occupations are Healthcare Support (100.0%), Food Preparation & Serving (100.0%), and Cleaning & Maintenance (100.0%).
| Occupation | Male | Female |
| Healthcare Support | 0 (0.0%) | 33 (100.0%) |
| Security & Protection | 21 (63.6%) | 12 (36.4%) |
| Firefighting & Prevention | 10 (45.5%) | 12 (54.5%) |
| Law Enforcement | 11 (100.0%) | 0 (0.0%) |
| Food Preparation & Serving | 0 (0.0%) | 57 (100.0%) |
| Cleaning & Maintenance | 0 (0.0%) | 36 (100.0%) |
| Personal Care & Service | 0 (0.0%) | 56 (100.0%) |
| Total (Category) | 21 (9.8%) | 194 (90.2%) |
| Total (Overall) | 1,205 (52.7%) | 1,082 (47.3%) |
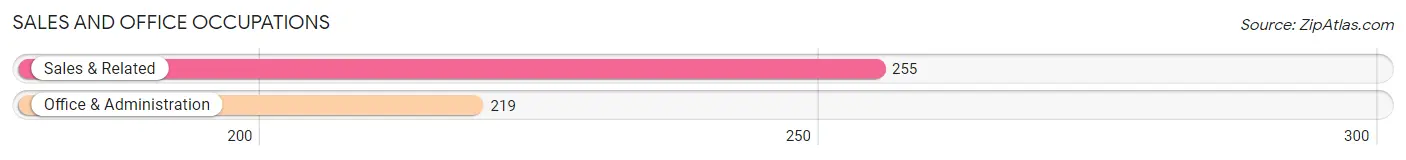
Sales and Office Occupations
The most common Sales and Office occupations in Lake Barrington are Sales & Related (255 | 11.2%), and Office & Administration (219 | 9.6%).
Sales and Office Occupations by Sex
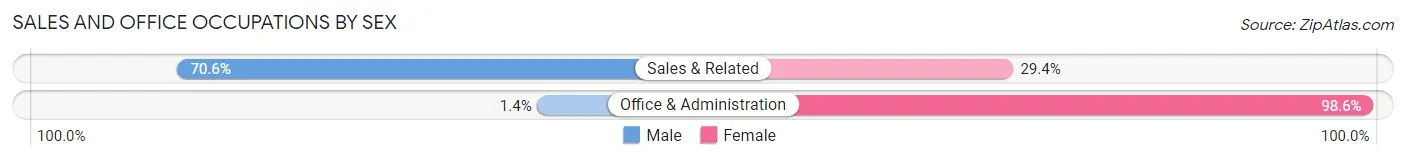
| Occupation | Male | Female |
| Sales & Related | 180 (70.6%) | 75 (29.4%) |
| Office & Administration | 3 (1.4%) | 216 (98.6%) |
| Total (Category) | 183 (38.6%) | 291 (61.4%) |
| Total (Overall) | 1,205 (52.7%) | 1,082 (47.3%) |
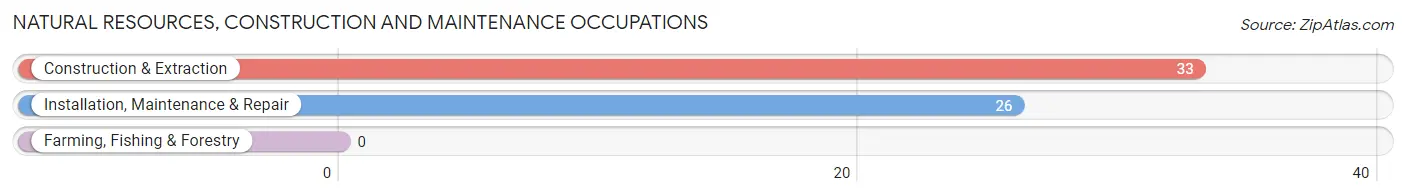
Natural Resources, Construction and Maintenance Occupations
The most common Natural Resources, Construction and Maintenance occupations in Lake Barrington are Construction & Extraction (33 | 1.4%), and Installation, Maintenance & Repair (26 | 1.1%).
Natural Resources, Construction and Maintenance Occupations by Sex
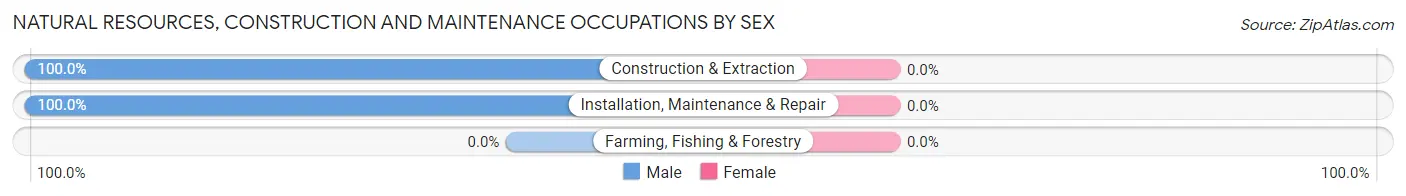
| Occupation | Male | Female |
| Farming, Fishing & Forestry | 0 (0.0%) | 0 (0.0%) |
| Construction & Extraction | 33 (100.0%) | 0 (0.0%) |
| Installation, Maintenance & Repair | 26 (100.0%) | 0 (0.0%) |
| Total (Category) | 59 (100.0%) | 0 (0.0%) |
| Total (Overall) | 1,205 (52.7%) | 1,082 (47.3%) |
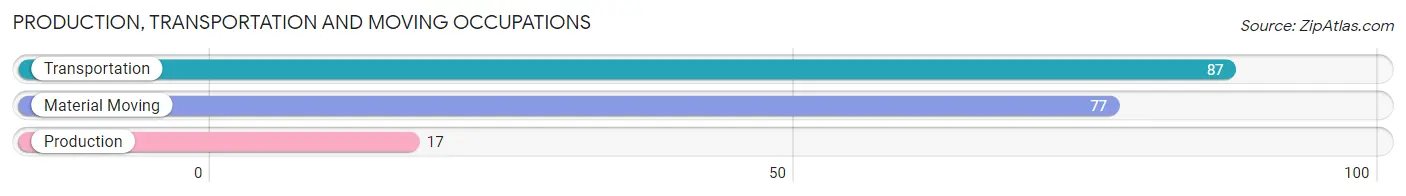
Production, Transportation and Moving Occupations
The most common Production, Transportation and Moving occupations in Lake Barrington are Transportation (87 | 3.8%), Material Moving (77 | 3.4%), and Production (17 | 0.7%).
Production, Transportation and Moving Occupations by Sex
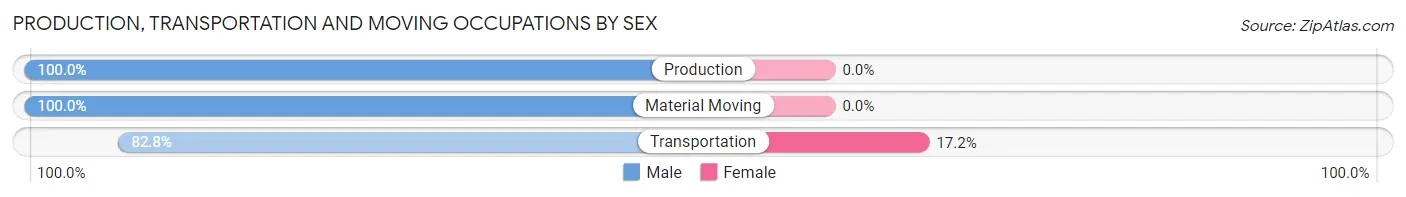
| Occupation | Male | Female |
| Production | 17 (100.0%) | 0 (0.0%) |
| Transportation | 72 (82.8%) | 15 (17.2%) |
| Material Moving | 77 (100.0%) | 0 (0.0%) |
| Total (Category) | 166 (91.7%) | 15 (8.3%) |
| Total (Overall) | 1,205 (52.7%) | 1,082 (47.3%) |
Employment Industries by Sex in Lake Barrington
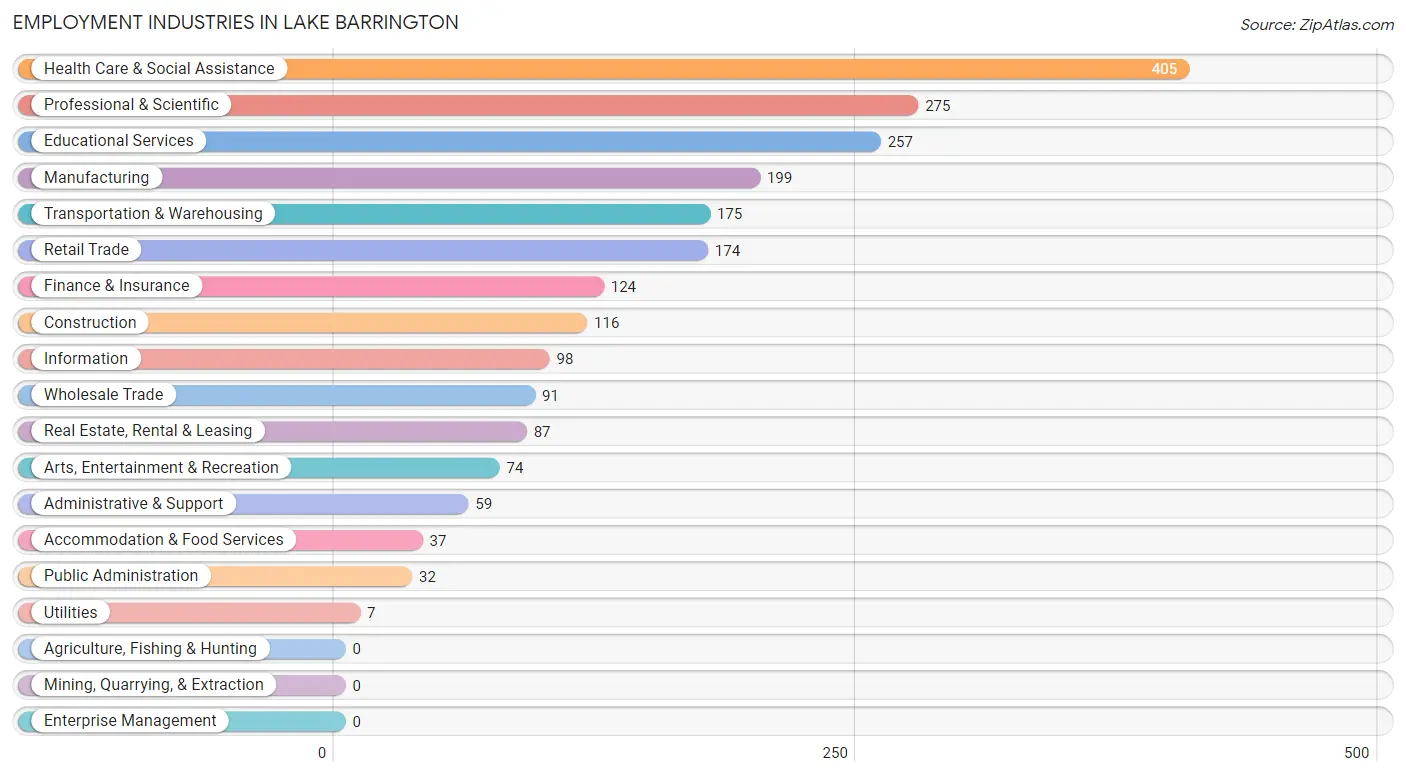
Employment Industries in Lake Barrington
The major employment industries in Lake Barrington include Health Care & Social Assistance (405 | 17.7%), Professional & Scientific (275 | 12.0%), Educational Services (257 | 11.2%), Manufacturing (199 | 8.7%), and Transportation & Warehousing (175 | 7.6%).
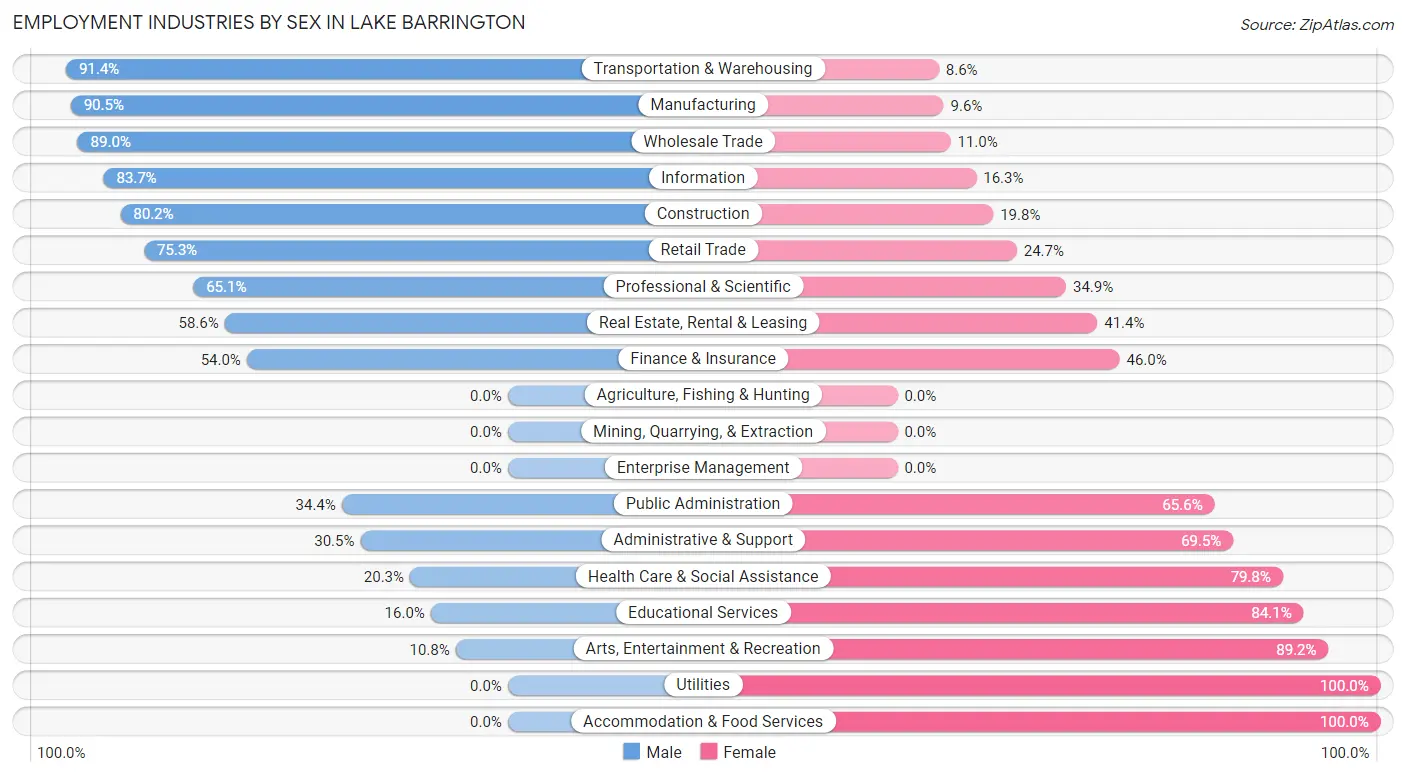
Employment Industries by Sex in Lake Barrington
The Lake Barrington industries that see more men than women are Transportation & Warehousing (91.4%), Manufacturing (90.4%), and Wholesale Trade (89.0%), whereas the industries that tend to have a higher number of women are Utilities (100.0%), Accommodation & Food Services (100.0%), and Arts, Entertainment & Recreation (89.2%).
| Industry | Male | Female |
| Agriculture, Fishing & Hunting | 0 (0.0%) | 0 (0.0%) |
| Mining, Quarrying, & Extraction | 0 (0.0%) | 0 (0.0%) |
| Construction | 93 (80.2%) | 23 (19.8%) |
| Manufacturing | 180 (90.4%) | 19 (9.6%) |
| Wholesale Trade | 81 (89.0%) | 10 (11.0%) |
| Retail Trade | 131 (75.3%) | 43 (24.7%) |
| Transportation & Warehousing | 160 (91.4%) | 15 (8.6%) |
| Utilities | 0 (0.0%) | 7 (100.0%) |
| Information | 82 (83.7%) | 16 (16.3%) |
| Finance & Insurance | 67 (54.0%) | 57 (46.0%) |
| Real Estate, Rental & Leasing | 51 (58.6%) | 36 (41.4%) |
| Professional & Scientific | 179 (65.1%) | 96 (34.9%) |
| Enterprise Management | 0 (0.0%) | 0 (0.0%) |
| Administrative & Support | 18 (30.5%) | 41 (69.5%) |
| Educational Services | 41 (16.0%) | 216 (84.1%) |
| Health Care & Social Assistance | 82 (20.3%) | 323 (79.7%) |
| Arts, Entertainment & Recreation | 8 (10.8%) | 66 (89.2%) |
| Accommodation & Food Services | 0 (0.0%) | 37 (100.0%) |
| Public Administration | 11 (34.4%) | 21 (65.6%) |
| Total | 1,205 (52.7%) | 1,082 (47.3%) |
Education in Lake Barrington
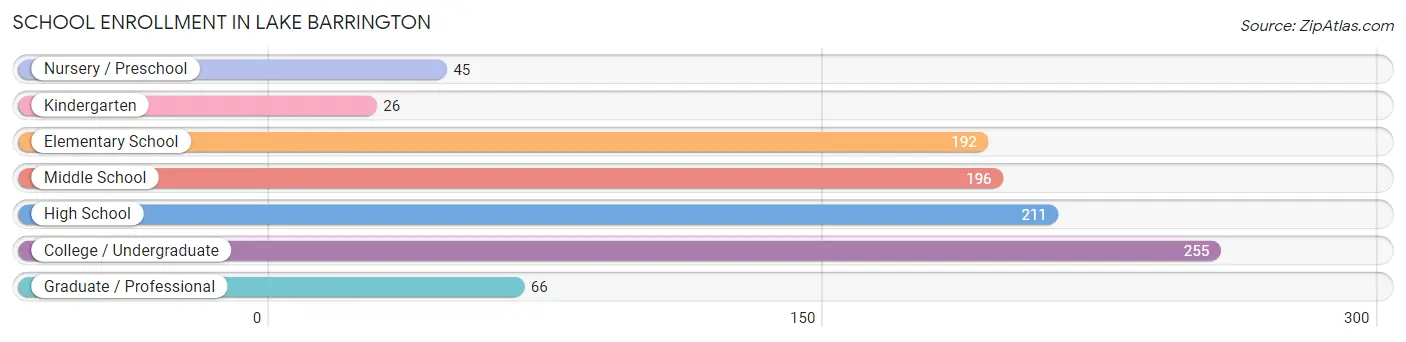
School Enrollment in Lake Barrington
The most common levels of schooling among the 991 students in Lake Barrington are college / undergraduate (255 | 25.7%), high school (211 | 21.3%), and middle school (196 | 19.8%).
| School Level | # Students | % Students |
| Nursery / Preschool | 45 | 4.5% |
| Kindergarten | 26 | 2.6% |
| Elementary School | 192 | 19.4% |
| Middle School | 196 | 19.8% |
| High School | 211 | 21.3% |
| College / Undergraduate | 255 | 25.7% |
| Graduate / Professional | 66 | 6.7% |
| Total | 991 | 100.0% |
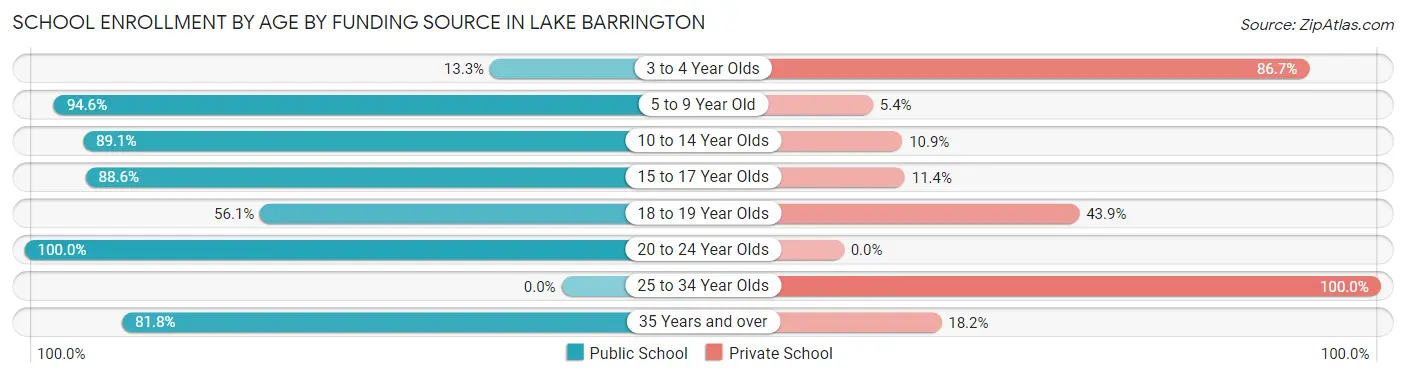
School Enrollment by Age by Funding Source in Lake Barrington
Out of a total of 991 students who are enrolled in schools in Lake Barrington, 195 (19.7%) attend a private institution, while the remaining 796 (80.3%) are enrolled in public schools. The age group of 25 to 34 year olds has the highest likelihood of being enrolled in private schools, with 29 (100.0% in the age bracket) enrolled. Conversely, the age group of 20 to 24 year olds has the lowest likelihood of being enrolled in a private school, with 117 (100.0% in the age bracket) attending a public institution.
| Age Bracket | Public School | Private School |
| 3 to 4 Year Olds | 6 (13.3%) | 39 (86.7%) |
| 5 to 9 Year Old | 174 (94.6%) | 10 (5.4%) |
| 10 to 14 Year Olds | 237 (89.1%) | 29 (10.9%) |
| 15 to 17 Year Olds | 148 (88.6%) | 19 (11.4%) |
| 18 to 19 Year Olds | 78 (56.1%) | 61 (43.9%) |
| 20 to 24 Year Olds | 117 (100.0%) | 0 (0.0%) |
| 25 to 34 Year Olds | 0 (0.0%) | 29 (100.0%) |
| 35 Years and over | 36 (81.8%) | 8 (18.2%) |
| Total | 796 (80.3%) | 195 (19.7%) |
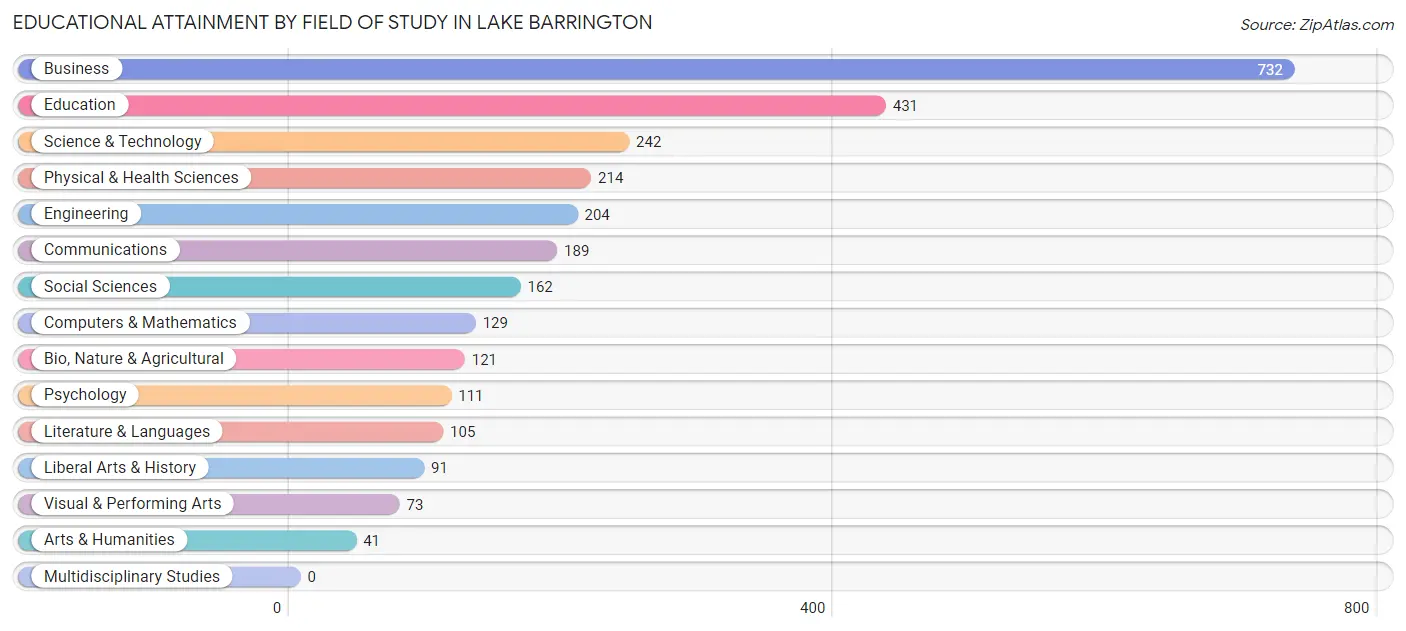
Educational Attainment by Field of Study in Lake Barrington
Business (732 | 25.7%), education (431 | 15.1%), science & technology (242 | 8.5%), physical & health sciences (214 | 7.5%), and engineering (204 | 7.2%) are the most common fields of study among 2,845 individuals in Lake Barrington who have obtained a bachelor's degree or higher.
| Field of Study | # Graduates | % Graduates |
| Computers & Mathematics | 129 | 4.5% |
| Bio, Nature & Agricultural | 121 | 4.3% |
| Physical & Health Sciences | 214 | 7.5% |
| Psychology | 111 | 3.9% |
| Social Sciences | 162 | 5.7% |
| Engineering | 204 | 7.2% |
| Multidisciplinary Studies | 0 | 0.0% |
| Science & Technology | 242 | 8.5% |
| Business | 732 | 25.7% |
| Education | 431 | 15.1% |
| Literature & Languages | 105 | 3.7% |
| Liberal Arts & History | 91 | 3.2% |
| Visual & Performing Arts | 73 | 2.6% |
| Communications | 189 | 6.6% |
| Arts & Humanities | 41 | 1.4% |
| Total | 2,845 | 100.0% |
Transportation & Commute in Lake Barrington
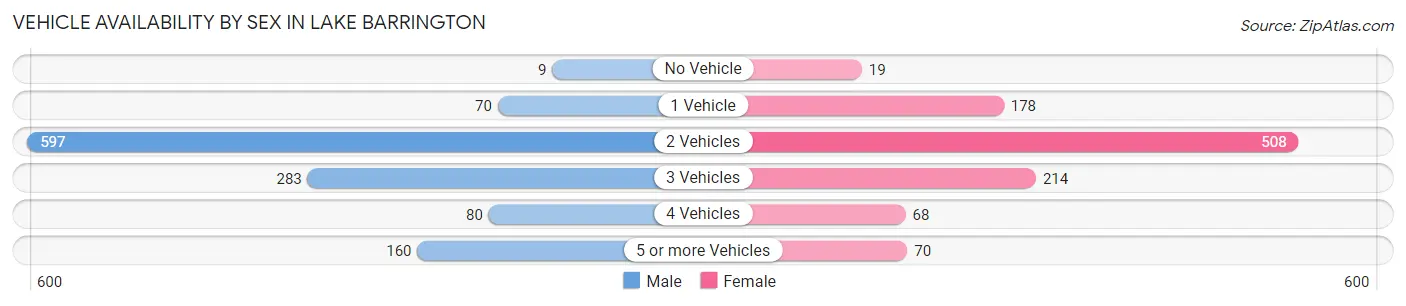
Vehicle Availability by Sex in Lake Barrington
The most prevalent vehicle ownership categories in Lake Barrington are males with 2 vehicles (597, accounting for 49.8%) and females with 2 vehicles (508, making up 56.5%).
| Vehicles Available | Male | Female |
| No Vehicle | 9 (0.7%) | 19 (1.8%) |
| 1 Vehicle | 70 (5.8%) | 178 (16.8%) |
| 2 Vehicles | 597 (49.8%) | 508 (48.1%) |
| 3 Vehicles | 283 (23.6%) | 214 (20.3%) |
| 4 Vehicles | 80 (6.7%) | 68 (6.4%) |
| 5 or more Vehicles | 160 (13.3%) | 70 (6.6%) |
| Total | 1,199 (100.0%) | 1,057 (100.0%) |
Commute Time in Lake Barrington
The most frequently occuring commute durations in Lake Barrington are 30 to 34 minutes (304 commuters, 17.1%), 10 to 14 minutes (245 commuters, 13.8%), and 45 to 59 minutes (242 commuters, 13.6%).
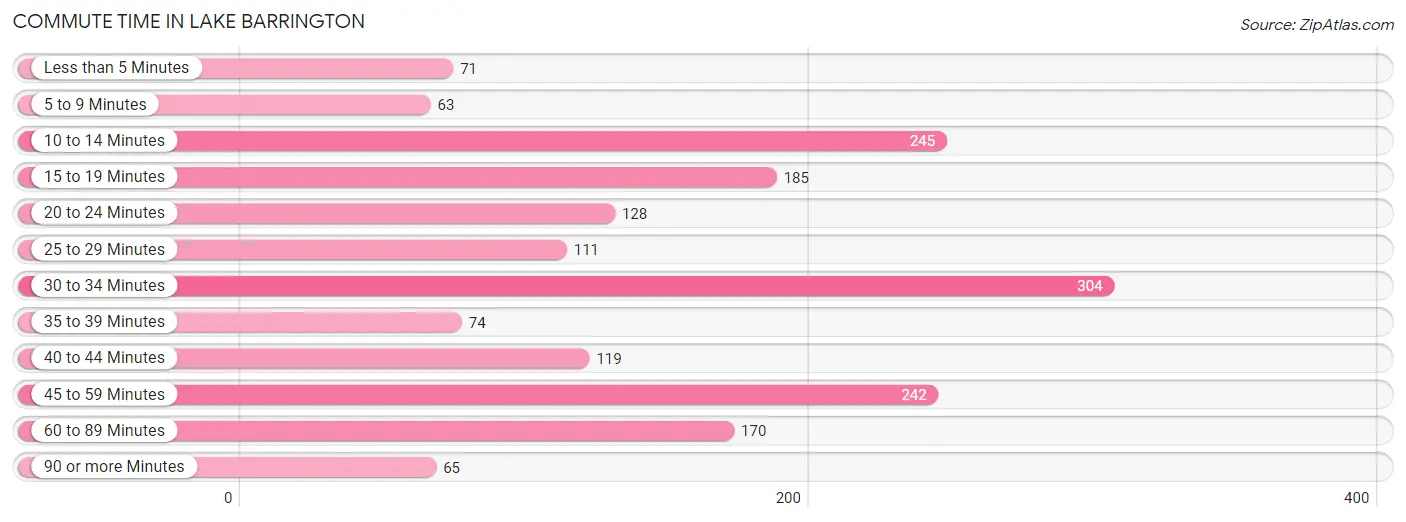
| Commute Time | # Commuters | % Commuters |
| Less than 5 Minutes | 71 | 4.0% |
| 5 to 9 Minutes | 63 | 3.5% |
| 10 to 14 Minutes | 245 | 13.8% |
| 15 to 19 Minutes | 185 | 10.4% |
| 20 to 24 Minutes | 128 | 7.2% |
| 25 to 29 Minutes | 111 | 6.2% |
| 30 to 34 Minutes | 304 | 17.1% |
| 35 to 39 Minutes | 74 | 4.2% |
| 40 to 44 Minutes | 119 | 6.7% |
| 45 to 59 Minutes | 242 | 13.6% |
| 60 to 89 Minutes | 170 | 9.6% |
| 90 or more Minutes | 65 | 3.7% |
Commute Time by Sex in Lake Barrington
The most common commute times in Lake Barrington are 45 to 59 minutes (183 commuters, 19.7%) for males and 30 to 34 minutes (194 commuters, 22.8%) for females.
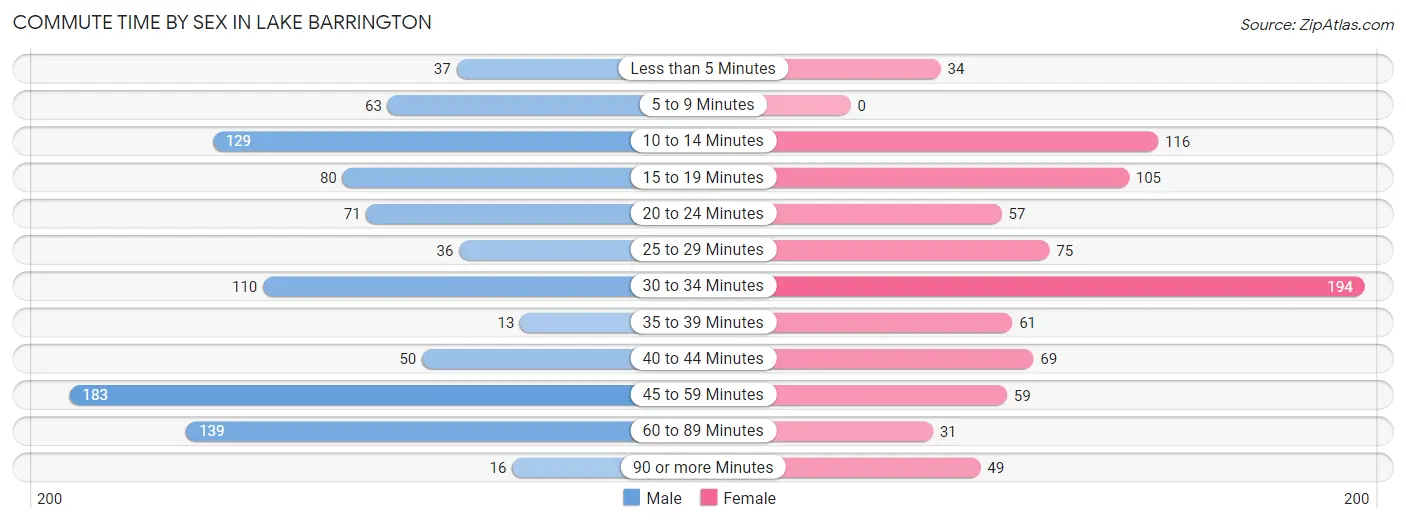
| Commute Time | Male | Female |
| Less than 5 Minutes | 37 (4.0%) | 34 (4.0%) |
| 5 to 9 Minutes | 63 (6.8%) | 0 (0.0%) |
| 10 to 14 Minutes | 129 (13.9%) | 116 (13.7%) |
| 15 to 19 Minutes | 80 (8.6%) | 105 (12.3%) |
| 20 to 24 Minutes | 71 (7.7%) | 57 (6.7%) |
| 25 to 29 Minutes | 36 (3.9%) | 75 (8.8%) |
| 30 to 34 Minutes | 110 (11.9%) | 194 (22.8%) |
| 35 to 39 Minutes | 13 (1.4%) | 61 (7.2%) |
| 40 to 44 Minutes | 50 (5.4%) | 69 (8.1%) |
| 45 to 59 Minutes | 183 (19.7%) | 59 (6.9%) |
| 60 to 89 Minutes | 139 (15.0%) | 31 (3.6%) |
| 90 or more Minutes | 16 (1.7%) | 49 (5.8%) |
Time of Departure to Work by Sex in Lake Barrington
The most frequent times of departure to work in Lake Barrington are 8:00 AM to 8:29 AM (253, 27.3%) for males and 7:00 AM to 7:29 AM (183, 21.5%) for females.
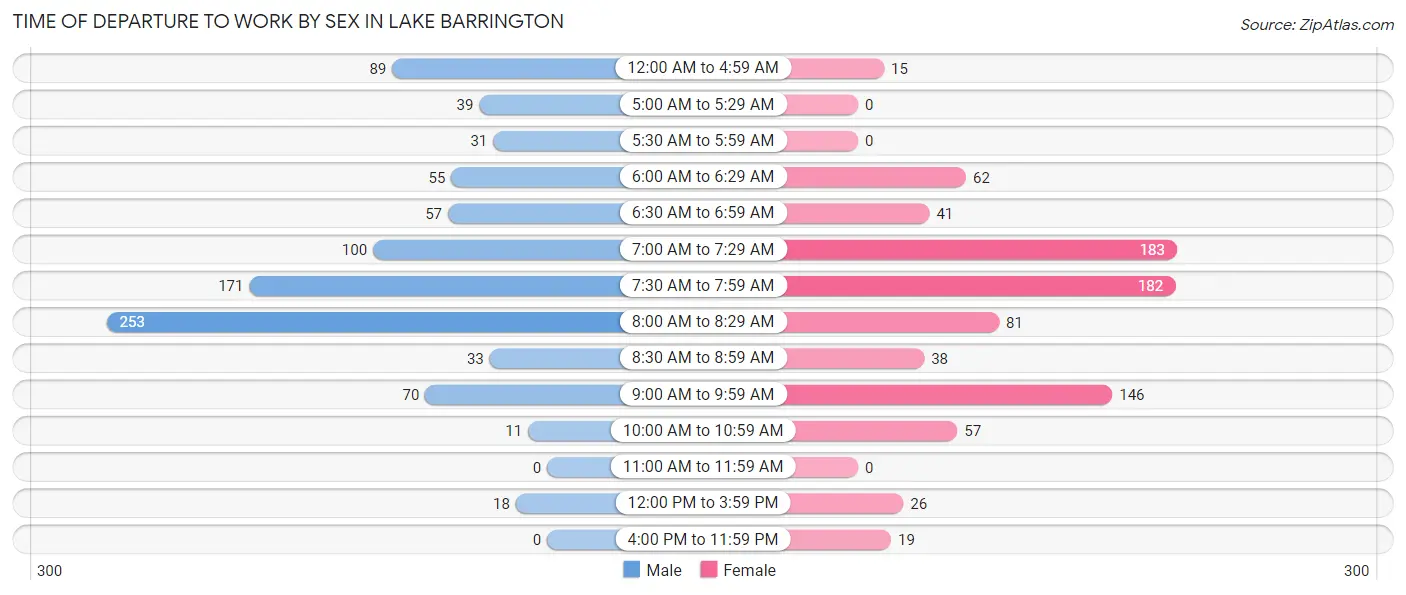
| Time of Departure | Male | Female |
| 12:00 AM to 4:59 AM | 89 (9.6%) | 15 (1.8%) |
| 5:00 AM to 5:29 AM | 39 (4.2%) | 0 (0.0%) |
| 5:30 AM to 5:59 AM | 31 (3.3%) | 0 (0.0%) |
| 6:00 AM to 6:29 AM | 55 (5.9%) | 62 (7.3%) |
| 6:30 AM to 6:59 AM | 57 (6.1%) | 41 (4.8%) |
| 7:00 AM to 7:29 AM | 100 (10.8%) | 183 (21.5%) |
| 7:30 AM to 7:59 AM | 171 (18.4%) | 182 (21.4%) |
| 8:00 AM to 8:29 AM | 253 (27.3%) | 81 (9.5%) |
| 8:30 AM to 8:59 AM | 33 (3.6%) | 38 (4.5%) |
| 9:00 AM to 9:59 AM | 70 (7.5%) | 146 (17.2%) |
| 10:00 AM to 10:59 AM | 11 (1.2%) | 57 (6.7%) |
| 11:00 AM to 11:59 AM | 0 (0.0%) | 0 (0.0%) |
| 12:00 PM to 3:59 PM | 18 (1.9%) | 26 (3.1%) |
| 4:00 PM to 11:59 PM | 0 (0.0%) | 19 (2.2%) |
| Total | 927 (100.0%) | 850 (100.0%) |
Housing Occupancy in Lake Barrington
Occupancy by Ownership in Lake Barrington
Of the total 2,414 dwellings in Lake Barrington, owner-occupied units account for 2,166 (89.7%), while renter-occupied units make up 248 (10.3%).
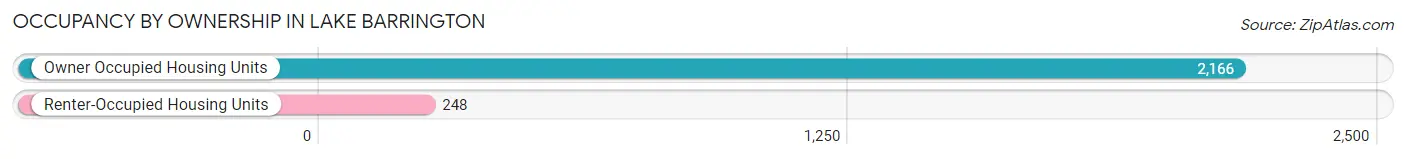
| Occupancy | # Housing Units | % Housing Units |
| Owner Occupied Housing Units | 2,166 | 89.7% |
| Renter-Occupied Housing Units | 248 | 10.3% |
| Total Occupied Housing Units | 2,414 | 100.0% |
Occupancy by Household Size in Lake Barrington
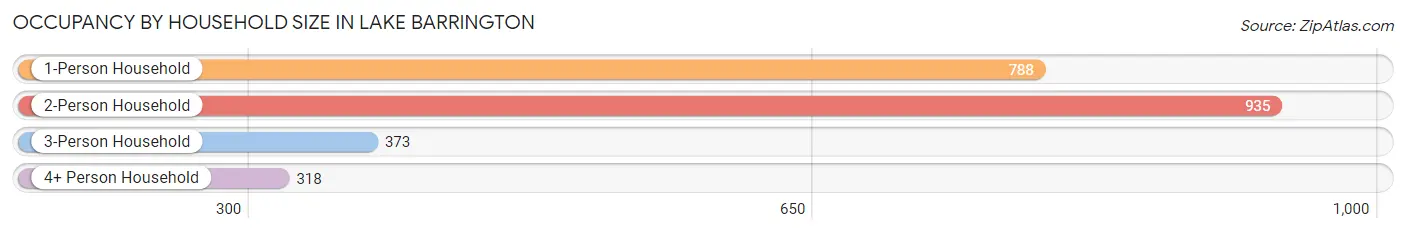
| Household Size | # Housing Units | % Housing Units |
| 1-Person Household | 788 | 32.6% |
| 2-Person Household | 935 | 38.7% |
| 3-Person Household | 373 | 15.4% |
| 4+ Person Household | 318 | 13.2% |
| Total Housing Units | 2,414 | 100.0% |
Occupancy by Ownership by Household Size in Lake Barrington
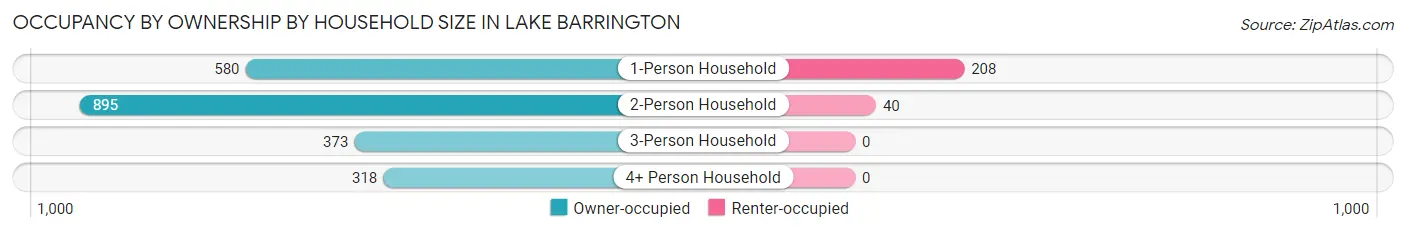
| Household Size | Owner-occupied | Renter-occupied |
| 1-Person Household | 580 (73.6%) | 208 (26.4%) |
| 2-Person Household | 895 (95.7%) | 40 (4.3%) |
| 3-Person Household | 373 (100.0%) | 0 (0.0%) |
| 4+ Person Household | 318 (100.0%) | 0 (0.0%) |
| Total Housing Units | 2,166 (89.7%) | 248 (10.3%) |
Occupancy by Educational Attainment in Lake Barrington
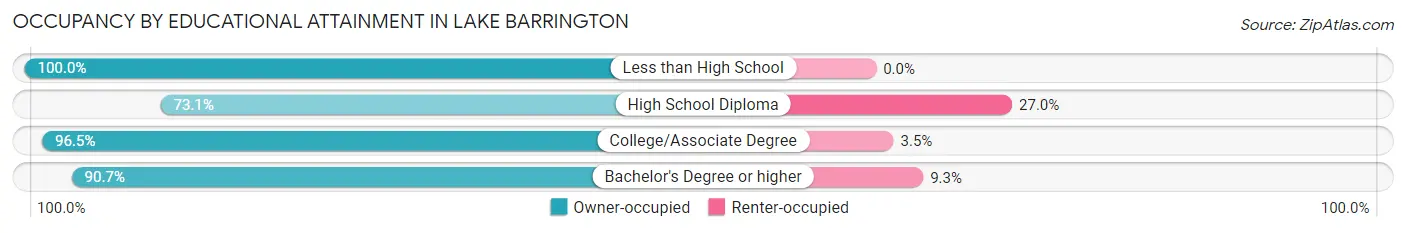
| Household Size | Owner-occupied | Renter-occupied |
| Less than High School | 29 (100.0%) | 0 (0.0%) |
| High School Diploma | 225 (73.1%) | 83 (27.0%) |
| College/Associate Degree | 474 (96.5%) | 17 (3.5%) |
| Bachelor's Degree or higher | 1,438 (90.7%) | 148 (9.3%) |
Occupancy by Age of Householder in Lake Barrington
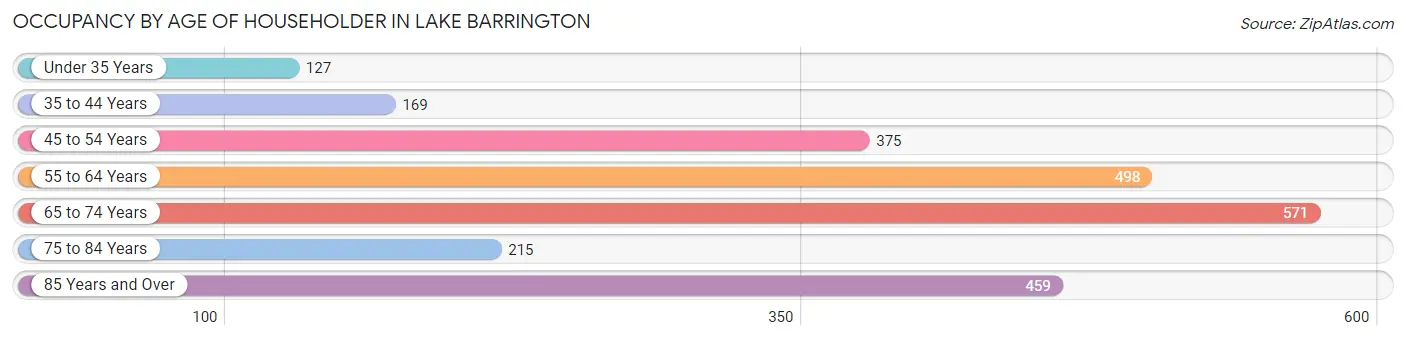
| Age Bracket | # Households | % Households |
| Under 35 Years | 127 | 5.3% |
| 35 to 44 Years | 169 | 7.0% |
| 45 to 54 Years | 375 | 15.5% |
| 55 to 64 Years | 498 | 20.6% |
| 65 to 74 Years | 571 | 23.6% |
| 75 to 84 Years | 215 | 8.9% |
| 85 Years and Over | 459 | 19.0% |
| Total | 2,414 | 100.0% |
Housing Finances in Lake Barrington
Median Income by Occupancy in Lake Barrington
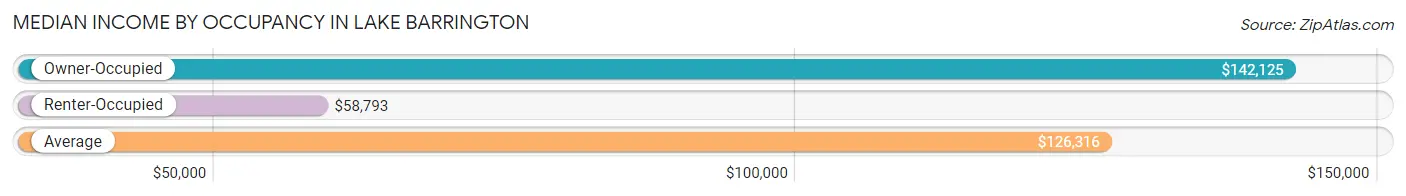
| Occupancy Type | # Households | Median Income |
| Owner-Occupied | 2,166 (89.7%) | $142,125 |
| Renter-Occupied | 248 (10.3%) | $58,793 |
| Average | 2,414 (100.0%) | $126,316 |
Occupancy by Householder Income Bracket in Lake Barrington
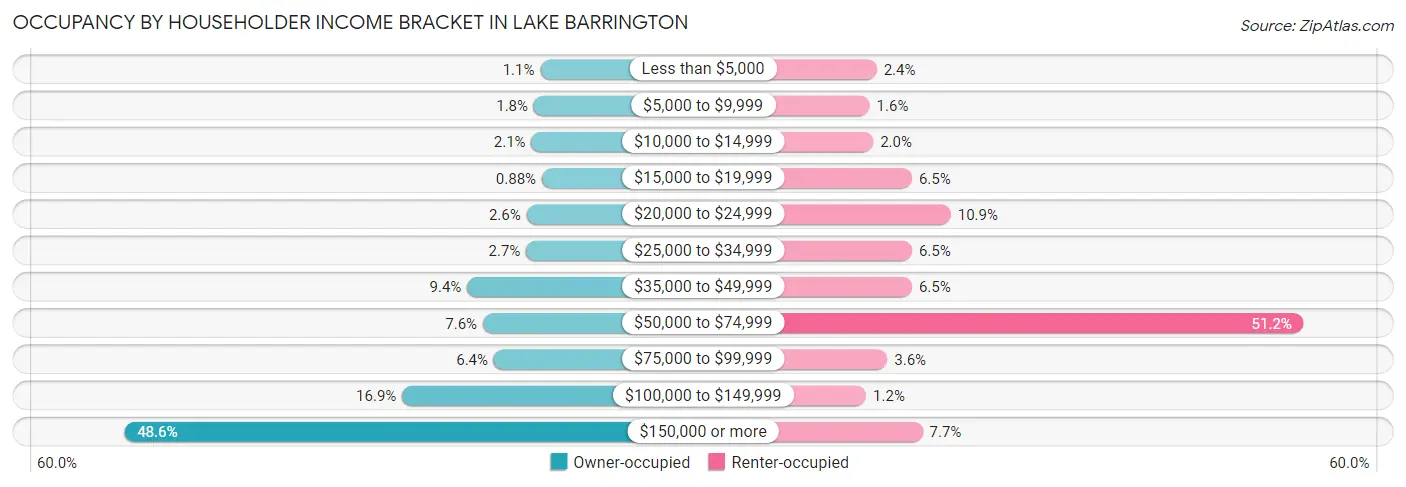
| Income Bracket | Owner-occupied | Renter-occupied |
| Less than $5,000 | 23 (1.1%) | 6 (2.4%) |
| $5,000 to $9,999 | 39 (1.8%) | 4 (1.6%) |
| $10,000 to $14,999 | 45 (2.1%) | 5 (2.0%) |
| $15,000 to $19,999 | 19 (0.9%) | 16 (6.5%) |
| $20,000 to $24,999 | 57 (2.6%) | 27 (10.9%) |
| $25,000 to $34,999 | 58 (2.7%) | 16 (6.5%) |
| $35,000 to $49,999 | 204 (9.4%) | 16 (6.5%) |
| $50,000 to $74,999 | 165 (7.6%) | 127 (51.2%) |
| $75,000 to $99,999 | 138 (6.4%) | 9 (3.6%) |
| $100,000 to $149,999 | 365 (16.9%) | 3 (1.2%) |
| $150,000 or more | 1,053 (48.6%) | 19 (7.7%) |
| Total | 2,166 (100.0%) | 248 (100.0%) |
Monthly Housing Cost Tiers in Lake Barrington
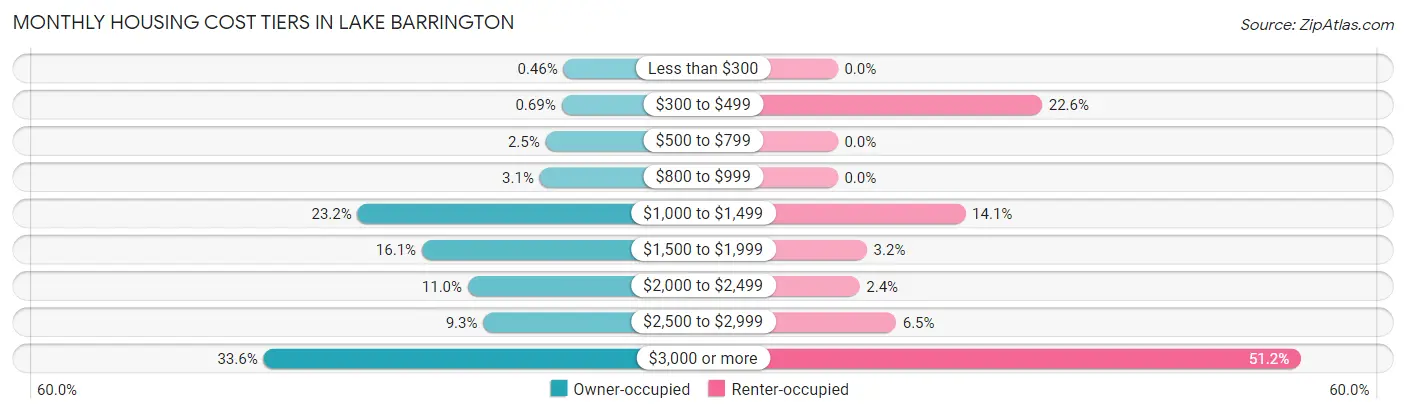
| Monthly Cost | Owner-occupied | Renter-occupied |
| Less than $300 | 10 (0.5%) | 0 (0.0%) |
| $300 to $499 | 15 (0.7%) | 56 (22.6%) |
| $500 to $799 | 53 (2.5%) | 0 (0.0%) |
| $800 to $999 | 67 (3.1%) | 0 (0.0%) |
| $1,000 to $1,499 | 503 (23.2%) | 35 (14.1%) |
| $1,500 to $1,999 | 349 (16.1%) | 8 (3.2%) |
| $2,000 to $2,499 | 239 (11.0%) | 6 (2.4%) |
| $2,500 to $2,999 | 202 (9.3%) | 16 (6.5%) |
| $3,000 or more | 728 (33.6%) | 127 (51.2%) |
| Total | 2,166 (100.0%) | 248 (100.0%) |
Physical Housing Characteristics in Lake Barrington
Housing Structures in Lake Barrington
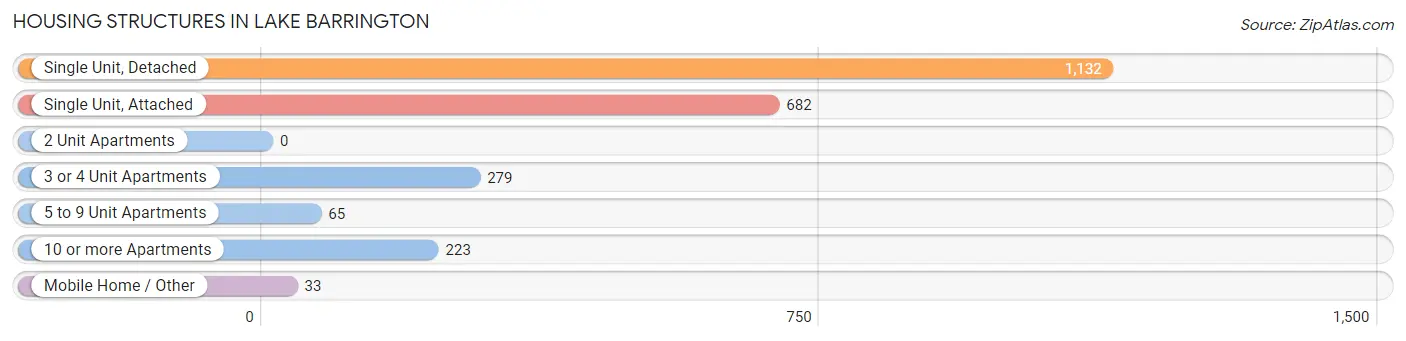
| Structure Type | # Housing Units | % Housing Units |
| Single Unit, Detached | 1,132 | 46.9% |
| Single Unit, Attached | 682 | 28.2% |
| 2 Unit Apartments | 0 | 0.0% |
| 3 or 4 Unit Apartments | 279 | 11.6% |
| 5 to 9 Unit Apartments | 65 | 2.7% |
| 10 or more Apartments | 223 | 9.2% |
| Mobile Home / Other | 33 | 1.4% |
| Total | 2,414 | 100.0% |
Housing Structures by Occupancy in Lake Barrington
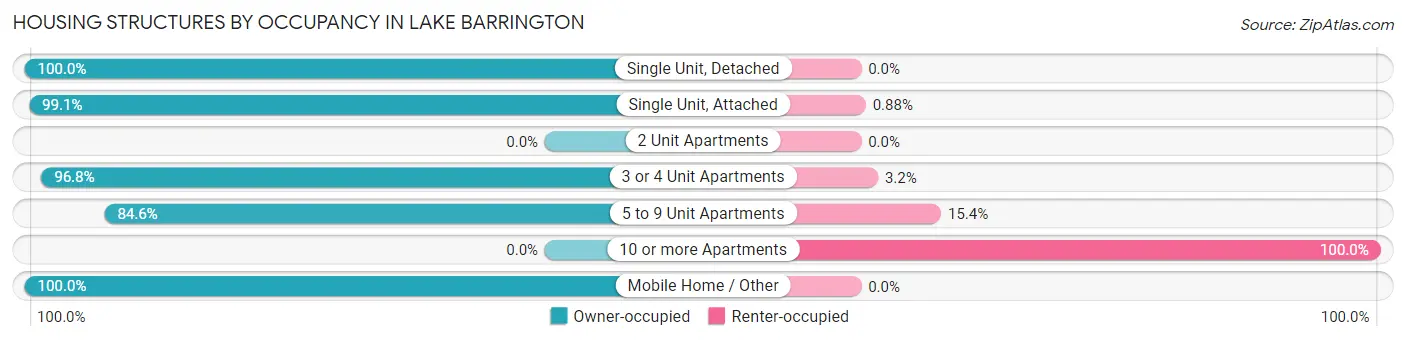
| Structure Type | Owner-occupied | Renter-occupied |
| Single Unit, Detached | 1,132 (100.0%) | 0 (0.0%) |
| Single Unit, Attached | 676 (99.1%) | 6 (0.9%) |
| 2 Unit Apartments | 0 (0.0%) | 0 (0.0%) |
| 3 or 4 Unit Apartments | 270 (96.8%) | 9 (3.2%) |
| 5 to 9 Unit Apartments | 55 (84.6%) | 10 (15.4%) |
| 10 or more Apartments | 0 (0.0%) | 223 (100.0%) |
| Mobile Home / Other | 33 (100.0%) | 0 (0.0%) |
| Total | 2,166 (89.7%) | 248 (10.3%) |
Housing Structures by Number of Rooms in Lake Barrington
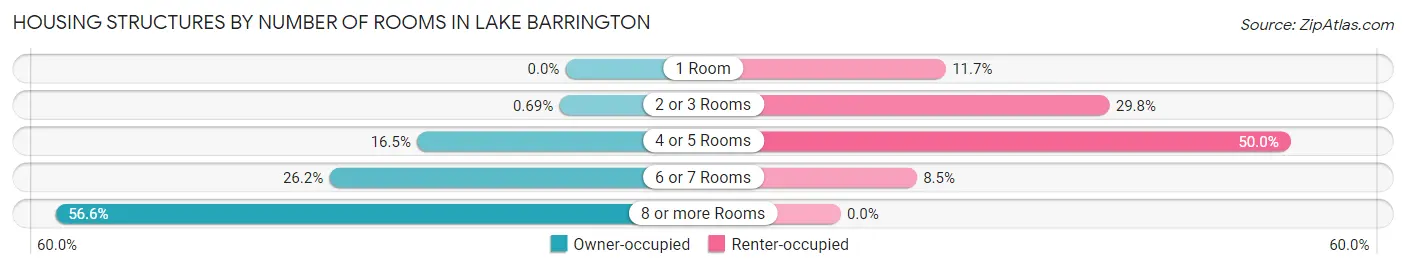
| Number of Rooms | Owner-occupied | Renter-occupied |
| 1 Room | 0 (0.0%) | 29 (11.7%) |
| 2 or 3 Rooms | 15 (0.7%) | 74 (29.8%) |
| 4 or 5 Rooms | 357 (16.5%) | 124 (50.0%) |
| 6 or 7 Rooms | 568 (26.2%) | 21 (8.5%) |
| 8 or more Rooms | 1,226 (56.6%) | 0 (0.0%) |
| Total | 2,166 (100.0%) | 248 (100.0%) |
Housing Structure by Heating Type in Lake Barrington
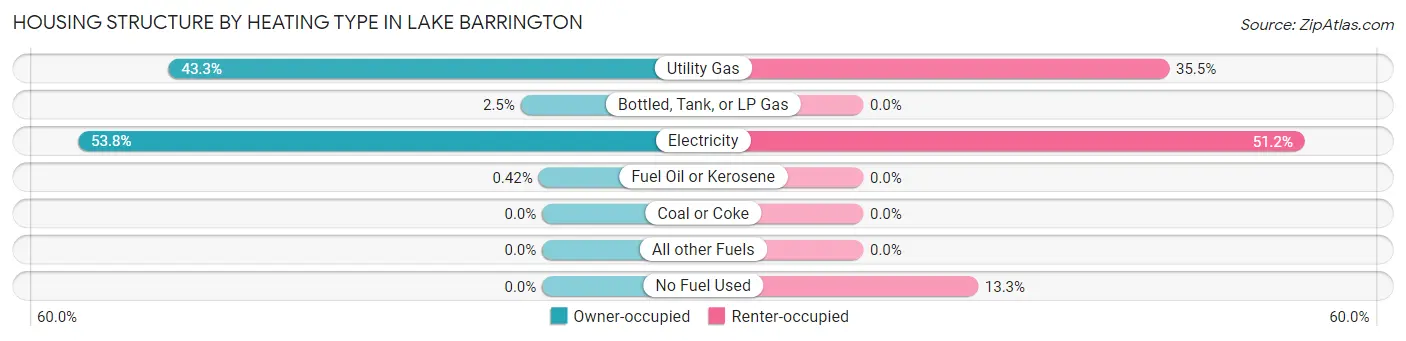
| Heating Type | Owner-occupied | Renter-occupied |
| Utility Gas | 938 (43.3%) | 88 (35.5%) |
| Bottled, Tank, or LP Gas | 54 (2.5%) | 0 (0.0%) |
| Electricity | 1,165 (53.8%) | 127 (51.2%) |
| Fuel Oil or Kerosene | 9 (0.4%) | 0 (0.0%) |
| Coal or Coke | 0 (0.0%) | 0 (0.0%) |
| All other Fuels | 0 (0.0%) | 0 (0.0%) |
| No Fuel Used | 0 (0.0%) | 33 (13.3%) |
| Total | 2,166 (100.0%) | 248 (100.0%) |
Household Vehicle Usage in Lake Barrington
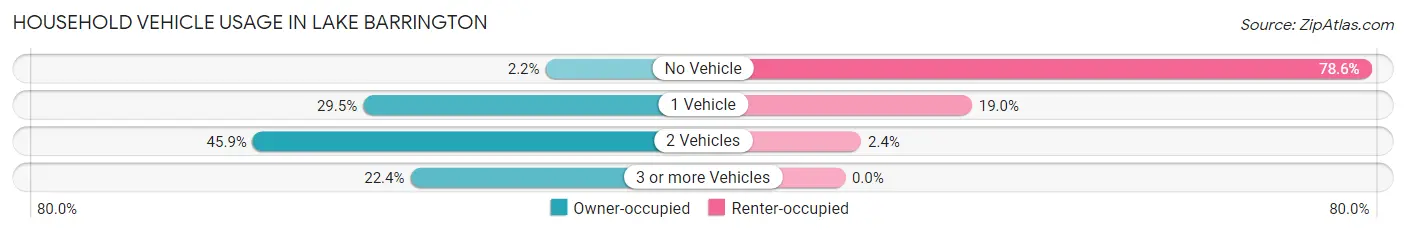
| Vehicles per Household | Owner-occupied | Renter-occupied |
| No Vehicle | 48 (2.2%) | 195 (78.6%) |
| 1 Vehicle | 638 (29.5%) | 47 (19.0%) |
| 2 Vehicles | 995 (45.9%) | 6 (2.4%) |
| 3 or more Vehicles | 485 (22.4%) | 0 (0.0%) |
| Total | 2,166 (100.0%) | 248 (100.0%) |
Real Estate & Mortgages in Lake Barrington
Real Estate and Mortgage Overview in Lake Barrington
| Characteristic | Without Mortgage | With Mortgage |
| Housing Units | 709 | 1,457 |
| Median Property Value | $392,400 | $478,400 |
| Median Household Income | $102,279 | $825 |
| Monthly Housing Costs | $1,335 | $728 |
| Real Estate Taxes | $7,641 | $15 |
Property Value by Mortgage Status in Lake Barrington
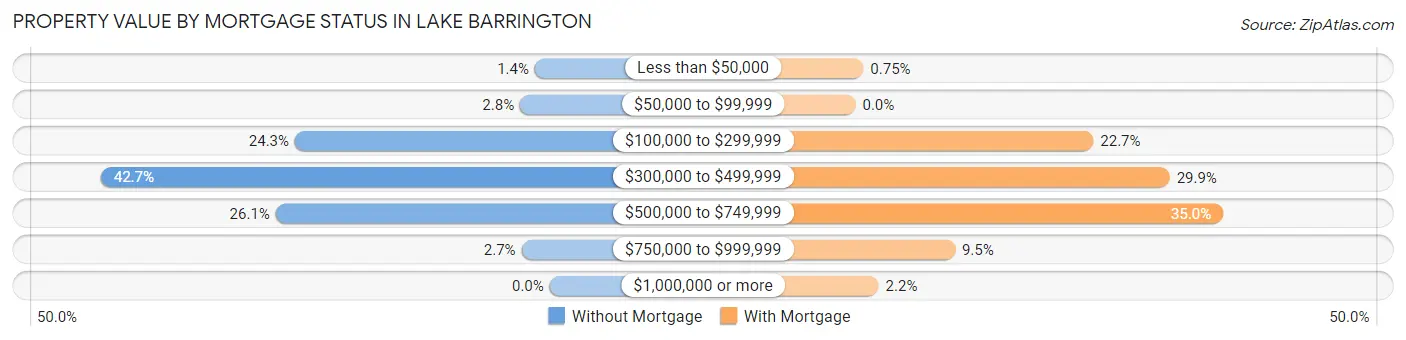
| Property Value | Without Mortgage | With Mortgage |
| Less than $50,000 | 10 (1.4%) | 11 (0.7%) |
| $50,000 to $99,999 | 20 (2.8%) | 0 (0.0%) |
| $100,000 to $299,999 | 172 (24.3%) | 330 (22.7%) |
| $300,000 to $499,999 | 303 (42.7%) | 436 (29.9%) |
| $500,000 to $749,999 | 185 (26.1%) | 510 (35.0%) |
| $750,000 to $999,999 | 19 (2.7%) | 138 (9.5%) |
| $1,000,000 or more | 0 (0.0%) | 32 (2.2%) |
| Total | 709 (100.0%) | 1,457 (100.0%) |
Household Income by Mortgage Status in Lake Barrington
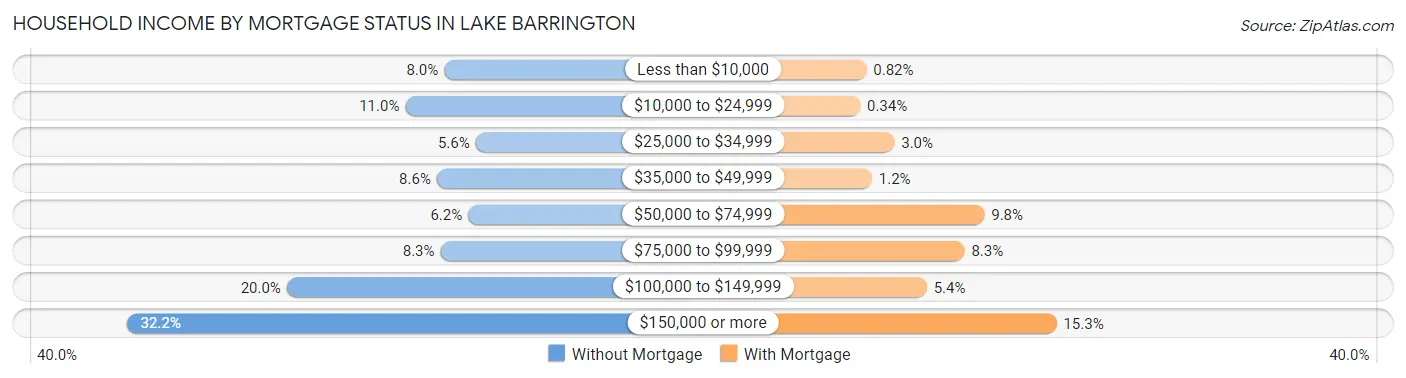
| Household Income | Without Mortgage | With Mortgage |
| Less than $10,000 | 57 (8.0%) | 12 (0.8%) |
| $10,000 to $24,999 | 78 (11.0%) | 5 (0.3%) |
| $25,000 to $34,999 | 40 (5.6%) | 43 (2.9%) |
| $35,000 to $49,999 | 61 (8.6%) | 18 (1.2%) |
| $50,000 to $74,999 | 44 (6.2%) | 143 (9.8%) |
| $75,000 to $99,999 | 59 (8.3%) | 121 (8.3%) |
| $100,000 to $149,999 | 142 (20.0%) | 79 (5.4%) |
| $150,000 or more | 228 (32.2%) | 223 (15.3%) |
| Total | 709 (100.0%) | 1,457 (100.0%) |
Property Value to Household Income Ratio in Lake Barrington
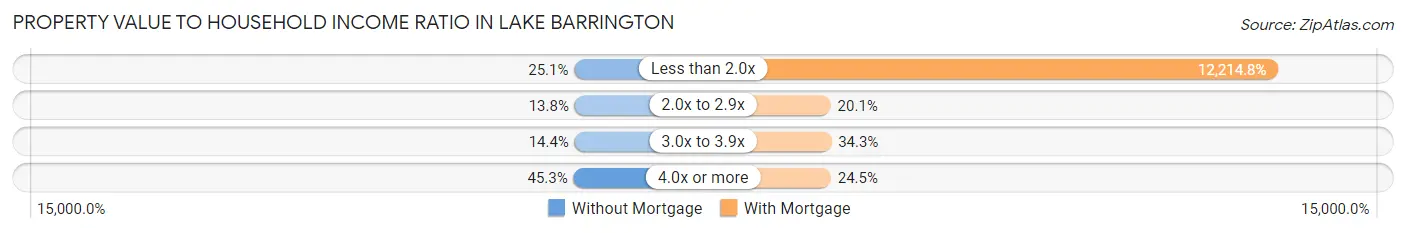
| Value-to-Income Ratio | Without Mortgage | With Mortgage |
| Less than 2.0x | 178 (25.1%) | 177,969 (12,214.8%) |
| 2.0x to 2.9x | 98 (13.8%) | 293 (20.1%) |
| 3.0x to 3.9x | 102 (14.4%) | 500 (34.3%) |
| 4.0x or more | 321 (45.3%) | 357 (24.5%) |
| Total | 709 (100.0%) | 1,457 (100.0%) |
Real Estate Taxes by Mortgage Status in Lake Barrington
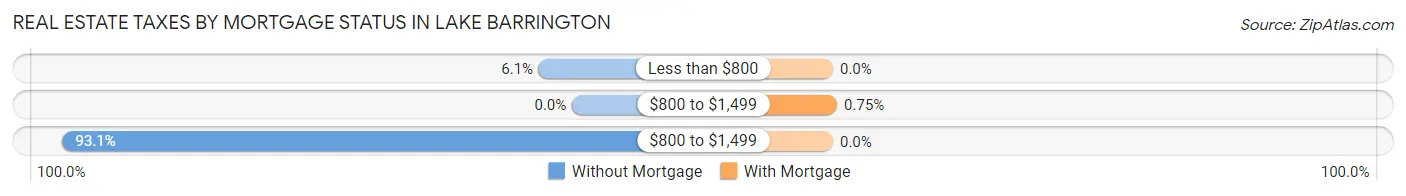
| Property Taxes | Without Mortgage | With Mortgage |
| Less than $800 | 43 (6.1%) | 0 (0.0%) |
| $800 to $1,499 | 0 (0.0%) | 11 (0.7%) |
| $800 to $1,499 | 660 (93.1%) | 0 (0.0%) |
| Total | 709 (100.0%) | 1,457 (100.0%) |
Health & Disability in Lake Barrington
Health Insurance Coverage by Age in Lake Barrington
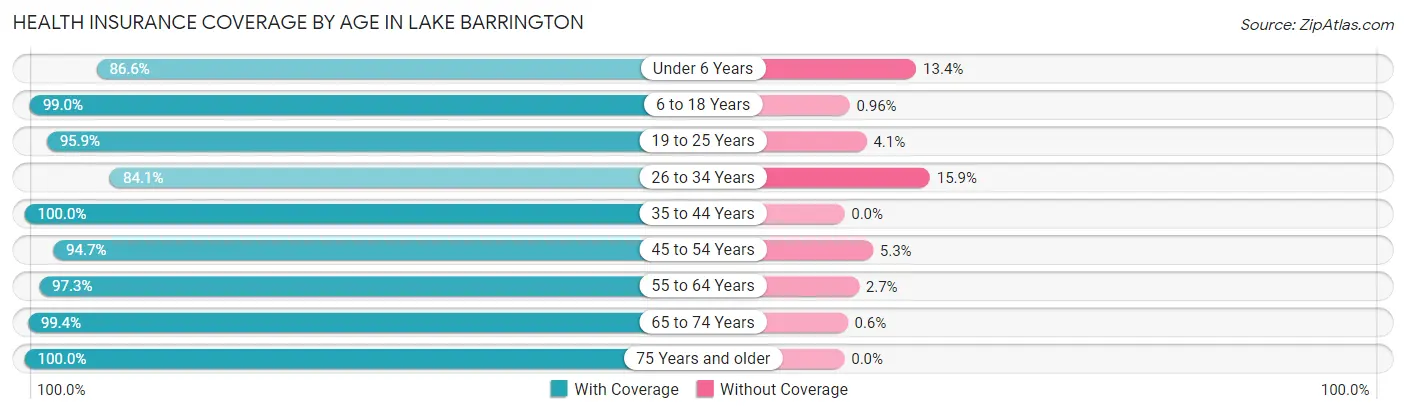
| Age Bracket | With Coverage | Without Coverage |
| Under 6 Years | 168 (86.6%) | 26 (13.4%) |
| 6 to 18 Years | 721 (99.0%) | 7 (1.0%) |
| 19 to 25 Years | 441 (95.9%) | 19 (4.1%) |
| 26 to 34 Years | 174 (84.1%) | 33 (15.9%) |
| 35 to 44 Years | 360 (100.0%) | 0 (0.0%) |
| 45 to 54 Years | 640 (94.7%) | 36 (5.3%) |
| 55 to 64 Years | 933 (97.3%) | 26 (2.7%) |
| 65 to 74 Years | 832 (99.4%) | 5 (0.6%) |
| 75 Years and older | 919 (100.0%) | 0 (0.0%) |
| Total | 5,188 (97.2%) | 152 (2.9%) |
Health Insurance Coverage by Citizenship Status in Lake Barrington
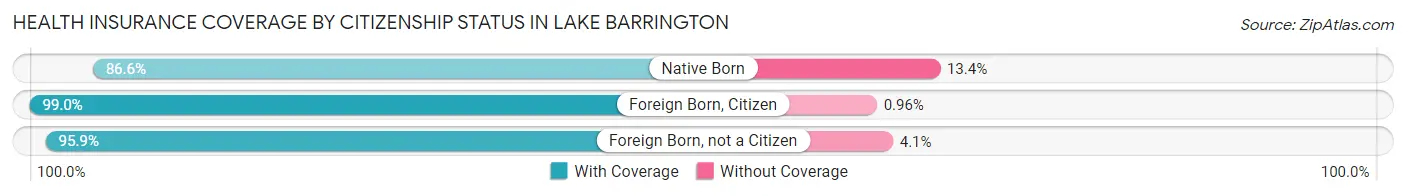
| Citizenship Status | With Coverage | Without Coverage |
| Native Born | 168 (86.6%) | 26 (13.4%) |
| Foreign Born, Citizen | 721 (99.0%) | 7 (1.0%) |
| Foreign Born, not a Citizen | 441 (95.9%) | 19 (4.1%) |
Health Insurance Coverage by Household Income in Lake Barrington
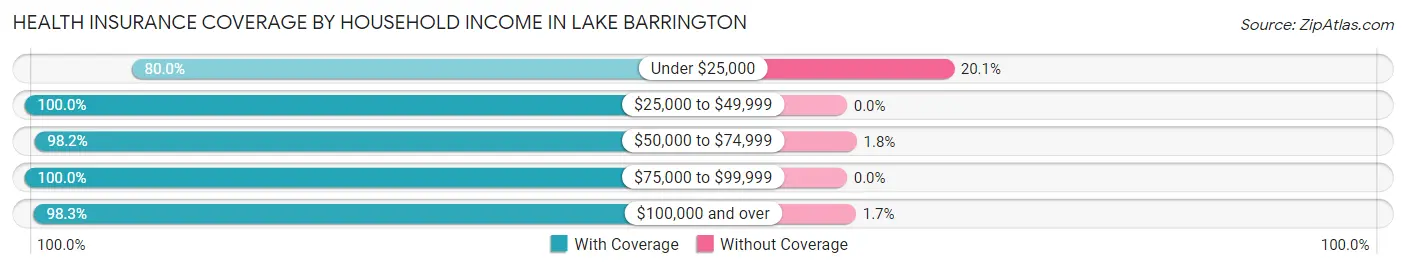
| Household Income | With Coverage | Without Coverage |
| Under $25,000 | 315 (79.9%) | 79 (20.1%) |
| $25,000 to $49,999 | 364 (100.0%) | 0 (0.0%) |
| $50,000 to $74,999 | 482 (98.2%) | 9 (1.8%) |
| $75,000 to $99,999 | 274 (100.0%) | 0 (0.0%) |
| $100,000 and over | 3,753 (98.3%) | 64 (1.7%) |
Public vs Private Health Insurance Coverage by Age in Lake Barrington
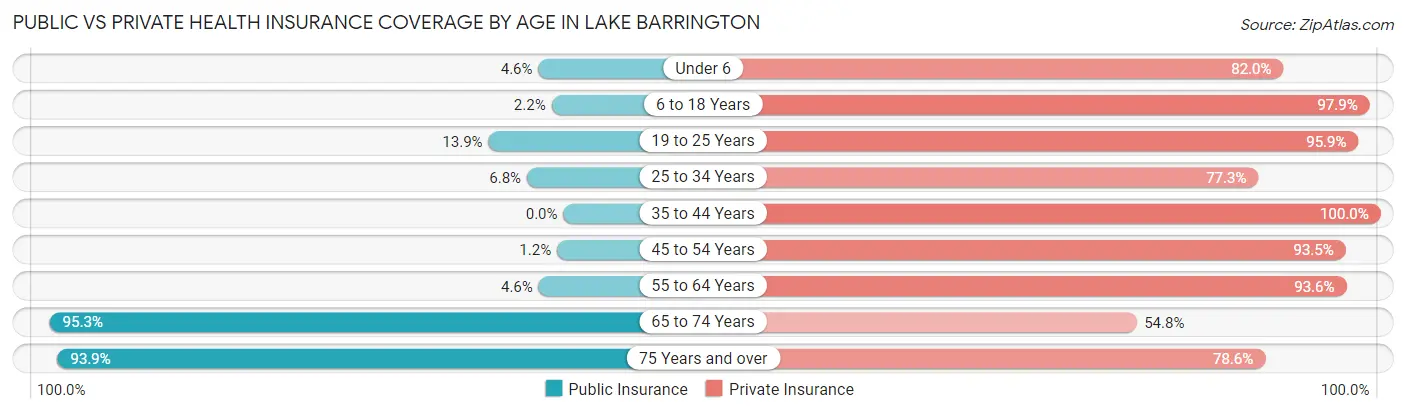
| Age Bracket | Public Insurance | Private Insurance |
| Under 6 | 9 (4.6%) | 159 (82.0%) |
| 6 to 18 Years | 16 (2.2%) | 713 (97.9%) |
| 19 to 25 Years | 64 (13.9%) | 441 (95.9%) |
| 25 to 34 Years | 14 (6.8%) | 160 (77.3%) |
| 35 to 44 Years | 0 (0.0%) | 360 (100.0%) |
| 45 to 54 Years | 8 (1.2%) | 632 (93.5%) |
| 55 to 64 Years | 44 (4.6%) | 898 (93.6%) |
| 65 to 74 Years | 798 (95.3%) | 459 (54.8%) |
| 75 Years and over | 863 (93.9%) | 722 (78.6%) |
| Total | 1,816 (34.0%) | 4,544 (85.1%) |
Disability Status by Sex by Age in Lake Barrington
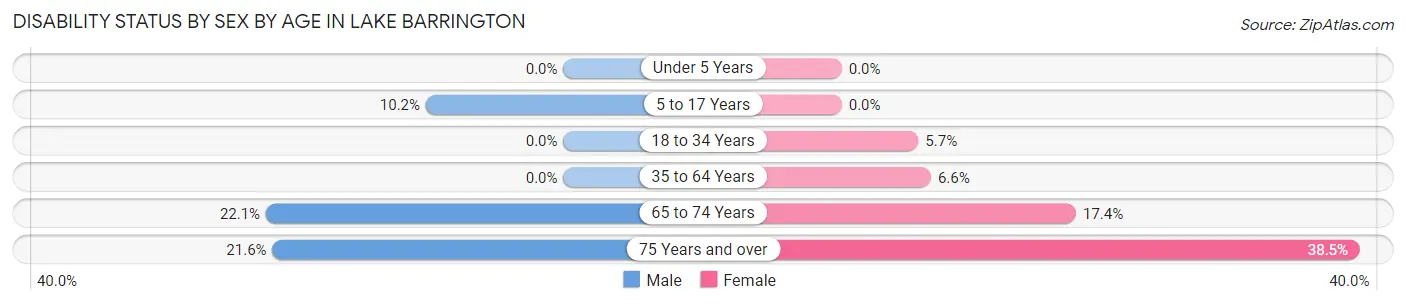
| Age Bracket | Male | Female |
| Under 5 Years | 0 (0.0%) | 0 (0.0%) |
| 5 to 17 Years | 34 (10.2%) | 0 (0.0%) |
| 18 to 34 Years | 0 (0.0%) | 17 (5.7%) |
| 35 to 64 Years | 0 (0.0%) | 71 (6.6%) |
| 65 to 74 Years | 68 (22.1%) | 92 (17.4%) |
| 75 Years and over | 89 (21.6%) | 195 (38.5%) |
Disability Class by Sex by Age in Lake Barrington
Disability Class: Hearing Difficulty
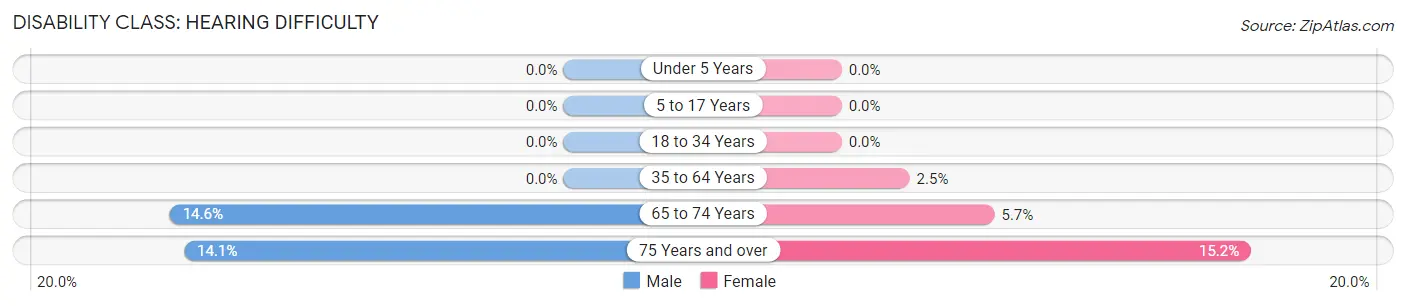
| Age Bracket | Male | Female |
| Under 5 Years | 0 (0.0%) | 0 (0.0%) |
| 5 to 17 Years | 0 (0.0%) | 0 (0.0%) |
| 18 to 34 Years | 0 (0.0%) | 0 (0.0%) |
| 35 to 64 Years | 0 (0.0%) | 27 (2.5%) |
| 65 to 74 Years | 45 (14.6%) | 30 (5.7%) |
| 75 Years and over | 58 (14.1%) | 77 (15.2%) |
Disability Class: Vision Difficulty
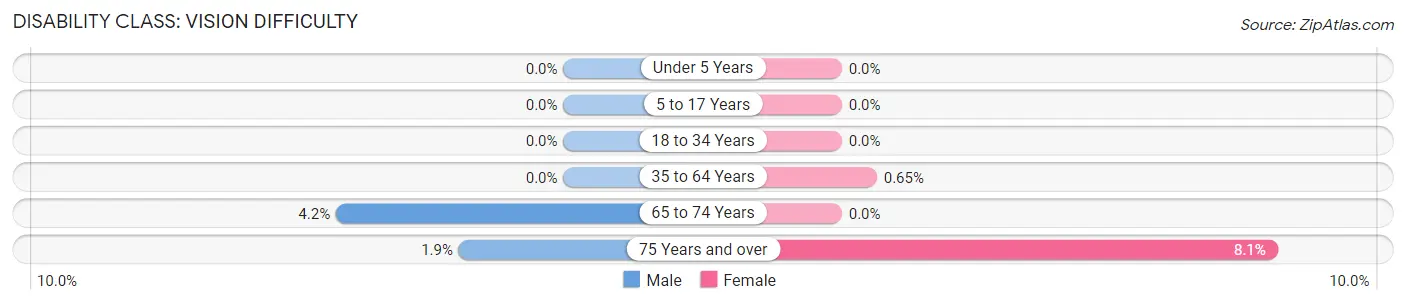
| Age Bracket | Male | Female |
| Under 5 Years | 0 (0.0%) | 0 (0.0%) |
| 5 to 17 Years | 0 (0.0%) | 0 (0.0%) |
| 18 to 34 Years | 0 (0.0%) | 0 (0.0%) |
| 35 to 64 Years | 0 (0.0%) | 7 (0.6%) |
| 65 to 74 Years | 13 (4.2%) | 0 (0.0%) |
| 75 Years and over | 8 (1.9%) | 41 (8.1%) |
Disability Class: Cognitive Difficulty
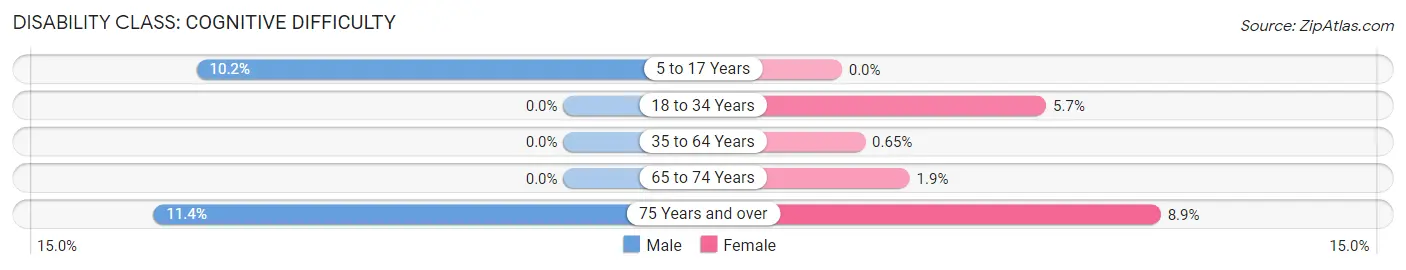
| Age Bracket | Male | Female |
| 5 to 17 Years | 34 (10.2%) | 0 (0.0%) |
| 18 to 34 Years | 0 (0.0%) | 17 (5.7%) |
| 35 to 64 Years | 0 (0.0%) | 7 (0.6%) |
| 65 to 74 Years | 0 (0.0%) | 10 (1.9%) |
| 75 Years and over | 47 (11.4%) | 45 (8.9%) |
Disability Class: Ambulatory Difficulty
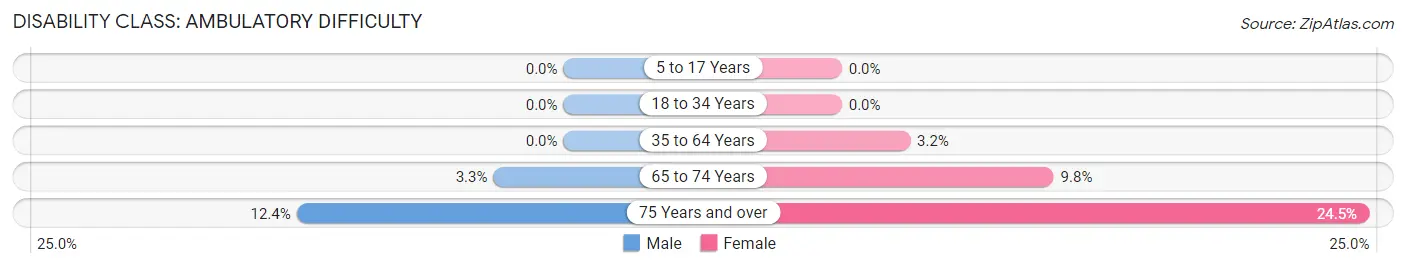
| Age Bracket | Male | Female |
| 5 to 17 Years | 0 (0.0%) | 0 (0.0%) |
| 18 to 34 Years | 0 (0.0%) | 0 (0.0%) |
| 35 to 64 Years | 0 (0.0%) | 34 (3.2%) |
| 65 to 74 Years | 10 (3.3%) | 52 (9.8%) |
| 75 Years and over | 51 (12.4%) | 124 (24.5%) |
Disability Class: Self-Care Difficulty
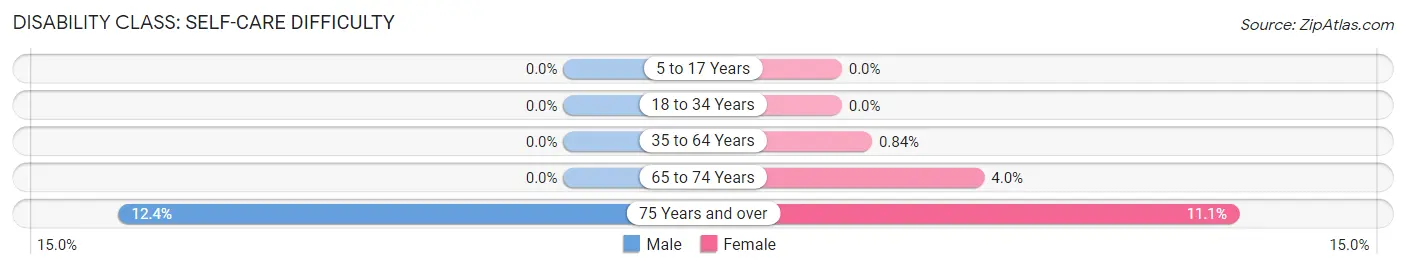
| Age Bracket | Male | Female |
| 5 to 17 Years | 0 (0.0%) | 0 (0.0%) |
| 18 to 34 Years | 0 (0.0%) | 0 (0.0%) |
| 35 to 64 Years | 0 (0.0%) | 9 (0.8%) |
| 65 to 74 Years | 0 (0.0%) | 21 (4.0%) |
| 75 Years and over | 51 (12.4%) | 56 (11.1%) |
Technology Access in Lake Barrington
Computing Device Access in Lake Barrington
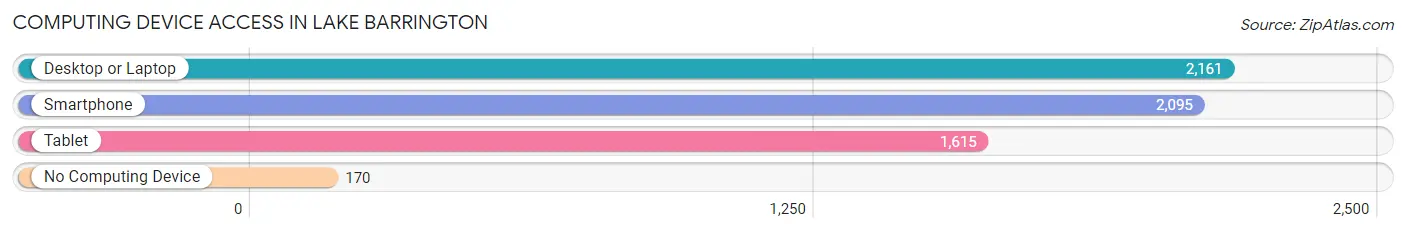
| Device Type | # Households | % Households |
| Desktop or Laptop | 2,161 | 89.5% |
| Smartphone | 2,095 | 86.8% |
| Tablet | 1,615 | 66.9% |
| No Computing Device | 170 | 7.0% |
| Total | 2,414 | 100.0% |
Internet Access in Lake Barrington
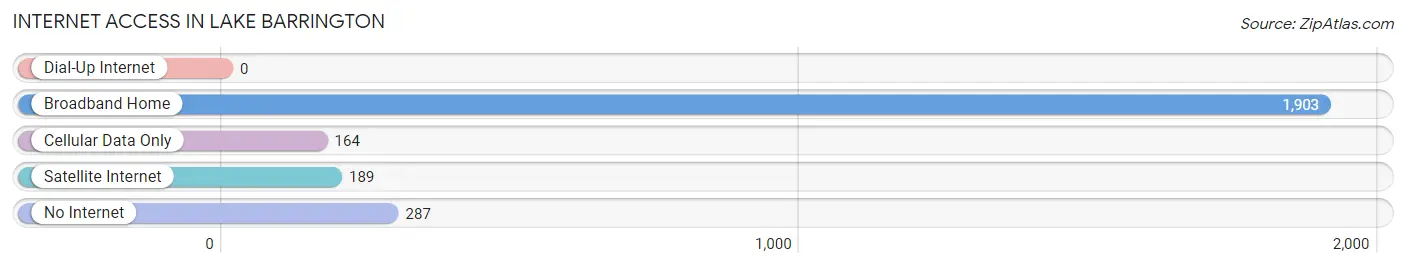
| Internet Type | # Households | % Households |
| Dial-Up Internet | 0 | 0.0% |
| Broadband Home | 1,903 | 78.8% |
| Cellular Data Only | 164 | 6.8% |
| Satellite Internet | 189 | 7.8% |
| No Internet | 287 | 11.9% |
| Total | 2,414 | 100.0% |
Lake Barrington Summary
History
The history of Lake Barrington, Illinois dates back to the early 1800s when the area was first settled by pioneers. The first settlers were primarily of German and English descent, and the area was known as the Barrington Prairie. The area was originally part of the Northwest Territory, and was part of the original land grant given to the settlers by the federal government.
In 1837, the area was officially incorporated as the Village of Barrington. The village was named after the Barrington family, who were some of the first settlers in the area. The village was primarily an agricultural community, and the main crops grown were wheat, corn, and oats.
In the late 1800s, the area began to experience a population boom as more people moved to the area. This was due to the construction of the Chicago and Northwestern Railroad, which connected the area to Chicago. This allowed for easier access to the city, and the population of the village began to grow.
In the early 1900s, the village was renamed to Lake Barrington, due to the presence of a large lake in the area. The lake was created by damming the Fox River, and it became a popular spot for fishing and swimming.
In the 1950s, the village began to experience a population decline as people moved away from the area. This was due to the construction of the Northwest Tollway, which made it easier for people to commute to Chicago.
In the late 1970s, the village began to experience a population resurgence as people began to move back to the area. This was due to the construction of the Lake Barrington Shores development, which was a large residential development. The development was built on the shores of the lake, and it attracted many people to the area.
Today, Lake Barrington is a small village with a population of around 8,000 people. The village is known for its beautiful lake, and it is a popular spot for fishing and swimming. The village is also home to several parks, including the Lake Barrington Shores Park, which is a popular spot for picnics and outdoor activities.
Geography
Lake Barrington is located in the northern part of Illinois, in the county of Lake. The village is situated on the shores of the Fox River, and it is surrounded by rolling hills and wooded areas. The village is located about 40 miles northwest of Chicago, and it is part of the Chicago metropolitan area.
The village has a total area of 4.2 square miles, and it is mostly composed of residential areas. The village is home to several parks, including the Lake Barrington Shores Park, which is a popular spot for picnics and outdoor activities.
Economy
The economy of Lake Barrington is primarily based on the service industry. The village is home to several businesses, including restaurants, retail stores, and professional services. The village is also home to several manufacturing companies, which produce a variety of products.
The village is also home to several educational institutions, including the Lake Barrington School District, which serves the village and the surrounding area. The village is also home to several churches, which provide spiritual guidance to the residents of the village.
Demographics
As of the 2010 census, the population of Lake Barrington was 8,072. The population is primarily composed of white (90.2%) and Asian (4.2%) residents. The median household income in the village is $90,845, and the median age is 44.7 years. The village has a low crime rate, and it is considered to be a safe place to live.
Common Questions
What is Per Capita Income in Lake Barrington?
Per Capita income in Lake Barrington is $75,469.
What is the Median Family Income in Lake Barrington?
Median Family Income in Lake Barrington is $195,231.
What is the Median Household income in Lake Barrington?
Median Household Income in Lake Barrington is $126,316.
What is Income or Wage Gap in Lake Barrington?
Income or Wage Gap in Lake Barrington is 67.0%.
Women in Lake Barrington earn 33.0 cents for every dollar earned by a man.
What is Inequality or Gini Index in Lake Barrington?
Inequality or Gini Index in Lake Barrington is 0.46.
What is the Total Population of Lake Barrington?
Total Population of Lake Barrington is 5,377.
What is the Total Male Population of Lake Barrington?
Total Male Population of Lake Barrington is 2,532.
What is the Total Female Population of Lake Barrington?
Total Female Population of Lake Barrington is 2,845.
What is the Ratio of Males per 100 Females in Lake Barrington?
There are 89.00 Males per 100 Females in Lake Barrington.
What is the Ratio of Females per 100 Males in Lake Barrington?
There are 112.36 Females per 100 Males in Lake Barrington.
What is the Median Population Age in Lake Barrington?
Median Population Age in Lake Barrington is 56.0 Years.
What is the Average Family Size in Lake Barrington
Average Family Size in Lake Barrington is 2.8 People.
What is the Average Household Size in Lake Barrington
Average Household Size in Lake Barrington is 2.2 People.
How Large is the Labor Force in Lake Barrington?
There are 2,443 People in the Labor Forcein in Lake Barrington.
What is the Percentage of People in the Labor Force in Lake Barrington?
53.0% of People are in the Labor Force in Lake Barrington.
What is the Unemployment Rate in Lake Barrington?
Unemployment Rate in Lake Barrington is 6.4%.