Winnetka, IL Map & Demographics
Winnetka Map
Winnetka Overview
$154,576
PER CAPITA INCOME
$250,001
AVG FAMILY INCOME
$250,001
AVG HOUSEHOLD INCOME
73.4%
WAGE / INCOME GAP [ % ]
26.6¢/ $1
WAGE / INCOME GAP [ $ ]
0.50
INEQUALITY / GINI INDEX
12,607
TOTAL POPULATION
6,346
MALE POPULATION
6,261
FEMALE POPULATION
101.36
MALES / 100 FEMALES
98.66
FEMALES / 100 MALES
42.8
MEDIAN AGE
3.3
AVG FAMILY SIZE
3.0
AVG HOUSEHOLD SIZE
5,193
LABOR FORCE [ PEOPLE ]
58.1%
PERCENT IN LABOR FORCE
3.7%
UNEMPLOYMENT RATE
Winnetka Zip Codes
Income in Winnetka
Income Overview in Winnetka
Per Capita Income in Winnetka is $154,576, while median incomes of families and households are $250,001 and $250,001 respectively.
| Characteristic | Number | Measure |
| Per Capita Income | 12,607 | $154,576 |
| Median Family Income | 3,581 | $250,001 |
| Mean Family Income | 3,581 | $504,375 |
| Median Household Income | 4,242 | $250,001 |
| Mean Household Income | 4,242 | $458,988 |
| Income Deficit | 3,581 | $0 |
| Wage / Income Gap (%) | 12,607 | 73.41% |
| Wage / Income Gap ($) | 12,607 | 26.59¢ per $1 |
| Gini / Inequality Index | 12,607 | 0.50 |
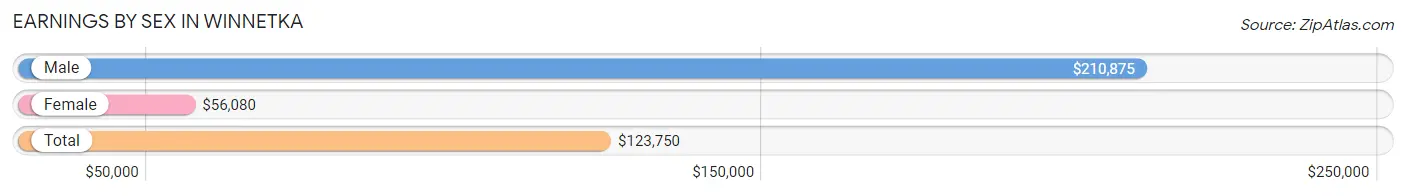
Earnings by Sex in Winnetka
Average Earnings in Winnetka are $123,750, $210,875 for men and $56,080 for women, a difference of 73.4%.
| Sex | Number | Average Earnings |
| Male | 3,307 (57.6%) | $210,875 |
| Female | 2,431 (42.4%) | $56,080 |
| Total | 5,738 (100.0%) | $123,750 |
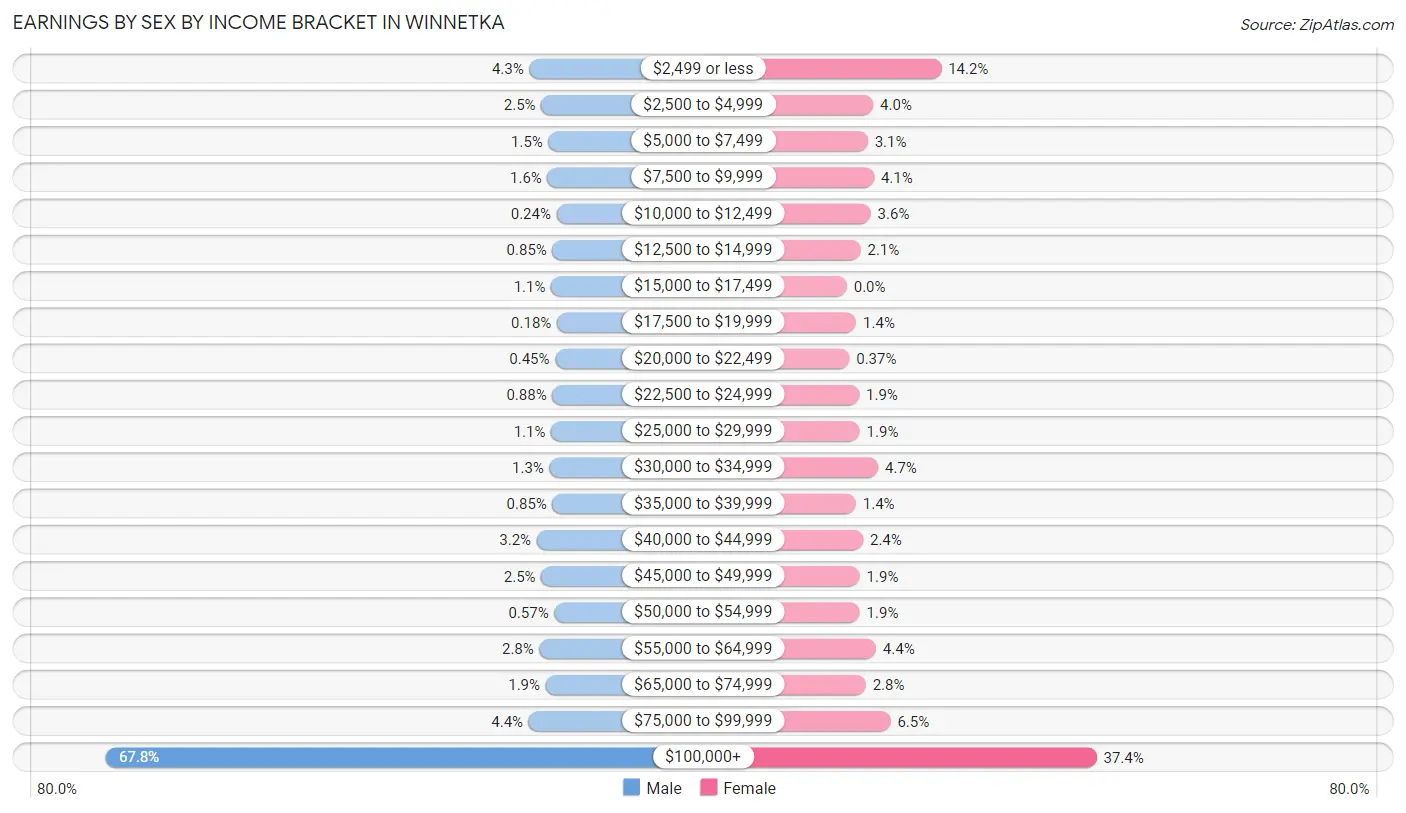
Earnings by Sex by Income Bracket in Winnetka
The most common earnings brackets in Winnetka are $100,000+ for men (2,242 | 67.8%) and $100,000+ for women (910 | 37.4%).
| Income | Male | Female |
| $2,499 or less | 143 (4.3%) | 344 (14.1%) |
| $2,500 to $4,999 | 84 (2.5%) | 96 (4.0%) |
| $5,000 to $7,499 | 48 (1.5%) | 76 (3.1%) |
| $7,500 to $9,999 | 53 (1.6%) | 99 (4.1%) |
| $10,000 to $12,499 | 8 (0.2%) | 87 (3.6%) |
| $12,500 to $14,999 | 28 (0.9%) | 50 (2.1%) |
| $15,000 to $17,499 | 35 (1.1%) | 0 (0.0%) |
| $17,500 to $19,999 | 6 (0.2%) | 34 (1.4%) |
| $20,000 to $22,499 | 15 (0.4%) | 9 (0.4%) |
| $22,500 to $24,999 | 29 (0.9%) | 45 (1.8%) |
| $25,000 to $29,999 | 35 (1.1%) | 47 (1.9%) |
| $30,000 to $34,999 | 43 (1.3%) | 114 (4.7%) |
| $35,000 to $39,999 | 28 (0.9%) | 33 (1.4%) |
| $40,000 to $44,999 | 106 (3.2%) | 59 (2.4%) |
| $45,000 to $49,999 | 84 (2.5%) | 47 (1.9%) |
| $50,000 to $54,999 | 19 (0.6%) | 47 (1.9%) |
| $55,000 to $64,999 | 93 (2.8%) | 106 (4.4%) |
| $65,000 to $74,999 | 62 (1.9%) | 69 (2.8%) |
| $75,000 to $99,999 | 146 (4.4%) | 159 (6.5%) |
| $100,000+ | 2,242 (67.8%) | 910 (37.4%) |
| Total | 3,307 (100.0%) | 2,431 (100.0%) |
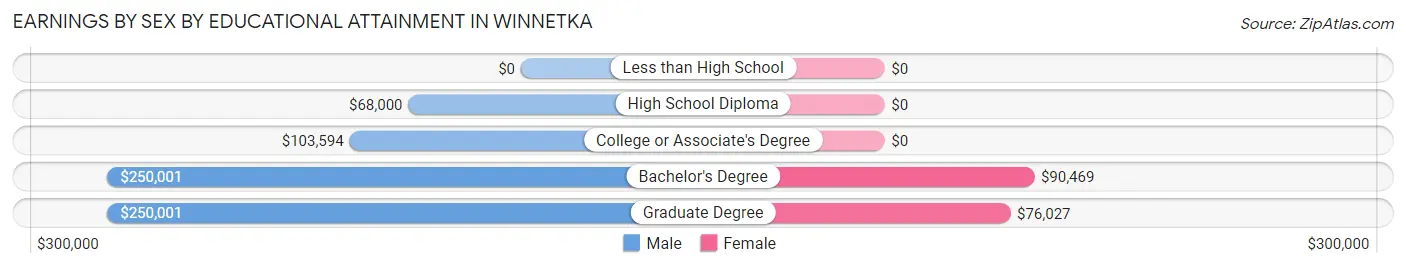
Earnings by Sex by Educational Attainment in Winnetka
Average earnings in Winnetka are $229,831 for men and $75,577 for women, a difference of 67.1%. Men with an educational attainment of bachelor's degree enjoy the highest average annual earnings of $250,001, while those with high school diploma education earn the least with $68,000. Women with an educational attainment of bachelor's degree earn the most with the average annual earnings of $90,469, while those with graduate degree education have the smallest earnings of $76,027.
| Educational Attainment | Male Income | Female Income |
| Less than High School | - | - |
| High School Diploma | $68,000 | $0 |
| College or Associate's Degree | $103,594 | $0 |
| Bachelor's Degree | $250,001 | $90,469 |
| Graduate Degree | $250,001 | $76,027 |
| Total | $229,831 | $75,577 |
Family Income in Winnetka
Family Income Brackets in Winnetka
According to the Winnetka family income data, there are 2,578 families falling into the $200,000+ income range, which is the most common income bracket and makes up 72.0% of all families.
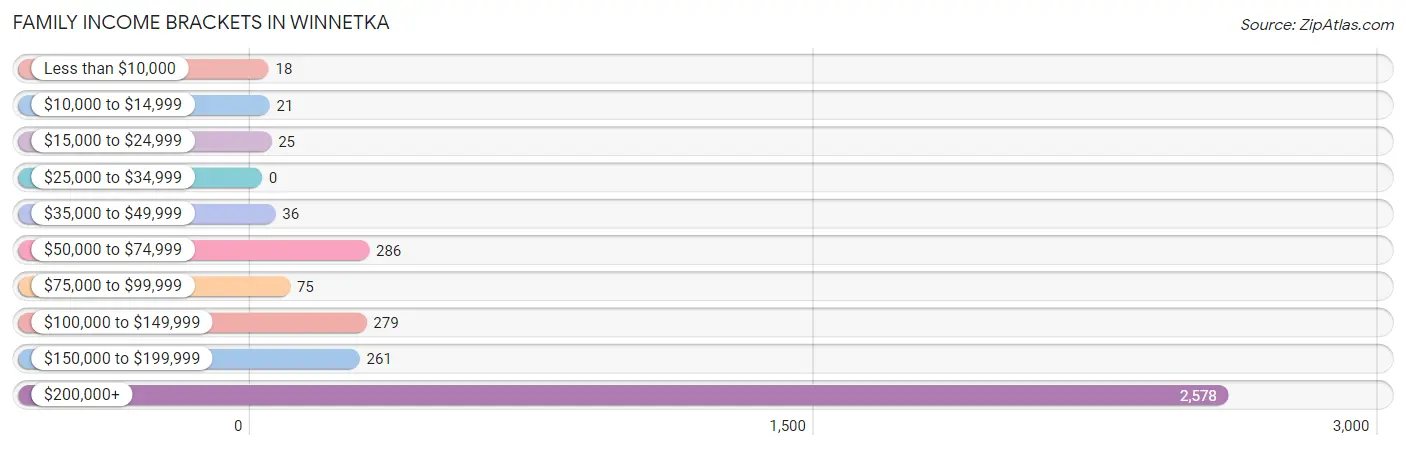
| Income Bracket | # Families | % Families |
| Less than $10,000 | 18 | 0.5% |
| $10,000 to $14,999 | 21 | 0.6% |
| $15,000 to $24,999 | 25 | 0.7% |
| $25,000 to $34,999 | 0 | 0.0% |
| $35,000 to $49,999 | 36 | 1.0% |
| $50,000 to $74,999 | 286 | 8.0% |
| $75,000 to $99,999 | 75 | 2.1% |
| $100,000 to $149,999 | 279 | 7.8% |
| $150,000 to $199,999 | 261 | 7.3% |
| $200,000+ | 2,578 | 72.0% |
Family Income by Famaliy Size in Winnetka
3-person families (770 | 21.5%) account for the highest median family income in Winnetka with $250,001 per family, while 2-person families (1,298 | 36.2%) have the highest median income of $114,250 per family member.
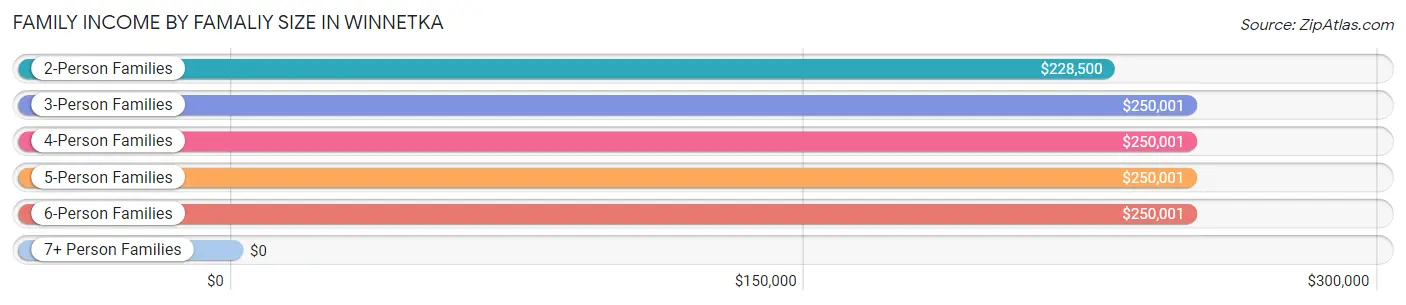
| Income Bracket | # Families | Median Income |
| 2-Person Families | 1,298 (36.2%) | $228,500 |
| 3-Person Families | 770 (21.5%) | $250,001 |
| 4-Person Families | 895 (25.0%) | $250,001 |
| 5-Person Families | 510 (14.2%) | $250,001 |
| 6-Person Families | 108 (3.0%) | $250,001 |
| 7+ Person Families | 0 (0.0%) | $0 |
| Total | 3,581 (100.0%) | $250,001 |
Family Income by Number of Earners in Winnetka
The median family income in Winnetka is $250,001, with families comprising 1 earner (1,367) having the highest median family income of $250,001, while families with no earners (411) have the lowest median family income of $126,625, accounting for 38.2% and 11.5% of families, respectively.
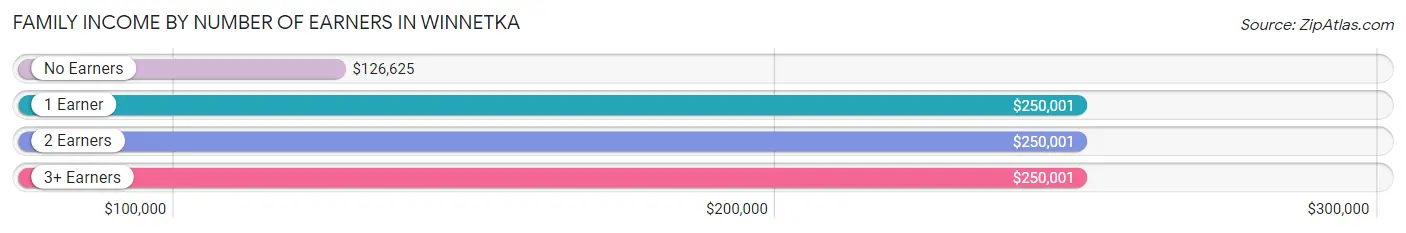
| Number of Earners | # Families | Median Income |
| No Earners | 411 (11.5%) | $126,625 |
| 1 Earner | 1,367 (38.2%) | $250,001 |
| 2 Earners | 1,535 (42.9%) | $250,001 |
| 3+ Earners | 268 (7.5%) | $250,001 |
| Total | 3,581 (100.0%) | $250,001 |
Household Income in Winnetka
Household Income Brackets in Winnetka
With 2,715 households falling in the category, the $200,000+ income range is the most frequent in Winnetka, accounting for 64.0% of all households. In contrast, only 34 households (0.8%) fall into the $10,000 to $14,999 income bracket, making it the least populous group.
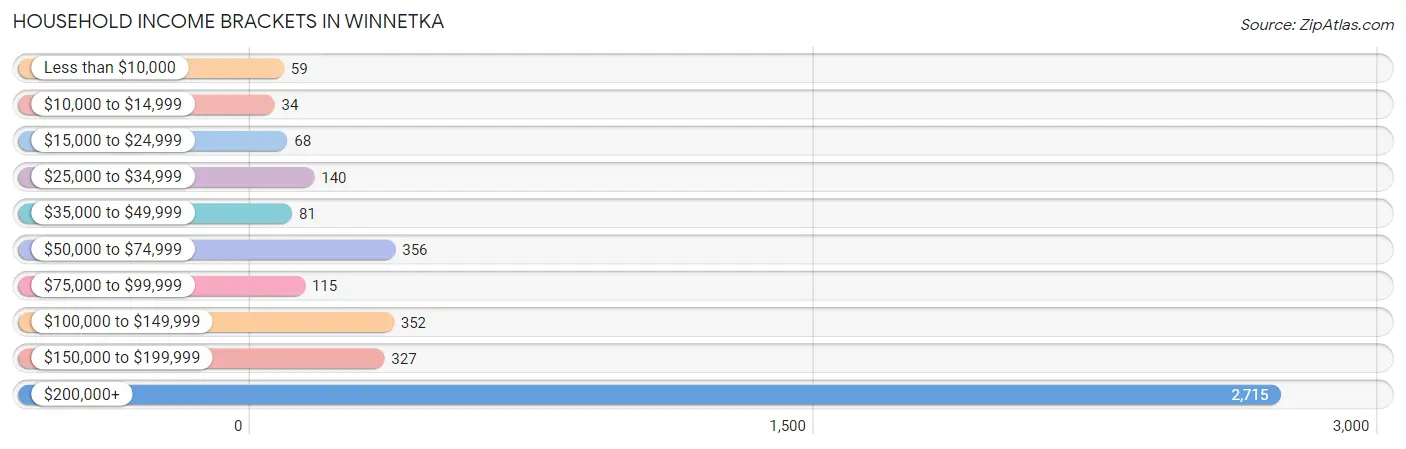
| Income Bracket | # Households | % Households |
| Less than $10,000 | 59 | 1.4% |
| $10,000 to $14,999 | 34 | 0.8% |
| $15,000 to $24,999 | 68 | 1.6% |
| $25,000 to $34,999 | 140 | 3.3% |
| $35,000 to $49,999 | 81 | 1.9% |
| $50,000 to $74,999 | 356 | 8.4% |
| $75,000 to $99,999 | 115 | 2.7% |
| $100,000 to $149,999 | 352 | 8.3% |
| $150,000 to $199,999 | 327 | 7.7% |
| $200,000+ | 2,715 | 64.0% |
Household Income by Householder Age in Winnetka
The median household income in Winnetka is $250,001, with the highest median household income of $250,001 found in the 25 to 44 years age bracket for the primary householder. A total of 886 households (20.9%) fall into this category. Meanwhile, the 15 to 24 years age bracket for the primary householder has the lowest median household income of $0, with 35 households (0.8%) in this group.
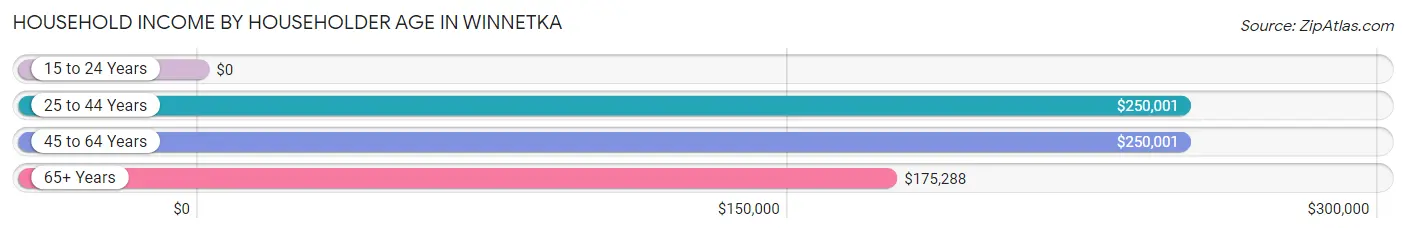
| Income Bracket | # Households | Median Income |
| 15 to 24 Years | 35 (0.8%) | $0 |
| 25 to 44 Years | 886 (20.9%) | $250,001 |
| 45 to 64 Years | 2,044 (48.2%) | $250,001 |
| 65+ Years | 1,277 (30.1%) | $175,288 |
| Total | 4,242 (100.0%) | $250,001 |
Poverty in Winnetka
Income Below Poverty by Sex and Age in Winnetka
With 1.3% poverty level for males and 2.5% for females among the residents of Winnetka, 18 to 24 year old males and 18 to 24 year old females are the most vulnerable to poverty, with 19 males (11.2%) and 69 females (23.2%) in their respective age groups living below the poverty level.
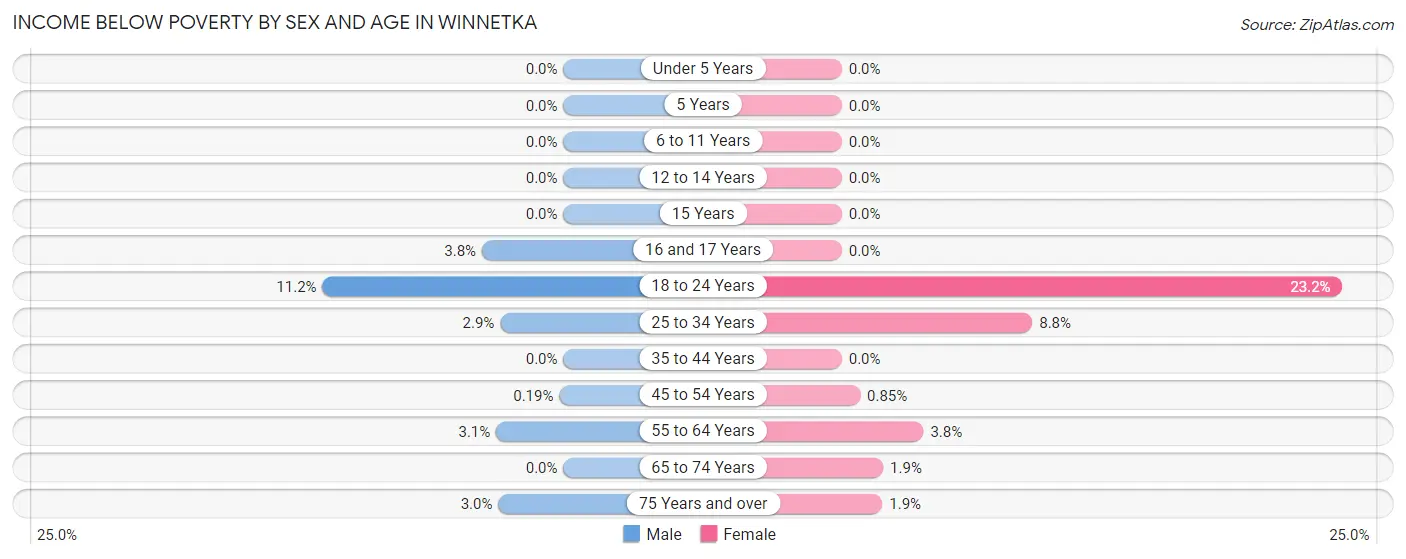
| Age Bracket | Male | Female |
| Under 5 Years | 0 (0.0%) | 0 (0.0%) |
| 5 Years | 0 (0.0%) | 0 (0.0%) |
| 6 to 11 Years | 0 (0.0%) | 0 (0.0%) |
| 12 to 14 Years | 0 (0.0%) | 0 (0.0%) |
| 15 Years | 0 (0.0%) | 0 (0.0%) |
| 16 and 17 Years | 11 (3.8%) | 0 (0.0%) |
| 18 to 24 Years | 19 (11.2%) | 69 (23.2%) |
| 25 to 34 Years | 9 (2.9%) | 26 (8.8%) |
| 35 to 44 Years | 0 (0.0%) | 0 (0.0%) |
| 45 to 54 Years | 2 (0.2%) | 9 (0.9%) |
| 55 to 64 Years | 26 (3.1%) | 29 (3.8%) |
| 65 to 74 Years | 0 (0.0%) | 13 (1.9%) |
| 75 Years and over | 13 (3.0%) | 9 (1.9%) |
| Total | 80 (1.3%) | 155 (2.5%) |
Income Above Poverty by Sex and Age in Winnetka
According to the poverty statistics in Winnetka, males aged under 5 years and females aged under 5 years are the age groups that are most secure financially, with 100.0% of males and 100.0% of females in these age groups living above the poverty line.
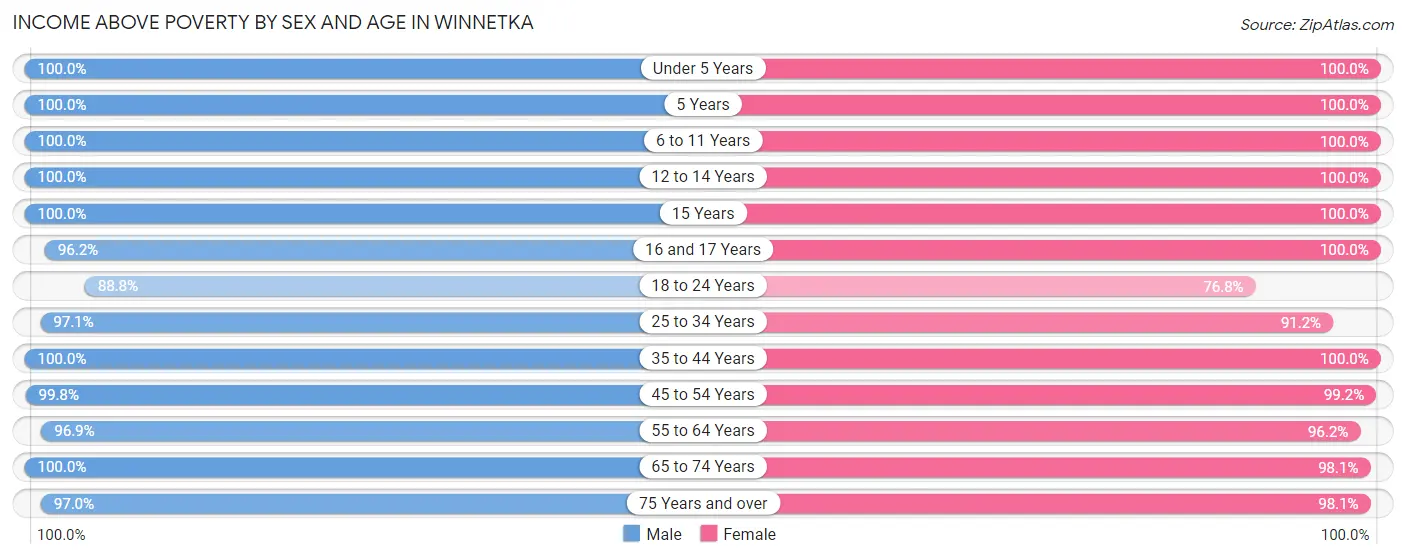
| Age Bracket | Male | Female |
| Under 5 Years | 534 (100.0%) | 477 (100.0%) |
| 5 Years | 98 (100.0%) | 114 (100.0%) |
| 6 to 11 Years | 770 (100.0%) | 729 (100.0%) |
| 12 to 14 Years | 380 (100.0%) | 274 (100.0%) |
| 15 Years | 94 (100.0%) | 98 (100.0%) |
| 16 and 17 Years | 280 (96.2%) | 215 (100.0%) |
| 18 to 24 Years | 151 (88.8%) | 228 (76.8%) |
| 25 to 34 Years | 298 (97.1%) | 268 (91.2%) |
| 35 to 44 Years | 606 (100.0%) | 735 (100.0%) |
| 45 to 54 Years | 1,070 (99.8%) | 1,046 (99.2%) |
| 55 to 64 Years | 807 (96.9%) | 737 (96.2%) |
| 65 to 74 Years | 711 (100.0%) | 663 (98.1%) |
| 75 Years and over | 418 (97.0%) | 470 (98.1%) |
| Total | 6,217 (98.7%) | 6,054 (97.5%) |
Income Below Poverty Among Married-Couple Families in Winnetka
The poverty statistics for married-couple families in Winnetka show that 0.9% or 31 of the total 3,388 families live below the poverty line. Families with no children have the highest poverty rate of 1.5%, comprising of 24 families. On the other hand, families with 3 or 4 children have the lowest poverty rate of 0.0%, which includes 0 families.
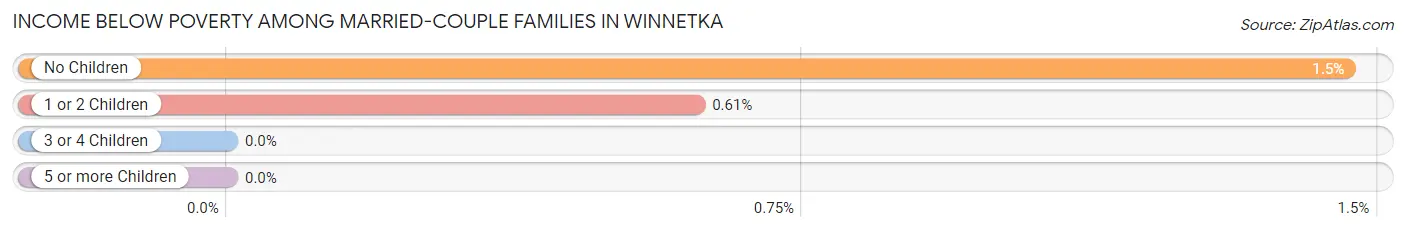
| Children | Above Poverty | Below Poverty |
| No Children | 1,624 (98.5%) | 24 (1.5%) |
| 1 or 2 Children | 1,145 (99.4%) | 7 (0.6%) |
| 3 or 4 Children | 588 (100.0%) | 0 (0.0%) |
| 5 or more Children | 0 (0.0%) | 0 (0.0%) |
| Total | 3,357 (99.1%) | 31 (0.9%) |
Income Below Poverty Among Single-Parent Households in Winnetka
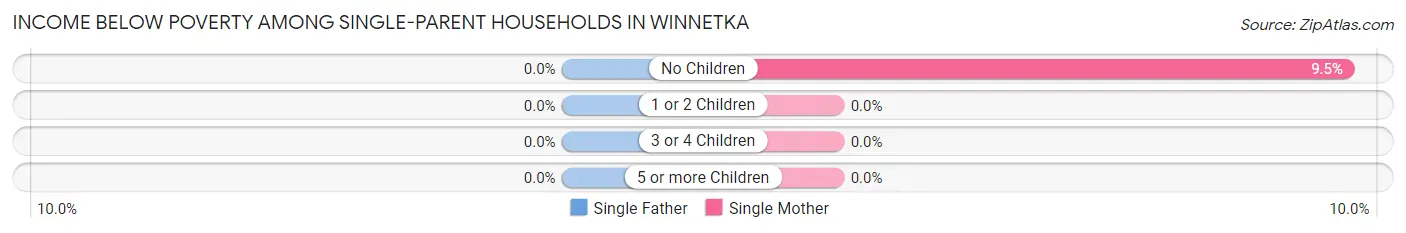
| Children | Single Father | Single Mother |
| No Children | 0 (0.0%) | 8 (9.5%) |
| 1 or 2 Children | 0 (0.0%) | 0 (0.0%) |
| 3 or 4 Children | 0 (0.0%) | 0 (0.0%) |
| 5 or more Children | 0 (0.0%) | 0 (0.0%) |
| Total | 0 (0.0%) | 8 (5.8%) |
Income Below Poverty Among Married-Couple vs Single-Parent Households in Winnetka
The poverty data for Winnetka shows that 31 of the married-couple family households (0.9%) and 8 of the single-parent households (4.2%) are living below the poverty level. Within the married-couple family households, those with no children have the highest poverty rate, with 24 households (1.5%) falling below the poverty line. Among the single-parent households, those with no children have the highest poverty rate, with 8 household (9.5%) living below poverty.
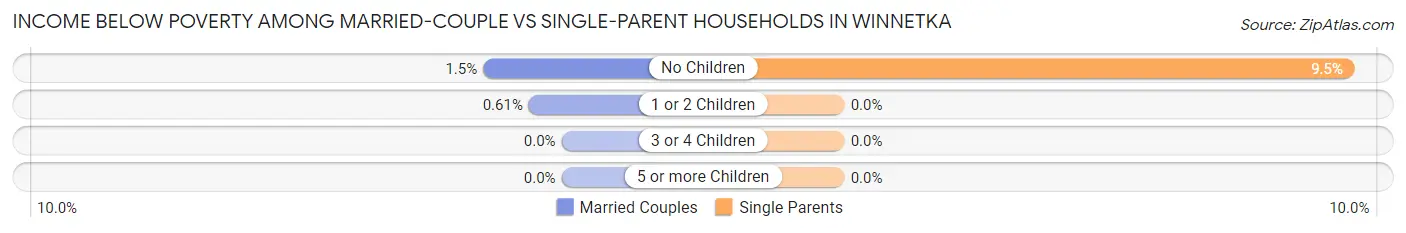
| Children | Married-Couple Families | Single-Parent Households |
| No Children | 24 (1.5%) | 8 (9.5%) |
| 1 or 2 Children | 7 (0.6%) | 0 (0.0%) |
| 3 or 4 Children | 0 (0.0%) | 0 (0.0%) |
| 5 or more Children | 0 (0.0%) | 0 (0.0%) |
| Total | 31 (0.9%) | 8 (4.2%) |
Race in Winnetka
The most populous races in Winnetka are White / Caucasian (11,495 | 91.2%), Two or more Races (617 | 4.9%), and Asian (292 | 2.3%).
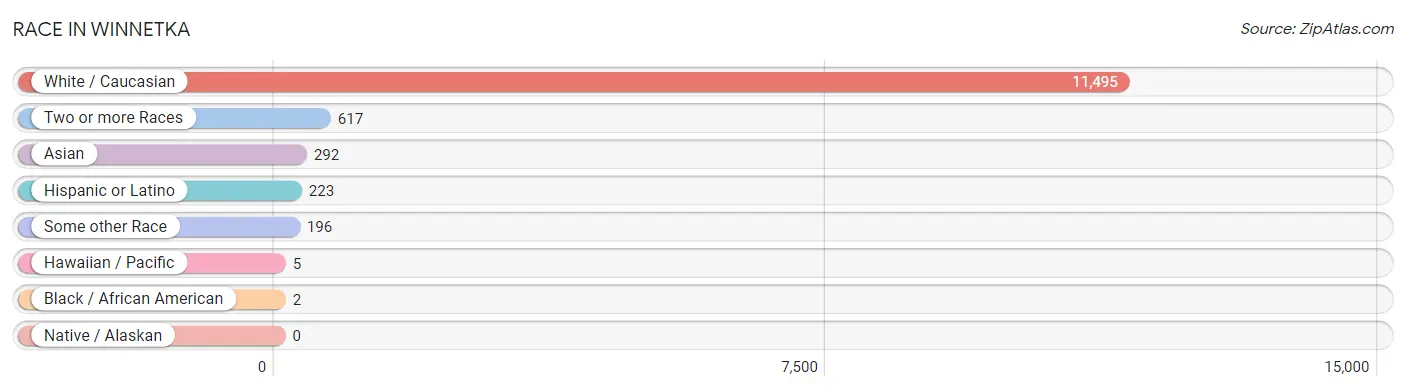
| Race | # Population | % Population |
| Asian | 292 | 2.3% |
| Black / African American | 2 | 0.0% |
| Hawaiian / Pacific | 5 | 0.0% |
| Hispanic or Latino | 223 | 1.8% |
| Native / Alaskan | 0 | 0.0% |
| White / Caucasian | 11,495 | 91.2% |
| Two or more Races | 617 | 4.9% |
| Some other Race | 196 | 1.5% |
| Total | 12,607 | 100.0% |
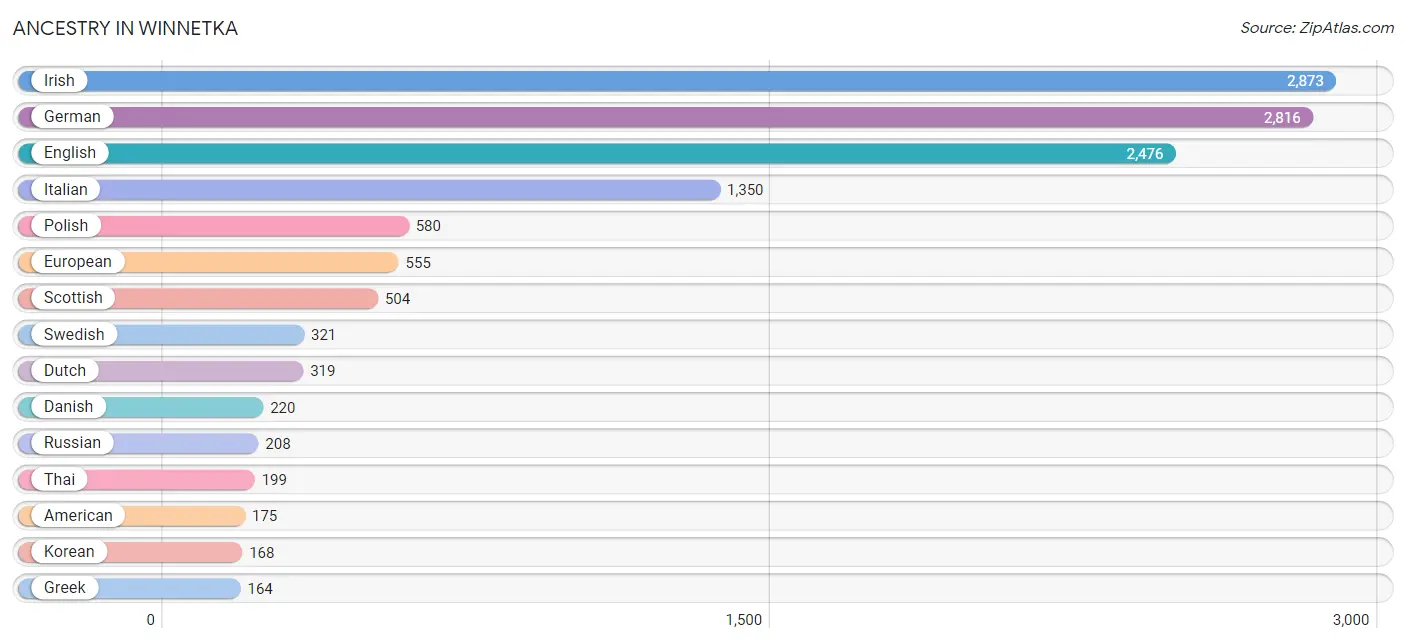
Ancestry in Winnetka
The most populous ancestries reported in Winnetka are Irish (2,873 | 22.8%), German (2,816 | 22.3%), English (2,476 | 19.6%), Italian (1,350 | 10.7%), and Polish (580 | 4.6%), together accounting for 80.1% of all Winnetka residents.
| Ancestry | # Population | % Population |
| Alsatian | 78 | 0.6% |
| American | 175 | 1.4% |
| Arab | 95 | 0.7% |
| Armenian | 5 | 0.0% |
| Assyrian / Chaldean / Syriac | 11 | 0.1% |
| Austrian | 15 | 0.1% |
| Bangladeshi | 18 | 0.1% |
| Basque | 32 | 0.3% |
| Belgian | 11 | 0.1% |
| Bhutanese | 20 | 0.2% |
| Brazilian | 7 | 0.1% |
| British | 17 | 0.1% |
| Burmese | 9 | 0.1% |
| Canadian | 20 | 0.2% |
| Colombian | 21 | 0.2% |
| Croatian | 12 | 0.1% |
| Cuban | 32 | 0.3% |
| Czech | 155 | 1.2% |
| Czechoslovakian | 8 | 0.1% |
| Danish | 220 | 1.8% |
| Dutch | 319 | 2.5% |
| Eastern European | 122 | 1.0% |
| Ecuadorian | 10 | 0.1% |
| English | 2,476 | 19.6% |
| European | 555 | 4.4% |
| Filipino | 32 | 0.3% |
| Finnish | 15 | 0.1% |
| French | 130 | 1.0% |
| French Canadian | 17 | 0.1% |
| German | 2,816 | 22.3% |
| German Russian | 8 | 0.1% |
| Greek | 164 | 1.3% |
| Hungarian | 44 | 0.4% |
| Indian (Asian) | 135 | 1.1% |
| Iranian | 9 | 0.1% |
| Iraqi | 49 | 0.4% |
| Irish | 2,873 | 22.8% |
| Israeli | 6 | 0.1% |
| Italian | 1,350 | 10.7% |
| Korean | 168 | 1.3% |
| Latvian | 76 | 0.6% |
| Lithuanian | 44 | 0.4% |
| Mexican | 102 | 0.8% |
| Native Hawaiian | 5 | 0.0% |
| Northern European | 91 | 0.7% |
| Norwegian | 116 | 0.9% |
| Polish | 580 | 4.6% |
| Romanian | 40 | 0.3% |
| Russian | 208 | 1.7% |
| Scandinavian | 130 | 1.0% |
| Scotch-Irish | 84 | 0.7% |
| Scottish | 504 | 4.0% |
| Serbian | 110 | 0.9% |
| Slovak | 19 | 0.2% |
| South African | 6 | 0.1% |
| South American | 31 | 0.3% |
| Spaniard | 30 | 0.2% |
| Spanish | 28 | 0.2% |
| Sri Lankan | 62 | 0.5% |
| Subsaharan African | 6 | 0.1% |
| Swedish | 321 | 2.5% |
| Swiss | 32 | 0.3% |
| Syrian | 10 | 0.1% |
| Thai | 199 | 1.6% |
| Ukrainian | 26 | 0.2% |
| Welsh | 58 | 0.5% | View All 66 Rows |
Immigrants in Winnetka
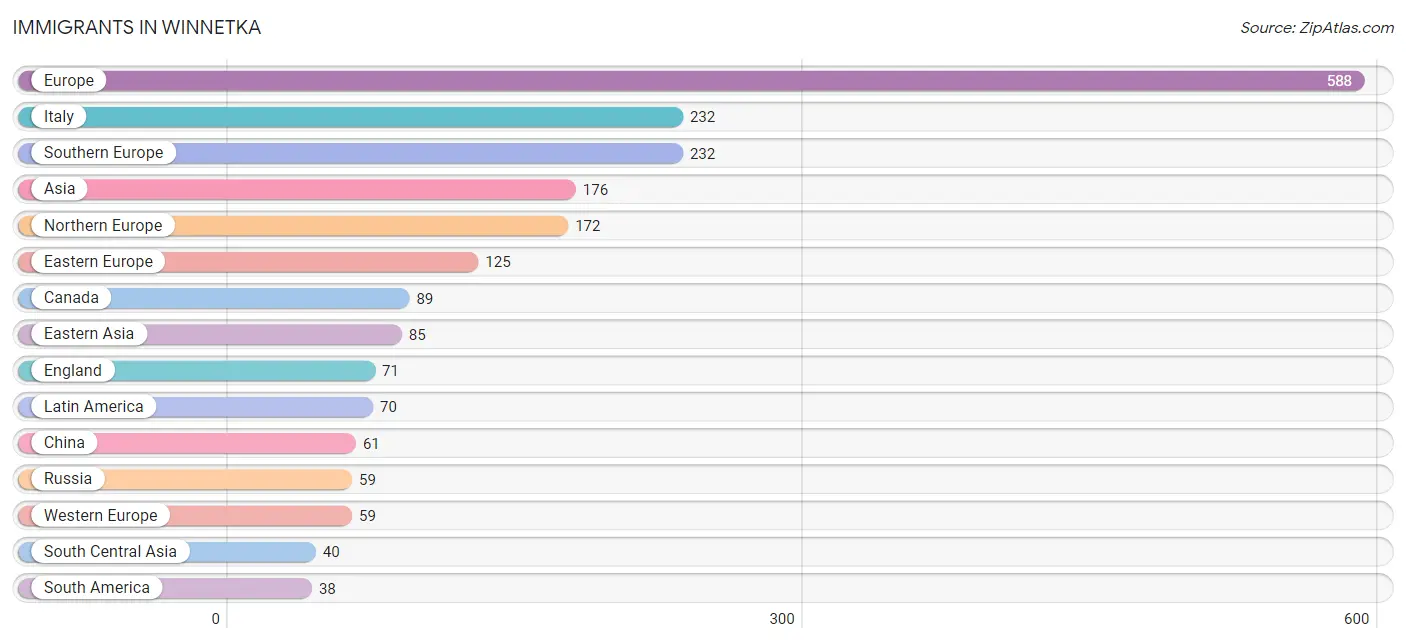
The most numerous immigrant groups reported in Winnetka came from Europe (588 | 4.7%), Italy (232 | 1.8%), Southern Europe (232 | 1.8%), Asia (176 | 1.4%), and Northern Europe (172 | 1.4%), together accounting for 11.1% of all Winnetka residents.
| Immigration Origin | # Population | % Population |
| Argentina | 10 | 0.1% |
| Asia | 176 | 1.4% |
| Belize | 8 | 0.1% |
| Brazil | 7 | 0.1% |
| Canada | 89 | 0.7% |
| Caribbean | 10 | 0.1% |
| Central America | 22 | 0.2% |
| China | 61 | 0.5% |
| Colombia | 21 | 0.2% |
| Croatia | 25 | 0.2% |
| Cuba | 10 | 0.1% |
| Eastern Asia | 85 | 0.7% |
| Eastern Europe | 125 | 1.0% |
| England | 71 | 0.6% |
| Europe | 588 | 4.7% |
| France | 16 | 0.1% |
| Germany | 9 | 0.1% |
| Hong Kong | 5 | 0.0% |
| India | 30 | 0.2% |
| Iran | 10 | 0.1% |
| Ireland | 16 | 0.1% |
| Israel | 28 | 0.2% |
| Italy | 232 | 1.8% |
| Japan | 10 | 0.1% |
| Korea | 14 | 0.1% |
| Latin America | 70 | 0.6% |
| Mexico | 14 | 0.1% |
| Netherlands | 34 | 0.3% |
| Northern Europe | 172 | 1.4% |
| Philippines | 8 | 0.1% |
| Poland | 25 | 0.2% |
| Russia | 59 | 0.5% |
| Singapore | 15 | 0.1% |
| South America | 38 | 0.3% |
| South Central Asia | 40 | 0.3% |
| South Eastern Asia | 23 | 0.2% |
| Southern Europe | 232 | 1.8% |
| Ukraine | 9 | 0.1% |
| Western Asia | 28 | 0.2% |
| Western Europe | 59 | 0.5% | View All 40 Rows |
Sex and Age in Winnetka
Sex and Age in Winnetka
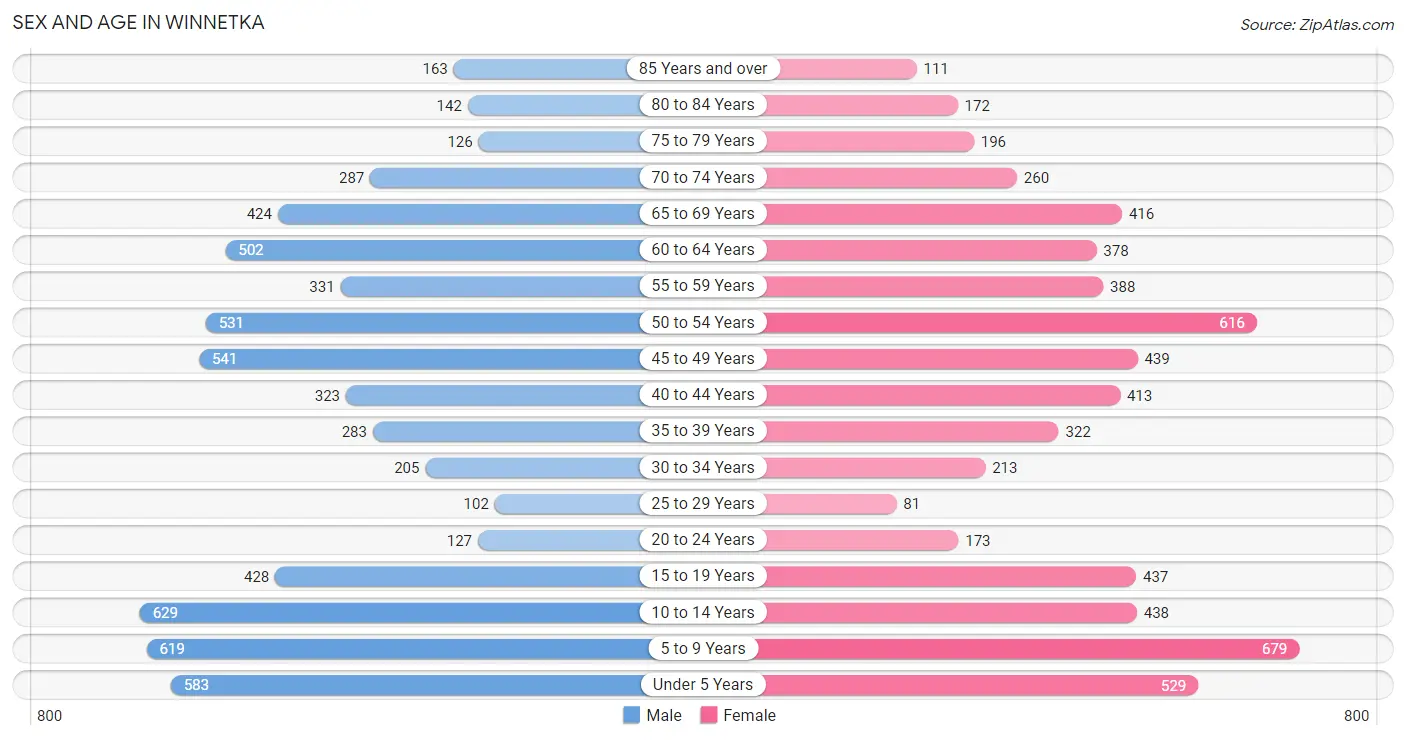
The most populous age groups in Winnetka are 10 to 14 Years (629 | 9.9%) for men and 5 to 9 Years (679 | 10.8%) for women.
| Age Bracket | Male | Female |
| Under 5 Years | 583 (9.2%) | 529 (8.5%) |
| 5 to 9 Years | 619 (9.8%) | 679 (10.8%) |
| 10 to 14 Years | 629 (9.9%) | 438 (7.0%) |
| 15 to 19 Years | 428 (6.7%) | 437 (7.0%) |
| 20 to 24 Years | 127 (2.0%) | 173 (2.8%) |
| 25 to 29 Years | 102 (1.6%) | 81 (1.3%) |
| 30 to 34 Years | 205 (3.2%) | 213 (3.4%) |
| 35 to 39 Years | 283 (4.5%) | 322 (5.1%) |
| 40 to 44 Years | 323 (5.1%) | 413 (6.6%) |
| 45 to 49 Years | 541 (8.5%) | 439 (7.0%) |
| 50 to 54 Years | 531 (8.4%) | 616 (9.8%) |
| 55 to 59 Years | 331 (5.2%) | 388 (6.2%) |
| 60 to 64 Years | 502 (7.9%) | 378 (6.0%) |
| 65 to 69 Years | 424 (6.7%) | 416 (6.6%) |
| 70 to 74 Years | 287 (4.5%) | 260 (4.2%) |
| 75 to 79 Years | 126 (2.0%) | 196 (3.1%) |
| 80 to 84 Years | 142 (2.2%) | 172 (2.8%) |
| 85 Years and over | 163 (2.6%) | 111 (1.8%) |
| Total | 6,346 (100.0%) | 6,261 (100.0%) |
Families and Households in Winnetka
Median Family Size in Winnetka
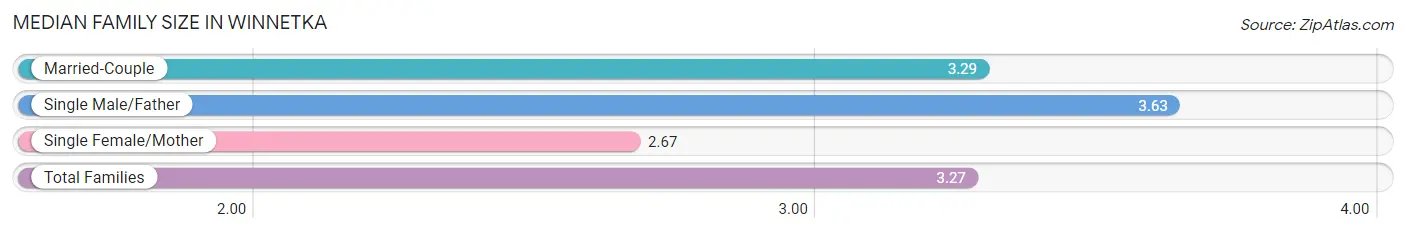
The median family size in Winnetka is 3.27 persons per family, with single male/father families (54 | 1.5%) accounting for the largest median family size of 3.63 persons per family. On the other hand, single female/mother families (139 | 3.9%) represent the smallest median family size with 2.67 persons per family.
| Family Type | # Families | Family Size |
| Married-Couple | 3,388 (94.6%) | 3.29 |
| Single Male/Father | 54 (1.5%) | 3.63 |
| Single Female/Mother | 139 (3.9%) | 2.67 |
| Total Families | 3,581 (100.0%) | 3.27 |
Median Household Size in Winnetka
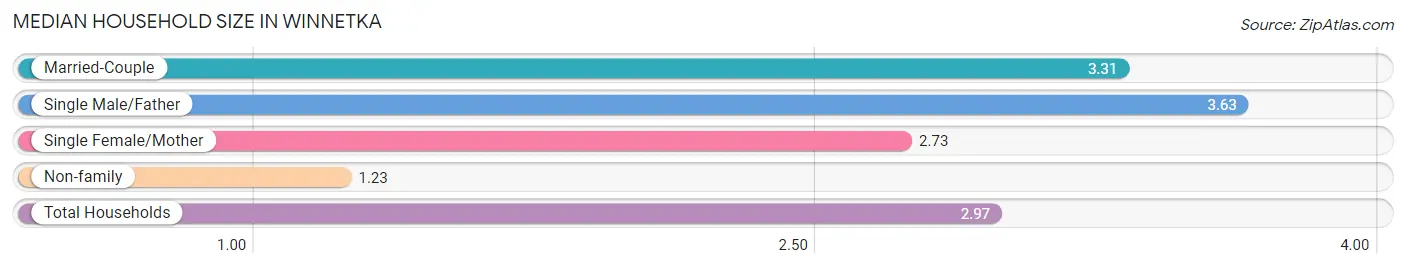
The median household size in Winnetka is 2.97 persons per household, with single male/father households (54 | 1.3%) accounting for the largest median household size of 3.63 persons per household. non-family households (661 | 15.6%) represent the smallest median household size with 1.23 persons per household.
| Household Type | # Households | Household Size |
| Married-Couple | 3,388 (79.9%) | 3.31 |
| Single Male/Father | 54 (1.3%) | 3.63 |
| Single Female/Mother | 139 (3.3%) | 2.73 |
| Non-family | 661 (15.6%) | 1.23 |
| Total Households | 4,242 (100.0%) | 2.97 |
Household Size by Marriage Status in Winnetka
Out of a total of 4,242 households in Winnetka, 3,581 (84.4%) are family households, while 661 (15.6%) are nonfamily households. The most numerous type of family households are 2-person households, comprising 1,290, and the most common type of nonfamily households are 1-person households, comprising 588.
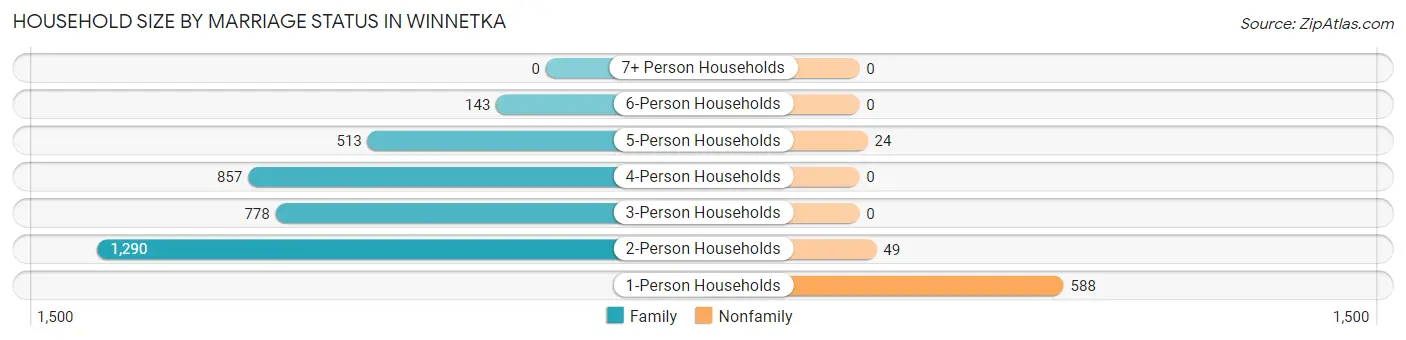
| Household Size | Family Households | Nonfamily Households |
| 1-Person Households | - | 588 (13.9%) |
| 2-Person Households | 1,290 (30.4%) | 49 (1.2%) |
| 3-Person Households | 778 (18.3%) | 0 (0.0%) |
| 4-Person Households | 857 (20.2%) | 0 (0.0%) |
| 5-Person Households | 513 (12.1%) | 24 (0.6%) |
| 6-Person Households | 143 (3.4%) | 0 (0.0%) |
| 7+ Person Households | 0 (0.0%) | 0 (0.0%) |
| Total | 3,581 (84.4%) | 661 (15.6%) |
Female Fertility in Winnetka
Fertility by Age in Winnetka
Average fertility rate in Winnetka is 70.0 births per 1,000 women. Women in the age bracket of 20 to 34 years have the highest fertility rate with 216.0 births per 1,000 women. Women in the age bracket of 20 to 34 years acount for 64.7% of all women with births.
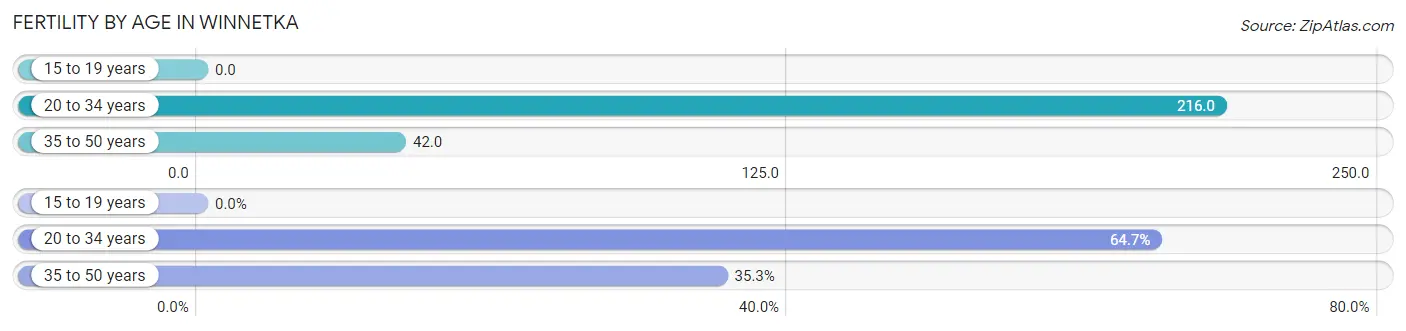
| Age Bracket | Women with Births | Births / 1,000 Women |
| 15 to 19 years | 0 (0.0%) | 0.0 |
| 20 to 34 years | 101 (64.7%) | 216.0 |
| 35 to 50 years | 55 (35.3%) | 42.0 |
| Total | 156 (100.0%) | 70.0 |
Fertility by Age by Marriage Status in Winnetka
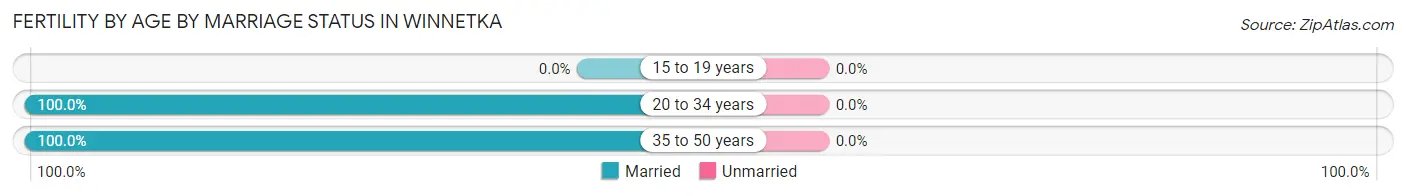
| Age Bracket | Married | Unmarried |
| 15 to 19 years | 0 (0.0%) | 0 (0.0%) |
| 20 to 34 years | 101 (100.0%) | 0 (0.0%) |
| 35 to 50 years | 55 (100.0%) | 0 (0.0%) |
| Total | 156 (100.0%) | 0 (0.0%) |
Fertility by Education in Winnetka
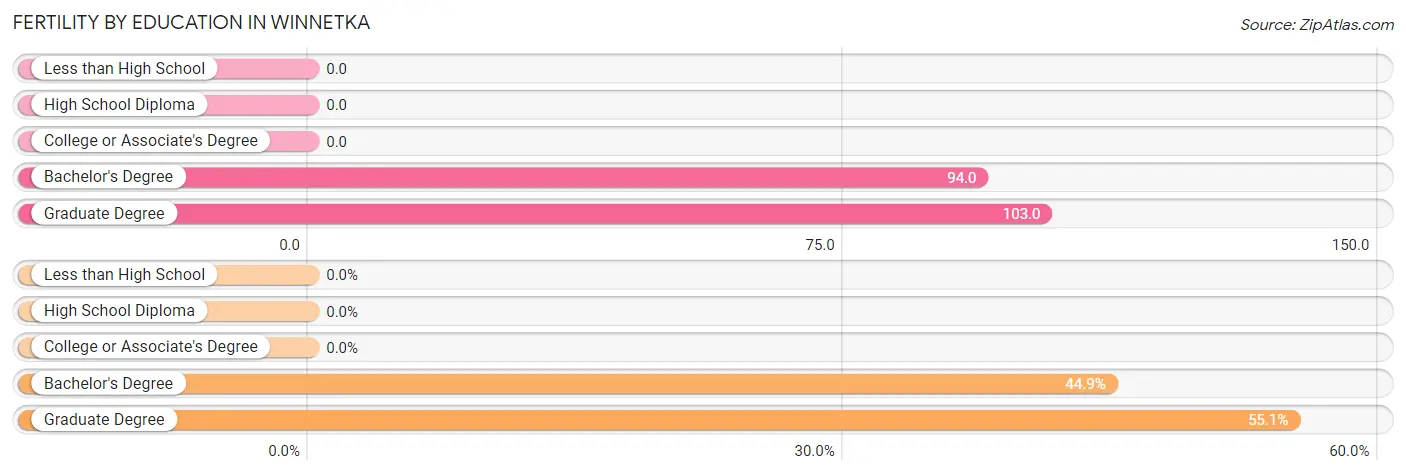
| Educational Attainment | Women with Births | Births / 1,000 Women |
| Less than High School | 0 (0.0%) | 0.0 |
| High School Diploma | 0 (0.0%) | 0.0 |
| College or Associate's Degree | 0 (0.0%) | 0.0 |
| Bachelor's Degree | 70 (44.9%) | 94.0 |
| Graduate Degree | 86 (55.1%) | 103.0 |
| Total | 156 (100.0%) | 70.0 |
Fertility by Education by Marriage Status in Winnetka
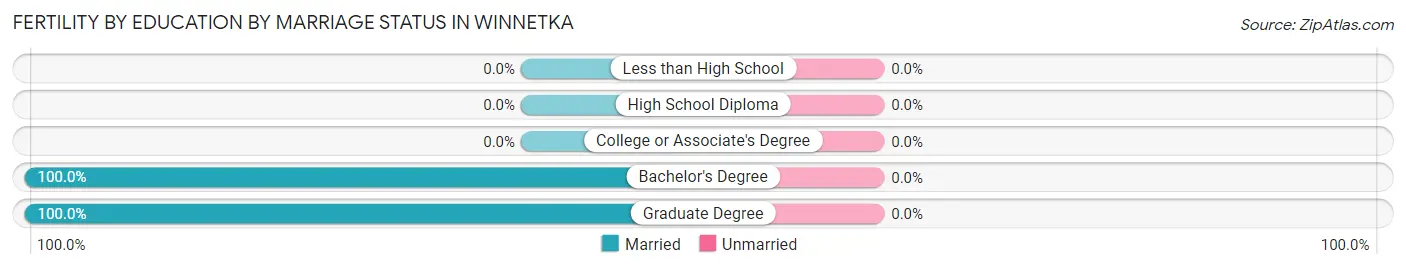
| Educational Attainment | Married | Unmarried |
| Less than High School | 0 (0.0%) | 0 (0.0%) |
| High School Diploma | 0 (0.0%) | 0 (0.0%) |
| College or Associate's Degree | 0 (0.0%) | 0 (0.0%) |
| Bachelor's Degree | 70 (100.0%) | 0 (0.0%) |
| Graduate Degree | 86 (100.0%) | 0 (0.0%) |
| Total | 156 (100.0%) | 0 (0.0%) |
Employment Characteristics in Winnetka
Employment by Class of Employer in Winnetka
Among the 4,958 employed individuals in Winnetka, private company employees (3,394 | 68.5%), self-employed (incorporated) (464 | 9.4%), and not-for-profit organizations (460 | 9.3%) make up the most common classes of employment.
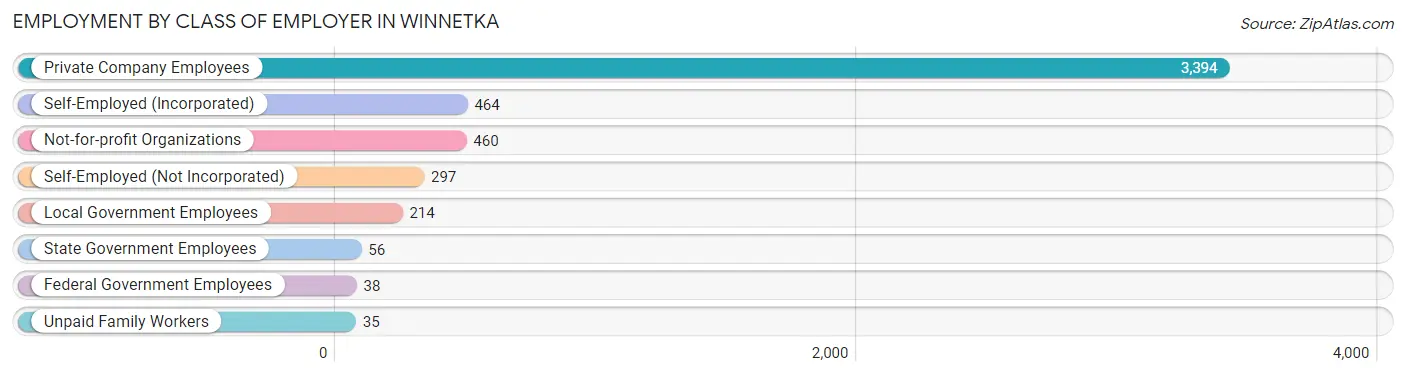
| Employer Class | # Employees | % Employees |
| Private Company Employees | 3,394 | 68.5% |
| Self-Employed (Incorporated) | 464 | 9.4% |
| Self-Employed (Not Incorporated) | 297 | 6.0% |
| Not-for-profit Organizations | 460 | 9.3% |
| Local Government Employees | 214 | 4.3% |
| State Government Employees | 56 | 1.1% |
| Federal Government Employees | 38 | 0.8% |
| Unpaid Family Workers | 35 | 0.7% |
| Total | 4,958 | 100.0% |
Employment Status by Age in Winnetka
According to the labor force statistics for Winnetka, out of the total population over 16 years of age (8,938), 58.1% or 5,193 individuals are in the labor force, with 3.7% or 192 of them unemployed. The age group with the highest labor force participation rate is 35 to 44 years, with 85.1% or 1,141 individuals in the labor force. Within the labor force, the 20 to 24 years age range has the highest percentage of unemployed individuals, with 21.8% or 39 of them being unemployed.
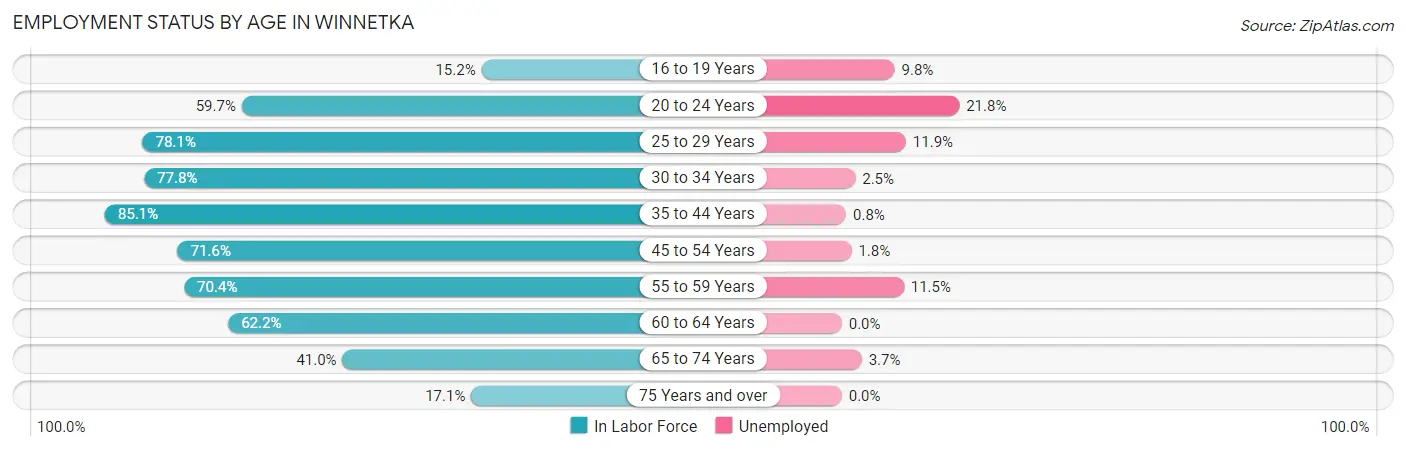
| Age Bracket | In Labor Force | Unemployed |
| 16 to 19 Years | 102 (15.2%) | 10 (9.8%) |
| 20 to 24 Years | 179 (59.7%) | 39 (21.8%) |
| 25 to 29 Years | 143 (78.1%) | 17 (11.9%) |
| 30 to 34 Years | 325 (77.8%) | 8 (2.5%) |
| 35 to 44 Years | 1,141 (85.1%) | 9 (0.8%) |
| 45 to 54 Years | 1,523 (71.6%) | 27 (1.8%) |
| 55 to 59 Years | 506 (70.4%) | 58 (11.5%) |
| 60 to 64 Years | 547 (62.2%) | 0 (0.0%) |
| 65 to 74 Years | 569 (41.0%) | 21 (3.7%) |
| 75 Years and over | 156 (17.1%) | 0 (0.0%) |
| Total | 5,193 (58.1%) | 192 (3.7%) |
Employment Status by Educational Attainment in Winnetka
According to labor force statistics for Winnetka, 73.8% of individuals (4,183) out of the total population between 25 and 64 years of age (5,668) are in the labor force, with 2.9% or 121 of them being unemployed. The group with the highest labor force participation rate are those with the educational attainment of bachelor's degree or higher, with 74.8% or 3,949 individuals in the labor force. Within the labor force, individuals with bachelor's degree or higher education have the highest percentage of unemployment, with 3.0% or 118 of them being unemployed.
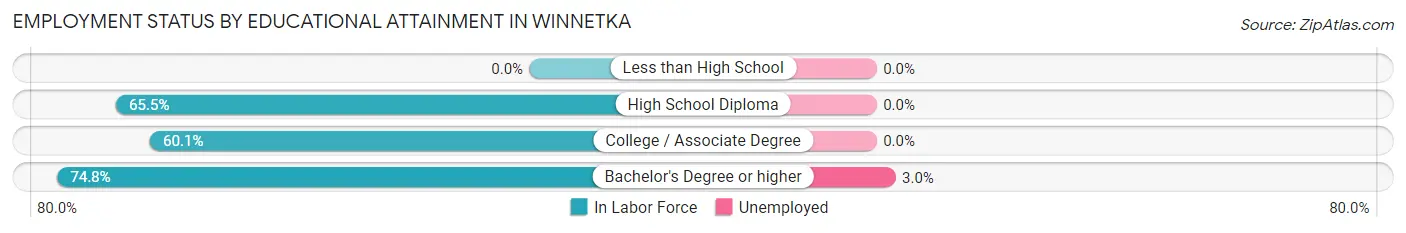
| Educational Attainment | In Labor Force | Unemployed |
| Less than High School | 0 (0.0%) | 0 (0.0%) |
| High School Diploma | 108 (65.5%) | 0 (0.0%) |
| College / Associate Degree | 128 (60.1%) | 0 (0.0%) |
| Bachelor's Degree or higher | 3,949 (74.8%) | 158 (3.0%) |
| Total | 4,183 (73.8%) | 164 (2.9%) |
Employment Occupations by Sex in Winnetka
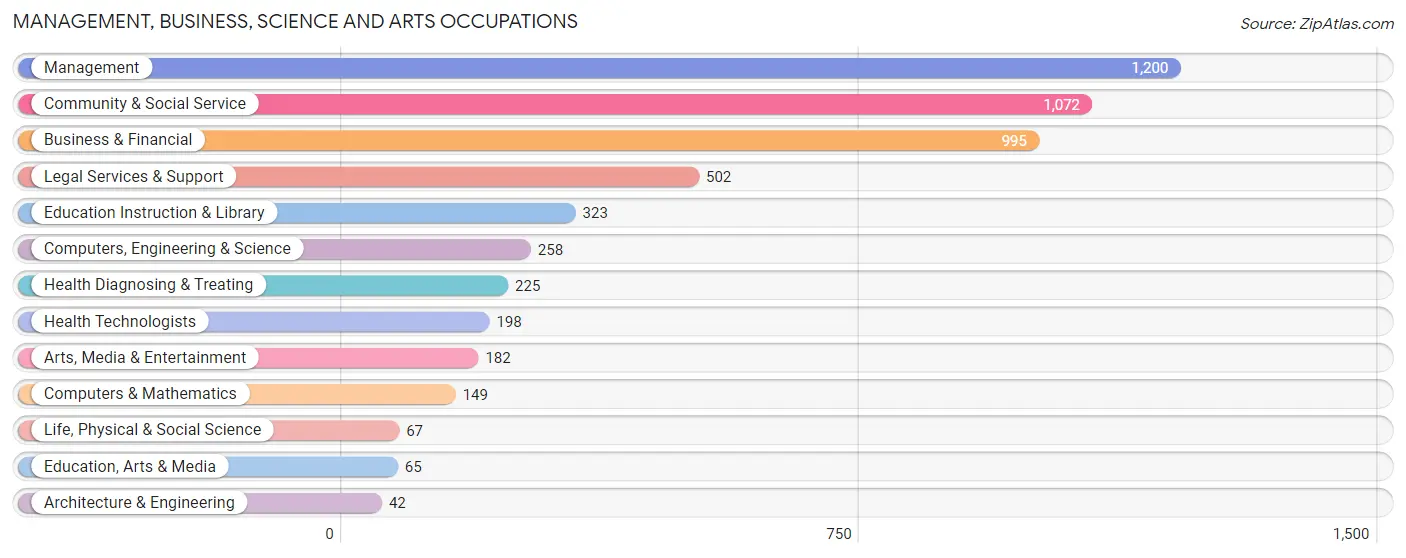
Management, Business, Science and Arts Occupations
The most common Management, Business, Science and Arts occupations in Winnetka are Management (1,200 | 24.0%), Community & Social Service (1,072 | 21.4%), Business & Financial (995 | 19.9%), Legal Services & Support (502 | 10.0%), and Education Instruction & Library (323 | 6.5%).
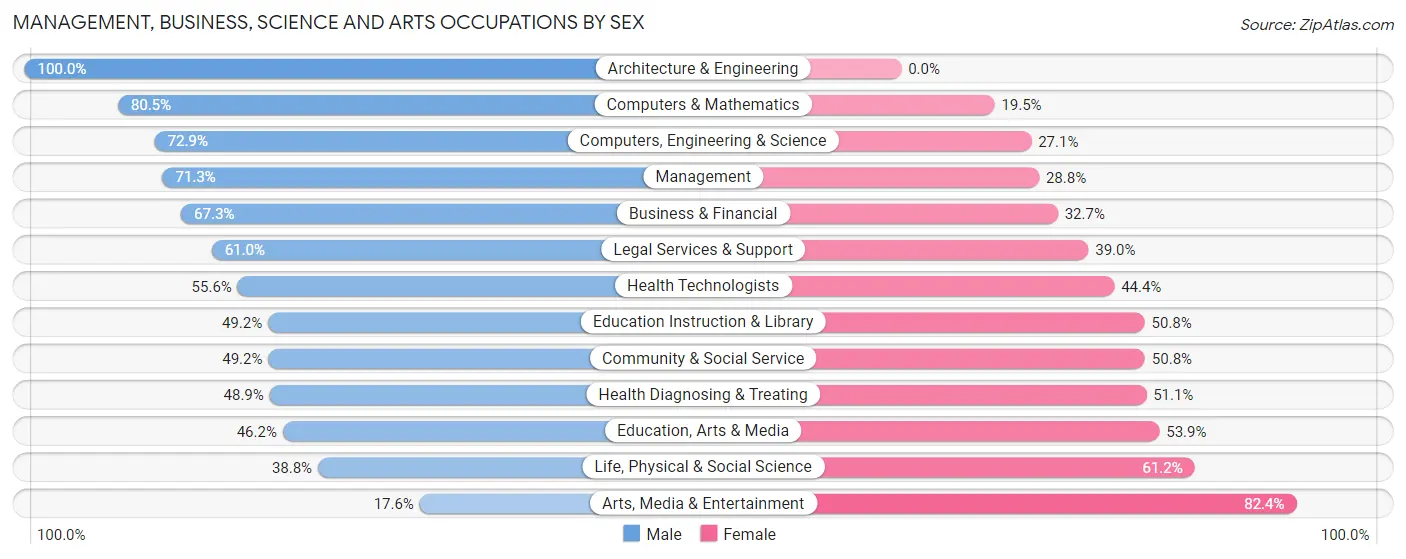
Management, Business, Science and Arts Occupations by Sex
Within the Management, Business, Science and Arts occupations in Winnetka, the most male-oriented occupations are Architecture & Engineering (100.0%), Computers & Mathematics (80.5%), and Computers, Engineering & Science (72.9%), while the most female-oriented occupations are Arts, Media & Entertainment (82.4%), Life, Physical & Social Science (61.2%), and Education, Arts & Media (53.8%).
| Occupation | Male | Female |
| Management | 855 (71.3%) | 345 (28.7%) |
| Business & Financial | 670 (67.3%) | 325 (32.7%) |
| Computers, Engineering & Science | 188 (72.9%) | 70 (27.1%) |
| Computers & Mathematics | 120 (80.5%) | 29 (19.5%) |
| Architecture & Engineering | 42 (100.0%) | 0 (0.0%) |
| Life, Physical & Social Science | 26 (38.8%) | 41 (61.2%) |
| Community & Social Service | 527 (49.2%) | 545 (50.8%) |
| Education, Arts & Media | 30 (46.2%) | 35 (53.8%) |
| Legal Services & Support | 306 (61.0%) | 196 (39.0%) |
| Education Instruction & Library | 159 (49.2%) | 164 (50.8%) |
| Arts, Media & Entertainment | 32 (17.6%) | 150 (82.4%) |
| Health Diagnosing & Treating | 110 (48.9%) | 115 (51.1%) |
| Health Technologists | 110 (55.6%) | 88 (44.4%) |
| Total (Category) | 2,350 (62.7%) | 1,400 (37.3%) |
| Total (Overall) | 3,024 (60.5%) | 1,975 (39.5%) |
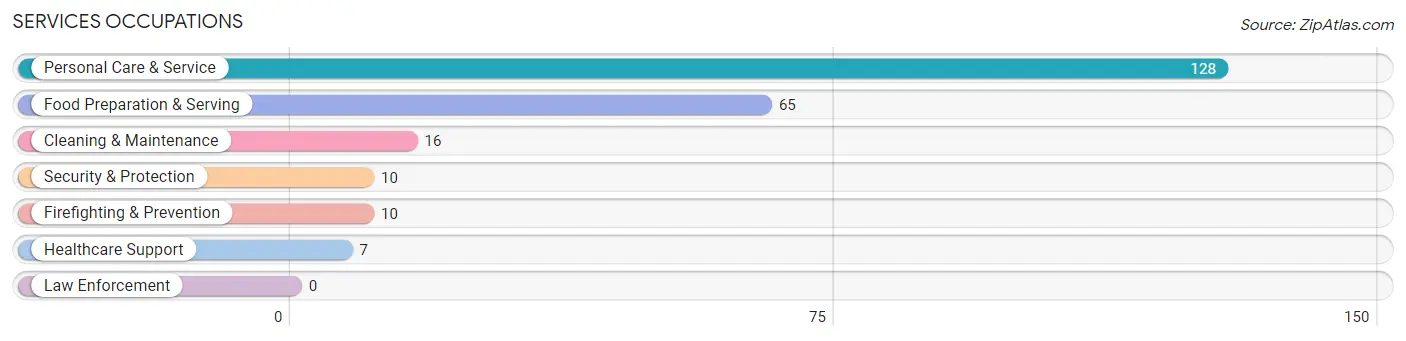
Services Occupations
The most common Services occupations in Winnetka are Personal Care & Service (128 | 2.6%), Food Preparation & Serving (65 | 1.3%), Cleaning & Maintenance (16 | 0.3%), Security & Protection (10 | 0.2%), and Firefighting & Prevention (10 | 0.2%).
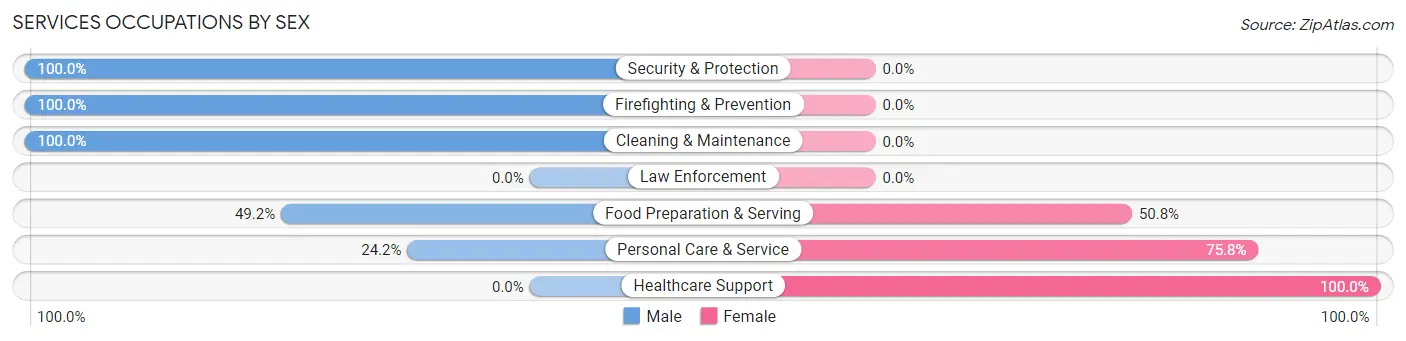
Services Occupations by Sex
Within the Services occupations in Winnetka, the most male-oriented occupations are Security & Protection (100.0%), Firefighting & Prevention (100.0%), and Cleaning & Maintenance (100.0%), while the most female-oriented occupations are Healthcare Support (100.0%), Personal Care & Service (75.8%), and Food Preparation & Serving (50.8%).
| Occupation | Male | Female |
| Healthcare Support | 0 (0.0%) | 7 (100.0%) |
| Security & Protection | 10 (100.0%) | 0 (0.0%) |
| Firefighting & Prevention | 10 (100.0%) | 0 (0.0%) |
| Law Enforcement | 0 (0.0%) | 0 (0.0%) |
| Food Preparation & Serving | 32 (49.2%) | 33 (50.8%) |
| Cleaning & Maintenance | 16 (100.0%) | 0 (0.0%) |
| Personal Care & Service | 31 (24.2%) | 97 (75.8%) |
| Total (Category) | 89 (39.4%) | 137 (60.6%) |
| Total (Overall) | 3,024 (60.5%) | 1,975 (39.5%) |
Sales and Office Occupations
The most common Sales and Office occupations in Winnetka are Sales & Related (682 | 13.6%), and Office & Administration (214 | 4.3%).

Sales and Office Occupations by Sex
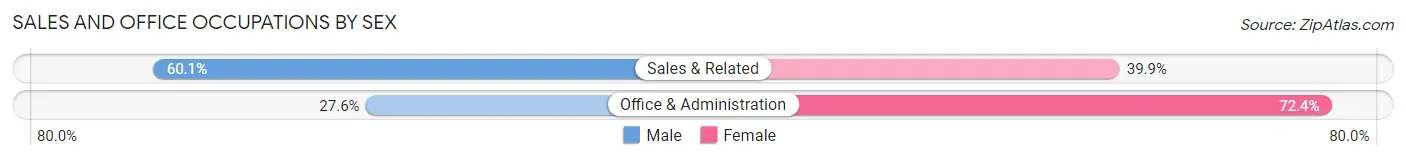
| Occupation | Male | Female |
| Sales & Related | 410 (60.1%) | 272 (39.9%) |
| Office & Administration | 59 (27.6%) | 155 (72.4%) |
| Total (Category) | 469 (52.3%) | 427 (47.7%) |
| Total (Overall) | 3,024 (60.5%) | 1,975 (39.5%) |
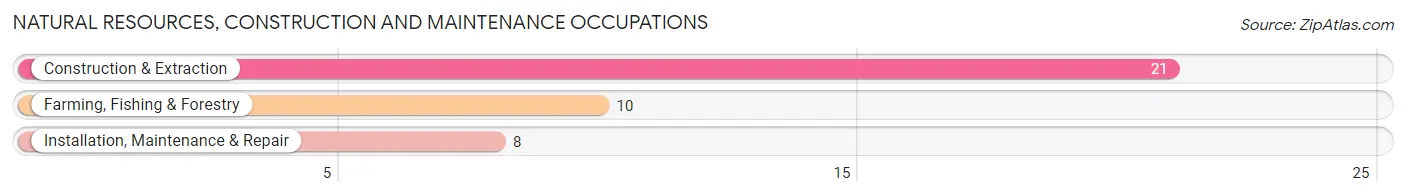
Natural Resources, Construction and Maintenance Occupations
The most common Natural Resources, Construction and Maintenance occupations in Winnetka are Construction & Extraction (21 | 0.4%), Farming, Fishing & Forestry (10 | 0.2%), and Installation, Maintenance & Repair (8 | 0.2%).
Natural Resources, Construction and Maintenance Occupations by Sex
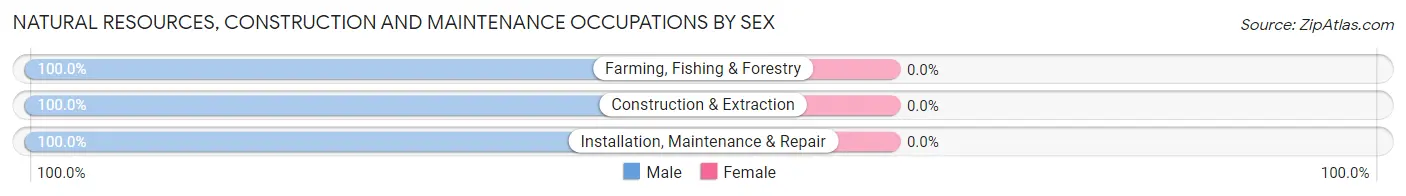
| Occupation | Male | Female |
| Farming, Fishing & Forestry | 10 (100.0%) | 0 (0.0%) |
| Construction & Extraction | 21 (100.0%) | 0 (0.0%) |
| Installation, Maintenance & Repair | 8 (100.0%) | 0 (0.0%) |
| Total (Category) | 39 (100.0%) | 0 (0.0%) |
| Total (Overall) | 3,024 (60.5%) | 1,975 (39.5%) |
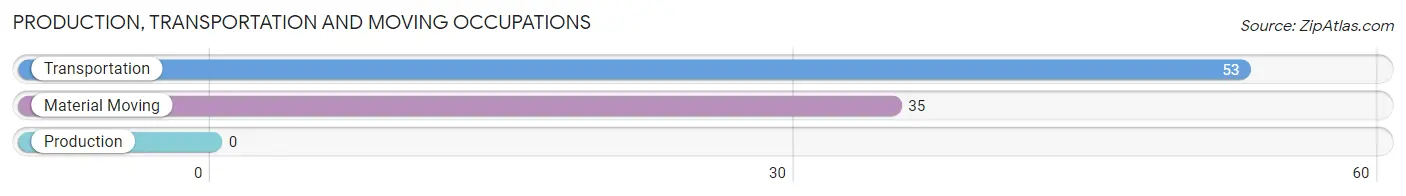
Production, Transportation and Moving Occupations
The most common Production, Transportation and Moving occupations in Winnetka are Transportation (53 | 1.1%), and Material Moving (35 | 0.7%).
Production, Transportation and Moving Occupations by Sex
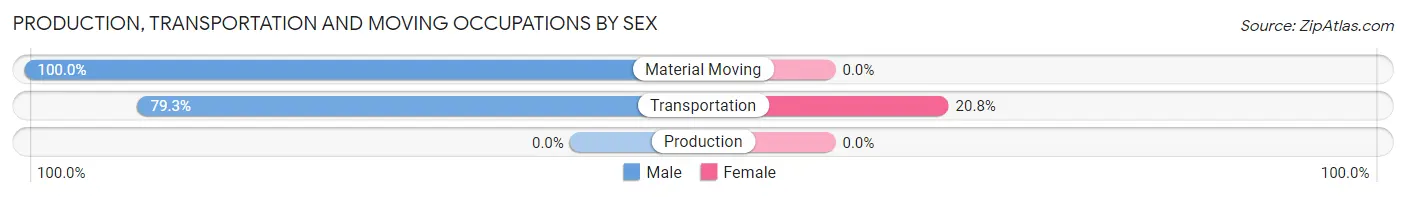
| Occupation | Male | Female |
| Production | 0 (0.0%) | 0 (0.0%) |
| Transportation | 42 (79.2%) | 11 (20.7%) |
| Material Moving | 35 (100.0%) | 0 (0.0%) |
| Total (Category) | 77 (87.5%) | 11 (12.5%) |
| Total (Overall) | 3,024 (60.5%) | 1,975 (39.5%) |
Employment Industries by Sex in Winnetka
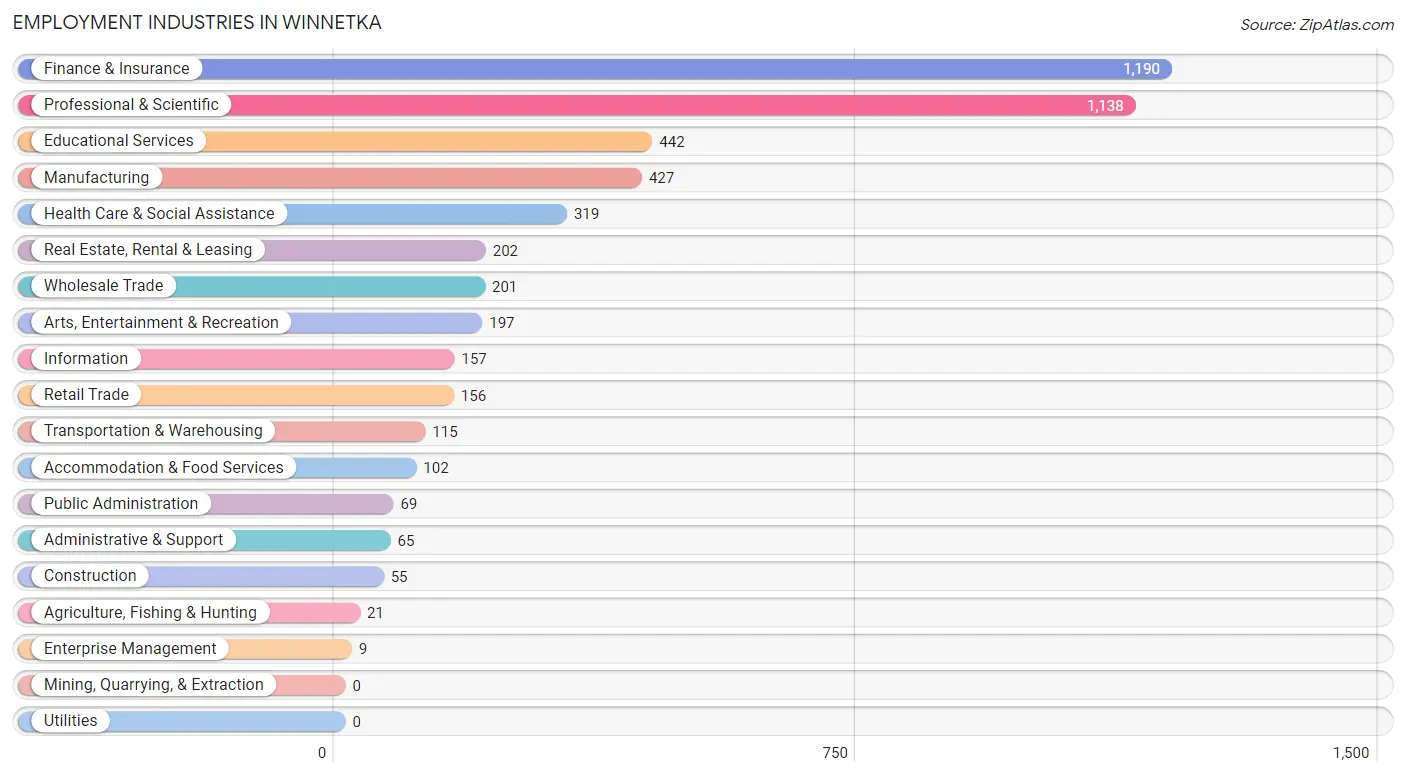
Employment Industries in Winnetka
The major employment industries in Winnetka include Finance & Insurance (1,190 | 23.8%), Professional & Scientific (1,138 | 22.8%), Educational Services (442 | 8.8%), Manufacturing (427 | 8.5%), and Health Care & Social Assistance (319 | 6.4%).
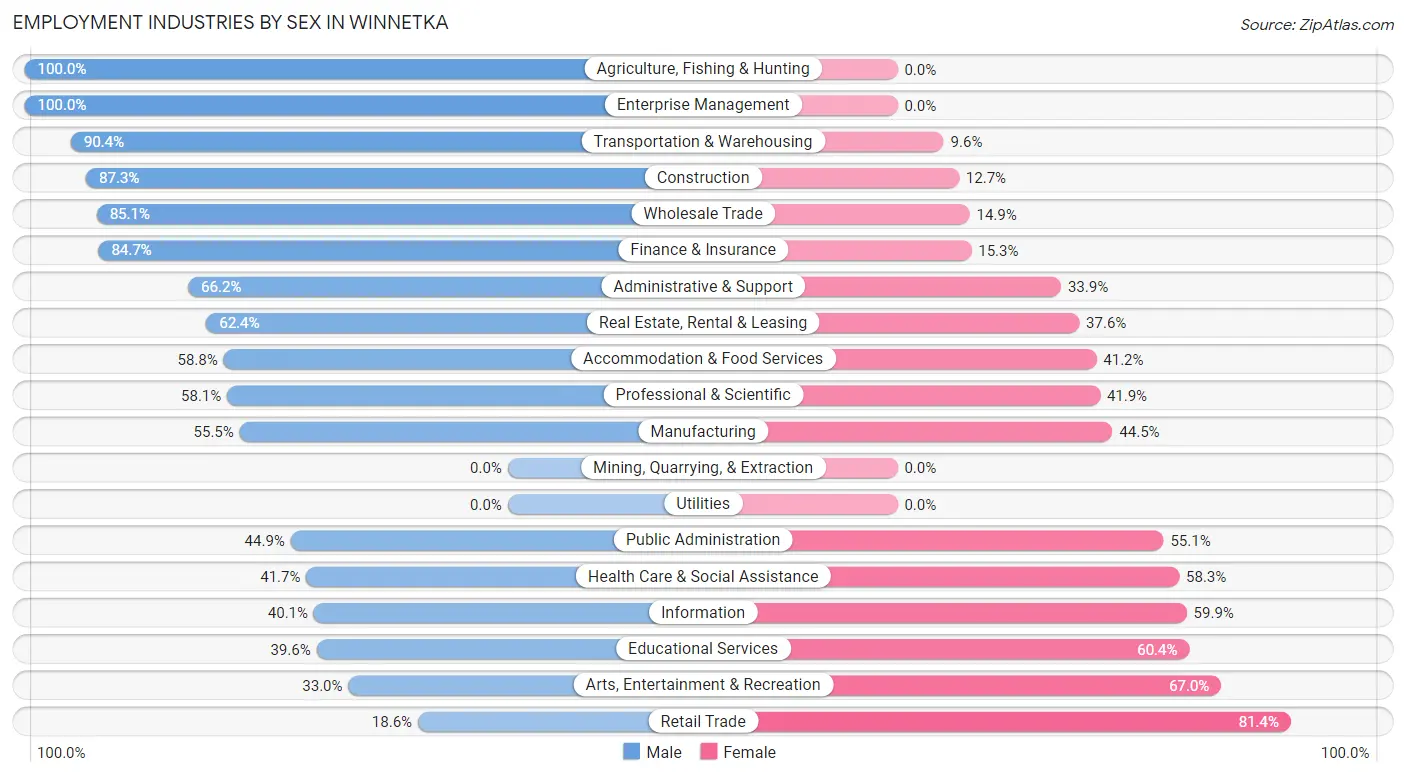
Employment Industries by Sex in Winnetka
The Winnetka industries that see more men than women are Agriculture, Fishing & Hunting (100.0%), Enterprise Management (100.0%), and Transportation & Warehousing (90.4%), whereas the industries that tend to have a higher number of women are Retail Trade (81.4%), Arts, Entertainment & Recreation (67.0%), and Educational Services (60.4%).
| Industry | Male | Female |
| Agriculture, Fishing & Hunting | 21 (100.0%) | 0 (0.0%) |
| Mining, Quarrying, & Extraction | 0 (0.0%) | 0 (0.0%) |
| Construction | 48 (87.3%) | 7 (12.7%) |
| Manufacturing | 237 (55.5%) | 190 (44.5%) |
| Wholesale Trade | 171 (85.1%) | 30 (14.9%) |
| Retail Trade | 29 (18.6%) | 127 (81.4%) |
| Transportation & Warehousing | 104 (90.4%) | 11 (9.6%) |
| Utilities | 0 (0.0%) | 0 (0.0%) |
| Information | 63 (40.1%) | 94 (59.9%) |
| Finance & Insurance | 1,008 (84.7%) | 182 (15.3%) |
| Real Estate, Rental & Leasing | 126 (62.4%) | 76 (37.6%) |
| Professional & Scientific | 661 (58.1%) | 477 (41.9%) |
| Enterprise Management | 9 (100.0%) | 0 (0.0%) |
| Administrative & Support | 43 (66.1%) | 22 (33.9%) |
| Educational Services | 175 (39.6%) | 267 (60.4%) |
| Health Care & Social Assistance | 133 (41.7%) | 186 (58.3%) |
| Arts, Entertainment & Recreation | 65 (33.0%) | 132 (67.0%) |
| Accommodation & Food Services | 60 (58.8%) | 42 (41.2%) |
| Public Administration | 31 (44.9%) | 38 (55.1%) |
| Total | 3,024 (60.5%) | 1,975 (39.5%) |
Education in Winnetka
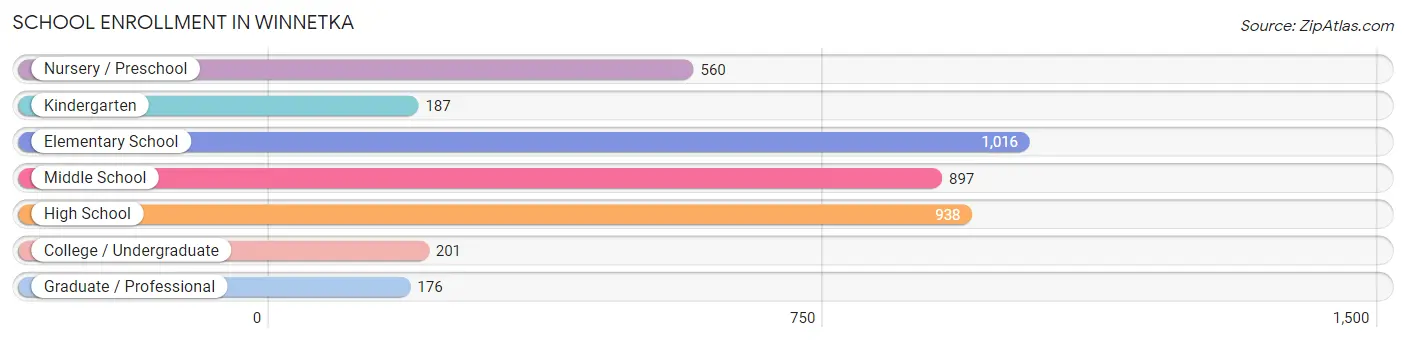
School Enrollment in Winnetka
The most common levels of schooling among the 3,975 students in Winnetka are elementary school (1,016 | 25.6%), high school (938 | 23.6%), and middle school (897 | 22.6%).
| School Level | # Students | % Students |
| Nursery / Preschool | 560 | 14.1% |
| Kindergarten | 187 | 4.7% |
| Elementary School | 1,016 | 25.6% |
| Middle School | 897 | 22.6% |
| High School | 938 | 23.6% |
| College / Undergraduate | 201 | 5.1% |
| Graduate / Professional | 176 | 4.4% |
| Total | 3,975 | 100.0% |
School Enrollment by Age by Funding Source in Winnetka
Out of a total of 3,975 students who are enrolled in schools in Winnetka, 1,061 (26.7%) attend a private institution, while the remaining 2,914 (73.3%) are enrolled in public schools. The age group of 35 years and over has the highest likelihood of being enrolled in private schools, with 118 (79.7% in the age bracket) enrolled. Conversely, the age group of 15 to 17 year olds has the lowest likelihood of being enrolled in a private school, with 618 (88.5% in the age bracket) attending a public institution.
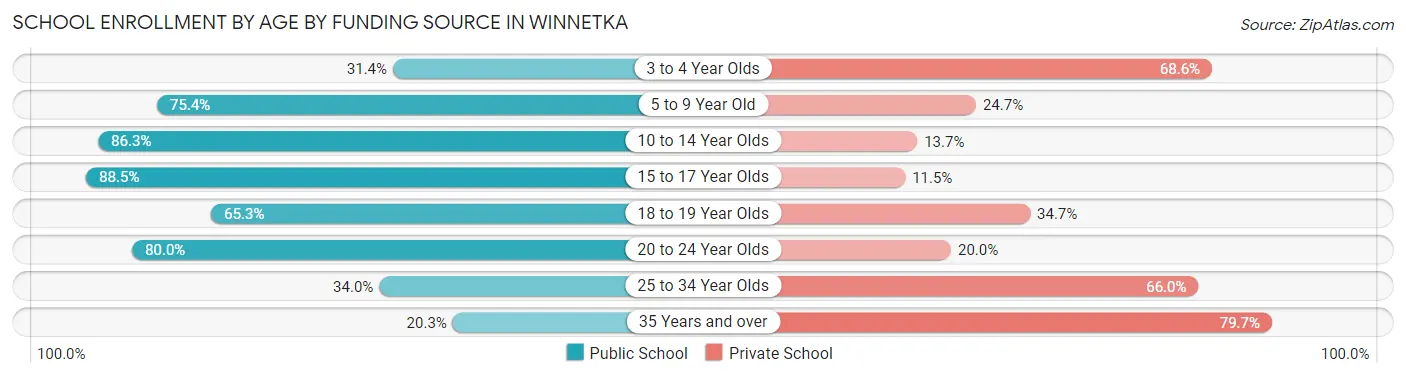
| Age Bracket | Public School | Private School |
| 3 to 4 Year Olds | 125 (31.4%) | 273 (68.6%) |
| 5 to 9 Year Old | 972 (75.3%) | 318 (24.6%) |
| 10 to 14 Year Olds | 907 (86.3%) | 144 (13.7%) |
| 15 to 17 Year Olds | 618 (88.5%) | 80 (11.5%) |
| 18 to 19 Year Olds | 109 (65.3%) | 58 (34.7%) |
| 20 to 24 Year Olds | 136 (80.0%) | 34 (20.0%) |
| 25 to 34 Year Olds | 18 (34.0%) | 35 (66.0%) |
| 35 Years and over | 30 (20.3%) | 118 (79.7%) |
| Total | 2,914 (73.3%) | 1,061 (26.7%) |
Educational Attainment by Field of Study in Winnetka
Business (1,826 | 23.6%), social sciences (1,734 | 22.4%), liberal arts & history (786 | 10.2%), literature & languages (677 | 8.8%), and communications (484 | 6.3%) are the most common fields of study among 7,732 individuals in Winnetka who have obtained a bachelor's degree or higher.
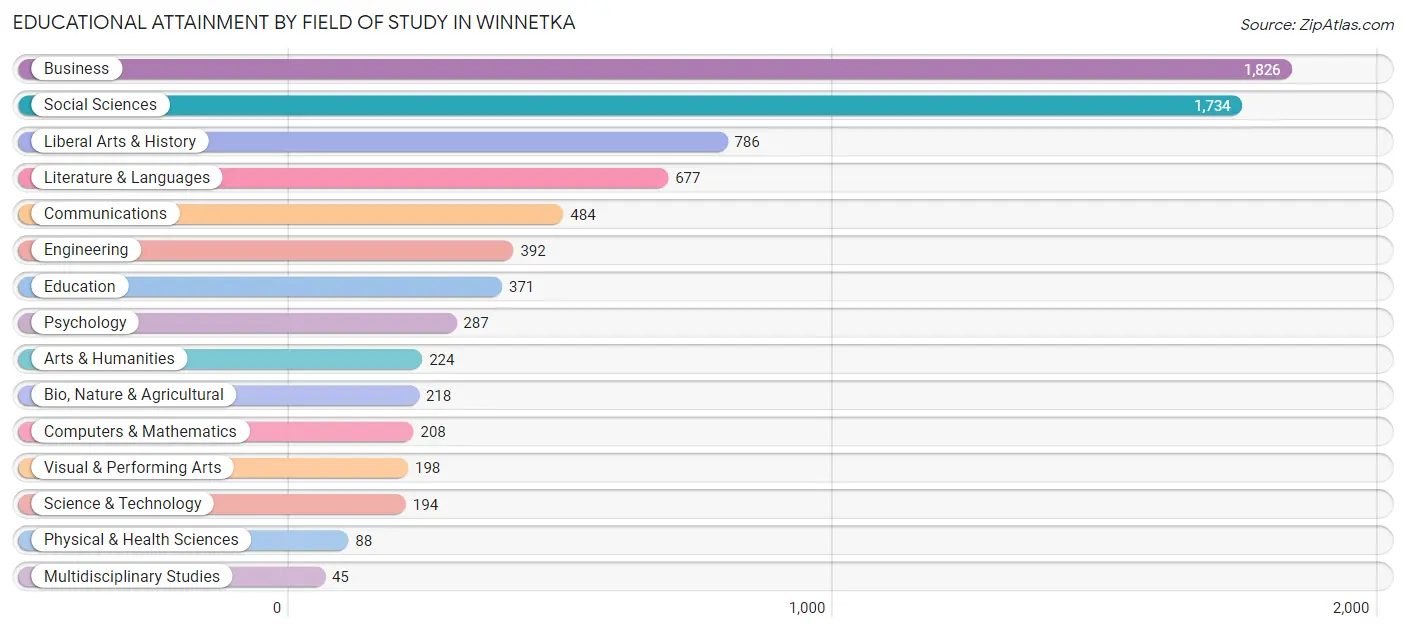
| Field of Study | # Graduates | % Graduates |
| Computers & Mathematics | 208 | 2.7% |
| Bio, Nature & Agricultural | 218 | 2.8% |
| Physical & Health Sciences | 88 | 1.1% |
| Psychology | 287 | 3.7% |
| Social Sciences | 1,734 | 22.4% |
| Engineering | 392 | 5.1% |
| Multidisciplinary Studies | 45 | 0.6% |
| Science & Technology | 194 | 2.5% |
| Business | 1,826 | 23.6% |
| Education | 371 | 4.8% |
| Literature & Languages | 677 | 8.8% |
| Liberal Arts & History | 786 | 10.2% |
| Visual & Performing Arts | 198 | 2.6% |
| Communications | 484 | 6.3% |
| Arts & Humanities | 224 | 2.9% |
| Total | 7,732 | 100.0% |
Transportation & Commute in Winnetka
Vehicle Availability by Sex in Winnetka
The most prevalent vehicle ownership categories in Winnetka are males with 2 vehicles (1,702, accounting for 56.9%) and females with 2 vehicles (1,087, making up 86.7%).
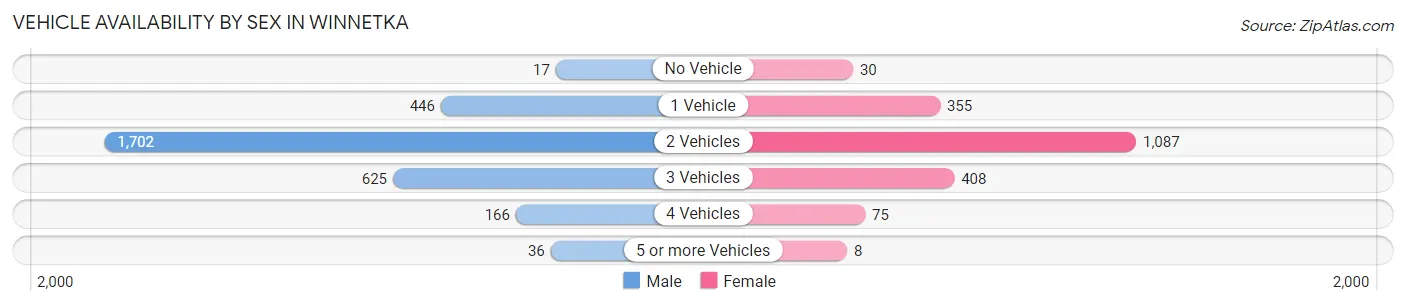
| Vehicles Available | Male | Female |
| No Vehicle | 17 (0.6%) | 30 (1.5%) |
| 1 Vehicle | 446 (14.9%) | 355 (18.1%) |
| 2 Vehicles | 1,702 (56.9%) | 1,087 (55.4%) |
| 3 Vehicles | 625 (20.9%) | 408 (20.8%) |
| 4 Vehicles | 166 (5.6%) | 75 (3.8%) |
| 5 or more Vehicles | 36 (1.2%) | 8 (0.4%) |
| Total | 2,992 (100.0%) | 1,963 (100.0%) |
Commute Time in Winnetka
The most frequently occuring commute durations in Winnetka are 45 to 59 minutes (960 commuters, 25.8%), 60 to 89 minutes (409 commuters, 11.0%), and 15 to 19 minutes (374 commuters, 10.1%).
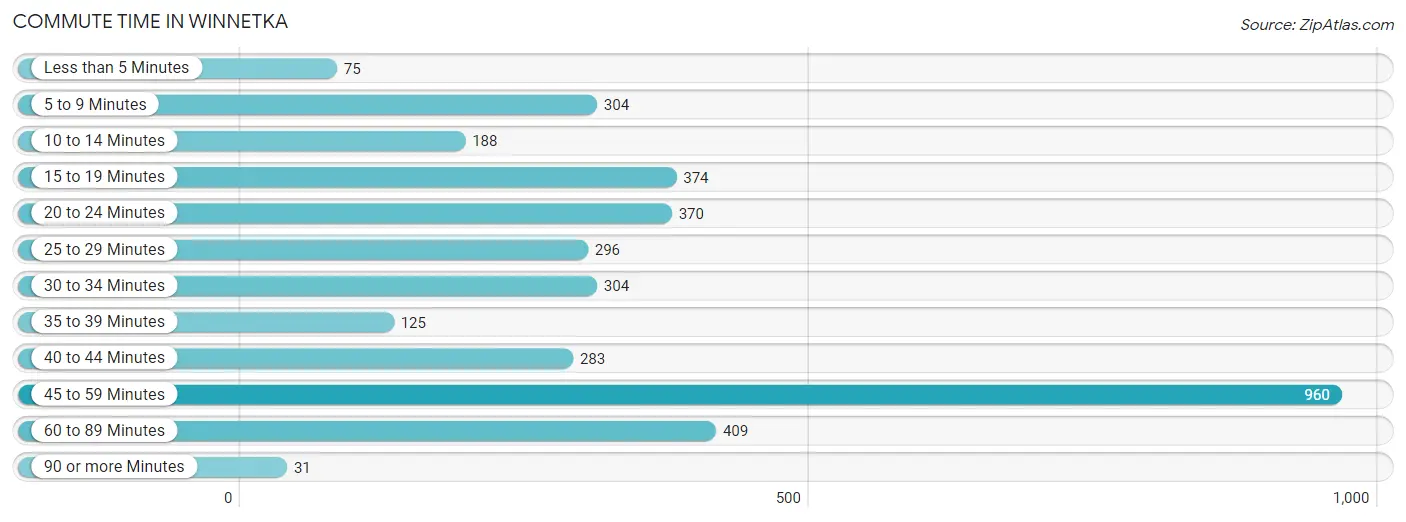
| Commute Time | # Commuters | % Commuters |
| Less than 5 Minutes | 75 | 2.0% |
| 5 to 9 Minutes | 304 | 8.2% |
| 10 to 14 Minutes | 188 | 5.1% |
| 15 to 19 Minutes | 374 | 10.1% |
| 20 to 24 Minutes | 370 | 10.0% |
| 25 to 29 Minutes | 296 | 8.0% |
| 30 to 34 Minutes | 304 | 8.2% |
| 35 to 39 Minutes | 125 | 3.4% |
| 40 to 44 Minutes | 283 | 7.6% |
| 45 to 59 Minutes | 960 | 25.8% |
| 60 to 89 Minutes | 409 | 11.0% |
| 90 or more Minutes | 31 | 0.8% |
Commute Time by Sex in Winnetka
The most common commute times in Winnetka are 45 to 59 minutes (707 commuters, 30.6%) for males and 45 to 59 minutes (253 commuters, 18.0%) for females.
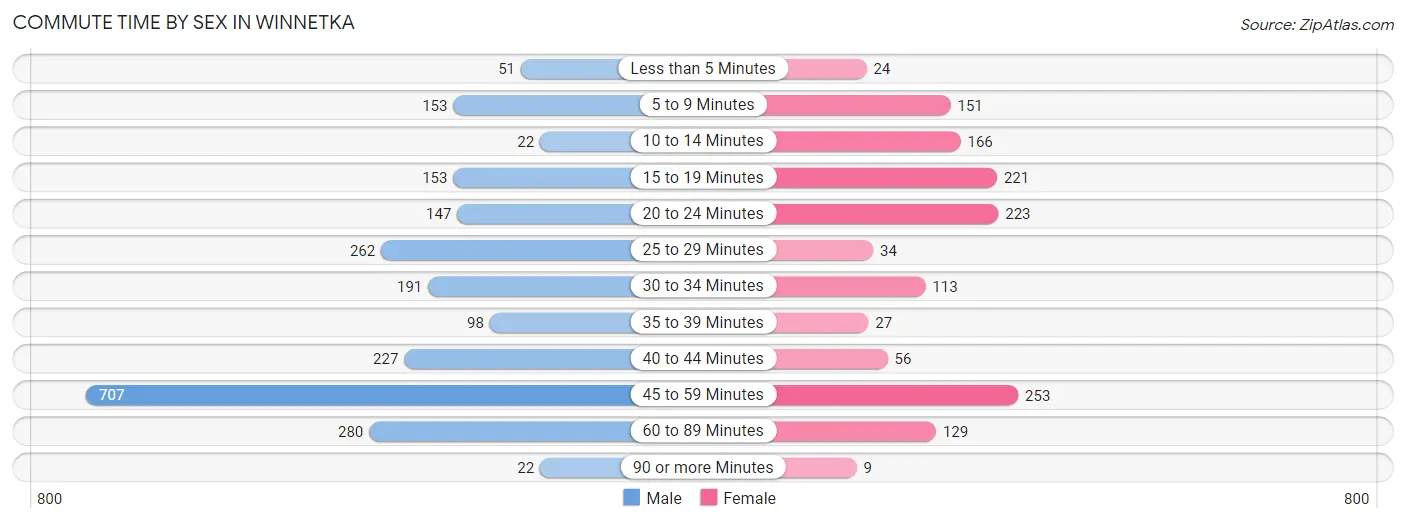
| Commute Time | Male | Female |
| Less than 5 Minutes | 51 (2.2%) | 24 (1.7%) |
| 5 to 9 Minutes | 153 (6.6%) | 151 (10.7%) |
| 10 to 14 Minutes | 22 (0.9%) | 166 (11.8%) |
| 15 to 19 Minutes | 153 (6.6%) | 221 (15.7%) |
| 20 to 24 Minutes | 147 (6.4%) | 223 (15.9%) |
| 25 to 29 Minutes | 262 (11.3%) | 34 (2.4%) |
| 30 to 34 Minutes | 191 (8.3%) | 113 (8.0%) |
| 35 to 39 Minutes | 98 (4.2%) | 27 (1.9%) |
| 40 to 44 Minutes | 227 (9.8%) | 56 (4.0%) |
| 45 to 59 Minutes | 707 (30.6%) | 253 (18.0%) |
| 60 to 89 Minutes | 280 (12.1%) | 129 (9.2%) |
| 90 or more Minutes | 22 (0.9%) | 9 (0.6%) |
Time of Departure to Work by Sex in Winnetka
The most frequent times of departure to work in Winnetka are 7:00 AM to 7:29 AM (453, 19.6%) for males and 9:00 AM to 9:59 AM (326, 23.2%) for females.
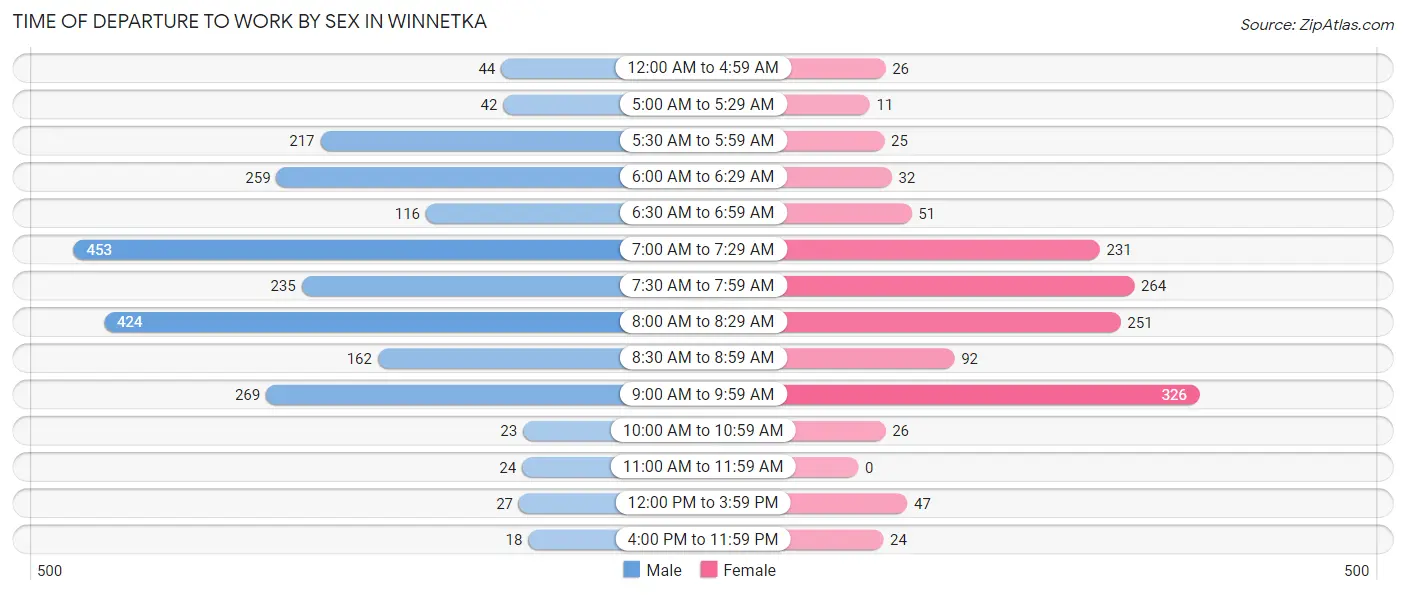
| Time of Departure | Male | Female |
| 12:00 AM to 4:59 AM | 44 (1.9%) | 26 (1.8%) |
| 5:00 AM to 5:29 AM | 42 (1.8%) | 11 (0.8%) |
| 5:30 AM to 5:59 AM | 217 (9.4%) | 25 (1.8%) |
| 6:00 AM to 6:29 AM | 259 (11.2%) | 32 (2.3%) |
| 6:30 AM to 6:59 AM | 116 (5.0%) | 51 (3.6%) |
| 7:00 AM to 7:29 AM | 453 (19.6%) | 231 (16.4%) |
| 7:30 AM to 7:59 AM | 235 (10.2%) | 264 (18.8%) |
| 8:00 AM to 8:29 AM | 424 (18.3%) | 251 (17.8%) |
| 8:30 AM to 8:59 AM | 162 (7.0%) | 92 (6.5%) |
| 9:00 AM to 9:59 AM | 269 (11.6%) | 326 (23.2%) |
| 10:00 AM to 10:59 AM | 23 (1.0%) | 26 (1.8%) |
| 11:00 AM to 11:59 AM | 24 (1.0%) | 0 (0.0%) |
| 12:00 PM to 3:59 PM | 27 (1.2%) | 47 (3.3%) |
| 4:00 PM to 11:59 PM | 18 (0.8%) | 24 (1.7%) |
| Total | 2,313 (100.0%) | 1,406 (100.0%) |
Housing Occupancy in Winnetka
Occupancy by Ownership in Winnetka
Of the total 4,242 dwellings in Winnetka, owner-occupied units account for 3,917 (92.3%), while renter-occupied units make up 325 (7.7%).
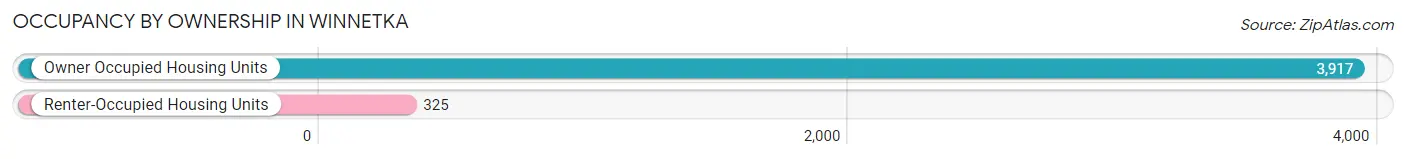
| Occupancy | # Housing Units | % Housing Units |
| Owner Occupied Housing Units | 3,917 | 92.3% |
| Renter-Occupied Housing Units | 325 | 7.7% |
| Total Occupied Housing Units | 4,242 | 100.0% |
Occupancy by Household Size in Winnetka
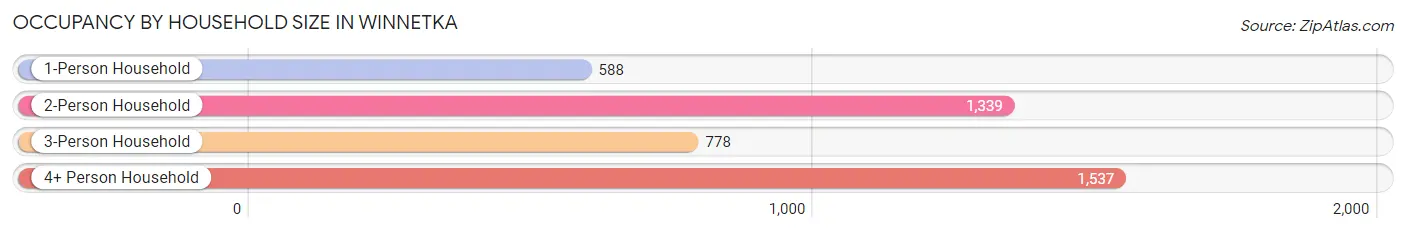
| Household Size | # Housing Units | % Housing Units |
| 1-Person Household | 588 | 13.9% |
| 2-Person Household | 1,339 | 31.6% |
| 3-Person Household | 778 | 18.3% |
| 4+ Person Household | 1,537 | 36.2% |
| Total Housing Units | 4,242 | 100.0% |
Occupancy by Ownership by Household Size in Winnetka
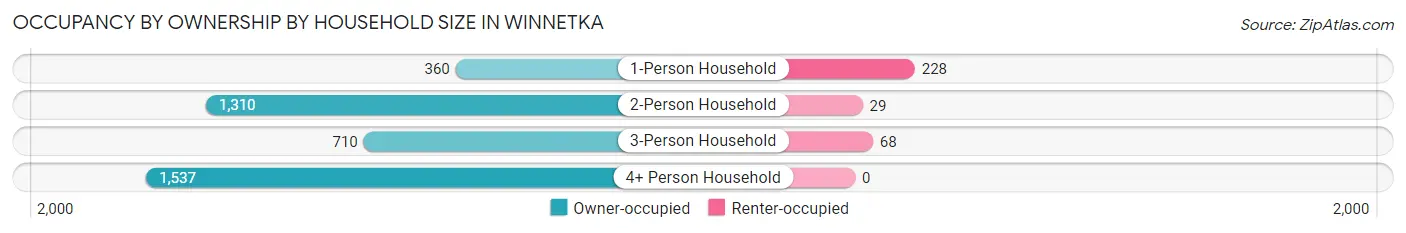
| Household Size | Owner-occupied | Renter-occupied |
| 1-Person Household | 360 (61.2%) | 228 (38.8%) |
| 2-Person Household | 1,310 (97.8%) | 29 (2.2%) |
| 3-Person Household | 710 (91.3%) | 68 (8.7%) |
| 4+ Person Household | 1,537 (100.0%) | 0 (0.0%) |
| Total Housing Units | 3,917 (92.3%) | 325 (7.7%) |
Occupancy by Educational Attainment in Winnetka
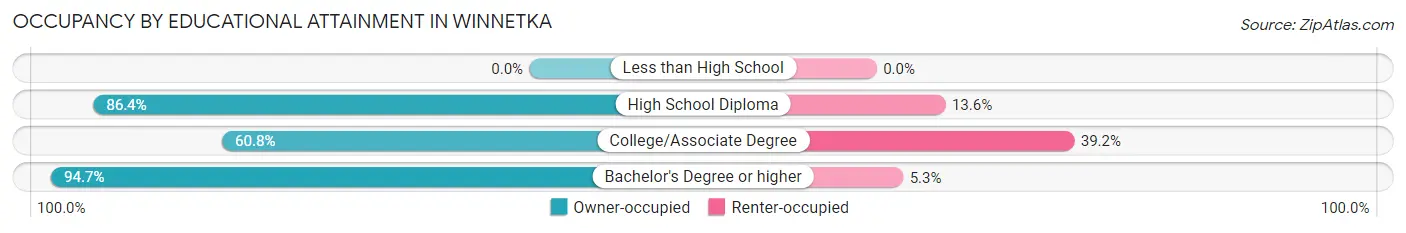
| Household Size | Owner-occupied | Renter-occupied |
| Less than High School | 0 (0.0%) | 0 (0.0%) |
| High School Diploma | 114 (86.4%) | 18 (13.6%) |
| College/Associate Degree | 163 (60.8%) | 105 (39.2%) |
| Bachelor's Degree or higher | 3,640 (94.7%) | 202 (5.3%) |
Occupancy by Age of Householder in Winnetka
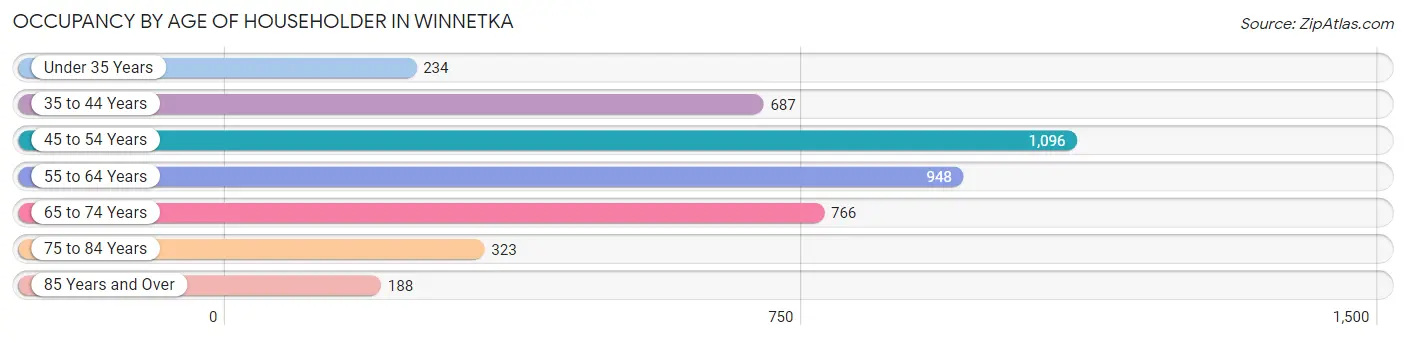
| Age Bracket | # Households | % Households |
| Under 35 Years | 234 | 5.5% |
| 35 to 44 Years | 687 | 16.2% |
| 45 to 54 Years | 1,096 | 25.8% |
| 55 to 64 Years | 948 | 22.4% |
| 65 to 74 Years | 766 | 18.1% |
| 75 to 84 Years | 323 | 7.6% |
| 85 Years and Over | 188 | 4.4% |
| Total | 4,242 | 100.0% |
Housing Finances in Winnetka
Median Income by Occupancy in Winnetka
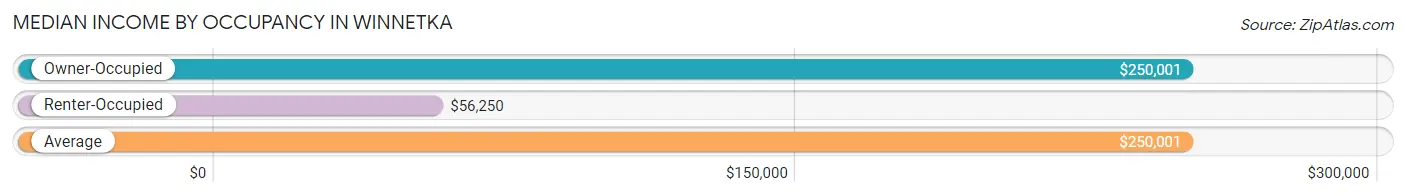
| Occupancy Type | # Households | Median Income |
| Owner-Occupied | 3,917 (92.3%) | $250,001 |
| Renter-Occupied | 325 (7.7%) | $56,250 |
| Average | 4,242 (100.0%) | $250,001 |
Occupancy by Householder Income Bracket in Winnetka
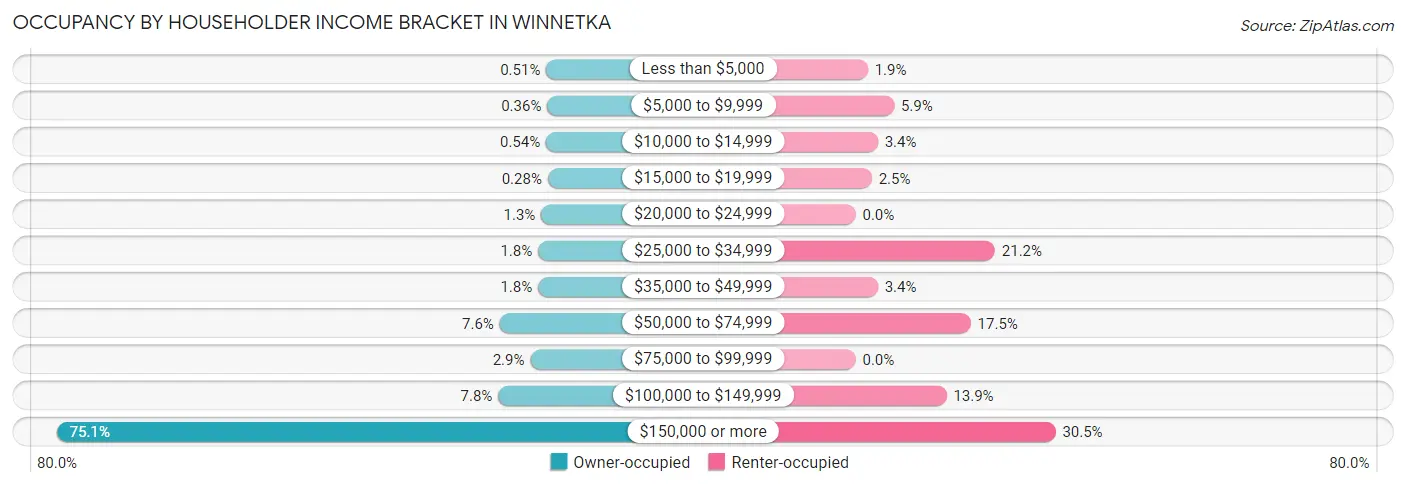
| Income Bracket | Owner-occupied | Renter-occupied |
| Less than $5,000 | 20 (0.5%) | 6 (1.8%) |
| $5,000 to $9,999 | 14 (0.4%) | 19 (5.9%) |
| $10,000 to $14,999 | 21 (0.5%) | 11 (3.4%) |
| $15,000 to $19,999 | 11 (0.3%) | 8 (2.5%) |
| $20,000 to $24,999 | 50 (1.3%) | 0 (0.0%) |
| $25,000 to $34,999 | 69 (1.8%) | 69 (21.2%) |
| $35,000 to $49,999 | 69 (1.8%) | 11 (3.4%) |
| $50,000 to $74,999 | 298 (7.6%) | 57 (17.5%) |
| $75,000 to $99,999 | 115 (2.9%) | 0 (0.0%) |
| $100,000 to $149,999 | 307 (7.8%) | 45 (13.9%) |
| $150,000 or more | 2,943 (75.1%) | 99 (30.5%) |
| Total | 3,917 (100.0%) | 325 (100.0%) |
Monthly Housing Cost Tiers in Winnetka
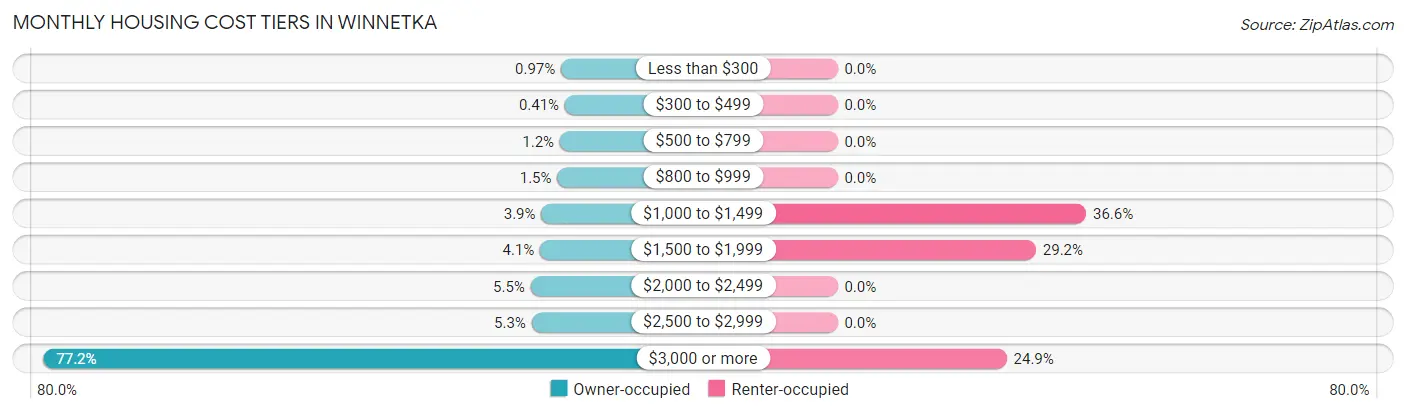
| Monthly Cost | Owner-occupied | Renter-occupied |
| Less than $300 | 38 (1.0%) | 0 (0.0%) |
| $300 to $499 | 16 (0.4%) | 0 (0.0%) |
| $500 to $799 | 45 (1.1%) | 0 (0.0%) |
| $800 to $999 | 60 (1.5%) | 0 (0.0%) |
| $1,000 to $1,499 | 152 (3.9%) | 119 (36.6%) |
| $1,500 to $1,999 | 159 (4.1%) | 95 (29.2%) |
| $2,000 to $2,499 | 214 (5.5%) | 0 (0.0%) |
| $2,500 to $2,999 | 208 (5.3%) | 0 (0.0%) |
| $3,000 or more | 3,025 (77.2%) | 81 (24.9%) |
| Total | 3,917 (100.0%) | 325 (100.0%) |
Physical Housing Characteristics in Winnetka
Housing Structures in Winnetka
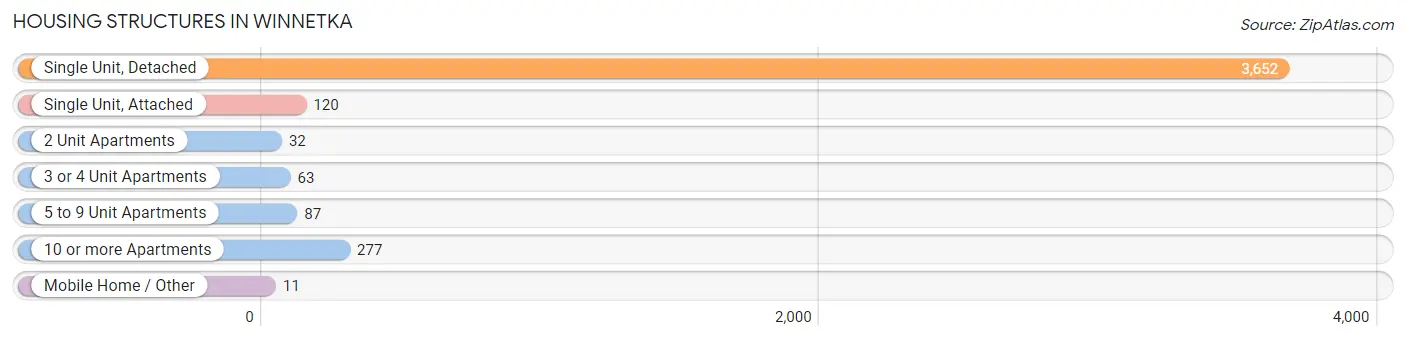
| Structure Type | # Housing Units | % Housing Units |
| Single Unit, Detached | 3,652 | 86.1% |
| Single Unit, Attached | 120 | 2.8% |
| 2 Unit Apartments | 32 | 0.7% |
| 3 or 4 Unit Apartments | 63 | 1.5% |
| 5 to 9 Unit Apartments | 87 | 2.1% |
| 10 or more Apartments | 277 | 6.5% |
| Mobile Home / Other | 11 | 0.3% |
| Total | 4,242 | 100.0% |
Housing Structures by Occupancy in Winnetka
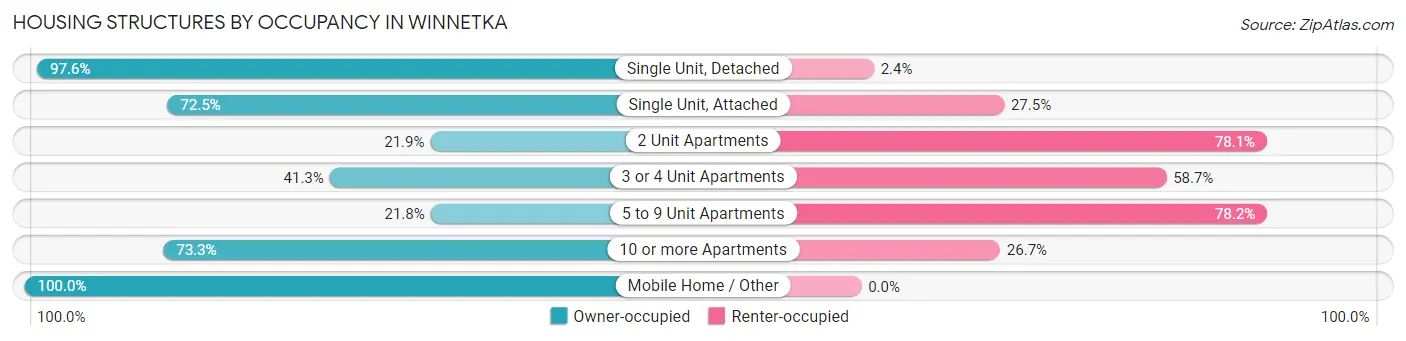
| Structure Type | Owner-occupied | Renter-occupied |
| Single Unit, Detached | 3,564 (97.6%) | 88 (2.4%) |
| Single Unit, Attached | 87 (72.5%) | 33 (27.5%) |
| 2 Unit Apartments | 7 (21.9%) | 25 (78.1%) |
| 3 or 4 Unit Apartments | 26 (41.3%) | 37 (58.7%) |
| 5 to 9 Unit Apartments | 19 (21.8%) | 68 (78.2%) |
| 10 or more Apartments | 203 (73.3%) | 74 (26.7%) |
| Mobile Home / Other | 11 (100.0%) | 0 (0.0%) |
| Total | 3,917 (92.3%) | 325 (7.7%) |
Housing Structures by Number of Rooms in Winnetka
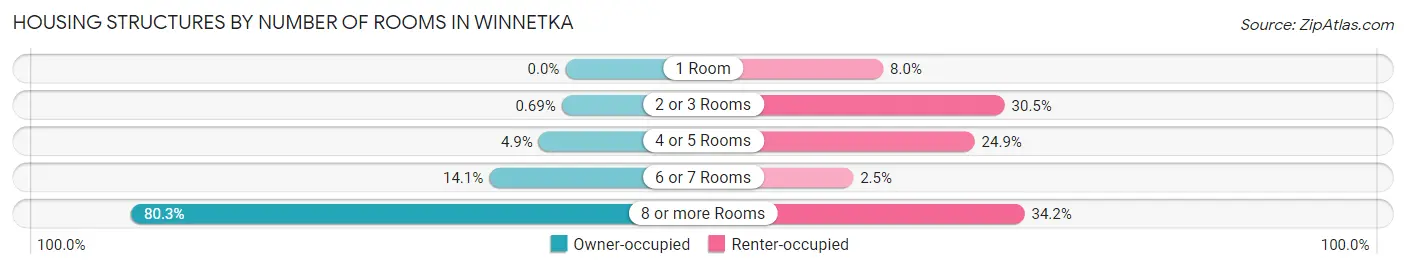
| Number of Rooms | Owner-occupied | Renter-occupied |
| 1 Room | 0 (0.0%) | 26 (8.0%) |
| 2 or 3 Rooms | 27 (0.7%) | 99 (30.5%) |
| 4 or 5 Rooms | 193 (4.9%) | 81 (24.9%) |
| 6 or 7 Rooms | 552 (14.1%) | 8 (2.5%) |
| 8 or more Rooms | 3,145 (80.3%) | 111 (34.2%) |
| Total | 3,917 (100.0%) | 325 (100.0%) |
Housing Structure by Heating Type in Winnetka
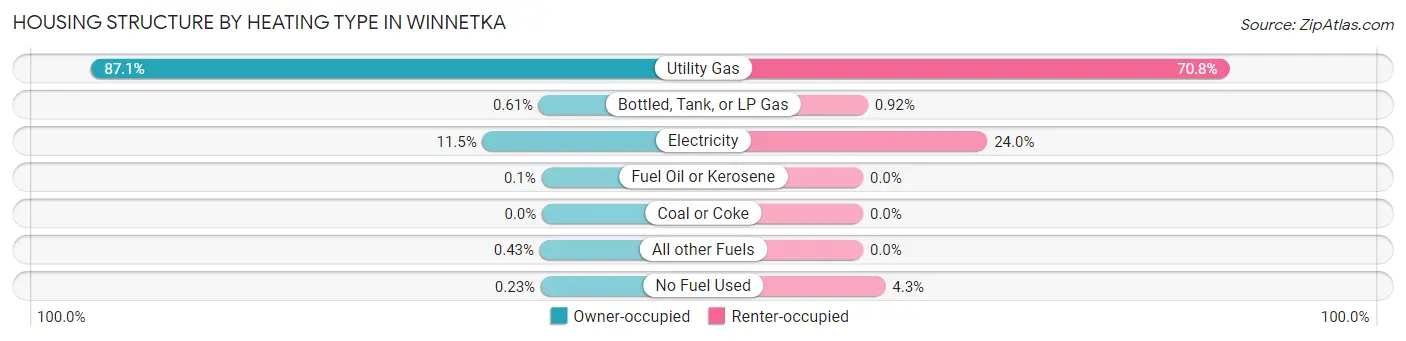
| Heating Type | Owner-occupied | Renter-occupied |
| Utility Gas | 3,412 (87.1%) | 230 (70.8%) |
| Bottled, Tank, or LP Gas | 24 (0.6%) | 3 (0.9%) |
| Electricity | 451 (11.5%) | 78 (24.0%) |
| Fuel Oil or Kerosene | 4 (0.1%) | 0 (0.0%) |
| Coal or Coke | 0 (0.0%) | 0 (0.0%) |
| All other Fuels | 17 (0.4%) | 0 (0.0%) |
| No Fuel Used | 9 (0.2%) | 14 (4.3%) |
| Total | 3,917 (100.0%) | 325 (100.0%) |
Household Vehicle Usage in Winnetka
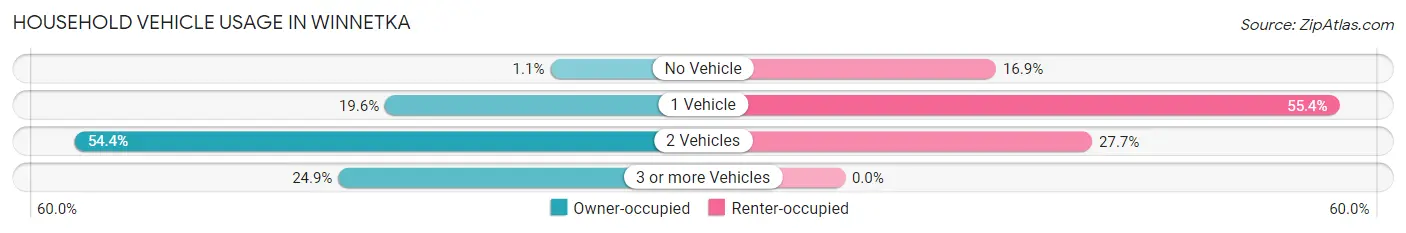
| Vehicles per Household | Owner-occupied | Renter-occupied |
| No Vehicle | 44 (1.1%) | 55 (16.9%) |
| 1 Vehicle | 769 (19.6%) | 180 (55.4%) |
| 2 Vehicles | 2,130 (54.4%) | 90 (27.7%) |
| 3 or more Vehicles | 974 (24.9%) | 0 (0.0%) |
| Total | 3,917 (100.0%) | 325 (100.0%) |
Real Estate & Mortgages in Winnetka
Real Estate and Mortgage Overview in Winnetka
| Characteristic | Without Mortgage | With Mortgage |
| Housing Units | 1,264 | 2,653 |
| Median Property Value | $1,148,400 | $1,208,400 |
| Median Household Income | $209,615 | $2,154 |
| Monthly Housing Costs | $1,501 | $2,425 |
| Real Estate Taxes | $10,001 | $14 |
Property Value by Mortgage Status in Winnetka
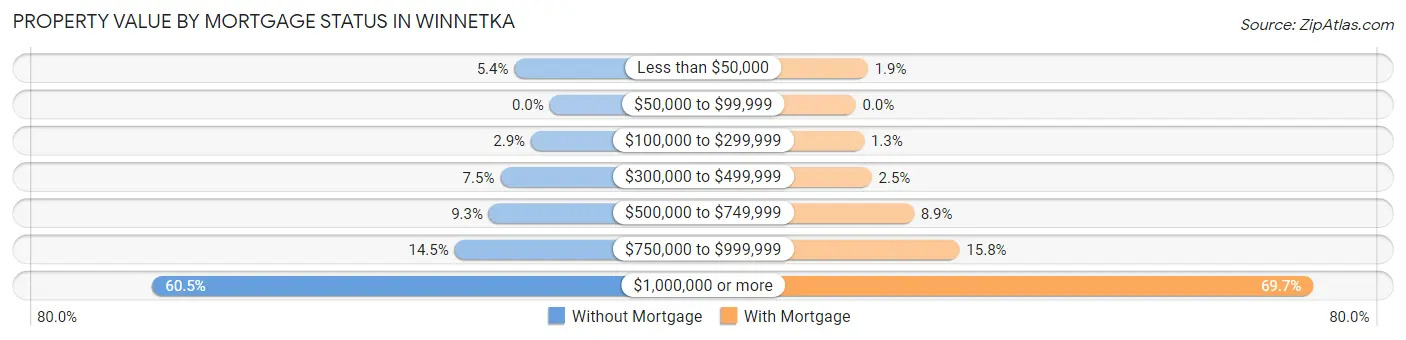
| Property Value | Without Mortgage | With Mortgage |
| Less than $50,000 | 68 (5.4%) | 49 (1.8%) |
| $50,000 to $99,999 | 0 (0.0%) | 0 (0.0%) |
| $100,000 to $299,999 | 36 (2.9%) | 34 (1.3%) |
| $300,000 to $499,999 | 95 (7.5%) | 65 (2.5%) |
| $500,000 to $749,999 | 117 (9.3%) | 235 (8.9%) |
| $750,000 to $999,999 | 183 (14.5%) | 420 (15.8%) |
| $1,000,000 or more | 765 (60.5%) | 1,850 (69.7%) |
| Total | 1,264 (100.0%) | 2,653 (100.0%) |
Household Income by Mortgage Status in Winnetka
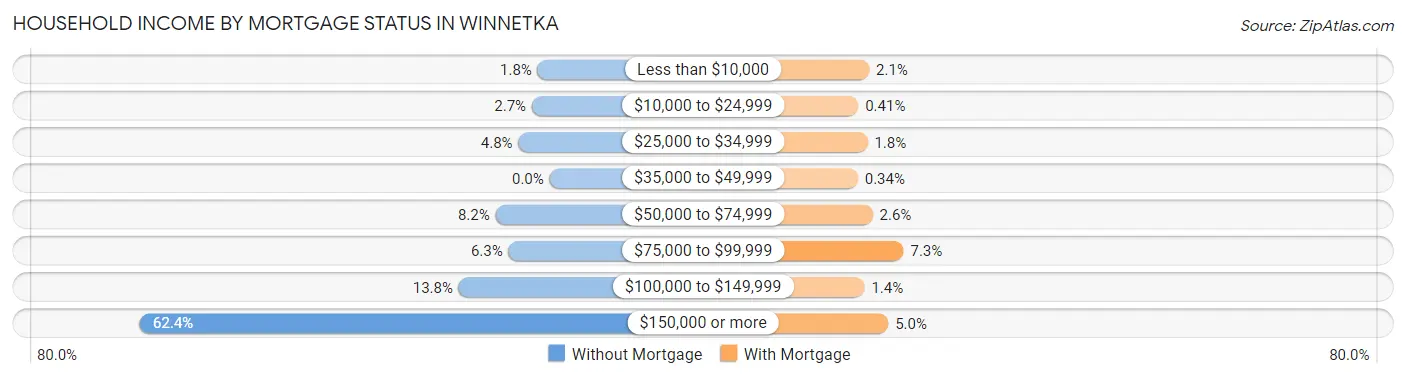
| Household Income | Without Mortgage | With Mortgage |
| Less than $10,000 | 23 (1.8%) | 55 (2.1%) |
| $10,000 to $24,999 | 34 (2.7%) | 11 (0.4%) |
| $25,000 to $34,999 | 60 (4.8%) | 48 (1.8%) |
| $35,000 to $49,999 | 0 (0.0%) | 9 (0.3%) |
| $50,000 to $74,999 | 104 (8.2%) | 69 (2.6%) |
| $75,000 to $99,999 | 79 (6.2%) | 194 (7.3%) |
| $100,000 to $149,999 | 175 (13.8%) | 36 (1.4%) |
| $150,000 or more | 789 (62.4%) | 132 (5.0%) |
| Total | 1,264 (100.0%) | 2,653 (100.0%) |
Property Value to Household Income Ratio in Winnetka
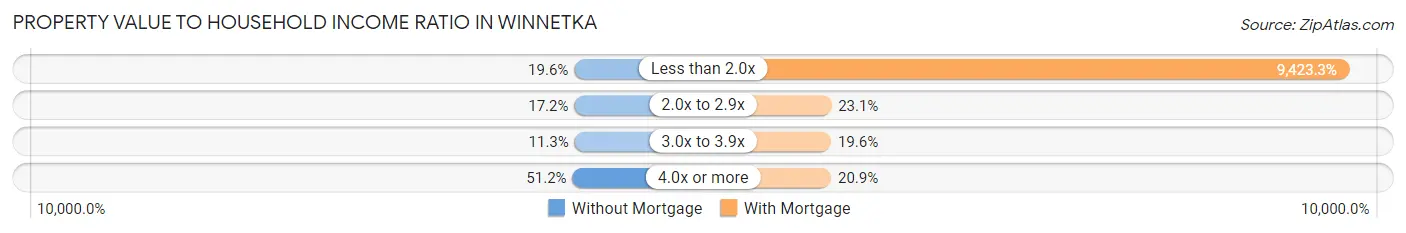
| Value-to-Income Ratio | Without Mortgage | With Mortgage |
| Less than 2.0x | 248 (19.6%) | 250,001 (9,423.3%) |
| 2.0x to 2.9x | 217 (17.2%) | 614 (23.1%) |
| 3.0x to 3.9x | 143 (11.3%) | 519 (19.6%) |
| 4.0x or more | 647 (51.2%) | 555 (20.9%) |
| Total | 1,264 (100.0%) | 2,653 (100.0%) |
Real Estate Taxes by Mortgage Status in Winnetka
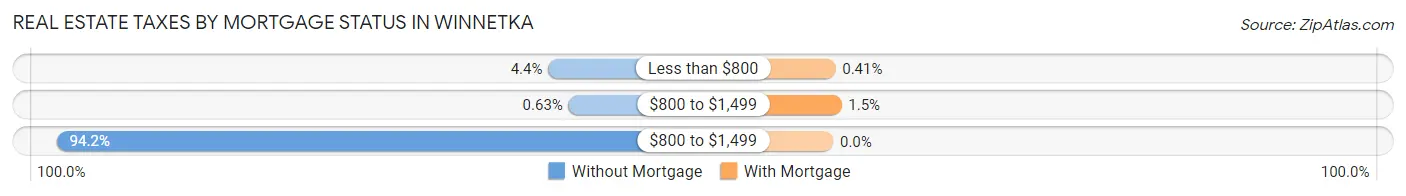
| Property Taxes | Without Mortgage | With Mortgage |
| Less than $800 | 55 (4.3%) | 11 (0.4%) |
| $800 to $1,499 | 8 (0.6%) | 40 (1.5%) |
| $800 to $1,499 | 1,190 (94.2%) | 0 (0.0%) |
| Total | 1,264 (100.0%) | 2,653 (100.0%) |
Health & Disability in Winnetka
Health Insurance Coverage by Age in Winnetka
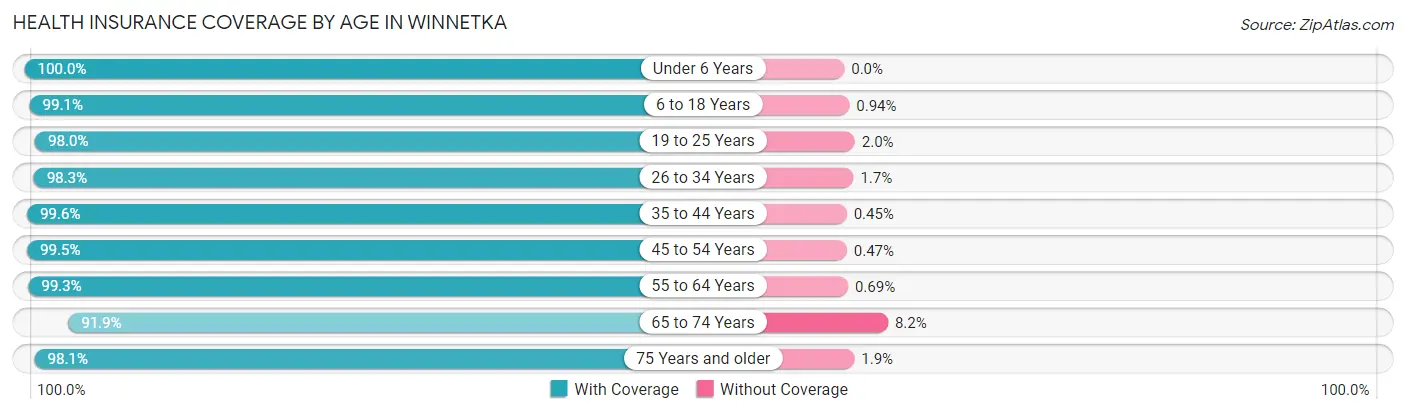
| Age Bracket | With Coverage | Without Coverage |
| Under 6 Years | 1,324 (100.0%) | 0 (0.0%) |
| 6 to 18 Years | 2,959 (99.1%) | 28 (0.9%) |
| 19 to 25 Years | 398 (98.0%) | 8 (2.0%) |
| 26 to 34 Years | 517 (98.3%) | 9 (1.7%) |
| 35 to 44 Years | 1,335 (99.6%) | 6 (0.4%) |
| 45 to 54 Years | 2,117 (99.5%) | 10 (0.5%) |
| 55 to 64 Years | 1,588 (99.3%) | 11 (0.7%) |
| 65 to 74 Years | 1,274 (91.8%) | 113 (8.2%) |
| 75 Years and older | 893 (98.1%) | 17 (1.9%) |
| Total | 12,405 (98.4%) | 202 (1.6%) |
Health Insurance Coverage by Citizenship Status in Winnetka
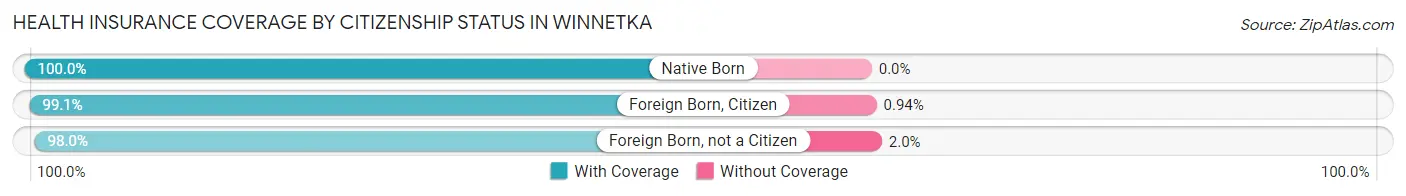
| Citizenship Status | With Coverage | Without Coverage |
| Native Born | 1,324 (100.0%) | 0 (0.0%) |
| Foreign Born, Citizen | 2,959 (99.1%) | 28 (0.9%) |
| Foreign Born, not a Citizen | 398 (98.0%) | 8 (2.0%) |
Health Insurance Coverage by Household Income in Winnetka
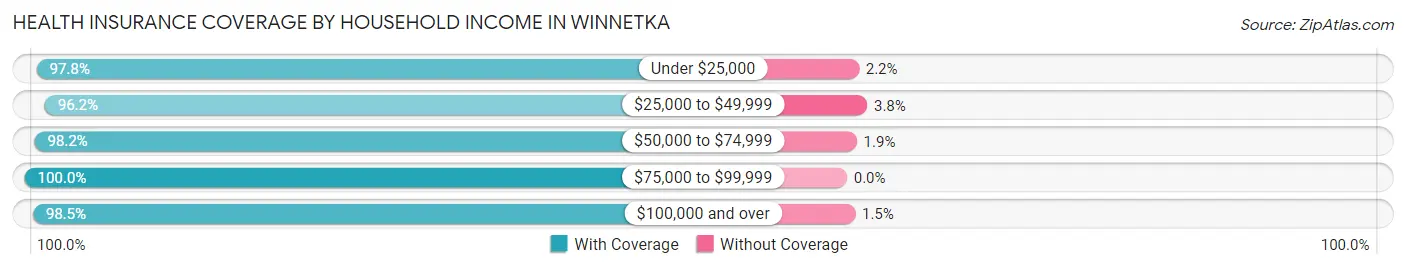
| Household Income | With Coverage | Without Coverage |
| Under $25,000 | 349 (97.8%) | 8 (2.2%) |
| $25,000 to $49,999 | 279 (96.2%) | 11 (3.8%) |
| $50,000 to $74,999 | 904 (98.2%) | 17 (1.8%) |
| $75,000 to $99,999 | 219 (100.0%) | 0 (0.0%) |
| $100,000 and over | 10,646 (98.5%) | 166 (1.5%) |
Public vs Private Health Insurance Coverage by Age in Winnetka
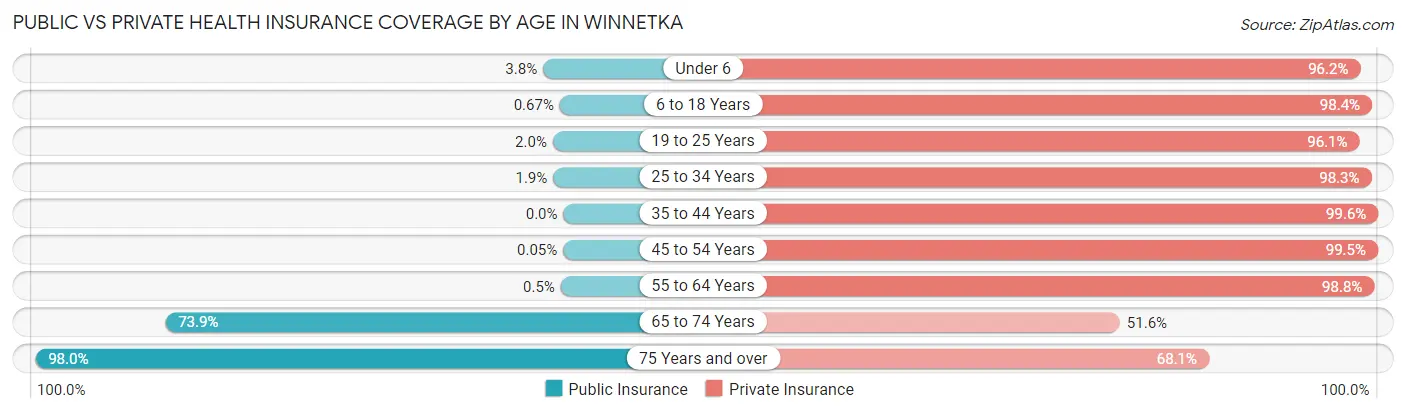
| Age Bracket | Public Insurance | Private Insurance |
| Under 6 | 50 (3.8%) | 1,274 (96.2%) |
| 6 to 18 Years | 20 (0.7%) | 2,939 (98.4%) |
| 19 to 25 Years | 8 (2.0%) | 390 (96.1%) |
| 25 to 34 Years | 10 (1.9%) | 517 (98.3%) |
| 35 to 44 Years | 0 (0.0%) | 1,335 (99.6%) |
| 45 to 54 Years | 1 (0.1%) | 2,116 (99.5%) |
| 55 to 64 Years | 8 (0.5%) | 1,580 (98.8%) |
| 65 to 74 Years | 1,025 (73.9%) | 716 (51.6%) |
| 75 Years and over | 892 (98.0%) | 620 (68.1%) |
| Total | 2,014 (16.0%) | 11,487 (91.1%) |
Disability Status by Sex by Age in Winnetka
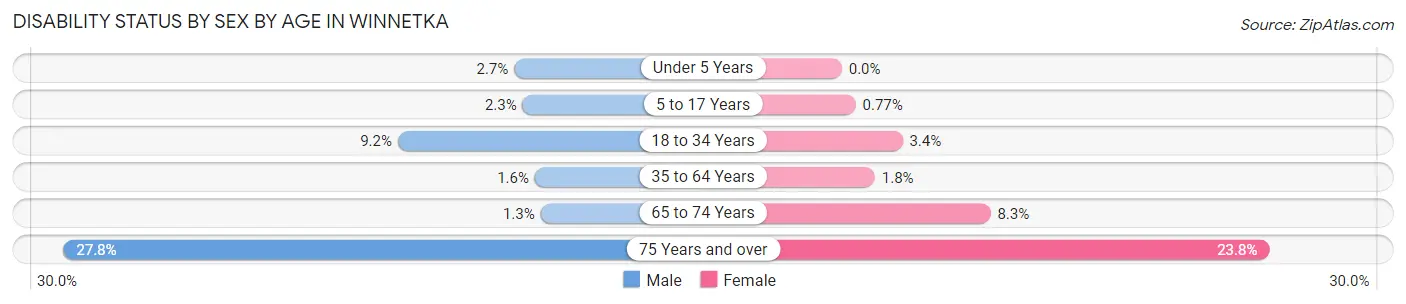
| Age Bracket | Male | Female |
| Under 5 Years | 16 (2.7%) | 0 (0.0%) |
| 5 to 17 Years | 37 (2.3%) | 11 (0.8%) |
| 18 to 34 Years | 44 (9.2%) | 20 (3.4%) |
| 35 to 64 Years | 40 (1.6%) | 47 (1.8%) |
| 65 to 74 Years | 9 (1.3%) | 56 (8.3%) |
| 75 Years and over | 120 (27.8%) | 114 (23.8%) |
Disability Class by Sex by Age in Winnetka
Disability Class: Hearing Difficulty
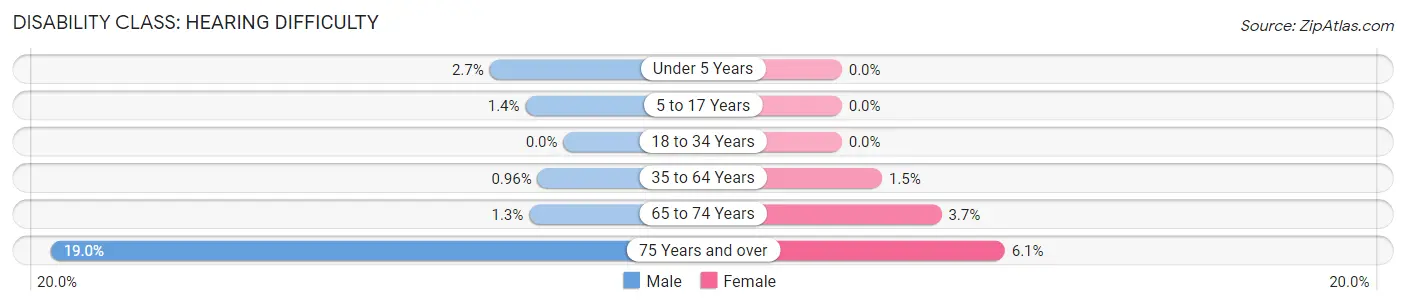
| Age Bracket | Male | Female |
| Under 5 Years | 16 (2.7%) | 0 (0.0%) |
| 5 to 17 Years | 23 (1.4%) | 0 (0.0%) |
| 18 to 34 Years | 0 (0.0%) | 0 (0.0%) |
| 35 to 64 Years | 24 (1.0%) | 38 (1.5%) |
| 65 to 74 Years | 9 (1.3%) | 25 (3.7%) |
| 75 Years and over | 82 (19.0%) | 29 (6.0%) |
Disability Class: Vision Difficulty
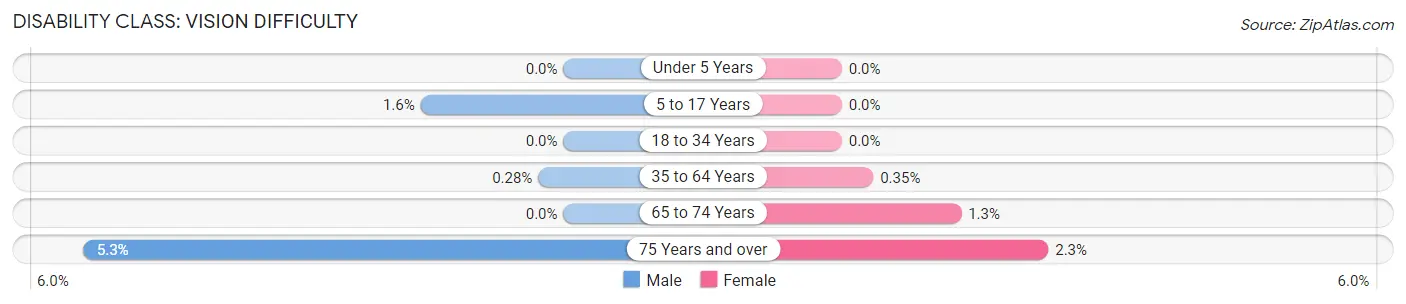
| Age Bracket | Male | Female |
| Under 5 Years | 0 (0.0%) | 0 (0.0%) |
| 5 to 17 Years | 26 (1.6%) | 0 (0.0%) |
| 18 to 34 Years | 0 (0.0%) | 0 (0.0%) |
| 35 to 64 Years | 7 (0.3%) | 9 (0.4%) |
| 65 to 74 Years | 0 (0.0%) | 9 (1.3%) |
| 75 Years and over | 23 (5.3%) | 11 (2.3%) |
Disability Class: Cognitive Difficulty
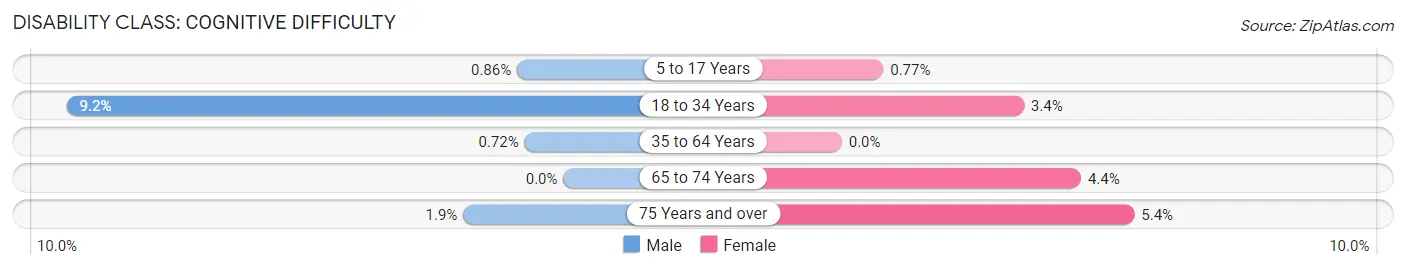
| Age Bracket | Male | Female |
| 5 to 17 Years | 14 (0.9%) | 11 (0.8%) |
| 18 to 34 Years | 44 (9.2%) | 20 (3.4%) |
| 35 to 64 Years | 18 (0.7%) | 0 (0.0%) |
| 65 to 74 Years | 0 (0.0%) | 30 (4.4%) |
| 75 Years and over | 8 (1.9%) | 26 (5.4%) |
Disability Class: Ambulatory Difficulty
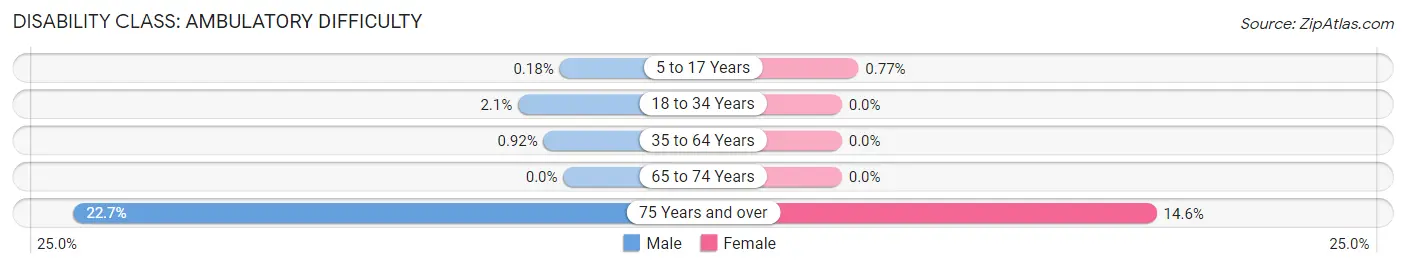
| Age Bracket | Male | Female |
| 5 to 17 Years | 3 (0.2%) | 11 (0.8%) |
| 18 to 34 Years | 10 (2.1%) | 0 (0.0%) |
| 35 to 64 Years | 23 (0.9%) | 0 (0.0%) |
| 65 to 74 Years | 0 (0.0%) | 0 (0.0%) |
| 75 Years and over | 98 (22.7%) | 70 (14.6%) |
Disability Class: Self-Care Difficulty
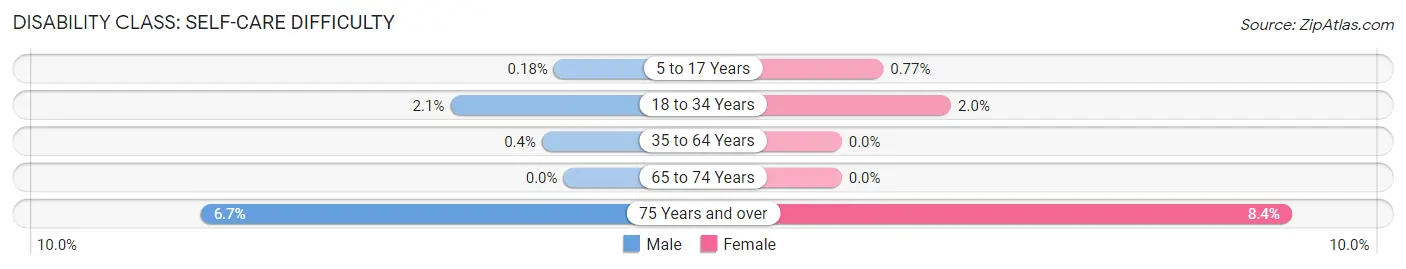
| Age Bracket | Male | Female |
| 5 to 17 Years | 3 (0.2%) | 11 (0.8%) |
| 18 to 34 Years | 10 (2.1%) | 12 (2.0%) |
| 35 to 64 Years | 10 (0.4%) | 0 (0.0%) |
| 65 to 74 Years | 0 (0.0%) | 0 (0.0%) |
| 75 Years and over | 29 (6.7%) | 40 (8.4%) |
Technology Access in Winnetka
Computing Device Access in Winnetka
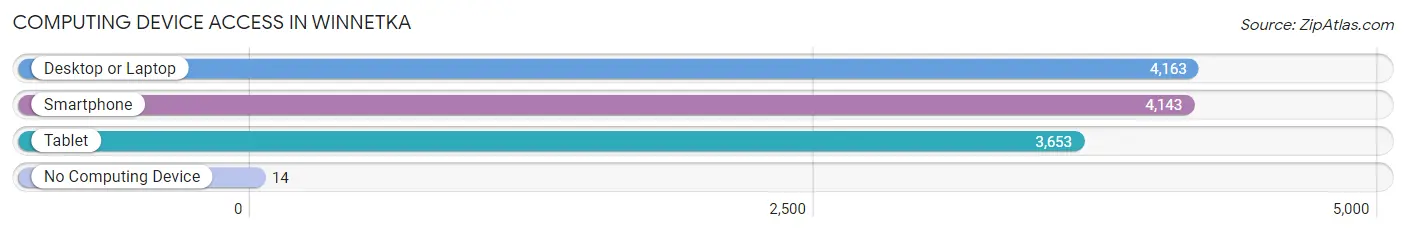
| Device Type | # Households | % Households |
| Desktop or Laptop | 4,163 | 98.1% |
| Smartphone | 4,143 | 97.7% |
| Tablet | 3,653 | 86.1% |
| No Computing Device | 14 | 0.3% |
| Total | 4,242 | 100.0% |
Internet Access in Winnetka
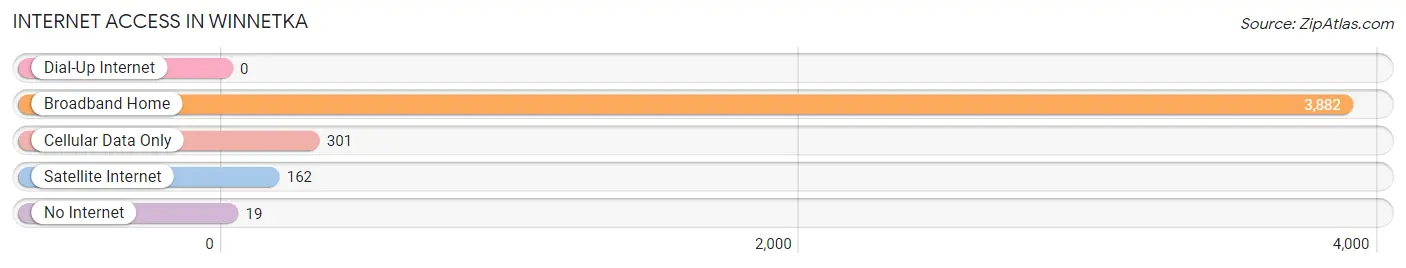
| Internet Type | # Households | % Households |
| Dial-Up Internet | 0 | 0.0% |
| Broadband Home | 3,882 | 91.5% |
| Cellular Data Only | 301 | 7.1% |
| Satellite Internet | 162 | 3.8% |
| No Internet | 19 | 0.4% |
| Total | 4,242 | 100.0% |
Winnetka Summary
Winnetka is a village located in Cook County, Illinois, United States. It is a suburb of Chicago, located on the North Shore of Lake Michigan. As of the 2010 census, the village had a population of 12,187.
History
The area now known as Winnetka was first settled in 1836 by a group of Potawatomi Indians. The first non-native settlers arrived in the area in 1854. The village was officially incorporated in 1869.
The village was named after a Potawatomi chief, Winnetka, who lived in the area. The name is derived from the Potawatomi word for “beautiful”.
Geography
Winnetka is located in northeastern Illinois, about 25 miles north of downtown Chicago. It is bordered by the city of Evanston to the east, Wilmette to the north, and Glencoe to the south. The village is situated on the western shore of Lake Michigan.
The village covers an area of 4.2 square miles, of which 0.2 square miles is water. The terrain is generally flat, with some rolling hills.
Economy
Winnetka is a wealthy suburb of Chicago, with a median household income of $180,000. The village is home to many corporate headquarters, including the headquarters of the Quaker Oats Company.
The village is also home to several large retail stores, including the Winnetka Shopping Center, which is the largest shopping center in the area.
Demographics
As of the 2010 census, there were 12,187 people, 4,845 households, and 3,541 families residing in the village. The population density was 2,902.3 people per square mile. The racial makeup of the village was 94.2% White, 0.7% African American, 0.1% Native American, 3.3% Asian, 0.1% Pacific Islander, 0.5% from other races, and 1.2% from two or more races. Hispanic or Latino of any race were 2.7% of the population.
The median age in the village was 44.2 years. About 24.2% of residents were under the age of 18, and 8.2% were 65 years of age or older. The gender makeup of the village was 48.2% male and 51.8% female.
Conclusion
Winnetka is a wealthy suburb of Chicago located on the North Shore of Lake Michigan. It has a population of 12,187 and a median household income of $180,000. The village is home to many corporate headquarters and large retail stores. The population is predominantly white, with a small percentage of African American, Native American, Asian, and Pacific Islander residents.
Common Questions
What is Per Capita Income in Winnetka?
Per Capita income in Winnetka is $154,576.
What is the Median Family Income in Winnetka?
Median Family Income in Winnetka is $250,001.
What is the Median Household income in Winnetka?
Median Household Income in Winnetka is $250,001.
What is Income or Wage Gap in Winnetka?
Income or Wage Gap in Winnetka is 73.4%.
Women in Winnetka earn 26.6 cents for every dollar earned by a man.
What is Inequality or Gini Index in Winnetka?
Inequality or Gini Index in Winnetka is 0.50.
What is the Total Population of Winnetka?
Total Population of Winnetka is 12,607.
What is the Total Male Population of Winnetka?
Total Male Population of Winnetka is 6,346.
What is the Total Female Population of Winnetka?
Total Female Population of Winnetka is 6,261.
What is the Ratio of Males per 100 Females in Winnetka?
There are 101.36 Males per 100 Females in Winnetka.
What is the Ratio of Females per 100 Males in Winnetka?
There are 98.66 Females per 100 Males in Winnetka.
What is the Median Population Age in Winnetka?
Median Population Age in Winnetka is 42.8 Years.
What is the Average Family Size in Winnetka
Average Family Size in Winnetka is 3.3 People.
What is the Average Household Size in Winnetka
Average Household Size in Winnetka is 3.0 People.
How Large is the Labor Force in Winnetka?
There are 5,193 People in the Labor Forcein in Winnetka.
What is the Percentage of People in the Labor Force in Winnetka?
58.1% of People are in the Labor Force in Winnetka.
What is the Unemployment Rate in Winnetka?
Unemployment Rate in Winnetka is 3.7%.