Leland Grove, IL Map & Demographics
Leland Grove Map
Leland Grove Overview
$93,174
PER CAPITA INCOME
$165,000
AVG FAMILY INCOME
$127,500
AVG HOUSEHOLD INCOME
25.5%
WAGE / INCOME GAP [ % ]
74.5¢/ $1
WAGE / INCOME GAP [ $ ]
0.52
INEQUALITY / GINI INDEX
1,478
TOTAL POPULATION
649
MALE POPULATION
829
FEMALE POPULATION
78.29
MALES / 100 FEMALES
127.73
FEMALES / 100 MALES
50.9
MEDIAN AGE
2.7
AVG FAMILY SIZE
2.1
AVG HOUSEHOLD SIZE
705
LABOR FORCE [ PEOPLE ]
55.8%
PERCENT IN LABOR FORCE
2.3%
UNEMPLOYMENT RATE
Leland Grove Area Codes
Income in Leland Grove
Income Overview in Leland Grove
Per Capita Income in Leland Grove is $93,174, while median incomes of families and households are $165,000 and $127,500 respectively.
| Characteristic | Number | Measure |
| Per Capita Income | 1,478 | $93,174 |
| Median Family Income | 428 | $165,000 |
| Mean Family Income | 428 | $266,744 |
| Median Household Income | 688 | $127,500 |
| Mean Household Income | 688 | $200,794 |
| Income Deficit | 428 | $0 |
| Wage / Income Gap (%) | 1,478 | 25.55% |
| Wage / Income Gap ($) | 1,478 | 74.45¢ per $1 |
| Gini / Inequality Index | 1,478 | 0.52 |
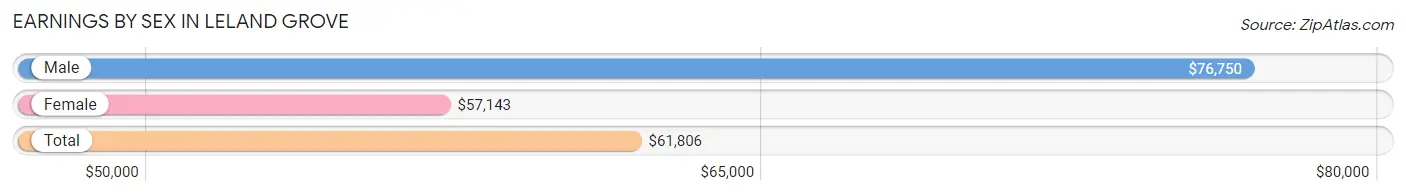
Earnings by Sex in Leland Grove
Average Earnings in Leland Grove are $61,806, $76,750 for men and $57,143 for women, a difference of 25.6%.
| Sex | Number | Average Earnings |
| Male | 387 (48.7%) | $76,750 |
| Female | 408 (51.3%) | $57,143 |
| Total | 795 (100.0%) | $61,806 |
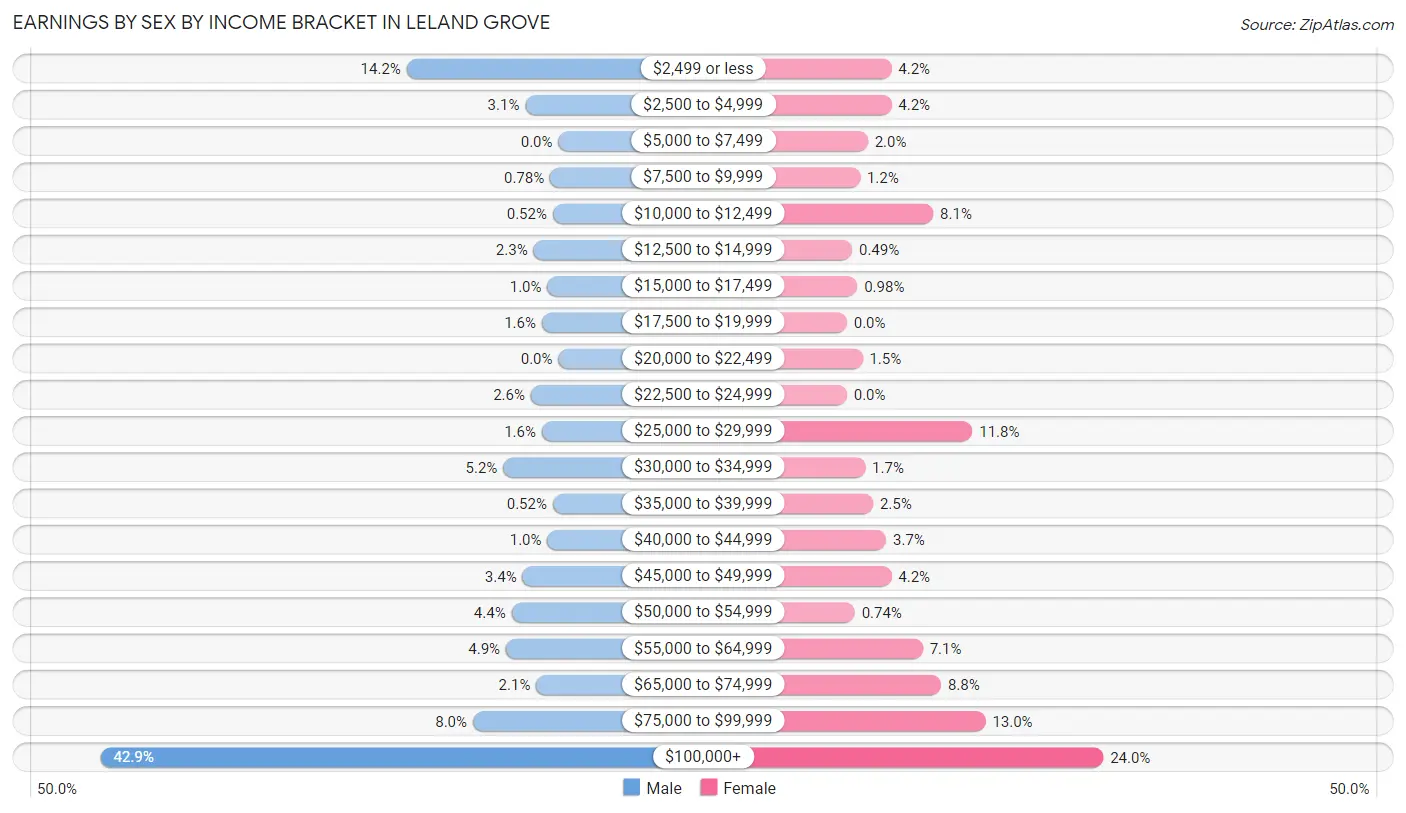
Earnings by Sex by Income Bracket in Leland Grove
The most common earnings brackets in Leland Grove are $100,000+ for men (166 | 42.9%) and $100,000+ for women (98 | 24.0%).
| Income | Male | Female |
| $2,499 or less | 55 (14.2%) | 17 (4.2%) |
| $2,500 to $4,999 | 12 (3.1%) | 17 (4.2%) |
| $5,000 to $7,499 | 0 (0.0%) | 8 (2.0%) |
| $7,500 to $9,999 | 3 (0.8%) | 5 (1.2%) |
| $10,000 to $12,499 | 2 (0.5%) | 33 (8.1%) |
| $12,500 to $14,999 | 9 (2.3%) | 2 (0.5%) |
| $15,000 to $17,499 | 4 (1.0%) | 4 (1.0%) |
| $17,500 to $19,999 | 6 (1.5%) | 0 (0.0%) |
| $20,000 to $22,499 | 0 (0.0%) | 6 (1.5%) |
| $22,500 to $24,999 | 10 (2.6%) | 0 (0.0%) |
| $25,000 to $29,999 | 6 (1.5%) | 48 (11.8%) |
| $30,000 to $34,999 | 20 (5.2%) | 7 (1.7%) |
| $35,000 to $39,999 | 2 (0.5%) | 10 (2.5%) |
| $40,000 to $44,999 | 4 (1.0%) | 15 (3.7%) |
| $45,000 to $49,999 | 13 (3.4%) | 17 (4.2%) |
| $50,000 to $54,999 | 17 (4.4%) | 3 (0.7%) |
| $55,000 to $64,999 | 19 (4.9%) | 29 (7.1%) |
| $65,000 to $74,999 | 8 (2.1%) | 36 (8.8%) |
| $75,000 to $99,999 | 31 (8.0%) | 53 (13.0%) |
| $100,000+ | 166 (42.9%) | 98 (24.0%) |
| Total | 387 (100.0%) | 408 (100.0%) |
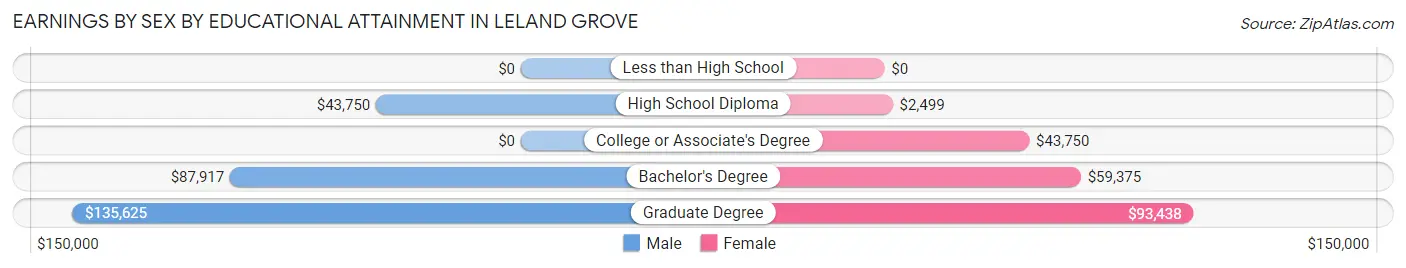
Earnings by Sex by Educational Attainment in Leland Grove
Average earnings in Leland Grove are $86,375 for men and $67,321 for women, a difference of 22.1%. Men with an educational attainment of graduate degree enjoy the highest average annual earnings of $135,625, while those with high school diploma education earn the least with $43,750. Women with an educational attainment of graduate degree earn the most with the average annual earnings of $93,438, while those with high school diploma education have the smallest earnings of $2,499.
| Educational Attainment | Male Income | Female Income |
| Less than High School | - | - |
| High School Diploma | $43,750 | $2,499 |
| College or Associate's Degree | - | - |
| Bachelor's Degree | $87,917 | $59,375 |
| Graduate Degree | $135,625 | $93,438 |
| Total | $86,375 | $67,321 |
Family Income in Leland Grove
Family Income Brackets in Leland Grove
According to the Leland Grove family income data, there are 165 families falling into the $200,000+ income range, which is the most common income bracket and makes up 38.6% of all families.
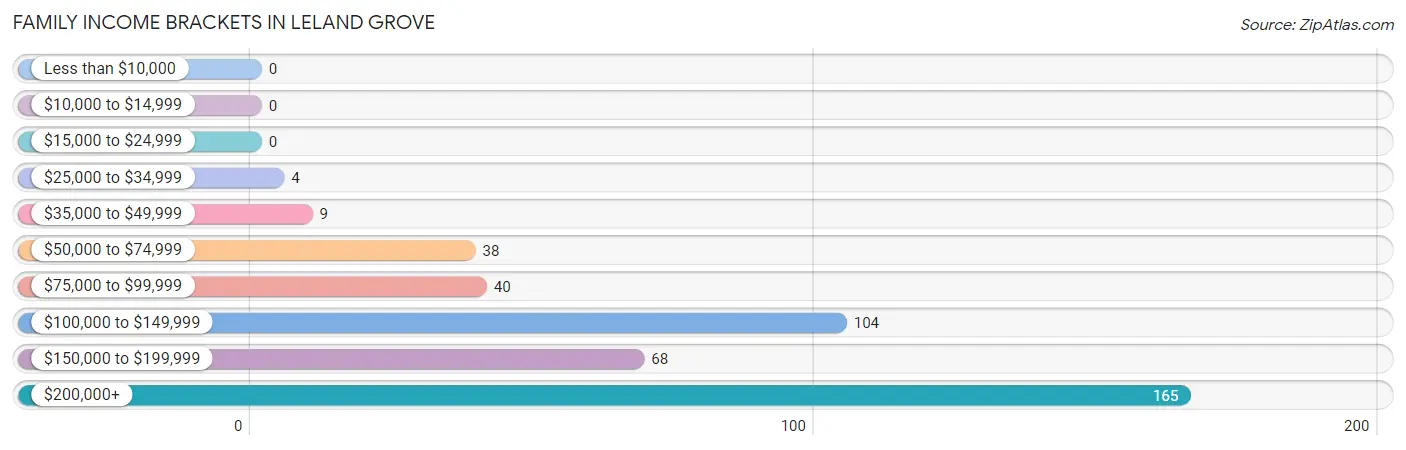
| Income Bracket | # Families | % Families |
| Less than $10,000 | 0 | 0.0% |
| $10,000 to $14,999 | 0 | 0.0% |
| $15,000 to $24,999 | 0 | 0.0% |
| $25,000 to $34,999 | 4 | 0.9% |
| $35,000 to $49,999 | 9 | 2.1% |
| $50,000 to $74,999 | 38 | 8.9% |
| $75,000 to $99,999 | 40 | 9.3% |
| $100,000 to $149,999 | 104 | 24.3% |
| $150,000 to $199,999 | 68 | 15.9% |
| $200,000+ | 165 | 38.6% |
Family Income by Famaliy Size in Leland Grove
5-person families (27 | 6.3%) account for the highest median family income in Leland Grove with $250,001 per family, while 2-person families (271 | 63.3%) have the highest median income of $77,292 per family member.
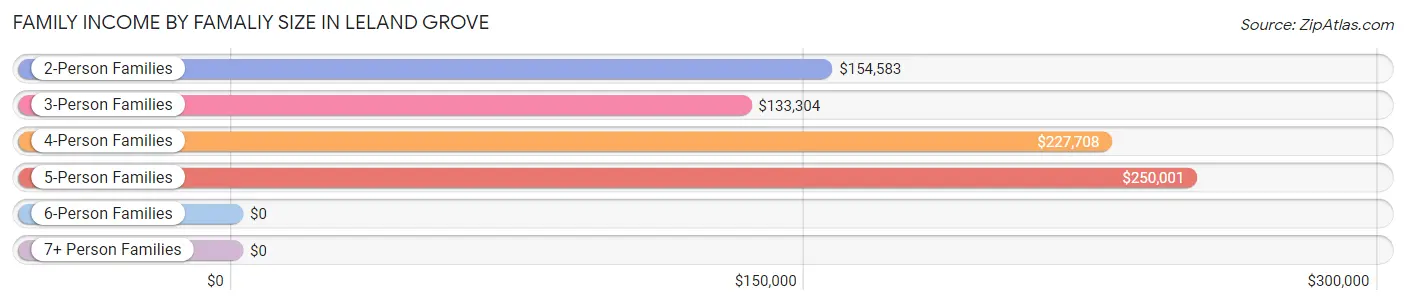
| Income Bracket | # Families | Median Income |
| 2-Person Families | 271 (63.3%) | $154,583 |
| 3-Person Families | 79 (18.5%) | $133,304 |
| 4-Person Families | 47 (11.0%) | $227,708 |
| 5-Person Families | 27 (6.3%) | $250,001 |
| 6-Person Families | 4 (0.9%) | $0 |
| 7+ Person Families | 0 (0.0%) | $0 |
| Total | 428 (100.0%) | $165,000 |
Family Income by Number of Earners in Leland Grove
The median family income in Leland Grove is $165,000, with families comprising 3+ earners (40) having the highest median family income of $250,001, while families with no earners (73) have the lowest median family income of $127,708, accounting for 9.3% and 17.1% of families, respectively.
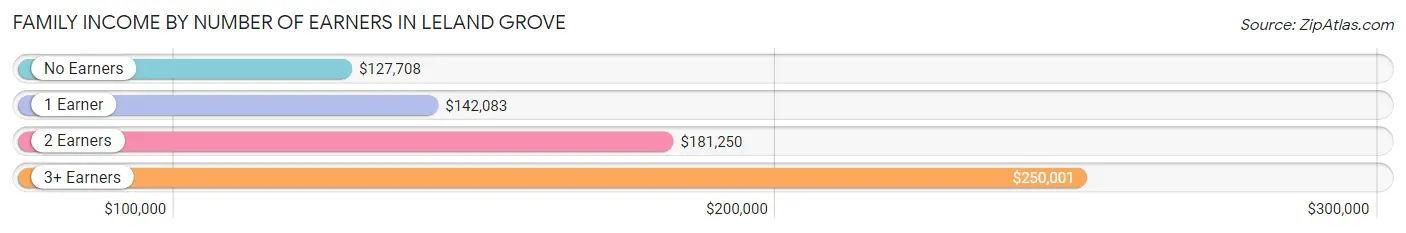
| Number of Earners | # Families | Median Income |
| No Earners | 73 (17.1%) | $127,708 |
| 1 Earner | 125 (29.2%) | $142,083 |
| 2 Earners | 190 (44.4%) | $181,250 |
| 3+ Earners | 40 (9.3%) | $250,001 |
| Total | 428 (100.0%) | $165,000 |
Household Income in Leland Grove
Household Income Brackets in Leland Grove
With 187 households falling in the category, the $200,000+ income range is the most frequent in Leland Grove, accounting for 27.2% of all households. In contrast, only 7 households (1.0%) fall into the $10,000 to $14,999 income bracket, making it the least populous group.
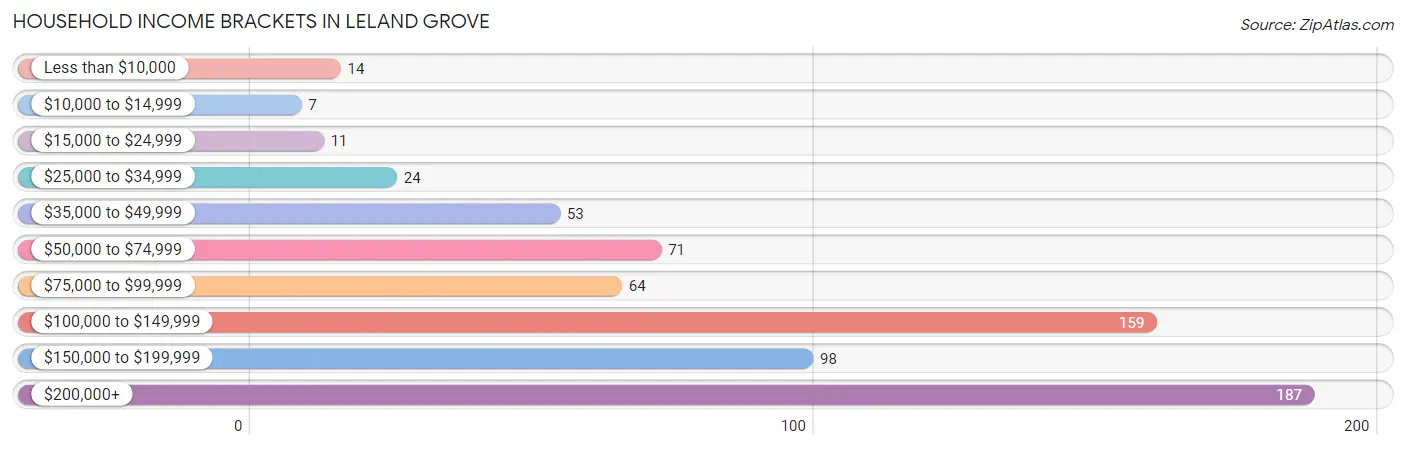
| Income Bracket | # Households | % Households |
| Less than $10,000 | 14 | 2.0% |
| $10,000 to $14,999 | 7 | 1.0% |
| $15,000 to $24,999 | 11 | 1.6% |
| $25,000 to $34,999 | 24 | 3.5% |
| $35,000 to $49,999 | 53 | 7.7% |
| $50,000 to $74,999 | 71 | 10.3% |
| $75,000 to $99,999 | 64 | 9.3% |
| $100,000 to $149,999 | 159 | 23.1% |
| $150,000 to $199,999 | 98 | 14.2% |
| $200,000+ | 187 | 27.2% |
Household Income by Householder Age in Leland Grove
The median household income in Leland Grove is $127,500, with the highest median household income of $165,625 found in the 45 to 64 years age bracket for the primary householder. A total of 267 households (38.8%) fall into this category.
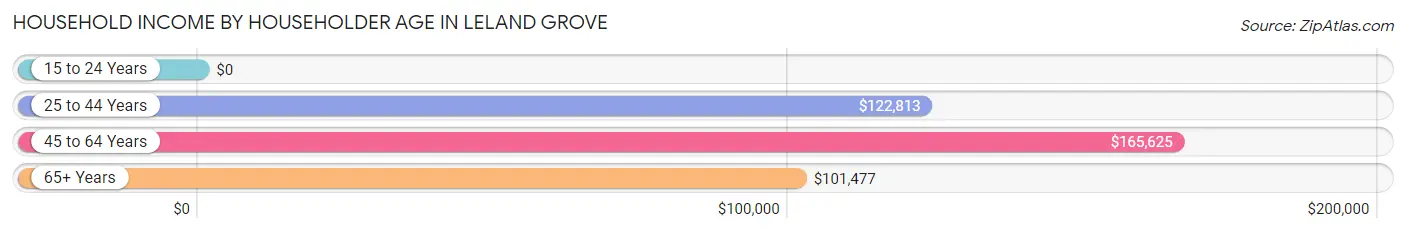
| Income Bracket | # Households | Median Income |
| 15 to 24 Years | 0 (0.0%) | $0 |
| 25 to 44 Years | 122 (17.7%) | $122,813 |
| 45 to 64 Years | 267 (38.8%) | $165,625 |
| 65+ Years | 299 (43.5%) | $101,477 |
| Total | 688 (100.0%) | $127,500 |
Poverty in Leland Grove
Income Below Poverty by Sex and Age in Leland Grove
With 2.2% poverty level for males and 2.2% for females among the residents of Leland Grove, 45 to 54 year old males and 25 to 34 year old females are the most vulnerable to poverty, with 7 males (6.5%) and 4 females (6.5%) in their respective age groups living below the poverty level.
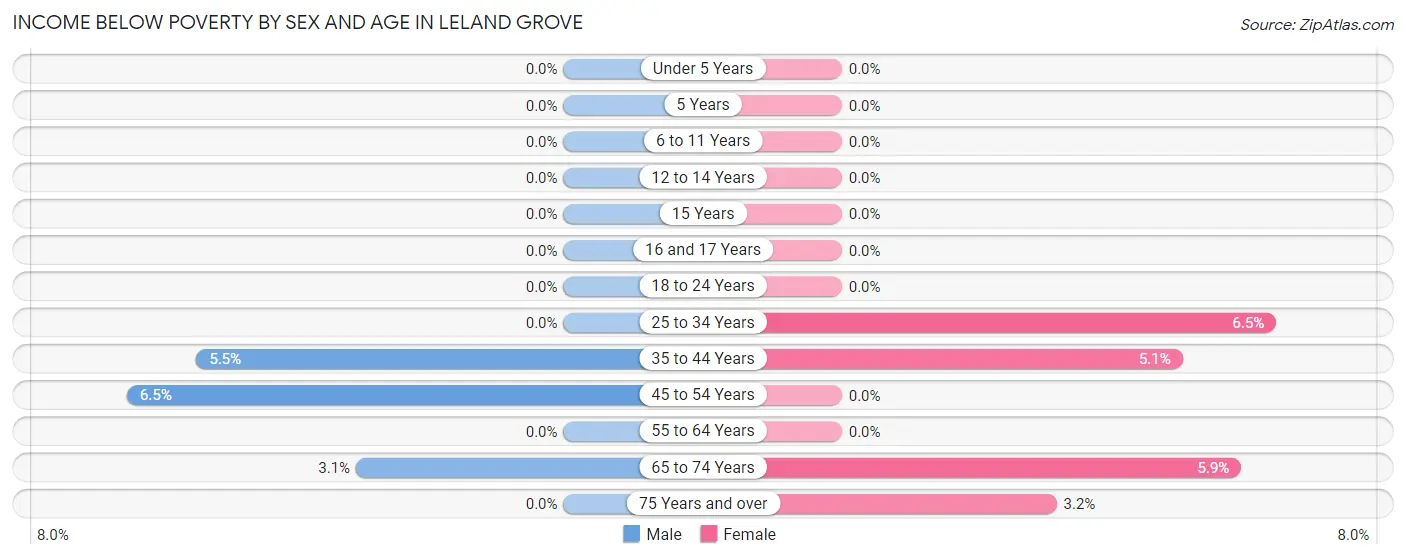
| Age Bracket | Male | Female |
| Under 5 Years | 0 (0.0%) | 0 (0.0%) |
| 5 Years | 0 (0.0%) | 0 (0.0%) |
| 6 to 11 Years | 0 (0.0%) | 0 (0.0%) |
| 12 to 14 Years | 0 (0.0%) | 0 (0.0%) |
| 15 Years | 0 (0.0%) | 0 (0.0%) |
| 16 and 17 Years | 0 (0.0%) | 0 (0.0%) |
| 18 to 24 Years | 0 (0.0%) | 0 (0.0%) |
| 25 to 34 Years | 0 (0.0%) | 4 (6.5%) |
| 35 to 44 Years | 3 (5.4%) | 4 (5.1%) |
| 45 to 54 Years | 7 (6.5%) | 0 (0.0%) |
| 55 to 64 Years | 0 (0.0%) | 0 (0.0%) |
| 65 to 74 Years | 4 (3.1%) | 7 (5.9%) |
| 75 Years and over | 0 (0.0%) | 3 (3.2%) |
| Total | 14 (2.2%) | 18 (2.2%) |
Income Above Poverty by Sex and Age in Leland Grove
According to the poverty statistics in Leland Grove, males aged under 5 years and females aged under 5 years are the age groups that are most secure financially, with 100.0% of males and 100.0% of females in these age groups living above the poverty line.
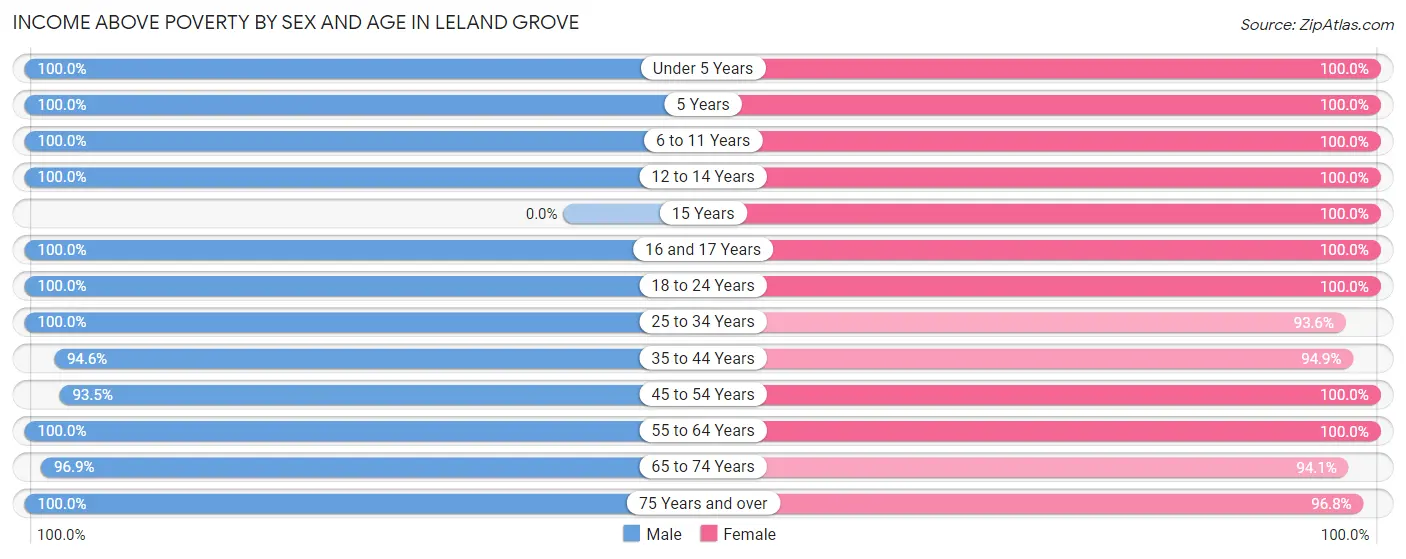
| Age Bracket | Male | Female |
| Under 5 Years | 22 (100.0%) | 41 (100.0%) |
| 5 Years | 6 (100.0%) | 8 (100.0%) |
| 6 to 11 Years | 48 (100.0%) | 41 (100.0%) |
| 12 to 14 Years | 9 (100.0%) | 24 (100.0%) |
| 15 Years | 0 (0.0%) | 9 (100.0%) |
| 16 and 17 Years | 15 (100.0%) | 31 (100.0%) |
| 18 to 24 Years | 17 (100.0%) | 38 (100.0%) |
| 25 to 34 Years | 31 (100.0%) | 58 (93.5%) |
| 35 to 44 Years | 52 (94.6%) | 75 (94.9%) |
| 45 to 54 Years | 101 (93.5%) | 166 (100.0%) |
| 55 to 64 Years | 103 (100.0%) | 118 (100.0%) |
| 65 to 74 Years | 126 (96.9%) | 111 (94.1%) |
| 75 Years and over | 98 (100.0%) | 91 (96.8%) |
| Total | 628 (97.8%) | 811 (97.8%) |
Income Below Poverty Among Married-Couple Families in Leland Grove
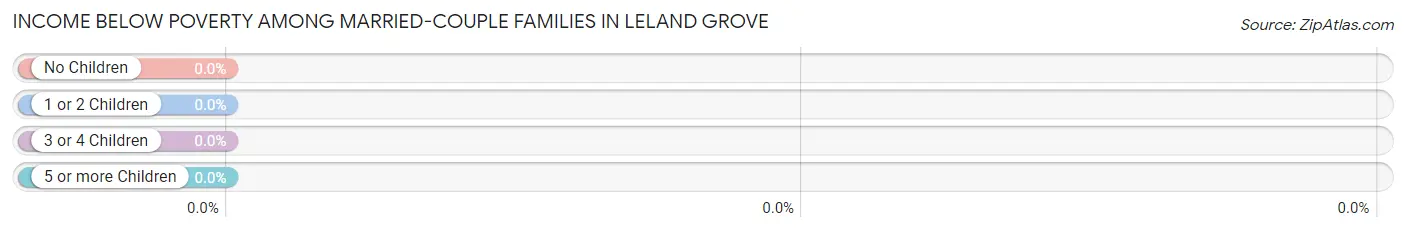
| Children | Above Poverty | Below Poverty |
| No Children | 263 (100.0%) | 0 (0.0%) |
| 1 or 2 Children | 101 (100.0%) | 0 (0.0%) |
| 3 or 4 Children | 16 (100.0%) | 0 (0.0%) |
| 5 or more Children | 0 (0.0%) | 0 (0.0%) |
| Total | 380 (100.0%) | 0 (0.0%) |
Income Below Poverty Among Single-Parent Households in Leland Grove
| Children | Single Father | Single Mother |
| No Children | 0 (0.0%) | 0 (0.0%) |
| 1 or 2 Children | 0 (0.0%) | 0 (0.0%) |
| 3 or 4 Children | 0 (0.0%) | 0 (0.0%) |
| 5 or more Children | 0 (0.0%) | 0 (0.0%) |
| Total | 0 (0.0%) | 0 (0.0%) |
Income Below Poverty Among Married-Couple vs Single-Parent Households in Leland Grove
| Children | Married-Couple Families | Single-Parent Households |
| No Children | 0 (0.0%) | 0 (0.0%) |
| 1 or 2 Children | 0 (0.0%) | 0 (0.0%) |
| 3 or 4 Children | 0 (0.0%) | 0 (0.0%) |
| 5 or more Children | 0 (0.0%) | 0 (0.0%) |
| Total | 0 (0.0%) | 0 (0.0%) |
Race in Leland Grove
The most populous races in Leland Grove are White / Caucasian (1,405 | 95.1%), Hispanic or Latino (33 | 2.2%), and Asian (32 | 2.2%).
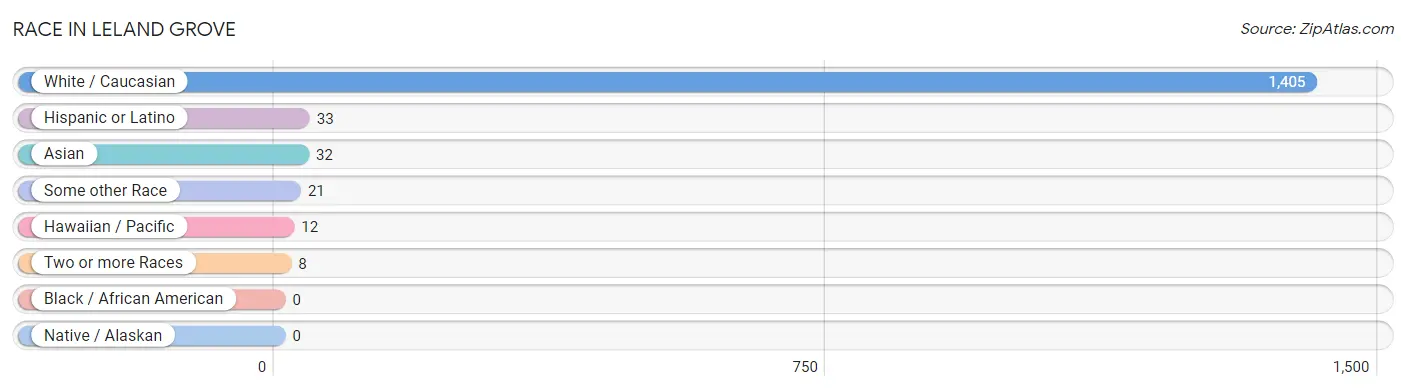
| Race | # Population | % Population |
| Asian | 32 | 2.2% |
| Black / African American | 0 | 0.0% |
| Hawaiian / Pacific | 12 | 0.8% |
| Hispanic or Latino | 33 | 2.2% |
| Native / Alaskan | 0 | 0.0% |
| White / Caucasian | 1,405 | 95.1% |
| Two or more Races | 8 | 0.5% |
| Some other Race | 21 | 1.4% |
| Total | 1,478 | 100.0% |
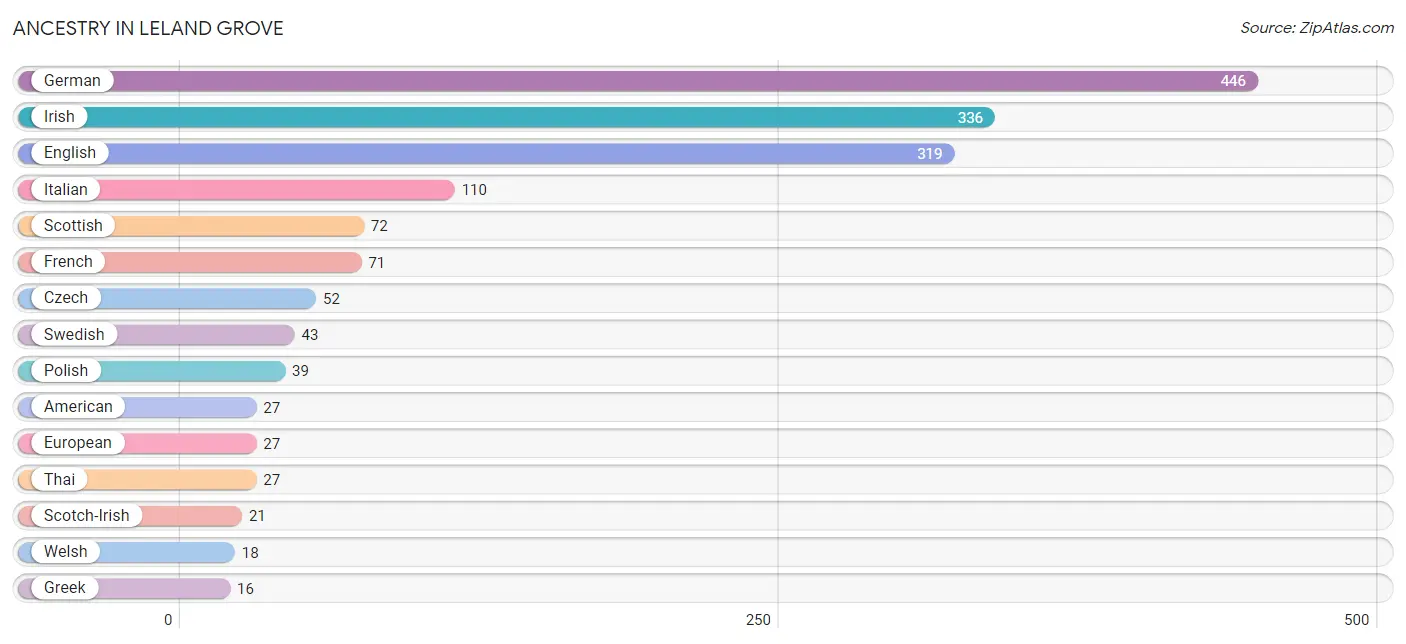
Ancestry in Leland Grove
The most populous ancestries reported in Leland Grove are German (446 | 30.2%), Irish (336 | 22.7%), English (319 | 21.6%), Italian (110 | 7.4%), and Scottish (72 | 4.9%), together accounting for 86.8% of all Leland Grove residents.
| Ancestry | # Population | % Population |
| American | 27 | 1.8% |
| Armenian | 3 | 0.2% |
| Austrian | 11 | 0.7% |
| British | 15 | 1.0% |
| Burmese | 4 | 0.3% |
| Central American | 15 | 1.0% |
| Cherokee | 1 | 0.1% |
| Czech | 52 | 3.5% |
| Danish | 4 | 0.3% |
| Dutch | 12 | 0.8% |
| Eastern European | 11 | 0.7% |
| English | 319 | 21.6% |
| European | 27 | 1.8% |
| French | 71 | 4.8% |
| French Canadian | 7 | 0.5% |
| German | 446 | 30.2% |
| Greek | 16 | 1.1% |
| Guamanian / Chamorro | 12 | 0.8% |
| Guatemalan | 12 | 0.8% |
| Hungarian | 6 | 0.4% |
| Irish | 336 | 22.7% |
| Israeli | 9 | 0.6% |
| Italian | 110 | 7.4% |
| Korean | 1 | 0.1% |
| Lithuanian | 6 | 0.4% |
| Mexican | 10 | 0.7% |
| Nicaraguan | 3 | 0.2% |
| Northern European | 3 | 0.2% |
| Norwegian | 15 | 1.0% |
| Polish | 39 | 2.6% |
| Puerto Rican | 3 | 0.2% |
| Russian | 4 | 0.3% |
| Scotch-Irish | 21 | 1.4% |
| Scottish | 72 | 4.9% |
| Slovene | 8 | 0.5% |
| Spanish | 5 | 0.3% |
| Swedish | 43 | 2.9% |
| Swiss | 8 | 0.5% |
| Thai | 27 | 1.8% |
| Turkish | 2 | 0.1% |
| Ukrainian | 5 | 0.3% |
| Welsh | 18 | 1.2% | View All 42 Rows |
Immigrants in Leland Grove
The most numerous immigrant groups reported in Leland Grove came from Central America (20 | 1.3%), Latin America (20 | 1.3%), Guatemala (12 | 0.8%), Asia (9 | 0.6%), and India (5 | 0.3%), together accounting for 4.5% of all Leland Grove residents.
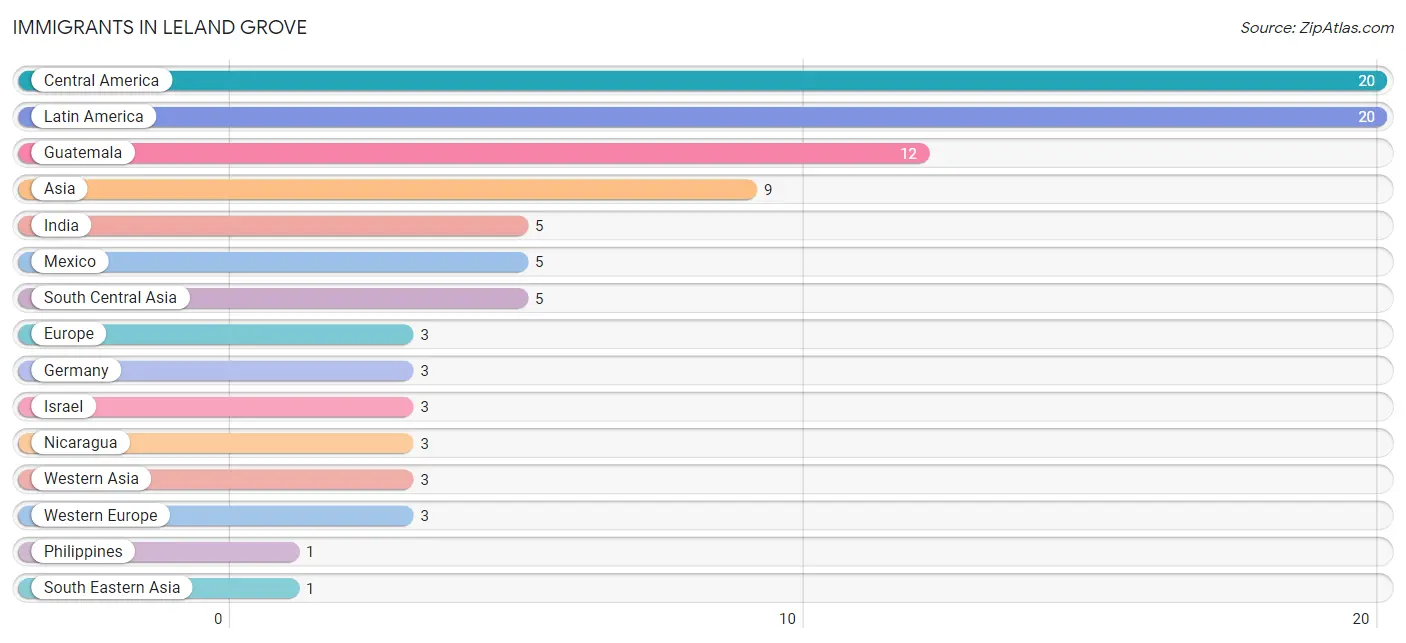
| Immigration Origin | # Population | % Population |
| Asia | 9 | 0.6% |
| Central America | 20 | 1.3% |
| Europe | 3 | 0.2% |
| Germany | 3 | 0.2% |
| Guatemala | 12 | 0.8% |
| India | 5 | 0.3% |
| Israel | 3 | 0.2% |
| Latin America | 20 | 1.3% |
| Mexico | 5 | 0.3% |
| Nicaragua | 3 | 0.2% |
| Philippines | 1 | 0.1% |
| South Central Asia | 5 | 0.3% |
| South Eastern Asia | 1 | 0.1% |
| Western Asia | 3 | 0.2% |
| Western Europe | 3 | 0.2% | View All 15 Rows |
Sex and Age in Leland Grove
Sex and Age in Leland Grove
The most populous age groups in Leland Grove are 65 to 69 Years (90 | 13.9%) for men and 45 to 49 Years (133 | 16.0%) for women.
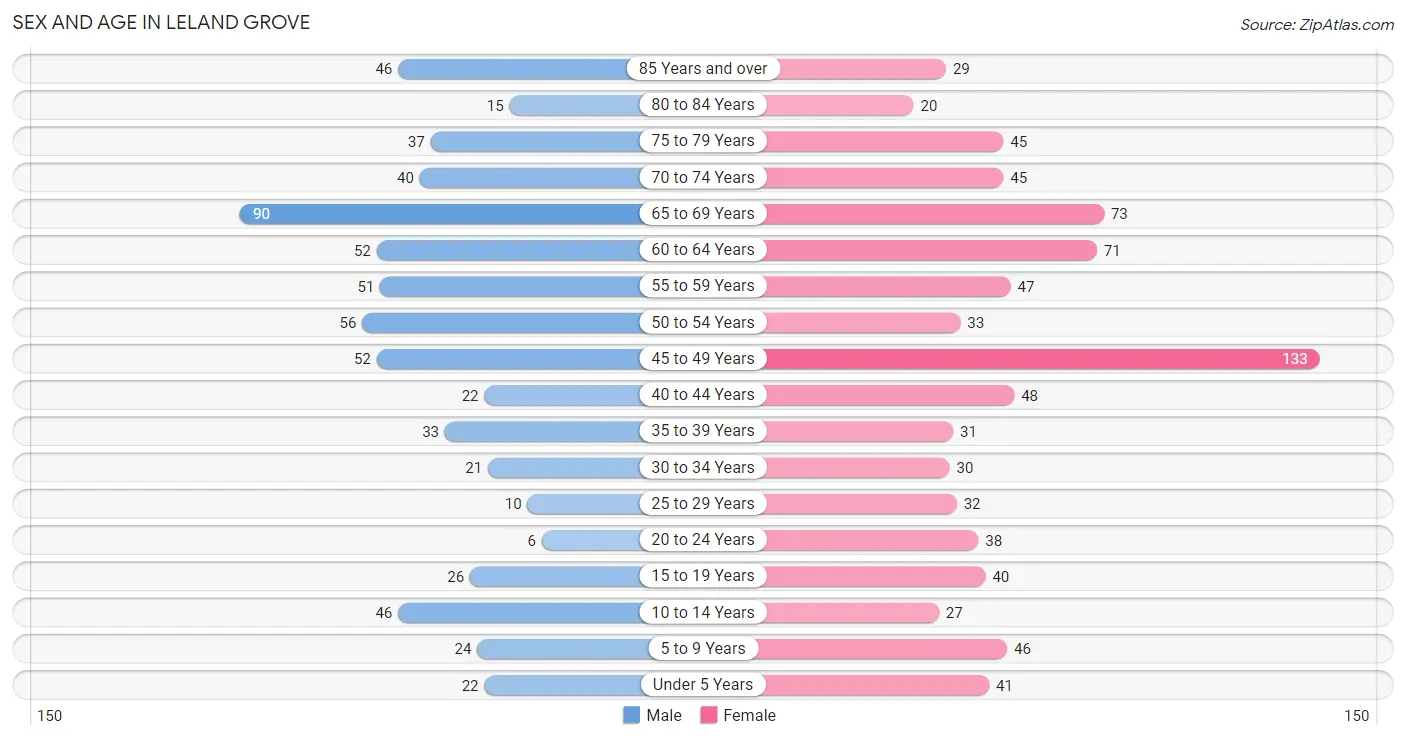
| Age Bracket | Male | Female |
| Under 5 Years | 22 (3.4%) | 41 (5.0%) |
| 5 to 9 Years | 24 (3.7%) | 46 (5.6%) |
| 10 to 14 Years | 46 (7.1%) | 27 (3.3%) |
| 15 to 19 Years | 26 (4.0%) | 40 (4.8%) |
| 20 to 24 Years | 6 (0.9%) | 38 (4.6%) |
| 25 to 29 Years | 10 (1.5%) | 32 (3.9%) |
| 30 to 34 Years | 21 (3.2%) | 30 (3.6%) |
| 35 to 39 Years | 33 (5.1%) | 31 (3.7%) |
| 40 to 44 Years | 22 (3.4%) | 48 (5.8%) |
| 45 to 49 Years | 52 (8.0%) | 133 (16.0%) |
| 50 to 54 Years | 56 (8.6%) | 33 (4.0%) |
| 55 to 59 Years | 51 (7.9%) | 47 (5.7%) |
| 60 to 64 Years | 52 (8.0%) | 71 (8.6%) |
| 65 to 69 Years | 90 (13.9%) | 73 (8.8%) |
| 70 to 74 Years | 40 (6.2%) | 45 (5.4%) |
| 75 to 79 Years | 37 (5.7%) | 45 (5.4%) |
| 80 to 84 Years | 15 (2.3%) | 20 (2.4%) |
| 85 Years and over | 46 (7.1%) | 29 (3.5%) |
| Total | 649 (100.0%) | 829 (100.0%) |
Families and Households in Leland Grove
Median Family Size in Leland Grove
The median family size in Leland Grove is 2.71 persons per family, with married-couple families (380 | 88.8%) accounting for the largest median family size of 2.79 persons per family. On the other hand, single male/father families (3 | 0.7%) represent the smallest median family size with 2.00 persons per family.
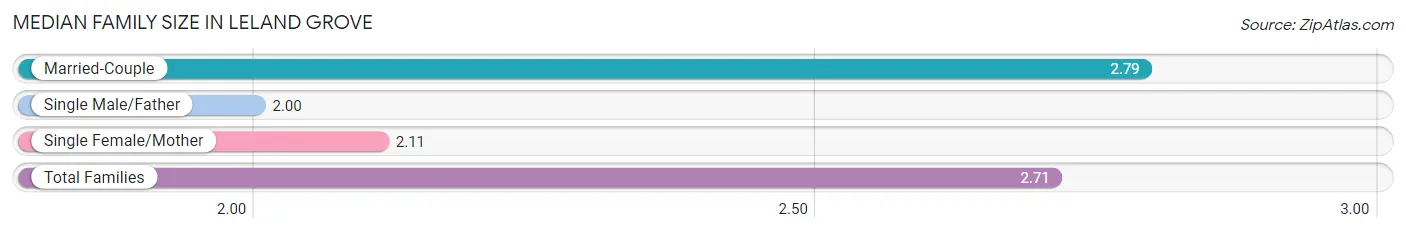
| Family Type | # Families | Family Size |
| Married-Couple | 380 (88.8%) | 2.79 |
| Single Male/Father | 3 (0.7%) | 2.00 |
| Single Female/Mother | 45 (10.5%) | 2.11 |
| Total Families | 428 (100.0%) | 2.71 |
Median Household Size in Leland Grove
The median household size in Leland Grove is 2.14 persons per household, with married-couple households (380 | 55.2%) accounting for the largest median household size of 2.81 persons per household. non-family households (260 | 37.8%) represent the smallest median household size with 1.16 persons per household.
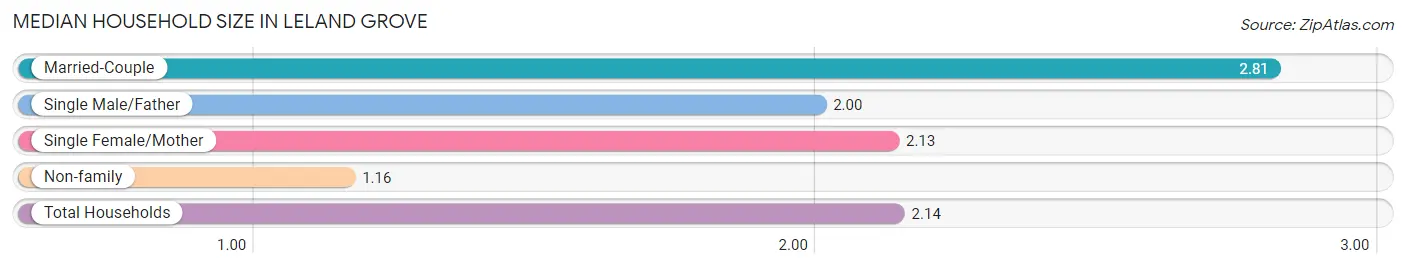
| Household Type | # Households | Household Size |
| Married-Couple | 380 (55.2%) | 2.81 |
| Single Male/Father | 3 (0.4%) | 2.00 |
| Single Female/Mother | 45 (6.5%) | 2.13 |
| Non-family | 260 (37.8%) | 1.16 |
| Total Households | 688 (100.0%) | 2.14 |
Household Size by Marriage Status in Leland Grove
Out of a total of 688 households in Leland Grove, 428 (62.2%) are family households, while 260 (37.8%) are nonfamily households. The most numerous type of family households are 2-person households, comprising 262, and the most common type of nonfamily households are 1-person households, comprising 220.
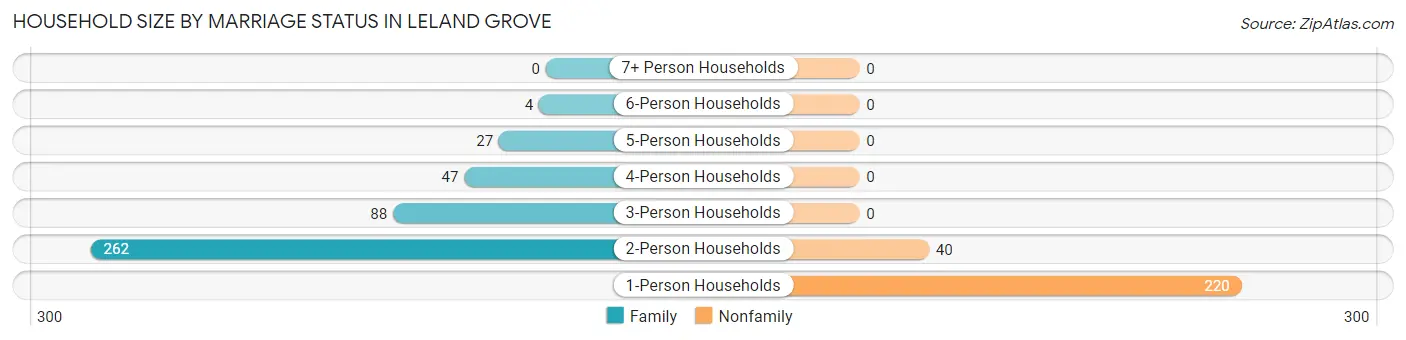
| Household Size | Family Households | Nonfamily Households |
| 1-Person Households | - | 220 (32.0%) |
| 2-Person Households | 262 (38.1%) | 40 (5.8%) |
| 3-Person Households | 88 (12.8%) | 0 (0.0%) |
| 4-Person Households | 47 (6.8%) | 0 (0.0%) |
| 5-Person Households | 27 (3.9%) | 0 (0.0%) |
| 6-Person Households | 4 (0.6%) | 0 (0.0%) |
| 7+ Person Households | 0 (0.0%) | 0 (0.0%) |
| Total | 428 (62.2%) | 260 (37.8%) |
Female Fertility in Leland Grove
Fertility by Age in Leland Grove
Average fertility rate in Leland Grove is 25.0 births per 1,000 women. Women in the age bracket of 20 to 34 years have the highest fertility rate with 40.0 births per 1,000 women. Women in the age bracket of 35 to 50 years acount for 55.6% of all women with births.
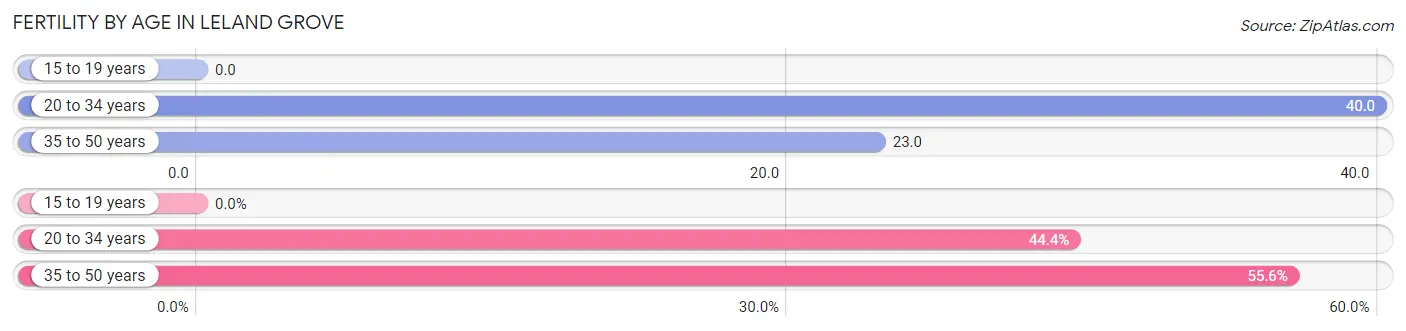
| Age Bracket | Women with Births | Births / 1,000 Women |
| 15 to 19 years | 0 (0.0%) | 0.0 |
| 20 to 34 years | 4 (44.4%) | 40.0 |
| 35 to 50 years | 5 (55.6%) | 23.0 |
| Total | 9 (100.0%) | 25.0 |
Fertility by Age by Marriage Status in Leland Grove
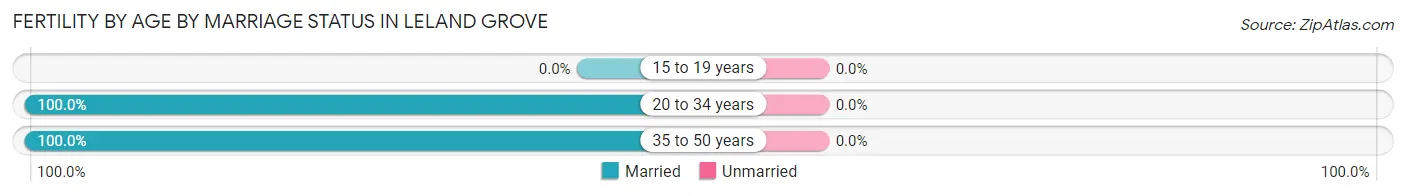
| Age Bracket | Married | Unmarried |
| 15 to 19 years | 0 (0.0%) | 0 (0.0%) |
| 20 to 34 years | 4 (100.0%) | 0 (0.0%) |
| 35 to 50 years | 5 (100.0%) | 0 (0.0%) |
| Total | 9 (100.0%) | 0 (0.0%) |
Fertility by Education in Leland Grove
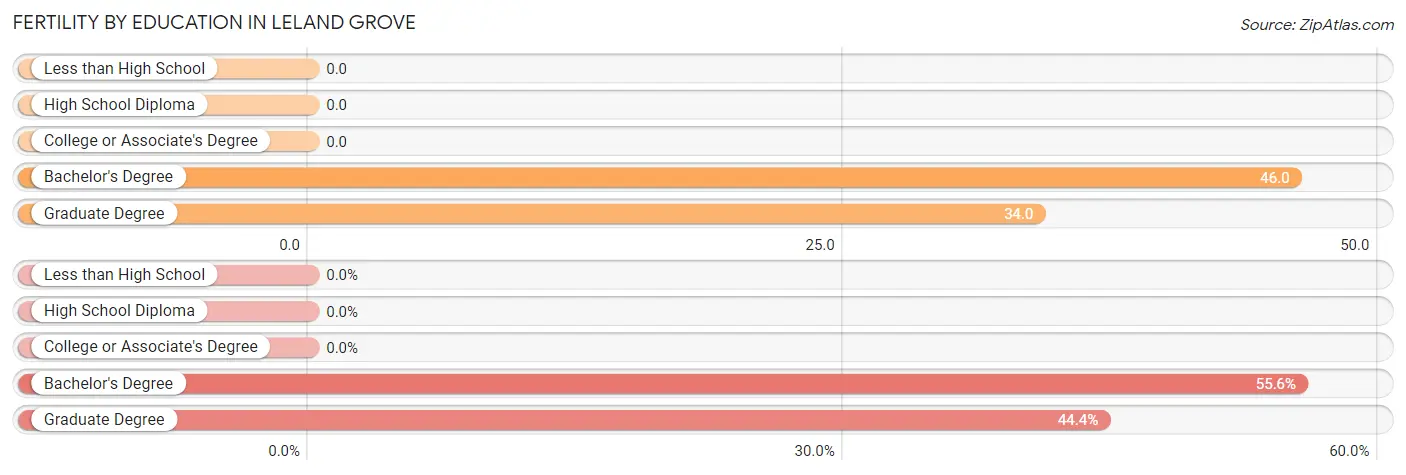
| Educational Attainment | Women with Births | Births / 1,000 Women |
| Less than High School | 0 (0.0%) | 0.0 |
| High School Diploma | 0 (0.0%) | 0.0 |
| College or Associate's Degree | 0 (0.0%) | 0.0 |
| Bachelor's Degree | 5 (55.6%) | 46.0 |
| Graduate Degree | 4 (44.4%) | 34.0 |
| Total | 9 (100.0%) | 25.0 |
Fertility by Education by Marriage Status in Leland Grove
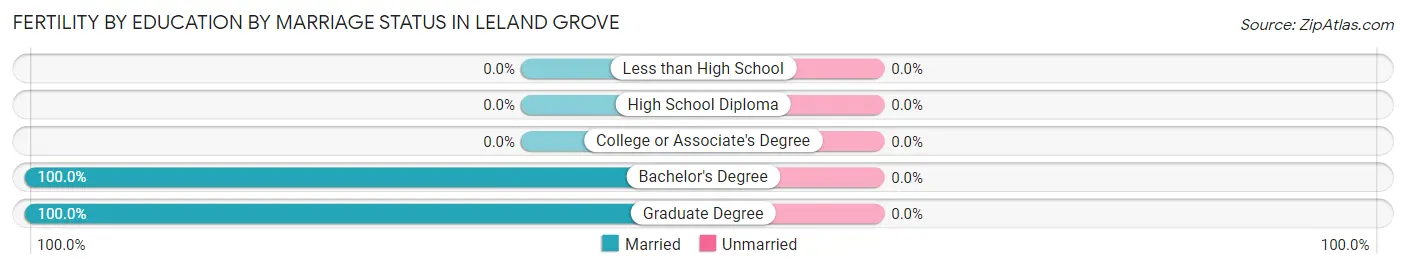
| Educational Attainment | Married | Unmarried |
| Less than High School | 0 (0.0%) | 0 (0.0%) |
| High School Diploma | 0 (0.0%) | 0 (0.0%) |
| College or Associate's Degree | 0 (0.0%) | 0 (0.0%) |
| Bachelor's Degree | 5 (100.0%) | 0 (0.0%) |
| Graduate Degree | 4 (100.0%) | 0 (0.0%) |
| Total | 9 (100.0%) | 0 (0.0%) |
Employment Characteristics in Leland Grove
Employment by Class of Employer in Leland Grove
Among the 686 employed individuals in Leland Grove, private company employees (283 | 41.2%), not-for-profit organizations (106 | 15.4%), and state government employees (102 | 14.9%) make up the most common classes of employment.
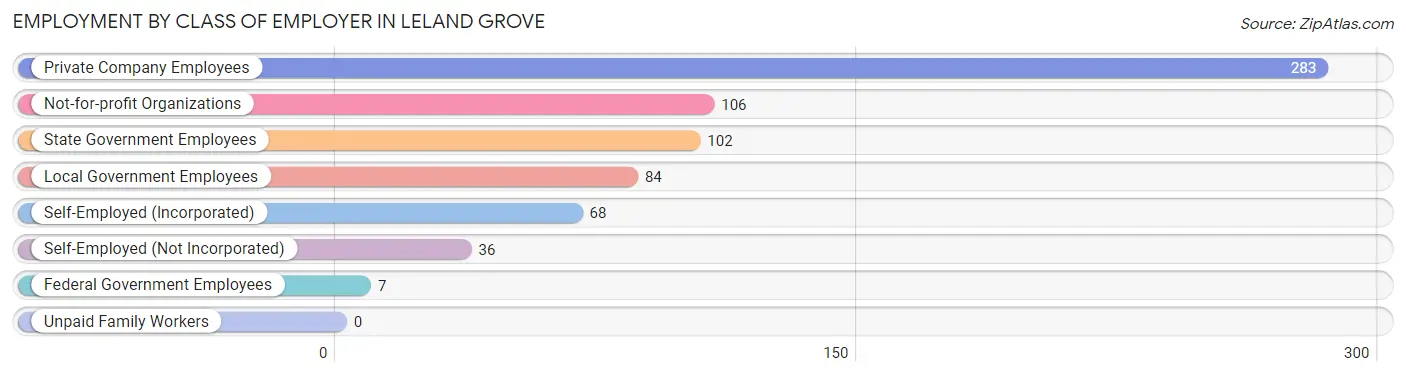
| Employer Class | # Employees | % Employees |
| Private Company Employees | 283 | 41.2% |
| Self-Employed (Incorporated) | 68 | 9.9% |
| Self-Employed (Not Incorporated) | 36 | 5.2% |
| Not-for-profit Organizations | 106 | 15.4% |
| Local Government Employees | 84 | 12.2% |
| State Government Employees | 102 | 14.9% |
| Federal Government Employees | 7 | 1.0% |
| Unpaid Family Workers | 0 | 0.0% |
| Total | 686 | 100.0% |
Employment Status by Age in Leland Grove
According to the labor force statistics for Leland Grove, out of the total population over 16 years of age (1,263), 55.8% or 705 individuals are in the labor force, with 2.3% or 16 of them unemployed. The age group with the highest labor force participation rate is 25 to 29 years, with 100.0% or 42 individuals in the labor force. Within the labor force, the 45 to 54 years age range has the highest percentage of unemployed individuals, with 6.3% or 13 of them being unemployed.
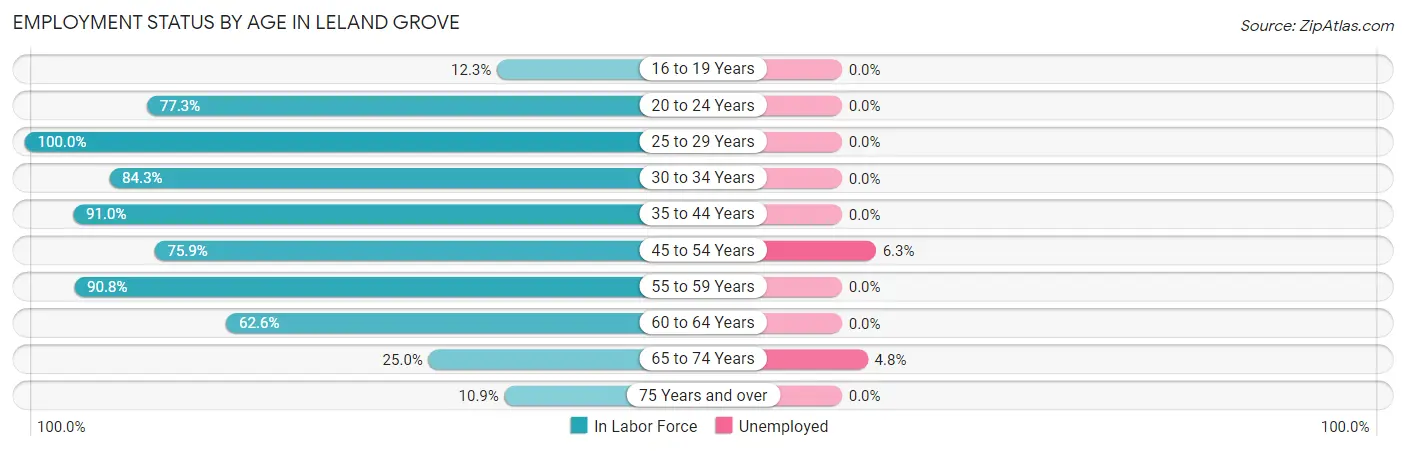
| Age Bracket | In Labor Force | Unemployed |
| 16 to 19 Years | 7 (12.3%) | 0 (0.0%) |
| 20 to 24 Years | 34 (77.3%) | 0 (0.0%) |
| 25 to 29 Years | 42 (100.0%) | 0 (0.0%) |
| 30 to 34 Years | 43 (84.3%) | 0 (0.0%) |
| 35 to 44 Years | 122 (91.0%) | 0 (0.0%) |
| 45 to 54 Years | 208 (75.9%) | 13 (6.3%) |
| 55 to 59 Years | 89 (90.8%) | 0 (0.0%) |
| 60 to 64 Years | 77 (62.6%) | 0 (0.0%) |
| 65 to 74 Years | 62 (25.0%) | 3 (4.8%) |
| 75 Years and over | 21 (10.9%) | 0 (0.0%) |
| Total | 705 (55.8%) | 16 (2.3%) |
Employment Status by Educational Attainment in Leland Grove
According to labor force statistics for Leland Grove, 80.5% of individuals (581) out of the total population between 25 and 64 years of age (722) are in the labor force, with 2.2% or 13 of them being unemployed. The group with the highest labor force participation rate are those with the educational attainment of bachelor's degree or higher, with 88.3% or 461 individuals in the labor force. Within the labor force, individuals with bachelor's degree or higher education have the highest percentage of unemployment, with 2.8% or 13 of them being unemployed.
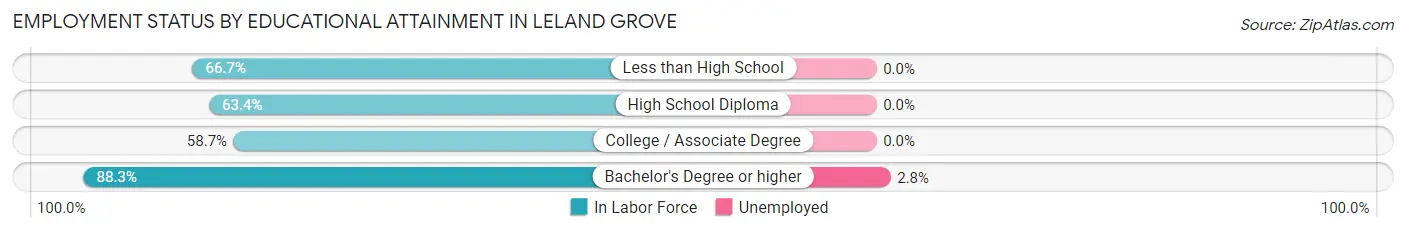
| Educational Attainment | In Labor Force | Unemployed |
| Less than High School | 6 (66.7%) | 0 (0.0%) |
| High School Diploma | 26 (63.4%) | 0 (0.0%) |
| College / Associate Degree | 88 (58.7%) | 0 (0.0%) |
| Bachelor's Degree or higher | 461 (88.3%) | 15 (2.8%) |
| Total | 581 (80.5%) | 16 (2.2%) |
Employment Occupations by Sex in Leland Grove
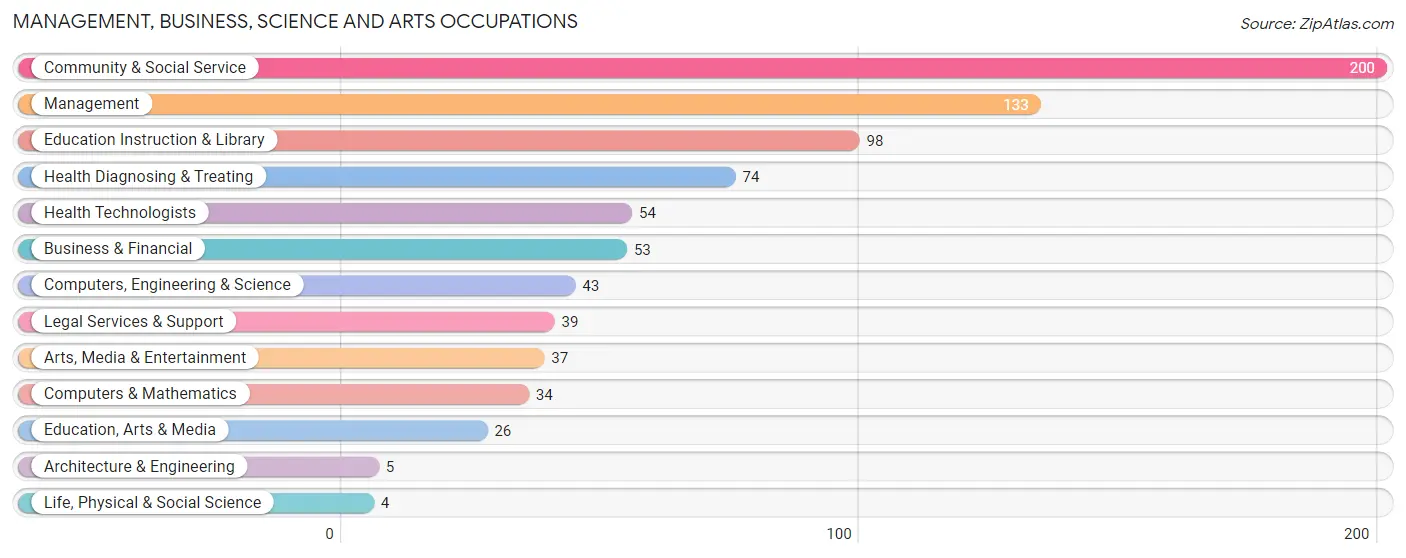
Management, Business, Science and Arts Occupations
The most common Management, Business, Science and Arts occupations in Leland Grove are Community & Social Service (200 | 29.0%), Management (133 | 19.3%), Education Instruction & Library (98 | 14.2%), Health Diagnosing & Treating (74 | 10.7%), and Health Technologists (54 | 7.8%).
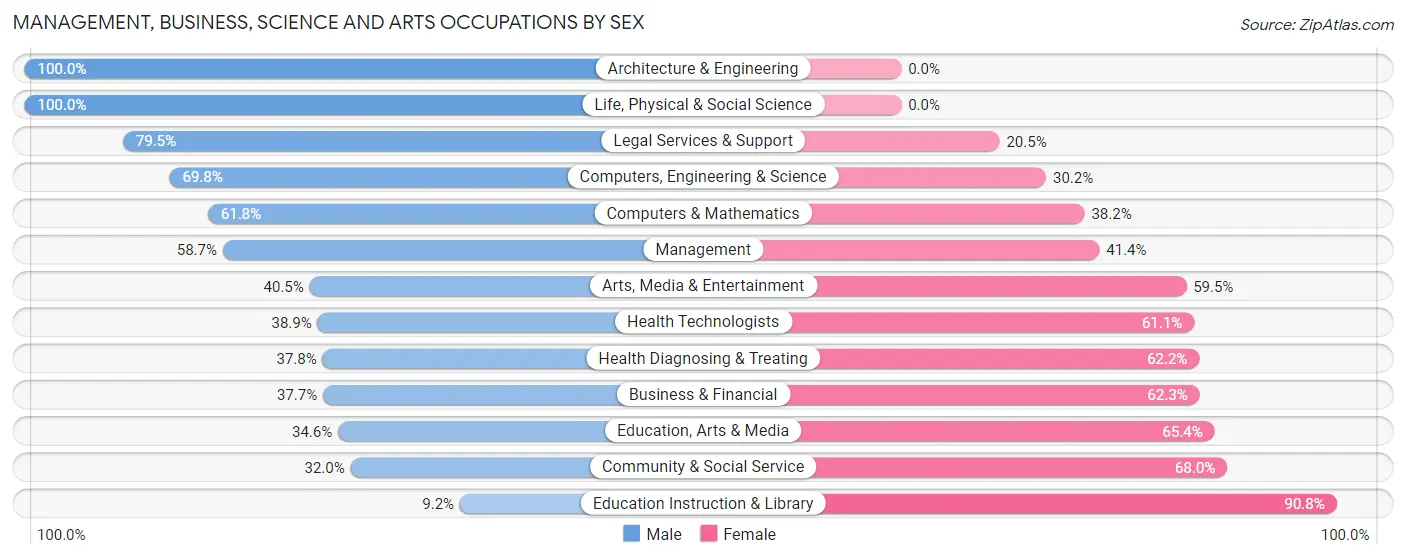
Management, Business, Science and Arts Occupations by Sex
Within the Management, Business, Science and Arts occupations in Leland Grove, the most male-oriented occupations are Architecture & Engineering (100.0%), Life, Physical & Social Science (100.0%), and Legal Services & Support (79.5%), while the most female-oriented occupations are Education Instruction & Library (90.8%), Community & Social Service (68.0%), and Education, Arts & Media (65.4%).
| Occupation | Male | Female |
| Management | 78 (58.7%) | 55 (41.3%) |
| Business & Financial | 20 (37.7%) | 33 (62.3%) |
| Computers, Engineering & Science | 30 (69.8%) | 13 (30.2%) |
| Computers & Mathematics | 21 (61.8%) | 13 (38.2%) |
| Architecture & Engineering | 5 (100.0%) | 0 (0.0%) |
| Life, Physical & Social Science | 4 (100.0%) | 0 (0.0%) |
| Community & Social Service | 64 (32.0%) | 136 (68.0%) |
| Education, Arts & Media | 9 (34.6%) | 17 (65.4%) |
| Legal Services & Support | 31 (79.5%) | 8 (20.5%) |
| Education Instruction & Library | 9 (9.2%) | 89 (90.8%) |
| Arts, Media & Entertainment | 15 (40.5%) | 22 (59.5%) |
| Health Diagnosing & Treating | 28 (37.8%) | 46 (62.2%) |
| Health Technologists | 21 (38.9%) | 33 (61.1%) |
| Total (Category) | 220 (43.7%) | 283 (56.3%) |
| Total (Overall) | 316 (45.9%) | 373 (54.1%) |
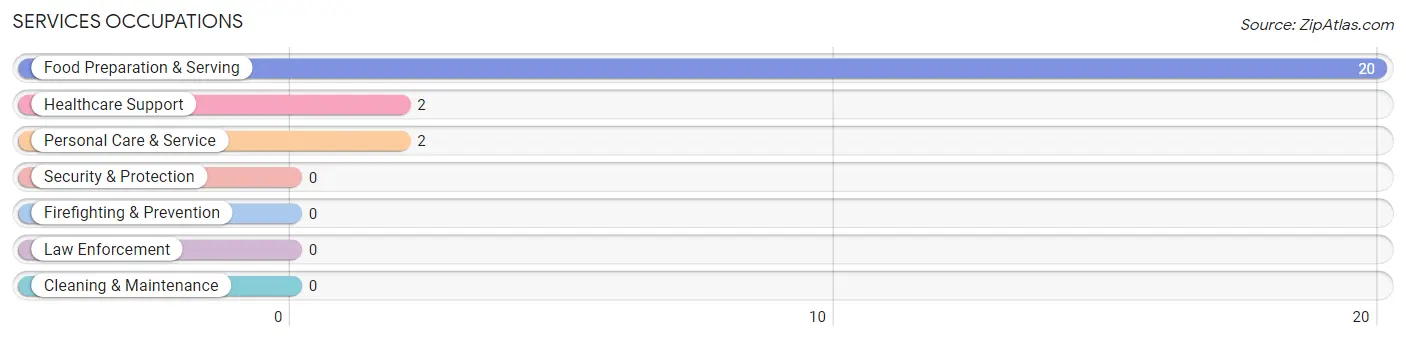
Services Occupations
The most common Services occupations in Leland Grove are Food Preparation & Serving (20 | 2.9%), Healthcare Support (2 | 0.3%), and Personal Care & Service (2 | 0.3%).
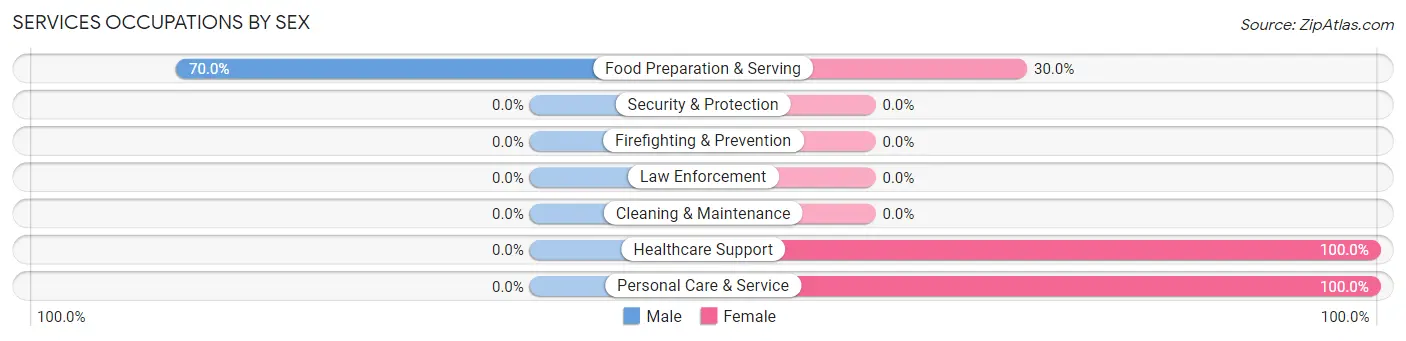
Services Occupations by Sex
| Occupation | Male | Female |
| Healthcare Support | 0 (0.0%) | 2 (100.0%) |
| Security & Protection | 0 (0.0%) | 0 (0.0%) |
| Firefighting & Prevention | 0 (0.0%) | 0 (0.0%) |
| Law Enforcement | 0 (0.0%) | 0 (0.0%) |
| Food Preparation & Serving | 14 (70.0%) | 6 (30.0%) |
| Cleaning & Maintenance | 0 (0.0%) | 0 (0.0%) |
| Personal Care & Service | 0 (0.0%) | 2 (100.0%) |
| Total (Category) | 14 (58.3%) | 10 (41.7%) |
| Total (Overall) | 316 (45.9%) | 373 (54.1%) |
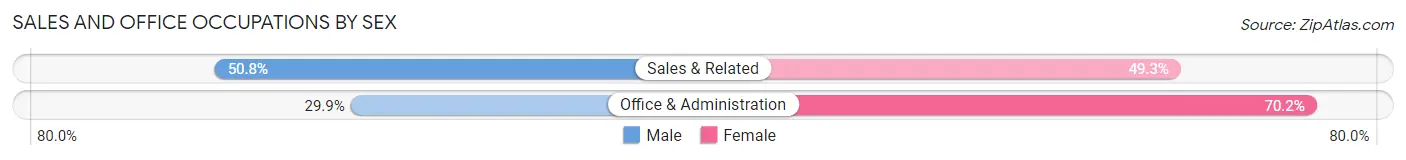
Sales and Office Occupations
The most common Sales and Office occupations in Leland Grove are Sales & Related (67 | 9.7%), and Office & Administration (67 | 9.7%).

Sales and Office Occupations by Sex
| Occupation | Male | Female |
| Sales & Related | 34 (50.7%) | 33 (49.2%) |
| Office & Administration | 20 (29.8%) | 47 (70.2%) |
| Total (Category) | 54 (40.3%) | 80 (59.7%) |
| Total (Overall) | 316 (45.9%) | 373 (54.1%) |
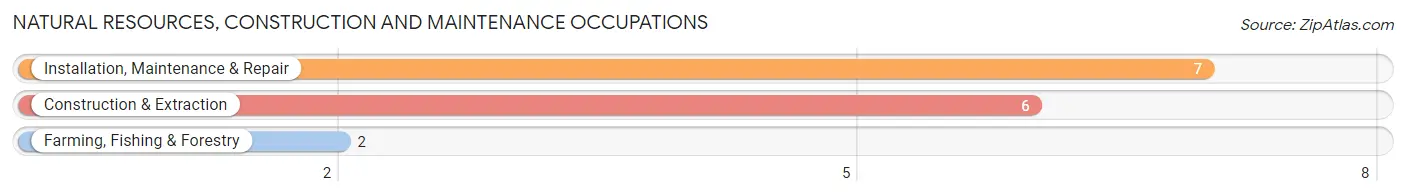
Natural Resources, Construction and Maintenance Occupations
The most common Natural Resources, Construction and Maintenance occupations in Leland Grove are Installation, Maintenance & Repair (7 | 1.0%), Construction & Extraction (6 | 0.9%), and Farming, Fishing & Forestry (2 | 0.3%).
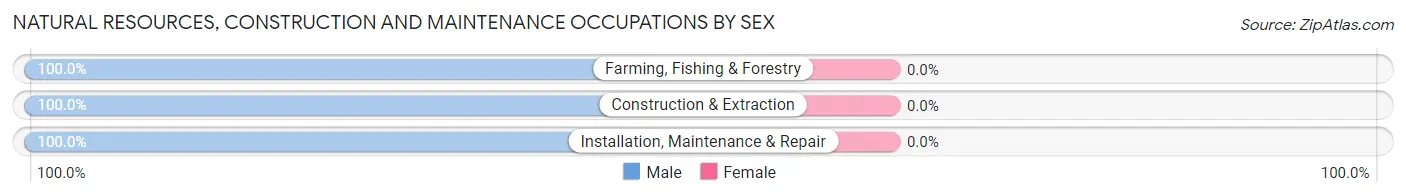
Natural Resources, Construction and Maintenance Occupations by Sex
| Occupation | Male | Female |
| Farming, Fishing & Forestry | 2 (100.0%) | 0 (0.0%) |
| Construction & Extraction | 6 (100.0%) | 0 (0.0%) |
| Installation, Maintenance & Repair | 7 (100.0%) | 0 (0.0%) |
| Total (Category) | 15 (100.0%) | 0 (0.0%) |
| Total (Overall) | 316 (45.9%) | 373 (54.1%) |
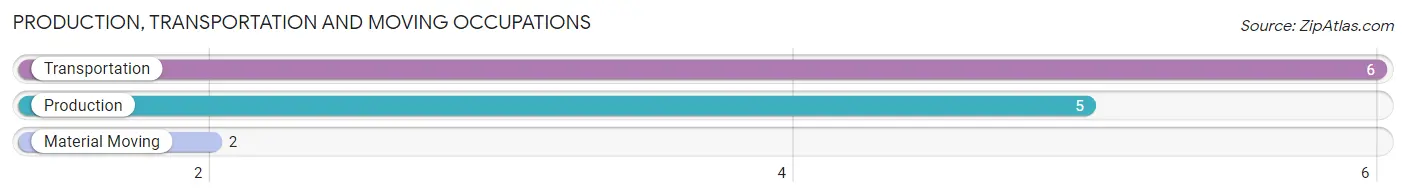
Production, Transportation and Moving Occupations
The most common Production, Transportation and Moving occupations in Leland Grove are Transportation (6 | 0.9%), Production (5 | 0.7%), and Material Moving (2 | 0.3%).
Production, Transportation and Moving Occupations by Sex
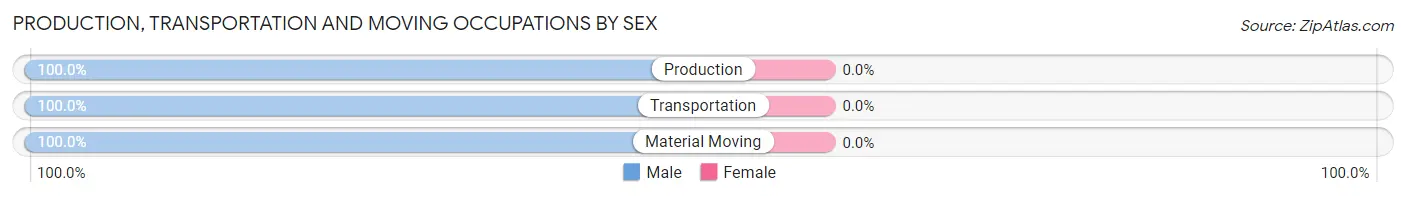
| Occupation | Male | Female |
| Production | 5 (100.0%) | 0 (0.0%) |
| Transportation | 6 (100.0%) | 0 (0.0%) |
| Material Moving | 2 (100.0%) | 0 (0.0%) |
| Total (Category) | 13 (100.0%) | 0 (0.0%) |
| Total (Overall) | 316 (45.9%) | 373 (54.1%) |
Employment Industries by Sex in Leland Grove
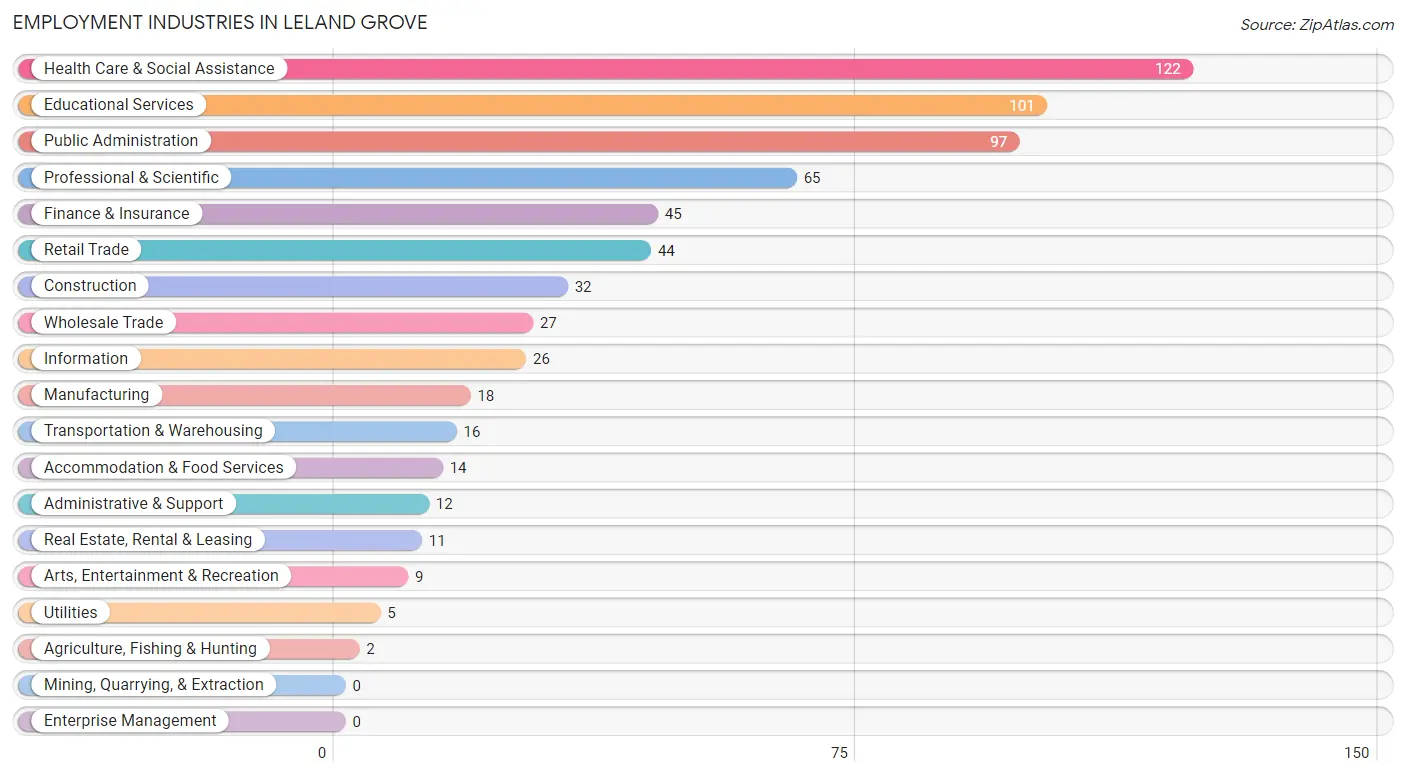
Employment Industries in Leland Grove
The major employment industries in Leland Grove include Health Care & Social Assistance (122 | 17.7%), Educational Services (101 | 14.7%), Public Administration (97 | 14.1%), Professional & Scientific (65 | 9.4%), and Finance & Insurance (45 | 6.5%).
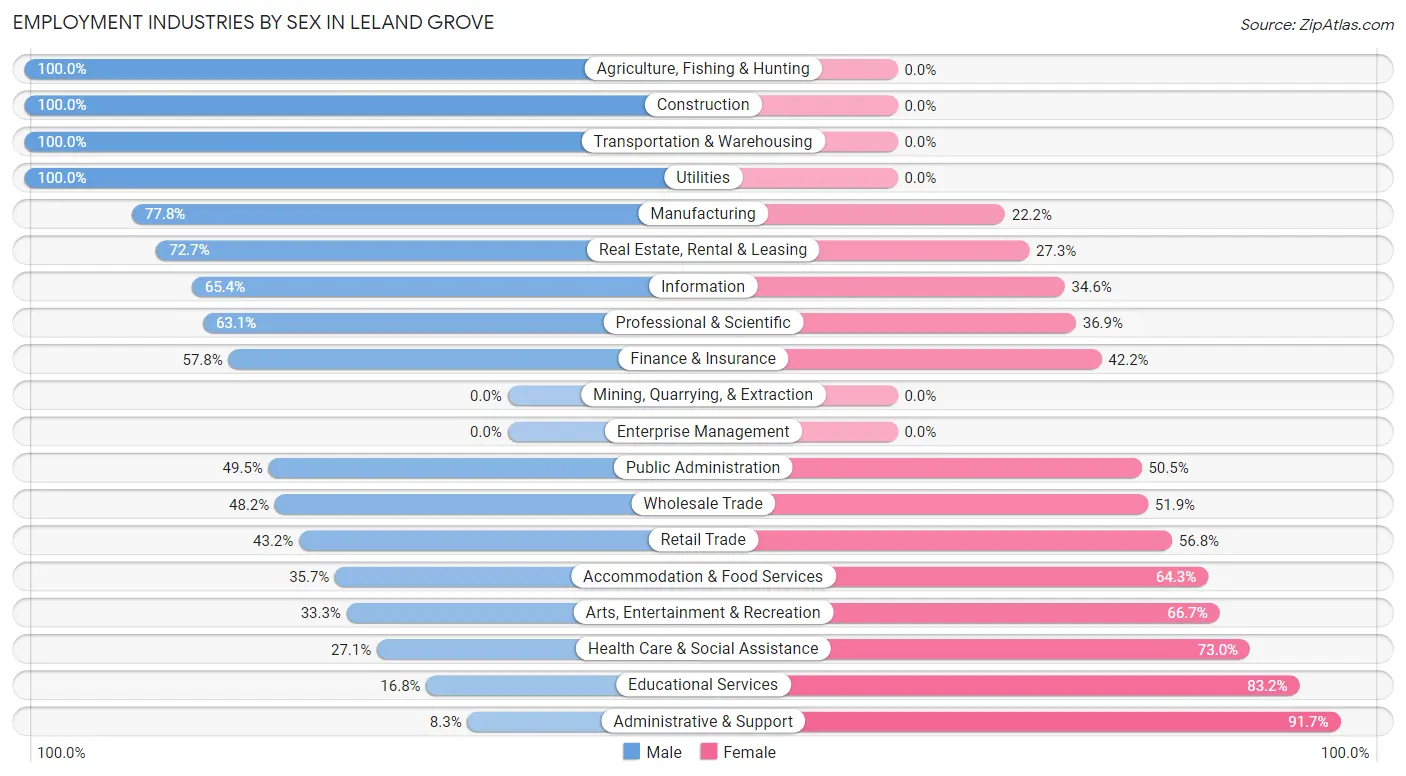
Employment Industries by Sex in Leland Grove
The Leland Grove industries that see more men than women are Agriculture, Fishing & Hunting (100.0%), Construction (100.0%), and Transportation & Warehousing (100.0%), whereas the industries that tend to have a higher number of women are Administrative & Support (91.7%), Educational Services (83.2%), and Health Care & Social Assistance (73.0%).
| Industry | Male | Female |
| Agriculture, Fishing & Hunting | 2 (100.0%) | 0 (0.0%) |
| Mining, Quarrying, & Extraction | 0 (0.0%) | 0 (0.0%) |
| Construction | 32 (100.0%) | 0 (0.0%) |
| Manufacturing | 14 (77.8%) | 4 (22.2%) |
| Wholesale Trade | 13 (48.1%) | 14 (51.8%) |
| Retail Trade | 19 (43.2%) | 25 (56.8%) |
| Transportation & Warehousing | 16 (100.0%) | 0 (0.0%) |
| Utilities | 5 (100.0%) | 0 (0.0%) |
| Information | 17 (65.4%) | 9 (34.6%) |
| Finance & Insurance | 26 (57.8%) | 19 (42.2%) |
| Real Estate, Rental & Leasing | 8 (72.7%) | 3 (27.3%) |
| Professional & Scientific | 41 (63.1%) | 24 (36.9%) |
| Enterprise Management | 0 (0.0%) | 0 (0.0%) |
| Administrative & Support | 1 (8.3%) | 11 (91.7%) |
| Educational Services | 17 (16.8%) | 84 (83.2%) |
| Health Care & Social Assistance | 33 (27.1%) | 89 (73.0%) |
| Arts, Entertainment & Recreation | 3 (33.3%) | 6 (66.7%) |
| Accommodation & Food Services | 5 (35.7%) | 9 (64.3%) |
| Public Administration | 48 (49.5%) | 49 (50.5%) |
| Total | 316 (45.9%) | 373 (54.1%) |
Education in Leland Grove
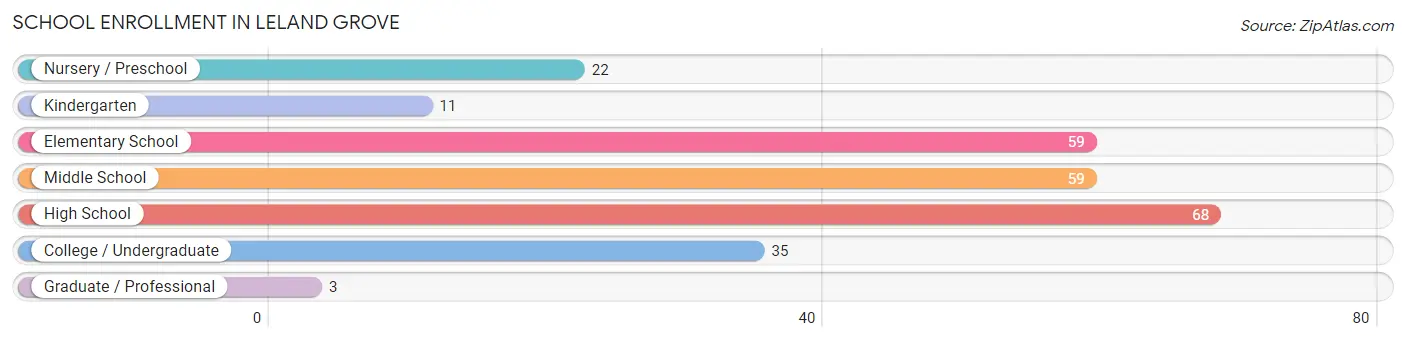
School Enrollment in Leland Grove
The most common levels of schooling among the 257 students in Leland Grove are high school (68 | 26.5%), elementary school (59 | 23.0%), and middle school (59 | 23.0%).
| School Level | # Students | % Students |
| Nursery / Preschool | 22 | 8.6% |
| Kindergarten | 11 | 4.3% |
| Elementary School | 59 | 23.0% |
| Middle School | 59 | 23.0% |
| High School | 68 | 26.5% |
| College / Undergraduate | 35 | 13.6% |
| Graduate / Professional | 3 | 1.2% |
| Total | 257 | 100.0% |
School Enrollment by Age by Funding Source in Leland Grove
Out of a total of 257 students who are enrolled in schools in Leland Grove, 134 (52.1%) attend a private institution, while the remaining 123 (47.9%) are enrolled in public schools. The age group of 18 to 19 year olds has the highest likelihood of being enrolled in private schools, with 11 (100.0% in the age bracket) enrolled. Conversely, the age group of 20 to 24 year olds has the lowest likelihood of being enrolled in a private school, with 16 (100.0% in the age bracket) attending a public institution.
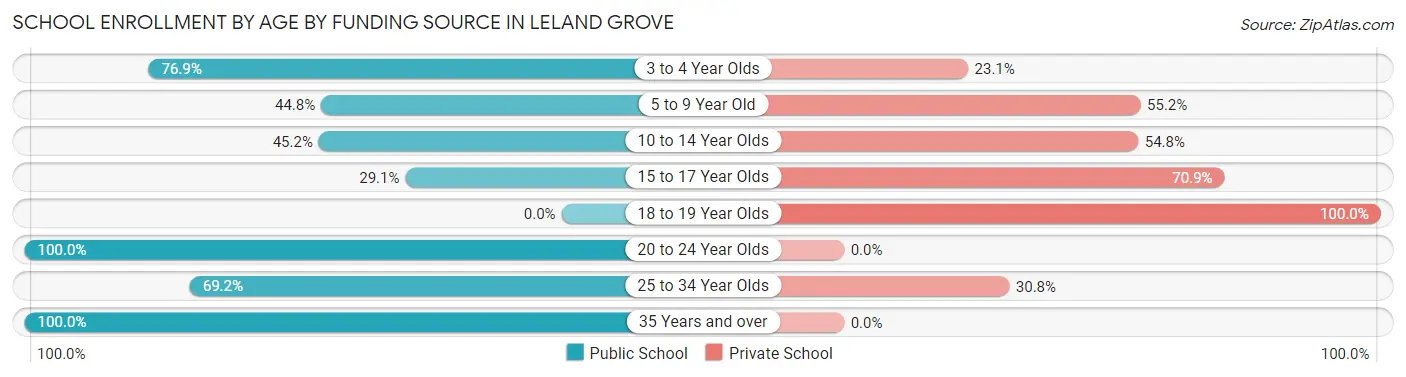
| Age Bracket | Public School | Private School |
| 3 to 4 Year Olds | 10 (76.9%) | 3 (23.1%) |
| 5 to 9 Year Old | 30 (44.8%) | 37 (55.2%) |
| 10 to 14 Year Olds | 33 (45.2%) | 40 (54.8%) |
| 15 to 17 Year Olds | 16 (29.1%) | 39 (70.9%) |
| 18 to 19 Year Olds | 0 (0.0%) | 11 (100.0%) |
| 20 to 24 Year Olds | 16 (100.0%) | 0 (0.0%) |
| 25 to 34 Year Olds | 9 (69.2%) | 4 (30.8%) |
| 35 Years and over | 9 (100.0%) | 0 (0.0%) |
| Total | 123 (47.9%) | 134 (52.1%) |
Educational Attainment by Field of Study in Leland Grove
Education (126 | 14.5%), business (116 | 13.4%), social sciences (105 | 12.1%), science & technology (98 | 11.3%), and communications (84 | 9.7%) are the most common fields of study among 869 individuals in Leland Grove who have obtained a bachelor's degree or higher.
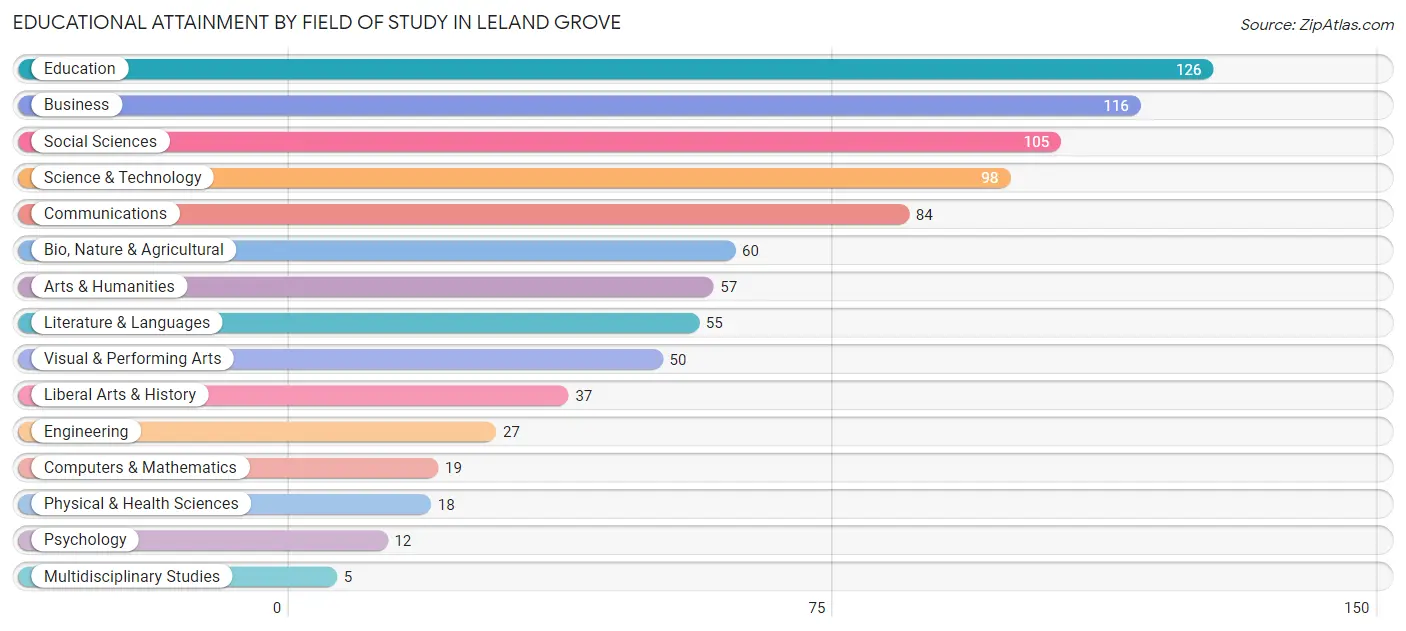
| Field of Study | # Graduates | % Graduates |
| Computers & Mathematics | 19 | 2.2% |
| Bio, Nature & Agricultural | 60 | 6.9% |
| Physical & Health Sciences | 18 | 2.1% |
| Psychology | 12 | 1.4% |
| Social Sciences | 105 | 12.1% |
| Engineering | 27 | 3.1% |
| Multidisciplinary Studies | 5 | 0.6% |
| Science & Technology | 98 | 11.3% |
| Business | 116 | 13.4% |
| Education | 126 | 14.5% |
| Literature & Languages | 55 | 6.3% |
| Liberal Arts & History | 37 | 4.3% |
| Visual & Performing Arts | 50 | 5.8% |
| Communications | 84 | 9.7% |
| Arts & Humanities | 57 | 6.6% |
| Total | 869 | 100.0% |
Transportation & Commute in Leland Grove
Vehicle Availability by Sex in Leland Grove
The most prevalent vehicle ownership categories in Leland Grove are males with 2 vehicles (176, accounting for 55.7%) and females with 2 vehicles (201, making up 47.6%).
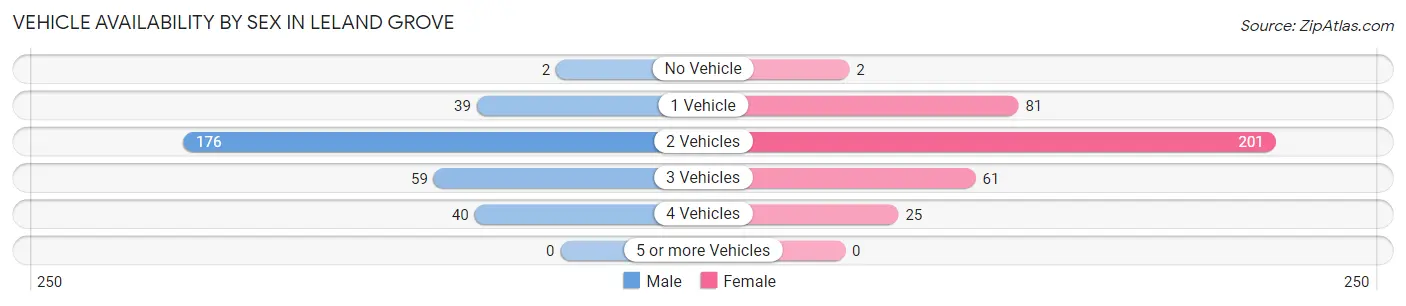
| Vehicles Available | Male | Female |
| No Vehicle | 2 (0.6%) | 2 (0.5%) |
| 1 Vehicle | 39 (12.3%) | 81 (21.9%) |
| 2 Vehicles | 176 (55.7%) | 201 (54.3%) |
| 3 Vehicles | 59 (18.7%) | 61 (16.5%) |
| 4 Vehicles | 40 (12.7%) | 25 (6.8%) |
| 5 or more Vehicles | 0 (0.0%) | 0 (0.0%) |
| Total | 316 (100.0%) | 370 (100.0%) |
Commute Time in Leland Grove
The most frequently occuring commute durations in Leland Grove are 10 to 14 minutes (235 commuters, 40.4%), 15 to 19 minutes (117 commuters, 20.1%), and 5 to 9 minutes (86 commuters, 14.8%).
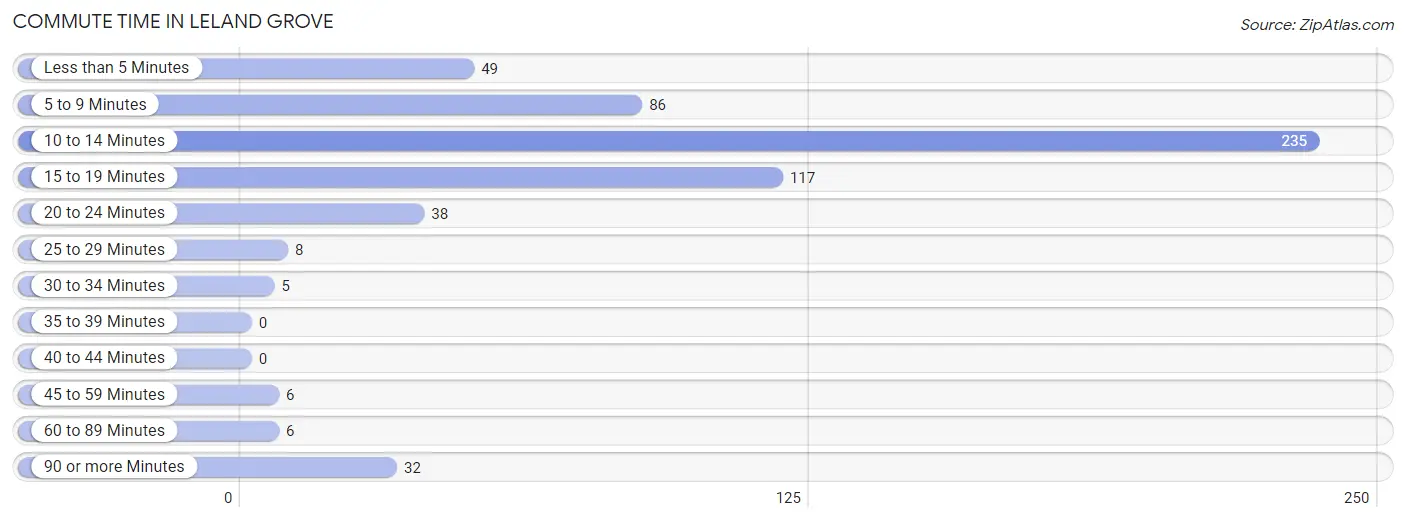
| Commute Time | # Commuters | % Commuters |
| Less than 5 Minutes | 49 | 8.4% |
| 5 to 9 Minutes | 86 | 14.8% |
| 10 to 14 Minutes | 235 | 40.4% |
| 15 to 19 Minutes | 117 | 20.1% |
| 20 to 24 Minutes | 38 | 6.5% |
| 25 to 29 Minutes | 8 | 1.4% |
| 30 to 34 Minutes | 5 | 0.9% |
| 35 to 39 Minutes | 0 | 0.0% |
| 40 to 44 Minutes | 0 | 0.0% |
| 45 to 59 Minutes | 6 | 1.0% |
| 60 to 89 Minutes | 6 | 1.0% |
| 90 or more Minutes | 32 | 5.5% |
Commute Time by Sex in Leland Grove
The most common commute times in Leland Grove are 10 to 14 minutes (95 commuters, 33.9%) for males and 10 to 14 minutes (140 commuters, 46.4%) for females.
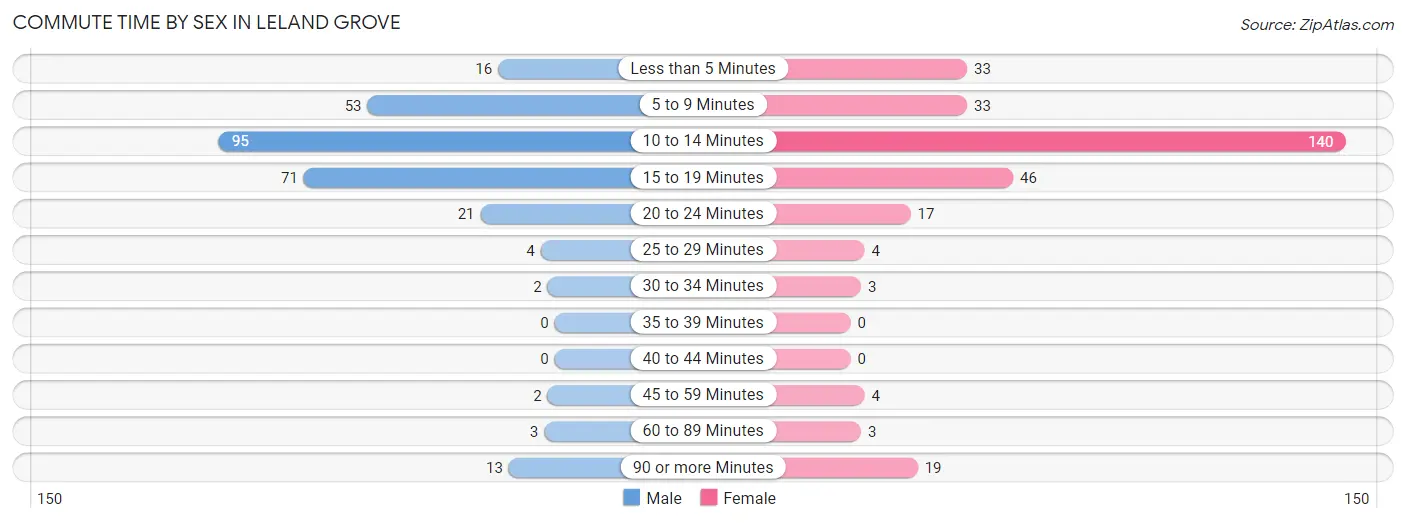
| Commute Time | Male | Female |
| Less than 5 Minutes | 16 (5.7%) | 33 (10.9%) |
| 5 to 9 Minutes | 53 (18.9%) | 33 (10.9%) |
| 10 to 14 Minutes | 95 (33.9%) | 140 (46.4%) |
| 15 to 19 Minutes | 71 (25.4%) | 46 (15.2%) |
| 20 to 24 Minutes | 21 (7.5%) | 17 (5.6%) |
| 25 to 29 Minutes | 4 (1.4%) | 4 (1.3%) |
| 30 to 34 Minutes | 2 (0.7%) | 3 (1.0%) |
| 35 to 39 Minutes | 0 (0.0%) | 0 (0.0%) |
| 40 to 44 Minutes | 0 (0.0%) | 0 (0.0%) |
| 45 to 59 Minutes | 2 (0.7%) | 4 (1.3%) |
| 60 to 89 Minutes | 3 (1.1%) | 3 (1.0%) |
| 90 or more Minutes | 13 (4.6%) | 19 (6.3%) |
Time of Departure to Work by Sex in Leland Grove
The most frequent times of departure to work in Leland Grove are 8:00 AM to 8:29 AM (94, 33.6%) for males and 8:00 AM to 8:29 AM (62, 20.5%) for females.
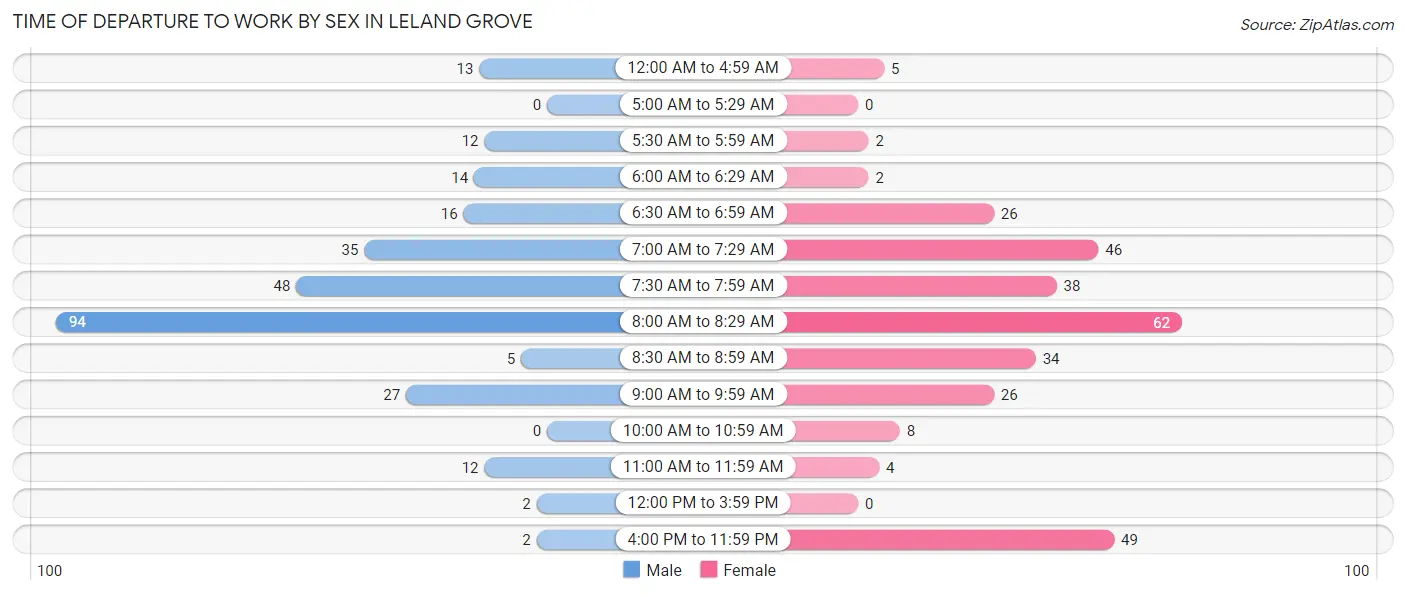
| Time of Departure | Male | Female |
| 12:00 AM to 4:59 AM | 13 (4.6%) | 5 (1.7%) |
| 5:00 AM to 5:29 AM | 0 (0.0%) | 0 (0.0%) |
| 5:30 AM to 5:59 AM | 12 (4.3%) | 2 (0.7%) |
| 6:00 AM to 6:29 AM | 14 (5.0%) | 2 (0.7%) |
| 6:30 AM to 6:59 AM | 16 (5.7%) | 26 (8.6%) |
| 7:00 AM to 7:29 AM | 35 (12.5%) | 46 (15.2%) |
| 7:30 AM to 7:59 AM | 48 (17.1%) | 38 (12.6%) |
| 8:00 AM to 8:29 AM | 94 (33.6%) | 62 (20.5%) |
| 8:30 AM to 8:59 AM | 5 (1.8%) | 34 (11.3%) |
| 9:00 AM to 9:59 AM | 27 (9.6%) | 26 (8.6%) |
| 10:00 AM to 10:59 AM | 0 (0.0%) | 8 (2.6%) |
| 11:00 AM to 11:59 AM | 12 (4.3%) | 4 (1.3%) |
| 12:00 PM to 3:59 PM | 2 (0.7%) | 0 (0.0%) |
| 4:00 PM to 11:59 PM | 2 (0.7%) | 49 (16.2%) |
| Total | 280 (100.0%) | 302 (100.0%) |
Housing Occupancy in Leland Grove
Occupancy by Ownership in Leland Grove
Of the total 688 dwellings in Leland Grove, owner-occupied units account for 645 (93.8%), while renter-occupied units make up 43 (6.2%).
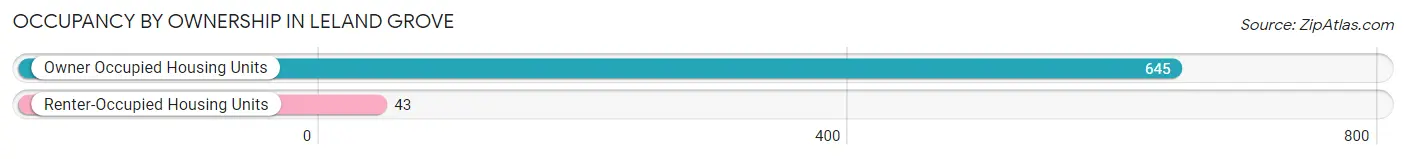
| Occupancy | # Housing Units | % Housing Units |
| Owner Occupied Housing Units | 645 | 93.8% |
| Renter-Occupied Housing Units | 43 | 6.2% |
| Total Occupied Housing Units | 688 | 100.0% |
Occupancy by Household Size in Leland Grove
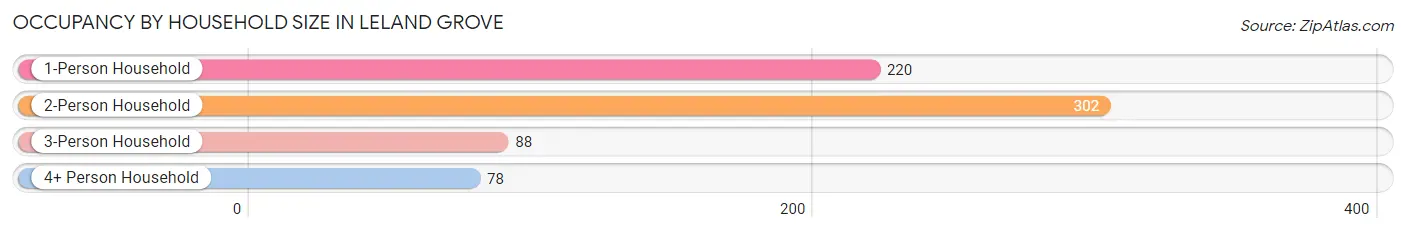
| Household Size | # Housing Units | % Housing Units |
| 1-Person Household | 220 | 32.0% |
| 2-Person Household | 302 | 43.9% |
| 3-Person Household | 88 | 12.8% |
| 4+ Person Household | 78 | 11.3% |
| Total Housing Units | 688 | 100.0% |
Occupancy by Ownership by Household Size in Leland Grove
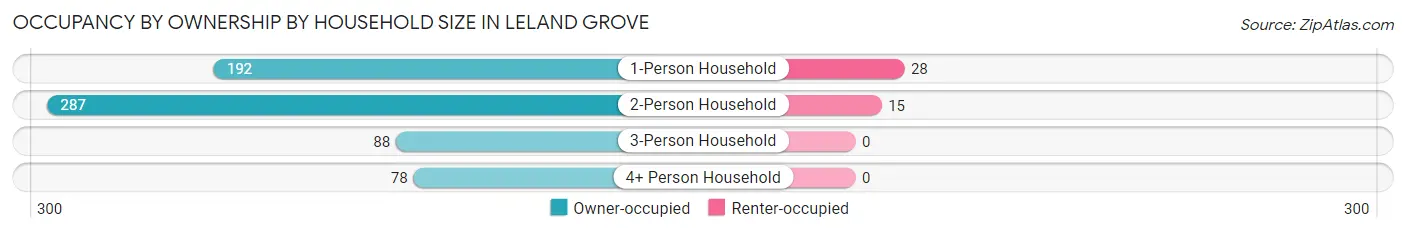
| Household Size | Owner-occupied | Renter-occupied |
| 1-Person Household | 192 (87.3%) | 28 (12.7%) |
| 2-Person Household | 287 (95.0%) | 15 (5.0%) |
| 3-Person Household | 88 (100.0%) | 0 (0.0%) |
| 4+ Person Household | 78 (100.0%) | 0 (0.0%) |
| Total Housing Units | 645 (93.8%) | 43 (6.2%) |
Occupancy by Educational Attainment in Leland Grove
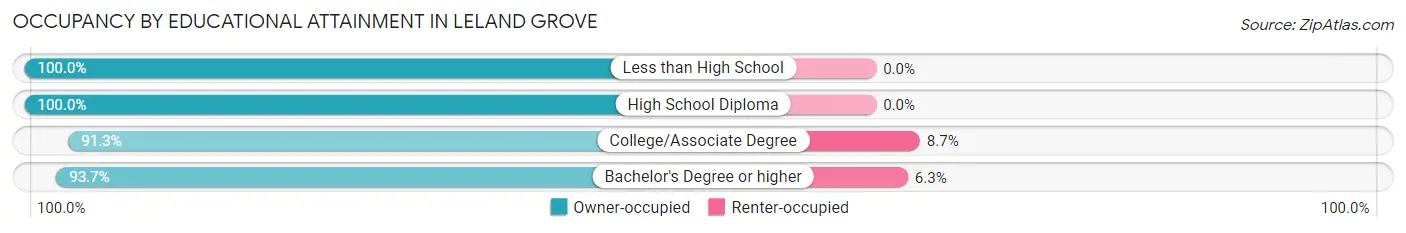
| Household Size | Owner-occupied | Renter-occupied |
| Less than High School | 18 (100.0%) | 0 (0.0%) |
| High School Diploma | 43 (100.0%) | 0 (0.0%) |
| College/Associate Degree | 137 (91.3%) | 13 (8.7%) |
| Bachelor's Degree or higher | 447 (93.7%) | 30 (6.3%) |
Occupancy by Age of Householder in Leland Grove
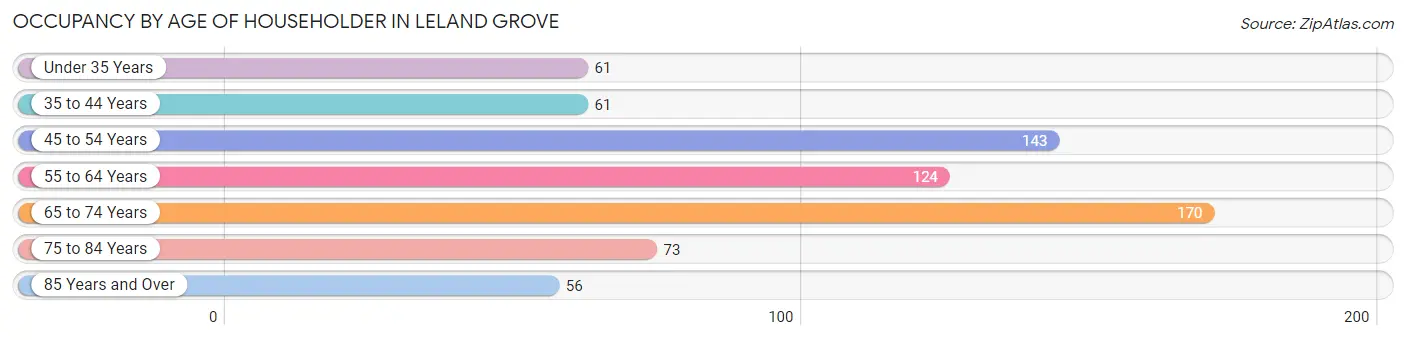
| Age Bracket | # Households | % Households |
| Under 35 Years | 61 | 8.9% |
| 35 to 44 Years | 61 | 8.9% |
| 45 to 54 Years | 143 | 20.8% |
| 55 to 64 Years | 124 | 18.0% |
| 65 to 74 Years | 170 | 24.7% |
| 75 to 84 Years | 73 | 10.6% |
| 85 Years and Over | 56 | 8.1% |
| Total | 688 | 100.0% |
Housing Finances in Leland Grove
Median Income by Occupancy in Leland Grove
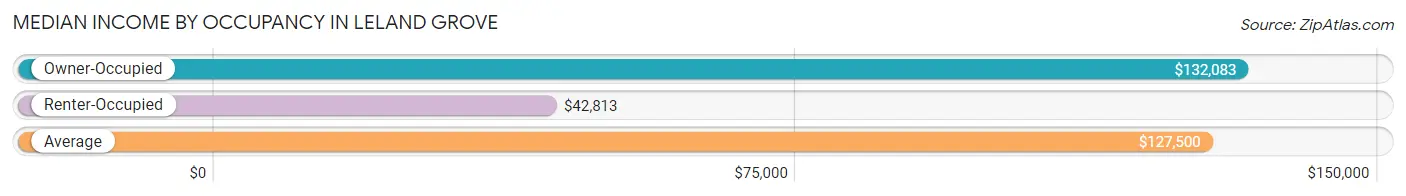
| Occupancy Type | # Households | Median Income |
| Owner-Occupied | 645 (93.8%) | $132,083 |
| Renter-Occupied | 43 (6.2%) | $42,813 |
| Average | 688 (100.0%) | $127,500 |
Occupancy by Householder Income Bracket in Leland Grove
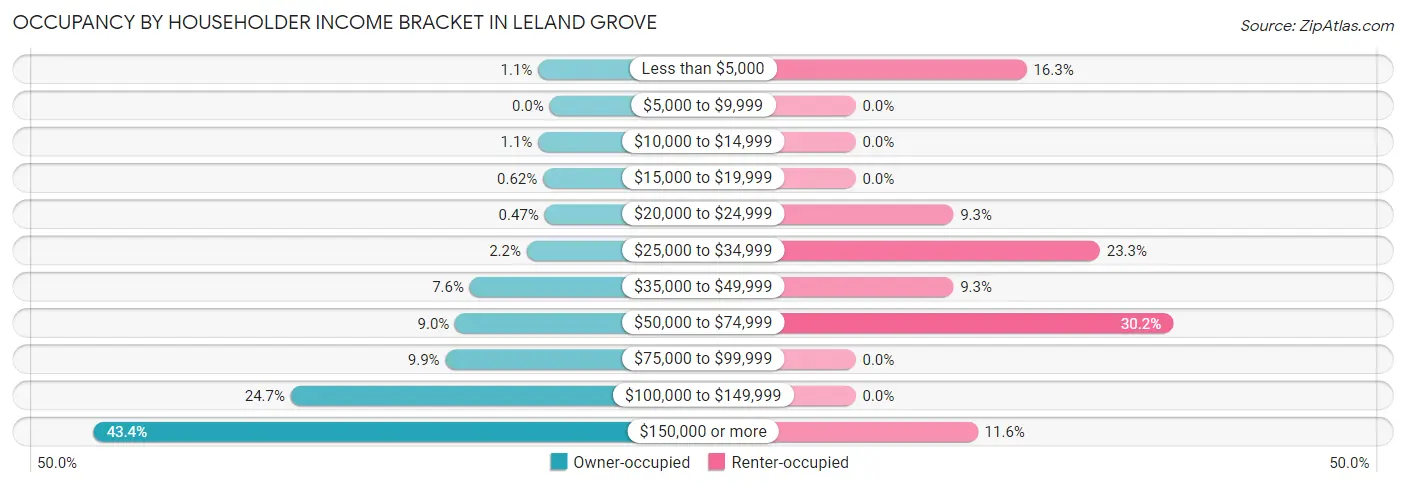
| Income Bracket | Owner-occupied | Renter-occupied |
| Less than $5,000 | 7 (1.1%) | 7 (16.3%) |
| $5,000 to $9,999 | 0 (0.0%) | 0 (0.0%) |
| $10,000 to $14,999 | 7 (1.1%) | 0 (0.0%) |
| $15,000 to $19,999 | 4 (0.6%) | 0 (0.0%) |
| $20,000 to $24,999 | 3 (0.5%) | 4 (9.3%) |
| $25,000 to $34,999 | 14 (2.2%) | 10 (23.3%) |
| $35,000 to $49,999 | 49 (7.6%) | 4 (9.3%) |
| $50,000 to $74,999 | 58 (9.0%) | 13 (30.2%) |
| $75,000 to $99,999 | 64 (9.9%) | 0 (0.0%) |
| $100,000 to $149,999 | 159 (24.6%) | 0 (0.0%) |
| $150,000 or more | 280 (43.4%) | 5 (11.6%) |
| Total | 645 (100.0%) | 43 (100.0%) |
Monthly Housing Cost Tiers in Leland Grove
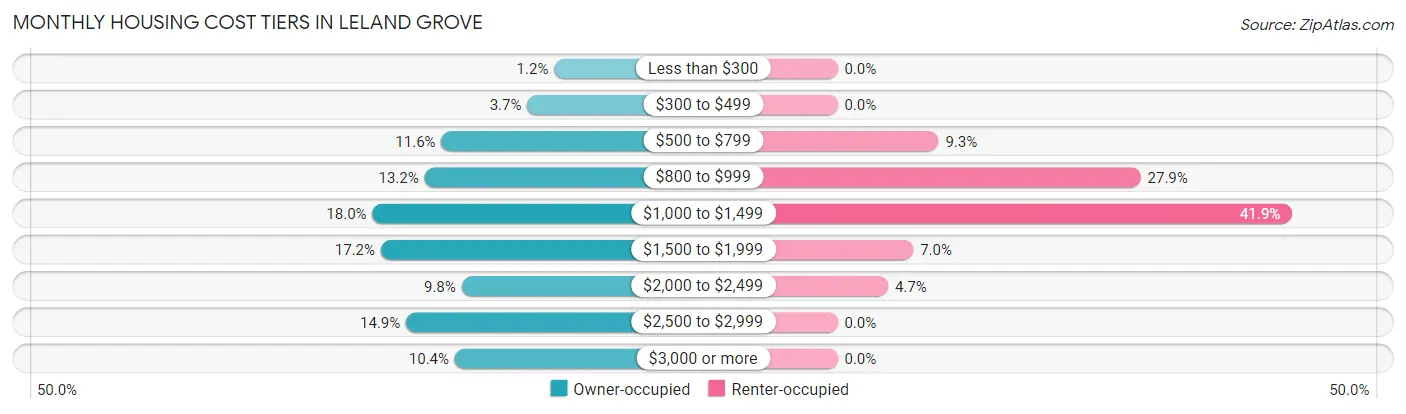
| Monthly Cost | Owner-occupied | Renter-occupied |
| Less than $300 | 8 (1.2%) | 0 (0.0%) |
| $300 to $499 | 24 (3.7%) | 0 (0.0%) |
| $500 to $799 | 75 (11.6%) | 4 (9.3%) |
| $800 to $999 | 85 (13.2%) | 12 (27.9%) |
| $1,000 to $1,499 | 116 (18.0%) | 18 (41.9%) |
| $1,500 to $1,999 | 111 (17.2%) | 3 (7.0%) |
| $2,000 to $2,499 | 63 (9.8%) | 2 (4.6%) |
| $2,500 to $2,999 | 96 (14.9%) | 0 (0.0%) |
| $3,000 or more | 67 (10.4%) | 0 (0.0%) |
| Total | 645 (100.0%) | 43 (100.0%) |
Physical Housing Characteristics in Leland Grove
Housing Structures in Leland Grove
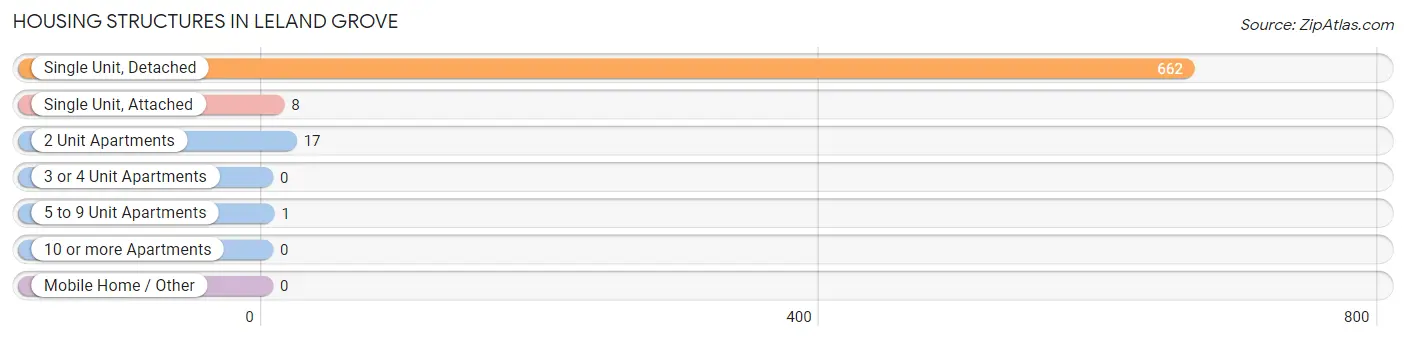
| Structure Type | # Housing Units | % Housing Units |
| Single Unit, Detached | 662 | 96.2% |
| Single Unit, Attached | 8 | 1.2% |
| 2 Unit Apartments | 17 | 2.5% |
| 3 or 4 Unit Apartments | 0 | 0.0% |
| 5 to 9 Unit Apartments | 1 | 0.2% |
| 10 or more Apartments | 0 | 0.0% |
| Mobile Home / Other | 0 | 0.0% |
| Total | 688 | 100.0% |
Housing Structures by Occupancy in Leland Grove
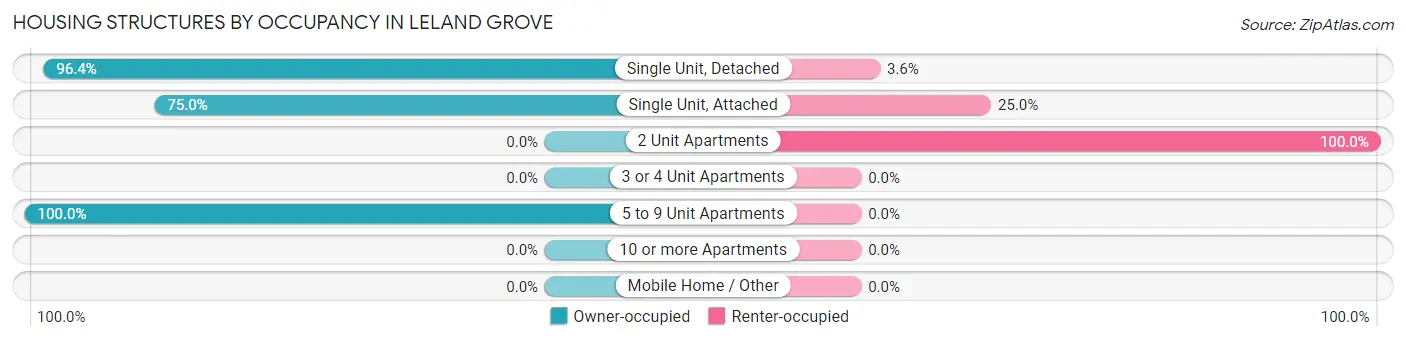
| Structure Type | Owner-occupied | Renter-occupied |
| Single Unit, Detached | 638 (96.4%) | 24 (3.6%) |
| Single Unit, Attached | 6 (75.0%) | 2 (25.0%) |
| 2 Unit Apartments | 0 (0.0%) | 17 (100.0%) |
| 3 or 4 Unit Apartments | 0 (0.0%) | 0 (0.0%) |
| 5 to 9 Unit Apartments | 1 (100.0%) | 0 (0.0%) |
| 10 or more Apartments | 0 (0.0%) | 0 (0.0%) |
| Mobile Home / Other | 0 (0.0%) | 0 (0.0%) |
| Total | 645 (93.8%) | 43 (6.2%) |
Housing Structures by Number of Rooms in Leland Grove
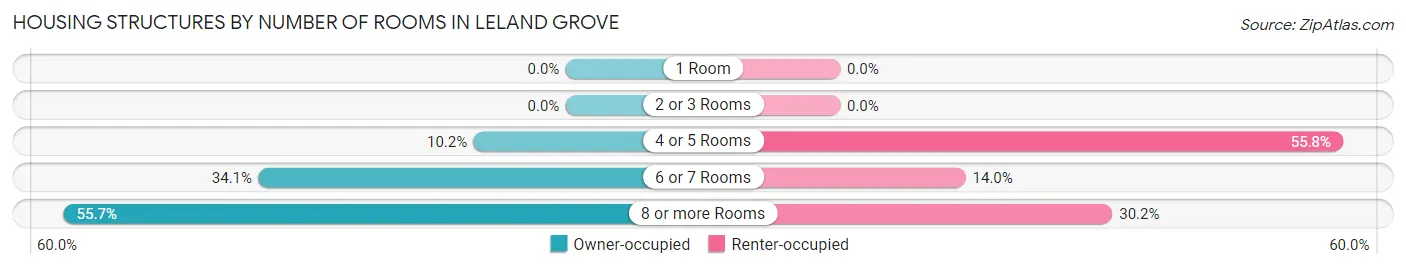
| Number of Rooms | Owner-occupied | Renter-occupied |
| 1 Room | 0 (0.0%) | 0 (0.0%) |
| 2 or 3 Rooms | 0 (0.0%) | 0 (0.0%) |
| 4 or 5 Rooms | 66 (10.2%) | 24 (55.8%) |
| 6 or 7 Rooms | 220 (34.1%) | 6 (14.0%) |
| 8 or more Rooms | 359 (55.7%) | 13 (30.2%) |
| Total | 645 (100.0%) | 43 (100.0%) |
Housing Structure by Heating Type in Leland Grove
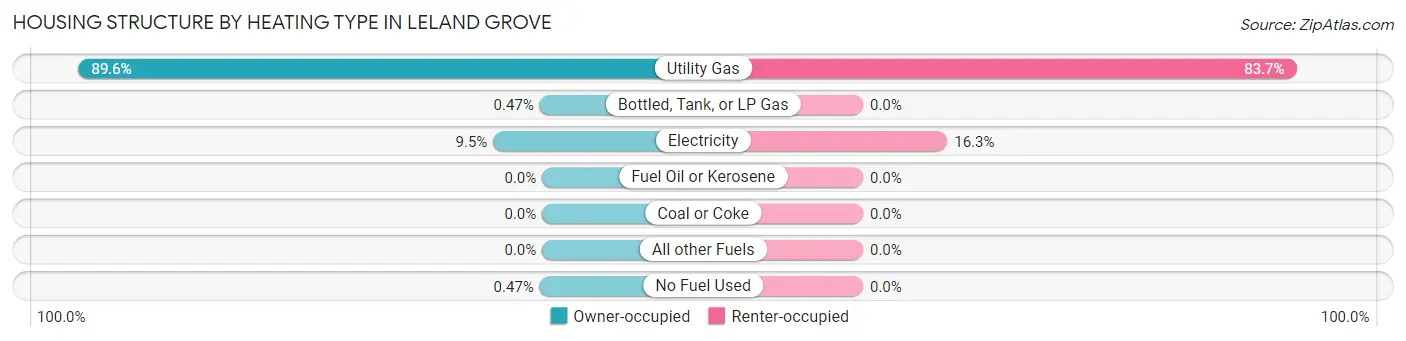
| Heating Type | Owner-occupied | Renter-occupied |
| Utility Gas | 578 (89.6%) | 36 (83.7%) |
| Bottled, Tank, or LP Gas | 3 (0.5%) | 0 (0.0%) |
| Electricity | 61 (9.5%) | 7 (16.3%) |
| Fuel Oil or Kerosene | 0 (0.0%) | 0 (0.0%) |
| Coal or Coke | 0 (0.0%) | 0 (0.0%) |
| All other Fuels | 0 (0.0%) | 0 (0.0%) |
| No Fuel Used | 3 (0.5%) | 0 (0.0%) |
| Total | 645 (100.0%) | 43 (100.0%) |
Household Vehicle Usage in Leland Grove
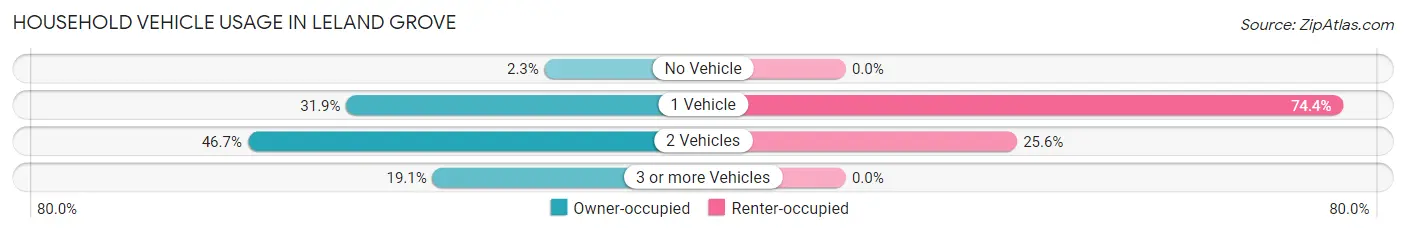
| Vehicles per Household | Owner-occupied | Renter-occupied |
| No Vehicle | 15 (2.3%) | 0 (0.0%) |
| 1 Vehicle | 206 (31.9%) | 32 (74.4%) |
| 2 Vehicles | 301 (46.7%) | 11 (25.6%) |
| 3 or more Vehicles | 123 (19.1%) | 0 (0.0%) |
| Total | 645 (100.0%) | 43 (100.0%) |
Real Estate & Mortgages in Leland Grove
Real Estate and Mortgage Overview in Leland Grove
| Characteristic | Without Mortgage | With Mortgage |
| Housing Units | 292 | 353 |
| Median Property Value | $262,500 | $274,300 |
| Median Household Income | $111,667 | $168 |
| Monthly Housing Costs | $947 | $63 |
| Real Estate Taxes | $6,199 | $0 |
Property Value by Mortgage Status in Leland Grove
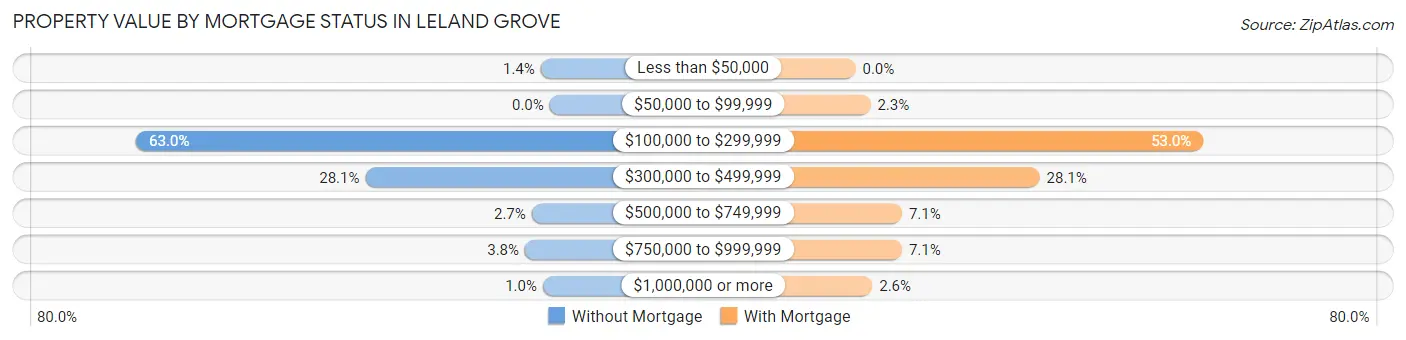
| Property Value | Without Mortgage | With Mortgage |
| Less than $50,000 | 4 (1.4%) | 0 (0.0%) |
| $50,000 to $99,999 | 0 (0.0%) | 8 (2.3%) |
| $100,000 to $299,999 | 184 (63.0%) | 187 (53.0%) |
| $300,000 to $499,999 | 82 (28.1%) | 99 (28.1%) |
| $500,000 to $749,999 | 8 (2.7%) | 25 (7.1%) |
| $750,000 to $999,999 | 11 (3.8%) | 25 (7.1%) |
| $1,000,000 or more | 3 (1.0%) | 9 (2.5%) |
| Total | 292 (100.0%) | 353 (100.0%) |
Household Income by Mortgage Status in Leland Grove
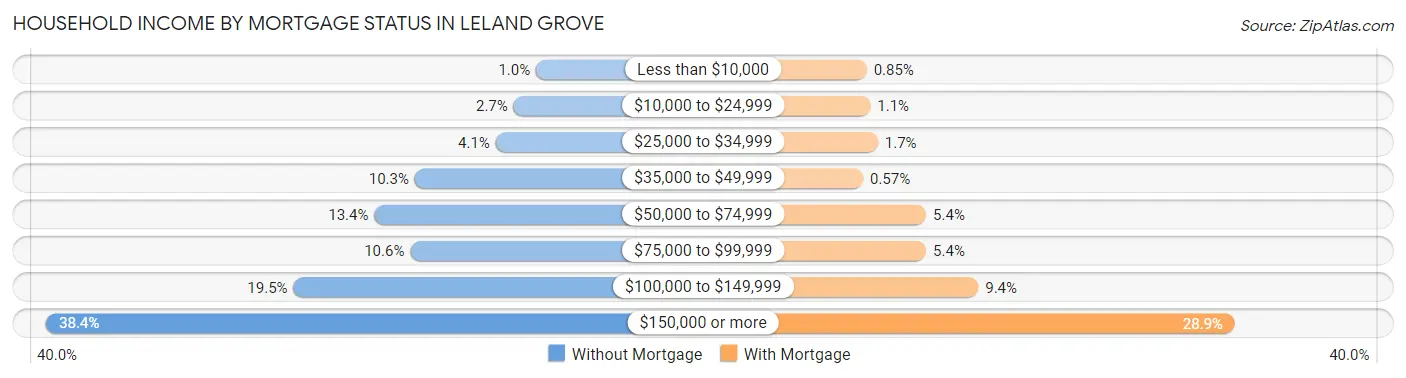
| Household Income | Without Mortgage | With Mortgage |
| Less than $10,000 | 3 (1.0%) | 3 (0.9%) |
| $10,000 to $24,999 | 8 (2.7%) | 4 (1.1%) |
| $25,000 to $34,999 | 12 (4.1%) | 6 (1.7%) |
| $35,000 to $49,999 | 30 (10.3%) | 2 (0.6%) |
| $50,000 to $74,999 | 39 (13.4%) | 19 (5.4%) |
| $75,000 to $99,999 | 31 (10.6%) | 19 (5.4%) |
| $100,000 to $149,999 | 57 (19.5%) | 33 (9.3%) |
| $150,000 or more | 112 (38.4%) | 102 (28.9%) |
| Total | 292 (100.0%) | 353 (100.0%) |
Property Value to Household Income Ratio in Leland Grove
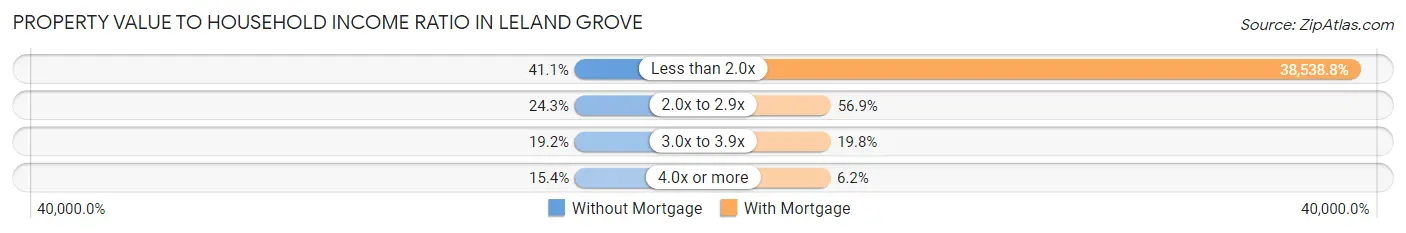
| Value-to-Income Ratio | Without Mortgage | With Mortgage |
| Less than 2.0x | 120 (41.1%) | 136,042 (38,538.8%) |
| 2.0x to 2.9x | 71 (24.3%) | 201 (56.9%) |
| 3.0x to 3.9x | 56 (19.2%) | 70 (19.8%) |
| 4.0x or more | 45 (15.4%) | 22 (6.2%) |
| Total | 292 (100.0%) | 353 (100.0%) |
Real Estate Taxes by Mortgage Status in Leland Grove
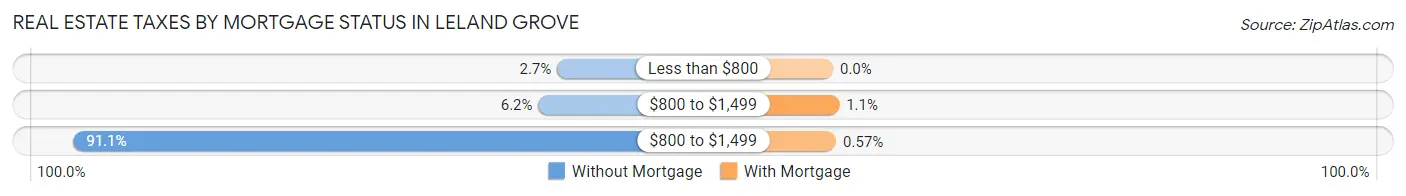
| Property Taxes | Without Mortgage | With Mortgage |
| Less than $800 | 8 (2.7%) | 0 (0.0%) |
| $800 to $1,499 | 18 (6.2%) | 4 (1.1%) |
| $800 to $1,499 | 266 (91.1%) | 2 (0.6%) |
| Total | 292 (100.0%) | 353 (100.0%) |
Health & Disability in Leland Grove
Health Insurance Coverage by Age in Leland Grove
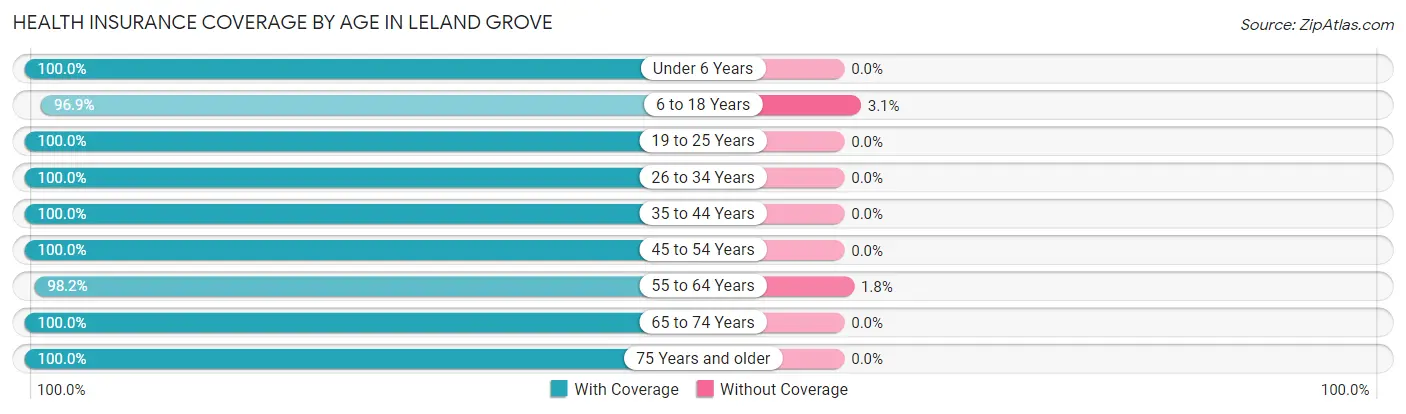
| Age Bracket | With Coverage | Without Coverage |
| Under 6 Years | 77 (100.0%) | 0 (0.0%) |
| 6 to 18 Years | 189 (96.9%) | 6 (3.1%) |
| 19 to 25 Years | 63 (100.0%) | 0 (0.0%) |
| 26 to 34 Years | 74 (100.0%) | 0 (0.0%) |
| 35 to 44 Years | 134 (100.0%) | 0 (0.0%) |
| 45 to 54 Years | 274 (100.0%) | 0 (0.0%) |
| 55 to 64 Years | 217 (98.2%) | 4 (1.8%) |
| 65 to 74 Years | 248 (100.0%) | 0 (0.0%) |
| 75 Years and older | 192 (100.0%) | 0 (0.0%) |
| Total | 1,468 (99.3%) | 10 (0.7%) |
Health Insurance Coverage by Citizenship Status in Leland Grove
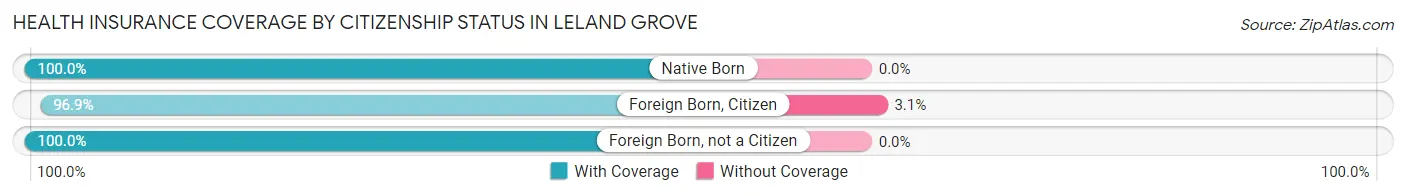
| Citizenship Status | With Coverage | Without Coverage |
| Native Born | 77 (100.0%) | 0 (0.0%) |
| Foreign Born, Citizen | 189 (96.9%) | 6 (3.1%) |
| Foreign Born, not a Citizen | 63 (100.0%) | 0 (0.0%) |
Health Insurance Coverage by Household Income in Leland Grove
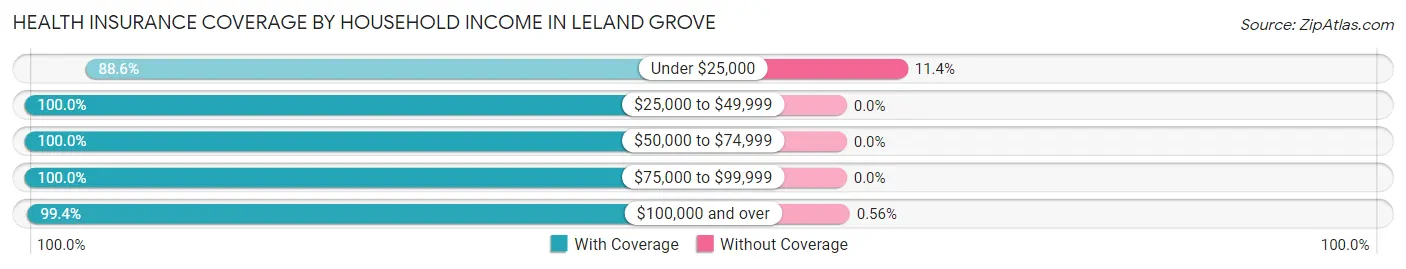
| Household Income | With Coverage | Without Coverage |
| Under $25,000 | 31 (88.6%) | 4 (11.4%) |
| $25,000 to $49,999 | 102 (100.0%) | 0 (0.0%) |
| $50,000 to $74,999 | 152 (100.0%) | 0 (0.0%) |
| $75,000 to $99,999 | 110 (100.0%) | 0 (0.0%) |
| $100,000 and over | 1,065 (99.4%) | 6 (0.6%) |
Public vs Private Health Insurance Coverage by Age in Leland Grove
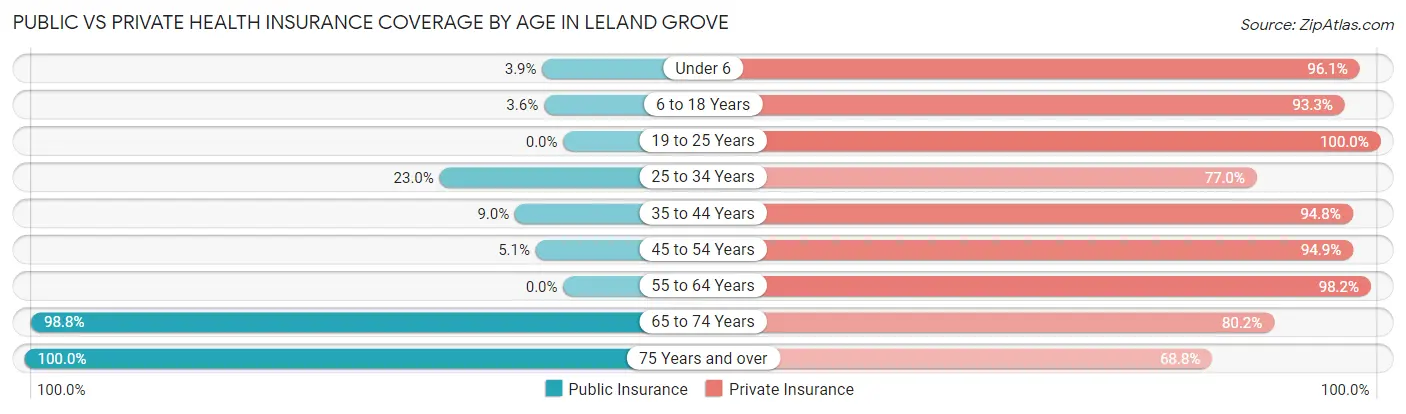
| Age Bracket | Public Insurance | Private Insurance |
| Under 6 | 3 (3.9%) | 74 (96.1%) |
| 6 to 18 Years | 7 (3.6%) | 182 (93.3%) |
| 19 to 25 Years | 0 (0.0%) | 63 (100.0%) |
| 25 to 34 Years | 17 (23.0%) | 57 (77.0%) |
| 35 to 44 Years | 12 (9.0%) | 127 (94.8%) |
| 45 to 54 Years | 14 (5.1%) | 260 (94.9%) |
| 55 to 64 Years | 0 (0.0%) | 217 (98.2%) |
| 65 to 74 Years | 245 (98.8%) | 199 (80.2%) |
| 75 Years and over | 192 (100.0%) | 132 (68.8%) |
| Total | 490 (33.2%) | 1,311 (88.7%) |
Disability Status by Sex by Age in Leland Grove
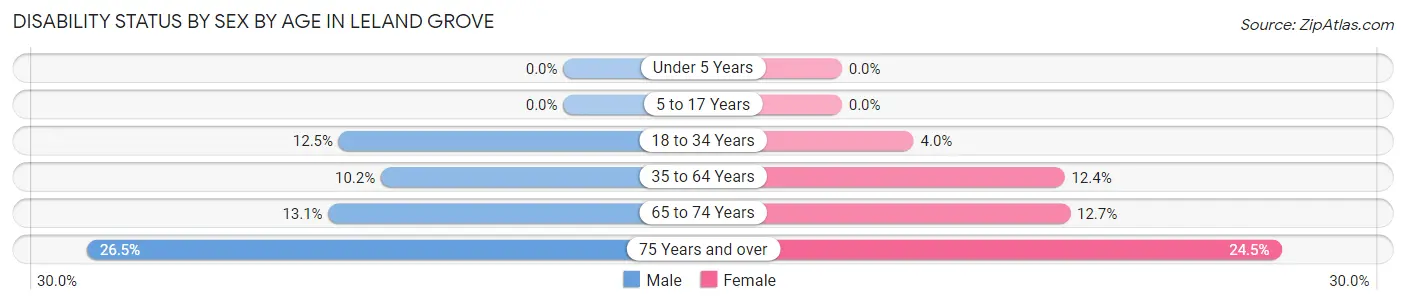
| Age Bracket | Male | Female |
| Under 5 Years | 0 (0.0%) | 0 (0.0%) |
| 5 to 17 Years | 0 (0.0%) | 0 (0.0%) |
| 18 to 34 Years | 6 (12.5%) | 4 (4.0%) |
| 35 to 64 Years | 27 (10.2%) | 45 (12.4%) |
| 65 to 74 Years | 17 (13.1%) | 15 (12.7%) |
| 75 Years and over | 26 (26.5%) | 23 (24.5%) |
Disability Class by Sex by Age in Leland Grove
Disability Class: Hearing Difficulty
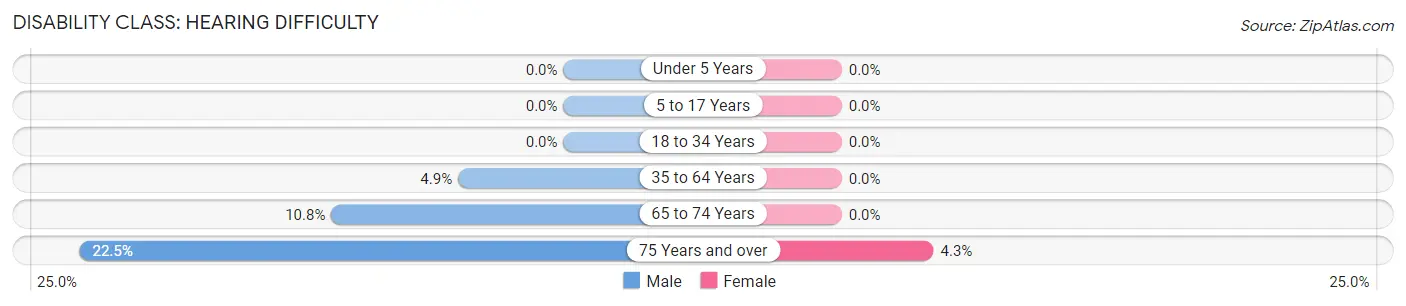
| Age Bracket | Male | Female |
| Under 5 Years | 0 (0.0%) | 0 (0.0%) |
| 5 to 17 Years | 0 (0.0%) | 0 (0.0%) |
| 18 to 34 Years | 0 (0.0%) | 0 (0.0%) |
| 35 to 64 Years | 13 (4.9%) | 0 (0.0%) |
| 65 to 74 Years | 14 (10.8%) | 0 (0.0%) |
| 75 Years and over | 22 (22.5%) | 4 (4.3%) |
Disability Class: Vision Difficulty
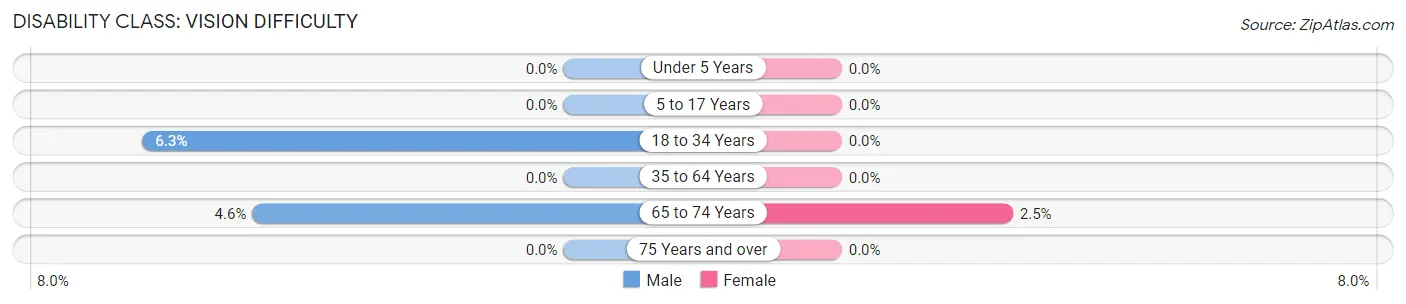
| Age Bracket | Male | Female |
| Under 5 Years | 0 (0.0%) | 0 (0.0%) |
| 5 to 17 Years | 0 (0.0%) | 0 (0.0%) |
| 18 to 34 Years | 3 (6.2%) | 0 (0.0%) |
| 35 to 64 Years | 0 (0.0%) | 0 (0.0%) |
| 65 to 74 Years | 6 (4.6%) | 3 (2.5%) |
| 75 Years and over | 0 (0.0%) | 0 (0.0%) |
Disability Class: Cognitive Difficulty
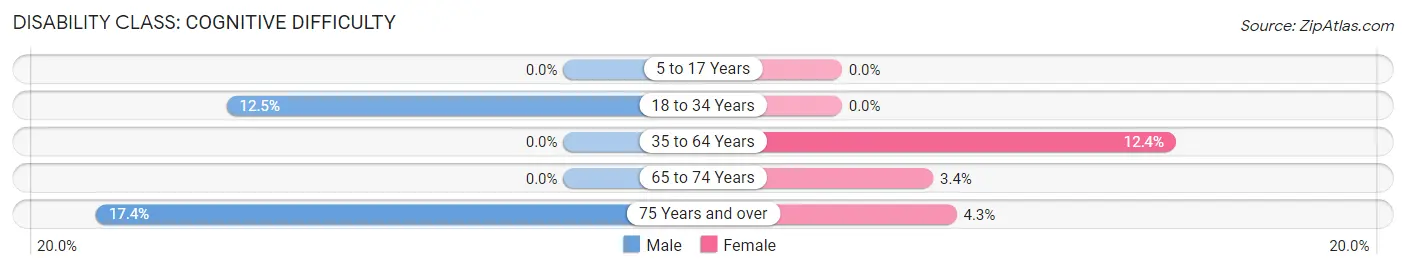
| Age Bracket | Male | Female |
| 5 to 17 Years | 0 (0.0%) | 0 (0.0%) |
| 18 to 34 Years | 6 (12.5%) | 0 (0.0%) |
| 35 to 64 Years | 0 (0.0%) | 45 (12.4%) |
| 65 to 74 Years | 0 (0.0%) | 4 (3.4%) |
| 75 Years and over | 17 (17.3%) | 4 (4.3%) |
Disability Class: Ambulatory Difficulty
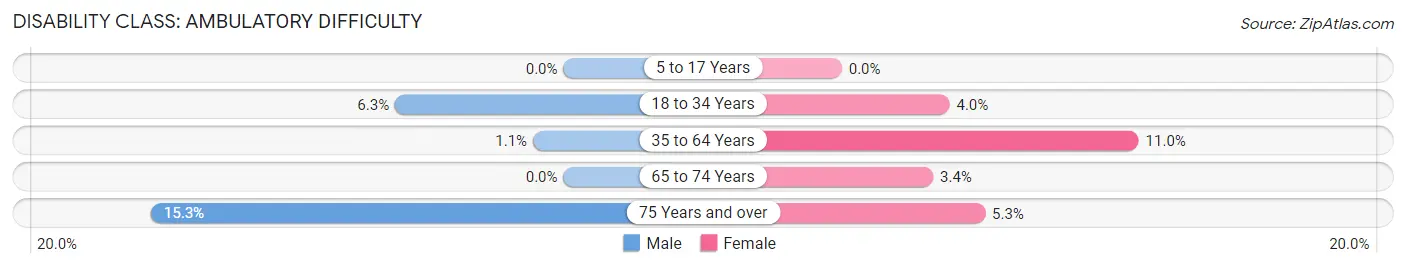
| Age Bracket | Male | Female |
| 5 to 17 Years | 0 (0.0%) | 0 (0.0%) |
| 18 to 34 Years | 3 (6.2%) | 4 (4.0%) |
| 35 to 64 Years | 3 (1.1%) | 40 (11.0%) |
| 65 to 74 Years | 0 (0.0%) | 4 (3.4%) |
| 75 Years and over | 15 (15.3%) | 5 (5.3%) |
Disability Class: Self-Care Difficulty
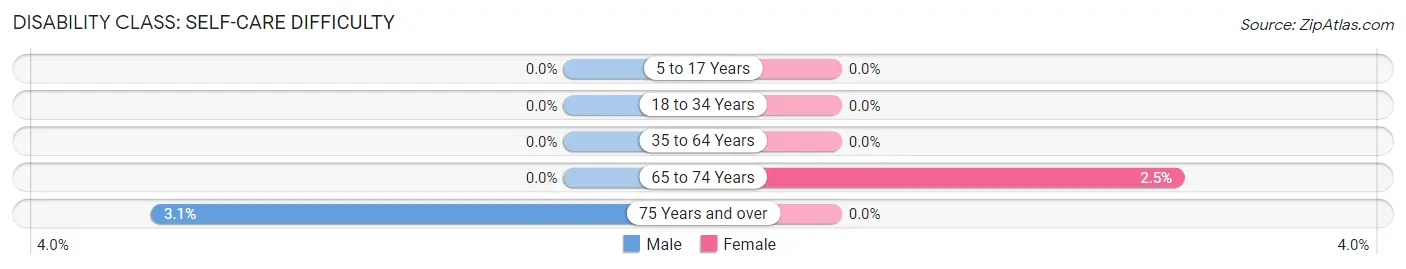
| Age Bracket | Male | Female |
| 5 to 17 Years | 0 (0.0%) | 0 (0.0%) |
| 18 to 34 Years | 0 (0.0%) | 0 (0.0%) |
| 35 to 64 Years | 0 (0.0%) | 0 (0.0%) |
| 65 to 74 Years | 0 (0.0%) | 3 (2.5%) |
| 75 Years and over | 3 (3.1%) | 0 (0.0%) |
Technology Access in Leland Grove
Computing Device Access in Leland Grove
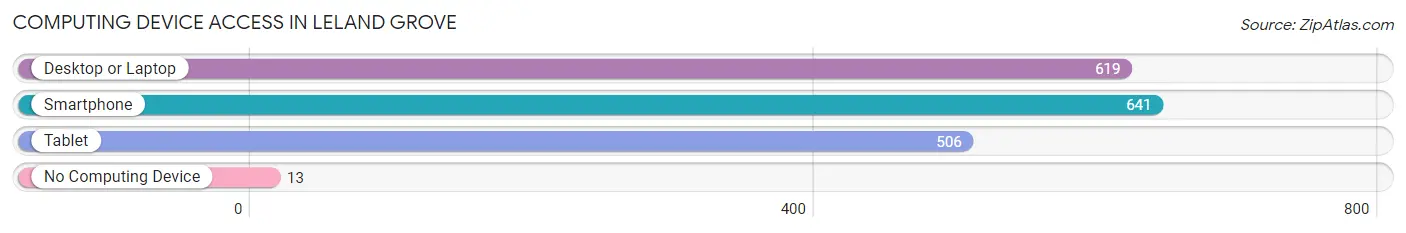
| Device Type | # Households | % Households |
| Desktop or Laptop | 619 | 90.0% |
| Smartphone | 641 | 93.2% |
| Tablet | 506 | 73.6% |
| No Computing Device | 13 | 1.9% |
| Total | 688 | 100.0% |
Internet Access in Leland Grove
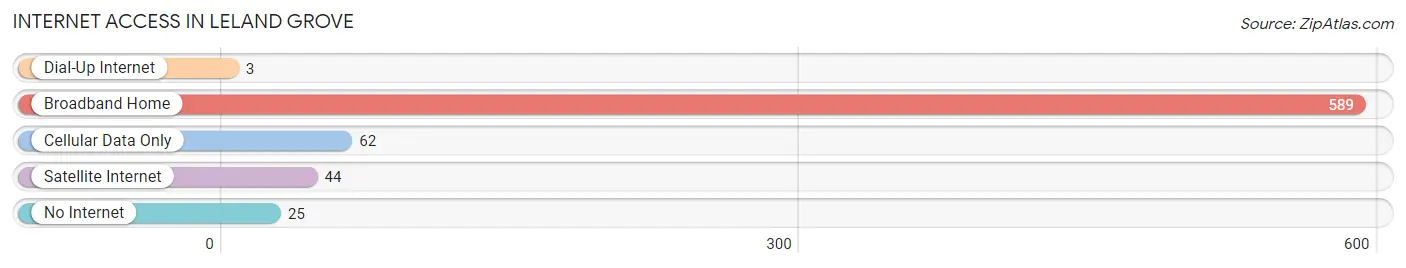
| Internet Type | # Households | % Households |
| Dial-Up Internet | 3 | 0.4% |
| Broadband Home | 589 | 85.6% |
| Cellular Data Only | 62 | 9.0% |
| Satellite Internet | 44 | 6.4% |
| No Internet | 25 | 3.6% |
| Total | 688 | 100.0% |
Leland Grove Summary
Leland Grove is a small village located in Sangamon County, Illinois. It is situated just south of the city of Springfield and is part of the Springfield Metropolitan Statistical Area. The village has a population of 1,845 as of the 2010 census.
History
Leland Grove was founded in 1871 by William Leland, a local businessman. He purchased the land from the local Native American tribes and named the village after himself. The village was incorporated in 1875 and has remained a small, rural community ever since.
The village was originally a farming community, but in the early 20th century, it began to develop into a residential area. The village was home to a number of small businesses, including a grocery store, a hardware store, and a post office.
Geography
Leland Grove is located in central Illinois, just south of the city of Springfield. It is situated in the Sangamon River Valley, which is part of the larger Illinois River Valley. The village is located on the western edge of the Sangamon River, which is a tributary of the Illinois River.
The village is located in a flat, open area with few hills or valleys. The terrain is mostly flat, with some rolling hills in the area. The village is located in a temperate climate, with hot summers and cold winters.
Economy
Leland Grove is a small, rural community with a limited economy. The village is home to a few small businesses, including a grocery store, a hardware store, and a post office. The village also has a few restaurants and bars.
The village is home to a number of small manufacturing companies, including a plastics manufacturer and a metal fabrication company. The village is also home to a number of small farms, which produce a variety of crops, including corn, soybeans, and wheat.
Demographics
As of the 2010 census, the population of Leland Grove was 1,845. The population is predominantly white, with a small minority of African Americans and Hispanics. The median household income is $45,000, and the median age is 38.
The village is home to a number of churches, including the Leland Grove United Methodist Church, the Leland Grove Baptist Church, and the Leland Grove Presbyterian Church. The village also has a public library and a number of parks and recreational facilities.
Conclusion
Leland Grove is a small, rural village located in Sangamon County, Illinois. It was founded in 1871 and has remained a small, residential community ever since. The village has a limited economy, with a few small businesses and a number of small farms. The population is predominantly white, with a small minority of African Americans and Hispanics. The village is home to a number of churches, a public library, and a number of parks and recreational facilities.
Common Questions
What is Per Capita Income in Leland Grove?
Per Capita income in Leland Grove is $93,174.
What is the Median Family Income in Leland Grove?
Median Family Income in Leland Grove is $165,000.
What is the Median Household income in Leland Grove?
Median Household Income in Leland Grove is $127,500.
What is Income or Wage Gap in Leland Grove?
Income or Wage Gap in Leland Grove is 25.5%.
Women in Leland Grove earn 74.5 cents for every dollar earned by a man.
What is Inequality or Gini Index in Leland Grove?
Inequality or Gini Index in Leland Grove is 0.52.
What is the Total Population of Leland Grove?
Total Population of Leland Grove is 1,478.
What is the Total Male Population of Leland Grove?
Total Male Population of Leland Grove is 649.
What is the Total Female Population of Leland Grove?
Total Female Population of Leland Grove is 829.
What is the Ratio of Males per 100 Females in Leland Grove?
There are 78.29 Males per 100 Females in Leland Grove.
What is the Ratio of Females per 100 Males in Leland Grove?
There are 127.73 Females per 100 Males in Leland Grove.
What is the Median Population Age in Leland Grove?
Median Population Age in Leland Grove is 50.9 Years.
What is the Average Family Size in Leland Grove
Average Family Size in Leland Grove is 2.7 People.
What is the Average Household Size in Leland Grove
Average Household Size in Leland Grove is 2.1 People.
How Large is the Labor Force in Leland Grove?
There are 705 People in the Labor Forcein in Leland Grove.
What is the Percentage of People in the Labor Force in Leland Grove?
55.8% of People are in the Labor Force in Leland Grove.
What is the Unemployment Rate in Leland Grove?
Unemployment Rate in Leland Grove is 2.3%.