Indian Head Park, IL Map & Demographics
Indian Head Park Map
Indian Head Park Overview
$72,100
PER CAPITA INCOME
$151,974
AVG FAMILY INCOME
$100,455
AVG HOUSEHOLD INCOME
3.2%
WAGE / INCOME GAP [ % ]
96.8¢/ $1
WAGE / INCOME GAP [ $ ]
0.50
INEQUALITY / GINI INDEX
4,022
TOTAL POPULATION
1,934
MALE POPULATION
2,088
FEMALE POPULATION
92.62
MALES / 100 FEMALES
107.96
FEMALES / 100 MALES
52.9
MEDIAN AGE
2.8
AVG FAMILY SIZE
2.1
AVG HOUSEHOLD SIZE
1,839
LABOR FORCE [ PEOPLE ]
54.1%
PERCENT IN LABOR FORCE
7.3%
UNEMPLOYMENT RATE
Income in Indian Head Park
Income Overview in Indian Head Park
Per Capita Income in Indian Head Park is $72,100, while median incomes of families and households are $151,974 and $100,455 respectively.
| Characteristic | Number | Measure |
| Per Capita Income | 4,022 | $72,100 |
| Median Family Income | 1,090 | $151,974 |
| Mean Family Income | 1,090 | $223,074 |
| Median Household Income | 1,800 | $100,455 |
| Mean Household Income | 1,800 | $163,343 |
| Income Deficit | 1,090 | $0 |
| Wage / Income Gap (%) | 4,022 | 3.16% |
| Wage / Income Gap ($) | 4,022 | 96.84¢ per $1 |
| Gini / Inequality Index | 4,022 | 0.50 |
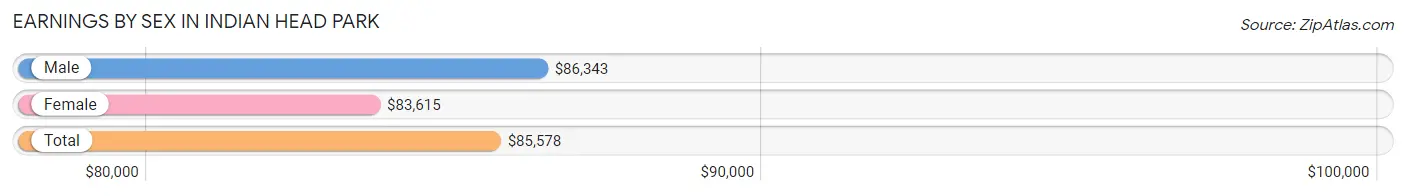
Earnings by Sex in Indian Head Park
Average Earnings in Indian Head Park are $85,578, $86,343 for men and $83,615 for women, a difference of 3.2%.
| Sex | Number | Average Earnings |
| Male | 1,026 (53.7%) | $86,343 |
| Female | 883 (46.3%) | $83,615 |
| Total | 1,909 (100.0%) | $85,578 |
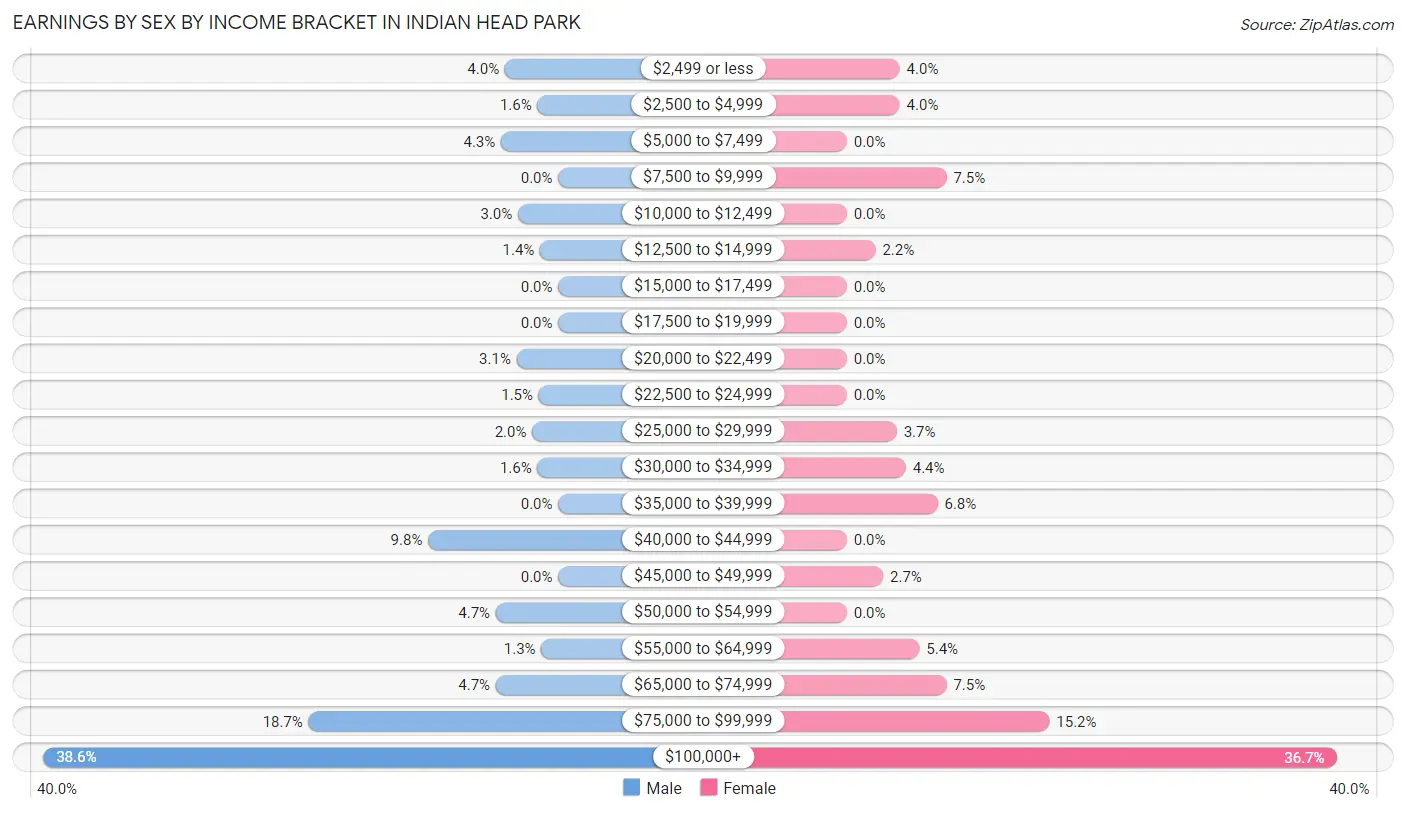
Earnings by Sex by Income Bracket in Indian Head Park
The most common earnings brackets in Indian Head Park are $100,000+ for men (396 | 38.6%) and $100,000+ for women (324 | 36.7%).
| Income | Male | Female |
| $2,499 or less | 41 (4.0%) | 35 (4.0%) |
| $2,500 to $4,999 | 16 (1.6%) | 35 (4.0%) |
| $5,000 to $7,499 | 44 (4.3%) | 0 (0.0%) |
| $7,500 to $9,999 | 0 (0.0%) | 66 (7.5%) |
| $10,000 to $12,499 | 31 (3.0%) | 0 (0.0%) |
| $12,500 to $14,999 | 14 (1.4%) | 19 (2.1%) |
| $15,000 to $17,499 | 0 (0.0%) | 0 (0.0%) |
| $17,500 to $19,999 | 0 (0.0%) | 0 (0.0%) |
| $20,000 to $22,499 | 32 (3.1%) | 0 (0.0%) |
| $22,500 to $24,999 | 15 (1.5%) | 0 (0.0%) |
| $25,000 to $29,999 | 20 (1.9%) | 33 (3.7%) |
| $30,000 to $34,999 | 16 (1.6%) | 39 (4.4%) |
| $35,000 to $39,999 | 0 (0.0%) | 60 (6.8%) |
| $40,000 to $44,999 | 100 (9.8%) | 0 (0.0%) |
| $45,000 to $49,999 | 0 (0.0%) | 24 (2.7%) |
| $50,000 to $54,999 | 48 (4.7%) | 0 (0.0%) |
| $55,000 to $64,999 | 13 (1.3%) | 48 (5.4%) |
| $65,000 to $74,999 | 48 (4.7%) | 66 (7.5%) |
| $75,000 to $99,999 | 192 (18.7%) | 134 (15.2%) |
| $100,000+ | 396 (38.6%) | 324 (36.7%) |
| Total | 1,026 (100.0%) | 883 (100.0%) |
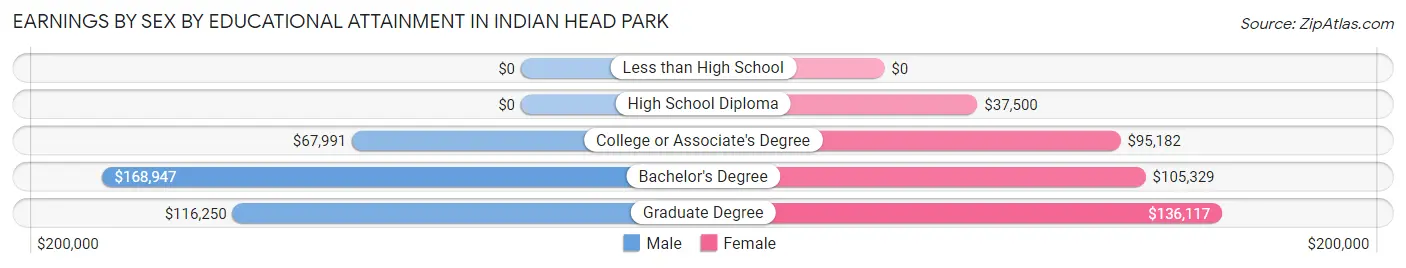
Earnings by Sex by Educational Attainment in Indian Head Park
Average earnings in Indian Head Park are $92,550 for men and $93,661 for women, a difference of 1.2%. Men with an educational attainment of bachelor's degree enjoy the highest average annual earnings of $168,947, while those with college or associate's degree education earn the least with $67,991. Women with an educational attainment of graduate degree earn the most with the average annual earnings of $136,117, while those with high school diploma education have the smallest earnings of $37,500.
| Educational Attainment | Male Income | Female Income |
| Less than High School | - | - |
| High School Diploma | - | - |
| College or Associate's Degree | $67,991 | $95,182 |
| Bachelor's Degree | $168,947 | $105,329 |
| Graduate Degree | $116,250 | $136,117 |
| Total | $92,550 | $93,661 |
Family Income in Indian Head Park
Family Income Brackets in Indian Head Park
According to the Indian Head Park family income data, there are 450 families falling into the $200,000+ income range, which is the most common income bracket and makes up 41.3% of all families.
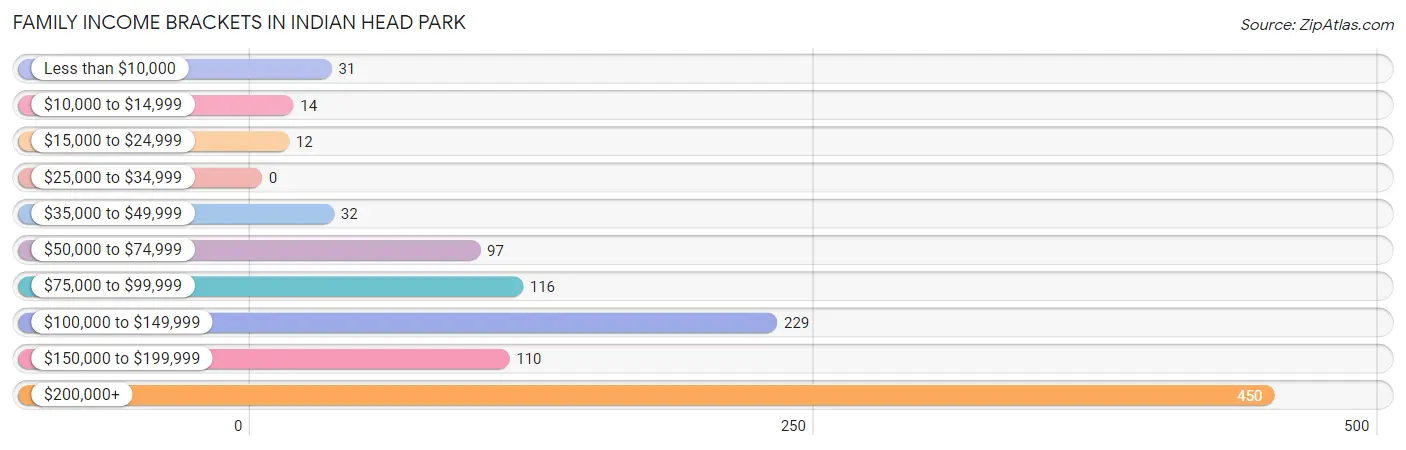
| Income Bracket | # Families | % Families |
| Less than $10,000 | 31 | 2.8% |
| $10,000 to $14,999 | 14 | 1.3% |
| $15,000 to $24,999 | 12 | 1.1% |
| $25,000 to $34,999 | 0 | 0.0% |
| $35,000 to $49,999 | 32 | 2.9% |
| $50,000 to $74,999 | 97 | 8.9% |
| $75,000 to $99,999 | 116 | 10.6% |
| $100,000 to $149,999 | 229 | 21.0% |
| $150,000 to $199,999 | 110 | 10.1% |
| $200,000+ | 450 | 41.3% |
Family Income by Famaliy Size in Indian Head Park
3-person families (403 | 37.0%) account for the highest median family income in Indian Head Park with $200,885 per family, while 3-person families (403 | 37.0%) have the highest median income of $66,962 per family member.
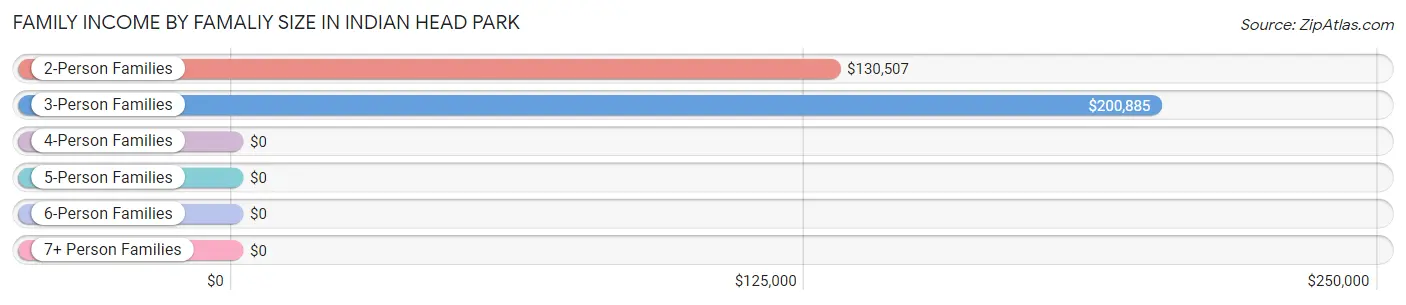
| Income Bracket | # Families | Median Income |
| 2-Person Families | 479 (43.9%) | $130,507 |
| 3-Person Families | 403 (37.0%) | $200,885 |
| 4-Person Families | 208 (19.1%) | $0 |
| 5-Person Families | 0 (0.0%) | $0 |
| 6-Person Families | 0 (0.0%) | $0 |
| 7+ Person Families | 0 (0.0%) | $0 |
| Total | 1,090 (100.0%) | $151,974 |
Family Income by Number of Earners in Indian Head Park
The median family income in Indian Head Park is $151,974, with families comprising 2 earners (475) having the highest median family income of $232,125, while families with no earners (194) have the lowest median family income of $81,000, accounting for 43.6% and 17.8% of families, respectively.
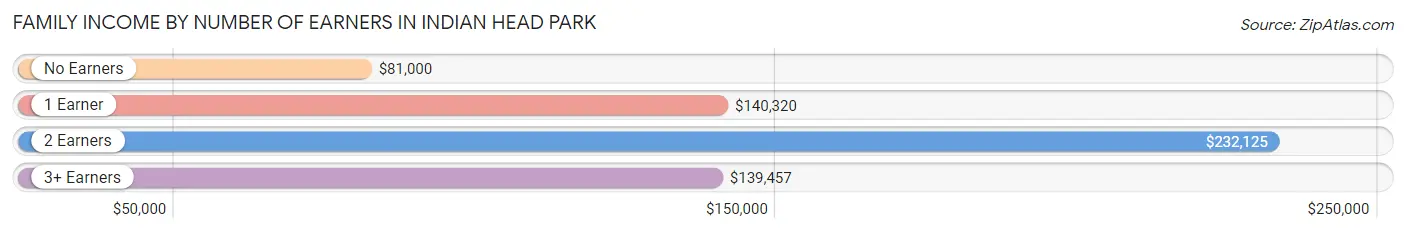
| Number of Earners | # Families | Median Income |
| No Earners | 194 (17.8%) | $81,000 |
| 1 Earner | 281 (25.8%) | $140,320 |
| 2 Earners | 475 (43.6%) | $232,125 |
| 3+ Earners | 140 (12.8%) | $139,457 |
| Total | 1,090 (100.0%) | $151,974 |
Household Income in Indian Head Park
Household Income Brackets in Indian Head Park
With 473 households falling in the category, the $200,000+ income range is the most frequent in Indian Head Park, accounting for 26.3% of all households. In contrast, only 14 households (0.8%) fall into the $10,000 to $14,999 income bracket, making it the least populous group.
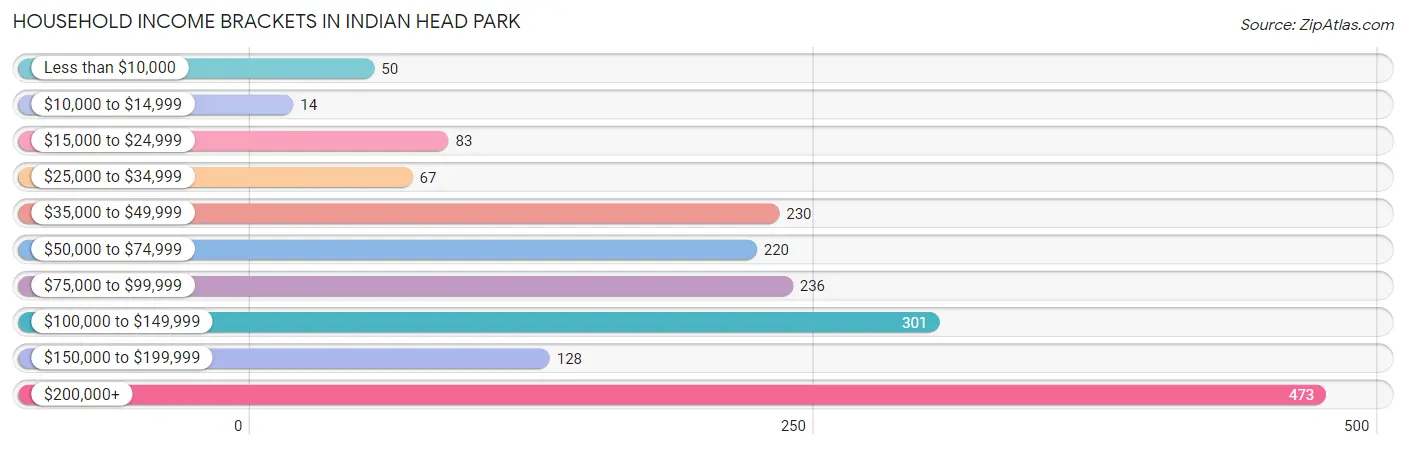
| Income Bracket | # Households | % Households |
| Less than $10,000 | 50 | 2.8% |
| $10,000 to $14,999 | 14 | 0.8% |
| $15,000 to $24,999 | 83 | 4.6% |
| $25,000 to $34,999 | 67 | 3.7% |
| $35,000 to $49,999 | 230 | 12.8% |
| $50,000 to $74,999 | 220 | 12.2% |
| $75,000 to $99,999 | 236 | 13.1% |
| $100,000 to $149,999 | 301 | 16.7% |
| $150,000 to $199,999 | 128 | 7.1% |
| $200,000+ | 473 | 26.3% |
Household Income by Householder Age in Indian Head Park
The median household income in Indian Head Park is $100,455, with the highest median household income of $200,677 found in the 25 to 44 years age bracket for the primary householder. A total of 413 households (22.9%) fall into this category.
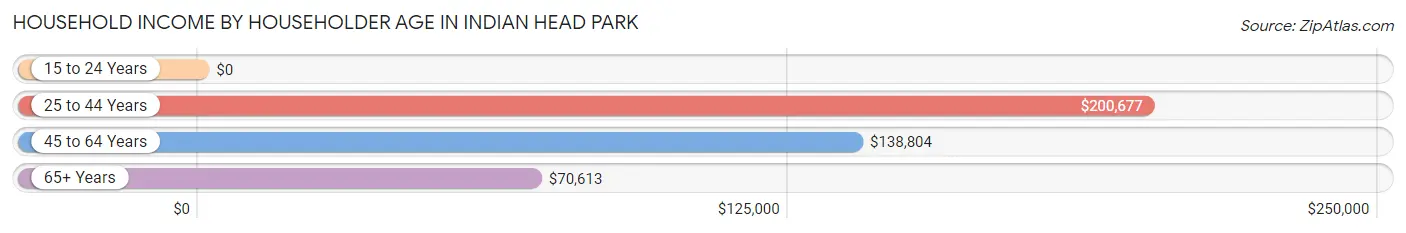
| Income Bracket | # Households | Median Income |
| 15 to 24 Years | 0 (0.0%) | $0 |
| 25 to 44 Years | 413 (22.9%) | $200,677 |
| 45 to 64 Years | 522 (29.0%) | $138,804 |
| 65+ Years | 865 (48.1%) | $70,613 |
| Total | 1,800 (100.0%) | $100,455 |
Poverty in Indian Head Park
Income Below Poverty by Sex and Age in Indian Head Park
With 6.8% poverty level for males and 5.6% for females among the residents of Indian Head Park, 12 to 14 year old males and 18 to 24 year old females are the most vulnerable to poverty, with 75 males (49.3%) and 20 females (18.2%) in their respective age groups living below the poverty level.
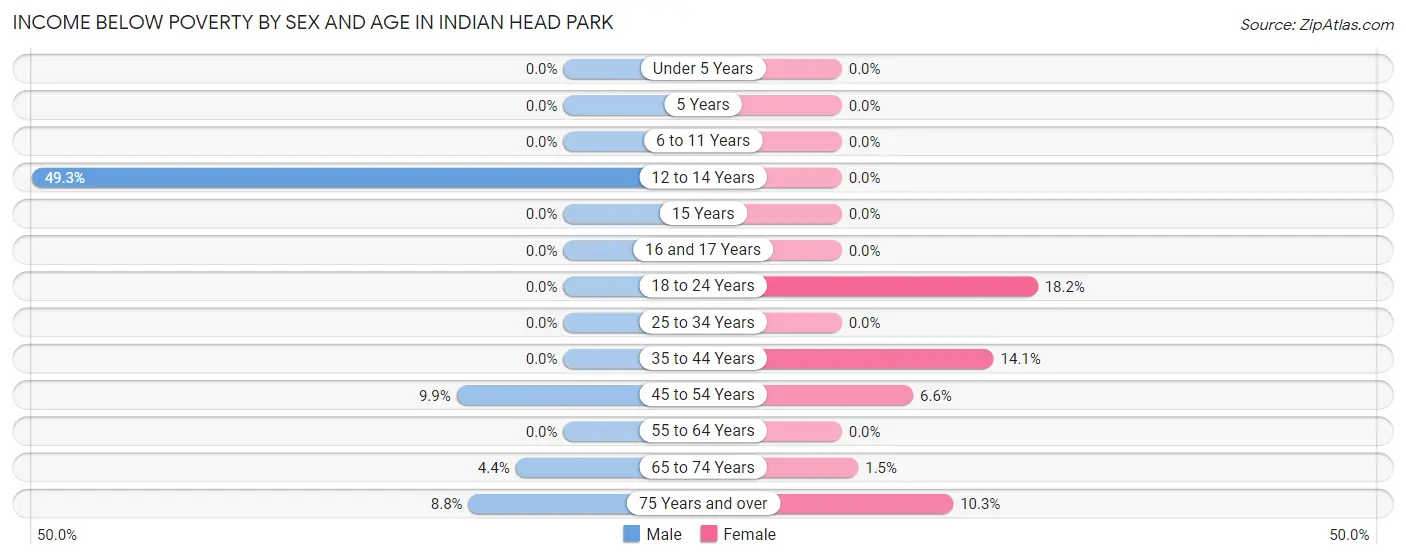
| Age Bracket | Male | Female |
| Under 5 Years | 0 (0.0%) | 0 (0.0%) |
| 5 Years | 0 (0.0%) | 0 (0.0%) |
| 6 to 11 Years | 0 (0.0%) | 0 (0.0%) |
| 12 to 14 Years | 75 (49.3%) | 0 (0.0%) |
| 15 Years | 0 (0.0%) | 0 (0.0%) |
| 16 and 17 Years | 0 (0.0%) | 0 (0.0%) |
| 18 to 24 Years | 0 (0.0%) | 20 (18.2%) |
| 25 to 34 Years | 0 (0.0%) | 0 (0.0%) |
| 35 to 44 Years | 0 (0.0%) | 31 (14.1%) |
| 45 to 54 Years | 22 (9.9%) | 19 (6.6%) |
| 55 to 64 Years | 0 (0.0%) | 0 (0.0%) |
| 65 to 74 Years | 12 (4.4%) | 7 (1.5%) |
| 75 Years and over | 14 (8.8%) | 33 (10.3%) |
| Total | 123 (6.8%) | 110 (5.6%) |
Income Above Poverty by Sex and Age in Indian Head Park
According to the poverty statistics in Indian Head Park, males aged under 5 years and females aged under 5 years are the age groups that are most secure financially, with 100.0% of males and 100.0% of females in these age groups living above the poverty line.
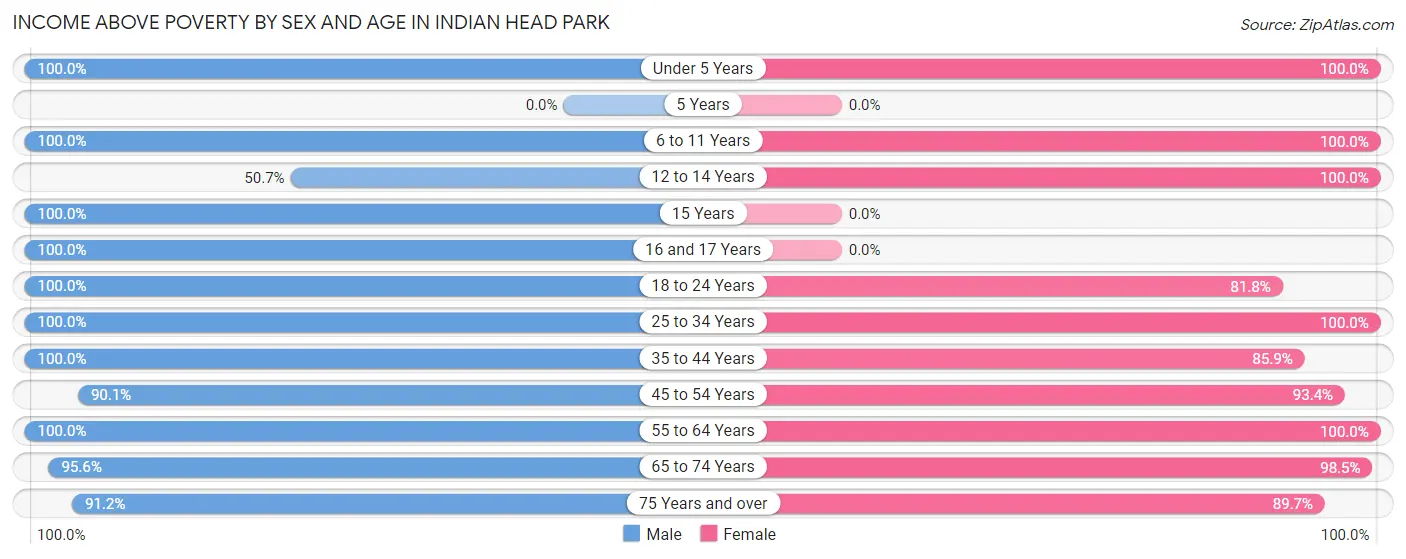
| Age Bracket | Male | Female |
| Under 5 Years | 130 (100.0%) | 97 (100.0%) |
| 5 Years | 0 (0.0%) | 0 (0.0%) |
| 6 to 11 Years | 96 (100.0%) | 114 (100.0%) |
| 12 to 14 Years | 77 (50.7%) | 14 (100.0%) |
| 15 Years | 19 (100.0%) | 0 (0.0%) |
| 16 and 17 Years | 84 (100.0%) | 0 (0.0%) |
| 18 to 24 Years | 108 (100.0%) | 90 (81.8%) |
| 25 to 34 Years | 159 (100.0%) | 131 (100.0%) |
| 35 to 44 Years | 144 (100.0%) | 189 (85.9%) |
| 45 to 54 Years | 200 (90.1%) | 268 (93.4%) |
| 55 to 64 Years | 269 (100.0%) | 208 (100.0%) |
| 65 to 74 Years | 258 (95.6%) | 452 (98.5%) |
| 75 Years and over | 145 (91.2%) | 286 (89.7%) |
| Total | 1,689 (93.2%) | 1,849 (94.4%) |
Income Below Poverty Among Married-Couple Families in Indian Head Park
The poverty statistics for married-couple families in Indian Head Park show that 2.8% or 26 of the total 941 families live below the poverty line. Families with 1 or 2 children have the highest poverty rate of 2.9%, comprising of 12 families. On the other hand, families with no children have the lowest poverty rate of 2.7%, which includes 14 families.
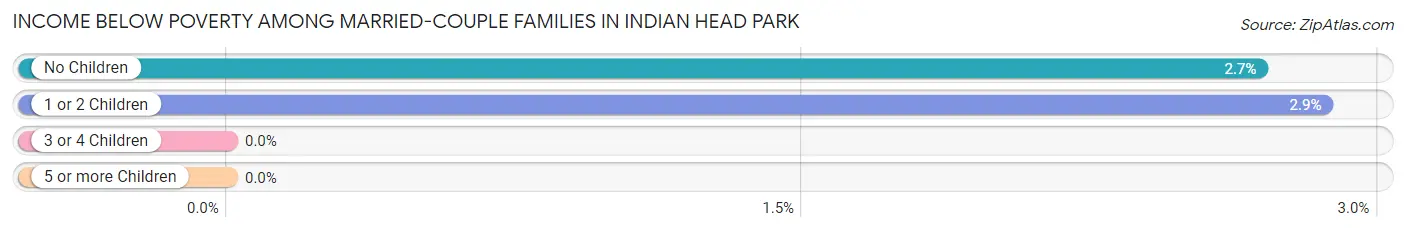
| Children | Above Poverty | Below Poverty |
| No Children | 507 (97.3%) | 14 (2.7%) |
| 1 or 2 Children | 408 (97.1%) | 12 (2.9%) |
| 3 or 4 Children | 0 (0.0%) | 0 (0.0%) |
| 5 or more Children | 0 (0.0%) | 0 (0.0%) |
| Total | 915 (97.2%) | 26 (2.8%) |
Income Below Poverty Among Single-Parent Households in Indian Head Park
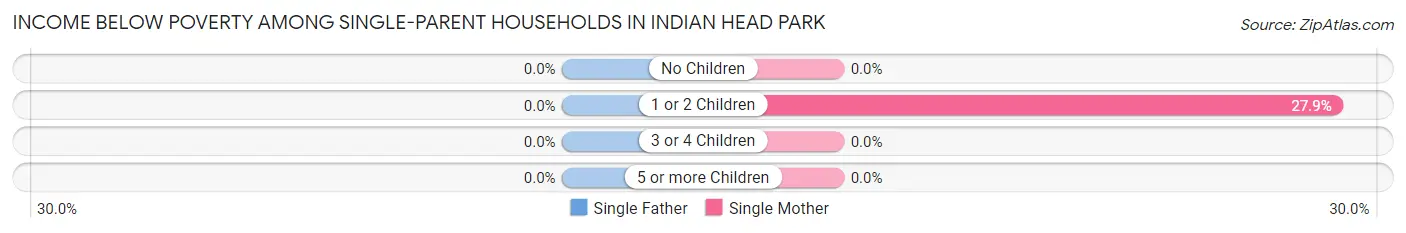
| Children | Single Father | Single Mother |
| No Children | 0 (0.0%) | 0 (0.0%) |
| 1 or 2 Children | 0 (0.0%) | 31 (27.9%) |
| 3 or 4 Children | 0 (0.0%) | 0 (0.0%) |
| 5 or more Children | 0 (0.0%) | 0 (0.0%) |
| Total | 0 (0.0%) | 31 (22.3%) |
Income Below Poverty Among Married-Couple vs Single-Parent Households in Indian Head Park
The poverty data for Indian Head Park shows that 26 of the married-couple family households (2.8%) and 31 of the single-parent households (20.8%) are living below the poverty level. Within the married-couple family households, those with 1 or 2 children have the highest poverty rate, with 12 households (2.9%) falling below the poverty line. Among the single-parent households, those with 1 or 2 children have the highest poverty rate, with 31 household (27.9%) living below poverty.
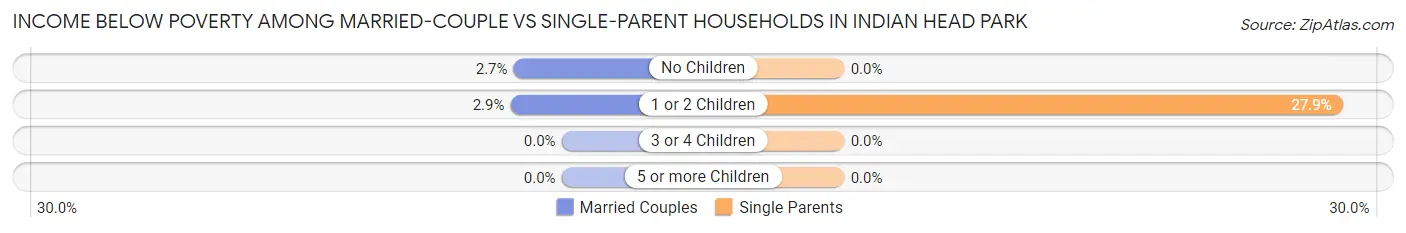
| Children | Married-Couple Families | Single-Parent Households |
| No Children | 14 (2.7%) | 0 (0.0%) |
| 1 or 2 Children | 12 (2.9%) | 31 (27.9%) |
| 3 or 4 Children | 0 (0.0%) | 0 (0.0%) |
| 5 or more Children | 0 (0.0%) | 0 (0.0%) |
| Total | 26 (2.8%) | 31 (20.8%) |
Race in Indian Head Park
The most populous races in Indian Head Park are White / Caucasian (3,671 | 91.3%), Hispanic or Latino (614 | 15.3%), and Two or more Races (139 | 3.5%).
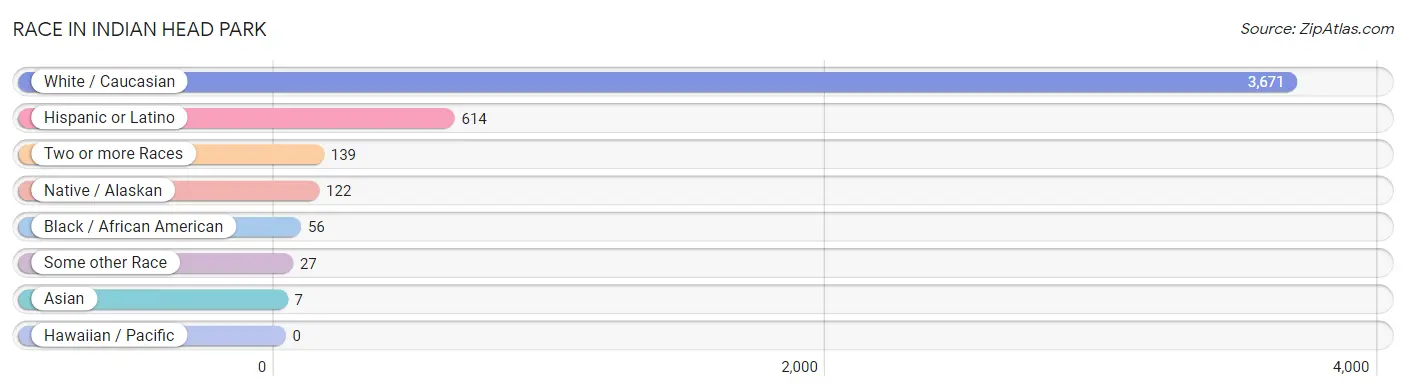
| Race | # Population | % Population |
| Asian | 7 | 0.2% |
| Black / African American | 56 | 1.4% |
| Hawaiian / Pacific | 0 | 0.0% |
| Hispanic or Latino | 614 | 15.3% |
| Native / Alaskan | 122 | 3.0% |
| White / Caucasian | 3,671 | 91.3% |
| Two or more Races | 139 | 3.5% |
| Some other Race | 27 | 0.7% |
| Total | 4,022 | 100.0% |
Ancestry in Indian Head Park
The most populous ancestries reported in Indian Head Park are Irish (664 | 16.5%), Polish (520 | 12.9%), German (445 | 11.1%), English (400 | 10.0%), and Italian (343 | 8.5%), together accounting for 59.0% of all Indian Head Park residents.
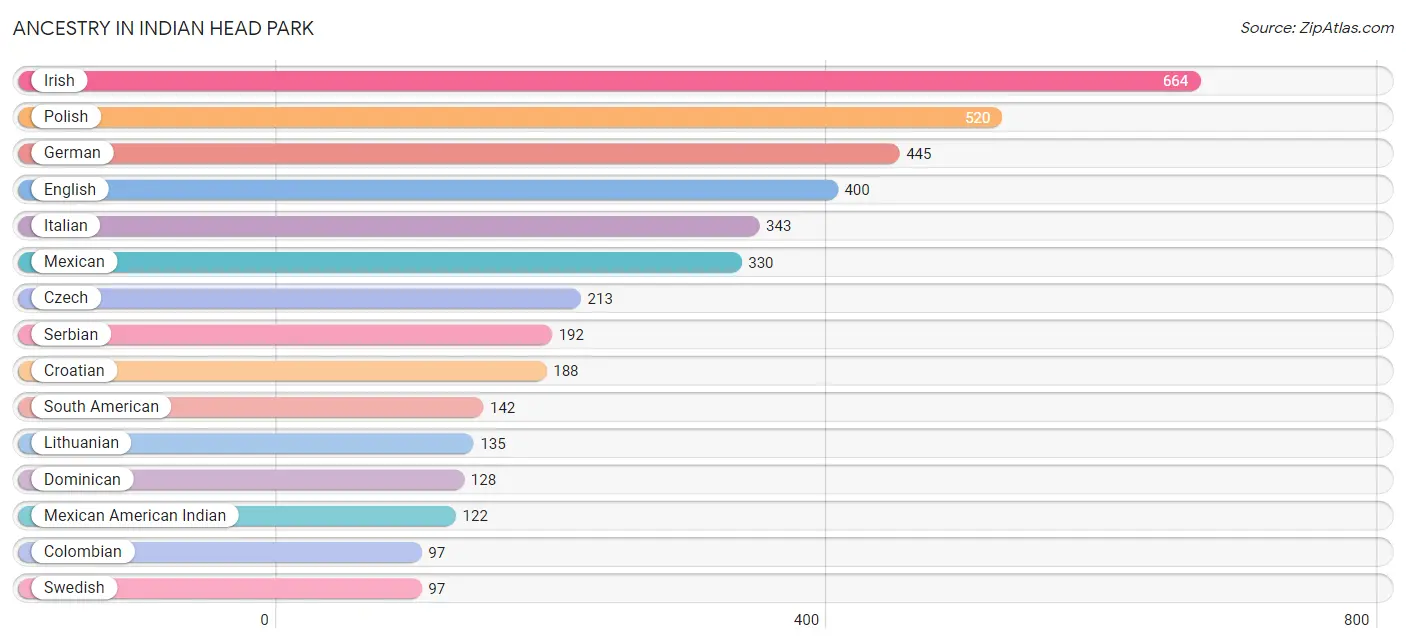
| Ancestry | # Population | % Population |
| African | 7 | 0.2% |
| American | 53 | 1.3% |
| Arab | 19 | 0.5% |
| Belgian | 13 | 0.3% |
| Brazilian | 37 | 0.9% |
| Colombian | 97 | 2.4% |
| Croatian | 188 | 4.7% |
| Czech | 213 | 5.3% |
| Czechoslovakian | 26 | 0.6% |
| Dominican | 128 | 3.2% |
| Dutch | 94 | 2.3% |
| Eastern European | 71 | 1.8% |
| English | 400 | 10.0% |
| French | 57 | 1.4% |
| German | 445 | 11.1% |
| German Russian | 21 | 0.5% |
| Greek | 12 | 0.3% |
| Irish | 664 | 16.5% |
| Italian | 343 | 8.5% |
| Lithuanian | 135 | 3.4% |
| Mexican | 330 | 8.2% |
| Mexican American Indian | 122 | 3.0% |
| Norwegian | 70 | 1.7% |
| Peruvian | 45 | 1.1% |
| Polish | 520 | 12.9% |
| Puerto Rican | 7 | 0.2% |
| Romanian | 14 | 0.4% |
| Russian | 65 | 1.6% |
| Scotch-Irish | 16 | 0.4% |
| Scottish | 78 | 1.9% |
| Serbian | 192 | 4.8% |
| Slovak | 62 | 1.5% |
| Slovene | 28 | 0.7% |
| South American | 142 | 3.5% |
| Subsaharan African | 7 | 0.2% |
| Swedish | 97 | 2.4% |
| Ukrainian | 21 | 0.5% |
| Welsh | 28 | 0.7% |
| Yugoslavian | 8 | 0.2% | View All 39 Rows |
Immigrants in Indian Head Park
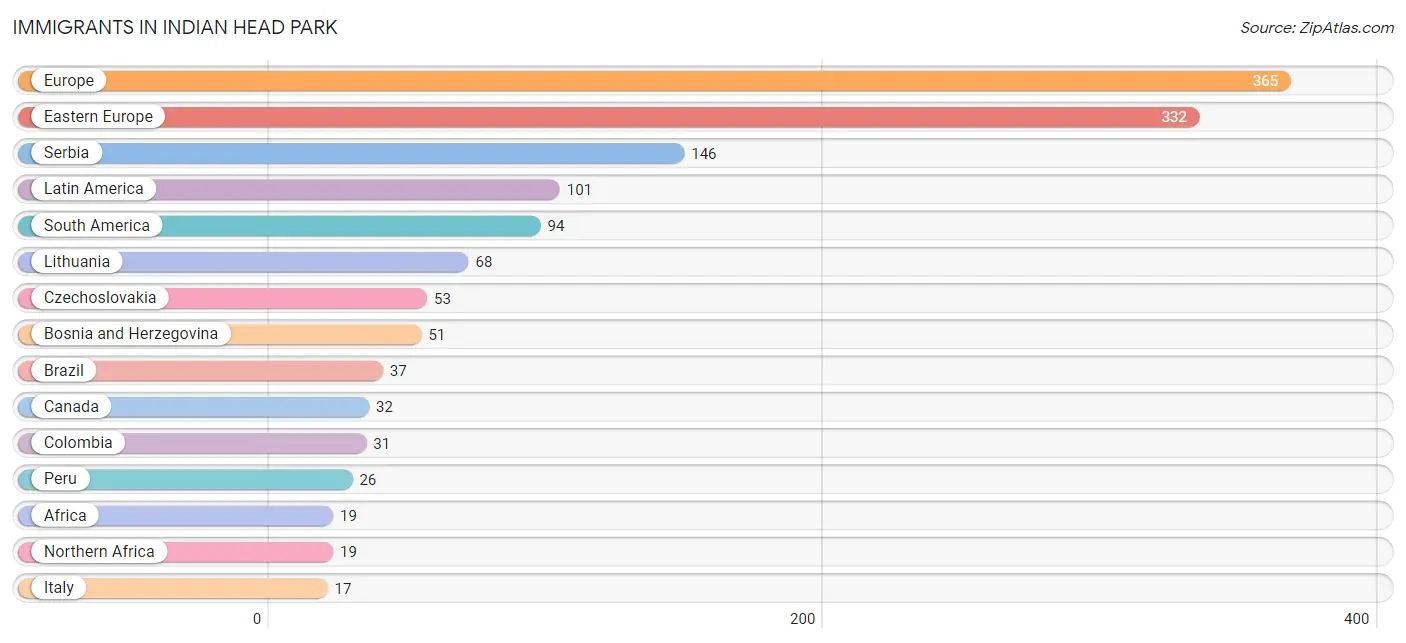
The most numerous immigrant groups reported in Indian Head Park came from Europe (365 | 9.1%), Eastern Europe (332 | 8.3%), Serbia (146 | 3.6%), Latin America (101 | 2.5%), and South America (94 | 2.3%), together accounting for 25.8% of all Indian Head Park residents.
| Immigration Origin | # Population | % Population |
| Africa | 19 | 0.5% |
| Bosnia and Herzegovina | 51 | 1.3% |
| Brazil | 37 | 0.9% |
| Canada | 32 | 0.8% |
| Central America | 7 | 0.2% |
| Colombia | 31 | 0.8% |
| Czechoslovakia | 53 | 1.3% |
| Eastern Europe | 332 | 8.3% |
| Europe | 365 | 9.1% |
| Germany | 16 | 0.4% |
| Italy | 17 | 0.4% |
| Latin America | 101 | 2.5% |
| Lithuania | 68 | 1.7% |
| Mexico | 7 | 0.2% |
| Northern Africa | 19 | 0.5% |
| Peru | 26 | 0.6% |
| Poland | 14 | 0.4% |
| Serbia | 146 | 3.6% |
| South America | 94 | 2.3% |
| Southern Europe | 17 | 0.4% |
| Western Europe | 16 | 0.4% | View All 21 Rows |
Sex and Age in Indian Head Park
Sex and Age in Indian Head Park
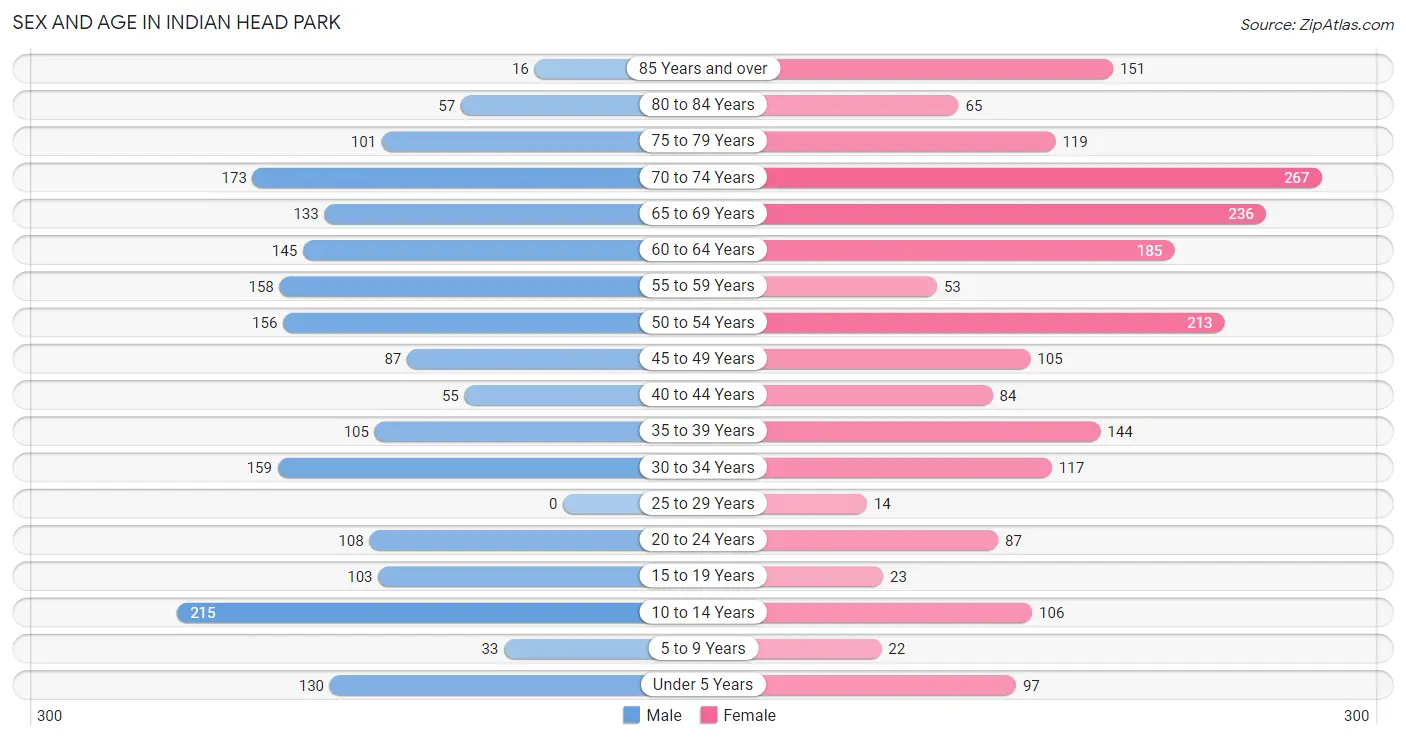
The most populous age groups in Indian Head Park are 10 to 14 Years (215 | 11.1%) for men and 70 to 74 Years (267 | 12.8%) for women.
| Age Bracket | Male | Female |
| Under 5 Years | 130 (6.7%) | 97 (4.6%) |
| 5 to 9 Years | 33 (1.7%) | 22 (1.1%) |
| 10 to 14 Years | 215 (11.1%) | 106 (5.1%) |
| 15 to 19 Years | 103 (5.3%) | 23 (1.1%) |
| 20 to 24 Years | 108 (5.6%) | 87 (4.2%) |
| 25 to 29 Years | 0 (0.0%) | 14 (0.7%) |
| 30 to 34 Years | 159 (8.2%) | 117 (5.6%) |
| 35 to 39 Years | 105 (5.4%) | 144 (6.9%) |
| 40 to 44 Years | 55 (2.8%) | 84 (4.0%) |
| 45 to 49 Years | 87 (4.5%) | 105 (5.0%) |
| 50 to 54 Years | 156 (8.1%) | 213 (10.2%) |
| 55 to 59 Years | 158 (8.2%) | 53 (2.5%) |
| 60 to 64 Years | 145 (7.5%) | 185 (8.9%) |
| 65 to 69 Years | 133 (6.9%) | 236 (11.3%) |
| 70 to 74 Years | 173 (8.9%) | 267 (12.8%) |
| 75 to 79 Years | 101 (5.2%) | 119 (5.7%) |
| 80 to 84 Years | 57 (2.9%) | 65 (3.1%) |
| 85 Years and over | 16 (0.8%) | 151 (7.2%) |
| Total | 1,934 (100.0%) | 2,088 (100.0%) |
Families and Households in Indian Head Park
Median Family Size in Indian Head Park
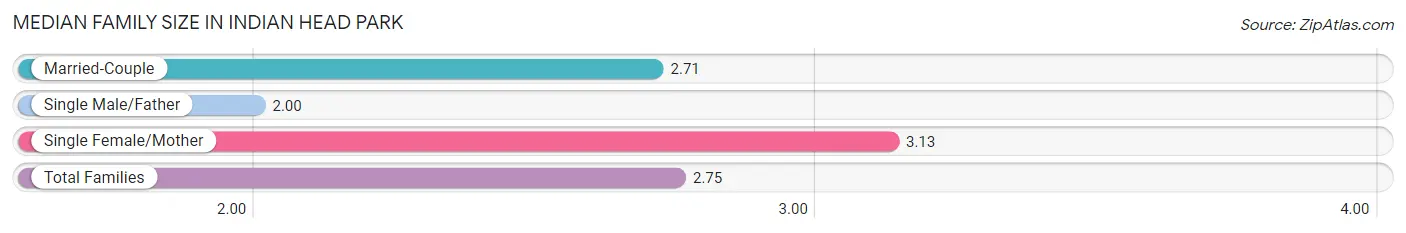
The median family size in Indian Head Park is 2.75 persons per family, with single female/mother families (139 | 12.8%) accounting for the largest median family size of 3.13 persons per family. On the other hand, single male/father families (10 | 0.9%) represent the smallest median family size with 2.00 persons per family.
| Family Type | # Families | Family Size |
| Married-Couple | 941 (86.3%) | 2.71 |
| Single Male/Father | 10 (0.9%) | 2.00 |
| Single Female/Mother | 139 (12.8%) | 3.13 |
| Total Families | 1,090 (100.0%) | 2.75 |
Median Household Size in Indian Head Park
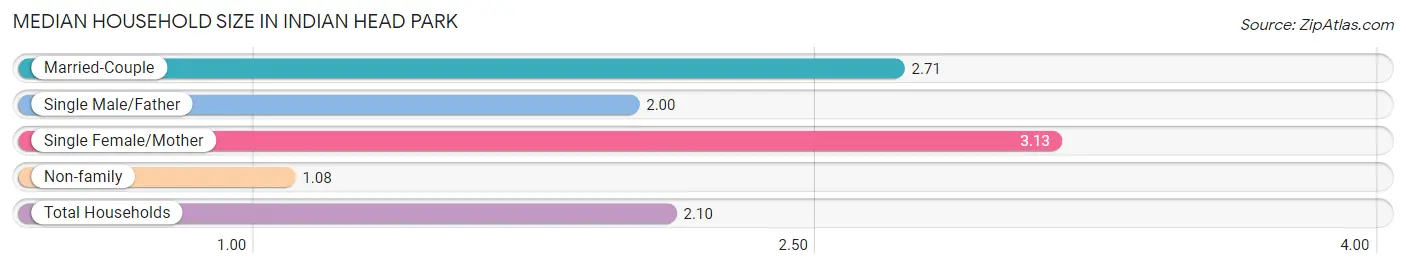
The median household size in Indian Head Park is 2.10 persons per household, with single female/mother households (139 | 7.7%) accounting for the largest median household size of 3.13 persons per household. non-family households (710 | 39.4%) represent the smallest median household size with 1.08 persons per household.
| Household Type | # Households | Household Size |
| Married-Couple | 941 (52.3%) | 2.71 |
| Single Male/Father | 10 (0.6%) | 2.00 |
| Single Female/Mother | 139 (7.7%) | 3.13 |
| Non-family | 710 (39.4%) | 1.08 |
| Total Households | 1,800 (100.0%) | 2.10 |
Household Size by Marriage Status in Indian Head Park
Out of a total of 1,800 households in Indian Head Park, 1,090 (60.6%) are family households, while 710 (39.4%) are nonfamily households. The most numerous type of family households are 2-person households, comprising 479, and the most common type of nonfamily households are 1-person households, comprising 667.
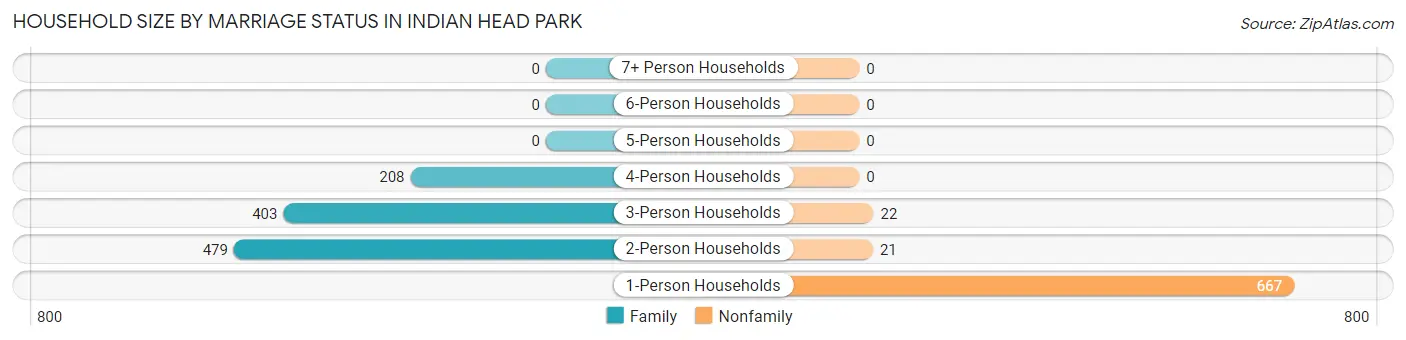
| Household Size | Family Households | Nonfamily Households |
| 1-Person Households | - | 667 (37.1%) |
| 2-Person Households | 479 (26.6%) | 21 (1.2%) |
| 3-Person Households | 403 (22.4%) | 22 (1.2%) |
| 4-Person Households | 208 (11.6%) | 0 (0.0%) |
| 5-Person Households | 0 (0.0%) | 0 (0.0%) |
| 6-Person Households | 0 (0.0%) | 0 (0.0%) |
| 7+ Person Households | 0 (0.0%) | 0 (0.0%) |
| Total | 1,090 (60.6%) | 710 (39.4%) |
Female Fertility in Indian Head Park
Fertility by Age in Indian Head Park
Average fertility rate in Indian Head Park is 179.0 births per 1,000 women. Women in the age bracket of 20 to 34 years have the highest fertility rate with 472.0 births per 1,000 women. Women in the age bracket of 20 to 34 years acount for 100.0% of all women with births.
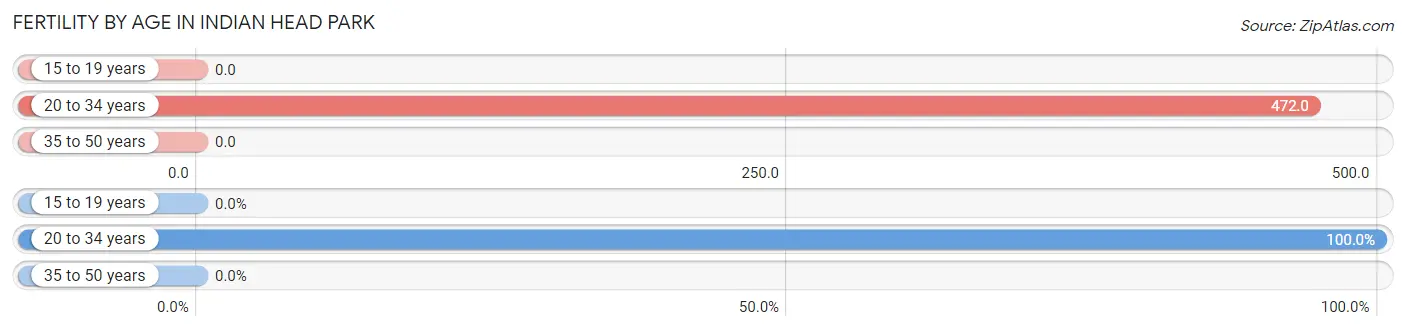
| Age Bracket | Women with Births | Births / 1,000 Women |
| 15 to 19 years | 0 (0.0%) | 0.0 |
| 20 to 34 years | 103 (100.0%) | 472.0 |
| 35 to 50 years | 0 (0.0%) | 0.0 |
| Total | 103 (100.0%) | 179.0 |
Fertility by Age by Marriage Status in Indian Head Park
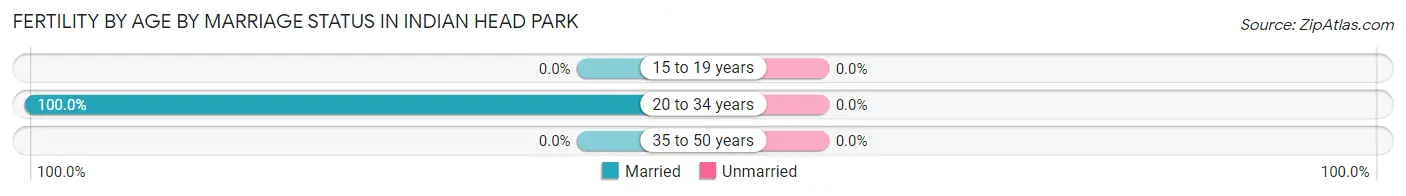
| Age Bracket | Married | Unmarried |
| 15 to 19 years | 0 (0.0%) | 0 (0.0%) |
| 20 to 34 years | 103 (100.0%) | 0 (0.0%) |
| 35 to 50 years | 0 (0.0%) | 0 (0.0%) |
| Total | 103 (100.0%) | 0 (0.0%) |
Fertility by Education in Indian Head Park
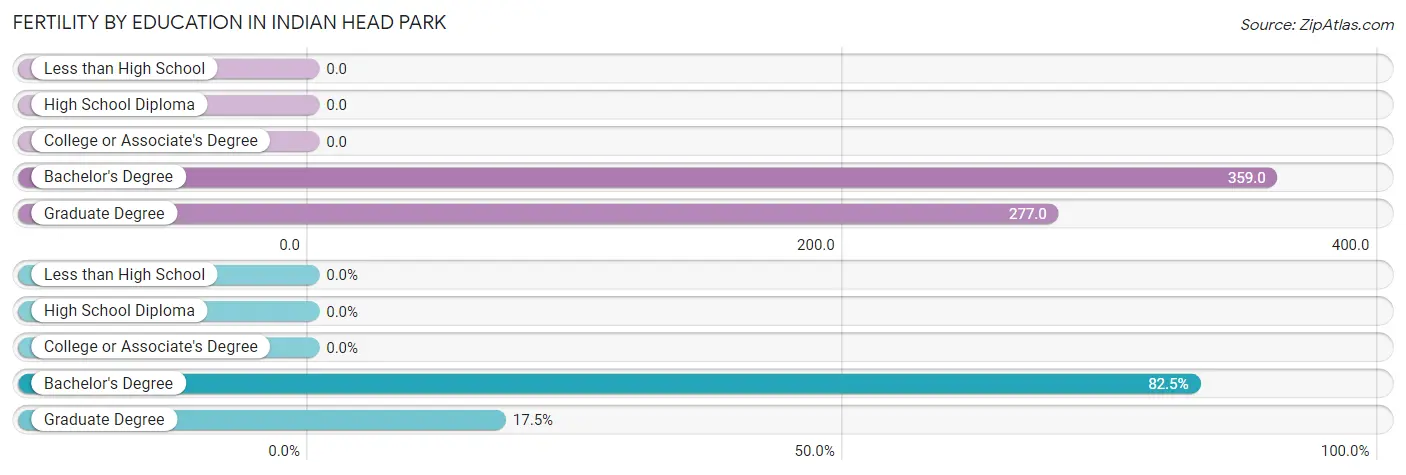
| Educational Attainment | Women with Births | Births / 1,000 Women |
| Less than High School | 0 (0.0%) | 0.0 |
| High School Diploma | 0 (0.0%) | 0.0 |
| College or Associate's Degree | 0 (0.0%) | 0.0 |
| Bachelor's Degree | 85 (82.5%) | 359.0 |
| Graduate Degree | 18 (17.5%) | 277.0 |
| Total | 103 (100.0%) | 179.0 |
Fertility by Education by Marriage Status in Indian Head Park
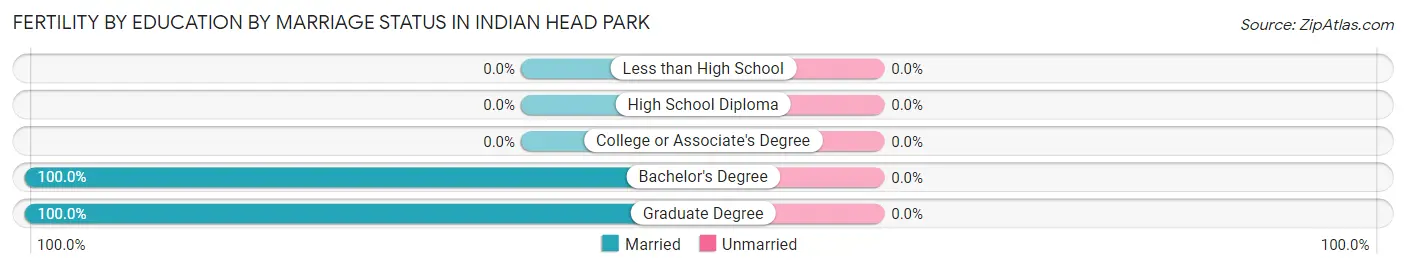
| Educational Attainment | Married | Unmarried |
| Less than High School | 0 (0.0%) | 0 (0.0%) |
| High School Diploma | 0 (0.0%) | 0 (0.0%) |
| College or Associate's Degree | 0 (0.0%) | 0 (0.0%) |
| Bachelor's Degree | 85 (100.0%) | 0 (0.0%) |
| Graduate Degree | 18 (100.0%) | 0 (0.0%) |
| Total | 103 (100.0%) | 0 (0.0%) |
Employment Characteristics in Indian Head Park
Employment by Class of Employer in Indian Head Park
Among the 1,705 employed individuals in Indian Head Park, private company employees (1,195 | 70.1%), self-employed (incorporated) (258 | 15.1%), and local government employees (104 | 6.1%) make up the most common classes of employment.
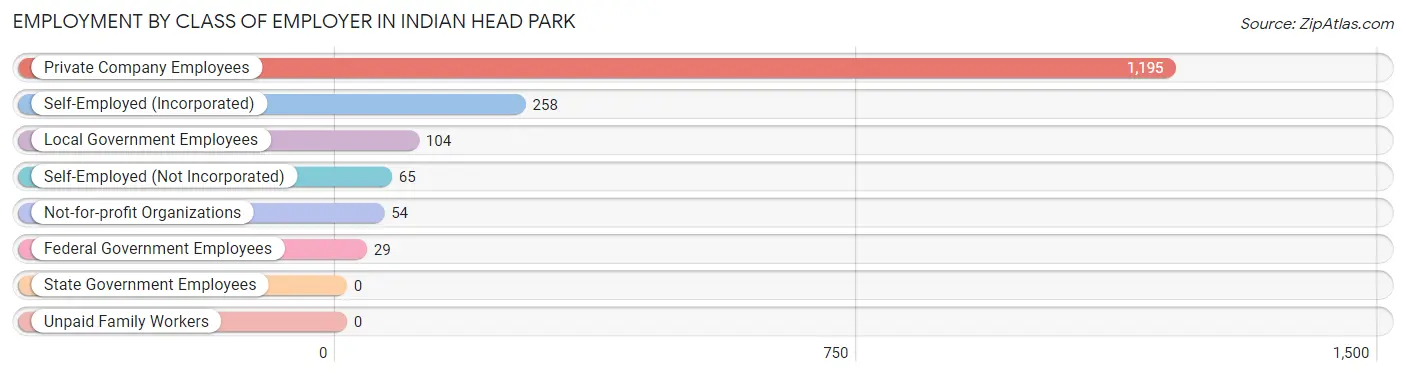
| Employer Class | # Employees | % Employees |
| Private Company Employees | 1,195 | 70.1% |
| Self-Employed (Incorporated) | 258 | 15.1% |
| Self-Employed (Not Incorporated) | 65 | 3.8% |
| Not-for-profit Organizations | 54 | 3.2% |
| Local Government Employees | 104 | 6.1% |
| State Government Employees | 0 | 0.0% |
| Federal Government Employees | 29 | 1.7% |
| Unpaid Family Workers | 0 | 0.0% |
| Total | 1,705 | 100.0% |
Employment Status by Age in Indian Head Park
According to the labor force statistics for Indian Head Park, out of the total population over 16 years of age (3,400), 54.1% or 1,839 individuals are in the labor force, with 7.3% or 134 of them unemployed. The age group with the highest labor force participation rate is 25 to 29 years, with 100.0% or 14 individuals in the labor force. Within the labor force, the 75 years and over age range has the highest percentage of unemployed individuals, with 23.0% or 14 of them being unemployed.
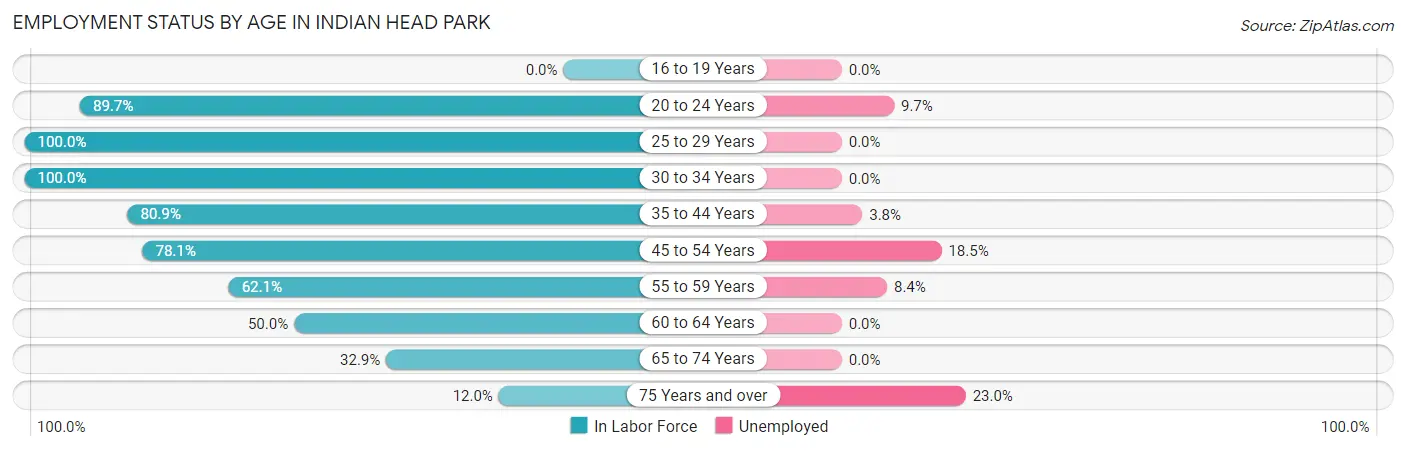
| Age Bracket | In Labor Force | Unemployed |
| 16 to 19 Years | 0 (0.0%) | 0 (0.0%) |
| 20 to 24 Years | 175 (89.7%) | 17 (9.7%) |
| 25 to 29 Years | 14 (100.0%) | 0 (0.0%) |
| 30 to 34 Years | 276 (100.0%) | 0 (0.0%) |
| 35 to 44 Years | 314 (80.9%) | 12 (3.8%) |
| 45 to 54 Years | 438 (78.1%) | 81 (18.5%) |
| 55 to 59 Years | 131 (62.1%) | 11 (8.4%) |
| 60 to 64 Years | 165 (50.0%) | 0 (0.0%) |
| 65 to 74 Years | 266 (32.9%) | 0 (0.0%) |
| 75 Years and over | 61 (12.0%) | 14 (23.0%) |
| Total | 1,839 (54.1%) | 134 (7.3%) |
Employment Status by Educational Attainment in Indian Head Park
According to labor force statistics for Indian Head Park, 75.2% of individuals (1,339) out of the total population between 25 and 64 years of age (1,780) are in the labor force, with 7.8% or 104 of them being unemployed. The group with the highest labor force participation rate are those with the educational attainment of bachelor's degree or higher, with 84.3% or 837 individuals in the labor force. Within the labor force, individuals with high school diploma education have the highest percentage of unemployment, with 51.4% or 37 of them being unemployed.
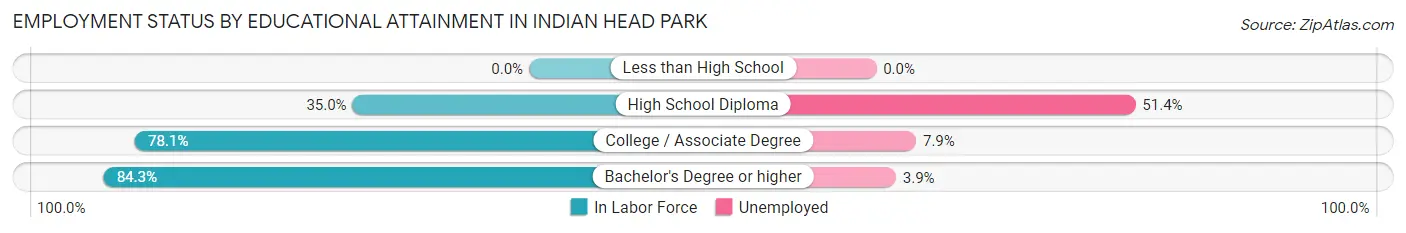
| Educational Attainment | In Labor Force | Unemployed |
| Less than High School | 0 (0.0%) | 0 (0.0%) |
| High School Diploma | 72 (35.0%) | 106 (51.4%) |
| College / Associate Degree | 429 (78.1%) | 43 (7.9%) |
| Bachelor's Degree or higher | 837 (84.3%) | 39 (3.9%) |
| Total | 1,339 (75.2%) | 139 (7.8%) |
Employment Occupations by Sex in Indian Head Park
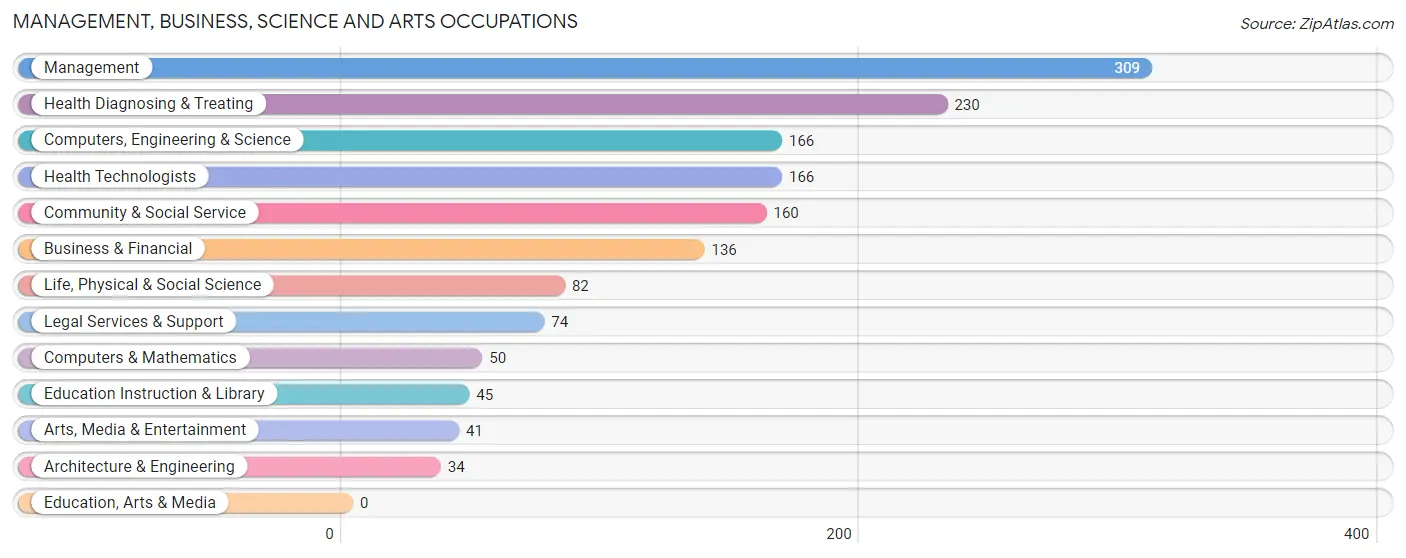
Management, Business, Science and Arts Occupations
The most common Management, Business, Science and Arts occupations in Indian Head Park are Management (309 | 18.1%), Health Diagnosing & Treating (230 | 13.5%), Computers, Engineering & Science (166 | 9.7%), Health Technologists (166 | 9.7%), and Community & Social Service (160 | 9.4%).
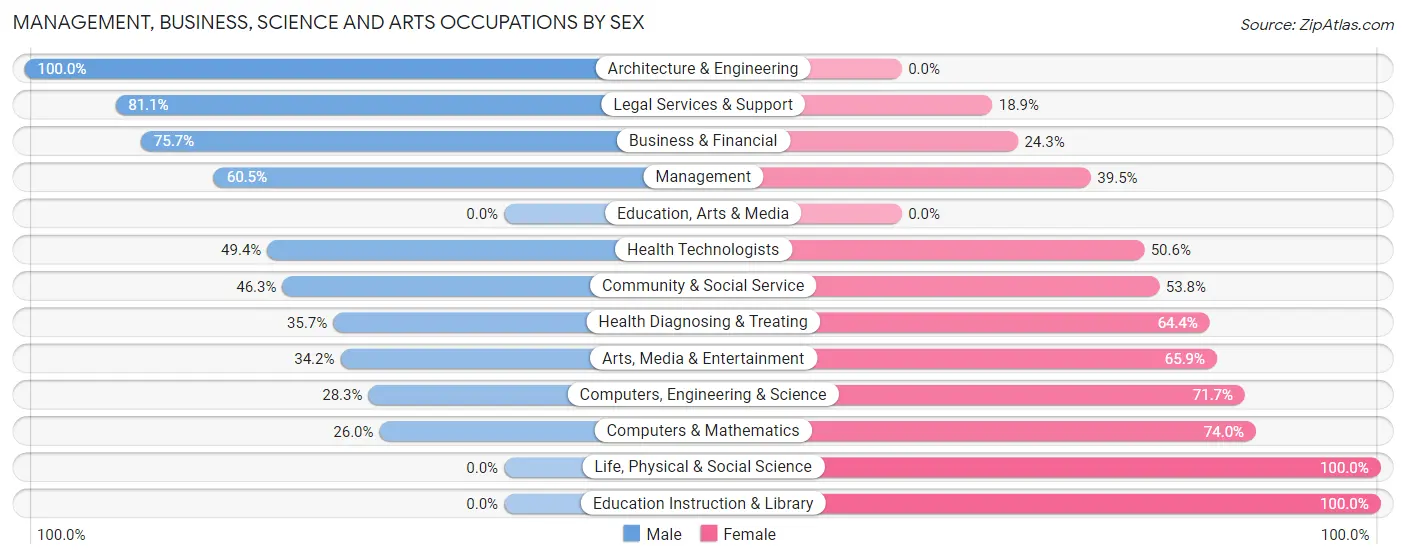
Management, Business, Science and Arts Occupations by Sex
Within the Management, Business, Science and Arts occupations in Indian Head Park, the most male-oriented occupations are Architecture & Engineering (100.0%), Legal Services & Support (81.1%), and Business & Financial (75.7%), while the most female-oriented occupations are Life, Physical & Social Science (100.0%), Education Instruction & Library (100.0%), and Computers & Mathematics (74.0%).
| Occupation | Male | Female |
| Management | 187 (60.5%) | 122 (39.5%) |
| Business & Financial | 103 (75.7%) | 33 (24.3%) |
| Computers, Engineering & Science | 47 (28.3%) | 119 (71.7%) |
| Computers & Mathematics | 13 (26.0%) | 37 (74.0%) |
| Architecture & Engineering | 34 (100.0%) | 0 (0.0%) |
| Life, Physical & Social Science | 0 (0.0%) | 82 (100.0%) |
| Community & Social Service | 74 (46.3%) | 86 (53.7%) |
| Education, Arts & Media | 0 (0.0%) | 0 (0.0%) |
| Legal Services & Support | 60 (81.1%) | 14 (18.9%) |
| Education Instruction & Library | 0 (0.0%) | 45 (100.0%) |
| Arts, Media & Entertainment | 14 (34.2%) | 27 (65.8%) |
| Health Diagnosing & Treating | 82 (35.6%) | 148 (64.3%) |
| Health Technologists | 82 (49.4%) | 84 (50.6%) |
| Total (Category) | 493 (49.2%) | 508 (50.7%) |
| Total (Overall) | 897 (52.6%) | 808 (47.4%) |
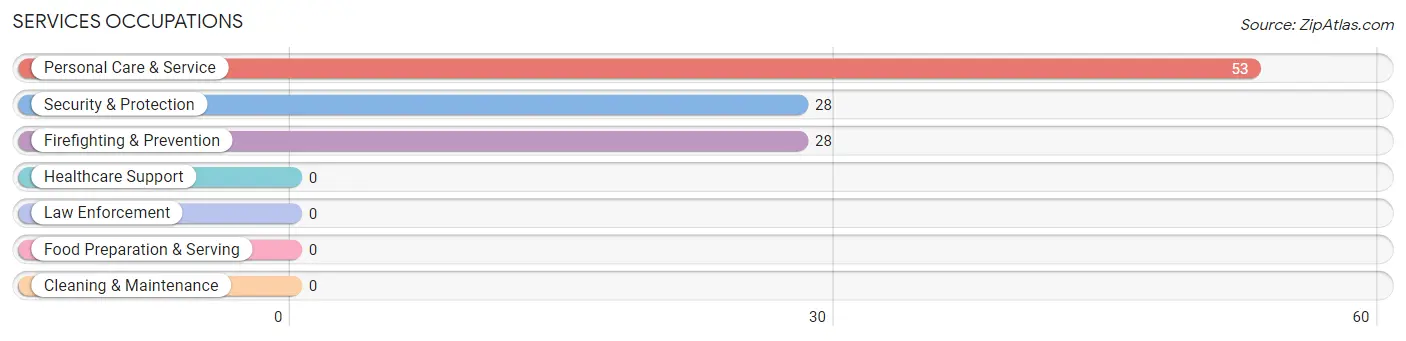
Services Occupations
The most common Services occupations in Indian Head Park are Personal Care & Service (53 | 3.1%), Security & Protection (28 | 1.6%), and Firefighting & Prevention (28 | 1.6%).
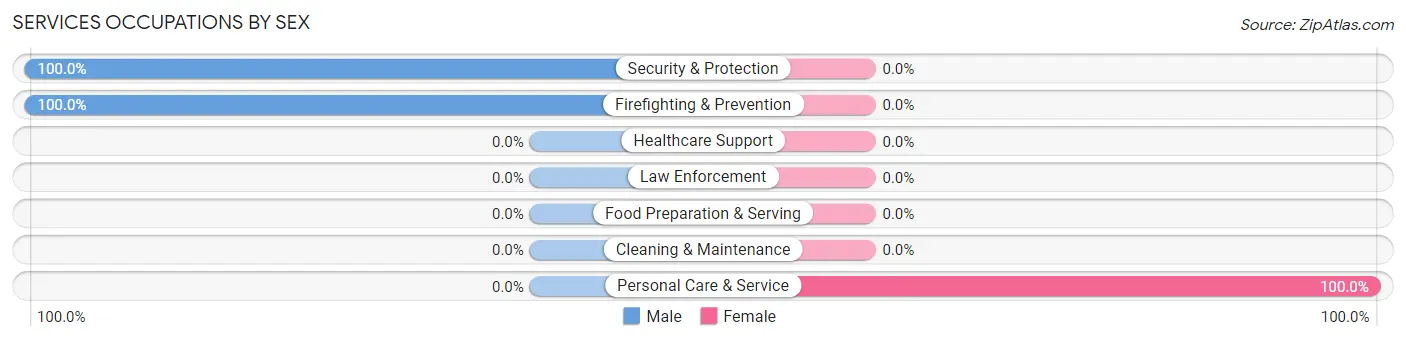
Services Occupations by Sex
| Occupation | Male | Female |
| Healthcare Support | 0 (0.0%) | 0 (0.0%) |
| Security & Protection | 28 (100.0%) | 0 (0.0%) |
| Firefighting & Prevention | 28 (100.0%) | 0 (0.0%) |
| Law Enforcement | 0 (0.0%) | 0 (0.0%) |
| Food Preparation & Serving | 0 (0.0%) | 0 (0.0%) |
| Cleaning & Maintenance | 0 (0.0%) | 0 (0.0%) |
| Personal Care & Service | 0 (0.0%) | 53 (100.0%) |
| Total (Category) | 28 (34.6%) | 53 (65.4%) |
| Total (Overall) | 897 (52.6%) | 808 (47.4%) |
Sales and Office Occupations
The most common Sales and Office occupations in Indian Head Park are Sales & Related (204 | 12.0%), and Office & Administration (196 | 11.5%).
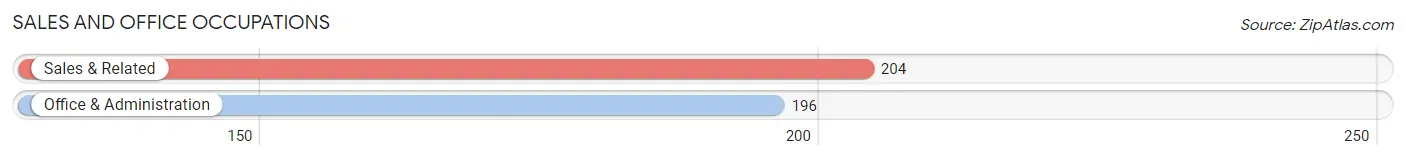
Sales and Office Occupations by Sex
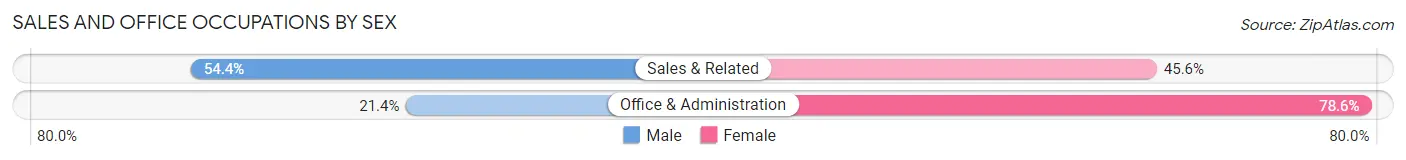
| Occupation | Male | Female |
| Sales & Related | 111 (54.4%) | 93 (45.6%) |
| Office & Administration | 42 (21.4%) | 154 (78.6%) |
| Total (Category) | 153 (38.3%) | 247 (61.8%) |
| Total (Overall) | 897 (52.6%) | 808 (47.4%) |
Natural Resources, Construction and Maintenance Occupations
Natural Resources, Construction and Maintenance Occupations by Sex
| Occupation | Male | Female |
| Farming, Fishing & Forestry | 0 (0.0%) | 0 (0.0%) |
| Construction & Extraction | 0 (0.0%) | 0 (0.0%) |
| Installation, Maintenance & Repair | 0 (0.0%) | 0 (0.0%) |
| Total (Category) | 0 (0.0%) | 0 (0.0%) |
| Total (Overall) | 897 (52.6%) | 808 (47.4%) |
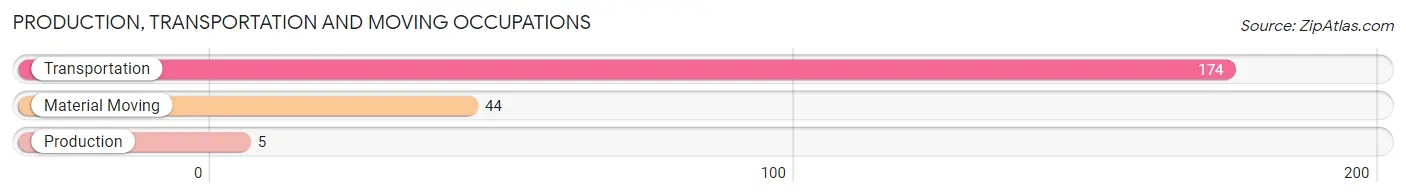
Production, Transportation and Moving Occupations
The most common Production, Transportation and Moving occupations in Indian Head Park are Transportation (174 | 10.2%), Material Moving (44 | 2.6%), and Production (5 | 0.3%).
Production, Transportation and Moving Occupations by Sex
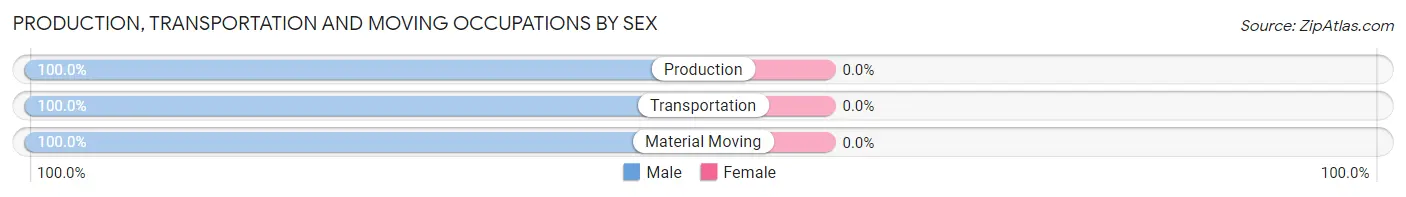
| Occupation | Male | Female |
| Production | 5 (100.0%) | 0 (0.0%) |
| Transportation | 174 (100.0%) | 0 (0.0%) |
| Material Moving | 44 (100.0%) | 0 (0.0%) |
| Total (Category) | 223 (100.0%) | 0 (0.0%) |
| Total (Overall) | 897 (52.6%) | 808 (47.4%) |
Employment Industries by Sex in Indian Head Park
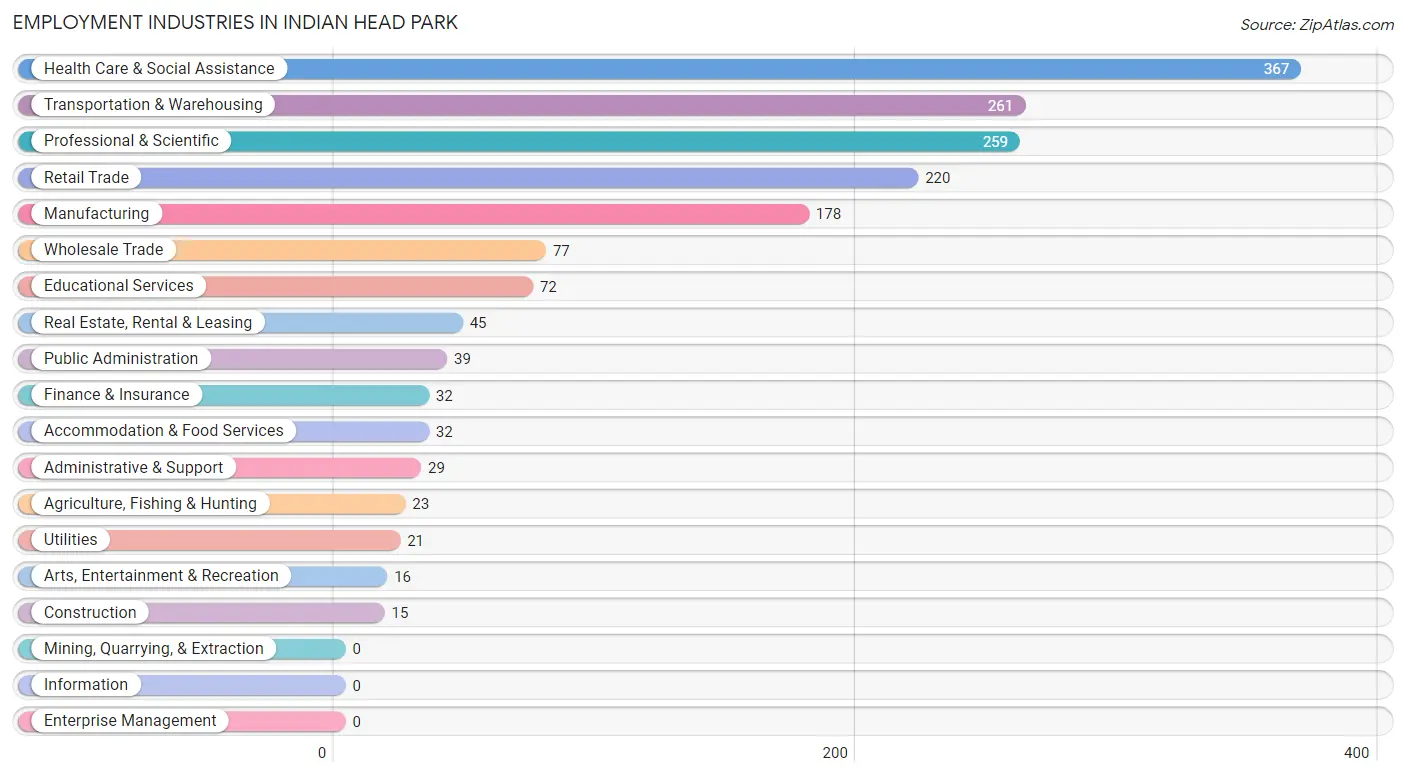
Employment Industries in Indian Head Park
The major employment industries in Indian Head Park include Health Care & Social Assistance (367 | 21.5%), Transportation & Warehousing (261 | 15.3%), Professional & Scientific (259 | 15.2%), Retail Trade (220 | 12.9%), and Manufacturing (178 | 10.4%).
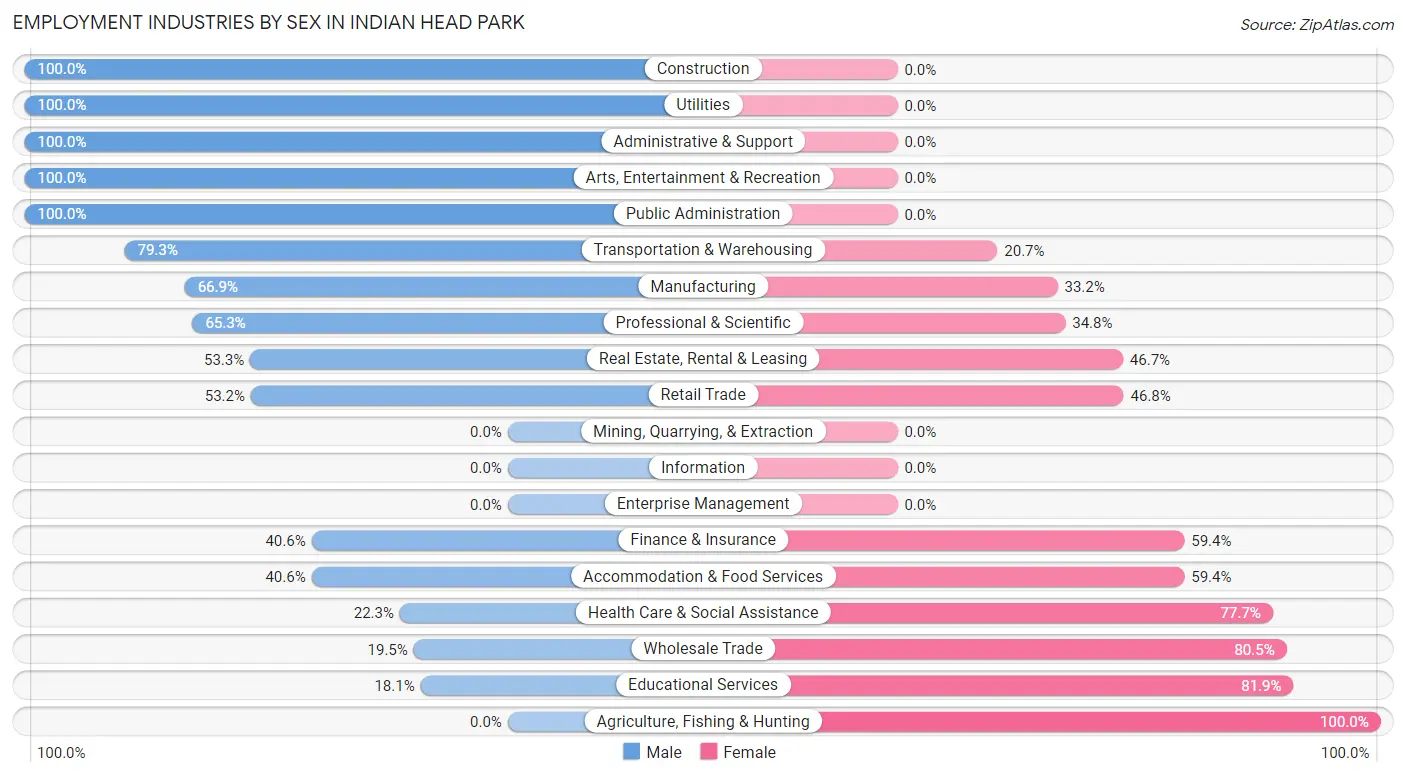
Employment Industries by Sex in Indian Head Park
The Indian Head Park industries that see more men than women are Construction (100.0%), Utilities (100.0%), and Administrative & Support (100.0%), whereas the industries that tend to have a higher number of women are Agriculture, Fishing & Hunting (100.0%), Educational Services (81.9%), and Wholesale Trade (80.5%).
| Industry | Male | Female |
| Agriculture, Fishing & Hunting | 0 (0.0%) | 23 (100.0%) |
| Mining, Quarrying, & Extraction | 0 (0.0%) | 0 (0.0%) |
| Construction | 15 (100.0%) | 0 (0.0%) |
| Manufacturing | 119 (66.8%) | 59 (33.2%) |
| Wholesale Trade | 15 (19.5%) | 62 (80.5%) |
| Retail Trade | 117 (53.2%) | 103 (46.8%) |
| Transportation & Warehousing | 207 (79.3%) | 54 (20.7%) |
| Utilities | 21 (100.0%) | 0 (0.0%) |
| Information | 0 (0.0%) | 0 (0.0%) |
| Finance & Insurance | 13 (40.6%) | 19 (59.4%) |
| Real Estate, Rental & Leasing | 24 (53.3%) | 21 (46.7%) |
| Professional & Scientific | 169 (65.2%) | 90 (34.7%) |
| Enterprise Management | 0 (0.0%) | 0 (0.0%) |
| Administrative & Support | 29 (100.0%) | 0 (0.0%) |
| Educational Services | 13 (18.1%) | 59 (81.9%) |
| Health Care & Social Assistance | 82 (22.3%) | 285 (77.7%) |
| Arts, Entertainment & Recreation | 16 (100.0%) | 0 (0.0%) |
| Accommodation & Food Services | 13 (40.6%) | 19 (59.4%) |
| Public Administration | 39 (100.0%) | 0 (0.0%) |
| Total | 897 (52.6%) | 808 (47.4%) |
Education in Indian Head Park
School Enrollment in Indian Head Park
The most common levels of schooling among the 666 students in Indian Head Park are middle school (284 | 42.6%), college / undergraduate (131 | 19.7%), and high school (103 | 15.5%).
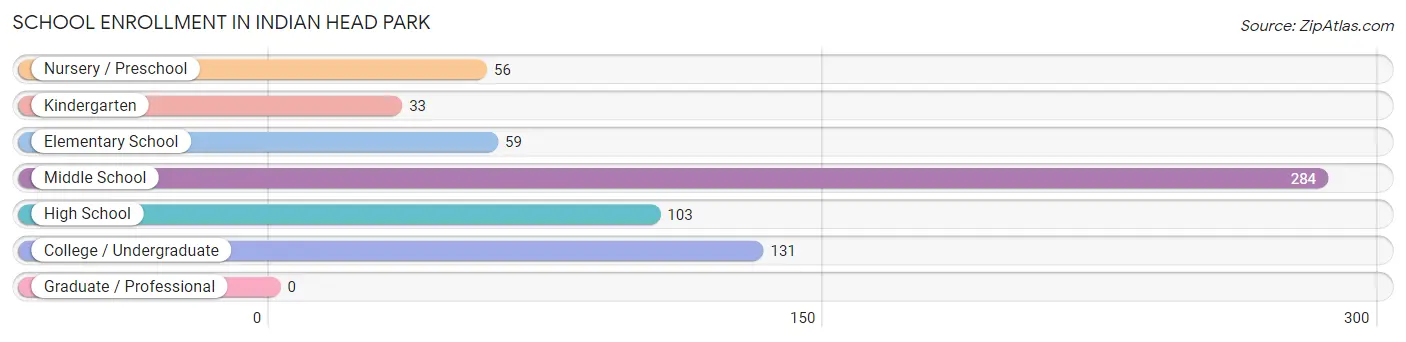
| School Level | # Students | % Students |
| Nursery / Preschool | 56 | 8.4% |
| Kindergarten | 33 | 5.0% |
| Elementary School | 59 | 8.9% |
| Middle School | 284 | 42.6% |
| High School | 103 | 15.5% |
| College / Undergraduate | 131 | 19.7% |
| Graduate / Professional | 0 | 0.0% |
| Total | 666 | 100.0% |
School Enrollment by Age by Funding Source in Indian Head Park
Out of a total of 666 students who are enrolled in schools in Indian Head Park, 36 (5.4%) attend a private institution, while the remaining 630 (94.6%) are enrolled in public schools. The age group of 20 to 24 year olds has the highest likelihood of being enrolled in private schools, with 36 (33.3% in the age bracket) enrolled. Conversely, the age group of 3 to 4 year olds has the lowest likelihood of being enrolled in a private school, with 56 (100.0% in the age bracket) attending a public institution.
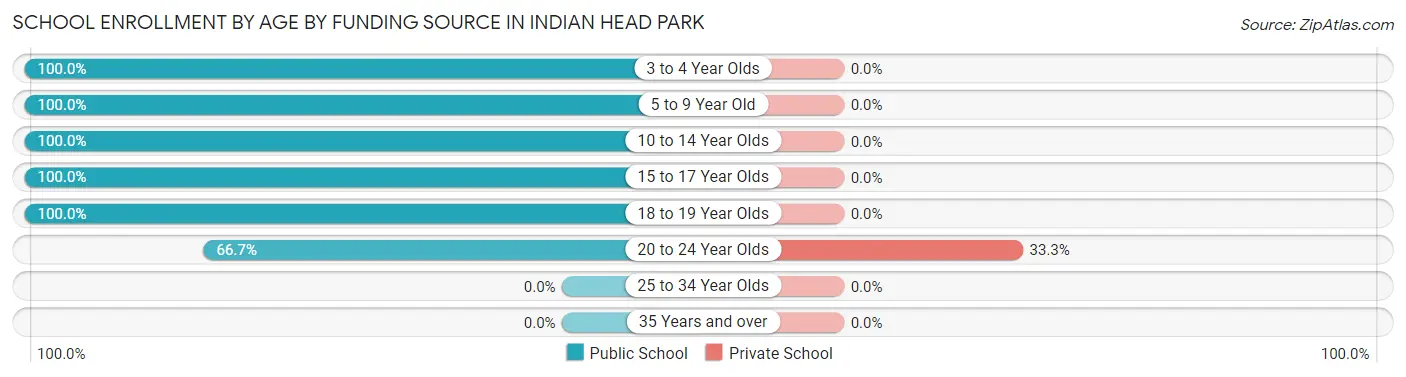
| Age Bracket | Public School | Private School |
| 3 to 4 Year Olds | 56 (100.0%) | 0 (0.0%) |
| 5 to 9 Year Old | 55 (100.0%) | 0 (0.0%) |
| 10 to 14 Year Olds | 321 (100.0%) | 0 (0.0%) |
| 15 to 17 Year Olds | 103 (100.0%) | 0 (0.0%) |
| 18 to 19 Year Olds | 23 (100.0%) | 0 (0.0%) |
| 20 to 24 Year Olds | 72 (66.7%) | 36 (33.3%) |
| 25 to 34 Year Olds | 0 (0.0%) | 0 (0.0%) |
| 35 Years and over | 0 (0.0%) | 0 (0.0%) |
| Total | 630 (94.6%) | 36 (5.4%) |
Educational Attainment by Field of Study in Indian Head Park
Business (294 | 17.3%), social sciences (216 | 12.7%), liberal arts & history (202 | 11.9%), education (158 | 9.3%), and engineering (152 | 9.0%) are the most common fields of study among 1,697 individuals in Indian Head Park who have obtained a bachelor's degree or higher.
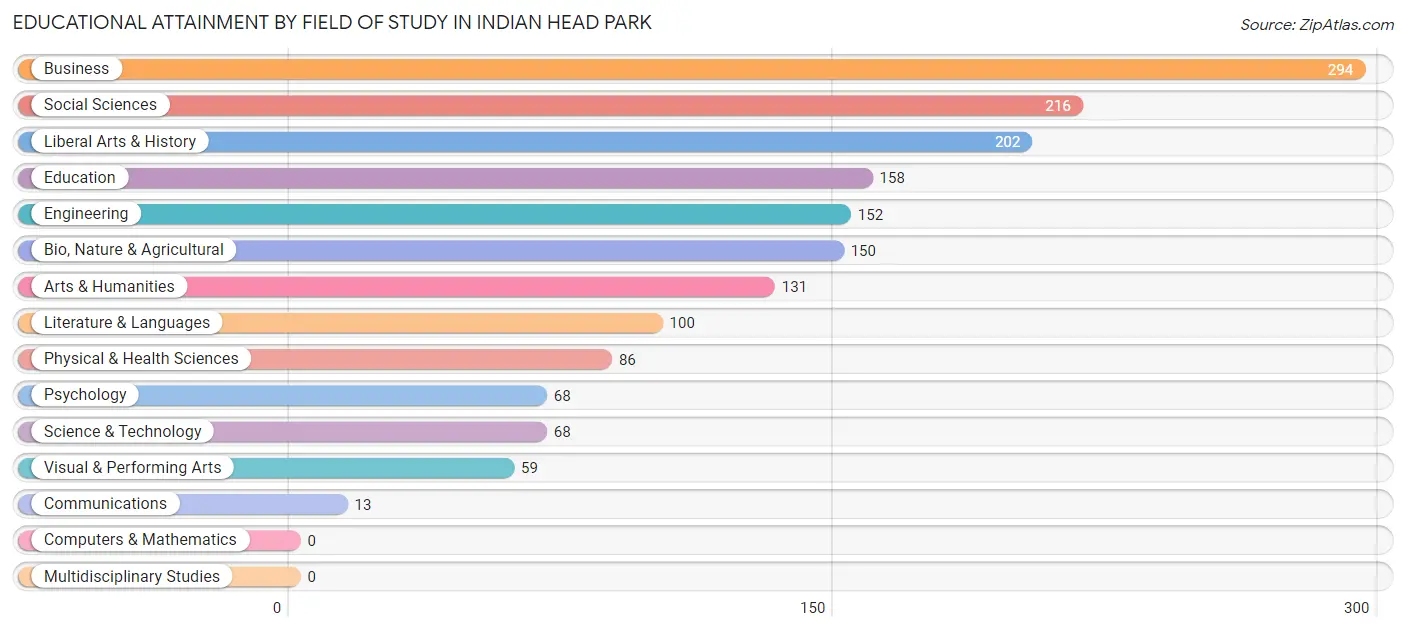
| Field of Study | # Graduates | % Graduates |
| Computers & Mathematics | 0 | 0.0% |
| Bio, Nature & Agricultural | 150 | 8.8% |
| Physical & Health Sciences | 86 | 5.1% |
| Psychology | 68 | 4.0% |
| Social Sciences | 216 | 12.7% |
| Engineering | 152 | 9.0% |
| Multidisciplinary Studies | 0 | 0.0% |
| Science & Technology | 68 | 4.0% |
| Business | 294 | 17.3% |
| Education | 158 | 9.3% |
| Literature & Languages | 100 | 5.9% |
| Liberal Arts & History | 202 | 11.9% |
| Visual & Performing Arts | 59 | 3.5% |
| Communications | 13 | 0.8% |
| Arts & Humanities | 131 | 7.7% |
| Total | 1,697 | 100.0% |
Transportation & Commute in Indian Head Park
Vehicle Availability by Sex in Indian Head Park
The most prevalent vehicle ownership categories in Indian Head Park are males with 2 vehicles (547, accounting for 61.0%) and females with 2 vehicles (406, making up 67.7%).
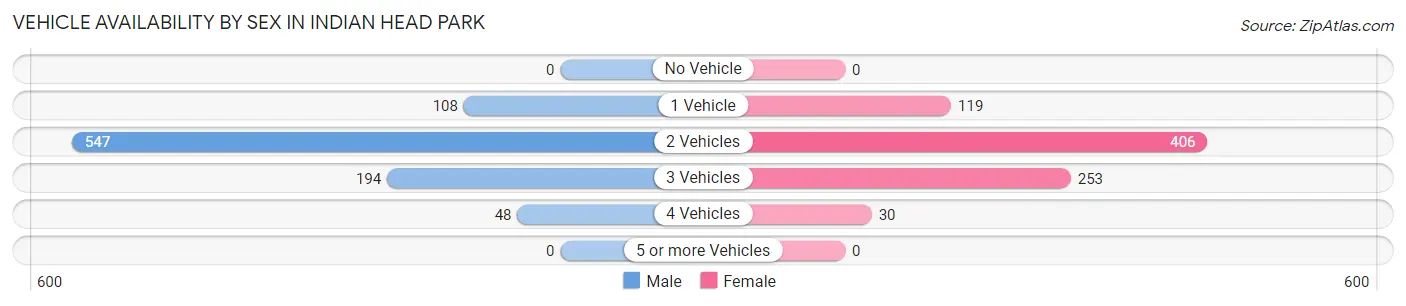
| Vehicles Available | Male | Female |
| No Vehicle | 0 (0.0%) | 0 (0.0%) |
| 1 Vehicle | 108 (12.0%) | 119 (14.7%) |
| 2 Vehicles | 547 (61.0%) | 406 (50.2%) |
| 3 Vehicles | 194 (21.6%) | 253 (31.3%) |
| 4 Vehicles | 48 (5.3%) | 30 (3.7%) |
| 5 or more Vehicles | 0 (0.0%) | 0 (0.0%) |
| Total | 897 (100.0%) | 808 (100.0%) |
Commute Time in Indian Head Park
The most frequently occuring commute durations in Indian Head Park are 30 to 34 minutes (386 commuters, 27.2%), 15 to 19 minutes (330 commuters, 23.3%), and 20 to 24 minutes (247 commuters, 17.4%).
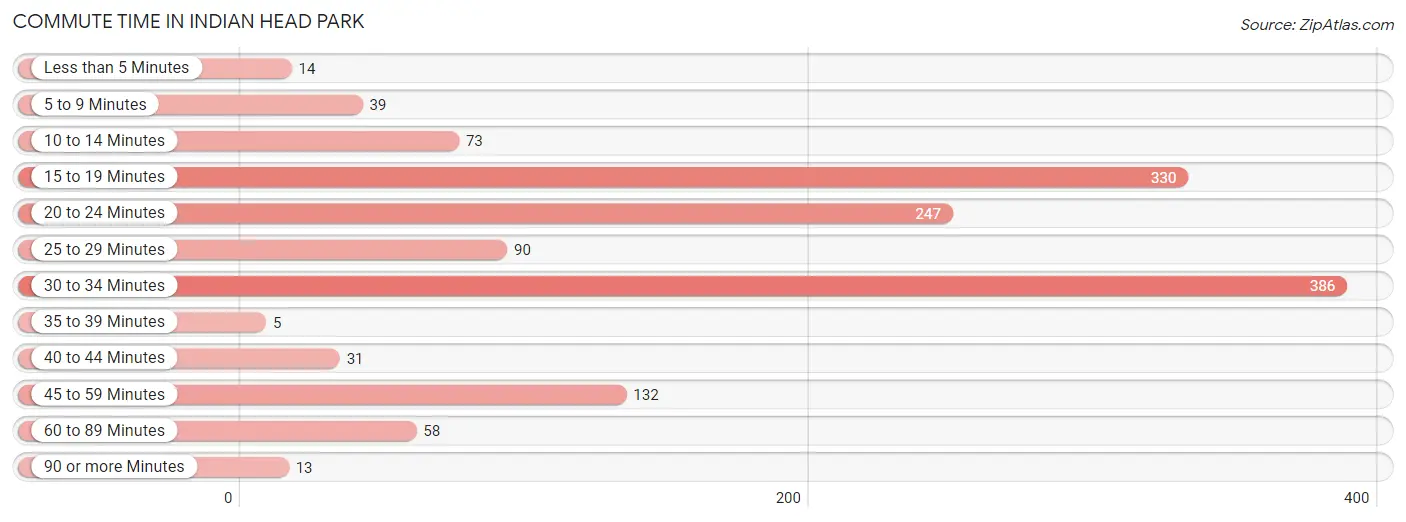
| Commute Time | # Commuters | % Commuters |
| Less than 5 Minutes | 14 | 1.0% |
| 5 to 9 Minutes | 39 | 2.8% |
| 10 to 14 Minutes | 73 | 5.1% |
| 15 to 19 Minutes | 330 | 23.3% |
| 20 to 24 Minutes | 247 | 17.4% |
| 25 to 29 Minutes | 90 | 6.4% |
| 30 to 34 Minutes | 386 | 27.2% |
| 35 to 39 Minutes | 5 | 0.4% |
| 40 to 44 Minutes | 31 | 2.2% |
| 45 to 59 Minutes | 132 | 9.3% |
| 60 to 89 Minutes | 58 | 4.1% |
| 90 or more Minutes | 13 | 0.9% |
Commute Time by Sex in Indian Head Park
The most common commute times in Indian Head Park are 30 to 34 minutes (170 commuters, 21.4%) for males and 30 to 34 minutes (216 commuters, 34.6%) for females.
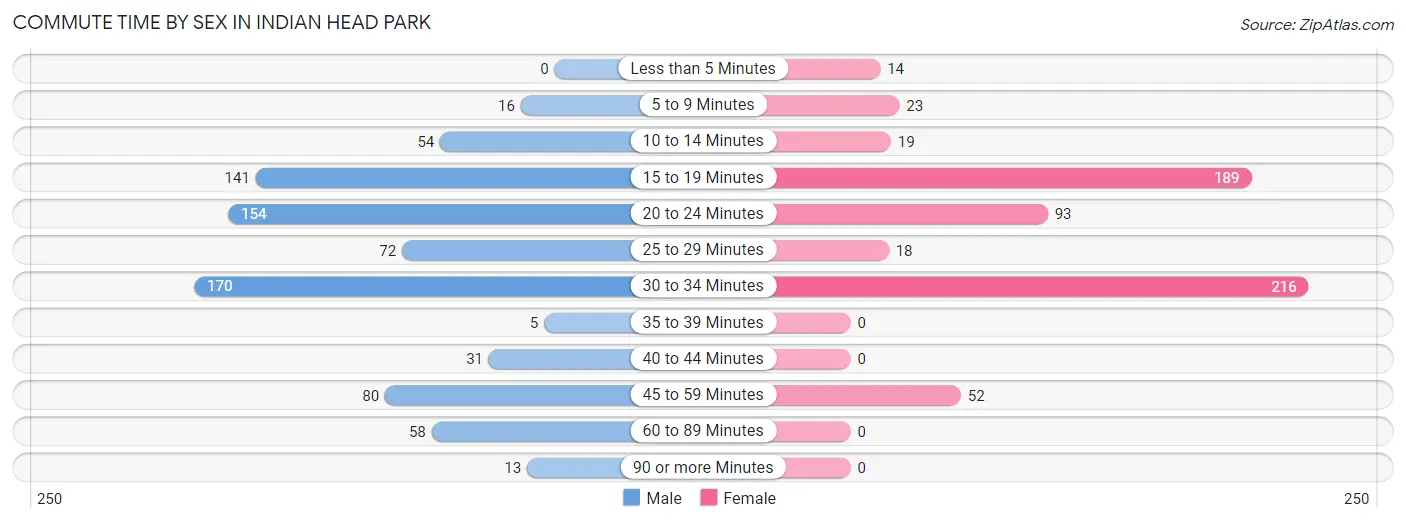
| Commute Time | Male | Female |
| Less than 5 Minutes | 0 (0.0%) | 14 (2.2%) |
| 5 to 9 Minutes | 16 (2.0%) | 23 (3.7%) |
| 10 to 14 Minutes | 54 (6.8%) | 19 (3.0%) |
| 15 to 19 Minutes | 141 (17.8%) | 189 (30.3%) |
| 20 to 24 Minutes | 154 (19.4%) | 93 (14.9%) |
| 25 to 29 Minutes | 72 (9.1%) | 18 (2.9%) |
| 30 to 34 Minutes | 170 (21.4%) | 216 (34.6%) |
| 35 to 39 Minutes | 5 (0.6%) | 0 (0.0%) |
| 40 to 44 Minutes | 31 (3.9%) | 0 (0.0%) |
| 45 to 59 Minutes | 80 (10.1%) | 52 (8.3%) |
| 60 to 89 Minutes | 58 (7.3%) | 0 (0.0%) |
| 90 or more Minutes | 13 (1.6%) | 0 (0.0%) |
Time of Departure to Work by Sex in Indian Head Park
The most frequent times of departure to work in Indian Head Park are 7:30 AM to 7:59 AM (133, 16.8%) for males and 8:00 AM to 8:29 AM (148, 23.7%) for females.
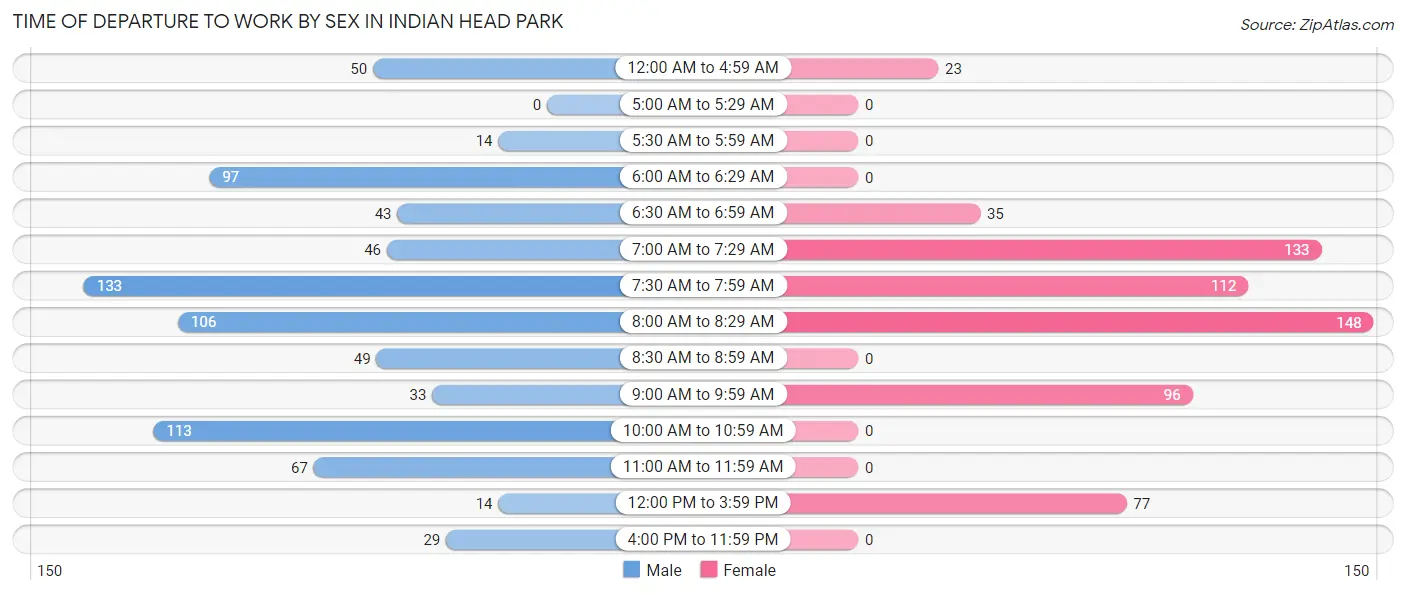
| Time of Departure | Male | Female |
| 12:00 AM to 4:59 AM | 50 (6.3%) | 23 (3.7%) |
| 5:00 AM to 5:29 AM | 0 (0.0%) | 0 (0.0%) |
| 5:30 AM to 5:59 AM | 14 (1.8%) | 0 (0.0%) |
| 6:00 AM to 6:29 AM | 97 (12.2%) | 0 (0.0%) |
| 6:30 AM to 6:59 AM | 43 (5.4%) | 35 (5.6%) |
| 7:00 AM to 7:29 AM | 46 (5.8%) | 133 (21.3%) |
| 7:30 AM to 7:59 AM | 133 (16.8%) | 112 (17.9%) |
| 8:00 AM to 8:29 AM | 106 (13.4%) | 148 (23.7%) |
| 8:30 AM to 8:59 AM | 49 (6.2%) | 0 (0.0%) |
| 9:00 AM to 9:59 AM | 33 (4.2%) | 96 (15.4%) |
| 10:00 AM to 10:59 AM | 113 (14.2%) | 0 (0.0%) |
| 11:00 AM to 11:59 AM | 67 (8.4%) | 0 (0.0%) |
| 12:00 PM to 3:59 PM | 14 (1.8%) | 77 (12.3%) |
| 4:00 PM to 11:59 PM | 29 (3.6%) | 0 (0.0%) |
| Total | 794 (100.0%) | 624 (100.0%) |
Housing Occupancy in Indian Head Park
Occupancy by Ownership in Indian Head Park
Of the total 1,800 dwellings in Indian Head Park, owner-occupied units account for 1,567 (87.1%), while renter-occupied units make up 233 (12.9%).
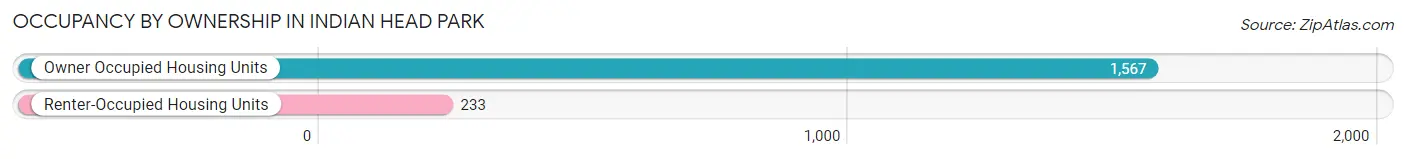
| Occupancy | # Housing Units | % Housing Units |
| Owner Occupied Housing Units | 1,567 | 87.1% |
| Renter-Occupied Housing Units | 233 | 12.9% |
| Total Occupied Housing Units | 1,800 | 100.0% |
Occupancy by Household Size in Indian Head Park
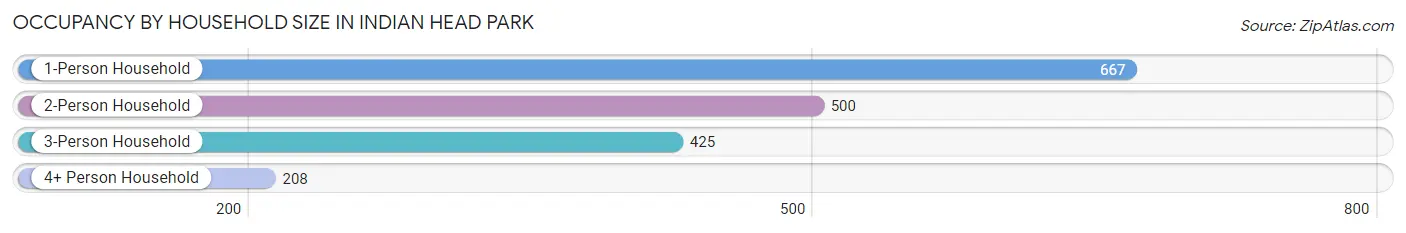
| Household Size | # Housing Units | % Housing Units |
| 1-Person Household | 667 | 37.1% |
| 2-Person Household | 500 | 27.8% |
| 3-Person Household | 425 | 23.6% |
| 4+ Person Household | 208 | 11.6% |
| Total Housing Units | 1,800 | 100.0% |
Occupancy by Ownership by Household Size in Indian Head Park
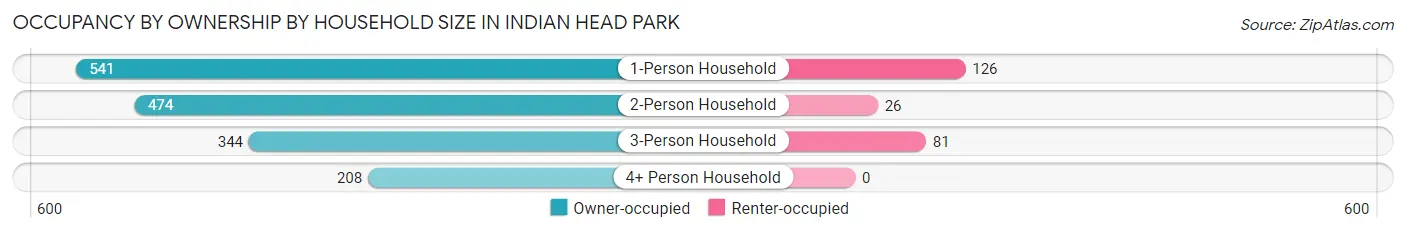
| Household Size | Owner-occupied | Renter-occupied |
| 1-Person Household | 541 (81.1%) | 126 (18.9%) |
| 2-Person Household | 474 (94.8%) | 26 (5.2%) |
| 3-Person Household | 344 (80.9%) | 81 (19.1%) |
| 4+ Person Household | 208 (100.0%) | 0 (0.0%) |
| Total Housing Units | 1,567 (87.1%) | 233 (12.9%) |
Occupancy by Educational Attainment in Indian Head Park
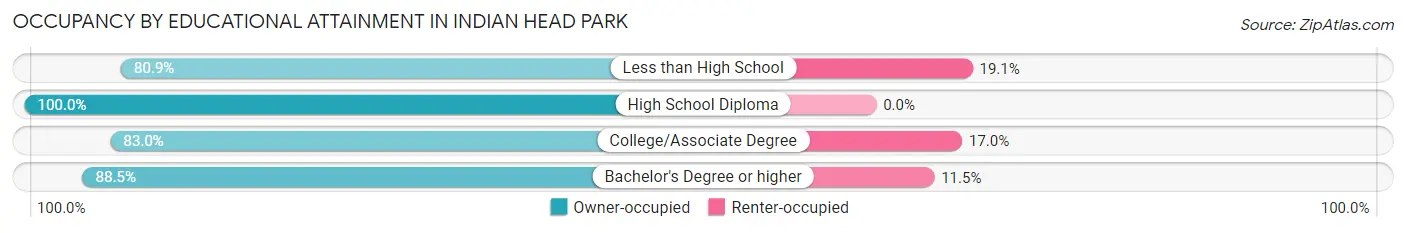
| Household Size | Owner-occupied | Renter-occupied |
| Less than High School | 72 (80.9%) | 17 (19.1%) |
| High School Diploma | 124 (100.0%) | 0 (0.0%) |
| College/Associate Degree | 502 (83.0%) | 103 (17.0%) |
| Bachelor's Degree or higher | 869 (88.5%) | 113 (11.5%) |
Occupancy by Age of Householder in Indian Head Park
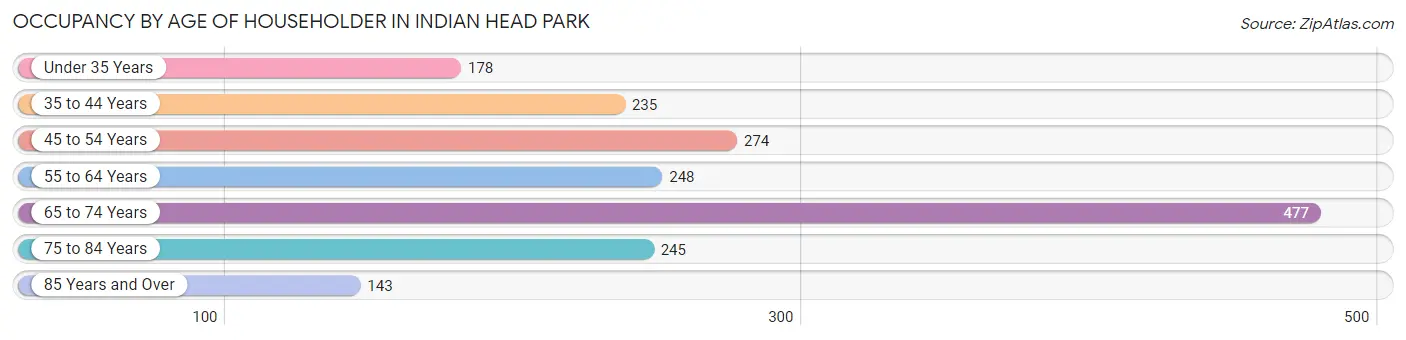
| Age Bracket | # Households | % Households |
| Under 35 Years | 178 | 9.9% |
| 35 to 44 Years | 235 | 13.1% |
| 45 to 54 Years | 274 | 15.2% |
| 55 to 64 Years | 248 | 13.8% |
| 65 to 74 Years | 477 | 26.5% |
| 75 to 84 Years | 245 | 13.6% |
| 85 Years and Over | 143 | 7.9% |
| Total | 1,800 | 100.0% |
Housing Finances in Indian Head Park
Median Income by Occupancy in Indian Head Park
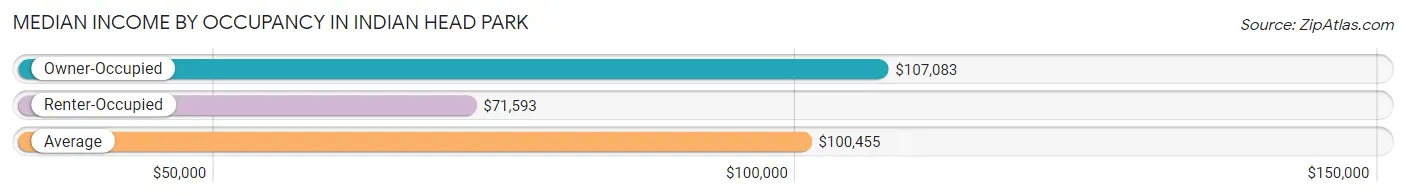
| Occupancy Type | # Households | Median Income |
| Owner-Occupied | 1,567 (87.1%) | $107,083 |
| Renter-Occupied | 233 (12.9%) | $71,593 |
| Average | 1,800 (100.0%) | $100,455 |
Occupancy by Householder Income Bracket in Indian Head Park
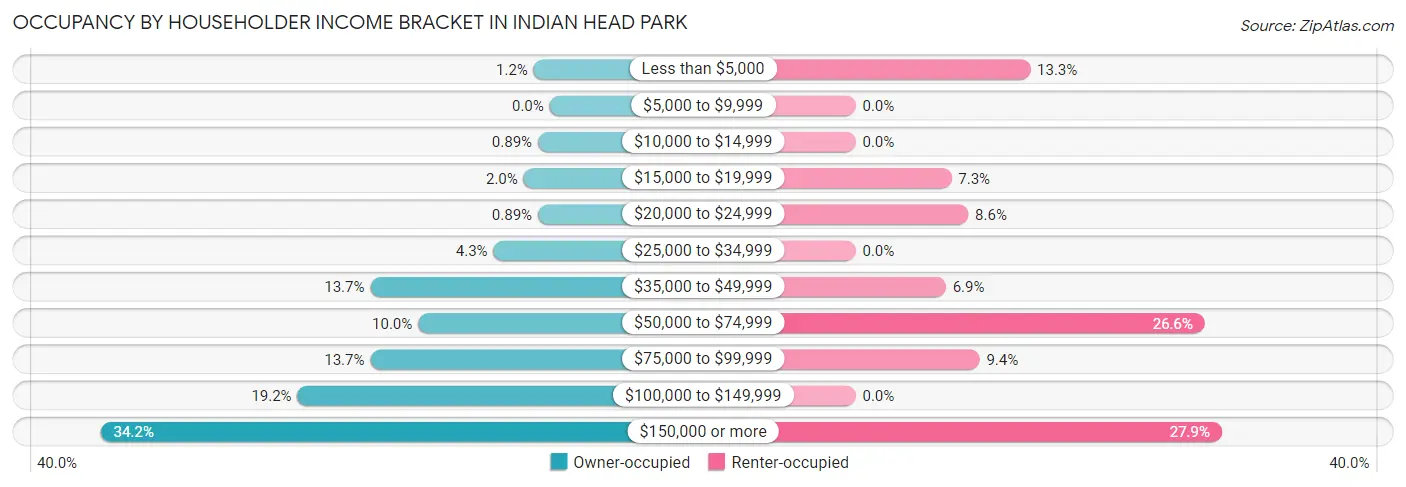
| Income Bracket | Owner-occupied | Renter-occupied |
| Less than $5,000 | 19 (1.2%) | 31 (13.3%) |
| $5,000 to $9,999 | 0 (0.0%) | 0 (0.0%) |
| $10,000 to $14,999 | 14 (0.9%) | 0 (0.0%) |
| $15,000 to $19,999 | 31 (2.0%) | 17 (7.3%) |
| $20,000 to $24,999 | 14 (0.9%) | 20 (8.6%) |
| $25,000 to $34,999 | 67 (4.3%) | 0 (0.0%) |
| $35,000 to $49,999 | 214 (13.7%) | 16 (6.9%) |
| $50,000 to $74,999 | 157 (10.0%) | 62 (26.6%) |
| $75,000 to $99,999 | 214 (13.7%) | 22 (9.4%) |
| $100,000 to $149,999 | 301 (19.2%) | 0 (0.0%) |
| $150,000 or more | 536 (34.2%) | 65 (27.9%) |
| Total | 1,567 (100.0%) | 233 (100.0%) |
Monthly Housing Cost Tiers in Indian Head Park
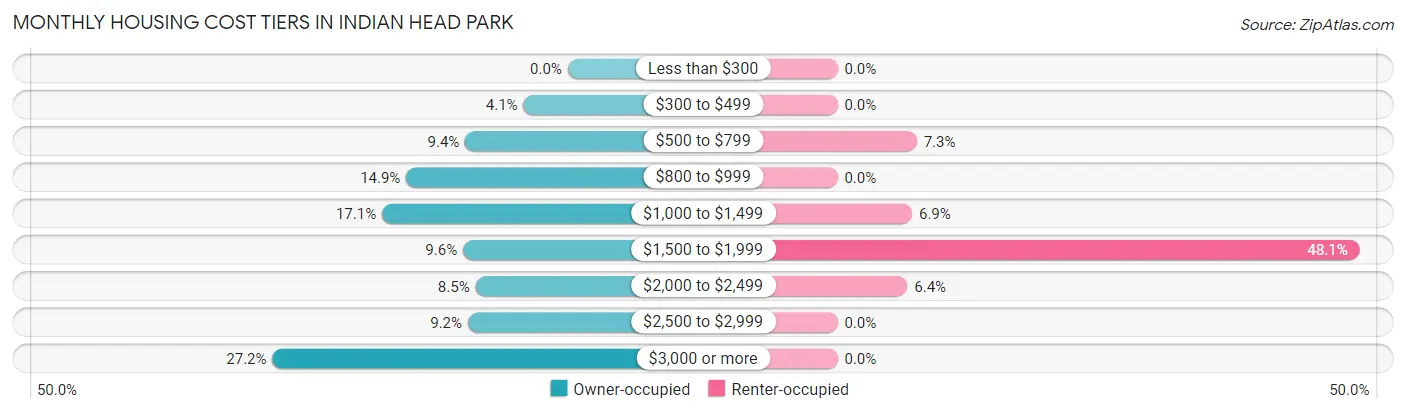
| Monthly Cost | Owner-occupied | Renter-occupied |
| Less than $300 | 0 (0.0%) | 0 (0.0%) |
| $300 to $499 | 64 (4.1%) | 0 (0.0%) |
| $500 to $799 | 148 (9.4%) | 17 (7.3%) |
| $800 to $999 | 233 (14.9%) | 0 (0.0%) |
| $1,000 to $1,499 | 268 (17.1%) | 16 (6.9%) |
| $1,500 to $1,999 | 151 (9.6%) | 112 (48.1%) |
| $2,000 to $2,499 | 133 (8.5%) | 15 (6.4%) |
| $2,500 to $2,999 | 144 (9.2%) | 0 (0.0%) |
| $3,000 or more | 426 (27.2%) | 0 (0.0%) |
| Total | 1,567 (100.0%) | 233 (100.0%) |
Physical Housing Characteristics in Indian Head Park
Housing Structures in Indian Head Park
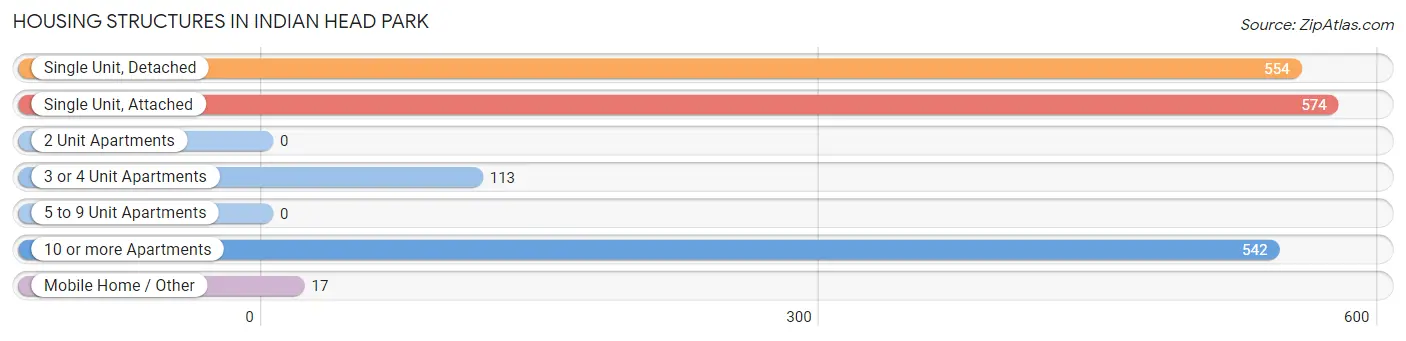
| Structure Type | # Housing Units | % Housing Units |
| Single Unit, Detached | 554 | 30.8% |
| Single Unit, Attached | 574 | 31.9% |
| 2 Unit Apartments | 0 | 0.0% |
| 3 or 4 Unit Apartments | 113 | 6.3% |
| 5 to 9 Unit Apartments | 0 | 0.0% |
| 10 or more Apartments | 542 | 30.1% |
| Mobile Home / Other | 17 | 0.9% |
| Total | 1,800 | 100.0% |
Housing Structures by Occupancy in Indian Head Park
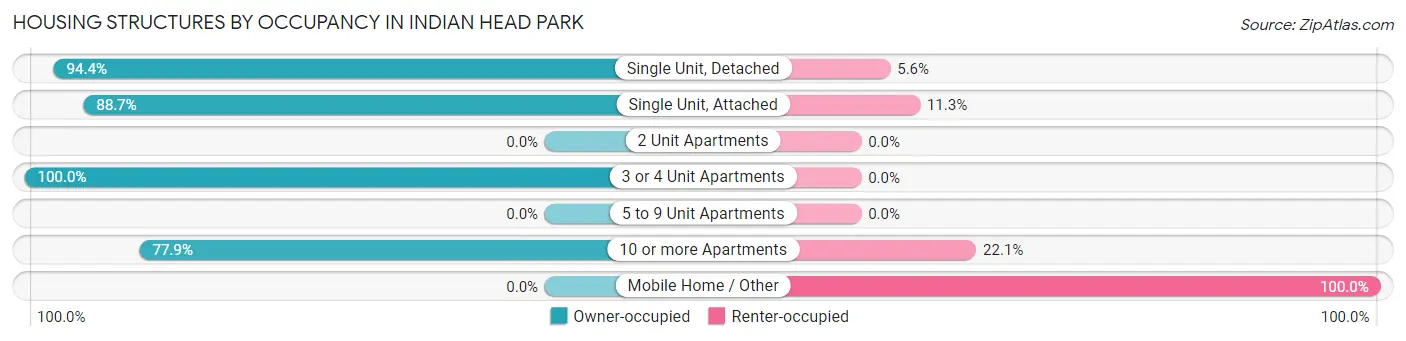
| Structure Type | Owner-occupied | Renter-occupied |
| Single Unit, Detached | 523 (94.4%) | 31 (5.6%) |
| Single Unit, Attached | 509 (88.7%) | 65 (11.3%) |
| 2 Unit Apartments | 0 (0.0%) | 0 (0.0%) |
| 3 or 4 Unit Apartments | 113 (100.0%) | 0 (0.0%) |
| 5 to 9 Unit Apartments | 0 (0.0%) | 0 (0.0%) |
| 10 or more Apartments | 422 (77.9%) | 120 (22.1%) |
| Mobile Home / Other | 0 (0.0%) | 17 (100.0%) |
| Total | 1,567 (87.1%) | 233 (12.9%) |
Housing Structures by Number of Rooms in Indian Head Park
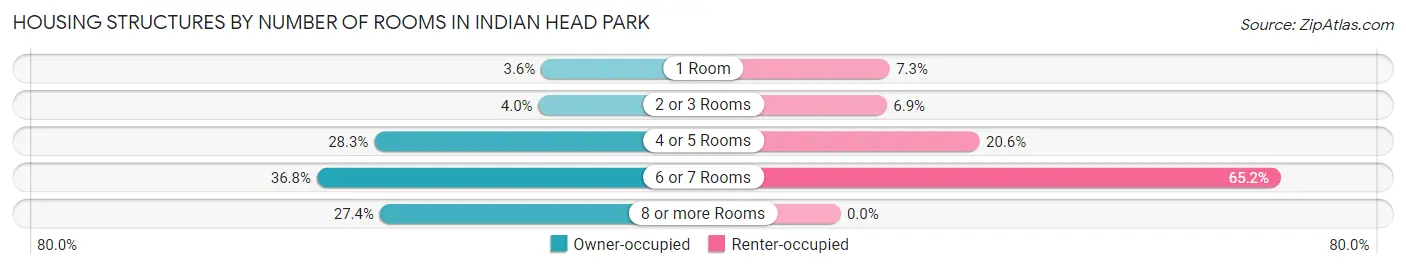
| Number of Rooms | Owner-occupied | Renter-occupied |
| 1 Room | 56 (3.6%) | 17 (7.3%) |
| 2 or 3 Rooms | 62 (4.0%) | 16 (6.9%) |
| 4 or 5 Rooms | 443 (28.3%) | 48 (20.6%) |
| 6 or 7 Rooms | 576 (36.8%) | 152 (65.2%) |
| 8 or more Rooms | 430 (27.4%) | 0 (0.0%) |
| Total | 1,567 (100.0%) | 233 (100.0%) |
Housing Structure by Heating Type in Indian Head Park
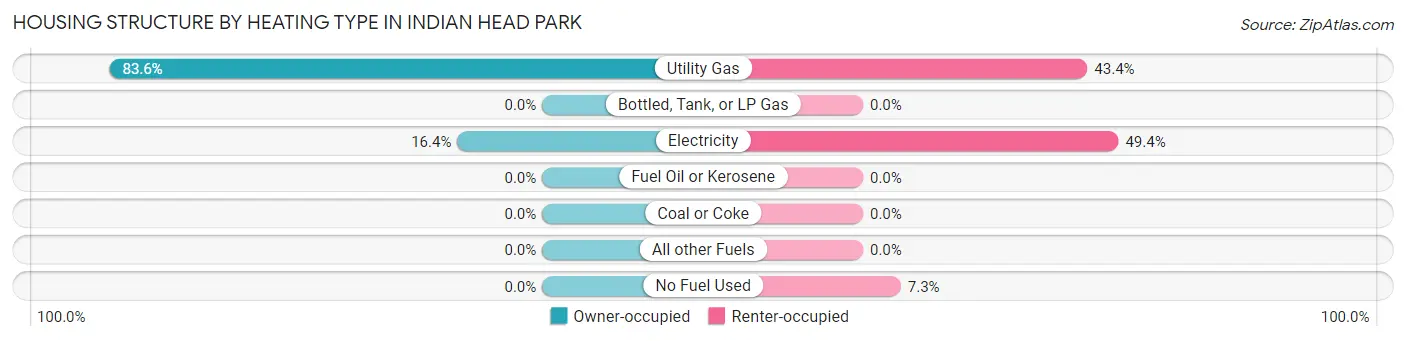
| Heating Type | Owner-occupied | Renter-occupied |
| Utility Gas | 1,310 (83.6%) | 101 (43.3%) |
| Bottled, Tank, or LP Gas | 0 (0.0%) | 0 (0.0%) |
| Electricity | 257 (16.4%) | 115 (49.4%) |
| Fuel Oil or Kerosene | 0 (0.0%) | 0 (0.0%) |
| Coal or Coke | 0 (0.0%) | 0 (0.0%) |
| All other Fuels | 0 (0.0%) | 0 (0.0%) |
| No Fuel Used | 0 (0.0%) | 17 (7.3%) |
| Total | 1,567 (100.0%) | 233 (100.0%) |
Household Vehicle Usage in Indian Head Park
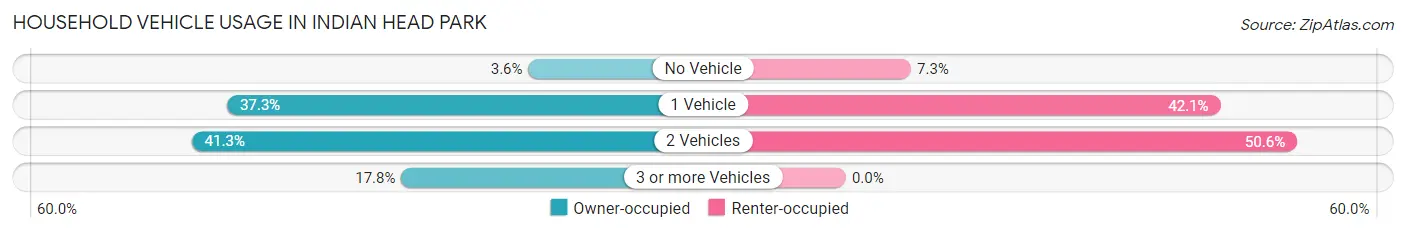
| Vehicles per Household | Owner-occupied | Renter-occupied |
| No Vehicle | 56 (3.6%) | 17 (7.3%) |
| 1 Vehicle | 585 (37.3%) | 98 (42.1%) |
| 2 Vehicles | 647 (41.3%) | 118 (50.6%) |
| 3 or more Vehicles | 279 (17.8%) | 0 (0.0%) |
| Total | 1,567 (100.0%) | 233 (100.0%) |
Real Estate & Mortgages in Indian Head Park
Real Estate and Mortgage Overview in Indian Head Park
| Characteristic | Without Mortgage | With Mortgage |
| Housing Units | 557 | 1,010 |
| Median Property Value | $269,400 | $360,200 |
| Median Household Income | $77,784 | $443 |
| Monthly Housing Costs | $855 | $426 |
| Real Estate Taxes | $3,728 | $0 |
Property Value by Mortgage Status in Indian Head Park
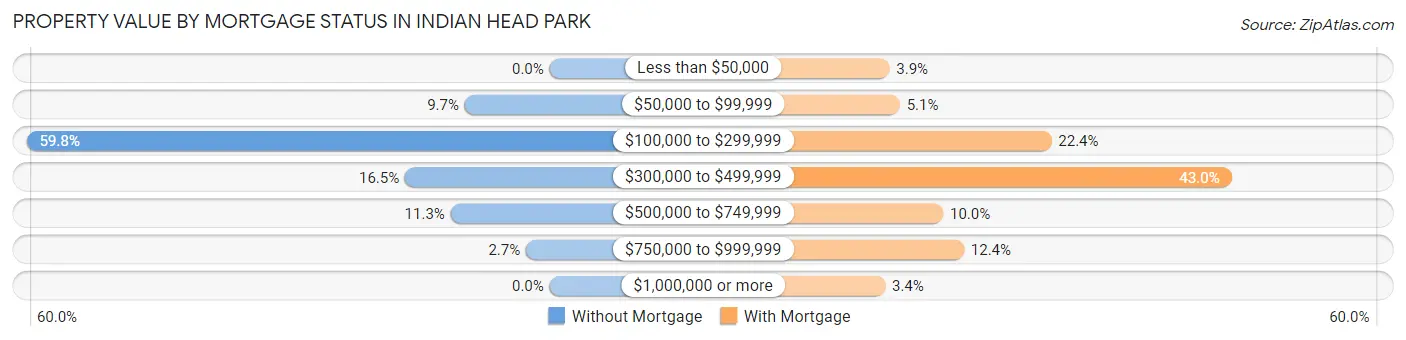
| Property Value | Without Mortgage | With Mortgage |
| Less than $50,000 | 0 (0.0%) | 39 (3.9%) |
| $50,000 to $99,999 | 54 (9.7%) | 51 (5.1%) |
| $100,000 to $299,999 | 333 (59.8%) | 226 (22.4%) |
| $300,000 to $499,999 | 92 (16.5%) | 434 (43.0%) |
| $500,000 to $749,999 | 63 (11.3%) | 101 (10.0%) |
| $750,000 to $999,999 | 15 (2.7%) | 125 (12.4%) |
| $1,000,000 or more | 0 (0.0%) | 34 (3.4%) |
| Total | 557 (100.0%) | 1,010 (100.0%) |
Household Income by Mortgage Status in Indian Head Park
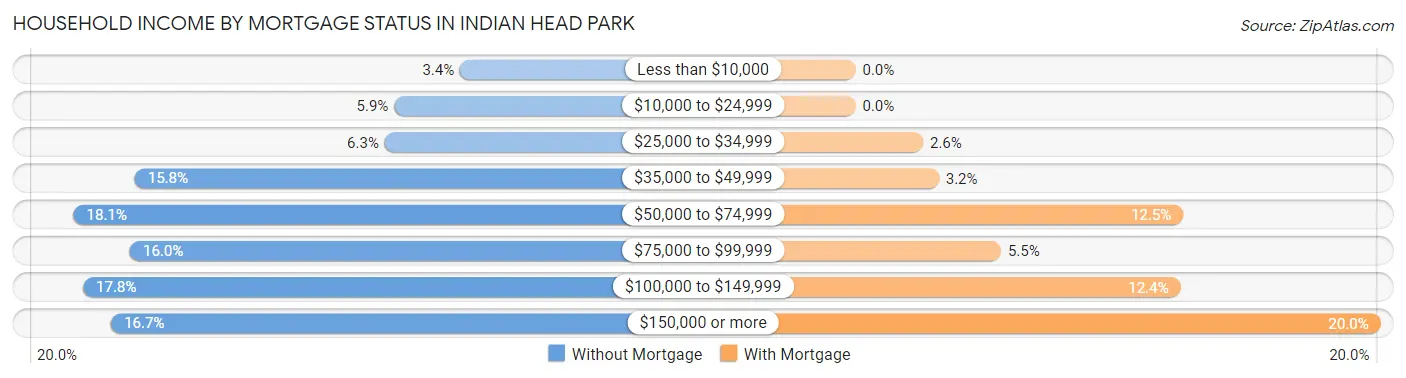
| Household Income | Without Mortgage | With Mortgage |
| Less than $10,000 | 19 (3.4%) | 0 (0.0%) |
| $10,000 to $24,999 | 33 (5.9%) | 0 (0.0%) |
| $25,000 to $34,999 | 35 (6.3%) | 26 (2.6%) |
| $35,000 to $49,999 | 88 (15.8%) | 32 (3.2%) |
| $50,000 to $74,999 | 101 (18.1%) | 126 (12.5%) |
| $75,000 to $99,999 | 89 (16.0%) | 56 (5.5%) |
| $100,000 to $149,999 | 99 (17.8%) | 125 (12.4%) |
| $150,000 or more | 93 (16.7%) | 202 (20.0%) |
| Total | 557 (100.0%) | 1,010 (100.0%) |
Property Value to Household Income Ratio in Indian Head Park
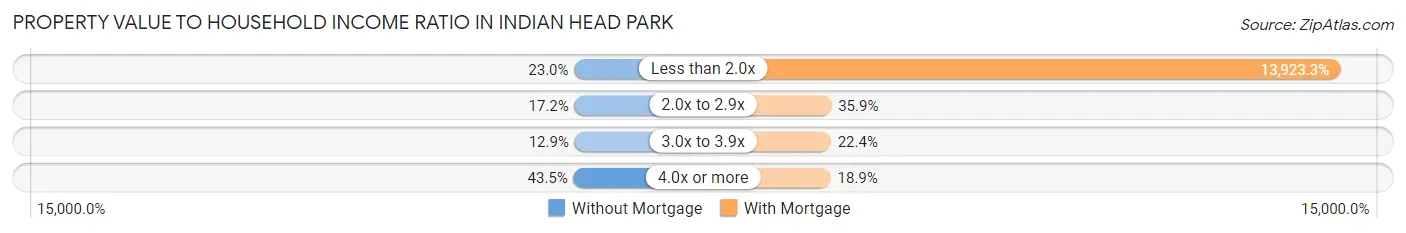
| Value-to-Income Ratio | Without Mortgage | With Mortgage |
| Less than 2.0x | 128 (23.0%) | 140,625 (13,923.3%) |
| 2.0x to 2.9x | 96 (17.2%) | 363 (35.9%) |
| 3.0x to 3.9x | 72 (12.9%) | 226 (22.4%) |
| 4.0x or more | 242 (43.4%) | 191 (18.9%) |
| Total | 557 (100.0%) | 1,010 (100.0%) |
Real Estate Taxes by Mortgage Status in Indian Head Park
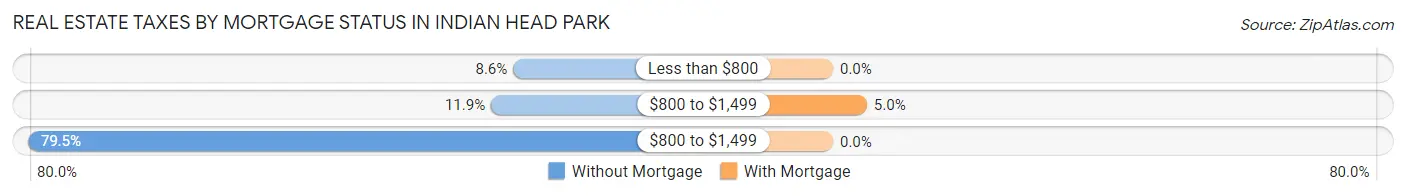
| Property Taxes | Without Mortgage | With Mortgage |
| Less than $800 | 48 (8.6%) | 0 (0.0%) |
| $800 to $1,499 | 66 (11.8%) | 50 (5.0%) |
| $800 to $1,499 | 443 (79.5%) | 0 (0.0%) |
| Total | 557 (100.0%) | 1,010 (100.0%) |
Health & Disability in Indian Head Park
Health Insurance Coverage by Age in Indian Head Park
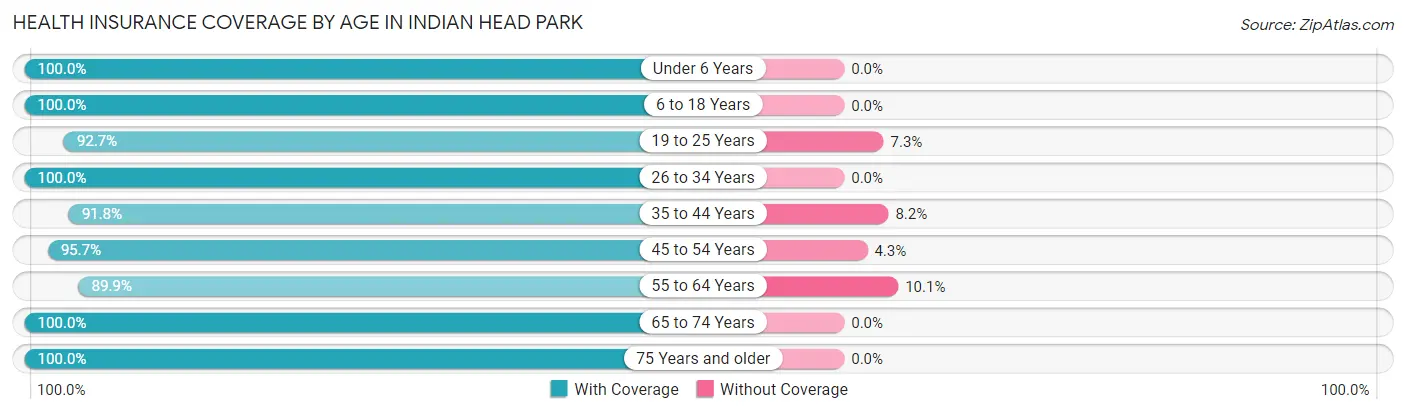
| Age Bracket | With Coverage | Without Coverage |
| Under 6 Years | 227 (100.0%) | 0 (0.0%) |
| 6 to 18 Years | 479 (100.0%) | 0 (0.0%) |
| 19 to 25 Years | 215 (92.7%) | 17 (7.3%) |
| 26 to 34 Years | 276 (100.0%) | 0 (0.0%) |
| 35 to 44 Years | 334 (91.8%) | 30 (8.2%) |
| 45 to 54 Years | 487 (95.7%) | 22 (4.3%) |
| 55 to 64 Years | 429 (89.9%) | 48 (10.1%) |
| 65 to 74 Years | 729 (100.0%) | 0 (0.0%) |
| 75 Years and older | 478 (100.0%) | 0 (0.0%) |
| Total | 3,654 (96.9%) | 117 (3.1%) |
Health Insurance Coverage by Citizenship Status in Indian Head Park
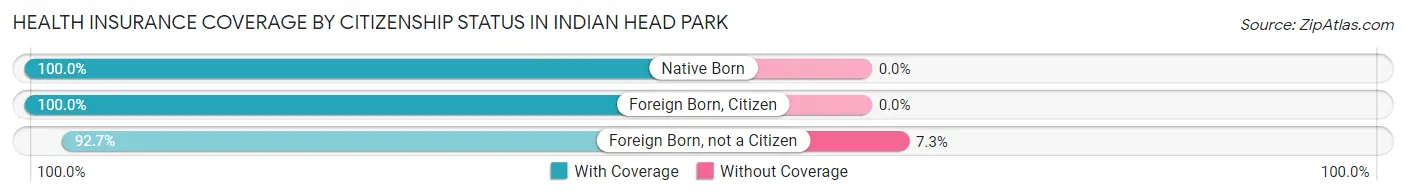
| Citizenship Status | With Coverage | Without Coverage |
| Native Born | 227 (100.0%) | 0 (0.0%) |
| Foreign Born, Citizen | 479 (100.0%) | 0 (0.0%) |
| Foreign Born, not a Citizen | 215 (92.7%) | 17 (7.3%) |
Health Insurance Coverage by Household Income in Indian Head Park
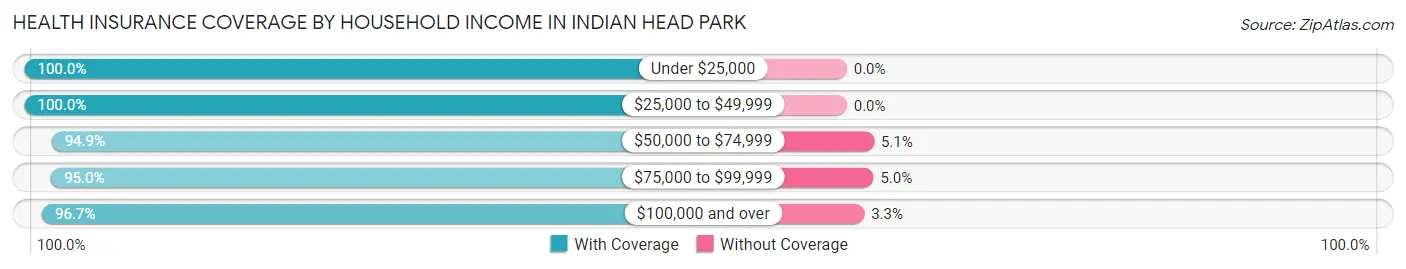
| Household Income | With Coverage | Without Coverage |
| Under $25,000 | 242 (100.0%) | 0 (0.0%) |
| $25,000 to $49,999 | 372 (100.0%) | 0 (0.0%) |
| $50,000 to $74,999 | 317 (94.9%) | 17 (5.1%) |
| $75,000 to $99,999 | 418 (95.0%) | 22 (5.0%) |
| $100,000 and over | 2,305 (96.7%) | 78 (3.3%) |
Public vs Private Health Insurance Coverage by Age in Indian Head Park
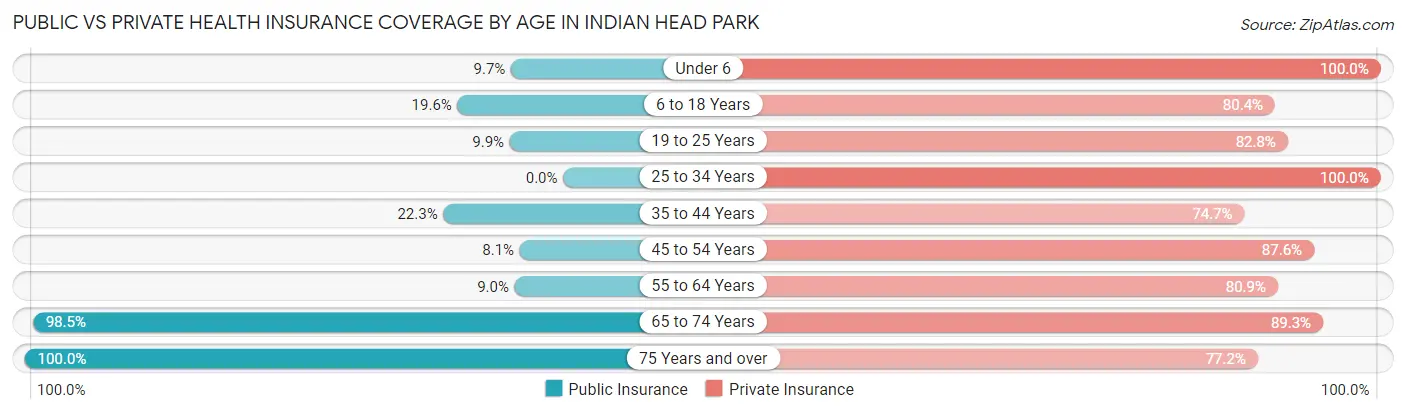
| Age Bracket | Public Insurance | Private Insurance |
| Under 6 | 22 (9.7%) | 227 (100.0%) |
| 6 to 18 Years | 94 (19.6%) | 385 (80.4%) |
| 19 to 25 Years | 23 (9.9%) | 192 (82.8%) |
| 25 to 34 Years | 0 (0.0%) | 276 (100.0%) |
| 35 to 44 Years | 81 (22.3%) | 272 (74.7%) |
| 45 to 54 Years | 41 (8.1%) | 446 (87.6%) |
| 55 to 64 Years | 43 (9.0%) | 386 (80.9%) |
| 65 to 74 Years | 718 (98.5%) | 651 (89.3%) |
| 75 Years and over | 478 (100.0%) | 369 (77.2%) |
| Total | 1,500 (39.8%) | 3,204 (85.0%) |
Disability Status by Sex by Age in Indian Head Park
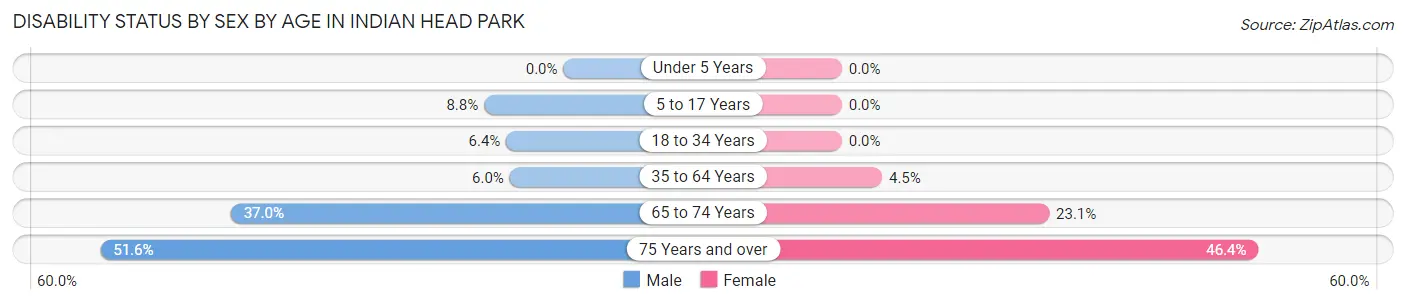
| Age Bracket | Male | Female |
| Under 5 Years | 0 (0.0%) | 0 (0.0%) |
| 5 to 17 Years | 31 (8.8%) | 0 (0.0%) |
| 18 to 34 Years | 17 (6.4%) | 0 (0.0%) |
| 35 to 64 Years | 38 (6.0%) | 32 (4.5%) |
| 65 to 74 Years | 100 (37.0%) | 106 (23.1%) |
| 75 Years and over | 82 (51.6%) | 148 (46.4%) |
Disability Class by Sex by Age in Indian Head Park
Disability Class: Hearing Difficulty
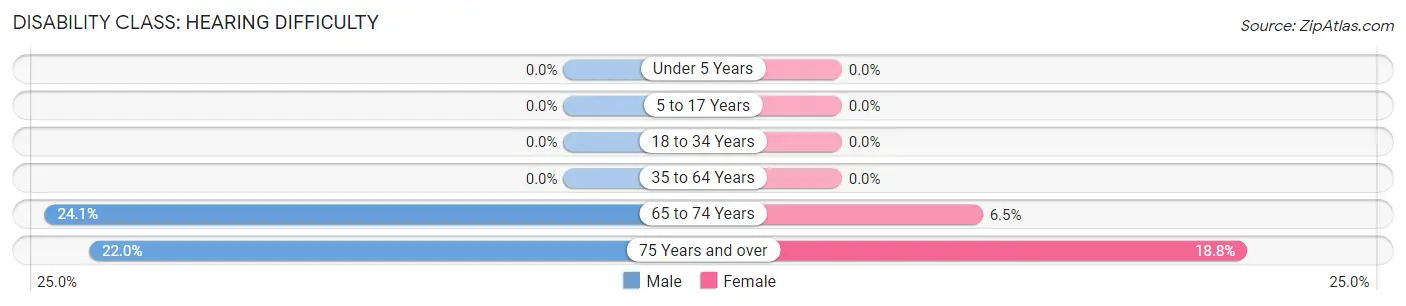
| Age Bracket | Male | Female |
| Under 5 Years | 0 (0.0%) | 0 (0.0%) |
| 5 to 17 Years | 0 (0.0%) | 0 (0.0%) |
| 18 to 34 Years | 0 (0.0%) | 0 (0.0%) |
| 35 to 64 Years | 0 (0.0%) | 0 (0.0%) |
| 65 to 74 Years | 65 (24.1%) | 30 (6.5%) |
| 75 Years and over | 35 (22.0%) | 60 (18.8%) |
Disability Class: Vision Difficulty
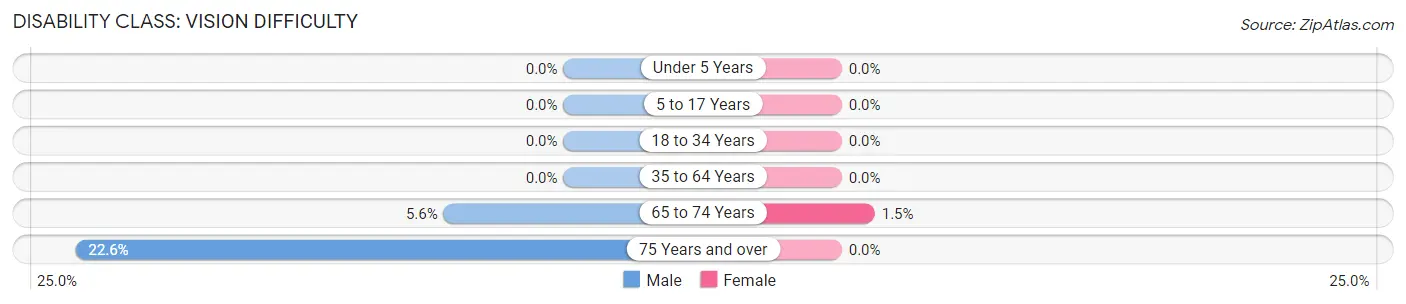
| Age Bracket | Male | Female |
| Under 5 Years | 0 (0.0%) | 0 (0.0%) |
| 5 to 17 Years | 0 (0.0%) | 0 (0.0%) |
| 18 to 34 Years | 0 (0.0%) | 0 (0.0%) |
| 35 to 64 Years | 0 (0.0%) | 0 (0.0%) |
| 65 to 74 Years | 15 (5.6%) | 7 (1.5%) |
| 75 Years and over | 36 (22.6%) | 0 (0.0%) |
Disability Class: Cognitive Difficulty
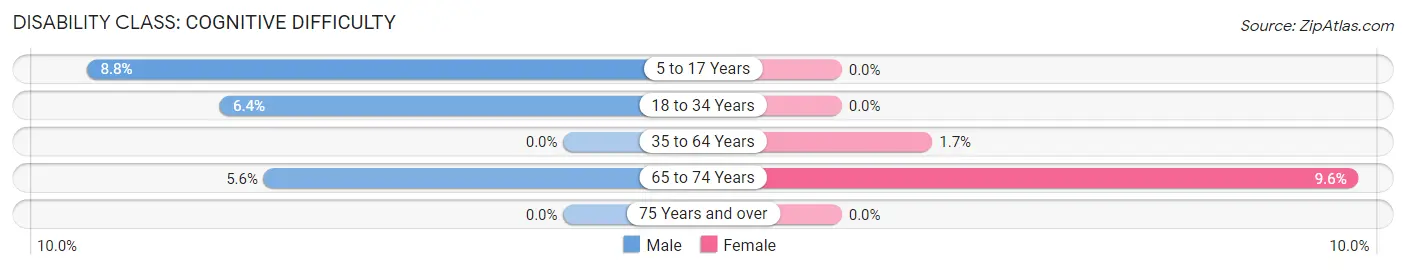
| Age Bracket | Male | Female |
| 5 to 17 Years | 31 (8.8%) | 0 (0.0%) |
| 18 to 34 Years | 17 (6.4%) | 0 (0.0%) |
| 35 to 64 Years | 0 (0.0%) | 12 (1.7%) |
| 65 to 74 Years | 15 (5.6%) | 44 (9.6%) |
| 75 Years and over | 0 (0.0%) | 0 (0.0%) |
Disability Class: Ambulatory Difficulty
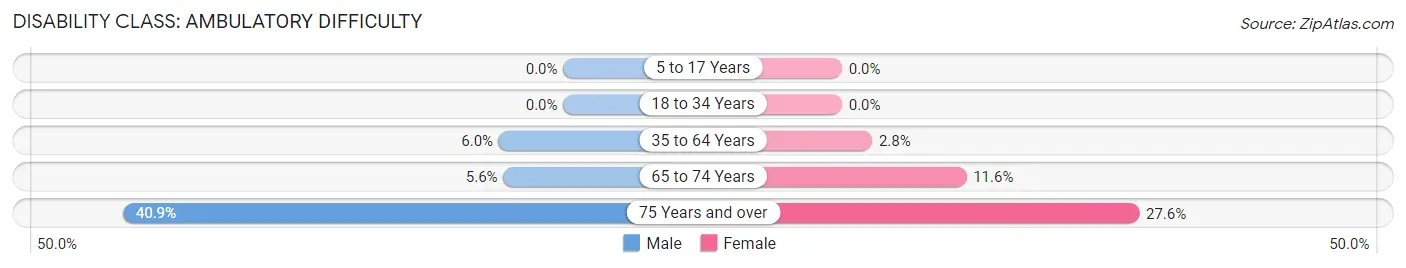
| Age Bracket | Male | Female |
| 5 to 17 Years | 0 (0.0%) | 0 (0.0%) |
| 18 to 34 Years | 0 (0.0%) | 0 (0.0%) |
| 35 to 64 Years | 38 (6.0%) | 20 (2.8%) |
| 65 to 74 Years | 15 (5.6%) | 53 (11.6%) |
| 75 Years and over | 65 (40.9%) | 88 (27.6%) |
Disability Class: Self-Care Difficulty
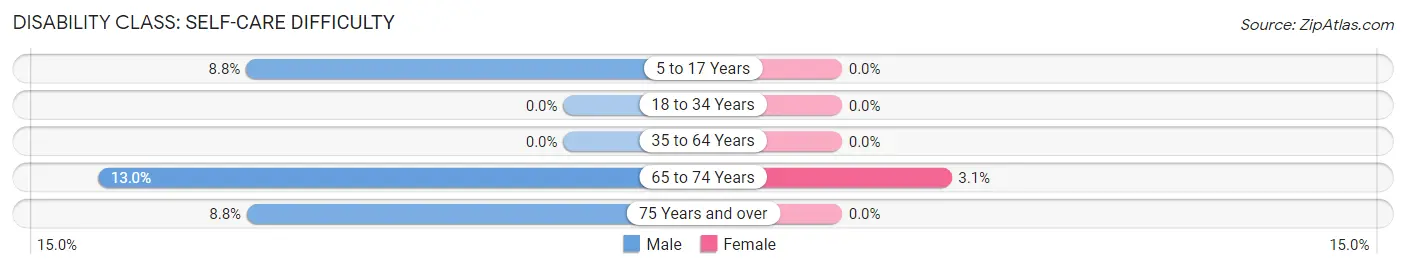
| Age Bracket | Male | Female |
| 5 to 17 Years | 31 (8.8%) | 0 (0.0%) |
| 18 to 34 Years | 0 (0.0%) | 0 (0.0%) |
| 35 to 64 Years | 0 (0.0%) | 0 (0.0%) |
| 65 to 74 Years | 35 (13.0%) | 14 (3.0%) |
| 75 Years and over | 14 (8.8%) | 0 (0.0%) |
Technology Access in Indian Head Park
Computing Device Access in Indian Head Park
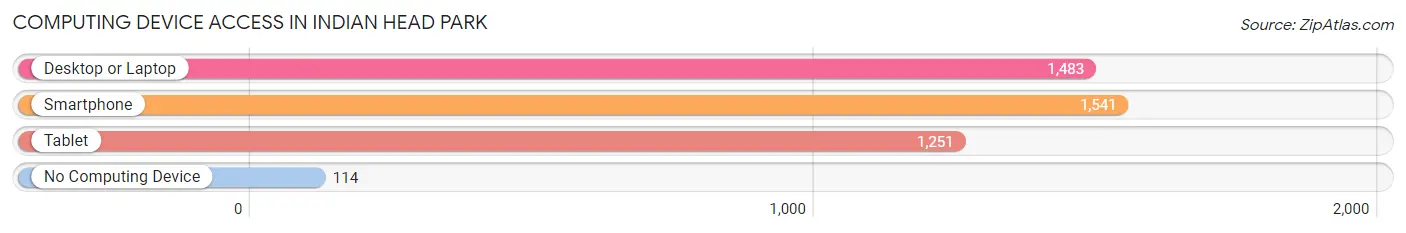
| Device Type | # Households | % Households |
| Desktop or Laptop | 1,483 | 82.4% |
| Smartphone | 1,541 | 85.6% |
| Tablet | 1,251 | 69.5% |
| No Computing Device | 114 | 6.3% |
| Total | 1,800 | 100.0% |
Internet Access in Indian Head Park
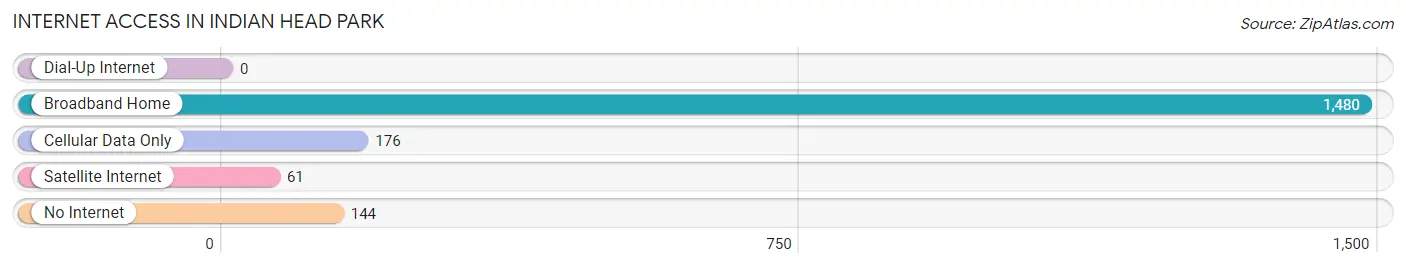
| Internet Type | # Households | % Households |
| Dial-Up Internet | 0 | 0.0% |
| Broadband Home | 1,480 | 82.2% |
| Cellular Data Only | 176 | 9.8% |
| Satellite Internet | 61 | 3.4% |
| No Internet | 144 | 8.0% |
| Total | 1,800 | 100.0% |
Indian Head Park Summary
Heading Introduction to Indian Head Park IL
Indian Head Park, IL is a small village located in Cook County, Illinois. It is situated approximately 20 miles southwest of downtown Chicago and is part of the Chicago metropolitan area. The village was incorporated in 1957 and has a population of approximately 4,000 people. Indian Head Park is known for its small-town charm and its close proximity to the city of Chicago.
Geography
Indian Head Park is located in Cook County, Illinois, approximately 20 miles southwest of downtown Chicago. The village is situated on the Des Plaines River and is bordered by the villages of Burr Ridge, Willowbrook, and La Grange. The village covers an area of 1.3 square miles and is located at an elevation of 645 feet. The climate in Indian Head Park is classified as humid continental, with hot summers and cold winters.
Demographics
As of the 2010 census, the population of Indian Head Park was 4,000 people. The racial makeup of the village was 94.2% White, 1.2% African American, 0.2% Native American, 2.2% Asian, and 2.2% from other races. The median household income in Indian Head Park was $90,000, and the median family income was $103,000.
Economy
Indian Head Park is primarily a residential community, with most of its residents commuting to nearby cities for work. The village is home to several small businesses, including restaurants, retail stores, and professional services. The village also has a few industrial parks, which provide employment opportunities for local residents.
History
Indian Head Park was first settled in the early 1800s by a group of Native Americans. The village was officially incorporated in 1957 and was named after the nearby Indian Head Park. The village was originally a farming community, but it has since become a residential community.
Conclusion
Indian Head Park, IL is a small village located in Cook County, Illinois. It is situated approximately 20 miles southwest of downtown Chicago and is part of the Chicago metropolitan area. The village was incorporated in 1957 and has a population of approximately 4,000 people. Indian Head Park is known for its small-town charm and its close proximity to the city of Chicago. The village is primarily a residential community, with most of its residents commuting to nearby cities for work. The village is home to several small businesses, including restaurants, retail stores, and professional services. Indian Head Park has a rich history, and it is a great place to live and work.
Common Questions
What is Per Capita Income in Indian Head Park?
Per Capita income in Indian Head Park is $72,100.
What is the Median Family Income in Indian Head Park?
Median Family Income in Indian Head Park is $151,974.
What is the Median Household income in Indian Head Park?
Median Household Income in Indian Head Park is $100,455.
What is Income or Wage Gap in Indian Head Park?
Income or Wage Gap in Indian Head Park is 3.2%.
Women in Indian Head Park earn 96.8 cents for every dollar earned by a man.
What is Inequality or Gini Index in Indian Head Park?
Inequality or Gini Index in Indian Head Park is 0.50.
What is the Total Population of Indian Head Park?
Total Population of Indian Head Park is 4,022.
What is the Total Male Population of Indian Head Park?
Total Male Population of Indian Head Park is 1,934.
What is the Total Female Population of Indian Head Park?
Total Female Population of Indian Head Park is 2,088.
What is the Ratio of Males per 100 Females in Indian Head Park?
There are 92.62 Males per 100 Females in Indian Head Park.
What is the Ratio of Females per 100 Males in Indian Head Park?
There are 107.96 Females per 100 Males in Indian Head Park.
What is the Median Population Age in Indian Head Park?
Median Population Age in Indian Head Park is 52.9 Years.
What is the Average Family Size in Indian Head Park
Average Family Size in Indian Head Park is 2.8 People.
What is the Average Household Size in Indian Head Park
Average Household Size in Indian Head Park is 2.1 People.
How Large is the Labor Force in Indian Head Park?
There are 1,839 People in the Labor Forcein in Indian Head Park.
What is the Percentage of People in the Labor Force in Indian Head Park?
54.1% of People are in the Labor Force in Indian Head Park.
What is the Unemployment Rate in Indian Head Park?
Unemployment Rate in Indian Head Park is 7.3%.