Deerfield, IL Map & Demographics
Deerfield Map
Deerfield Overview
$92,981
PER CAPITA INCOME
$212,582
AVG FAMILY INCOME
$185,762
AVG HOUSEHOLD INCOME
47.8%
WAGE / INCOME GAP [ % ]
52.2¢/ $1
WAGE / INCOME GAP [ $ ]
0.46
INEQUALITY / GINI INDEX
19,173
TOTAL POPULATION
9,677
MALE POPULATION
9,496
FEMALE POPULATION
101.91
MALES / 100 FEMALES
98.13
FEMALES / 100 MALES
44.6
MEDIAN AGE
3.0
AVG FAMILY SIZE
2.6
AVG HOUSEHOLD SIZE
10,433
LABOR FORCE [ PEOPLE ]
68.2%
PERCENT IN LABOR FORCE
2.4%
UNEMPLOYMENT RATE
Deerfield Zip Codes
Income in Deerfield
Income Overview in Deerfield
Per Capita Income in Deerfield is $92,981, while median incomes of families and households are $212,582 and $185,762 respectively.
| Characteristic | Number | Measure |
| Per Capita Income | 19,173 | $92,981 |
| Median Family Income | 5,544 | $212,582 |
| Mean Family Income | 5,544 | $277,044 |
| Median Household Income | 7,358 | $185,762 |
| Mean Household Income | 7,358 | $240,571 |
| Income Deficit | 5,544 | $0 |
| Wage / Income Gap (%) | 19,173 | 47.77% |
| Wage / Income Gap ($) | 19,173 | 52.23¢ per $1 |
| Gini / Inequality Index | 19,173 | 0.46 |
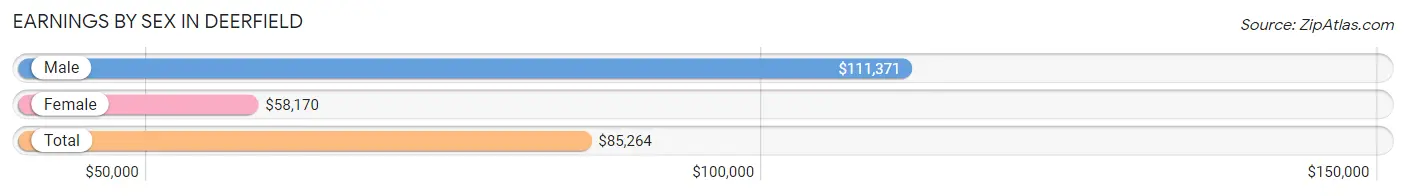
Earnings by Sex in Deerfield
Average Earnings in Deerfield are $85,264, $111,371 for men and $58,170 for women, a difference of 47.8%.
| Sex | Number | Average Earnings |
| Male | 6,158 (55.3%) | $111,371 |
| Female | 4,981 (44.7%) | $58,170 |
| Total | 11,139 (100.0%) | $85,264 |
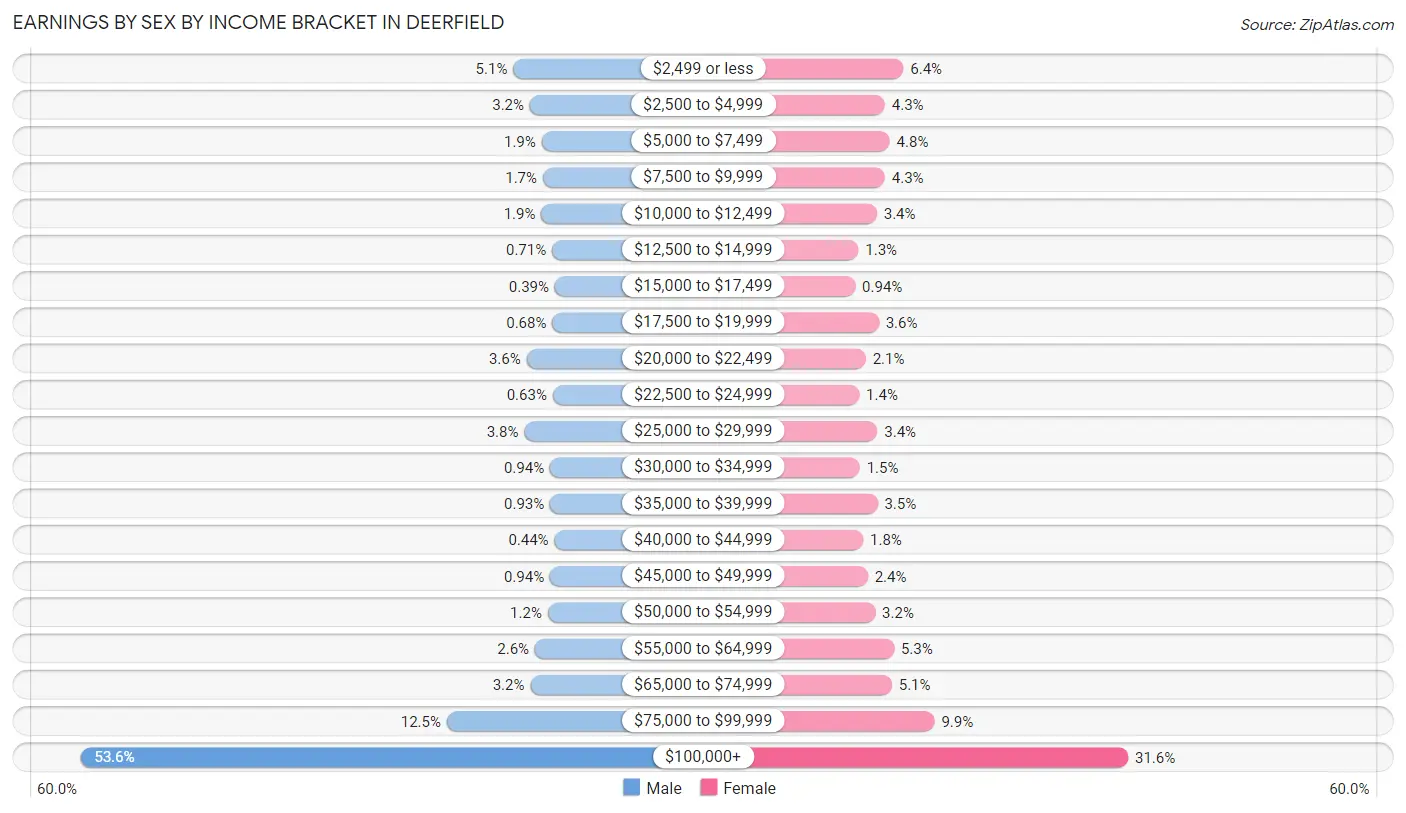
Earnings by Sex by Income Bracket in Deerfield
The most common earnings brackets in Deerfield are $100,000+ for men (3,302 | 53.6%) and $100,000+ for women (1,575 | 31.6%).
| Income | Male | Female |
| $2,499 or less | 312 (5.1%) | 317 (6.4%) |
| $2,500 to $4,999 | 197 (3.2%) | 213 (4.3%) |
| $5,000 to $7,499 | 116 (1.9%) | 240 (4.8%) |
| $7,500 to $9,999 | 107 (1.7%) | 213 (4.3%) |
| $10,000 to $12,499 | 118 (1.9%) | 168 (3.4%) |
| $12,500 to $14,999 | 44 (0.7%) | 65 (1.3%) |
| $15,000 to $17,499 | 24 (0.4%) | 47 (0.9%) |
| $17,500 to $19,999 | 42 (0.7%) | 179 (3.6%) |
| $20,000 to $22,499 | 220 (3.6%) | 106 (2.1%) |
| $22,500 to $24,999 | 39 (0.6%) | 69 (1.4%) |
| $25,000 to $29,999 | 236 (3.8%) | 171 (3.4%) |
| $30,000 to $34,999 | 58 (0.9%) | 72 (1.5%) |
| $35,000 to $39,999 | 57 (0.9%) | 172 (3.5%) |
| $40,000 to $44,999 | 27 (0.4%) | 91 (1.8%) |
| $45,000 to $49,999 | 58 (0.9%) | 117 (2.4%) |
| $50,000 to $54,999 | 73 (1.2%) | 159 (3.2%) |
| $55,000 to $64,999 | 162 (2.6%) | 264 (5.3%) |
| $65,000 to $74,999 | 194 (3.2%) | 252 (5.1%) |
| $75,000 to $99,999 | 772 (12.5%) | 491 (9.9%) |
| $100,000+ | 3,302 (53.6%) | 1,575 (31.6%) |
| Total | 6,158 (100.0%) | 4,981 (100.0%) |
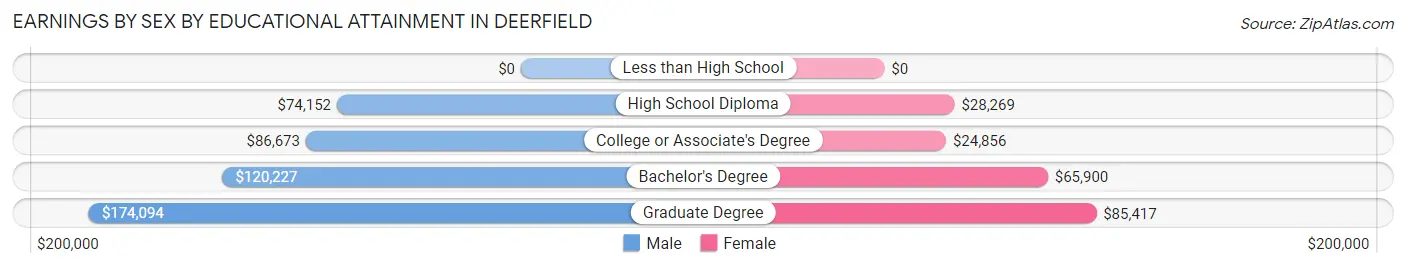
Earnings by Sex by Educational Attainment in Deerfield
Average earnings in Deerfield are $127,419 for men and $67,431 for women, a difference of 47.1%. Men with an educational attainment of graduate degree enjoy the highest average annual earnings of $174,094, while those with high school diploma education earn the least with $74,152. Women with an educational attainment of graduate degree earn the most with the average annual earnings of $85,417, while those with college or associate's degree education have the smallest earnings of $24,856.
| Educational Attainment | Male Income | Female Income |
| Less than High School | - | - |
| High School Diploma | $74,152 | $28,269 |
| College or Associate's Degree | $86,673 | $24,856 |
| Bachelor's Degree | $120,227 | $65,900 |
| Graduate Degree | $174,094 | $85,417 |
| Total | $127,419 | $67,431 |
Family Income in Deerfield
Family Income Brackets in Deerfield
According to the Deerfield family income data, there are 2,916 families falling into the $200,000+ income range, which is the most common income bracket and makes up 52.6% of all families. Conversely, the $10,000 to $14,999 income bracket is the least frequent group with only 6 families (0.1%) belonging to this category.
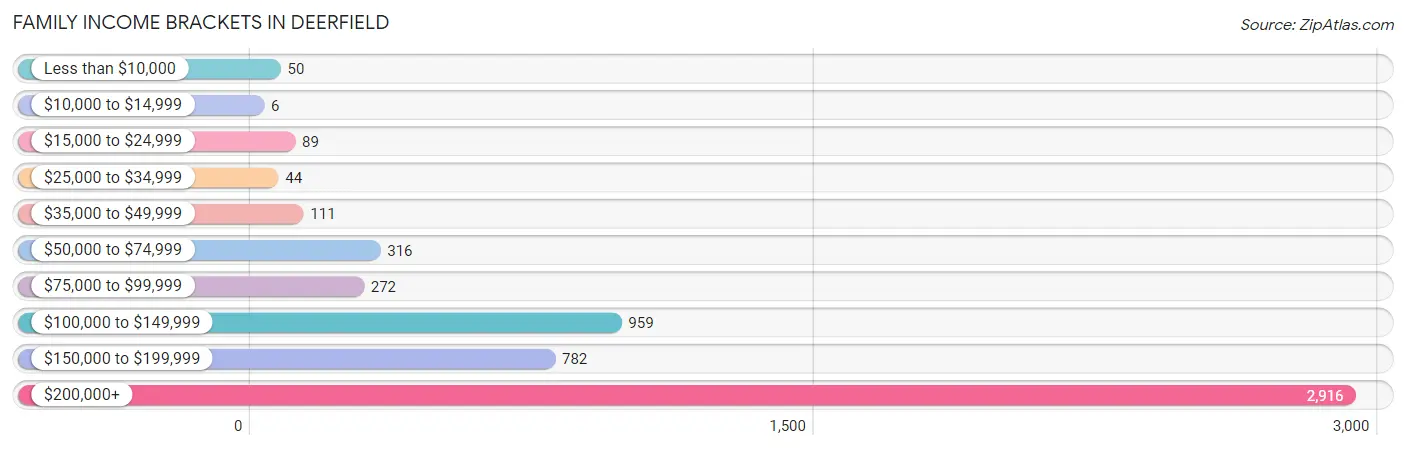
| Income Bracket | # Families | % Families |
| Less than $10,000 | 50 | 0.9% |
| $10,000 to $14,999 | 6 | 0.1% |
| $15,000 to $24,999 | 89 | 1.6% |
| $25,000 to $34,999 | 44 | 0.8% |
| $35,000 to $49,999 | 111 | 2.0% |
| $50,000 to $74,999 | 316 | 5.7% |
| $75,000 to $99,999 | 272 | 4.9% |
| $100,000 to $149,999 | 959 | 17.3% |
| $150,000 to $199,999 | 782 | 14.1% |
| $200,000+ | 2,916 | 52.6% |
Family Income by Famaliy Size in Deerfield
5-person families (398 | 7.2%) account for the highest median family income in Deerfield with $239,000 per family, while 2-person families (2,629 | 47.4%) have the highest median income of $95,164 per family member.
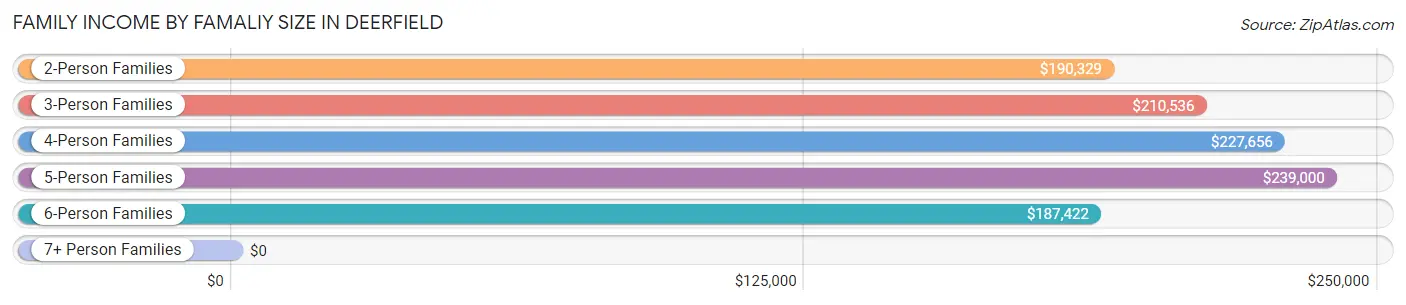
| Income Bracket | # Families | Median Income |
| 2-Person Families | 2,629 (47.4%) | $190,329 |
| 3-Person Families | 1,187 (21.4%) | $210,536 |
| 4-Person Families | 1,235 (22.3%) | $227,656 |
| 5-Person Families | 398 (7.2%) | $239,000 |
| 6-Person Families | 85 (1.5%) | $187,422 |
| 7+ Person Families | 10 (0.2%) | $0 |
| Total | 5,544 (100.0%) | $212,582 |
Family Income by Number of Earners in Deerfield
The median family income in Deerfield is $212,582, with families comprising 3+ earners (733) having the highest median family income of $241,615, while families with no earners (475) have the lowest median family income of $100,750, accounting for 13.2% and 8.6% of families, respectively.
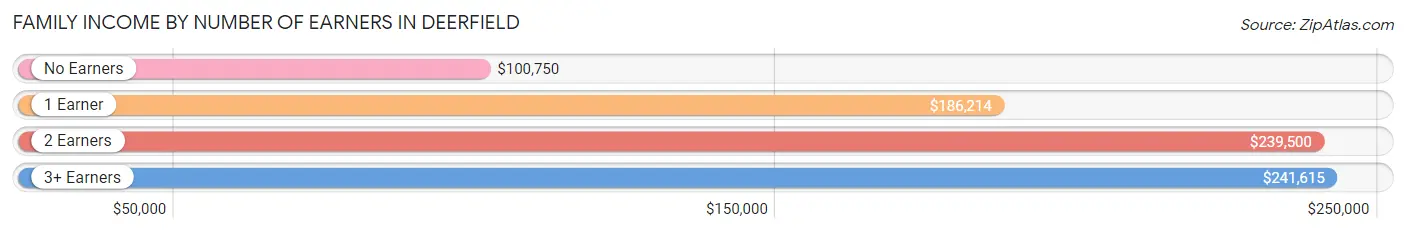
| Number of Earners | # Families | Median Income |
| No Earners | 475 (8.6%) | $100,750 |
| 1 Earner | 1,558 (28.1%) | $186,214 |
| 2 Earners | 2,778 (50.1%) | $239,500 |
| 3+ Earners | 733 (13.2%) | $241,615 |
| Total | 5,544 (100.0%) | $212,582 |
Household Income in Deerfield
Household Income Brackets in Deerfield
With 3,260 households falling in the category, the $200,000+ income range is the most frequent in Deerfield, accounting for 44.3% of all households. In contrast, only 88 households (1.2%) fall into the $10,000 to $14,999 income bracket, making it the least populous group.
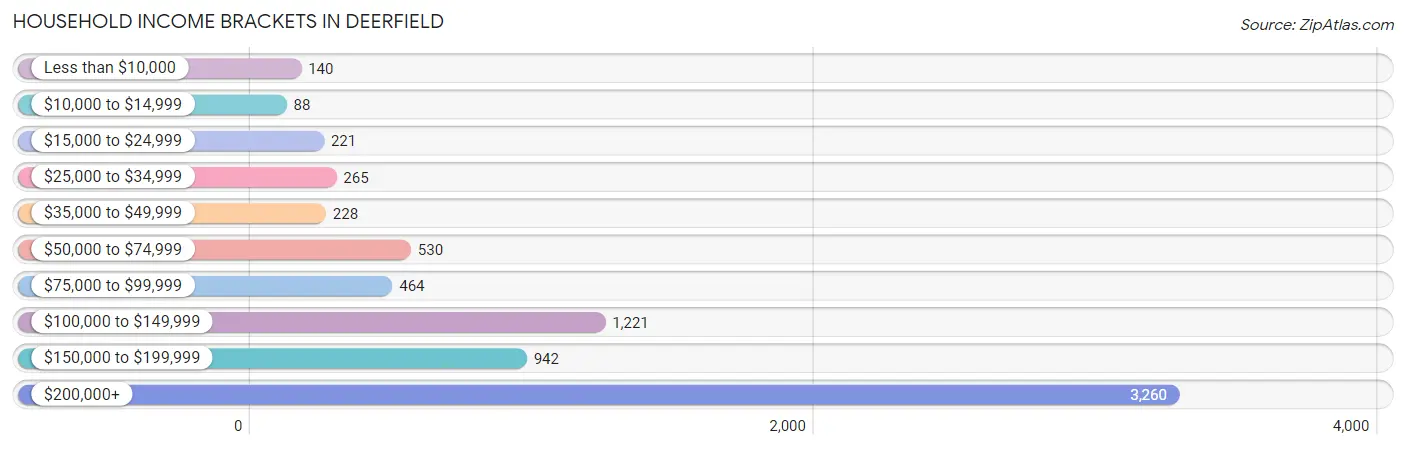
| Income Bracket | # Households | % Households |
| Less than $10,000 | 140 | 1.9% |
| $10,000 to $14,999 | 88 | 1.2% |
| $15,000 to $24,999 | 221 | 3.0% |
| $25,000 to $34,999 | 265 | 3.6% |
| $35,000 to $49,999 | 228 | 3.1% |
| $50,000 to $74,999 | 530 | 7.2% |
| $75,000 to $99,999 | 464 | 6.3% |
| $100,000 to $149,999 | 1,221 | 16.6% |
| $150,000 to $199,999 | 942 | 12.8% |
| $200,000+ | 3,260 | 44.3% |
Household Income by Householder Age in Deerfield
The median household income in Deerfield is $185,762, with the highest median household income of $221,281 found in the 45 to 64 years age bracket for the primary householder. A total of 3,285 households (44.7%) fall into this category. Meanwhile, the 15 to 24 years age bracket for the primary householder has the lowest median household income of $59,237, with 107 households (1.5%) in this group.
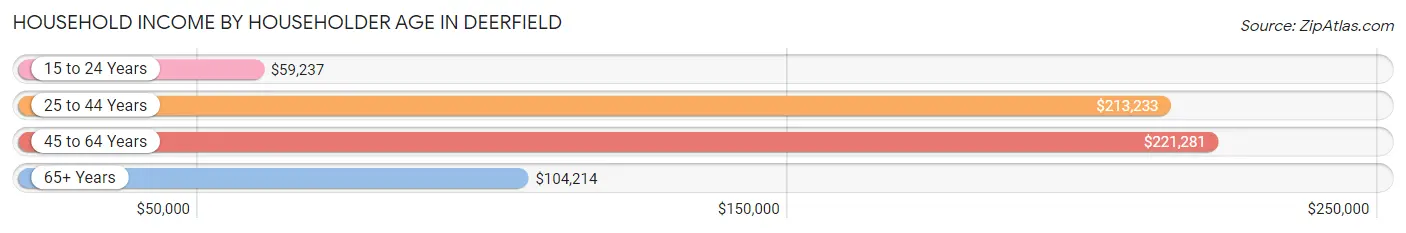
| Income Bracket | # Households | Median Income |
| 15 to 24 Years | 107 (1.5%) | $59,237 |
| 25 to 44 Years | 1,740 (23.6%) | $213,233 |
| 45 to 64 Years | 3,285 (44.7%) | $221,281 |
| 65+ Years | 2,226 (30.2%) | $104,214 |
| Total | 7,358 (100.0%) | $185,762 |
Poverty in Deerfield
Income Below Poverty by Sex and Age in Deerfield
With 2.3% poverty level for males and 3.0% for females among the residents of Deerfield, 16 and 17 year old males and 65 to 74 year old females are the most vulnerable to poverty, with 25 males (6.8%) and 84 females (9.5%) in their respective age groups living below the poverty level.
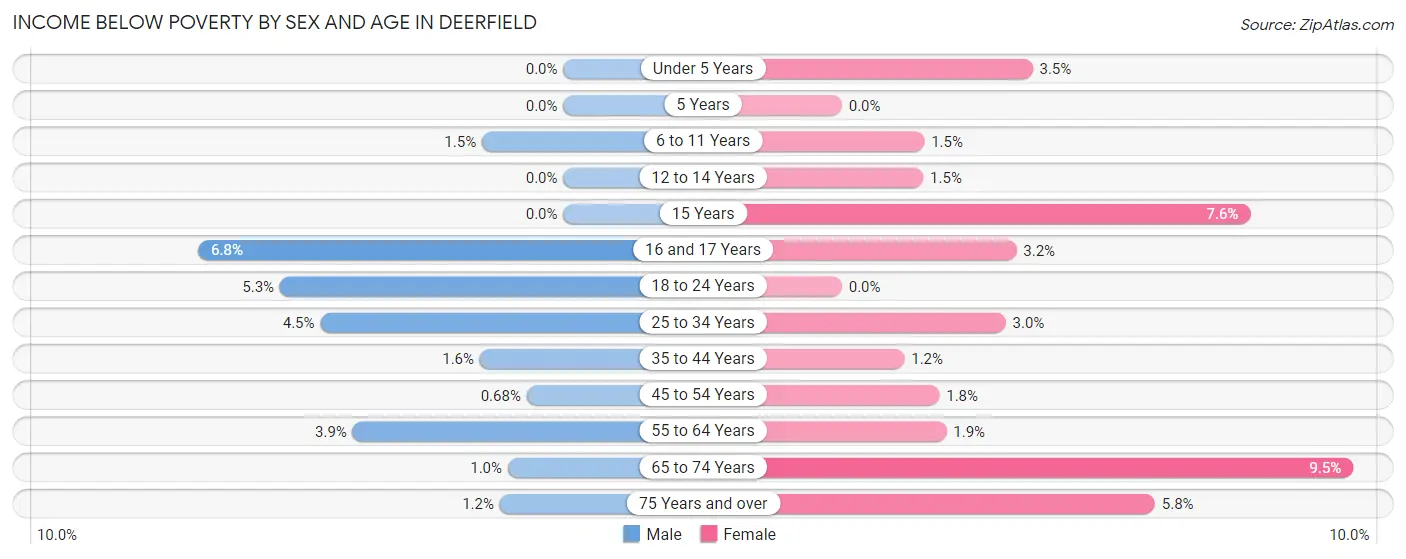
| Age Bracket | Male | Female |
| Under 5 Years | 0 (0.0%) | 8 (3.5%) |
| 5 Years | 0 (0.0%) | 0 (0.0%) |
| 6 to 11 Years | 13 (1.5%) | 13 (1.5%) |
| 12 to 14 Years | 0 (0.0%) | 7 (1.5%) |
| 15 Years | 0 (0.0%) | 10 (7.6%) |
| 16 and 17 Years | 25 (6.8%) | 11 (3.2%) |
| 18 to 24 Years | 50 (5.3%) | 0 (0.0%) |
| 25 to 34 Years | 33 (4.5%) | 23 (3.0%) |
| 35 to 44 Years | 17 (1.5%) | 13 (1.2%) |
| 45 to 54 Years | 10 (0.7%) | 28 (1.8%) |
| 55 to 64 Years | 58 (3.9%) | 29 (1.9%) |
| 65 to 74 Years | 8 (1.0%) | 84 (9.5%) |
| 75 Years and over | 8 (1.2%) | 59 (5.8%) |
| Total | 222 (2.3%) | 285 (3.0%) |
Income Above Poverty by Sex and Age in Deerfield
According to the poverty statistics in Deerfield, males aged under 5 years and females aged 5 years are the age groups that are most secure financially, with 100.0% of males and 100.0% of females in these age groups living above the poverty line.
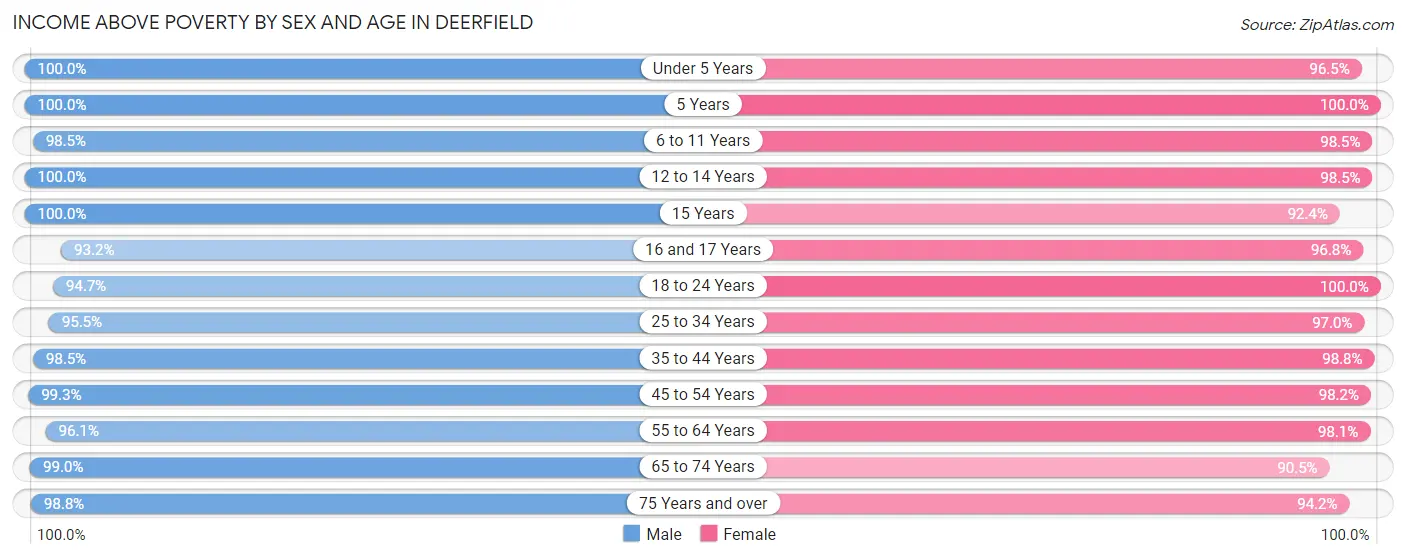
| Age Bracket | Male | Female |
| Under 5 Years | 448 (100.0%) | 218 (96.5%) |
| 5 Years | 121 (100.0%) | 119 (100.0%) |
| 6 to 11 Years | 846 (98.5%) | 837 (98.5%) |
| 12 to 14 Years | 488 (100.0%) | 457 (98.5%) |
| 15 Years | 146 (100.0%) | 122 (92.4%) |
| 16 and 17 Years | 344 (93.2%) | 329 (96.8%) |
| 18 to 24 Years | 900 (94.7%) | 504 (100.0%) |
| 25 to 34 Years | 698 (95.5%) | 734 (97.0%) |
| 35 to 44 Years | 1,079 (98.5%) | 1,112 (98.8%) |
| 45 to 54 Years | 1,465 (99.3%) | 1,522 (98.2%) |
| 55 to 64 Years | 1,424 (96.1%) | 1,464 (98.1%) |
| 65 to 74 Years | 769 (99.0%) | 801 (90.5%) |
| 75 Years and over | 670 (98.8%) | 957 (94.2%) |
| Total | 9,398 (97.7%) | 9,176 (97.0%) |
Income Below Poverty Among Married-Couple Families in Deerfield
The poverty statistics for married-couple families in Deerfield show that 1.2% or 60 of the total 5,000 families live below the poverty line. Families with 3 or 4 children have the highest poverty rate of 2.1%, comprising of 8 families. On the other hand, families with 1 or 2 children have the lowest poverty rate of 0.9%, which includes 15 families.
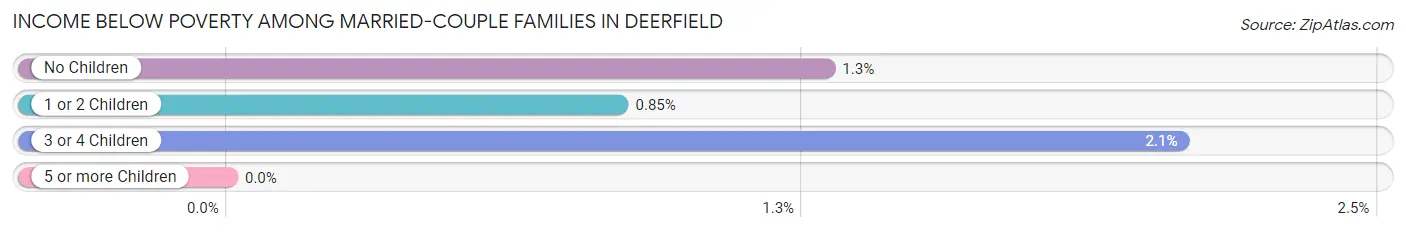
| Children | Above Poverty | Below Poverty |
| No Children | 2,805 (98.7%) | 37 (1.3%) |
| 1 or 2 Children | 1,757 (99.2%) | 15 (0.9%) |
| 3 or 4 Children | 378 (97.9%) | 8 (2.1%) |
| 5 or more Children | 0 (0.0%) | 0 (0.0%) |
| Total | 4,940 (98.8%) | 60 (1.2%) |
Income Below Poverty Among Single-Parent Households in Deerfield
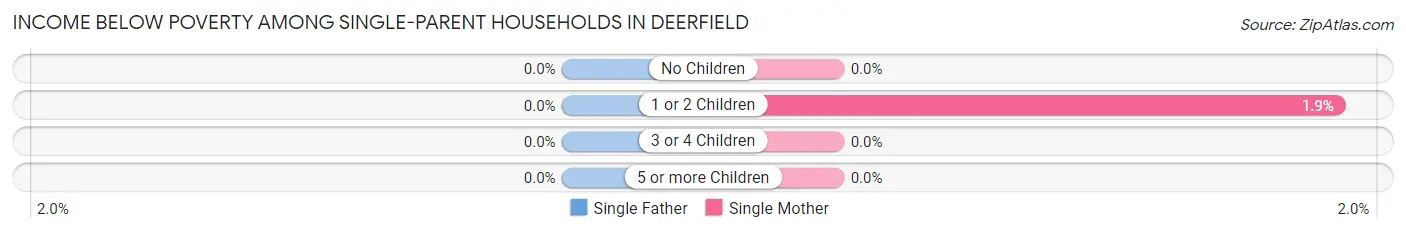
| Children | Single Father | Single Mother |
| No Children | 0 (0.0%) | 0 (0.0%) |
| 1 or 2 Children | 0 (0.0%) | 5 (1.9%) |
| 3 or 4 Children | 0 (0.0%) | 0 (0.0%) |
| 5 or more Children | 0 (0.0%) | 0 (0.0%) |
| Total | 0 (0.0%) | 5 (1.2%) |
Income Below Poverty Among Married-Couple vs Single-Parent Households in Deerfield
The poverty data for Deerfield shows that 60 of the married-couple family households (1.2%) and 5 of the single-parent households (0.9%) are living below the poverty level. Within the married-couple family households, those with 3 or 4 children have the highest poverty rate, with 8 households (2.1%) falling below the poverty line. Among the single-parent households, those with 1 or 2 children have the highest poverty rate, with 5 household (1.4%) living below poverty.
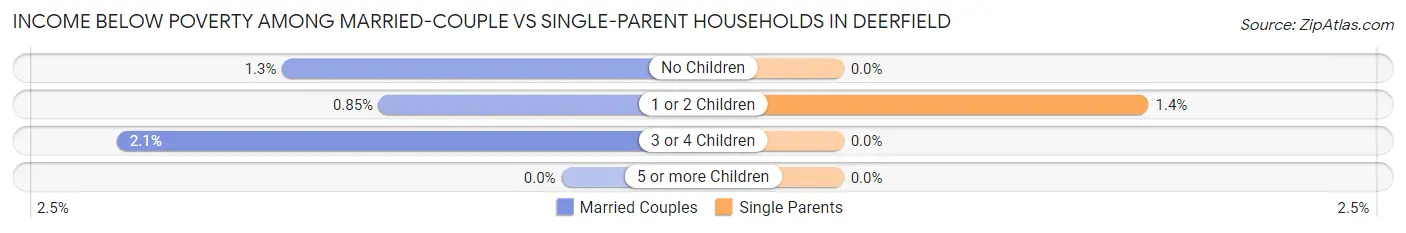
| Children | Married-Couple Families | Single-Parent Households |
| No Children | 37 (1.3%) | 0 (0.0%) |
| 1 or 2 Children | 15 (0.9%) | 5 (1.4%) |
| 3 or 4 Children | 8 (2.1%) | 0 (0.0%) |
| 5 or more Children | 0 (0.0%) | 0 (0.0%) |
| Total | 60 (1.2%) | 5 (0.9%) |
Race in Deerfield
The most populous races in Deerfield are White / Caucasian (17,580 | 91.7%), Hispanic or Latino (912 | 4.8%), and Asian (863 | 4.5%).
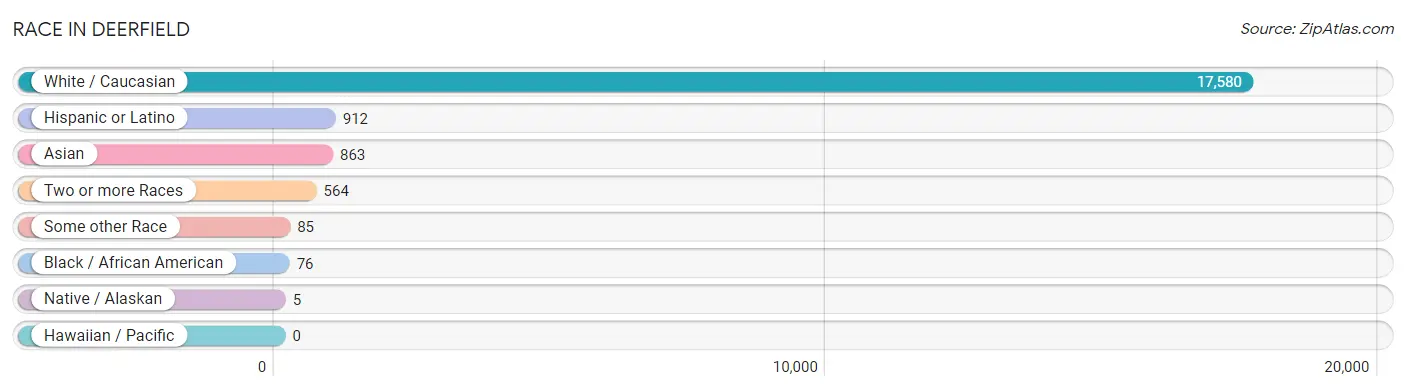
| Race | # Population | % Population |
| Asian | 863 | 4.5% |
| Black / African American | 76 | 0.4% |
| Hawaiian / Pacific | 0 | 0.0% |
| Hispanic or Latino | 912 | 4.8% |
| Native / Alaskan | 5 | 0.0% |
| White / Caucasian | 17,580 | 91.7% |
| Two or more Races | 564 | 2.9% |
| Some other Race | 85 | 0.4% |
| Total | 19,173 | 100.0% |
Ancestry in Deerfield
The most populous ancestries reported in Deerfield are German (2,714 | 14.2%), Russian (2,031 | 10.6%), Polish (1,964 | 10.2%), Irish (1,804 | 9.4%), and American (1,373 | 7.2%), together accounting for 51.6% of all Deerfield residents.
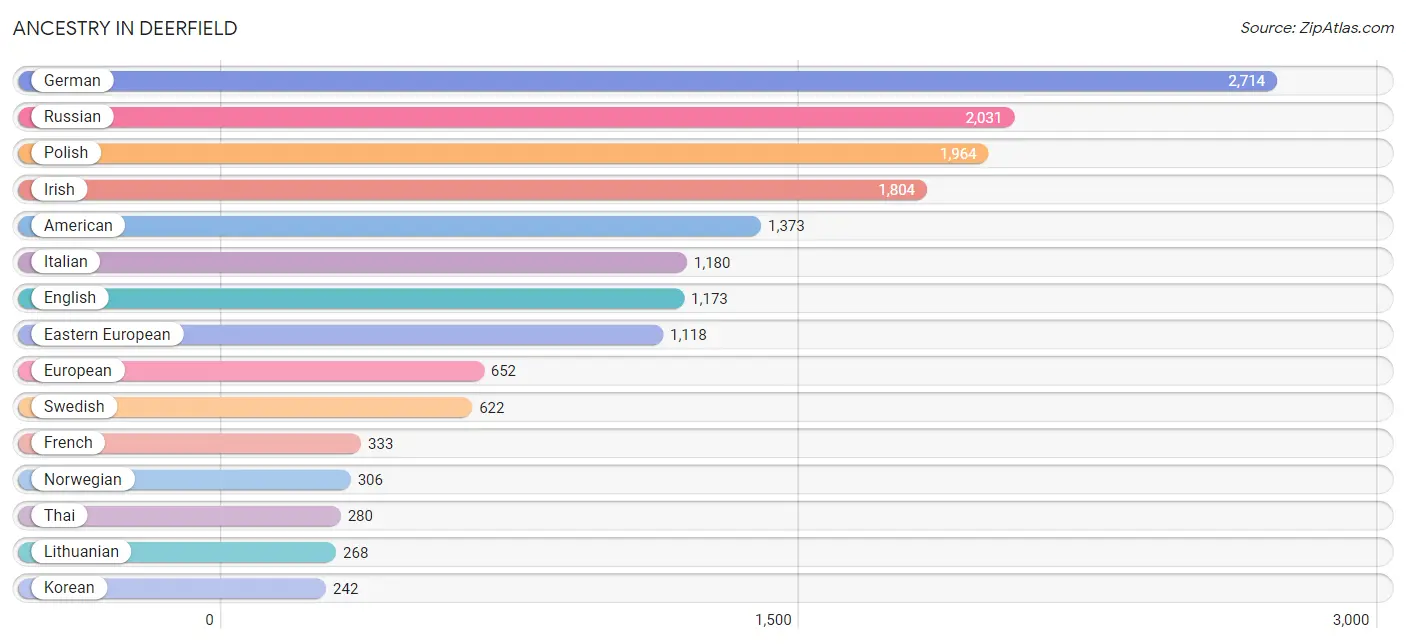
| Ancestry | # Population | % Population |
| American | 1,373 | 7.2% |
| Arab | 129 | 0.7% |
| Argentinean | 144 | 0.7% |
| Armenian | 19 | 0.1% |
| Assyrian / Chaldean / Syriac | 15 | 0.1% |
| Austrian | 95 | 0.5% |
| Belgian | 17 | 0.1% |
| Belizean | 16 | 0.1% |
| Bhutanese | 55 | 0.3% |
| Bolivian | 17 | 0.1% |
| British | 78 | 0.4% |
| Bulgarian | 39 | 0.2% |
| Burmese | 198 | 1.0% |
| Canadian | 41 | 0.2% |
| Central American | 40 | 0.2% |
| Colombian | 9 | 0.1% |
| Croatian | 51 | 0.3% |
| Cuban | 44 | 0.2% |
| Czech | 59 | 0.3% |
| Czechoslovakian | 9 | 0.1% |
| Danish | 76 | 0.4% |
| Dutch | 198 | 1.0% |
| Eastern European | 1,118 | 5.8% |
| Egyptian | 12 | 0.1% |
| English | 1,173 | 6.1% |
| European | 652 | 3.4% |
| Filipino | 22 | 0.1% |
| Finnish | 82 | 0.4% |
| French | 333 | 1.7% |
| French Canadian | 7 | 0.0% |
| German | 2,714 | 14.2% |
| Greek | 153 | 0.8% |
| Guatemalan | 6 | 0.0% |
| Hungarian | 228 | 1.2% |
| Indian (Asian) | 175 | 0.9% |
| Indonesian | 54 | 0.3% |
| Iranian | 78 | 0.4% |
| Irish | 1,804 | 9.4% |
| Israeli | 25 | 0.1% |
| Italian | 1,180 | 6.1% |
| Jamaican | 14 | 0.1% |
| Korean | 242 | 1.3% |
| Lebanese | 33 | 0.2% |
| Lithuanian | 268 | 1.4% |
| Lumbee | 5 | 0.0% |
| Luxembourger | 23 | 0.1% |
| Maltese | 12 | 0.1% |
| Mexican | 223 | 1.2% |
| Native Hawaiian | 11 | 0.1% |
| Navajo | 8 | 0.0% |
| Nigerian | 18 | 0.1% |
| Northern European | 10 | 0.1% |
| Norwegian | 306 | 1.6% |
| Pakistani | 57 | 0.3% |
| Panamanian | 27 | 0.1% |
| Peruvian | 41 | 0.2% |
| Polish | 1,964 | 10.2% |
| Portuguese | 8 | 0.0% |
| Puerto Rican | 67 | 0.4% |
| Romanian | 192 | 1.0% |
| Russian | 2,031 | 10.6% |
| Salvadoran | 7 | 0.0% |
| Scandinavian | 61 | 0.3% |
| Scotch-Irish | 46 | 0.2% |
| Scottish | 167 | 0.9% |
| Serbian | 66 | 0.3% |
| Slovak | 8 | 0.0% |
| Slovene | 2 | 0.0% |
| South African | 43 | 0.2% |
| South American | 227 | 1.2% |
| Spaniard | 51 | 0.3% |
| Spanish | 86 | 0.4% |
| Sri Lankan | 22 | 0.1% |
| Subsaharan African | 61 | 0.3% |
| Swedish | 622 | 3.2% |
| Swiss | 40 | 0.2% |
| Thai | 280 | 1.5% |
| Turkish | 36 | 0.2% |
| Ukrainian | 116 | 0.6% |
| Venezuelan | 16 | 0.1% |
| Welsh | 29 | 0.2% | View All 81 Rows |
Immigrants in Deerfield
The most numerous immigrant groups reported in Deerfield came from Asia (724 | 3.8%), Europe (684 | 3.6%), Eastern Europe (385 | 2.0%), South Central Asia (300 | 1.6%), and Eastern Asia (259 | 1.3%), together accounting for 12.3% of all Deerfield residents.
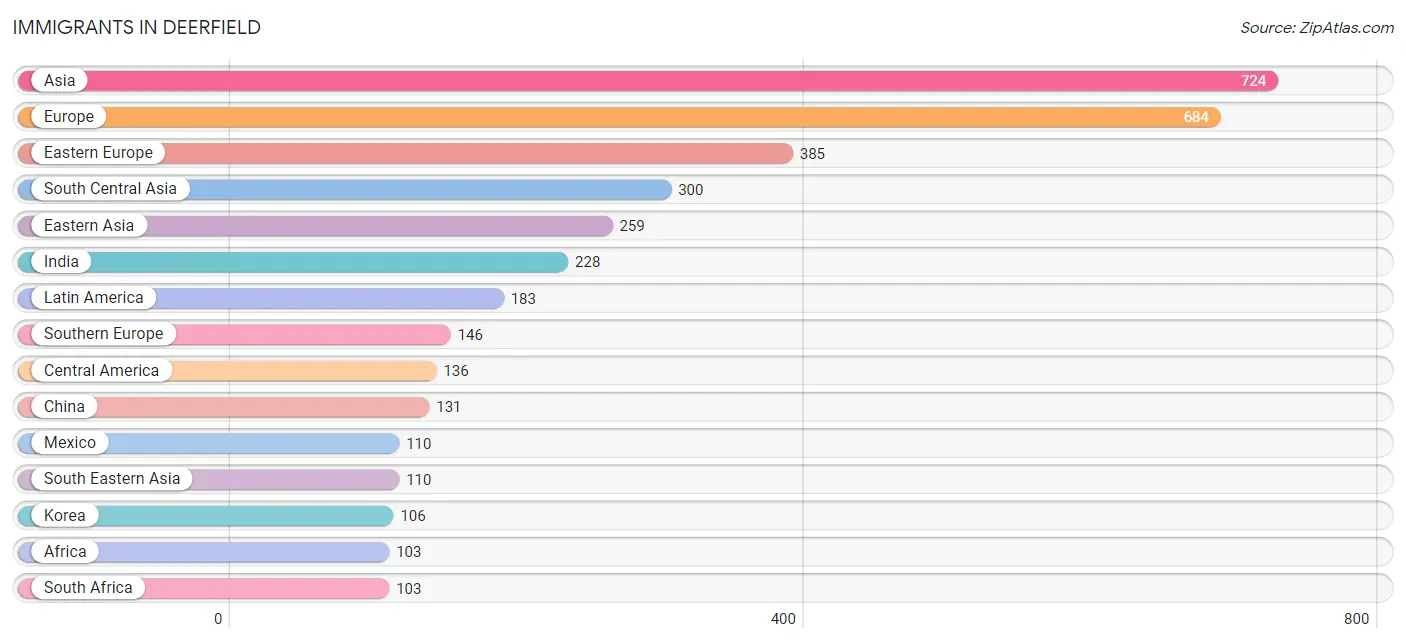
| Immigration Origin | # Population | % Population |
| Africa | 103 | 0.5% |
| Asia | 724 | 3.8% |
| Austria | 5 | 0.0% |
| Belarus | 49 | 0.3% |
| Brazil | 15 | 0.1% |
| Bulgaria | 11 | 0.1% |
| Canada | 68 | 0.4% |
| Caribbean | 7 | 0.0% |
| Central America | 136 | 0.7% |
| China | 131 | 0.7% |
| Cuba | 7 | 0.0% |
| Eastern Asia | 259 | 1.3% |
| Eastern Europe | 385 | 2.0% |
| El Salvador | 7 | 0.0% |
| England | 11 | 0.1% |
| Europe | 684 | 3.6% |
| France | 12 | 0.1% |
| Germany | 36 | 0.2% |
| Greece | 64 | 0.3% |
| Guatemala | 6 | 0.0% |
| India | 228 | 1.2% |
| Iran | 41 | 0.2% |
| Iraq | 7 | 0.0% |
| Israel | 28 | 0.2% |
| Italy | 72 | 0.4% |
| Japan | 22 | 0.1% |
| Kazakhstan | 31 | 0.2% |
| Korea | 106 | 0.5% |
| Latin America | 183 | 0.9% |
| Latvia | 34 | 0.2% |
| Mexico | 110 | 0.6% |
| Moldova | 65 | 0.3% |
| Netherlands | 8 | 0.0% |
| Northern Europe | 74 | 0.4% |
| Panama | 13 | 0.1% |
| Peru | 25 | 0.1% |
| Philippines | 101 | 0.5% |
| Poland | 50 | 0.3% |
| Romania | 37 | 0.2% |
| Russia | 39 | 0.2% |
| Serbia | 23 | 0.1% |
| South Africa | 103 | 0.5% |
| South America | 40 | 0.2% |
| South Central Asia | 300 | 1.6% |
| South Eastern Asia | 110 | 0.6% |
| Southern Europe | 146 | 0.8% |
| Spain | 10 | 0.1% |
| Sweden | 12 | 0.1% |
| Switzerland | 8 | 0.0% |
| Taiwan | 22 | 0.1% |
| Thailand | 9 | 0.1% |
| Turkey | 14 | 0.1% |
| Ukraine | 41 | 0.2% |
| Western Asia | 55 | 0.3% |
| Western Europe | 69 | 0.4% | View All 55 Rows |
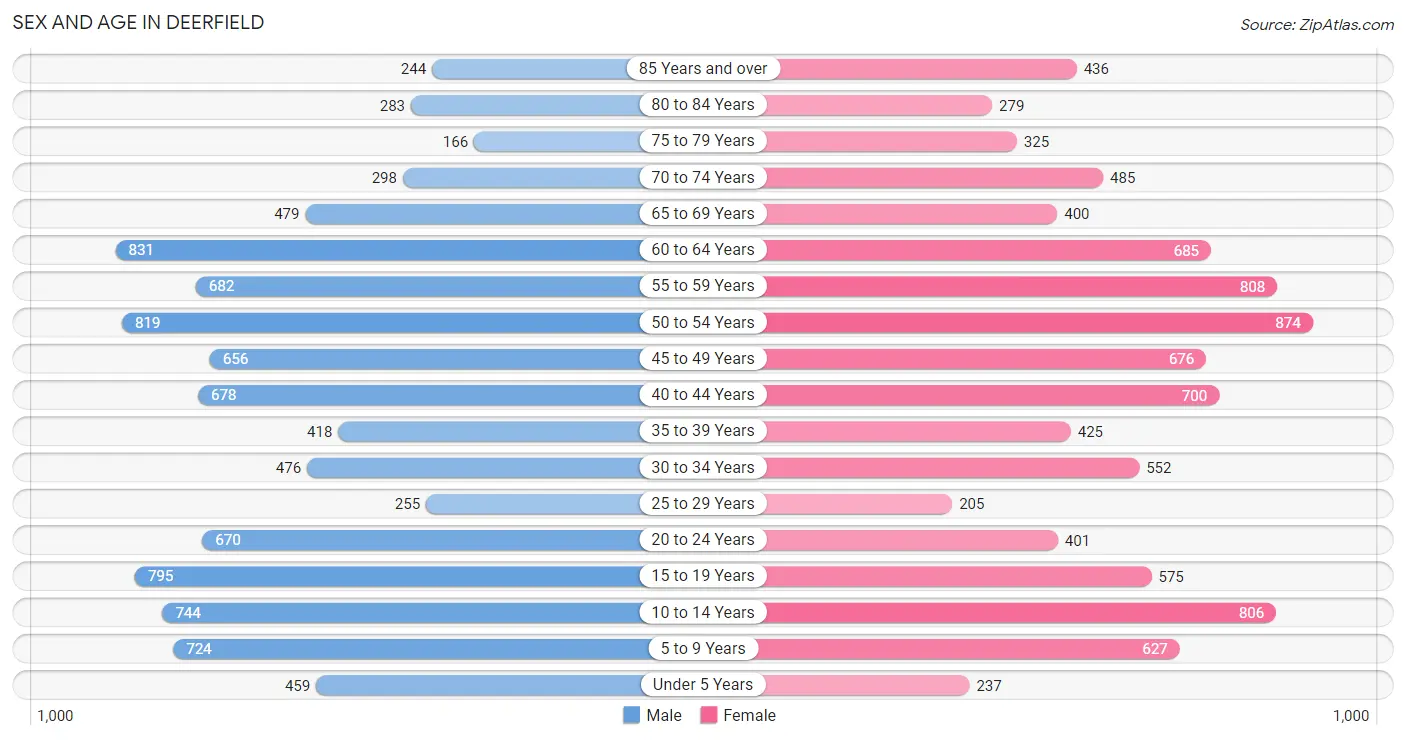
Sex and Age in Deerfield
Sex and Age in Deerfield
The most populous age groups in Deerfield are 60 to 64 Years (831 | 8.6%) for men and 50 to 54 Years (874 | 9.2%) for women.
| Age Bracket | Male | Female |
| Under 5 Years | 459 (4.7%) | 237 (2.5%) |
| 5 to 9 Years | 724 (7.5%) | 627 (6.6%) |
| 10 to 14 Years | 744 (7.7%) | 806 (8.5%) |
| 15 to 19 Years | 795 (8.2%) | 575 (6.1%) |
| 20 to 24 Years | 670 (6.9%) | 401 (4.2%) |
| 25 to 29 Years | 255 (2.6%) | 205 (2.2%) |
| 30 to 34 Years | 476 (4.9%) | 552 (5.8%) |
| 35 to 39 Years | 418 (4.3%) | 425 (4.5%) |
| 40 to 44 Years | 678 (7.0%) | 700 (7.4%) |
| 45 to 49 Years | 656 (6.8%) | 676 (7.1%) |
| 50 to 54 Years | 819 (8.5%) | 874 (9.2%) |
| 55 to 59 Years | 682 (7.0%) | 808 (8.5%) |
| 60 to 64 Years | 831 (8.6%) | 685 (7.2%) |
| 65 to 69 Years | 479 (5.0%) | 400 (4.2%) |
| 70 to 74 Years | 298 (3.1%) | 485 (5.1%) |
| 75 to 79 Years | 166 (1.7%) | 325 (3.4%) |
| 80 to 84 Years | 283 (2.9%) | 279 (2.9%) |
| 85 Years and over | 244 (2.5%) | 436 (4.6%) |
| Total | 9,677 (100.0%) | 9,496 (100.0%) |
Families and Households in Deerfield
Median Family Size in Deerfield
The median family size in Deerfield is 3.04 persons per family, with married-couple families (5,000 | 90.2%) accounting for the largest median family size of 3.1 persons per family. On the other hand, single male/father families (139 | 2.5%) represent the smallest median family size with 2.21 persons per family.
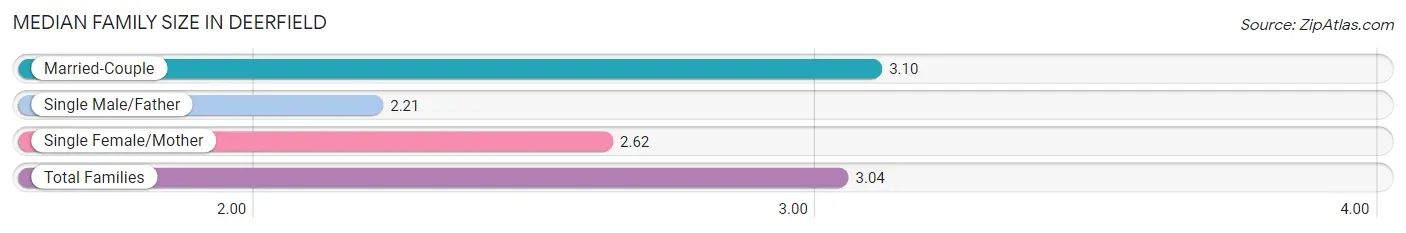
| Family Type | # Families | Family Size |
| Married-Couple | 5,000 (90.2%) | 3.10 |
| Single Male/Father | 139 (2.5%) | 2.21 |
| Single Female/Mother | 405 (7.3%) | 2.62 |
| Total Families | 5,544 (100.0%) | 3.04 |
Median Household Size in Deerfield
The median household size in Deerfield is 2.60 persons per household, with married-couple households (5,000 | 67.9%) accounting for the largest median household size of 3.11 persons per household. non-family households (1,814 | 24.6%) represent the smallest median household size with 1.17 persons per household.
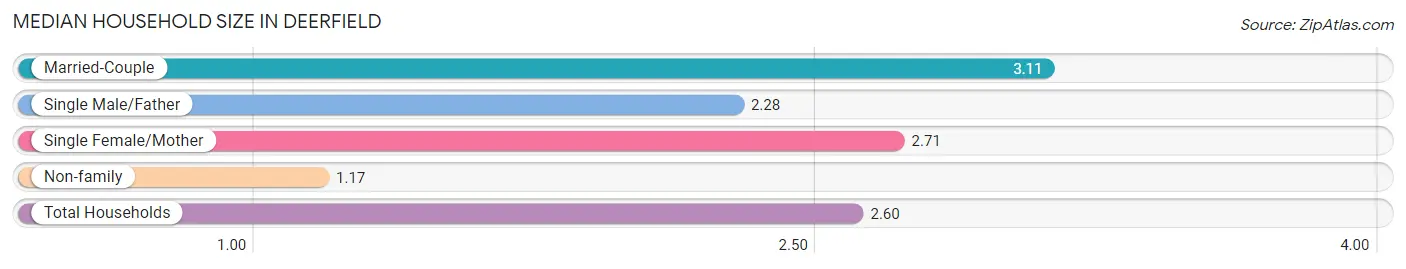
| Household Type | # Households | Household Size |
| Married-Couple | 5,000 (67.9%) | 3.11 |
| Single Male/Father | 139 (1.9%) | 2.28 |
| Single Female/Mother | 405 (5.5%) | 2.71 |
| Non-family | 1,814 (24.6%) | 1.17 |
| Total Households | 7,358 (100.0%) | 2.60 |
Household Size by Marriage Status in Deerfield
Out of a total of 7,358 households in Deerfield, 5,544 (75.3%) are family households, while 1,814 (24.6%) are nonfamily households. The most numerous type of family households are 2-person households, comprising 2,598, and the most common type of nonfamily households are 1-person households, comprising 1,566.
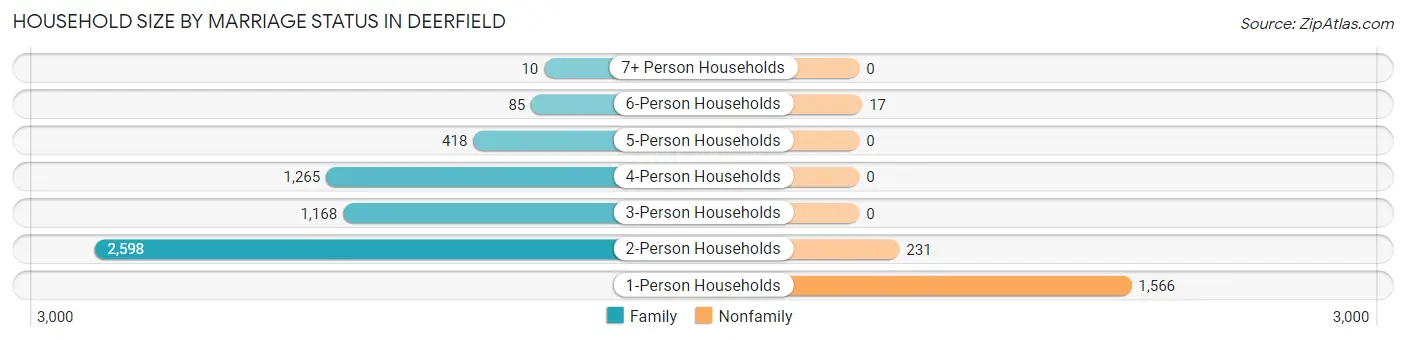
| Household Size | Family Households | Nonfamily Households |
| 1-Person Households | - | 1,566 (21.3%) |
| 2-Person Households | 2,598 (35.3%) | 231 (3.1%) |
| 3-Person Households | 1,168 (15.9%) | 0 (0.0%) |
| 4-Person Households | 1,265 (17.2%) | 0 (0.0%) |
| 5-Person Households | 418 (5.7%) | 0 (0.0%) |
| 6-Person Households | 85 (1.2%) | 17 (0.2%) |
| 7+ Person Households | 10 (0.1%) | 0 (0.0%) |
| Total | 5,544 (75.3%) | 1,814 (24.6%) |
Female Fertility in Deerfield
Fertility by Age in Deerfield
Average fertility rate in Deerfield is 35.0 births per 1,000 women. Women in the age bracket of 20 to 34 years have the highest fertility rate with 73.0 births per 1,000 women. Women in the age bracket of 20 to 34 years acount for 64.9% of all women with births.
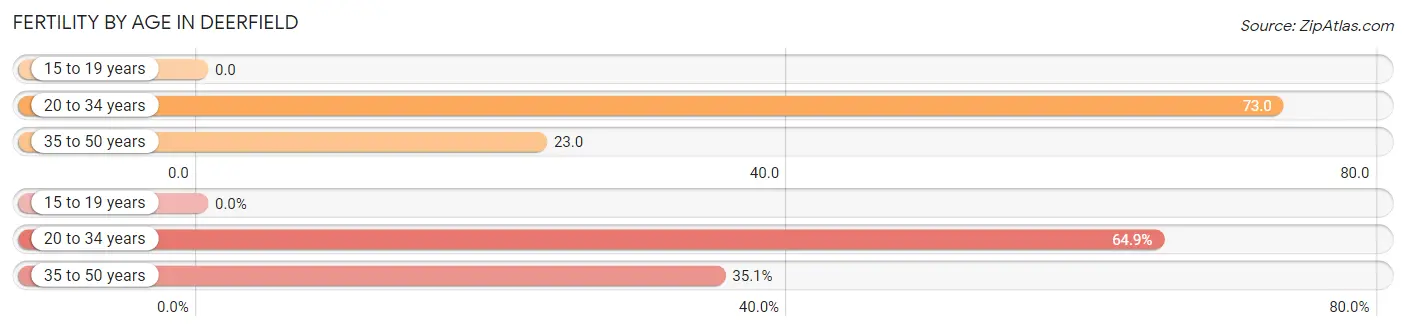
| Age Bracket | Women with Births | Births / 1,000 Women |
| 15 to 19 years | 0 (0.0%) | 0.0 |
| 20 to 34 years | 85 (64.9%) | 73.0 |
| 35 to 50 years | 46 (35.1%) | 23.0 |
| Total | 131 (100.0%) | 35.0 |
Fertility by Age by Marriage Status in Deerfield
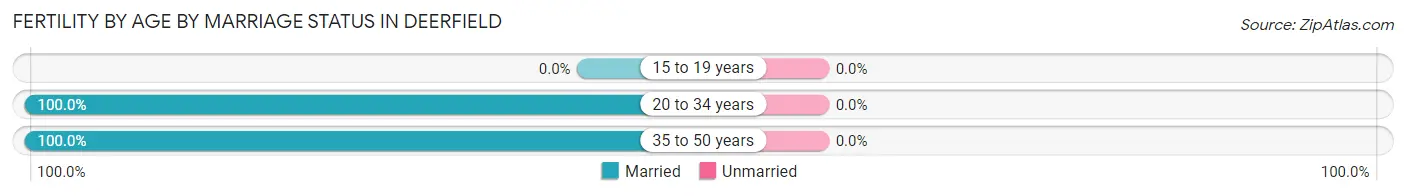
| Age Bracket | Married | Unmarried |
| 15 to 19 years | 0 (0.0%) | 0 (0.0%) |
| 20 to 34 years | 85 (100.0%) | 0 (0.0%) |
| 35 to 50 years | 46 (100.0%) | 0 (0.0%) |
| Total | 131 (100.0%) | 0 (0.0%) |
Fertility by Education in Deerfield
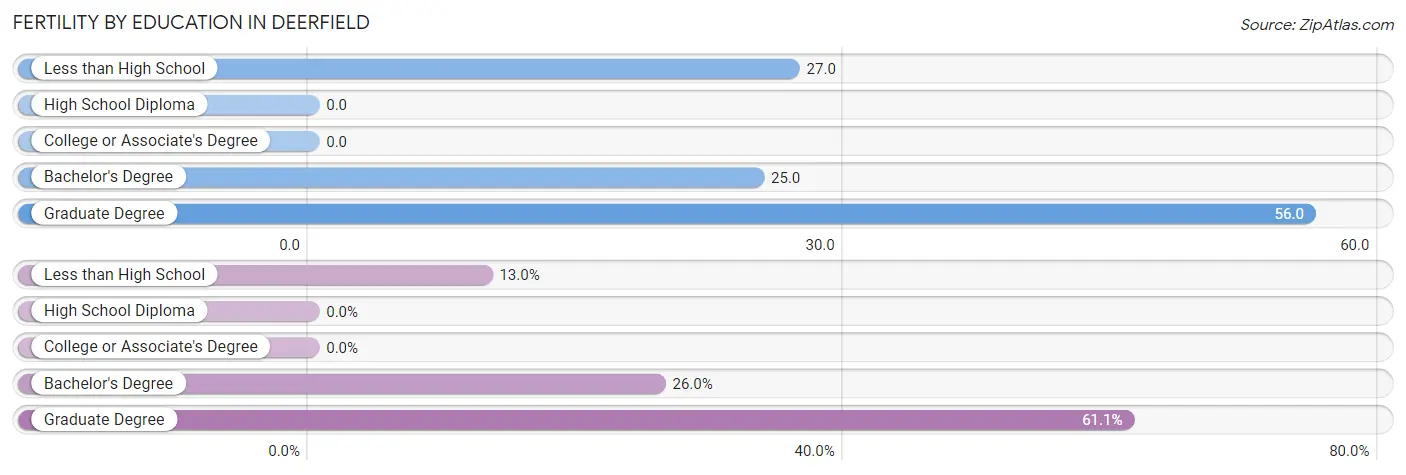
| Educational Attainment | Women with Births | Births / 1,000 Women |
| Less than High School | 17 (13.0%) | 27.0 |
| High School Diploma | 0 (0.0%) | 0.0 |
| College or Associate's Degree | 0 (0.0%) | 0.0 |
| Bachelor's Degree | 34 (26.0%) | 25.0 |
| Graduate Degree | 80 (61.1%) | 56.0 |
| Total | 131 (100.0%) | 35.0 |
Fertility by Education by Marriage Status in Deerfield
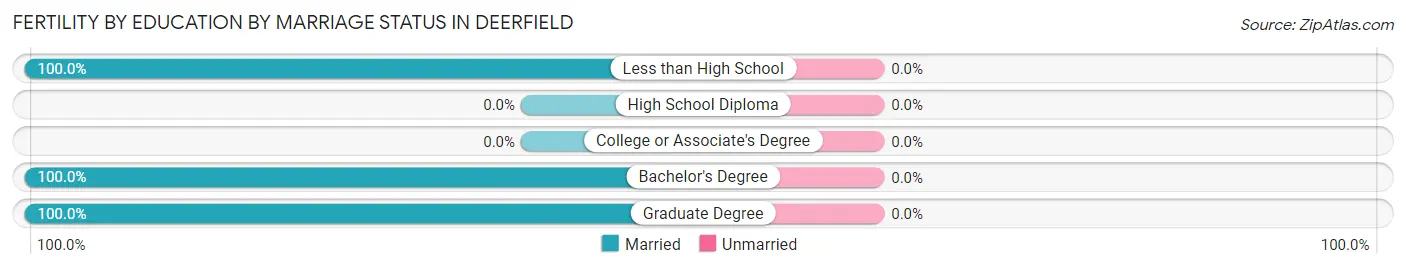
| Educational Attainment | Married | Unmarried |
| Less than High School | 17 (100.0%) | 0 (0.0%) |
| High School Diploma | 0 (0.0%) | 0 (0.0%) |
| College or Associate's Degree | 0 (0.0%) | 0 (0.0%) |
| Bachelor's Degree | 34 (100.0%) | 0 (0.0%) |
| Graduate Degree | 80 (100.0%) | 0 (0.0%) |
| Total | 131 (100.0%) | 0 (0.0%) |
Employment Characteristics in Deerfield
Employment by Class of Employer in Deerfield
Among the 10,052 employed individuals in Deerfield, private company employees (6,803 | 67.7%), self-employed (incorporated) (1,000 | 10.0%), and not-for-profit organizations (984 | 9.8%) make up the most common classes of employment.
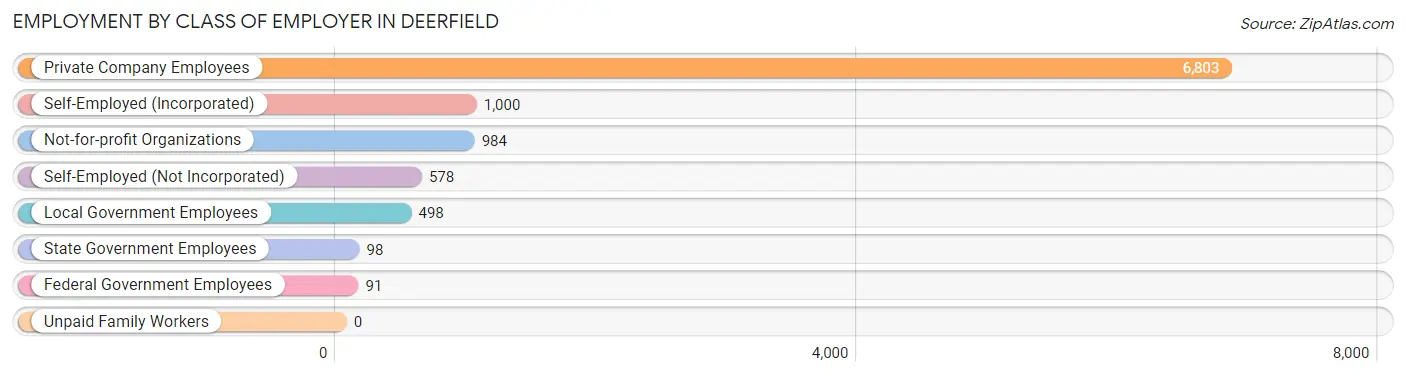
| Employer Class | # Employees | % Employees |
| Private Company Employees | 6,803 | 67.7% |
| Self-Employed (Incorporated) | 1,000 | 10.0% |
| Self-Employed (Not Incorporated) | 578 | 5.8% |
| Not-for-profit Organizations | 984 | 9.8% |
| Local Government Employees | 498 | 5.0% |
| State Government Employees | 98 | 1.0% |
| Federal Government Employees | 91 | 0.9% |
| Unpaid Family Workers | 0 | 0.0% |
| Total | 10,052 | 100.0% |
Employment Status by Age in Deerfield
According to the labor force statistics for Deerfield, out of the total population over 16 years of age (15,298), 68.2% or 10,433 individuals are in the labor force, with 2.4% or 250 of them unemployed. The age group with the highest labor force participation rate is 25 to 29 years, with 93.7% or 431 individuals in the labor force. Within the labor force, the 20 to 24 years age range has the highest percentage of unemployed individuals, with 6.6% or 50 of them being unemployed.
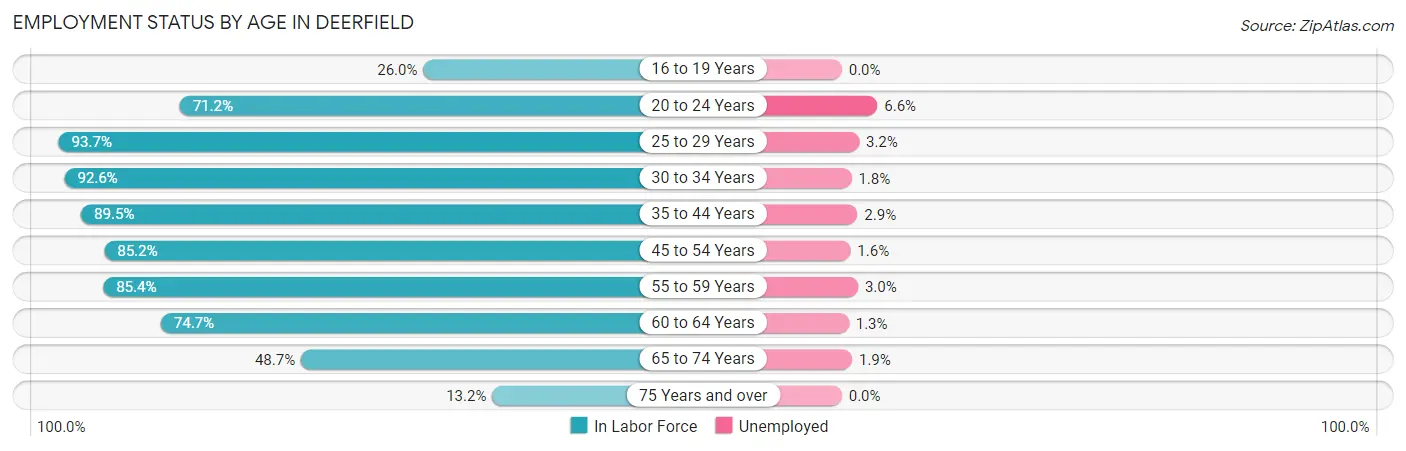
| Age Bracket | In Labor Force | Unemployed |
| 16 to 19 Years | 284 (26.0%) | 0 (0.0%) |
| 20 to 24 Years | 763 (71.2%) | 50 (6.6%) |
| 25 to 29 Years | 431 (93.7%) | 14 (3.2%) |
| 30 to 34 Years | 952 (92.6%) | 17 (1.8%) |
| 35 to 44 Years | 1,988 (89.5%) | 58 (2.9%) |
| 45 to 54 Years | 2,577 (85.2%) | 41 (1.6%) |
| 55 to 59 Years | 1,272 (85.4%) | 38 (3.0%) |
| 60 to 64 Years | 1,132 (74.7%) | 15 (1.3%) |
| 65 to 74 Years | 809 (48.7%) | 15 (1.9%) |
| 75 Years and over | 229 (13.2%) | 0 (0.0%) |
| Total | 10,433 (68.2%) | 250 (2.4%) |
Employment Status by Educational Attainment in Deerfield
According to labor force statistics for Deerfield, 85.8% of individuals (8,357) out of the total population between 25 and 64 years of age (9,740) are in the labor force, with 2.2% or 184 of them being unemployed. The group with the highest labor force participation rate are those with the educational attainment of bachelor's degree or higher, with 87.4% or 7,431 individuals in the labor force. Within the labor force, individuals with high school diploma education have the highest percentage of unemployment, with 4.6% or 9 of them being unemployed.
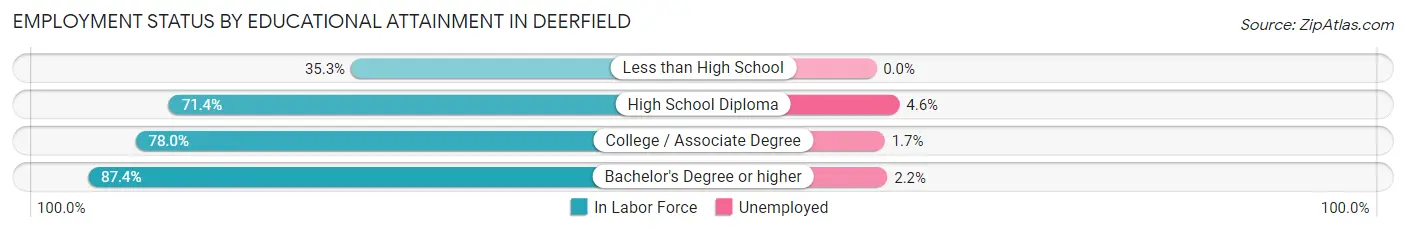
| Educational Attainment | In Labor Force | Unemployed |
| Less than High School | 18 (35.3%) | 0 (0.0%) |
| High School Diploma | 197 (71.4%) | 13 (4.6%) |
| College / Associate Degree | 711 (78.0%) | 15 (1.7%) |
| Bachelor's Degree or higher | 7,431 (87.4%) | 187 (2.2%) |
| Total | 8,357 (85.8%) | 214 (2.2%) |
Employment Occupations by Sex in Deerfield
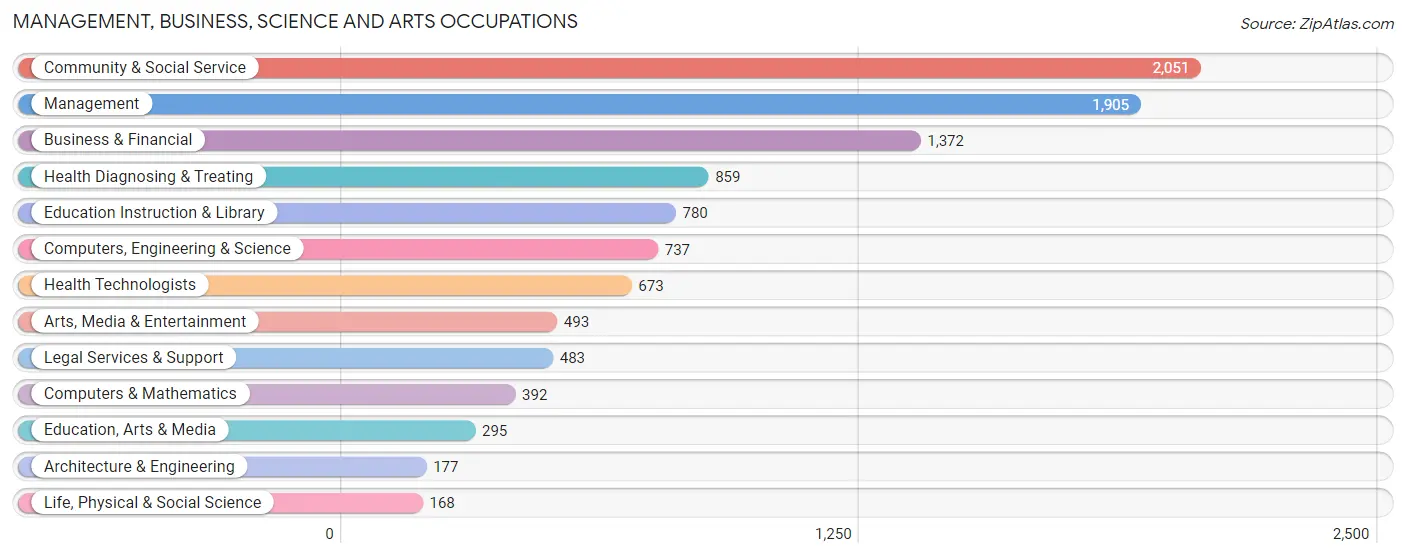
Management, Business, Science and Arts Occupations
The most common Management, Business, Science and Arts occupations in Deerfield are Community & Social Service (2,051 | 20.1%), Management (1,905 | 18.7%), Business & Financial (1,372 | 13.5%), Health Diagnosing & Treating (859 | 8.4%), and Education Instruction & Library (780 | 7.6%).
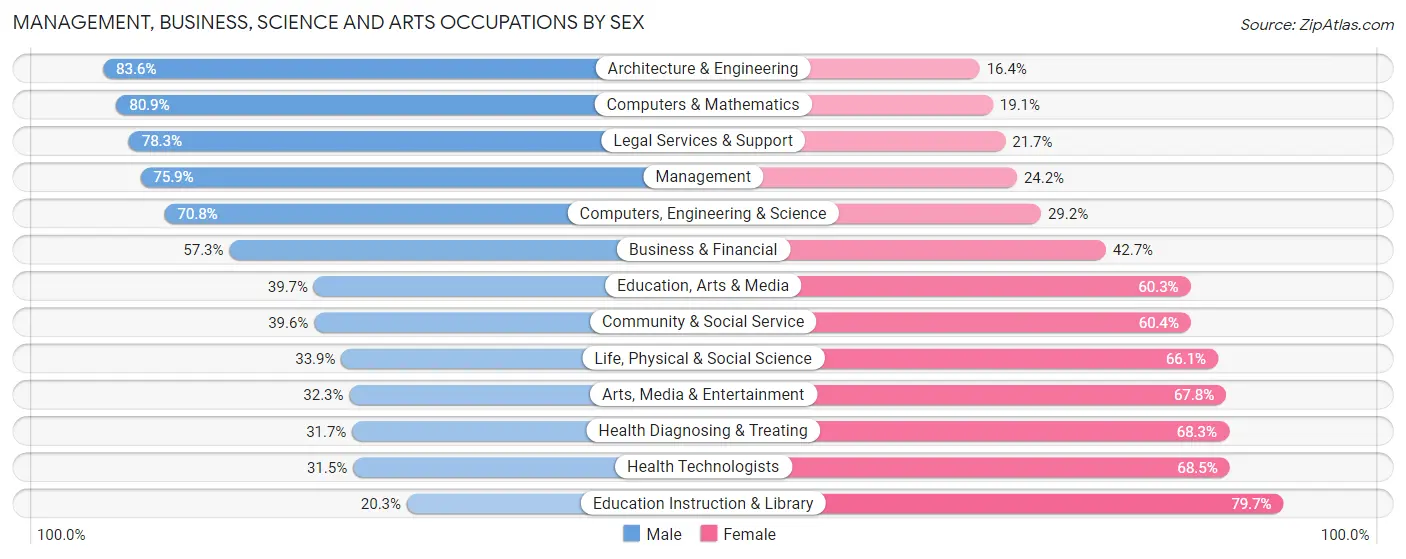
Management, Business, Science and Arts Occupations by Sex
Within the Management, Business, Science and Arts occupations in Deerfield, the most male-oriented occupations are Architecture & Engineering (83.6%), Computers & Mathematics (80.9%), and Legal Services & Support (78.3%), while the most female-oriented occupations are Education Instruction & Library (79.7%), Health Technologists (68.5%), and Health Diagnosing & Treating (68.3%).
| Occupation | Male | Female |
| Management | 1,445 (75.8%) | 460 (24.1%) |
| Business & Financial | 786 (57.3%) | 586 (42.7%) |
| Computers, Engineering & Science | 522 (70.8%) | 215 (29.2%) |
| Computers & Mathematics | 317 (80.9%) | 75 (19.1%) |
| Architecture & Engineering | 148 (83.6%) | 29 (16.4%) |
| Life, Physical & Social Science | 57 (33.9%) | 111 (66.1%) |
| Community & Social Service | 812 (39.6%) | 1,239 (60.4%) |
| Education, Arts & Media | 117 (39.7%) | 178 (60.3%) |
| Legal Services & Support | 378 (78.3%) | 105 (21.7%) |
| Education Instruction & Library | 158 (20.3%) | 622 (79.7%) |
| Arts, Media & Entertainment | 159 (32.3%) | 334 (67.7%) |
| Health Diagnosing & Treating | 272 (31.7%) | 587 (68.3%) |
| Health Technologists | 212 (31.5%) | 461 (68.5%) |
| Total (Category) | 3,837 (55.4%) | 3,087 (44.6%) |
| Total (Overall) | 5,593 (54.9%) | 4,598 (45.1%) |
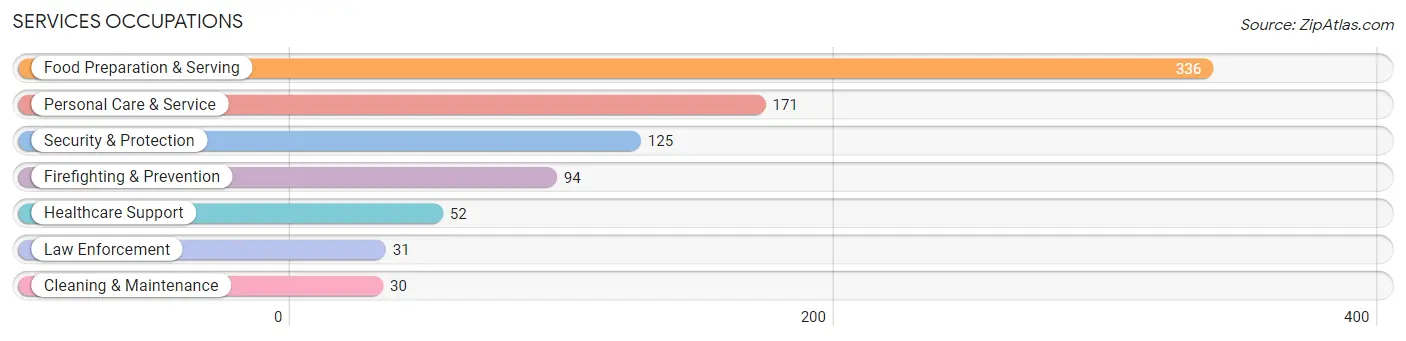
Services Occupations
The most common Services occupations in Deerfield are Food Preparation & Serving (336 | 3.3%), Personal Care & Service (171 | 1.7%), Security & Protection (125 | 1.2%), Firefighting & Prevention (94 | 0.9%), and Healthcare Support (52 | 0.5%).
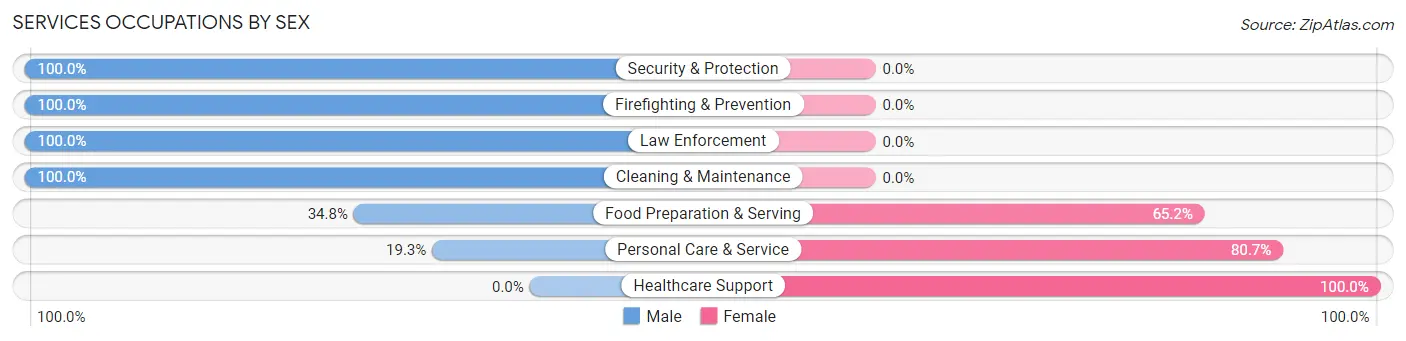
Services Occupations by Sex
Within the Services occupations in Deerfield, the most male-oriented occupations are Security & Protection (100.0%), Firefighting & Prevention (100.0%), and Law Enforcement (100.0%), while the most female-oriented occupations are Healthcare Support (100.0%), Personal Care & Service (80.7%), and Food Preparation & Serving (65.2%).
| Occupation | Male | Female |
| Healthcare Support | 0 (0.0%) | 52 (100.0%) |
| Security & Protection | 125 (100.0%) | 0 (0.0%) |
| Firefighting & Prevention | 94 (100.0%) | 0 (0.0%) |
| Law Enforcement | 31 (100.0%) | 0 (0.0%) |
| Food Preparation & Serving | 117 (34.8%) | 219 (65.2%) |
| Cleaning & Maintenance | 30 (100.0%) | 0 (0.0%) |
| Personal Care & Service | 33 (19.3%) | 138 (80.7%) |
| Total (Category) | 305 (42.7%) | 409 (57.3%) |
| Total (Overall) | 5,593 (54.9%) | 4,598 (45.1%) |
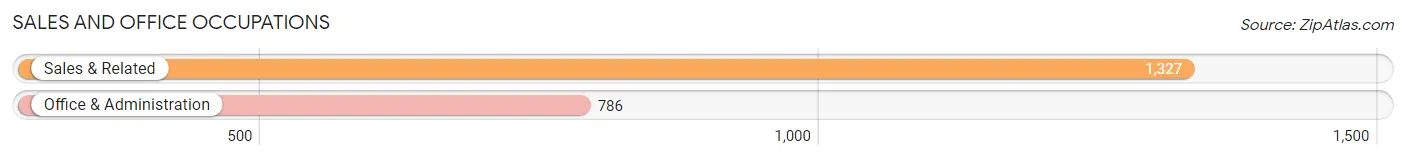
Sales and Office Occupations
The most common Sales and Office occupations in Deerfield are Sales & Related (1,327 | 13.0%), and Office & Administration (786 | 7.7%).
Sales and Office Occupations by Sex
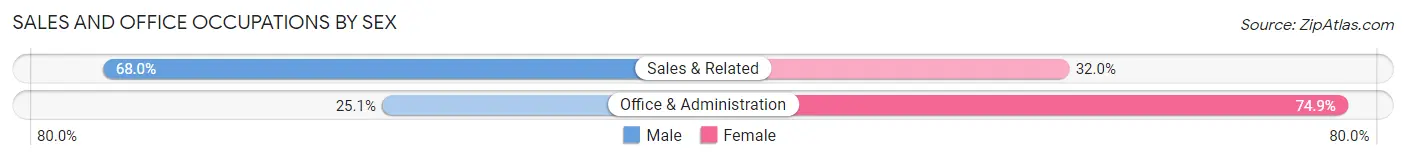
| Occupation | Male | Female |
| Sales & Related | 902 (68.0%) | 425 (32.0%) |
| Office & Administration | 197 (25.1%) | 589 (74.9%) |
| Total (Category) | 1,099 (52.0%) | 1,014 (48.0%) |
| Total (Overall) | 5,593 (54.9%) | 4,598 (45.1%) |
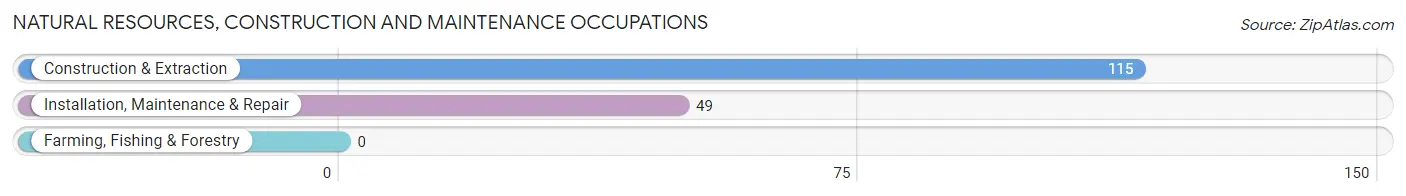
Natural Resources, Construction and Maintenance Occupations
The most common Natural Resources, Construction and Maintenance occupations in Deerfield are Construction & Extraction (115 | 1.1%), and Installation, Maintenance & Repair (49 | 0.5%).
Natural Resources, Construction and Maintenance Occupations by Sex
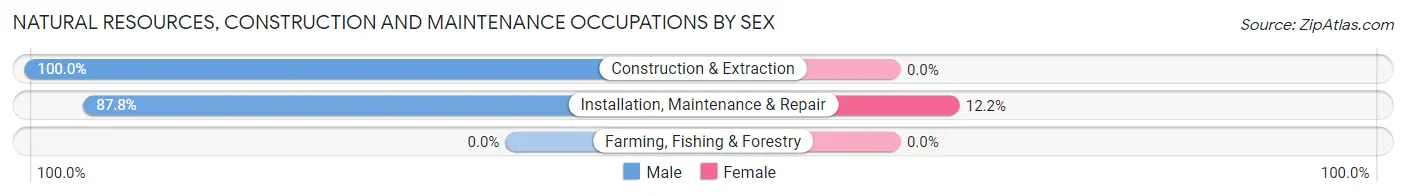
| Occupation | Male | Female |
| Farming, Fishing & Forestry | 0 (0.0%) | 0 (0.0%) |
| Construction & Extraction | 115 (100.0%) | 0 (0.0%) |
| Installation, Maintenance & Repair | 43 (87.8%) | 6 (12.2%) |
| Total (Category) | 158 (96.3%) | 6 (3.7%) |
| Total (Overall) | 5,593 (54.9%) | 4,598 (45.1%) |
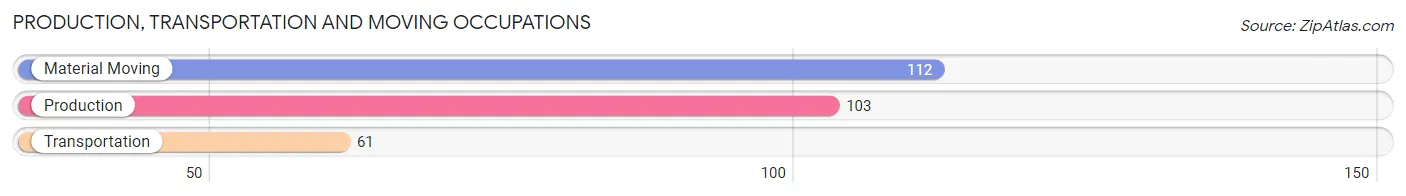
Production, Transportation and Moving Occupations
The most common Production, Transportation and Moving occupations in Deerfield are Material Moving (112 | 1.1%), Production (103 | 1.0%), and Transportation (61 | 0.6%).
Production, Transportation and Moving Occupations by Sex
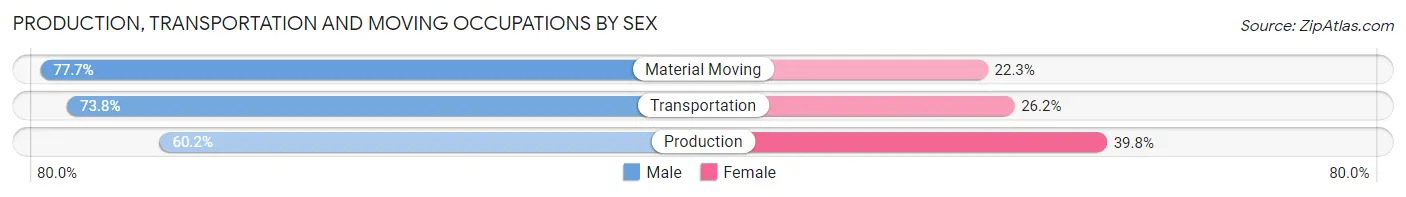
| Occupation | Male | Female |
| Production | 62 (60.2%) | 41 (39.8%) |
| Transportation | 45 (73.8%) | 16 (26.2%) |
| Material Moving | 87 (77.7%) | 25 (22.3%) |
| Total (Category) | 194 (70.3%) | 82 (29.7%) |
| Total (Overall) | 5,593 (54.9%) | 4,598 (45.1%) |
Employment Industries by Sex in Deerfield
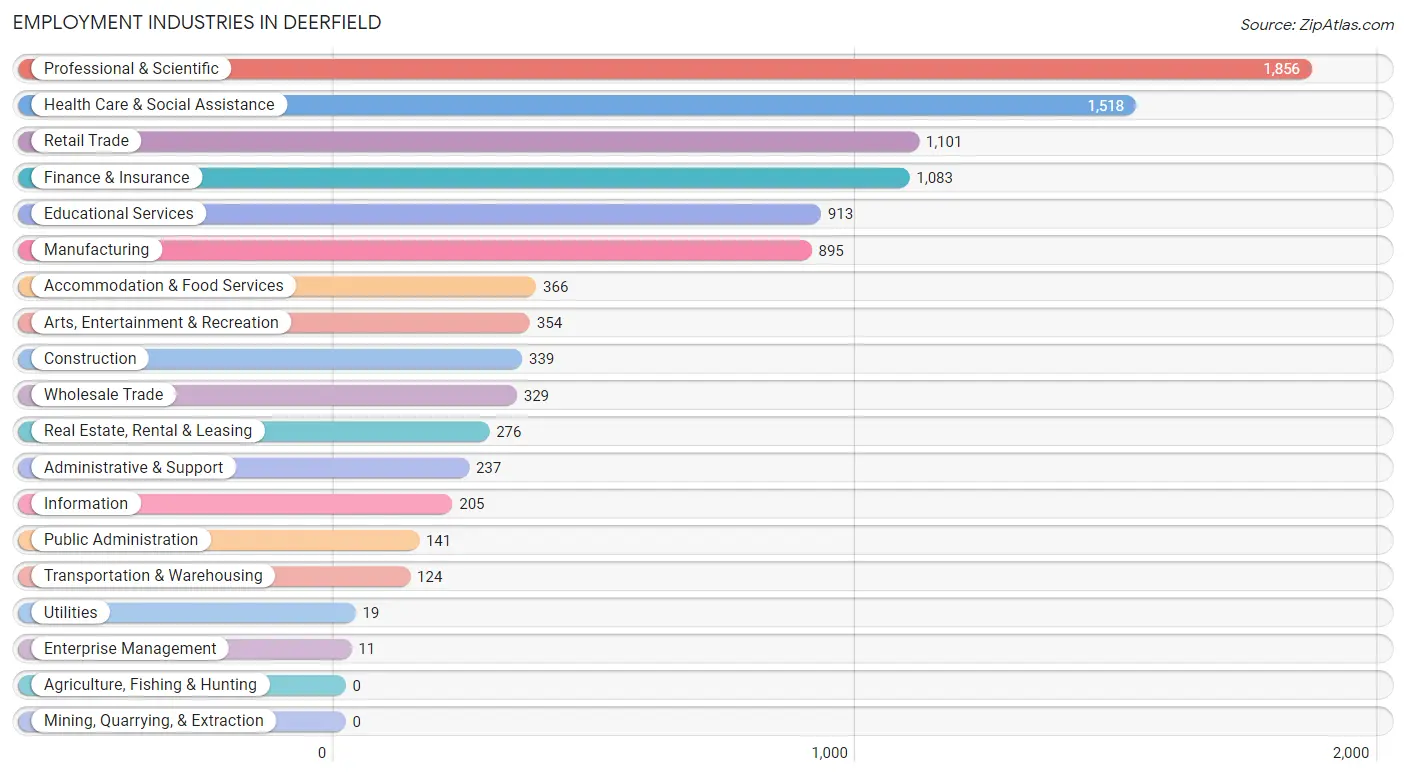
Employment Industries in Deerfield
The major employment industries in Deerfield include Professional & Scientific (1,856 | 18.2%), Health Care & Social Assistance (1,518 | 14.9%), Retail Trade (1,101 | 10.8%), Finance & Insurance (1,083 | 10.6%), and Educational Services (913 | 9.0%).
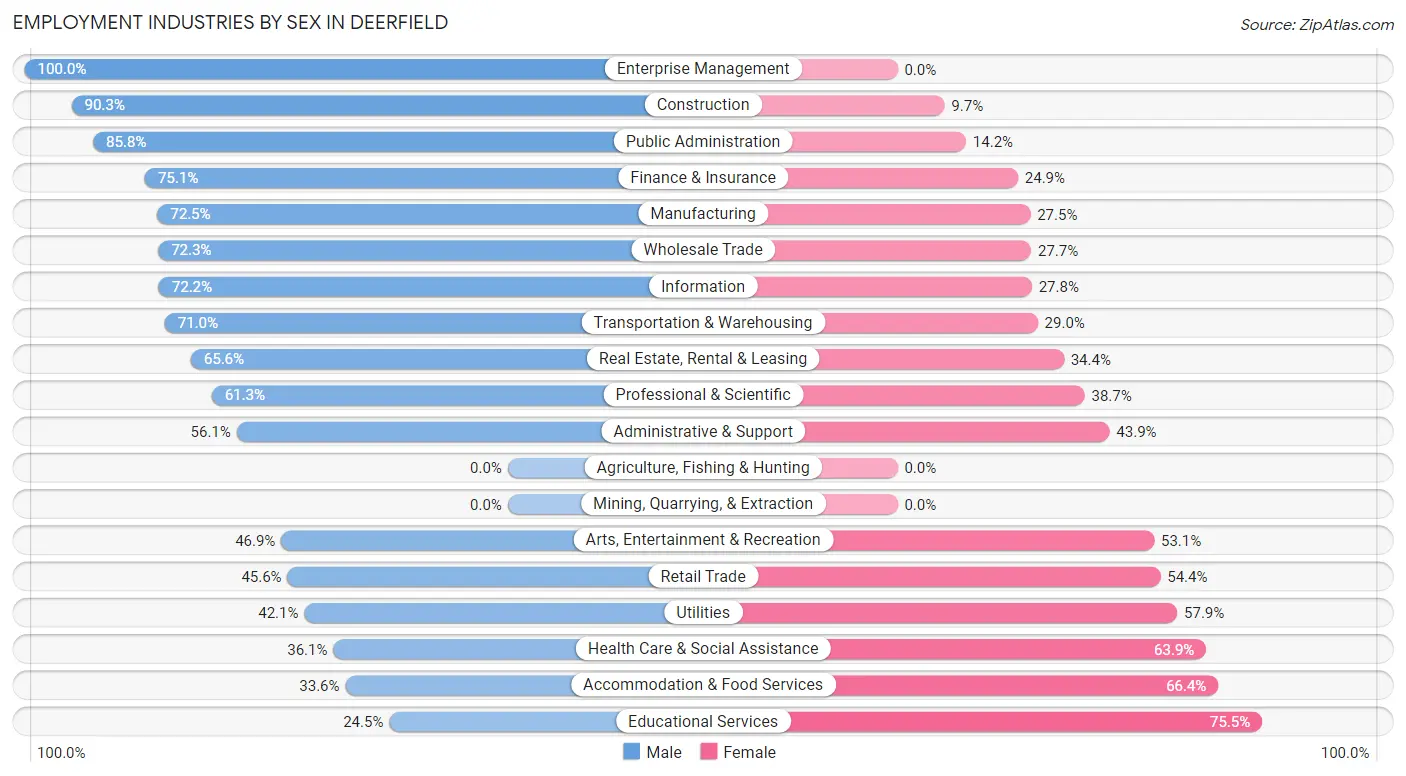
Employment Industries by Sex in Deerfield
The Deerfield industries that see more men than women are Enterprise Management (100.0%), Construction (90.3%), and Public Administration (85.8%), whereas the industries that tend to have a higher number of women are Educational Services (75.5%), Accommodation & Food Services (66.4%), and Health Care & Social Assistance (63.9%).
| Industry | Male | Female |
| Agriculture, Fishing & Hunting | 0 (0.0%) | 0 (0.0%) |
| Mining, Quarrying, & Extraction | 0 (0.0%) | 0 (0.0%) |
| Construction | 306 (90.3%) | 33 (9.7%) |
| Manufacturing | 649 (72.5%) | 246 (27.5%) |
| Wholesale Trade | 238 (72.3%) | 91 (27.7%) |
| Retail Trade | 502 (45.6%) | 599 (54.4%) |
| Transportation & Warehousing | 88 (71.0%) | 36 (29.0%) |
| Utilities | 8 (42.1%) | 11 (57.9%) |
| Information | 148 (72.2%) | 57 (27.8%) |
| Finance & Insurance | 813 (75.1%) | 270 (24.9%) |
| Real Estate, Rental & Leasing | 181 (65.6%) | 95 (34.4%) |
| Professional & Scientific | 1,137 (61.3%) | 719 (38.7%) |
| Enterprise Management | 11 (100.0%) | 0 (0.0%) |
| Administrative & Support | 133 (56.1%) | 104 (43.9%) |
| Educational Services | 224 (24.5%) | 689 (75.5%) |
| Health Care & Social Assistance | 548 (36.1%) | 970 (63.9%) |
| Arts, Entertainment & Recreation | 166 (46.9%) | 188 (53.1%) |
| Accommodation & Food Services | 123 (33.6%) | 243 (66.4%) |
| Public Administration | 121 (85.8%) | 20 (14.2%) |
| Total | 5,593 (54.9%) | 4,598 (45.1%) |
Education in Deerfield
School Enrollment in Deerfield
The most common levels of schooling among the 5,355 students in Deerfield are high school (1,255 | 23.4%), middle school (1,225 | 22.9%), and elementary school (1,144 | 21.4%).
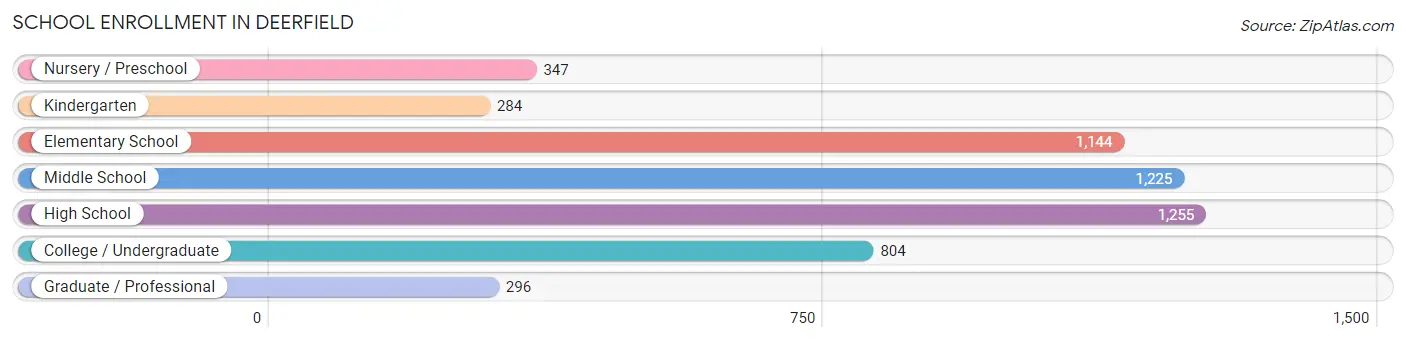
| School Level | # Students | % Students |
| Nursery / Preschool | 347 | 6.5% |
| Kindergarten | 284 | 5.3% |
| Elementary School | 1,144 | 21.4% |
| Middle School | 1,225 | 22.9% |
| High School | 1,255 | 23.4% |
| College / Undergraduate | 804 | 15.0% |
| Graduate / Professional | 296 | 5.5% |
| Total | 5,355 | 100.0% |
School Enrollment by Age by Funding Source in Deerfield
Out of a total of 5,355 students who are enrolled in schools in Deerfield, 942 (17.6%) attend a private institution, while the remaining 4,413 (82.4%) are enrolled in public schools. The age group of 3 to 4 year olds has the highest likelihood of being enrolled in private schools, with 201 (72.6% in the age bracket) enrolled. Conversely, the age group of 15 to 17 year olds has the lowest likelihood of being enrolled in a private school, with 962 (97.5% in the age bracket) attending a public institution.
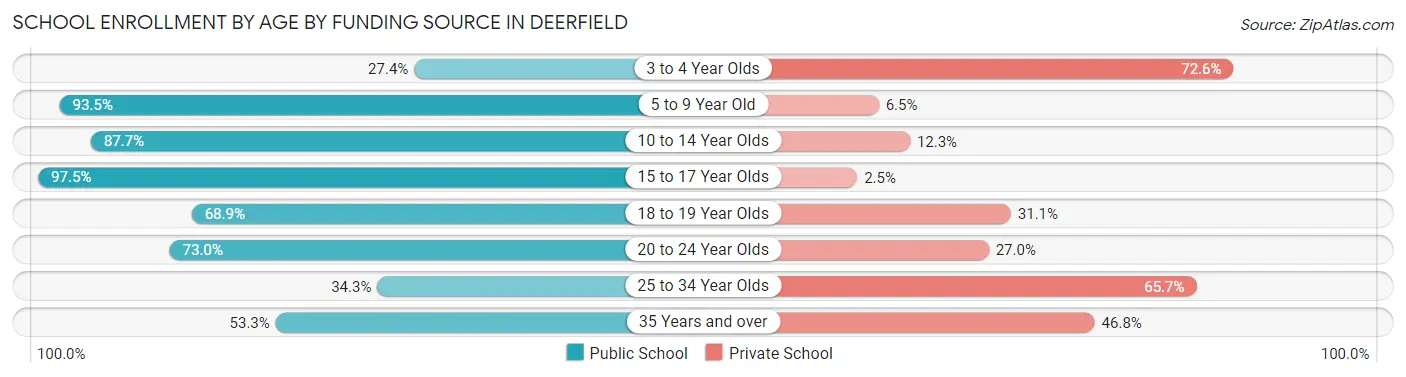
| Age Bracket | Public School | Private School |
| 3 to 4 Year Olds | 76 (27.4%) | 201 (72.6%) |
| 5 to 9 Year Old | 1,247 (93.5%) | 87 (6.5%) |
| 10 to 14 Year Olds | 1,350 (87.7%) | 190 (12.3%) |
| 15 to 17 Year Olds | 962 (97.5%) | 25 (2.5%) |
| 18 to 19 Year Olds | 241 (68.9%) | 109 (31.1%) |
| 20 to 24 Year Olds | 397 (73.0%) | 147 (27.0%) |
| 25 to 34 Year Olds | 58 (34.3%) | 111 (65.7%) |
| 35 Years and over | 82 (53.2%) | 72 (46.8%) |
| Total | 4,413 (82.4%) | 942 (17.6%) |
Educational Attainment by Field of Study in Deerfield
Business (2,606 | 22.0%), social sciences (1,420 | 12.0%), education (951 | 8.0%), engineering (907 | 7.7%), and psychology (797 | 6.7%) are the most common fields of study among 11,848 individuals in Deerfield who have obtained a bachelor's degree or higher.
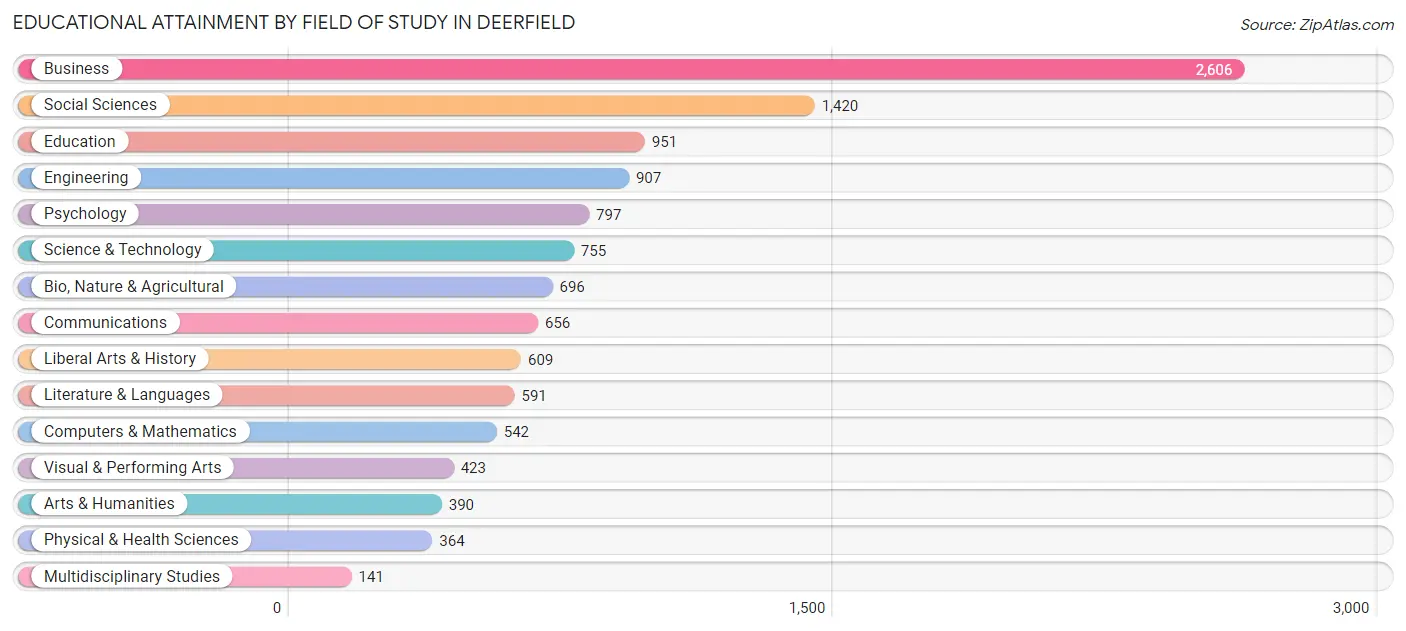
| Field of Study | # Graduates | % Graduates |
| Computers & Mathematics | 542 | 4.6% |
| Bio, Nature & Agricultural | 696 | 5.9% |
| Physical & Health Sciences | 364 | 3.1% |
| Psychology | 797 | 6.7% |
| Social Sciences | 1,420 | 12.0% |
| Engineering | 907 | 7.7% |
| Multidisciplinary Studies | 141 | 1.2% |
| Science & Technology | 755 | 6.4% |
| Business | 2,606 | 22.0% |
| Education | 951 | 8.0% |
| Literature & Languages | 591 | 5.0% |
| Liberal Arts & History | 609 | 5.1% |
| Visual & Performing Arts | 423 | 3.6% |
| Communications | 656 | 5.5% |
| Arts & Humanities | 390 | 3.3% |
| Total | 11,848 | 100.0% |
Transportation & Commute in Deerfield
Vehicle Availability by Sex in Deerfield
The most prevalent vehicle ownership categories in Deerfield are males with 2 vehicles (3,162, accounting for 57.0%) and females with 2 vehicles (2,529, making up 70.3%).
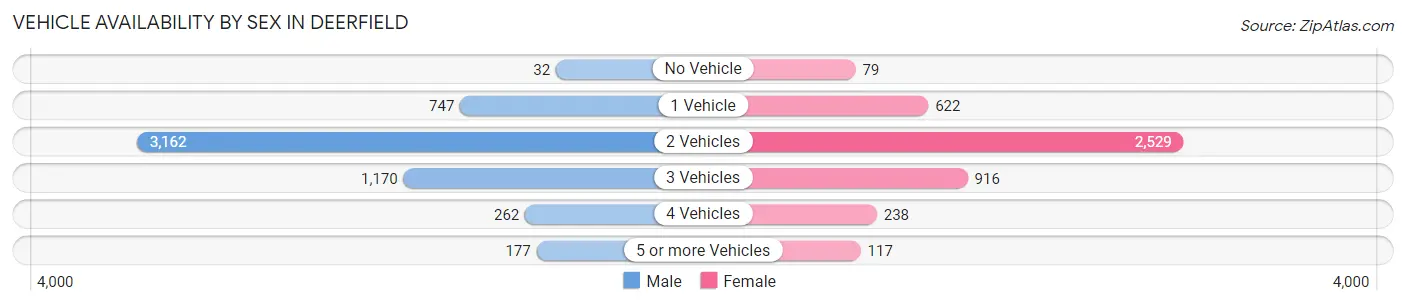
| Vehicles Available | Male | Female |
| No Vehicle | 32 (0.6%) | 79 (1.8%) |
| 1 Vehicle | 747 (13.5%) | 622 (13.8%) |
| 2 Vehicles | 3,162 (57.0%) | 2,529 (56.2%) |
| 3 Vehicles | 1,170 (21.1%) | 916 (20.3%) |
| 4 Vehicles | 262 (4.7%) | 238 (5.3%) |
| 5 or more Vehicles | 177 (3.2%) | 117 (2.6%) |
| Total | 5,550 (100.0%) | 4,501 (100.0%) |
Commute Time in Deerfield
The most frequently occuring commute durations in Deerfield are 20 to 24 minutes (1,148 commuters, 14.5%), 15 to 19 minutes (1,120 commuters, 14.1%), and 10 to 14 minutes (1,090 commuters, 13.8%).
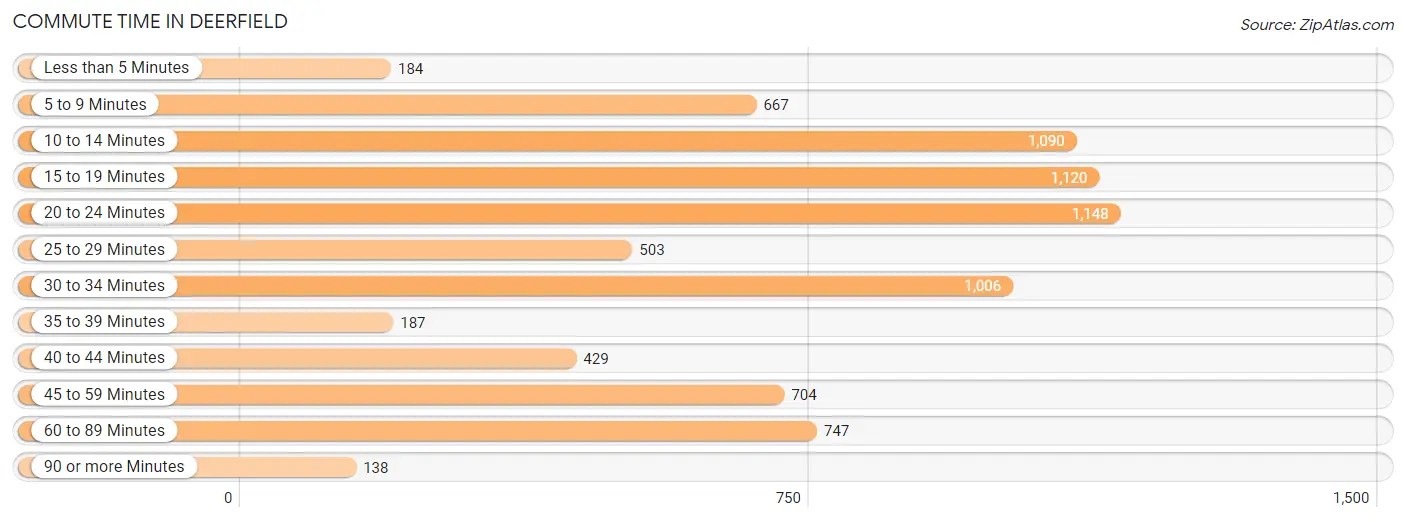
| Commute Time | # Commuters | % Commuters |
| Less than 5 Minutes | 184 | 2.3% |
| 5 to 9 Minutes | 667 | 8.4% |
| 10 to 14 Minutes | 1,090 | 13.8% |
| 15 to 19 Minutes | 1,120 | 14.1% |
| 20 to 24 Minutes | 1,148 | 14.5% |
| 25 to 29 Minutes | 503 | 6.4% |
| 30 to 34 Minutes | 1,006 | 12.7% |
| 35 to 39 Minutes | 187 | 2.4% |
| 40 to 44 Minutes | 429 | 5.4% |
| 45 to 59 Minutes | 704 | 8.9% |
| 60 to 89 Minutes | 747 | 9.4% |
| 90 or more Minutes | 138 | 1.7% |
Commute Time by Sex in Deerfield
The most common commute times in Deerfield are 20 to 24 minutes (721 commuters, 16.6%) for males and 15 to 19 minutes (650 commuters, 18.2%) for females.
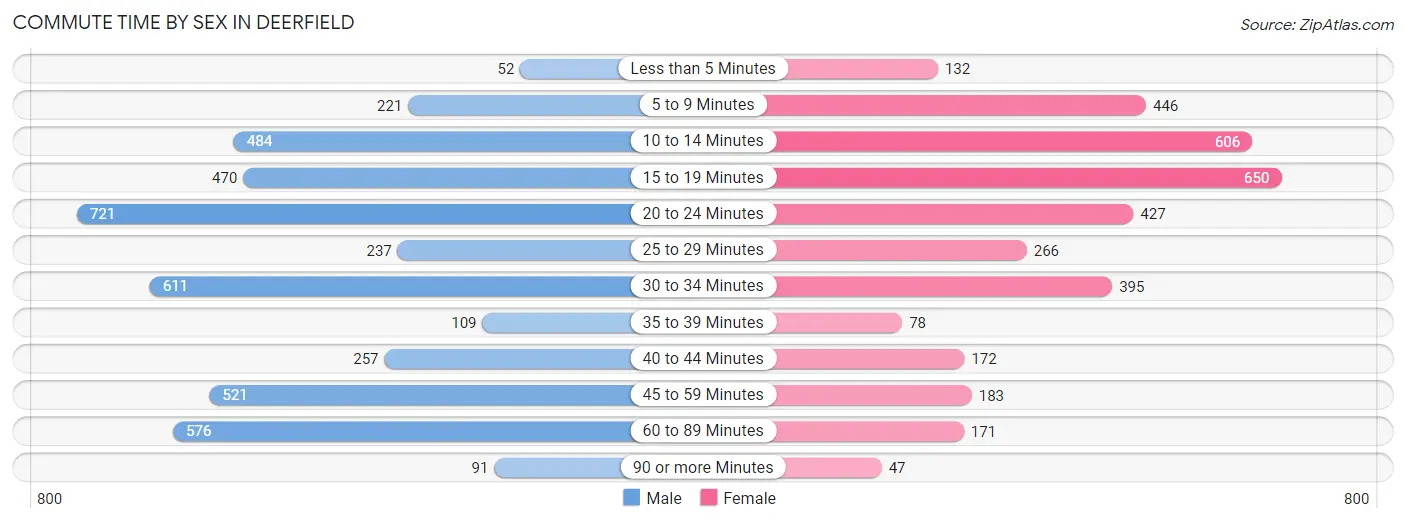
| Commute Time | Male | Female |
| Less than 5 Minutes | 52 (1.2%) | 132 (3.7%) |
| 5 to 9 Minutes | 221 (5.1%) | 446 (12.5%) |
| 10 to 14 Minutes | 484 (11.1%) | 606 (17.0%) |
| 15 to 19 Minutes | 470 (10.8%) | 650 (18.2%) |
| 20 to 24 Minutes | 721 (16.6%) | 427 (11.9%) |
| 25 to 29 Minutes | 237 (5.4%) | 266 (7.4%) |
| 30 to 34 Minutes | 611 (14.1%) | 395 (11.1%) |
| 35 to 39 Minutes | 109 (2.5%) | 78 (2.2%) |
| 40 to 44 Minutes | 257 (5.9%) | 172 (4.8%) |
| 45 to 59 Minutes | 521 (12.0%) | 183 (5.1%) |
| 60 to 89 Minutes | 576 (13.2%) | 171 (4.8%) |
| 90 or more Minutes | 91 (2.1%) | 47 (1.3%) |
Time of Departure to Work by Sex in Deerfield
The most frequent times of departure to work in Deerfield are 7:30 AM to 7:59 AM (866, 19.9%) for males and 8:00 AM to 8:29 AM (738, 20.6%) for females.
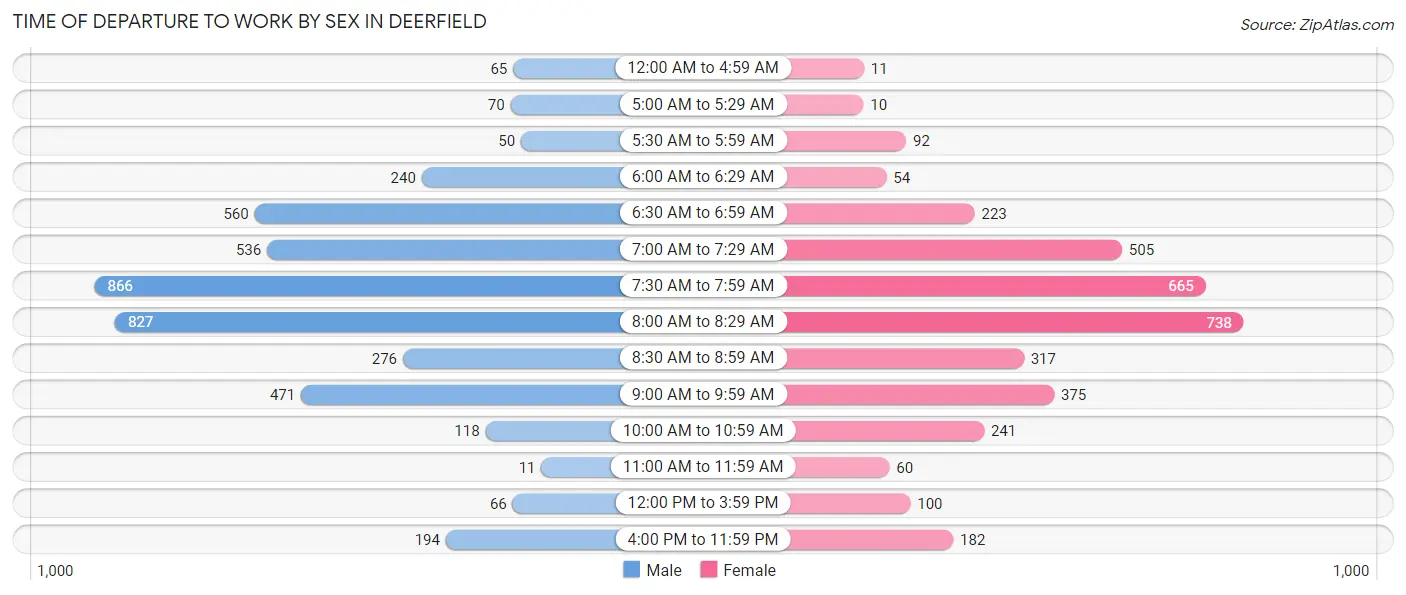
| Time of Departure | Male | Female |
| 12:00 AM to 4:59 AM | 65 (1.5%) | 11 (0.3%) |
| 5:00 AM to 5:29 AM | 70 (1.6%) | 10 (0.3%) |
| 5:30 AM to 5:59 AM | 50 (1.1%) | 92 (2.6%) |
| 6:00 AM to 6:29 AM | 240 (5.5%) | 54 (1.5%) |
| 6:30 AM to 6:59 AM | 560 (12.9%) | 223 (6.2%) |
| 7:00 AM to 7:29 AM | 536 (12.3%) | 505 (14.1%) |
| 7:30 AM to 7:59 AM | 866 (19.9%) | 665 (18.6%) |
| 8:00 AM to 8:29 AM | 827 (19.0%) | 738 (20.6%) |
| 8:30 AM to 8:59 AM | 276 (6.3%) | 317 (8.9%) |
| 9:00 AM to 9:59 AM | 471 (10.8%) | 375 (10.5%) |
| 10:00 AM to 10:59 AM | 118 (2.7%) | 241 (6.8%) |
| 11:00 AM to 11:59 AM | 11 (0.3%) | 60 (1.7%) |
| 12:00 PM to 3:59 PM | 66 (1.5%) | 100 (2.8%) |
| 4:00 PM to 11:59 PM | 194 (4.5%) | 182 (5.1%) |
| Total | 4,350 (100.0%) | 3,573 (100.0%) |
Housing Occupancy in Deerfield
Occupancy by Ownership in Deerfield
Of the total 7,358 dwellings in Deerfield, owner-occupied units account for 5,947 (80.8%), while renter-occupied units make up 1,411 (19.2%).
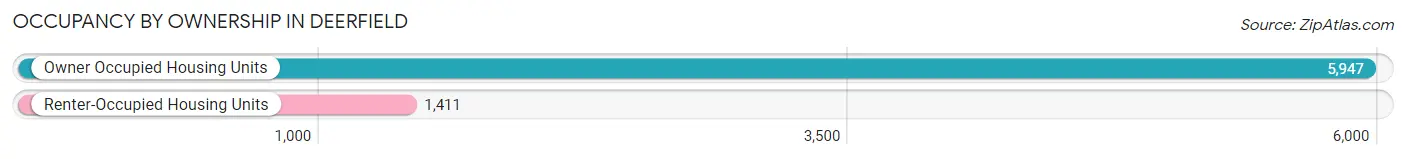
| Occupancy | # Housing Units | % Housing Units |
| Owner Occupied Housing Units | 5,947 | 80.8% |
| Renter-Occupied Housing Units | 1,411 | 19.2% |
| Total Occupied Housing Units | 7,358 | 100.0% |
Occupancy by Household Size in Deerfield
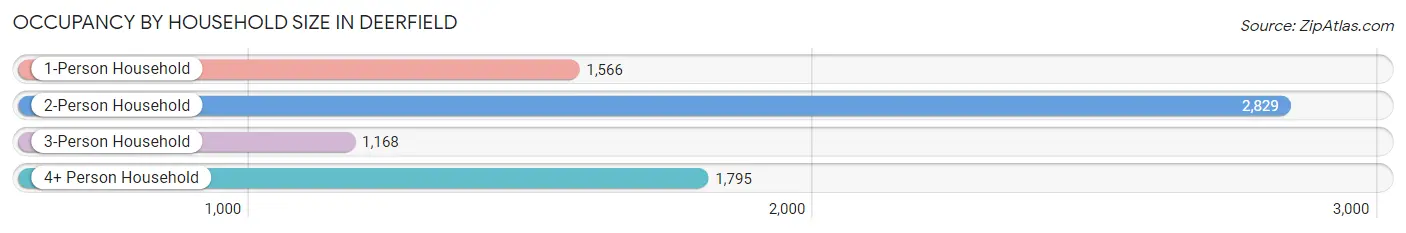
| Household Size | # Housing Units | % Housing Units |
| 1-Person Household | 1,566 | 21.3% |
| 2-Person Household | 2,829 | 38.5% |
| 3-Person Household | 1,168 | 15.9% |
| 4+ Person Household | 1,795 | 24.4% |
| Total Housing Units | 7,358 | 100.0% |
Occupancy by Ownership by Household Size in Deerfield
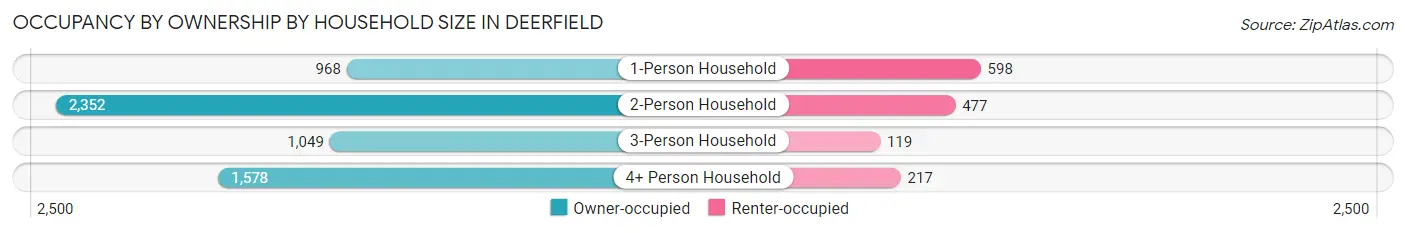
| Household Size | Owner-occupied | Renter-occupied |
| 1-Person Household | 968 (61.8%) | 598 (38.2%) |
| 2-Person Household | 2,352 (83.1%) | 477 (16.9%) |
| 3-Person Household | 1,049 (89.8%) | 119 (10.2%) |
| 4+ Person Household | 1,578 (87.9%) | 217 (12.1%) |
| Total Housing Units | 5,947 (80.8%) | 1,411 (19.2%) |
Occupancy by Educational Attainment in Deerfield
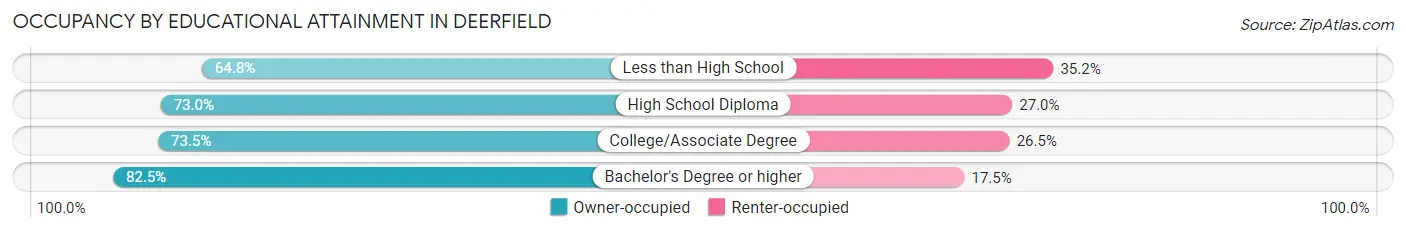
| Household Size | Owner-occupied | Renter-occupied |
| Less than High School | 83 (64.8%) | 45 (35.2%) |
| High School Diploma | 219 (73.0%) | 81 (27.0%) |
| College/Associate Degree | 583 (73.5%) | 210 (26.5%) |
| Bachelor's Degree or higher | 5,062 (82.5%) | 1,075 (17.5%) |
Occupancy by Age of Householder in Deerfield
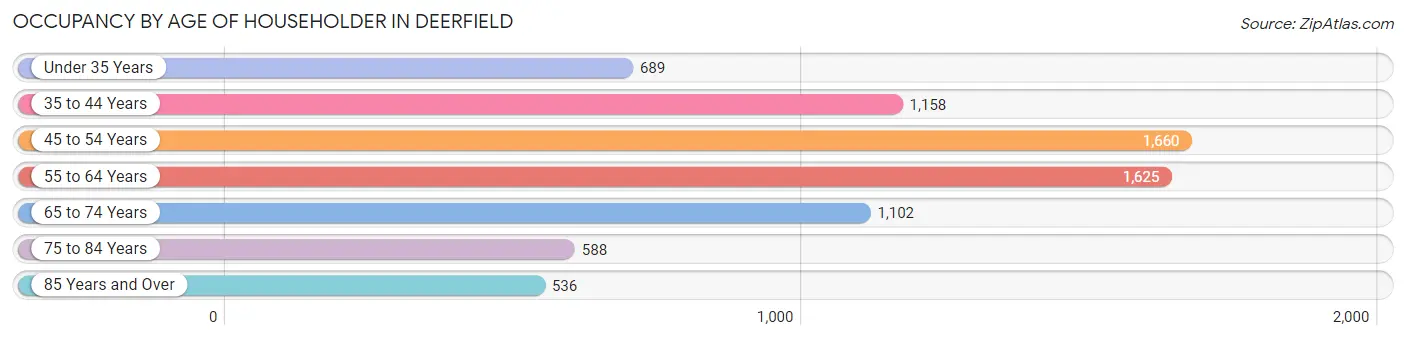
| Age Bracket | # Households | % Households |
| Under 35 Years | 689 | 9.4% |
| 35 to 44 Years | 1,158 | 15.7% |
| 45 to 54 Years | 1,660 | 22.6% |
| 55 to 64 Years | 1,625 | 22.1% |
| 65 to 74 Years | 1,102 | 15.0% |
| 75 to 84 Years | 588 | 8.0% |
| 85 Years and Over | 536 | 7.3% |
| Total | 7,358 | 100.0% |
Housing Finances in Deerfield
Median Income by Occupancy in Deerfield
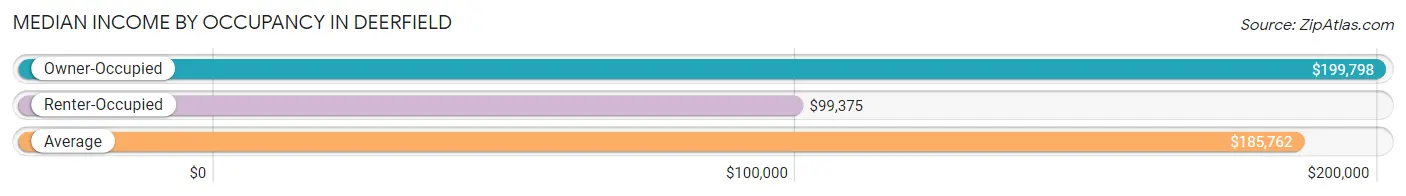
| Occupancy Type | # Households | Median Income |
| Owner-Occupied | 5,947 (80.8%) | $199,798 |
| Renter-Occupied | 1,411 (19.2%) | $99,375 |
| Average | 7,358 (100.0%) | $185,762 |
Occupancy by Householder Income Bracket in Deerfield
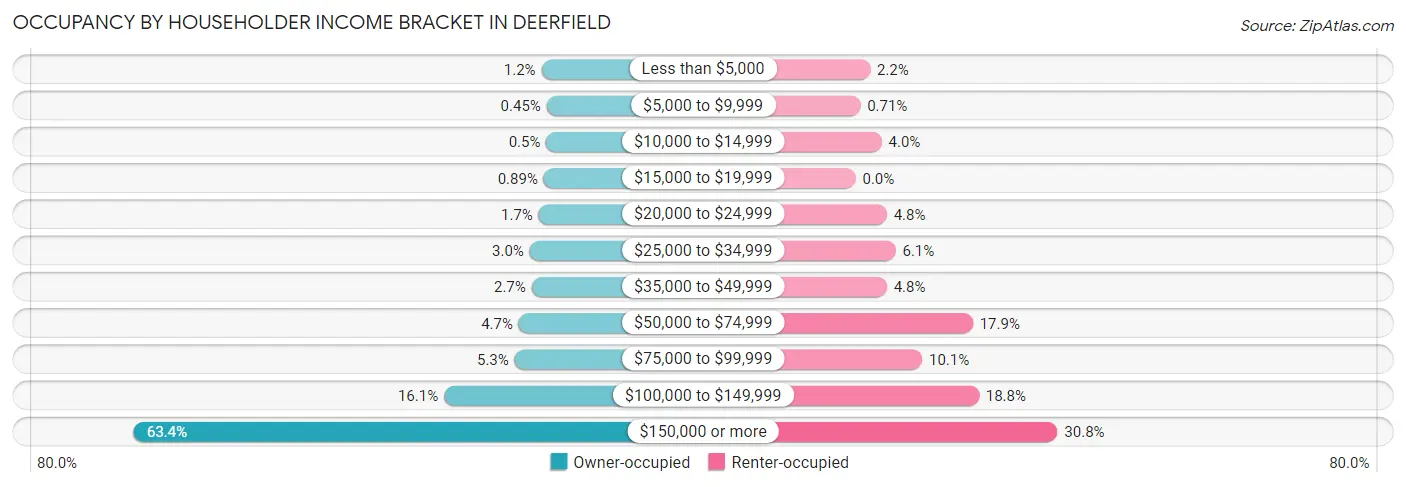
| Income Bracket | Owner-occupied | Renter-occupied |
| Less than $5,000 | 74 (1.2%) | 31 (2.2%) |
| $5,000 to $9,999 | 27 (0.4%) | 10 (0.7%) |
| $10,000 to $14,999 | 30 (0.5%) | 56 (4.0%) |
| $15,000 to $19,999 | 53 (0.9%) | 0 (0.0%) |
| $20,000 to $24,999 | 99 (1.7%) | 67 (4.8%) |
| $25,000 to $34,999 | 180 (3.0%) | 86 (6.1%) |
| $35,000 to $49,999 | 163 (2.7%) | 67 (4.8%) |
| $50,000 to $74,999 | 279 (4.7%) | 252 (17.9%) |
| $75,000 to $99,999 | 317 (5.3%) | 143 (10.1%) |
| $100,000 to $149,999 | 957 (16.1%) | 265 (18.8%) |
| $150,000 or more | 3,768 (63.4%) | 434 (30.8%) |
| Total | 5,947 (100.0%) | 1,411 (100.0%) |
Monthly Housing Cost Tiers in Deerfield
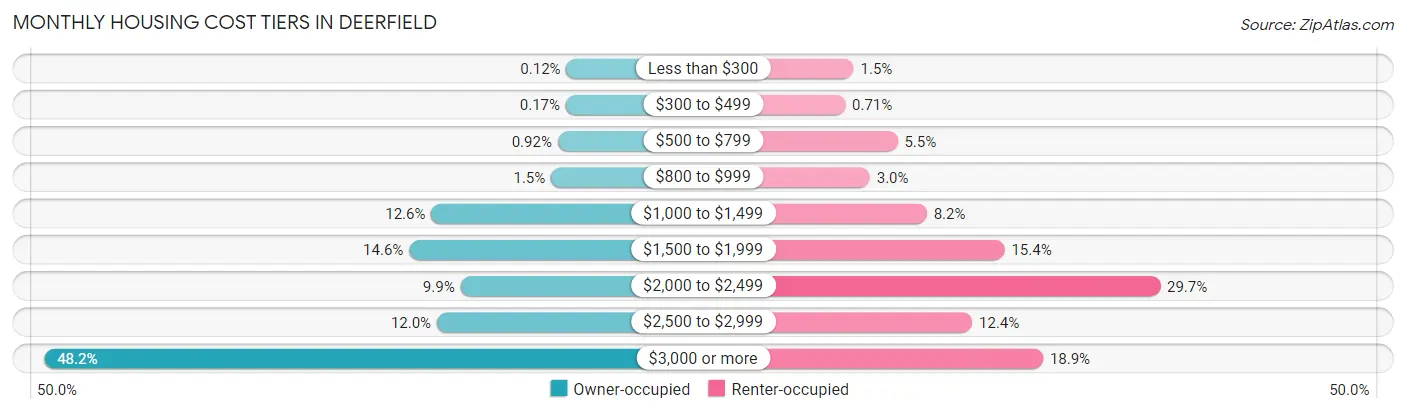
| Monthly Cost | Owner-occupied | Renter-occupied |
| Less than $300 | 7 (0.1%) | 21 (1.5%) |
| $300 to $499 | 10 (0.2%) | 10 (0.7%) |
| $500 to $799 | 55 (0.9%) | 78 (5.5%) |
| $800 to $999 | 91 (1.5%) | 42 (3.0%) |
| $1,000 to $1,499 | 747 (12.6%) | 116 (8.2%) |
| $1,500 to $1,999 | 868 (14.6%) | 217 (15.4%) |
| $2,000 to $2,499 | 587 (9.9%) | 419 (29.7%) |
| $2,500 to $2,999 | 716 (12.0%) | 175 (12.4%) |
| $3,000 or more | 2,866 (48.2%) | 267 (18.9%) |
| Total | 5,947 (100.0%) | 1,411 (100.0%) |
Physical Housing Characteristics in Deerfield
Housing Structures in Deerfield
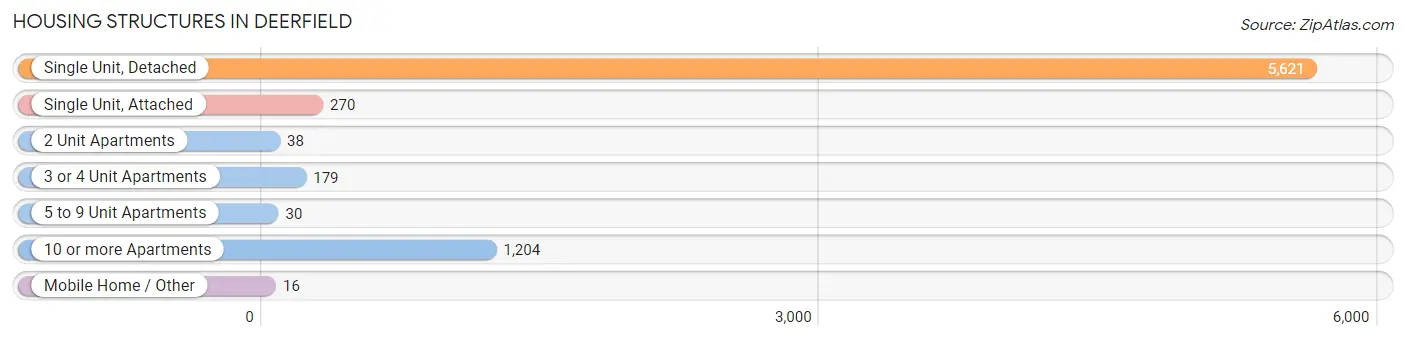
| Structure Type | # Housing Units | % Housing Units |
| Single Unit, Detached | 5,621 | 76.4% |
| Single Unit, Attached | 270 | 3.7% |
| 2 Unit Apartments | 38 | 0.5% |
| 3 or 4 Unit Apartments | 179 | 2.4% |
| 5 to 9 Unit Apartments | 30 | 0.4% |
| 10 or more Apartments | 1,204 | 16.4% |
| Mobile Home / Other | 16 | 0.2% |
| Total | 7,358 | 100.0% |
Housing Structures by Occupancy in Deerfield
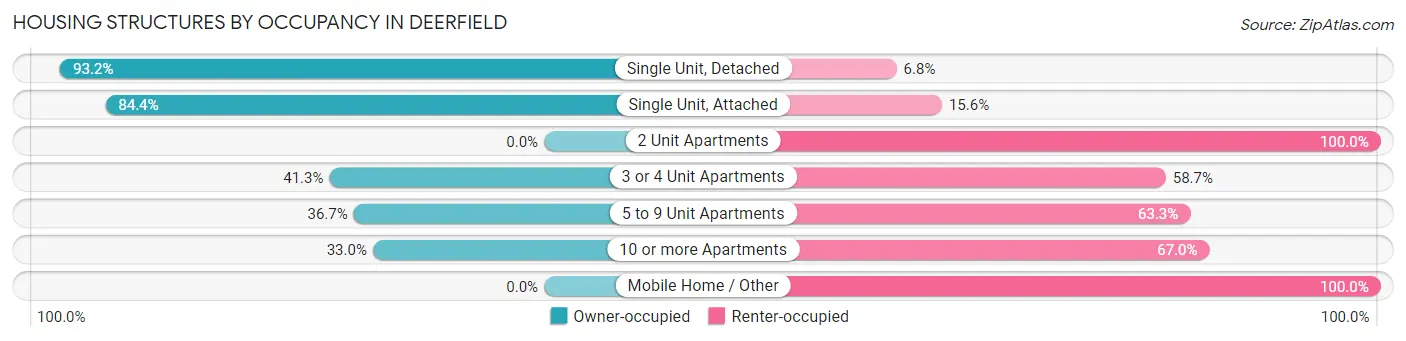
| Structure Type | Owner-occupied | Renter-occupied |
| Single Unit, Detached | 5,237 (93.2%) | 384 (6.8%) |
| Single Unit, Attached | 228 (84.4%) | 42 (15.6%) |
| 2 Unit Apartments | 0 (0.0%) | 38 (100.0%) |
| 3 or 4 Unit Apartments | 74 (41.3%) | 105 (58.7%) |
| 5 to 9 Unit Apartments | 11 (36.7%) | 19 (63.3%) |
| 10 or more Apartments | 397 (33.0%) | 807 (67.0%) |
| Mobile Home / Other | 0 (0.0%) | 16 (100.0%) |
| Total | 5,947 (80.8%) | 1,411 (19.2%) |
Housing Structures by Number of Rooms in Deerfield
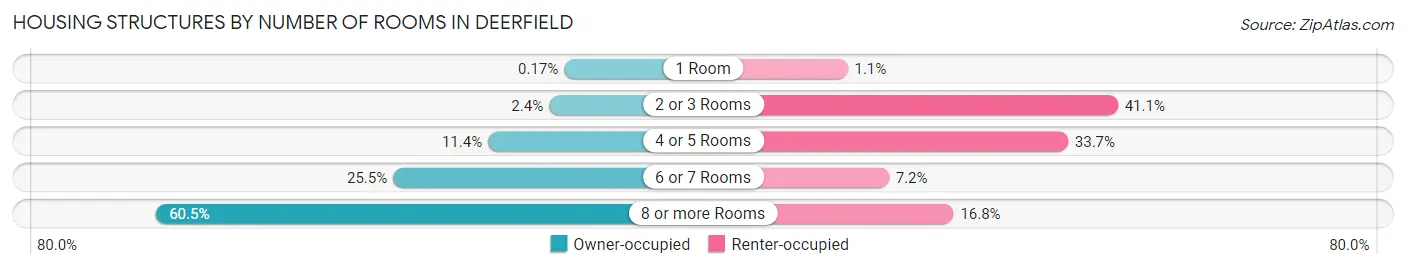
| Number of Rooms | Owner-occupied | Renter-occupied |
| 1 Room | 10 (0.2%) | 16 (1.1%) |
| 2 or 3 Rooms | 143 (2.4%) | 580 (41.1%) |
| 4 or 5 Rooms | 680 (11.4%) | 476 (33.7%) |
| 6 or 7 Rooms | 1,515 (25.5%) | 102 (7.2%) |
| 8 or more Rooms | 3,599 (60.5%) | 237 (16.8%) |
| Total | 5,947 (100.0%) | 1,411 (100.0%) |
Housing Structure by Heating Type in Deerfield
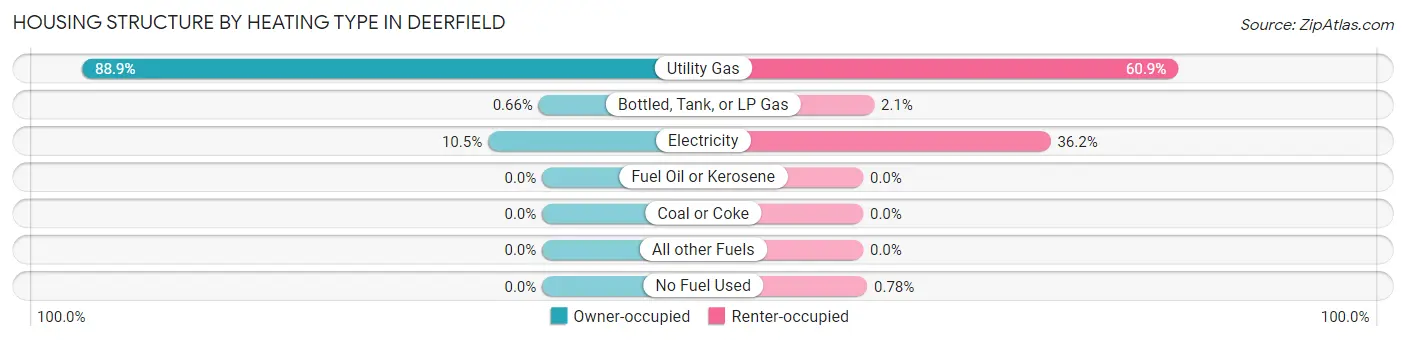
| Heating Type | Owner-occupied | Renter-occupied |
| Utility Gas | 5,286 (88.9%) | 859 (60.9%) |
| Bottled, Tank, or LP Gas | 39 (0.7%) | 30 (2.1%) |
| Electricity | 622 (10.5%) | 511 (36.2%) |
| Fuel Oil or Kerosene | 0 (0.0%) | 0 (0.0%) |
| Coal or Coke | 0 (0.0%) | 0 (0.0%) |
| All other Fuels | 0 (0.0%) | 0 (0.0%) |
| No Fuel Used | 0 (0.0%) | 11 (0.8%) |
| Total | 5,947 (100.0%) | 1,411 (100.0%) |
Household Vehicle Usage in Deerfield
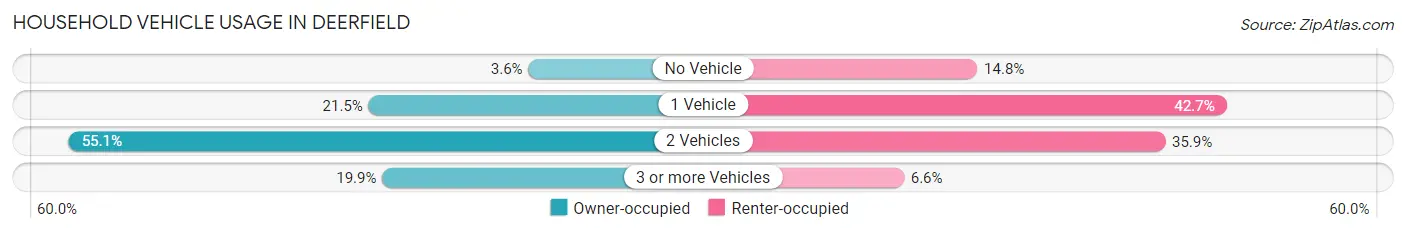
| Vehicles per Household | Owner-occupied | Renter-occupied |
| No Vehicle | 212 (3.6%) | 209 (14.8%) |
| 1 Vehicle | 1,276 (21.5%) | 603 (42.7%) |
| 2 Vehicles | 3,274 (55.0%) | 506 (35.9%) |
| 3 or more Vehicles | 1,185 (19.9%) | 93 (6.6%) |
| Total | 5,947 (100.0%) | 1,411 (100.0%) |
Real Estate & Mortgages in Deerfield
Real Estate and Mortgage Overview in Deerfield
| Characteristic | Without Mortgage | With Mortgage |
| Housing Units | 2,114 | 3,833 |
| Median Property Value | $551,000 | $617,800 |
| Median Household Income | $146,471 | $2,744 |
| Monthly Housing Costs | $1,501 | $2,733 |
| Real Estate Taxes | $10,001 | $0 |
Property Value by Mortgage Status in Deerfield
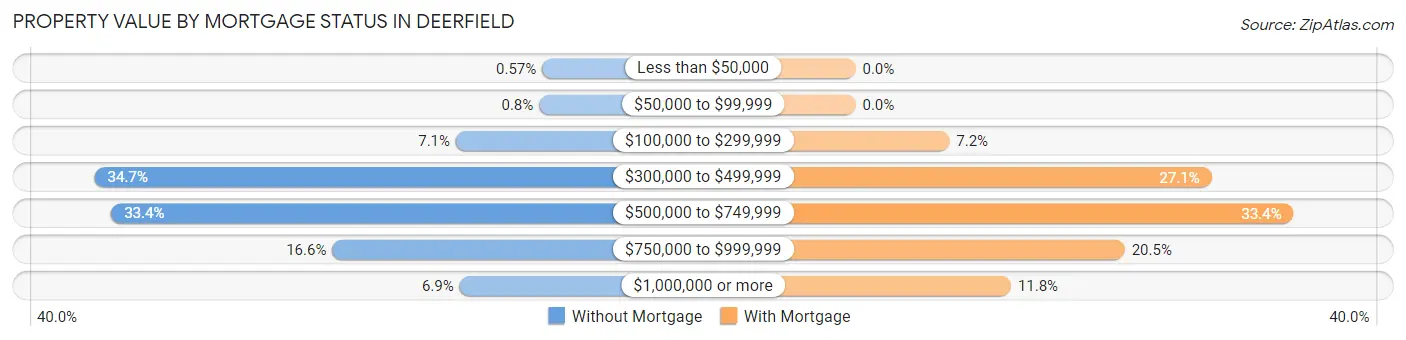
| Property Value | Without Mortgage | With Mortgage |
| Less than $50,000 | 12 (0.6%) | 0 (0.0%) |
| $50,000 to $99,999 | 17 (0.8%) | 0 (0.0%) |
| $100,000 to $299,999 | 151 (7.1%) | 274 (7.1%) |
| $300,000 to $499,999 | 733 (34.7%) | 1,040 (27.1%) |
| $500,000 to $749,999 | 706 (33.4%) | 1,279 (33.4%) |
| $750,000 to $999,999 | 350 (16.6%) | 786 (20.5%) |
| $1,000,000 or more | 145 (6.9%) | 454 (11.8%) |
| Total | 2,114 (100.0%) | 3,833 (100.0%) |
Household Income by Mortgage Status in Deerfield
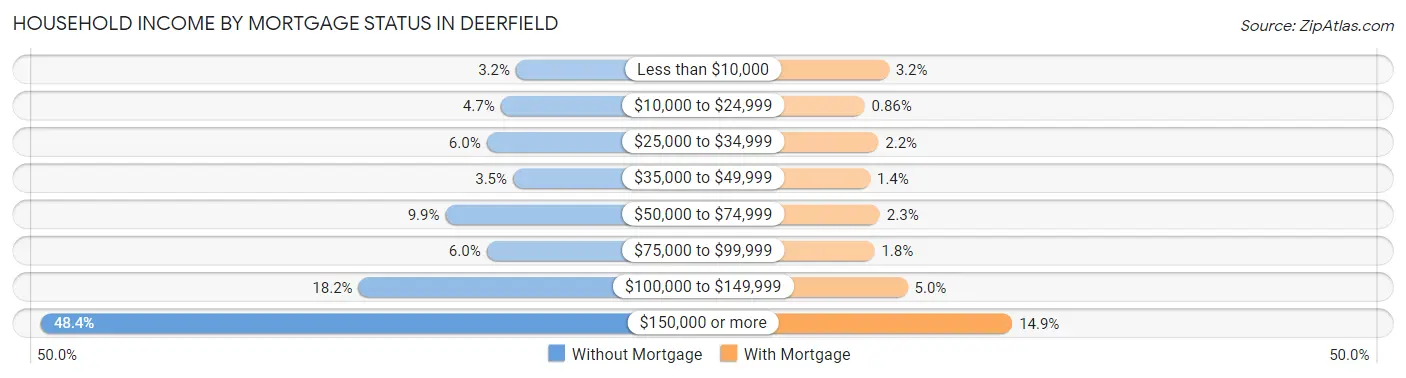
| Household Income | Without Mortgage | With Mortgage |
| Less than $10,000 | 68 (3.2%) | 121 (3.2%) |
| $10,000 to $24,999 | 99 (4.7%) | 33 (0.9%) |
| $25,000 to $34,999 | 127 (6.0%) | 83 (2.2%) |
| $35,000 to $49,999 | 74 (3.5%) | 53 (1.4%) |
| $50,000 to $74,999 | 210 (9.9%) | 89 (2.3%) |
| $75,000 to $99,999 | 127 (6.0%) | 69 (1.8%) |
| $100,000 to $149,999 | 385 (18.2%) | 190 (5.0%) |
| $150,000 or more | 1,024 (48.4%) | 572 (14.9%) |
| Total | 2,114 (100.0%) | 3,833 (100.0%) |
Property Value to Household Income Ratio in Deerfield
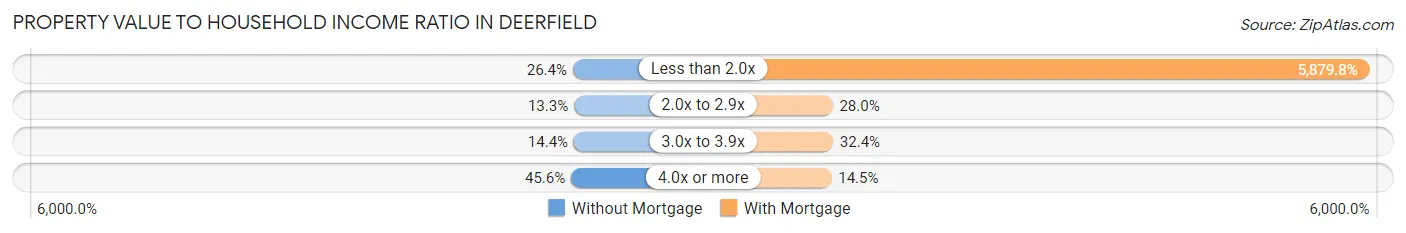
| Value-to-Income Ratio | Without Mortgage | With Mortgage |
| Less than 2.0x | 559 (26.4%) | 225,371 (5,879.7%) |
| 2.0x to 2.9x | 281 (13.3%) | 1,073 (28.0%) |
| 3.0x to 3.9x | 304 (14.4%) | 1,243 (32.4%) |
| 4.0x or more | 963 (45.6%) | 557 (14.5%) |
| Total | 2,114 (100.0%) | 3,833 (100.0%) |
Real Estate Taxes by Mortgage Status in Deerfield
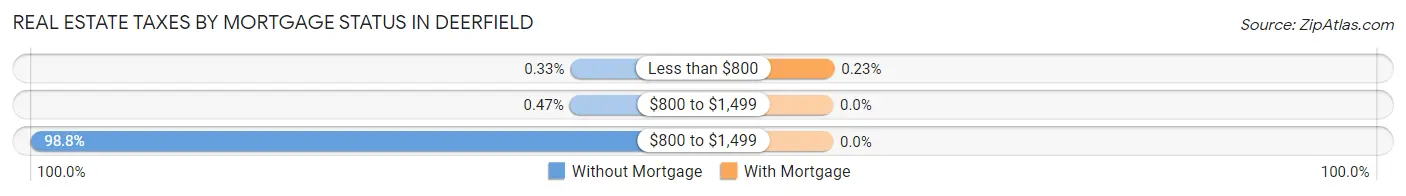
| Property Taxes | Without Mortgage | With Mortgage |
| Less than $800 | 7 (0.3%) | 9 (0.2%) |
| $800 to $1,499 | 10 (0.5%) | 0 (0.0%) |
| $800 to $1,499 | 2,088 (98.8%) | 0 (0.0%) |
| Total | 2,114 (100.0%) | 3,833 (100.0%) |
Health & Disability in Deerfield
Health Insurance Coverage by Age in Deerfield
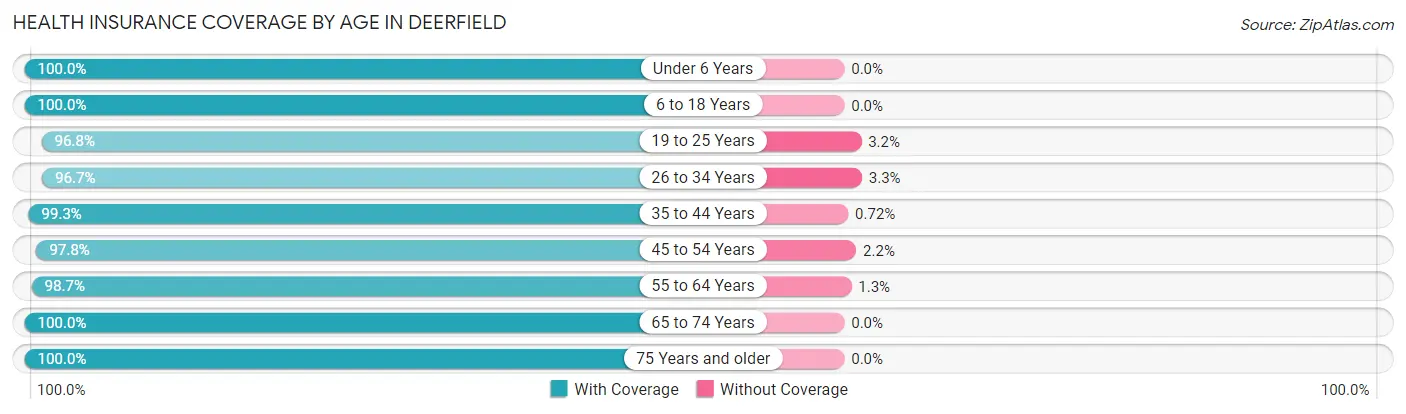
| Age Bracket | With Coverage | Without Coverage |
| Under 6 Years | 936 (100.0%) | 0 (0.0%) |
| 6 to 18 Years | 3,827 (100.0%) | 0 (0.0%) |
| 19 to 25 Years | 1,289 (96.8%) | 42 (3.2%) |
| 26 to 34 Years | 1,385 (96.7%) | 47 (3.3%) |
| 35 to 44 Years | 2,205 (99.3%) | 16 (0.7%) |
| 45 to 54 Years | 2,958 (97.8%) | 67 (2.2%) |
| 55 to 64 Years | 2,935 (98.7%) | 39 (1.3%) |
| 65 to 74 Years | 1,662 (100.0%) | 0 (0.0%) |
| 75 Years and older | 1,694 (100.0%) | 0 (0.0%) |
| Total | 18,891 (98.9%) | 211 (1.1%) |
Health Insurance Coverage by Citizenship Status in Deerfield
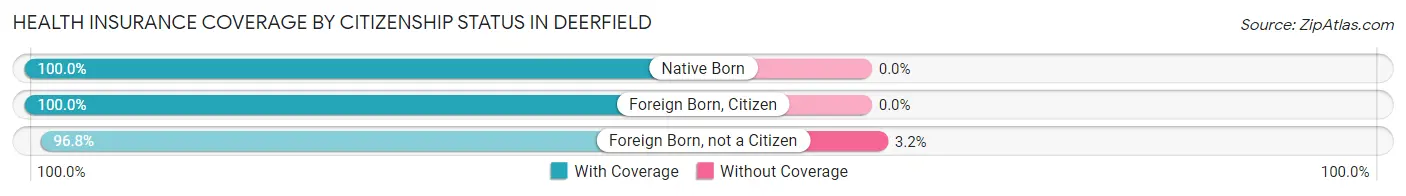
| Citizenship Status | With Coverage | Without Coverage |
| Native Born | 936 (100.0%) | 0 (0.0%) |
| Foreign Born, Citizen | 3,827 (100.0%) | 0 (0.0%) |
| Foreign Born, not a Citizen | 1,289 (96.8%) | 42 (3.2%) |
Health Insurance Coverage by Household Income in Deerfield
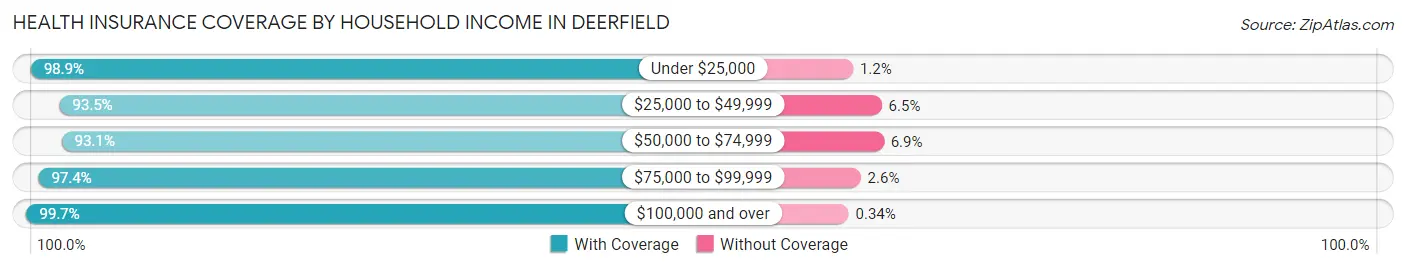
| Household Income | With Coverage | Without Coverage |
| Under $25,000 | 688 (98.9%) | 8 (1.1%) |
| $25,000 to $49,999 | 773 (93.5%) | 54 (6.5%) |
| $50,000 to $74,999 | 915 (93.1%) | 68 (6.9%) |
| $75,000 to $99,999 | 1,088 (97.4%) | 29 (2.6%) |
| $100,000 and over | 15,423 (99.7%) | 52 (0.3%) |
Public vs Private Health Insurance Coverage by Age in Deerfield
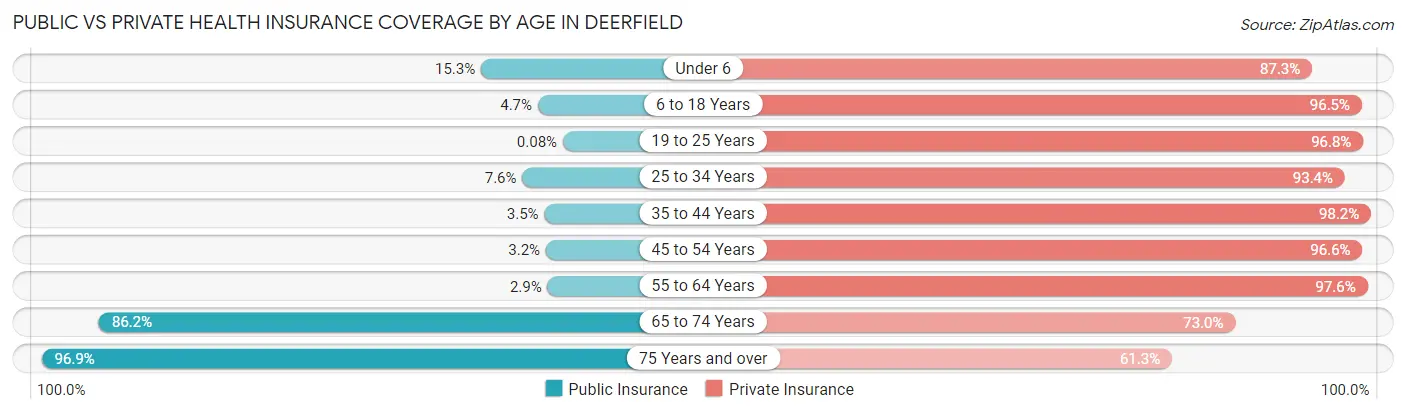
| Age Bracket | Public Insurance | Private Insurance |
| Under 6 | 143 (15.3%) | 817 (87.3%) |
| 6 to 18 Years | 181 (4.7%) | 3,694 (96.5%) |
| 19 to 25 Years | 1 (0.1%) | 1,288 (96.8%) |
| 25 to 34 Years | 109 (7.6%) | 1,337 (93.4%) |
| 35 to 44 Years | 78 (3.5%) | 2,182 (98.2%) |
| 45 to 54 Years | 98 (3.2%) | 2,923 (96.6%) |
| 55 to 64 Years | 87 (2.9%) | 2,902 (97.6%) |
| 65 to 74 Years | 1,433 (86.2%) | 1,214 (73.0%) |
| 75 Years and over | 1,641 (96.9%) | 1,038 (61.3%) |
| Total | 3,771 (19.7%) | 17,395 (91.1%) |
Disability Status by Sex by Age in Deerfield
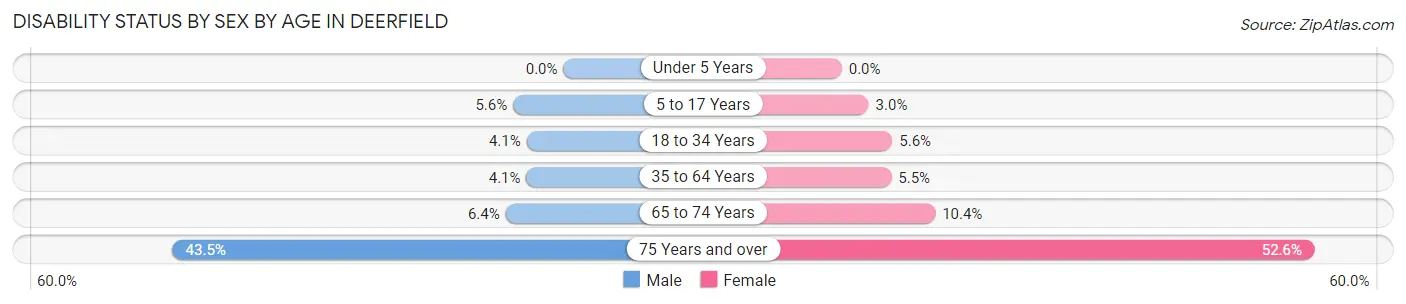
| Age Bracket | Male | Female |
| Under 5 Years | 0 (0.0%) | 0 (0.0%) |
| 5 to 17 Years | 111 (5.6%) | 57 (3.0%) |
| 18 to 34 Years | 69 (4.1%) | 71 (5.6%) |
| 35 to 64 Years | 167 (4.1%) | 230 (5.5%) |
| 65 to 74 Years | 50 (6.4%) | 92 (10.4%) |
| 75 Years and over | 295 (43.5%) | 534 (52.6%) |
Disability Class by Sex by Age in Deerfield
Disability Class: Hearing Difficulty
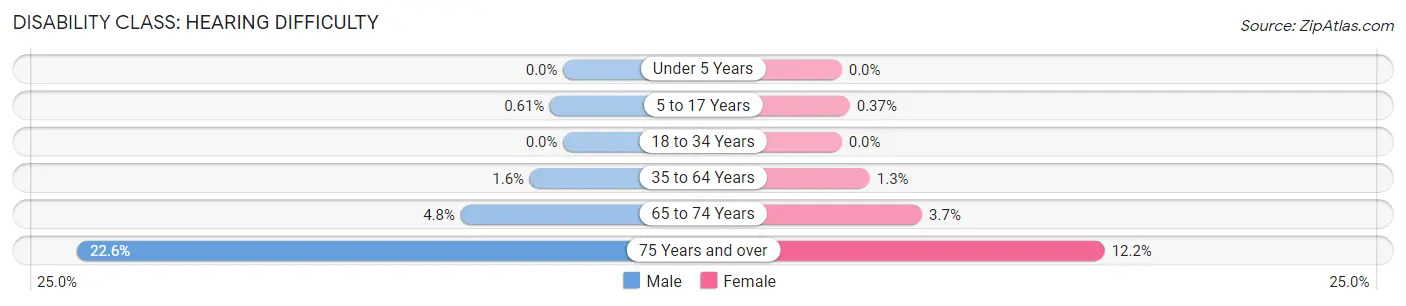
| Age Bracket | Male | Female |
| Under 5 Years | 0 (0.0%) | 0 (0.0%) |
| 5 to 17 Years | 12 (0.6%) | 7 (0.4%) |
| 18 to 34 Years | 0 (0.0%) | 0 (0.0%) |
| 35 to 64 Years | 63 (1.5%) | 54 (1.3%) |
| 65 to 74 Years | 37 (4.8%) | 33 (3.7%) |
| 75 Years and over | 153 (22.6%) | 124 (12.2%) |
Disability Class: Vision Difficulty
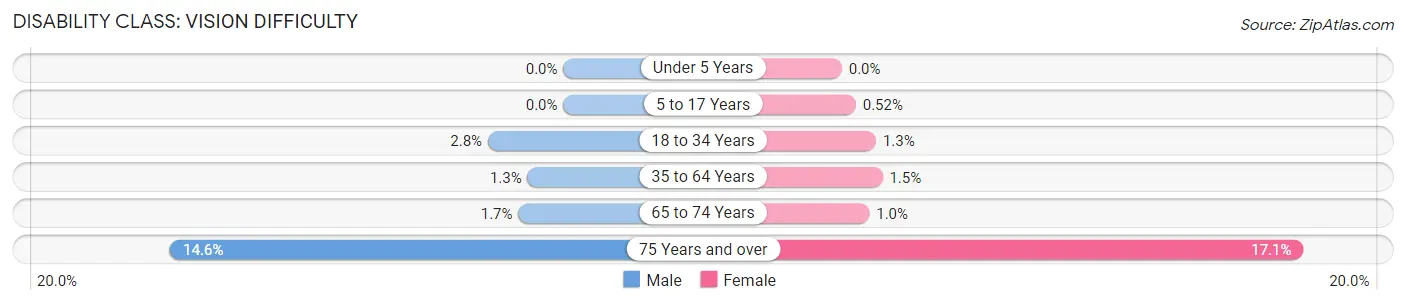
| Age Bracket | Male | Female |
| Under 5 Years | 0 (0.0%) | 0 (0.0%) |
| 5 to 17 Years | 0 (0.0%) | 10 (0.5%) |
| 18 to 34 Years | 47 (2.8%) | 16 (1.3%) |
| 35 to 64 Years | 54 (1.3%) | 63 (1.5%) |
| 65 to 74 Years | 13 (1.7%) | 9 (1.0%) |
| 75 Years and over | 99 (14.6%) | 174 (17.1%) |
Disability Class: Cognitive Difficulty
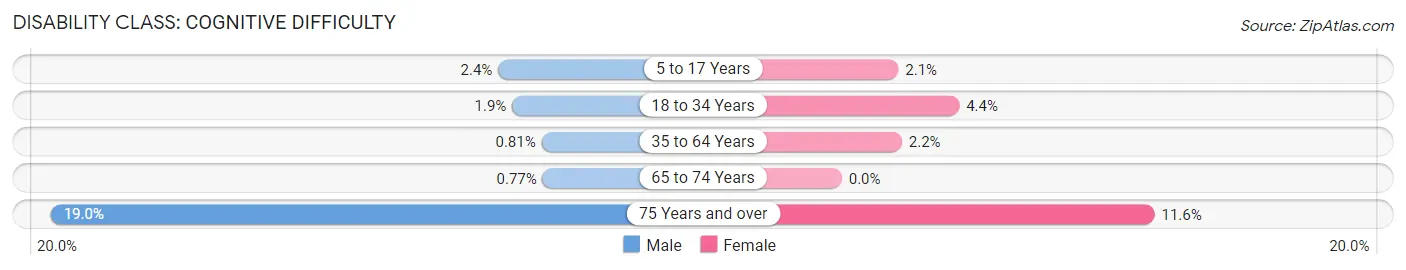
| Age Bracket | Male | Female |
| 5 to 17 Years | 48 (2.4%) | 40 (2.1%) |
| 18 to 34 Years | 32 (1.9%) | 55 (4.4%) |
| 35 to 64 Years | 33 (0.8%) | 93 (2.2%) |
| 65 to 74 Years | 6 (0.8%) | 0 (0.0%) |
| 75 Years and over | 129 (19.0%) | 118 (11.6%) |
Disability Class: Ambulatory Difficulty
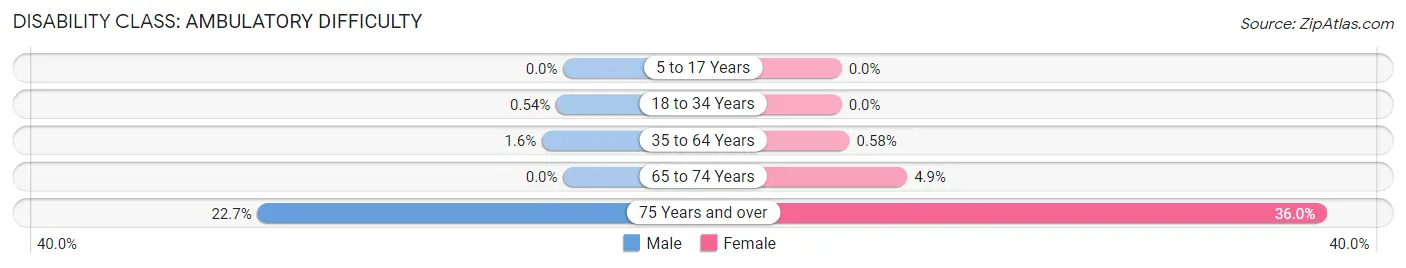
| Age Bracket | Male | Female |
| 5 to 17 Years | 0 (0.0%) | 0 (0.0%) |
| 18 to 34 Years | 9 (0.5%) | 0 (0.0%) |
| 35 to 64 Years | 64 (1.6%) | 24 (0.6%) |
| 65 to 74 Years | 0 (0.0%) | 43 (4.9%) |
| 75 Years and over | 154 (22.7%) | 366 (36.0%) |
Disability Class: Self-Care Difficulty
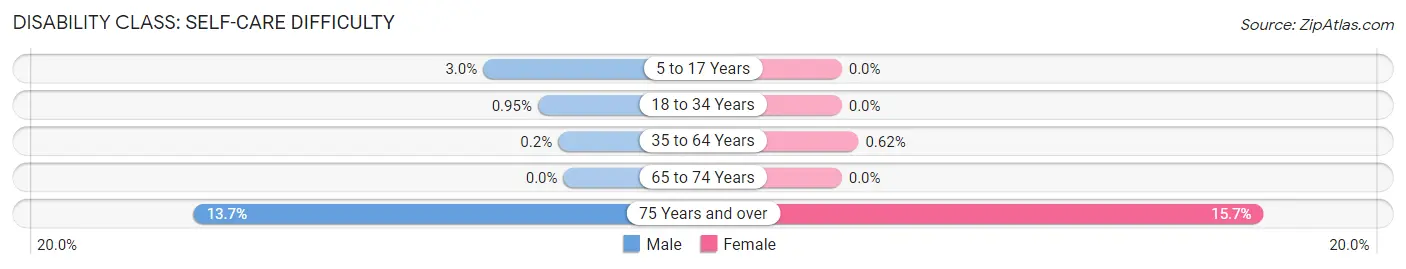
| Age Bracket | Male | Female |
| 5 to 17 Years | 59 (3.0%) | 0 (0.0%) |
| 18 to 34 Years | 16 (0.9%) | 0 (0.0%) |
| 35 to 64 Years | 8 (0.2%) | 26 (0.6%) |
| 65 to 74 Years | 0 (0.0%) | 0 (0.0%) |
| 75 Years and over | 93 (13.7%) | 159 (15.7%) |
Technology Access in Deerfield
Computing Device Access in Deerfield
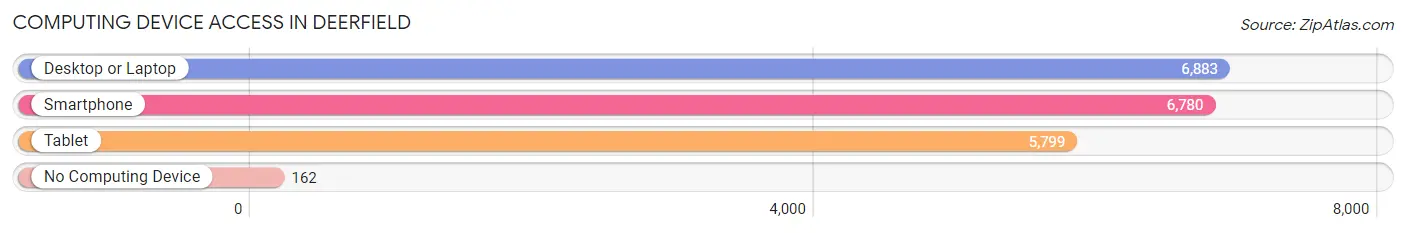
| Device Type | # Households | % Households |
| Desktop or Laptop | 6,883 | 93.5% |
| Smartphone | 6,780 | 92.1% |
| Tablet | 5,799 | 78.8% |
| No Computing Device | 162 | 2.2% |
| Total | 7,358 | 100.0% |
Internet Access in Deerfield
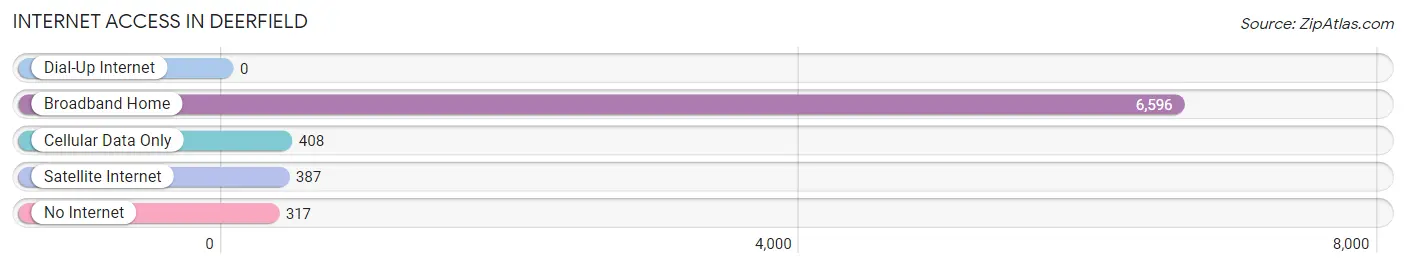
| Internet Type | # Households | % Households |
| Dial-Up Internet | 0 | 0.0% |
| Broadband Home | 6,596 | 89.6% |
| Cellular Data Only | 408 | 5.5% |
| Satellite Internet | 387 | 5.3% |
| No Internet | 317 | 4.3% |
| Total | 7,358 | 100.0% |
Deerfield Summary
Deerfield, Illinois is a village located in Lake County, Illinois, United States. It is a northern suburb of Chicago, located approximately 25 miles north of the city. As of the 2010 census, the population of Deerfield was 18,225.
History
The area that is now Deerfield was originally inhabited by the Potawatomi Native American tribe. The first non-native settlers arrived in the area in 1835, and the village was officially incorporated in 1903. The village was named after the deer that roamed the area.
In the early 20th century, Deerfield was a small farming community. In the 1950s, the village began to experience rapid growth as Chicagoans moved to the area in search of more affordable housing. This growth continued into the 1970s and 1980s, and Deerfield has since become a prosperous suburb of Chicago.
Geography
Deerfield is located in northeastern Illinois, in Lake County. It is bordered by the villages of Bannockburn, Riverwoods, and Highland Park to the north, Northbrook to the east, Lincolnshire to the south, and Lake Forest to the west. The village covers an area of 8.3 square miles, and is located approximately 25 miles north of downtown Chicago.
The terrain of Deerfield is mostly flat, with some rolling hills in the northern part of the village. The village is located on the Des Plaines River, and is home to several small lakes and ponds.
Economy
Deerfield is home to a number of large corporations, including Walgreens, Baxter International, and Mondelez International. The village is also home to a number of smaller businesses, including restaurants, retail stores, and professional services.
The village has a strong commercial base, with a number of shopping centers and office parks located in the area. The village is also home to a number of corporate headquarters, including Walgreens, Baxter International, and Mondelez International.
Demographics
As of the 2010 census, the population of Deerfield was 18,225. The racial makeup of the village was 87.3% White, 4.2% Asian, 3.2% African American, and 2.3% Hispanic or Latino.
The median household income in Deerfield was $118,845 in 2017, and the median home value was $541,400. The village has a highly educated population, with over 80% of residents having a bachelor's degree or higher.
Conclusion
Deerfield, Illinois is a village located in Lake County, Illinois, United States. It is a northern suburb of Chicago, located approximately 25 miles north of the city. As of the 2010 census, the population of Deerfield was 18,225. The area was originally inhabited by the Potawatomi Native American tribe, and was officially incorporated in 1903. The village has experienced rapid growth since the 1950s, and is now a prosperous suburb of Chicago. The village is home to a number of large corporations, and has a strong commercial base. The population of Deerfield is mostly white, with a median household income of $118,845 and a median home value of $541,400. The village has a highly educated population, with over 80% of residents having a bachelor's degree or higher.
Common Questions
What is Per Capita Income in Deerfield?
Per Capita income in Deerfield is $92,981.
What is the Median Family Income in Deerfield?
Median Family Income in Deerfield is $212,582.
What is the Median Household income in Deerfield?
Median Household Income in Deerfield is $185,762.
What is Income or Wage Gap in Deerfield?
Income or Wage Gap in Deerfield is 47.8%.
Women in Deerfield earn 52.2 cents for every dollar earned by a man.
What is Inequality or Gini Index in Deerfield?
Inequality or Gini Index in Deerfield is 0.46.
What is the Total Population of Deerfield?
Total Population of Deerfield is 19,173.
What is the Total Male Population of Deerfield?
Total Male Population of Deerfield is 9,677.
What is the Total Female Population of Deerfield?
Total Female Population of Deerfield is 9,496.
What is the Ratio of Males per 100 Females in Deerfield?
There are 101.91 Males per 100 Females in Deerfield.
What is the Ratio of Females per 100 Males in Deerfield?
There are 98.13 Females per 100 Males in Deerfield.
What is the Median Population Age in Deerfield?
Median Population Age in Deerfield is 44.6 Years.
What is the Average Family Size in Deerfield
Average Family Size in Deerfield is 3.0 People.
What is the Average Household Size in Deerfield
Average Household Size in Deerfield is 2.6 People.
How Large is the Labor Force in Deerfield?
There are 10,433 People in the Labor Forcein in Deerfield.
What is the Percentage of People in the Labor Force in Deerfield?
68.2% of People are in the Labor Force in Deerfield.
What is the Unemployment Rate in Deerfield?
Unemployment Rate in Deerfield is 2.4%.