Bannockburn, IL Map & Demographics
Bannockburn Map
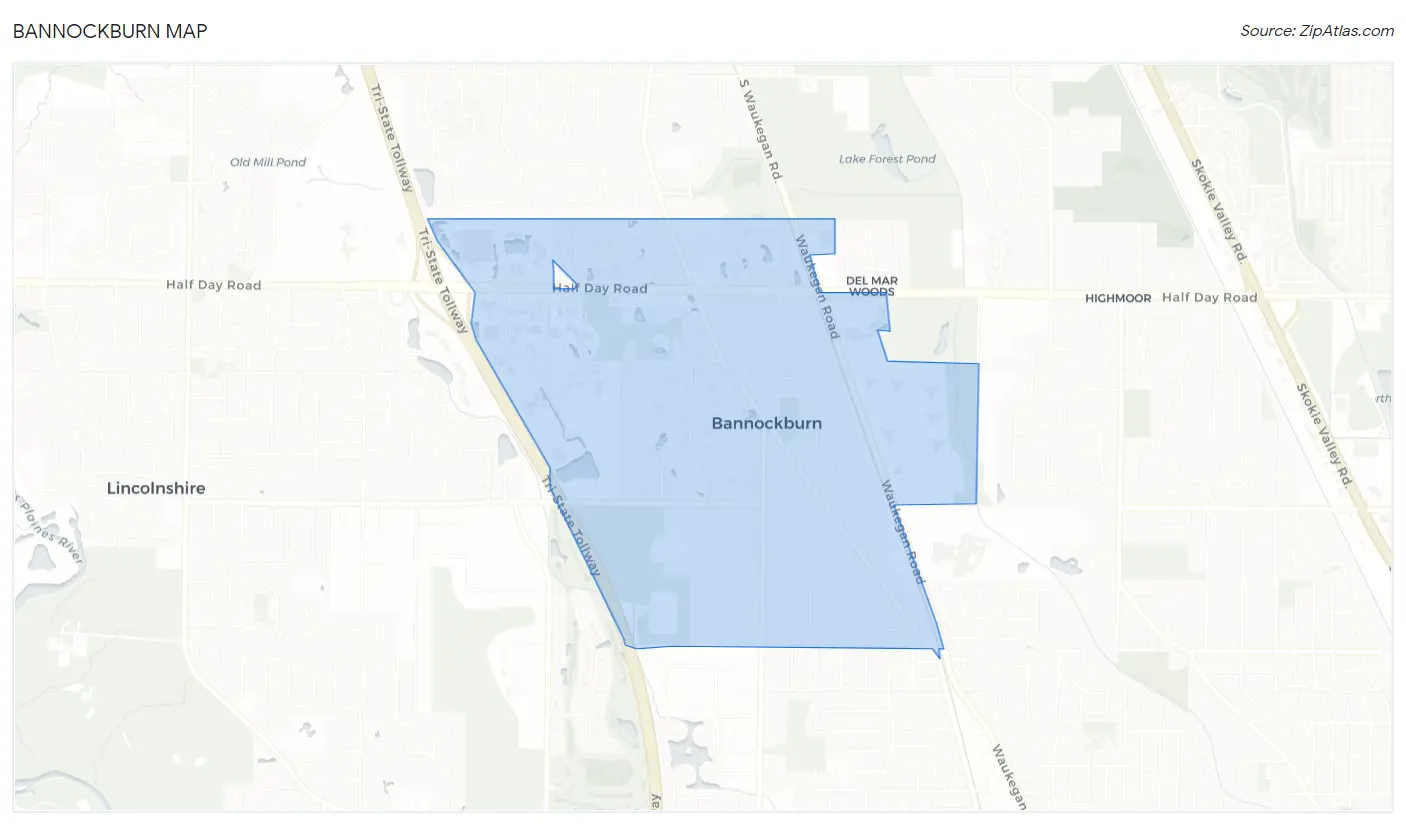
Bannockburn Overview
$81,849
PER CAPITA INCOME
$195,417
AVG FAMILY INCOME
$161,875
AVG HOUSEHOLD INCOME
0.58
INEQUALITY / GINI INDEX
1,065
TOTAL POPULATION
567
MALE POPULATION
498
FEMALE POPULATION
113.86
MALES / 100 FEMALES
87.83
FEMALES / 100 MALES
24.9
MEDIAN AGE
3.0
AVG FAMILY SIZE
2.6
AVG HOUSEHOLD SIZE
552
LABOR FORCE [ PEOPLE ]
58.8%
PERCENT IN LABOR FORCE
2.2%
UNEMPLOYMENT RATE
Income in Bannockburn
Income Overview in Bannockburn
Per Capita Income in Bannockburn is $81,849, while median incomes of families and households are $195,417 and $161,875 respectively.
| Characteristic | Number | Measure |
| Per Capita Income | 1,065 | $81,849 |
| Median Family Income | 191 | $195,417 |
| Mean Family Income | 191 | $389,576 |
| Median Household Income | 239 | $161,875 |
| Mean Household Income | 239 | $340,814 |
| Income Deficit | 191 | $0 |
| Wage / Income Gap (%) | 1,065 | 0.00% |
| Wage / Income Gap ($) | 1,065 | 100.00¢ per $1 |
| Gini / Inequality Index | 1,065 | 0.58 |
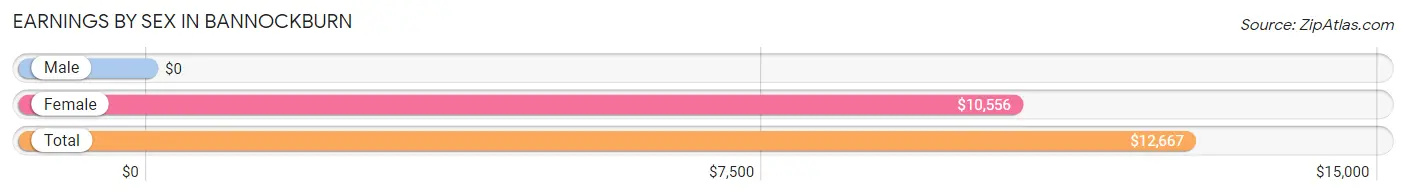
Earnings by Sex in Bannockburn
| Sex | Number | Average Earnings |
| Male | 360 (58.8%) | $0 |
| Female | 252 (41.2%) | $10,556 |
| Total | 612 (100.0%) | $12,667 |
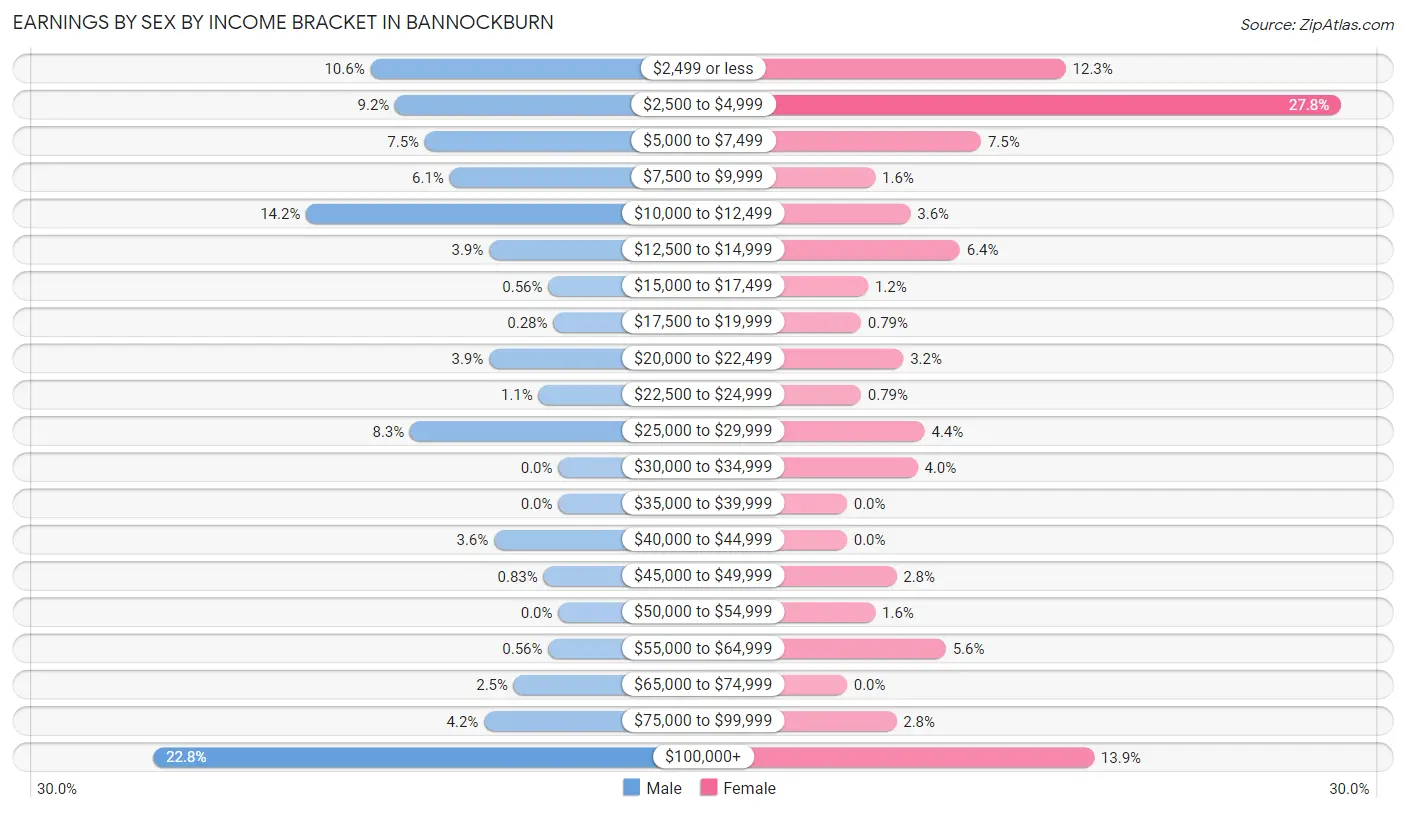
Earnings by Sex by Income Bracket in Bannockburn
The most common earnings brackets in Bannockburn are $100,000+ for men (82 | 22.8%) and $2,500 to $4,999 for women (70 | 27.8%).
| Income | Male | Female |
| $2,499 or less | 38 (10.6%) | 31 (12.3%) |
| $2,500 to $4,999 | 33 (9.2%) | 70 (27.8%) |
| $5,000 to $7,499 | 27 (7.5%) | 19 (7.5%) |
| $7,500 to $9,999 | 22 (6.1%) | 4 (1.6%) |
| $10,000 to $12,499 | 51 (14.2%) | 9 (3.6%) |
| $12,500 to $14,999 | 14 (3.9%) | 16 (6.4%) |
| $15,000 to $17,499 | 2 (0.6%) | 3 (1.2%) |
| $17,500 to $19,999 | 1 (0.3%) | 2 (0.8%) |
| $20,000 to $22,499 | 14 (3.9%) | 8 (3.2%) |
| $22,500 to $24,999 | 4 (1.1%) | 2 (0.8%) |
| $25,000 to $29,999 | 30 (8.3%) | 11 (4.4%) |
| $30,000 to $34,999 | 0 (0.0%) | 10 (4.0%) |
| $35,000 to $39,999 | 0 (0.0%) | 0 (0.0%) |
| $40,000 to $44,999 | 13 (3.6%) | 0 (0.0%) |
| $45,000 to $49,999 | 3 (0.8%) | 7 (2.8%) |
| $50,000 to $54,999 | 0 (0.0%) | 4 (1.6%) |
| $55,000 to $64,999 | 2 (0.6%) | 14 (5.6%) |
| $65,000 to $74,999 | 9 (2.5%) | 0 (0.0%) |
| $75,000 to $99,999 | 15 (4.2%) | 7 (2.8%) |
| $100,000+ | 82 (22.8%) | 35 (13.9%) |
| Total | 360 (100.0%) | 252 (100.0%) |
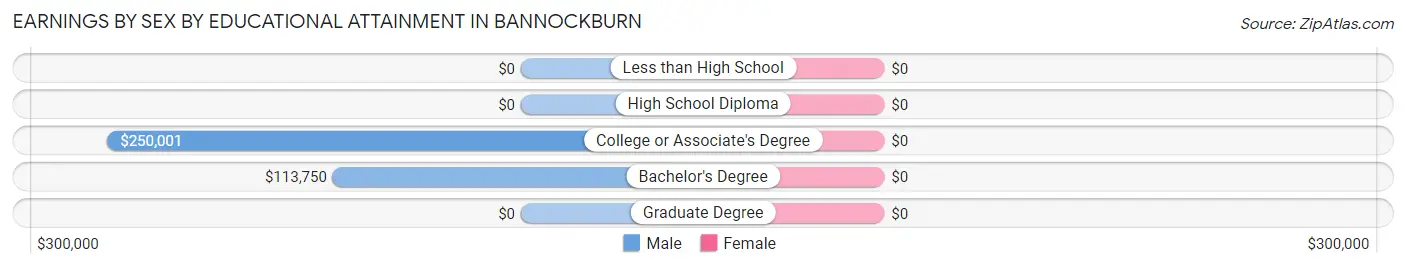
Earnings by Sex by Educational Attainment in Bannockburn
| Educational Attainment | Male Income | Female Income |
| Less than High School | - | - |
| High School Diploma | - | - |
| College or Associate's Degree | $250,001 | $0 |
| Bachelor's Degree | $113,750 | $0 |
| Graduate Degree | - | - |
| Total | $76,250 | $46,250 |
Family Income in Bannockburn
Family Income Brackets in Bannockburn
According to the Bannockburn family income data, there are 93 families falling into the $200,000+ income range, which is the most common income bracket and makes up 48.7% of all families.
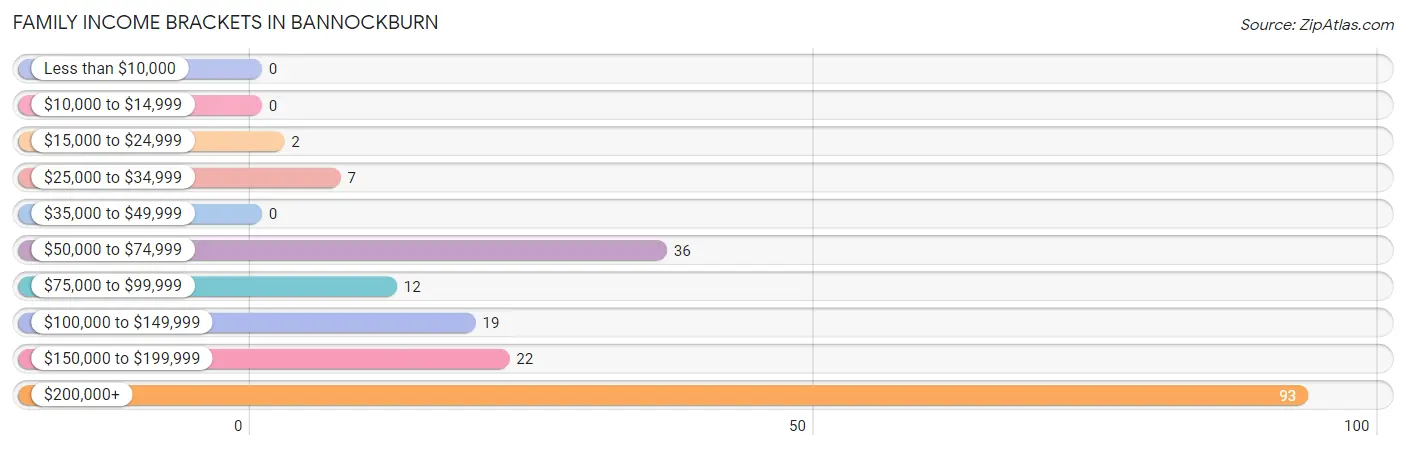
| Income Bracket | # Families | % Families |
| Less than $10,000 | 0 | 0.0% |
| $10,000 to $14,999 | 0 | 0.0% |
| $15,000 to $24,999 | 2 | 1.0% |
| $25,000 to $34,999 | 7 | 3.7% |
| $35,000 to $49,999 | 0 | 0.0% |
| $50,000 to $74,999 | 36 | 18.8% |
| $75,000 to $99,999 | 12 | 6.3% |
| $100,000 to $149,999 | 19 | 9.9% |
| $150,000 to $199,999 | 22 | 11.5% |
| $200,000+ | 93 | 48.7% |
Family Income by Famaliy Size in Bannockburn
4-person families (31 | 16.2%) account for the highest median family income in Bannockburn with $250,001 per family, while 2-person families (105 | 55.0%) have the highest median income of $84,375 per family member.
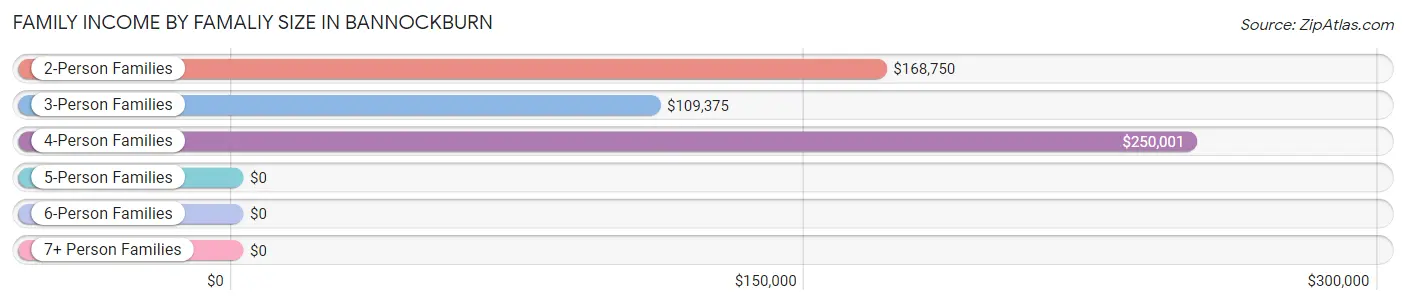
| Income Bracket | # Families | Median Income |
| 2-Person Families | 105 (55.0%) | $168,750 |
| 3-Person Families | 33 (17.3%) | $109,375 |
| 4-Person Families | 31 (16.2%) | $250,001 |
| 5-Person Families | 12 (6.3%) | $0 |
| 6-Person Families | 8 (4.2%) | $0 |
| 7+ Person Families | 2 (1.1%) | $0 |
| Total | 191 (100.0%) | $195,417 |
Family Income by Number of Earners in Bannockburn

| Number of Earners | # Families | Median Income |
| No Earners | 47 (24.6%) | $0 |
| 1 Earner | 56 (29.3%) | $168,750 |
| 2 Earners | 70 (36.6%) | $250,001 |
| 3+ Earners | 18 (9.4%) | $250,001 |
| Total | 191 (100.0%) | $195,417 |
Household Income in Bannockburn
Household Income Brackets in Bannockburn
With 98 households falling in the category, the $200,000+ income range is the most frequent in Bannockburn, accounting for 41.0% of all households.
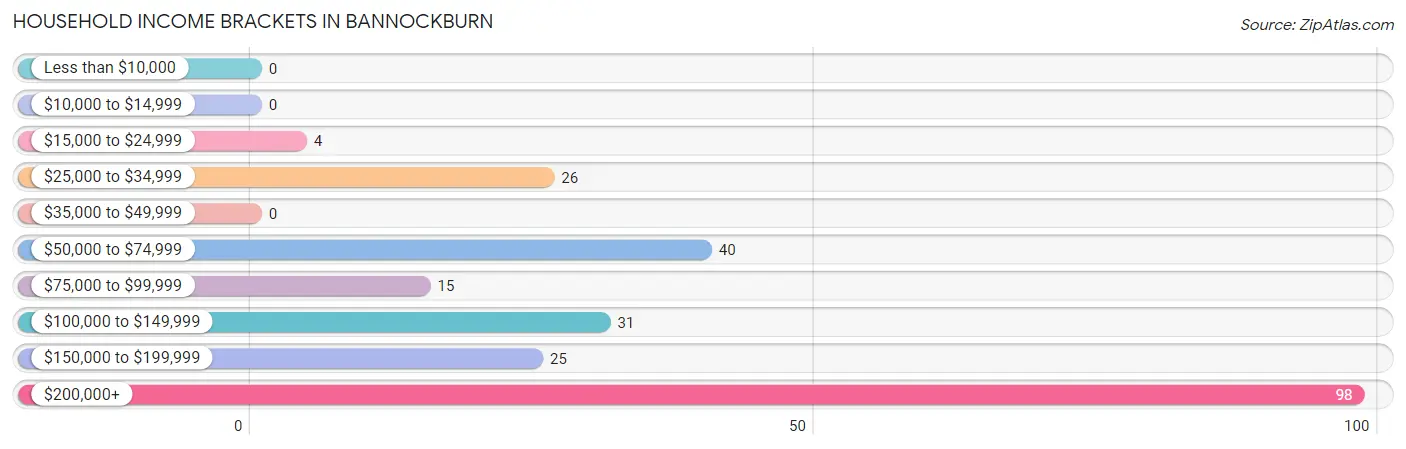
| Income Bracket | # Households | % Households |
| Less than $10,000 | 0 | 0.0% |
| $10,000 to $14,999 | 0 | 0.0% |
| $15,000 to $24,999 | 4 | 1.7% |
| $25,000 to $34,999 | 26 | 10.9% |
| $35,000 to $49,999 | 0 | 0.0% |
| $50,000 to $74,999 | 40 | 16.7% |
| $75,000 to $99,999 | 15 | 6.3% |
| $100,000 to $149,999 | 31 | 13.0% |
| $150,000 to $199,999 | 25 | 10.5% |
| $200,000+ | 98 | 41.0% |
Household Income by Householder Age in Bannockburn
The median household income in Bannockburn is $161,875, with the highest median household income of $250,001 found in the 45 to 64 years age bracket for the primary householder. A total of 61 households (25.5%) fall into this category.
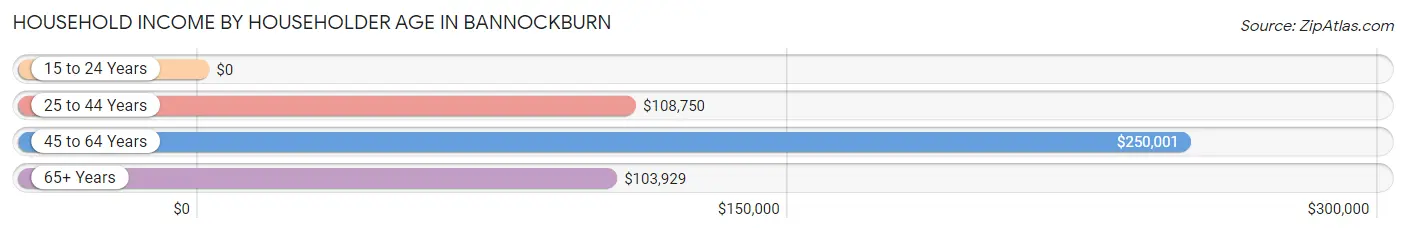
| Income Bracket | # Households | Median Income |
| 15 to 24 Years | 0 (0.0%) | $0 |
| 25 to 44 Years | 50 (20.9%) | $108,750 |
| 45 to 64 Years | 61 (25.5%) | $250,001 |
| 65+ Years | 128 (53.6%) | $103,929 |
| Total | 239 (100.0%) | $161,875 |
Poverty in Bannockburn
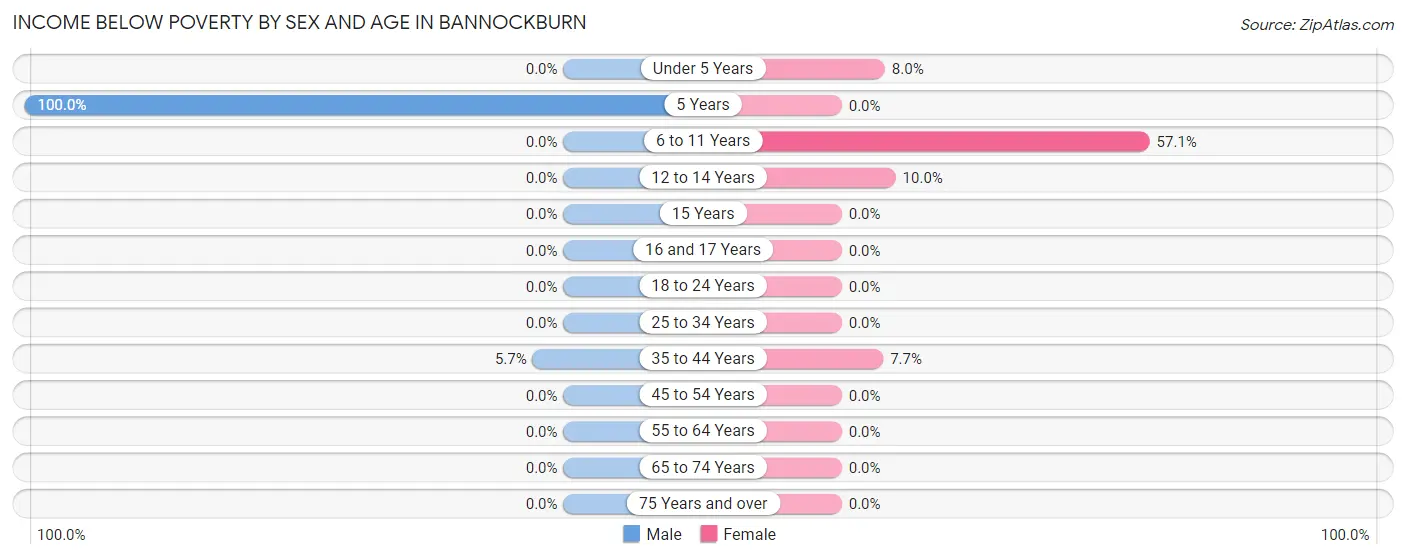
Income Below Poverty by Sex and Age in Bannockburn
With 1.3% poverty level for males and 3.1% for females among the residents of Bannockburn, 5 year old males and 6 to 11 year old females are the most vulnerable to poverty, with 2 males (100.0%) and 4 females (57.1%) in their respective age groups living below the poverty level.
| Age Bracket | Male | Female |
| Under 5 Years | 0 (0.0%) | 2 (8.0%) |
| 5 Years | 2 (100.0%) | 0 (0.0%) |
| 6 to 11 Years | 0 (0.0%) | 4 (57.1%) |
| 12 to 14 Years | 0 (0.0%) | 2 (10.0%) |
| 15 Years | 0 (0.0%) | 0 (0.0%) |
| 16 and 17 Years | 0 (0.0%) | 0 (0.0%) |
| 18 to 24 Years | 0 (0.0%) | 0 (0.0%) |
| 25 to 34 Years | 0 (0.0%) | 0 (0.0%) |
| 35 to 44 Years | 2 (5.7%) | 2 (7.7%) |
| 45 to 54 Years | 0 (0.0%) | 0 (0.0%) |
| 55 to 64 Years | 0 (0.0%) | 0 (0.0%) |
| 65 to 74 Years | 0 (0.0%) | 0 (0.0%) |
| 75 Years and over | 0 (0.0%) | 0 (0.0%) |
| Total | 4 (1.3%) | 10 (3.1%) |
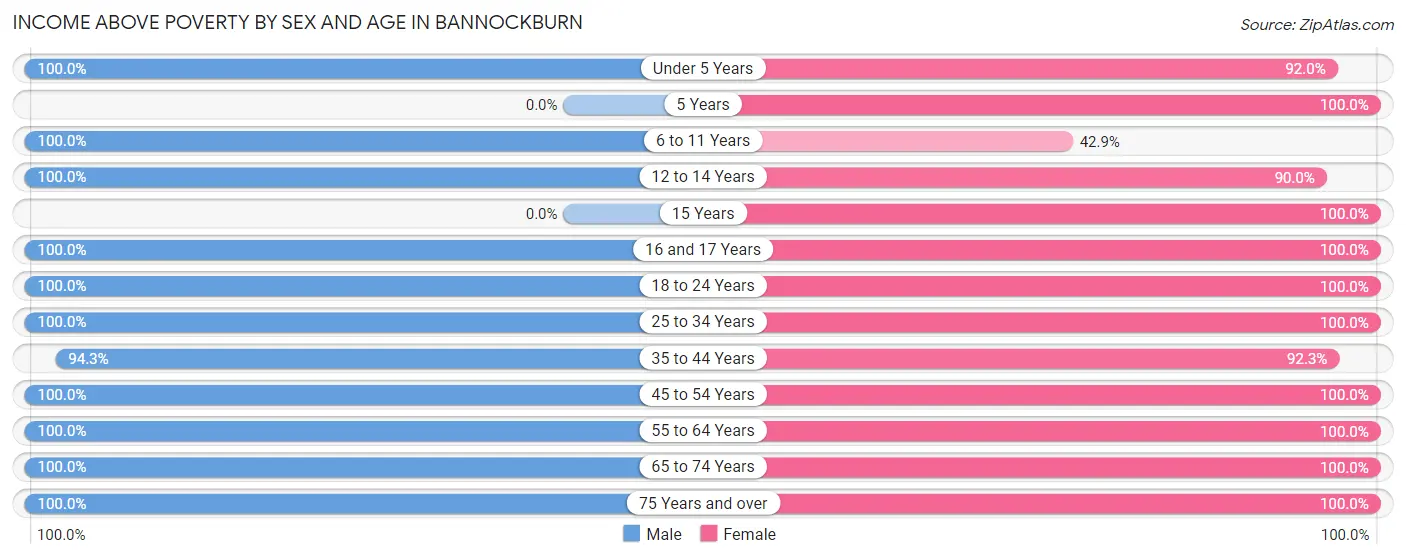
Income Above Poverty by Sex and Age in Bannockburn
According to the poverty statistics in Bannockburn, males aged under 5 years and females aged 5 years are the age groups that are most secure financially, with 100.0% of males and 100.0% of females in these age groups living above the poverty line.
| Age Bracket | Male | Female |
| Under 5 Years | 23 (100.0%) | 23 (92.0%) |
| 5 Years | 0 (0.0%) | 5 (100.0%) |
| 6 to 11 Years | 21 (100.0%) | 3 (42.9%) |
| 12 to 14 Years | 6 (100.0%) | 18 (90.0%) |
| 15 Years | 0 (0.0%) | 17 (100.0%) |
| 16 and 17 Years | 8 (100.0%) | 17 (100.0%) |
| 18 to 24 Years | 10 (100.0%) | 5 (100.0%) |
| 25 to 34 Years | 22 (100.0%) | 23 (100.0%) |
| 35 to 44 Years | 33 (94.3%) | 24 (92.3%) |
| 45 to 54 Years | 39 (100.0%) | 26 (100.0%) |
| 55 to 64 Years | 26 (100.0%) | 37 (100.0%) |
| 65 to 74 Years | 39 (100.0%) | 54 (100.0%) |
| 75 Years and over | 67 (100.0%) | 61 (100.0%) |
| Total | 294 (98.7%) | 313 (96.9%) |
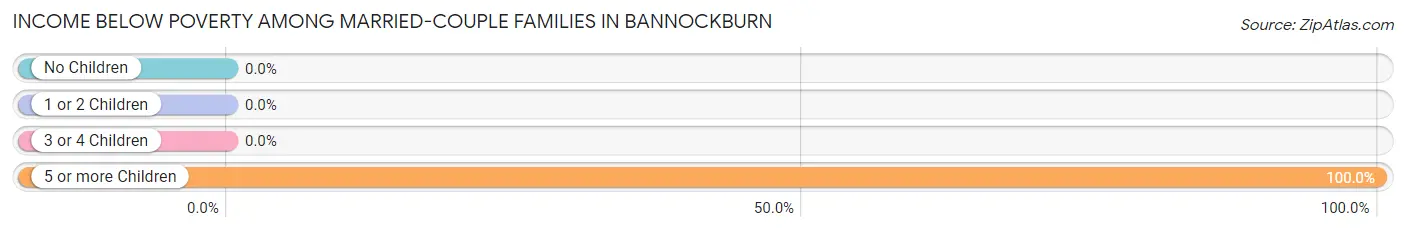
Income Below Poverty Among Married-Couple Families in Bannockburn
The poverty statistics for married-couple families in Bannockburn show that 1.1% or 2 of the total 189 families live below the poverty line. Families with 5 or more children have the highest poverty rate of 100.0%, comprising of 2 families. On the other hand, families with no children have the lowest poverty rate of 0.0%, which includes 0 families.
| Children | Above Poverty | Below Poverty |
| No Children | 119 (100.0%) | 0 (0.0%) |
| 1 or 2 Children | 53 (100.0%) | 0 (0.0%) |
| 3 or 4 Children | 15 (100.0%) | 0 (0.0%) |
| 5 or more Children | 0 (0.0%) | 2 (100.0%) |
| Total | 187 (98.9%) | 2 (1.1%) |
Income Below Poverty Among Single-Parent Households in Bannockburn
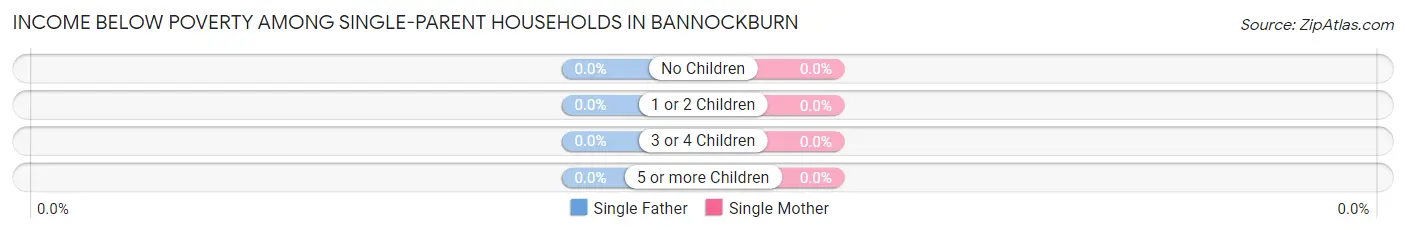
| Children | Single Father | Single Mother |
| No Children | 0 (0.0%) | 0 (0.0%) |
| 1 or 2 Children | 0 (0.0%) | 0 (0.0%) |
| 3 or 4 Children | 0 (0.0%) | 0 (0.0%) |
| 5 or more Children | 0 (0.0%) | 0 (0.0%) |
| Total | 0 (0.0%) | 0 (0.0%) |
Income Below Poverty Among Married-Couple vs Single-Parent Households in Bannockburn
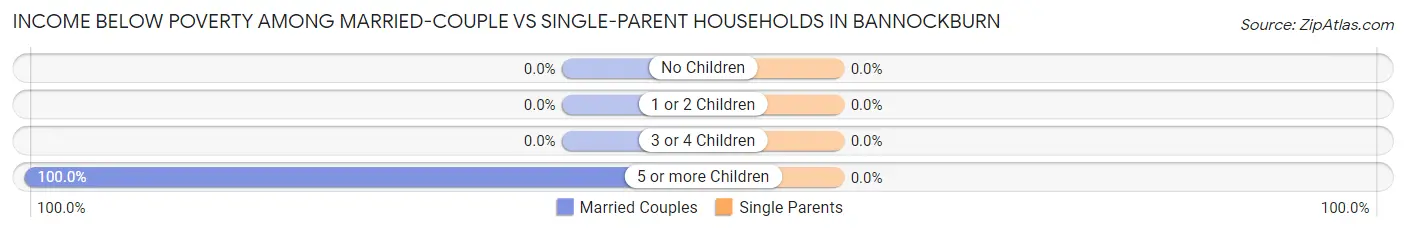
| Children | Married-Couple Families | Single-Parent Households |
| No Children | 0 (0.0%) | 0 (0.0%) |
| 1 or 2 Children | 0 (0.0%) | 0 (0.0%) |
| 3 or 4 Children | 0 (0.0%) | 0 (0.0%) |
| 5 or more Children | 2 (100.0%) | 0 (0.0%) |
| Total | 2 (1.1%) | 0 (0.0%) |
Race in Bannockburn
The most populous races in Bannockburn are White / Caucasian (794 | 74.6%), Black / African American (137 | 12.9%), and Hispanic or Latino (98 | 9.2%).
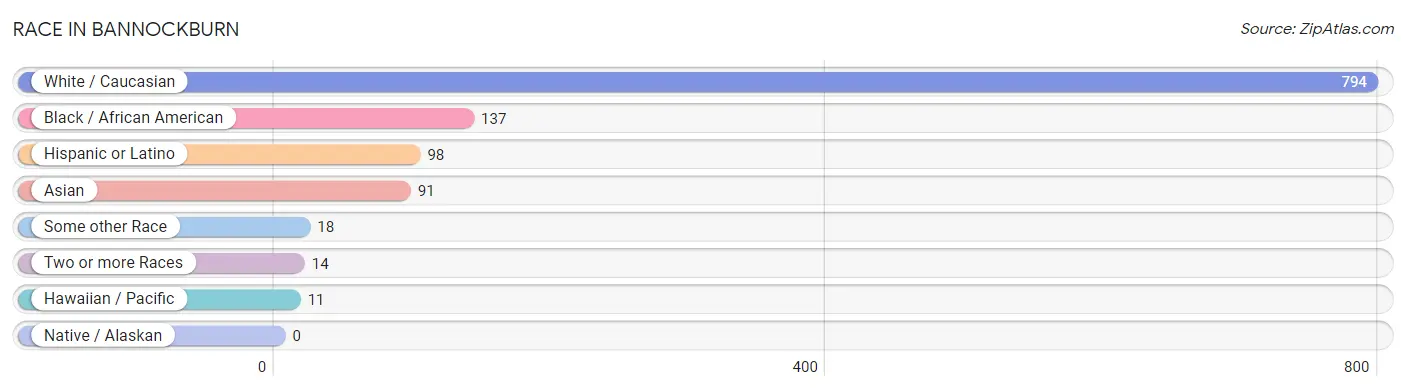
| Race | # Population | % Population |
| Asian | 91 | 8.5% |
| Black / African American | 137 | 12.9% |
| Hawaiian / Pacific | 11 | 1.0% |
| Hispanic or Latino | 98 | 9.2% |
| Native / Alaskan | 0 | 0.0% |
| White / Caucasian | 794 | 74.6% |
| Two or more Races | 14 | 1.3% |
| Some other Race | 18 | 1.7% |
| Total | 1,065 | 100.0% |
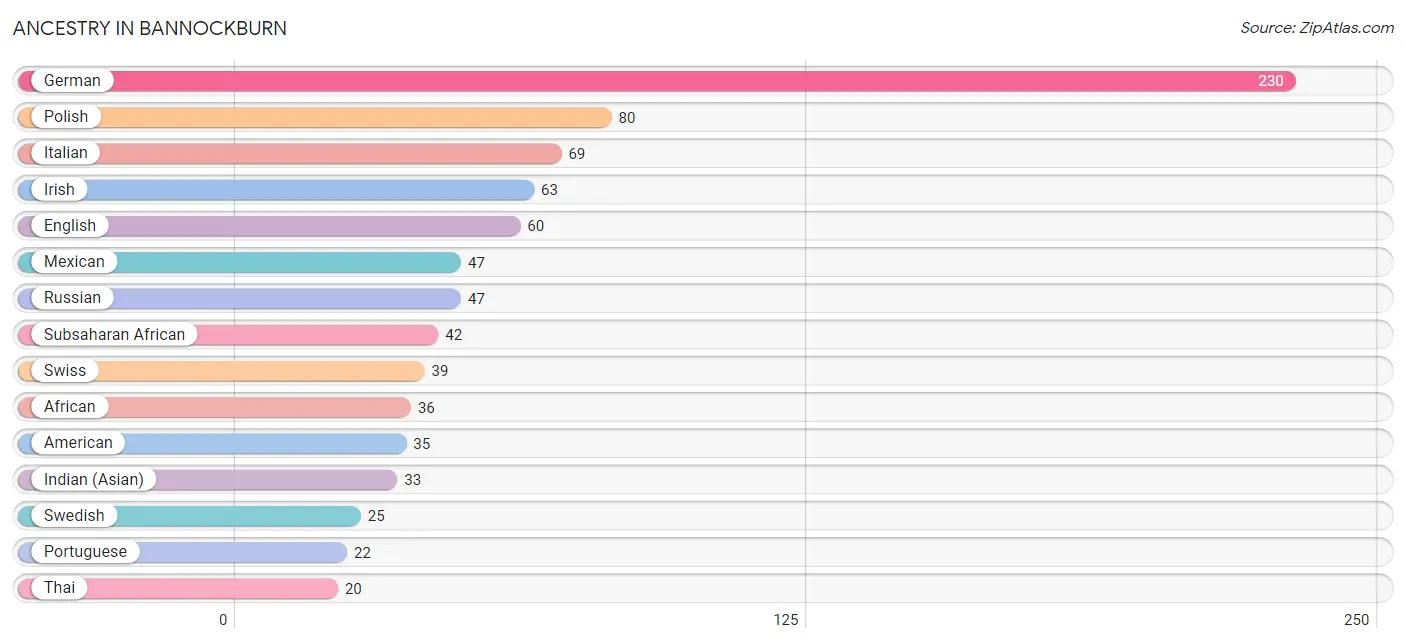
Ancestry in Bannockburn
The most populous ancestries reported in Bannockburn are German (230 | 21.6%), Polish (80 | 7.5%), Italian (69 | 6.5%), Irish (63 | 5.9%), and English (60 | 5.6%), together accounting for 47.1% of all Bannockburn residents.
| Ancestry | # Population | % Population |
| African | 36 | 3.4% |
| American | 35 | 3.3% |
| Arab | 5 | 0.5% |
| Austrian | 5 | 0.5% |
| Bangladeshi | 2 | 0.2% |
| Belgian | 9 | 0.9% |
| Bhutanese | 6 | 0.6% |
| British | 16 | 1.5% |
| Burmese | 18 | 1.7% |
| Canadian | 2 | 0.2% |
| Central American | 12 | 1.1% |
| Colombian | 4 | 0.4% |
| Costa Rican | 12 | 1.1% |
| Cuban | 19 | 1.8% |
| Czech | 5 | 0.5% |
| Dutch | 7 | 0.7% |
| Eastern European | 2 | 0.2% |
| Egyptian | 5 | 0.5% |
| English | 60 | 5.6% |
| European | 16 | 1.5% |
| Finnish | 3 | 0.3% |
| French | 14 | 1.3% |
| French Canadian | 3 | 0.3% |
| German | 230 | 21.6% |
| Greek | 16 | 1.5% |
| Hungarian | 18 | 1.7% |
| Indian (Asian) | 33 | 3.1% |
| Irish | 63 | 5.9% |
| Italian | 69 | 6.5% |
| Jamaican | 11 | 1.0% |
| Japanese | 4 | 0.4% |
| Lithuanian | 3 | 0.3% |
| Macedonian | 3 | 0.3% |
| Mexican | 47 | 4.4% |
| Nigerian | 17 | 1.6% |
| Norwegian | 11 | 1.0% |
| Okinawan | 6 | 0.6% |
| Polish | 80 | 7.5% |
| Portuguese | 22 | 2.1% |
| Romanian | 2 | 0.2% |
| Russian | 47 | 4.4% |
| Scandinavian | 5 | 0.5% |
| Scotch-Irish | 14 | 1.3% |
| Scottish | 14 | 1.3% |
| Serbian | 10 | 0.9% |
| Slovak | 2 | 0.2% |
| South American | 4 | 0.4% |
| Spaniard | 11 | 1.0% |
| Sri Lankan | 6 | 0.6% |
| Subsaharan African | 42 | 3.9% |
| Swedish | 25 | 2.4% |
| Swiss | 39 | 3.7% |
| Thai | 20 | 1.9% |
| Ugandan | 6 | 0.6% |
| Ukrainian | 4 | 0.4% | View All 55 Rows |
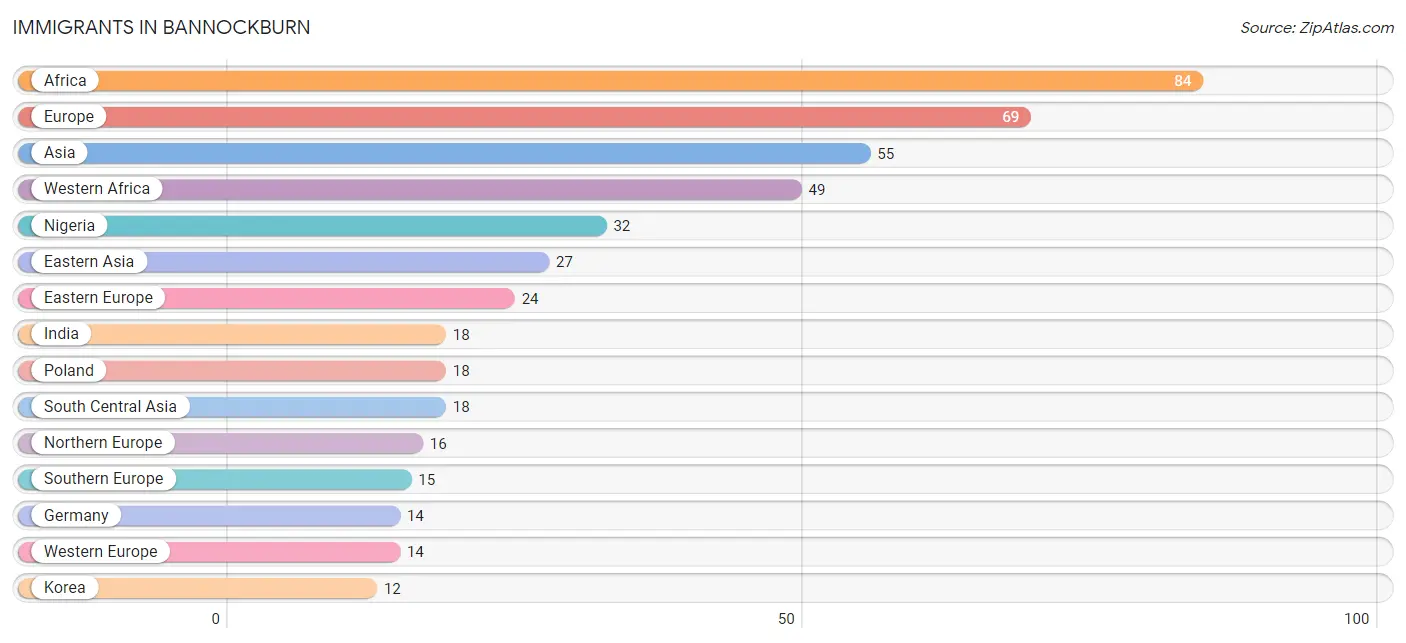
Immigrants in Bannockburn
The most numerous immigrant groups reported in Bannockburn came from Africa (84 | 7.9%), Europe (69 | 6.5%), Asia (55 | 5.2%), Western Africa (49 | 4.6%), and Nigeria (32 | 3.0%), together accounting for 27.1% of all Bannockburn residents.
| Immigration Origin | # Population | % Population |
| Africa | 84 | 7.9% |
| Asia | 55 | 5.2% |
| Canada | 2 | 0.2% |
| China | 9 | 0.9% |
| Colombia | 4 | 0.4% |
| Eastern Africa | 6 | 0.6% |
| Eastern Asia | 27 | 2.5% |
| Eastern Europe | 24 | 2.2% |
| Europe | 69 | 6.5% |
| Fiji | 11 | 1.0% |
| Germany | 14 | 1.3% |
| Greece | 6 | 0.6% |
| India | 18 | 1.7% |
| Indonesia | 4 | 0.4% |
| Japan | 6 | 0.6% |
| Korea | 12 | 1.1% |
| Latin America | 4 | 0.4% |
| Nigeria | 32 | 3.0% |
| Northern Africa | 10 | 0.9% |
| Northern Europe | 16 | 1.5% |
| Oceania | 11 | 1.0% |
| Poland | 18 | 1.7% |
| Serbia | 5 | 0.5% |
| Singapore | 6 | 0.6% |
| South America | 4 | 0.4% |
| South Central Asia | 18 | 1.7% |
| South Eastern Asia | 10 | 0.9% |
| Southern Europe | 15 | 1.4% |
| Spain | 9 | 0.9% |
| Uganda | 6 | 0.6% |
| Ukraine | 1 | 0.1% |
| Western Africa | 49 | 4.6% |
| Western Europe | 14 | 1.3% | View All 33 Rows |
Sex and Age in Bannockburn
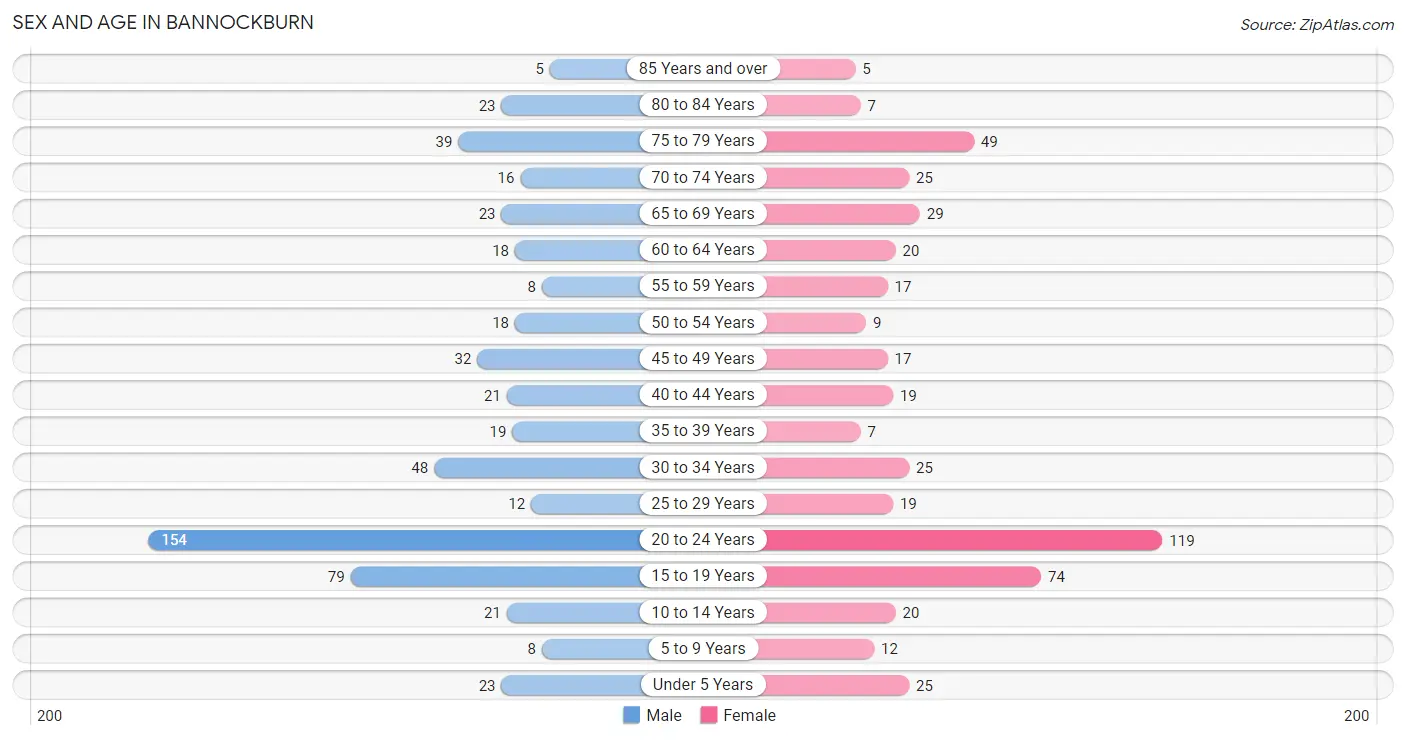
Sex and Age in Bannockburn
The most populous age groups in Bannockburn are 20 to 24 Years (154 | 27.2%) for men and 20 to 24 Years (119 | 23.9%) for women.
| Age Bracket | Male | Female |
| Under 5 Years | 23 (4.1%) | 25 (5.0%) |
| 5 to 9 Years | 8 (1.4%) | 12 (2.4%) |
| 10 to 14 Years | 21 (3.7%) | 20 (4.0%) |
| 15 to 19 Years | 79 (13.9%) | 74 (14.9%) |
| 20 to 24 Years | 154 (27.2%) | 119 (23.9%) |
| 25 to 29 Years | 12 (2.1%) | 19 (3.8%) |
| 30 to 34 Years | 48 (8.5%) | 25 (5.0%) |
| 35 to 39 Years | 19 (3.4%) | 7 (1.4%) |
| 40 to 44 Years | 21 (3.7%) | 19 (3.8%) |
| 45 to 49 Years | 32 (5.6%) | 17 (3.4%) |
| 50 to 54 Years | 18 (3.2%) | 9 (1.8%) |
| 55 to 59 Years | 8 (1.4%) | 17 (3.4%) |
| 60 to 64 Years | 18 (3.2%) | 20 (4.0%) |
| 65 to 69 Years | 23 (4.1%) | 29 (5.8%) |
| 70 to 74 Years | 16 (2.8%) | 25 (5.0%) |
| 75 to 79 Years | 39 (6.9%) | 49 (9.8%) |
| 80 to 84 Years | 23 (4.1%) | 7 (1.4%) |
| 85 Years and over | 5 (0.9%) | 5 (1.0%) |
| Total | 567 (100.0%) | 498 (100.0%) |
Families and Households in Bannockburn
Median Family Size in Bannockburn
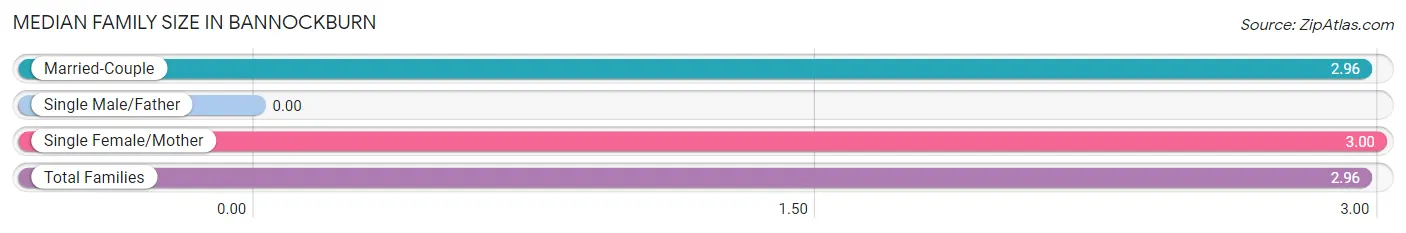
| Family Type | # Families | Family Size |
| Married-Couple | 189 (99.0%) | 2.96 |
| Single Male/Father | 0 (0.0%) | - |
| Single Female/Mother | 2 (1.1%) | 3.00 |
| Total Families | 191 (100.0%) | 2.96 |
Median Household Size in Bannockburn
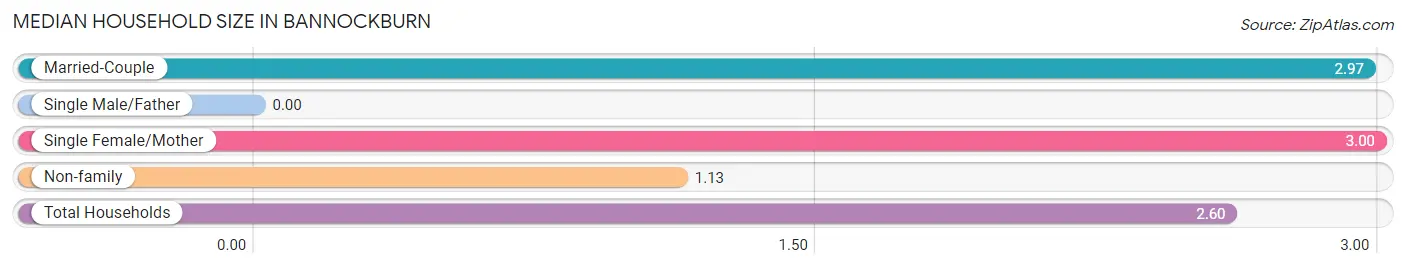
| Household Type | # Households | Household Size |
| Married-Couple | 189 (79.1%) | 2.97 |
| Single Male/Father | 0 (0.0%) | - |
| Single Female/Mother | 2 (0.8%) | 3.00 |
| Non-family | 48 (20.1%) | 1.13 |
| Total Households | 239 (100.0%) | 2.60 |
Household Size by Marriage Status in Bannockburn
Out of a total of 239 households in Bannockburn, 191 (79.9%) are family households, while 48 (20.1%) are nonfamily households. The most numerous type of family households are 2-person households, comprising 105, and the most common type of nonfamily households are 1-person households, comprising 41.
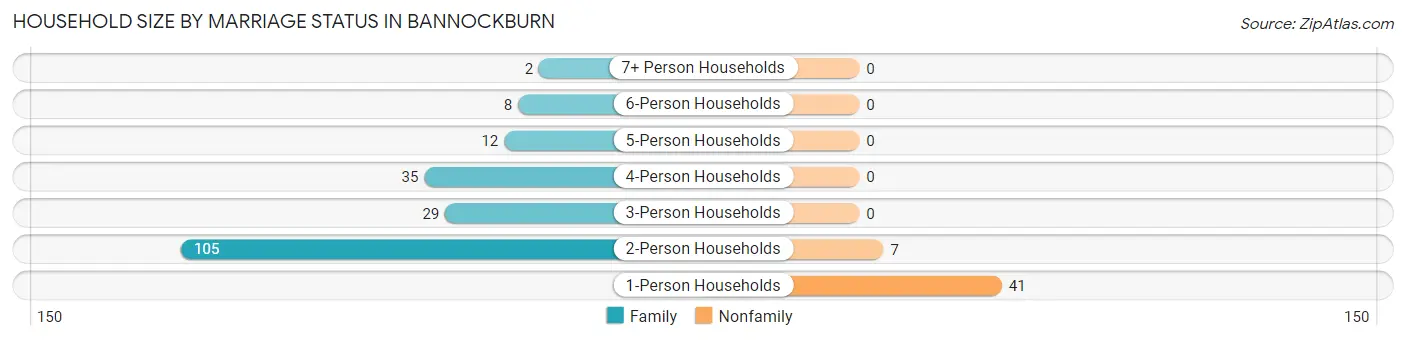
| Household Size | Family Households | Nonfamily Households |
| 1-Person Households | - | 41 (17.2%) |
| 2-Person Households | 105 (43.9%) | 7 (2.9%) |
| 3-Person Households | 29 (12.1%) | 0 (0.0%) |
| 4-Person Households | 35 (14.6%) | 0 (0.0%) |
| 5-Person Households | 12 (5.0%) | 0 (0.0%) |
| 6-Person Households | 8 (3.4%) | 0 (0.0%) |
| 7+ Person Households | 2 (0.8%) | 0 (0.0%) |
| Total | 191 (79.9%) | 48 (20.1%) |
Female Fertility in Bannockburn
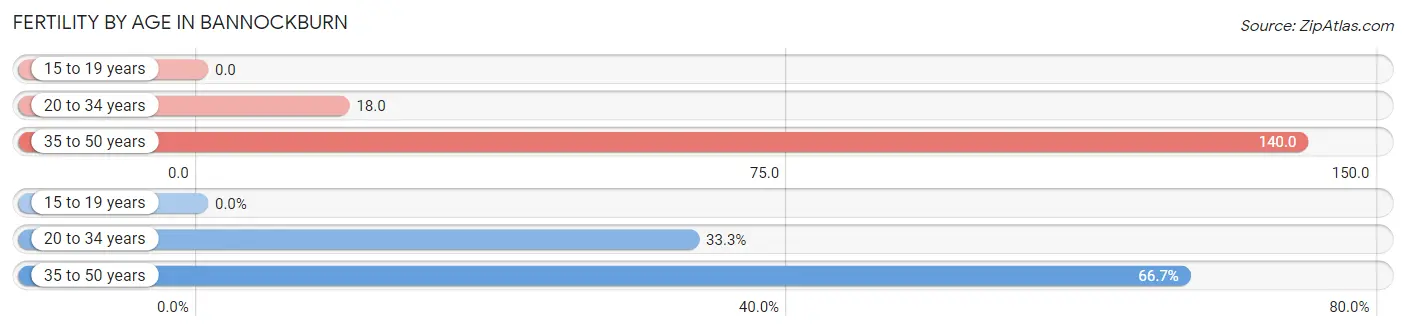
Fertility by Age in Bannockburn
Average fertility rate in Bannockburn is 32.0 births per 1,000 women. Women in the age bracket of 35 to 50 years have the highest fertility rate with 140.0 births per 1,000 women. Women in the age bracket of 35 to 50 years acount for 66.7% of all women with births.
| Age Bracket | Women with Births | Births / 1,000 Women |
| 15 to 19 years | 0 (0.0%) | 0.0 |
| 20 to 34 years | 3 (33.3%) | 18.0 |
| 35 to 50 years | 6 (66.7%) | 140.0 |
| Total | 9 (100.0%) | 32.0 |
Fertility by Age by Marriage Status in Bannockburn
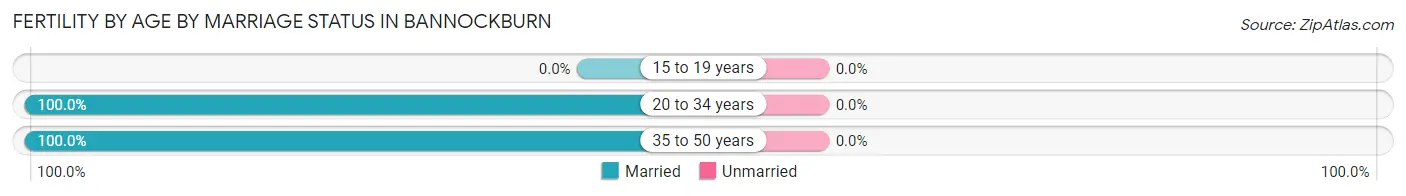
| Age Bracket | Married | Unmarried |
| 15 to 19 years | 0 (0.0%) | 0 (0.0%) |
| 20 to 34 years | 3 (100.0%) | 0 (0.0%) |
| 35 to 50 years | 6 (100.0%) | 0 (0.0%) |
| Total | 9 (100.0%) | 0 (0.0%) |
Fertility by Education in Bannockburn
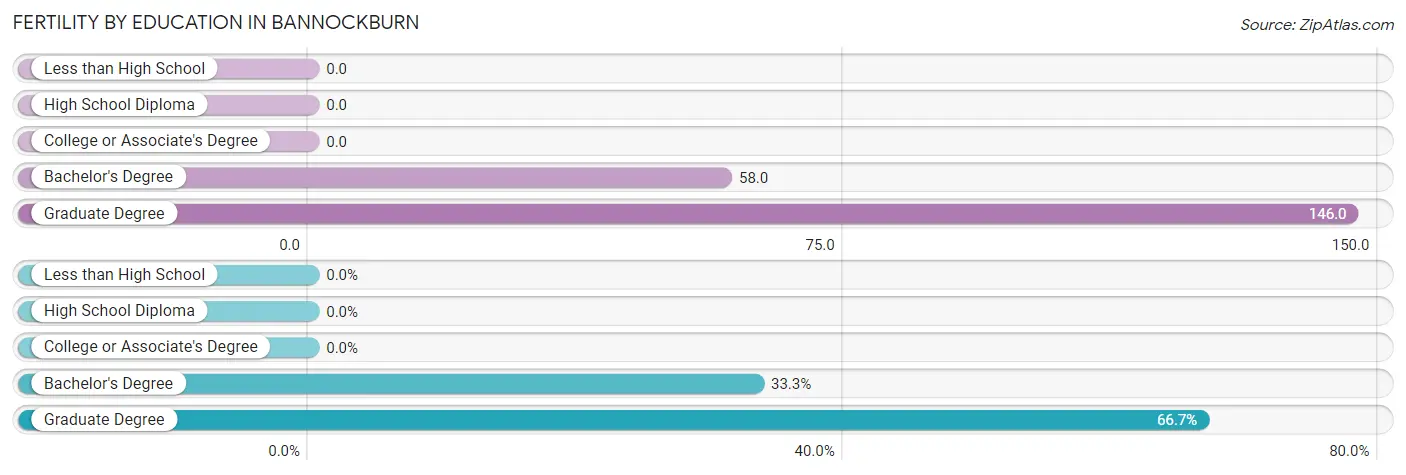
| Educational Attainment | Women with Births | Births / 1,000 Women |
| Less than High School | 0 (0.0%) | 0.0 |
| High School Diploma | 0 (0.0%) | 0.0 |
| College or Associate's Degree | 0 (0.0%) | 0.0 |
| Bachelor's Degree | 3 (33.3%) | 58.0 |
| Graduate Degree | 6 (66.7%) | 146.0 |
| Total | 9 (100.0%) | 32.0 |
Fertility by Education by Marriage Status in Bannockburn
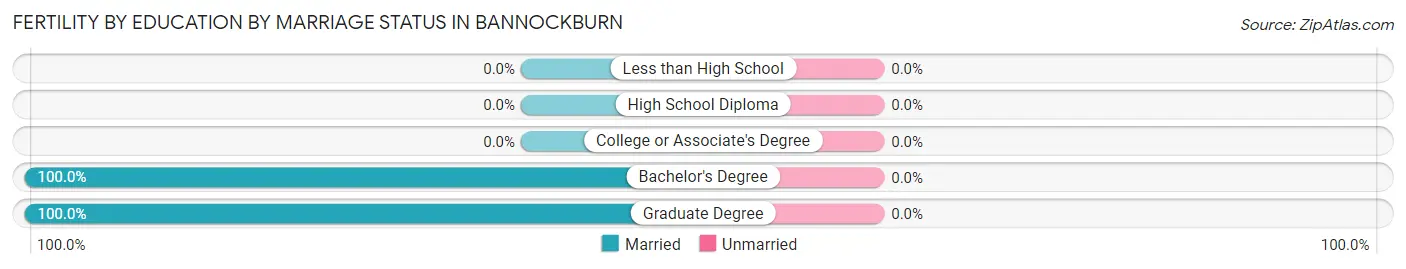
| Educational Attainment | Married | Unmarried |
| Less than High School | 0 (0.0%) | 0 (0.0%) |
| High School Diploma | 0 (0.0%) | 0 (0.0%) |
| College or Associate's Degree | 0 (0.0%) | 0 (0.0%) |
| Bachelor's Degree | 3 (100.0%) | 0 (0.0%) |
| Graduate Degree | 6 (100.0%) | 0 (0.0%) |
| Total | 9 (100.0%) | 0 (0.0%) |
Employment Characteristics in Bannockburn
Employment by Class of Employer in Bannockburn
Among the 534 employed individuals in Bannockburn, private company employees (289 | 54.1%), not-for-profit organizations (131 | 24.5%), and self-employed (incorporated) (44 | 8.2%) make up the most common classes of employment.
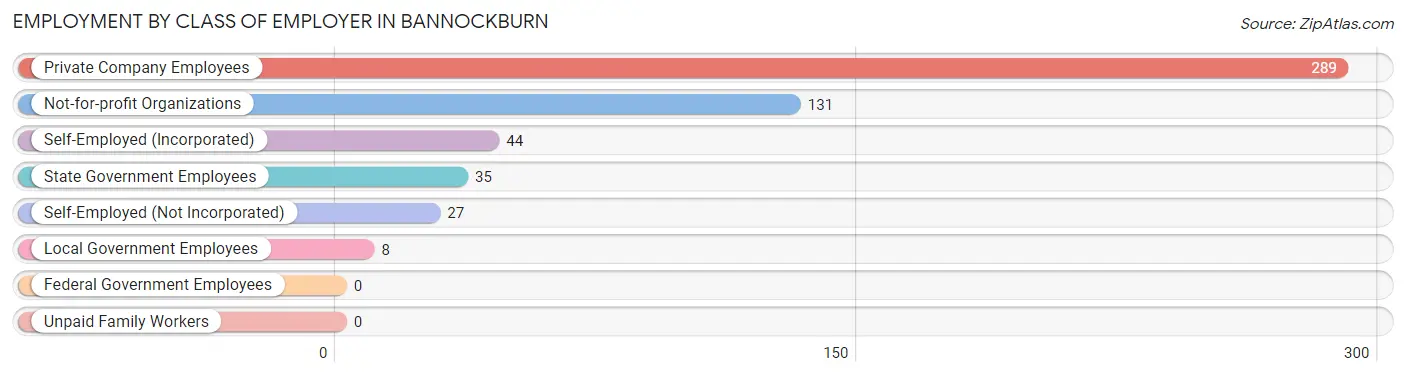
| Employer Class | # Employees | % Employees |
| Private Company Employees | 289 | 54.1% |
| Self-Employed (Incorporated) | 44 | 8.2% |
| Self-Employed (Not Incorporated) | 27 | 5.1% |
| Not-for-profit Organizations | 131 | 24.5% |
| Local Government Employees | 8 | 1.5% |
| State Government Employees | 35 | 6.6% |
| Federal Government Employees | 0 | 0.0% |
| Unpaid Family Workers | 0 | 0.0% |
| Total | 534 | 100.0% |
Employment Status by Age in Bannockburn
According to the labor force statistics for Bannockburn, out of the total population over 16 years of age (939), 58.8% or 552 individuals are in the labor force, with 2.2% or 12 of them unemployed. The age group with the highest labor force participation rate is 45 to 54 years, with 100.0% or 76 individuals in the labor force. Within the labor force, the 35 to 44 years age range has the highest percentage of unemployed individuals, with 8.1% or 5 of them being unemployed.
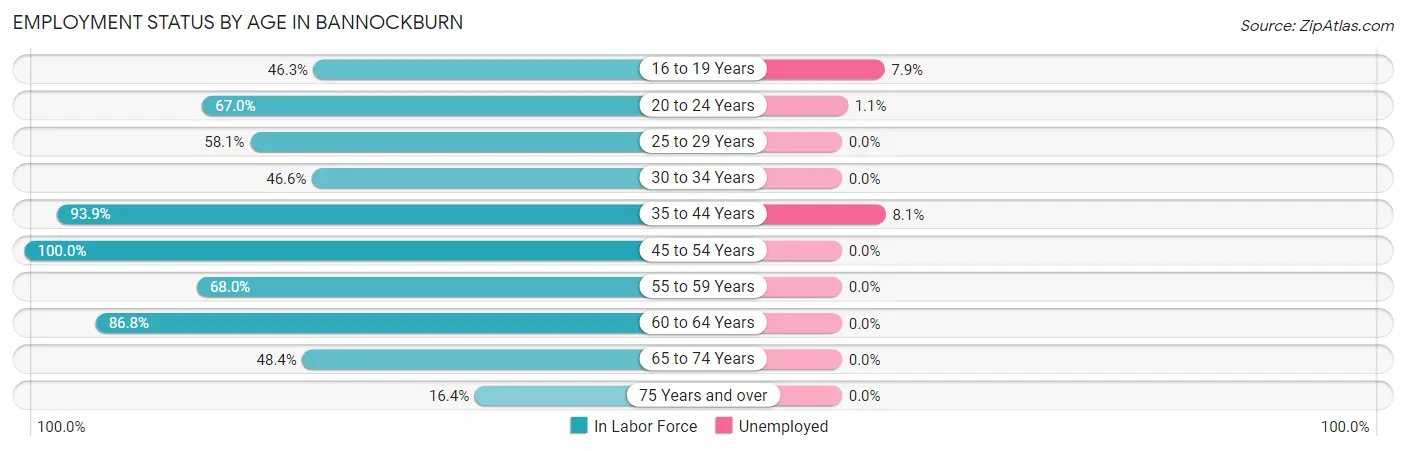
| Age Bracket | In Labor Force | Unemployed |
| 16 to 19 Years | 63 (46.3%) | 5 (7.9%) |
| 20 to 24 Years | 183 (67.0%) | 2 (1.1%) |
| 25 to 29 Years | 18 (58.1%) | 0 (0.0%) |
| 30 to 34 Years | 34 (46.6%) | 0 (0.0%) |
| 35 to 44 Years | 62 (93.9%) | 5 (8.1%) |
| 45 to 54 Years | 76 (100.0%) | 0 (0.0%) |
| 55 to 59 Years | 17 (68.0%) | 0 (0.0%) |
| 60 to 64 Years | 33 (86.8%) | 0 (0.0%) |
| 65 to 74 Years | 45 (48.4%) | 0 (0.0%) |
| 75 Years and over | 21 (16.4%) | 0 (0.0%) |
| Total | 552 (58.8%) | 12 (2.2%) |
Employment Status by Educational Attainment in Bannockburn
According to labor force statistics for Bannockburn, 77.7% of individuals (240) out of the total population between 25 and 64 years of age (309) are in the labor force, with 2.1% or 5 of them being unemployed. The group with the highest labor force participation rate are those with the educational attainment of less than high school, with 100.0% or 2 individuals in the labor force. Within the labor force, individuals with bachelor's degree or higher education have the highest percentage of unemployment, with 2.4% or 5 of them being unemployed.
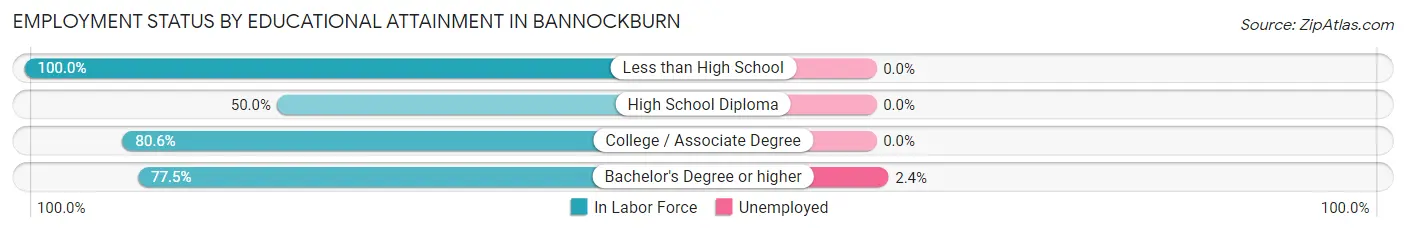
| Educational Attainment | In Labor Force | Unemployed |
| Less than High School | 2 (100.0%) | 0 (0.0%) |
| High School Diploma | 2 (50.0%) | 0 (0.0%) |
| College / Associate Degree | 29 (80.6%) | 0 (0.0%) |
| Bachelor's Degree or higher | 207 (77.5%) | 6 (2.4%) |
| Total | 240 (77.7%) | 6 (2.1%) |
Employment Occupations by Sex in Bannockburn
Management, Business, Science and Arts Occupations
The most common Management, Business, Science and Arts occupations in Bannockburn are Community & Social Service (118 | 21.8%), Management (79 | 14.6%), Education, Arts & Media (56 | 10.4%), Education Instruction & Library (49 | 9.1%), and Health Diagnosing & Treating (41 | 7.6%).
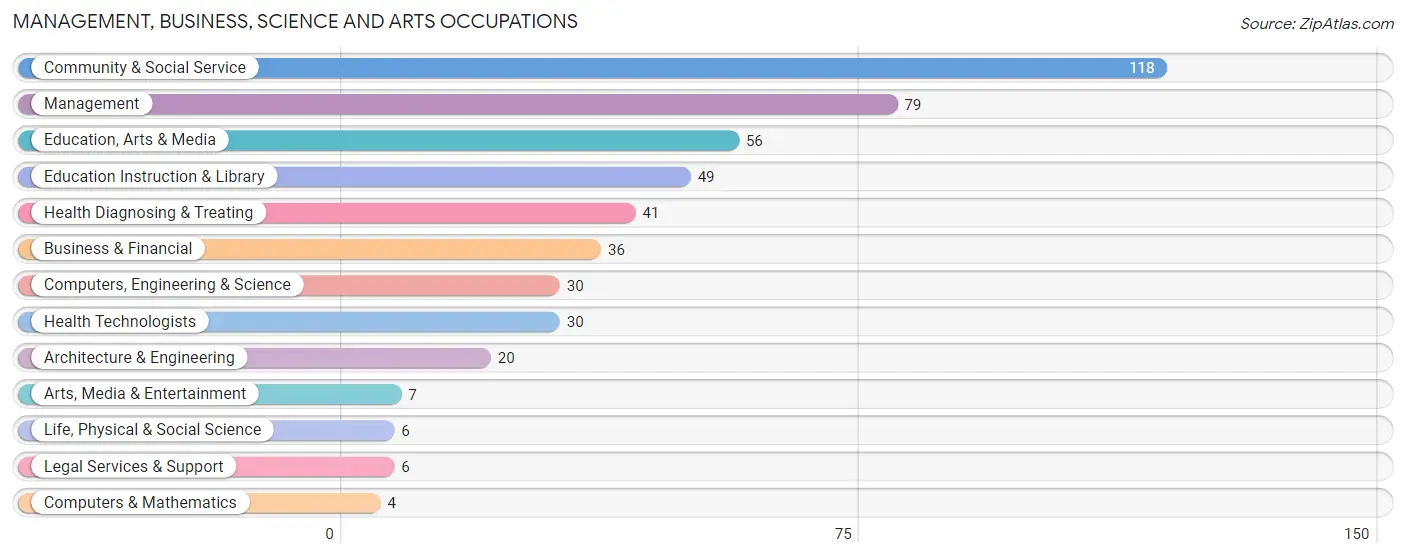
Management, Business, Science and Arts Occupations by Sex
Within the Management, Business, Science and Arts occupations in Bannockburn, the most male-oriented occupations are Architecture & Engineering (100.0%), Life, Physical & Social Science (100.0%), and Education, Arts & Media (100.0%), while the most female-oriented occupations are Computers & Mathematics (100.0%), Education Instruction & Library (89.8%), and Health Diagnosing & Treating (78.0%).
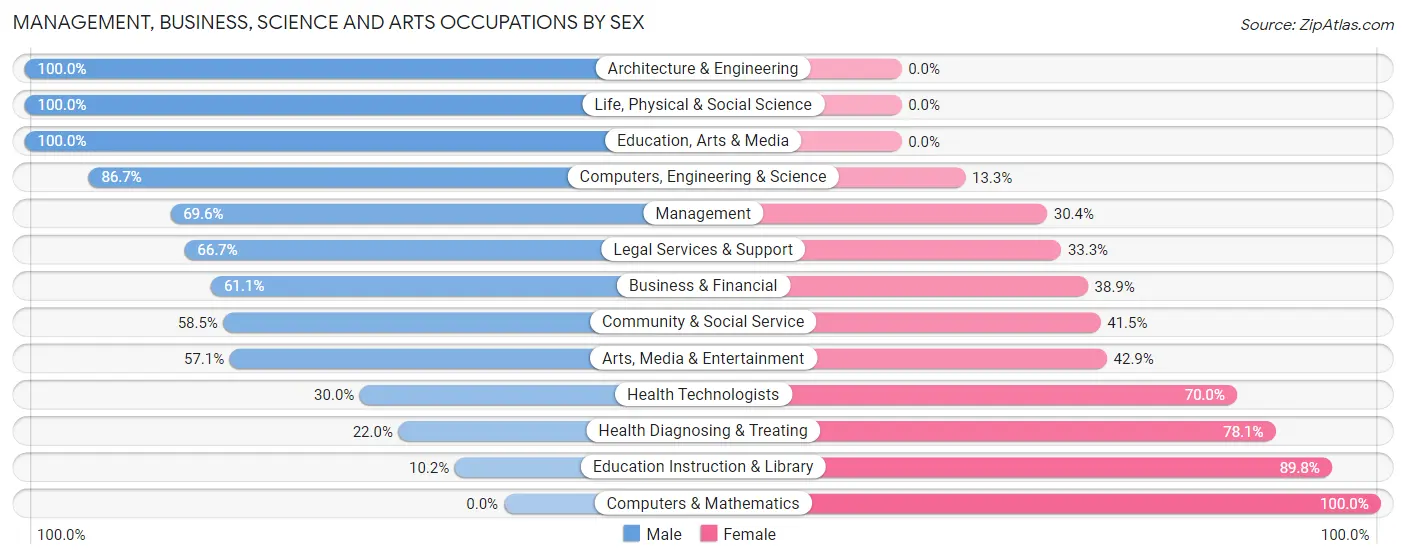
| Occupation | Male | Female |
| Management | 55 (69.6%) | 24 (30.4%) |
| Business & Financial | 22 (61.1%) | 14 (38.9%) |
| Computers, Engineering & Science | 26 (86.7%) | 4 (13.3%) |
| Computers & Mathematics | 0 (0.0%) | 4 (100.0%) |
| Architecture & Engineering | 20 (100.0%) | 0 (0.0%) |
| Life, Physical & Social Science | 6 (100.0%) | 0 (0.0%) |
| Community & Social Service | 69 (58.5%) | 49 (41.5%) |
| Education, Arts & Media | 56 (100.0%) | 0 (0.0%) |
| Legal Services & Support | 4 (66.7%) | 2 (33.3%) |
| Education Instruction & Library | 5 (10.2%) | 44 (89.8%) |
| Arts, Media & Entertainment | 4 (57.1%) | 3 (42.9%) |
| Health Diagnosing & Treating | 9 (22.0%) | 32 (78.0%) |
| Health Technologists | 9 (30.0%) | 21 (70.0%) |
| Total (Category) | 181 (59.5%) | 123 (40.5%) |
| Total (Overall) | 304 (56.3%) | 236 (43.7%) |
Services Occupations
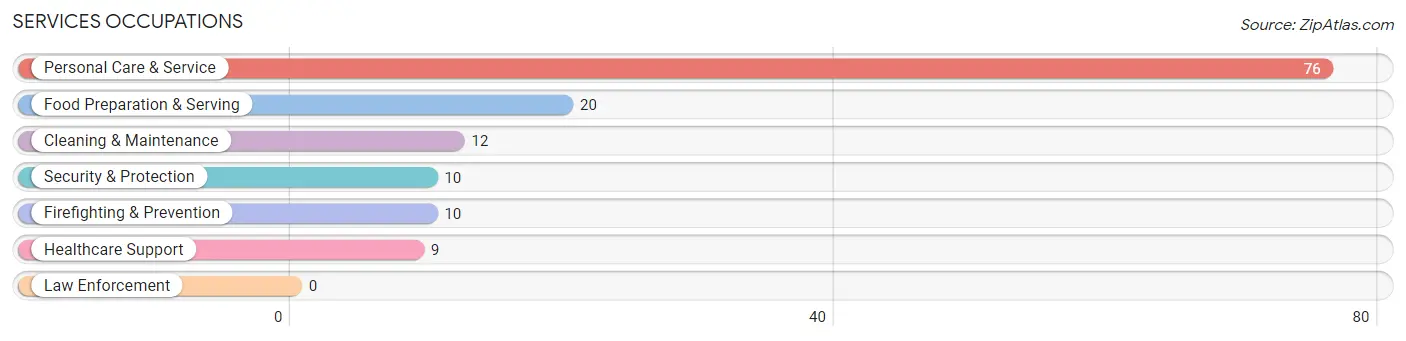
The most common Services occupations in Bannockburn are Personal Care & Service (76 | 14.1%), Food Preparation & Serving (20 | 3.7%), Cleaning & Maintenance (12 | 2.2%), Security & Protection (10 | 1.8%), and Firefighting & Prevention (10 | 1.8%).
Services Occupations by Sex
Within the Services occupations in Bannockburn, the most male-oriented occupations are Security & Protection (100.0%), Firefighting & Prevention (100.0%), and Cleaning & Maintenance (100.0%), while the most female-oriented occupations are Healthcare Support (100.0%), Personal Care & Service (69.7%), and Food Preparation & Serving (35.0%).
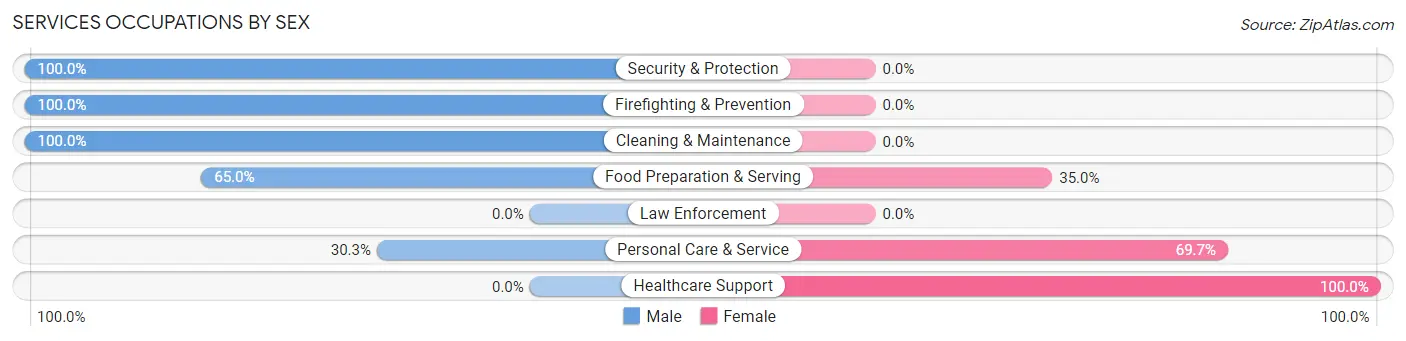
| Occupation | Male | Female |
| Healthcare Support | 0 (0.0%) | 9 (100.0%) |
| Security & Protection | 10 (100.0%) | 0 (0.0%) |
| Firefighting & Prevention | 10 (100.0%) | 0 (0.0%) |
| Law Enforcement | 0 (0.0%) | 0 (0.0%) |
| Food Preparation & Serving | 13 (65.0%) | 7 (35.0%) |
| Cleaning & Maintenance | 12 (100.0%) | 0 (0.0%) |
| Personal Care & Service | 23 (30.3%) | 53 (69.7%) |
| Total (Category) | 58 (45.7%) | 69 (54.3%) |
| Total (Overall) | 304 (56.3%) | 236 (43.7%) |
Sales and Office Occupations
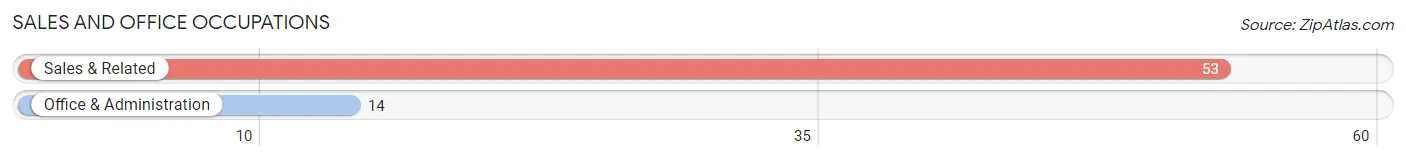
The most common Sales and Office occupations in Bannockburn are Sales & Related (53 | 9.8%), and Office & Administration (14 | 2.6%).
Sales and Office Occupations by Sex
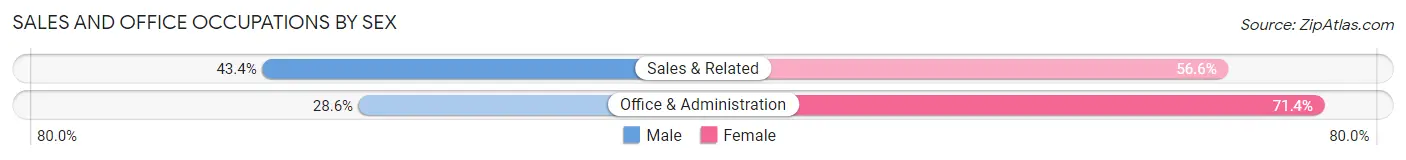
| Occupation | Male | Female |
| Sales & Related | 23 (43.4%) | 30 (56.6%) |
| Office & Administration | 4 (28.6%) | 10 (71.4%) |
| Total (Category) | 27 (40.3%) | 40 (59.7%) |
| Total (Overall) | 304 (56.3%) | 236 (43.7%) |
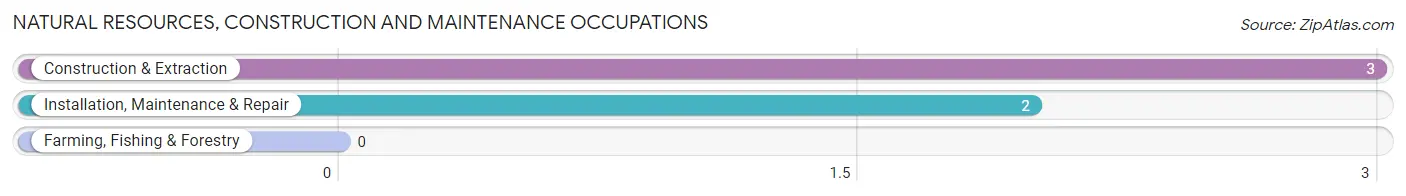
Natural Resources, Construction and Maintenance Occupations
The most common Natural Resources, Construction and Maintenance occupations in Bannockburn are Construction & Extraction (3 | 0.6%), and Installation, Maintenance & Repair (2 | 0.4%).
Natural Resources, Construction and Maintenance Occupations by Sex
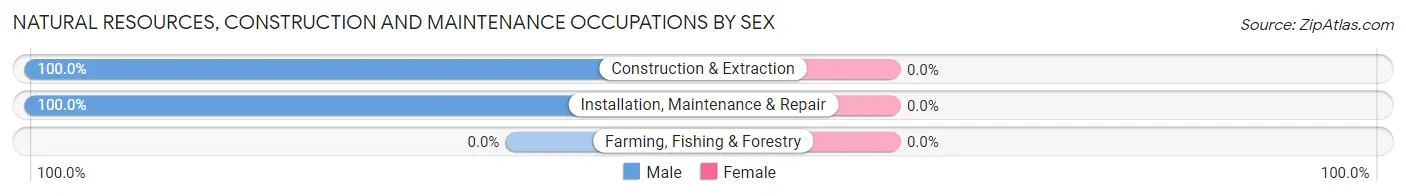
| Occupation | Male | Female |
| Farming, Fishing & Forestry | 0 (0.0%) | 0 (0.0%) |
| Construction & Extraction | 3 (100.0%) | 0 (0.0%) |
| Installation, Maintenance & Repair | 2 (100.0%) | 0 (0.0%) |
| Total (Category) | 5 (100.0%) | 0 (0.0%) |
| Total (Overall) | 304 (56.3%) | 236 (43.7%) |
Production, Transportation and Moving Occupations
The most common Production, Transportation and Moving occupations in Bannockburn are Material Moving (30 | 5.6%), and Production (7 | 1.3%).
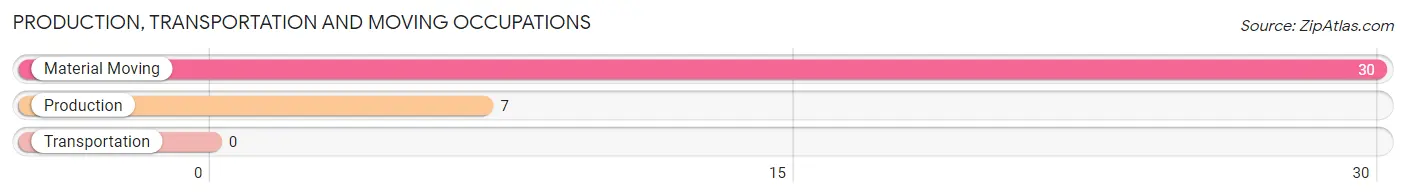
Production, Transportation and Moving Occupations by Sex
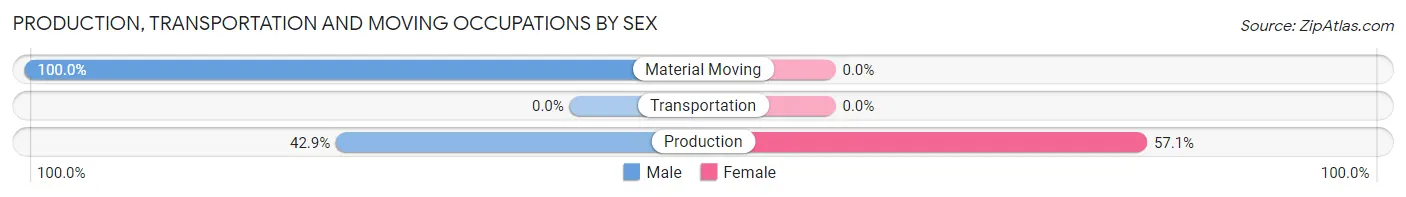
| Occupation | Male | Female |
| Production | 3 (42.9%) | 4 (57.1%) |
| Transportation | 0 (0.0%) | 0 (0.0%) |
| Material Moving | 30 (100.0%) | 0 (0.0%) |
| Total (Category) | 33 (89.2%) | 4 (10.8%) |
| Total (Overall) | 304 (56.3%) | 236 (43.7%) |
Employment Industries by Sex in Bannockburn
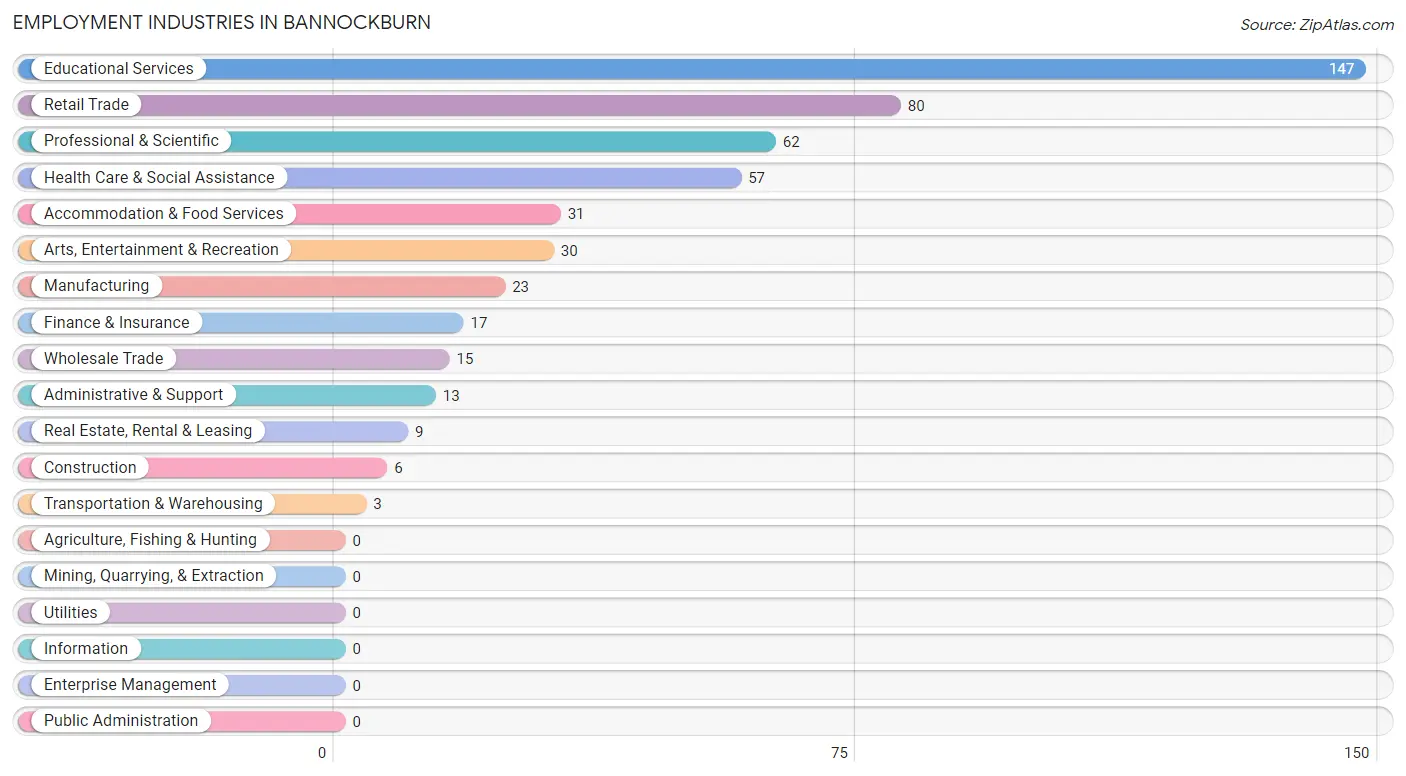
Employment Industries in Bannockburn
The major employment industries in Bannockburn include Educational Services (147 | 27.2%), Retail Trade (80 | 14.8%), Professional & Scientific (62 | 11.5%), Health Care & Social Assistance (57 | 10.6%), and Accommodation & Food Services (31 | 5.7%).
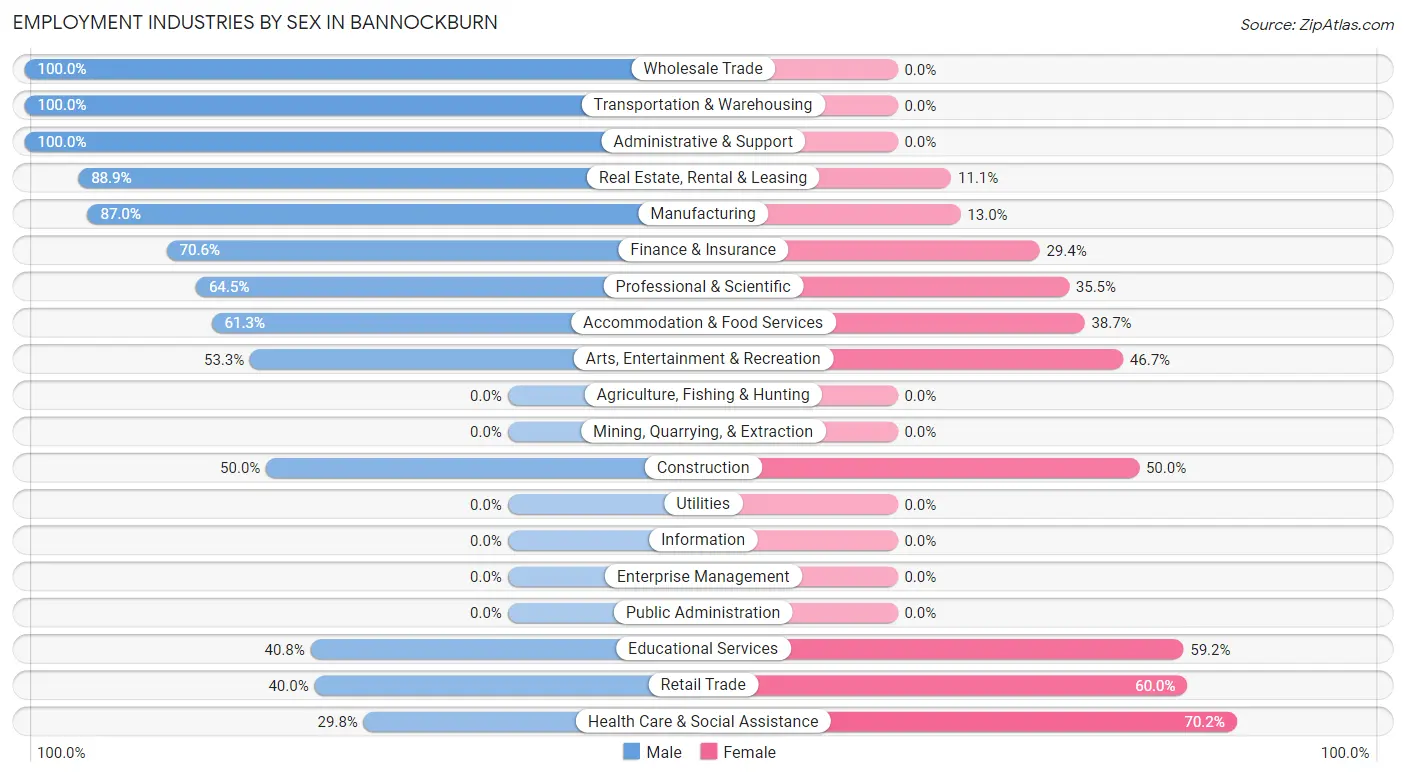
Employment Industries by Sex in Bannockburn
The Bannockburn industries that see more men than women are Wholesale Trade (100.0%), Transportation & Warehousing (100.0%), and Administrative & Support (100.0%), whereas the industries that tend to have a higher number of women are Health Care & Social Assistance (70.2%), Retail Trade (60.0%), and Educational Services (59.2%).
| Industry | Male | Female |
| Agriculture, Fishing & Hunting | 0 (0.0%) | 0 (0.0%) |
| Mining, Quarrying, & Extraction | 0 (0.0%) | 0 (0.0%) |
| Construction | 3 (50.0%) | 3 (50.0%) |
| Manufacturing | 20 (87.0%) | 3 (13.0%) |
| Wholesale Trade | 15 (100.0%) | 0 (0.0%) |
| Retail Trade | 32 (40.0%) | 48 (60.0%) |
| Transportation & Warehousing | 3 (100.0%) | 0 (0.0%) |
| Utilities | 0 (0.0%) | 0 (0.0%) |
| Information | 0 (0.0%) | 0 (0.0%) |
| Finance & Insurance | 12 (70.6%) | 5 (29.4%) |
| Real Estate, Rental & Leasing | 8 (88.9%) | 1 (11.1%) |
| Professional & Scientific | 40 (64.5%) | 22 (35.5%) |
| Enterprise Management | 0 (0.0%) | 0 (0.0%) |
| Administrative & Support | 13 (100.0%) | 0 (0.0%) |
| Educational Services | 60 (40.8%) | 87 (59.2%) |
| Health Care & Social Assistance | 17 (29.8%) | 40 (70.2%) |
| Arts, Entertainment & Recreation | 16 (53.3%) | 14 (46.7%) |
| Accommodation & Food Services | 19 (61.3%) | 12 (38.7%) |
| Public Administration | 0 (0.0%) | 0 (0.0%) |
| Total | 304 (56.3%) | 236 (43.7%) |
Education in Bannockburn
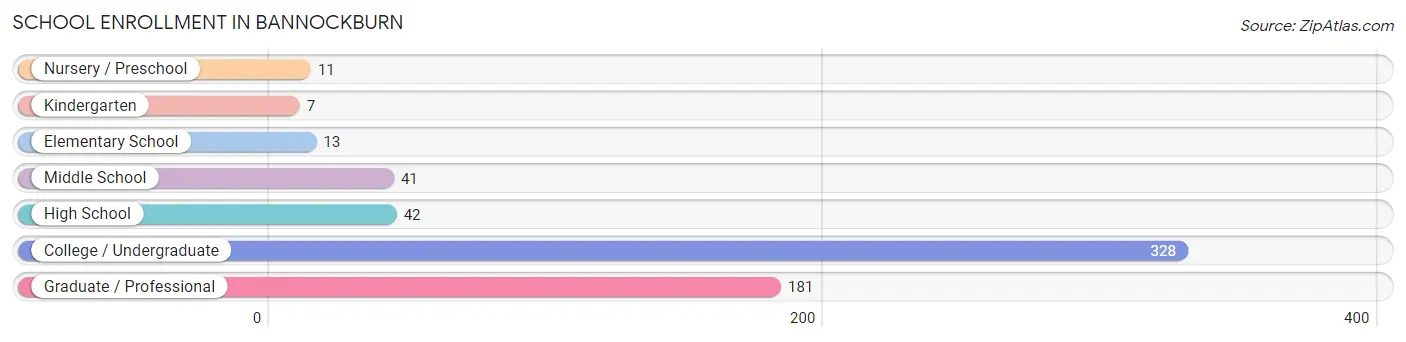
School Enrollment in Bannockburn
The most common levels of schooling among the 623 students in Bannockburn are college / undergraduate (328 | 52.6%), graduate / professional (181 | 29.0%), and high school (42 | 6.7%).
| School Level | # Students | % Students |
| Nursery / Preschool | 11 | 1.8% |
| Kindergarten | 7 | 1.1% |
| Elementary School | 13 | 2.1% |
| Middle School | 41 | 6.6% |
| High School | 42 | 6.7% |
| College / Undergraduate | 328 | 52.6% |
| Graduate / Professional | 181 | 29.0% |
| Total | 623 | 100.0% |
School Enrollment by Age by Funding Source in Bannockburn
Out of a total of 623 students who are enrolled in schools in Bannockburn, 430 (69.0%) attend a private institution, while the remaining 193 (31.0%) are enrolled in public schools. The age group of 20 to 24 year olds has the highest likelihood of being enrolled in private schools, with 246 (90.8% in the age bracket) enrolled. Conversely, the age group of 3 to 4 year olds has the lowest likelihood of being enrolled in a private school, with 11 (100.0% in the age bracket) attending a public institution.
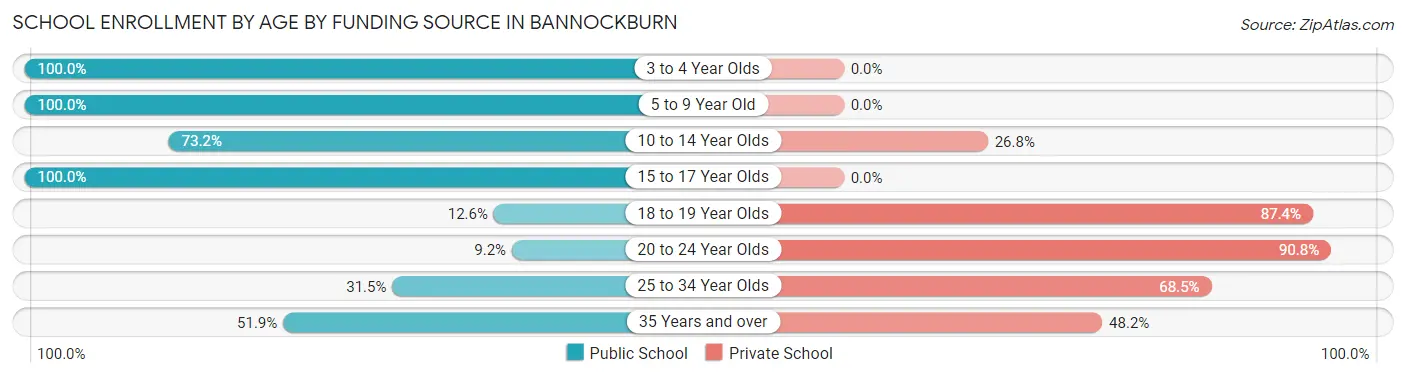
| Age Bracket | Public School | Private School |
| 3 to 4 Year Olds | 11 (100.0%) | 0 (0.0%) |
| 5 to 9 Year Old | 20 (100.0%) | 0 (0.0%) |
| 10 to 14 Year Olds | 30 (73.2%) | 11 (26.8%) |
| 15 to 17 Year Olds | 42 (100.0%) | 0 (0.0%) |
| 18 to 19 Year Olds | 14 (12.6%) | 97 (87.4%) |
| 20 to 24 Year Olds | 25 (9.2%) | 246 (90.8%) |
| 25 to 34 Year Olds | 23 (31.5%) | 50 (68.5%) |
| 35 Years and over | 28 (51.8%) | 26 (48.1%) |
| Total | 193 (31.0%) | 430 (69.0%) |
Educational Attainment by Field of Study in Bannockburn
Business (125 | 25.4%), science & technology (55 | 11.2%), bio, nature & agricultural (54 | 11.0%), education (49 | 9.9%), and liberal arts & history (47 | 9.5%) are the most common fields of study among 493 individuals in Bannockburn who have obtained a bachelor's degree or higher.
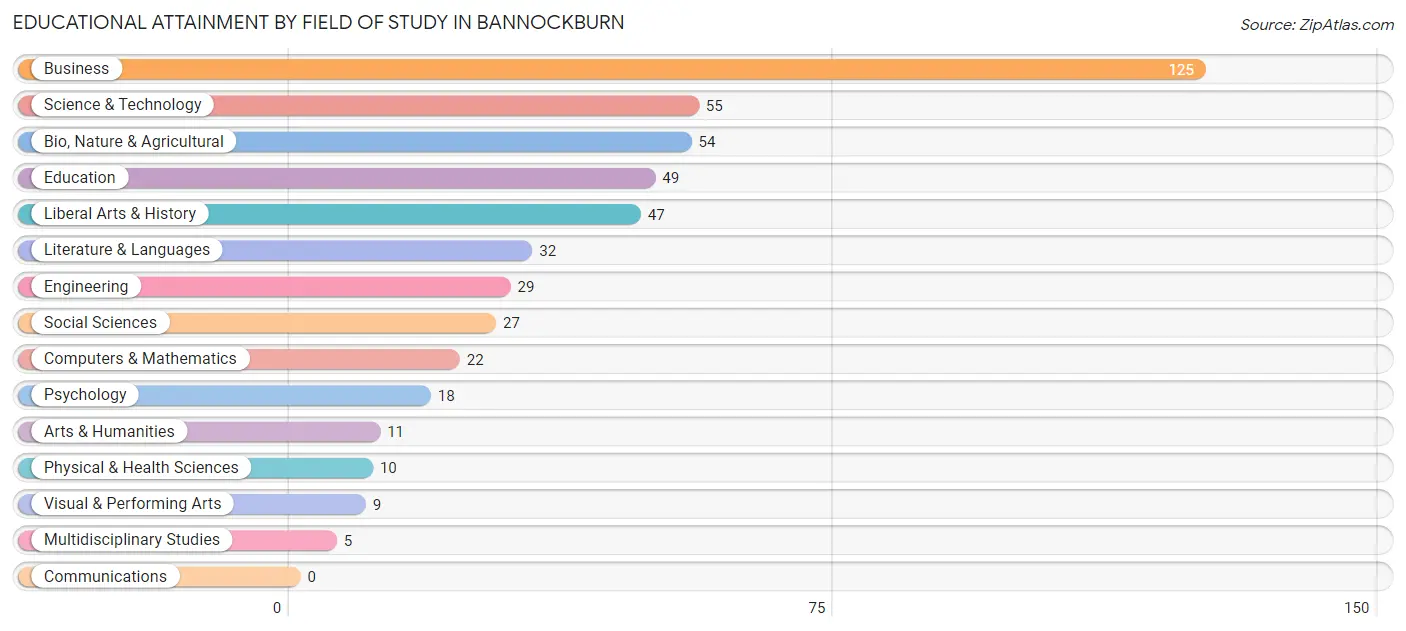
| Field of Study | # Graduates | % Graduates |
| Computers & Mathematics | 22 | 4.5% |
| Bio, Nature & Agricultural | 54 | 11.0% |
| Physical & Health Sciences | 10 | 2.0% |
| Psychology | 18 | 3.6% |
| Social Sciences | 27 | 5.5% |
| Engineering | 29 | 5.9% |
| Multidisciplinary Studies | 5 | 1.0% |
| Science & Technology | 55 | 11.2% |
| Business | 125 | 25.4% |
| Education | 49 | 9.9% |
| Literature & Languages | 32 | 6.5% |
| Liberal Arts & History | 47 | 9.5% |
| Visual & Performing Arts | 9 | 1.8% |
| Communications | 0 | 0.0% |
| Arts & Humanities | 11 | 2.2% |
| Total | 493 | 100.0% |
Transportation & Commute in Bannockburn
Vehicle Availability by Sex in Bannockburn
The most prevalent vehicle ownership categories in Bannockburn are males with 2 vehicles (68, accounting for 44.2%) and females with 2 vehicles (61, making up 58.1%).
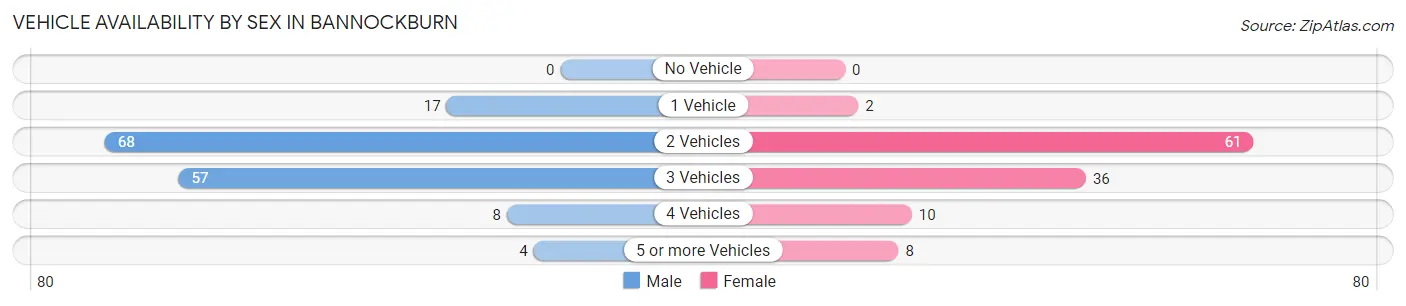
| Vehicles Available | Male | Female |
| No Vehicle | 0 (0.0%) | 0 (0.0%) |
| 1 Vehicle | 17 (11.0%) | 2 (1.7%) |
| 2 Vehicles | 68 (44.2%) | 61 (52.1%) |
| 3 Vehicles | 57 (37.0%) | 36 (30.8%) |
| 4 Vehicles | 8 (5.2%) | 10 (8.6%) |
| 5 or more Vehicles | 4 (2.6%) | 8 (6.8%) |
| Total | 154 (100.0%) | 117 (100.0%) |
Commute Time in Bannockburn
The most frequently occuring commute durations in Bannockburn are 5 to 9 minutes (83 commuters, 20.2%), 10 to 14 minutes (80 commuters, 19.4%), and 20 to 24 minutes (60 commuters, 14.6%).
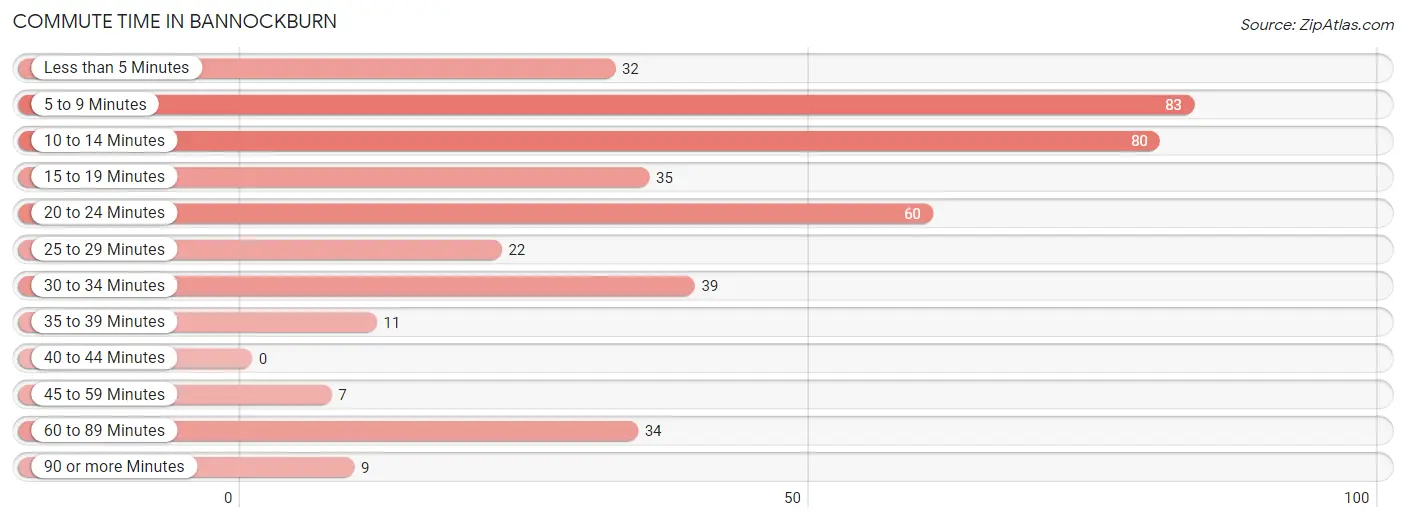
| Commute Time | # Commuters | % Commuters |
| Less than 5 Minutes | 32 | 7.8% |
| 5 to 9 Minutes | 83 | 20.2% |
| 10 to 14 Minutes | 80 | 19.4% |
| 15 to 19 Minutes | 35 | 8.5% |
| 20 to 24 Minutes | 60 | 14.6% |
| 25 to 29 Minutes | 22 | 5.3% |
| 30 to 34 Minutes | 39 | 9.5% |
| 35 to 39 Minutes | 11 | 2.7% |
| 40 to 44 Minutes | 0 | 0.0% |
| 45 to 59 Minutes | 7 | 1.7% |
| 60 to 89 Minutes | 34 | 8.3% |
| 90 or more Minutes | 9 | 2.2% |
Commute Time by Sex in Bannockburn
The most common commute times in Bannockburn are 5 to 9 minutes (48 commuters, 22.5%) for males and 10 to 14 minutes (63 commuters, 31.7%) for females.
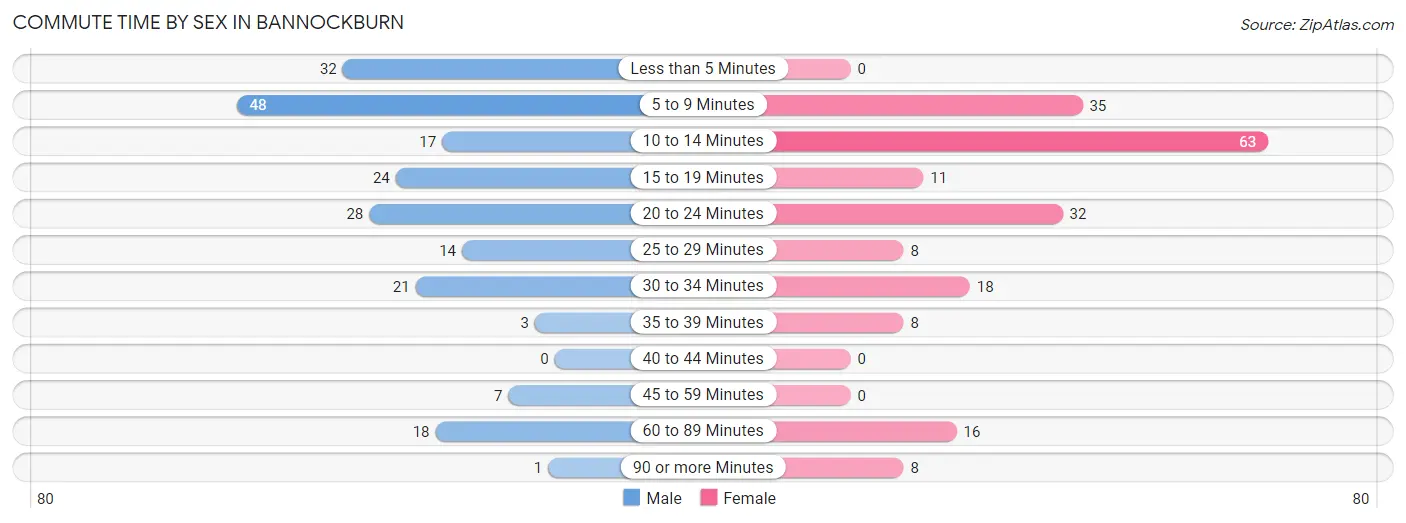
| Commute Time | Male | Female |
| Less than 5 Minutes | 32 (15.0%) | 0 (0.0%) |
| 5 to 9 Minutes | 48 (22.5%) | 35 (17.6%) |
| 10 to 14 Minutes | 17 (8.0%) | 63 (31.7%) |
| 15 to 19 Minutes | 24 (11.3%) | 11 (5.5%) |
| 20 to 24 Minutes | 28 (13.2%) | 32 (16.1%) |
| 25 to 29 Minutes | 14 (6.6%) | 8 (4.0%) |
| 30 to 34 Minutes | 21 (9.9%) | 18 (9.0%) |
| 35 to 39 Minutes | 3 (1.4%) | 8 (4.0%) |
| 40 to 44 Minutes | 0 (0.0%) | 0 (0.0%) |
| 45 to 59 Minutes | 7 (3.3%) | 0 (0.0%) |
| 60 to 89 Minutes | 18 (8.5%) | 16 (8.0%) |
| 90 or more Minutes | 1 (0.5%) | 8 (4.0%) |
Time of Departure to Work by Sex in Bannockburn
The most frequent times of departure to work in Bannockburn are 12:00 PM to 3:59 PM (46, 21.6%) for males and 4:00 PM to 11:59 PM (60, 30.1%) for females.
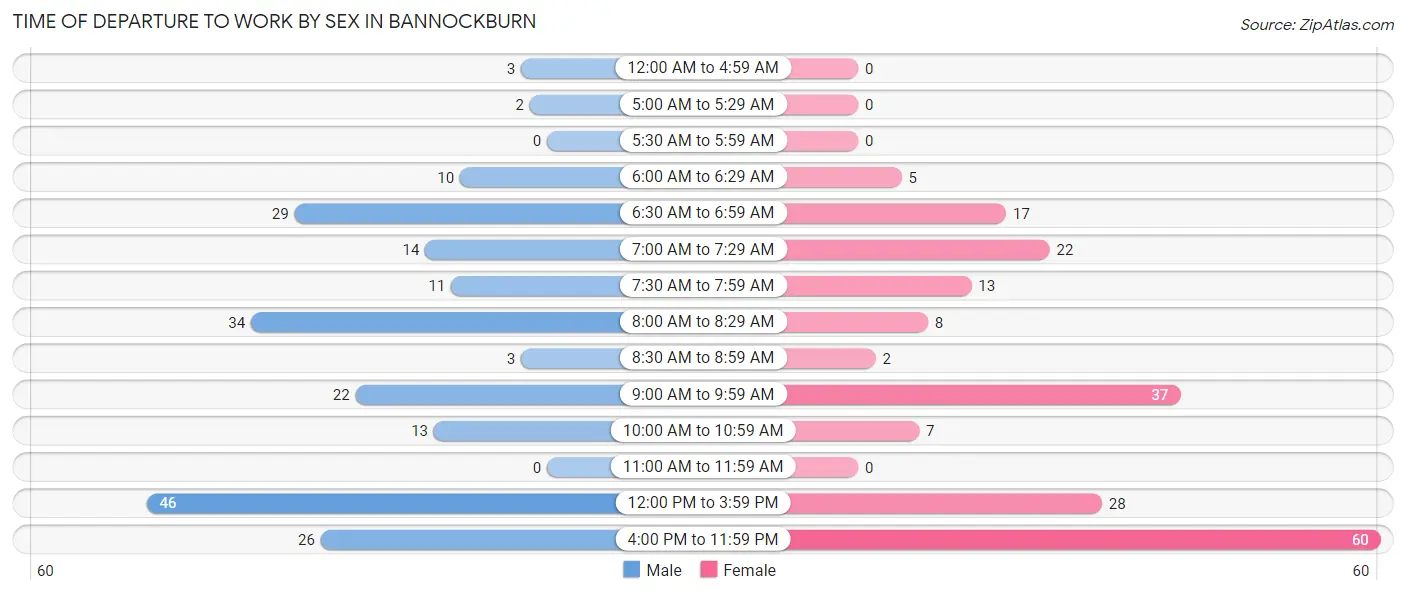
| Time of Departure | Male | Female |
| 12:00 AM to 4:59 AM | 3 (1.4%) | 0 (0.0%) |
| 5:00 AM to 5:29 AM | 2 (0.9%) | 0 (0.0%) |
| 5:30 AM to 5:59 AM | 0 (0.0%) | 0 (0.0%) |
| 6:00 AM to 6:29 AM | 10 (4.7%) | 5 (2.5%) |
| 6:30 AM to 6:59 AM | 29 (13.6%) | 17 (8.5%) |
| 7:00 AM to 7:29 AM | 14 (6.6%) | 22 (11.1%) |
| 7:30 AM to 7:59 AM | 11 (5.2%) | 13 (6.5%) |
| 8:00 AM to 8:29 AM | 34 (16.0%) | 8 (4.0%) |
| 8:30 AM to 8:59 AM | 3 (1.4%) | 2 (1.0%) |
| 9:00 AM to 9:59 AM | 22 (10.3%) | 37 (18.6%) |
| 10:00 AM to 10:59 AM | 13 (6.1%) | 7 (3.5%) |
| 11:00 AM to 11:59 AM | 0 (0.0%) | 0 (0.0%) |
| 12:00 PM to 3:59 PM | 46 (21.6%) | 28 (14.1%) |
| 4:00 PM to 11:59 PM | 26 (12.2%) | 60 (30.1%) |
| Total | 213 (100.0%) | 199 (100.0%) |
Housing Occupancy in Bannockburn
Occupancy by Ownership in Bannockburn
Of the total 239 dwellings in Bannockburn, owner-occupied units account for 205 (85.8%), while renter-occupied units make up 34 (14.2%).
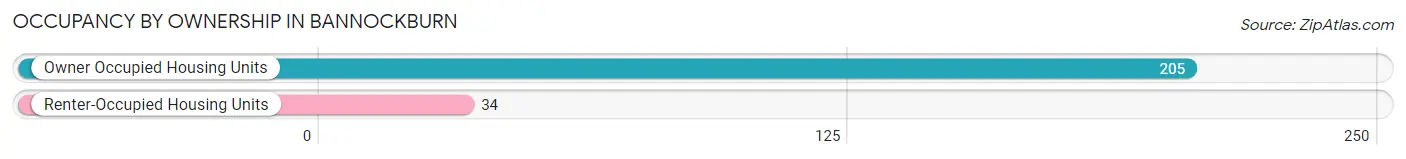
| Occupancy | # Housing Units | % Housing Units |
| Owner Occupied Housing Units | 205 | 85.8% |
| Renter-Occupied Housing Units | 34 | 14.2% |
| Total Occupied Housing Units | 239 | 100.0% |
Occupancy by Household Size in Bannockburn
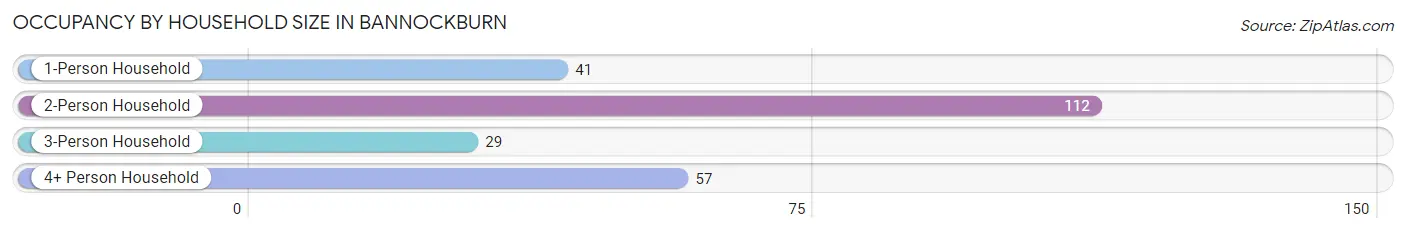
| Household Size | # Housing Units | % Housing Units |
| 1-Person Household | 41 | 17.2% |
| 2-Person Household | 112 | 46.9% |
| 3-Person Household | 29 | 12.1% |
| 4+ Person Household | 57 | 23.8% |
| Total Housing Units | 239 | 100.0% |
Occupancy by Ownership by Household Size in Bannockburn
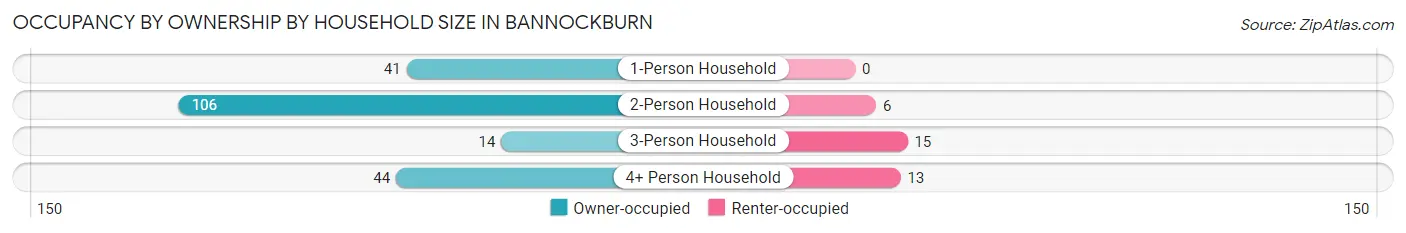
| Household Size | Owner-occupied | Renter-occupied |
| 1-Person Household | 41 (100.0%) | 0 (0.0%) |
| 2-Person Household | 106 (94.6%) | 6 (5.4%) |
| 3-Person Household | 14 (48.3%) | 15 (51.7%) |
| 4+ Person Household | 44 (77.2%) | 13 (22.8%) |
| Total Housing Units | 205 (85.8%) | 34 (14.2%) |
Occupancy by Educational Attainment in Bannockburn
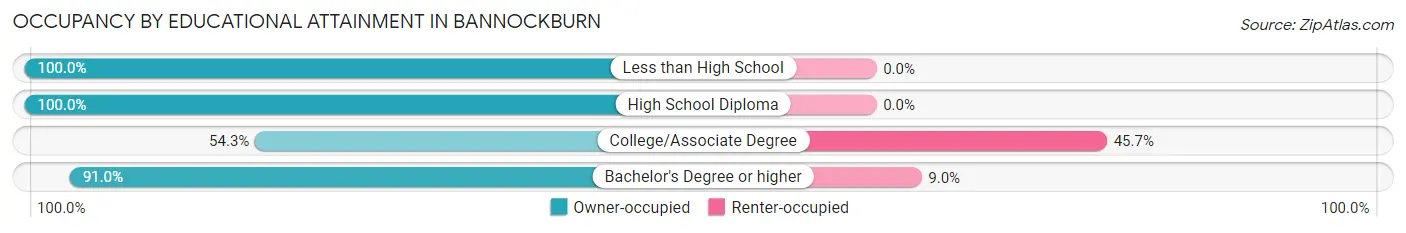
| Household Size | Owner-occupied | Renter-occupied |
| Less than High School | 2 (100.0%) | 0 (0.0%) |
| High School Diploma | 1 (100.0%) | 0 (0.0%) |
| College/Associate Degree | 19 (54.3%) | 16 (45.7%) |
| Bachelor's Degree or higher | 183 (91.0%) | 18 (9.0%) |
Occupancy by Age of Householder in Bannockburn
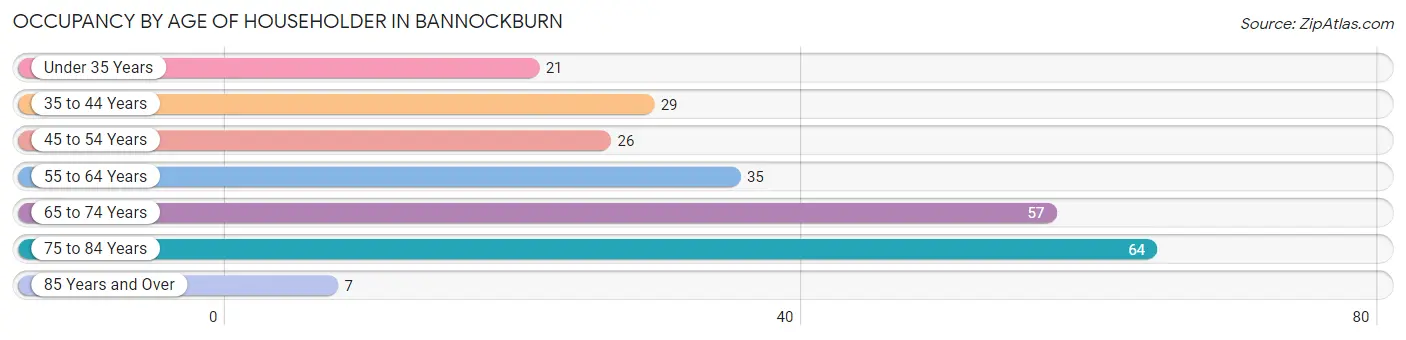
| Age Bracket | # Households | % Households |
| Under 35 Years | 21 | 8.8% |
| 35 to 44 Years | 29 | 12.1% |
| 45 to 54 Years | 26 | 10.9% |
| 55 to 64 Years | 35 | 14.6% |
| 65 to 74 Years | 57 | 23.8% |
| 75 to 84 Years | 64 | 26.8% |
| 85 Years and Over | 7 | 2.9% |
| Total | 239 | 100.0% |
Housing Finances in Bannockburn
Median Income by Occupancy in Bannockburn
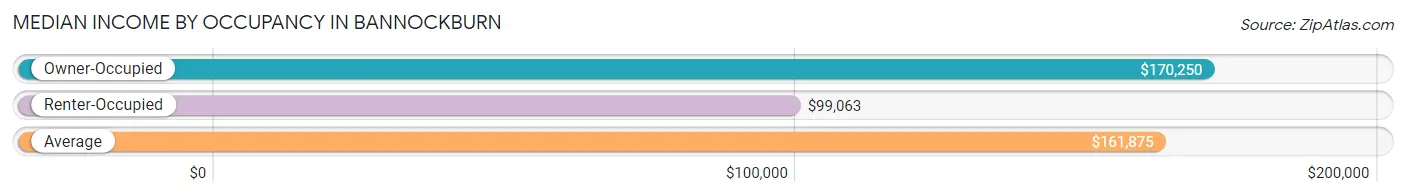
| Occupancy Type | # Households | Median Income |
| Owner-Occupied | 205 (85.8%) | $170,250 |
| Renter-Occupied | 34 (14.2%) | $99,063 |
| Average | 239 (100.0%) | $161,875 |
Occupancy by Householder Income Bracket in Bannockburn
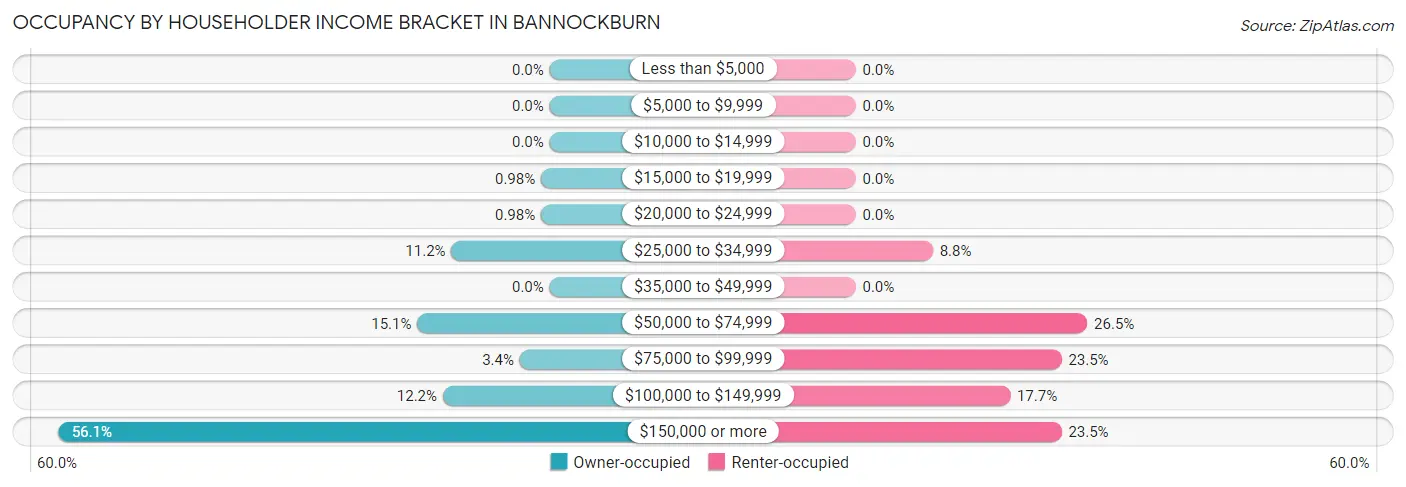
| Income Bracket | Owner-occupied | Renter-occupied |
| Less than $5,000 | 0 (0.0%) | 0 (0.0%) |
| $5,000 to $9,999 | 0 (0.0%) | 0 (0.0%) |
| $10,000 to $14,999 | 0 (0.0%) | 0 (0.0%) |
| $15,000 to $19,999 | 2 (1.0%) | 0 (0.0%) |
| $20,000 to $24,999 | 2 (1.0%) | 0 (0.0%) |
| $25,000 to $34,999 | 23 (11.2%) | 3 (8.8%) |
| $35,000 to $49,999 | 0 (0.0%) | 0 (0.0%) |
| $50,000 to $74,999 | 31 (15.1%) | 9 (26.5%) |
| $75,000 to $99,999 | 7 (3.4%) | 8 (23.5%) |
| $100,000 to $149,999 | 25 (12.2%) | 6 (17.6%) |
| $150,000 or more | 115 (56.1%) | 8 (23.5%) |
| Total | 205 (100.0%) | 34 (100.0%) |
Monthly Housing Cost Tiers in Bannockburn
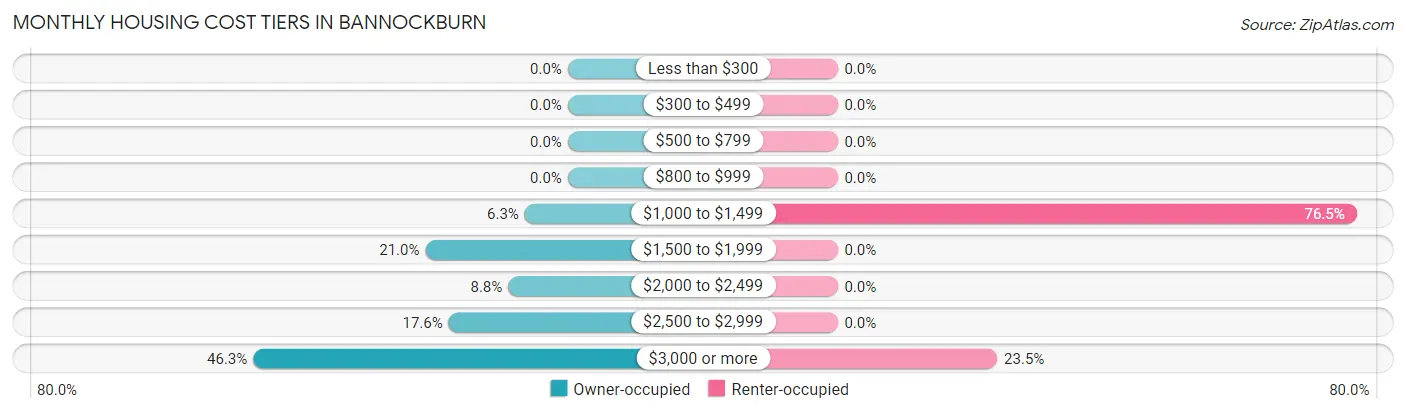
| Monthly Cost | Owner-occupied | Renter-occupied |
| Less than $300 | 0 (0.0%) | 0 (0.0%) |
| $300 to $499 | 0 (0.0%) | 0 (0.0%) |
| $500 to $799 | 0 (0.0%) | 0 (0.0%) |
| $800 to $999 | 0 (0.0%) | 0 (0.0%) |
| $1,000 to $1,499 | 13 (6.3%) | 26 (76.5%) |
| $1,500 to $1,999 | 43 (21.0%) | 0 (0.0%) |
| $2,000 to $2,499 | 18 (8.8%) | 0 (0.0%) |
| $2,500 to $2,999 | 36 (17.6%) | 0 (0.0%) |
| $3,000 or more | 95 (46.3%) | 8 (23.5%) |
| Total | 205 (100.0%) | 34 (100.0%) |
Physical Housing Characteristics in Bannockburn
Housing Structures in Bannockburn
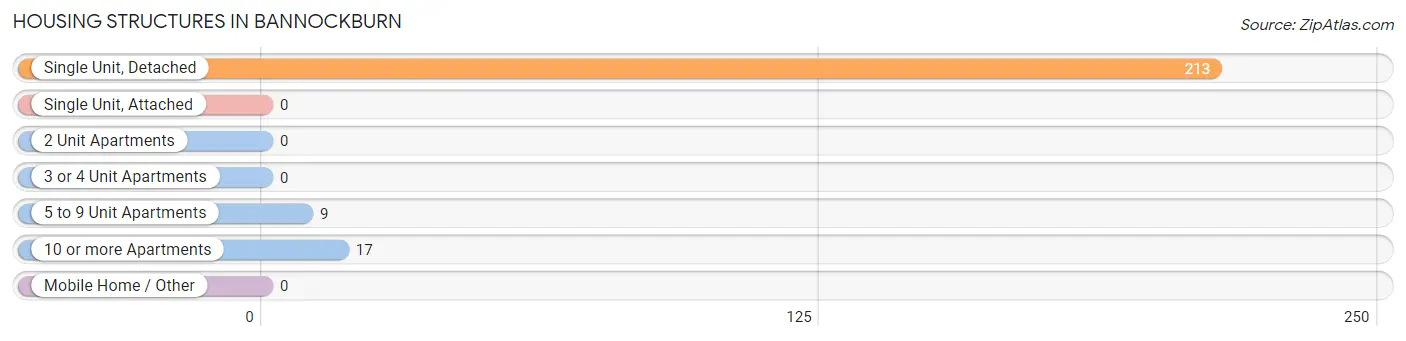
| Structure Type | # Housing Units | % Housing Units |
| Single Unit, Detached | 213 | 89.1% |
| Single Unit, Attached | 0 | 0.0% |
| 2 Unit Apartments | 0 | 0.0% |
| 3 or 4 Unit Apartments | 0 | 0.0% |
| 5 to 9 Unit Apartments | 9 | 3.8% |
| 10 or more Apartments | 17 | 7.1% |
| Mobile Home / Other | 0 | 0.0% |
| Total | 239 | 100.0% |
Housing Structures by Occupancy in Bannockburn
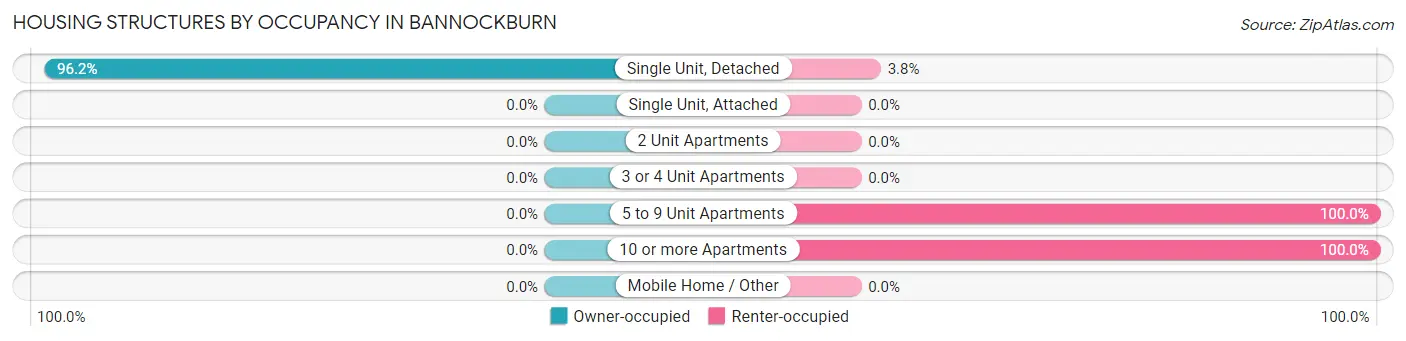
| Structure Type | Owner-occupied | Renter-occupied |
| Single Unit, Detached | 205 (96.2%) | 8 (3.8%) |
| Single Unit, Attached | 0 (0.0%) | 0 (0.0%) |
| 2 Unit Apartments | 0 (0.0%) | 0 (0.0%) |
| 3 or 4 Unit Apartments | 0 (0.0%) | 0 (0.0%) |
| 5 to 9 Unit Apartments | 0 (0.0%) | 9 (100.0%) |
| 10 or more Apartments | 0 (0.0%) | 17 (100.0%) |
| Mobile Home / Other | 0 (0.0%) | 0 (0.0%) |
| Total | 205 (85.8%) | 34 (14.2%) |
Housing Structures by Number of Rooms in Bannockburn
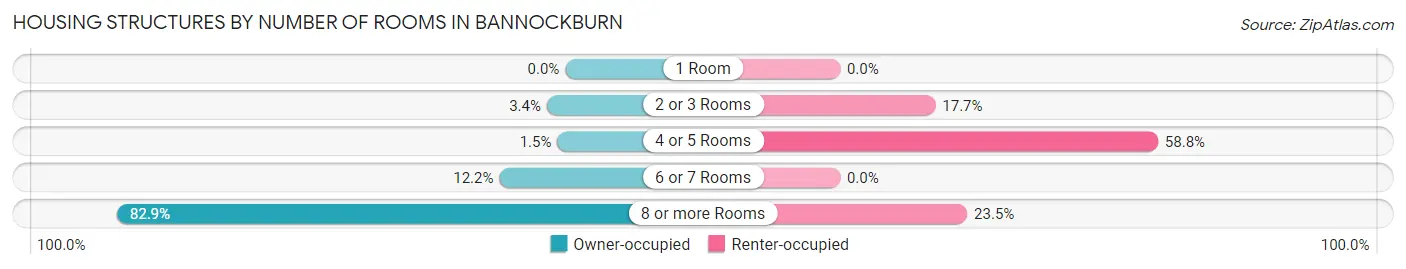
| Number of Rooms | Owner-occupied | Renter-occupied |
| 1 Room | 0 (0.0%) | 0 (0.0%) |
| 2 or 3 Rooms | 7 (3.4%) | 6 (17.6%) |
| 4 or 5 Rooms | 3 (1.5%) | 20 (58.8%) |
| 6 or 7 Rooms | 25 (12.2%) | 0 (0.0%) |
| 8 or more Rooms | 170 (82.9%) | 8 (23.5%) |
| Total | 205 (100.0%) | 34 (100.0%) |
Housing Structure by Heating Type in Bannockburn
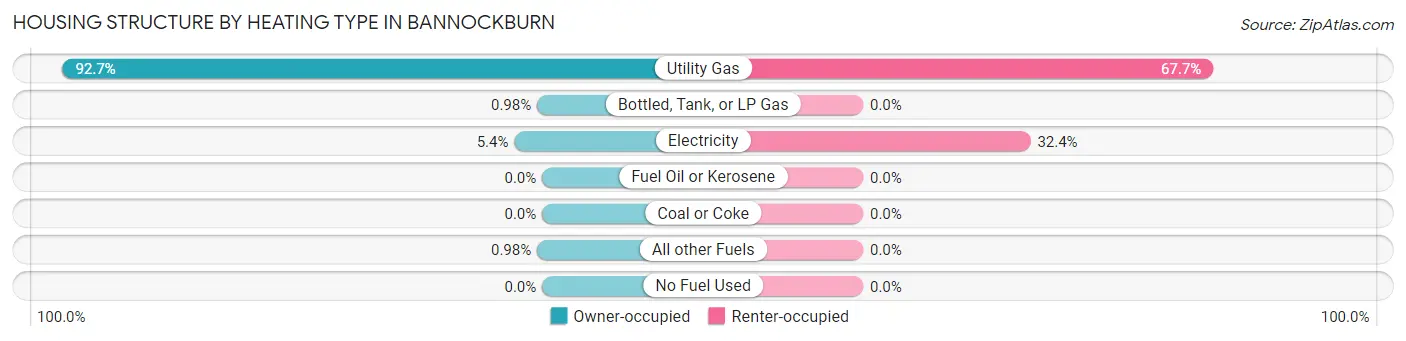
| Heating Type | Owner-occupied | Renter-occupied |
| Utility Gas | 190 (92.7%) | 23 (67.6%) |
| Bottled, Tank, or LP Gas | 2 (1.0%) | 0 (0.0%) |
| Electricity | 11 (5.4%) | 11 (32.4%) |
| Fuel Oil or Kerosene | 0 (0.0%) | 0 (0.0%) |
| Coal or Coke | 0 (0.0%) | 0 (0.0%) |
| All other Fuels | 2 (1.0%) | 0 (0.0%) |
| No Fuel Used | 0 (0.0%) | 0 (0.0%) |
| Total | 205 (100.0%) | 34 (100.0%) |
Household Vehicle Usage in Bannockburn
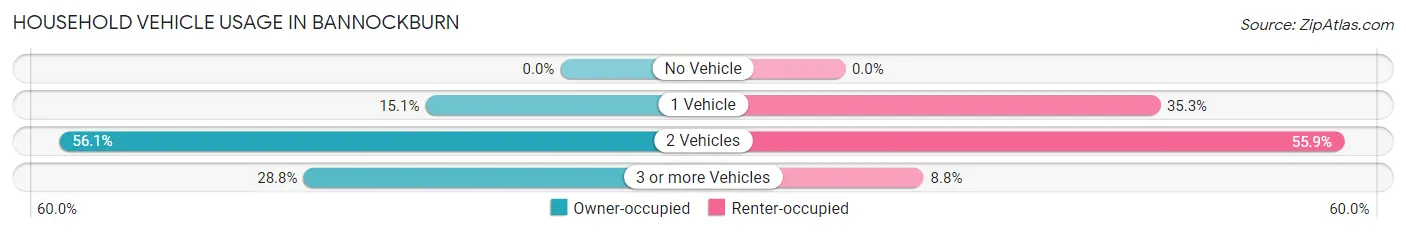
| Vehicles per Household | Owner-occupied | Renter-occupied |
| No Vehicle | 0 (0.0%) | 0 (0.0%) |
| 1 Vehicle | 31 (15.1%) | 12 (35.3%) |
| 2 Vehicles | 115 (56.1%) | 19 (55.9%) |
| 3 or more Vehicles | 59 (28.8%) | 3 (8.8%) |
| Total | 205 (100.0%) | 34 (100.0%) |
Real Estate & Mortgages in Bannockburn
Real Estate and Mortgage Overview in Bannockburn
| Characteristic | Without Mortgage | With Mortgage |
| Housing Units | 121 | 84 |
| Median Property Value | $991,700 | $1,050,000 |
| Median Household Income | $104,464 | $64 |
| Monthly Housing Costs | $1,501 | $68 |
| Real Estate Taxes | $10,001 | $1 |
Property Value by Mortgage Status in Bannockburn
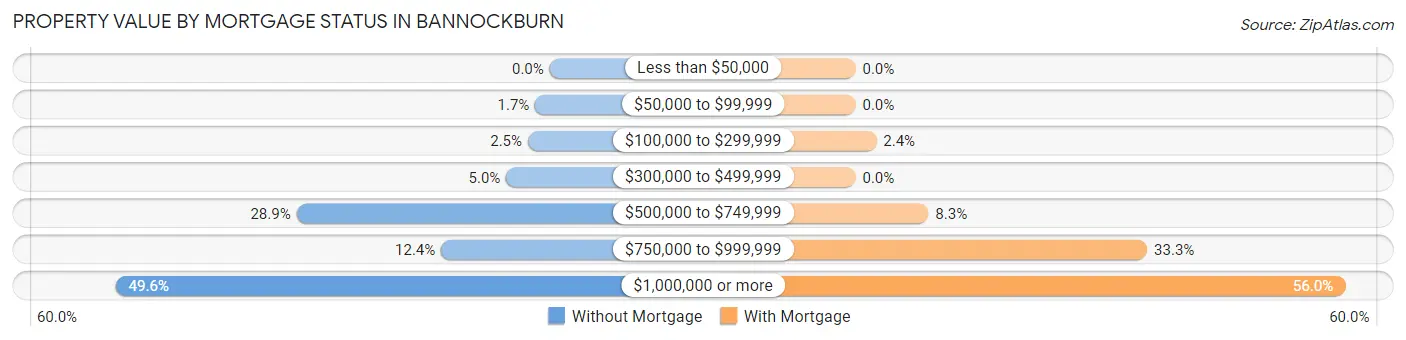
| Property Value | Without Mortgage | With Mortgage |
| Less than $50,000 | 0 (0.0%) | 0 (0.0%) |
| $50,000 to $99,999 | 2 (1.7%) | 0 (0.0%) |
| $100,000 to $299,999 | 3 (2.5%) | 2 (2.4%) |
| $300,000 to $499,999 | 6 (5.0%) | 0 (0.0%) |
| $500,000 to $749,999 | 35 (28.9%) | 7 (8.3%) |
| $750,000 to $999,999 | 15 (12.4%) | 28 (33.3%) |
| $1,000,000 or more | 60 (49.6%) | 47 (55.9%) |
| Total | 121 (100.0%) | 84 (100.0%) |
Household Income by Mortgage Status in Bannockburn
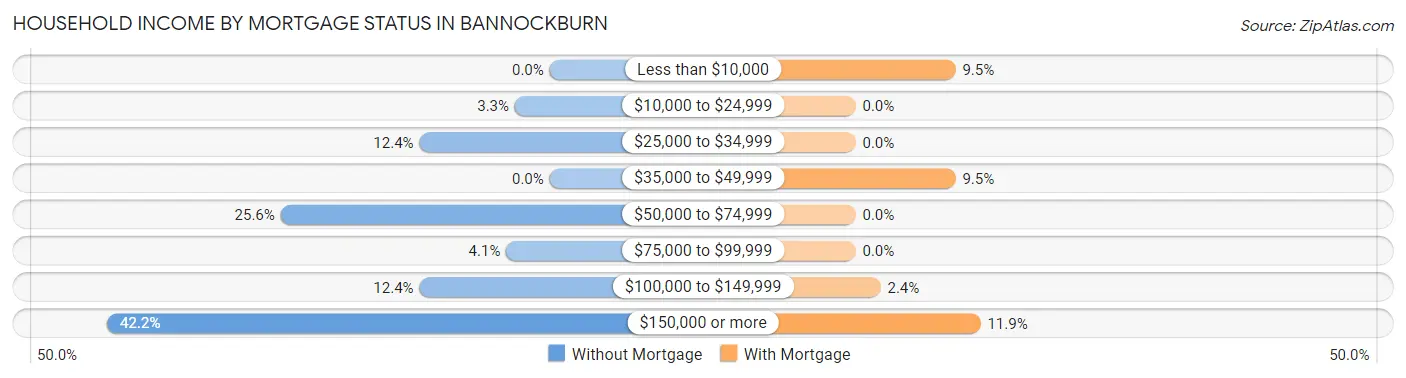
| Household Income | Without Mortgage | With Mortgage |
| Less than $10,000 | 0 (0.0%) | 8 (9.5%) |
| $10,000 to $24,999 | 4 (3.3%) | 0 (0.0%) |
| $25,000 to $34,999 | 15 (12.4%) | 0 (0.0%) |
| $35,000 to $49,999 | 0 (0.0%) | 8 (9.5%) |
| $50,000 to $74,999 | 31 (25.6%) | 0 (0.0%) |
| $75,000 to $99,999 | 5 (4.1%) | 0 (0.0%) |
| $100,000 to $149,999 | 15 (12.4%) | 2 (2.4%) |
| $150,000 or more | 51 (42.1%) | 10 (11.9%) |
| Total | 121 (100.0%) | 84 (100.0%) |
Property Value to Household Income Ratio in Bannockburn
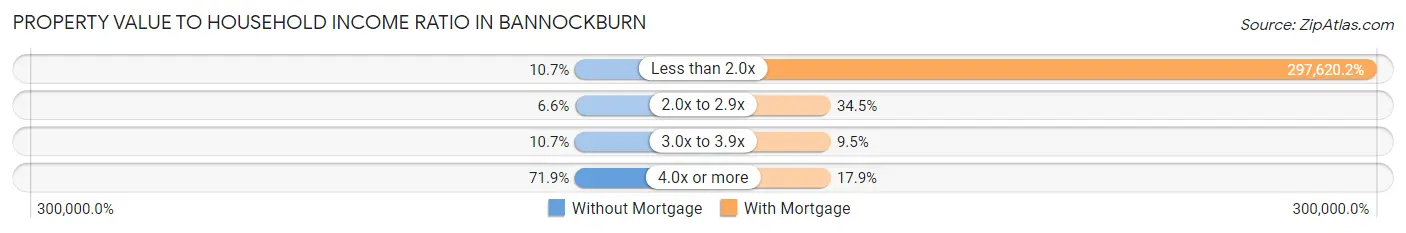
| Value-to-Income Ratio | Without Mortgage | With Mortgage |
| Less than 2.0x | 13 (10.7%) | 250,001 (297,620.2%) |
| 2.0x to 2.9x | 8 (6.6%) | 29 (34.5%) |
| 3.0x to 3.9x | 13 (10.7%) | 8 (9.5%) |
| 4.0x or more | 87 (71.9%) | 15 (17.9%) |
| Total | 121 (100.0%) | 84 (100.0%) |
Real Estate Taxes by Mortgage Status in Bannockburn
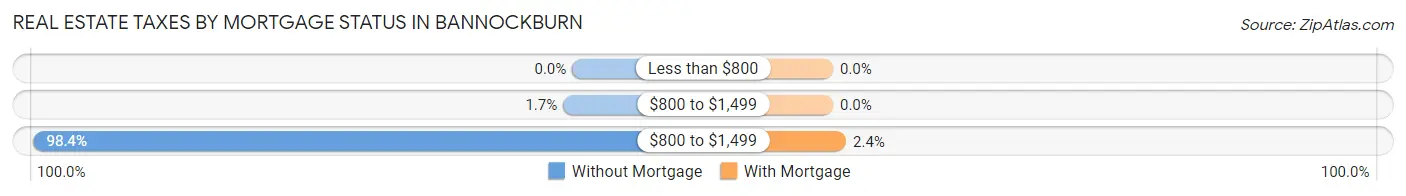
| Property Taxes | Without Mortgage | With Mortgage |
| Less than $800 | 0 (0.0%) | 0 (0.0%) |
| $800 to $1,499 | 2 (1.7%) | 0 (0.0%) |
| $800 to $1,499 | 119 (98.4%) | 2 (2.4%) |
| Total | 121 (100.0%) | 84 (100.0%) |
Health & Disability in Bannockburn
Health Insurance Coverage by Age in Bannockburn
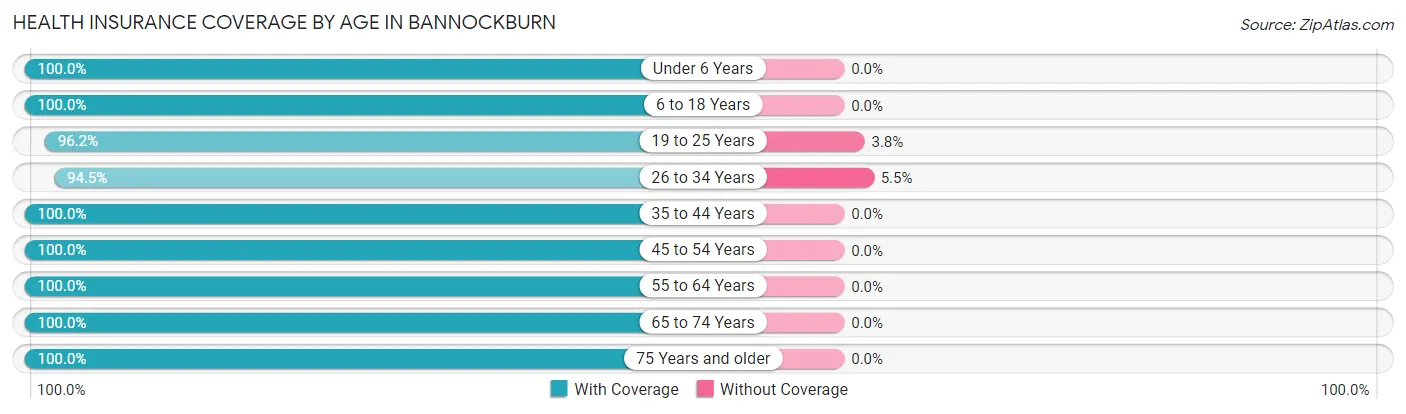
| Age Bracket | With Coverage | Without Coverage |
| Under 6 Years | 55 (100.0%) | 0 (0.0%) |
| 6 to 18 Years | 175 (100.0%) | 0 (0.0%) |
| 19 to 25 Years | 306 (96.2%) | 12 (3.8%) |
| 26 to 34 Years | 86 (94.5%) | 5 (5.5%) |
| 35 to 44 Years | 66 (100.0%) | 0 (0.0%) |
| 45 to 54 Years | 76 (100.0%) | 0 (0.0%) |
| 55 to 64 Years | 63 (100.0%) | 0 (0.0%) |
| 65 to 74 Years | 93 (100.0%) | 0 (0.0%) |
| 75 Years and older | 128 (100.0%) | 0 (0.0%) |
| Total | 1,048 (98.4%) | 17 (1.6%) |
Health Insurance Coverage by Citizenship Status in Bannockburn
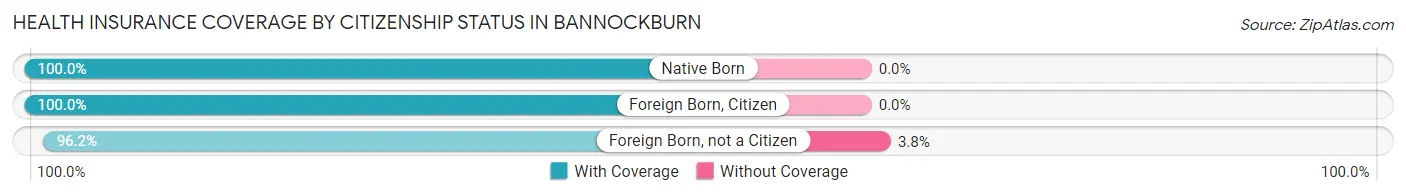
| Citizenship Status | With Coverage | Without Coverage |
| Native Born | 55 (100.0%) | 0 (0.0%) |
| Foreign Born, Citizen | 175 (100.0%) | 0 (0.0%) |
| Foreign Born, not a Citizen | 306 (96.2%) | 12 (3.8%) |
Health Insurance Coverage by Household Income in Bannockburn
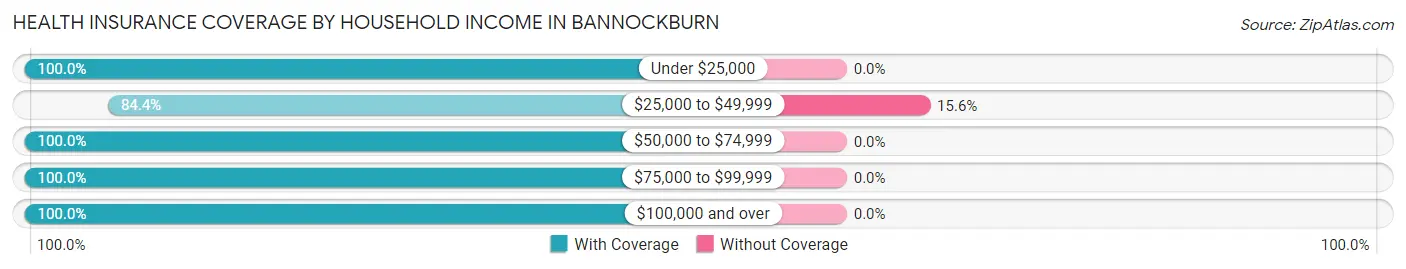
| Household Income | With Coverage | Without Coverage |
| Under $25,000 | 16 (100.0%) | 0 (0.0%) |
| $25,000 to $49,999 | 27 (84.4%) | 5 (15.6%) |
| $50,000 to $74,999 | 82 (100.0%) | 0 (0.0%) |
| $75,000 to $99,999 | 68 (100.0%) | 0 (0.0%) |
| $100,000 and over | 423 (100.0%) | 0 (0.0%) |
Public vs Private Health Insurance Coverage by Age in Bannockburn
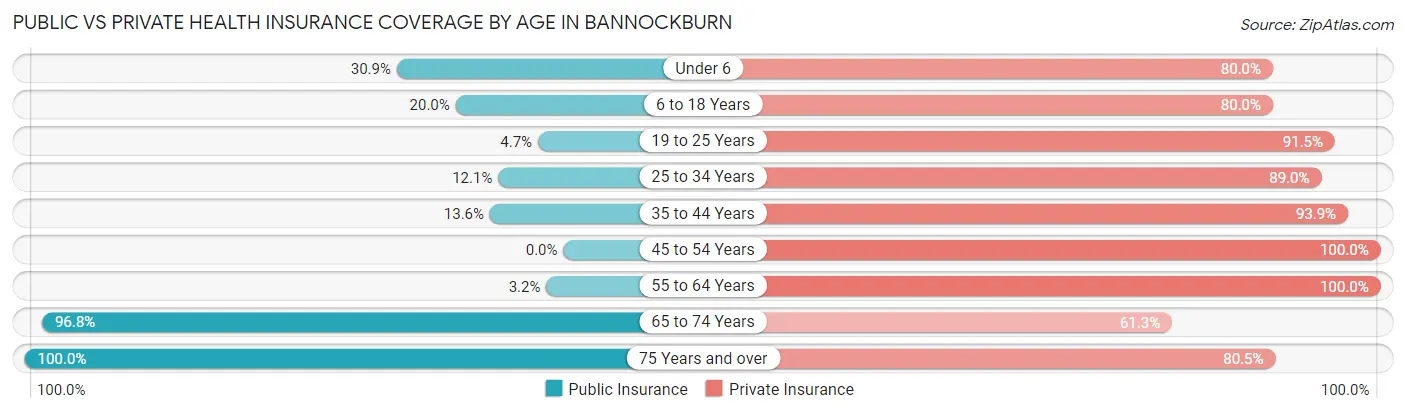
| Age Bracket | Public Insurance | Private Insurance |
| Under 6 | 17 (30.9%) | 44 (80.0%) |
| 6 to 18 Years | 35 (20.0%) | 140 (80.0%) |
| 19 to 25 Years | 15 (4.7%) | 291 (91.5%) |
| 25 to 34 Years | 11 (12.1%) | 81 (89.0%) |
| 35 to 44 Years | 9 (13.6%) | 62 (93.9%) |
| 45 to 54 Years | 0 (0.0%) | 76 (100.0%) |
| 55 to 64 Years | 2 (3.2%) | 63 (100.0%) |
| 65 to 74 Years | 90 (96.8%) | 57 (61.3%) |
| 75 Years and over | 128 (100.0%) | 103 (80.5%) |
| Total | 307 (28.8%) | 917 (86.1%) |
Disability Status by Sex by Age in Bannockburn
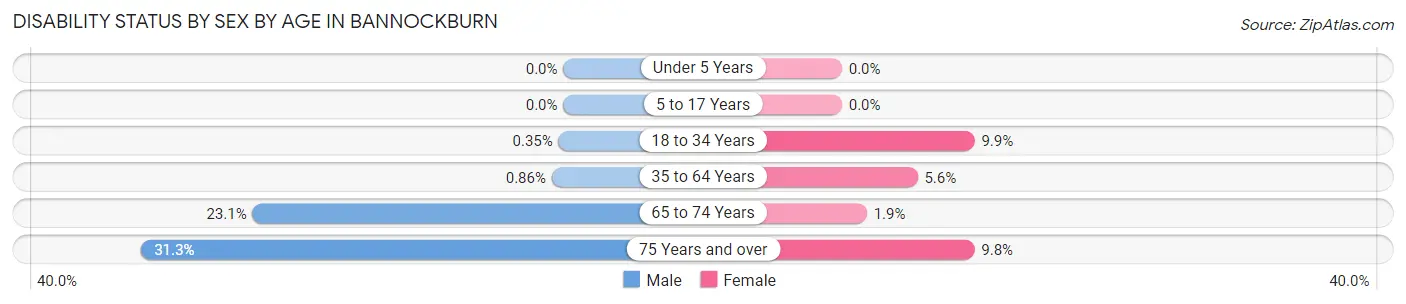
| Age Bracket | Male | Female |
| Under 5 Years | 0 (0.0%) | 0 (0.0%) |
| 5 to 17 Years | 0 (0.0%) | 0 (0.0%) |
| 18 to 34 Years | 1 (0.4%) | 20 (9.9%) |
| 35 to 64 Years | 1 (0.9%) | 5 (5.6%) |
| 65 to 74 Years | 9 (23.1%) | 1 (1.8%) |
| 75 Years and over | 21 (31.3%) | 6 (9.8%) |
Disability Class by Sex by Age in Bannockburn
Disability Class: Hearing Difficulty
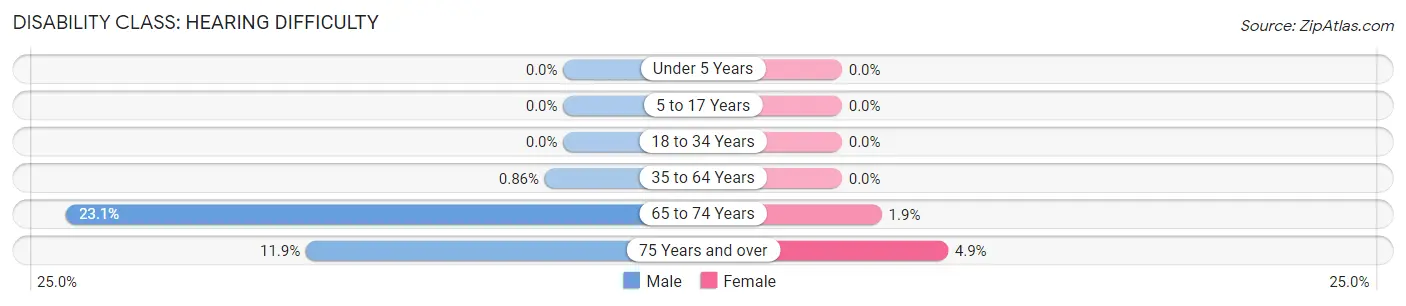
| Age Bracket | Male | Female |
| Under 5 Years | 0 (0.0%) | 0 (0.0%) |
| 5 to 17 Years | 0 (0.0%) | 0 (0.0%) |
| 18 to 34 Years | 0 (0.0%) | 0 (0.0%) |
| 35 to 64 Years | 1 (0.9%) | 0 (0.0%) |
| 65 to 74 Years | 9 (23.1%) | 1 (1.8%) |
| 75 Years and over | 8 (11.9%) | 3 (4.9%) |
Disability Class: Vision Difficulty
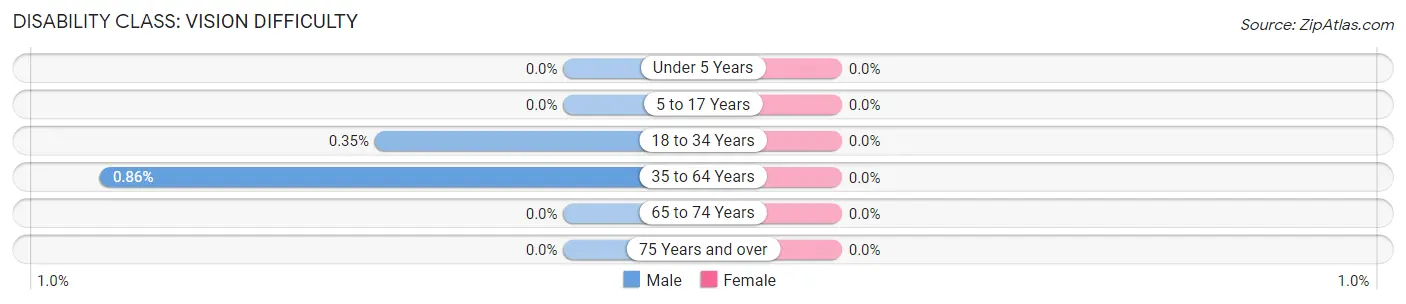
| Age Bracket | Male | Female |
| Under 5 Years | 0 (0.0%) | 0 (0.0%) |
| 5 to 17 Years | 0 (0.0%) | 0 (0.0%) |
| 18 to 34 Years | 1 (0.4%) | 0 (0.0%) |
| 35 to 64 Years | 1 (0.9%) | 0 (0.0%) |
| 65 to 74 Years | 0 (0.0%) | 0 (0.0%) |
| 75 Years and over | 0 (0.0%) | 0 (0.0%) |
Disability Class: Cognitive Difficulty
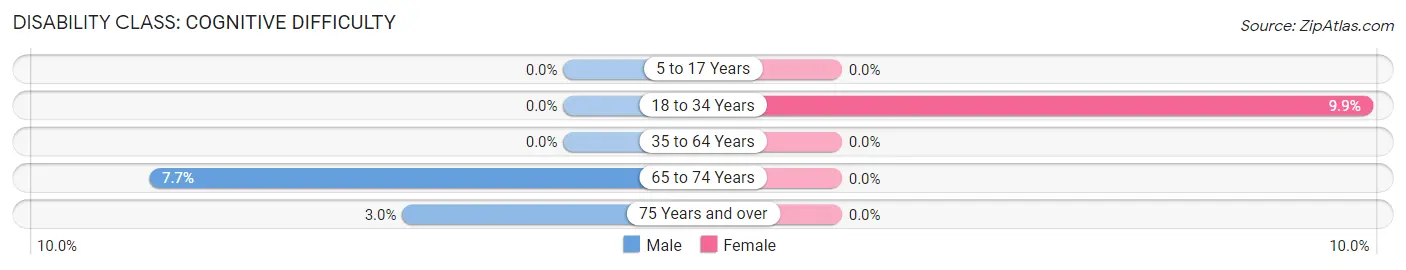
| Age Bracket | Male | Female |
| 5 to 17 Years | 0 (0.0%) | 0 (0.0%) |
| 18 to 34 Years | 0 (0.0%) | 20 (9.9%) |
| 35 to 64 Years | 0 (0.0%) | 0 (0.0%) |
| 65 to 74 Years | 3 (7.7%) | 0 (0.0%) |
| 75 Years and over | 2 (3.0%) | 0 (0.0%) |
Disability Class: Ambulatory Difficulty
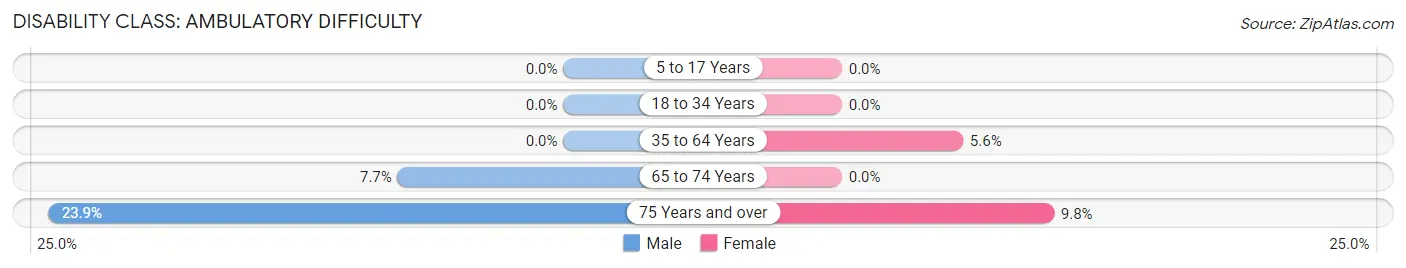
| Age Bracket | Male | Female |
| 5 to 17 Years | 0 (0.0%) | 0 (0.0%) |
| 18 to 34 Years | 0 (0.0%) | 0 (0.0%) |
| 35 to 64 Years | 0 (0.0%) | 5 (5.6%) |
| 65 to 74 Years | 3 (7.7%) | 0 (0.0%) |
| 75 Years and over | 16 (23.9%) | 6 (9.8%) |
Disability Class: Self-Care Difficulty
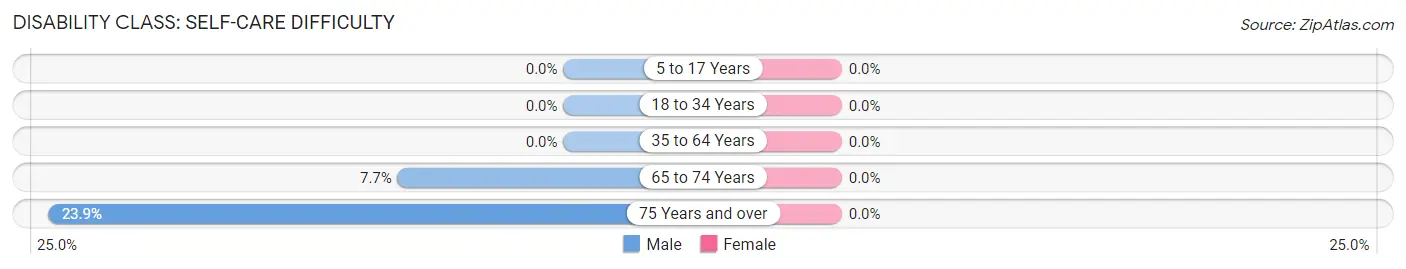
| Age Bracket | Male | Female |
| 5 to 17 Years | 0 (0.0%) | 0 (0.0%) |
| 18 to 34 Years | 0 (0.0%) | 0 (0.0%) |
| 35 to 64 Years | 0 (0.0%) | 0 (0.0%) |
| 65 to 74 Years | 3 (7.7%) | 0 (0.0%) |
| 75 Years and over | 16 (23.9%) | 0 (0.0%) |
Technology Access in Bannockburn
Computing Device Access in Bannockburn
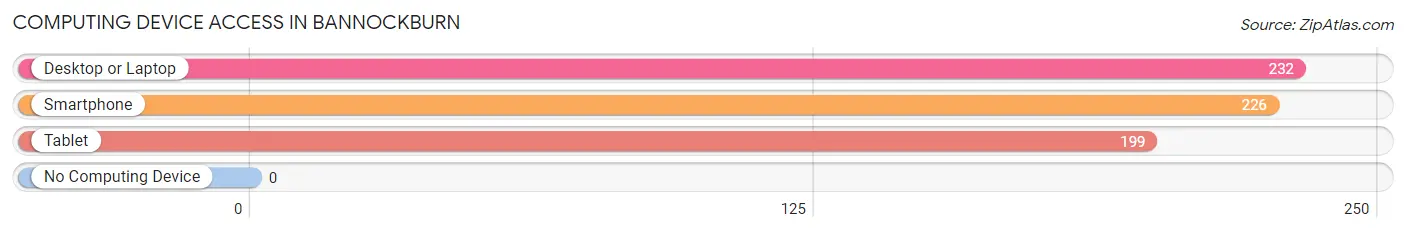
| Device Type | # Households | % Households |
| Desktop or Laptop | 232 | 97.1% |
| Smartphone | 226 | 94.6% |
| Tablet | 199 | 83.3% |
| No Computing Device | 0 | 0.0% |
| Total | 239 | 100.0% |
Internet Access in Bannockburn
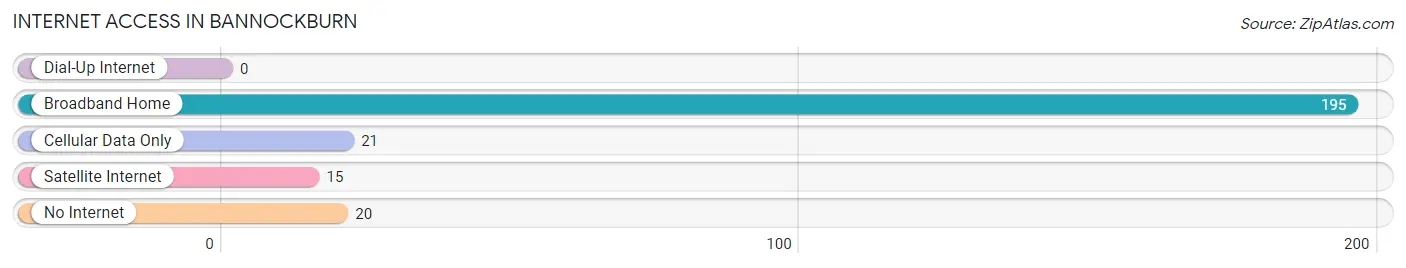
| Internet Type | # Households | % Households |
| Dial-Up Internet | 0 | 0.0% |
| Broadband Home | 195 | 81.6% |
| Cellular Data Only | 21 | 8.8% |
| Satellite Internet | 15 | 6.3% |
| No Internet | 20 | 8.4% |
| Total | 239 | 100.0% |
Bannockburn Summary
Bannockburn, Illinois is a small village located in Lake County, Illinois, United States. It is situated on the North Shore of Lake Michigan, approximately 25 miles north of Chicago. The village has a population of approximately 2,500 people and covers an area of 1.3 square miles.
History
The area that is now Bannockburn was first settled in the early 1800s by Scottish immigrants. The village was named after the Battle of Bannockburn, which was fought in Scotland in 1314. The village was officially incorporated in 1957.
Geography
Bannockburn is located in Lake County, Illinois, approximately 25 miles north of Chicago. The village is situated on the North Shore of Lake Michigan and covers an area of 1.3 square miles. The village is bordered by the villages of Deerfield, Highland Park, and Riverwoods. The village is located in the North Shore area of Chicago, which is known for its affluent neighborhoods and high-end shopping.
Economy
Bannockburn is a small village with a population of approximately 2,500 people. The village is home to a number of small businesses, including restaurants, retail stores, and professional services. The village is also home to a number of corporate offices, including those of Baxter International, Allstate Insurance, and Walgreens.
Demographics
As of the 2010 census, the population of Bannockburn was 2,521. The racial makeup of the village was 94.3% White, 1.2% African American, 0.2% Native American, 2.2% Asian, 0.1% Pacific Islander, 0.7% from other races, and 1.5% from two or more races. The median household income in Bannockburn was $150,000, and the median family income was $170,000.
Conclusion
Bannockburn, Illinois is a small village located in Lake County, Illinois, United States. It is situated on the North Shore of Lake Michigan, approximately 25 miles north of Chicago. The village has a population of approximately 2,500 people and covers an area of 1.3 square miles. The village was first settled in the early 1800s by Scottish immigrants and was officially incorporated in 1957. The village is home to a number of small businesses, including restaurants, retail stores, and professional services. The village is also home to a number of corporate offices, including those of Baxter International, Allstate Insurance, and Walgreens. As of the 2010 census, the population of Bannockburn was 2,521. The racial makeup of the village was 94.3% White, 1.2% African American, 0.2% Native American, 2.2% Asian, 0.1% Pacific Islander, 0.7% from other races, and 1.5% from two or more races. The median household income in Bannockburn was $150,000, and the median family income was $170,000.
Common Questions
What is Per Capita Income in Bannockburn?
Per Capita income in Bannockburn is $81,849.
What is the Median Family Income in Bannockburn?
Median Family Income in Bannockburn is $195,417.
What is the Median Household income in Bannockburn?
Median Household Income in Bannockburn is $161,875.
What is Inequality or Gini Index in Bannockburn?
Inequality or Gini Index in Bannockburn is 0.58.
What is the Total Population of Bannockburn?
Total Population of Bannockburn is 1,065.
What is the Total Male Population of Bannockburn?
Total Male Population of Bannockburn is 567.
What is the Total Female Population of Bannockburn?
Total Female Population of Bannockburn is 498.
What is the Ratio of Males per 100 Females in Bannockburn?
There are 113.86 Males per 100 Females in Bannockburn.
What is the Ratio of Females per 100 Males in Bannockburn?
There are 87.83 Females per 100 Males in Bannockburn.
What is the Median Population Age in Bannockburn?
Median Population Age in Bannockburn is 24.9 Years.
What is the Average Family Size in Bannockburn
Average Family Size in Bannockburn is 3.0 People.
What is the Average Household Size in Bannockburn
Average Household Size in Bannockburn is 2.6 People.
How Large is the Labor Force in Bannockburn?
There are 552 People in the Labor Forcein in Bannockburn.
What is the Percentage of People in the Labor Force in Bannockburn?
58.8% of People are in the Labor Force in Bannockburn.
What is the Unemployment Rate in Bannockburn?
Unemployment Rate in Bannockburn is 2.2%.