Bull Valley, IL Map & Demographics
Bull Valley Map
Bull Valley Overview
$93,289
PER CAPITA INCOME
$168,750
AVG FAMILY INCOME
$147,500
AVG HOUSEHOLD INCOME
42.6%
WAGE / INCOME GAP [ % ]
57.4¢/ $1
WAGE / INCOME GAP [ $ ]
0.54
INEQUALITY / GINI INDEX
1,248
TOTAL POPULATION
625
MALE POPULATION
623
FEMALE POPULATION
100.32
MALES / 100 FEMALES
99.68
FEMALES / 100 MALES
58.9
MEDIAN AGE
2.7
AVG FAMILY SIZE
2.5
AVG HOUSEHOLD SIZE
605
LABOR FORCE [ PEOPLE ]
52.1%
PERCENT IN LABOR FORCE
5.1%
UNEMPLOYMENT RATE
Income in Bull Valley
Income Overview in Bull Valley
Per Capita Income in Bull Valley is $93,289, while median incomes of families and households are $168,750 and $147,500 respectively.
| Characteristic | Number | Measure |
| Per Capita Income | 1,248 | $93,289 |
| Median Family Income | 378 | $168,750 |
| Mean Family Income | 378 | $270,846 |
| Median Household Income | 504 | $147,500 |
| Mean Household Income | 504 | $228,453 |
| Income Deficit | 378 | $0 |
| Wage / Income Gap (%) | 1,248 | 42.61% |
| Wage / Income Gap ($) | 1,248 | 57.39¢ per $1 |
| Gini / Inequality Index | 1,248 | 0.54 |
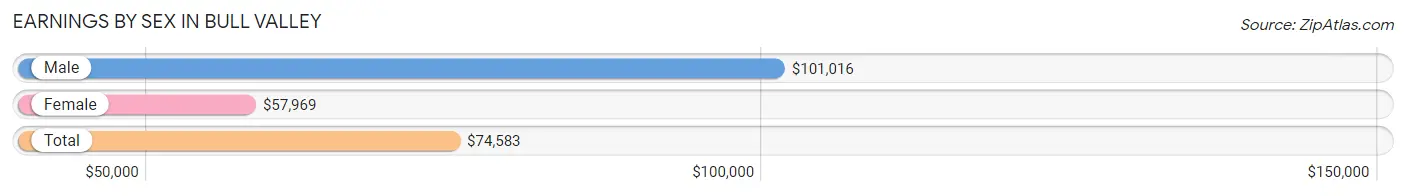
Earnings by Sex in Bull Valley
Average Earnings in Bull Valley are $74,583, $101,016 for men and $57,969 for women, a difference of 42.6%.
| Sex | Number | Average Earnings |
| Male | 365 (58.3%) | $101,016 |
| Female | 261 (41.7%) | $57,969 |
| Total | 626 (100.0%) | $74,583 |
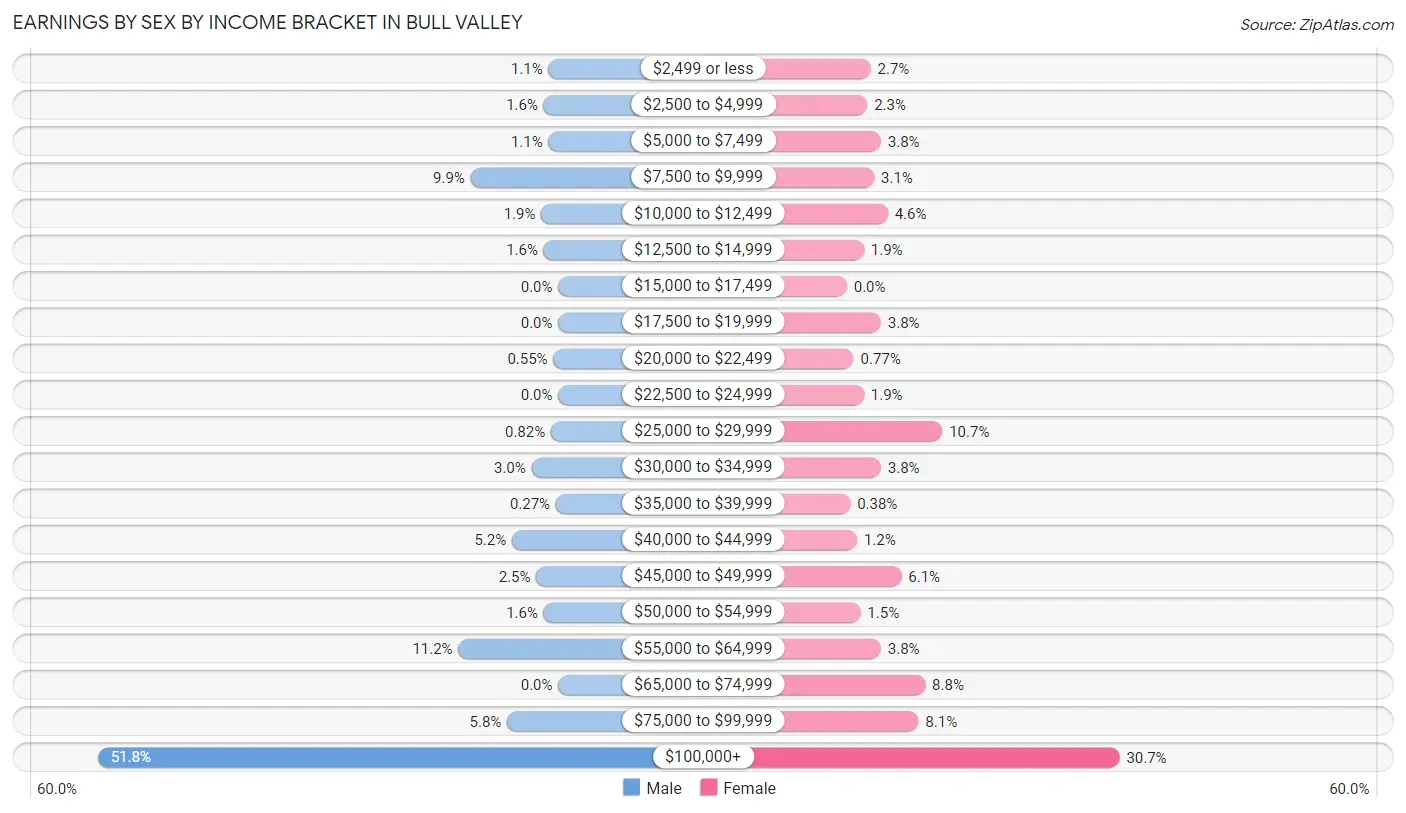
Earnings by Sex by Income Bracket in Bull Valley
The most common earnings brackets in Bull Valley are $100,000+ for men (189 | 51.8%) and $100,000+ for women (80 | 30.6%).
| Income | Male | Female |
| $2,499 or less | 4 (1.1%) | 7 (2.7%) |
| $2,500 to $4,999 | 6 (1.6%) | 6 (2.3%) |
| $5,000 to $7,499 | 4 (1.1%) | 10 (3.8%) |
| $7,500 to $9,999 | 36 (9.9%) | 8 (3.1%) |
| $10,000 to $12,499 | 7 (1.9%) | 12 (4.6%) |
| $12,500 to $14,999 | 6 (1.6%) | 5 (1.9%) |
| $15,000 to $17,499 | 0 (0.0%) | 0 (0.0%) |
| $17,500 to $19,999 | 0 (0.0%) | 10 (3.8%) |
| $20,000 to $22,499 | 2 (0.5%) | 2 (0.8%) |
| $22,500 to $24,999 | 0 (0.0%) | 5 (1.9%) |
| $25,000 to $29,999 | 3 (0.8%) | 28 (10.7%) |
| $30,000 to $34,999 | 11 (3.0%) | 10 (3.8%) |
| $35,000 to $39,999 | 1 (0.3%) | 1 (0.4%) |
| $40,000 to $44,999 | 19 (5.2%) | 3 (1.1%) |
| $45,000 to $49,999 | 9 (2.5%) | 16 (6.1%) |
| $50,000 to $54,999 | 6 (1.6%) | 4 (1.5%) |
| $55,000 to $64,999 | 41 (11.2%) | 10 (3.8%) |
| $65,000 to $74,999 | 0 (0.0%) | 23 (8.8%) |
| $75,000 to $99,999 | 21 (5.8%) | 21 (8.1%) |
| $100,000+ | 189 (51.8%) | 80 (30.6%) |
| Total | 365 (100.0%) | 261 (100.0%) |
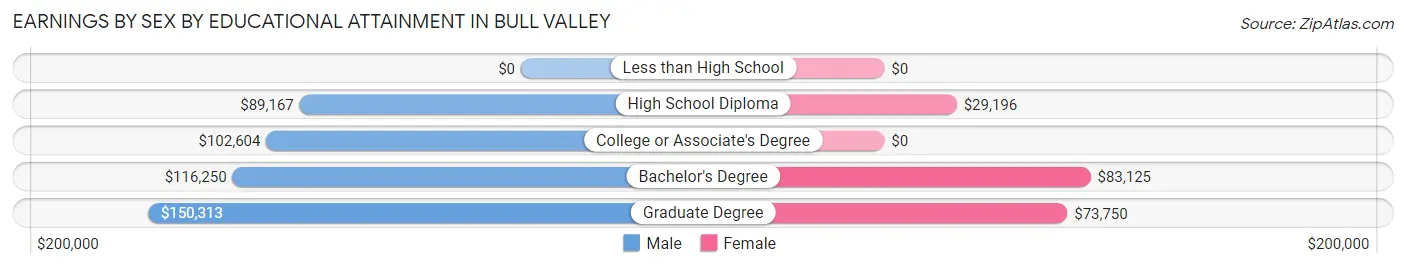
Earnings by Sex by Educational Attainment in Bull Valley
Average earnings in Bull Valley are $113,750 for men and $68,571 for women, a difference of 39.7%. Men with an educational attainment of graduate degree enjoy the highest average annual earnings of $150,313, while those with high school diploma education earn the least with $89,167. Women with an educational attainment of bachelor's degree earn the most with the average annual earnings of $83,125, while those with high school diploma education have the smallest earnings of $29,196.
| Educational Attainment | Male Income | Female Income |
| Less than High School | - | - |
| High School Diploma | $89,167 | $29,196 |
| College or Associate's Degree | $102,604 | $0 |
| Bachelor's Degree | $116,250 | $83,125 |
| Graduate Degree | $150,313 | $73,750 |
| Total | $113,750 | $68,571 |
Family Income in Bull Valley
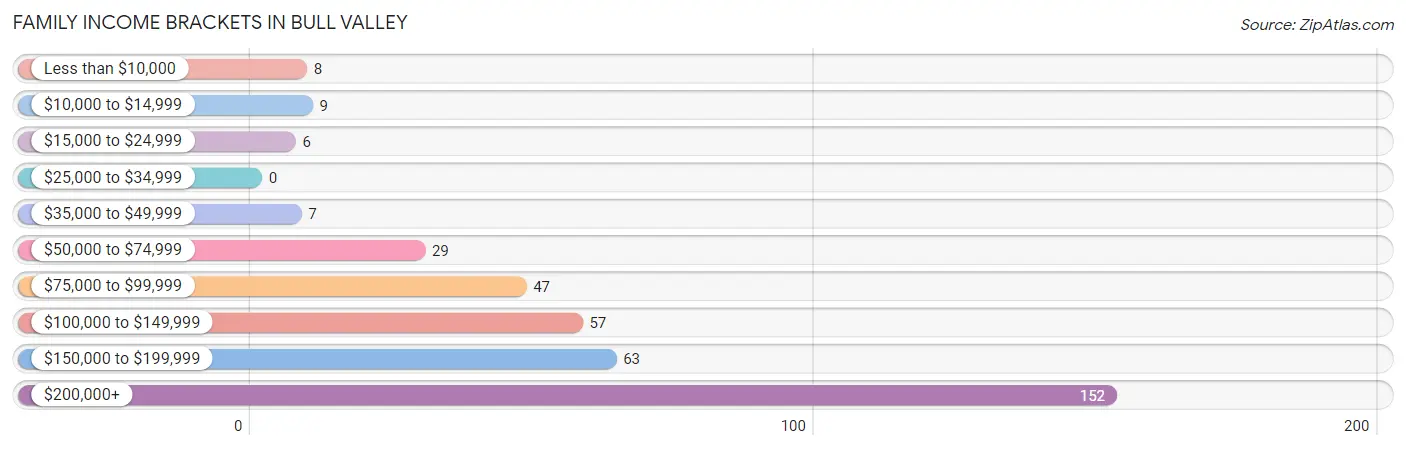
Family Income Brackets in Bull Valley
According to the Bull Valley family income data, there are 152 families falling into the $200,000+ income range, which is the most common income bracket and makes up 40.2% of all families.
| Income Bracket | # Families | % Families |
| Less than $10,000 | 8 | 2.1% |
| $10,000 to $14,999 | 9 | 2.4% |
| $15,000 to $24,999 | 6 | 1.6% |
| $25,000 to $34,999 | 0 | 0.0% |
| $35,000 to $49,999 | 7 | 1.9% |
| $50,000 to $74,999 | 29 | 7.7% |
| $75,000 to $99,999 | 47 | 12.4% |
| $100,000 to $149,999 | 57 | 15.1% |
| $150,000 to $199,999 | 63 | 16.7% |
| $200,000+ | 152 | 40.2% |
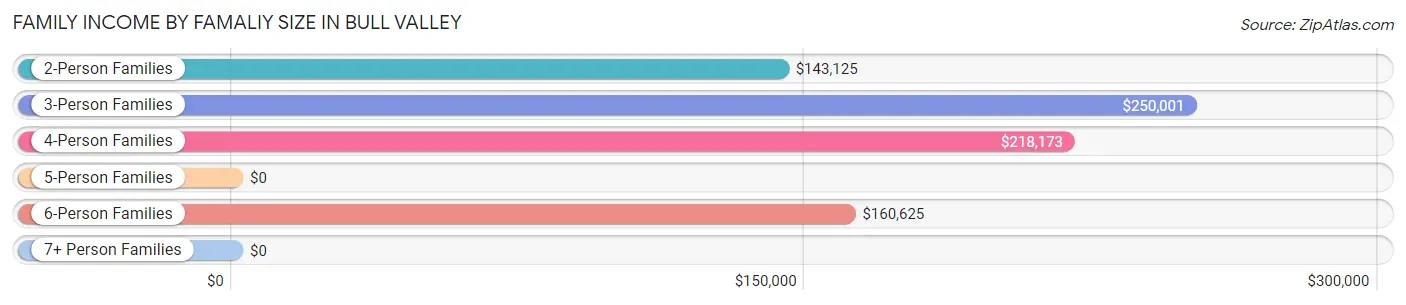
Family Income by Famaliy Size in Bull Valley
3-person families (73 | 19.3%) account for the highest median family income in Bull Valley with $250,001 per family, while 3-person families (73 | 19.3%) have the highest median income of $83,334 per family member.
| Income Bracket | # Families | Median Income |
| 2-Person Families | 243 (64.3%) | $143,125 |
| 3-Person Families | 73 (19.3%) | $250,001 |
| 4-Person Families | 43 (11.4%) | $218,173 |
| 5-Person Families | 9 (2.4%) | $0 |
| 6-Person Families | 10 (2.6%) | $160,625 |
| 7+ Person Families | 0 (0.0%) | $0 |
| Total | 378 (100.0%) | $168,750 |
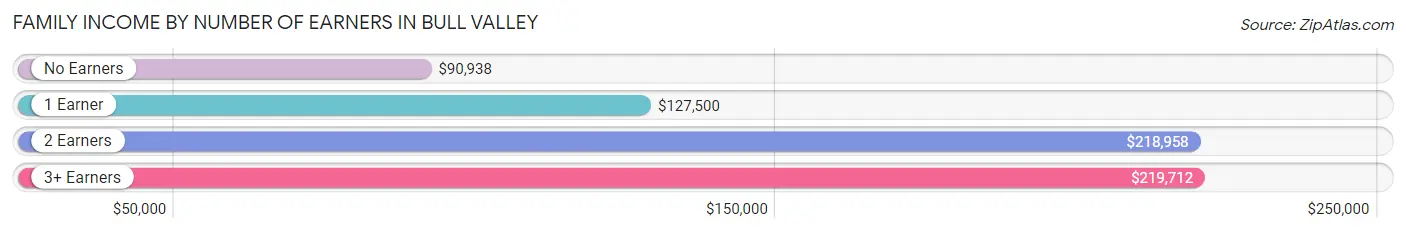
Family Income by Number of Earners in Bull Valley
The median family income in Bull Valley is $168,750, with families comprising 3+ earners (49) having the highest median family income of $219,712, while families with no earners (102) have the lowest median family income of $90,938, accounting for 13.0% and 27.0% of families, respectively.
| Number of Earners | # Families | Median Income |
| No Earners | 102 (27.0%) | $90,938 |
| 1 Earner | 106 (28.0%) | $127,500 |
| 2 Earners | 121 (32.0%) | $218,958 |
| 3+ Earners | 49 (13.0%) | $219,712 |
| Total | 378 (100.0%) | $168,750 |
Household Income in Bull Valley
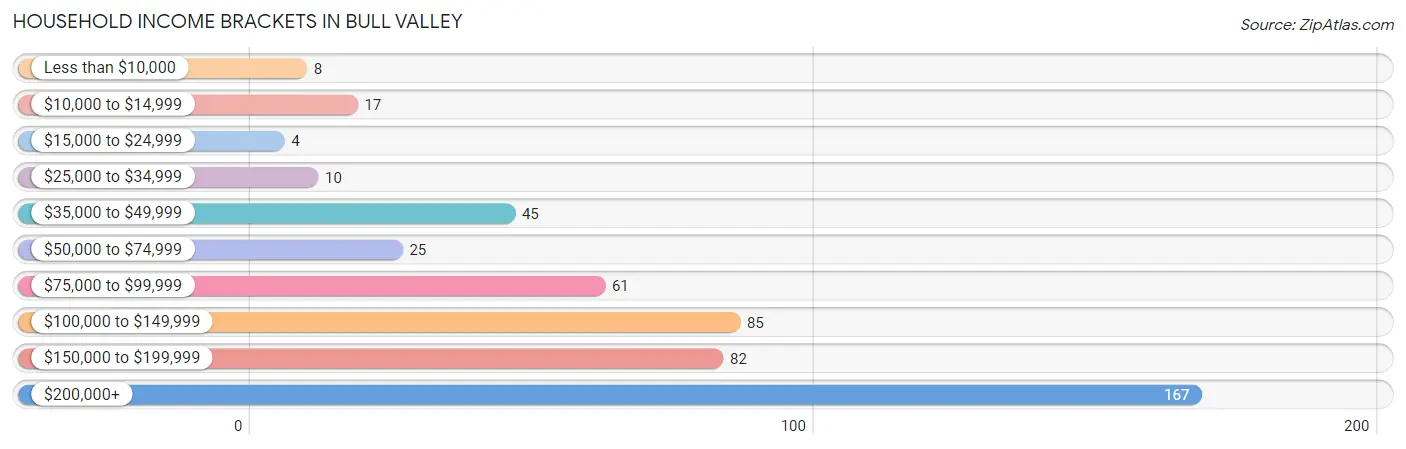
Household Income Brackets in Bull Valley
With 167 households falling in the category, the $200,000+ income range is the most frequent in Bull Valley, accounting for 33.1% of all households. In contrast, only 4 households (0.8%) fall into the $15,000 to $24,999 income bracket, making it the least populous group.
| Income Bracket | # Households | % Households |
| Less than $10,000 | 8 | 1.6% |
| $10,000 to $14,999 | 17 | 3.4% |
| $15,000 to $24,999 | 4 | 0.8% |
| $25,000 to $34,999 | 10 | 2.0% |
| $35,000 to $49,999 | 45 | 8.9% |
| $50,000 to $74,999 | 25 | 5.0% |
| $75,000 to $99,999 | 61 | 12.1% |
| $100,000 to $149,999 | 85 | 16.9% |
| $150,000 to $199,999 | 82 | 16.3% |
| $200,000+ | 167 | 33.1% |
Household Income by Householder Age in Bull Valley
The median household income in Bull Valley is $147,500, with the highest median household income of $197,813 found in the 25 to 44 years age bracket for the primary householder. A total of 43 households (8.5%) fall into this category.
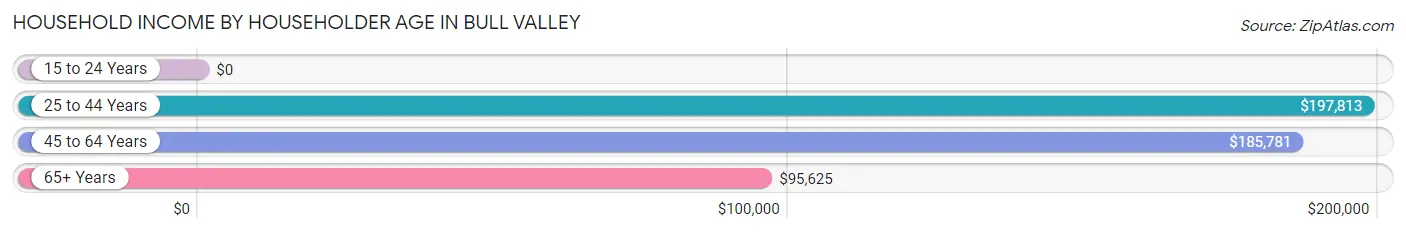
| Income Bracket | # Households | Median Income |
| 15 to 24 Years | 0 (0.0%) | $0 |
| 25 to 44 Years | 43 (8.5%) | $197,813 |
| 45 to 64 Years | 217 (43.1%) | $185,781 |
| 65+ Years | 244 (48.4%) | $95,625 |
| Total | 504 (100.0%) | $147,500 |
Poverty in Bull Valley
Income Below Poverty by Sex and Age in Bull Valley
With 3.0% poverty level for males and 9.5% for females among the residents of Bull Valley, 12 to 14 year old males and 45 to 54 year old females are the most vulnerable to poverty, with 4 males (100.0%) and 16 females (19.8%) in their respective age groups living below the poverty level.
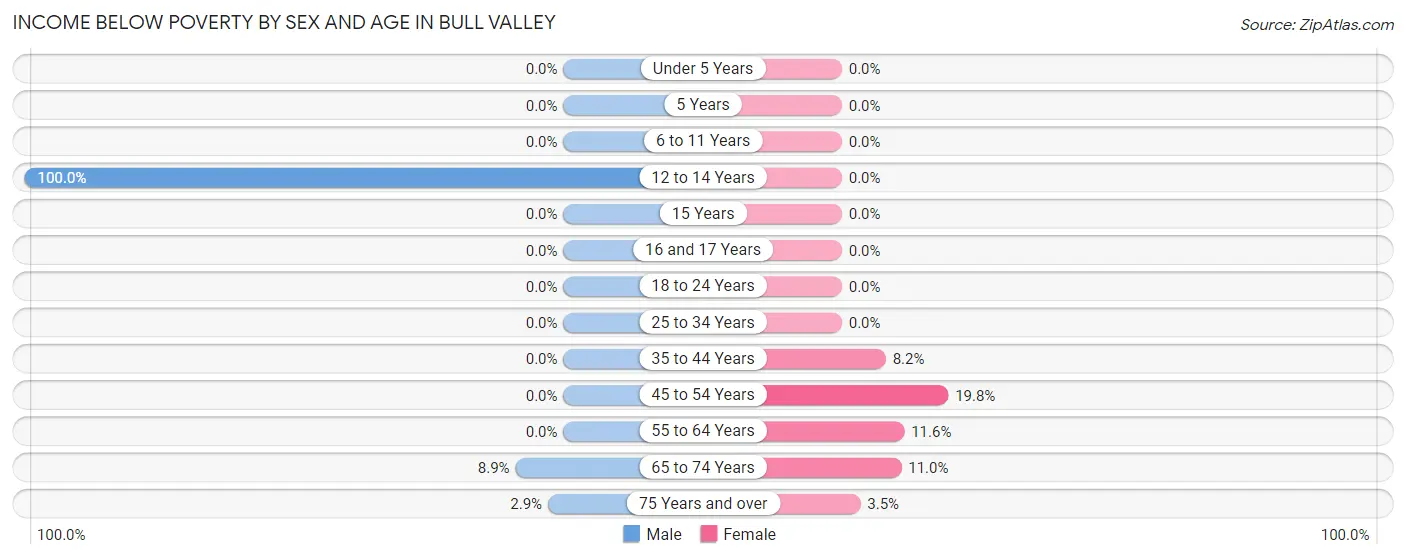
| Age Bracket | Male | Female |
| Under 5 Years | 0 (0.0%) | 0 (0.0%) |
| 5 Years | 0 (0.0%) | 0 (0.0%) |
| 6 to 11 Years | 0 (0.0%) | 0 (0.0%) |
| 12 to 14 Years | 4 (100.0%) | 0 (0.0%) |
| 15 Years | 0 (0.0%) | 0 (0.0%) |
| 16 and 17 Years | 0 (0.0%) | 0 (0.0%) |
| 18 to 24 Years | 0 (0.0%) | 0 (0.0%) |
| 25 to 34 Years | 0 (0.0%) | 0 (0.0%) |
| 35 to 44 Years | 0 (0.0%) | 4 (8.2%) |
| 45 to 54 Years | 0 (0.0%) | 16 (19.8%) |
| 55 to 64 Years | 0 (0.0%) | 19 (11.6%) |
| 65 to 74 Years | 13 (8.9%) | 17 (11.0%) |
| 75 Years and over | 2 (2.9%) | 2 (3.5%) |
| Total | 19 (3.0%) | 58 (9.5%) |
Income Above Poverty by Sex and Age in Bull Valley
According to the poverty statistics in Bull Valley, males aged under 5 years and females aged under 5 years are the age groups that are most secure financially, with 100.0% of males and 100.0% of females in these age groups living above the poverty line.
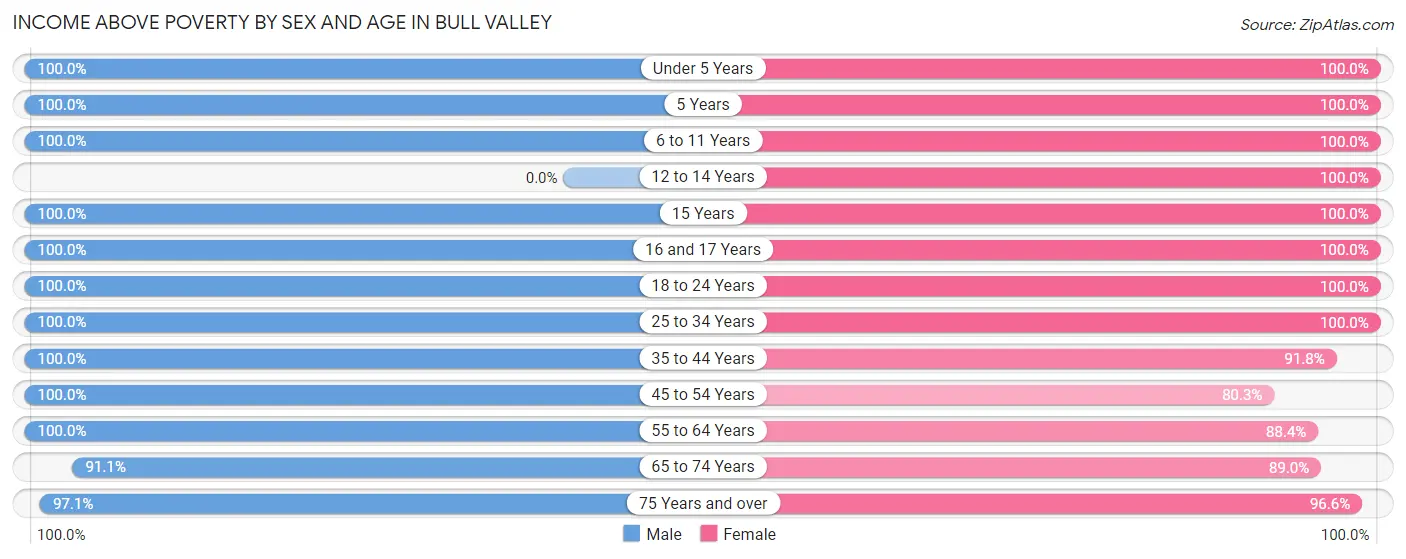
| Age Bracket | Male | Female |
| Under 5 Years | 5 (100.0%) | 27 (100.0%) |
| 5 Years | 8 (100.0%) | 2 (100.0%) |
| 6 to 11 Years | 3 (100.0%) | 9 (100.0%) |
| 12 to 14 Years | 0 (0.0%) | 15 (100.0%) |
| 15 Years | 2 (100.0%) | 2 (100.0%) |
| 16 and 17 Years | 17 (100.0%) | 7 (100.0%) |
| 18 to 24 Years | 88 (100.0%) | 20 (100.0%) |
| 25 to 34 Years | 28 (100.0%) | 25 (100.0%) |
| 35 to 44 Years | 46 (100.0%) | 45 (91.8%) |
| 45 to 54 Years | 79 (100.0%) | 65 (80.2%) |
| 55 to 64 Years | 129 (100.0%) | 145 (88.4%) |
| 65 to 74 Years | 133 (91.1%) | 137 (89.0%) |
| 75 Years and over | 68 (97.1%) | 56 (96.6%) |
| Total | 606 (97.0%) | 555 (90.5%) |
Income Below Poverty Among Married-Couple Families in Bull Valley
The poverty statistics for married-couple families in Bull Valley show that 4.6% or 17 of the total 366 families live below the poverty line. Families with no children have the highest poverty rate of 5.7%, comprising of 17 families. On the other hand, families with 1 or 2 children have the lowest poverty rate of 0.0%, which includes 0 families.
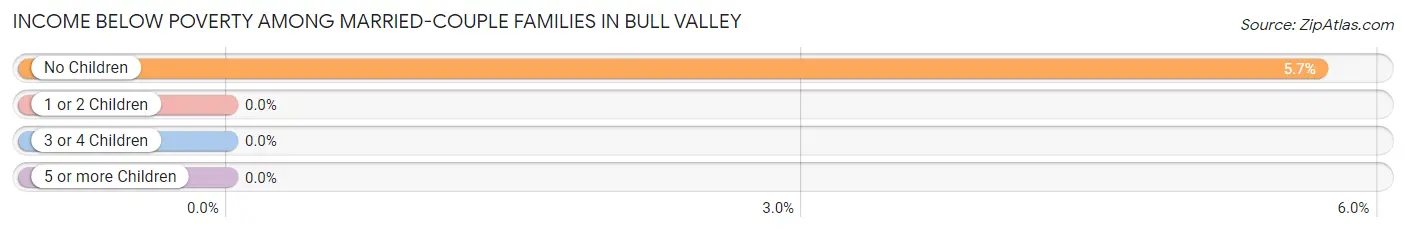
| Children | Above Poverty | Below Poverty |
| No Children | 282 (94.3%) | 17 (5.7%) |
| 1 or 2 Children | 65 (100.0%) | 0 (0.0%) |
| 3 or 4 Children | 2 (100.0%) | 0 (0.0%) |
| 5 or more Children | 0 (0.0%) | 0 (0.0%) |
| Total | 349 (95.4%) | 17 (4.6%) |
Income Below Poverty Among Single-Parent Households in Bull Valley
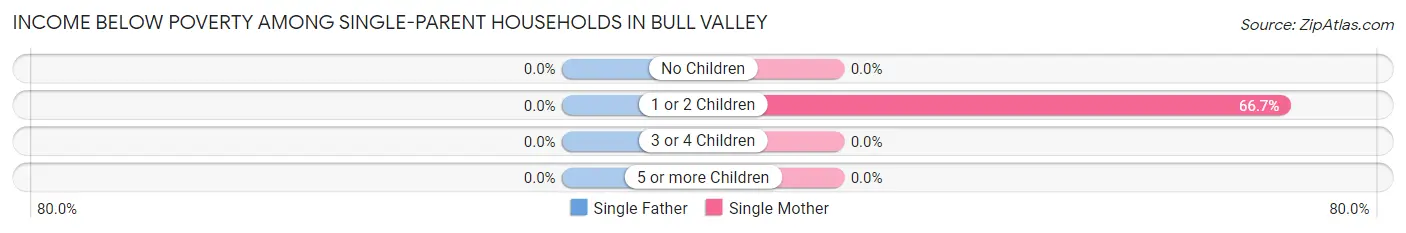
| Children | Single Father | Single Mother |
| No Children | 0 (0.0%) | 0 (0.0%) |
| 1 or 2 Children | 0 (0.0%) | 6 (66.7%) |
| 3 or 4 Children | 0 (0.0%) | 0 (0.0%) |
| 5 or more Children | 0 (0.0%) | 0 (0.0%) |
| Total | 0 (0.0%) | 6 (54.5%) |
Income Below Poverty Among Married-Couple vs Single-Parent Households in Bull Valley
The poverty data for Bull Valley shows that 17 of the married-couple family households (4.6%) and 6 of the single-parent households (50.0%) are living below the poverty level. Within the married-couple family households, those with no children have the highest poverty rate, with 17 households (5.7%) falling below the poverty line. Among the single-parent households, those with 1 or 2 children have the highest poverty rate, with 6 household (60.0%) living below poverty.
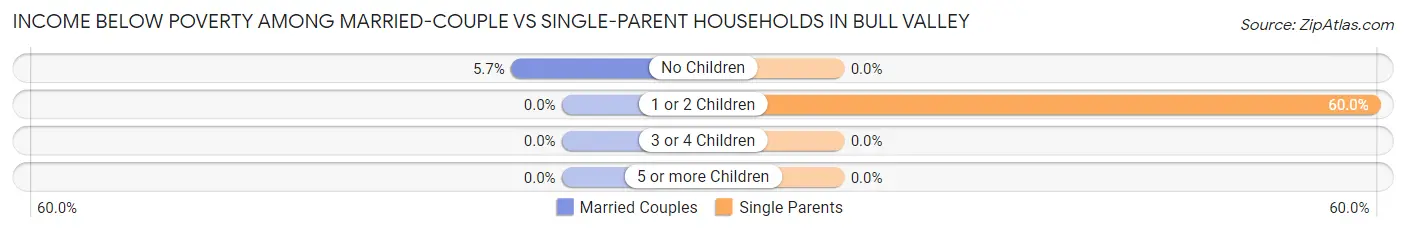
| Children | Married-Couple Families | Single-Parent Households |
| No Children | 17 (5.7%) | 0 (0.0%) |
| 1 or 2 Children | 0 (0.0%) | 6 (60.0%) |
| 3 or 4 Children | 0 (0.0%) | 0 (0.0%) |
| 5 or more Children | 0 (0.0%) | 0 (0.0%) |
| Total | 17 (4.6%) | 6 (50.0%) |
Race in Bull Valley
The most populous races in Bull Valley are White / Caucasian (1,093 | 87.6%), Hispanic or Latino (140 | 11.2%), and Two or more Races (71 | 5.7%).
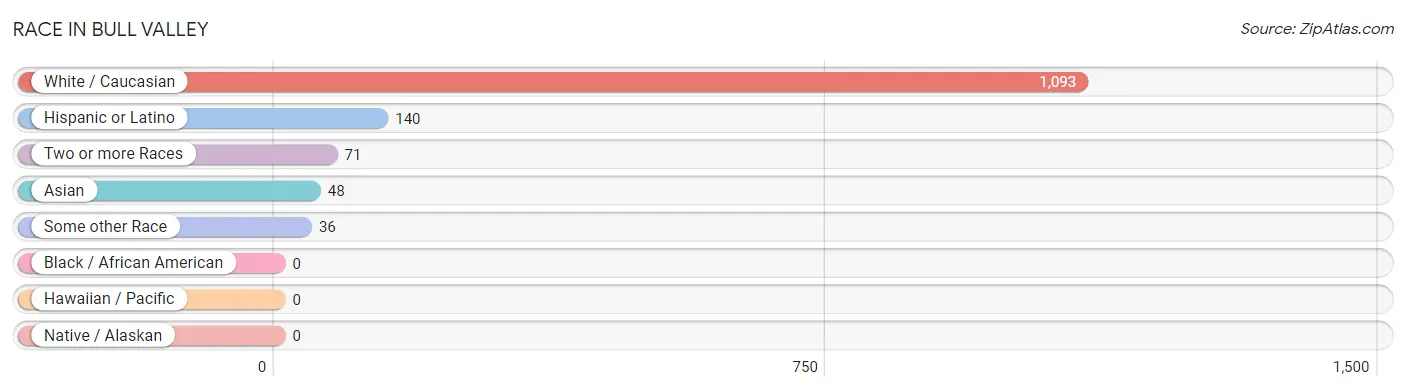
| Race | # Population | % Population |
| Asian | 48 | 3.8% |
| Black / African American | 0 | 0.0% |
| Hawaiian / Pacific | 0 | 0.0% |
| Hispanic or Latino | 140 | 11.2% |
| Native / Alaskan | 0 | 0.0% |
| White / Caucasian | 1,093 | 87.6% |
| Two or more Races | 71 | 5.7% |
| Some other Race | 36 | 2.9% |
| Total | 1,248 | 100.0% |
Ancestry in Bull Valley
The most populous ancestries reported in Bull Valley are German (325 | 26.0%), Irish (186 | 14.9%), Polish (138 | 11.1%), Italian (112 | 9.0%), and English (104 | 8.3%), together accounting for 69.3% of all Bull Valley residents.
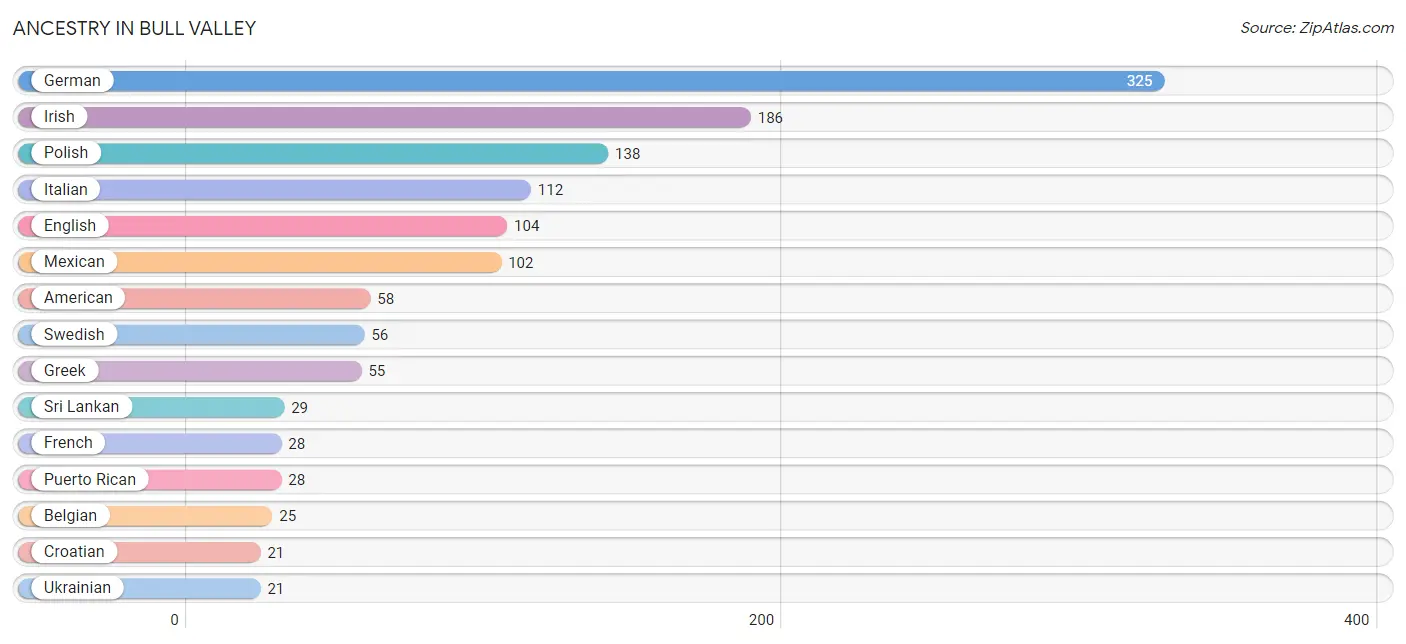
| Ancestry | # Population | % Population |
| American | 58 | 4.6% |
| Arab | 4 | 0.3% |
| Armenian | 4 | 0.3% |
| Belgian | 25 | 2.0% |
| British | 14 | 1.1% |
| Burmese | 9 | 0.7% |
| Canadian | 2 | 0.2% |
| Celtic | 10 | 0.8% |
| Croatian | 21 | 1.7% |
| Cuban | 10 | 0.8% |
| Czech | 15 | 1.2% |
| Danish | 7 | 0.6% |
| Dutch | 16 | 1.3% |
| Eastern European | 2 | 0.2% |
| English | 104 | 8.3% |
| European | 17 | 1.4% |
| French | 28 | 2.2% |
| German | 325 | 26.0% |
| Greek | 55 | 4.4% |
| Indian (Asian) | 2 | 0.2% |
| Irish | 186 | 14.9% |
| Italian | 112 | 9.0% |
| Korean | 11 | 0.9% |
| Lebanese | 4 | 0.3% |
| Lithuanian | 12 | 1.0% |
| Maltese | 3 | 0.2% |
| Mexican | 102 | 8.2% |
| Northern European | 13 | 1.0% |
| Norwegian | 6 | 0.5% |
| Polish | 138 | 11.1% |
| Puerto Rican | 28 | 2.2% |
| Romanian | 2 | 0.2% |
| Russian | 7 | 0.6% |
| Scandinavian | 8 | 0.6% |
| Scotch-Irish | 9 | 0.7% |
| Scottish | 14 | 1.1% |
| Slovak | 2 | 0.2% |
| Sri Lankan | 29 | 2.3% |
| Swedish | 56 | 4.5% |
| Swiss | 8 | 0.6% |
| Thai | 7 | 0.6% |
| Ukrainian | 21 | 1.7% | View All 42 Rows |
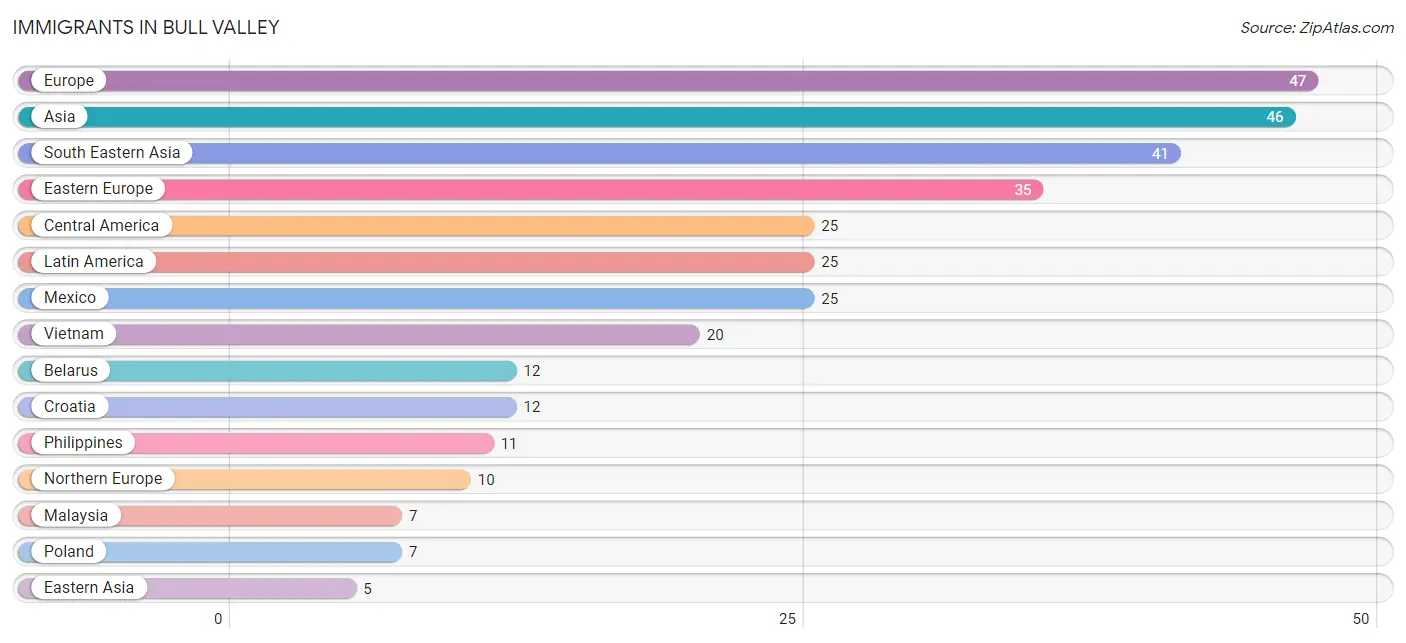
Immigrants in Bull Valley
The most numerous immigrant groups reported in Bull Valley came from Europe (47 | 3.8%), Asia (46 | 3.7%), South Eastern Asia (41 | 3.3%), Eastern Europe (35 | 2.8%), and Central America (25 | 2.0%), together accounting for 15.5% of all Bull Valley residents.
| Immigration Origin | # Population | % Population |
| Asia | 46 | 3.7% |
| Belarus | 12 | 1.0% |
| Canada | 3 | 0.2% |
| Central America | 25 | 2.0% |
| China | 2 | 0.2% |
| Croatia | 12 | 1.0% |
| Eastern Asia | 5 | 0.4% |
| Eastern Europe | 35 | 2.8% |
| England | 4 | 0.3% |
| Europe | 47 | 3.8% |
| Germany | 2 | 0.2% |
| Korea | 3 | 0.2% |
| Latin America | 25 | 2.0% |
| Malaysia | 7 | 0.6% |
| Mexico | 25 | 2.0% |
| Northern Europe | 10 | 0.8% |
| Philippines | 11 | 0.9% |
| Poland | 7 | 0.6% |
| Scotland | 4 | 0.3% |
| Singapore | 3 | 0.2% |
| South Eastern Asia | 41 | 3.3% |
| Taiwan | 2 | 0.2% |
| Ukraine | 4 | 0.3% |
| Vietnam | 20 | 1.6% |
| Western Europe | 2 | 0.2% | View All 25 Rows |
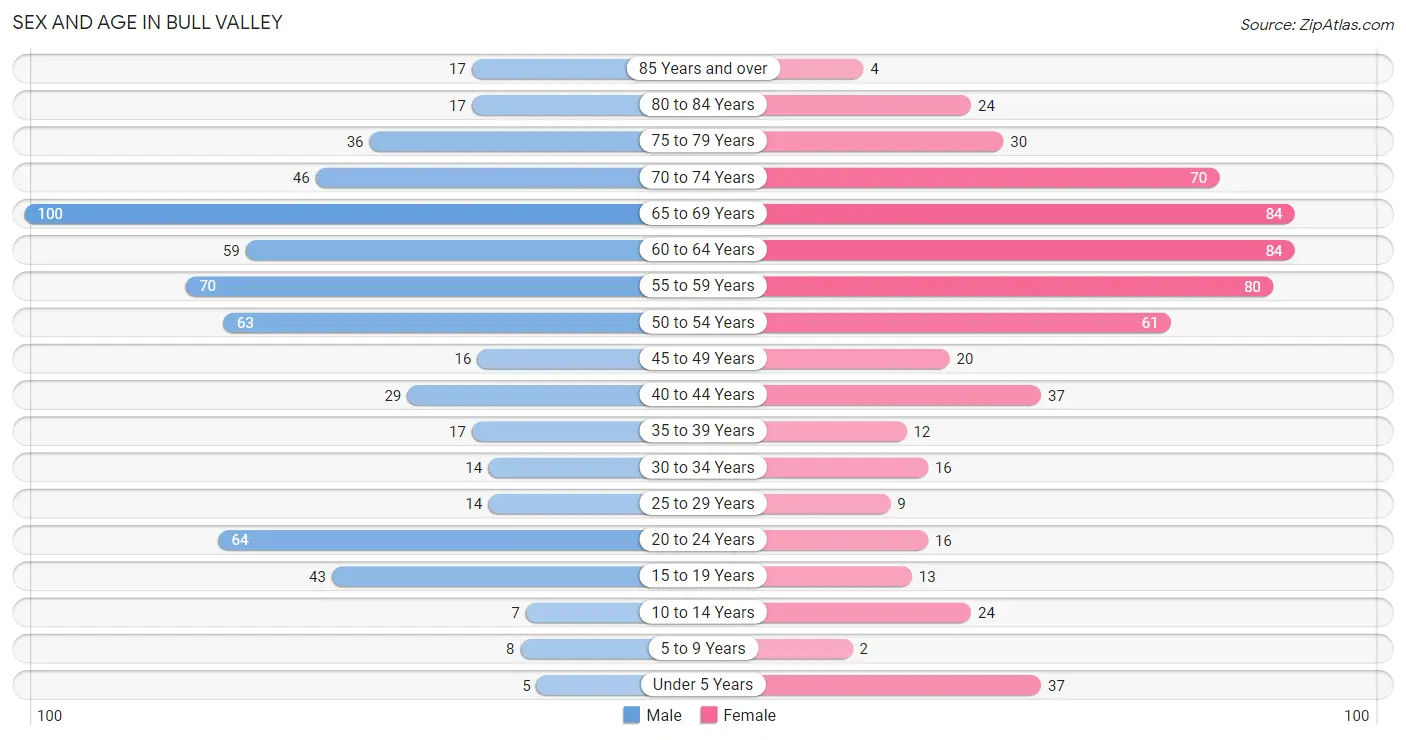
Sex and Age in Bull Valley
Sex and Age in Bull Valley
The most populous age groups in Bull Valley are 65 to 69 Years (100 | 16.0%) for men and 60 to 64 Years (84 | 13.5%) for women.
| Age Bracket | Male | Female |
| Under 5 Years | 5 (0.8%) | 37 (5.9%) |
| 5 to 9 Years | 8 (1.3%) | 2 (0.3%) |
| 10 to 14 Years | 7 (1.1%) | 24 (3.8%) |
| 15 to 19 Years | 43 (6.9%) | 13 (2.1%) |
| 20 to 24 Years | 64 (10.2%) | 16 (2.6%) |
| 25 to 29 Years | 14 (2.2%) | 9 (1.4%) |
| 30 to 34 Years | 14 (2.2%) | 16 (2.6%) |
| 35 to 39 Years | 17 (2.7%) | 12 (1.9%) |
| 40 to 44 Years | 29 (4.6%) | 37 (5.9%) |
| 45 to 49 Years | 16 (2.6%) | 20 (3.2%) |
| 50 to 54 Years | 63 (10.1%) | 61 (9.8%) |
| 55 to 59 Years | 70 (11.2%) | 80 (12.8%) |
| 60 to 64 Years | 59 (9.4%) | 84 (13.5%) |
| 65 to 69 Years | 100 (16.0%) | 84 (13.5%) |
| 70 to 74 Years | 46 (7.4%) | 70 (11.2%) |
| 75 to 79 Years | 36 (5.8%) | 30 (4.8%) |
| 80 to 84 Years | 17 (2.7%) | 24 (3.8%) |
| 85 Years and over | 17 (2.7%) | 4 (0.6%) |
| Total | 625 (100.0%) | 623 (100.0%) |
Families and Households in Bull Valley
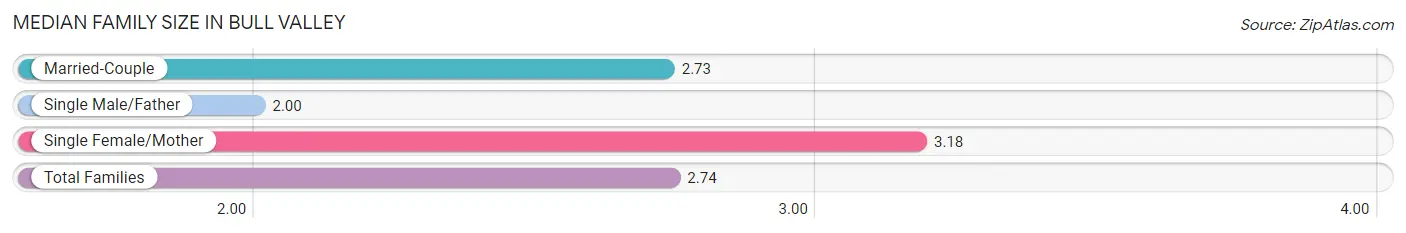
Median Family Size in Bull Valley
The median family size in Bull Valley is 2.74 persons per family, with single female/mother families (11 | 2.9%) accounting for the largest median family size of 3.18 persons per family. On the other hand, single male/father families (1 | 0.3%) represent the smallest median family size with 2.00 persons per family.
| Family Type | # Families | Family Size |
| Married-Couple | 366 (96.8%) | 2.73 |
| Single Male/Father | 1 (0.3%) | 2.00 |
| Single Female/Mother | 11 (2.9%) | 3.18 |
| Total Families | 378 (100.0%) | 2.74 |
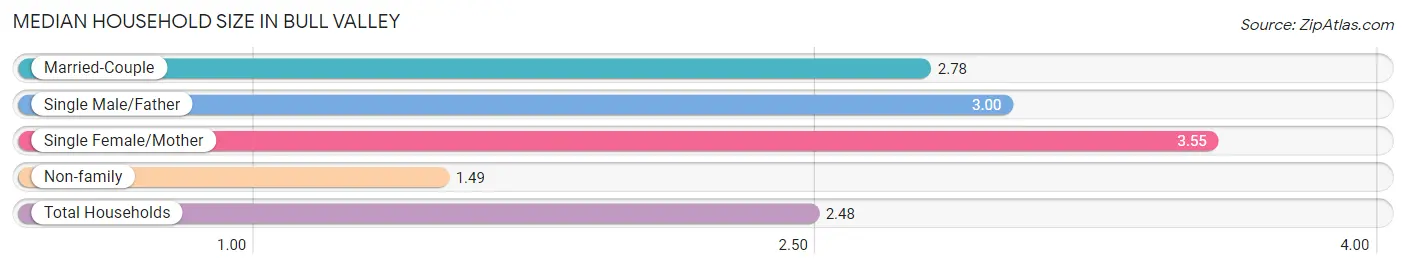
Median Household Size in Bull Valley
The median household size in Bull Valley is 2.48 persons per household, with single female/mother households (11 | 2.2%) accounting for the largest median household size of 3.55 persons per household. non-family households (126 | 25.0%) represent the smallest median household size with 1.49 persons per household.
| Household Type | # Households | Household Size |
| Married-Couple | 366 (72.6%) | 2.78 |
| Single Male/Father | 1 (0.2%) | 3.00 |
| Single Female/Mother | 11 (2.2%) | 3.55 |
| Non-family | 126 (25.0%) | 1.49 |
| Total Households | 504 (100.0%) | 2.48 |
Household Size by Marriage Status in Bull Valley
Out of a total of 504 households in Bull Valley, 378 (75.0%) are family households, while 126 (25.0%) are nonfamily households. The most numerous type of family households are 2-person households, comprising 236, and the most common type of nonfamily households are 1-person households, comprising 100.
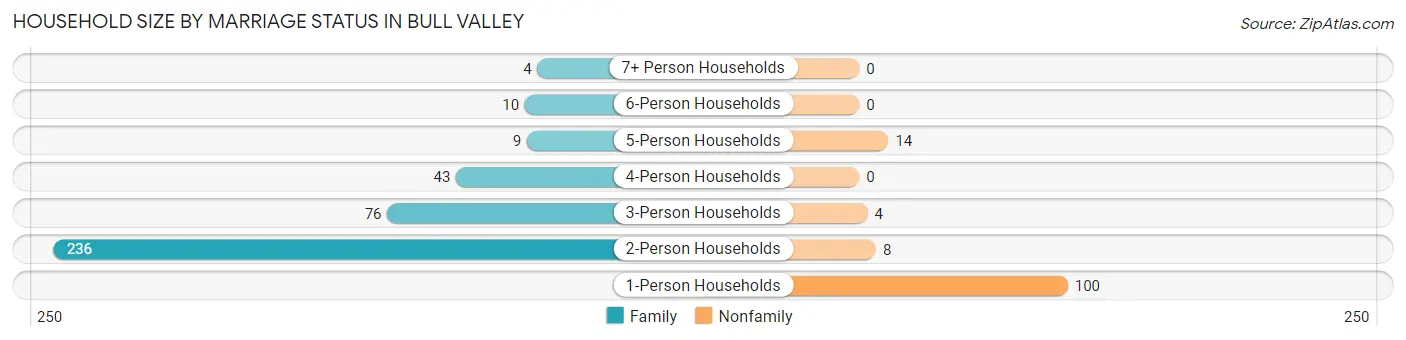
| Household Size | Family Households | Nonfamily Households |
| 1-Person Households | - | 100 (19.8%) |
| 2-Person Households | 236 (46.8%) | 8 (1.6%) |
| 3-Person Households | 76 (15.1%) | 4 (0.8%) |
| 4-Person Households | 43 (8.5%) | 0 (0.0%) |
| 5-Person Households | 9 (1.8%) | 14 (2.8%) |
| 6-Person Households | 10 (2.0%) | 0 (0.0%) |
| 7+ Person Households | 4 (0.8%) | 0 (0.0%) |
| Total | 378 (75.0%) | 126 (25.0%) |
Female Fertility in Bull Valley
Fertility by Age in Bull Valley
Average fertility rate in Bull Valley is 38.0 births per 1,000 women. Women in the age bracket of 20 to 34 years have the highest fertility rate with 122.0 births per 1,000 women. Women in the age bracket of 20 to 34 years acount for 100.0% of all women with births.
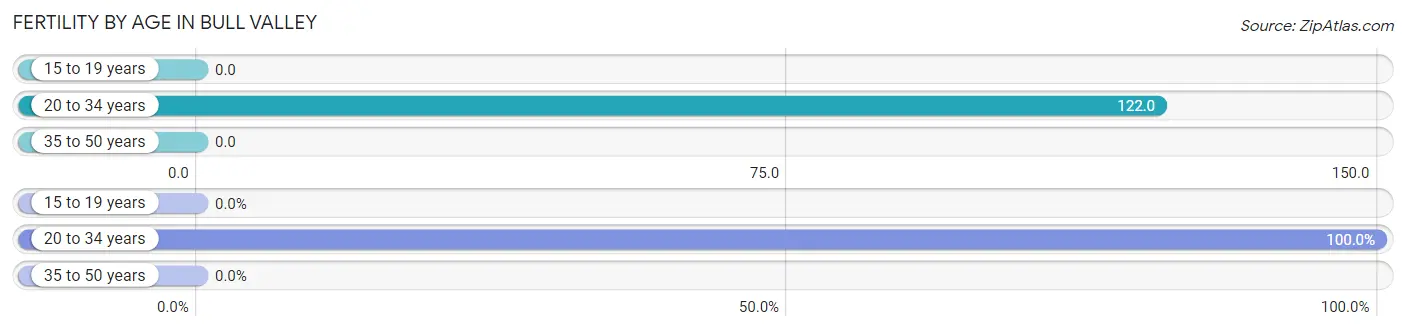
| Age Bracket | Women with Births | Births / 1,000 Women |
| 15 to 19 years | 0 (0.0%) | 0.0 |
| 20 to 34 years | 5 (100.0%) | 122.0 |
| 35 to 50 years | 0 (0.0%) | 0.0 |
| Total | 5 (100.0%) | 38.0 |
Fertility by Age by Marriage Status in Bull Valley
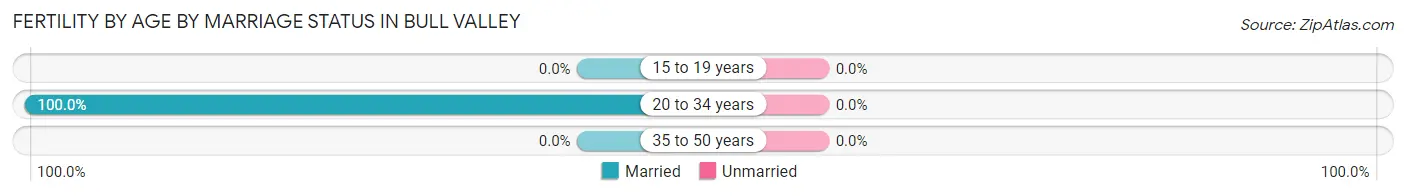
| Age Bracket | Married | Unmarried |
| 15 to 19 years | 0 (0.0%) | 0 (0.0%) |
| 20 to 34 years | 5 (100.0%) | 0 (0.0%) |
| 35 to 50 years | 0 (0.0%) | 0 (0.0%) |
| Total | 5 (100.0%) | 0 (0.0%) |
Fertility by Education in Bull Valley
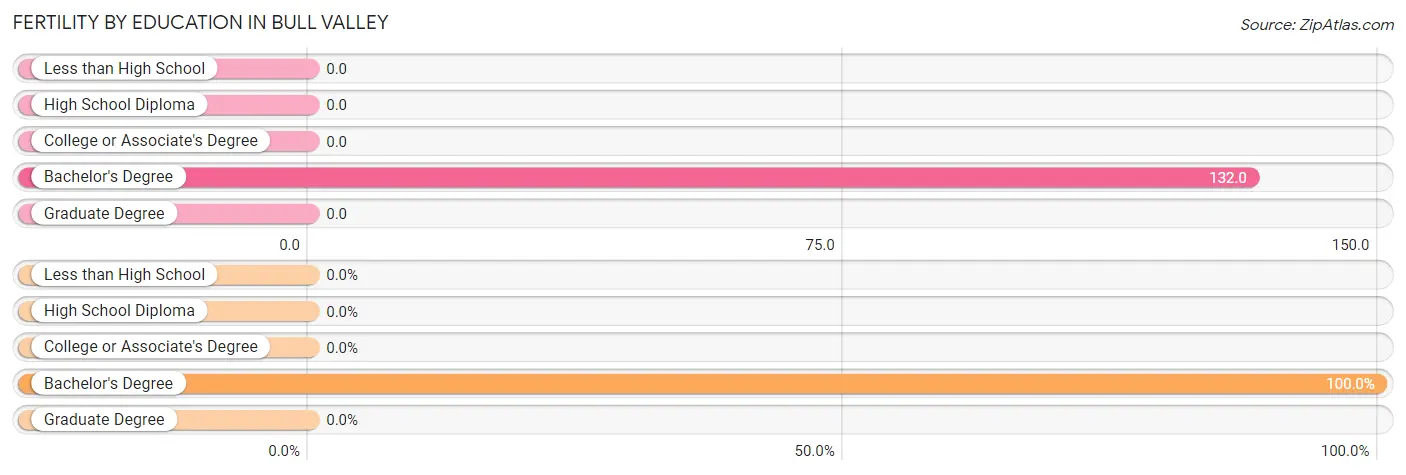
| Educational Attainment | Women with Births | Births / 1,000 Women |
| Less than High School | 0 (0.0%) | 0.0 |
| High School Diploma | 0 (0.0%) | 0.0 |
| College or Associate's Degree | 0 (0.0%) | 0.0 |
| Bachelor's Degree | 5 (100.0%) | 132.0 |
| Graduate Degree | 0 (0.0%) | 0.0 |
| Total | 5 (100.0%) | 38.0 |
Fertility by Education by Marriage Status in Bull Valley
| Educational Attainment | Married | Unmarried |
| Less than High School | 0 (0.0%) | 0 (0.0%) |
| High School Diploma | 0 (0.0%) | 0 (0.0%) |
| College or Associate's Degree | 0 (0.0%) | 0 (0.0%) |
| Bachelor's Degree | 5 (100.0%) | 0 (0.0%) |
| Graduate Degree | 0 (0.0%) | 0 (0.0%) |
| Total | 5 (100.0%) | 0 (0.0%) |
Employment Characteristics in Bull Valley
Employment by Class of Employer in Bull Valley
Among the 565 employed individuals in Bull Valley, private company employees (386 | 68.3%), self-employed (incorporated) (45 | 8.0%), and self-employed (not incorporated) (37 | 6.6%) make up the most common classes of employment.
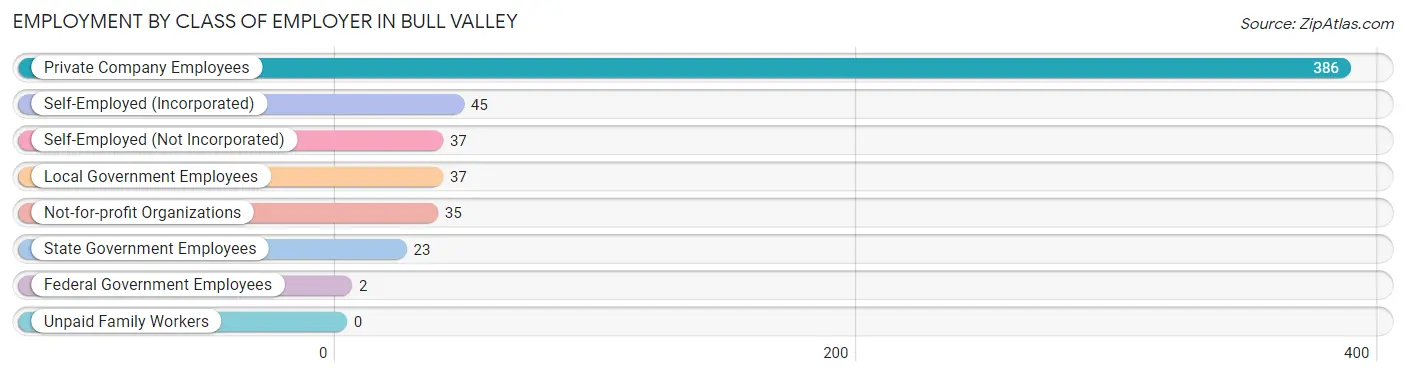
| Employer Class | # Employees | % Employees |
| Private Company Employees | 386 | 68.3% |
| Self-Employed (Incorporated) | 45 | 8.0% |
| Self-Employed (Not Incorporated) | 37 | 6.6% |
| Not-for-profit Organizations | 35 | 6.2% |
| Local Government Employees | 37 | 6.6% |
| State Government Employees | 23 | 4.1% |
| Federal Government Employees | 2 | 0.4% |
| Unpaid Family Workers | 0 | 0.0% |
| Total | 565 | 100.0% |
Employment Status by Age in Bull Valley
According to the labor force statistics for Bull Valley, out of the total population over 16 years of age (1,161), 52.1% or 605 individuals are in the labor force, with 5.1% or 31 of them unemployed. The age group with the highest labor force participation rate is 25 to 29 years, with 100.0% or 23 individuals in the labor force. Within the labor force, the 55 to 59 years age range has the highest percentage of unemployed individuals, with 19.3% or 17 of them being unemployed.
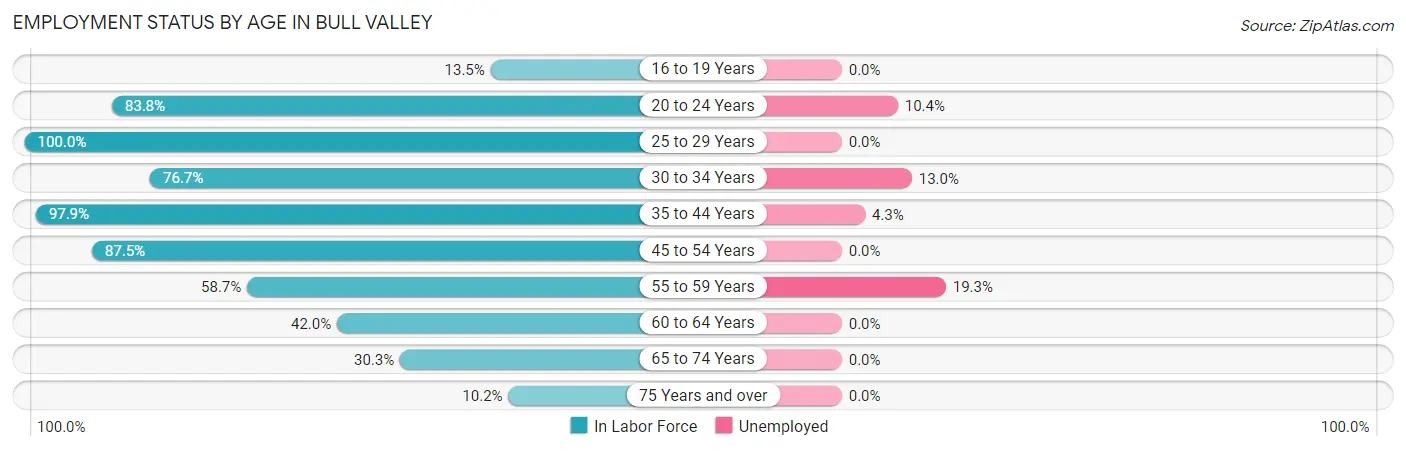
| Age Bracket | In Labor Force | Unemployed |
| 16 to 19 Years | 7 (13.5%) | 0 (0.0%) |
| 20 to 24 Years | 67 (83.8%) | 7 (10.4%) |
| 25 to 29 Years | 23 (100.0%) | 0 (0.0%) |
| 30 to 34 Years | 23 (76.7%) | 3 (13.0%) |
| 35 to 44 Years | 93 (97.9%) | 4 (4.3%) |
| 45 to 54 Years | 140 (87.5%) | 0 (0.0%) |
| 55 to 59 Years | 88 (58.7%) | 17 (19.3%) |
| 60 to 64 Years | 60 (42.0%) | 0 (0.0%) |
| 65 to 74 Years | 91 (30.3%) | 0 (0.0%) |
| 75 Years and over | 13 (10.2%) | 0 (0.0%) |
| Total | 605 (52.1%) | 31 (5.1%) |
Employment Status by Educational Attainment in Bull Valley
According to labor force statistics for Bull Valley, 71.0% of individuals (427) out of the total population between 25 and 64 years of age (601) are in the labor force, with 5.6% or 24 of them being unemployed. The group with the highest labor force participation rate are those with the educational attainment of college / associate degree, with 76.4% or 107 individuals in the labor force. Within the labor force, individuals with less than high school education have the highest percentage of unemployment, with 41.2% or 7 of them being unemployed.
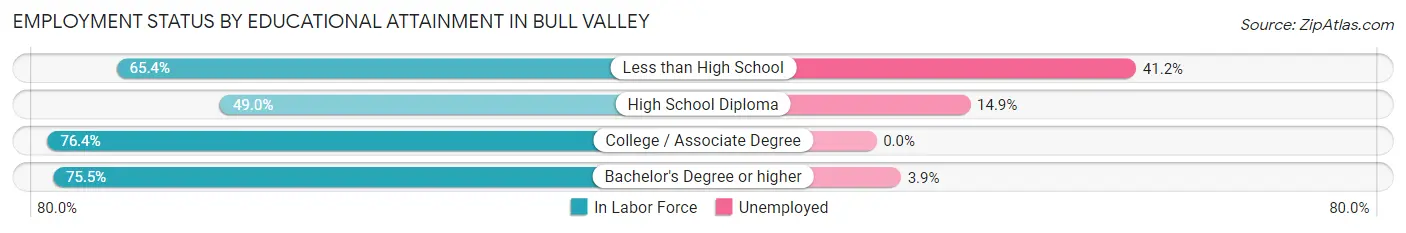
| Educational Attainment | In Labor Force | Unemployed |
| Less than High School | 17 (65.4%) | 11 (41.2%) |
| High School Diploma | 47 (49.0%) | 14 (14.9%) |
| College / Associate Degree | 107 (76.4%) | 0 (0.0%) |
| Bachelor's Degree or higher | 256 (75.5%) | 13 (3.9%) |
| Total | 427 (71.0%) | 34 (5.6%) |
Employment Occupations by Sex in Bull Valley
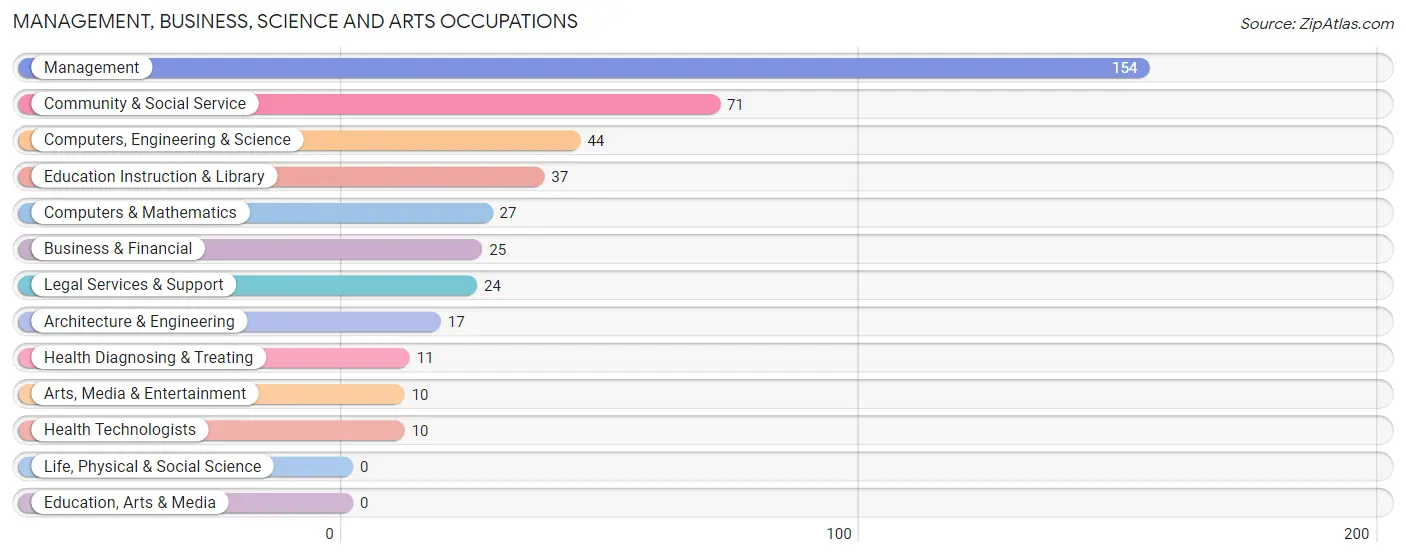
Management, Business, Science and Arts Occupations
The most common Management, Business, Science and Arts occupations in Bull Valley are Management (154 | 26.8%), Community & Social Service (71 | 12.4%), Computers, Engineering & Science (44 | 7.7%), Education Instruction & Library (37 | 6.5%), and Computers & Mathematics (27 | 4.7%).
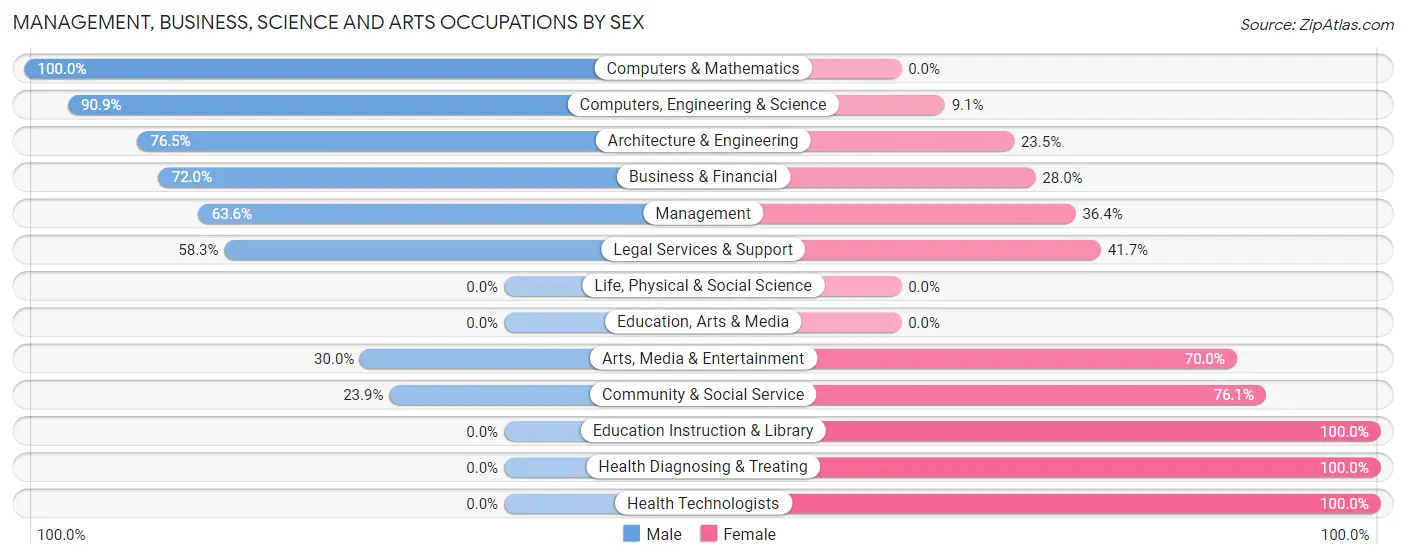
Management, Business, Science and Arts Occupations by Sex
Within the Management, Business, Science and Arts occupations in Bull Valley, the most male-oriented occupations are Computers & Mathematics (100.0%), Computers, Engineering & Science (90.9%), and Architecture & Engineering (76.5%), while the most female-oriented occupations are Education Instruction & Library (100.0%), Health Diagnosing & Treating (100.0%), and Health Technologists (100.0%).
| Occupation | Male | Female |
| Management | 98 (63.6%) | 56 (36.4%) |
| Business & Financial | 18 (72.0%) | 7 (28.0%) |
| Computers, Engineering & Science | 40 (90.9%) | 4 (9.1%) |
| Computers & Mathematics | 27 (100.0%) | 0 (0.0%) |
| Architecture & Engineering | 13 (76.5%) | 4 (23.5%) |
| Life, Physical & Social Science | 0 (0.0%) | 0 (0.0%) |
| Community & Social Service | 17 (23.9%) | 54 (76.1%) |
| Education, Arts & Media | 0 (0.0%) | 0 (0.0%) |
| Legal Services & Support | 14 (58.3%) | 10 (41.7%) |
| Education Instruction & Library | 0 (0.0%) | 37 (100.0%) |
| Arts, Media & Entertainment | 3 (30.0%) | 7 (70.0%) |
| Health Diagnosing & Treating | 0 (0.0%) | 11 (100.0%) |
| Health Technologists | 0 (0.0%) | 10 (100.0%) |
| Total (Category) | 173 (56.7%) | 132 (43.3%) |
| Total (Overall) | 343 (59.8%) | 231 (40.2%) |
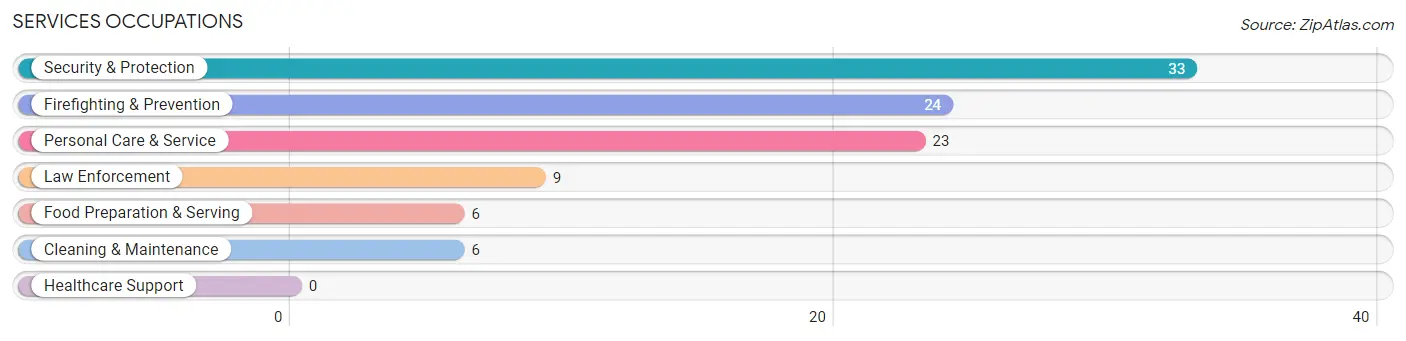
Services Occupations
The most common Services occupations in Bull Valley are Security & Protection (33 | 5.8%), Firefighting & Prevention (24 | 4.2%), Personal Care & Service (23 | 4.0%), Law Enforcement (9 | 1.6%), and Food Preparation & Serving (6 | 1.1%).
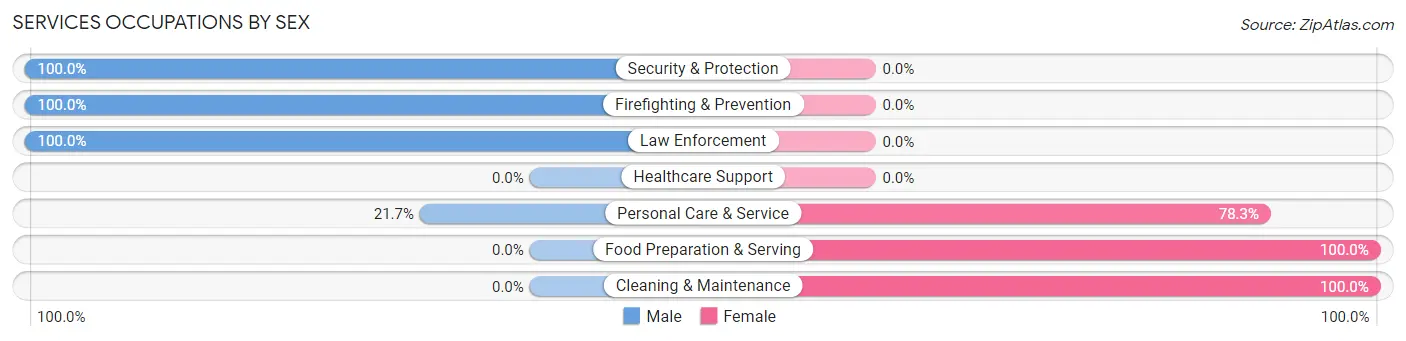
Services Occupations by Sex
Within the Services occupations in Bull Valley, the most male-oriented occupations are Security & Protection (100.0%), Firefighting & Prevention (100.0%), and Law Enforcement (100.0%), while the most female-oriented occupations are Food Preparation & Serving (100.0%), Cleaning & Maintenance (100.0%), and Personal Care & Service (78.3%).
| Occupation | Male | Female |
| Healthcare Support | 0 (0.0%) | 0 (0.0%) |
| Security & Protection | 33 (100.0%) | 0 (0.0%) |
| Firefighting & Prevention | 24 (100.0%) | 0 (0.0%) |
| Law Enforcement | 9 (100.0%) | 0 (0.0%) |
| Food Preparation & Serving | 0 (0.0%) | 6 (100.0%) |
| Cleaning & Maintenance | 0 (0.0%) | 6 (100.0%) |
| Personal Care & Service | 5 (21.7%) | 18 (78.3%) |
| Total (Category) | 38 (55.9%) | 30 (44.1%) |
| Total (Overall) | 343 (59.8%) | 231 (40.2%) |
Sales and Office Occupations
The most common Sales and Office occupations in Bull Valley are Sales & Related (70 | 12.2%), and Office & Administration (29 | 5.1%).
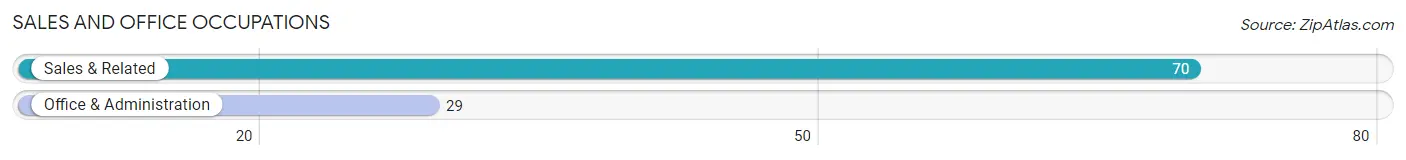
Sales and Office Occupations by Sex
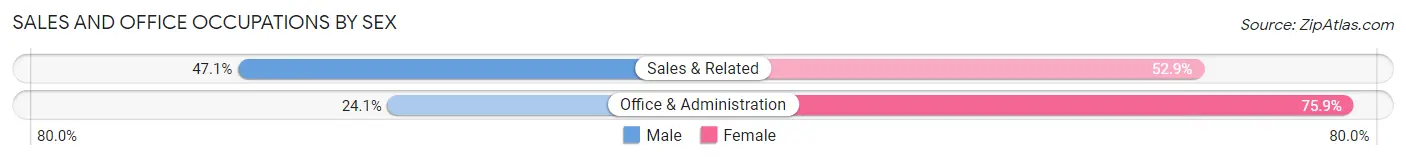
| Occupation | Male | Female |
| Sales & Related | 33 (47.1%) | 37 (52.9%) |
| Office & Administration | 7 (24.1%) | 22 (75.9%) |
| Total (Category) | 40 (40.4%) | 59 (59.6%) |
| Total (Overall) | 343 (59.8%) | 231 (40.2%) |
Natural Resources, Construction and Maintenance Occupations
The most common Natural Resources, Construction and Maintenance occupations in Bull Valley are Construction & Extraction (25 | 4.4%), and Installation, Maintenance & Repair (23 | 4.0%).
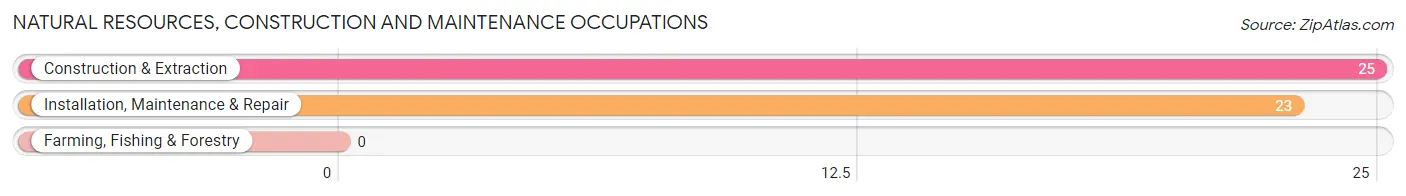
Natural Resources, Construction and Maintenance Occupations by Sex
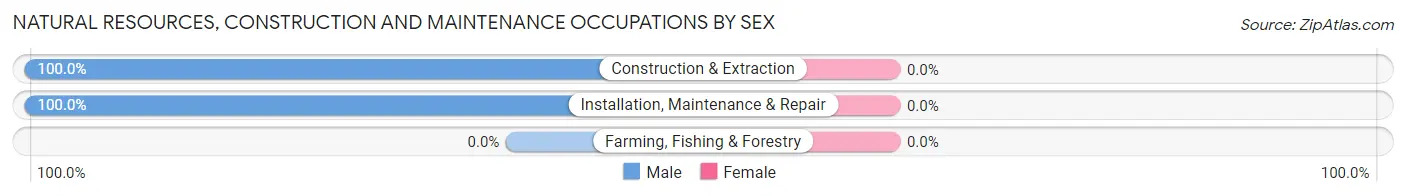
| Occupation | Male | Female |
| Farming, Fishing & Forestry | 0 (0.0%) | 0 (0.0%) |
| Construction & Extraction | 25 (100.0%) | 0 (0.0%) |
| Installation, Maintenance & Repair | 23 (100.0%) | 0 (0.0%) |
| Total (Category) | 48 (100.0%) | 0 (0.0%) |
| Total (Overall) | 343 (59.8%) | 231 (40.2%) |
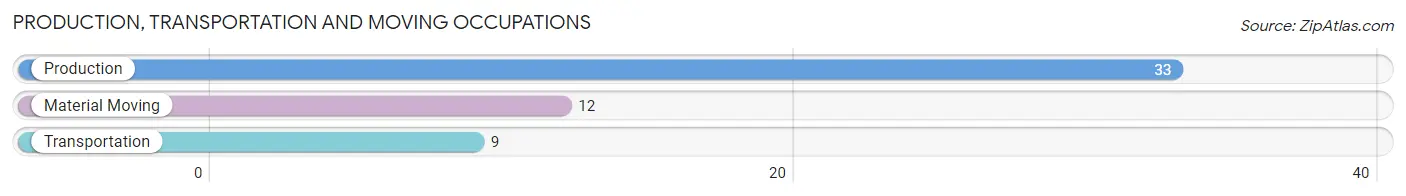
Production, Transportation and Moving Occupations
The most common Production, Transportation and Moving occupations in Bull Valley are Production (33 | 5.8%), Material Moving (12 | 2.1%), and Transportation (9 | 1.6%).
Production, Transportation and Moving Occupations by Sex
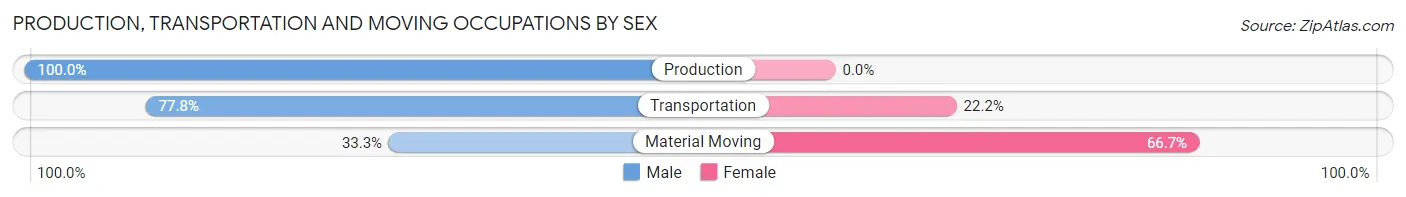
| Occupation | Male | Female |
| Production | 33 (100.0%) | 0 (0.0%) |
| Transportation | 7 (77.8%) | 2 (22.2%) |
| Material Moving | 4 (33.3%) | 8 (66.7%) |
| Total (Category) | 44 (81.5%) | 10 (18.5%) |
| Total (Overall) | 343 (59.8%) | 231 (40.2%) |
Employment Industries by Sex in Bull Valley
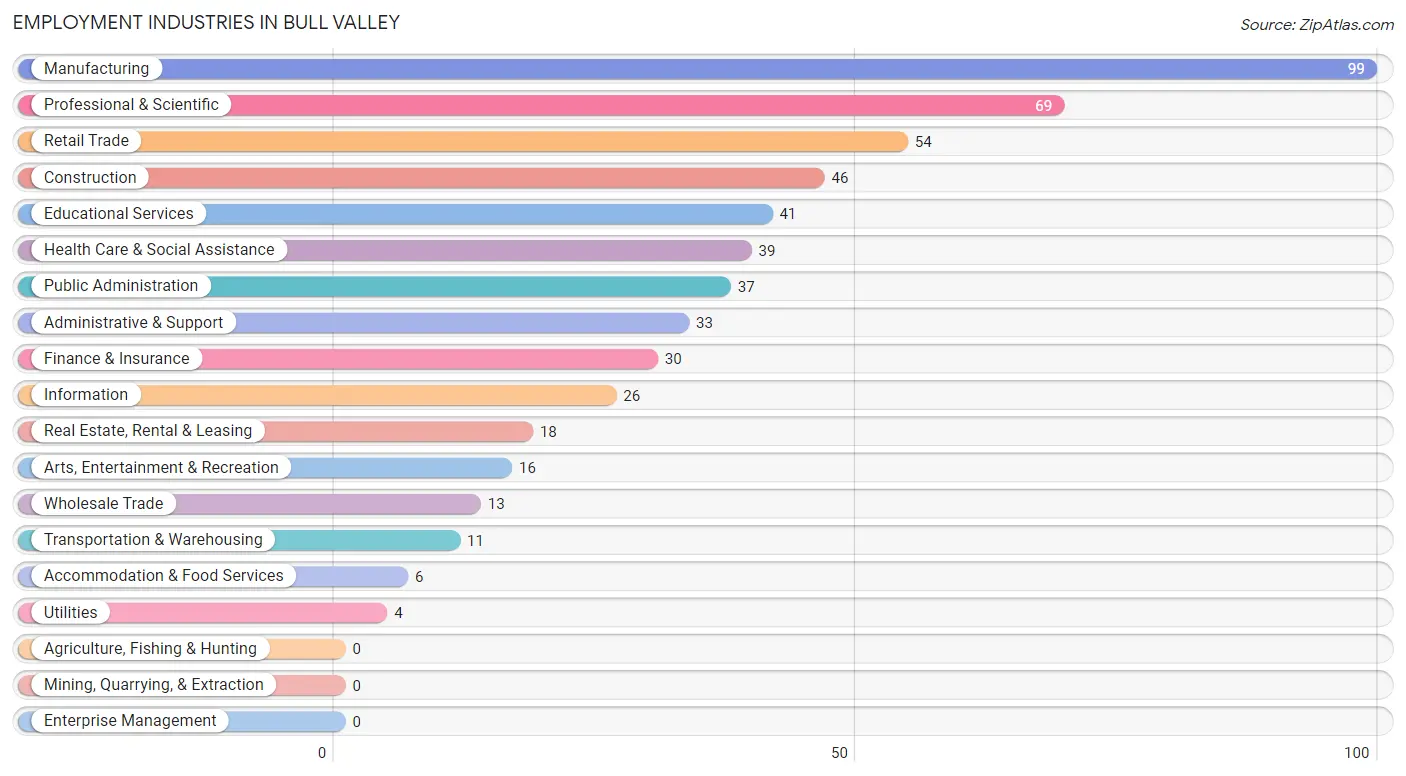
Employment Industries in Bull Valley
The major employment industries in Bull Valley include Manufacturing (99 | 17.2%), Professional & Scientific (69 | 12.0%), Retail Trade (54 | 9.4%), Construction (46 | 8.0%), and Educational Services (41 | 7.1%).
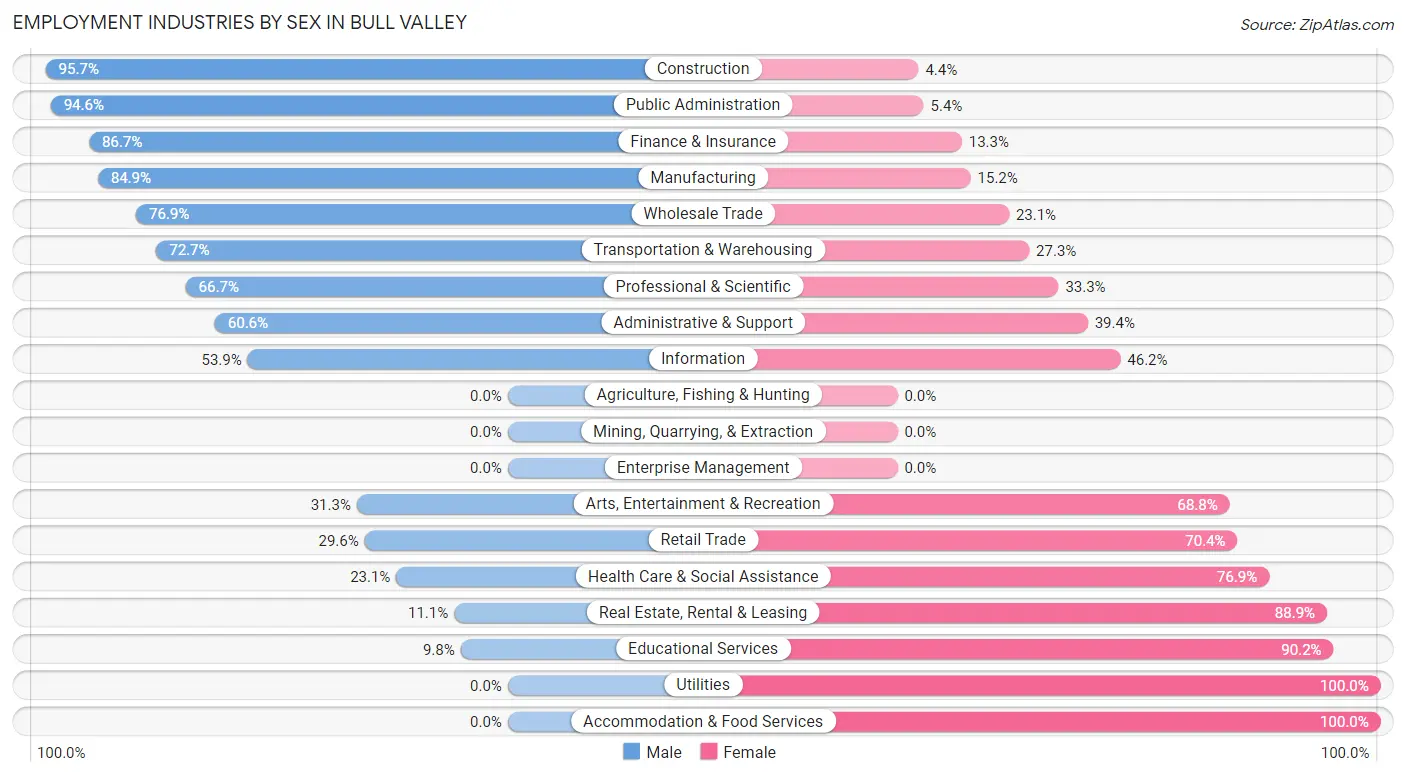
Employment Industries by Sex in Bull Valley
The Bull Valley industries that see more men than women are Construction (95.7%), Public Administration (94.6%), and Finance & Insurance (86.7%), whereas the industries that tend to have a higher number of women are Utilities (100.0%), Accommodation & Food Services (100.0%), and Educational Services (90.2%).
| Industry | Male | Female |
| Agriculture, Fishing & Hunting | 0 (0.0%) | 0 (0.0%) |
| Mining, Quarrying, & Extraction | 0 (0.0%) | 0 (0.0%) |
| Construction | 44 (95.7%) | 2 (4.3%) |
| Manufacturing | 84 (84.9%) | 15 (15.1%) |
| Wholesale Trade | 10 (76.9%) | 3 (23.1%) |
| Retail Trade | 16 (29.6%) | 38 (70.4%) |
| Transportation & Warehousing | 8 (72.7%) | 3 (27.3%) |
| Utilities | 0 (0.0%) | 4 (100.0%) |
| Information | 14 (53.8%) | 12 (46.2%) |
| Finance & Insurance | 26 (86.7%) | 4 (13.3%) |
| Real Estate, Rental & Leasing | 2 (11.1%) | 16 (88.9%) |
| Professional & Scientific | 46 (66.7%) | 23 (33.3%) |
| Enterprise Management | 0 (0.0%) | 0 (0.0%) |
| Administrative & Support | 20 (60.6%) | 13 (39.4%) |
| Educational Services | 4 (9.8%) | 37 (90.2%) |
| Health Care & Social Assistance | 9 (23.1%) | 30 (76.9%) |
| Arts, Entertainment & Recreation | 5 (31.2%) | 11 (68.8%) |
| Accommodation & Food Services | 0 (0.0%) | 6 (100.0%) |
| Public Administration | 35 (94.6%) | 2 (5.4%) |
| Total | 343 (59.8%) | 231 (40.2%) |
Education in Bull Valley
School Enrollment in Bull Valley
The most common levels of schooling among the 118 students in Bull Valley are high school (42 | 35.6%), college / undergraduate (29 | 24.6%), and middle school (21 | 17.8%).
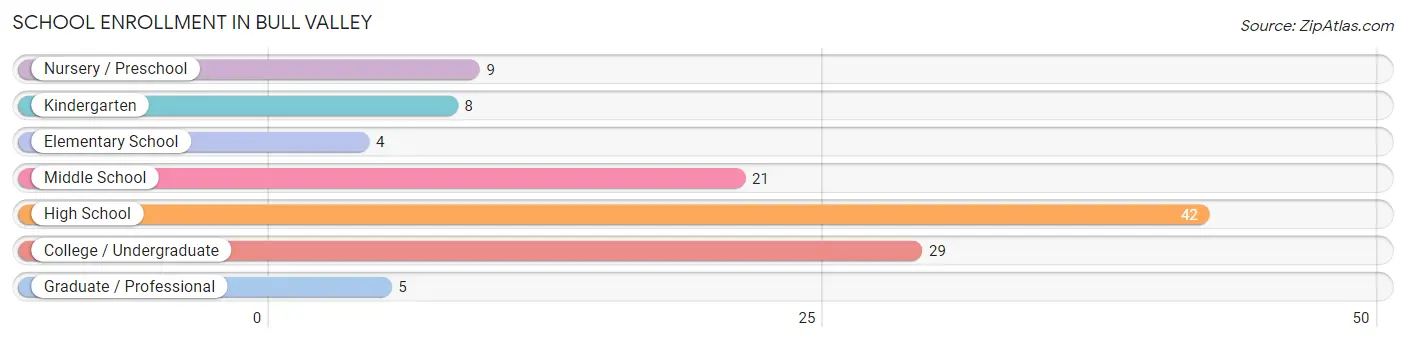
| School Level | # Students | % Students |
| Nursery / Preschool | 9 | 7.6% |
| Kindergarten | 8 | 6.8% |
| Elementary School | 4 | 3.4% |
| Middle School | 21 | 17.8% |
| High School | 42 | 35.6% |
| College / Undergraduate | 29 | 24.6% |
| Graduate / Professional | 5 | 4.2% |
| Total | 118 | 100.0% |
School Enrollment by Age by Funding Source in Bull Valley
Out of a total of 118 students who are enrolled in schools in Bull Valley, 23 (19.5%) attend a private institution, while the remaining 95 (80.5%) are enrolled in public schools. The age group of 3 to 4 year olds has the highest likelihood of being enrolled in private schools, with 7 (100.0% in the age bracket) enrolled. Conversely, the age group of 5 to 9 year old has the lowest likelihood of being enrolled in a private school, with 10 (100.0% in the age bracket) attending a public institution.
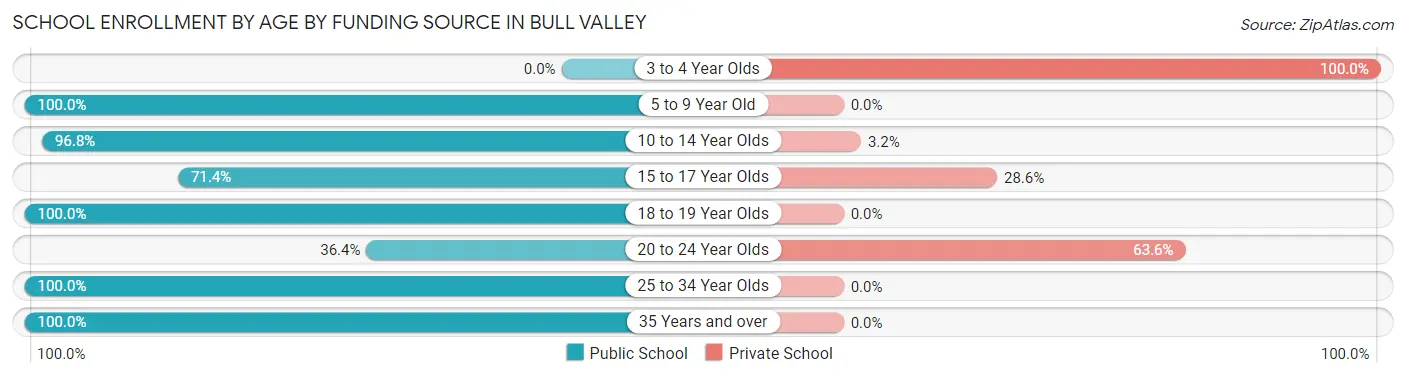
| Age Bracket | Public School | Private School |
| 3 to 4 Year Olds | 0 (0.0%) | 7 (100.0%) |
| 5 to 9 Year Old | 10 (100.0%) | 0 (0.0%) |
| 10 to 14 Year Olds | 30 (96.8%) | 1 (3.2%) |
| 15 to 17 Year Olds | 20 (71.4%) | 8 (28.6%) |
| 18 to 19 Year Olds | 24 (100.0%) | 0 (0.0%) |
| 20 to 24 Year Olds | 4 (36.4%) | 7 (63.6%) |
| 25 to 34 Year Olds | 2 (100.0%) | 0 (0.0%) |
| 35 Years and over | 5 (100.0%) | 0 (0.0%) |
| Total | 95 (80.5%) | 23 (19.5%) |
Educational Attainment by Field of Study in Bull Valley
Business (127 | 21.9%), engineering (73 | 12.6%), education (66 | 11.4%), computers & mathematics (57 | 9.8%), and social sciences (50 | 8.6%) are the most common fields of study among 581 individuals in Bull Valley who have obtained a bachelor's degree or higher.
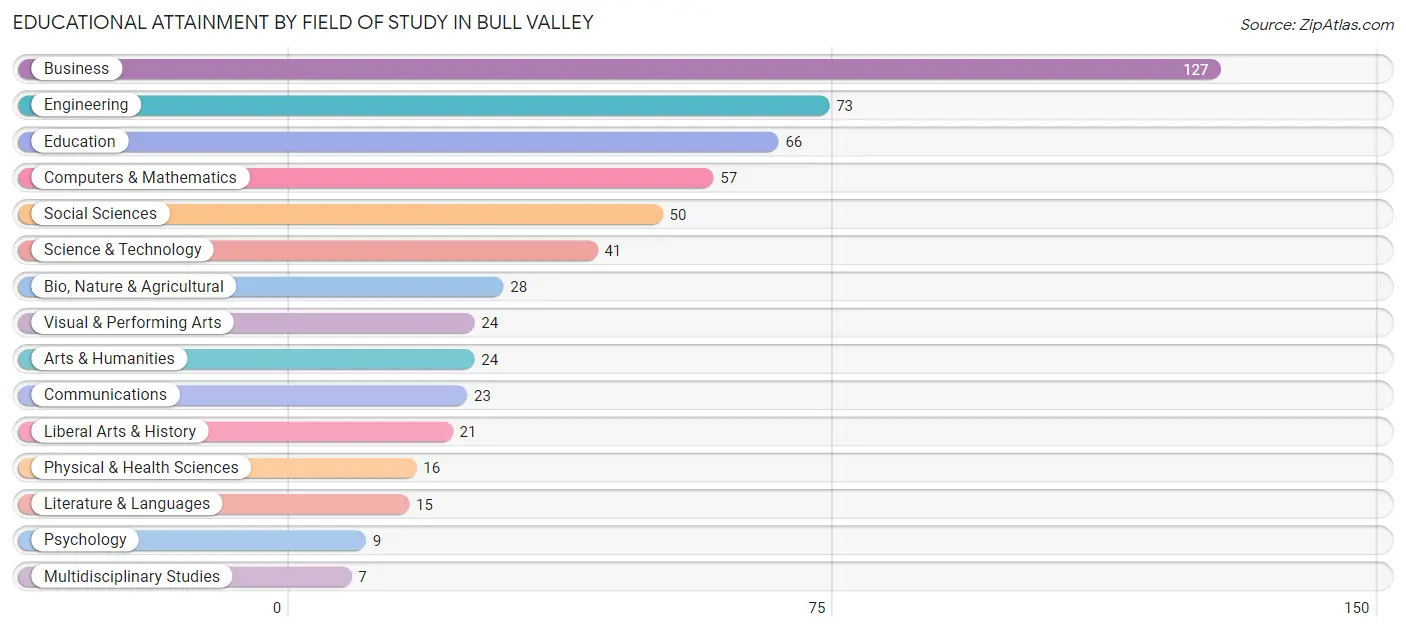
| Field of Study | # Graduates | % Graduates |
| Computers & Mathematics | 57 | 9.8% |
| Bio, Nature & Agricultural | 28 | 4.8% |
| Physical & Health Sciences | 16 | 2.8% |
| Psychology | 9 | 1.5% |
| Social Sciences | 50 | 8.6% |
| Engineering | 73 | 12.6% |
| Multidisciplinary Studies | 7 | 1.2% |
| Science & Technology | 41 | 7.1% |
| Business | 127 | 21.9% |
| Education | 66 | 11.4% |
| Literature & Languages | 15 | 2.6% |
| Liberal Arts & History | 21 | 3.6% |
| Visual & Performing Arts | 24 | 4.1% |
| Communications | 23 | 4.0% |
| Arts & Humanities | 24 | 4.1% |
| Total | 581 | 100.0% |
Transportation & Commute in Bull Valley
Vehicle Availability by Sex in Bull Valley
The most prevalent vehicle ownership categories in Bull Valley are males with 2 vehicles (136, accounting for 40.2%) and females with 2 vehicles (60, making up 59.9%).
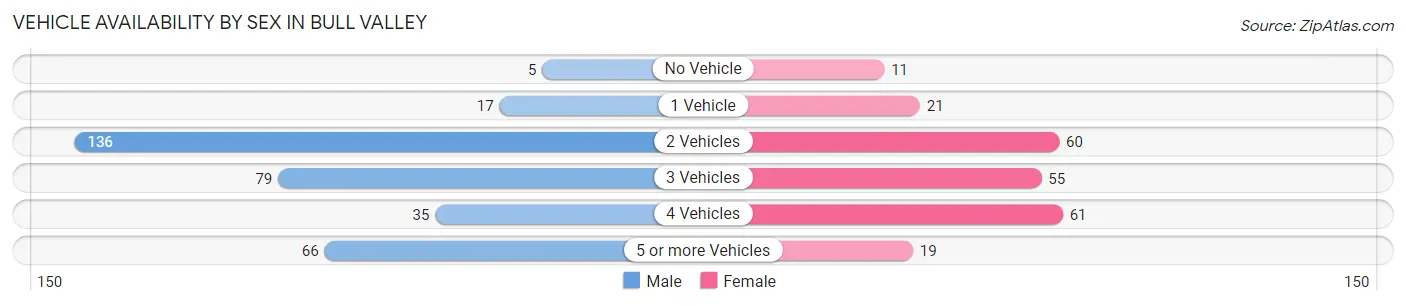
| Vehicles Available | Male | Female |
| No Vehicle | 5 (1.5%) | 11 (4.9%) |
| 1 Vehicle | 17 (5.0%) | 21 (9.2%) |
| 2 Vehicles | 136 (40.2%) | 60 (26.4%) |
| 3 Vehicles | 79 (23.4%) | 55 (24.2%) |
| 4 Vehicles | 35 (10.4%) | 61 (26.9%) |
| 5 or more Vehicles | 66 (19.5%) | 19 (8.4%) |
| Total | 338 (100.0%) | 227 (100.0%) |
Commute Time in Bull Valley
The most frequently occuring commute durations in Bull Valley are 30 to 34 minutes (95 commuters, 21.2%), 60 to 89 minutes (85 commuters, 19.0%), and 10 to 14 minutes (69 commuters, 15.4%).
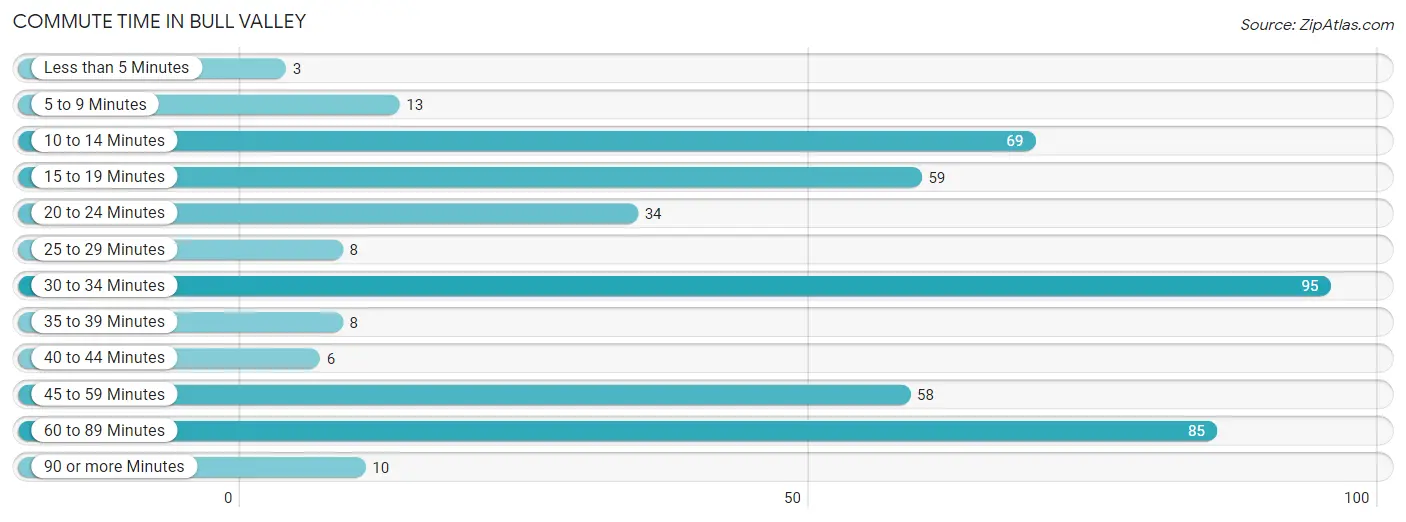
| Commute Time | # Commuters | % Commuters |
| Less than 5 Minutes | 3 | 0.7% |
| 5 to 9 Minutes | 13 | 2.9% |
| 10 to 14 Minutes | 69 | 15.4% |
| 15 to 19 Minutes | 59 | 13.2% |
| 20 to 24 Minutes | 34 | 7.6% |
| 25 to 29 Minutes | 8 | 1.8% |
| 30 to 34 Minutes | 95 | 21.2% |
| 35 to 39 Minutes | 8 | 1.8% |
| 40 to 44 Minutes | 6 | 1.3% |
| 45 to 59 Minutes | 58 | 13.0% |
| 60 to 89 Minutes | 85 | 19.0% |
| 90 or more Minutes | 10 | 2.2% |
Commute Time by Sex in Bull Valley
The most common commute times in Bull Valley are 30 to 34 minutes (72 commuters, 25.7%) for males and 15 to 19 minutes (35 commuters, 20.8%) for females.
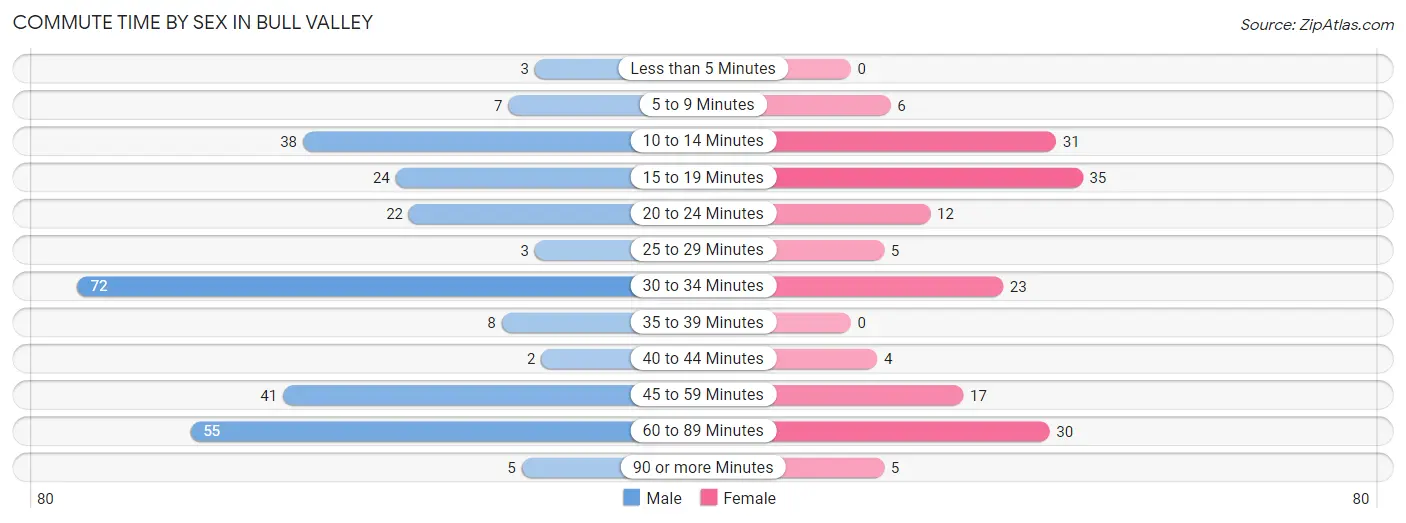
| Commute Time | Male | Female |
| Less than 5 Minutes | 3 (1.1%) | 0 (0.0%) |
| 5 to 9 Minutes | 7 (2.5%) | 6 (3.6%) |
| 10 to 14 Minutes | 38 (13.6%) | 31 (18.4%) |
| 15 to 19 Minutes | 24 (8.6%) | 35 (20.8%) |
| 20 to 24 Minutes | 22 (7.9%) | 12 (7.1%) |
| 25 to 29 Minutes | 3 (1.1%) | 5 (3.0%) |
| 30 to 34 Minutes | 72 (25.7%) | 23 (13.7%) |
| 35 to 39 Minutes | 8 (2.9%) | 0 (0.0%) |
| 40 to 44 Minutes | 2 (0.7%) | 4 (2.4%) |
| 45 to 59 Minutes | 41 (14.6%) | 17 (10.1%) |
| 60 to 89 Minutes | 55 (19.6%) | 30 (17.9%) |
| 90 or more Minutes | 5 (1.8%) | 5 (3.0%) |
Time of Departure to Work by Sex in Bull Valley
The most frequent times of departure to work in Bull Valley are 7:00 AM to 7:29 AM (66, 23.6%) for males and 6:30 AM to 6:59 AM (31, 18.4%) for females.
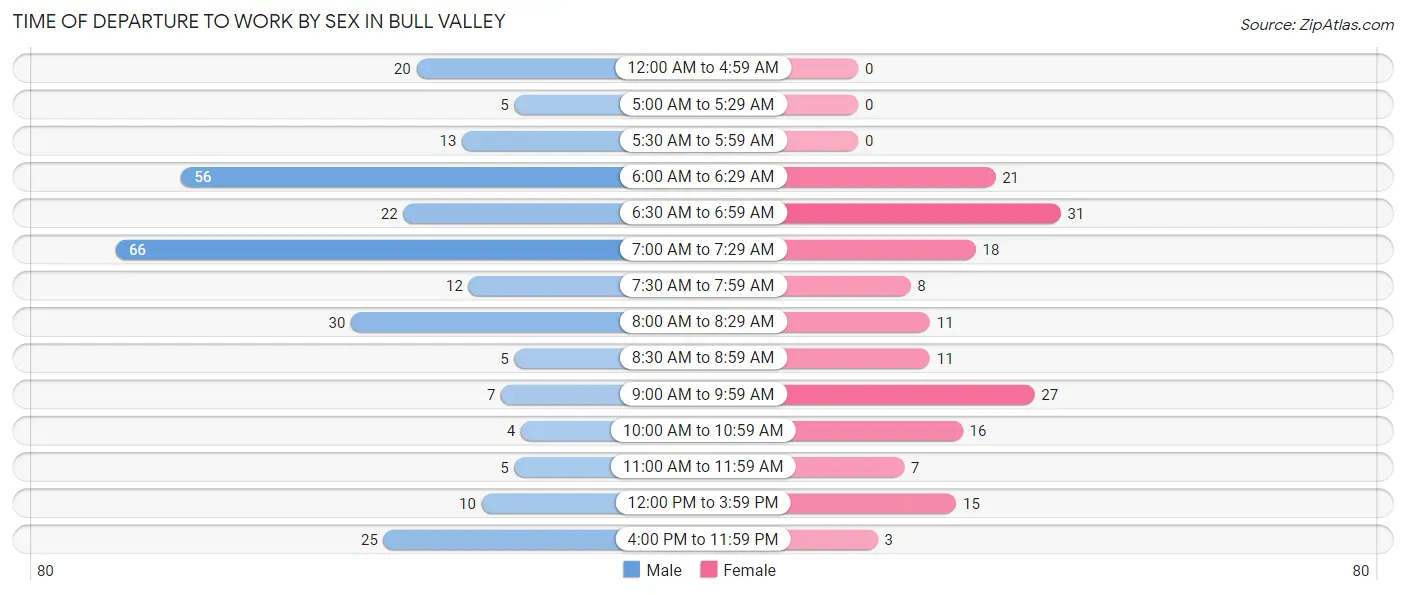
| Time of Departure | Male | Female |
| 12:00 AM to 4:59 AM | 20 (7.1%) | 0 (0.0%) |
| 5:00 AM to 5:29 AM | 5 (1.8%) | 0 (0.0%) |
| 5:30 AM to 5:59 AM | 13 (4.6%) | 0 (0.0%) |
| 6:00 AM to 6:29 AM | 56 (20.0%) | 21 (12.5%) |
| 6:30 AM to 6:59 AM | 22 (7.9%) | 31 (18.4%) |
| 7:00 AM to 7:29 AM | 66 (23.6%) | 18 (10.7%) |
| 7:30 AM to 7:59 AM | 12 (4.3%) | 8 (4.8%) |
| 8:00 AM to 8:29 AM | 30 (10.7%) | 11 (6.6%) |
| 8:30 AM to 8:59 AM | 5 (1.8%) | 11 (6.6%) |
| 9:00 AM to 9:59 AM | 7 (2.5%) | 27 (16.1%) |
| 10:00 AM to 10:59 AM | 4 (1.4%) | 16 (9.5%) |
| 11:00 AM to 11:59 AM | 5 (1.8%) | 7 (4.2%) |
| 12:00 PM to 3:59 PM | 10 (3.6%) | 15 (8.9%) |
| 4:00 PM to 11:59 PM | 25 (8.9%) | 3 (1.8%) |
| Total | 280 (100.0%) | 168 (100.0%) |
Housing Occupancy in Bull Valley
Occupancy by Ownership in Bull Valley
Of the total 504 dwellings in Bull Valley, owner-occupied units account for 472 (93.6%), while renter-occupied units make up 32 (6.4%).
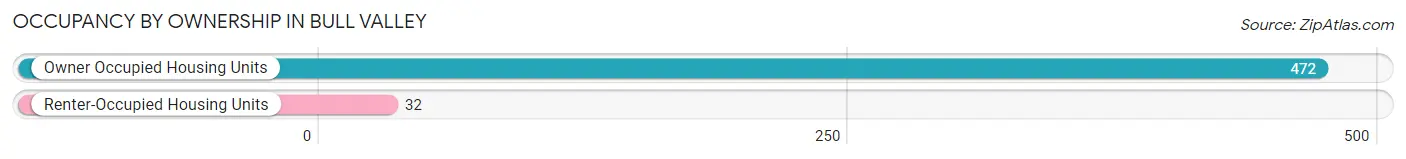
| Occupancy | # Housing Units | % Housing Units |
| Owner Occupied Housing Units | 472 | 93.6% |
| Renter-Occupied Housing Units | 32 | 6.4% |
| Total Occupied Housing Units | 504 | 100.0% |
Occupancy by Household Size in Bull Valley
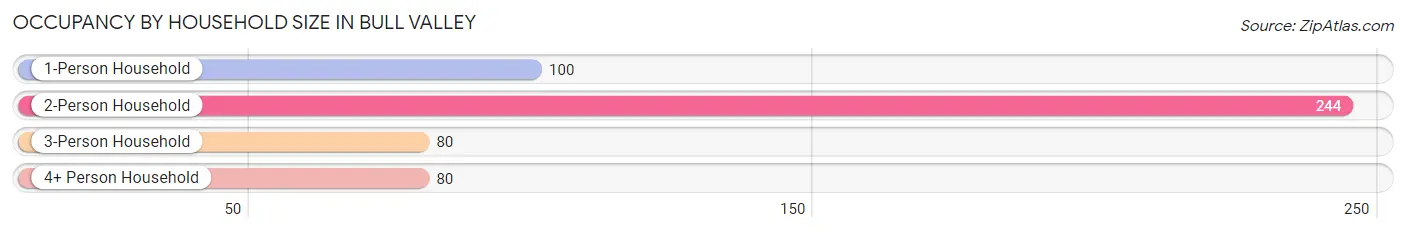
| Household Size | # Housing Units | % Housing Units |
| 1-Person Household | 100 | 19.8% |
| 2-Person Household | 244 | 48.4% |
| 3-Person Household | 80 | 15.9% |
| 4+ Person Household | 80 | 15.9% |
| Total Housing Units | 504 | 100.0% |
Occupancy by Ownership by Household Size in Bull Valley
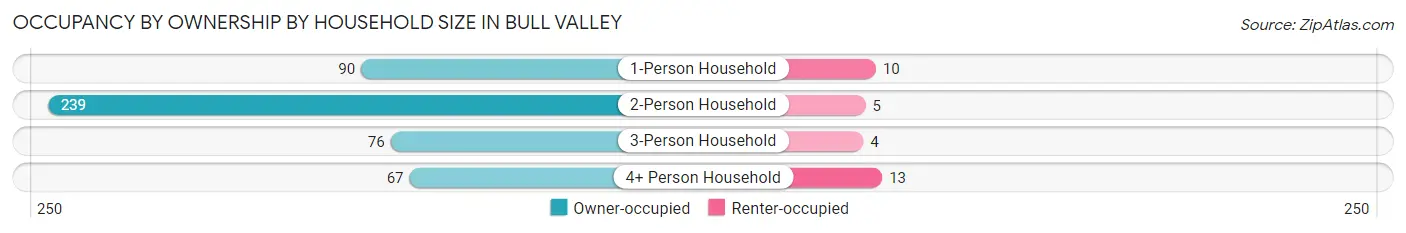
| Household Size | Owner-occupied | Renter-occupied |
| 1-Person Household | 90 (90.0%) | 10 (10.0%) |
| 2-Person Household | 239 (98.0%) | 5 (2.1%) |
| 3-Person Household | 76 (95.0%) | 4 (5.0%) |
| 4+ Person Household | 67 (83.8%) | 13 (16.3%) |
| Total Housing Units | 472 (93.6%) | 32 (6.4%) |
Occupancy by Educational Attainment in Bull Valley
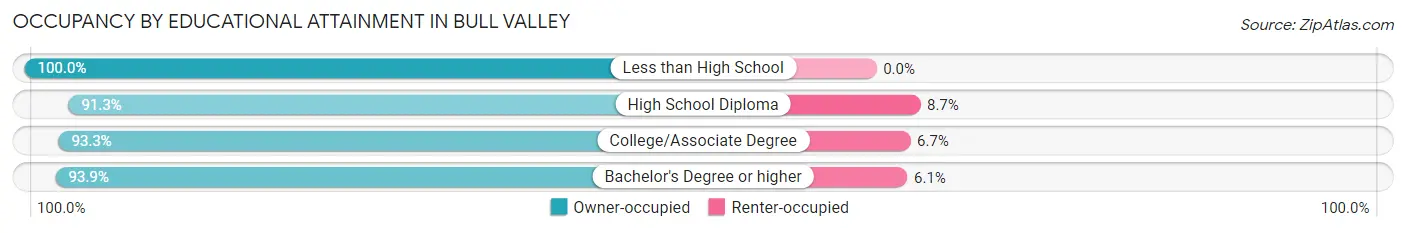
| Household Size | Owner-occupied | Renter-occupied |
| Less than High School | 13 (100.0%) | 0 (0.0%) |
| High School Diploma | 42 (91.3%) | 4 (8.7%) |
| College/Associate Degree | 111 (93.3%) | 8 (6.7%) |
| Bachelor's Degree or higher | 306 (93.9%) | 20 (6.1%) |
Occupancy by Age of Householder in Bull Valley
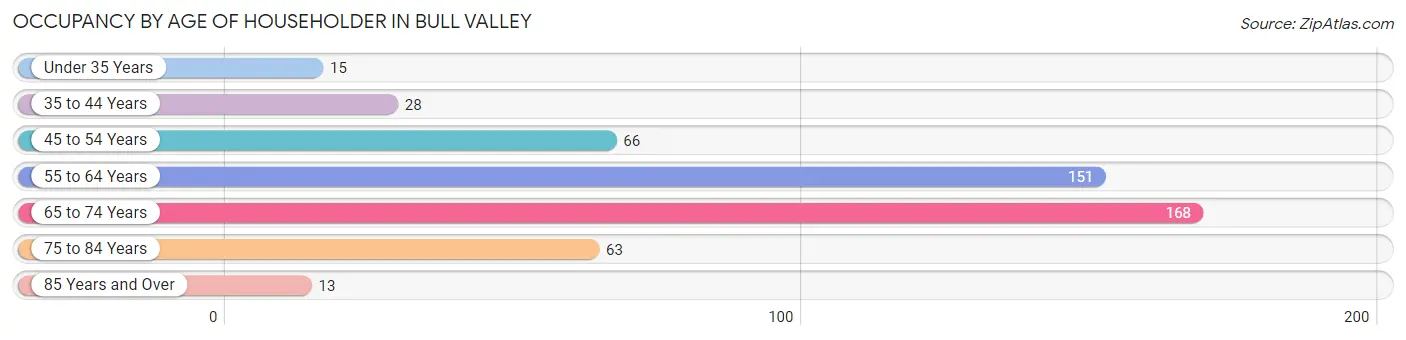
| Age Bracket | # Households | % Households |
| Under 35 Years | 15 | 3.0% |
| 35 to 44 Years | 28 | 5.6% |
| 45 to 54 Years | 66 | 13.1% |
| 55 to 64 Years | 151 | 30.0% |
| 65 to 74 Years | 168 | 33.3% |
| 75 to 84 Years | 63 | 12.5% |
| 85 Years and Over | 13 | 2.6% |
| Total | 504 | 100.0% |
Housing Finances in Bull Valley
Median Income by Occupancy in Bull Valley
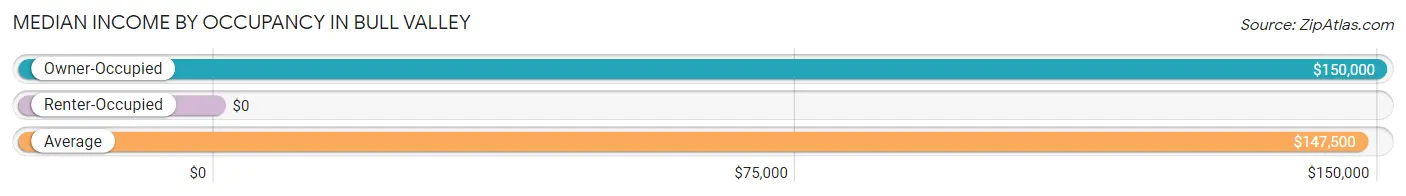
| Occupancy Type | # Households | Median Income |
| Owner-Occupied | 472 (93.6%) | $150,000 |
| Renter-Occupied | 32 (6.4%) | $0 |
| Average | 504 (100.0%) | $147,500 |
Occupancy by Householder Income Bracket in Bull Valley
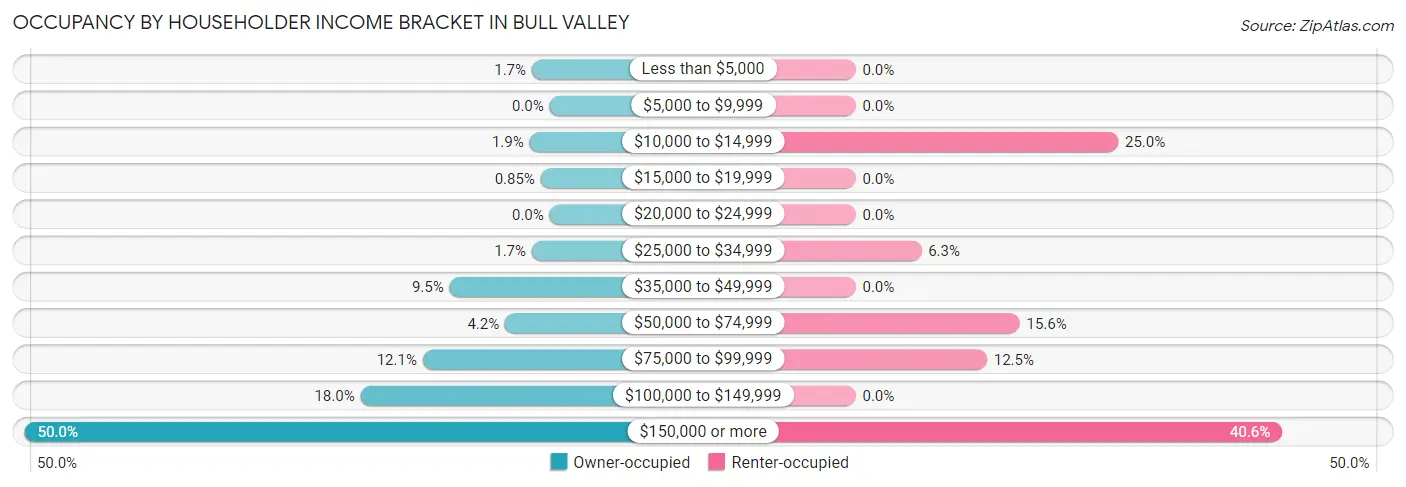
| Income Bracket | Owner-occupied | Renter-occupied |
| Less than $5,000 | 8 (1.7%) | 0 (0.0%) |
| $5,000 to $9,999 | 0 (0.0%) | 0 (0.0%) |
| $10,000 to $14,999 | 9 (1.9%) | 8 (25.0%) |
| $15,000 to $19,999 | 4 (0.9%) | 0 (0.0%) |
| $20,000 to $24,999 | 0 (0.0%) | 0 (0.0%) |
| $25,000 to $34,999 | 8 (1.7%) | 2 (6.2%) |
| $35,000 to $49,999 | 45 (9.5%) | 0 (0.0%) |
| $50,000 to $74,999 | 20 (4.2%) | 5 (15.6%) |
| $75,000 to $99,999 | 57 (12.1%) | 4 (12.5%) |
| $100,000 to $149,999 | 85 (18.0%) | 0 (0.0%) |
| $150,000 or more | 236 (50.0%) | 13 (40.6%) |
| Total | 472 (100.0%) | 32 (100.0%) |
Monthly Housing Cost Tiers in Bull Valley
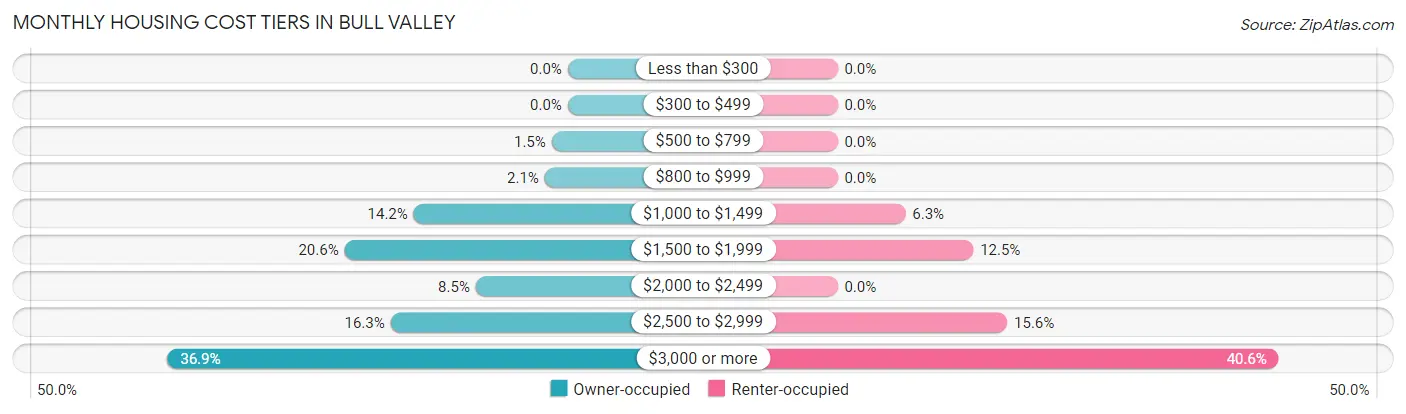
| Monthly Cost | Owner-occupied | Renter-occupied |
| Less than $300 | 0 (0.0%) | 0 (0.0%) |
| $300 to $499 | 0 (0.0%) | 0 (0.0%) |
| $500 to $799 | 7 (1.5%) | 0 (0.0%) |
| $800 to $999 | 10 (2.1%) | 0 (0.0%) |
| $1,000 to $1,499 | 67 (14.2%) | 2 (6.2%) |
| $1,500 to $1,999 | 97 (20.5%) | 4 (12.5%) |
| $2,000 to $2,499 | 40 (8.5%) | 0 (0.0%) |
| $2,500 to $2,999 | 77 (16.3%) | 5 (15.6%) |
| $3,000 or more | 174 (36.9%) | 13 (40.6%) |
| Total | 472 (100.0%) | 32 (100.0%) |
Physical Housing Characteristics in Bull Valley
Housing Structures in Bull Valley
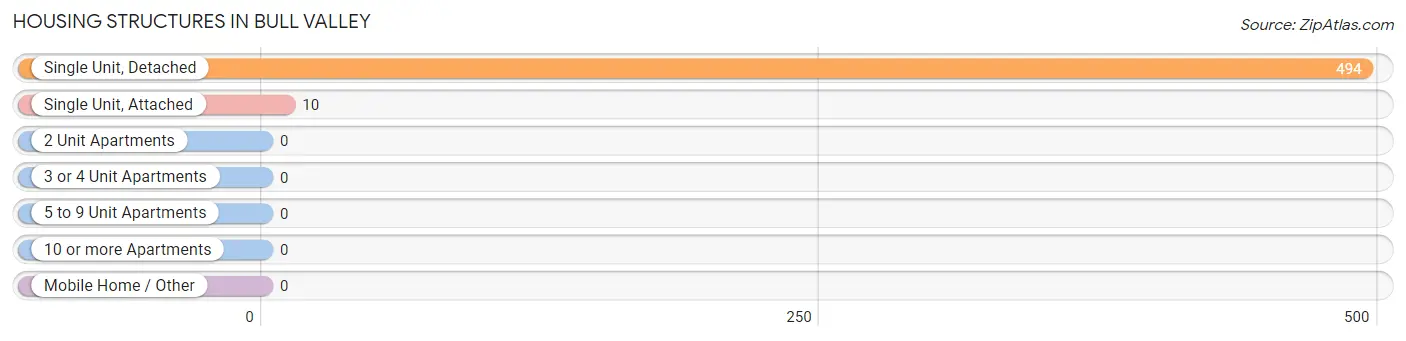
| Structure Type | # Housing Units | % Housing Units |
| Single Unit, Detached | 494 | 98.0% |
| Single Unit, Attached | 10 | 2.0% |
| 2 Unit Apartments | 0 | 0.0% |
| 3 or 4 Unit Apartments | 0 | 0.0% |
| 5 to 9 Unit Apartments | 0 | 0.0% |
| 10 or more Apartments | 0 | 0.0% |
| Mobile Home / Other | 0 | 0.0% |
| Total | 504 | 100.0% |
Housing Structures by Occupancy in Bull Valley
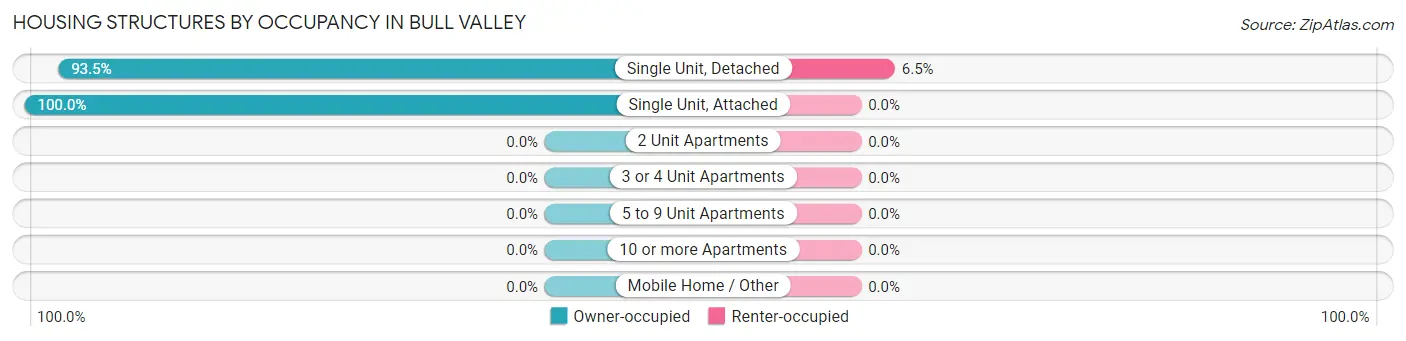
| Structure Type | Owner-occupied | Renter-occupied |
| Single Unit, Detached | 462 (93.5%) | 32 (6.5%) |
| Single Unit, Attached | 10 (100.0%) | 0 (0.0%) |
| 2 Unit Apartments | 0 (0.0%) | 0 (0.0%) |
| 3 or 4 Unit Apartments | 0 (0.0%) | 0 (0.0%) |
| 5 to 9 Unit Apartments | 0 (0.0%) | 0 (0.0%) |
| 10 or more Apartments | 0 (0.0%) | 0 (0.0%) |
| Mobile Home / Other | 0 (0.0%) | 0 (0.0%) |
| Total | 472 (93.6%) | 32 (6.4%) |
Housing Structures by Number of Rooms in Bull Valley
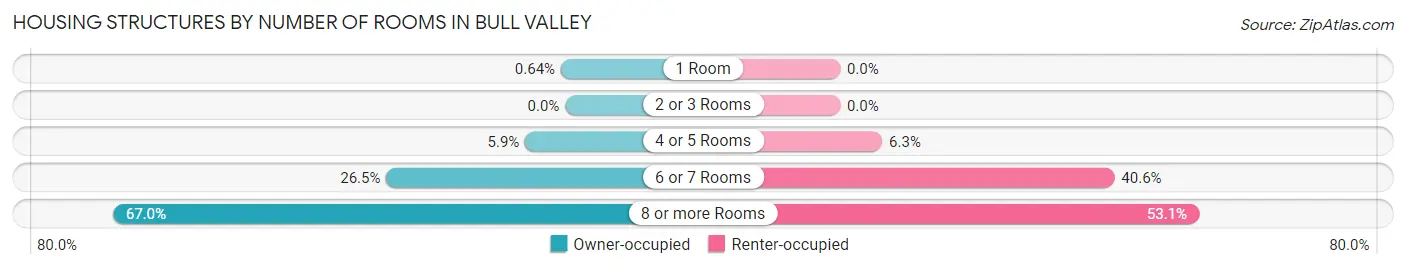
| Number of Rooms | Owner-occupied | Renter-occupied |
| 1 Room | 3 (0.6%) | 0 (0.0%) |
| 2 or 3 Rooms | 0 (0.0%) | 0 (0.0%) |
| 4 or 5 Rooms | 28 (5.9%) | 2 (6.2%) |
| 6 or 7 Rooms | 125 (26.5%) | 13 (40.6%) |
| 8 or more Rooms | 316 (66.9%) | 17 (53.1%) |
| Total | 472 (100.0%) | 32 (100.0%) |
Housing Structure by Heating Type in Bull Valley
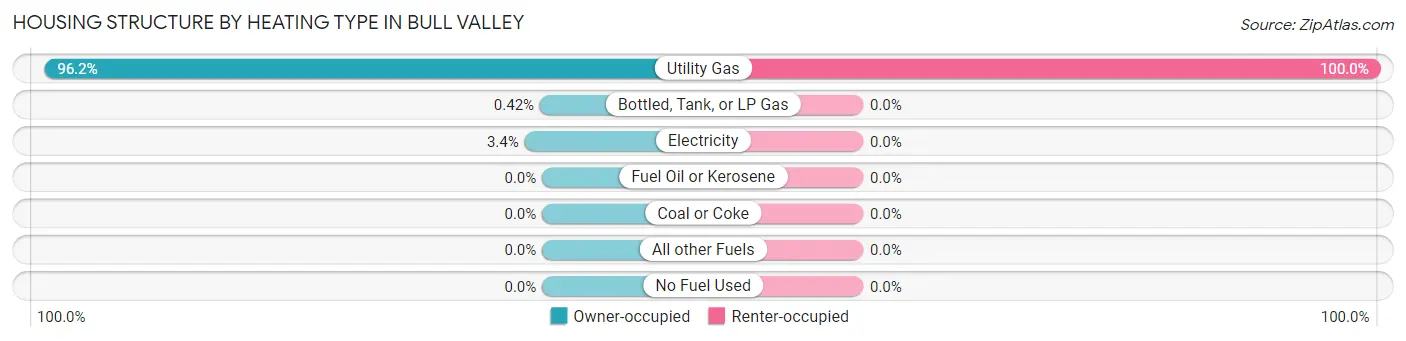
| Heating Type | Owner-occupied | Renter-occupied |
| Utility Gas | 454 (96.2%) | 32 (100.0%) |
| Bottled, Tank, or LP Gas | 2 (0.4%) | 0 (0.0%) |
| Electricity | 16 (3.4%) | 0 (0.0%) |
| Fuel Oil or Kerosene | 0 (0.0%) | 0 (0.0%) |
| Coal or Coke | 0 (0.0%) | 0 (0.0%) |
| All other Fuels | 0 (0.0%) | 0 (0.0%) |
| No Fuel Used | 0 (0.0%) | 0 (0.0%) |
| Total | 472 (100.0%) | 32 (100.0%) |
Household Vehicle Usage in Bull Valley
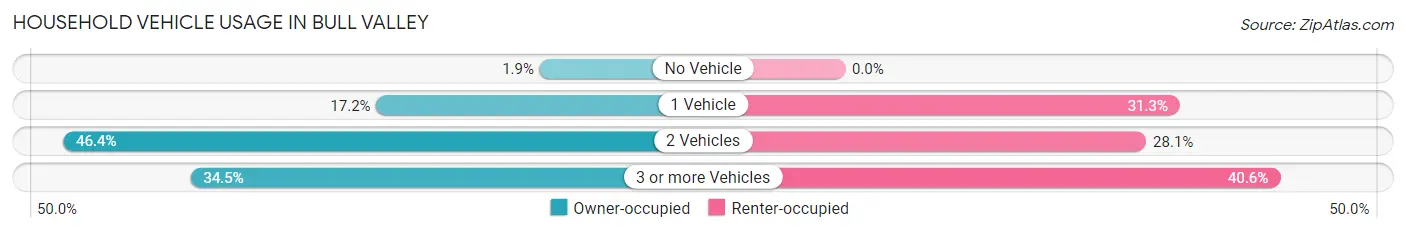
| Vehicles per Household | Owner-occupied | Renter-occupied |
| No Vehicle | 9 (1.9%) | 0 (0.0%) |
| 1 Vehicle | 81 (17.2%) | 10 (31.2%) |
| 2 Vehicles | 219 (46.4%) | 9 (28.1%) |
| 3 or more Vehicles | 163 (34.5%) | 13 (40.6%) |
| Total | 472 (100.0%) | 32 (100.0%) |
Real Estate & Mortgages in Bull Valley
Real Estate and Mortgage Overview in Bull Valley
| Characteristic | Without Mortgage | With Mortgage |
| Housing Units | 198 | 274 |
| Median Property Value | $453,000 | $424,400 |
| Median Household Income | $91,875 | $183 |
| Monthly Housing Costs | $1,501 | $166 |
| Real Estate Taxes | $10,001 | $3 |
Property Value by Mortgage Status in Bull Valley
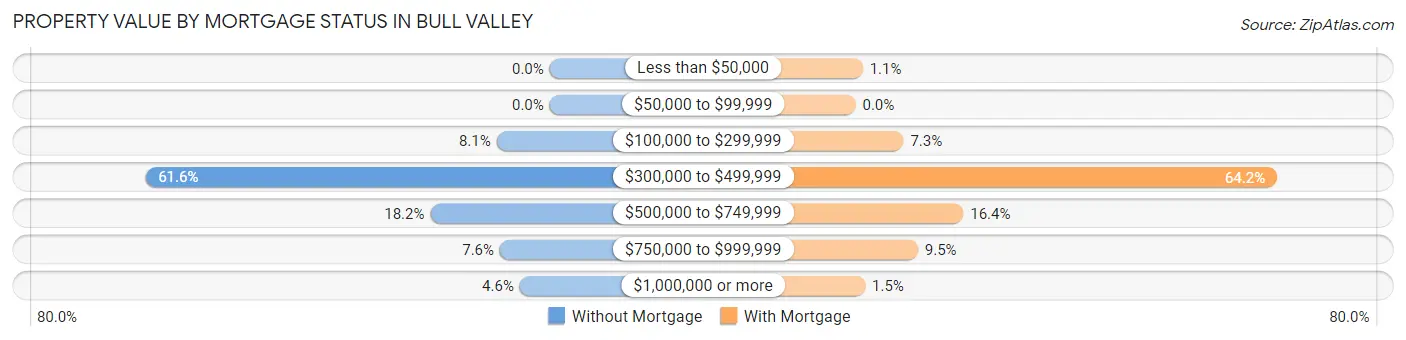
| Property Value | Without Mortgage | With Mortgage |
| Less than $50,000 | 0 (0.0%) | 3 (1.1%) |
| $50,000 to $99,999 | 0 (0.0%) | 0 (0.0%) |
| $100,000 to $299,999 | 16 (8.1%) | 20 (7.3%) |
| $300,000 to $499,999 | 122 (61.6%) | 176 (64.2%) |
| $500,000 to $749,999 | 36 (18.2%) | 45 (16.4%) |
| $750,000 to $999,999 | 15 (7.6%) | 26 (9.5%) |
| $1,000,000 or more | 9 (4.5%) | 4 (1.5%) |
| Total | 198 (100.0%) | 274 (100.0%) |
Household Income by Mortgage Status in Bull Valley
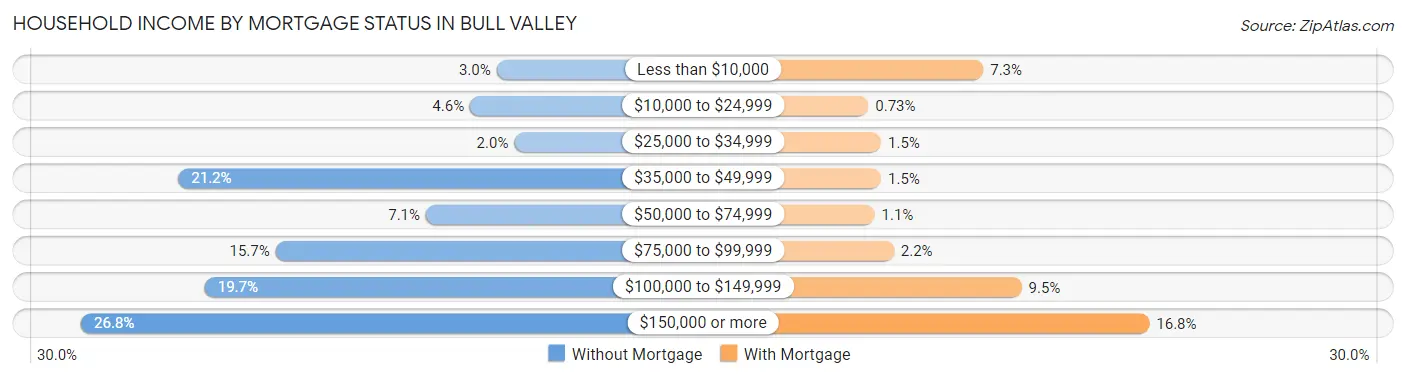
| Household Income | Without Mortgage | With Mortgage |
| Less than $10,000 | 6 (3.0%) | 20 (7.3%) |
| $10,000 to $24,999 | 9 (4.5%) | 2 (0.7%) |
| $25,000 to $34,999 | 4 (2.0%) | 4 (1.5%) |
| $35,000 to $49,999 | 42 (21.2%) | 4 (1.5%) |
| $50,000 to $74,999 | 14 (7.1%) | 3 (1.1%) |
| $75,000 to $99,999 | 31 (15.7%) | 6 (2.2%) |
| $100,000 to $149,999 | 39 (19.7%) | 26 (9.5%) |
| $150,000 or more | 53 (26.8%) | 46 (16.8%) |
| Total | 198 (100.0%) | 274 (100.0%) |
Property Value to Household Income Ratio in Bull Valley
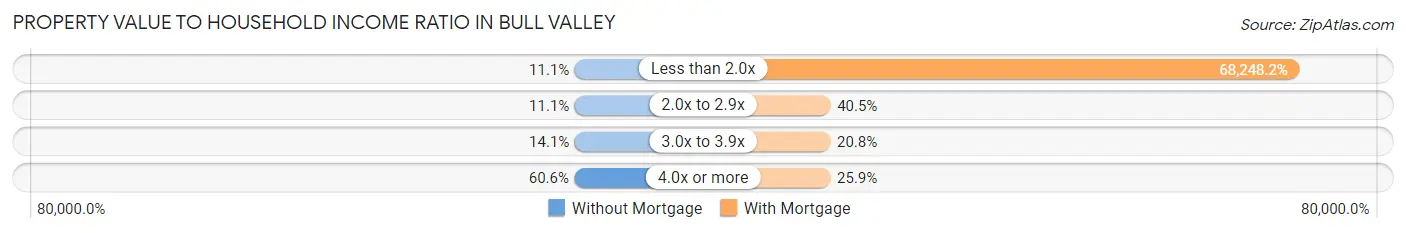
| Value-to-Income Ratio | Without Mortgage | With Mortgage |
| Less than 2.0x | 22 (11.1%) | 187,000 (68,248.2%) |
| 2.0x to 2.9x | 22 (11.1%) | 111 (40.5%) |
| 3.0x to 3.9x | 28 (14.1%) | 57 (20.8%) |
| 4.0x or more | 120 (60.6%) | 71 (25.9%) |
| Total | 198 (100.0%) | 274 (100.0%) |
Real Estate Taxes by Mortgage Status in Bull Valley
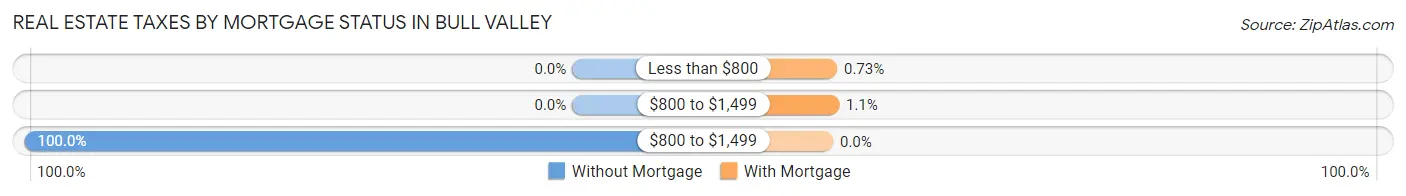
| Property Taxes | Without Mortgage | With Mortgage |
| Less than $800 | 0 (0.0%) | 2 (0.7%) |
| $800 to $1,499 | 0 (0.0%) | 3 (1.1%) |
| $800 to $1,499 | 198 (100.0%) | 0 (0.0%) |
| Total | 198 (100.0%) | 274 (100.0%) |
Health & Disability in Bull Valley
Health Insurance Coverage by Age in Bull Valley
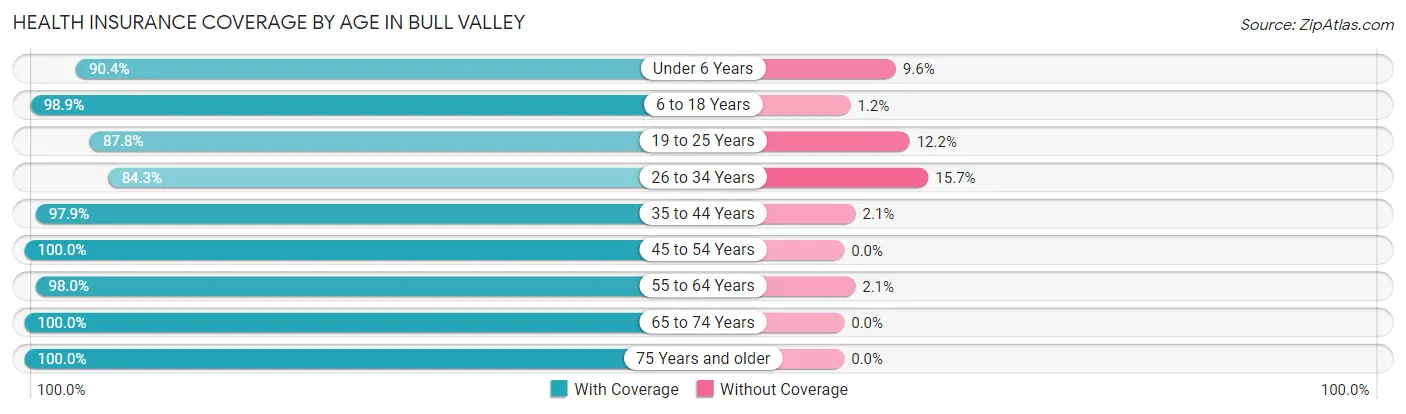
| Age Bracket | With Coverage | Without Coverage |
| Under 6 Years | 47 (90.4%) | 5 (9.6%) |
| 6 to 18 Years | 86 (98.9%) | 1 (1.1%) |
| 19 to 25 Years | 72 (87.8%) | 10 (12.2%) |
| 26 to 34 Years | 43 (84.3%) | 8 (15.7%) |
| 35 to 44 Years | 93 (97.9%) | 2 (2.1%) |
| 45 to 54 Years | 160 (100.0%) | 0 (0.0%) |
| 55 to 64 Years | 287 (98.0%) | 6 (2.1%) |
| 65 to 74 Years | 300 (100.0%) | 0 (0.0%) |
| 75 Years and older | 128 (100.0%) | 0 (0.0%) |
| Total | 1,216 (97.4%) | 32 (2.6%) |
Health Insurance Coverage by Citizenship Status in Bull Valley
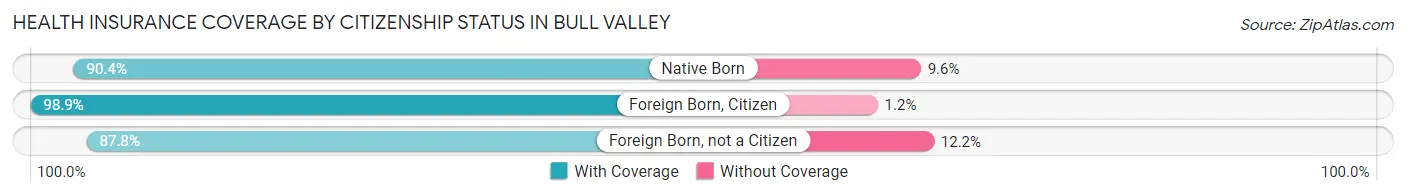
| Citizenship Status | With Coverage | Without Coverage |
| Native Born | 47 (90.4%) | 5 (9.6%) |
| Foreign Born, Citizen | 86 (98.9%) | 1 (1.1%) |
| Foreign Born, not a Citizen | 72 (87.8%) | 10 (12.2%) |
Health Insurance Coverage by Household Income in Bull Valley
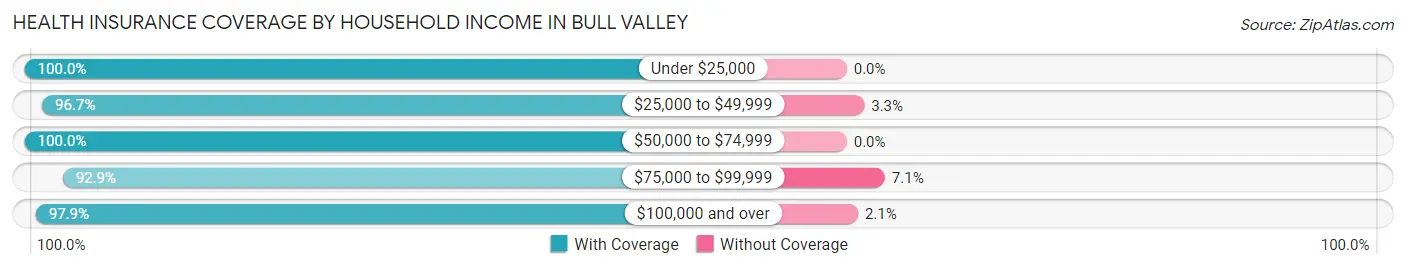
| Household Income | With Coverage | Without Coverage |
| Under $25,000 | 44 (100.0%) | 0 (0.0%) |
| $25,000 to $49,999 | 59 (96.7%) | 2 (3.3%) |
| $50,000 to $74,999 | 50 (100.0%) | 0 (0.0%) |
| $75,000 to $99,999 | 130 (92.9%) | 10 (7.1%) |
| $100,000 and over | 933 (97.9%) | 20 (2.1%) |
Public vs Private Health Insurance Coverage by Age in Bull Valley
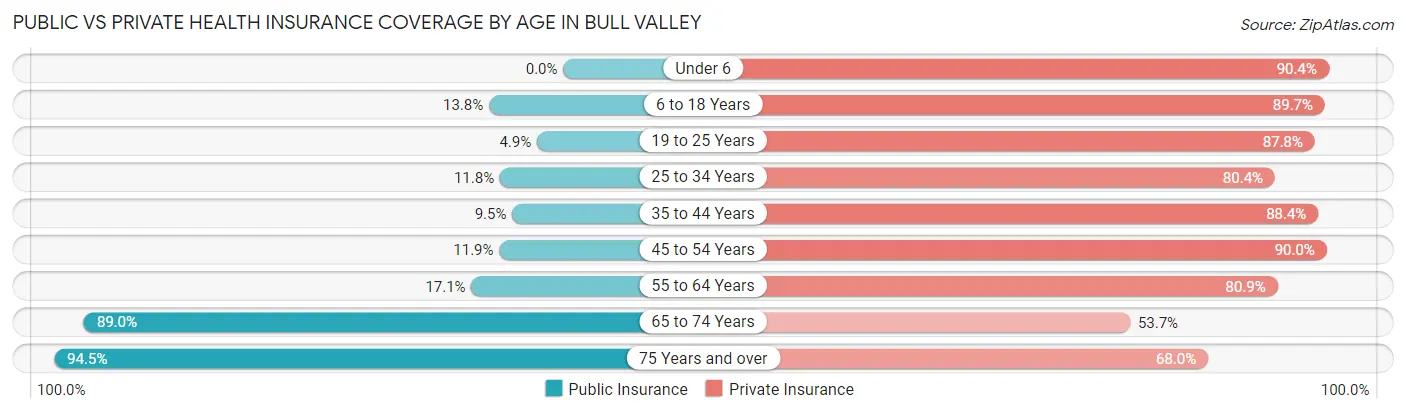
| Age Bracket | Public Insurance | Private Insurance |
| Under 6 | 0 (0.0%) | 47 (90.4%) |
| 6 to 18 Years | 12 (13.8%) | 78 (89.7%) |
| 19 to 25 Years | 4 (4.9%) | 72 (87.8%) |
| 25 to 34 Years | 6 (11.8%) | 41 (80.4%) |
| 35 to 44 Years | 9 (9.5%) | 84 (88.4%) |
| 45 to 54 Years | 19 (11.9%) | 144 (90.0%) |
| 55 to 64 Years | 50 (17.1%) | 237 (80.9%) |
| 65 to 74 Years | 267 (89.0%) | 161 (53.7%) |
| 75 Years and over | 121 (94.5%) | 87 (68.0%) |
| Total | 488 (39.1%) | 951 (76.2%) |
Disability Status by Sex by Age in Bull Valley
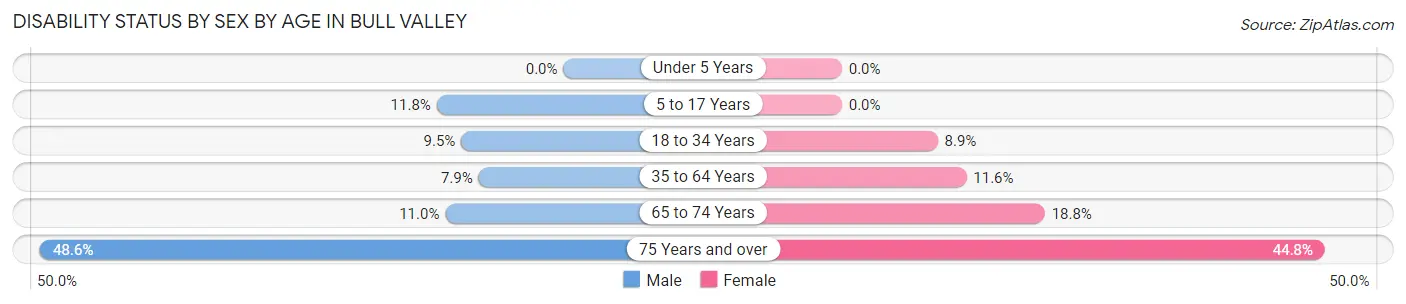
| Age Bracket | Male | Female |
| Under 5 Years | 0 (0.0%) | 0 (0.0%) |
| 5 to 17 Years | 4 (11.8%) | 0 (0.0%) |
| 18 to 34 Years | 11 (9.5%) | 4 (8.9%) |
| 35 to 64 Years | 20 (7.9%) | 34 (11.6%) |
| 65 to 74 Years | 16 (11.0%) | 29 (18.8%) |
| 75 Years and over | 34 (48.6%) | 26 (44.8%) |
Disability Class by Sex by Age in Bull Valley
Disability Class: Hearing Difficulty
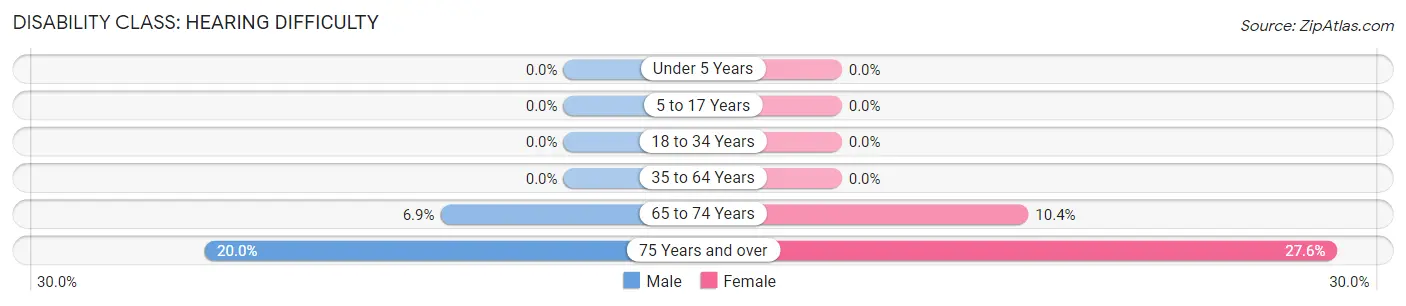
| Age Bracket | Male | Female |
| Under 5 Years | 0 (0.0%) | 0 (0.0%) |
| 5 to 17 Years | 0 (0.0%) | 0 (0.0%) |
| 18 to 34 Years | 0 (0.0%) | 0 (0.0%) |
| 35 to 64 Years | 0 (0.0%) | 0 (0.0%) |
| 65 to 74 Years | 10 (6.9%) | 16 (10.4%) |
| 75 Years and over | 14 (20.0%) | 16 (27.6%) |
Disability Class: Vision Difficulty
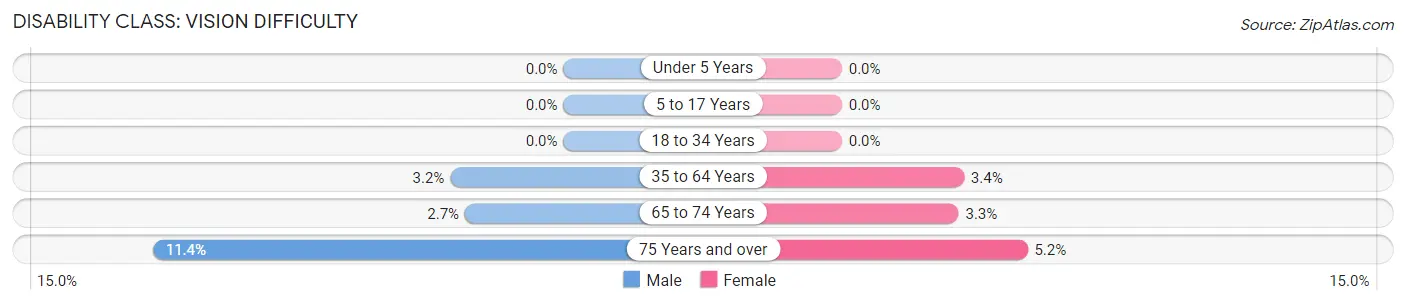
| Age Bracket | Male | Female |
| Under 5 Years | 0 (0.0%) | 0 (0.0%) |
| 5 to 17 Years | 0 (0.0%) | 0 (0.0%) |
| 18 to 34 Years | 0 (0.0%) | 0 (0.0%) |
| 35 to 64 Years | 8 (3.2%) | 10 (3.4%) |
| 65 to 74 Years | 4 (2.7%) | 5 (3.3%) |
| 75 Years and over | 8 (11.4%) | 3 (5.2%) |
Disability Class: Cognitive Difficulty
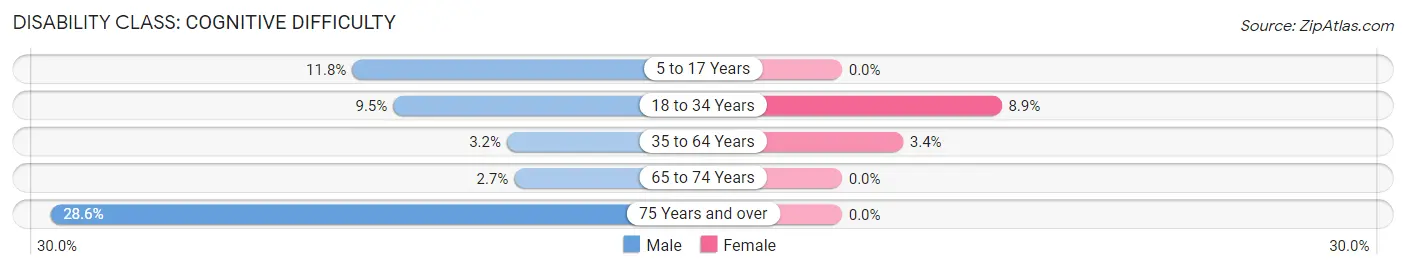
| Age Bracket | Male | Female |
| 5 to 17 Years | 4 (11.8%) | 0 (0.0%) |
| 18 to 34 Years | 11 (9.5%) | 4 (8.9%) |
| 35 to 64 Years | 8 (3.2%) | 10 (3.4%) |
| 65 to 74 Years | 4 (2.7%) | 0 (0.0%) |
| 75 Years and over | 20 (28.6%) | 0 (0.0%) |
Disability Class: Ambulatory Difficulty
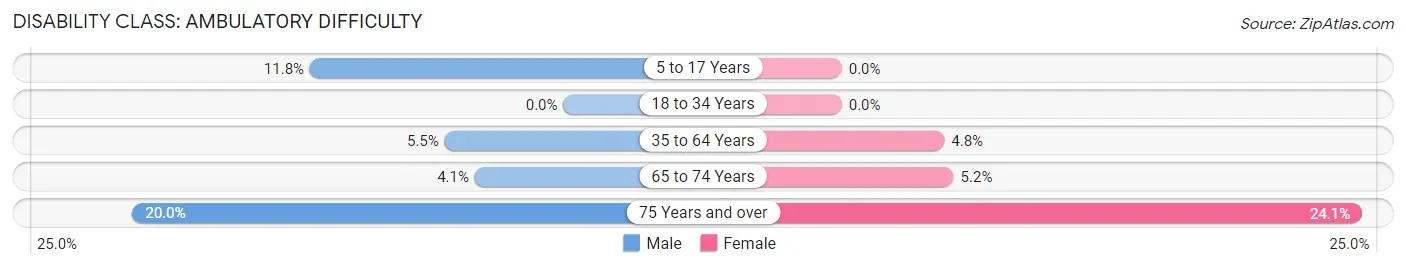
| Age Bracket | Male | Female |
| 5 to 17 Years | 4 (11.8%) | 0 (0.0%) |
| 18 to 34 Years | 0 (0.0%) | 0 (0.0%) |
| 35 to 64 Years | 14 (5.5%) | 14 (4.8%) |
| 65 to 74 Years | 6 (4.1%) | 8 (5.2%) |
| 75 Years and over | 14 (20.0%) | 14 (24.1%) |
Disability Class: Self-Care Difficulty
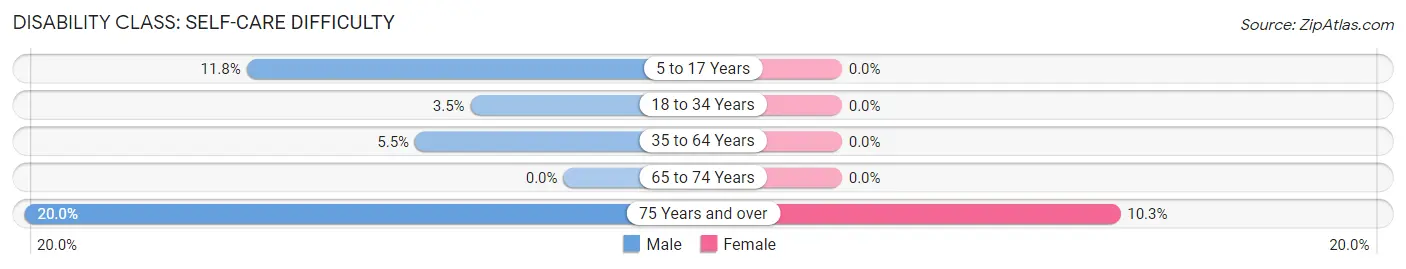
| Age Bracket | Male | Female |
| 5 to 17 Years | 4 (11.8%) | 0 (0.0%) |
| 18 to 34 Years | 4 (3.5%) | 0 (0.0%) |
| 35 to 64 Years | 14 (5.5%) | 0 (0.0%) |
| 65 to 74 Years | 0 (0.0%) | 0 (0.0%) |
| 75 Years and over | 14 (20.0%) | 6 (10.3%) |
Technology Access in Bull Valley
Computing Device Access in Bull Valley
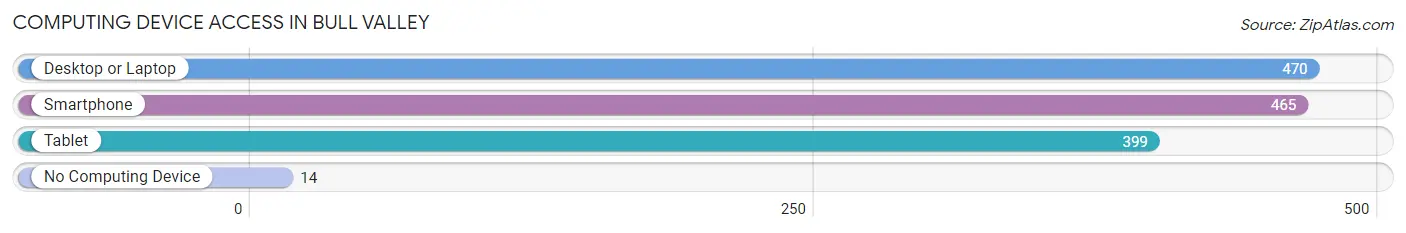
| Device Type | # Households | % Households |
| Desktop or Laptop | 470 | 93.2% |
| Smartphone | 465 | 92.3% |
| Tablet | 399 | 79.2% |
| No Computing Device | 14 | 2.8% |
| Total | 504 | 100.0% |
Internet Access in Bull Valley
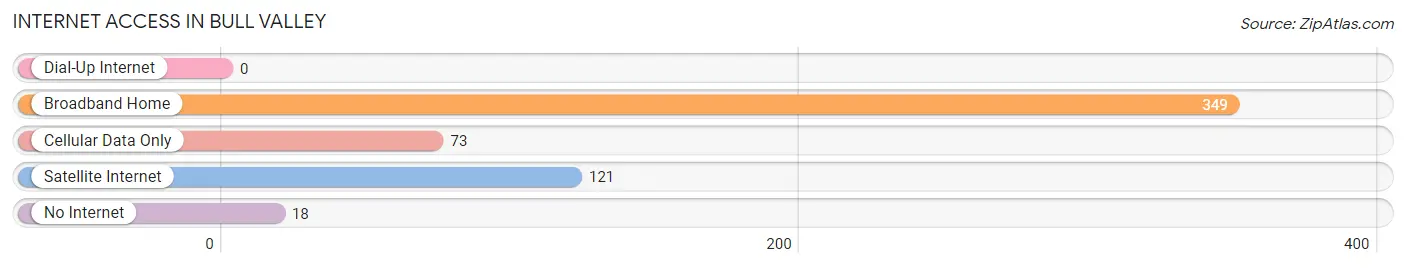
| Internet Type | # Households | % Households |
| Dial-Up Internet | 0 | 0.0% |
| Broadband Home | 349 | 69.3% |
| Cellular Data Only | 73 | 14.5% |
| Satellite Internet | 121 | 24.0% |
| No Internet | 18 | 3.6% |
| Total | 504 | 100.0% |
Bull Valley Summary
Bull Valley is a small village located in McHenry County, Illinois, United States. It is situated in the northwest corner of the county, about 40 miles northwest of Chicago. The village is bordered by the towns of Greenwood, McHenry, and Wonder Lake. As of the 2010 census, the population of Bull Valley was 1,093.
Geography
Bull Valley is located at 42°17'25"N 88°25'45"W (42.290278, -88.429167). According to the United States Census Bureau, the village has a total area of 1.2 square miles (3.1 km2), all land.
The village is located in the Fox River Valley, which is part of the larger Chicago metropolitan area. The Fox River runs through the village, and is a popular spot for fishing and boating. The village is also home to several parks, including Bull Valley Park, which features a playground, picnic area, and walking trails.
Demographics
As of the 2010 census, there were 1,093 people, 441 households, and 315 families residing in the village. The population density was 908.3 people per square mile (351.2/km2). There were 463 housing units at an average density of 382.5 per square mile (147.7/km2). The racial makeup of the village was 97.2% White, 0.3% African American, 0.2% Native American, 0.7% Asian, 0.1% Pacific Islander, 0.7% from other races, and 0.9% from two or more races. Hispanic or Latino of any race were 2.3% of the population.
There were 441 households, out of which 28.2% had children under the age of 18 living with them, 58.2% were married couples living together, 8.6% had a female householder with no husband present, and 29.7% were non-families. 24.3% of all households were made up of individuals, and 9.3% had someone living alone who was 65 years of age or older. The average household size was 2.48 and the average family size was 2.97.
In the village, the population was spread out, with 23.2% under the age of 18, 6.2% from 18 to 24, 28.2% from 25 to 44, 28.2% from 45 to 64, and 14.2% who were 65 years of age or older. The median age was 40 years. For every 100 females, there were 97.2 males. For every 100 females age 18 and over, there were 94.2 males.
The median income for a household in the village was $68,750, and the median income for a family was $77,500. Males had a median income of $50,000 versus $37,500 for females. The per capita income for the village was $31,945. About 2.2% of families and 3.2% of the population were below the poverty line, including 4.2% of those under age 18 and 4.2% of those age 65 or over.
Economy
Bull Valley is a small, rural village with a primarily agricultural economy. The village is home to several farms, which produce a variety of crops, including corn, soybeans, and wheat. The village is also home to several small businesses, including a grocery store, a hardware store, and a few restaurants.
The village is also home to several small manufacturing companies, including a plastics manufacturer and a metal fabrication company. The village is also home to a few small technology companies, including a software development company and a web design firm.
Conclusion
Bull Valley is a small village located in McHenry County, Illinois, about 40 miles northwest of Chicago. The village is bordered by the towns of Greenwood, McHenry, and Wonder Lake. As of the 2010 census, the population of Bull Valley was 1,093. The village is located in the Fox River Valley, and is home to several parks, including Bull Valley Park. The village has a primarily agricultural economy, with several farms producing a variety of crops, as well as several small businesses and manufacturing companies.
Common Questions
What is Per Capita Income in Bull Valley?
Per Capita income in Bull Valley is $93,289.
What is the Median Family Income in Bull Valley?
Median Family Income in Bull Valley is $168,750.
What is the Median Household income in Bull Valley?
Median Household Income in Bull Valley is $147,500.
What is Income or Wage Gap in Bull Valley?
Income or Wage Gap in Bull Valley is 42.6%.
Women in Bull Valley earn 57.4 cents for every dollar earned by a man.
What is Inequality or Gini Index in Bull Valley?
Inequality or Gini Index in Bull Valley is 0.54.
What is the Total Population of Bull Valley?
Total Population of Bull Valley is 1,248.
What is the Total Male Population of Bull Valley?
Total Male Population of Bull Valley is 625.
What is the Total Female Population of Bull Valley?
Total Female Population of Bull Valley is 623.
What is the Ratio of Males per 100 Females in Bull Valley?
There are 100.32 Males per 100 Females in Bull Valley.
What is the Ratio of Females per 100 Males in Bull Valley?
There are 99.68 Females per 100 Males in Bull Valley.
What is the Median Population Age in Bull Valley?
Median Population Age in Bull Valley is 58.9 Years.
What is the Average Family Size in Bull Valley
Average Family Size in Bull Valley is 2.7 People.
What is the Average Household Size in Bull Valley
Average Household Size in Bull Valley is 2.5 People.
How Large is the Labor Force in Bull Valley?
There are 605 People in the Labor Forcein in Bull Valley.
What is the Percentage of People in the Labor Force in Bull Valley?
52.1% of People are in the Labor Force in Bull Valley.
What is the Unemployment Rate in Bull Valley?
Unemployment Rate in Bull Valley is 5.1%.