Spring Grove, IL Map & Demographics
Spring Grove Map
Spring Grove Overview
$55,099
PER CAPITA INCOME
$139,557
AVG FAMILY INCOME
$137,891
AVG HOUSEHOLD INCOME
20.0%
WAGE / INCOME GAP [ % ]
80.0¢/ $1
WAGE / INCOME GAP [ $ ]
0.38
INEQUALITY / GINI INDEX
5,694
TOTAL POPULATION
3,082
MALE POPULATION
2,612
FEMALE POPULATION
117.99
MALES / 100 FEMALES
84.75
FEMALES / 100 MALES
40.2
MEDIAN AGE
3.2
AVG FAMILY SIZE
3.1
AVG HOUSEHOLD SIZE
3,094
LABOR FORCE [ PEOPLE ]
67.9%
PERCENT IN LABOR FORCE
8.9%
UNEMPLOYMENT RATE
Spring Grove Zip Codes
Spring Grove Area Codes
Income in Spring Grove
Income Overview in Spring Grove
Per Capita Income in Spring Grove is $55,099, while median incomes of families and households are $139,557 and $137,891 respectively.
| Characteristic | Number | Measure |
| Per Capita Income | 5,694 | $55,099 |
| Median Family Income | 1,685 | $139,557 |
| Mean Family Income | 1,685 | $174,496 |
| Median Household Income | 1,825 | $137,891 |
| Mean Household Income | 1,825 | $168,754 |
| Income Deficit | 1,685 | $0 |
| Wage / Income Gap (%) | 5,694 | 20.04% |
| Wage / Income Gap ($) | 5,694 | 79.96¢ per $1 |
| Gini / Inequality Index | 5,694 | 0.38 |
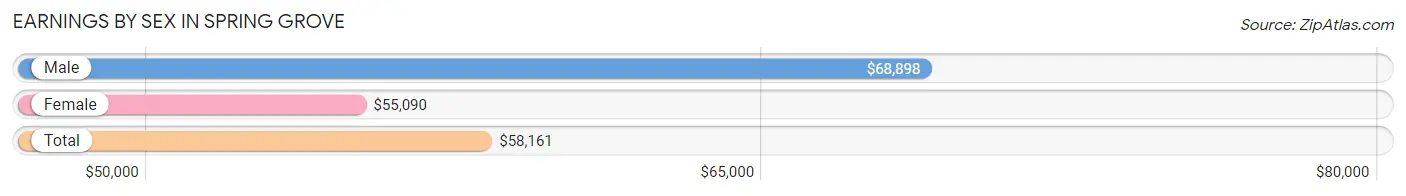
Earnings by Sex in Spring Grove
Average Earnings in Spring Grove are $58,161, $68,898 for men and $55,090 for women, a difference of 20.0%.
| Sex | Number | Average Earnings |
| Male | 2,018 (59.6%) | $68,898 |
| Female | 1,371 (40.5%) | $55,090 |
| Total | 3,389 (100.0%) | $58,161 |
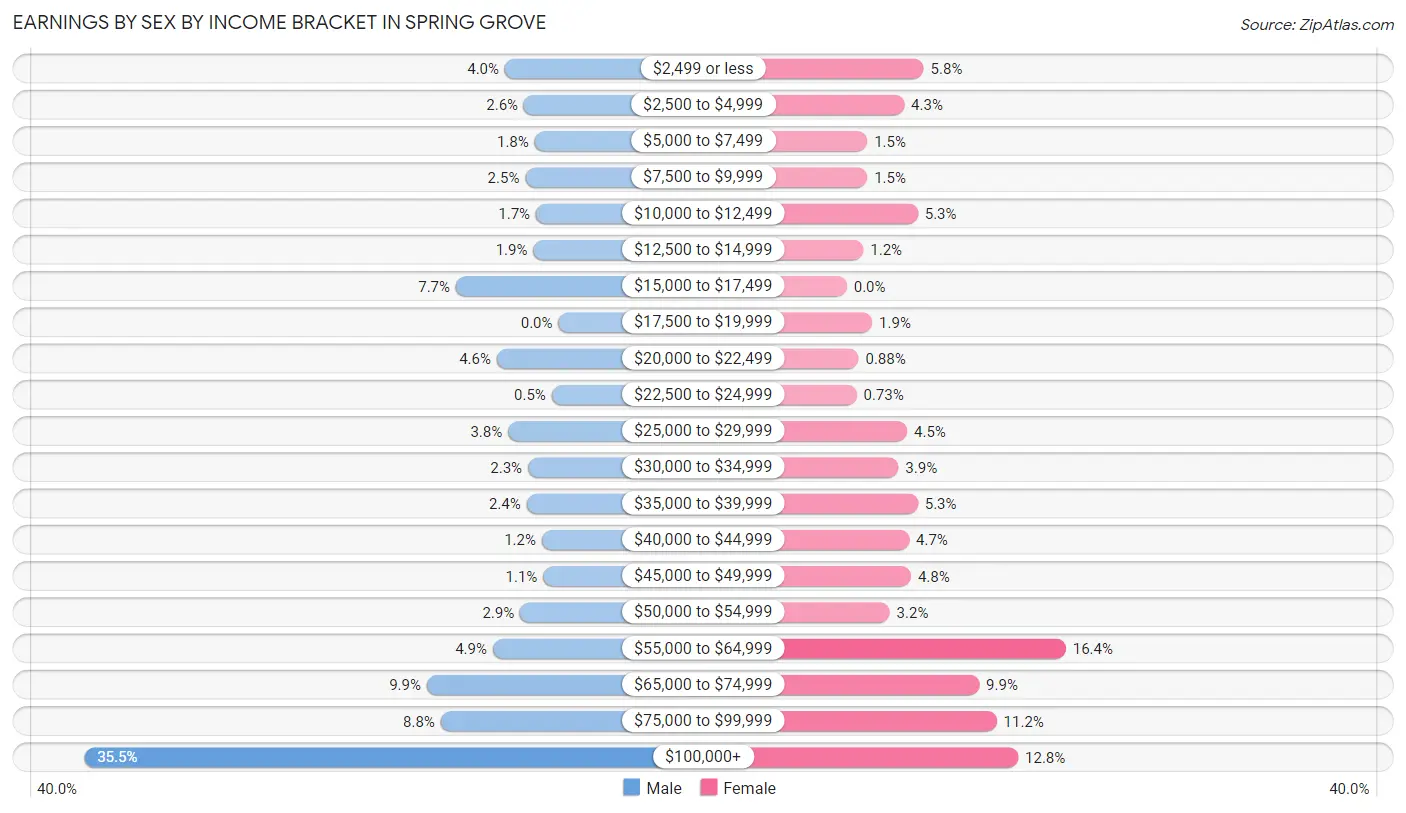
Earnings by Sex by Income Bracket in Spring Grove
The most common earnings brackets in Spring Grove are $100,000+ for men (717 | 35.5%) and $55,000 to $64,999 for women (225 | 16.4%).
| Income | Male | Female |
| $2,499 or less | 81 (4.0%) | 79 (5.8%) |
| $2,500 to $4,999 | 52 (2.6%) | 59 (4.3%) |
| $5,000 to $7,499 | 36 (1.8%) | 21 (1.5%) |
| $7,500 to $9,999 | 50 (2.5%) | 21 (1.5%) |
| $10,000 to $12,499 | 34 (1.7%) | 73 (5.3%) |
| $12,500 to $14,999 | 38 (1.9%) | 17 (1.2%) |
| $15,000 to $17,499 | 155 (7.7%) | 0 (0.0%) |
| $17,500 to $19,999 | 0 (0.0%) | 26 (1.9%) |
| $20,000 to $22,499 | 93 (4.6%) | 12 (0.9%) |
| $22,500 to $24,999 | 10 (0.5%) | 10 (0.7%) |
| $25,000 to $29,999 | 76 (3.8%) | 62 (4.5%) |
| $30,000 to $34,999 | 46 (2.3%) | 53 (3.9%) |
| $35,000 to $39,999 | 48 (2.4%) | 73 (5.3%) |
| $40,000 to $44,999 | 25 (1.2%) | 64 (4.7%) |
| $45,000 to $49,999 | 23 (1.1%) | 66 (4.8%) |
| $50,000 to $54,999 | 58 (2.9%) | 44 (3.2%) |
| $55,000 to $64,999 | 99 (4.9%) | 225 (16.4%) |
| $65,000 to $74,999 | 199 (9.9%) | 136 (9.9%) |
| $75,000 to $99,999 | 178 (8.8%) | 154 (11.2%) |
| $100,000+ | 717 (35.5%) | 176 (12.8%) |
| Total | 2,018 (100.0%) | 1,371 (100.0%) |
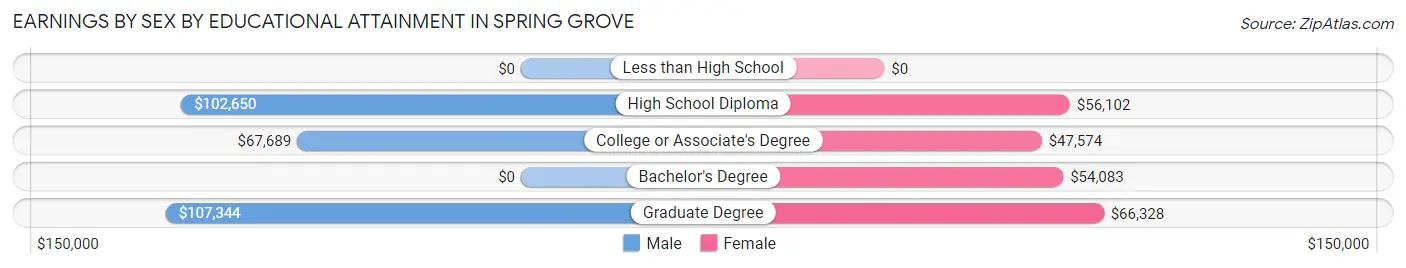
Earnings by Sex by Educational Attainment in Spring Grove
Average earnings in Spring Grove are $75,583 for men and $55,629 for women, a difference of 26.4%. Men with an educational attainment of graduate degree enjoy the highest average annual earnings of $107,344, while those with college or associate's degree education earn the least with $67,689. Women with an educational attainment of graduate degree earn the most with the average annual earnings of $66,328, while those with college or associate's degree education have the smallest earnings of $47,574.
| Educational Attainment | Male Income | Female Income |
| Less than High School | - | - |
| High School Diploma | $102,650 | $56,102 |
| College or Associate's Degree | $67,689 | $47,574 |
| Bachelor's Degree | - | - |
| Graduate Degree | $107,344 | $66,328 |
| Total | $75,583 | $55,629 |
Family Income in Spring Grove
Family Income Brackets in Spring Grove
According to the Spring Grove family income data, there are 470 families falling into the $200,000+ income range, which is the most common income bracket and makes up 27.9% of all families.
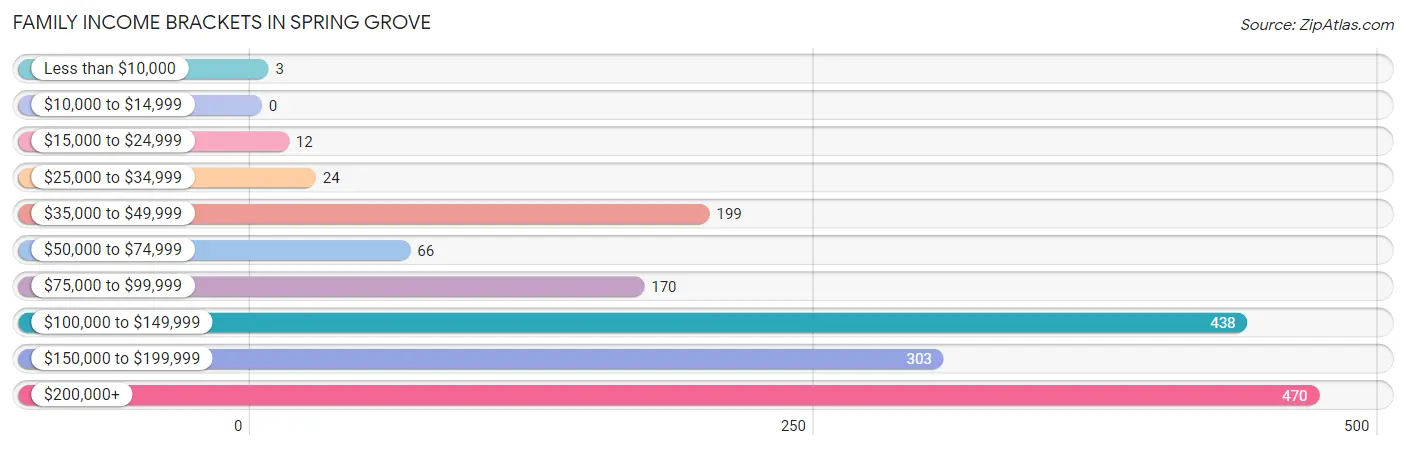
| Income Bracket | # Families | % Families |
| Less than $10,000 | 3 | 0.2% |
| $10,000 to $14,999 | 0 | 0.0% |
| $15,000 to $24,999 | 12 | 0.7% |
| $25,000 to $34,999 | 24 | 1.4% |
| $35,000 to $49,999 | 199 | 11.8% |
| $50,000 to $74,999 | 66 | 3.9% |
| $75,000 to $99,999 | 170 | 10.1% |
| $100,000 to $149,999 | 438 | 26.0% |
| $150,000 to $199,999 | 303 | 18.0% |
| $200,000+ | 470 | 27.9% |
Family Income by Famaliy Size in Spring Grove
5-person families (74 | 4.4%) account for the highest median family income in Spring Grove with $167,500 per family, while 2-person families (648 | 38.5%) have the highest median income of $59,262 per family member.
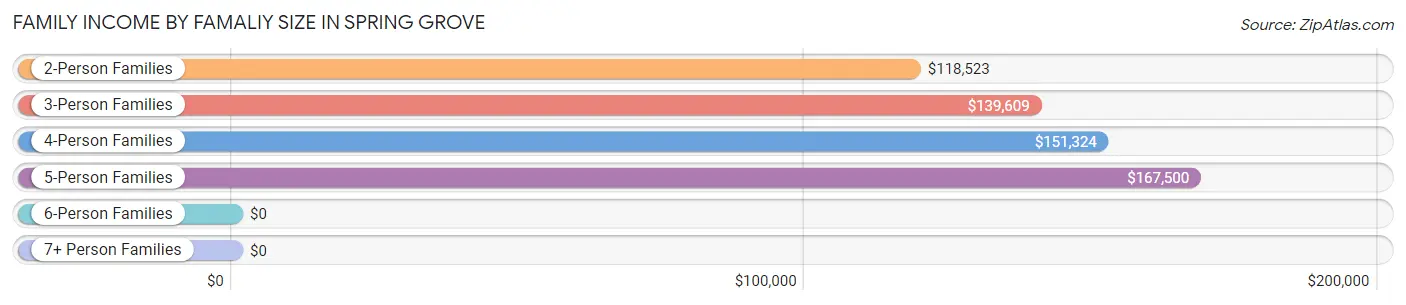
| Income Bracket | # Families | Median Income |
| 2-Person Families | 648 (38.5%) | $118,523 |
| 3-Person Families | 257 (15.2%) | $139,609 |
| 4-Person Families | 682 (40.5%) | $151,324 |
| 5-Person Families | 74 (4.4%) | $167,500 |
| 6-Person Families | 16 (0.9%) | $0 |
| 7+ Person Families | 8 (0.5%) | $0 |
| Total | 1,685 (100.0%) | $139,557 |
Family Income by Number of Earners in Spring Grove
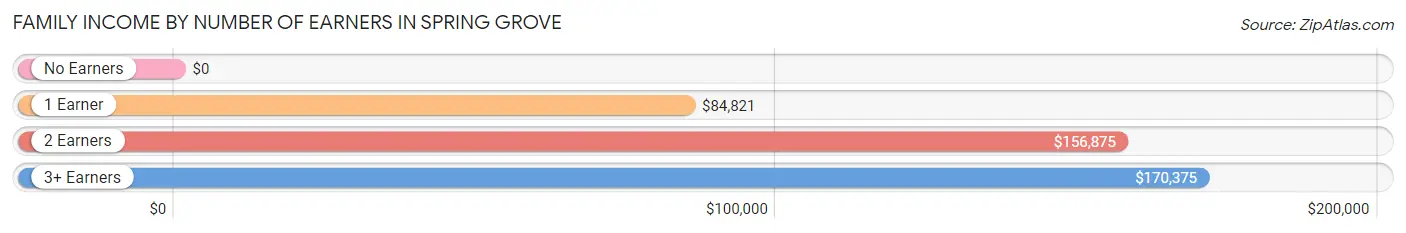
| Number of Earners | # Families | Median Income |
| No Earners | 66 (3.9%) | $0 |
| 1 Earner | 436 (25.9%) | $84,821 |
| 2 Earners | 916 (54.4%) | $156,875 |
| 3+ Earners | 267 (15.9%) | $170,375 |
| Total | 1,685 (100.0%) | $139,557 |
Household Income in Spring Grove
Household Income Brackets in Spring Grove
With 507 households falling in the category, the $100,000 to $149,999 income range is the most frequent in Spring Grove, accounting for 27.8% of all households.
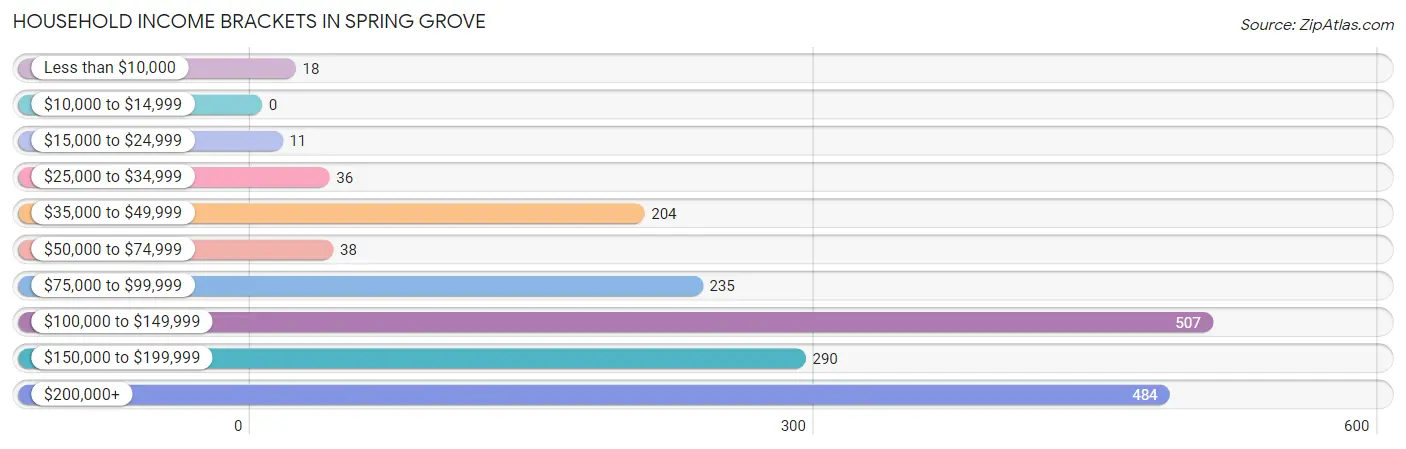
| Income Bracket | # Households | % Households |
| Less than $10,000 | 18 | 1.0% |
| $10,000 to $14,999 | 0 | 0.0% |
| $15,000 to $24,999 | 11 | 0.6% |
| $25,000 to $34,999 | 36 | 2.0% |
| $35,000 to $49,999 | 204 | 11.2% |
| $50,000 to $74,999 | 38 | 2.1% |
| $75,000 to $99,999 | 235 | 12.9% |
| $100,000 to $149,999 | 507 | 27.8% |
| $150,000 to $199,999 | 290 | 15.9% |
| $200,000+ | 484 | 26.5% |
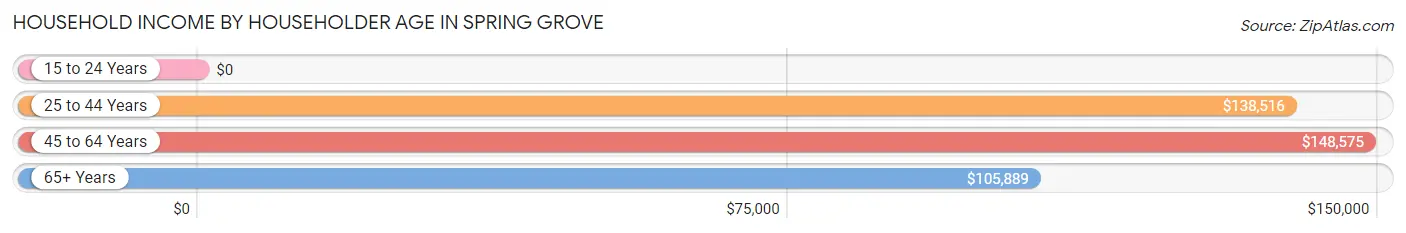
Household Income by Householder Age in Spring Grove
The median household income in Spring Grove is $137,891, with the highest median household income of $148,575 found in the 45 to 64 years age bracket for the primary householder. A total of 1,033 households (56.6%) fall into this category.
| Income Bracket | # Households | Median Income |
| 15 to 24 Years | 0 (0.0%) | $0 |
| 25 to 44 Years | 460 (25.2%) | $138,516 |
| 45 to 64 Years | 1,033 (56.6%) | $148,575 |
| 65+ Years | 332 (18.2%) | $105,889 |
| Total | 1,825 (100.0%) | $137,891 |
Poverty in Spring Grove
Income Below Poverty by Sex and Age in Spring Grove
With 0.5% poverty level for males and 1.8% for females among the residents of Spring Grove, 16 and 17 year old males and 15 year old females are the most vulnerable to poverty, with 6 males (3.8%) and 5 females (33.3%) in their respective age groups living below the poverty level.
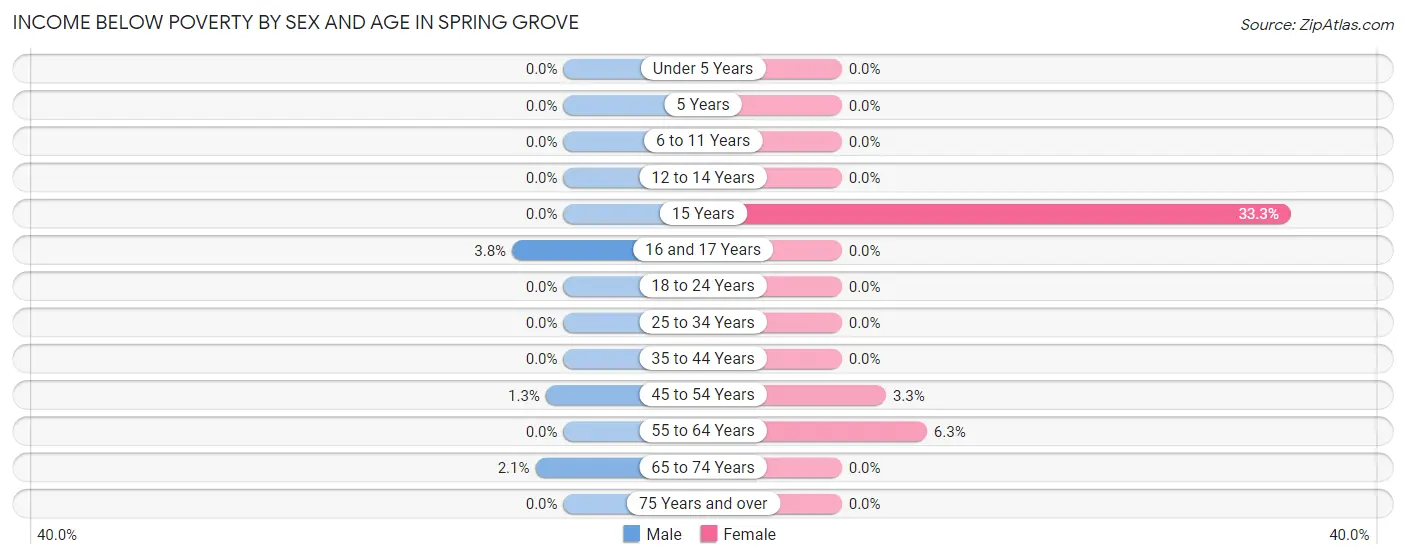
| Age Bracket | Male | Female |
| Under 5 Years | 0 (0.0%) | 0 (0.0%) |
| 5 Years | 0 (0.0%) | 0 (0.0%) |
| 6 to 11 Years | 0 (0.0%) | 0 (0.0%) |
| 12 to 14 Years | 0 (0.0%) | 0 (0.0%) |
| 15 Years | 0 (0.0%) | 5 (33.3%) |
| 16 and 17 Years | 6 (3.8%) | 0 (0.0%) |
| 18 to 24 Years | 0 (0.0%) | 0 (0.0%) |
| 25 to 34 Years | 0 (0.0%) | 0 (0.0%) |
| 35 to 44 Years | 0 (0.0%) | 0 (0.0%) |
| 45 to 54 Years | 5 (1.3%) | 16 (3.3%) |
| 55 to 64 Years | 0 (0.0%) | 27 (6.3%) |
| 65 to 74 Years | 6 (2.1%) | 0 (0.0%) |
| 75 Years and over | 0 (0.0%) | 0 (0.0%) |
| Total | 17 (0.5%) | 48 (1.8%) |
Income Above Poverty by Sex and Age in Spring Grove
According to the poverty statistics in Spring Grove, males aged under 5 years and females aged under 5 years are the age groups that are most secure financially, with 100.0% of males and 100.0% of females in these age groups living above the poverty line.
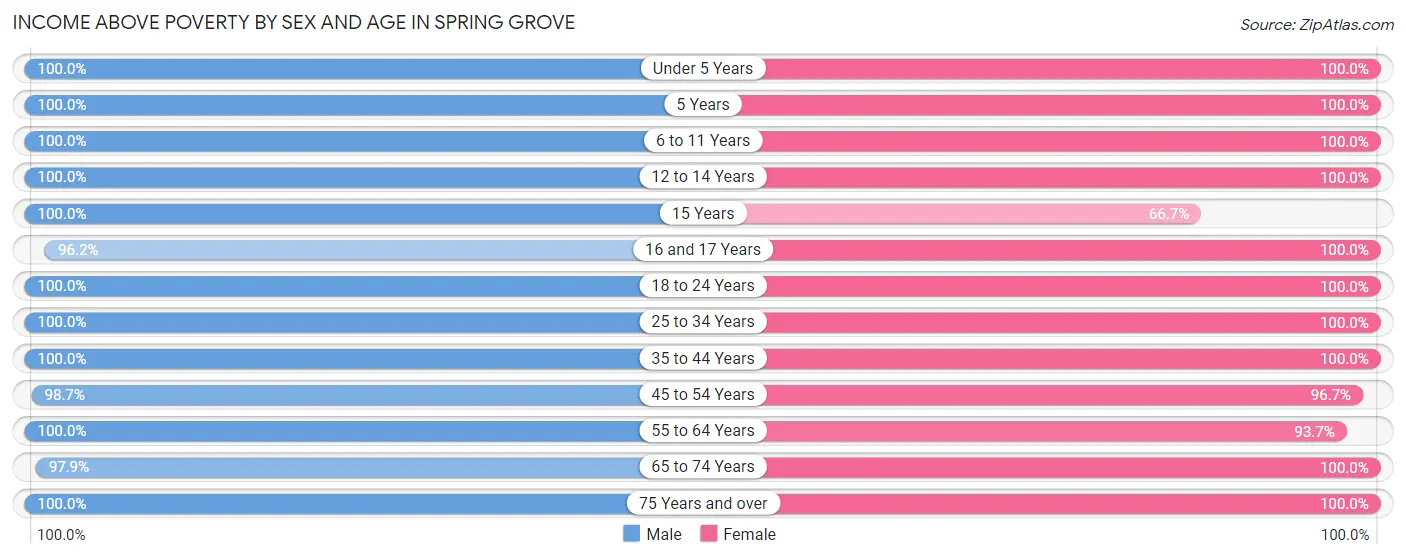
| Age Bracket | Male | Female |
| Under 5 Years | 218 (100.0%) | 249 (100.0%) |
| 5 Years | 10 (100.0%) | 24 (100.0%) |
| 6 to 11 Years | 298 (100.0%) | 110 (100.0%) |
| 12 to 14 Years | 38 (100.0%) | 165 (100.0%) |
| 15 Years | 11 (100.0%) | 10 (66.7%) |
| 16 and 17 Years | 151 (96.2%) | 135 (100.0%) |
| 18 to 24 Years | 221 (100.0%) | 45 (100.0%) |
| 25 to 34 Years | 338 (100.0%) | 422 (100.0%) |
| 35 to 44 Years | 396 (100.0%) | 241 (100.0%) |
| 45 to 54 Years | 377 (98.7%) | 472 (96.7%) |
| 55 to 64 Years | 659 (100.0%) | 400 (93.7%) |
| 65 to 74 Years | 283 (97.9%) | 151 (100.0%) |
| 75 Years and over | 65 (100.0%) | 140 (100.0%) |
| Total | 3,065 (99.5%) | 2,564 (98.2%) |
Income Below Poverty Among Married-Couple Families in Spring Grove
The poverty statistics for married-couple families in Spring Grove show that 0.3% or 4 of the total 1,470 families live below the poverty line. Families with 1 or 2 children have the highest poverty rate of 0.6%, comprising of 4 families. On the other hand, families with no children have the lowest poverty rate of 0.0%, which includes 0 families.
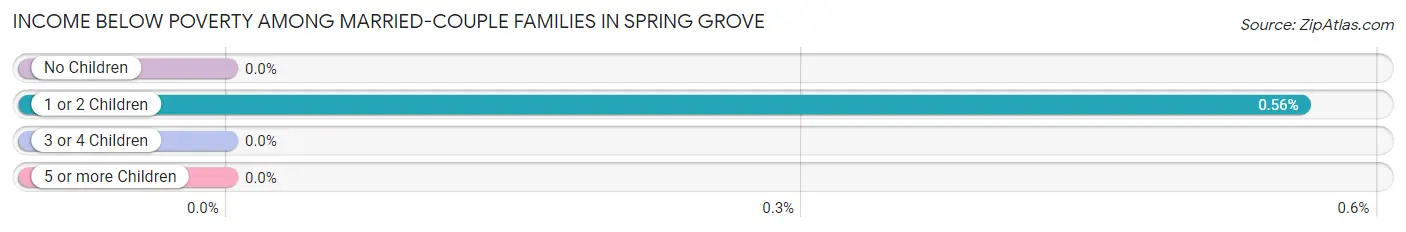
| Children | Above Poverty | Below Poverty |
| No Children | 713 (100.0%) | 0 (0.0%) |
| 1 or 2 Children | 705 (99.4%) | 4 (0.6%) |
| 3 or 4 Children | 48 (100.0%) | 0 (0.0%) |
| 5 or more Children | 0 (0.0%) | 0 (0.0%) |
| Total | 1,466 (99.7%) | 4 (0.3%) |
Income Below Poverty Among Single-Parent Households in Spring Grove
| Children | Single Father | Single Mother |
| No Children | 0 (0.0%) | 0 (0.0%) |
| 1 or 2 Children | 0 (0.0%) | 0 (0.0%) |
| 3 or 4 Children | 0 (0.0%) | 0 (0.0%) |
| 5 or more Children | 0 (0.0%) | 0 (0.0%) |
| Total | 0 (0.0%) | 0 (0.0%) |
Income Below Poverty Among Married-Couple vs Single-Parent Households in Spring Grove
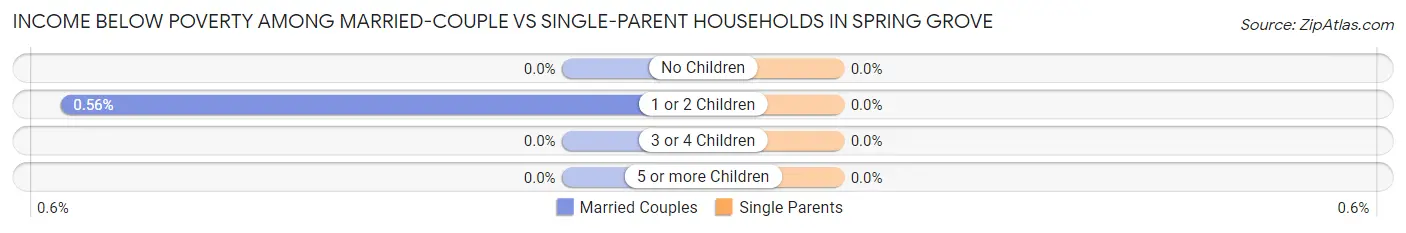
| Children | Married-Couple Families | Single-Parent Households |
| No Children | 0 (0.0%) | 0 (0.0%) |
| 1 or 2 Children | 4 (0.6%) | 0 (0.0%) |
| 3 or 4 Children | 0 (0.0%) | 0 (0.0%) |
| 5 or more Children | 0 (0.0%) | 0 (0.0%) |
| Total | 4 (0.3%) | 0 (0.0%) |
Race in Spring Grove
The most populous races in Spring Grove are White / Caucasian (4,919 | 86.4%), Two or more Races (514 | 9.0%), and Hispanic or Latino (361 | 6.3%).
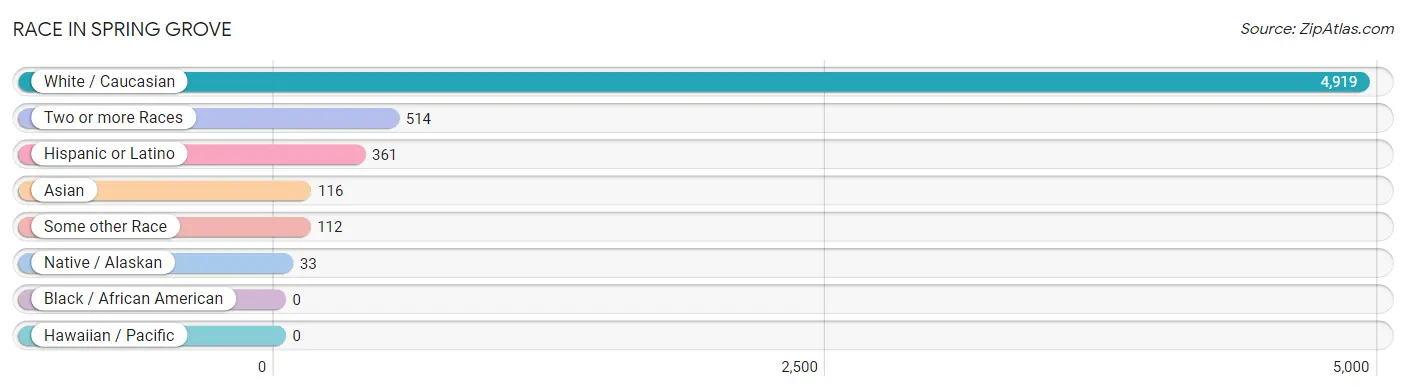
| Race | # Population | % Population |
| Asian | 116 | 2.0% |
| Black / African American | 0 | 0.0% |
| Hawaiian / Pacific | 0 | 0.0% |
| Hispanic or Latino | 361 | 6.3% |
| Native / Alaskan | 33 | 0.6% |
| White / Caucasian | 4,919 | 86.4% |
| Two or more Races | 514 | 9.0% |
| Some other Race | 112 | 2.0% |
| Total | 5,694 | 100.0% |
Ancestry in Spring Grove
The most populous ancestries reported in Spring Grove are German (2,191 | 38.5%), Irish (1,077 | 18.9%), Polish (676 | 11.9%), Italian (478 | 8.4%), and Thai (284 | 5.0%), together accounting for 82.6% of all Spring Grove residents.
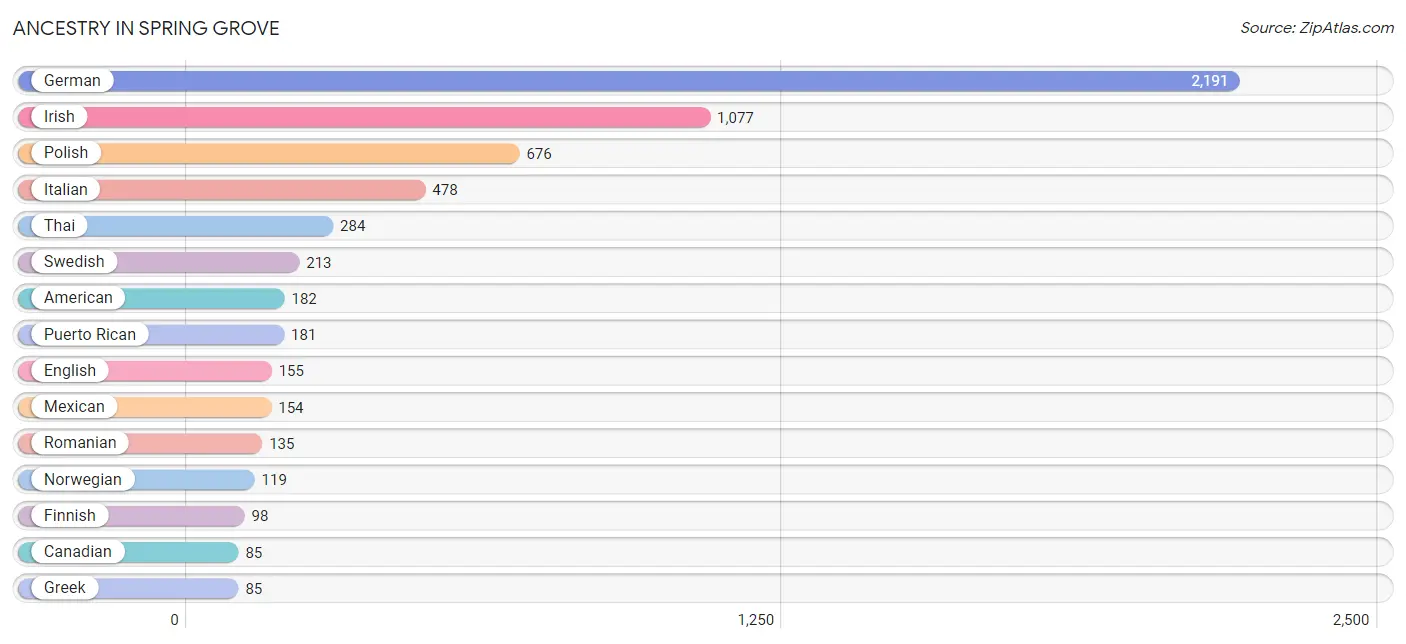
| Ancestry | # Population | % Population |
| American | 182 | 3.2% |
| Armenian | 47 | 0.8% |
| Austrian | 46 | 0.8% |
| Blackfeet | 7 | 0.1% |
| Canadian | 85 | 1.5% |
| Carpatho Rusyn | 10 | 0.2% |
| Central American | 26 | 0.5% |
| Central American Indian | 26 | 0.5% |
| Cherokee | 28 | 0.5% |
| Czech | 12 | 0.2% |
| Czechoslovakian | 7 | 0.1% |
| Danish | 15 | 0.3% |
| Dutch | 41 | 0.7% |
| Eastern European | 19 | 0.3% |
| English | 155 | 2.7% |
| Estonian | 49 | 0.9% |
| European | 9 | 0.2% |
| Finnish | 98 | 1.7% |
| French | 62 | 1.1% |
| French Canadian | 5 | 0.1% |
| German | 2,191 | 38.5% |
| Greek | 85 | 1.5% |
| Guatemalan | 26 | 0.5% |
| Indian (Asian) | 79 | 1.4% |
| Irish | 1,077 | 18.9% |
| Italian | 478 | 8.4% |
| Latvian | 11 | 0.2% |
| Lithuanian | 48 | 0.8% |
| Mexican | 154 | 2.7% |
| Mongolian | 12 | 0.2% |
| Northern European | 26 | 0.5% |
| Norwegian | 119 | 2.1% |
| Polish | 676 | 11.9% |
| Puerto Rican | 181 | 3.2% |
| Romanian | 135 | 2.4% |
| Scandinavian | 24 | 0.4% |
| Scotch-Irish | 14 | 0.3% |
| Scottish | 20 | 0.4% |
| Slovak | 19 | 0.3% |
| Sri Lankan | 58 | 1.0% |
| Swedish | 213 | 3.7% |
| Swiss | 30 | 0.5% |
| Thai | 284 | 5.0% |
| Ukrainian | 41 | 0.7% |
| Welsh | 36 | 0.6% | View All 45 Rows |
Immigrants in Spring Grove
The most numerous immigrant groups reported in Spring Grove came from Canada (86 | 1.5%), Europe (67 | 1.2%), Asia (49 | 0.9%), China (37 | 0.6%), and Eastern Asia (37 | 0.6%), together accounting for 4.9% of all Spring Grove residents.
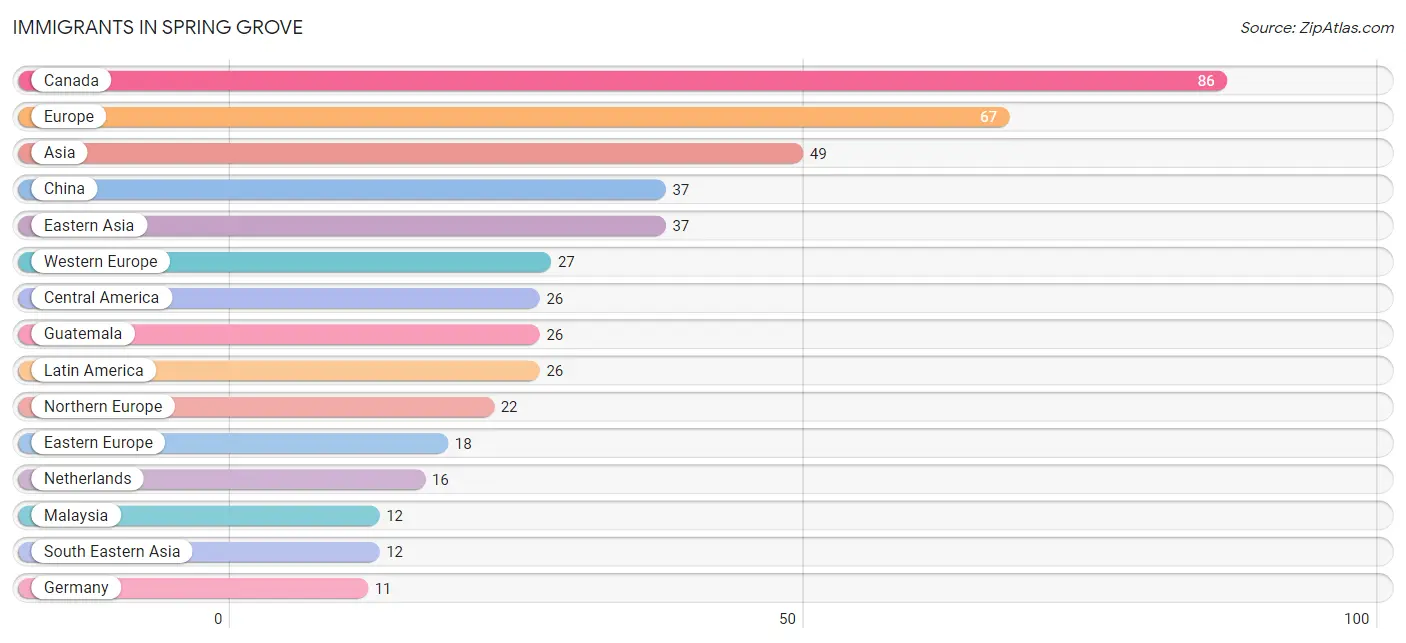
| Immigration Origin | # Population | % Population |
| Asia | 49 | 0.9% |
| Canada | 86 | 1.5% |
| Central America | 26 | 0.5% |
| China | 37 | 0.6% |
| Eastern Asia | 37 | 0.6% |
| Eastern Europe | 18 | 0.3% |
| England | 5 | 0.1% |
| Europe | 67 | 1.2% |
| Germany | 11 | 0.2% |
| Guatemala | 26 | 0.5% |
| Latin America | 26 | 0.5% |
| Malaysia | 12 | 0.2% |
| Netherlands | 16 | 0.3% |
| Northern Europe | 22 | 0.4% |
| Scotland | 9 | 0.2% |
| South Eastern Asia | 12 | 0.2% |
| Western Europe | 27 | 0.5% | View All 17 Rows |
Sex and Age in Spring Grove
Sex and Age in Spring Grove
The most populous age groups in Spring Grove are 55 to 59 Years (348 | 11.3%) for men and 50 to 54 Years (305 | 11.7%) for women.
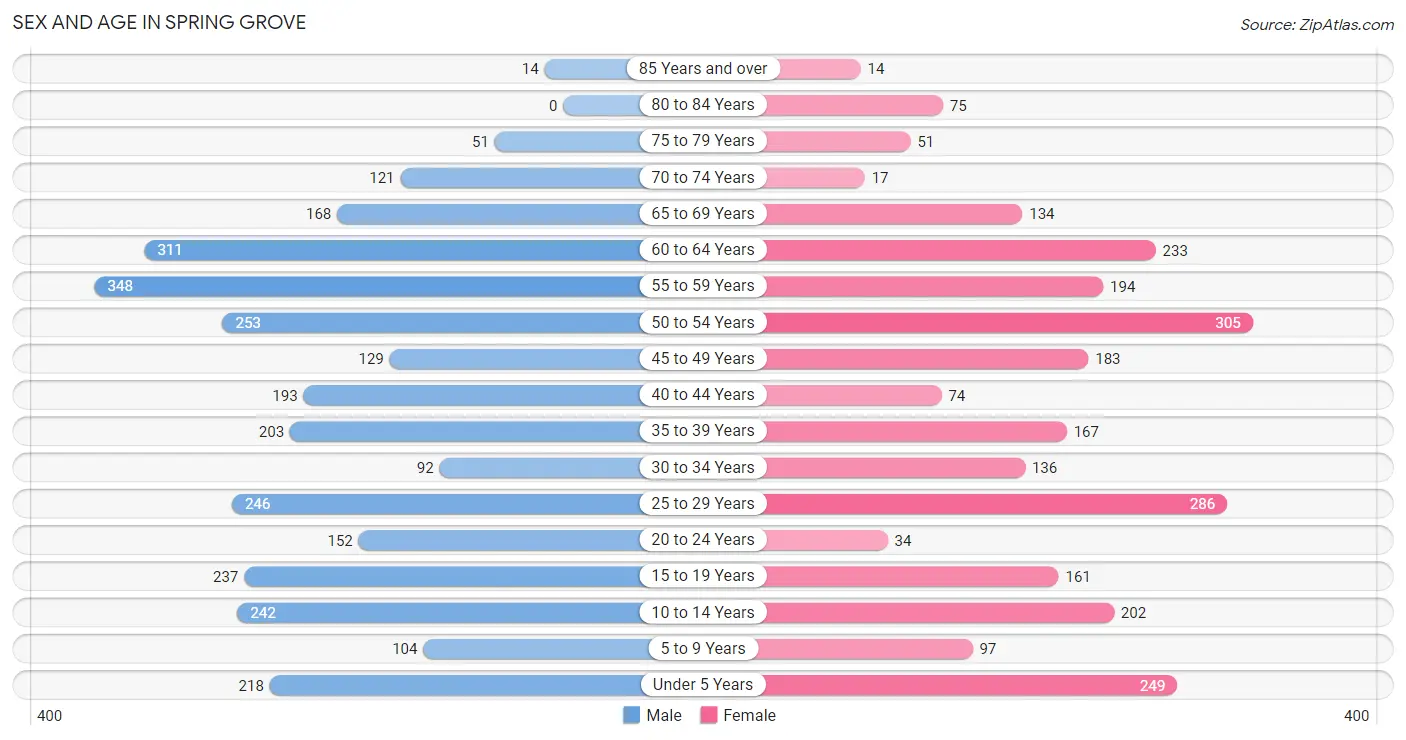
| Age Bracket | Male | Female |
| Under 5 Years | 218 (7.1%) | 249 (9.5%) |
| 5 to 9 Years | 104 (3.4%) | 97 (3.7%) |
| 10 to 14 Years | 242 (7.9%) | 202 (7.7%) |
| 15 to 19 Years | 237 (7.7%) | 161 (6.2%) |
| 20 to 24 Years | 152 (4.9%) | 34 (1.3%) |
| 25 to 29 Years | 246 (8.0%) | 286 (11.0%) |
| 30 to 34 Years | 92 (3.0%) | 136 (5.2%) |
| 35 to 39 Years | 203 (6.6%) | 167 (6.4%) |
| 40 to 44 Years | 193 (6.3%) | 74 (2.8%) |
| 45 to 49 Years | 129 (4.2%) | 183 (7.0%) |
| 50 to 54 Years | 253 (8.2%) | 305 (11.7%) |
| 55 to 59 Years | 348 (11.3%) | 194 (7.4%) |
| 60 to 64 Years | 311 (10.1%) | 233 (8.9%) |
| 65 to 69 Years | 168 (5.4%) | 134 (5.1%) |
| 70 to 74 Years | 121 (3.9%) | 17 (0.6%) |
| 75 to 79 Years | 51 (1.7%) | 51 (1.9%) |
| 80 to 84 Years | 0 (0.0%) | 75 (2.9%) |
| 85 Years and over | 14 (0.4%) | 14 (0.5%) |
| Total | 3,082 (100.0%) | 2,612 (100.0%) |
Families and Households in Spring Grove
Median Family Size in Spring Grove
The median family size in Spring Grove is 3.23 persons per family, with married-couple families (1,470 | 87.2%) accounting for the largest median family size of 3.27 persons per family. On the other hand, single female/mother families (85 | 5.0%) represent the smallest median family size with 2.73 persons per family.
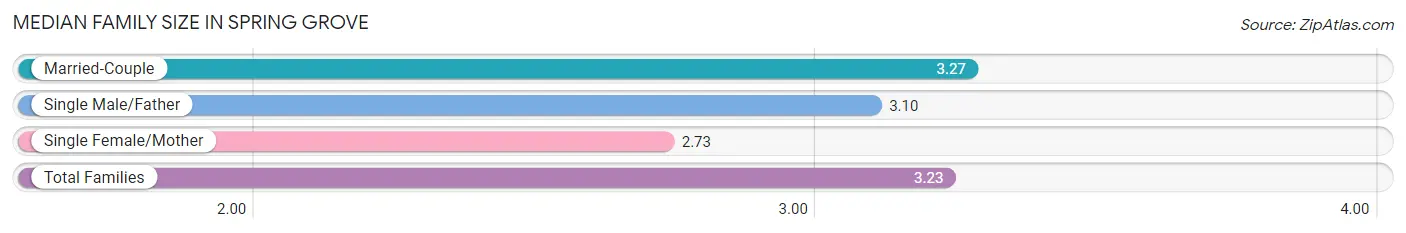
| Family Type | # Families | Family Size |
| Married-Couple | 1,470 (87.2%) | 3.27 |
| Single Male/Father | 130 (7.7%) | 3.10 |
| Single Female/Mother | 85 (5.0%) | 2.73 |
| Total Families | 1,685 (100.0%) | 3.23 |
Median Household Size in Spring Grove
The median household size in Spring Grove is 3.12 persons per household, with single female/mother households (85 | 4.7%) accounting for the largest median household size of 3.53 persons per household. non-family households (140 | 7.7%) represent the smallest median household size with 1.04 persons per household.
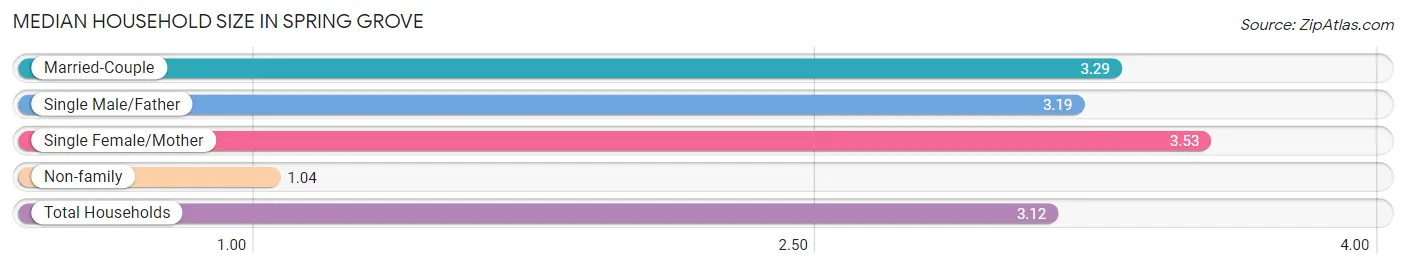
| Household Type | # Households | Household Size |
| Married-Couple | 1,470 (80.5%) | 3.29 |
| Single Male/Father | 130 (7.1%) | 3.19 |
| Single Female/Mother | 85 (4.7%) | 3.53 |
| Non-family | 140 (7.7%) | 1.04 |
| Total Households | 1,825 (100.0%) | 3.12 |
Household Size by Marriage Status in Spring Grove
Out of a total of 1,825 households in Spring Grove, 1,685 (92.3%) are family households, while 140 (7.7%) are nonfamily households. The most numerous type of family households are 4-person households, comprising 720, and the most common type of nonfamily households are 1-person households, comprising 134.
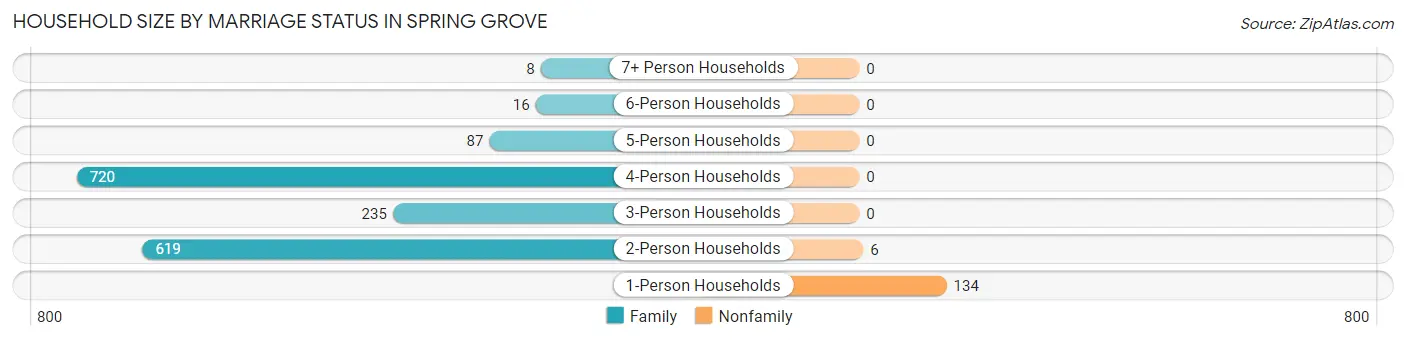
| Household Size | Family Households | Nonfamily Households |
| 1-Person Households | - | 134 (7.3%) |
| 2-Person Households | 619 (33.9%) | 6 (0.3%) |
| 3-Person Households | 235 (12.9%) | 0 (0.0%) |
| 4-Person Households | 720 (39.5%) | 0 (0.0%) |
| 5-Person Households | 87 (4.8%) | 0 (0.0%) |
| 6-Person Households | 16 (0.9%) | 0 (0.0%) |
| 7+ Person Households | 8 (0.4%) | 0 (0.0%) |
| Total | 1,685 (92.3%) | 140 (7.7%) |
Female Fertility in Spring Grove
Fertility by Age in Spring Grove
Average fertility rate in Spring Grove is 58.0 births per 1,000 women. Women in the age bracket of 20 to 34 years have the highest fertility rate with 116.0 births per 1,000 women. Women in the age bracket of 20 to 34 years acount for 84.1% of all women with births.
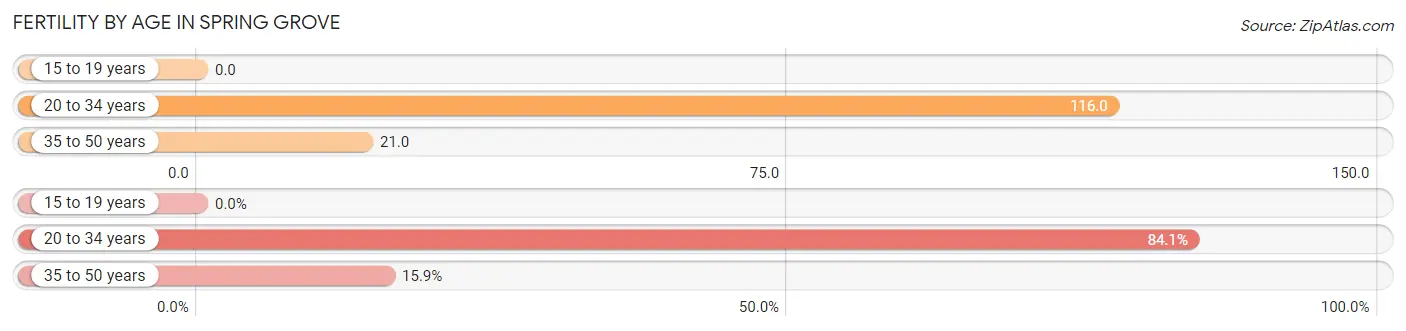
| Age Bracket | Women with Births | Births / 1,000 Women |
| 15 to 19 years | 0 (0.0%) | 0.0 |
| 20 to 34 years | 53 (84.1%) | 116.0 |
| 35 to 50 years | 10 (15.9%) | 21.0 |
| Total | 63 (100.0%) | 58.0 |
Fertility by Age by Marriage Status in Spring Grove
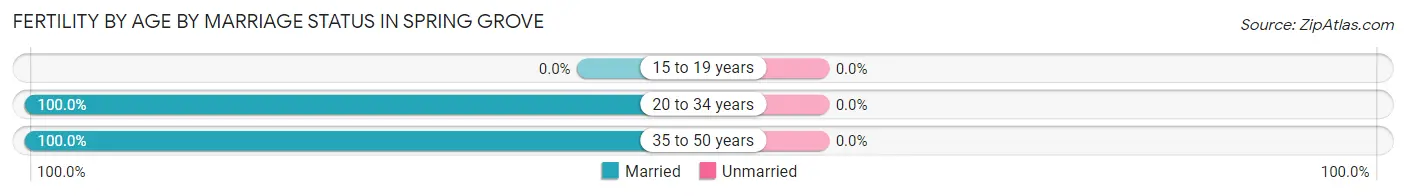
| Age Bracket | Married | Unmarried |
| 15 to 19 years | 0 (0.0%) | 0 (0.0%) |
| 20 to 34 years | 53 (100.0%) | 0 (0.0%) |
| 35 to 50 years | 10 (100.0%) | 0 (0.0%) |
| Total | 63 (100.0%) | 0 (0.0%) |
Fertility by Education in Spring Grove
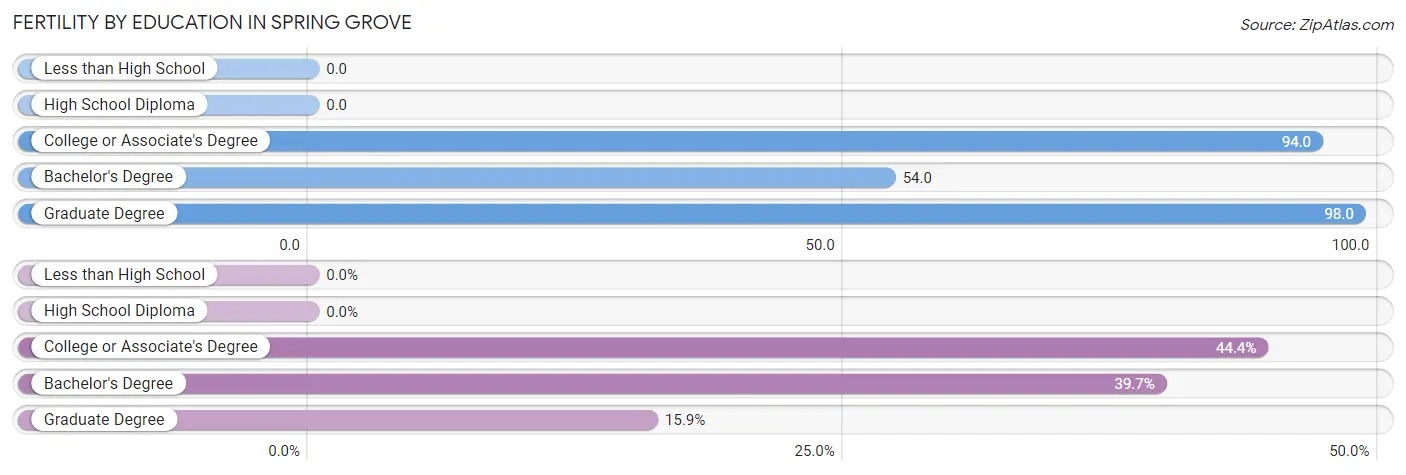
| Educational Attainment | Women with Births | Births / 1,000 Women |
| Less than High School | 0 (0.0%) | 0.0 |
| High School Diploma | 0 (0.0%) | 0.0 |
| College or Associate's Degree | 28 (44.4%) | 94.0 |
| Bachelor's Degree | 25 (39.7%) | 54.0 |
| Graduate Degree | 10 (15.9%) | 98.0 |
| Total | 63 (100.0%) | 58.0 |
Fertility by Education by Marriage Status in Spring Grove
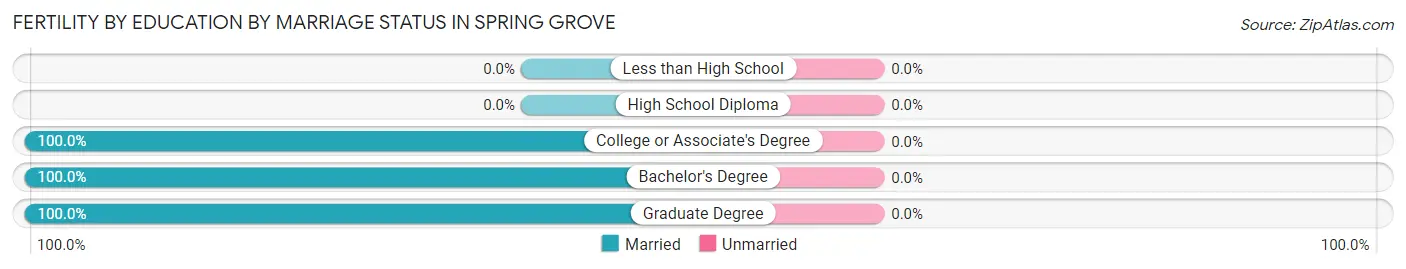
| Educational Attainment | Married | Unmarried |
| Less than High School | 0 (0.0%) | 0 (0.0%) |
| High School Diploma | 0 (0.0%) | 0 (0.0%) |
| College or Associate's Degree | 28 (100.0%) | 0 (0.0%) |
| Bachelor's Degree | 25 (100.0%) | 0 (0.0%) |
| Graduate Degree | 10 (100.0%) | 0 (0.0%) |
| Total | 63 (100.0%) | 0 (0.0%) |
Employment Characteristics in Spring Grove
Employment by Class of Employer in Spring Grove
Among the 2,766 employed individuals in Spring Grove, private company employees (1,896 | 68.5%), local government employees (447 | 16.2%), and self-employed (incorporated) (155 | 5.6%) make up the most common classes of employment.
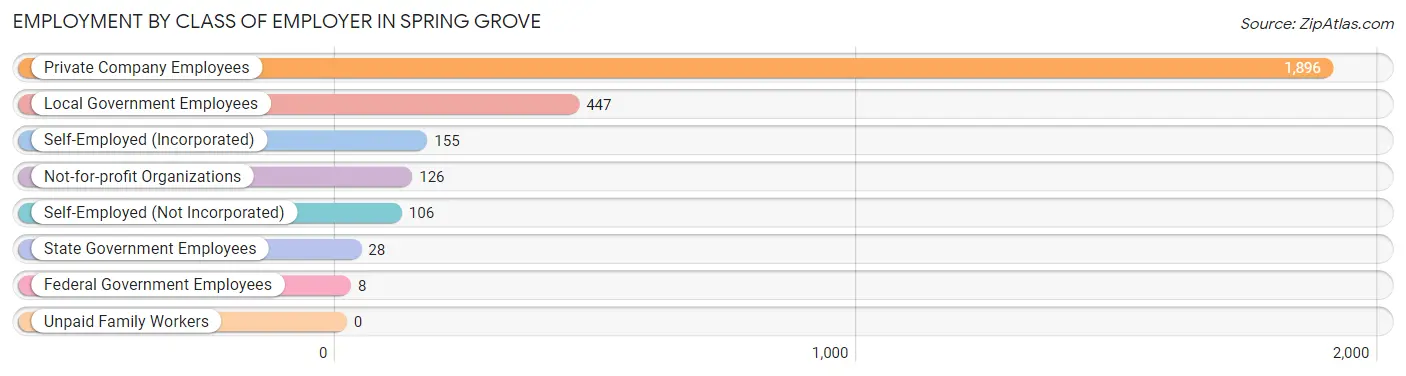
| Employer Class | # Employees | % Employees |
| Private Company Employees | 1,896 | 68.5% |
| Self-Employed (Incorporated) | 155 | 5.6% |
| Self-Employed (Not Incorporated) | 106 | 3.8% |
| Not-for-profit Organizations | 126 | 4.6% |
| Local Government Employees | 447 | 16.2% |
| State Government Employees | 28 | 1.0% |
| Federal Government Employees | 8 | 0.3% |
| Unpaid Family Workers | 0 | 0.0% |
| Total | 2,766 | 100.0% |
Employment Status by Age in Spring Grove
According to the labor force statistics for Spring Grove, out of the total population over 16 years of age (4,556), 67.9% or 3,094 individuals are in the labor force, with 8.9% or 275 of them unemployed. The age group with the highest labor force participation rate is 45 to 54 years, with 92.0% or 800 individuals in the labor force. Within the labor force, the 25 to 29 years age range has the highest percentage of unemployed individuals, with 47.0% or 198 of them being unemployed.
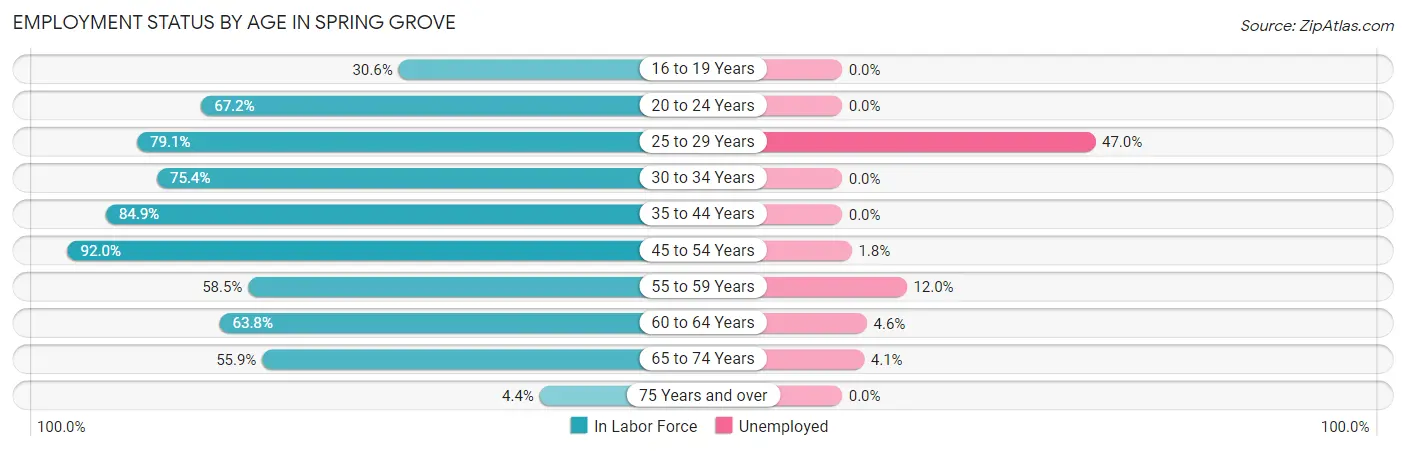
| Age Bracket | In Labor Force | Unemployed |
| 16 to 19 Years | 114 (30.6%) | 0 (0.0%) |
| 20 to 24 Years | 125 (67.2%) | 0 (0.0%) |
| 25 to 29 Years | 421 (79.1%) | 198 (47.0%) |
| 30 to 34 Years | 172 (75.4%) | 0 (0.0%) |
| 35 to 44 Years | 541 (84.9%) | 0 (0.0%) |
| 45 to 54 Years | 800 (92.0%) | 14 (1.8%) |
| 55 to 59 Years | 317 (58.5%) | 38 (12.0%) |
| 60 to 64 Years | 347 (63.8%) | 16 (4.6%) |
| 65 to 74 Years | 246 (55.9%) | 10 (4.1%) |
| 75 Years and over | 9 (4.4%) | 0 (0.0%) |
| Total | 3,094 (67.9%) | 275 (8.9%) |
Employment Status by Educational Attainment in Spring Grove
According to labor force statistics for Spring Grove, 77.5% of individuals (2,599) out of the total population between 25 and 64 years of age (3,353) are in the labor force, with 10.2% or 265 of them being unemployed. The group with the highest labor force participation rate are those with the educational attainment of less than high school, with 100.0% or 58 individuals in the labor force. Within the labor force, individuals with bachelor's degree or higher education have the highest percentage of unemployment, with 17.5% or 195 of them being unemployed.
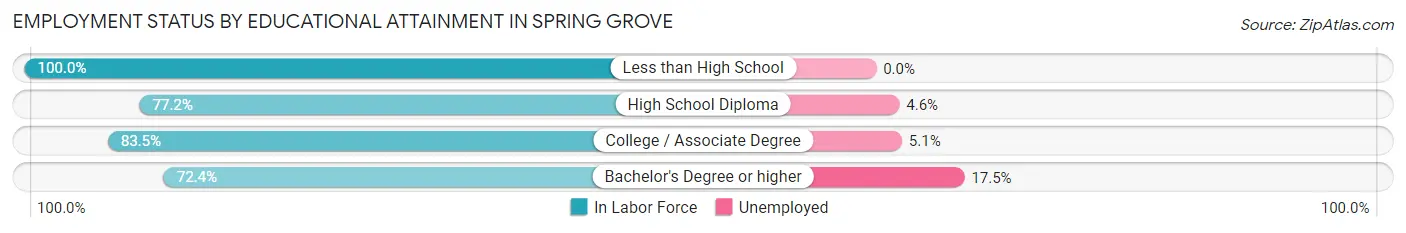
| Educational Attainment | In Labor Force | Unemployed |
| Less than High School | 58 (100.0%) | 0 (0.0%) |
| High School Diploma | 495 (77.2%) | 29 (4.6%) |
| College / Associate Degree | 929 (83.5%) | 57 (5.1%) |
| Bachelor's Degree or higher | 1,116 (72.4%) | 270 (17.5%) |
| Total | 2,599 (77.5%) | 342 (10.2%) |
Employment Occupations by Sex in Spring Grove
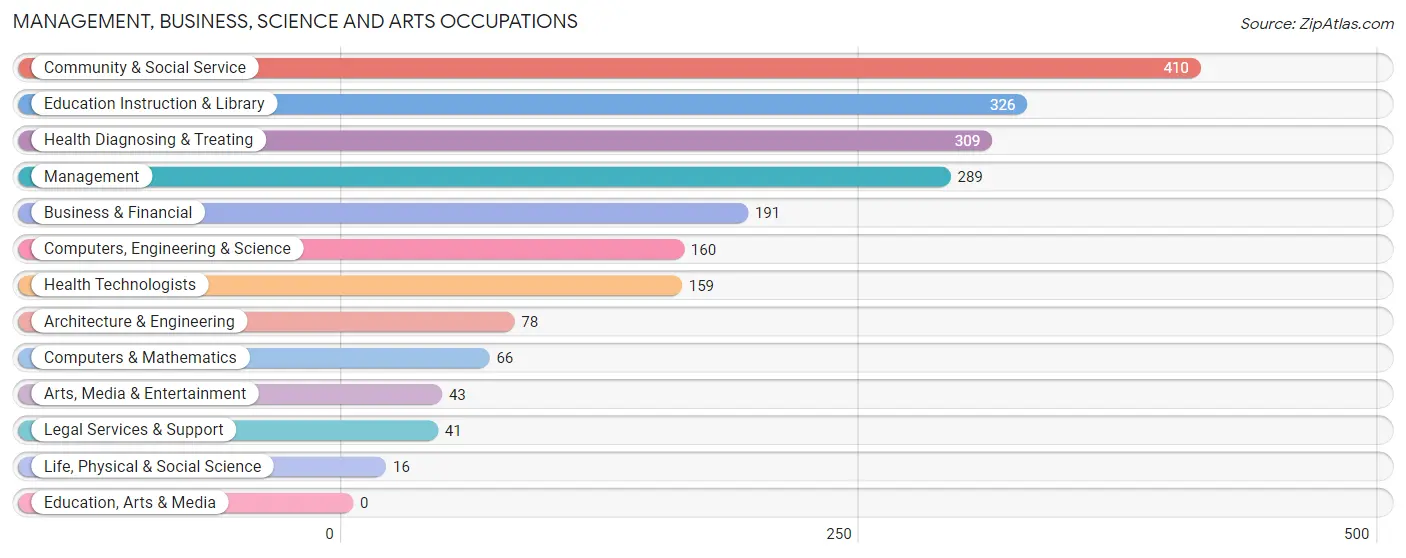
Management, Business, Science and Arts Occupations
The most common Management, Business, Science and Arts occupations in Spring Grove are Community & Social Service (410 | 14.6%), Education Instruction & Library (326 | 11.6%), Health Diagnosing & Treating (309 | 11.0%), Management (289 | 10.3%), and Business & Financial (191 | 6.8%).
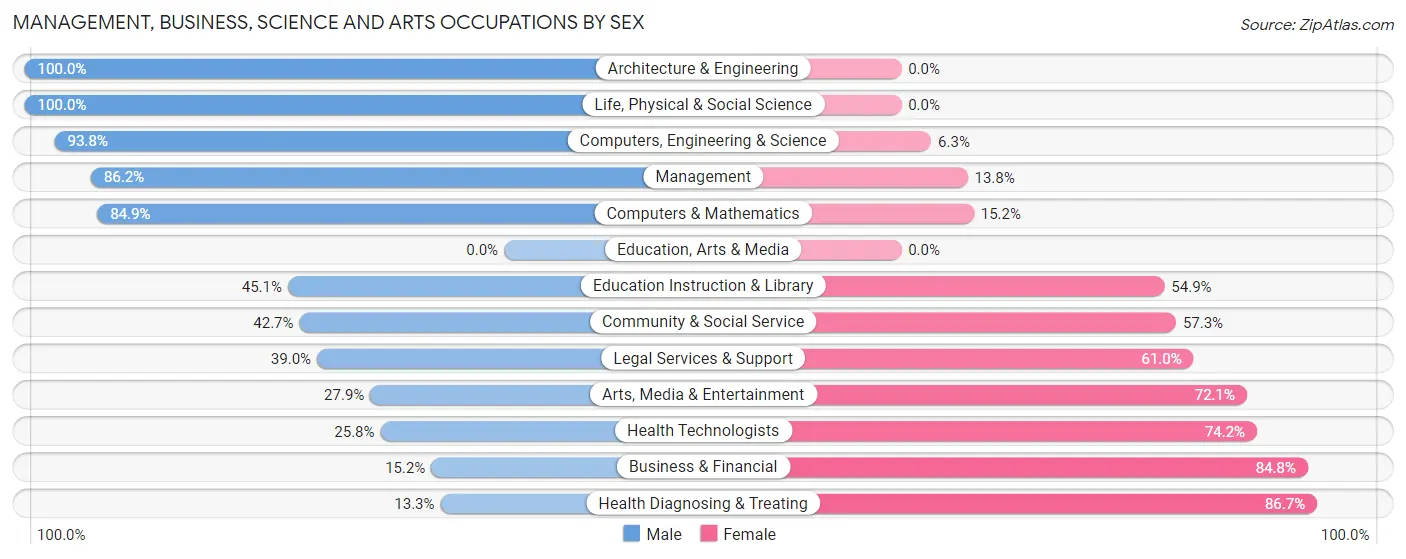
Management, Business, Science and Arts Occupations by Sex
Within the Management, Business, Science and Arts occupations in Spring Grove, the most male-oriented occupations are Architecture & Engineering (100.0%), Life, Physical & Social Science (100.0%), and Computers, Engineering & Science (93.8%), while the most female-oriented occupations are Health Diagnosing & Treating (86.7%), Business & Financial (84.8%), and Health Technologists (74.2%).
| Occupation | Male | Female |
| Management | 249 (86.2%) | 40 (13.8%) |
| Business & Financial | 29 (15.2%) | 162 (84.8%) |
| Computers, Engineering & Science | 150 (93.8%) | 10 (6.2%) |
| Computers & Mathematics | 56 (84.9%) | 10 (15.1%) |
| Architecture & Engineering | 78 (100.0%) | 0 (0.0%) |
| Life, Physical & Social Science | 16 (100.0%) | 0 (0.0%) |
| Community & Social Service | 175 (42.7%) | 235 (57.3%) |
| Education, Arts & Media | 0 (0.0%) | 0 (0.0%) |
| Legal Services & Support | 16 (39.0%) | 25 (61.0%) |
| Education Instruction & Library | 147 (45.1%) | 179 (54.9%) |
| Arts, Media & Entertainment | 12 (27.9%) | 31 (72.1%) |
| Health Diagnosing & Treating | 41 (13.3%) | 268 (86.7%) |
| Health Technologists | 41 (25.8%) | 118 (74.2%) |
| Total (Category) | 644 (47.4%) | 715 (52.6%) |
| Total (Overall) | 1,542 (54.8%) | 1,274 (45.2%) |
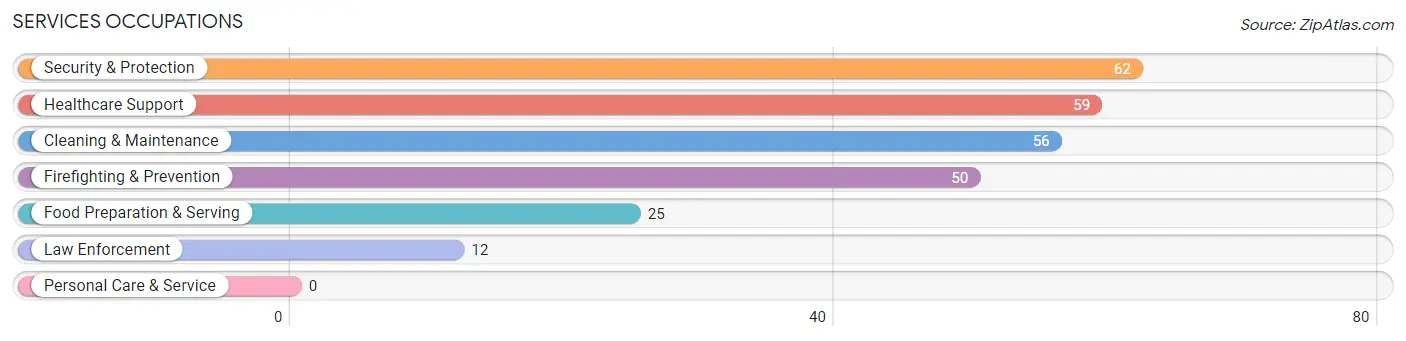
Services Occupations
The most common Services occupations in Spring Grove are Security & Protection (62 | 2.2%), Healthcare Support (59 | 2.1%), Cleaning & Maintenance (56 | 2.0%), Firefighting & Prevention (50 | 1.8%), and Food Preparation & Serving (25 | 0.9%).
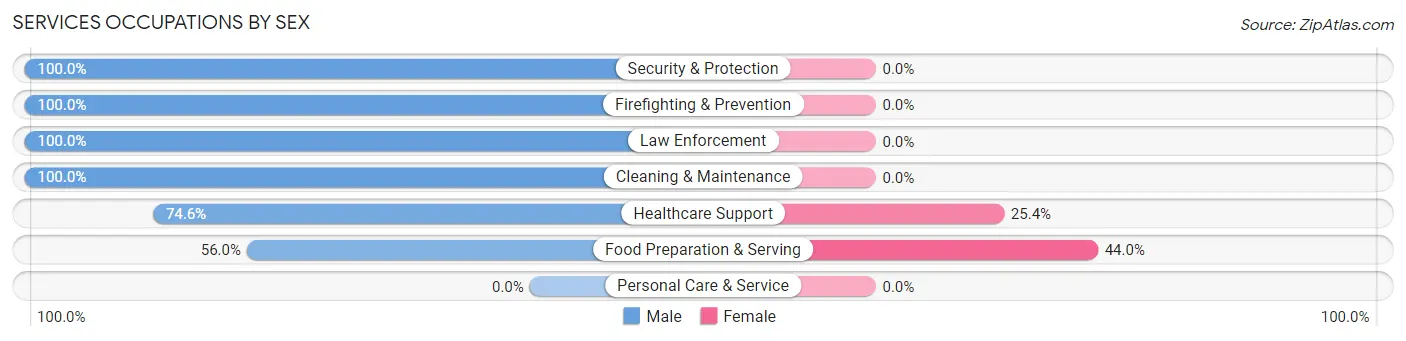
Services Occupations by Sex
Within the Services occupations in Spring Grove, the most male-oriented occupations are Security & Protection (100.0%), Firefighting & Prevention (100.0%), and Law Enforcement (100.0%), while the most female-oriented occupations are Food Preparation & Serving (44.0%), and Healthcare Support (25.4%).
| Occupation | Male | Female |
| Healthcare Support | 44 (74.6%) | 15 (25.4%) |
| Security & Protection | 62 (100.0%) | 0 (0.0%) |
| Firefighting & Prevention | 50 (100.0%) | 0 (0.0%) |
| Law Enforcement | 12 (100.0%) | 0 (0.0%) |
| Food Preparation & Serving | 14 (56.0%) | 11 (44.0%) |
| Cleaning & Maintenance | 56 (100.0%) | 0 (0.0%) |
| Personal Care & Service | 0 (0.0%) | 0 (0.0%) |
| Total (Category) | 176 (87.1%) | 26 (12.9%) |
| Total (Overall) | 1,542 (54.8%) | 1,274 (45.2%) |
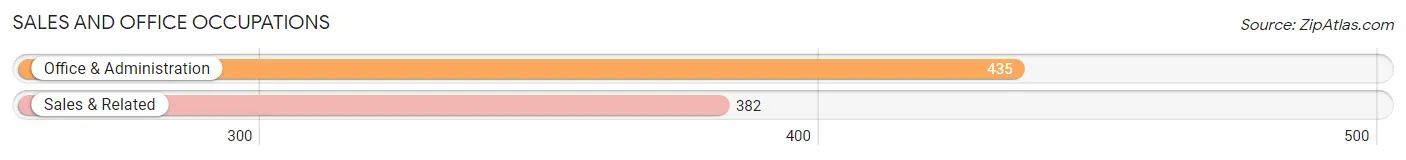
Sales and Office Occupations
The most common Sales and Office occupations in Spring Grove are Office & Administration (435 | 15.4%), and Sales & Related (382 | 13.6%).
Sales and Office Occupations by Sex
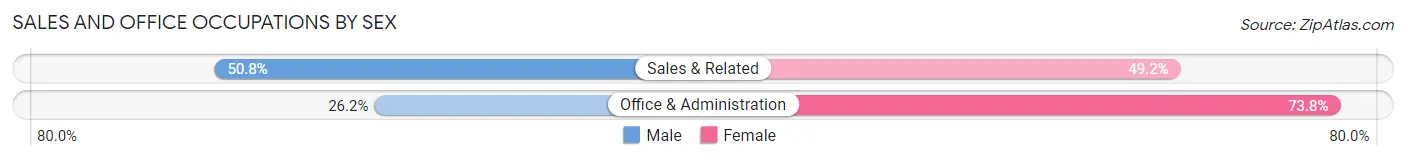
| Occupation | Male | Female |
| Sales & Related | 194 (50.8%) | 188 (49.2%) |
| Office & Administration | 114 (26.2%) | 321 (73.8%) |
| Total (Category) | 308 (37.7%) | 509 (62.3%) |
| Total (Overall) | 1,542 (54.8%) | 1,274 (45.2%) |
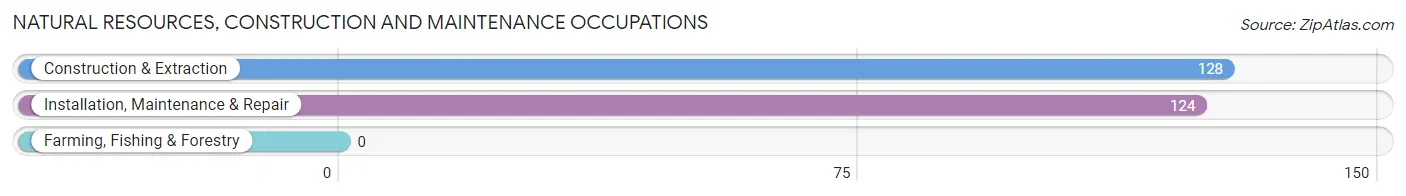
Natural Resources, Construction and Maintenance Occupations
The most common Natural Resources, Construction and Maintenance occupations in Spring Grove are Construction & Extraction (128 | 4.5%), and Installation, Maintenance & Repair (124 | 4.4%).
Natural Resources, Construction and Maintenance Occupations by Sex
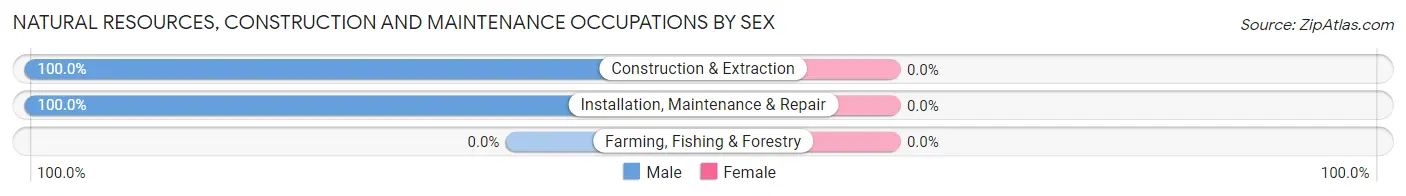
| Occupation | Male | Female |
| Farming, Fishing & Forestry | 0 (0.0%) | 0 (0.0%) |
| Construction & Extraction | 128 (100.0%) | 0 (0.0%) |
| Installation, Maintenance & Repair | 124 (100.0%) | 0 (0.0%) |
| Total (Category) | 252 (100.0%) | 0 (0.0%) |
| Total (Overall) | 1,542 (54.8%) | 1,274 (45.2%) |
Production, Transportation and Moving Occupations
The most common Production, Transportation and Moving occupations in Spring Grove are Material Moving (76 | 2.7%), Transportation (60 | 2.1%), and Production (50 | 1.8%).
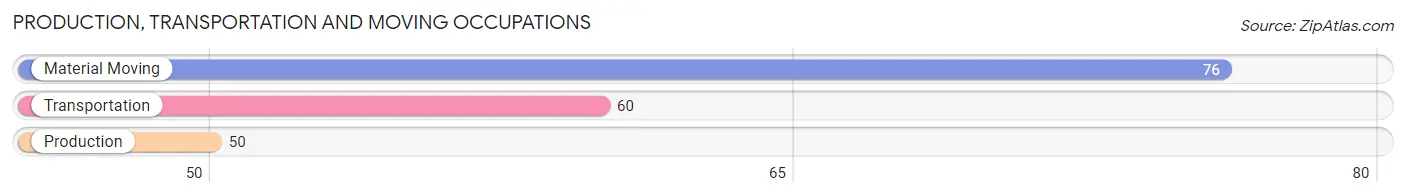
Production, Transportation and Moving Occupations by Sex
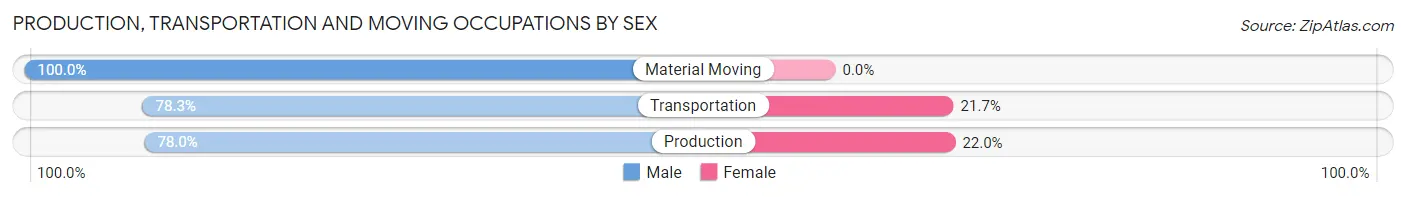
| Occupation | Male | Female |
| Production | 39 (78.0%) | 11 (22.0%) |
| Transportation | 47 (78.3%) | 13 (21.7%) |
| Material Moving | 76 (100.0%) | 0 (0.0%) |
| Total (Category) | 162 (87.1%) | 24 (12.9%) |
| Total (Overall) | 1,542 (54.8%) | 1,274 (45.2%) |
Employment Industries by Sex in Spring Grove
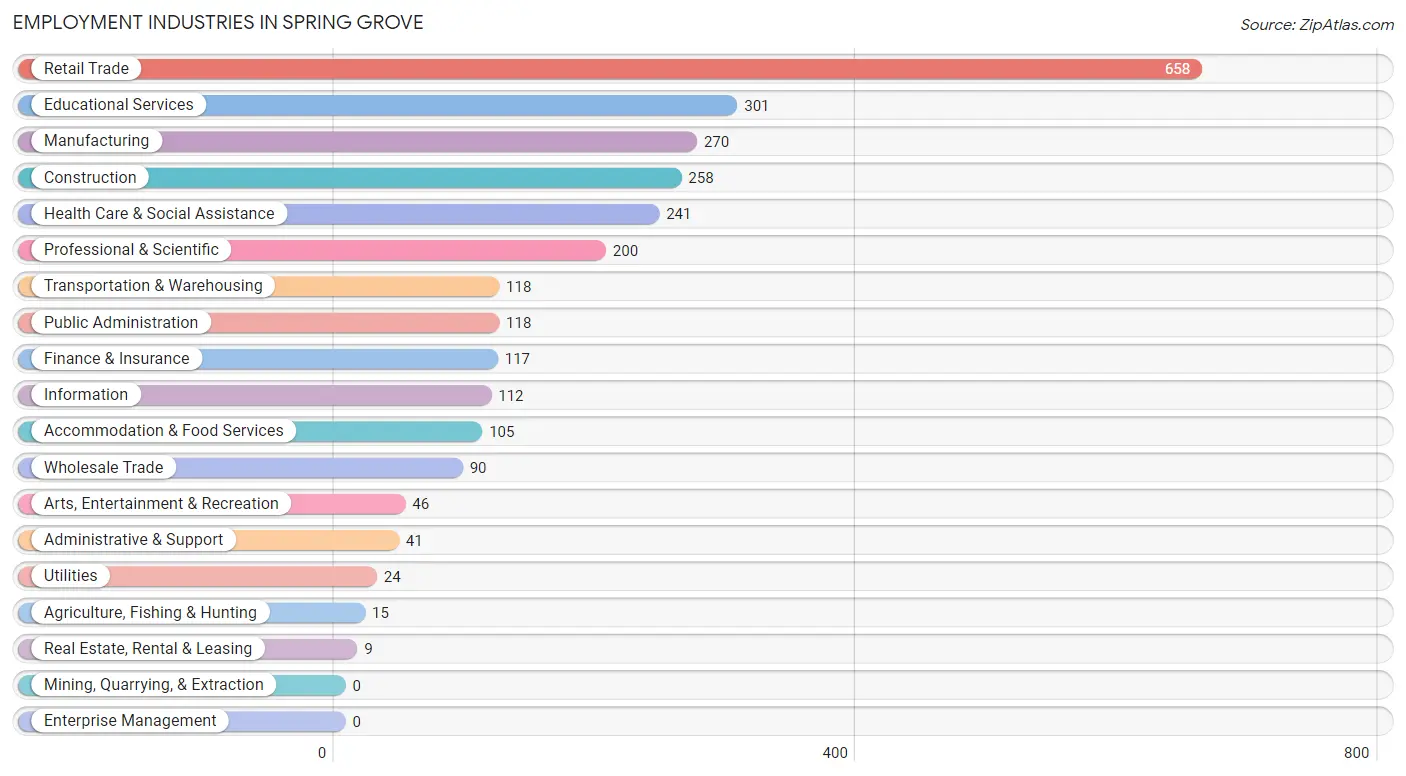
Employment Industries in Spring Grove
The major employment industries in Spring Grove include Retail Trade (658 | 23.4%), Educational Services (301 | 10.7%), Manufacturing (270 | 9.6%), Construction (258 | 9.2%), and Health Care & Social Assistance (241 | 8.6%).
Employment Industries by Sex in Spring Grove
The Spring Grove industries that see more men than women are Agriculture, Fishing & Hunting (100.0%), Utilities (100.0%), and Arts, Entertainment & Recreation (100.0%), whereas the industries that tend to have a higher number of women are Information (100.0%), Real Estate, Rental & Leasing (100.0%), and Finance & Insurance (89.7%).
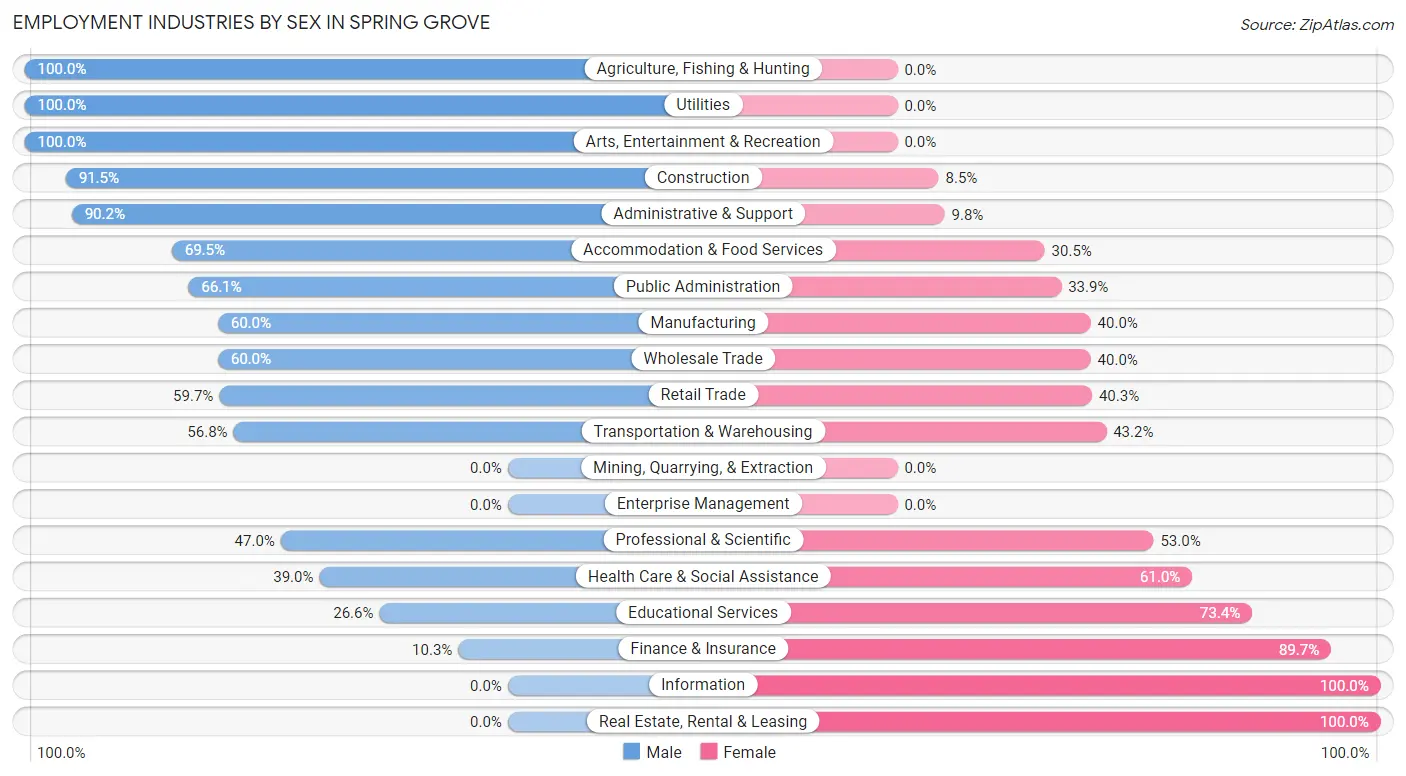
| Industry | Male | Female |
| Agriculture, Fishing & Hunting | 15 (100.0%) | 0 (0.0%) |
| Mining, Quarrying, & Extraction | 0 (0.0%) | 0 (0.0%) |
| Construction | 236 (91.5%) | 22 (8.5%) |
| Manufacturing | 162 (60.0%) | 108 (40.0%) |
| Wholesale Trade | 54 (60.0%) | 36 (40.0%) |
| Retail Trade | 393 (59.7%) | 265 (40.3%) |
| Transportation & Warehousing | 67 (56.8%) | 51 (43.2%) |
| Utilities | 24 (100.0%) | 0 (0.0%) |
| Information | 0 (0.0%) | 112 (100.0%) |
| Finance & Insurance | 12 (10.3%) | 105 (89.7%) |
| Real Estate, Rental & Leasing | 0 (0.0%) | 9 (100.0%) |
| Professional & Scientific | 94 (47.0%) | 106 (53.0%) |
| Enterprise Management | 0 (0.0%) | 0 (0.0%) |
| Administrative & Support | 37 (90.2%) | 4 (9.8%) |
| Educational Services | 80 (26.6%) | 221 (73.4%) |
| Health Care & Social Assistance | 94 (39.0%) | 147 (61.0%) |
| Arts, Entertainment & Recreation | 46 (100.0%) | 0 (0.0%) |
| Accommodation & Food Services | 73 (69.5%) | 32 (30.5%) |
| Public Administration | 78 (66.1%) | 40 (33.9%) |
| Total | 1,542 (54.8%) | 1,274 (45.2%) |
Education in Spring Grove
School Enrollment in Spring Grove
The most common levels of schooling among the 1,339 students in Spring Grove are high school (359 | 26.8%), elementary school (319 | 23.8%), and middle school (232 | 17.3%).
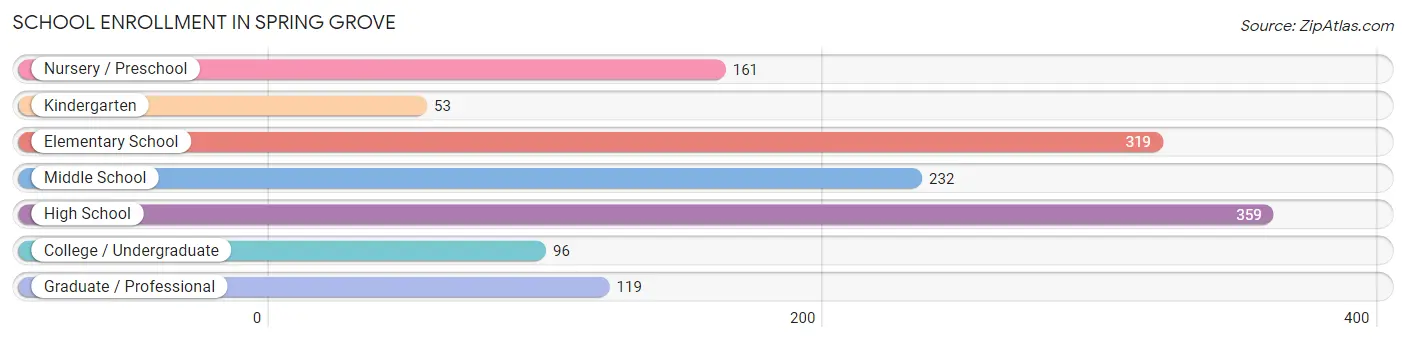
| School Level | # Students | % Students |
| Nursery / Preschool | 161 | 12.0% |
| Kindergarten | 53 | 4.0% |
| Elementary School | 319 | 23.8% |
| Middle School | 232 | 17.3% |
| High School | 359 | 26.8% |
| College / Undergraduate | 96 | 7.2% |
| Graduate / Professional | 119 | 8.9% |
| Total | 1,339 | 100.0% |
School Enrollment by Age by Funding Source in Spring Grove
Out of a total of 1,339 students who are enrolled in schools in Spring Grove, 133 (9.9%) attend a private institution, while the remaining 1,206 (90.1%) are enrolled in public schools. The age group of 20 to 24 year olds has the highest likelihood of being enrolled in private schools, with 48 (46.2% in the age bracket) enrolled. Conversely, the age group of 15 to 17 year olds has the lowest likelihood of being enrolled in a private school, with 318 (100.0% in the age bracket) attending a public institution.
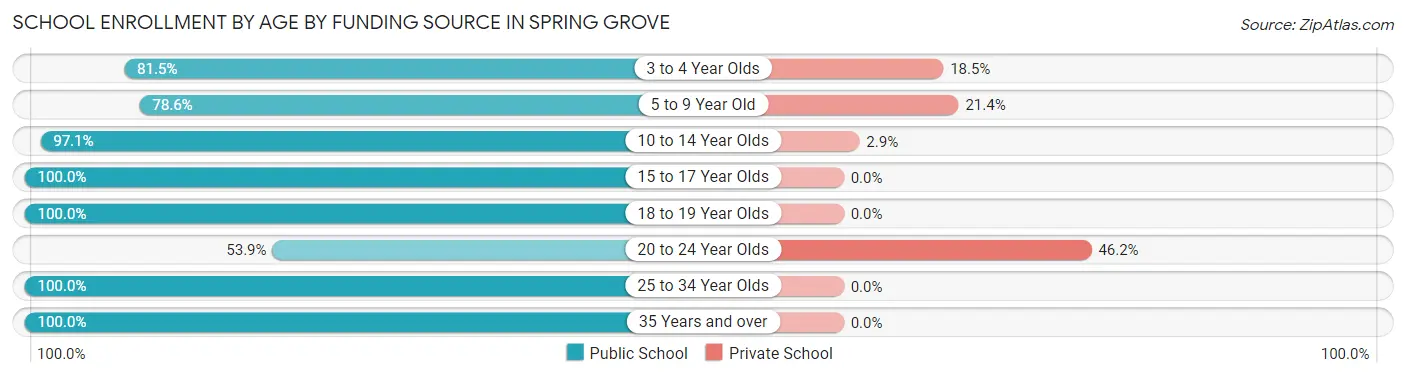
| Age Bracket | Public School | Private School |
| 3 to 4 Year Olds | 123 (81.5%) | 28 (18.5%) |
| 5 to 9 Year Old | 158 (78.6%) | 43 (21.4%) |
| 10 to 14 Year Olds | 431 (97.1%) | 13 (2.9%) |
| 15 to 17 Year Olds | 318 (100.0%) | 0 (0.0%) |
| 18 to 19 Year Olds | 38 (100.0%) | 0 (0.0%) |
| 20 to 24 Year Olds | 56 (53.8%) | 48 (46.2%) |
| 25 to 34 Year Olds | 24 (100.0%) | 0 (0.0%) |
| 35 Years and over | 59 (100.0%) | 0 (0.0%) |
| Total | 1,206 (90.1%) | 133 (9.9%) |
Educational Attainment by Field of Study in Spring Grove
Business (259 | 14.8%), science & technology (245 | 14.1%), education (245 | 14.1%), engineering (195 | 11.2%), and communications (187 | 10.7%) are the most common fields of study among 1,744 individuals in Spring Grove who have obtained a bachelor's degree or higher.
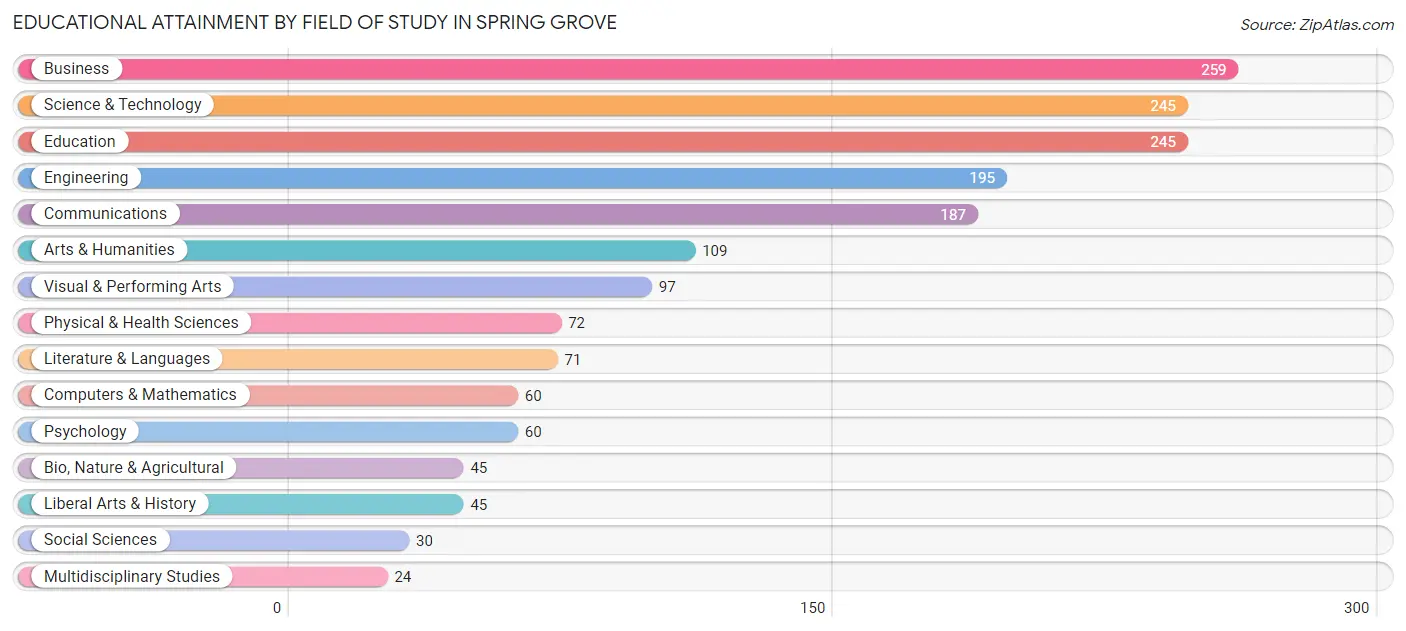
| Field of Study | # Graduates | % Graduates |
| Computers & Mathematics | 60 | 3.4% |
| Bio, Nature & Agricultural | 45 | 2.6% |
| Physical & Health Sciences | 72 | 4.1% |
| Psychology | 60 | 3.4% |
| Social Sciences | 30 | 1.7% |
| Engineering | 195 | 11.2% |
| Multidisciplinary Studies | 24 | 1.4% |
| Science & Technology | 245 | 14.1% |
| Business | 259 | 14.8% |
| Education | 245 | 14.1% |
| Literature & Languages | 71 | 4.1% |
| Liberal Arts & History | 45 | 2.6% |
| Visual & Performing Arts | 97 | 5.6% |
| Communications | 187 | 10.7% |
| Arts & Humanities | 109 | 6.2% |
| Total | 1,744 | 100.0% |
Transportation & Commute in Spring Grove
Vehicle Availability by Sex in Spring Grove
The most prevalent vehicle ownership categories in Spring Grove are males with 2 vehicles (555, accounting for 36.0%) and females with 2 vehicles (533, making up 45.3%).
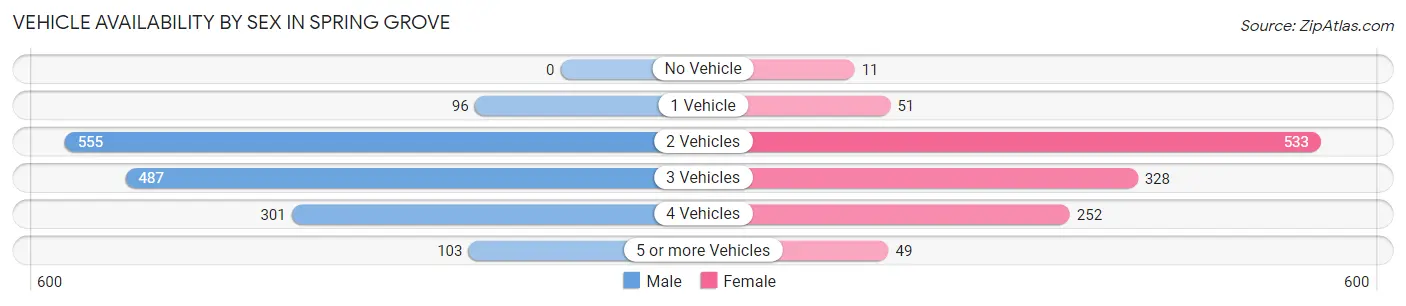
| Vehicles Available | Male | Female |
| No Vehicle | 0 (0.0%) | 11 (0.9%) |
| 1 Vehicle | 96 (6.2%) | 51 (4.2%) |
| 2 Vehicles | 555 (36.0%) | 533 (43.5%) |
| 3 Vehicles | 487 (31.6%) | 328 (26.8%) |
| 4 Vehicles | 301 (19.5%) | 252 (20.6%) |
| 5 or more Vehicles | 103 (6.7%) | 49 (4.0%) |
| Total | 1,542 (100.0%) | 1,224 (100.0%) |
Commute Time in Spring Grove
The most frequently occuring commute durations in Spring Grove are 45 to 59 minutes (382 commuters, 16.9%), 20 to 24 minutes (370 commuters, 16.4%), and 5 to 9 minutes (230 commuters, 10.2%).
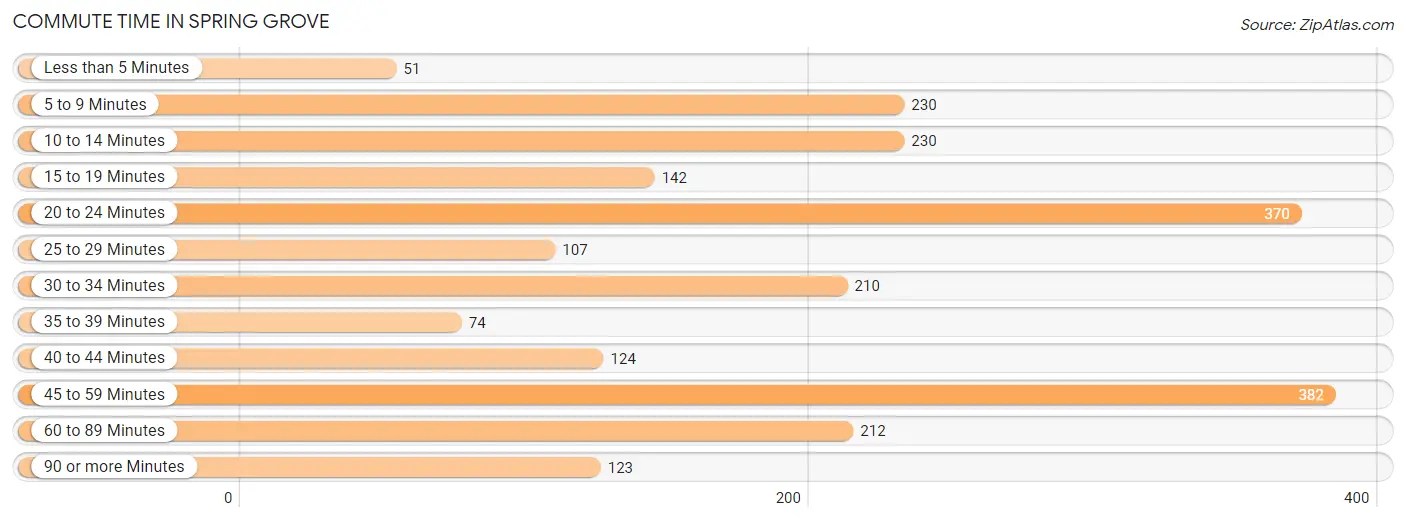
| Commute Time | # Commuters | % Commuters |
| Less than 5 Minutes | 51 | 2.3% |
| 5 to 9 Minutes | 230 | 10.2% |
| 10 to 14 Minutes | 230 | 10.2% |
| 15 to 19 Minutes | 142 | 6.3% |
| 20 to 24 Minutes | 370 | 16.4% |
| 25 to 29 Minutes | 107 | 4.8% |
| 30 to 34 Minutes | 210 | 9.3% |
| 35 to 39 Minutes | 74 | 3.3% |
| 40 to 44 Minutes | 124 | 5.5% |
| 45 to 59 Minutes | 382 | 16.9% |
| 60 to 89 Minutes | 212 | 9.4% |
| 90 or more Minutes | 123 | 5.4% |
Commute Time by Sex in Spring Grove
The most common commute times in Spring Grove are 45 to 59 minutes (245 commuters, 19.3%) for males and 20 to 24 minutes (261 commuters, 26.4%) for females.
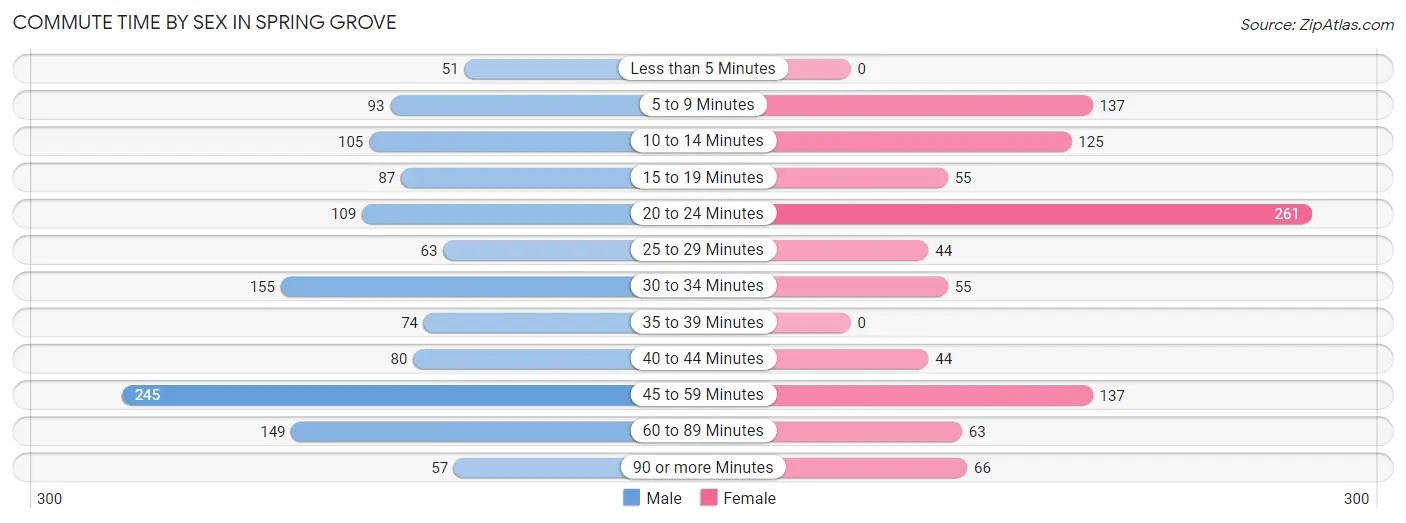
| Commute Time | Male | Female |
| Less than 5 Minutes | 51 (4.0%) | 0 (0.0%) |
| 5 to 9 Minutes | 93 (7.3%) | 137 (13.9%) |
| 10 to 14 Minutes | 105 (8.3%) | 125 (12.7%) |
| 15 to 19 Minutes | 87 (6.9%) | 55 (5.6%) |
| 20 to 24 Minutes | 109 (8.6%) | 261 (26.4%) |
| 25 to 29 Minutes | 63 (5.0%) | 44 (4.5%) |
| 30 to 34 Minutes | 155 (12.2%) | 55 (5.6%) |
| 35 to 39 Minutes | 74 (5.8%) | 0 (0.0%) |
| 40 to 44 Minutes | 80 (6.3%) | 44 (4.5%) |
| 45 to 59 Minutes | 245 (19.3%) | 137 (13.9%) |
| 60 to 89 Minutes | 149 (11.7%) | 63 (6.4%) |
| 90 or more Minutes | 57 (4.5%) | 66 (6.7%) |
Time of Departure to Work by Sex in Spring Grove
The most frequent times of departure to work in Spring Grove are 5:30 AM to 5:59 AM (201, 15.9%) for males and 7:30 AM to 7:59 AM (280, 28.4%) for females.
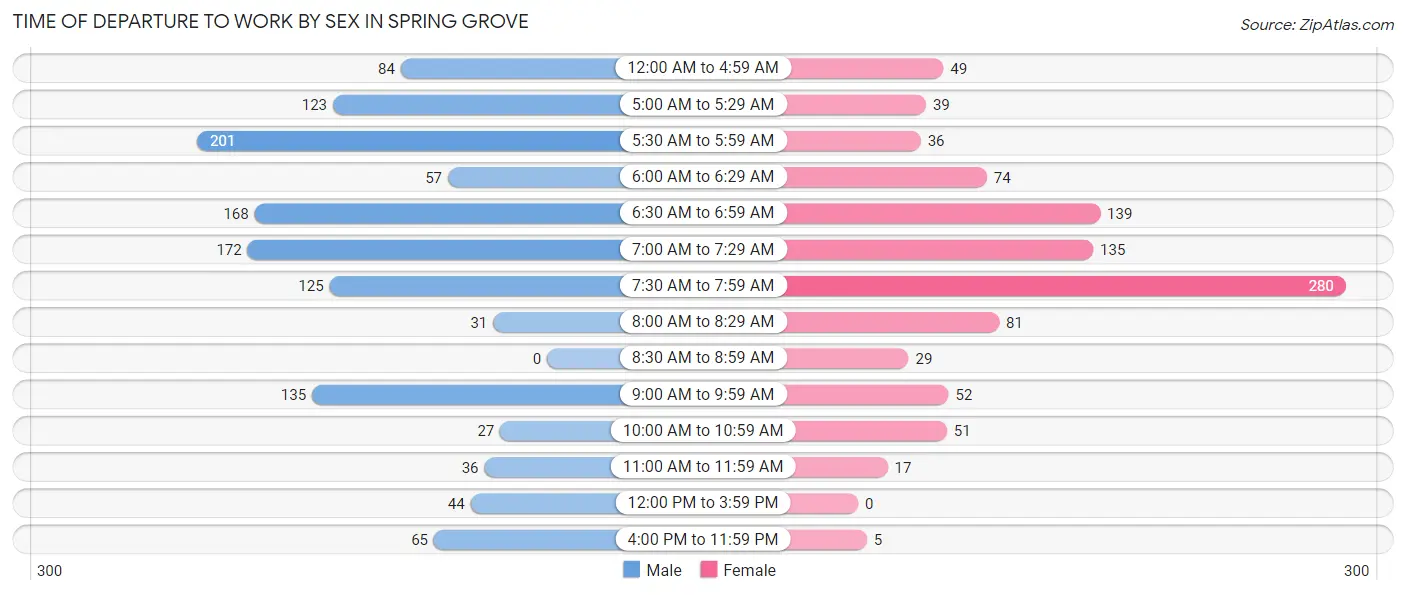
| Time of Departure | Male | Female |
| 12:00 AM to 4:59 AM | 84 (6.6%) | 49 (5.0%) |
| 5:00 AM to 5:29 AM | 123 (9.7%) | 39 (4.0%) |
| 5:30 AM to 5:59 AM | 201 (15.9%) | 36 (3.6%) |
| 6:00 AM to 6:29 AM | 57 (4.5%) | 74 (7.5%) |
| 6:30 AM to 6:59 AM | 168 (13.3%) | 139 (14.1%) |
| 7:00 AM to 7:29 AM | 172 (13.6%) | 135 (13.7%) |
| 7:30 AM to 7:59 AM | 125 (9.9%) | 280 (28.4%) |
| 8:00 AM to 8:29 AM | 31 (2.4%) | 81 (8.2%) |
| 8:30 AM to 8:59 AM | 0 (0.0%) | 29 (2.9%) |
| 9:00 AM to 9:59 AM | 135 (10.6%) | 52 (5.3%) |
| 10:00 AM to 10:59 AM | 27 (2.1%) | 51 (5.2%) |
| 11:00 AM to 11:59 AM | 36 (2.8%) | 17 (1.7%) |
| 12:00 PM to 3:59 PM | 44 (3.5%) | 0 (0.0%) |
| 4:00 PM to 11:59 PM | 65 (5.1%) | 5 (0.5%) |
| Total | 1,268 (100.0%) | 987 (100.0%) |
Housing Occupancy in Spring Grove
Occupancy by Ownership in Spring Grove
Of the total 1,825 dwellings in Spring Grove, owner-occupied units account for 1,818 (99.6%), while renter-occupied units make up 7 (0.4%).
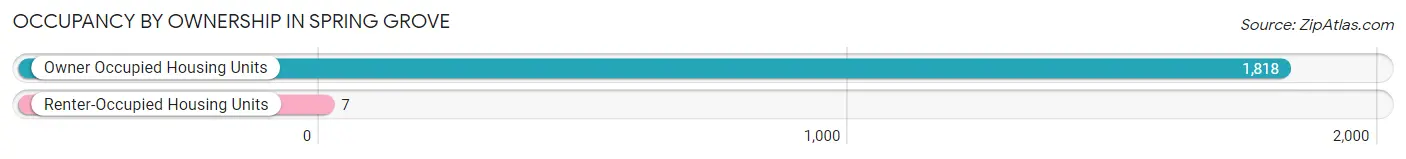
| Occupancy | # Housing Units | % Housing Units |
| Owner Occupied Housing Units | 1,818 | 99.6% |
| Renter-Occupied Housing Units | 7 | 0.4% |
| Total Occupied Housing Units | 1,825 | 100.0% |
Occupancy by Household Size in Spring Grove
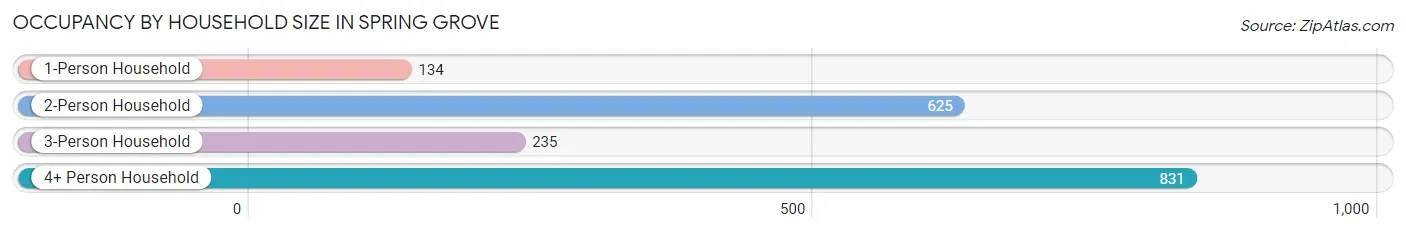
| Household Size | # Housing Units | % Housing Units |
| 1-Person Household | 134 | 7.3% |
| 2-Person Household | 625 | 34.3% |
| 3-Person Household | 235 | 12.9% |
| 4+ Person Household | 831 | 45.5% |
| Total Housing Units | 1,825 | 100.0% |
Occupancy by Ownership by Household Size in Spring Grove
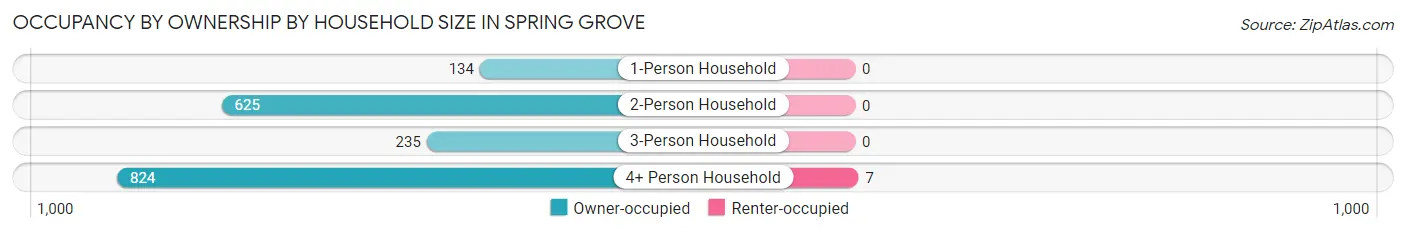
| Household Size | Owner-occupied | Renter-occupied |
| 1-Person Household | 134 (100.0%) | 0 (0.0%) |
| 2-Person Household | 625 (100.0%) | 0 (0.0%) |
| 3-Person Household | 235 (100.0%) | 0 (0.0%) |
| 4+ Person Household | 824 (99.2%) | 7 (0.8%) |
| Total Housing Units | 1,818 (99.6%) | 7 (0.4%) |
Occupancy by Educational Attainment in Spring Grove
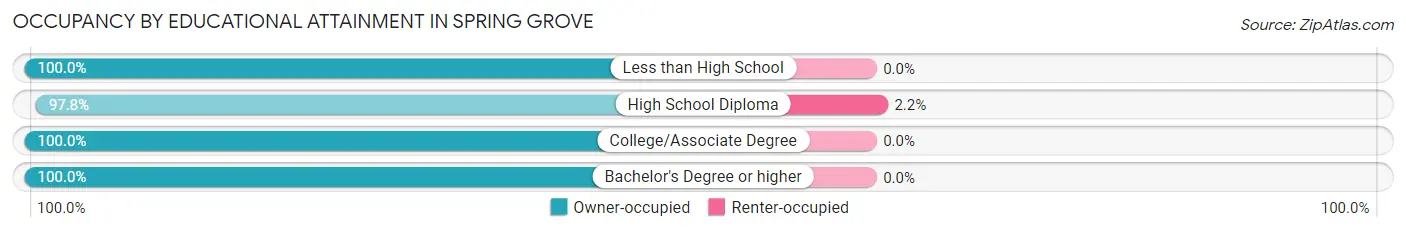
| Household Size | Owner-occupied | Renter-occupied |
| Less than High School | 23 (100.0%) | 0 (0.0%) |
| High School Diploma | 306 (97.8%) | 7 (2.2%) |
| College/Associate Degree | 521 (100.0%) | 0 (0.0%) |
| Bachelor's Degree or higher | 968 (100.0%) | 0 (0.0%) |
Occupancy by Age of Householder in Spring Grove
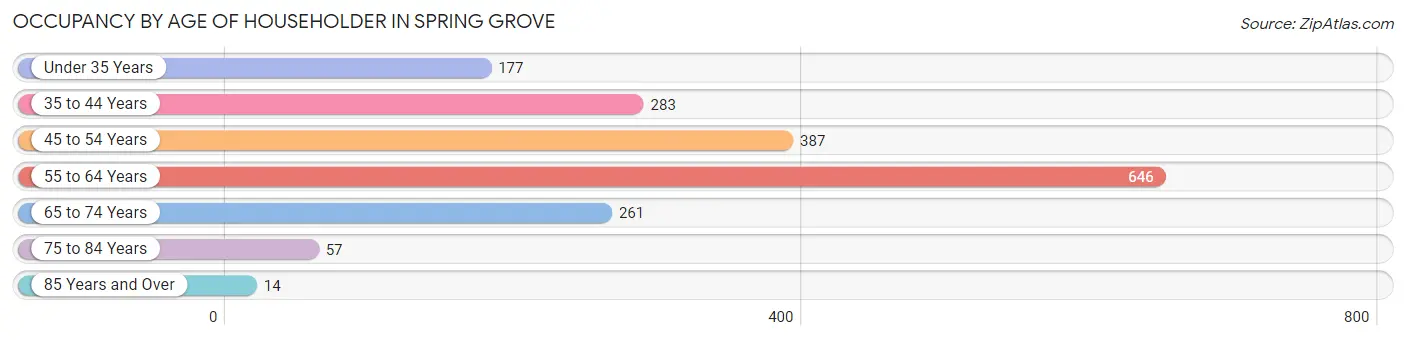
| Age Bracket | # Households | % Households |
| Under 35 Years | 177 | 9.7% |
| 35 to 44 Years | 283 | 15.5% |
| 45 to 54 Years | 387 | 21.2% |
| 55 to 64 Years | 646 | 35.4% |
| 65 to 74 Years | 261 | 14.3% |
| 75 to 84 Years | 57 | 3.1% |
| 85 Years and Over | 14 | 0.8% |
| Total | 1,825 | 100.0% |
Housing Finances in Spring Grove
Median Income by Occupancy in Spring Grove
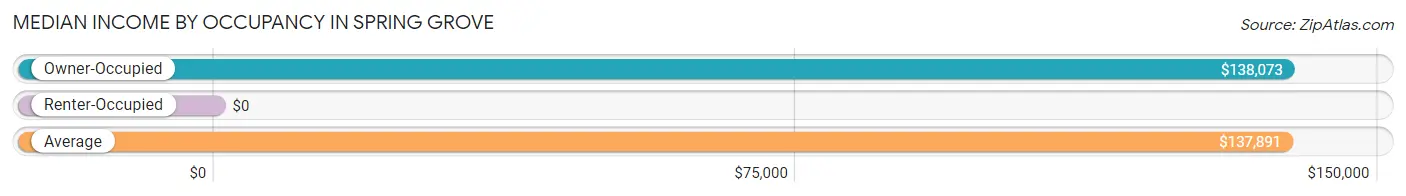
| Occupancy Type | # Households | Median Income |
| Owner-Occupied | 1,818 (99.6%) | $138,073 |
| Renter-Occupied | 7 (0.4%) | $0 |
| Average | 1,825 (100.0%) | $137,891 |
Occupancy by Householder Income Bracket in Spring Grove
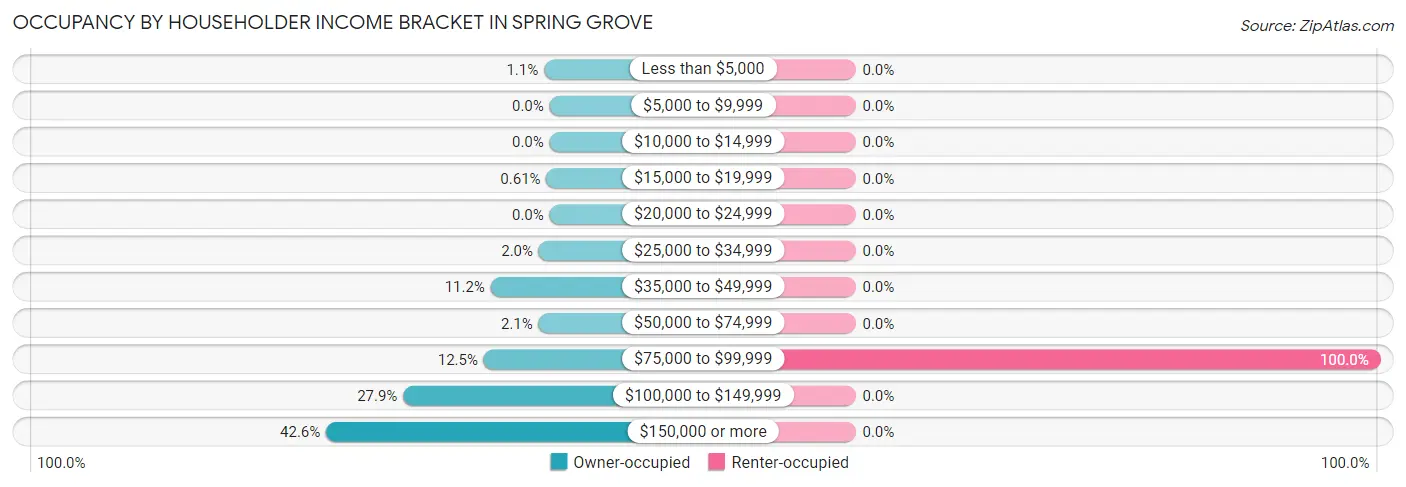
| Income Bracket | Owner-occupied | Renter-occupied |
| Less than $5,000 | 19 (1.1%) | 0 (0.0%) |
| $5,000 to $9,999 | 0 (0.0%) | 0 (0.0%) |
| $10,000 to $14,999 | 0 (0.0%) | 0 (0.0%) |
| $15,000 to $19,999 | 11 (0.6%) | 0 (0.0%) |
| $20,000 to $24,999 | 0 (0.0%) | 0 (0.0%) |
| $25,000 to $34,999 | 37 (2.0%) | 0 (0.0%) |
| $35,000 to $49,999 | 204 (11.2%) | 0 (0.0%) |
| $50,000 to $74,999 | 38 (2.1%) | 0 (0.0%) |
| $75,000 to $99,999 | 228 (12.5%) | 7 (100.0%) |
| $100,000 to $149,999 | 507 (27.9%) | 0 (0.0%) |
| $150,000 or more | 774 (42.6%) | 0 (0.0%) |
| Total | 1,818 (100.0%) | 7 (100.0%) |
Monthly Housing Cost Tiers in Spring Grove
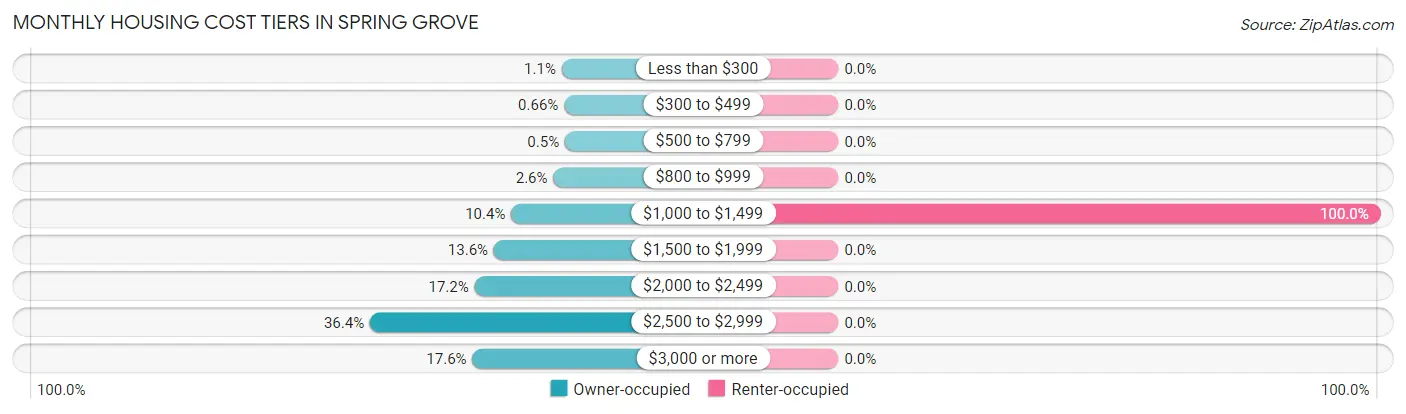
| Monthly Cost | Owner-occupied | Renter-occupied |
| Less than $300 | 20 (1.1%) | 0 (0.0%) |
| $300 to $499 | 12 (0.7%) | 0 (0.0%) |
| $500 to $799 | 9 (0.5%) | 0 (0.0%) |
| $800 to $999 | 48 (2.6%) | 0 (0.0%) |
| $1,000 to $1,499 | 189 (10.4%) | 7 (100.0%) |
| $1,500 to $1,999 | 247 (13.6%) | 0 (0.0%) |
| $2,000 to $2,499 | 312 (17.2%) | 0 (0.0%) |
| $2,500 to $2,999 | 662 (36.4%) | 0 (0.0%) |
| $3,000 or more | 319 (17.5%) | 0 (0.0%) |
| Total | 1,818 (100.0%) | 7 (100.0%) |
Physical Housing Characteristics in Spring Grove
Housing Structures in Spring Grove
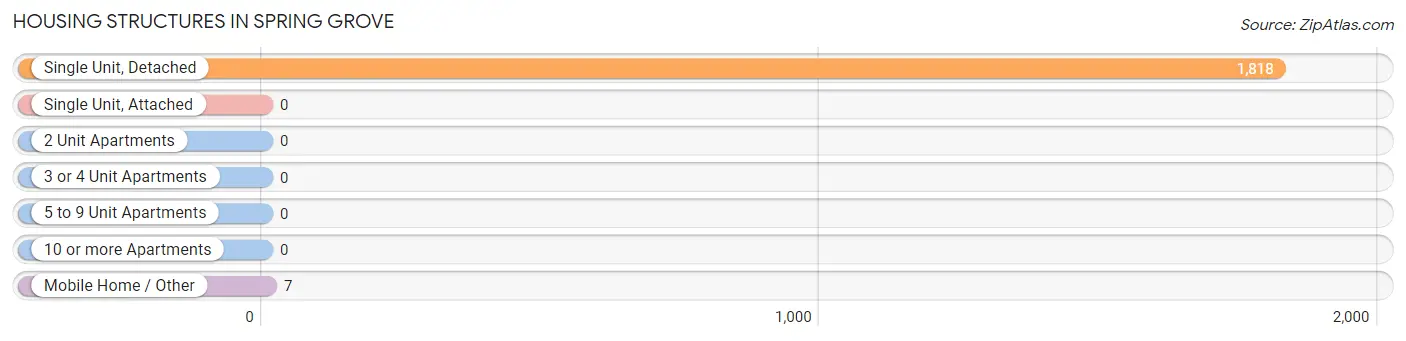
| Structure Type | # Housing Units | % Housing Units |
| Single Unit, Detached | 1,818 | 99.6% |
| Single Unit, Attached | 0 | 0.0% |
| 2 Unit Apartments | 0 | 0.0% |
| 3 or 4 Unit Apartments | 0 | 0.0% |
| 5 to 9 Unit Apartments | 0 | 0.0% |
| 10 or more Apartments | 0 | 0.0% |
| Mobile Home / Other | 7 | 0.4% |
| Total | 1,825 | 100.0% |
Housing Structures by Occupancy in Spring Grove
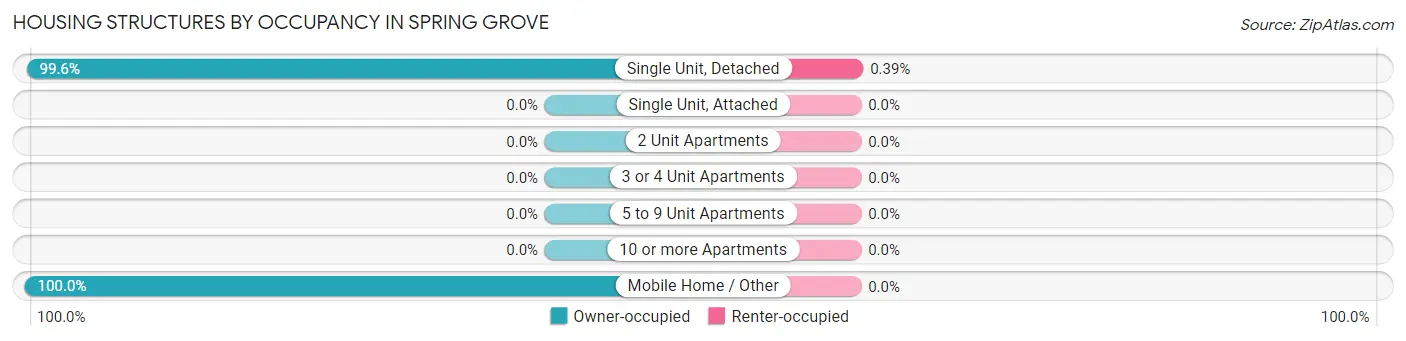
| Structure Type | Owner-occupied | Renter-occupied |
| Single Unit, Detached | 1,811 (99.6%) | 7 (0.4%) |
| Single Unit, Attached | 0 (0.0%) | 0 (0.0%) |
| 2 Unit Apartments | 0 (0.0%) | 0 (0.0%) |
| 3 or 4 Unit Apartments | 0 (0.0%) | 0 (0.0%) |
| 5 to 9 Unit Apartments | 0 (0.0%) | 0 (0.0%) |
| 10 or more Apartments | 0 (0.0%) | 0 (0.0%) |
| Mobile Home / Other | 7 (100.0%) | 0 (0.0%) |
| Total | 1,818 (99.6%) | 7 (0.4%) |
Housing Structures by Number of Rooms in Spring Grove
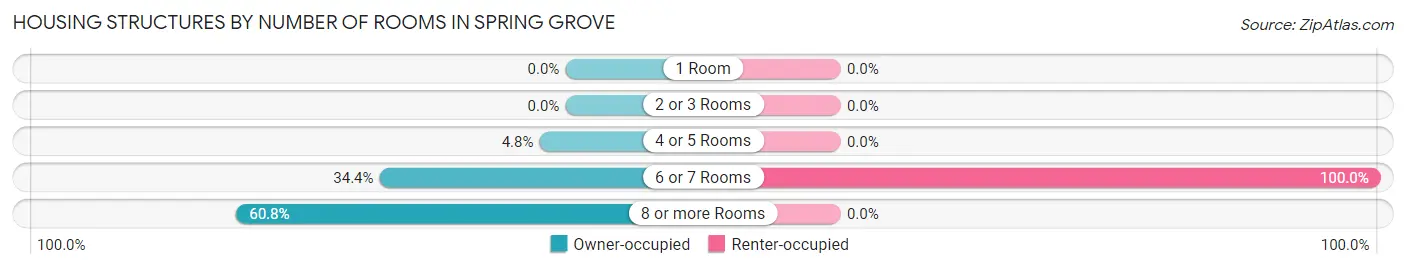
| Number of Rooms | Owner-occupied | Renter-occupied |
| 1 Room | 0 (0.0%) | 0 (0.0%) |
| 2 or 3 Rooms | 0 (0.0%) | 0 (0.0%) |
| 4 or 5 Rooms | 87 (4.8%) | 0 (0.0%) |
| 6 or 7 Rooms | 625 (34.4%) | 7 (100.0%) |
| 8 or more Rooms | 1,106 (60.8%) | 0 (0.0%) |
| Total | 1,818 (100.0%) | 7 (100.0%) |
Housing Structure by Heating Type in Spring Grove
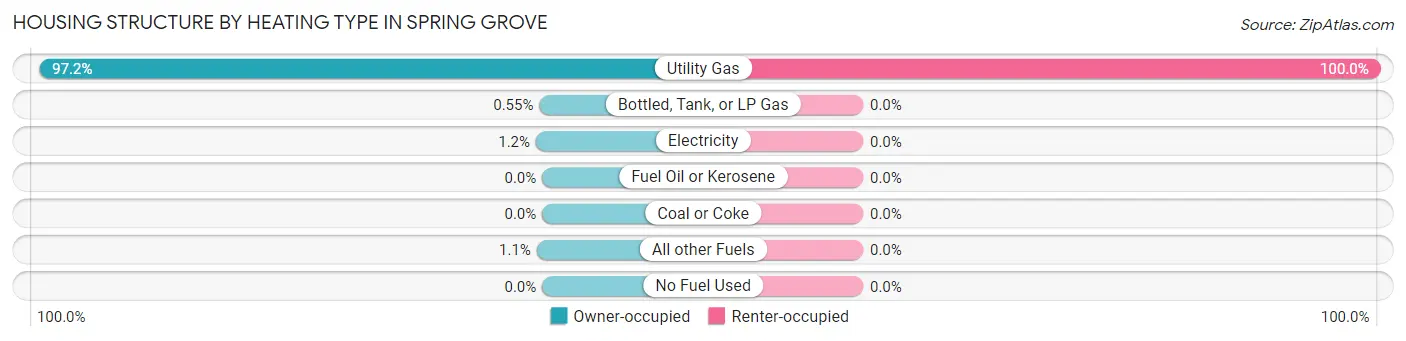
| Heating Type | Owner-occupied | Renter-occupied |
| Utility Gas | 1,767 (97.2%) | 7 (100.0%) |
| Bottled, Tank, or LP Gas | 10 (0.5%) | 0 (0.0%) |
| Electricity | 22 (1.2%) | 0 (0.0%) |
| Fuel Oil or Kerosene | 0 (0.0%) | 0 (0.0%) |
| Coal or Coke | 0 (0.0%) | 0 (0.0%) |
| All other Fuels | 19 (1.1%) | 0 (0.0%) |
| No Fuel Used | 0 (0.0%) | 0 (0.0%) |
| Total | 1,818 (100.0%) | 7 (100.0%) |
Household Vehicle Usage in Spring Grove
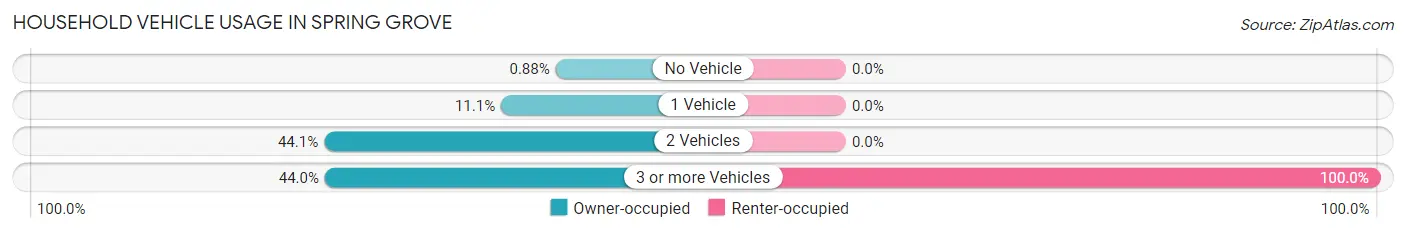
| Vehicles per Household | Owner-occupied | Renter-occupied |
| No Vehicle | 16 (0.9%) | 0 (0.0%) |
| 1 Vehicle | 201 (11.1%) | 0 (0.0%) |
| 2 Vehicles | 802 (44.1%) | 0 (0.0%) |
| 3 or more Vehicles | 799 (44.0%) | 7 (100.0%) |
| Total | 1,818 (100.0%) | 7 (100.0%) |
Real Estate & Mortgages in Spring Grove
Real Estate and Mortgage Overview in Spring Grove
| Characteristic | Without Mortgage | With Mortgage |
| Housing Units | 306 | 1,512 |
| Median Property Value | $382,800 | $345,800 |
| Median Household Income | $118,864 | $669 |
| Monthly Housing Costs | $1,160 | $319 |
| Real Estate Taxes | $9,860 | $27 |
Property Value by Mortgage Status in Spring Grove
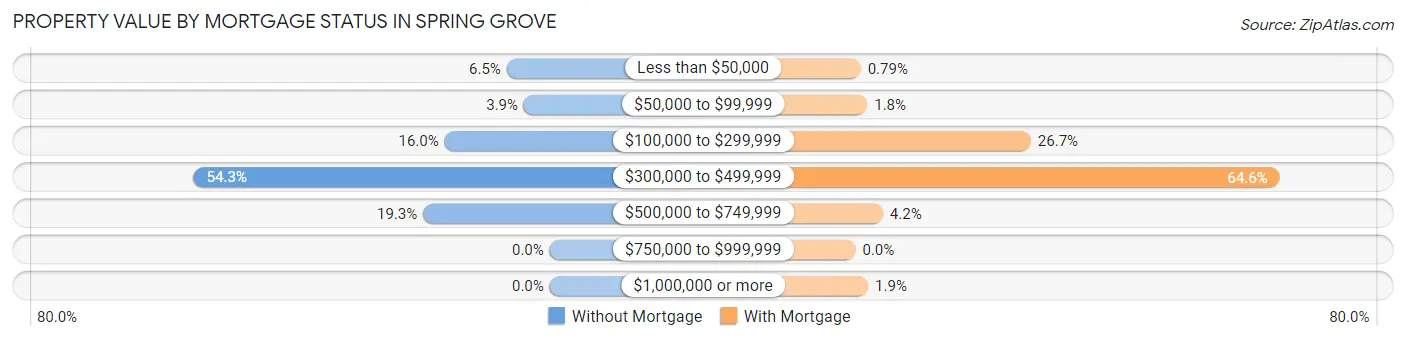
| Property Value | Without Mortgage | With Mortgage |
| Less than $50,000 | 20 (6.5%) | 12 (0.8%) |
| $50,000 to $99,999 | 12 (3.9%) | 27 (1.8%) |
| $100,000 to $299,999 | 49 (16.0%) | 404 (26.7%) |
| $300,000 to $499,999 | 166 (54.2%) | 977 (64.6%) |
| $500,000 to $749,999 | 59 (19.3%) | 63 (4.2%) |
| $750,000 to $999,999 | 0 (0.0%) | 0 (0.0%) |
| $1,000,000 or more | 0 (0.0%) | 29 (1.9%) |
| Total | 306 (100.0%) | 1,512 (100.0%) |
Household Income by Mortgage Status in Spring Grove
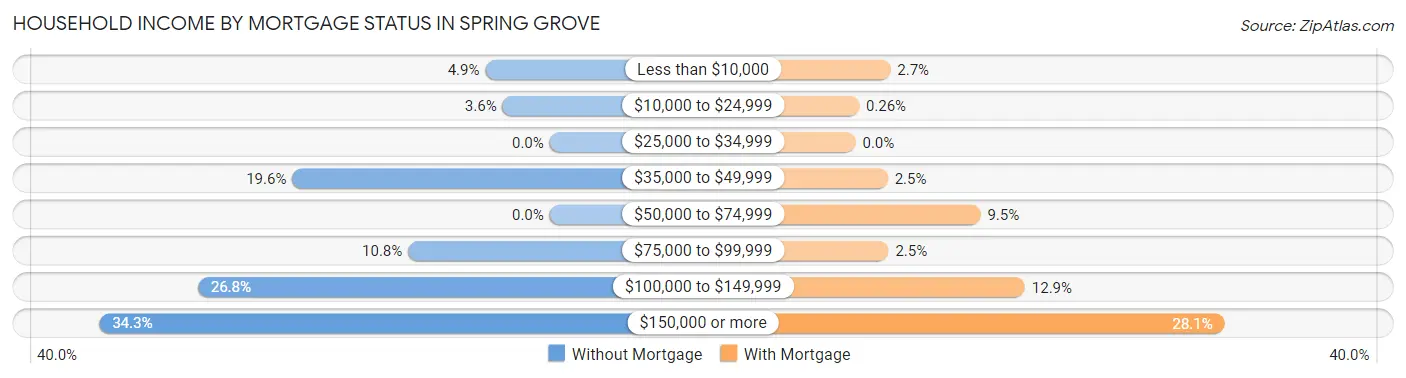
| Household Income | Without Mortgage | With Mortgage |
| Less than $10,000 | 15 (4.9%) | 40 (2.6%) |
| $10,000 to $24,999 | 11 (3.6%) | 4 (0.3%) |
| $25,000 to $34,999 | 0 (0.0%) | 0 (0.0%) |
| $35,000 to $49,999 | 60 (19.6%) | 37 (2.5%) |
| $50,000 to $74,999 | 0 (0.0%) | 144 (9.5%) |
| $75,000 to $99,999 | 33 (10.8%) | 38 (2.5%) |
| $100,000 to $149,999 | 82 (26.8%) | 195 (12.9%) |
| $150,000 or more | 105 (34.3%) | 425 (28.1%) |
| Total | 306 (100.0%) | 1,512 (100.0%) |
Property Value to Household Income Ratio in Spring Grove
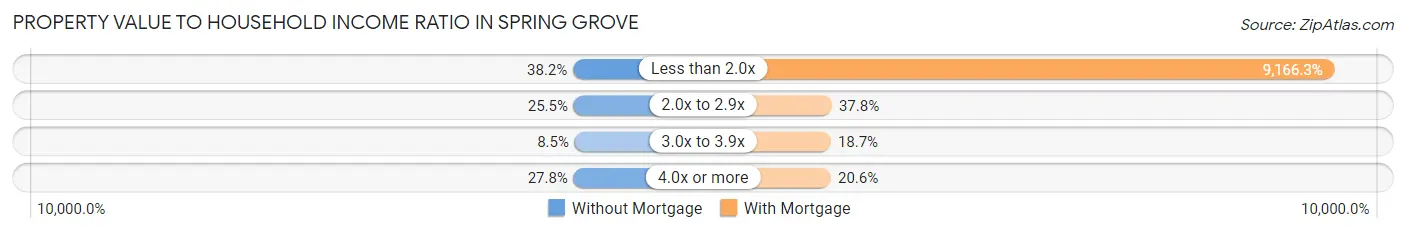
| Value-to-Income Ratio | Without Mortgage | With Mortgage |
| Less than 2.0x | 117 (38.2%) | 138,594 (9,166.3%) |
| 2.0x to 2.9x | 78 (25.5%) | 571 (37.8%) |
| 3.0x to 3.9x | 26 (8.5%) | 282 (18.6%) |
| 4.0x or more | 85 (27.8%) | 311 (20.6%) |
| Total | 306 (100.0%) | 1,512 (100.0%) |
Real Estate Taxes by Mortgage Status in Spring Grove
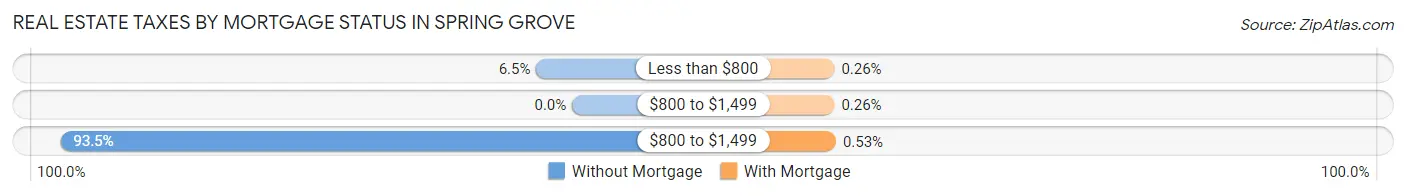
| Property Taxes | Without Mortgage | With Mortgage |
| Less than $800 | 20 (6.5%) | 4 (0.3%) |
| $800 to $1,499 | 0 (0.0%) | 4 (0.3%) |
| $800 to $1,499 | 286 (93.5%) | 8 (0.5%) |
| Total | 306 (100.0%) | 1,512 (100.0%) |
Health & Disability in Spring Grove
Health Insurance Coverage by Age in Spring Grove
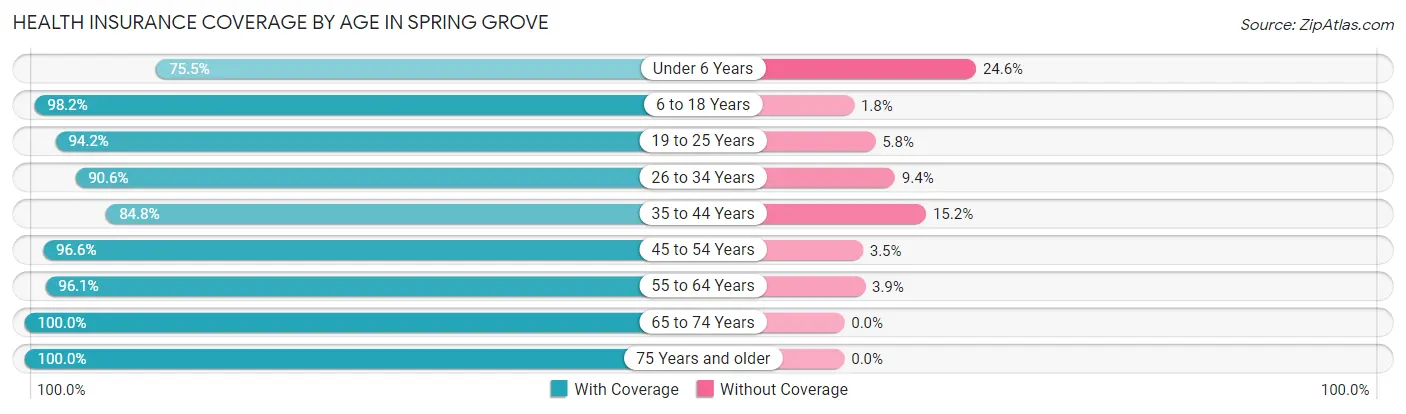
| Age Bracket | With Coverage | Without Coverage |
| Under 6 Years | 378 (75.4%) | 123 (24.5%) |
| 6 to 18 Years | 923 (98.2%) | 17 (1.8%) |
| 19 to 25 Years | 278 (94.2%) | 17 (5.8%) |
| 26 to 34 Years | 652 (90.6%) | 68 (9.4%) |
| 35 to 44 Years | 540 (84.8%) | 97 (15.2%) |
| 45 to 54 Years | 840 (96.6%) | 30 (3.5%) |
| 55 to 64 Years | 1,044 (96.1%) | 42 (3.9%) |
| 65 to 74 Years | 440 (100.0%) | 0 (0.0%) |
| 75 Years and older | 205 (100.0%) | 0 (0.0%) |
| Total | 5,300 (93.1%) | 394 (6.9%) |
Health Insurance Coverage by Citizenship Status in Spring Grove
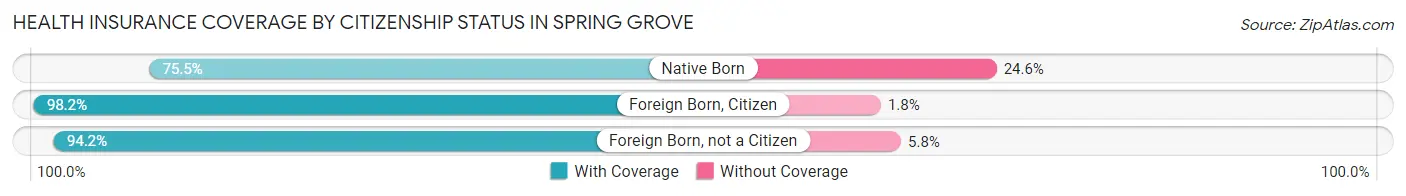
| Citizenship Status | With Coverage | Without Coverage |
| Native Born | 378 (75.4%) | 123 (24.5%) |
| Foreign Born, Citizen | 923 (98.2%) | 17 (1.8%) |
| Foreign Born, not a Citizen | 278 (94.2%) | 17 (5.8%) |
Health Insurance Coverage by Household Income in Spring Grove
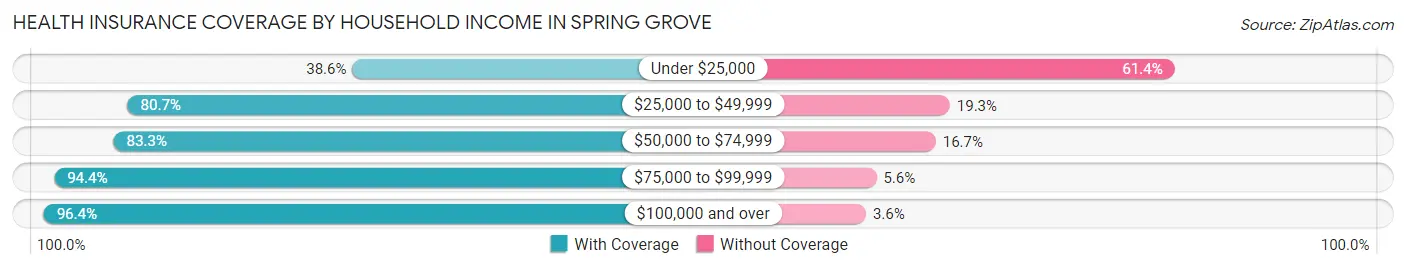
| Household Income | With Coverage | Without Coverage |
| Under $25,000 | 22 (38.6%) | 35 (61.4%) |
| $25,000 to $49,999 | 706 (80.7%) | 169 (19.3%) |
| $50,000 to $74,999 | 60 (83.3%) | 12 (16.7%) |
| $75,000 to $99,999 | 459 (94.4%) | 27 (5.6%) |
| $100,000 and over | 4,053 (96.4%) | 151 (3.6%) |
Public vs Private Health Insurance Coverage by Age in Spring Grove
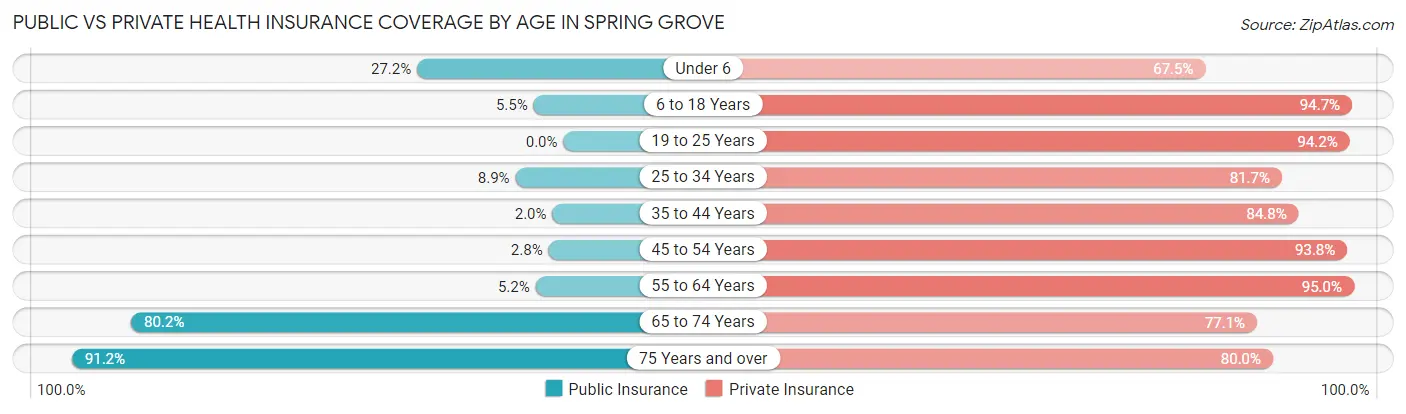
| Age Bracket | Public Insurance | Private Insurance |
| Under 6 | 136 (27.2%) | 338 (67.5%) |
| 6 to 18 Years | 52 (5.5%) | 890 (94.7%) |
| 19 to 25 Years | 0 (0.0%) | 278 (94.2%) |
| 25 to 34 Years | 64 (8.9%) | 588 (81.7%) |
| 35 to 44 Years | 13 (2.0%) | 540 (84.8%) |
| 45 to 54 Years | 24 (2.8%) | 816 (93.8%) |
| 55 to 64 Years | 56 (5.2%) | 1,032 (95.0%) |
| 65 to 74 Years | 353 (80.2%) | 339 (77.0%) |
| 75 Years and over | 187 (91.2%) | 164 (80.0%) |
| Total | 885 (15.5%) | 4,985 (87.5%) |
Disability Status by Sex by Age in Spring Grove
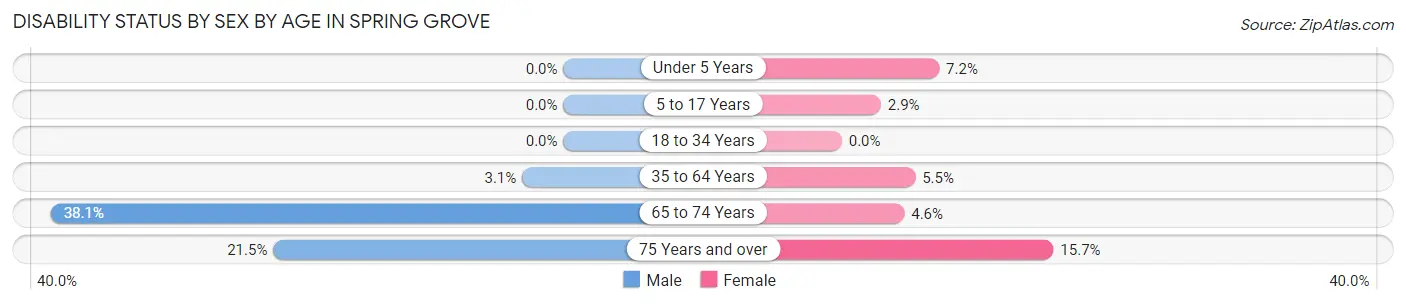
| Age Bracket | Male | Female |
| Under 5 Years | 0 (0.0%) | 18 (7.2%) |
| 5 to 17 Years | 0 (0.0%) | 13 (2.9%) |
| 18 to 34 Years | 0 (0.0%) | 0 (0.0%) |
| 35 to 64 Years | 44 (3.1%) | 63 (5.4%) |
| 65 to 74 Years | 110 (38.1%) | 7 (4.6%) |
| 75 Years and over | 14 (21.5%) | 22 (15.7%) |
Disability Class by Sex by Age in Spring Grove
Disability Class: Hearing Difficulty
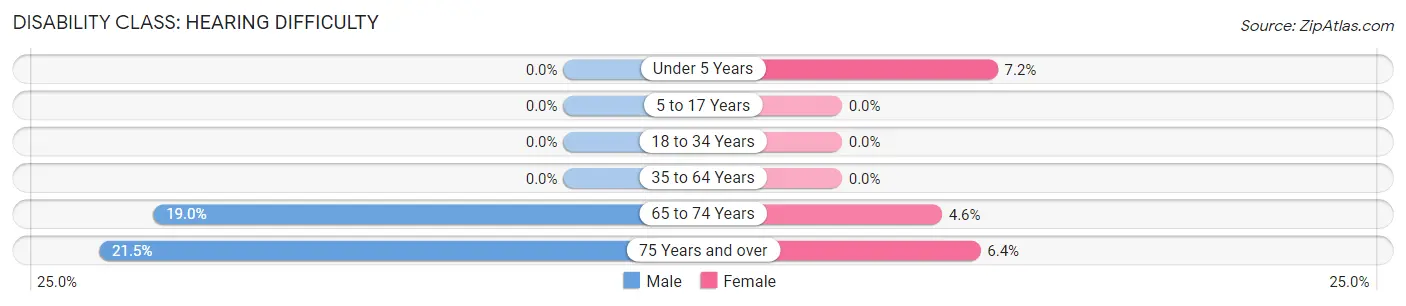
| Age Bracket | Male | Female |
| Under 5 Years | 0 (0.0%) | 18 (7.2%) |
| 5 to 17 Years | 0 (0.0%) | 0 (0.0%) |
| 18 to 34 Years | 0 (0.0%) | 0 (0.0%) |
| 35 to 64 Years | 0 (0.0%) | 0 (0.0%) |
| 65 to 74 Years | 55 (19.0%) | 7 (4.6%) |
| 75 Years and over | 14 (21.5%) | 9 (6.4%) |
Disability Class: Vision Difficulty
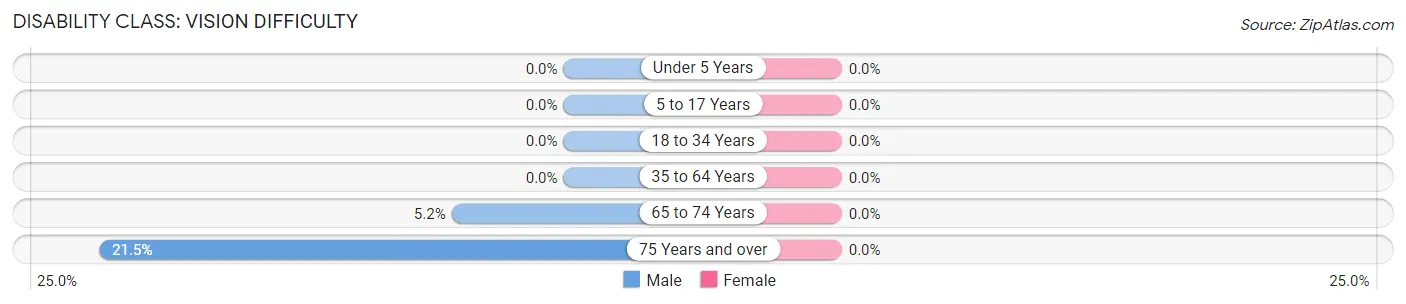
| Age Bracket | Male | Female |
| Under 5 Years | 0 (0.0%) | 0 (0.0%) |
| 5 to 17 Years | 0 (0.0%) | 0 (0.0%) |
| 18 to 34 Years | 0 (0.0%) | 0 (0.0%) |
| 35 to 64 Years | 0 (0.0%) | 0 (0.0%) |
| 65 to 74 Years | 15 (5.2%) | 0 (0.0%) |
| 75 Years and over | 14 (21.5%) | 0 (0.0%) |
Disability Class: Cognitive Difficulty
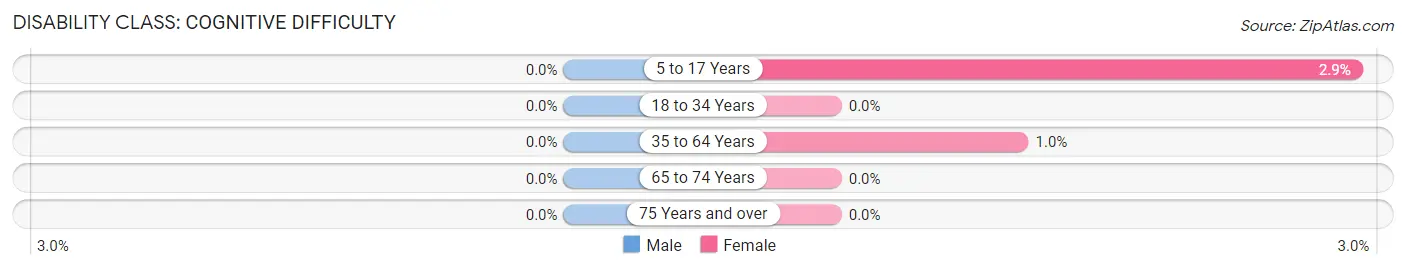
| Age Bracket | Male | Female |
| 5 to 17 Years | 0 (0.0%) | 13 (2.9%) |
| 18 to 34 Years | 0 (0.0%) | 0 (0.0%) |
| 35 to 64 Years | 0 (0.0%) | 12 (1.0%) |
| 65 to 74 Years | 0 (0.0%) | 0 (0.0%) |
| 75 Years and over | 0 (0.0%) | 0 (0.0%) |
Disability Class: Ambulatory Difficulty
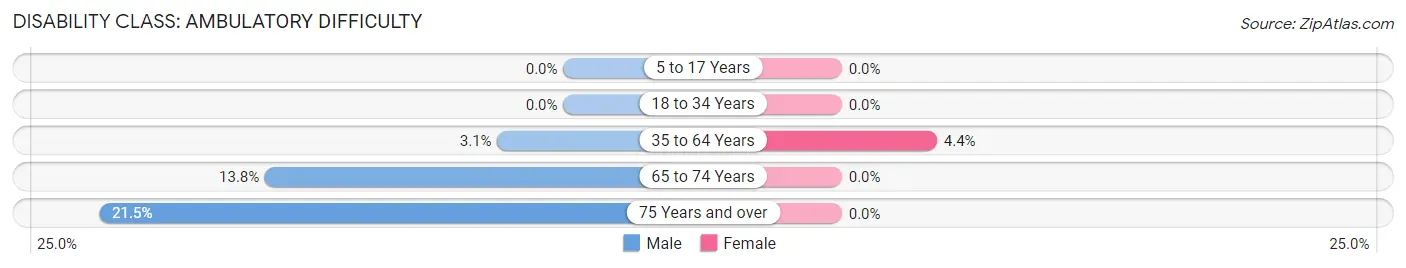
| Age Bracket | Male | Female |
| 5 to 17 Years | 0 (0.0%) | 0 (0.0%) |
| 18 to 34 Years | 0 (0.0%) | 0 (0.0%) |
| 35 to 64 Years | 44 (3.1%) | 51 (4.4%) |
| 65 to 74 Years | 40 (13.8%) | 0 (0.0%) |
| 75 Years and over | 14 (21.5%) | 0 (0.0%) |
Disability Class: Self-Care Difficulty
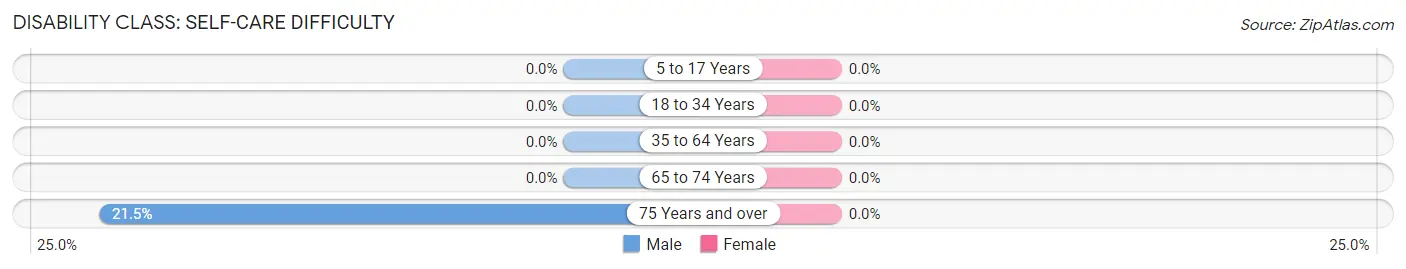
| Age Bracket | Male | Female |
| 5 to 17 Years | 0 (0.0%) | 0 (0.0%) |
| 18 to 34 Years | 0 (0.0%) | 0 (0.0%) |
| 35 to 64 Years | 0 (0.0%) | 0 (0.0%) |
| 65 to 74 Years | 0 (0.0%) | 0 (0.0%) |
| 75 Years and over | 14 (21.5%) | 0 (0.0%) |
Technology Access in Spring Grove
Computing Device Access in Spring Grove
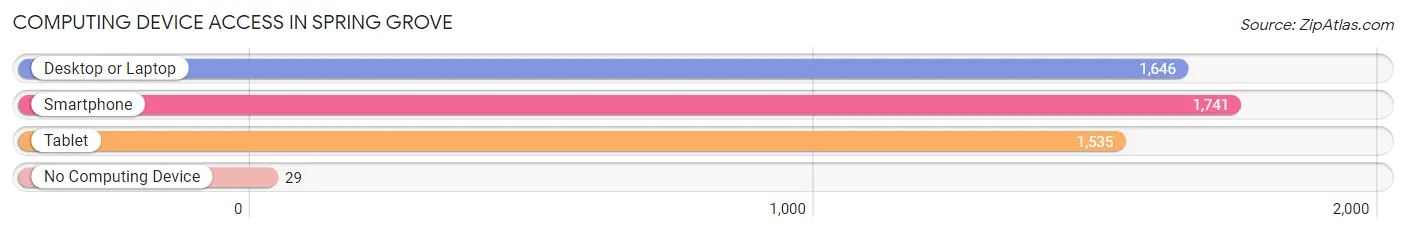
| Device Type | # Households | % Households |
| Desktop or Laptop | 1,646 | 90.2% |
| Smartphone | 1,741 | 95.4% |
| Tablet | 1,535 | 84.1% |
| No Computing Device | 29 | 1.6% |
| Total | 1,825 | 100.0% |
Internet Access in Spring Grove
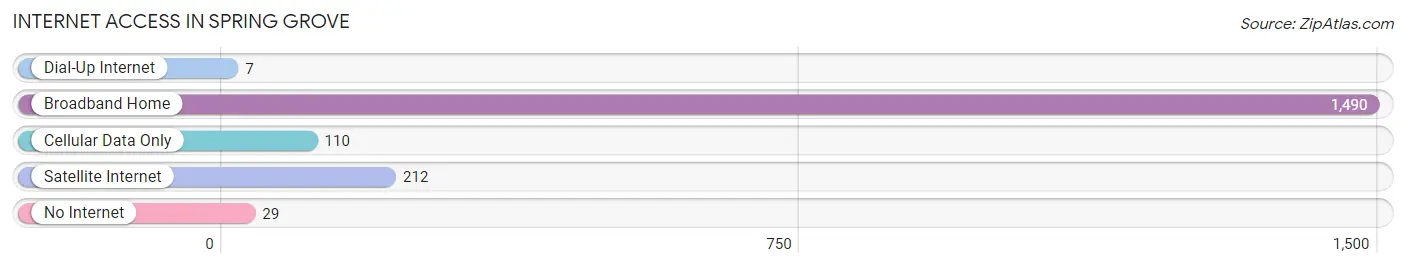
| Internet Type | # Households | % Households |
| Dial-Up Internet | 7 | 0.4% |
| Broadband Home | 1,490 | 81.6% |
| Cellular Data Only | 110 | 6.0% |
| Satellite Internet | 212 | 11.6% |
| No Internet | 29 | 1.6% |
| Total | 1,825 | 100.0% |
Spring Grove Summary
History
The history of Spring Grove, Illinois dates back to the early 1800s when the area was first settled by European immigrants. The first settlers were of German descent and they named the area Spring Grove after the abundance of springs in the area. The first settlers built a log cabin and a small church, and the area quickly grew into a small farming community.
In 1836, the first post office was established in Spring Grove and the village was officially incorporated in 1845. The village was named after the abundance of springs in the area, and the name was chosen to reflect the natural beauty of the area.
In the late 1800s, the village began to grow and develop. The first railroad line was built in 1871, connecting Spring Grove to Chicago. This allowed for the transportation of goods and people to and from the village. The railroad also allowed for the development of industry in the area, including a brickyard, a sawmill, and a flour mill.
In the early 1900s, the village continued to grow and develop. The population increased from 1,000 in 1900 to over 2,000 by 1920. During this time, the village also saw the construction of a new school, a library, and a fire station.
In the 1950s, the village saw a period of growth and development. The population increased to over 3,000 by 1960, and the village saw the construction of a new hospital, a shopping center, and a new library.
In the late 20th century, the village continued to grow and develop. The population increased to over 4,000 by 2000, and the village saw the construction of a new police station, a new fire station, and a new library.
Geography
Spring Grove is located in McHenry County, Illinois, about 50 miles northwest of Chicago. The village is situated on the banks of the Fox River, and is surrounded by rolling hills and farmland. The village covers an area of about 4.5 square miles, and has a population of 4,072 as of the 2010 census.
The village is located in a temperate climate, with hot summers and cold winters. The average temperature in the summer is around 75 degrees Fahrenheit, and the average temperature in the winter is around 25 degrees Fahrenheit.
Economy
The economy of Spring Grove is largely based on agriculture and manufacturing. The village is home to several farms, which produce a variety of crops, including corn, soybeans, and wheat. The village is also home to several manufacturing companies, which produce a variety of products, including furniture, automotive parts, and medical supplies.
The village is also home to several retail stores, restaurants, and other businesses. The village is home to several banks, a post office, and a library.
Demographics
As of the 2010 census, the population of Spring Grove was 4,072. The population is largely white (94.3%), with small percentages of African American (2.2%), Hispanic (1.7%), and Asian (1.2%) residents. The median household income is $63,929, and the median age is 41.7 years. The village is home to several churches, including Catholic, Lutheran, and Methodist.
Common Questions
What is Per Capita Income in Spring Grove?
Per Capita income in Spring Grove is $55,099.
What is the Median Family Income in Spring Grove?
Median Family Income in Spring Grove is $139,557.
What is the Median Household income in Spring Grove?
Median Household Income in Spring Grove is $137,891.
What is Income or Wage Gap in Spring Grove?
Income or Wage Gap in Spring Grove is 20.0%.
Women in Spring Grove earn 80.0 cents for every dollar earned by a man.
What is Inequality or Gini Index in Spring Grove?
Inequality or Gini Index in Spring Grove is 0.38.
What is the Total Population of Spring Grove?
Total Population of Spring Grove is 5,694.
What is the Total Male Population of Spring Grove?
Total Male Population of Spring Grove is 3,082.
What is the Total Female Population of Spring Grove?
Total Female Population of Spring Grove is 2,612.
What is the Ratio of Males per 100 Females in Spring Grove?
There are 117.99 Males per 100 Females in Spring Grove.
What is the Ratio of Females per 100 Males in Spring Grove?
There are 84.75 Females per 100 Males in Spring Grove.
What is the Median Population Age in Spring Grove?
Median Population Age in Spring Grove is 40.2 Years.
What is the Average Family Size in Spring Grove
Average Family Size in Spring Grove is 3.2 People.
What is the Average Household Size in Spring Grove
Average Household Size in Spring Grove is 3.1 People.
How Large is the Labor Force in Spring Grove?
There are 3,094 People in the Labor Forcein in Spring Grove.
What is the Percentage of People in the Labor Force in Spring Grove?
67.9% of People are in the Labor Force in Spring Grove.
What is the Unemployment Rate in Spring Grove?
Unemployment Rate in Spring Grove is 8.9%.