Plainfield, IL Map & Demographics
Plainfield Map
Plainfield Overview
$53,441
PER CAPITA INCOME
$153,909
AVG FAMILY INCOME
$143,064
AVG HOUSEHOLD INCOME
41.5%
WAGE / INCOME GAP [ % ]
58.5¢/ $1
WAGE / INCOME GAP [ $ ]
$11,886
FAMILY INCOME DEFICIT
0.37
INEQUALITY / GINI INDEX
44,941
TOTAL POPULATION
22,533
MALE POPULATION
22,408
FEMALE POPULATION
100.56
MALES / 100 FEMALES
99.45
FEMALES / 100 MALES
37.7
MEDIAN AGE
3.5
AVG FAMILY SIZE
3.2
AVG HOUSEHOLD SIZE
24,602
LABOR FORCE [ PEOPLE ]
72.9%
PERCENT IN LABOR FORCE
3.7%
UNEMPLOYMENT RATE
Income in Plainfield
Income Overview in Plainfield
Per Capita Income in Plainfield is $53,441, while median incomes of families and households are $153,909 and $143,064 respectively.
| Characteristic | Number | Measure |
| Per Capita Income | 44,941 | $53,441 |
| Median Family Income | 11,878 | $153,909 |
| Mean Family Income | 11,878 | $181,596 |
| Median Household Income | 13,919 | $143,064 |
| Mean Household Income | 13,919 | $168,145 |
| Income Deficit | 11,878 | $11,886 |
| Wage / Income Gap (%) | 44,941 | 41.53% |
| Wage / Income Gap ($) | 44,941 | 58.47¢ per $1 |
| Gini / Inequality Index | 44,941 | 0.37 |
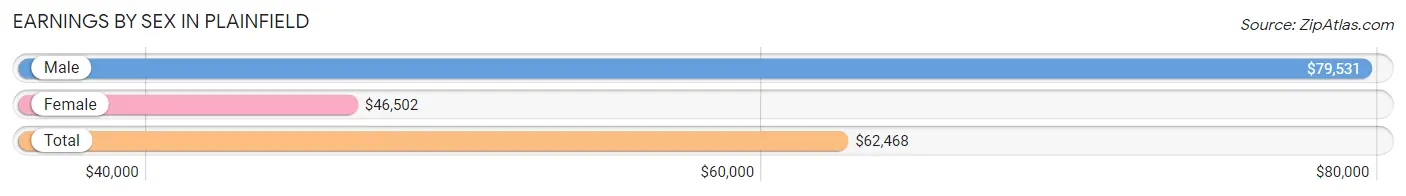
Earnings by Sex in Plainfield
Average Earnings in Plainfield are $62,468, $79,531 for men and $46,502 for women, a difference of 41.5%.
| Sex | Number | Average Earnings |
| Male | 13,761 (52.4%) | $79,531 |
| Female | 12,519 (47.6%) | $46,502 |
| Total | 26,280 (100.0%) | $62,468 |
Earnings by Sex by Income Bracket in Plainfield
The most common earnings brackets in Plainfield are $100,000+ for men (5,415 | 39.4%) and $100,000+ for women (2,032 | 16.2%).
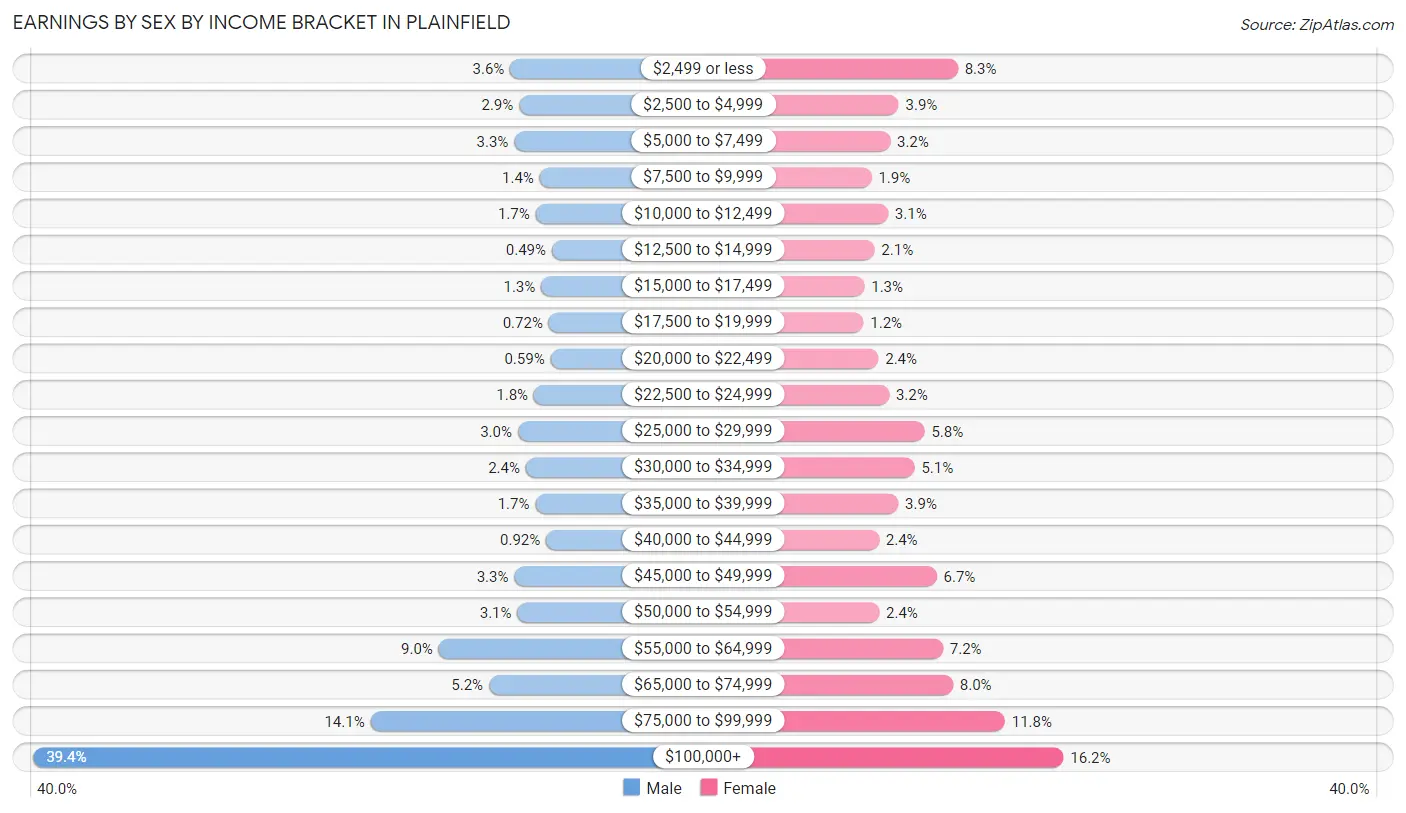
| Income | Male | Female |
| $2,499 or less | 497 (3.6%) | 1,040 (8.3%) |
| $2,500 to $4,999 | 404 (2.9%) | 486 (3.9%) |
| $5,000 to $7,499 | 455 (3.3%) | 406 (3.2%) |
| $7,500 to $9,999 | 193 (1.4%) | 231 (1.8%) |
| $10,000 to $12,499 | 236 (1.7%) | 386 (3.1%) |
| $12,500 to $14,999 | 68 (0.5%) | 259 (2.1%) |
| $15,000 to $17,499 | 178 (1.3%) | 164 (1.3%) |
| $17,500 to $19,999 | 99 (0.7%) | 155 (1.2%) |
| $20,000 to $22,499 | 81 (0.6%) | 295 (2.4%) |
| $22,500 to $24,999 | 252 (1.8%) | 395 (3.2%) |
| $25,000 to $29,999 | 419 (3.0%) | 729 (5.8%) |
| $30,000 to $34,999 | 336 (2.4%) | 635 (5.1%) |
| $35,000 to $39,999 | 238 (1.7%) | 482 (3.8%) |
| $40,000 to $44,999 | 126 (0.9%) | 301 (2.4%) |
| $45,000 to $49,999 | 454 (3.3%) | 842 (6.7%) |
| $50,000 to $54,999 | 423 (3.1%) | 303 (2.4%) |
| $55,000 to $64,999 | 1,235 (9.0%) | 901 (7.2%) |
| $65,000 to $74,999 | 715 (5.2%) | 995 (8.0%) |
| $75,000 to $99,999 | 1,937 (14.1%) | 1,482 (11.8%) |
| $100,000+ | 5,415 (39.4%) | 2,032 (16.2%) |
| Total | 13,761 (100.0%) | 12,519 (100.0%) |
Earnings by Sex by Educational Attainment in Plainfield
Average earnings in Plainfield are $90,557 for men and $56,610 for women, a difference of 37.5%. Men with an educational attainment of graduate degree enjoy the highest average annual earnings of $116,056, while those with less than high school education earn the least with $48,339. Women with an educational attainment of graduate degree earn the most with the average annual earnings of $90,450, while those with less than high school education have the smallest earnings of $24,191.
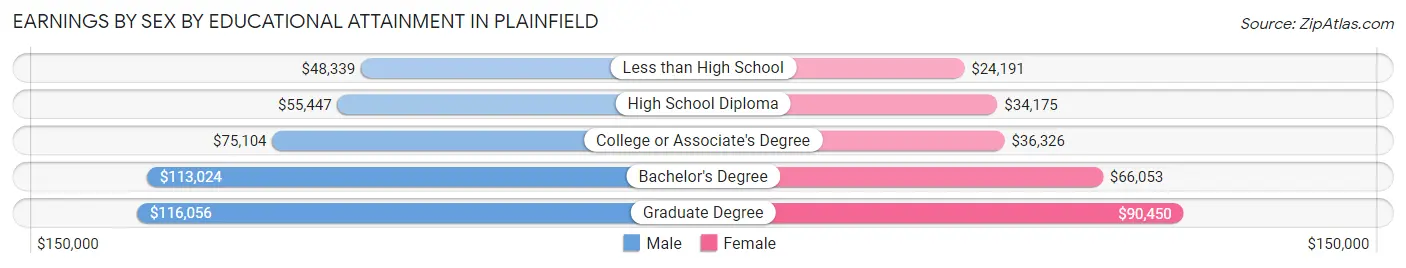
| Educational Attainment | Male Income | Female Income |
| Less than High School | $48,339 | $24,191 |
| High School Diploma | $55,447 | $34,175 |
| College or Associate's Degree | $75,104 | $36,326 |
| Bachelor's Degree | $113,024 | $66,053 |
| Graduate Degree | $116,056 | $90,450 |
| Total | $90,557 | $56,610 |
Family Income in Plainfield
Family Income Brackets in Plainfield
According to the Plainfield family income data, there are 3,884 families falling into the $200,000+ income range, which is the most common income bracket and makes up 32.7% of all families. Conversely, the less than $10,000 income bracket is the least frequent group with only 48 families (0.4%) belonging to this category.
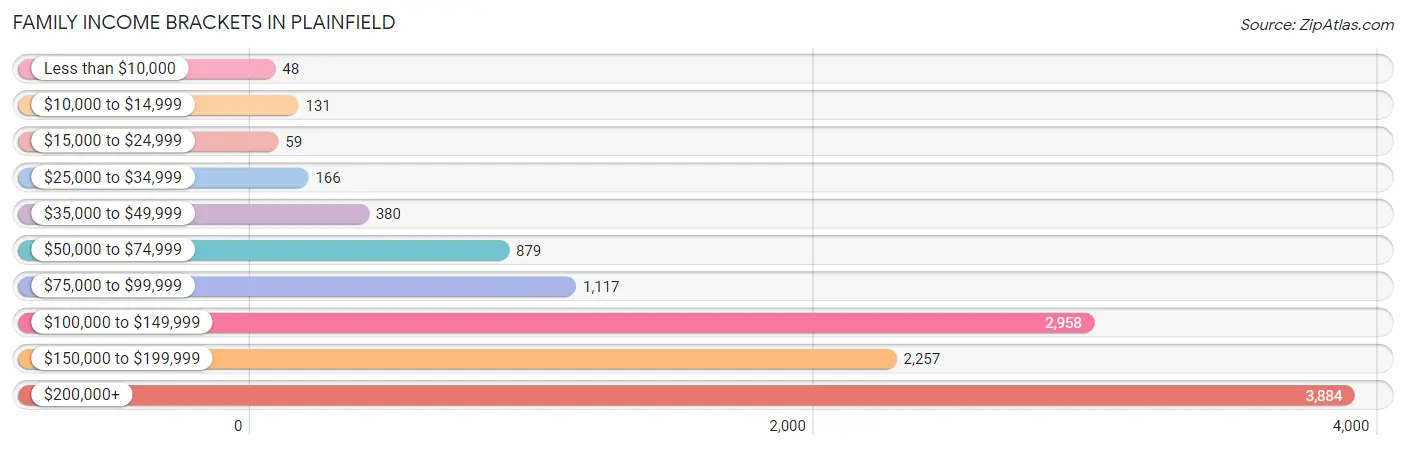
| Income Bracket | # Families | % Families |
| Less than $10,000 | 48 | 0.4% |
| $10,000 to $14,999 | 131 | 1.1% |
| $15,000 to $24,999 | 59 | 0.5% |
| $25,000 to $34,999 | 166 | 1.4% |
| $35,000 to $49,999 | 380 | 3.2% |
| $50,000 to $74,999 | 879 | 7.4% |
| $75,000 to $99,999 | 1,117 | 9.4% |
| $100,000 to $149,999 | 2,958 | 24.9% |
| $150,000 to $199,999 | 2,257 | 19.0% |
| $200,000+ | 3,884 | 32.7% |
Family Income by Famaliy Size in Plainfield
5-person families (1,438 | 12.1%) account for the highest median family income in Plainfield with $205,207 per family, while 2-person families (3,651 | 30.7%) have the highest median income of $67,301 per family member.
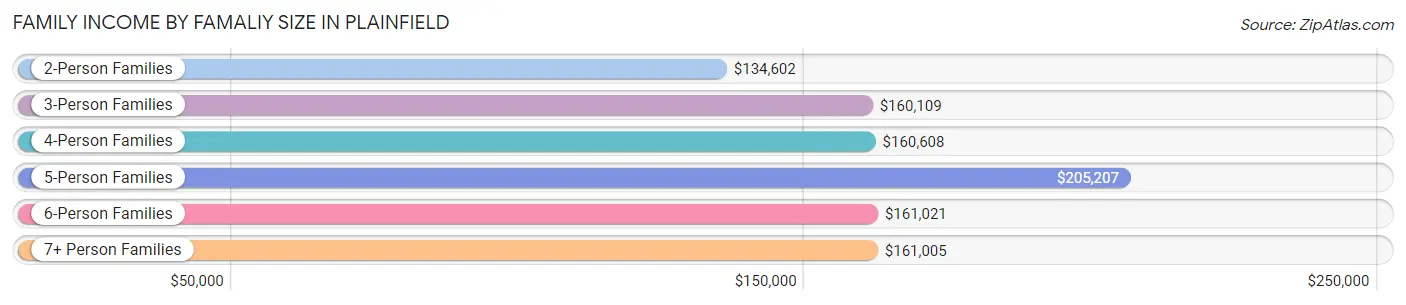
| Income Bracket | # Families | Median Income |
| 2-Person Families | 3,651 (30.7%) | $134,602 |
| 3-Person Families | 3,010 (25.3%) | $160,109 |
| 4-Person Families | 3,098 (26.1%) | $160,608 |
| 5-Person Families | 1,438 (12.1%) | $205,207 |
| 6-Person Families | 309 (2.6%) | $161,021 |
| 7+ Person Families | 372 (3.1%) | $161,005 |
| Total | 11,878 (100.0%) | $153,909 |
Family Income by Number of Earners in Plainfield
The median family income in Plainfield is $153,909, with families comprising 3+ earners (2,409) having the highest median family income of $183,581, while families with no earners (625) have the lowest median family income of $61,827, accounting for 20.3% and 5.3% of families, respectively.
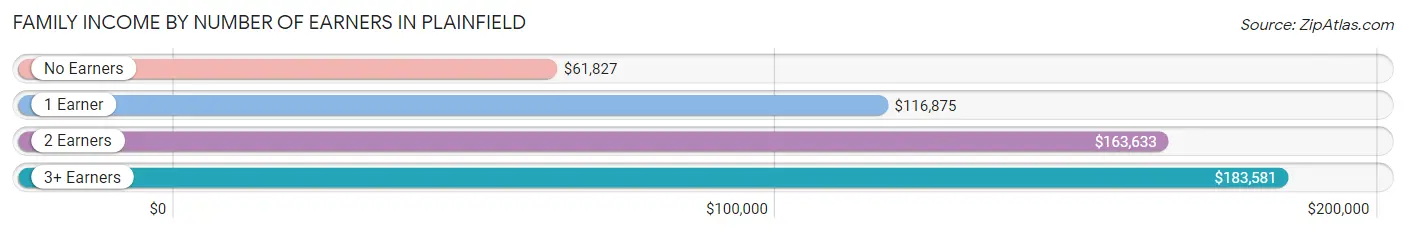
| Number of Earners | # Families | Median Income |
| No Earners | 625 (5.3%) | $61,827 |
| 1 Earner | 2,917 (24.6%) | $116,875 |
| 2 Earners | 5,927 (49.9%) | $163,633 |
| 3+ Earners | 2,409 (20.3%) | $183,581 |
| Total | 11,878 (100.0%) | $153,909 |
Household Income in Plainfield
Household Income Brackets in Plainfield
With 4,078 households falling in the category, the $200,000+ income range is the most frequent in Plainfield, accounting for 29.3% of all households. In contrast, only 139 households (1.0%) fall into the less than $10,000 income bracket, making it the least populous group.
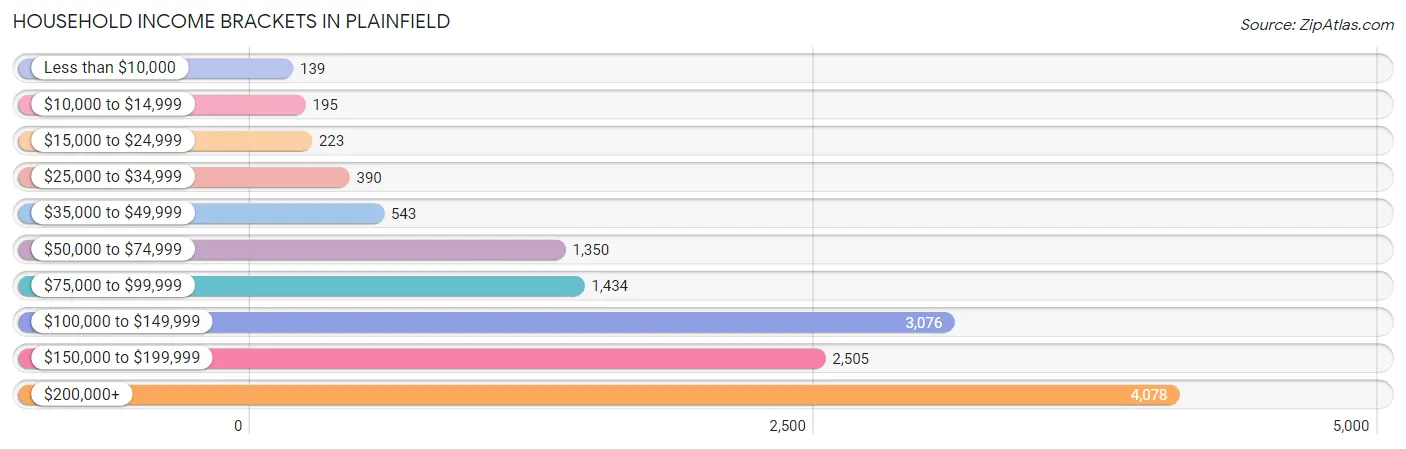
| Income Bracket | # Households | % Households |
| Less than $10,000 | 139 | 1.0% |
| $10,000 to $14,999 | 195 | 1.4% |
| $15,000 to $24,999 | 223 | 1.6% |
| $25,000 to $34,999 | 390 | 2.8% |
| $35,000 to $49,999 | 543 | 3.9% |
| $50,000 to $74,999 | 1,350 | 9.7% |
| $75,000 to $99,999 | 1,434 | 10.3% |
| $100,000 to $149,999 | 3,076 | 22.1% |
| $150,000 to $199,999 | 2,505 | 18.0% |
| $200,000+ | 4,078 | 29.3% |
Household Income by Householder Age in Plainfield
The median household income in Plainfield is $143,064, with the highest median household income of $161,344 found in the 45 to 64 years age bracket for the primary householder. A total of 6,886 households (49.5%) fall into this category. Meanwhile, the 65+ years age bracket for the primary householder has the lowest median household income of $79,184, with 2,130 households (15.3%) in this group.
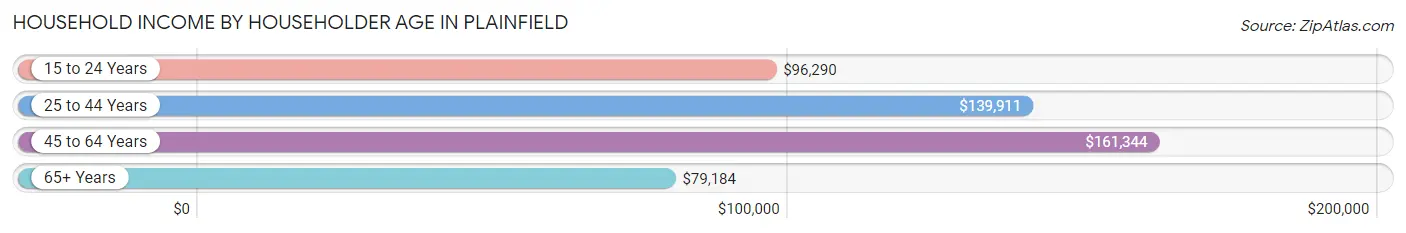
| Income Bracket | # Households | Median Income |
| 15 to 24 Years | 50 (0.4%) | $96,290 |
| 25 to 44 Years | 4,853 (34.9%) | $139,911 |
| 45 to 64 Years | 6,886 (49.5%) | $161,344 |
| 65+ Years | 2,130 (15.3%) | $79,184 |
| Total | 13,919 (100.0%) | $143,064 |
Poverty in Plainfield
Income Below Poverty by Sex and Age in Plainfield
With 1.8% poverty level for males and 2.7% for females among the residents of Plainfield, 55 to 64 year old males and 15 year old females are the most vulnerable to poverty, with 114 males (4.7%) and 39 females (9.7%) in their respective age groups living below the poverty level.
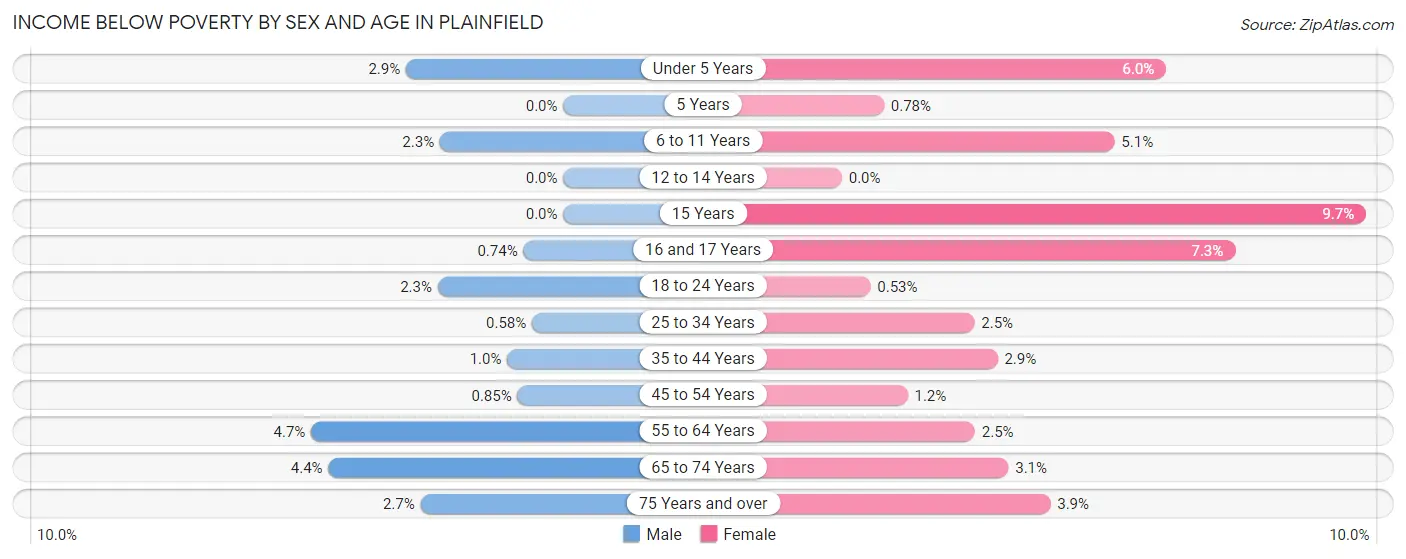
| Age Bracket | Male | Female |
| Under 5 Years | 33 (2.9%) | 66 (6.0%) |
| 5 Years | 0 (0.0%) | 4 (0.8%) |
| 6 to 11 Years | 56 (2.3%) | 89 (5.1%) |
| 12 to 14 Years | 0 (0.0%) | 0 (0.0%) |
| 15 Years | 0 (0.0%) | 39 (9.7%) |
| 16 and 17 Years | 7 (0.7%) | 55 (7.3%) |
| 18 to 24 Years | 36 (2.3%) | 11 (0.5%) |
| 25 to 34 Years | 11 (0.6%) | 54 (2.5%) |
| 35 to 44 Years | 35 (1.0%) | 112 (2.9%) |
| 45 to 54 Years | 35 (0.9%) | 48 (1.2%) |
| 55 to 64 Years | 114 (4.7%) | 55 (2.5%) |
| 65 to 74 Years | 60 (4.4%) | 38 (3.1%) |
| 75 Years and over | 19 (2.6%) | 34 (3.9%) |
| Total | 406 (1.8%) | 605 (2.7%) |
Income Above Poverty by Sex and Age in Plainfield
According to the poverty statistics in Plainfield, males aged 5 years and females aged 12 to 14 years are the age groups that are most secure financially, with 100.0% of males and 100.0% of females in these age groups living above the poverty line.
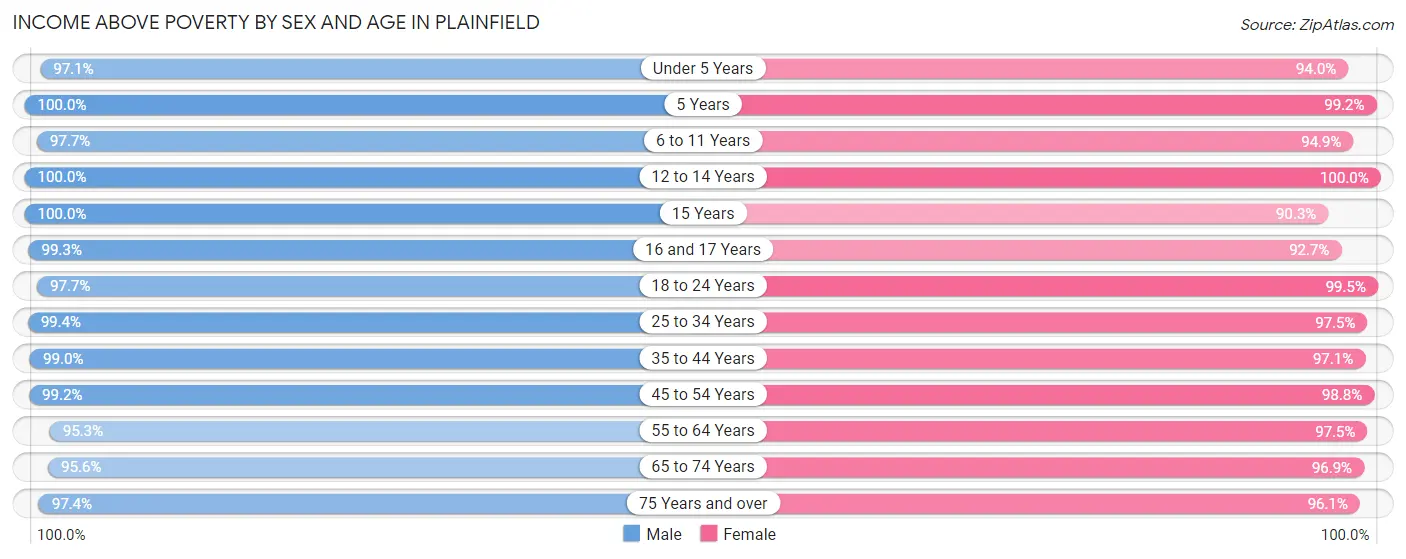
| Age Bracket | Male | Female |
| Under 5 Years | 1,099 (97.1%) | 1,030 (94.0%) |
| 5 Years | 343 (100.0%) | 507 (99.2%) |
| 6 to 11 Years | 2,393 (97.7%) | 1,669 (94.9%) |
| 12 to 14 Years | 1,647 (100.0%) | 1,362 (100.0%) |
| 15 Years | 466 (100.0%) | 362 (90.3%) |
| 16 and 17 Years | 939 (99.3%) | 698 (92.7%) |
| 18 to 24 Years | 1,511 (97.7%) | 2,072 (99.5%) |
| 25 to 34 Years | 1,902 (99.4%) | 2,143 (97.5%) |
| 35 to 44 Years | 3,318 (99.0%) | 3,759 (97.1%) |
| 45 to 54 Years | 4,101 (99.2%) | 3,882 (98.8%) |
| 55 to 64 Years | 2,323 (95.3%) | 2,176 (97.5%) |
| 65 to 74 Years | 1,316 (95.6%) | 1,193 (96.9%) |
| 75 Years and over | 699 (97.4%) | 845 (96.1%) |
| Total | 22,057 (98.2%) | 21,698 (97.3%) |
Income Below Poverty Among Married-Couple Families in Plainfield
The poverty statistics for married-couple families in Plainfield show that 0.4% or 43 of the total 9,740 families live below the poverty line. Families with no children have the highest poverty rate of 0.9%, comprising of 39 families. On the other hand, families with 1 or 2 children have the lowest poverty rate of 0.0%, which includes 0 families.
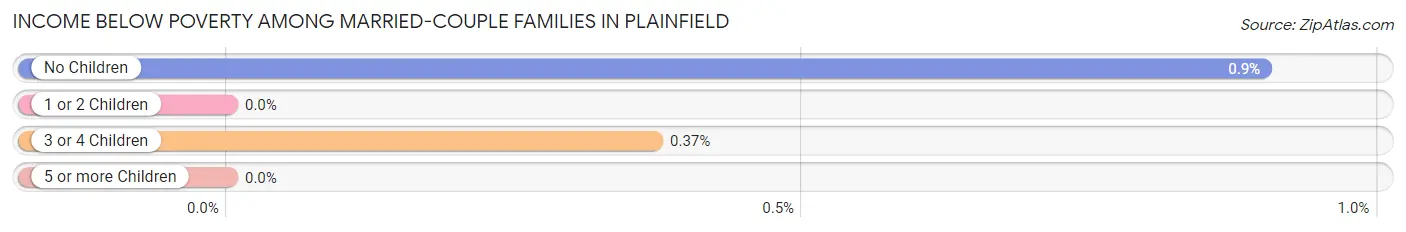
| Children | Above Poverty | Below Poverty |
| No Children | 4,294 (99.1%) | 39 (0.9%) |
| 1 or 2 Children | 4,209 (100.0%) | 0 (0.0%) |
| 3 or 4 Children | 1,084 (99.6%) | 4 (0.4%) |
| 5 or more Children | 110 (100.0%) | 0 (0.0%) |
| Total | 9,697 (99.6%) | 43 (0.4%) |
Income Below Poverty Among Single-Parent Households in Plainfield
According to the poverty data in Plainfield, 5.5% or 33 single-father households and 9.0% or 138 single-mother households are living below the poverty line. Among single-father households, those with no children have the highest poverty rate, with 27 households (7.9%) experiencing poverty. Likewise, among single-mother households, those with 3 or 4 children have the highest poverty rate, with 35 households (25.7%) falling below the poverty line.
| Children | Single Father | Single Mother |
| No Children | 27 (7.9%) | 14 (3.6%) |
| 1 or 2 Children | 6 (2.7%) | 89 (8.9%) |
| 3 or 4 Children | 0 (0.0%) | 35 (25.7%) |
| 5 or more Children | 0 (0.0%) | 0 (0.0%) |
| Total | 33 (5.5%) | 138 (9.0%) |
Income Below Poverty Among Married-Couple vs Single-Parent Households in Plainfield
The poverty data for Plainfield shows that 43 of the married-couple family households (0.4%) and 171 of the single-parent households (8.0%) are living below the poverty level. Within the married-couple family households, those with no children have the highest poverty rate, with 39 households (0.9%) falling below the poverty line. Among the single-parent households, those with 3 or 4 children have the highest poverty rate, with 35 household (23.6%) living below poverty.
| Children | Married-Couple Families | Single-Parent Households |
| No Children | 39 (0.9%) | 41 (5.6%) |
| 1 or 2 Children | 0 (0.0%) | 95 (7.8%) |
| 3 or 4 Children | 4 (0.4%) | 35 (23.6%) |
| 5 or more Children | 0 (0.0%) | 0 (0.0%) |
| Total | 43 (0.4%) | 171 (8.0%) |
Race in Plainfield
The most populous races in Plainfield are White / Caucasian (32,753 | 72.9%), Asian (4,289 | 9.5%), and Black / African American (4,196 | 9.3%).
| Race | # Population | % Population |
| Asian | 4,289 | 9.5% |
| Black / African American | 4,196 | 9.3% |
| Hawaiian / Pacific | 0 | 0.0% |
| Hispanic or Latino | 3,727 | 8.3% |
| Native / Alaskan | 169 | 0.4% |
| White / Caucasian | 32,753 | 72.9% |
| Two or more Races | 2,541 | 5.7% |
| Some other Race | 993 | 2.2% |
| Total | 44,941 | 100.0% |
Ancestry in Plainfield
The most populous ancestries reported in Plainfield are German (10,728 | 23.9%), Irish (7,198 | 16.0%), Polish (5,309 | 11.8%), Italian (4,914 | 10.9%), and English (3,621 | 8.1%), together accounting for 70.7% of all Plainfield residents.
| Ancestry | # Population | % Population |
| African | 283 | 0.6% |
| Albanian | 19 | 0.0% |
| American | 1,338 | 3.0% |
| Apache | 34 | 0.1% |
| Arab | 533 | 1.2% |
| Argentinean | 23 | 0.1% |
| Australian | 15 | 0.0% |
| Austrian | 216 | 0.5% |
| Belgian | 170 | 0.4% |
| Bhutanese | 69 | 0.2% |
| Blackfeet | 30 | 0.1% |
| Brazilian | 35 | 0.1% |
| British | 78 | 0.2% |
| Burmese | 51 | 0.1% |
| Canadian | 101 | 0.2% |
| Carpatho Rusyn | 7 | 0.0% |
| Central American | 67 | 0.2% |
| Cherokee | 283 | 0.6% |
| Choctaw | 27 | 0.1% |
| Colombian | 14 | 0.0% |
| Croatian | 126 | 0.3% |
| Cuban | 76 | 0.2% |
| Czech | 696 | 1.5% |
| Czechoslovakian | 111 | 0.3% |
| Danish | 181 | 0.4% |
| Dutch | 416 | 0.9% |
| Eastern European | 99 | 0.2% |
| Egyptian | 180 | 0.4% |
| English | 3,621 | 8.1% |
| Ethiopian | 15 | 0.0% |
| European | 474 | 1.1% |
| Filipino | 11 | 0.0% |
| Finnish | 94 | 0.2% |
| French | 529 | 1.2% |
| French Canadian | 126 | 0.3% |
| German | 10,728 | 23.9% |
| Greek | 365 | 0.8% |
| Guatemalan | 57 | 0.1% |
| Guyanese | 41 | 0.1% |
| Hungarian | 414 | 0.9% |
| Indian (Asian) | 605 | 1.3% |
| Iranian | 40 | 0.1% |
| Iraqi | 18 | 0.0% |
| Irish | 7,198 | 16.0% |
| Italian | 4,914 | 10.9% |
| Jamaican | 93 | 0.2% |
| Jordanian | 17 | 0.0% |
| Kenyan | 25 | 0.1% |
| Korean | 1,175 | 2.6% |
| Lebanese | 116 | 0.3% |
| Lithuanian | 632 | 1.4% |
| Lumbee | 47 | 0.1% |
| Luxembourger | 7 | 0.0% |
| Malaysian | 49 | 0.1% |
| Mexican | 2,252 | 5.0% |
| Mexican American Indian | 84 | 0.2% |
| Mongolian | 25 | 0.1% |
| Nigerian | 1,115 | 2.5% |
| Northern European | 142 | 0.3% |
| Norwegian | 623 | 1.4% |
| Pakistani | 63 | 0.1% |
| Palestinian | 61 | 0.1% |
| Panamanian | 10 | 0.0% |
| Peruvian | 47 | 0.1% |
| Polish | 5,309 | 11.8% |
| Portuguese | 26 | 0.1% |
| Puerto Rican | 456 | 1.0% |
| Romanian | 105 | 0.2% |
| Russian | 299 | 0.7% |
| Scandinavian | 135 | 0.3% |
| Scotch-Irish | 297 | 0.7% |
| Scottish | 391 | 0.9% |
| Serbian | 122 | 0.3% |
| Slavic | 12 | 0.0% |
| Slovak | 60 | 0.1% |
| Slovene | 23 | 0.1% |
| South American | 84 | 0.2% |
| Spaniard | 488 | 1.1% |
| Spanish | 91 | 0.2% |
| Sri Lankan | 238 | 0.5% |
| Subsaharan African | 1,497 | 3.3% |
| Swedish | 845 | 1.9% |
| Swiss | 85 | 0.2% |
| Thai | 1,815 | 4.0% |
| Ukrainian | 172 | 0.4% |
| Welsh | 364 | 0.8% |
| Yugoslavian | 169 | 0.4% | View All 87 Rows |
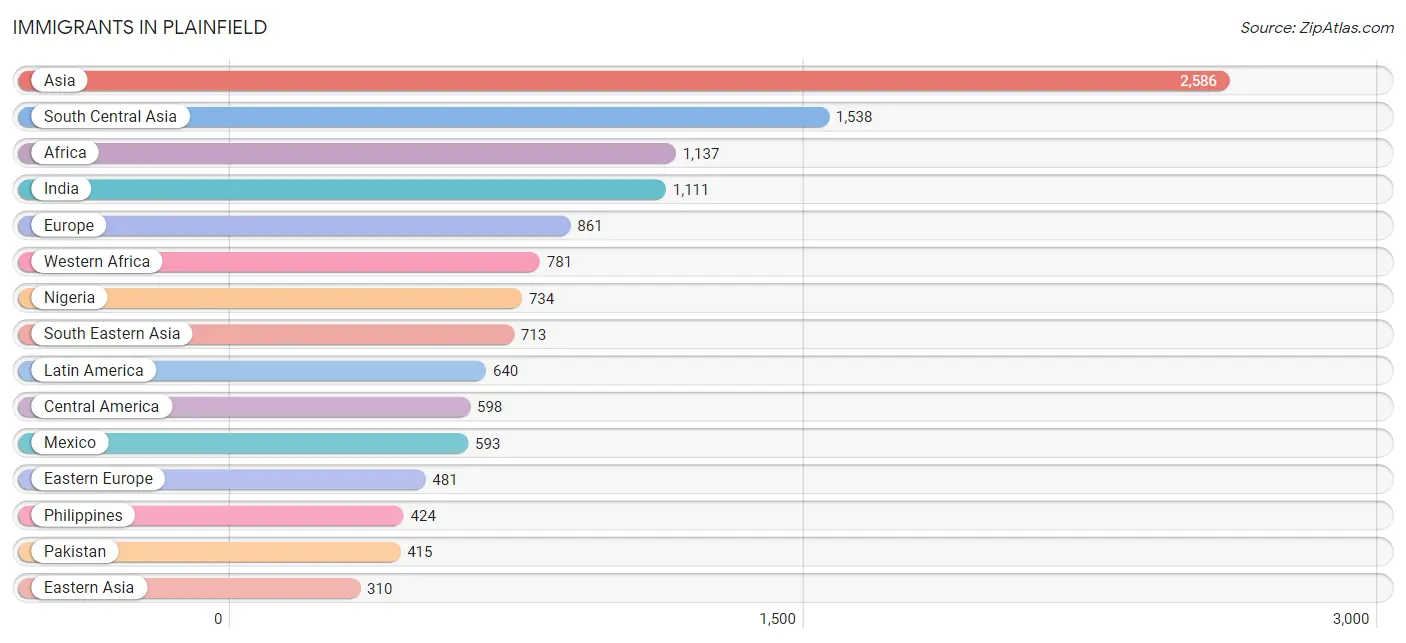
Immigrants in Plainfield
The most numerous immigrant groups reported in Plainfield came from Asia (2,586 | 5.8%), South Central Asia (1,538 | 3.4%), Africa (1,137 | 2.5%), India (1,111 | 2.5%), and Europe (861 | 1.9%), together accounting for 16.1% of all Plainfield residents.
| Immigration Origin | # Population | % Population |
| Africa | 1,137 | 2.5% |
| Argentina | 11 | 0.0% |
| Asia | 2,586 | 5.8% |
| Brazil | 9 | 0.0% |
| Canada | 125 | 0.3% |
| Central America | 598 | 1.3% |
| China | 242 | 0.5% |
| Croatia | 11 | 0.0% |
| Eastern Africa | 118 | 0.3% |
| Eastern Asia | 310 | 0.7% |
| Eastern Europe | 481 | 1.1% |
| Egypt | 172 | 0.4% |
| England | 32 | 0.1% |
| Ethiopia | 15 | 0.0% |
| Europe | 861 | 1.9% |
| France | 22 | 0.1% |
| Germany | 62 | 0.1% |
| Greece | 183 | 0.4% |
| Guatemala | 5 | 0.0% |
| India | 1,111 | 2.5% |
| Italy | 17 | 0.0% |
| Japan | 17 | 0.0% |
| Jordan | 9 | 0.0% |
| Kazakhstan | 12 | 0.0% |
| Kenya | 87 | 0.2% |
| Korea | 51 | 0.1% |
| Laos | 49 | 0.1% |
| Latin America | 640 | 1.4% |
| Lithuania | 101 | 0.2% |
| Malaysia | 73 | 0.2% |
| Mexico | 593 | 1.3% |
| Moldova | 68 | 0.2% |
| Nigeria | 734 | 1.6% |
| Northern Africa | 238 | 0.5% |
| Northern Europe | 87 | 0.2% |
| Pakistan | 415 | 0.9% |
| Peru | 6 | 0.0% |
| Philippines | 424 | 0.9% |
| Poland | 146 | 0.3% |
| Romania | 28 | 0.1% |
| Serbia | 47 | 0.1% |
| South America | 42 | 0.1% |
| South Central Asia | 1,538 | 3.4% |
| South Eastern Asia | 713 | 1.6% |
| Southern Europe | 209 | 0.5% |
| Spain | 9 | 0.0% |
| Sudan | 10 | 0.0% |
| Thailand | 40 | 0.1% |
| Ukraine | 42 | 0.1% |
| Vietnam | 127 | 0.3% |
| Western Africa | 781 | 1.7% |
| Western Asia | 25 | 0.1% |
| Western Europe | 84 | 0.2% | View All 53 Rows |
Sex and Age in Plainfield
Sex and Age in Plainfield
The most populous age groups in Plainfield are 10 to 14 Years (2,562 | 11.4%) for men and 45 to 49 Years (2,121 | 9.5%) for women.
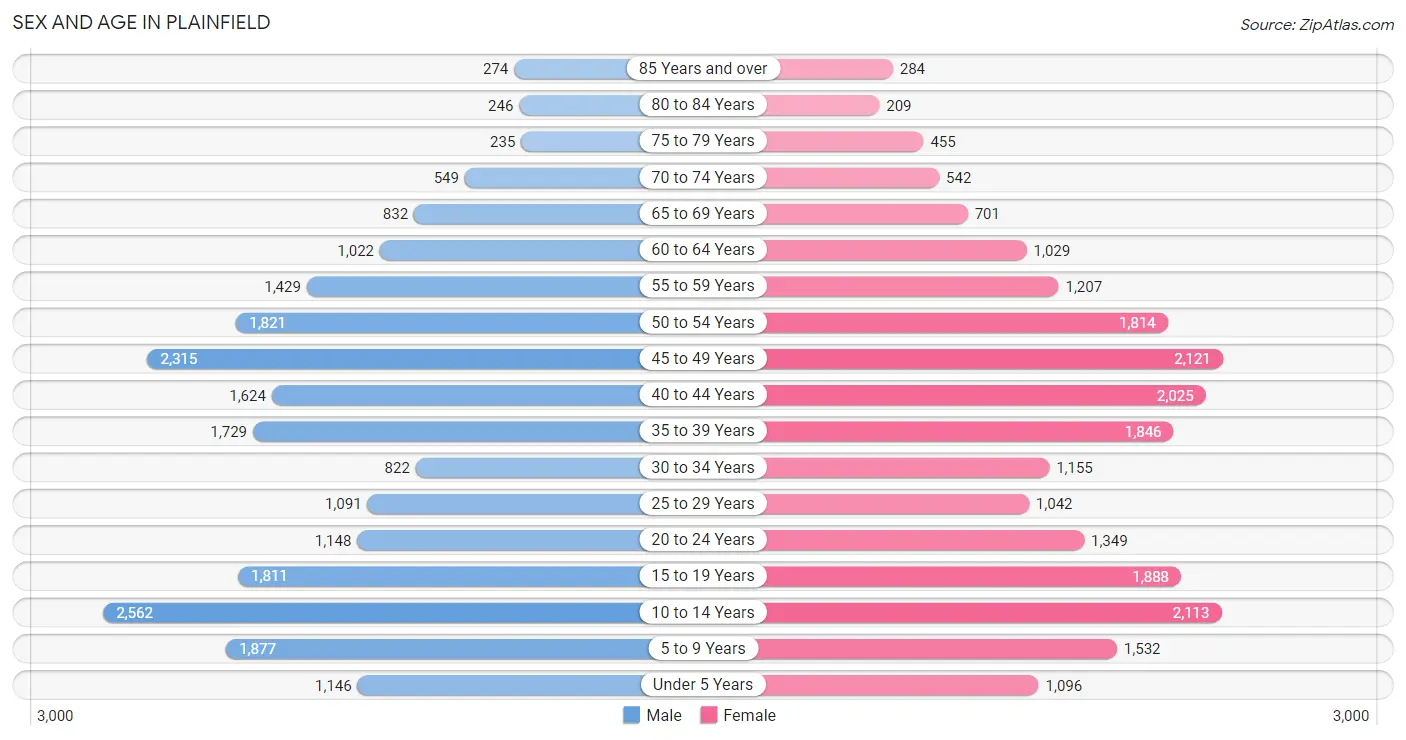
| Age Bracket | Male | Female |
| Under 5 Years | 1,146 (5.1%) | 1,096 (4.9%) |
| 5 to 9 Years | 1,877 (8.3%) | 1,532 (6.8%) |
| 10 to 14 Years | 2,562 (11.4%) | 2,113 (9.4%) |
| 15 to 19 Years | 1,811 (8.0%) | 1,888 (8.4%) |
| 20 to 24 Years | 1,148 (5.1%) | 1,349 (6.0%) |
| 25 to 29 Years | 1,091 (4.8%) | 1,042 (4.6%) |
| 30 to 34 Years | 822 (3.6%) | 1,155 (5.1%) |
| 35 to 39 Years | 1,729 (7.7%) | 1,846 (8.2%) |
| 40 to 44 Years | 1,624 (7.2%) | 2,025 (9.0%) |
| 45 to 49 Years | 2,315 (10.3%) | 2,121 (9.5%) |
| 50 to 54 Years | 1,821 (8.1%) | 1,814 (8.1%) |
| 55 to 59 Years | 1,429 (6.3%) | 1,207 (5.4%) |
| 60 to 64 Years | 1,022 (4.5%) | 1,029 (4.6%) |
| 65 to 69 Years | 832 (3.7%) | 701 (3.1%) |
| 70 to 74 Years | 549 (2.4%) | 542 (2.4%) |
| 75 to 79 Years | 235 (1.0%) | 455 (2.0%) |
| 80 to 84 Years | 246 (1.1%) | 209 (0.9%) |
| 85 Years and over | 274 (1.2%) | 284 (1.3%) |
| Total | 22,533 (100.0%) | 22,408 (100.0%) |
Families and Households in Plainfield
Median Family Size in Plainfield
The median family size in Plainfield is 3.51 persons per family, with married-couple families (9,740 | 82.0%) accounting for the largest median family size of 3.55 persons per family. On the other hand, single female/mother families (1,538 | 13.0%) represent the smallest median family size with 3.28 persons per family.
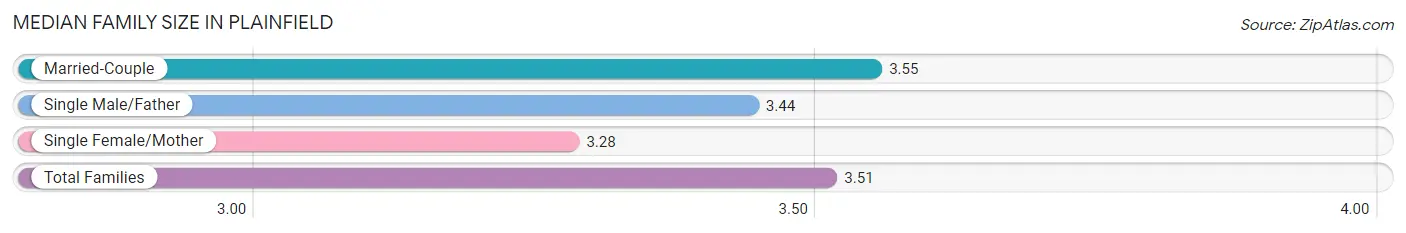
| Family Type | # Families | Family Size |
| Married-Couple | 9,740 (82.0%) | 3.55 |
| Single Male/Father | 600 (5.1%) | 3.44 |
| Single Female/Mother | 1,538 (13.0%) | 3.28 |
| Total Families | 11,878 (100.0%) | 3.51 |
Median Household Size in Plainfield
The median household size in Plainfield is 3.21 persons per household, with single male/father households (600 | 4.3%) accounting for the largest median household size of 3.79 persons per household. non-family households (2,041 | 14.7%) represent the smallest median household size with 1.15 persons per household.
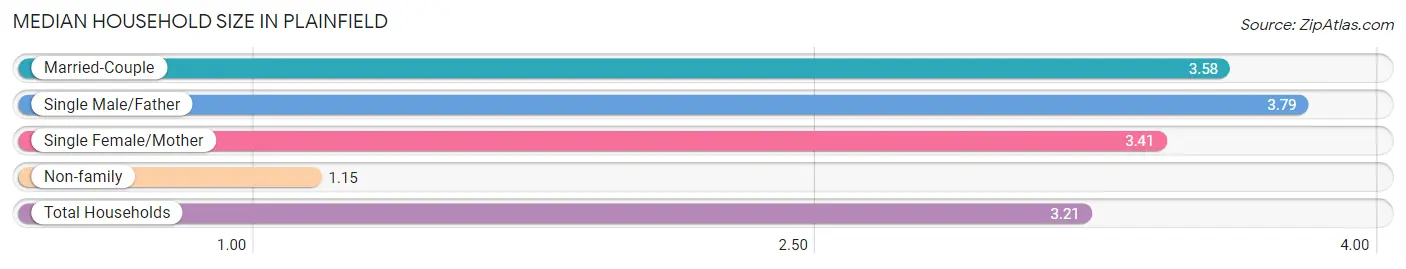
| Household Type | # Households | Household Size |
| Married-Couple | 9,740 (70.0%) | 3.58 |
| Single Male/Father | 600 (4.3%) | 3.79 |
| Single Female/Mother | 1,538 (11.1%) | 3.41 |
| Non-family | 2,041 (14.7%) | 1.15 |
| Total Households | 13,919 (100.0%) | 3.21 |
Household Size by Marriage Status in Plainfield
Out of a total of 13,919 households in Plainfield, 11,878 (85.3%) are family households, while 2,041 (14.7%) are nonfamily households. The most numerous type of family households are 2-person households, comprising 3,507, and the most common type of nonfamily households are 1-person households, comprising 1,752.
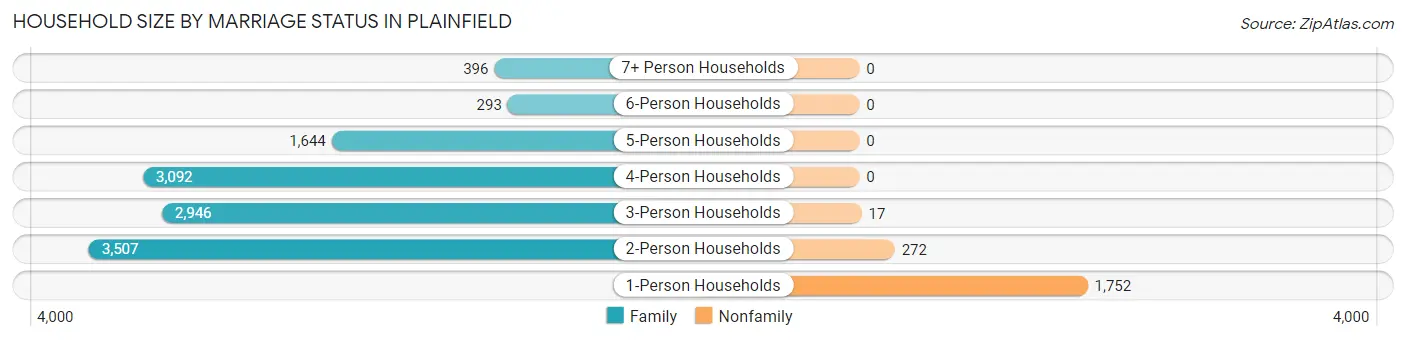
| Household Size | Family Households | Nonfamily Households |
| 1-Person Households | - | 1,752 (12.6%) |
| 2-Person Households | 3,507 (25.2%) | 272 (1.9%) |
| 3-Person Households | 2,946 (21.2%) | 17 (0.1%) |
| 4-Person Households | 3,092 (22.2%) | 0 (0.0%) |
| 5-Person Households | 1,644 (11.8%) | 0 (0.0%) |
| 6-Person Households | 293 (2.1%) | 0 (0.0%) |
| 7+ Person Households | 396 (2.9%) | 0 (0.0%) |
| Total | 11,878 (85.3%) | 2,041 (14.7%) |
Female Fertility in Plainfield
Fertility by Age in Plainfield
Average fertility rate in Plainfield is 48.0 births per 1,000 women. Women in the age bracket of 20 to 34 years have the highest fertility rate with 128.0 births per 1,000 women. Women in the age bracket of 20 to 34 years acount for 79.6% of all women with births.
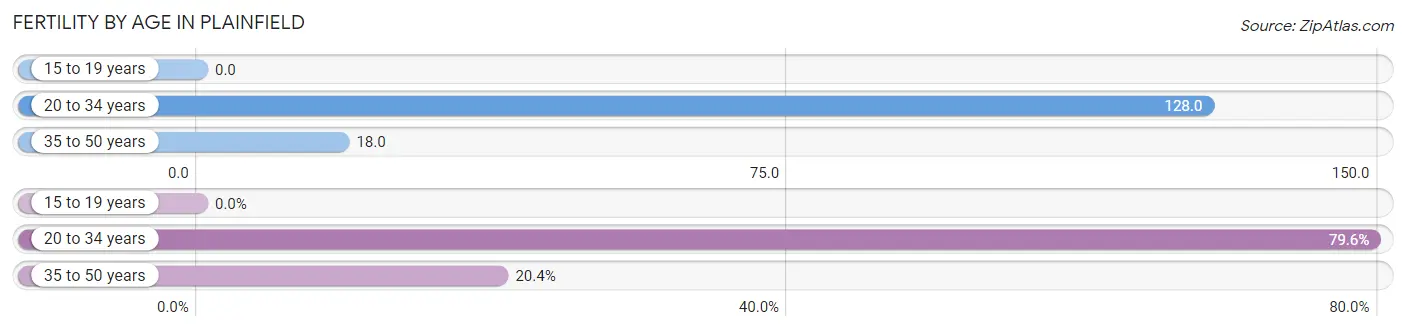
| Age Bracket | Women with Births | Births / 1,000 Women |
| 15 to 19 years | 0 (0.0%) | 0.0 |
| 20 to 34 years | 453 (79.6%) | 128.0 |
| 35 to 50 years | 116 (20.4%) | 18.0 |
| Total | 569 (100.0%) | 48.0 |
Fertility by Age by Marriage Status in Plainfield
92.4% of women with births (569) in Plainfield are married. The highest percentage of unmarried women with births falls into 20 to 34 years age bracket with 9.5% of them unmarried at the time of birth, while the lowest percentage of unmarried women with births belong to 35 to 50 years age bracket with 0.0% of them unmarried.
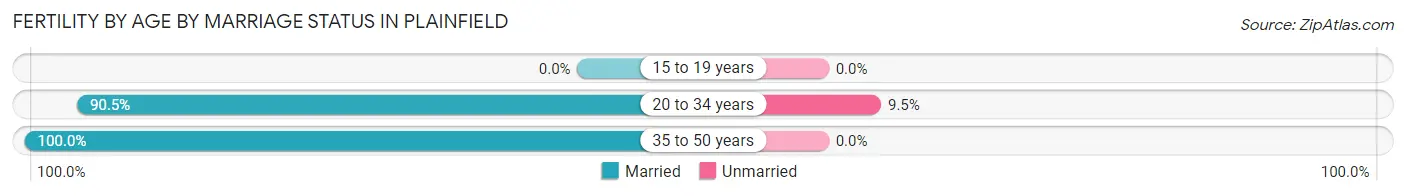
| Age Bracket | Married | Unmarried |
| 15 to 19 years | 0 (0.0%) | 0 (0.0%) |
| 20 to 34 years | 410 (90.5%) | 43 (9.5%) |
| 35 to 50 years | 116 (100.0%) | 0 (0.0%) |
| Total | 526 (92.4%) | 43 (7.6%) |
Fertility by Education in Plainfield
Average fertility rate in Plainfield is 48.0 births per 1,000 women. Women with the education attainment of college or associate's degree have the highest fertility rate of 84.0 births per 1,000 women, while women with the education attainment of high school diploma have the lowest fertility at 12.0 births per 1,000 women. Women with the education attainment of college or associate's degree represent 45.7% of all women with births.
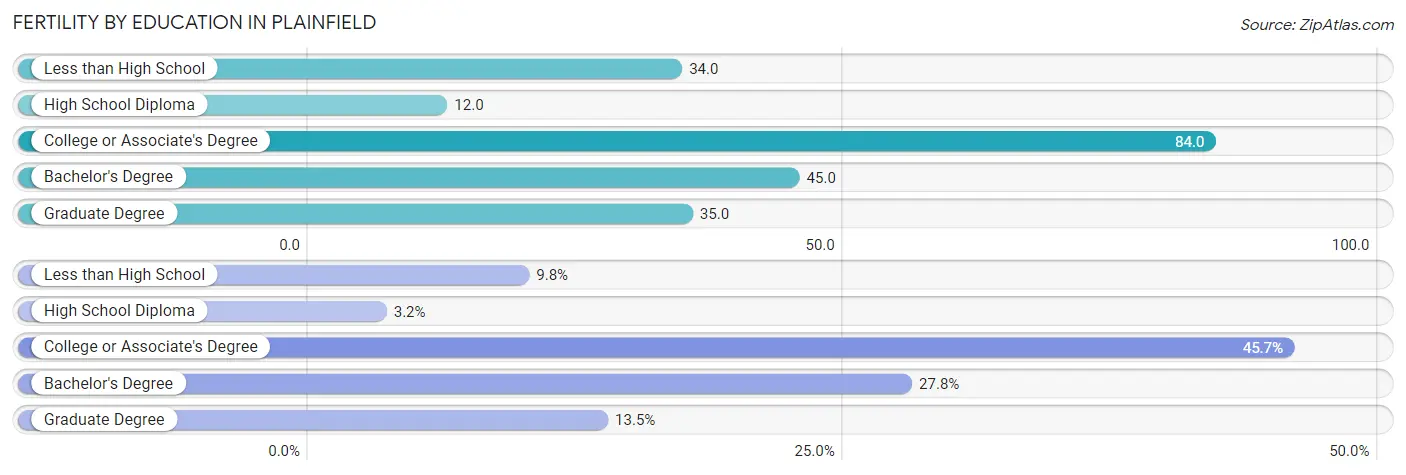
| Educational Attainment | Women with Births | Births / 1,000 Women |
| Less than High School | 56 (9.8%) | 34.0 |
| High School Diploma | 18 (3.2%) | 12.0 |
| College or Associate's Degree | 260 (45.7%) | 84.0 |
| Bachelor's Degree | 158 (27.8%) | 45.0 |
| Graduate Degree | 77 (13.5%) | 35.0 |
| Total | 569 (100.0%) | 48.0 |
Fertility by Education by Marriage Status in Plainfield
7.6% of women with births in Plainfield are unmarried. Women with the educational attainment of high school diploma are most likely to be married with 100.0% of them married at childbirth, while women with the educational attainment of less than high school are least likely to be married with 55.4% of them unmarried at childbirth.
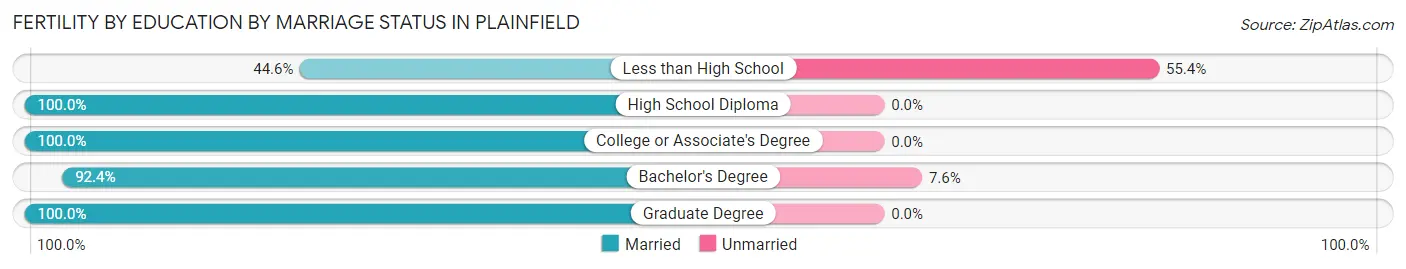
| Educational Attainment | Married | Unmarried |
| Less than High School | 25 (44.6%) | 31 (55.4%) |
| High School Diploma | 18 (100.0%) | 0 (0.0%) |
| College or Associate's Degree | 260 (100.0%) | 0 (0.0%) |
| Bachelor's Degree | 146 (92.4%) | 12 (7.6%) |
| Graduate Degree | 77 (100.0%) | 0 (0.0%) |
| Total | 526 (92.4%) | 43 (7.6%) |
Employment Characteristics in Plainfield
Employment by Class of Employer in Plainfield
Among the 23,410 employed individuals in Plainfield, private company employees (17,951 | 76.7%), not-for-profit organizations (1,578 | 6.7%), and local government employees (1,399 | 6.0%) make up the most common classes of employment.
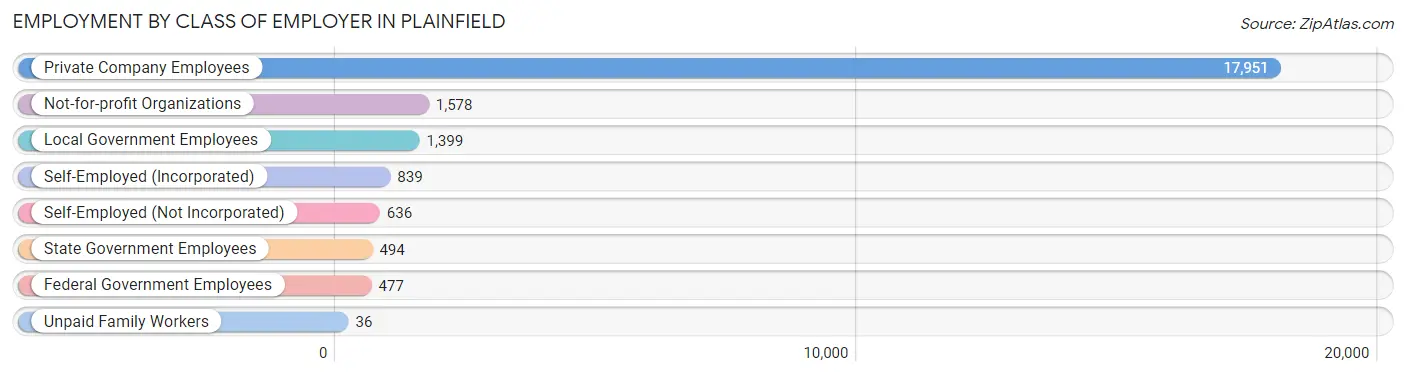
| Employer Class | # Employees | % Employees |
| Private Company Employees | 17,951 | 76.7% |
| Self-Employed (Incorporated) | 839 | 3.6% |
| Self-Employed (Not Incorporated) | 636 | 2.7% |
| Not-for-profit Organizations | 1,578 | 6.7% |
| Local Government Employees | 1,399 | 6.0% |
| State Government Employees | 494 | 2.1% |
| Federal Government Employees | 477 | 2.0% |
| Unpaid Family Workers | 36 | 0.2% |
| Total | 23,410 | 100.0% |
Employment Status by Age in Plainfield
According to the labor force statistics for Plainfield, out of the total population over 16 years of age (33,748), 72.9% or 24,602 individuals are in the labor force, with 3.7% or 910 of them unemployed. The age group with the highest labor force participation rate is 45 to 54 years, with 89.1% or 7,191 individuals in the labor force. Within the labor force, the 16 to 19 years age range has the highest percentage of unemployed individuals, with 13.3% or 163 of them being unemployed.
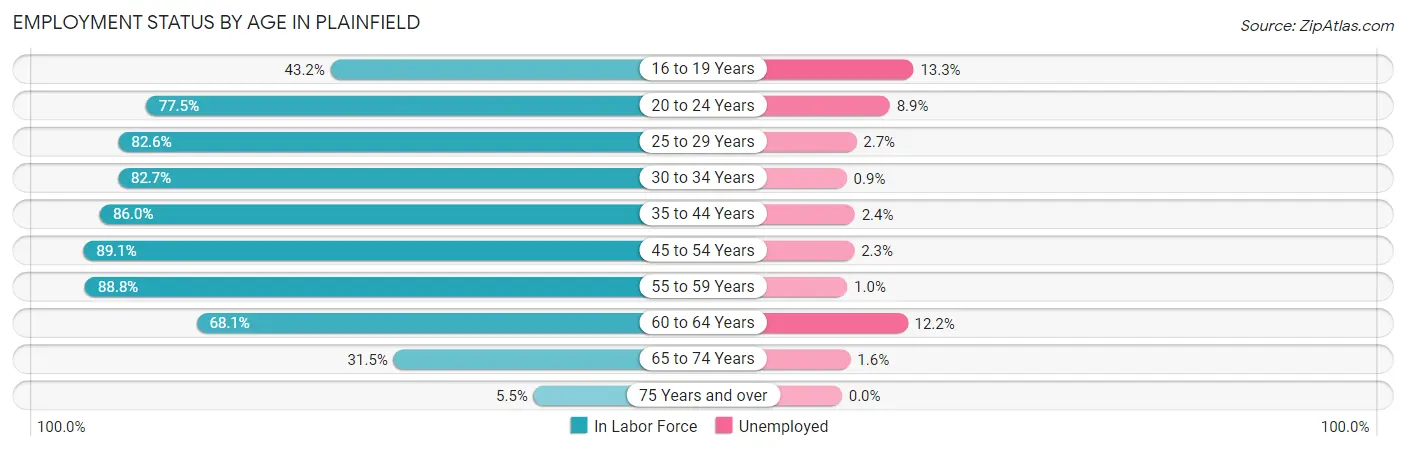
| Age Bracket | In Labor Force | Unemployed |
| 16 to 19 Years | 1,223 (43.2%) | 163 (13.3%) |
| 20 to 24 Years | 1,935 (77.5%) | 172 (8.9%) |
| 25 to 29 Years | 1,762 (82.6%) | 48 (2.7%) |
| 30 to 34 Years | 1,635 (82.7%) | 15 (0.9%) |
| 35 to 44 Years | 6,213 (86.0%) | 149 (2.4%) |
| 45 to 54 Years | 7,191 (89.1%) | 165 (2.3%) |
| 55 to 59 Years | 2,341 (88.8%) | 23 (1.0%) |
| 60 to 64 Years | 1,397 (68.1%) | 170 (12.2%) |
| 65 to 74 Years | 827 (31.5%) | 13 (1.6%) |
| 75 Years and over | 94 (5.5%) | 0 (0.0%) |
| Total | 24,602 (72.9%) | 910 (3.7%) |
Employment Status by Educational Attainment in Plainfield
According to labor force statistics for Plainfield, 85.3% of individuals (20,550) out of the total population between 25 and 64 years of age (24,092) are in the labor force, with 2.8% or 575 of them being unemployed. The group with the highest labor force participation rate are those with the educational attainment of bachelor's degree or higher, with 89.2% or 12,418 individuals in the labor force. Within the labor force, individuals with less than high school education have the highest percentage of unemployment, with 17.5% or 105 of them being unemployed.
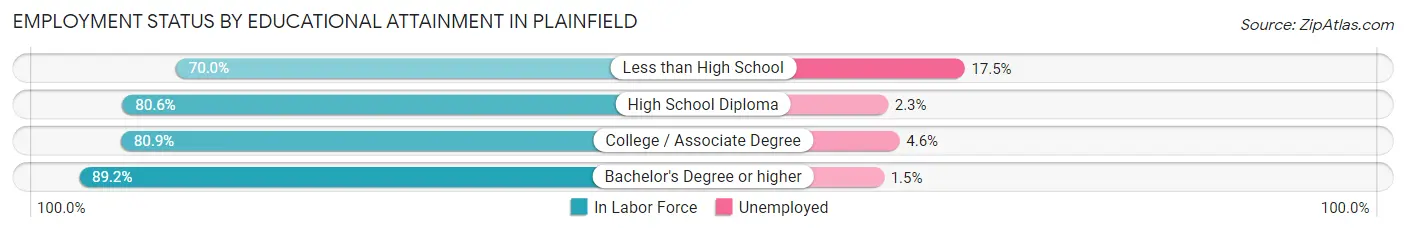
| Educational Attainment | In Labor Force | Unemployed |
| Less than High School | 601 (70.0%) | 150 (17.5%) |
| High School Diploma | 2,627 (80.6%) | 75 (2.3%) |
| College / Associate Degree | 4,898 (80.9%) | 278 (4.6%) |
| Bachelor's Degree or higher | 12,418 (89.2%) | 209 (1.5%) |
| Total | 20,550 (85.3%) | 675 (2.8%) |
Employment Occupations by Sex in Plainfield
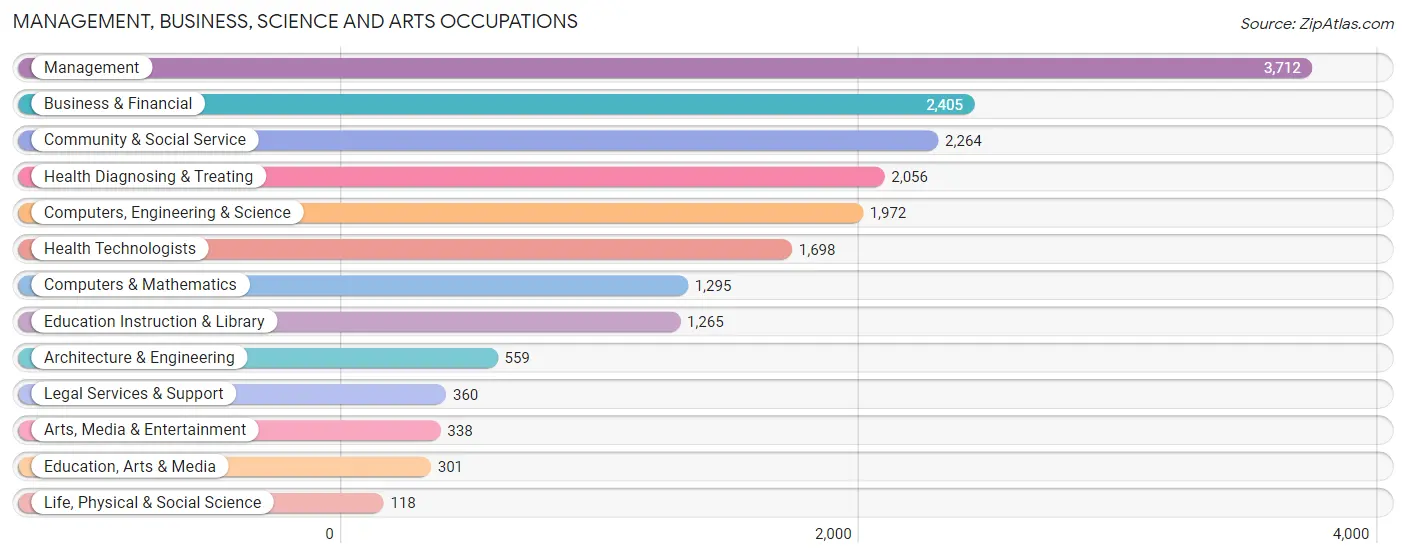
Management, Business, Science and Arts Occupations
The most common Management, Business, Science and Arts occupations in Plainfield are Management (3,712 | 15.7%), Business & Financial (2,405 | 10.2%), Community & Social Service (2,264 | 9.6%), Health Diagnosing & Treating (2,056 | 8.7%), and Computers, Engineering & Science (1,972 | 8.3%).
Management, Business, Science and Arts Occupations by Sex
Within the Management, Business, Science and Arts occupations in Plainfield, the most male-oriented occupations are Architecture & Engineering (84.4%), Computers, Engineering & Science (75.5%), and Computers & Mathematics (73.7%), while the most female-oriented occupations are Education Instruction & Library (83.3%), Education, Arts & Media (78.4%), and Health Technologists (76.1%).
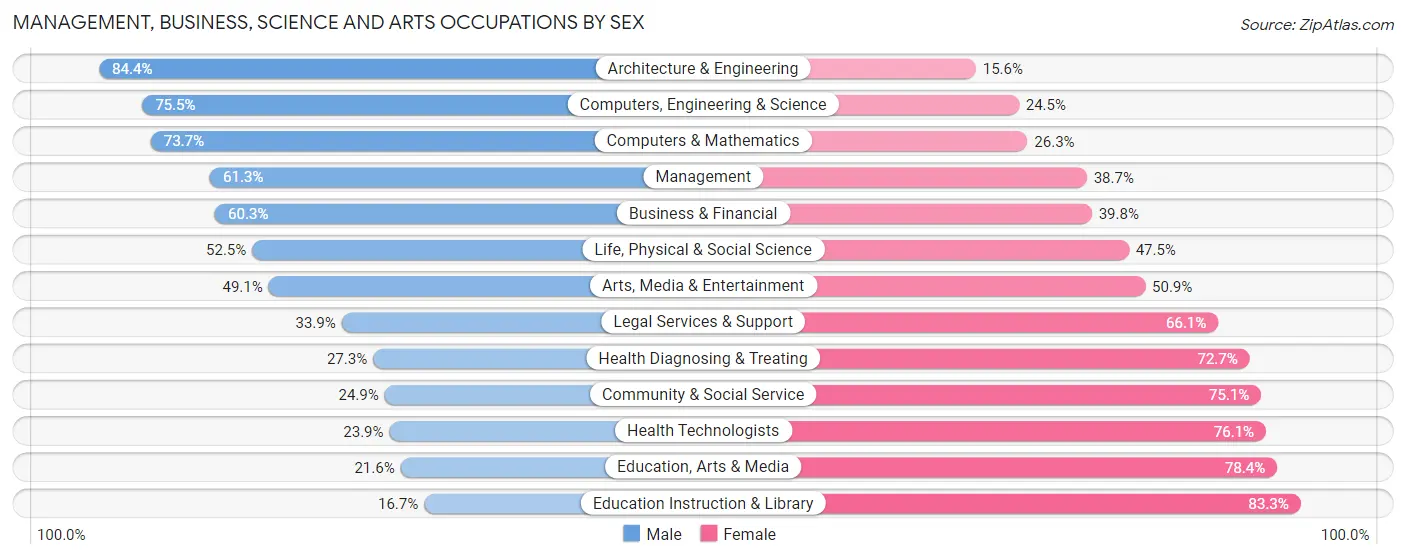
| Occupation | Male | Female |
| Management | 2,275 (61.3%) | 1,437 (38.7%) |
| Business & Financial | 1,449 (60.3%) | 956 (39.8%) |
| Computers, Engineering & Science | 1,488 (75.5%) | 484 (24.5%) |
| Computers & Mathematics | 954 (73.7%) | 341 (26.3%) |
| Architecture & Engineering | 472 (84.4%) | 87 (15.6%) |
| Life, Physical & Social Science | 62 (52.5%) | 56 (47.5%) |
| Community & Social Service | 564 (24.9%) | 1,700 (75.1%) |
| Education, Arts & Media | 65 (21.6%) | 236 (78.4%) |
| Legal Services & Support | 122 (33.9%) | 238 (66.1%) |
| Education Instruction & Library | 211 (16.7%) | 1,054 (83.3%) |
| Arts, Media & Entertainment | 166 (49.1%) | 172 (50.9%) |
| Health Diagnosing & Treating | 562 (27.3%) | 1,494 (72.7%) |
| Health Technologists | 406 (23.9%) | 1,292 (76.1%) |
| Total (Category) | 6,338 (51.1%) | 6,071 (48.9%) |
| Total (Overall) | 12,578 (53.1%) | 11,089 (46.9%) |
Services Occupations
The most common Services occupations in Plainfield are Food Preparation & Serving (831 | 3.5%), Personal Care & Service (634 | 2.7%), Security & Protection (544 | 2.3%), Healthcare Support (450 | 1.9%), and Cleaning & Maintenance (309 | 1.3%).
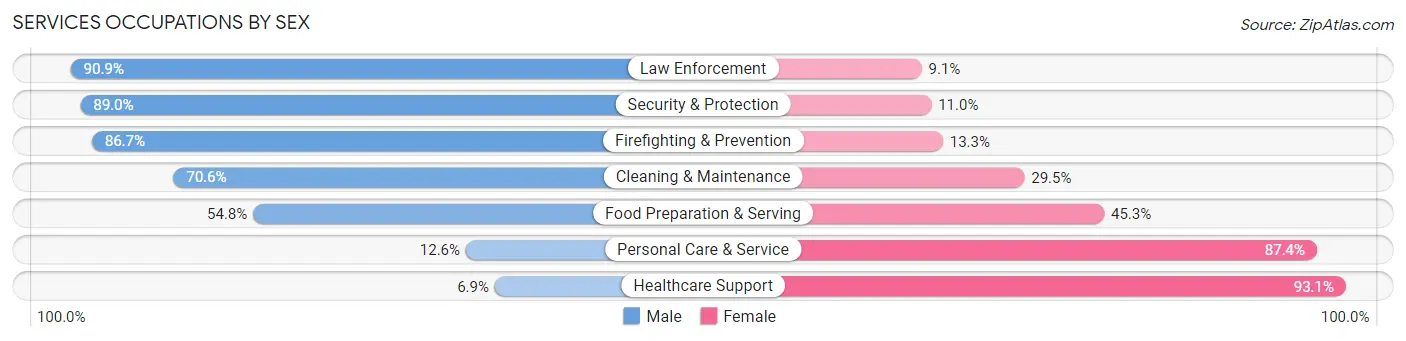
Services Occupations by Sex
Within the Services occupations in Plainfield, the most male-oriented occupations are Law Enforcement (90.9%), Security & Protection (89.0%), and Firefighting & Prevention (86.7%), while the most female-oriented occupations are Healthcare Support (93.1%), Personal Care & Service (87.4%), and Food Preparation & Serving (45.3%).
| Occupation | Male | Female |
| Healthcare Support | 31 (6.9%) | 419 (93.1%) |
| Security & Protection | 484 (89.0%) | 60 (11.0%) |
| Firefighting & Prevention | 215 (86.7%) | 33 (13.3%) |
| Law Enforcement | 269 (90.9%) | 27 (9.1%) |
| Food Preparation & Serving | 455 (54.7%) | 376 (45.3%) |
| Cleaning & Maintenance | 218 (70.6%) | 91 (29.4%) |
| Personal Care & Service | 80 (12.6%) | 554 (87.4%) |
| Total (Category) | 1,268 (45.8%) | 1,500 (54.2%) |
| Total (Overall) | 12,578 (53.1%) | 11,089 (46.9%) |
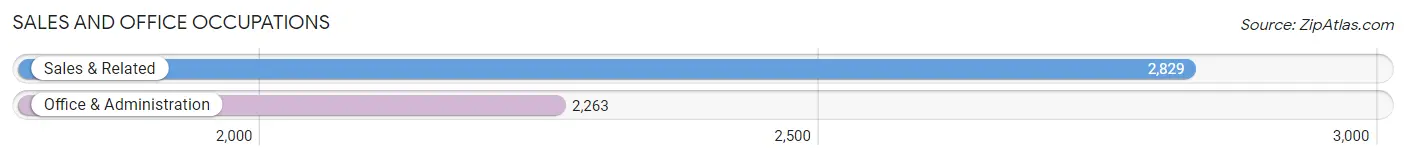
Sales and Office Occupations
The most common Sales and Office occupations in Plainfield are Sales & Related (2,829 | 11.9%), and Office & Administration (2,263 | 9.6%).
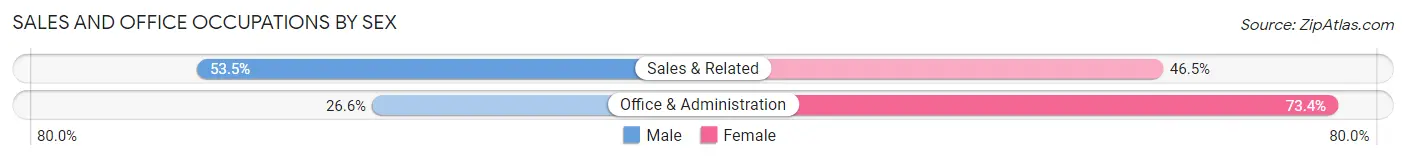
Sales and Office Occupations by Sex
| Occupation | Male | Female |
| Sales & Related | 1,513 (53.5%) | 1,316 (46.5%) |
| Office & Administration | 601 (26.6%) | 1,662 (73.4%) |
| Total (Category) | 2,114 (41.5%) | 2,978 (58.5%) |
| Total (Overall) | 12,578 (53.1%) | 11,089 (46.9%) |
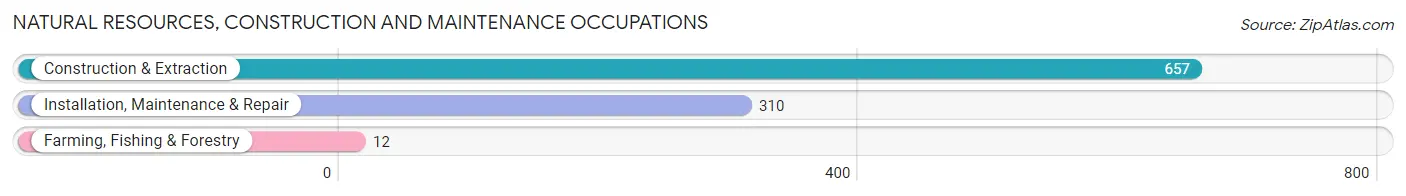
Natural Resources, Construction and Maintenance Occupations
The most common Natural Resources, Construction and Maintenance occupations in Plainfield are Construction & Extraction (657 | 2.8%), Installation, Maintenance & Repair (310 | 1.3%), and Farming, Fishing & Forestry (12 | 0.1%).
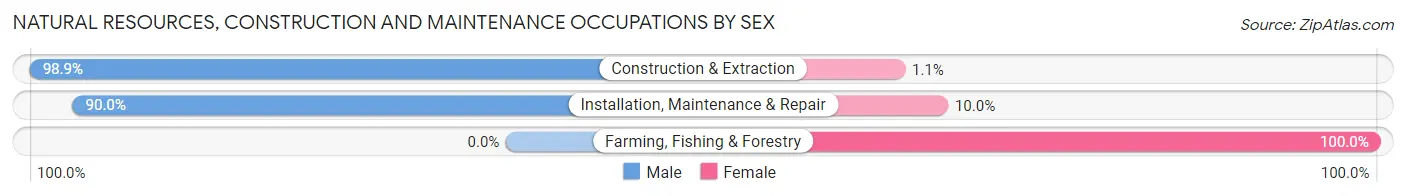
Natural Resources, Construction and Maintenance Occupations by Sex
| Occupation | Male | Female |
| Farming, Fishing & Forestry | 0 (0.0%) | 12 (100.0%) |
| Construction & Extraction | 650 (98.9%) | 7 (1.1%) |
| Installation, Maintenance & Repair | 279 (90.0%) | 31 (10.0%) |
| Total (Category) | 929 (94.9%) | 50 (5.1%) |
| Total (Overall) | 12,578 (53.1%) | 11,089 (46.9%) |
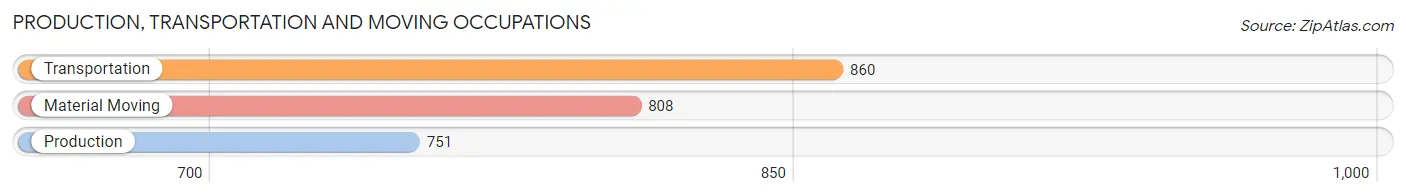
Production, Transportation and Moving Occupations
The most common Production, Transportation and Moving occupations in Plainfield are Transportation (860 | 3.6%), Material Moving (808 | 3.4%), and Production (751 | 3.2%).
Production, Transportation and Moving Occupations by Sex
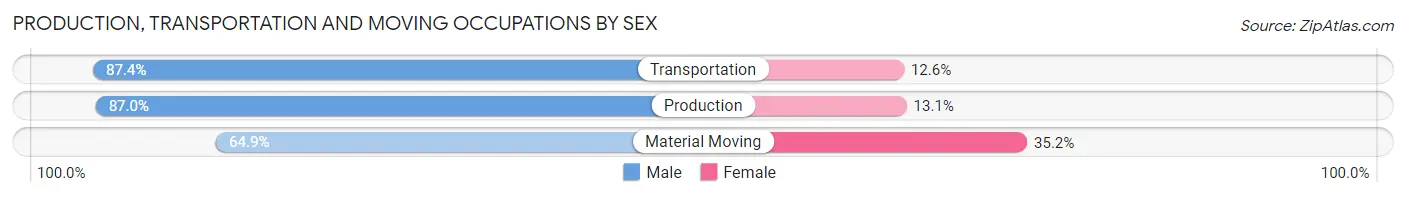
| Occupation | Male | Female |
| Production | 653 (87.0%) | 98 (13.1%) |
| Transportation | 752 (87.4%) | 108 (12.6%) |
| Material Moving | 524 (64.8%) | 284 (35.1%) |
| Total (Category) | 1,929 (79.7%) | 490 (20.3%) |
| Total (Overall) | 12,578 (53.1%) | 11,089 (46.9%) |
Employment Industries by Sex in Plainfield
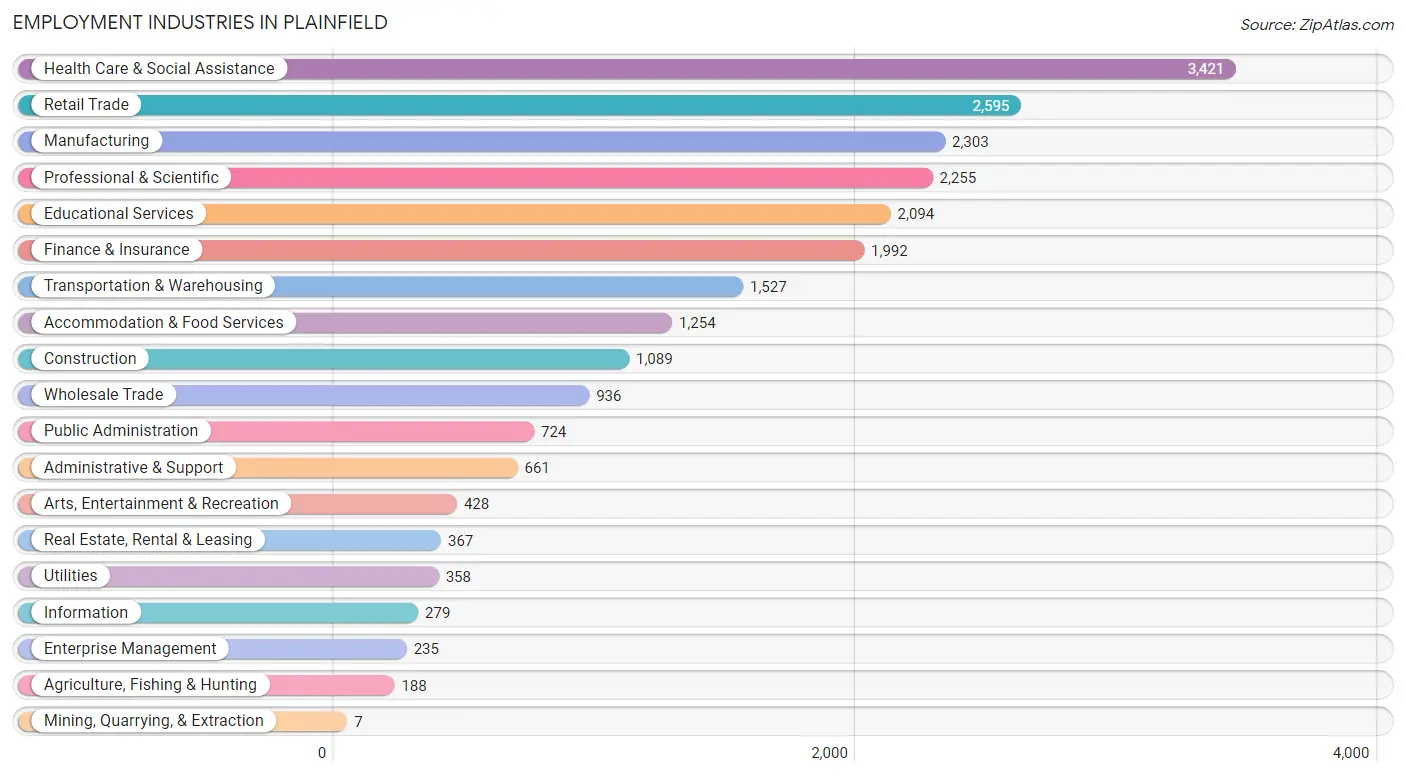
Employment Industries in Plainfield
The major employment industries in Plainfield include Health Care & Social Assistance (3,421 | 14.4%), Retail Trade (2,595 | 11.0%), Manufacturing (2,303 | 9.7%), Professional & Scientific (2,255 | 9.5%), and Educational Services (2,094 | 8.8%).
Employment Industries by Sex in Plainfield
The Plainfield industries that see more men than women are Mining, Quarrying, & Extraction (100.0%), Enterprise Management (94.5%), and Construction (93.7%), whereas the industries that tend to have a higher number of women are Educational Services (81.2%), Health Care & Social Assistance (73.3%), and Real Estate, Rental & Leasing (68.9%).
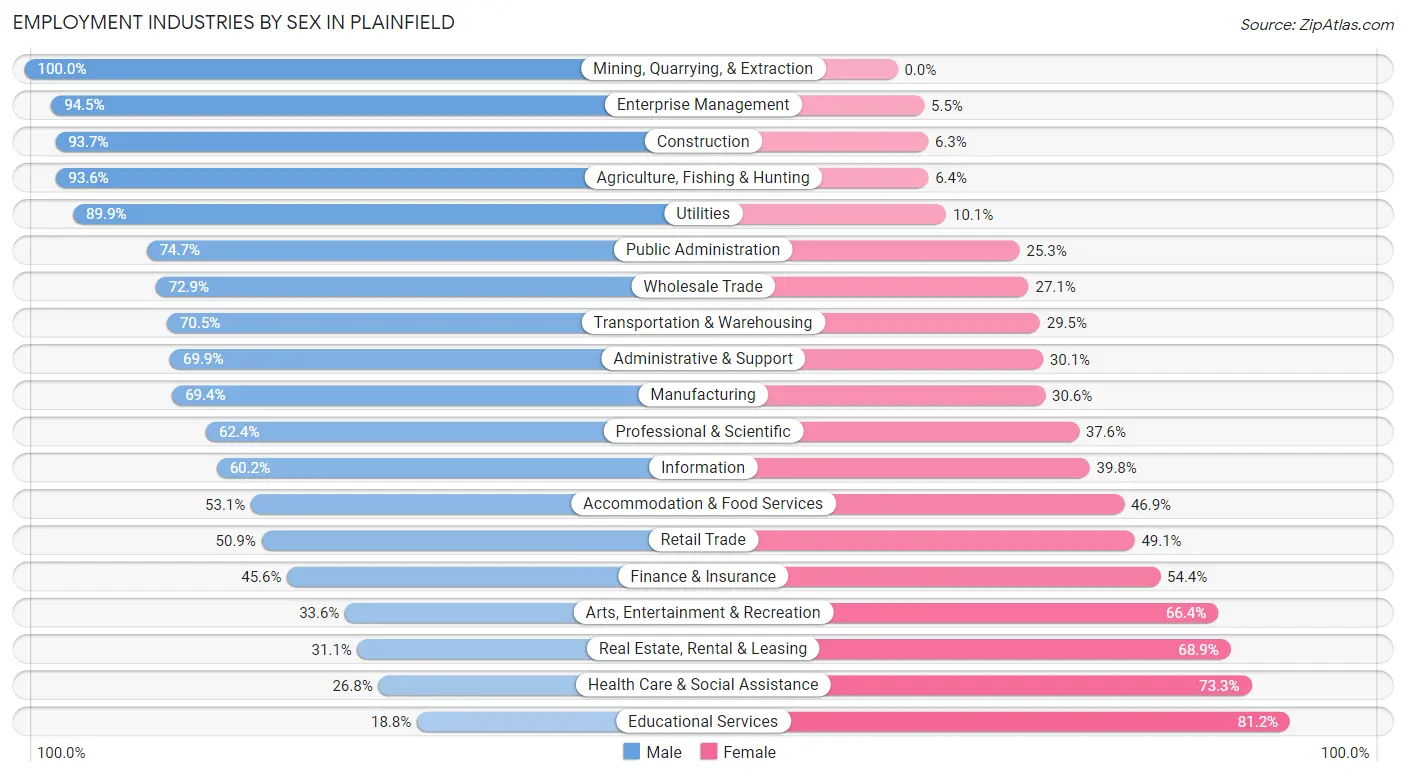
| Industry | Male | Female |
| Agriculture, Fishing & Hunting | 176 (93.6%) | 12 (6.4%) |
| Mining, Quarrying, & Extraction | 7 (100.0%) | 0 (0.0%) |
| Construction | 1,020 (93.7%) | 69 (6.3%) |
| Manufacturing | 1,599 (69.4%) | 704 (30.6%) |
| Wholesale Trade | 682 (72.9%) | 254 (27.1%) |
| Retail Trade | 1,322 (50.9%) | 1,273 (49.1%) |
| Transportation & Warehousing | 1,077 (70.5%) | 450 (29.5%) |
| Utilities | 322 (89.9%) | 36 (10.1%) |
| Information | 168 (60.2%) | 111 (39.8%) |
| Finance & Insurance | 909 (45.6%) | 1,083 (54.4%) |
| Real Estate, Rental & Leasing | 114 (31.1%) | 253 (68.9%) |
| Professional & Scientific | 1,408 (62.4%) | 847 (37.6%) |
| Enterprise Management | 222 (94.5%) | 13 (5.5%) |
| Administrative & Support | 462 (69.9%) | 199 (30.1%) |
| Educational Services | 393 (18.8%) | 1,701 (81.2%) |
| Health Care & Social Assistance | 915 (26.8%) | 2,506 (73.3%) |
| Arts, Entertainment & Recreation | 144 (33.6%) | 284 (66.4%) |
| Accommodation & Food Services | 666 (53.1%) | 588 (46.9%) |
| Public Administration | 541 (74.7%) | 183 (25.3%) |
| Total | 12,578 (53.1%) | 11,089 (46.9%) |
Education in Plainfield
School Enrollment in Plainfield
The most common levels of schooling among the 14,190 students in Plainfield are middle school (3,546 | 25.0%), high school (3,539 | 24.9%), and elementary school (2,615 | 18.4%).
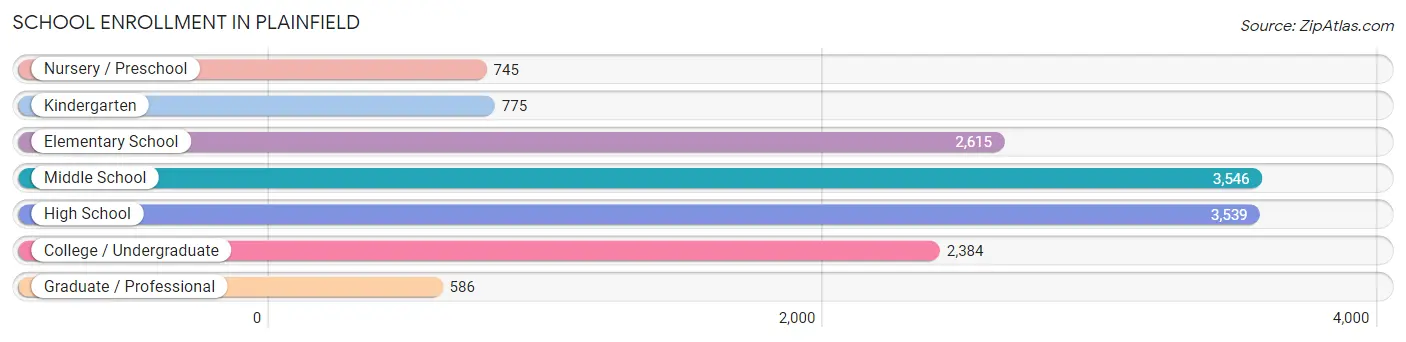
| School Level | # Students | % Students |
| Nursery / Preschool | 745 | 5.2% |
| Kindergarten | 775 | 5.5% |
| Elementary School | 2,615 | 18.4% |
| Middle School | 3,546 | 25.0% |
| High School | 3,539 | 24.9% |
| College / Undergraduate | 2,384 | 16.8% |
| Graduate / Professional | 586 | 4.1% |
| Total | 14,190 | 100.0% |
School Enrollment by Age by Funding Source in Plainfield
Out of a total of 14,190 students who are enrolled in schools in Plainfield, 1,958 (13.8%) attend a private institution, while the remaining 12,232 (86.2%) are enrolled in public schools. The age group of 20 to 24 year olds has the highest likelihood of being enrolled in private schools, with 549 (44.7% in the age bracket) enrolled. Conversely, the age group of 10 to 14 year olds has the lowest likelihood of being enrolled in a private school, with 4,430 (95.0% in the age bracket) attending a public institution.
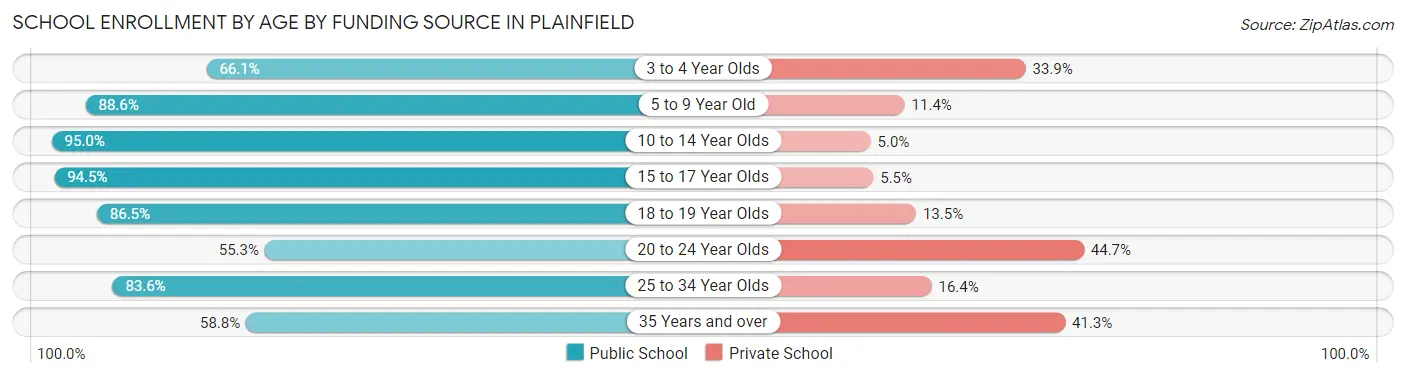
| Age Bracket | Public School | Private School |
| 3 to 4 Year Olds | 363 (66.1%) | 186 (33.9%) |
| 5 to 9 Year Old | 2,810 (88.6%) | 360 (11.4%) |
| 10 to 14 Year Olds | 4,430 (95.0%) | 234 (5.0%) |
| 15 to 17 Year Olds | 2,377 (94.5%) | 139 (5.5%) |
| 18 to 19 Year Olds | 777 (86.5%) | 121 (13.5%) |
| 20 to 24 Year Olds | 678 (55.3%) | 549 (44.7%) |
| 25 to 34 Year Olds | 373 (83.6%) | 73 (16.4%) |
| 35 Years and over | 423 (58.8%) | 297 (41.2%) |
| Total | 12,232 (86.2%) | 1,958 (13.8%) |
Educational Attainment by Field of Study in Plainfield
Business (4,370 | 26.6%), science & technology (2,237 | 13.6%), education (1,803 | 11.0%), engineering (1,419 | 8.6%), and arts & humanities (950 | 5.8%) are the most common fields of study among 16,426 individuals in Plainfield who have obtained a bachelor's degree or higher.
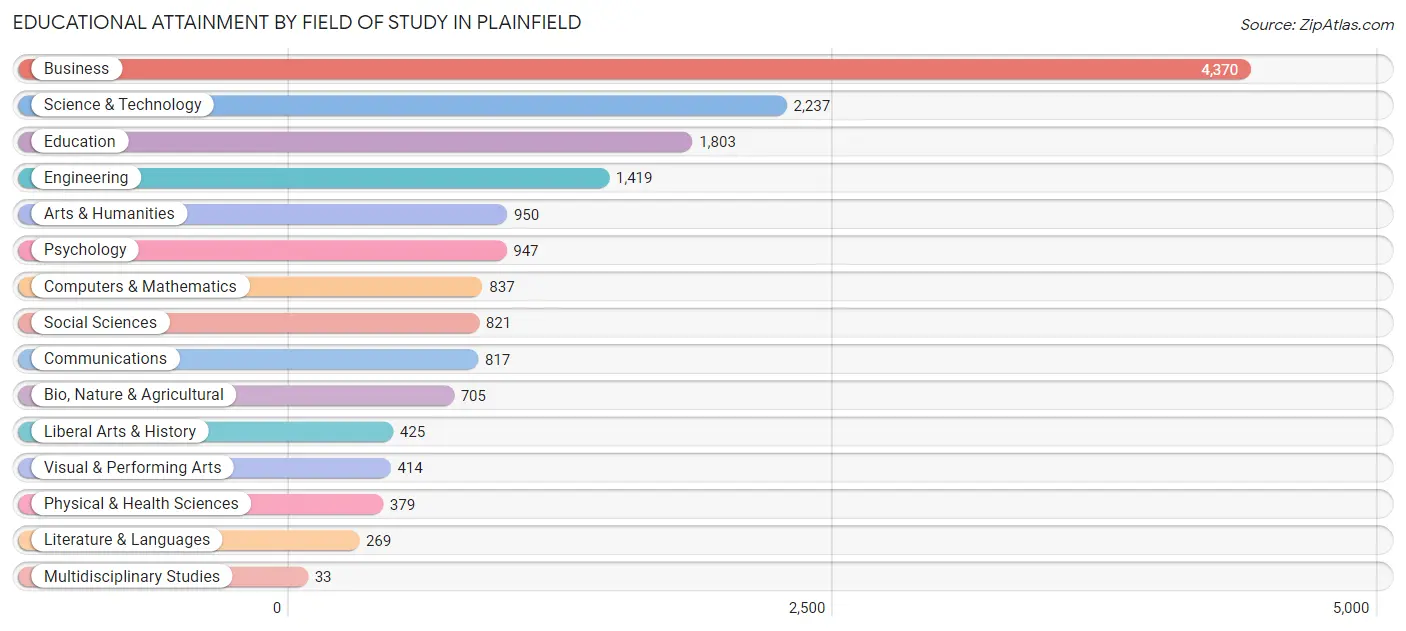
| Field of Study | # Graduates | % Graduates |
| Computers & Mathematics | 837 | 5.1% |
| Bio, Nature & Agricultural | 705 | 4.3% |
| Physical & Health Sciences | 379 | 2.3% |
| Psychology | 947 | 5.8% |
| Social Sciences | 821 | 5.0% |
| Engineering | 1,419 | 8.6% |
| Multidisciplinary Studies | 33 | 0.2% |
| Science & Technology | 2,237 | 13.6% |
| Business | 4,370 | 26.6% |
| Education | 1,803 | 11.0% |
| Literature & Languages | 269 | 1.6% |
| Liberal Arts & History | 425 | 2.6% |
| Visual & Performing Arts | 414 | 2.5% |
| Communications | 817 | 5.0% |
| Arts & Humanities | 950 | 5.8% |
| Total | 16,426 | 100.0% |
Transportation & Commute in Plainfield
Vehicle Availability by Sex in Plainfield
The most prevalent vehicle ownership categories in Plainfield are males with 2 vehicles (5,577, accounting for 44.6%) and females with 2 vehicles (4,583, making up 51.2%).
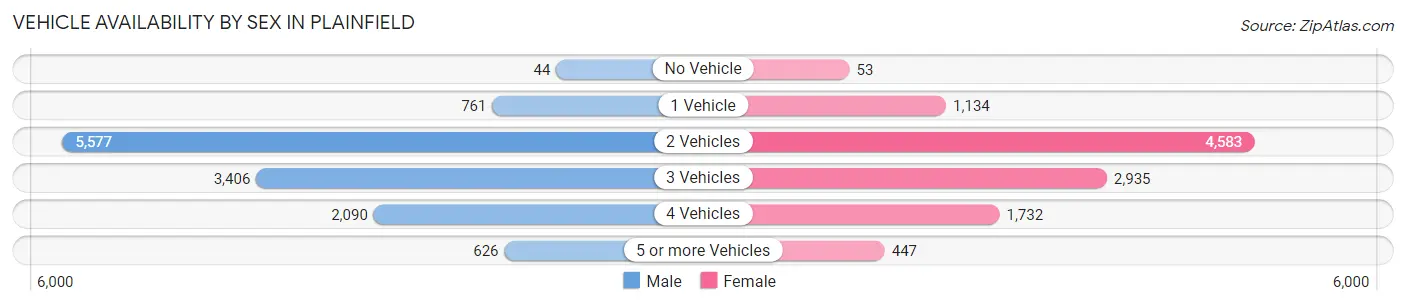
| Vehicles Available | Male | Female |
| No Vehicle | 44 (0.4%) | 53 (0.5%) |
| 1 Vehicle | 761 (6.1%) | 1,134 (10.4%) |
| 2 Vehicles | 5,577 (44.6%) | 4,583 (42.1%) |
| 3 Vehicles | 3,406 (27.2%) | 2,935 (27.0%) |
| 4 Vehicles | 2,090 (16.7%) | 1,732 (15.9%) |
| 5 or more Vehicles | 626 (5.0%) | 447 (4.1%) |
| Total | 12,504 (100.0%) | 10,884 (100.0%) |
Commute Time in Plainfield
The most frequently occuring commute durations in Plainfield are 30 to 34 minutes (2,874 commuters, 15.0%), 45 to 59 minutes (2,868 commuters, 14.9%), and 20 to 24 minutes (2,275 commuters, 11.8%).
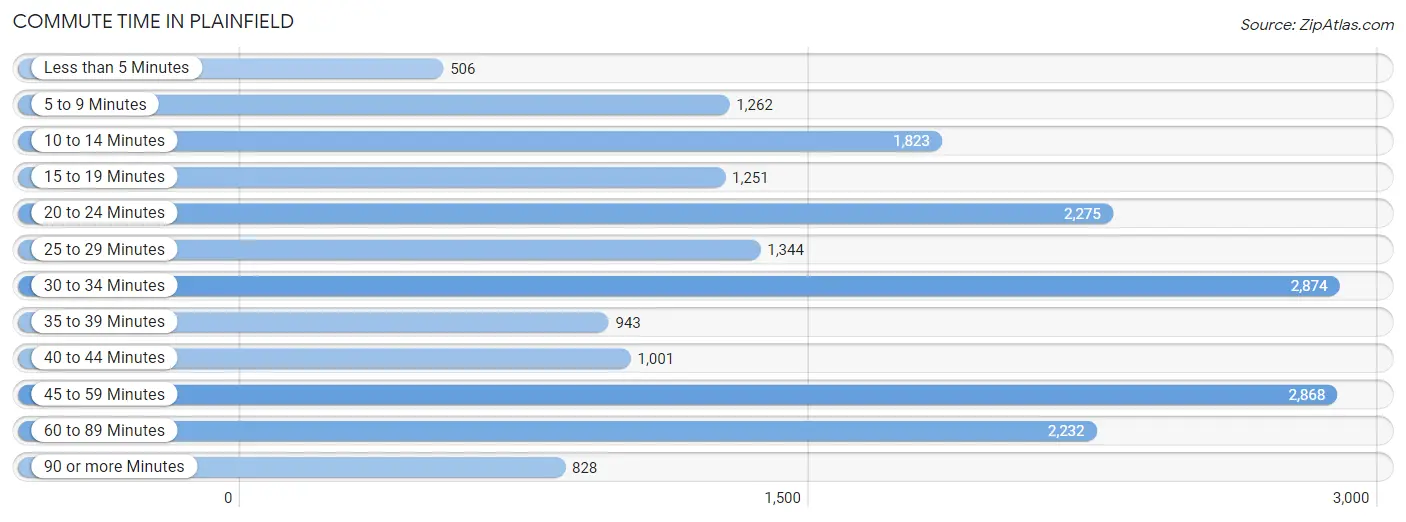
| Commute Time | # Commuters | % Commuters |
| Less than 5 Minutes | 506 | 2.6% |
| 5 to 9 Minutes | 1,262 | 6.6% |
| 10 to 14 Minutes | 1,823 | 9.5% |
| 15 to 19 Minutes | 1,251 | 6.5% |
| 20 to 24 Minutes | 2,275 | 11.8% |
| 25 to 29 Minutes | 1,344 | 7.0% |
| 30 to 34 Minutes | 2,874 | 15.0% |
| 35 to 39 Minutes | 943 | 4.9% |
| 40 to 44 Minutes | 1,001 | 5.2% |
| 45 to 59 Minutes | 2,868 | 14.9% |
| 60 to 89 Minutes | 2,232 | 11.6% |
| 90 or more Minutes | 828 | 4.3% |
Commute Time by Sex in Plainfield
The most common commute times in Plainfield are 45 to 59 minutes (1,767 commuters, 17.1%) for males and 30 to 34 minutes (1,512 commuters, 17.1%) for females.
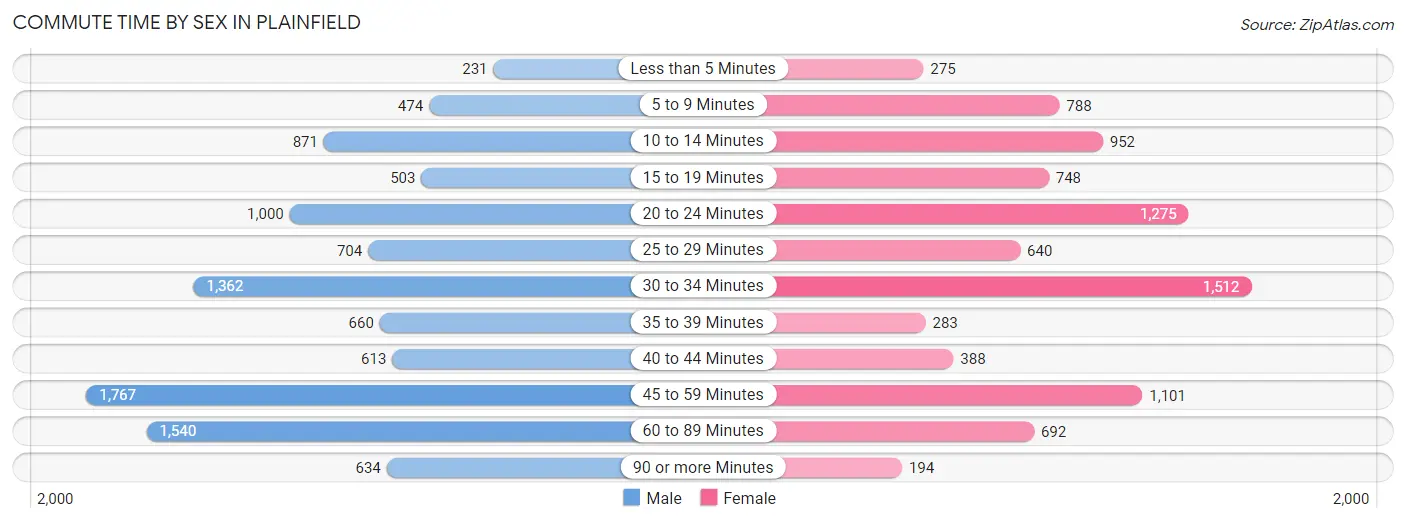
| Commute Time | Male | Female |
| Less than 5 Minutes | 231 (2.2%) | 275 (3.1%) |
| 5 to 9 Minutes | 474 (4.6%) | 788 (8.9%) |
| 10 to 14 Minutes | 871 (8.4%) | 952 (10.8%) |
| 15 to 19 Minutes | 503 (4.9%) | 748 (8.5%) |
| 20 to 24 Minutes | 1,000 (9.7%) | 1,275 (14.4%) |
| 25 to 29 Minutes | 704 (6.8%) | 640 (7.2%) |
| 30 to 34 Minutes | 1,362 (13.2%) | 1,512 (17.1%) |
| 35 to 39 Minutes | 660 (6.4%) | 283 (3.2%) |
| 40 to 44 Minutes | 613 (5.9%) | 388 (4.4%) |
| 45 to 59 Minutes | 1,767 (17.1%) | 1,101 (12.4%) |
| 60 to 89 Minutes | 1,540 (14.9%) | 692 (7.8%) |
| 90 or more Minutes | 634 (6.1%) | 194 (2.2%) |
Time of Departure to Work by Sex in Plainfield
The most frequent times of departure to work in Plainfield are 7:00 AM to 7:29 AM (1,659, 16.0%) for males and 7:00 AM to 7:29 AM (1,631, 18.4%) for females.
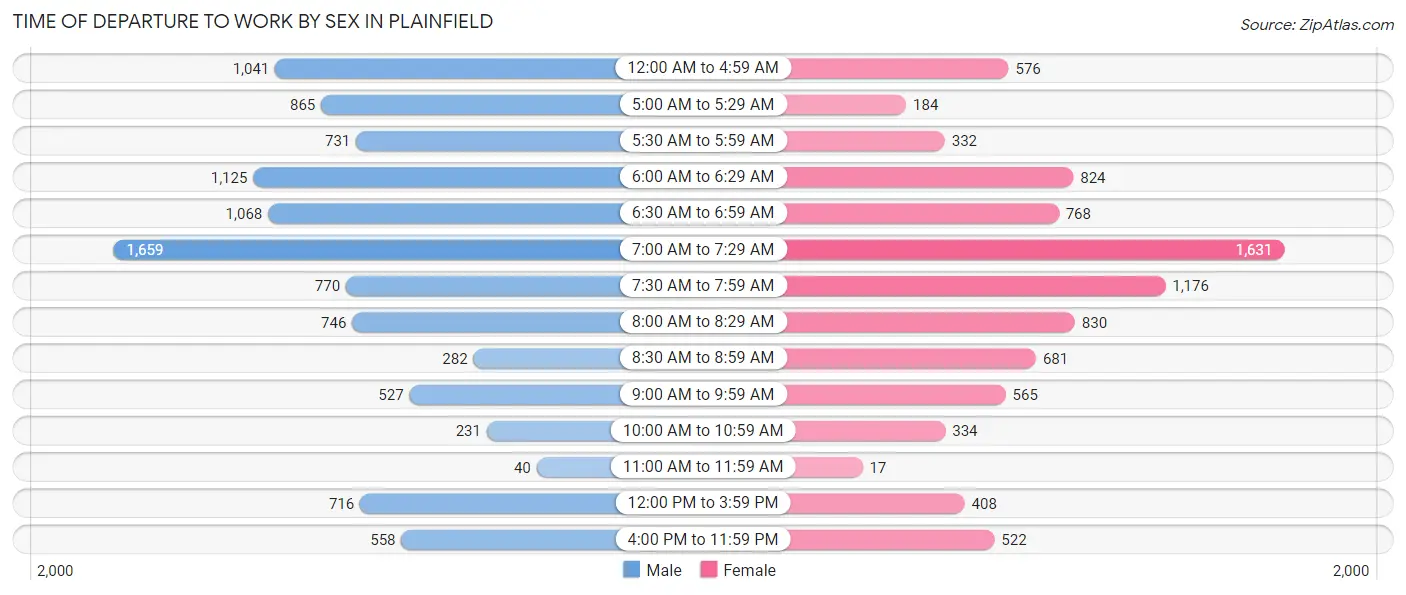
| Time of Departure | Male | Female |
| 12:00 AM to 4:59 AM | 1,041 (10.1%) | 576 (6.5%) |
| 5:00 AM to 5:29 AM | 865 (8.4%) | 184 (2.1%) |
| 5:30 AM to 5:59 AM | 731 (7.1%) | 332 (3.7%) |
| 6:00 AM to 6:29 AM | 1,125 (10.9%) | 824 (9.3%) |
| 6:30 AM to 6:59 AM | 1,068 (10.3%) | 768 (8.7%) |
| 7:00 AM to 7:29 AM | 1,659 (16.0%) | 1,631 (18.4%) |
| 7:30 AM to 7:59 AM | 770 (7.4%) | 1,176 (13.3%) |
| 8:00 AM to 8:29 AM | 746 (7.2%) | 830 (9.4%) |
| 8:30 AM to 8:59 AM | 282 (2.7%) | 681 (7.7%) |
| 9:00 AM to 9:59 AM | 527 (5.1%) | 565 (6.4%) |
| 10:00 AM to 10:59 AM | 231 (2.2%) | 334 (3.8%) |
| 11:00 AM to 11:59 AM | 40 (0.4%) | 17 (0.2%) |
| 12:00 PM to 3:59 PM | 716 (6.9%) | 408 (4.6%) |
| 4:00 PM to 11:59 PM | 558 (5.4%) | 522 (5.9%) |
| Total | 10,359 (100.0%) | 8,848 (100.0%) |
Housing Occupancy in Plainfield
Occupancy by Ownership in Plainfield
Of the total 13,919 dwellings in Plainfield, owner-occupied units account for 12,480 (89.7%), while renter-occupied units make up 1,439 (10.3%).
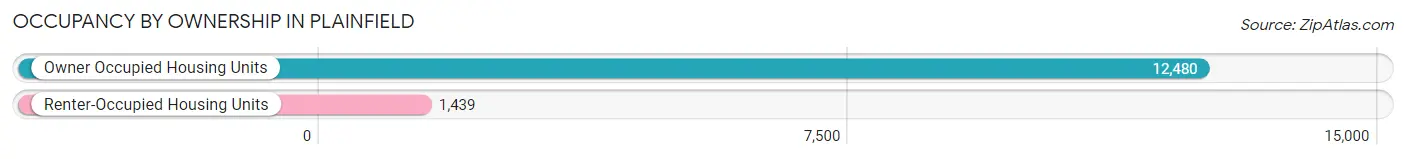
| Occupancy | # Housing Units | % Housing Units |
| Owner Occupied Housing Units | 12,480 | 89.7% |
| Renter-Occupied Housing Units | 1,439 | 10.3% |
| Total Occupied Housing Units | 13,919 | 100.0% |
Occupancy by Household Size in Plainfield
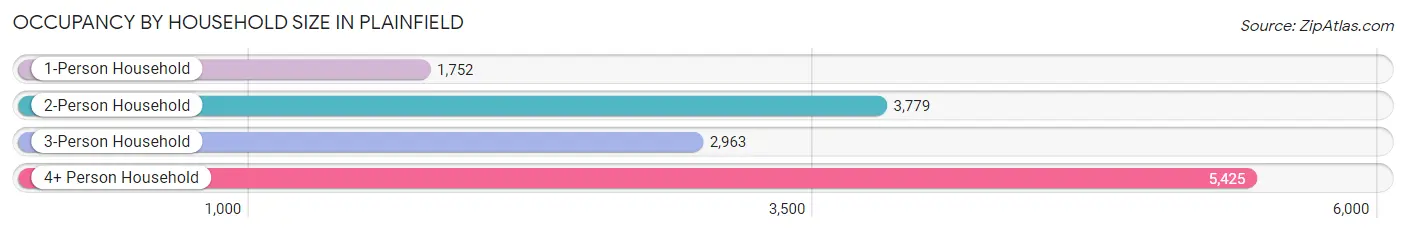
| Household Size | # Housing Units | % Housing Units |
| 1-Person Household | 1,752 | 12.6% |
| 2-Person Household | 3,779 | 27.2% |
| 3-Person Household | 2,963 | 21.3% |
| 4+ Person Household | 5,425 | 39.0% |
| Total Housing Units | 13,919 | 100.0% |
Occupancy by Ownership by Household Size in Plainfield
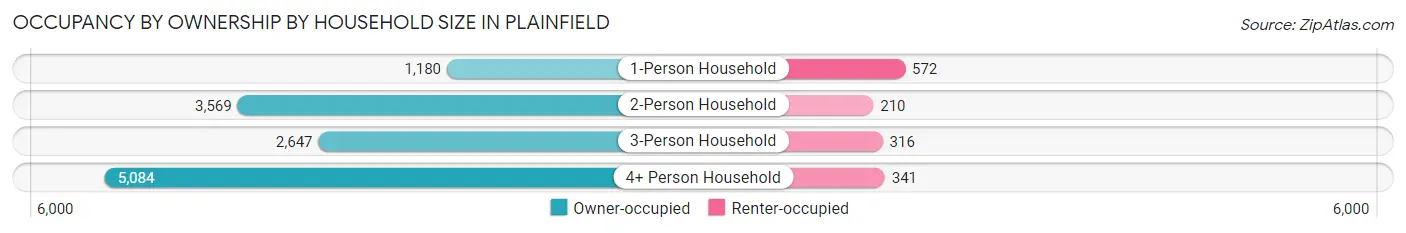
| Household Size | Owner-occupied | Renter-occupied |
| 1-Person Household | 1,180 (67.3%) | 572 (32.7%) |
| 2-Person Household | 3,569 (94.4%) | 210 (5.6%) |
| 3-Person Household | 2,647 (89.3%) | 316 (10.7%) |
| 4+ Person Household | 5,084 (93.7%) | 341 (6.3%) |
| Total Housing Units | 12,480 (89.7%) | 1,439 (10.3%) |
Occupancy by Educational Attainment in Plainfield
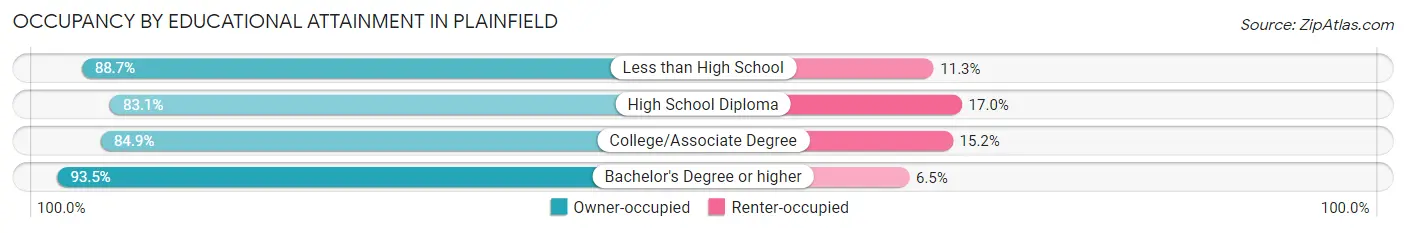
| Household Size | Owner-occupied | Renter-occupied |
| Less than High School | 391 (88.7%) | 50 (11.3%) |
| High School Diploma | 1,568 (83.1%) | 320 (17.0%) |
| College/Associate Degree | 3,080 (84.9%) | 550 (15.1%) |
| Bachelor's Degree or higher | 7,441 (93.5%) | 519 (6.5%) |
Occupancy by Age of Householder in Plainfield
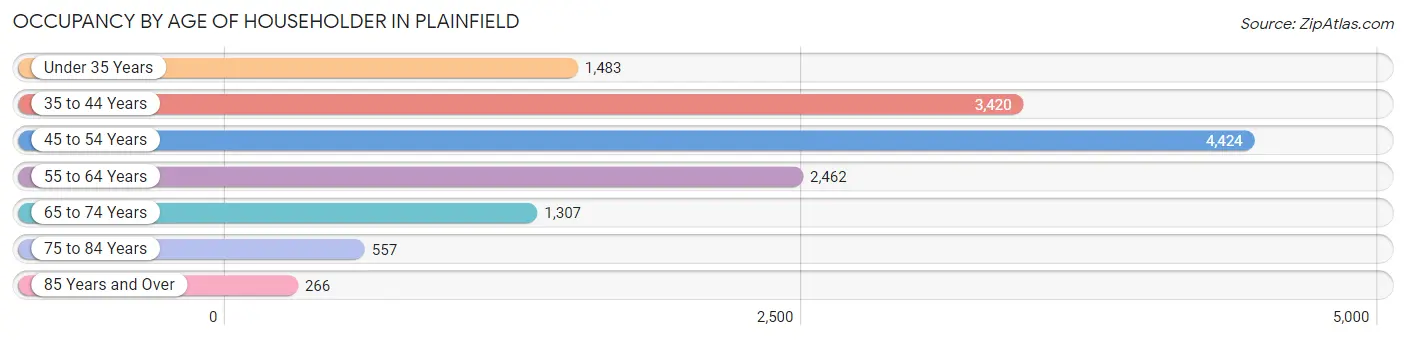
| Age Bracket | # Households | % Households |
| Under 35 Years | 1,483 | 10.6% |
| 35 to 44 Years | 3,420 | 24.6% |
| 45 to 54 Years | 4,424 | 31.8% |
| 55 to 64 Years | 2,462 | 17.7% |
| 65 to 74 Years | 1,307 | 9.4% |
| 75 to 84 Years | 557 | 4.0% |
| 85 Years and Over | 266 | 1.9% |
| Total | 13,919 | 100.0% |
Housing Finances in Plainfield
Median Income by Occupancy in Plainfield
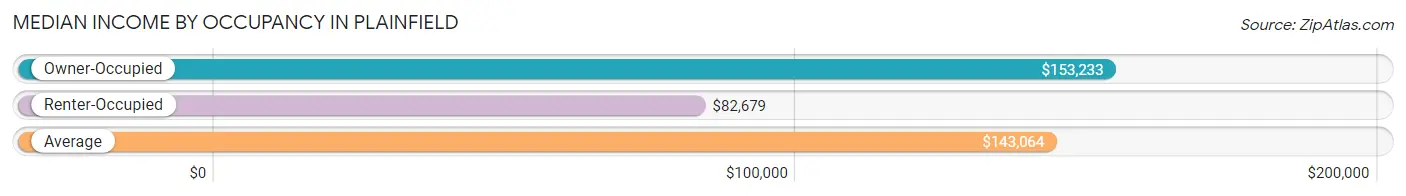
| Occupancy Type | # Households | Median Income |
| Owner-Occupied | 12,480 (89.7%) | $153,233 |
| Renter-Occupied | 1,439 (10.3%) | $82,679 |
| Average | 13,919 (100.0%) | $143,064 |
Occupancy by Householder Income Bracket in Plainfield
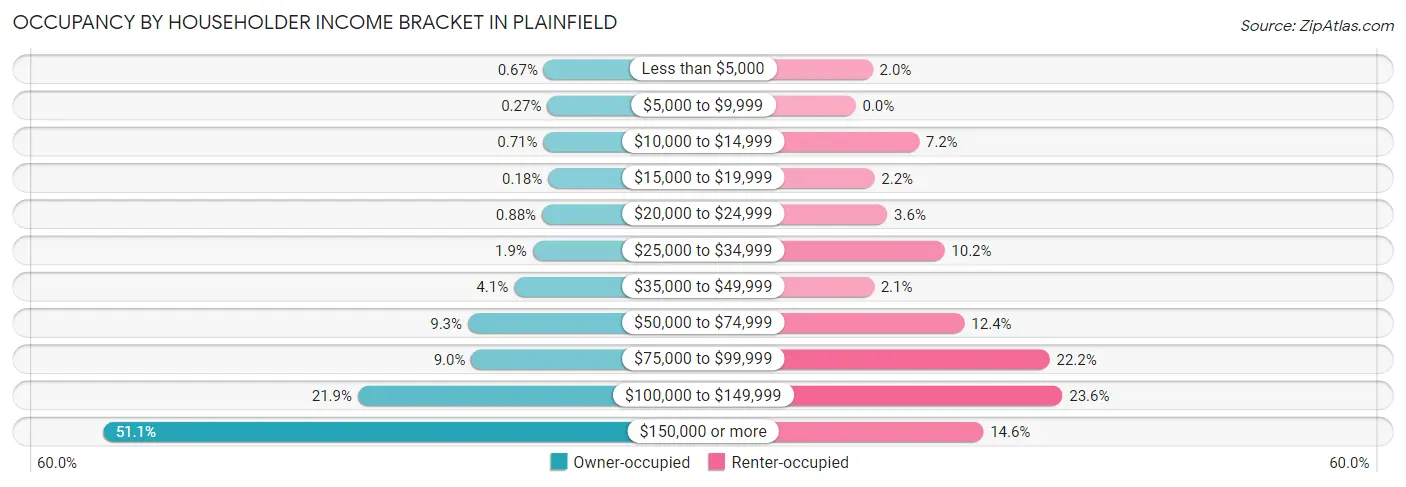
| Income Bracket | Owner-occupied | Renter-occupied |
| Less than $5,000 | 84 (0.7%) | 28 (1.9%) |
| $5,000 to $9,999 | 34 (0.3%) | 0 (0.0%) |
| $10,000 to $14,999 | 88 (0.7%) | 104 (7.2%) |
| $15,000 to $19,999 | 23 (0.2%) | 31 (2.1%) |
| $20,000 to $24,999 | 110 (0.9%) | 52 (3.6%) |
| $25,000 to $34,999 | 241 (1.9%) | 146 (10.2%) |
| $35,000 to $49,999 | 508 (4.1%) | 30 (2.1%) |
| $50,000 to $74,999 | 1,166 (9.3%) | 179 (12.4%) |
| $75,000 to $99,999 | 1,117 (8.9%) | 319 (22.2%) |
| $100,000 to $149,999 | 2,736 (21.9%) | 340 (23.6%) |
| $150,000 or more | 6,373 (51.1%) | 210 (14.6%) |
| Total | 12,480 (100.0%) | 1,439 (100.0%) |
Monthly Housing Cost Tiers in Plainfield
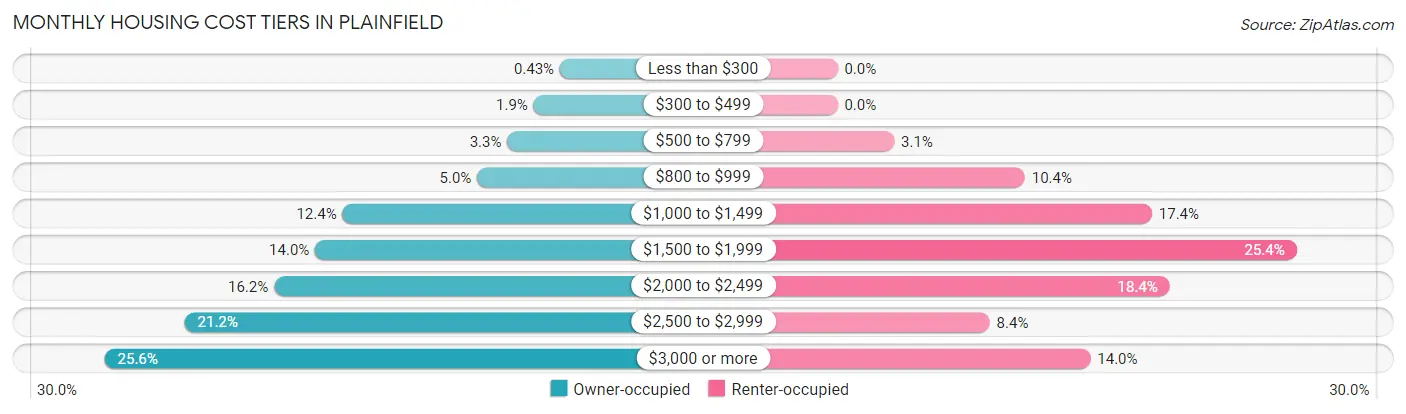
| Monthly Cost | Owner-occupied | Renter-occupied |
| Less than $300 | 54 (0.4%) | 0 (0.0%) |
| $300 to $499 | 235 (1.9%) | 0 (0.0%) |
| $500 to $799 | 417 (3.3%) | 45 (3.1%) |
| $800 to $999 | 624 (5.0%) | 149 (10.3%) |
| $1,000 to $1,499 | 1,552 (12.4%) | 250 (17.4%) |
| $1,500 to $1,999 | 1,741 (14.0%) | 365 (25.4%) |
| $2,000 to $2,499 | 2,024 (16.2%) | 264 (18.3%) |
| $2,500 to $2,999 | 2,641 (21.2%) | 121 (8.4%) |
| $3,000 or more | 3,192 (25.6%) | 201 (14.0%) |
| Total | 12,480 (100.0%) | 1,439 (100.0%) |
Physical Housing Characteristics in Plainfield
Housing Structures in Plainfield
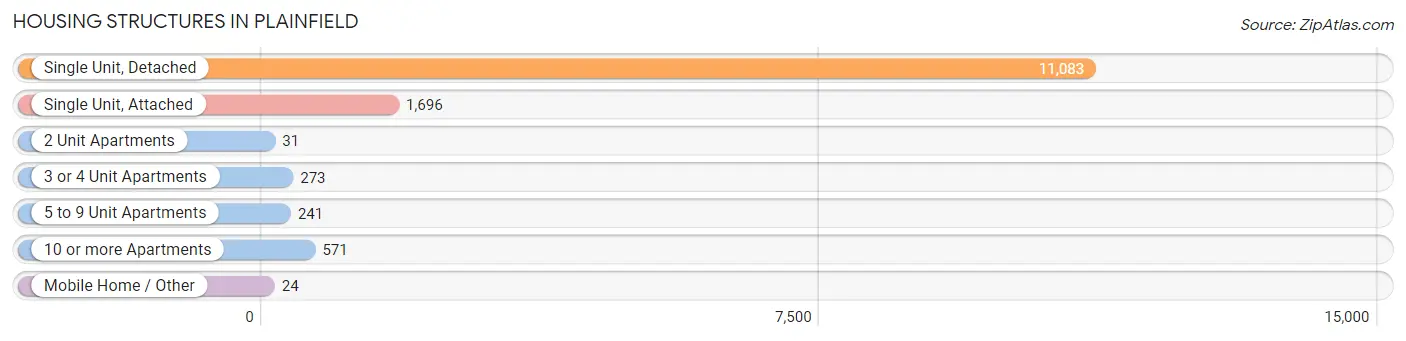
| Structure Type | # Housing Units | % Housing Units |
| Single Unit, Detached | 11,083 | 79.6% |
| Single Unit, Attached | 1,696 | 12.2% |
| 2 Unit Apartments | 31 | 0.2% |
| 3 or 4 Unit Apartments | 273 | 2.0% |
| 5 to 9 Unit Apartments | 241 | 1.7% |
| 10 or more Apartments | 571 | 4.1% |
| Mobile Home / Other | 24 | 0.2% |
| Total | 13,919 | 100.0% |
Housing Structures by Occupancy in Plainfield
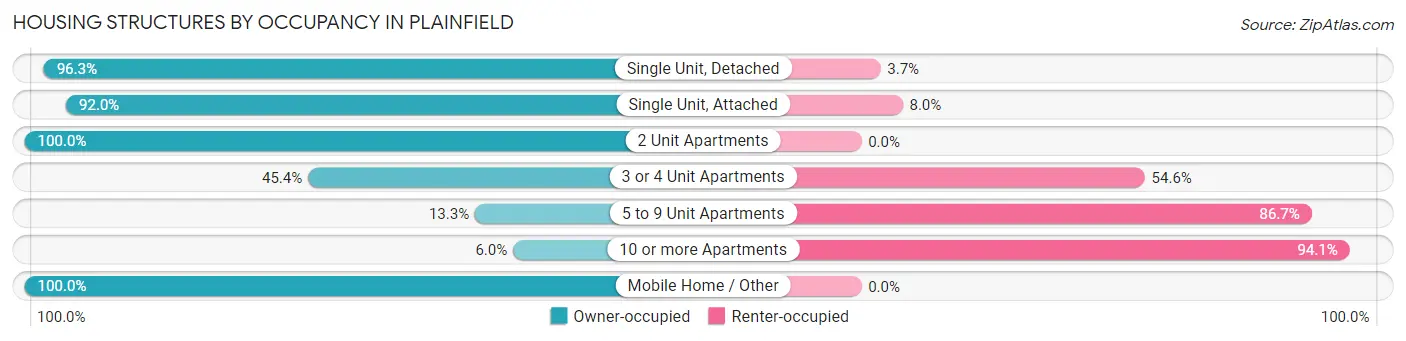
| Structure Type | Owner-occupied | Renter-occupied |
| Single Unit, Detached | 10,674 (96.3%) | 409 (3.7%) |
| Single Unit, Attached | 1,561 (92.0%) | 135 (8.0%) |
| 2 Unit Apartments | 31 (100.0%) | 0 (0.0%) |
| 3 or 4 Unit Apartments | 124 (45.4%) | 149 (54.6%) |
| 5 to 9 Unit Apartments | 32 (13.3%) | 209 (86.7%) |
| 10 or more Apartments | 34 (5.9%) | 537 (94.1%) |
| Mobile Home / Other | 24 (100.0%) | 0 (0.0%) |
| Total | 12,480 (89.7%) | 1,439 (10.3%) |
Housing Structures by Number of Rooms in Plainfield
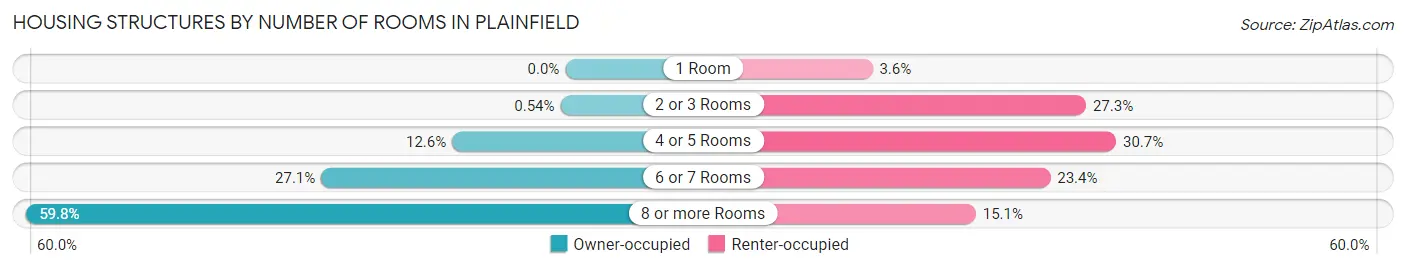
| Number of Rooms | Owner-occupied | Renter-occupied |
| 1 Room | 0 (0.0%) | 52 (3.6%) |
| 2 or 3 Rooms | 67 (0.5%) | 393 (27.3%) |
| 4 or 5 Rooms | 1,567 (12.6%) | 441 (30.6%) |
| 6 or 7 Rooms | 3,381 (27.1%) | 336 (23.4%) |
| 8 or more Rooms | 7,465 (59.8%) | 217 (15.1%) |
| Total | 12,480 (100.0%) | 1,439 (100.0%) |
Housing Structure by Heating Type in Plainfield
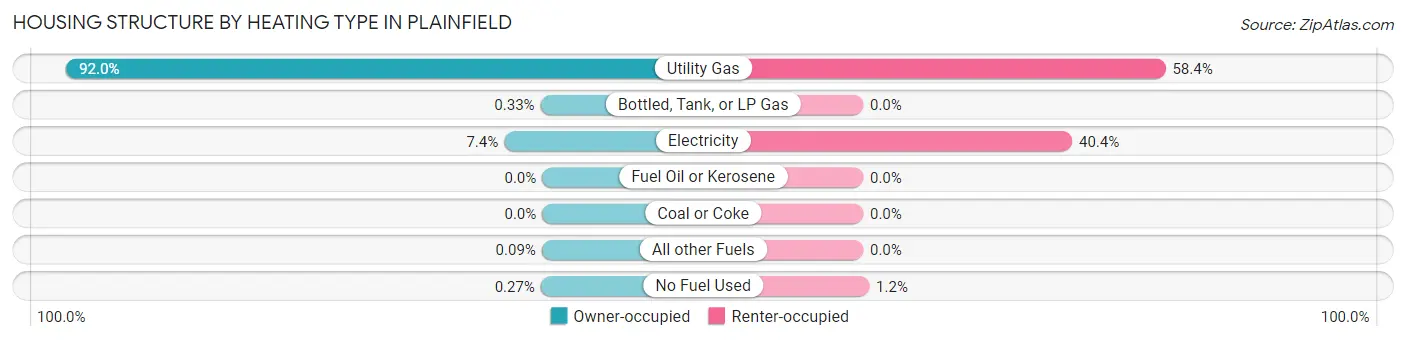
| Heating Type | Owner-occupied | Renter-occupied |
| Utility Gas | 11,477 (92.0%) | 841 (58.4%) |
| Bottled, Tank, or LP Gas | 41 (0.3%) | 0 (0.0%) |
| Electricity | 917 (7.3%) | 581 (40.4%) |
| Fuel Oil or Kerosene | 0 (0.0%) | 0 (0.0%) |
| Coal or Coke | 0 (0.0%) | 0 (0.0%) |
| All other Fuels | 11 (0.1%) | 0 (0.0%) |
| No Fuel Used | 34 (0.3%) | 17 (1.2%) |
| Total | 12,480 (100.0%) | 1,439 (100.0%) |
Household Vehicle Usage in Plainfield
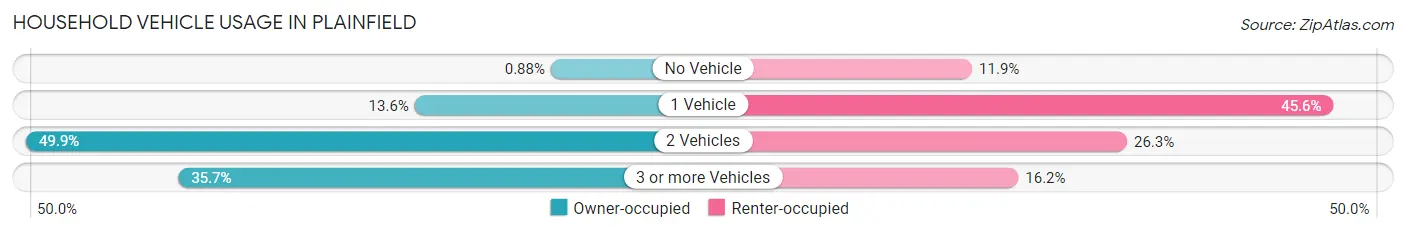
| Vehicles per Household | Owner-occupied | Renter-occupied |
| No Vehicle | 110 (0.9%) | 171 (11.9%) |
| 1 Vehicle | 1,696 (13.6%) | 656 (45.6%) |
| 2 Vehicles | 6,224 (49.9%) | 379 (26.3%) |
| 3 or more Vehicles | 4,450 (35.7%) | 233 (16.2%) |
| Total | 12,480 (100.0%) | 1,439 (100.0%) |
Real Estate & Mortgages in Plainfield
Real Estate and Mortgage Overview in Plainfield
| Characteristic | Without Mortgage | With Mortgage |
| Housing Units | 2,704 | 9,776 |
| Median Property Value | $349,600 | $383,300 |
| Median Household Income | $145,776 | $5,061 |
| Monthly Housing Costs | $1,067 | $3,192 |
| Real Estate Taxes | $8,140 | $31 |
Property Value by Mortgage Status in Plainfield
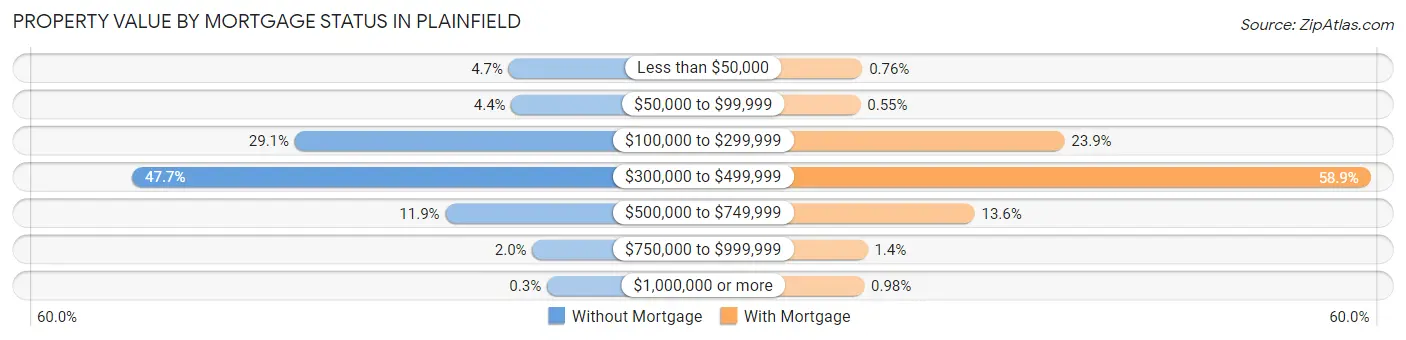
| Property Value | Without Mortgage | With Mortgage |
| Less than $50,000 | 126 (4.7%) | 74 (0.8%) |
| $50,000 to $99,999 | 118 (4.4%) | 54 (0.5%) |
| $100,000 to $299,999 | 787 (29.1%) | 2,334 (23.9%) |
| $300,000 to $499,999 | 1,290 (47.7%) | 5,755 (58.9%) |
| $500,000 to $749,999 | 322 (11.9%) | 1,330 (13.6%) |
| $750,000 to $999,999 | 53 (2.0%) | 133 (1.4%) |
| $1,000,000 or more | 8 (0.3%) | 96 (1.0%) |
| Total | 2,704 (100.0%) | 9,776 (100.0%) |
Household Income by Mortgage Status in Plainfield
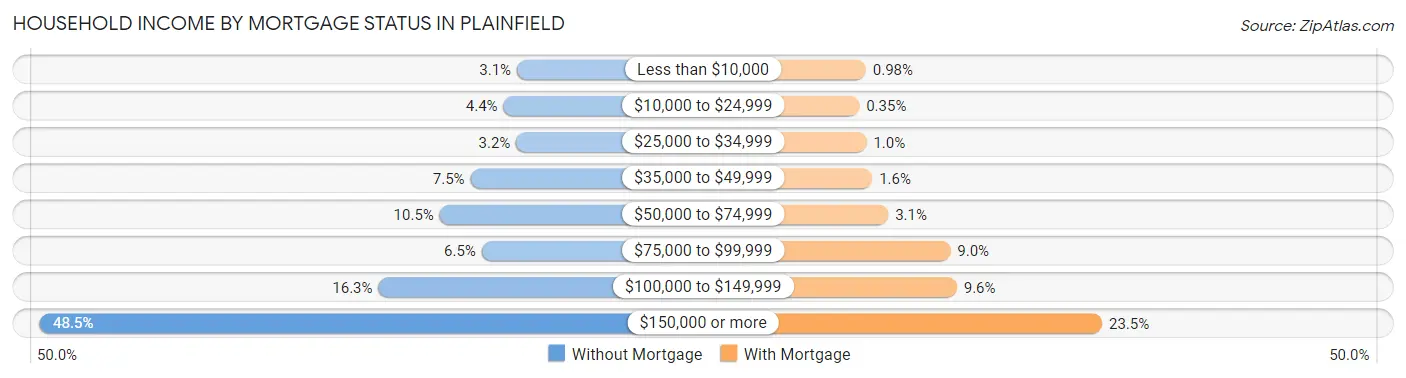
| Household Income | Without Mortgage | With Mortgage |
| Less than $10,000 | 84 (3.1%) | 96 (1.0%) |
| $10,000 to $24,999 | 119 (4.4%) | 34 (0.4%) |
| $25,000 to $34,999 | 86 (3.2%) | 102 (1.0%) |
| $35,000 to $49,999 | 204 (7.5%) | 155 (1.6%) |
| $50,000 to $74,999 | 283 (10.5%) | 304 (3.1%) |
| $75,000 to $99,999 | 175 (6.5%) | 883 (9.0%) |
| $100,000 to $149,999 | 441 (16.3%) | 942 (9.6%) |
| $150,000 or more | 1,312 (48.5%) | 2,295 (23.5%) |
| Total | 2,704 (100.0%) | 9,776 (100.0%) |
Property Value to Household Income Ratio in Plainfield
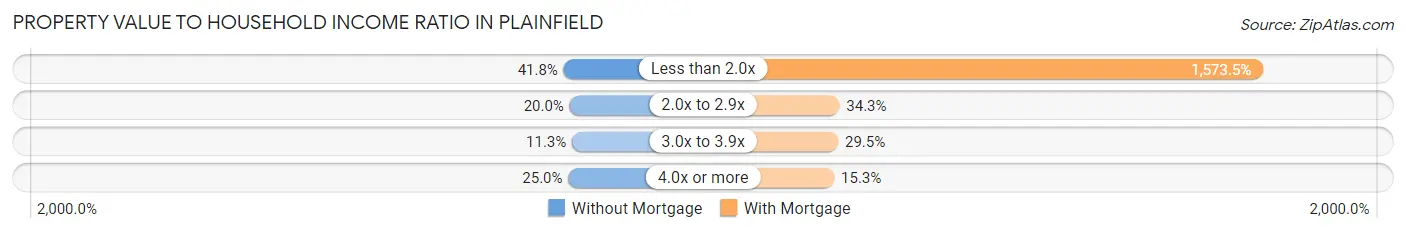
| Value-to-Income Ratio | Without Mortgage | With Mortgage |
| Less than 2.0x | 1,130 (41.8%) | 153,823 (1,573.5%) |
| 2.0x to 2.9x | 542 (20.0%) | 3,350 (34.3%) |
| 3.0x to 3.9x | 305 (11.3%) | 2,883 (29.5%) |
| 4.0x or more | 677 (25.0%) | 1,493 (15.3%) |
| Total | 2,704 (100.0%) | 9,776 (100.0%) |
Real Estate Taxes by Mortgage Status in Plainfield
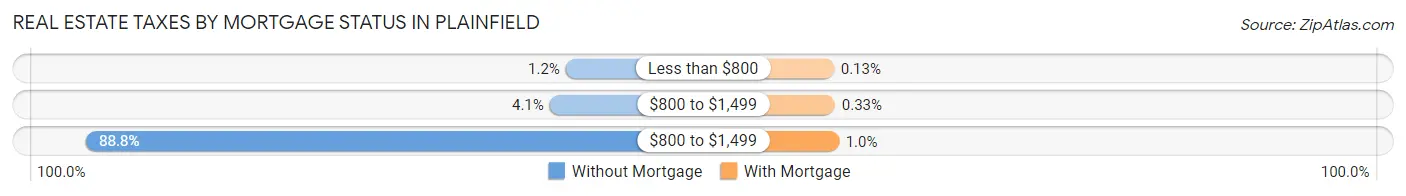
| Property Taxes | Without Mortgage | With Mortgage |
| Less than $800 | 32 (1.2%) | 13 (0.1%) |
| $800 to $1,499 | 111 (4.1%) | 32 (0.3%) |
| $800 to $1,499 | 2,400 (88.8%) | 102 (1.0%) |
| Total | 2,704 (100.0%) | 9,776 (100.0%) |
Health & Disability in Plainfield
Health Insurance Coverage by Age in Plainfield
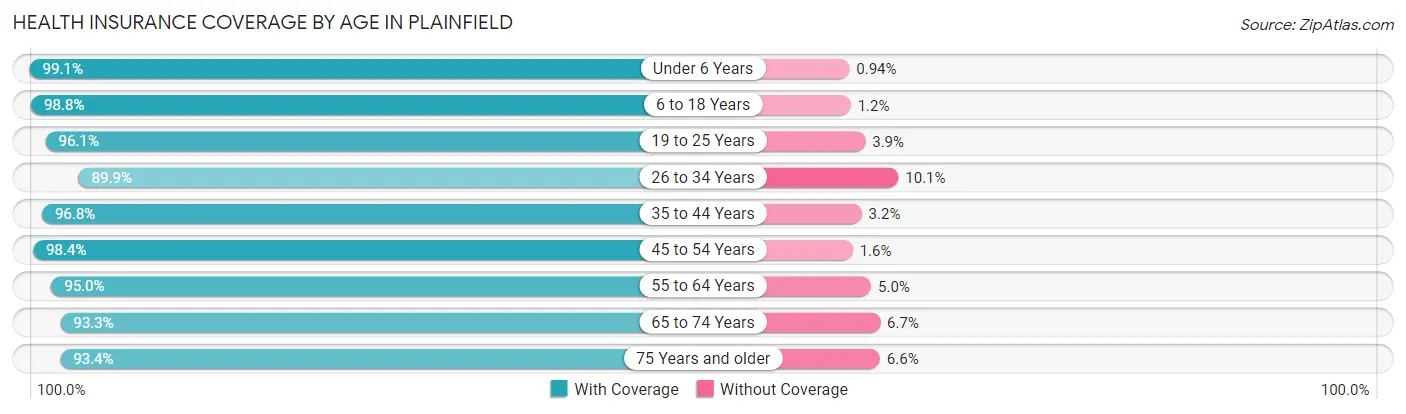
| Age Bracket | With Coverage | Without Coverage |
| Under 6 Years | 3,067 (99.1%) | 29 (0.9%) |
| 6 to 18 Years | 10,413 (98.8%) | 127 (1.2%) |
| 19 to 25 Years | 3,291 (96.1%) | 134 (3.9%) |
| 26 to 34 Years | 3,211 (89.9%) | 360 (10.1%) |
| 35 to 44 Years | 6,962 (96.8%) | 233 (3.2%) |
| 45 to 54 Years | 7,939 (98.4%) | 127 (1.6%) |
| 55 to 64 Years | 4,435 (95.0%) | 233 (5.0%) |
| 65 to 74 Years | 2,433 (93.3%) | 174 (6.7%) |
| 75 Years and older | 1,491 (93.4%) | 106 (6.6%) |
| Total | 43,242 (96.6%) | 1,523 (3.4%) |
Health Insurance Coverage by Citizenship Status in Plainfield
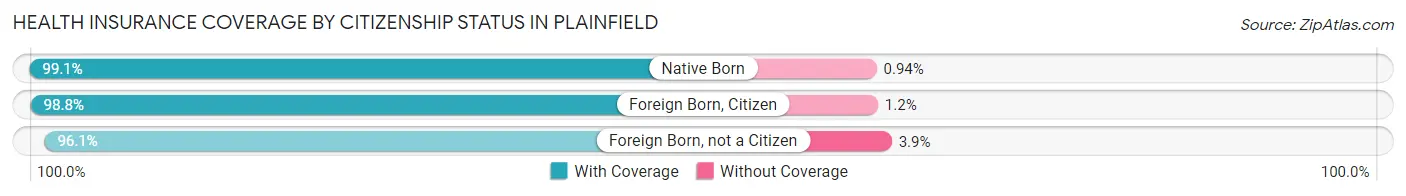
| Citizenship Status | With Coverage | Without Coverage |
| Native Born | 3,067 (99.1%) | 29 (0.9%) |
| Foreign Born, Citizen | 10,413 (98.8%) | 127 (1.2%) |
| Foreign Born, not a Citizen | 3,291 (96.1%) | 134 (3.9%) |
Health Insurance Coverage by Household Income in Plainfield
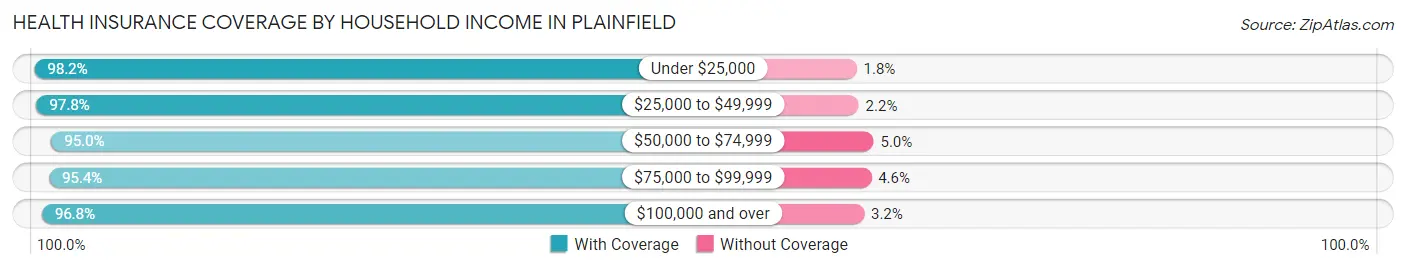
| Household Income | With Coverage | Without Coverage |
| Under $25,000 | 1,022 (98.2%) | 19 (1.8%) |
| $25,000 to $49,999 | 1,804 (97.8%) | 41 (2.2%) |
| $50,000 to $74,999 | 3,112 (95.0%) | 164 (5.0%) |
| $75,000 to $99,999 | 3,881 (95.4%) | 186 (4.6%) |
| $100,000 and over | 33,376 (96.8%) | 1,113 (3.2%) |
Public vs Private Health Insurance Coverage by Age in Plainfield
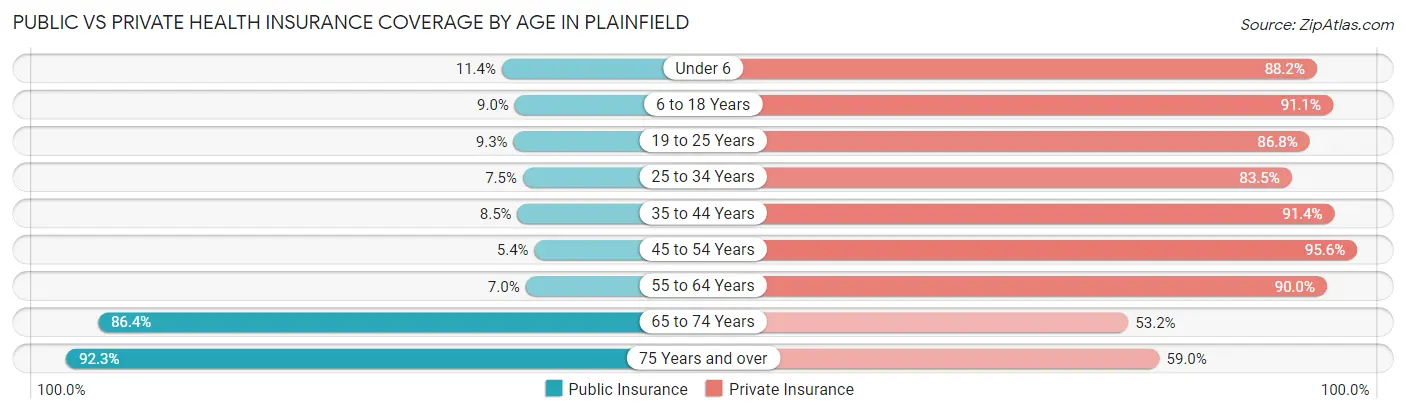
| Age Bracket | Public Insurance | Private Insurance |
| Under 6 | 354 (11.4%) | 2,729 (88.1%) |
| 6 to 18 Years | 953 (9.0%) | 9,605 (91.1%) |
| 19 to 25 Years | 317 (9.3%) | 2,974 (86.8%) |
| 25 to 34 Years | 269 (7.5%) | 2,981 (83.5%) |
| 35 to 44 Years | 614 (8.5%) | 6,579 (91.4%) |
| 45 to 54 Years | 433 (5.4%) | 7,714 (95.6%) |
| 55 to 64 Years | 328 (7.0%) | 4,202 (90.0%) |
| 65 to 74 Years | 2,252 (86.4%) | 1,387 (53.2%) |
| 75 Years and over | 1,474 (92.3%) | 942 (59.0%) |
| Total | 6,994 (15.6%) | 39,113 (87.4%) |
Disability Status by Sex by Age in Plainfield
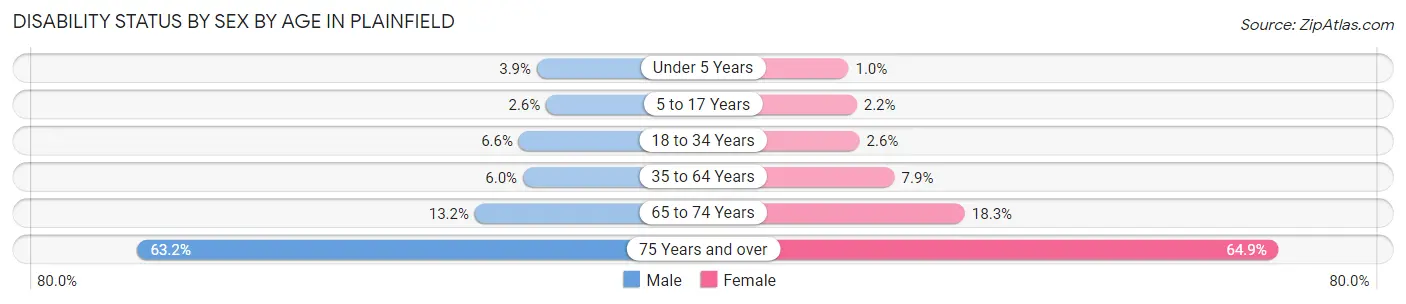
| Age Bracket | Male | Female |
| Under 5 Years | 45 (3.9%) | 11 (1.0%) |
| 5 to 17 Years | 150 (2.6%) | 107 (2.2%) |
| 18 to 34 Years | 229 (6.6%) | 113 (2.6%) |
| 35 to 64 Years | 594 (6.0%) | 788 (7.9%) |
| 65 to 74 Years | 181 (13.2%) | 225 (18.3%) |
| 75 Years and over | 454 (63.2%) | 570 (64.8%) |
Disability Class by Sex by Age in Plainfield
Disability Class: Hearing Difficulty
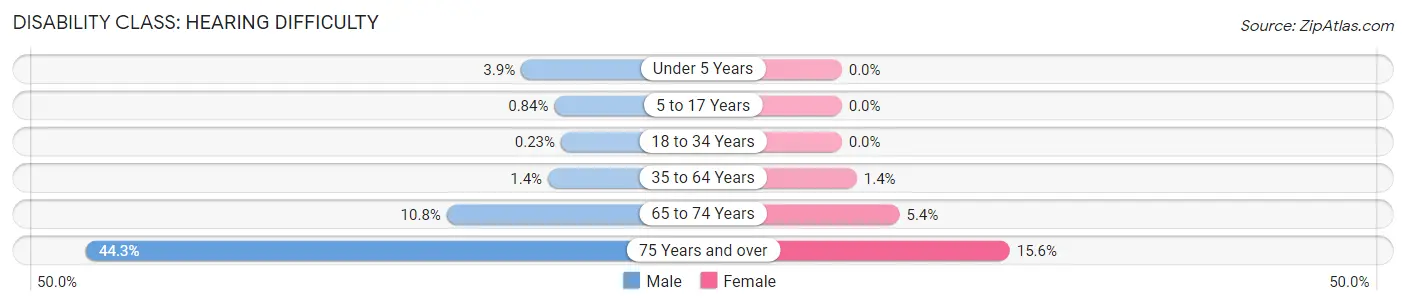
| Age Bracket | Male | Female |
| Under 5 Years | 45 (3.9%) | 0 (0.0%) |
| 5 to 17 Years | 49 (0.8%) | 0 (0.0%) |
| 18 to 34 Years | 8 (0.2%) | 0 (0.0%) |
| 35 to 64 Years | 142 (1.4%) | 140 (1.4%) |
| 65 to 74 Years | 149 (10.8%) | 66 (5.4%) |
| 75 Years and over | 318 (44.3%) | 137 (15.6%) |
Disability Class: Vision Difficulty
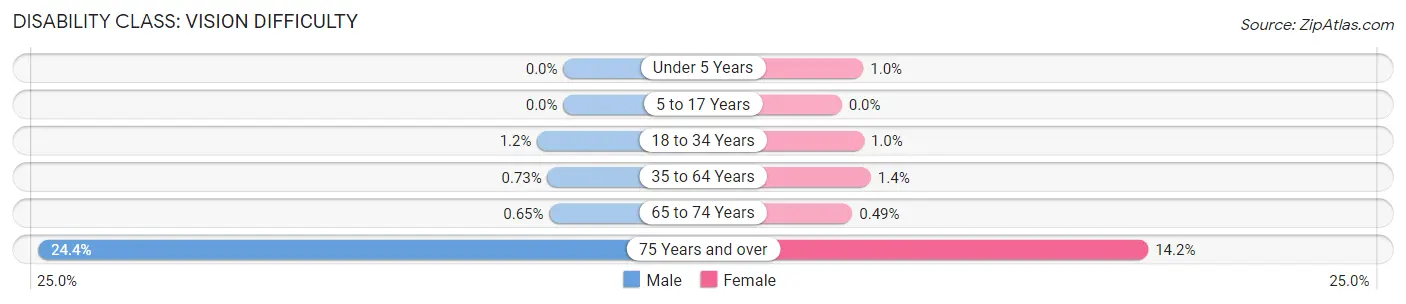
| Age Bracket | Male | Female |
| Under 5 Years | 0 (0.0%) | 11 (1.0%) |
| 5 to 17 Years | 0 (0.0%) | 0 (0.0%) |
| 18 to 34 Years | 42 (1.2%) | 44 (1.0%) |
| 35 to 64 Years | 72 (0.7%) | 135 (1.3%) |
| 65 to 74 Years | 9 (0.6%) | 6 (0.5%) |
| 75 Years and over | 175 (24.4%) | 125 (14.2%) |
Disability Class: Cognitive Difficulty
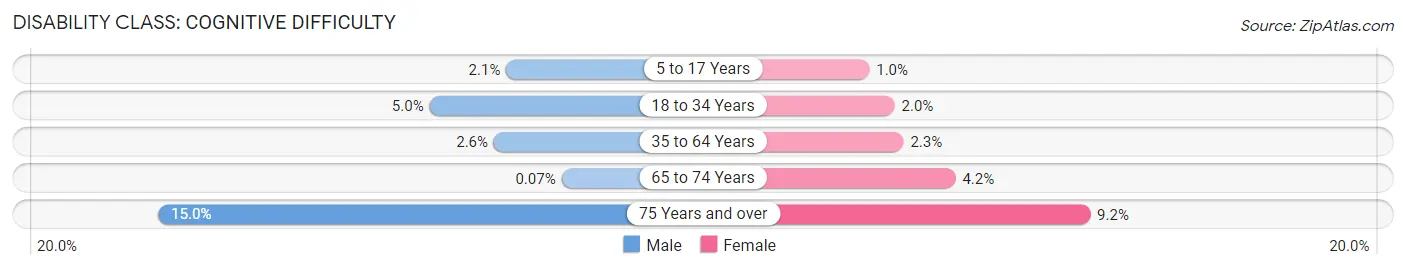
| Age Bracket | Male | Female |
| 5 to 17 Years | 124 (2.1%) | 49 (1.0%) |
| 18 to 34 Years | 172 (5.0%) | 84 (2.0%) |
| 35 to 64 Years | 255 (2.6%) | 230 (2.3%) |
| 65 to 74 Years | 1 (0.1%) | 52 (4.2%) |
| 75 Years and over | 108 (15.0%) | 81 (9.2%) |
Disability Class: Ambulatory Difficulty
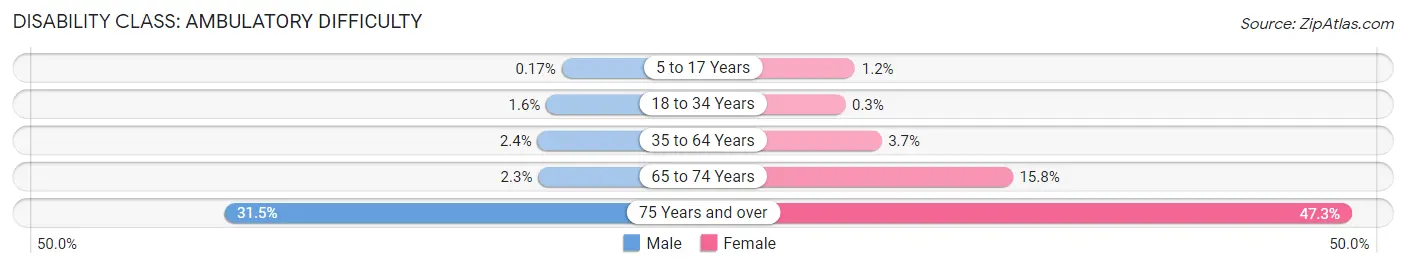
| Age Bracket | Male | Female |
| 5 to 17 Years | 10 (0.2%) | 58 (1.2%) |
| 18 to 34 Years | 55 (1.6%) | 13 (0.3%) |
| 35 to 64 Years | 238 (2.4%) | 367 (3.7%) |
| 65 to 74 Years | 32 (2.3%) | 195 (15.8%) |
| 75 Years and over | 226 (31.5%) | 416 (47.3%) |
Disability Class: Self-Care Difficulty
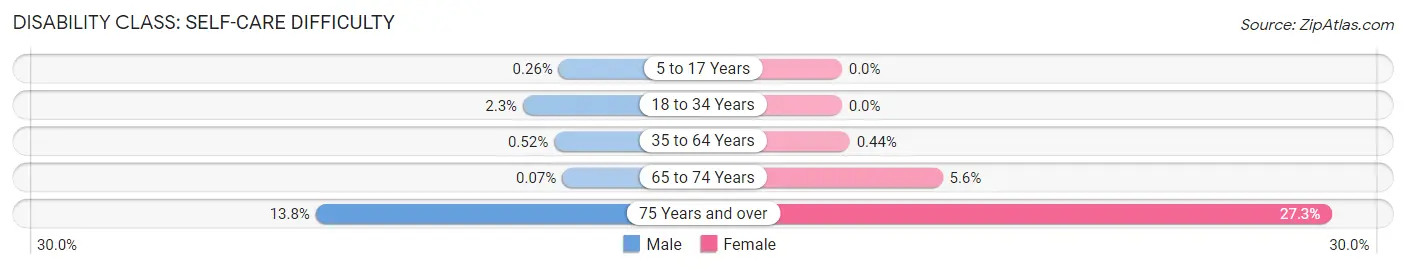
| Age Bracket | Male | Female |
| 5 to 17 Years | 15 (0.3%) | 0 (0.0%) |
| 18 to 34 Years | 78 (2.2%) | 0 (0.0%) |
| 35 to 64 Years | 51 (0.5%) | 44 (0.4%) |
| 65 to 74 Years | 1 (0.1%) | 69 (5.6%) |
| 75 Years and over | 99 (13.8%) | 240 (27.3%) |
Technology Access in Plainfield
Computing Device Access in Plainfield
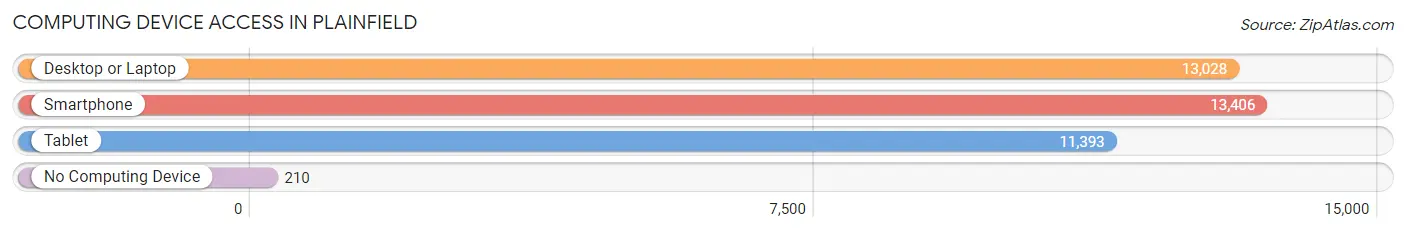
| Device Type | # Households | % Households |
| Desktop or Laptop | 13,028 | 93.6% |
| Smartphone | 13,406 | 96.3% |
| Tablet | 11,393 | 81.9% |
| No Computing Device | 210 | 1.5% |
| Total | 13,919 | 100.0% |
Internet Access in Plainfield
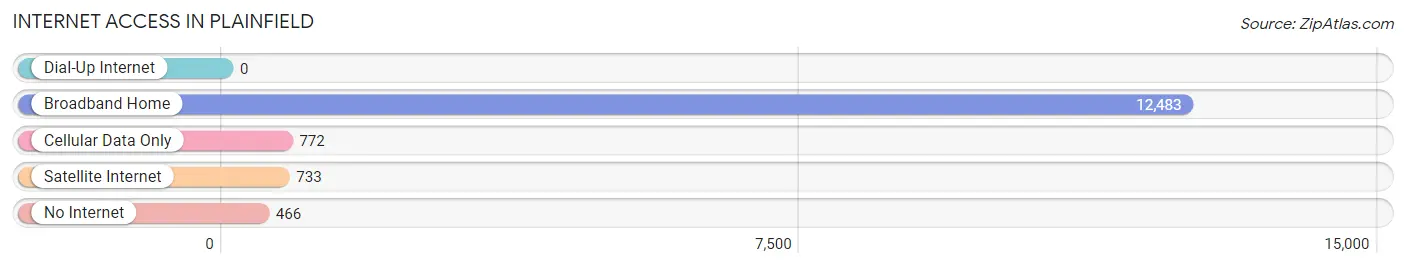
| Internet Type | # Households | % Households |
| Dial-Up Internet | 0 | 0.0% |
| Broadband Home | 12,483 | 89.7% |
| Cellular Data Only | 772 | 5.6% |
| Satellite Internet | 733 | 5.3% |
| No Internet | 466 | 3.4% |
| Total | 13,919 | 100.0% |
Plainfield Summary
Plainfield is a village located in Will County, Illinois, United States. It is part of the Chicago metropolitan area and is approximately 40 miles southwest of downtown Chicago. As of the 2010 census, the village had a population of 39,581.
Geography
Plainfield is located at 41°37′N 88°14′W (41.619, -88.233). According to the 2010 census, Plainfield has a total area of 24.9 square miles (64.4 km2), of which 24.8 square miles (64.2 km2) (or 99.60%) is land and 0.1 square miles (0.2 km2) (or 0.40%) is water.
The village is bordered by Naperville to the east, Bolingbrook to the south, Romeoville to the west, and unincorporated Wheatland Township to the north.
History
The area now known as Plainfield was originally inhabited by the Potawatomi Native Americans. The first European settlers arrived in the area in the 1820s. The village was originally known as Walkers' Grove, after the first settler, Jesse Walker. The village was renamed Plainfield in 1841.
Plainfield was incorporated as a village in 1866. The village grew rapidly in the late 19th and early 20th centuries, and by the 1950s had become a popular suburb of Chicago.
Economy
Plainfield's economy is largely based on retail and services. The village is home to several large retail centers, including the Louis Joliet Mall, which is the largest shopping mall in Will County. The village is also home to several corporate headquarters, including the headquarters of the Edward Don & Company, a foodservice equipment and supplies distributor.
Plainfield is also home to several industrial parks, including the Plainfield Business Park, which is home to several manufacturing and distribution companies.
Demographics
As of the 2010 census, there were 39,581 people, 13,851 households, and 10,845 families residing in the village. The population density was 1,597.3 people per square mile (616.2/km2). There were 14,717 housing units at an average density of 591.3 per square mile (228.3/km2). The racial makeup of the village was 77.2% White, 8.3% African American, 0.3% Native American, 5.7% Asian, 0.1% Pacific Islander, 5.2% from other races, and 3.2% from two or more races. Hispanic or Latino of any race were 16.9% of the population.
The median income for a household in the village was $77,945, and the median income for a family was $90,945. Males had a median income of $60,945 versus $41,945 for females. The per capita income for the village was $31,945. About 3.2% of families and 4.7% of the population were below the poverty line, including 5.3% of those under age 18 and 4.2% of those age 65 or over.
Common Questions
What is Per Capita Income in Plainfield?
Per Capita income in Plainfield is $53,441.
What is the Median Family Income in Plainfield?
Median Family Income in Plainfield is $153,909.
What is the Median Household income in Plainfield?
Median Household Income in Plainfield is $143,064.
What is Income or Wage Gap in Plainfield?
Income or Wage Gap in Plainfield is 41.5%.
Women in Plainfield earn 58.5 cents for every dollar earned by a man.
What is Family Income Deficit in Plainfield?
Family Income Deficit in Plainfield is $11,886.
Families that are below poverty line in Plainfield earn $11,886 less on average than the poverty threshold level.
What is Inequality or Gini Index in Plainfield?
Inequality or Gini Index in Plainfield is 0.37.
What is the Total Population of Plainfield?
Total Population of Plainfield is 44,941.
What is the Total Male Population of Plainfield?
Total Male Population of Plainfield is 22,533.
What is the Total Female Population of Plainfield?
Total Female Population of Plainfield is 22,408.
What is the Ratio of Males per 100 Females in Plainfield?
There are 100.56 Males per 100 Females in Plainfield.
What is the Ratio of Females per 100 Males in Plainfield?
There are 99.45 Females per 100 Males in Plainfield.
What is the Median Population Age in Plainfield?
Median Population Age in Plainfield is 37.7 Years.
What is the Average Family Size in Plainfield
Average Family Size in Plainfield is 3.5 People.
What is the Average Household Size in Plainfield
Average Household Size in Plainfield is 3.2 People.
How Large is the Labor Force in Plainfield?
There are 24,602 People in the Labor Forcein in Plainfield.
What is the Percentage of People in the Labor Force in Plainfield?
72.9% of People are in the Labor Force in Plainfield.
What is the Unemployment Rate in Plainfield?
Unemployment Rate in Plainfield is 3.7%.