Petersburg borough, PA Map & Demographics
Petersburg borough Overview
$30,235
PER CAPITA INCOME
$62,750
AVG FAMILY INCOME
$58,125
AVG HOUSEHOLD INCOME
48.5%
WAGE / INCOME GAP [ % ]
51.5¢/ $1
WAGE / INCOME GAP [ $ ]
0.39
INEQUALITY / GINI INDEX
383
TOTAL POPULATION
177
MALE POPULATION
206
FEMALE POPULATION
85.92
MALES / 100 FEMALES
116.38
FEMALES / 100 MALES
39.8
MEDIAN AGE
3.4
AVG FAMILY SIZE
2.6
AVG HOUSEHOLD SIZE
196
LABOR FORCE [ PEOPLE ]
64.3%
PERCENT IN LABOR FORCE
10.2%
UNEMPLOYMENT RATE
Income in Petersburg borough
Income Overview in Petersburg borough
Per Capita Income in Petersburg borough is $30,235, while median incomes of families and households are $62,750 and $58,125 respectively.
| Characteristic | Number | Measure |
| Per Capita Income | 383 | $30,235 |
| Median Family Income | 91 | $62,750 |
| Mean Family Income | 91 | $81,712 |
| Median Household Income | 147 | $58,125 |
| Mean Household Income | 147 | $71,501 |
| Income Deficit | 91 | $0 |
| Wage / Income Gap (%) | 383 | 48.54% |
| Wage / Income Gap ($) | 383 | 51.46¢ per $1 |
| Gini / Inequality Index | 383 | 0.39 |
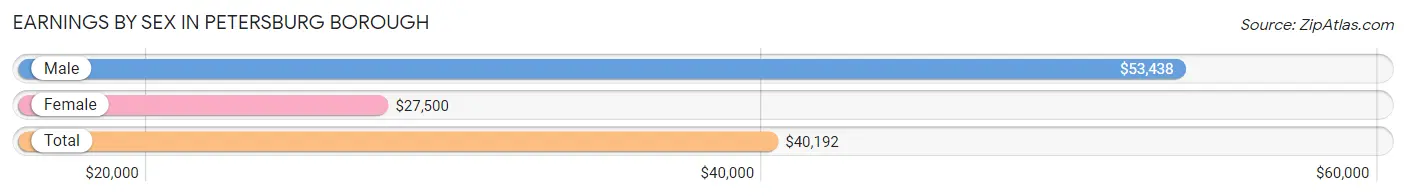
Earnings by Sex in Petersburg borough
Average Earnings in Petersburg borough are $40,192, $53,438 for men and $27,500 for women, a difference of 48.5%.
| Sex | Number | Average Earnings |
| Male | 94 (48.4%) | $53,438 |
| Female | 100 (51.5%) | $27,500 |
| Total | 194 (100.0%) | $40,192 |
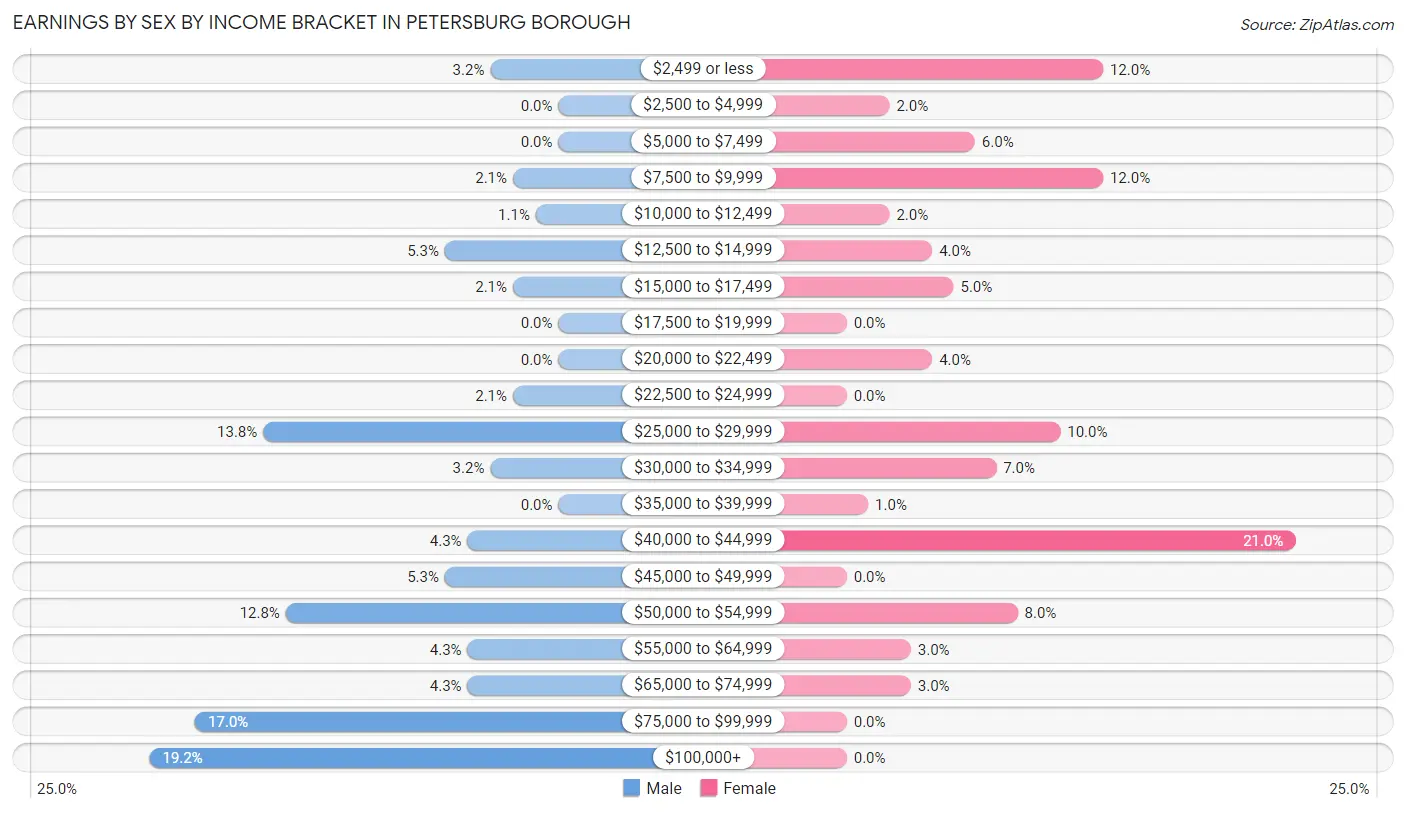
Earnings by Sex by Income Bracket in Petersburg borough
The most common earnings brackets in Petersburg borough are $100,000+ for men (18 | 19.2%) and $40,000 to $44,999 for women (21 | 21.0%).
| Income | Male | Female |
| $2,499 or less | 3 (3.2%) | 12 (12.0%) |
| $2,500 to $4,999 | 0 (0.0%) | 2 (2.0%) |
| $5,000 to $7,499 | 0 (0.0%) | 6 (6.0%) |
| $7,500 to $9,999 | 2 (2.1%) | 12 (12.0%) |
| $10,000 to $12,499 | 1 (1.1%) | 2 (2.0%) |
| $12,500 to $14,999 | 5 (5.3%) | 4 (4.0%) |
| $15,000 to $17,499 | 2 (2.1%) | 5 (5.0%) |
| $17,500 to $19,999 | 0 (0.0%) | 0 (0.0%) |
| $20,000 to $22,499 | 0 (0.0%) | 4 (4.0%) |
| $22,500 to $24,999 | 2 (2.1%) | 0 (0.0%) |
| $25,000 to $29,999 | 13 (13.8%) | 10 (10.0%) |
| $30,000 to $34,999 | 3 (3.2%) | 7 (7.0%) |
| $35,000 to $39,999 | 0 (0.0%) | 1 (1.0%) |
| $40,000 to $44,999 | 4 (4.3%) | 21 (21.0%) |
| $45,000 to $49,999 | 5 (5.3%) | 0 (0.0%) |
| $50,000 to $54,999 | 12 (12.8%) | 8 (8.0%) |
| $55,000 to $64,999 | 4 (4.3%) | 3 (3.0%) |
| $65,000 to $74,999 | 4 (4.3%) | 3 (3.0%) |
| $75,000 to $99,999 | 16 (17.0%) | 0 (0.0%) |
| $100,000+ | 18 (19.2%) | 0 (0.0%) |
| Total | 94 (100.0%) | 100 (100.0%) |
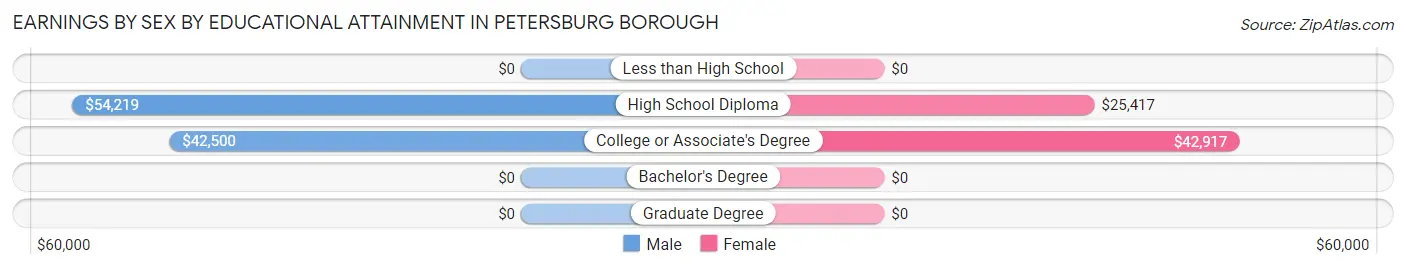
Earnings by Sex by Educational Attainment in Petersburg borough
Average earnings in Petersburg borough are $53,594 for men and $29,643 for women, a difference of 44.7%. Men with an educational attainment of high school diploma enjoy the highest average annual earnings of $54,219, while those with college or associate's degree education earn the least with $42,500. Women with an educational attainment of college or associate's degree earn the most with the average annual earnings of $42,917, while those with high school diploma education have the smallest earnings of $25,417.
| Educational Attainment | Male Income | Female Income |
| Less than High School | - | - |
| High School Diploma | $54,219 | $25,417 |
| College or Associate's Degree | $42,500 | $42,917 |
| Bachelor's Degree | - | - |
| Graduate Degree | - | - |
| Total | $53,594 | $29,643 |
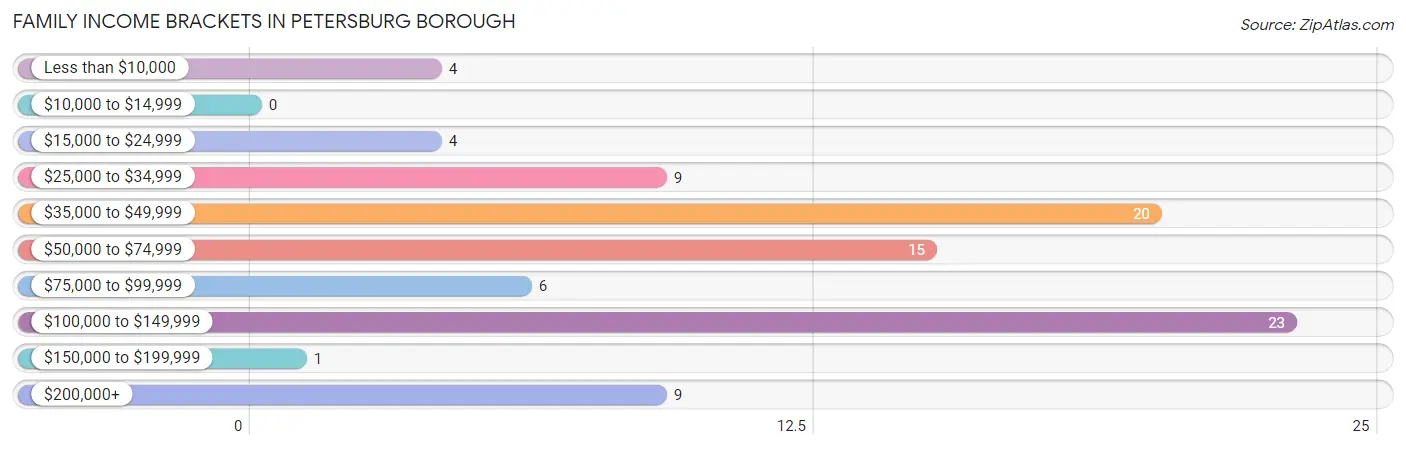
Family Income in Petersburg borough
Family Income Brackets in Petersburg borough
According to the Petersburg borough family income data, there are 23 families falling into the $100,000 to $149,999 income range, which is the most common income bracket and makes up 25.3% of all families.
| Income Bracket | # Families | % Families |
| Less than $10,000 | 4 | 4.4% |
| $10,000 to $14,999 | 0 | 0.0% |
| $15,000 to $24,999 | 4 | 4.4% |
| $25,000 to $34,999 | 9 | 9.9% |
| $35,000 to $49,999 | 20 | 22.0% |
| $50,000 to $74,999 | 15 | 16.5% |
| $75,000 to $99,999 | 6 | 6.6% |
| $100,000 to $149,999 | 23 | 25.3% |
| $150,000 to $199,999 | 1 | 1.1% |
| $200,000+ | 9 | 9.9% |
Family Income by Famaliy Size in Petersburg borough
4-person families (20 | 22.0%) account for the highest median family income in Petersburg borough with $122,500 per family, while 4-person families (20 | 22.0%) have the highest median income of $30,625 per family member.
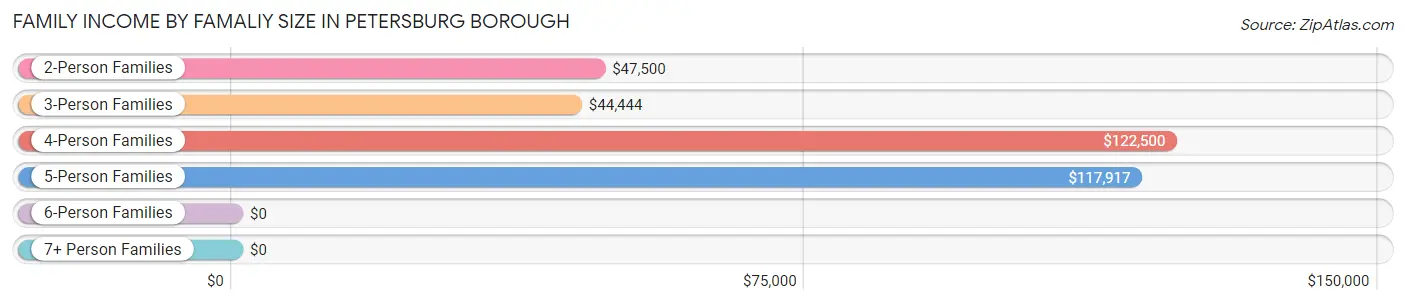
| Income Bracket | # Families | Median Income |
| 2-Person Families | 36 (39.6%) | $47,500 |
| 3-Person Families | 24 (26.4%) | $44,444 |
| 4-Person Families | 20 (22.0%) | $122,500 |
| 5-Person Families | 10 (11.0%) | $117,917 |
| 6-Person Families | 1 (1.1%) | $0 |
| 7+ Person Families | 0 (0.0%) | $0 |
| Total | 91 (100.0%) | $62,750 |
Family Income by Number of Earners in Petersburg borough
The median family income in Petersburg borough is $62,750, with families comprising 2 earners (19) having the highest median family income of $118,958, while families with 1 earner (36) have the lowest median family income of $43,889, accounting for 20.9% and 39.6% of families, respectively.
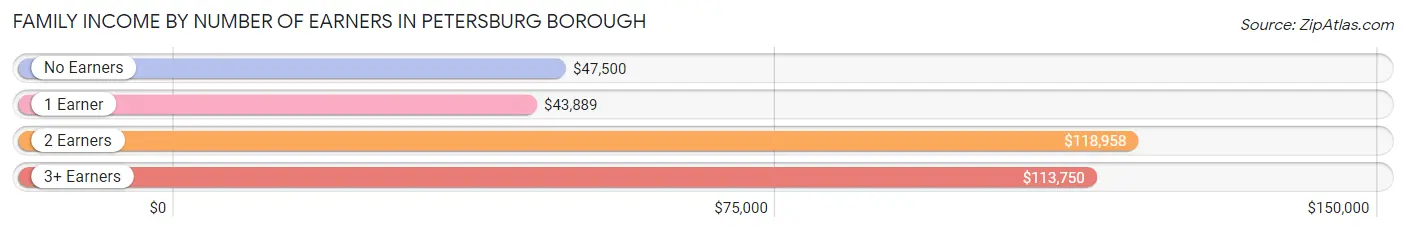
| Number of Earners | # Families | Median Income |
| No Earners | 20 (22.0%) | $47,500 |
| 1 Earner | 36 (39.6%) | $43,889 |
| 2 Earners | 19 (20.9%) | $118,958 |
| 3+ Earners | 16 (17.6%) | $113,750 |
| Total | 91 (100.0%) | $62,750 |
Household Income in Petersburg borough
Household Income Brackets in Petersburg borough
With 25 households falling in the category, the $50,000 to $74,999 income range is the most frequent in Petersburg borough, accounting for 17.0% of all households. In contrast, only 2 households (1.4%) fall into the $150,000 to $199,999 income bracket, making it the least populous group.
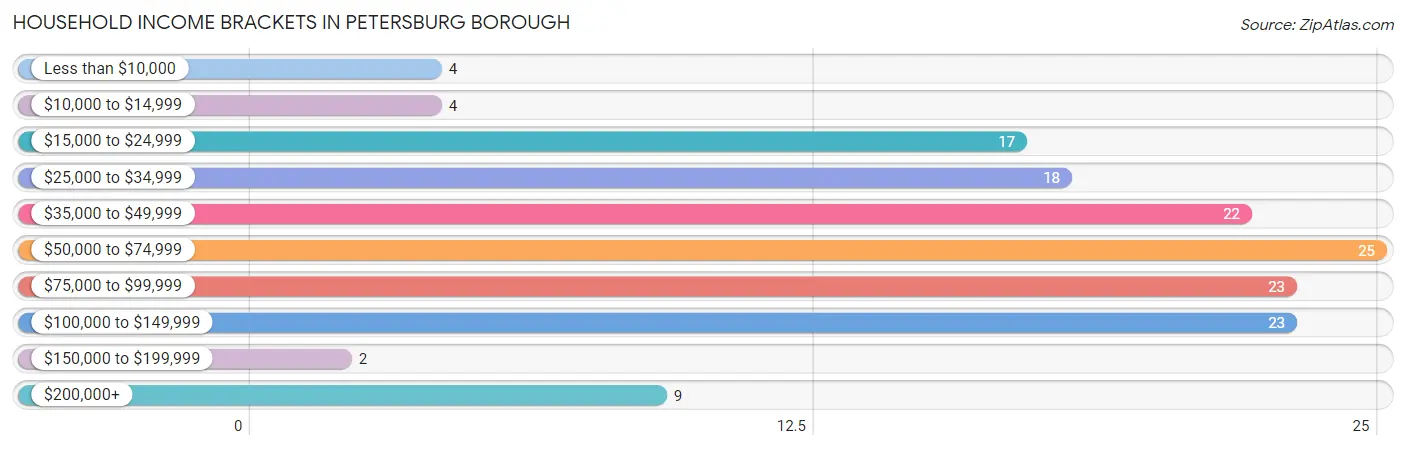
| Income Bracket | # Households | % Households |
| Less than $10,000 | 4 | 2.7% |
| $10,000 to $14,999 | 4 | 2.7% |
| $15,000 to $24,999 | 17 | 11.6% |
| $25,000 to $34,999 | 18 | 12.2% |
| $35,000 to $49,999 | 22 | 15.0% |
| $50,000 to $74,999 | 25 | 17.0% |
| $75,000 to $99,999 | 23 | 15.6% |
| $100,000 to $149,999 | 23 | 15.6% |
| $150,000 to $199,999 | 2 | 1.4% |
| $200,000+ | 9 | 6.1% |
Household Income by Householder Age in Petersburg borough
The median household income in Petersburg borough is $58,125, with the highest median household income of $95,000 found in the 25 to 44 years age bracket for the primary householder. A total of 48 households (32.7%) fall into this category. Meanwhile, the 15 to 24 years age bracket for the primary householder has the lowest median household income of $0, with 1 households (0.7%) in this group.
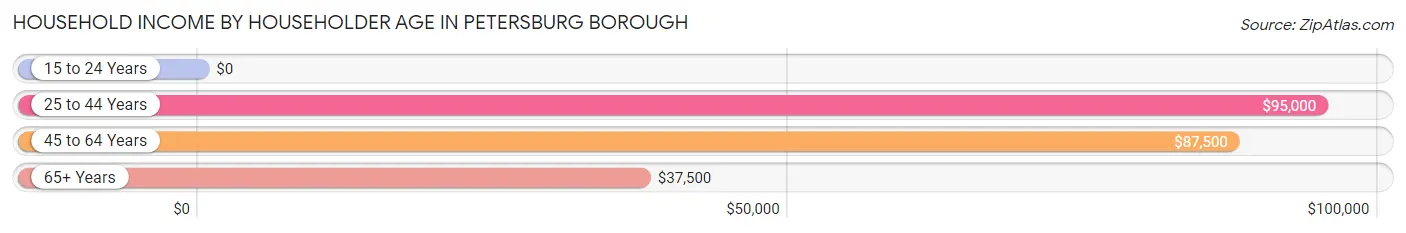
| Income Bracket | # Households | Median Income |
| 15 to 24 Years | 1 (0.7%) | $0 |
| 25 to 44 Years | 48 (32.7%) | $95,000 |
| 45 to 64 Years | 50 (34.0%) | $87,500 |
| 65+ Years | 48 (32.7%) | $37,500 |
| Total | 147 (100.0%) | $58,125 |
Poverty in Petersburg borough
Income Below Poverty by Sex and Age in Petersburg borough
With 5.1% poverty level for males and 12.6% for females among the residents of Petersburg borough, 35 to 44 year old males and 15 year old females are the most vulnerable to poverty, with 6 males (25.0%) and 3 females (100.0%) in their respective age groups living below the poverty level.
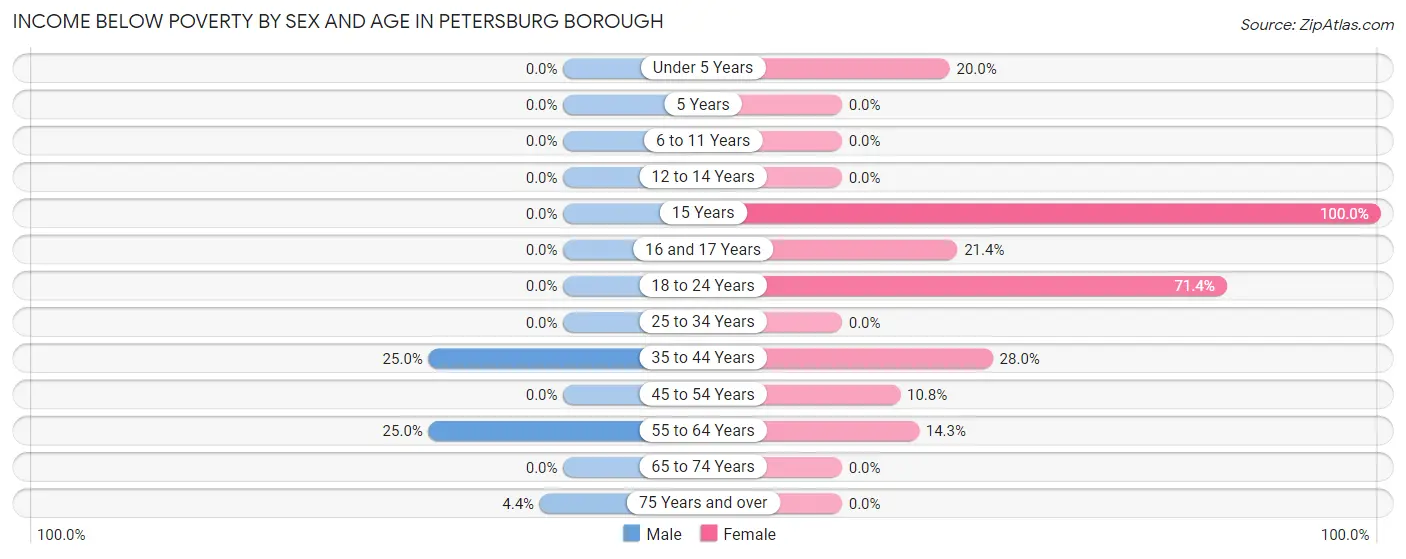
| Age Bracket | Male | Female |
| Under 5 Years | 0 (0.0%) | 2 (20.0%) |
| 5 Years | 0 (0.0%) | 0 (0.0%) |
| 6 to 11 Years | 0 (0.0%) | 0 (0.0%) |
| 12 to 14 Years | 0 (0.0%) | 0 (0.0%) |
| 15 Years | 0 (0.0%) | 3 (100.0%) |
| 16 and 17 Years | 0 (0.0%) | 3 (21.4%) |
| 18 to 24 Years | 0 (0.0%) | 5 (71.4%) |
| 25 to 34 Years | 0 (0.0%) | 0 (0.0%) |
| 35 to 44 Years | 6 (25.0%) | 7 (28.0%) |
| 45 to 54 Years | 0 (0.0%) | 4 (10.8%) |
| 55 to 64 Years | 2 (25.0%) | 2 (14.3%) |
| 65 to 74 Years | 0 (0.0%) | 0 (0.0%) |
| 75 Years and over | 1 (4.3%) | 0 (0.0%) |
| Total | 9 (5.1%) | 26 (12.6%) |
Income Above Poverty by Sex and Age in Petersburg borough
According to the poverty statistics in Petersburg borough, males aged under 5 years and females aged 5 years are the age groups that are most secure financially, with 100.0% of males and 100.0% of females in these age groups living above the poverty line.
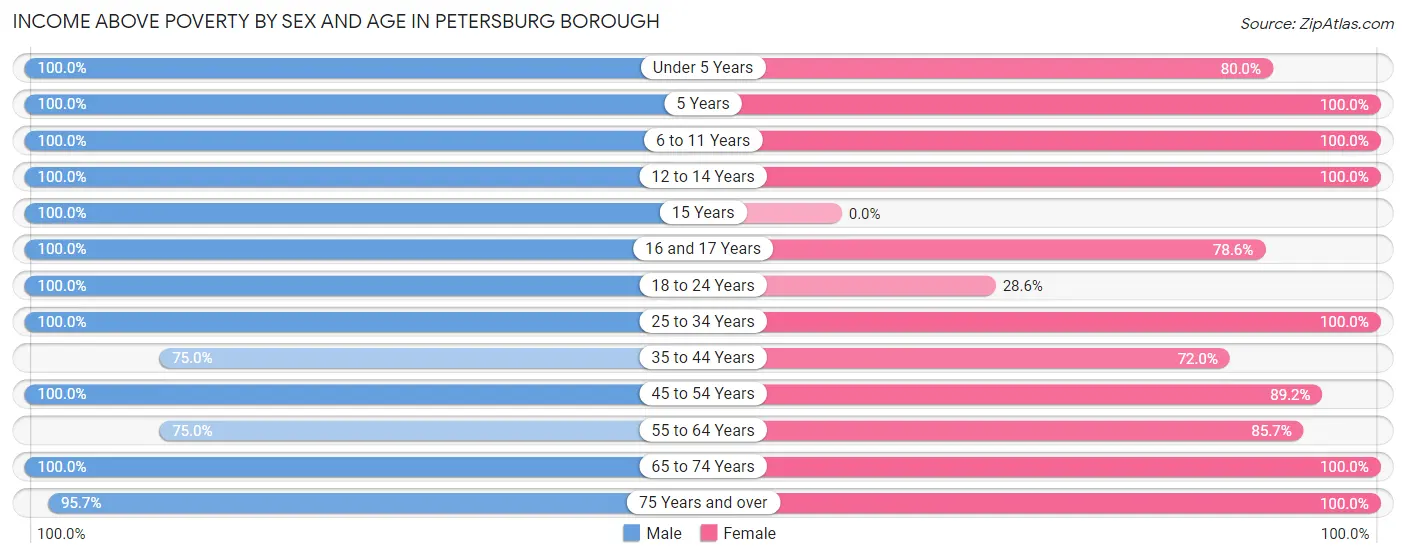
| Age Bracket | Male | Female |
| Under 5 Years | 21 (100.0%) | 8 (80.0%) |
| 5 Years | 2 (100.0%) | 7 (100.0%) |
| 6 to 11 Years | 7 (100.0%) | 14 (100.0%) |
| 12 to 14 Years | 4 (100.0%) | 5 (100.0%) |
| 15 Years | 4 (100.0%) | 0 (0.0%) |
| 16 and 17 Years | 4 (100.0%) | 11 (78.6%) |
| 18 to 24 Years | 23 (100.0%) | 2 (28.6%) |
| 25 to 34 Years | 20 (100.0%) | 27 (100.0%) |
| 35 to 44 Years | 18 (75.0%) | 18 (72.0%) |
| 45 to 54 Years | 27 (100.0%) | 33 (89.2%) |
| 55 to 64 Years | 6 (75.0%) | 12 (85.7%) |
| 65 to 74 Years | 9 (100.0%) | 17 (100.0%) |
| 75 Years and over | 22 (95.7%) | 26 (100.0%) |
| Total | 167 (94.9%) | 180 (87.4%) |
Income Below Poverty Among Married-Couple Families in Petersburg borough
The poverty statistics for married-couple families in Petersburg borough show that 5.4% or 3 of the total 56 families live below the poverty line. Families with 1 or 2 children have the highest poverty rate of 8.7%, comprising of 2 families. On the other hand, families with 3 or 4 children have the lowest poverty rate of 0.0%, which includes 0 families.
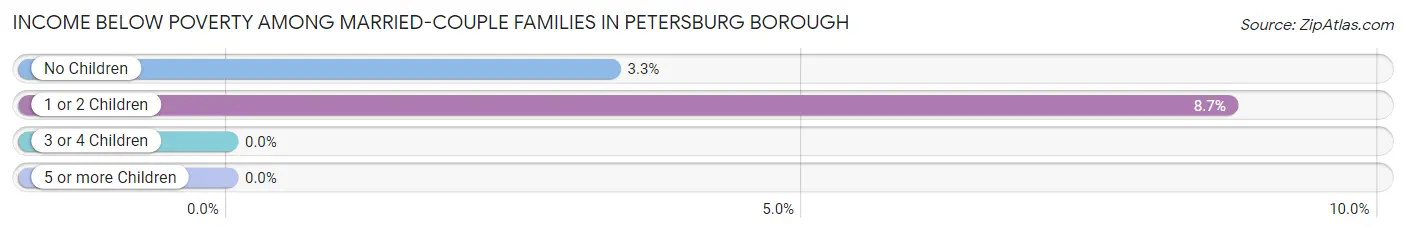
| Children | Above Poverty | Below Poverty |
| No Children | 29 (96.7%) | 1 (3.3%) |
| 1 or 2 Children | 21 (91.3%) | 2 (8.7%) |
| 3 or 4 Children | 3 (100.0%) | 0 (0.0%) |
| 5 or more Children | 0 (0.0%) | 0 (0.0%) |
| Total | 53 (94.6%) | 3 (5.4%) |
Income Below Poverty Among Single-Parent Households in Petersburg borough
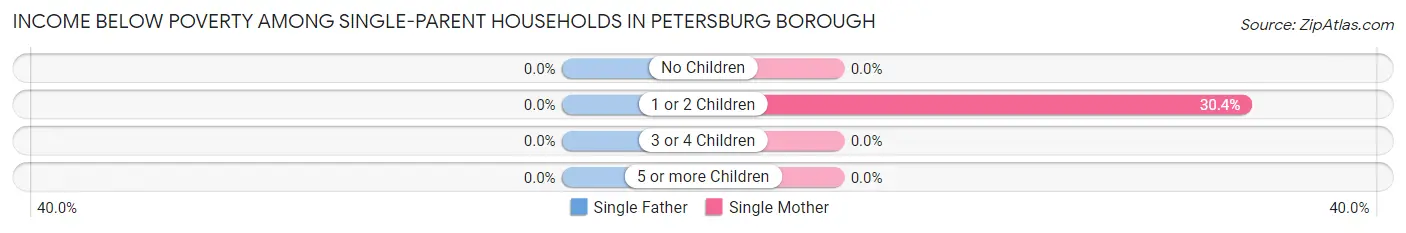
| Children | Single Father | Single Mother |
| No Children | 0 (0.0%) | 0 (0.0%) |
| 1 or 2 Children | 0 (0.0%) | 7 (30.4%) |
| 3 or 4 Children | 0 (0.0%) | 0 (0.0%) |
| 5 or more Children | 0 (0.0%) | 0 (0.0%) |
| Total | 0 (0.0%) | 7 (28.0%) |
Income Below Poverty Among Married-Couple vs Single-Parent Households in Petersburg borough
The poverty data for Petersburg borough shows that 3 of the married-couple family households (5.4%) and 7 of the single-parent households (20.0%) are living below the poverty level. Within the married-couple family households, those with 1 or 2 children have the highest poverty rate, with 2 households (8.7%) falling below the poverty line. Among the single-parent households, those with 1 or 2 children have the highest poverty rate, with 7 household (29.2%) living below poverty.
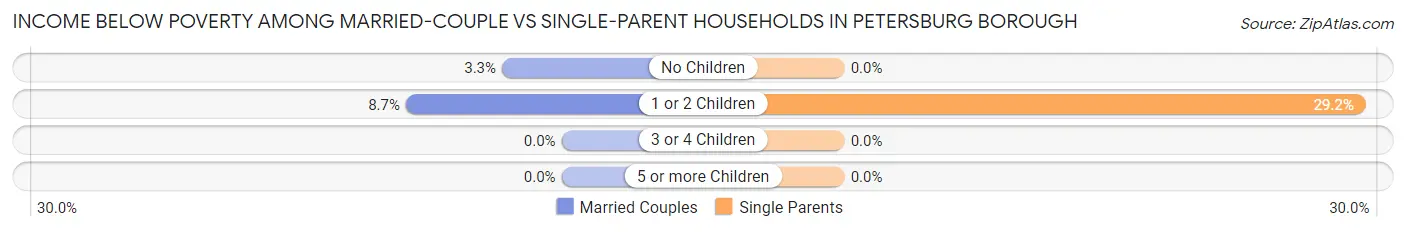
| Children | Married-Couple Families | Single-Parent Households |
| No Children | 1 (3.3%) | 0 (0.0%) |
| 1 or 2 Children | 2 (8.7%) | 7 (29.2%) |
| 3 or 4 Children | 0 (0.0%) | 0 (0.0%) |
| 5 or more Children | 0 (0.0%) | 0 (0.0%) |
| Total | 3 (5.4%) | 7 (20.0%) |
Race in Petersburg borough
The most populous races in Petersburg borough are White / Caucasian (375 | 97.9%), and Two or more Races (8 | 2.1%).
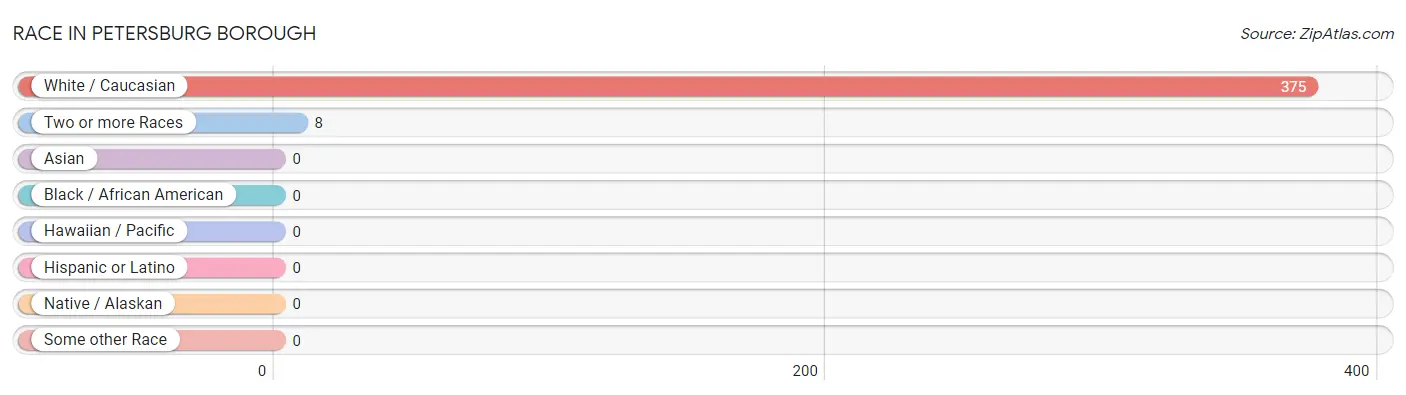
| Race | # Population | % Population |
| Asian | 0 | 0.0% |
| Black / African American | 0 | 0.0% |
| Hawaiian / Pacific | 0 | 0.0% |
| Hispanic or Latino | 0 | 0.0% |
| Native / Alaskan | 0 | 0.0% |
| White / Caucasian | 375 | 97.9% |
| Two or more Races | 8 | 2.1% |
| Some other Race | 0 | 0.0% |
| Total | 383 | 100.0% |
Ancestry in Petersburg borough
The most populous ancestries reported in Petersburg borough are German (132 | 34.5%), English (55 | 14.4%), Irish (51 | 13.3%), Italian (26 | 6.8%), and American (18 | 4.7%), together accounting for 73.6% of all Petersburg borough residents.
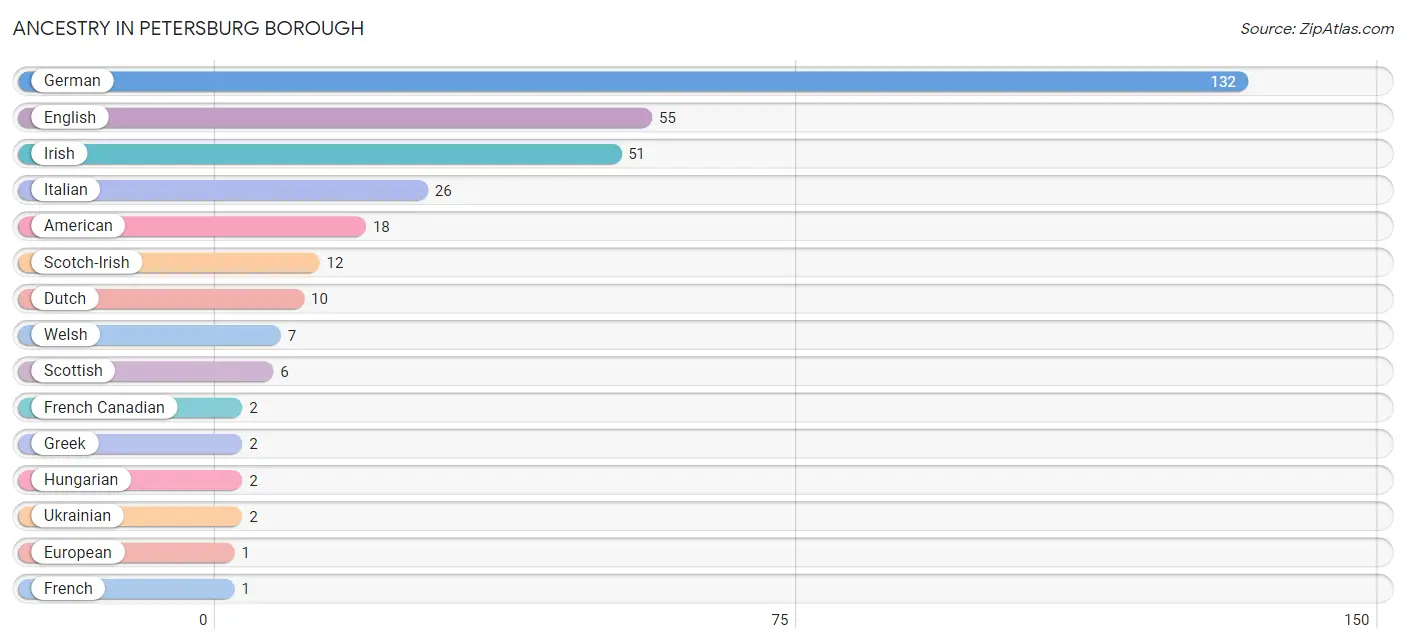
| Ancestry | # Population | % Population |
| American | 18 | 4.7% |
| Dutch | 10 | 2.6% |
| English | 55 | 14.4% |
| European | 1 | 0.3% |
| French | 1 | 0.3% |
| French Canadian | 2 | 0.5% |
| German | 132 | 34.5% |
| Greek | 2 | 0.5% |
| Hungarian | 2 | 0.5% |
| Irish | 51 | 13.3% |
| Italian | 26 | 6.8% |
| Scotch-Irish | 12 | 3.1% |
| Scottish | 6 | 1.6% |
| Swiss | 1 | 0.3% |
| Ukrainian | 2 | 0.5% |
| Welsh | 7 | 1.8% | View All 16 Rows |
Immigrants in Petersburg borough
The most numerous immigrant groups reported in Petersburg borough came from Europe (4 | 1.0%), Germany (4 | 1.0%), and Western Europe (4 | 1.0%), together accounting for 3.1% of all Petersburg borough residents.
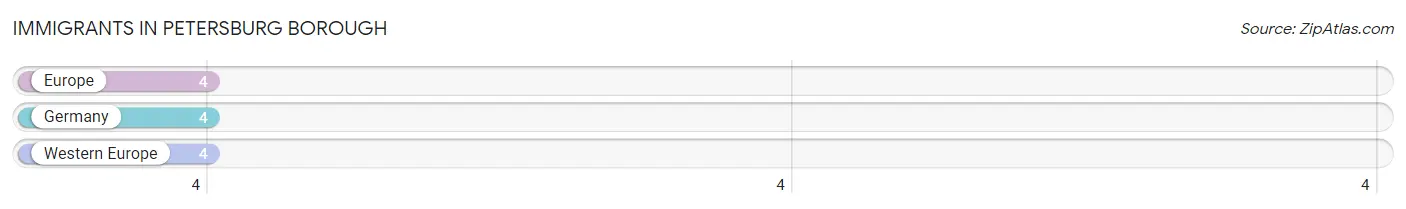
| Immigration Origin | # Population | % Population |
| Europe | 4 | 1.0% |
| Germany | 4 | 1.0% |
| Western Europe | 4 | 1.0% | View All 3 Rows |
Sex and Age in Petersburg borough
Sex and Age in Petersburg borough
The most populous age groups in Petersburg borough are 20 to 24 Years (23 | 13.0%) for men and 45 to 49 Years (26 | 12.6%) for women.
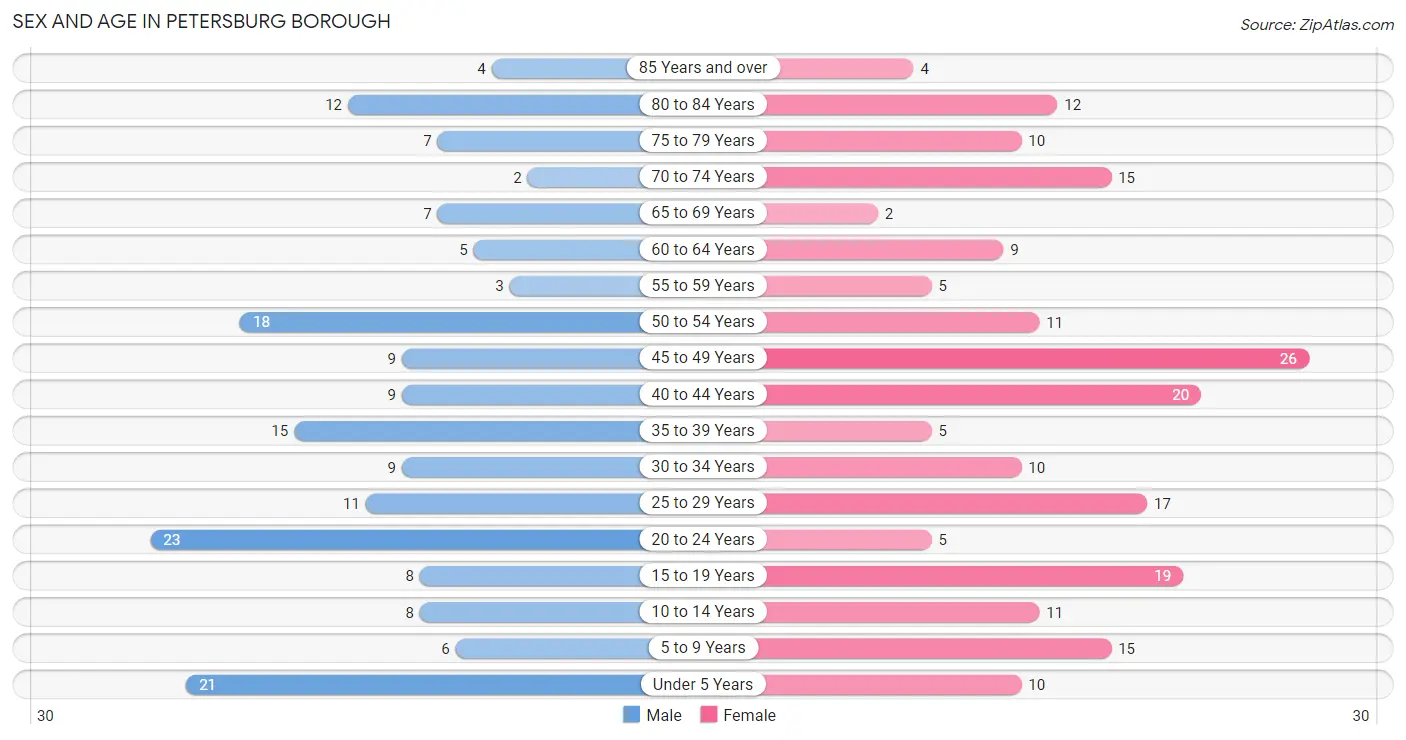
| Age Bracket | Male | Female |
| Under 5 Years | 21 (11.9%) | 10 (4.9%) |
| 5 to 9 Years | 6 (3.4%) | 15 (7.3%) |
| 10 to 14 Years | 8 (4.5%) | 11 (5.3%) |
| 15 to 19 Years | 8 (4.5%) | 19 (9.2%) |
| 20 to 24 Years | 23 (13.0%) | 5 (2.4%) |
| 25 to 29 Years | 11 (6.2%) | 17 (8.3%) |
| 30 to 34 Years | 9 (5.1%) | 10 (4.9%) |
| 35 to 39 Years | 15 (8.5%) | 5 (2.4%) |
| 40 to 44 Years | 9 (5.1%) | 20 (9.7%) |
| 45 to 49 Years | 9 (5.1%) | 26 (12.6%) |
| 50 to 54 Years | 18 (10.2%) | 11 (5.3%) |
| 55 to 59 Years | 3 (1.7%) | 5 (2.4%) |
| 60 to 64 Years | 5 (2.8%) | 9 (4.4%) |
| 65 to 69 Years | 7 (4.0%) | 2 (1.0%) |
| 70 to 74 Years | 2 (1.1%) | 15 (7.3%) |
| 75 to 79 Years | 7 (4.0%) | 10 (4.9%) |
| 80 to 84 Years | 12 (6.8%) | 12 (5.8%) |
| 85 Years and over | 4 (2.3%) | 4 (1.9%) |
| Total | 177 (100.0%) | 206 (100.0%) |
Families and Households in Petersburg borough
Median Family Size in Petersburg borough
The median family size in Petersburg borough is 3.38 persons per family, with married-couple families (56 | 61.5%) accounting for the largest median family size of 3.82 persons per family. On the other hand, single female/mother families (25 | 27.5%) represent the smallest median family size with 2.64 persons per family.
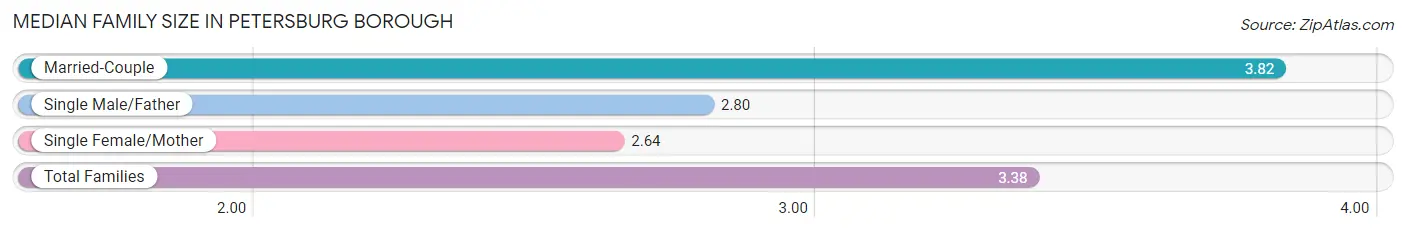
| Family Type | # Families | Family Size |
| Married-Couple | 56 (61.5%) | 3.82 |
| Single Male/Father | 10 (11.0%) | 2.80 |
| Single Female/Mother | 25 (27.5%) | 2.64 |
| Total Families | 91 (100.0%) | 3.38 |
Median Household Size in Petersburg borough
The median household size in Petersburg borough is 2.61 persons per household, with married-couple households (56 | 38.1%) accounting for the largest median household size of 3.88 persons per household. non-family households (56 | 38.1%) represent the smallest median household size with 1.11 persons per household.
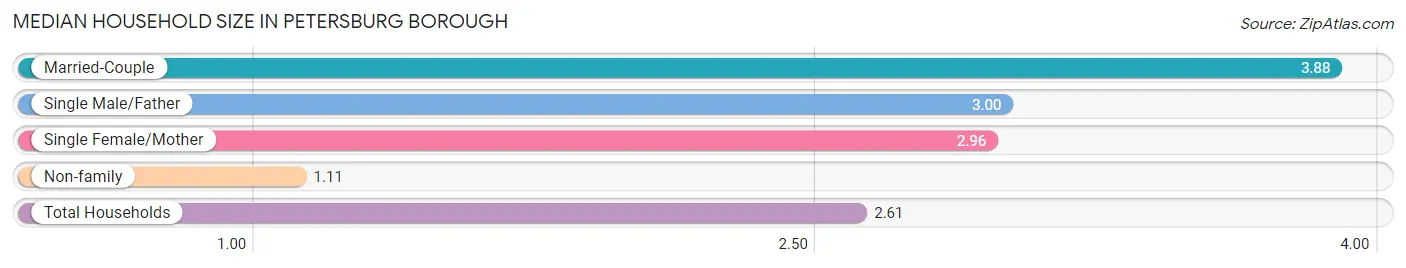
| Household Type | # Households | Household Size |
| Married-Couple | 56 (38.1%) | 3.88 |
| Single Male/Father | 10 (6.8%) | 3.00 |
| Single Female/Mother | 25 (17.0%) | 2.96 |
| Non-family | 56 (38.1%) | 1.11 |
| Total Households | 147 (100.0%) | 2.61 |
Household Size by Marriage Status in Petersburg borough
Out of a total of 147 households in Petersburg borough, 91 (61.9%) are family households, while 56 (38.1%) are nonfamily households. The most numerous type of family households are 2-person households, comprising 34, and the most common type of nonfamily households are 1-person households, comprising 49.
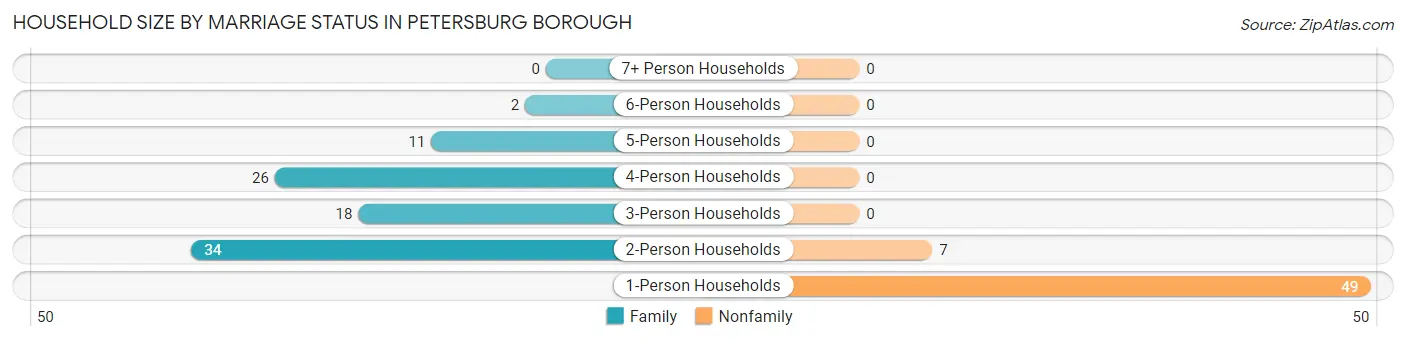
| Household Size | Family Households | Nonfamily Households |
| 1-Person Households | - | 49 (33.3%) |
| 2-Person Households | 34 (23.1%) | 7 (4.8%) |
| 3-Person Households | 18 (12.2%) | 0 (0.0%) |
| 4-Person Households | 26 (17.7%) | 0 (0.0%) |
| 5-Person Households | 11 (7.5%) | 0 (0.0%) |
| 6-Person Households | 2 (1.4%) | 0 (0.0%) |
| 7+ Person Households | 0 (0.0%) | 0 (0.0%) |
| Total | 91 (61.9%) | 56 (38.1%) |
Female Fertility in Petersburg borough
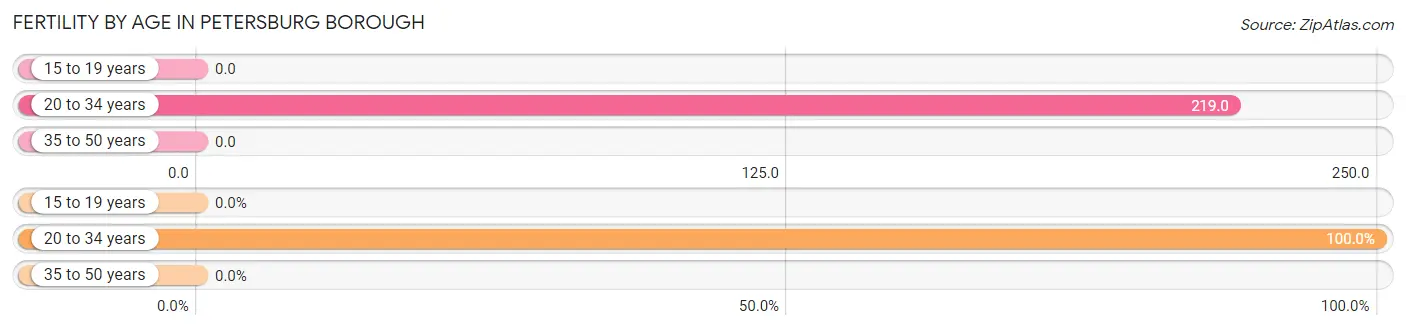
Fertility by Age in Petersburg borough
Average fertility rate in Petersburg borough is 69.0 births per 1,000 women. Women in the age bracket of 20 to 34 years have the highest fertility rate with 219.0 births per 1,000 women. Women in the age bracket of 20 to 34 years acount for 100.0% of all women with births.
| Age Bracket | Women with Births | Births / 1,000 Women |
| 15 to 19 years | 0 (0.0%) | 0.0 |
| 20 to 34 years | 7 (100.0%) | 219.0 |
| 35 to 50 years | 0 (0.0%) | 0.0 |
| Total | 7 (100.0%) | 69.0 |
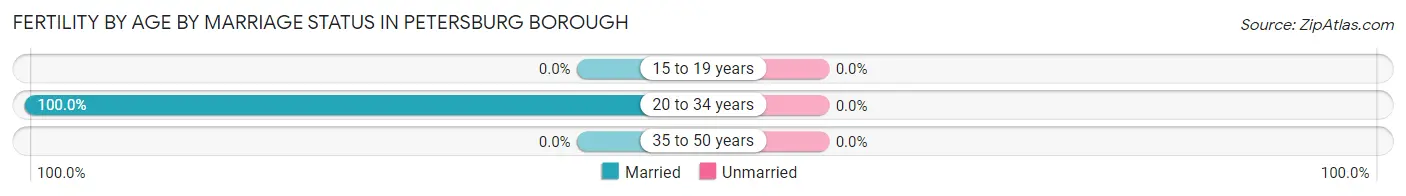
Fertility by Age by Marriage Status in Petersburg borough
| Age Bracket | Married | Unmarried |
| 15 to 19 years | 0 (0.0%) | 0 (0.0%) |
| 20 to 34 years | 7 (100.0%) | 0 (0.0%) |
| 35 to 50 years | 0 (0.0%) | 0 (0.0%) |
| Total | 7 (100.0%) | 0 (0.0%) |
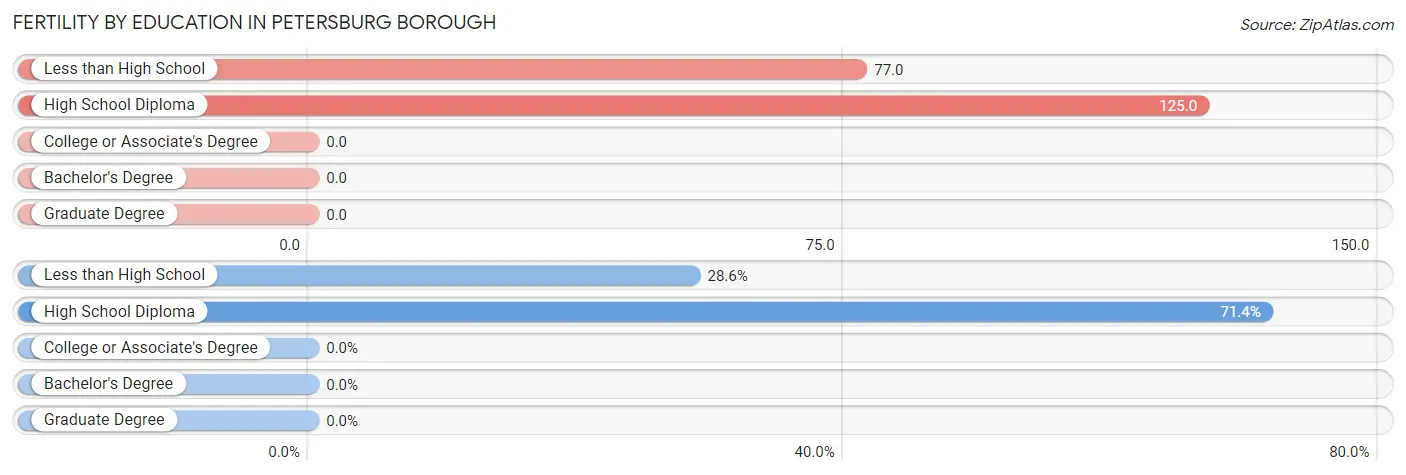
Fertility by Education in Petersburg borough
| Educational Attainment | Women with Births | Births / 1,000 Women |
| Less than High School | 2 (28.6%) | 77.0 |
| High School Diploma | 5 (71.4%) | 125.0 |
| College or Associate's Degree | 0 (0.0%) | 0.0 |
| Bachelor's Degree | 0 (0.0%) | 0.0 |
| Graduate Degree | 0 (0.0%) | 0.0 |
| Total | 7 (100.0%) | 69.0 |
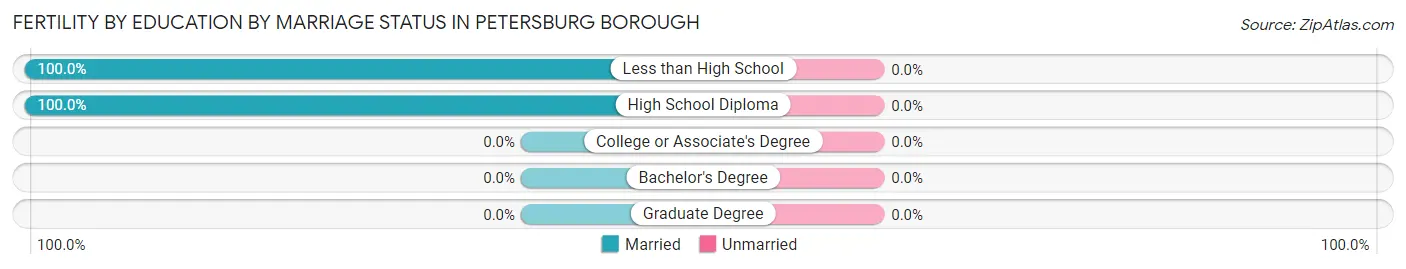
Fertility by Education by Marriage Status in Petersburg borough
| Educational Attainment | Married | Unmarried |
| Less than High School | 2 (100.0%) | 0 (0.0%) |
| High School Diploma | 5 (100.0%) | 0 (0.0%) |
| College or Associate's Degree | 0 (0.0%) | 0 (0.0%) |
| Bachelor's Degree | 0 (0.0%) | 0 (0.0%) |
| Graduate Degree | 0 (0.0%) | 0 (0.0%) |
| Total | 7 (100.0%) | 0 (0.0%) |
Employment Characteristics in Petersburg borough
Employment by Class of Employer in Petersburg borough
Among the 171 employed individuals in Petersburg borough, private company employees (119 | 69.6%), not-for-profit organizations (23 | 13.5%), and self-employed (incorporated) (10 | 5.9%) make up the most common classes of employment.
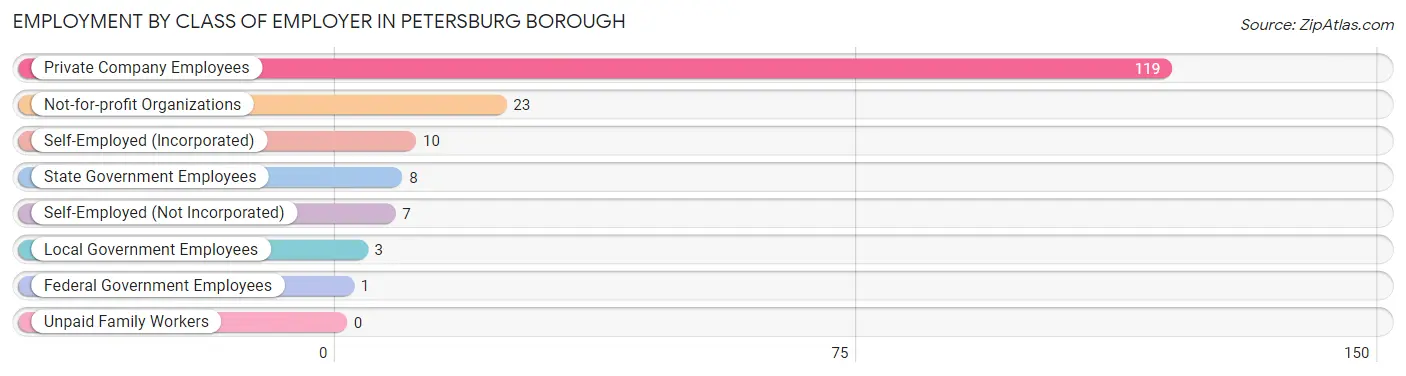
| Employer Class | # Employees | % Employees |
| Private Company Employees | 119 | 69.6% |
| Self-Employed (Incorporated) | 10 | 5.9% |
| Self-Employed (Not Incorporated) | 7 | 4.1% |
| Not-for-profit Organizations | 23 | 13.5% |
| Local Government Employees | 3 | 1.8% |
| State Government Employees | 8 | 4.7% |
| Federal Government Employees | 1 | 0.6% |
| Unpaid Family Workers | 0 | 0.0% |
| Total | 171 | 100.0% |
Employment Status by Age in Petersburg borough
According to the labor force statistics for Petersburg borough, out of the total population over 16 years of age (305), 64.3% or 196 individuals are in the labor force, with 10.2% or 20 of them unemployed. The age group with the highest labor force participation rate is 30 to 34 years, with 100.0% or 19 individuals in the labor force. Within the labor force, the 16 to 19 years age range has the highest percentage of unemployed individuals, with 36.4% or 4 of them being unemployed.
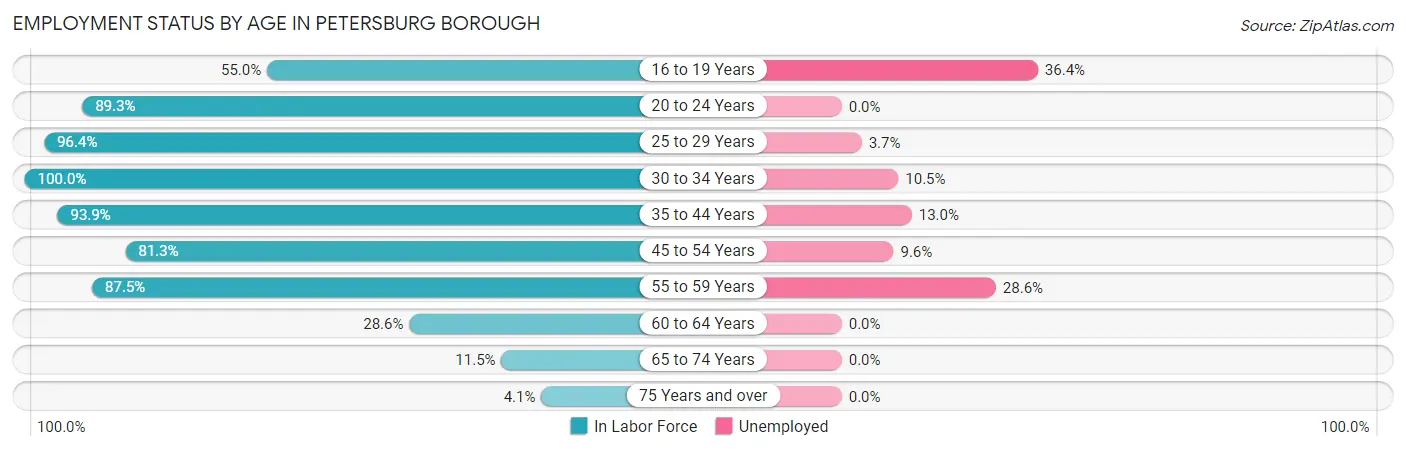
| Age Bracket | In Labor Force | Unemployed |
| 16 to 19 Years | 11 (55.0%) | 4 (36.4%) |
| 20 to 24 Years | 25 (89.3%) | 0 (0.0%) |
| 25 to 29 Years | 27 (96.4%) | 1 (3.7%) |
| 30 to 34 Years | 19 (100.0%) | 2 (10.5%) |
| 35 to 44 Years | 46 (93.9%) | 6 (13.0%) |
| 45 to 54 Years | 52 (81.3%) | 5 (9.6%) |
| 55 to 59 Years | 7 (87.5%) | 2 (28.6%) |
| 60 to 64 Years | 4 (28.6%) | 0 (0.0%) |
| 65 to 74 Years | 3 (11.5%) | 0 (0.0%) |
| 75 Years and over | 2 (4.1%) | 0 (0.0%) |
| Total | 196 (64.3%) | 20 (10.2%) |
Employment Status by Educational Attainment in Petersburg borough
According to labor force statistics for Petersburg borough, 85.2% of individuals (155) out of the total population between 25 and 64 years of age (182) are in the labor force, with 10.3% or 16 of them being unemployed. The group with the highest labor force participation rate are those with the educational attainment of high school diploma, with 93.8% or 105 individuals in the labor force. Within the labor force, individuals with less than high school education have the highest percentage of unemployment, with 20.0% or 2 of them being unemployed.
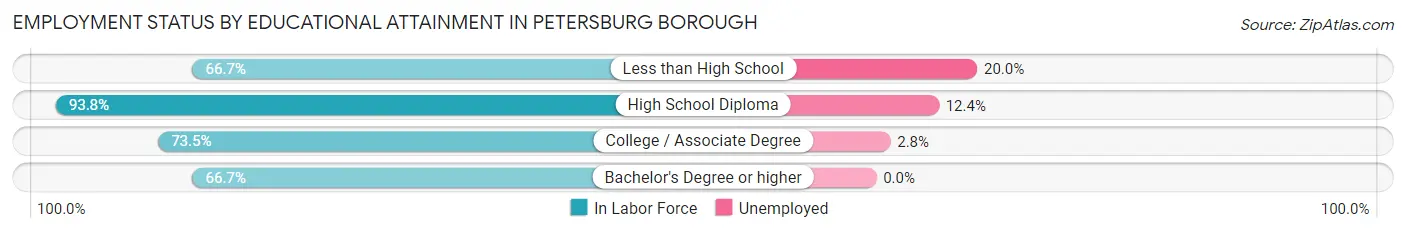
| Educational Attainment | In Labor Force | Unemployed |
| Less than High School | 10 (66.7%) | 3 (20.0%) |
| High School Diploma | 105 (93.8%) | 14 (12.4%) |
| College / Associate Degree | 36 (73.5%) | 1 (2.8%) |
| Bachelor's Degree or higher | 4 (66.7%) | 0 (0.0%) |
| Total | 155 (85.2%) | 19 (10.3%) |
Employment Occupations by Sex in Petersburg borough
Management, Business, Science and Arts Occupations
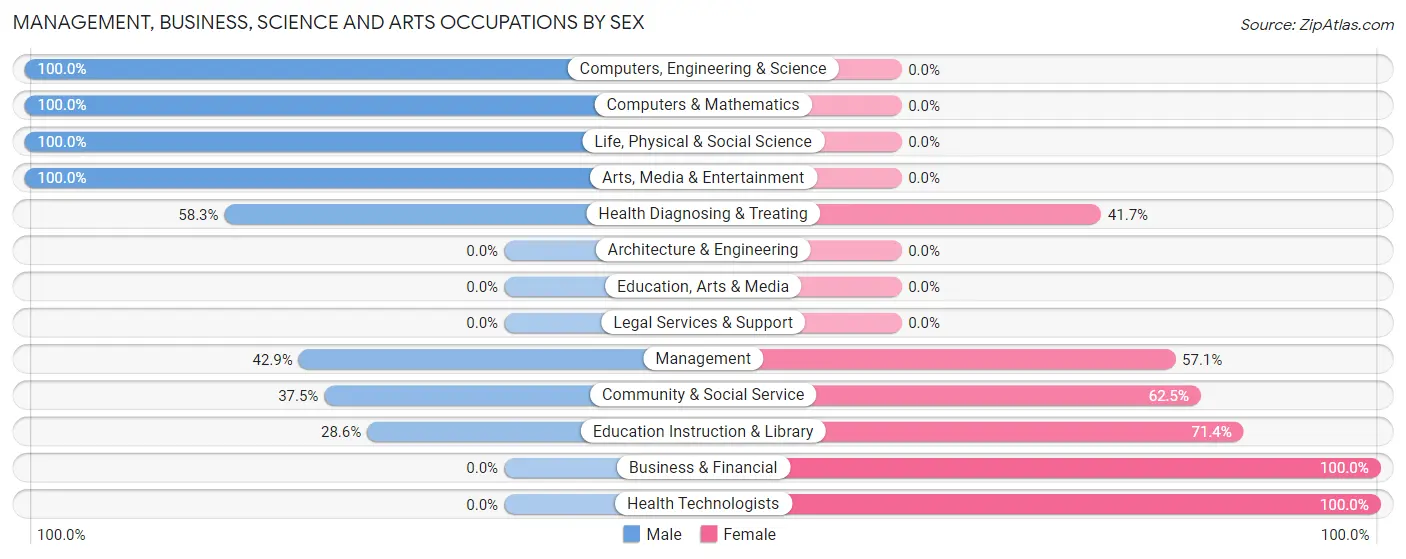
The most common Management, Business, Science and Arts occupations in Petersburg borough are Management (14 | 8.0%), Health Diagnosing & Treating (12 | 6.8%), Community & Social Service (8 | 4.5%), Education Instruction & Library (7 | 4.0%), and Business & Financial (6 | 3.4%).
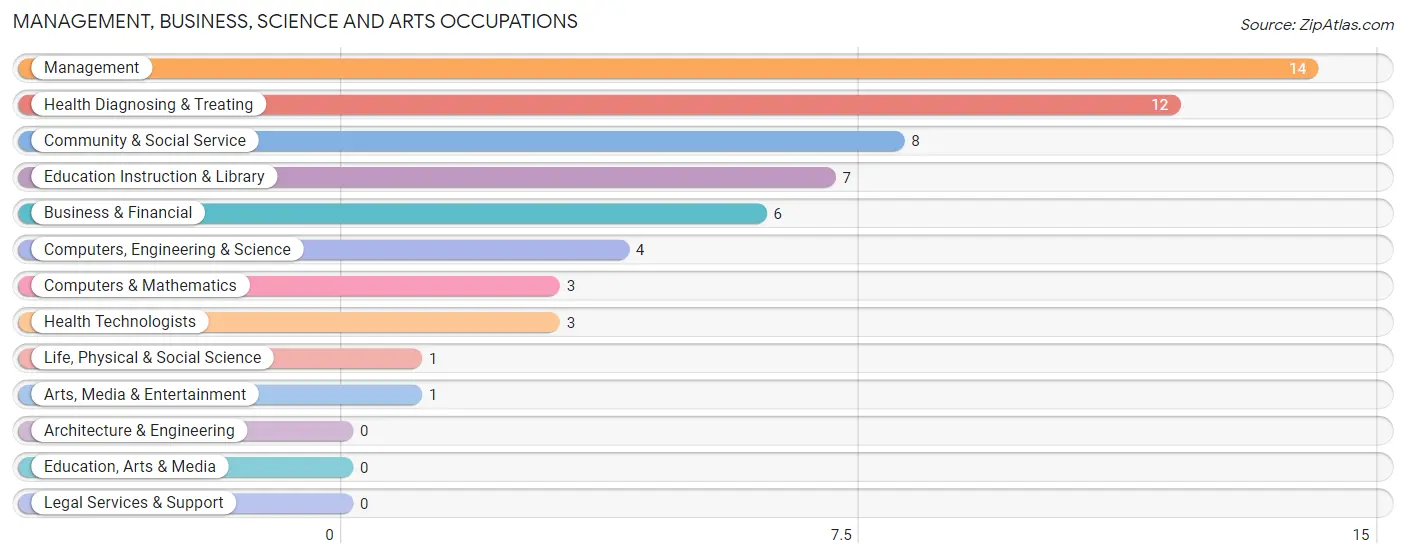
Management, Business, Science and Arts Occupations by Sex
Within the Management, Business, Science and Arts occupations in Petersburg borough, the most male-oriented occupations are Computers, Engineering & Science (100.0%), Computers & Mathematics (100.0%), and Life, Physical & Social Science (100.0%), while the most female-oriented occupations are Business & Financial (100.0%), Health Technologists (100.0%), and Education Instruction & Library (71.4%).
| Occupation | Male | Female |
| Management | 6 (42.9%) | 8 (57.1%) |
| Business & Financial | 0 (0.0%) | 6 (100.0%) |
| Computers, Engineering & Science | 4 (100.0%) | 0 (0.0%) |
| Computers & Mathematics | 3 (100.0%) | 0 (0.0%) |
| Architecture & Engineering | 0 (0.0%) | 0 (0.0%) |
| Life, Physical & Social Science | 1 (100.0%) | 0 (0.0%) |
| Community & Social Service | 3 (37.5%) | 5 (62.5%) |
| Education, Arts & Media | 0 (0.0%) | 0 (0.0%) |
| Legal Services & Support | 0 (0.0%) | 0 (0.0%) |
| Education Instruction & Library | 2 (28.6%) | 5 (71.4%) |
| Arts, Media & Entertainment | 1 (100.0%) | 0 (0.0%) |
| Health Diagnosing & Treating | 7 (58.3%) | 5 (41.7%) |
| Health Technologists | 0 (0.0%) | 3 (100.0%) |
| Total (Category) | 20 (45.5%) | 24 (54.5%) |
| Total (Overall) | 85 (48.3%) | 91 (51.7%) |
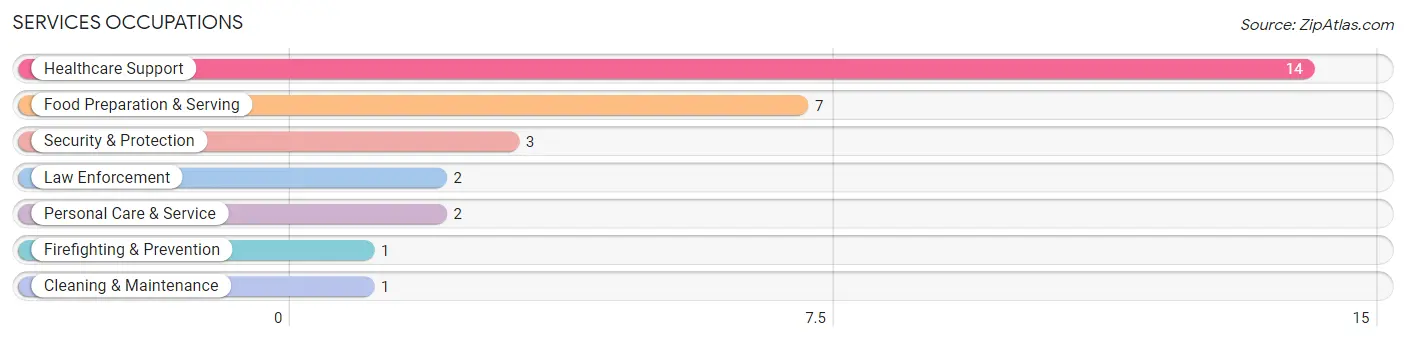
Services Occupations
The most common Services occupations in Petersburg borough are Healthcare Support (14 | 8.0%), Food Preparation & Serving (7 | 4.0%), Security & Protection (3 | 1.7%), Law Enforcement (2 | 1.1%), and Personal Care & Service (2 | 1.1%).
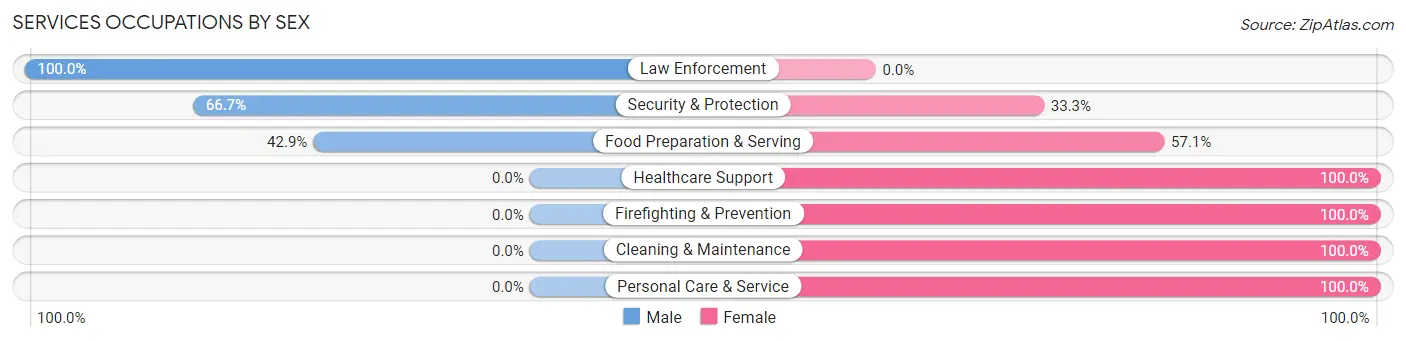
Services Occupations by Sex
Within the Services occupations in Petersburg borough, the most male-oriented occupations are Law Enforcement (100.0%), Security & Protection (66.7%), and Food Preparation & Serving (42.9%), while the most female-oriented occupations are Healthcare Support (100.0%), Firefighting & Prevention (100.0%), and Cleaning & Maintenance (100.0%).
| Occupation | Male | Female |
| Healthcare Support | 0 (0.0%) | 14 (100.0%) |
| Security & Protection | 2 (66.7%) | 1 (33.3%) |
| Firefighting & Prevention | 0 (0.0%) | 1 (100.0%) |
| Law Enforcement | 2 (100.0%) | 0 (0.0%) |
| Food Preparation & Serving | 3 (42.9%) | 4 (57.1%) |
| Cleaning & Maintenance | 0 (0.0%) | 1 (100.0%) |
| Personal Care & Service | 0 (0.0%) | 2 (100.0%) |
| Total (Category) | 5 (18.5%) | 22 (81.5%) |
| Total (Overall) | 85 (48.3%) | 91 (51.7%) |
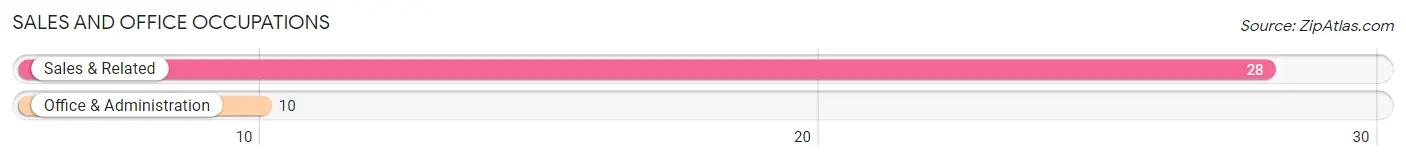
Sales and Office Occupations
The most common Sales and Office occupations in Petersburg borough are Sales & Related (28 | 15.9%), and Office & Administration (10 | 5.7%).
Sales and Office Occupations by Sex

| Occupation | Male | Female |
| Sales & Related | 8 (28.6%) | 20 (71.4%) |
| Office & Administration | 1 (10.0%) | 9 (90.0%) |
| Total (Category) | 9 (23.7%) | 29 (76.3%) |
| Total (Overall) | 85 (48.3%) | 91 (51.7%) |
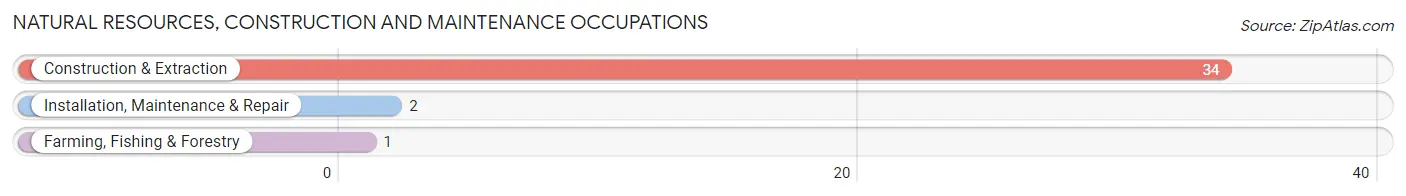
Natural Resources, Construction and Maintenance Occupations
The most common Natural Resources, Construction and Maintenance occupations in Petersburg borough are Construction & Extraction (34 | 19.3%), Installation, Maintenance & Repair (2 | 1.1%), and Farming, Fishing & Forestry (1 | 0.6%).
Natural Resources, Construction and Maintenance Occupations by Sex
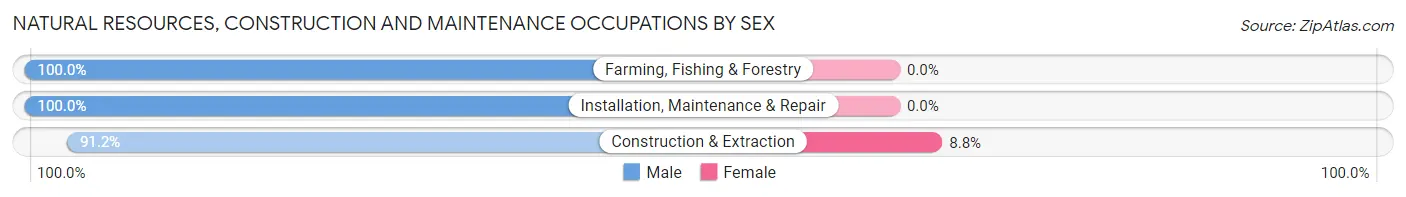
| Occupation | Male | Female |
| Farming, Fishing & Forestry | 1 (100.0%) | 0 (0.0%) |
| Construction & Extraction | 31 (91.2%) | 3 (8.8%) |
| Installation, Maintenance & Repair | 2 (100.0%) | 0 (0.0%) |
| Total (Category) | 34 (91.9%) | 3 (8.1%) |
| Total (Overall) | 85 (48.3%) | 91 (51.7%) |
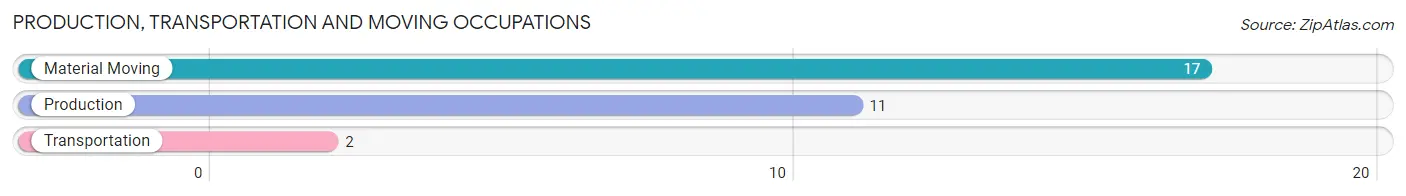
Production, Transportation and Moving Occupations
The most common Production, Transportation and Moving occupations in Petersburg borough are Material Moving (17 | 9.7%), Production (11 | 6.2%), and Transportation (2 | 1.1%).
Production, Transportation and Moving Occupations by Sex
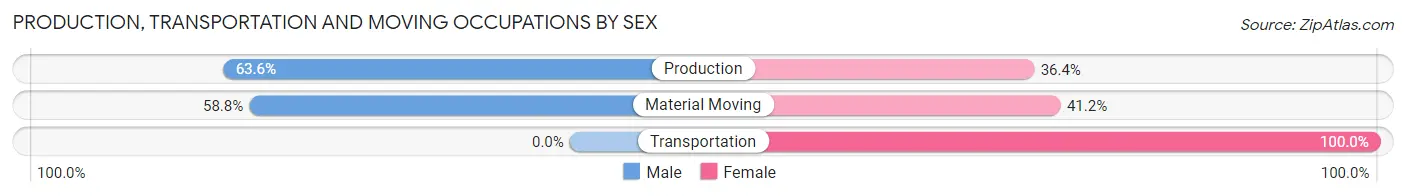
| Occupation | Male | Female |
| Production | 7 (63.6%) | 4 (36.4%) |
| Transportation | 0 (0.0%) | 2 (100.0%) |
| Material Moving | 10 (58.8%) | 7 (41.2%) |
| Total (Category) | 17 (56.7%) | 13 (43.3%) |
| Total (Overall) | 85 (48.3%) | 91 (51.7%) |
Employment Industries by Sex in Petersburg borough
Employment Industries in Petersburg borough
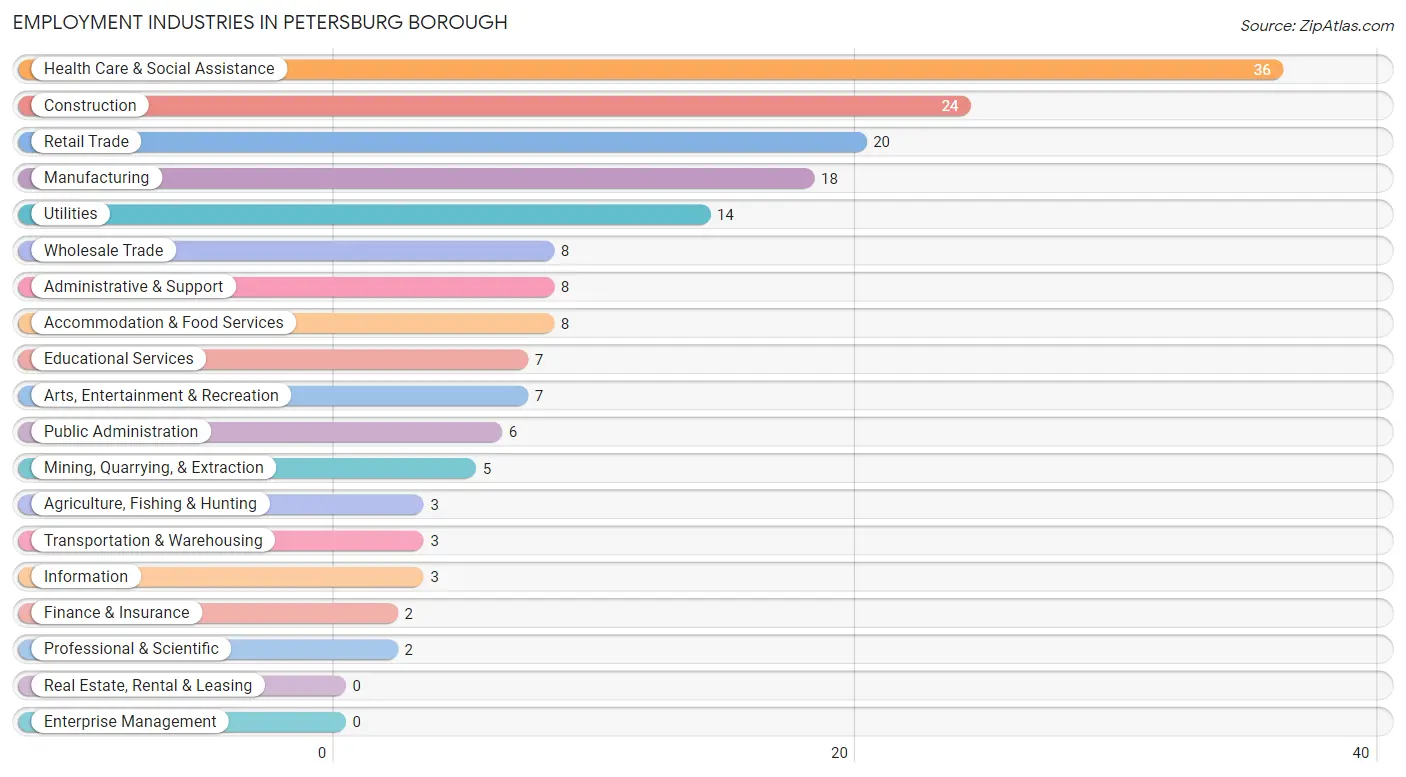
The major employment industries in Petersburg borough include Health Care & Social Assistance (36 | 20.4%), Construction (24 | 13.6%), Retail Trade (20 | 11.4%), Manufacturing (18 | 10.2%), and Utilities (14 | 8.0%).
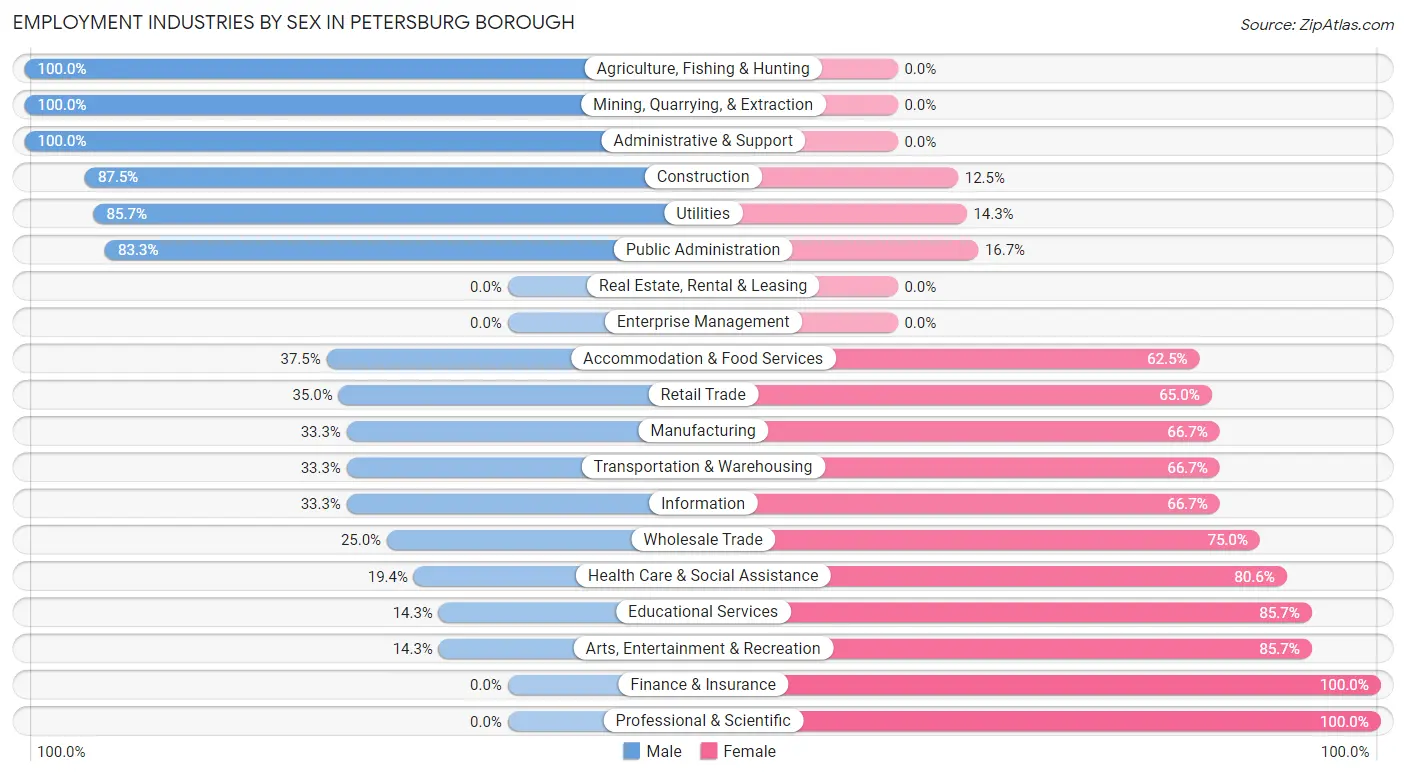
Employment Industries by Sex in Petersburg borough
The Petersburg borough industries that see more men than women are Agriculture, Fishing & Hunting (100.0%), Mining, Quarrying, & Extraction (100.0%), and Administrative & Support (100.0%), whereas the industries that tend to have a higher number of women are Finance & Insurance (100.0%), Professional & Scientific (100.0%), and Educational Services (85.7%).
| Industry | Male | Female |
| Agriculture, Fishing & Hunting | 3 (100.0%) | 0 (0.0%) |
| Mining, Quarrying, & Extraction | 5 (100.0%) | 0 (0.0%) |
| Construction | 21 (87.5%) | 3 (12.5%) |
| Manufacturing | 6 (33.3%) | 12 (66.7%) |
| Wholesale Trade | 2 (25.0%) | 6 (75.0%) |
| Retail Trade | 7 (35.0%) | 13 (65.0%) |
| Transportation & Warehousing | 1 (33.3%) | 2 (66.7%) |
| Utilities | 12 (85.7%) | 2 (14.3%) |
| Information | 1 (33.3%) | 2 (66.7%) |
| Finance & Insurance | 0 (0.0%) | 2 (100.0%) |
| Real Estate, Rental & Leasing | 0 (0.0%) | 0 (0.0%) |
| Professional & Scientific | 0 (0.0%) | 2 (100.0%) |
| Enterprise Management | 0 (0.0%) | 0 (0.0%) |
| Administrative & Support | 8 (100.0%) | 0 (0.0%) |
| Educational Services | 1 (14.3%) | 6 (85.7%) |
| Health Care & Social Assistance | 7 (19.4%) | 29 (80.6%) |
| Arts, Entertainment & Recreation | 1 (14.3%) | 6 (85.7%) |
| Accommodation & Food Services | 3 (37.5%) | 5 (62.5%) |
| Public Administration | 5 (83.3%) | 1 (16.7%) |
| Total | 85 (48.3%) | 91 (51.7%) |
Education in Petersburg borough
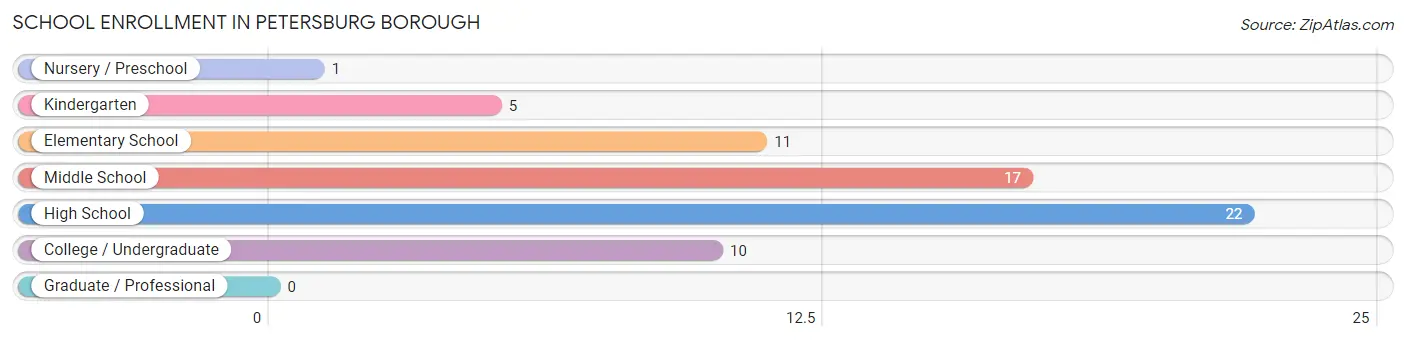
School Enrollment in Petersburg borough
The most common levels of schooling among the 66 students in Petersburg borough are high school (22 | 33.3%), middle school (17 | 25.8%), and elementary school (11 | 16.7%).
| School Level | # Students | % Students |
| Nursery / Preschool | 1 | 1.5% |
| Kindergarten | 5 | 7.6% |
| Elementary School | 11 | 16.7% |
| Middle School | 17 | 25.8% |
| High School | 22 | 33.3% |
| College / Undergraduate | 10 | 15.1% |
| Graduate / Professional | 0 | 0.0% |
| Total | 66 | 100.0% |
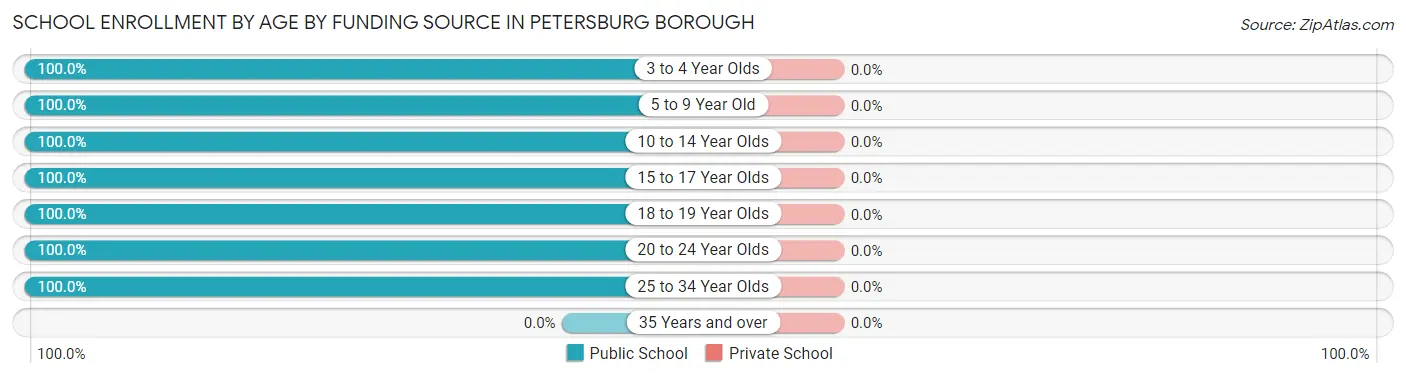
School Enrollment by Age by Funding Source in Petersburg borough
| Age Bracket | Public School | Private School |
| 3 to 4 Year Olds | 1 (100.0%) | 0 (0.0%) |
| 5 to 9 Year Old | 15 (100.0%) | 0 (0.0%) |
| 10 to 14 Year Olds | 19 (100.0%) | 0 (0.0%) |
| 15 to 17 Year Olds | 19 (100.0%) | 0 (0.0%) |
| 18 to 19 Year Olds | 2 (100.0%) | 0 (0.0%) |
| 20 to 24 Year Olds | 2 (100.0%) | 0 (0.0%) |
| 25 to 34 Year Olds | 8 (100.0%) | 0 (0.0%) |
| 35 Years and over | 0 (0.0%) | 0 (0.0%) |
| Total | 66 (100.0%) | 0 (0.0%) |
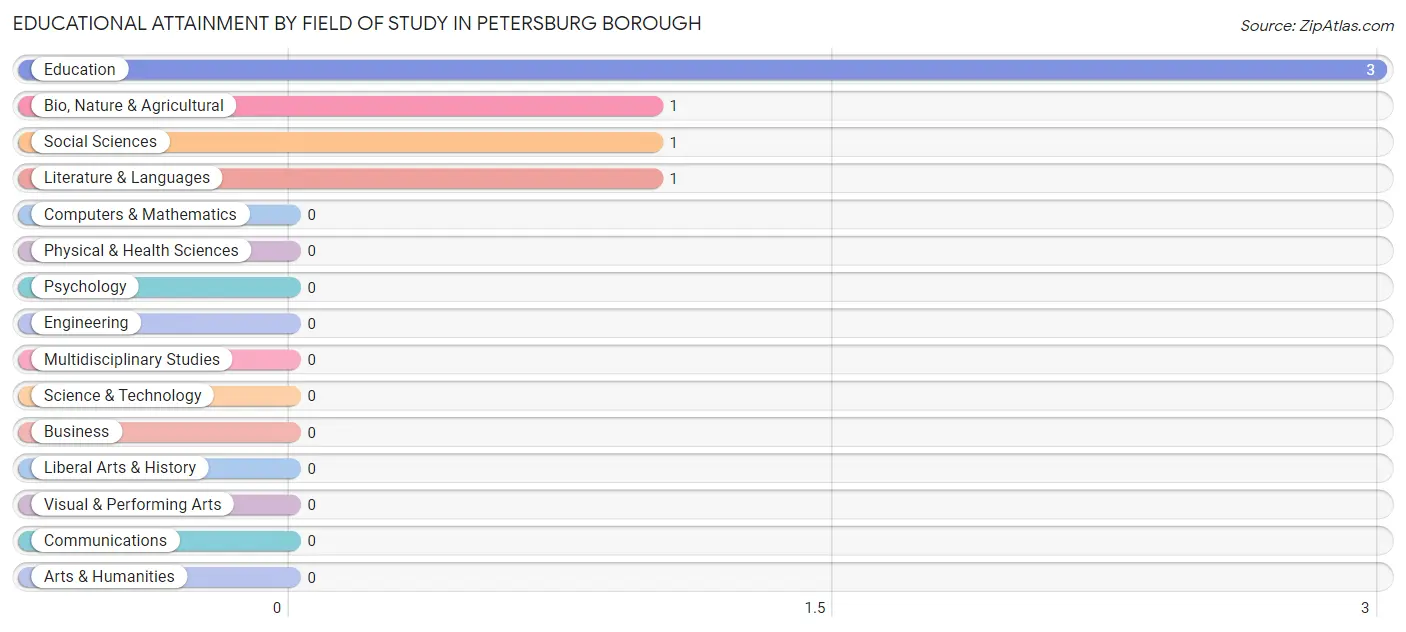
Educational Attainment by Field of Study in Petersburg borough
Education (3 | 50.0%), bio, nature & agricultural (1 | 16.7%), social sciences (1 | 16.7%), and literature & languages (1 | 16.7%) are the most common fields of study among 6 individuals in Petersburg borough who have obtained a bachelor's degree or higher.
| Field of Study | # Graduates | % Graduates |
| Computers & Mathematics | 0 | 0.0% |
| Bio, Nature & Agricultural | 1 | 16.7% |
| Physical & Health Sciences | 0 | 0.0% |
| Psychology | 0 | 0.0% |
| Social Sciences | 1 | 16.7% |
| Engineering | 0 | 0.0% |
| Multidisciplinary Studies | 0 | 0.0% |
| Science & Technology | 0 | 0.0% |
| Business | 0 | 0.0% |
| Education | 3 | 50.0% |
| Literature & Languages | 1 | 16.7% |
| Liberal Arts & History | 0 | 0.0% |
| Visual & Performing Arts | 0 | 0.0% |
| Communications | 0 | 0.0% |
| Arts & Humanities | 0 | 0.0% |
| Total | 6 | 100.0% |
Transportation & Commute in Petersburg borough
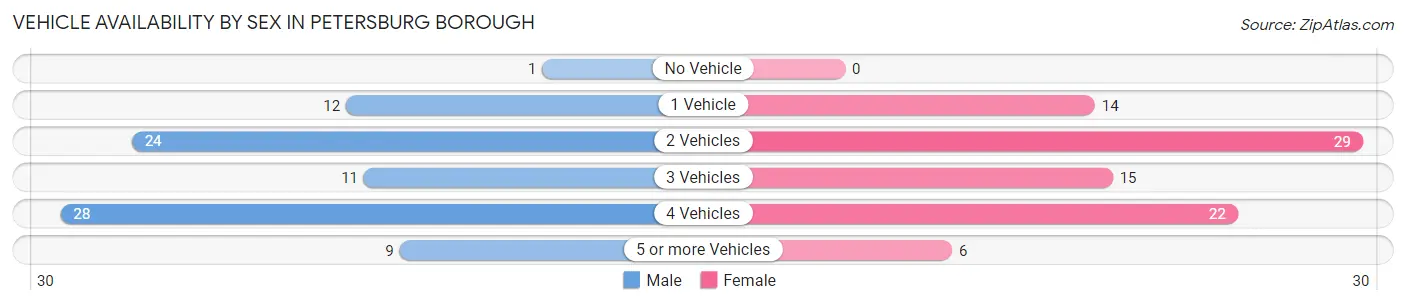
Vehicle Availability by Sex in Petersburg borough
The most prevalent vehicle ownership categories in Petersburg borough are males with 4 vehicles (28, accounting for 32.9%) and females with 4 vehicles (22, making up 32.6%).
| Vehicles Available | Male | Female |
| No Vehicle | 1 (1.2%) | 0 (0.0%) |
| 1 Vehicle | 12 (14.1%) | 14 (16.3%) |
| 2 Vehicles | 24 (28.2%) | 29 (33.7%) |
| 3 Vehicles | 11 (12.9%) | 15 (17.4%) |
| 4 Vehicles | 28 (32.9%) | 22 (25.6%) |
| 5 or more Vehicles | 9 (10.6%) | 6 (7.0%) |
| Total | 85 (100.0%) | 86 (100.0%) |
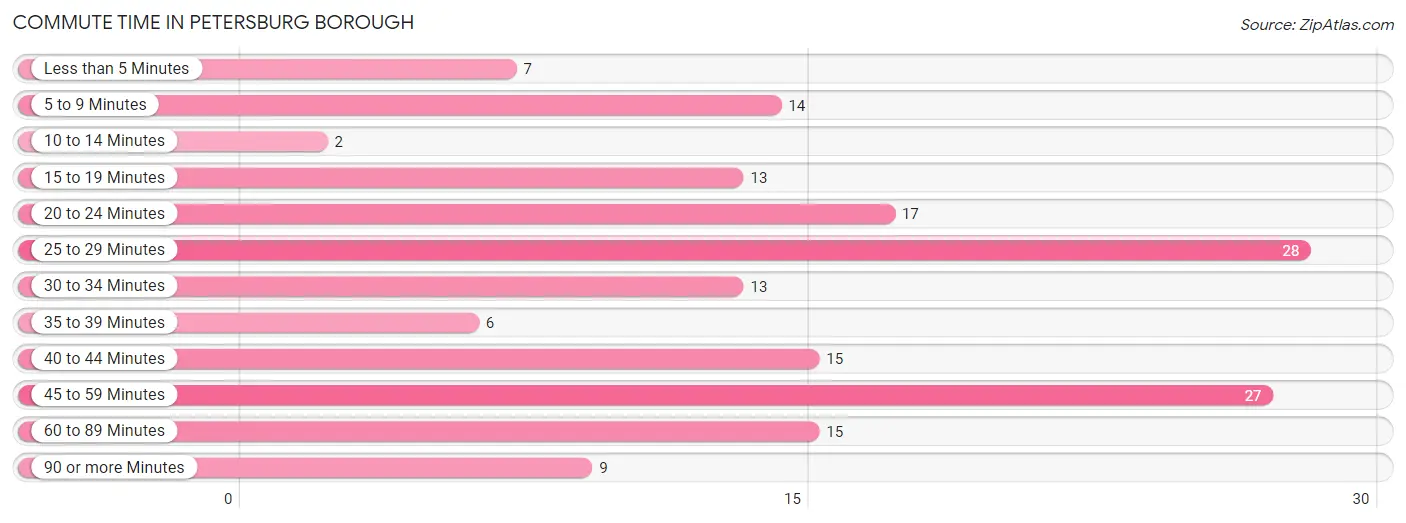
Commute Time in Petersburg borough
The most frequently occuring commute durations in Petersburg borough are 25 to 29 minutes (28 commuters, 16.9%), 45 to 59 minutes (27 commuters, 16.3%), and 20 to 24 minutes (17 commuters, 10.2%).
| Commute Time | # Commuters | % Commuters |
| Less than 5 Minutes | 7 | 4.2% |
| 5 to 9 Minutes | 14 | 8.4% |
| 10 to 14 Minutes | 2 | 1.2% |
| 15 to 19 Minutes | 13 | 7.8% |
| 20 to 24 Minutes | 17 | 10.2% |
| 25 to 29 Minutes | 28 | 16.9% |
| 30 to 34 Minutes | 13 | 7.8% |
| 35 to 39 Minutes | 6 | 3.6% |
| 40 to 44 Minutes | 15 | 9.0% |
| 45 to 59 Minutes | 27 | 16.3% |
| 60 to 89 Minutes | 15 | 9.0% |
| 90 or more Minutes | 9 | 5.4% |
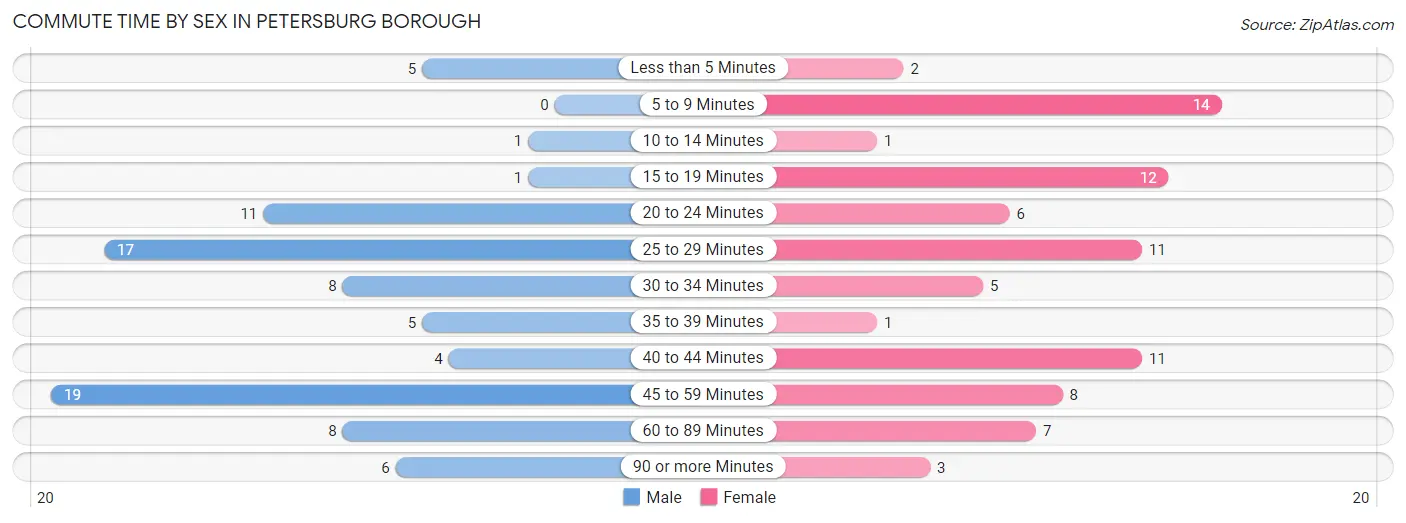
Commute Time by Sex in Petersburg borough
The most common commute times in Petersburg borough are 45 to 59 minutes (19 commuters, 22.4%) for males and 5 to 9 minutes (14 commuters, 17.3%) for females.
| Commute Time | Male | Female |
| Less than 5 Minutes | 5 (5.9%) | 2 (2.5%) |
| 5 to 9 Minutes | 0 (0.0%) | 14 (17.3%) |
| 10 to 14 Minutes | 1 (1.2%) | 1 (1.2%) |
| 15 to 19 Minutes | 1 (1.2%) | 12 (14.8%) |
| 20 to 24 Minutes | 11 (12.9%) | 6 (7.4%) |
| 25 to 29 Minutes | 17 (20.0%) | 11 (13.6%) |
| 30 to 34 Minutes | 8 (9.4%) | 5 (6.2%) |
| 35 to 39 Minutes | 5 (5.9%) | 1 (1.2%) |
| 40 to 44 Minutes | 4 (4.7%) | 11 (13.6%) |
| 45 to 59 Minutes | 19 (22.4%) | 8 (9.9%) |
| 60 to 89 Minutes | 8 (9.4%) | 7 (8.6%) |
| 90 or more Minutes | 6 (7.1%) | 3 (3.7%) |
Time of Departure to Work by Sex in Petersburg borough
The most frequent times of departure to work in Petersburg borough are 6:00 AM to 6:29 AM (22, 25.9%) for males and 6:30 AM to 6:59 AM (21, 25.9%) for females.
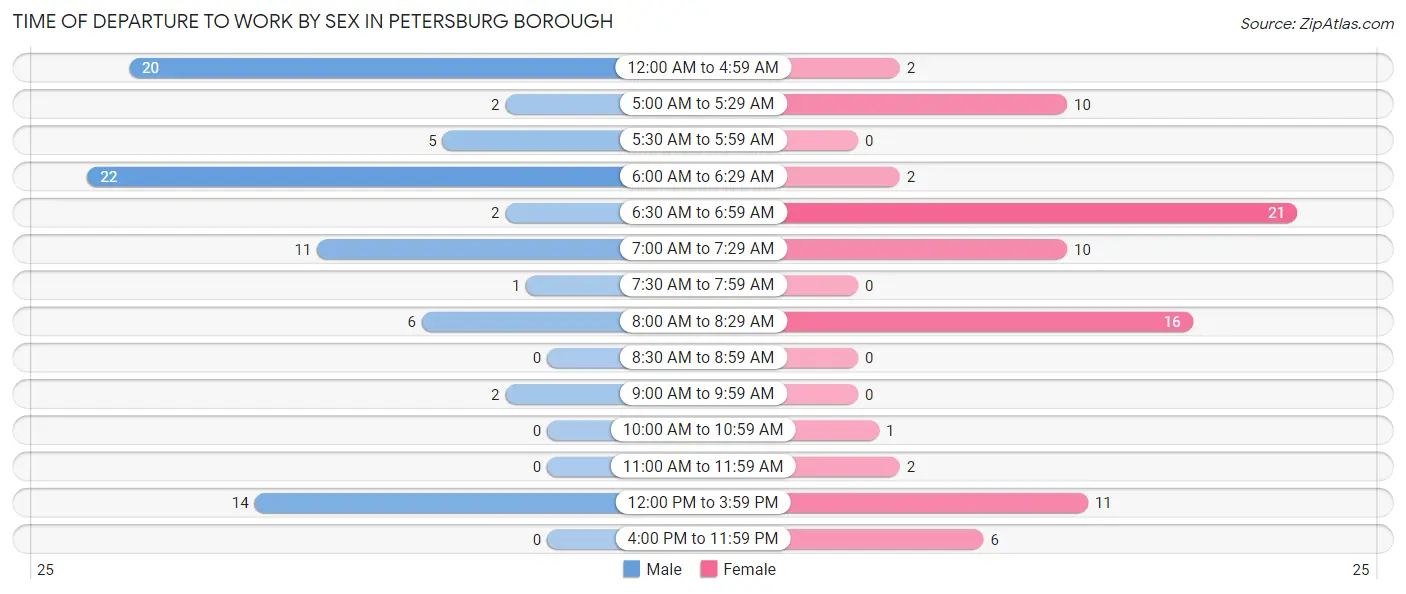
| Time of Departure | Male | Female |
| 12:00 AM to 4:59 AM | 20 (23.5%) | 2 (2.5%) |
| 5:00 AM to 5:29 AM | 2 (2.4%) | 10 (12.3%) |
| 5:30 AM to 5:59 AM | 5 (5.9%) | 0 (0.0%) |
| 6:00 AM to 6:29 AM | 22 (25.9%) | 2 (2.5%) |
| 6:30 AM to 6:59 AM | 2 (2.4%) | 21 (25.9%) |
| 7:00 AM to 7:29 AM | 11 (12.9%) | 10 (12.3%) |
| 7:30 AM to 7:59 AM | 1 (1.2%) | 0 (0.0%) |
| 8:00 AM to 8:29 AM | 6 (7.1%) | 16 (19.8%) |
| 8:30 AM to 8:59 AM | 0 (0.0%) | 0 (0.0%) |
| 9:00 AM to 9:59 AM | 2 (2.4%) | 0 (0.0%) |
| 10:00 AM to 10:59 AM | 0 (0.0%) | 1 (1.2%) |
| 11:00 AM to 11:59 AM | 0 (0.0%) | 2 (2.5%) |
| 12:00 PM to 3:59 PM | 14 (16.5%) | 11 (13.6%) |
| 4:00 PM to 11:59 PM | 0 (0.0%) | 6 (7.4%) |
| Total | 85 (100.0%) | 81 (100.0%) |
Housing Occupancy in Petersburg borough
Occupancy by Ownership in Petersburg borough
Of the total 147 dwellings in Petersburg borough, owner-occupied units account for 101 (68.7%), while renter-occupied units make up 46 (31.3%).
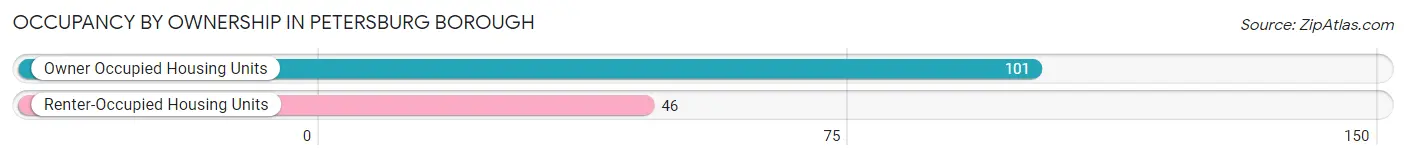
| Occupancy | # Housing Units | % Housing Units |
| Owner Occupied Housing Units | 101 | 68.7% |
| Renter-Occupied Housing Units | 46 | 31.3% |
| Total Occupied Housing Units | 147 | 100.0% |
Occupancy by Household Size in Petersburg borough
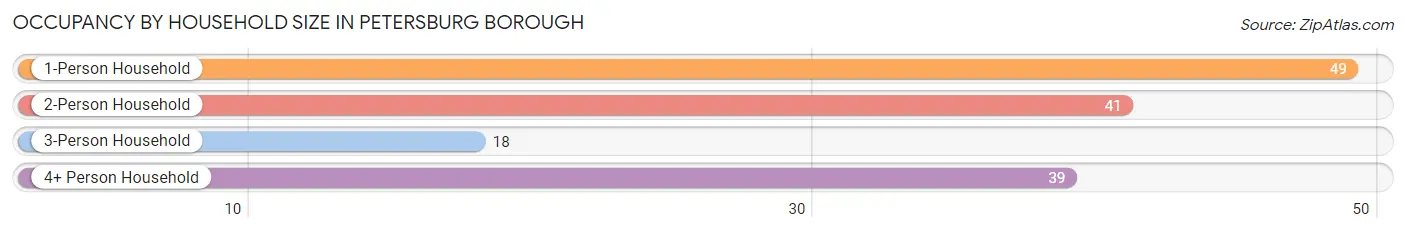
| Household Size | # Housing Units | % Housing Units |
| 1-Person Household | 49 | 33.3% |
| 2-Person Household | 41 | 27.9% |
| 3-Person Household | 18 | 12.2% |
| 4+ Person Household | 39 | 26.5% |
| Total Housing Units | 147 | 100.0% |
Occupancy by Ownership by Household Size in Petersburg borough
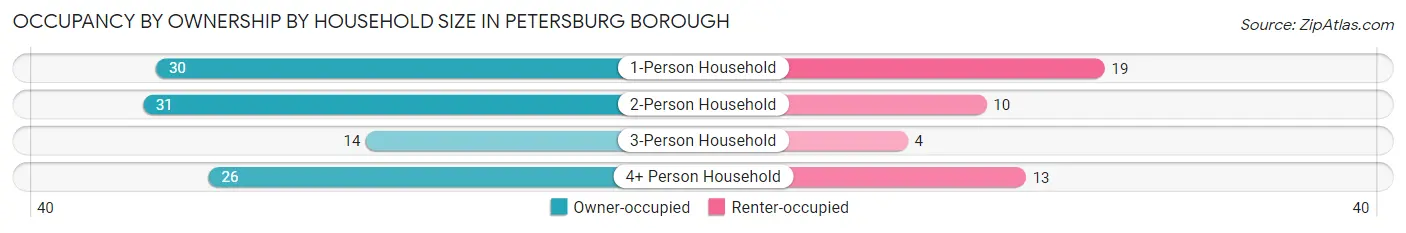
| Household Size | Owner-occupied | Renter-occupied |
| 1-Person Household | 30 (61.2%) | 19 (38.8%) |
| 2-Person Household | 31 (75.6%) | 10 (24.4%) |
| 3-Person Household | 14 (77.8%) | 4 (22.2%) |
| 4+ Person Household | 26 (66.7%) | 13 (33.3%) |
| Total Housing Units | 101 (68.7%) | 46 (31.3%) |
Occupancy by Educational Attainment in Petersburg borough
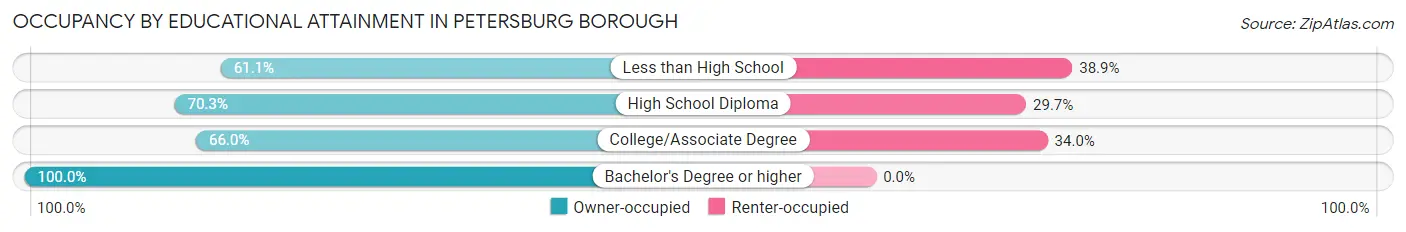
| Household Size | Owner-occupied | Renter-occupied |
| Less than High School | 11 (61.1%) | 7 (38.9%) |
| High School Diploma | 52 (70.3%) | 22 (29.7%) |
| College/Associate Degree | 33 (66.0%) | 17 (34.0%) |
| Bachelor's Degree or higher | 5 (100.0%) | 0 (0.0%) |
Occupancy by Age of Householder in Petersburg borough
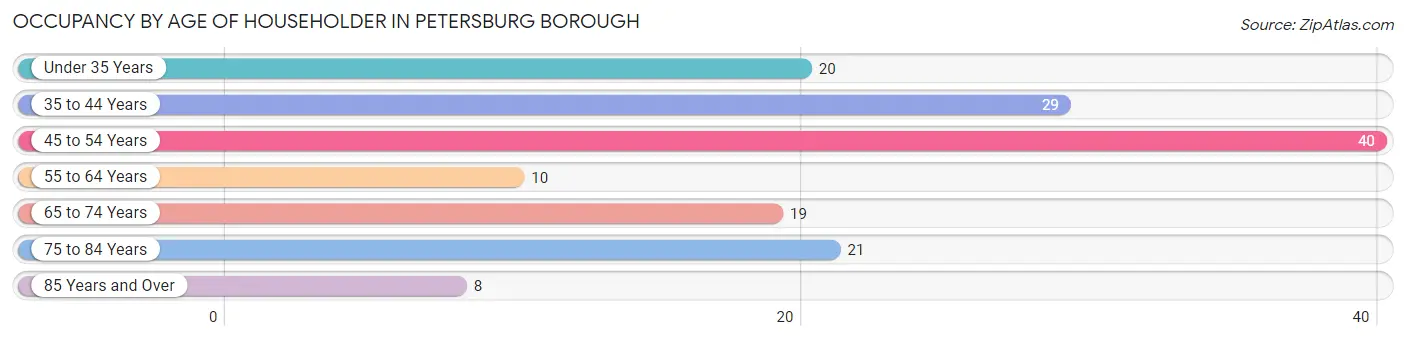
| Age Bracket | # Households | % Households |
| Under 35 Years | 20 | 13.6% |
| 35 to 44 Years | 29 | 19.7% |
| 45 to 54 Years | 40 | 27.2% |
| 55 to 64 Years | 10 | 6.8% |
| 65 to 74 Years | 19 | 12.9% |
| 75 to 84 Years | 21 | 14.3% |
| 85 Years and Over | 8 | 5.4% |
| Total | 147 | 100.0% |
Housing Finances in Petersburg borough
Median Income by Occupancy in Petersburg borough
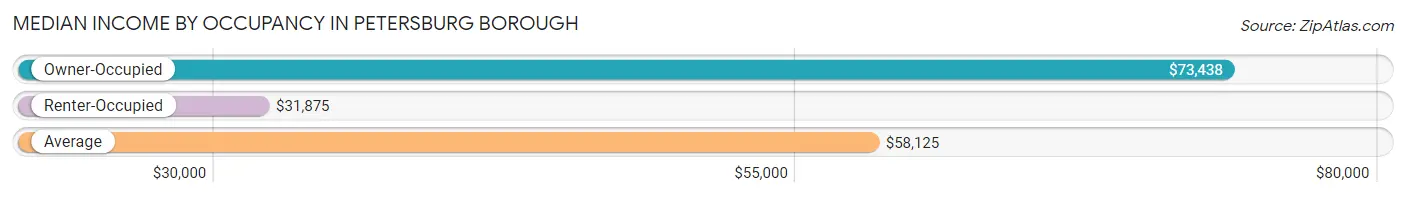
| Occupancy Type | # Households | Median Income |
| Owner-Occupied | 101 (68.7%) | $73,438 |
| Renter-Occupied | 46 (31.3%) | $31,875 |
| Average | 147 (100.0%) | $58,125 |
Occupancy by Householder Income Bracket in Petersburg borough
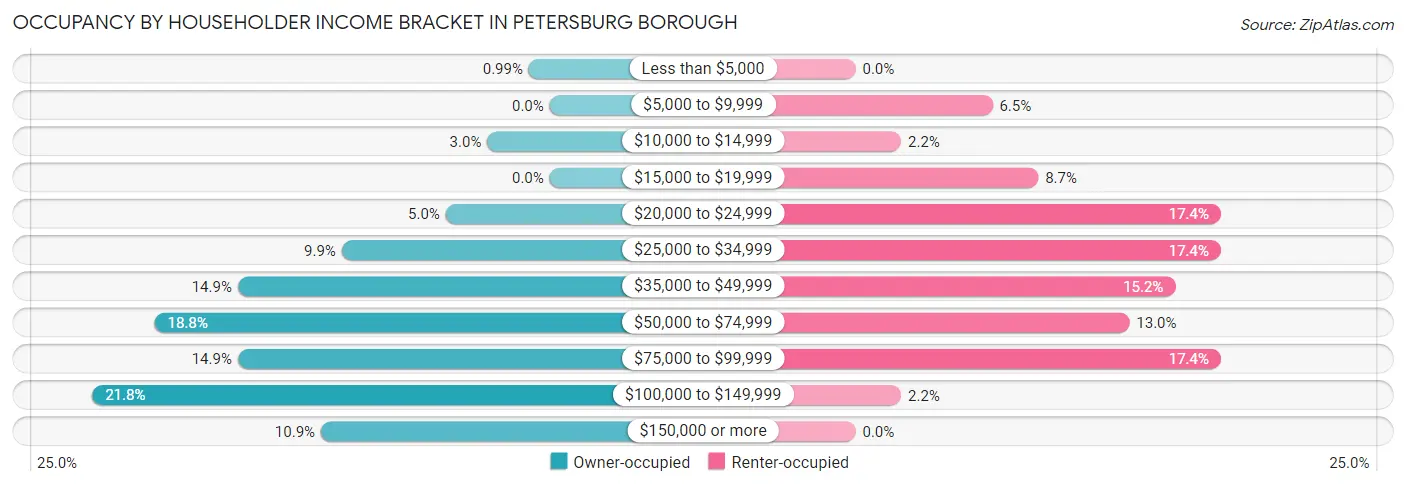
| Income Bracket | Owner-occupied | Renter-occupied |
| Less than $5,000 | 1 (1.0%) | 0 (0.0%) |
| $5,000 to $9,999 | 0 (0.0%) | 3 (6.5%) |
| $10,000 to $14,999 | 3 (3.0%) | 1 (2.2%) |
| $15,000 to $19,999 | 0 (0.0%) | 4 (8.7%) |
| $20,000 to $24,999 | 5 (5.0%) | 8 (17.4%) |
| $25,000 to $34,999 | 10 (9.9%) | 8 (17.4%) |
| $35,000 to $49,999 | 15 (14.8%) | 7 (15.2%) |
| $50,000 to $74,999 | 19 (18.8%) | 6 (13.0%) |
| $75,000 to $99,999 | 15 (14.8%) | 8 (17.4%) |
| $100,000 to $149,999 | 22 (21.8%) | 1 (2.2%) |
| $150,000 or more | 11 (10.9%) | 0 (0.0%) |
| Total | 101 (100.0%) | 46 (100.0%) |
Monthly Housing Cost Tiers in Petersburg borough
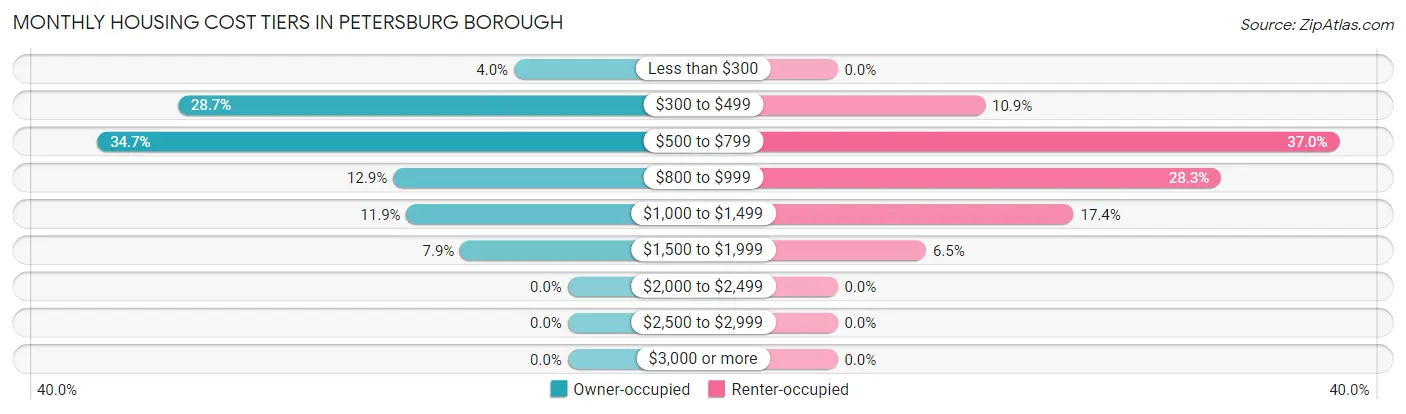
| Monthly Cost | Owner-occupied | Renter-occupied |
| Less than $300 | 4 (4.0%) | 0 (0.0%) |
| $300 to $499 | 29 (28.7%) | 5 (10.9%) |
| $500 to $799 | 35 (34.6%) | 17 (37.0%) |
| $800 to $999 | 13 (12.9%) | 13 (28.3%) |
| $1,000 to $1,499 | 12 (11.9%) | 8 (17.4%) |
| $1,500 to $1,999 | 8 (7.9%) | 3 (6.5%) |
| $2,000 to $2,499 | 0 (0.0%) | 0 (0.0%) |
| $2,500 to $2,999 | 0 (0.0%) | 0 (0.0%) |
| $3,000 or more | 0 (0.0%) | 0 (0.0%) |
| Total | 101 (100.0%) | 46 (100.0%) |
Physical Housing Characteristics in Petersburg borough
Housing Structures in Petersburg borough
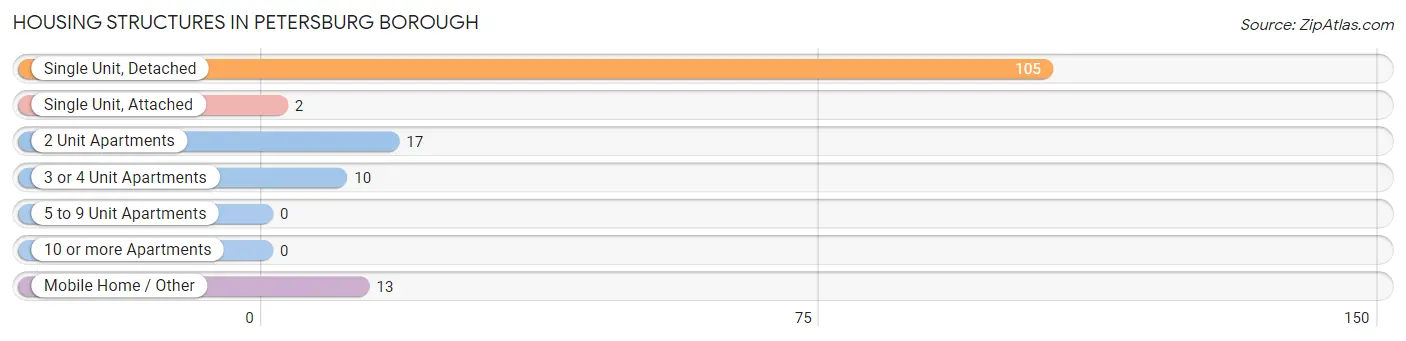
| Structure Type | # Housing Units | % Housing Units |
| Single Unit, Detached | 105 | 71.4% |
| Single Unit, Attached | 2 | 1.4% |
| 2 Unit Apartments | 17 | 11.6% |
| 3 or 4 Unit Apartments | 10 | 6.8% |
| 5 to 9 Unit Apartments | 0 | 0.0% |
| 10 or more Apartments | 0 | 0.0% |
| Mobile Home / Other | 13 | 8.8% |
| Total | 147 | 100.0% |
Housing Structures by Occupancy in Petersburg borough
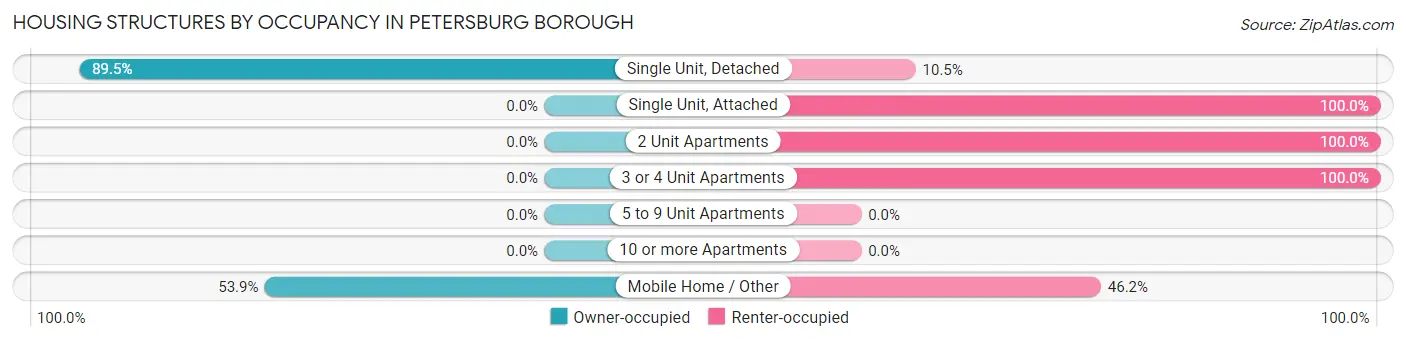
| Structure Type | Owner-occupied | Renter-occupied |
| Single Unit, Detached | 94 (89.5%) | 11 (10.5%) |
| Single Unit, Attached | 0 (0.0%) | 2 (100.0%) |
| 2 Unit Apartments | 0 (0.0%) | 17 (100.0%) |
| 3 or 4 Unit Apartments | 0 (0.0%) | 10 (100.0%) |
| 5 to 9 Unit Apartments | 0 (0.0%) | 0 (0.0%) |
| 10 or more Apartments | 0 (0.0%) | 0 (0.0%) |
| Mobile Home / Other | 7 (53.8%) | 6 (46.2%) |
| Total | 101 (68.7%) | 46 (31.3%) |
Housing Structures by Number of Rooms in Petersburg borough
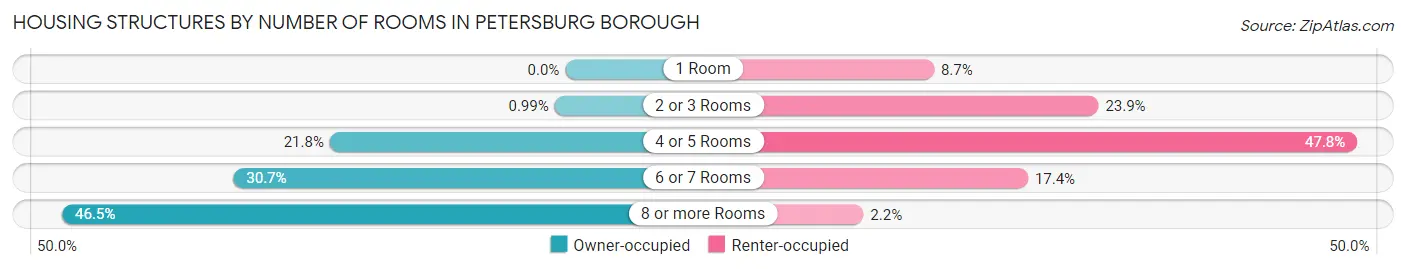
| Number of Rooms | Owner-occupied | Renter-occupied |
| 1 Room | 0 (0.0%) | 4 (8.7%) |
| 2 or 3 Rooms | 1 (1.0%) | 11 (23.9%) |
| 4 or 5 Rooms | 22 (21.8%) | 22 (47.8%) |
| 6 or 7 Rooms | 31 (30.7%) | 8 (17.4%) |
| 8 or more Rooms | 47 (46.5%) | 1 (2.2%) |
| Total | 101 (100.0%) | 46 (100.0%) |
Housing Structure by Heating Type in Petersburg borough
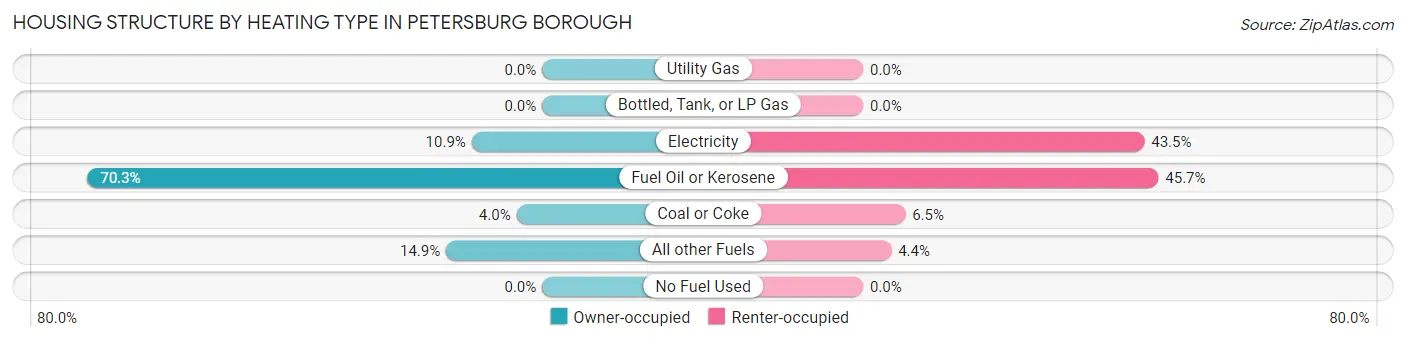
| Heating Type | Owner-occupied | Renter-occupied |
| Utility Gas | 0 (0.0%) | 0 (0.0%) |
| Bottled, Tank, or LP Gas | 0 (0.0%) | 0 (0.0%) |
| Electricity | 11 (10.9%) | 20 (43.5%) |
| Fuel Oil or Kerosene | 71 (70.3%) | 21 (45.7%) |
| Coal or Coke | 4 (4.0%) | 3 (6.5%) |
| All other Fuels | 15 (14.8%) | 2 (4.3%) |
| No Fuel Used | 0 (0.0%) | 0 (0.0%) |
| Total | 101 (100.0%) | 46 (100.0%) |
Household Vehicle Usage in Petersburg borough
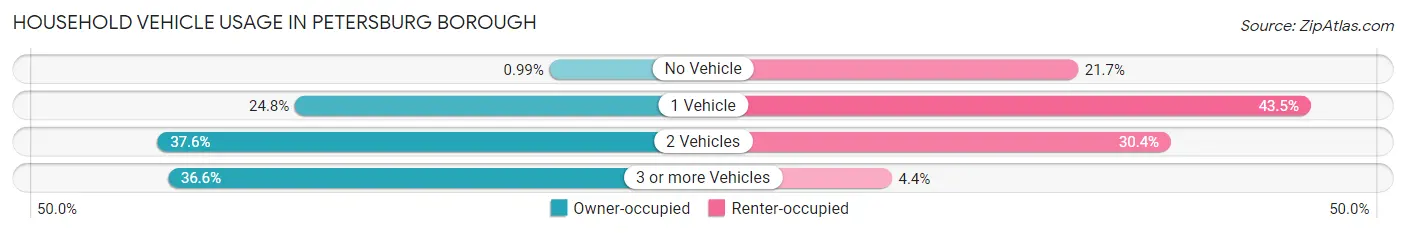
| Vehicles per Household | Owner-occupied | Renter-occupied |
| No Vehicle | 1 (1.0%) | 10 (21.7%) |
| 1 Vehicle | 25 (24.7%) | 20 (43.5%) |
| 2 Vehicles | 38 (37.6%) | 14 (30.4%) |
| 3 or more Vehicles | 37 (36.6%) | 2 (4.3%) |
| Total | 101 (100.0%) | 46 (100.0%) |
Real Estate & Mortgages in Petersburg borough
Real Estate and Mortgage Overview in Petersburg borough
| Characteristic | Without Mortgage | With Mortgage |
| Housing Units | 70 | 31 |
| Median Property Value | $95,000 | $110,400 |
| Median Household Income | $57,500 | $3 |
| Monthly Housing Costs | $527 | $0 |
| Real Estate Taxes | $875 | $3 |
Property Value by Mortgage Status in Petersburg borough
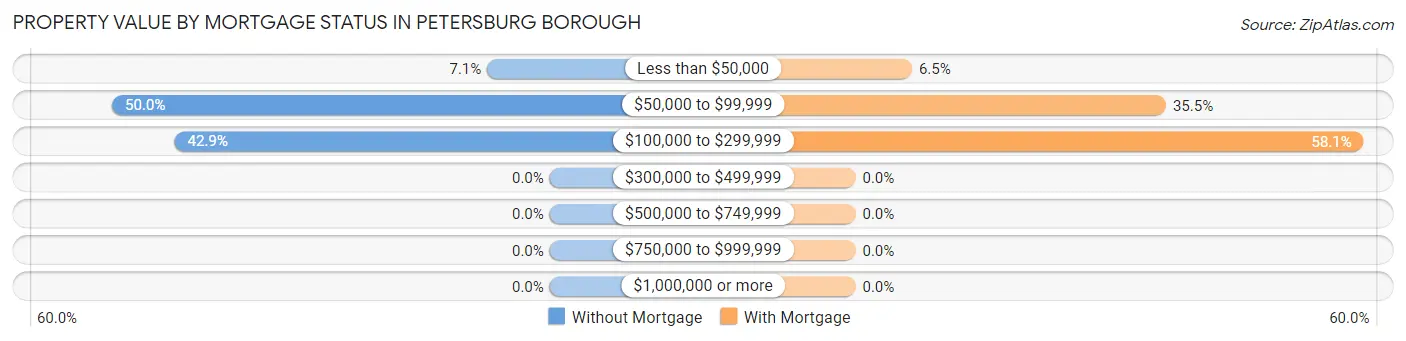
| Property Value | Without Mortgage | With Mortgage |
| Less than $50,000 | 5 (7.1%) | 2 (6.5%) |
| $50,000 to $99,999 | 35 (50.0%) | 11 (35.5%) |
| $100,000 to $299,999 | 30 (42.9%) | 18 (58.1%) |
| $300,000 to $499,999 | 0 (0.0%) | 0 (0.0%) |
| $500,000 to $749,999 | 0 (0.0%) | 0 (0.0%) |
| $750,000 to $999,999 | 0 (0.0%) | 0 (0.0%) |
| $1,000,000 or more | 0 (0.0%) | 0 (0.0%) |
| Total | 70 (100.0%) | 31 (100.0%) |
Household Income by Mortgage Status in Petersburg borough
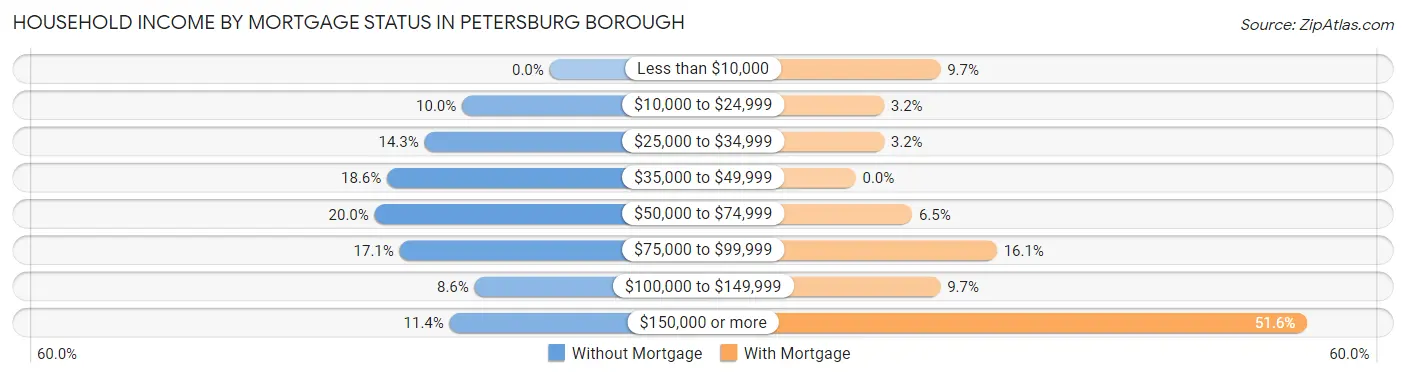
| Household Income | Without Mortgage | With Mortgage |
| Less than $10,000 | 0 (0.0%) | 3 (9.7%) |
| $10,000 to $24,999 | 7 (10.0%) | 1 (3.2%) |
| $25,000 to $34,999 | 10 (14.3%) | 1 (3.2%) |
| $35,000 to $49,999 | 13 (18.6%) | 0 (0.0%) |
| $50,000 to $74,999 | 14 (20.0%) | 2 (6.5%) |
| $75,000 to $99,999 | 12 (17.1%) | 5 (16.1%) |
| $100,000 to $149,999 | 6 (8.6%) | 3 (9.7%) |
| $150,000 or more | 8 (11.4%) | 16 (51.6%) |
| Total | 70 (100.0%) | 31 (100.0%) |
Property Value to Household Income Ratio in Petersburg borough
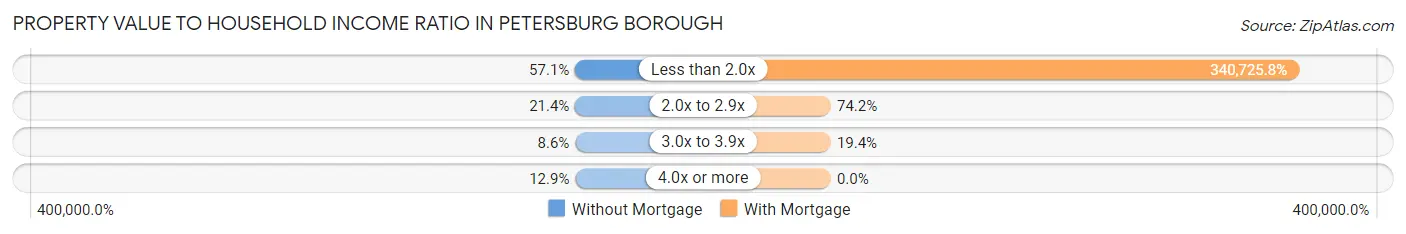
| Value-to-Income Ratio | Without Mortgage | With Mortgage |
| Less than 2.0x | 40 (57.1%) | 105,625 (340,725.8%) |
| 2.0x to 2.9x | 15 (21.4%) | 23 (74.2%) |
| 3.0x to 3.9x | 6 (8.6%) | 6 (19.4%) |
| 4.0x or more | 9 (12.9%) | 0 (0.0%) |
| Total | 70 (100.0%) | 31 (100.0%) |
Real Estate Taxes by Mortgage Status in Petersburg borough
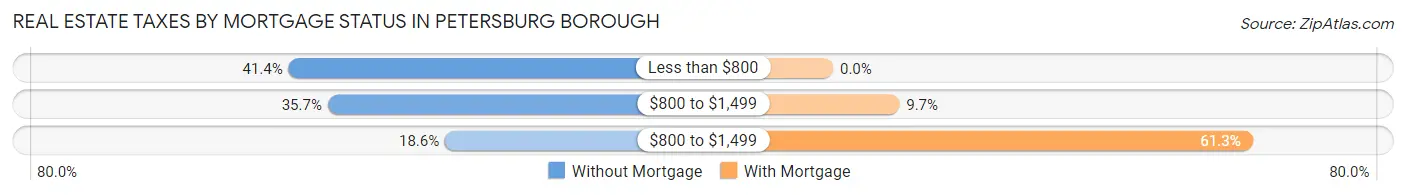
| Property Taxes | Without Mortgage | With Mortgage |
| Less than $800 | 29 (41.4%) | 0 (0.0%) |
| $800 to $1,499 | 25 (35.7%) | 3 (9.7%) |
| $800 to $1,499 | 13 (18.6%) | 19 (61.3%) |
| Total | 70 (100.0%) | 31 (100.0%) |
Health & Disability in Petersburg borough
Health Insurance Coverage by Age in Petersburg borough
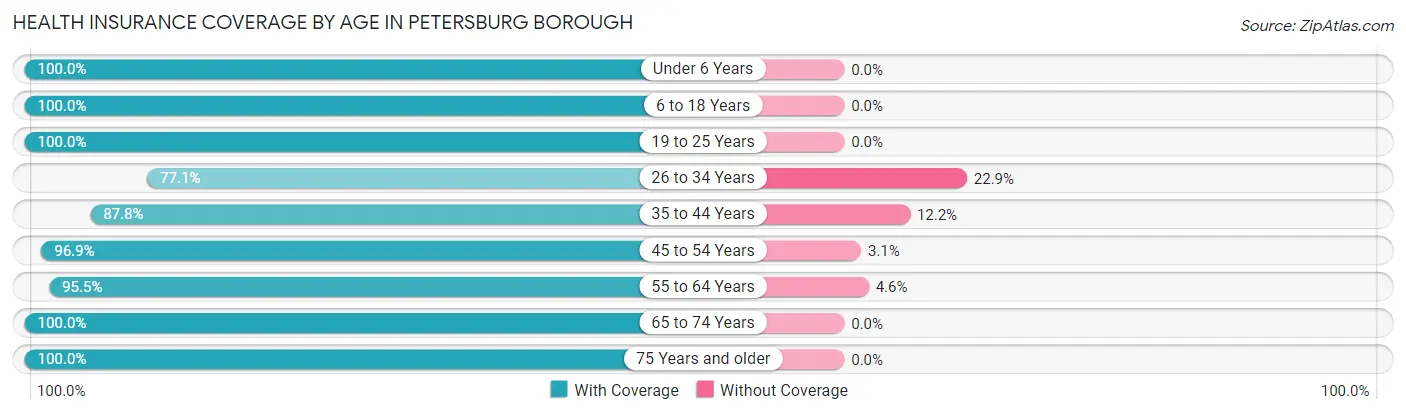
| Age Bracket | With Coverage | Without Coverage |
| Under 6 Years | 40 (100.0%) | 0 (0.0%) |
| 6 to 18 Years | 58 (100.0%) | 0 (0.0%) |
| 19 to 25 Years | 40 (100.0%) | 0 (0.0%) |
| 26 to 34 Years | 27 (77.1%) | 8 (22.9%) |
| 35 to 44 Years | 43 (87.8%) | 6 (12.2%) |
| 45 to 54 Years | 62 (96.9%) | 2 (3.1%) |
| 55 to 64 Years | 21 (95.5%) | 1 (4.5%) |
| 65 to 74 Years | 26 (100.0%) | 0 (0.0%) |
| 75 Years and older | 49 (100.0%) | 0 (0.0%) |
| Total | 366 (95.6%) | 17 (4.4%) |
Health Insurance Coverage by Citizenship Status in Petersburg borough
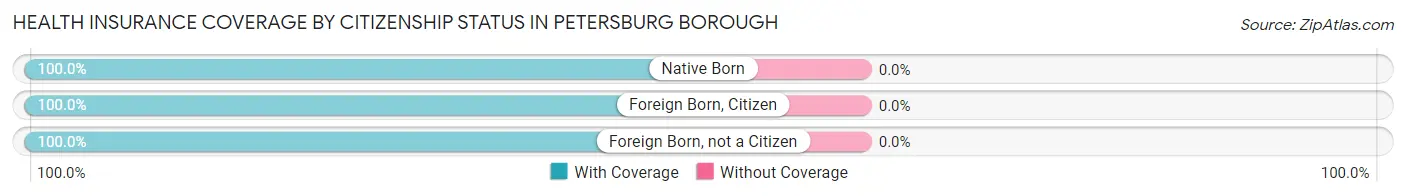
| Citizenship Status | With Coverage | Without Coverage |
| Native Born | 40 (100.0%) | 0 (0.0%) |
| Foreign Born, Citizen | 58 (100.0%) | 0 (0.0%) |
| Foreign Born, not a Citizen | 40 (100.0%) | 0 (0.0%) |
Health Insurance Coverage by Household Income in Petersburg borough
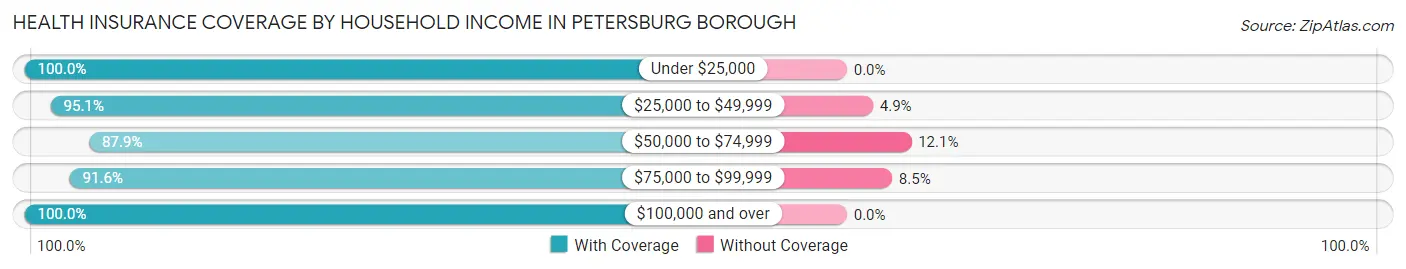
| Household Income | With Coverage | Without Coverage |
| Under $25,000 | 33 (100.0%) | 0 (0.0%) |
| $25,000 to $49,999 | 78 (95.1%) | 4 (4.9%) |
| $50,000 to $74,999 | 51 (87.9%) | 7 (12.1%) |
| $75,000 to $99,999 | 65 (91.5%) | 6 (8.5%) |
| $100,000 and over | 139 (100.0%) | 0 (0.0%) |
Public vs Private Health Insurance Coverage by Age in Petersburg borough
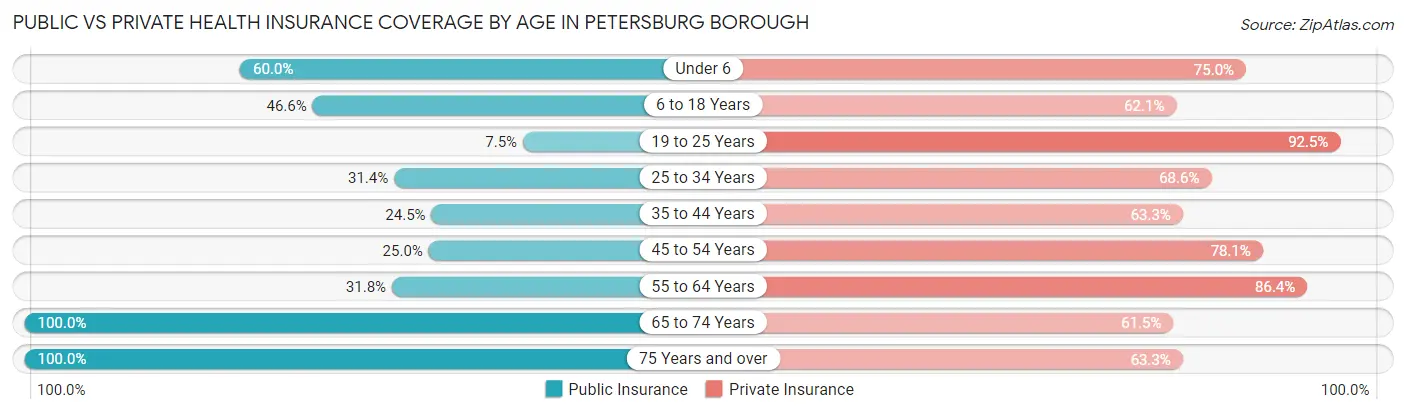
| Age Bracket | Public Insurance | Private Insurance |
| Under 6 | 24 (60.0%) | 30 (75.0%) |
| 6 to 18 Years | 27 (46.6%) | 36 (62.1%) |
| 19 to 25 Years | 3 (7.5%) | 37 (92.5%) |
| 25 to 34 Years | 11 (31.4%) | 24 (68.6%) |
| 35 to 44 Years | 12 (24.5%) | 31 (63.3%) |
| 45 to 54 Years | 16 (25.0%) | 50 (78.1%) |
| 55 to 64 Years | 7 (31.8%) | 19 (86.4%) |
| 65 to 74 Years | 26 (100.0%) | 16 (61.5%) |
| 75 Years and over | 49 (100.0%) | 31 (63.3%) |
| Total | 175 (45.7%) | 274 (71.5%) |
Disability Status by Sex by Age in Petersburg borough
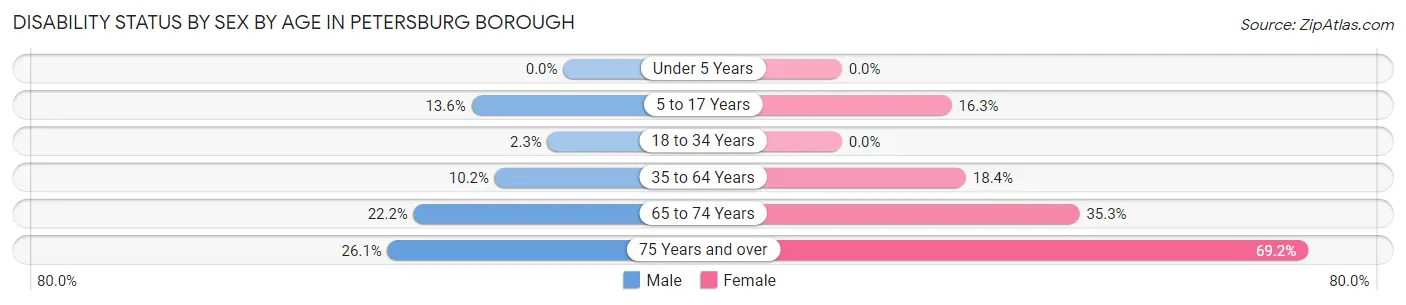
| Age Bracket | Male | Female |
| Under 5 Years | 0 (0.0%) | 0 (0.0%) |
| 5 to 17 Years | 3 (13.6%) | 7 (16.3%) |
| 18 to 34 Years | 1 (2.3%) | 0 (0.0%) |
| 35 to 64 Years | 6 (10.2%) | 14 (18.4%) |
| 65 to 74 Years | 2 (22.2%) | 6 (35.3%) |
| 75 Years and over | 6 (26.1%) | 18 (69.2%) |
Disability Class by Sex by Age in Petersburg borough
Disability Class: Hearing Difficulty
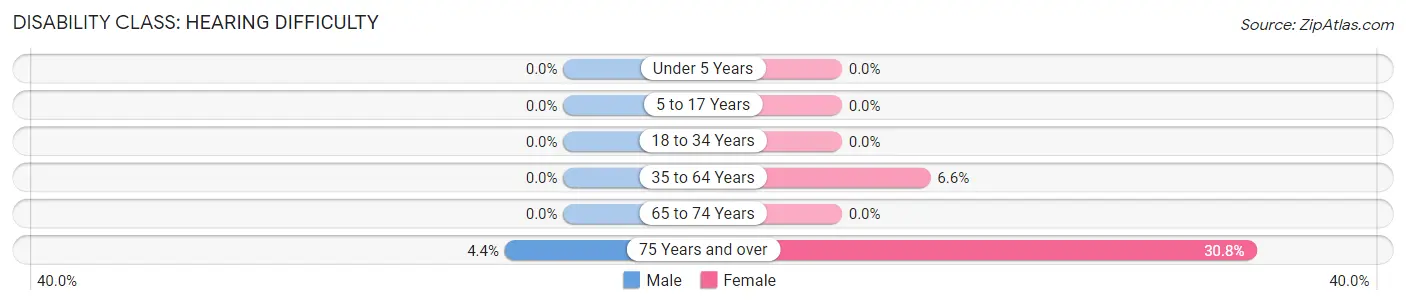
| Age Bracket | Male | Female |
| Under 5 Years | 0 (0.0%) | 0 (0.0%) |
| 5 to 17 Years | 0 (0.0%) | 0 (0.0%) |
| 18 to 34 Years | 0 (0.0%) | 0 (0.0%) |
| 35 to 64 Years | 0 (0.0%) | 5 (6.6%) |
| 65 to 74 Years | 0 (0.0%) | 0 (0.0%) |
| 75 Years and over | 1 (4.3%) | 8 (30.8%) |
Disability Class: Vision Difficulty
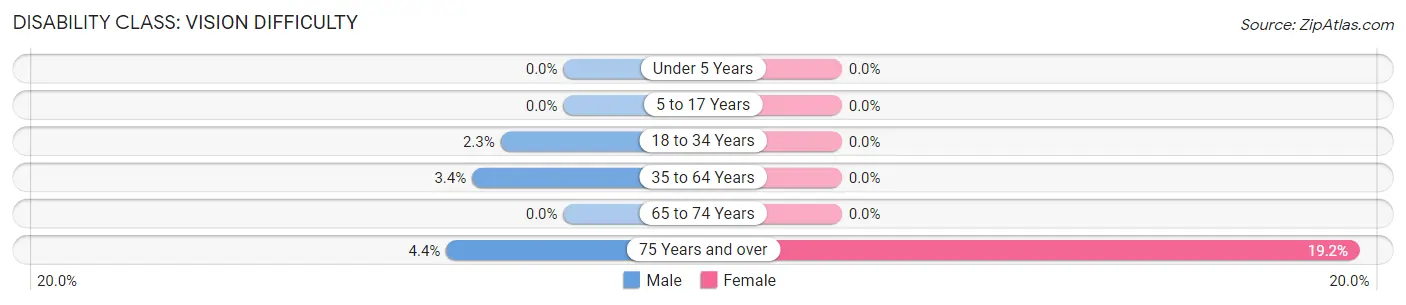
| Age Bracket | Male | Female |
| Under 5 Years | 0 (0.0%) | 0 (0.0%) |
| 5 to 17 Years | 0 (0.0%) | 0 (0.0%) |
| 18 to 34 Years | 1 (2.3%) | 0 (0.0%) |
| 35 to 64 Years | 2 (3.4%) | 0 (0.0%) |
| 65 to 74 Years | 0 (0.0%) | 0 (0.0%) |
| 75 Years and over | 1 (4.3%) | 5 (19.2%) |
Disability Class: Cognitive Difficulty
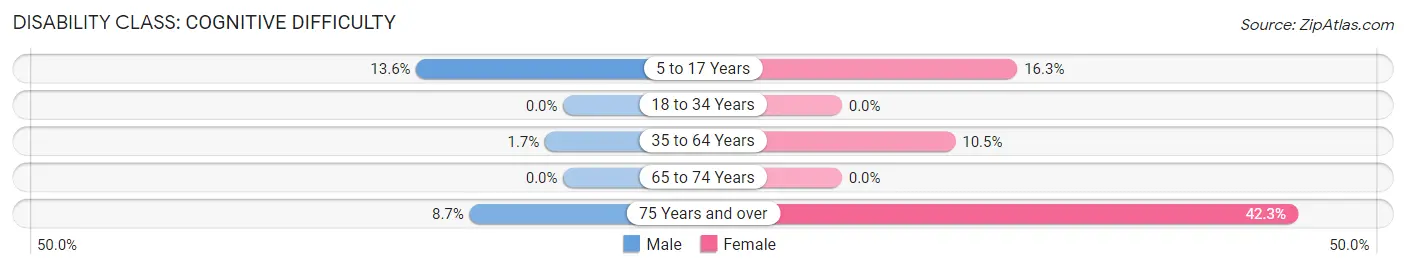
| Age Bracket | Male | Female |
| 5 to 17 Years | 3 (13.6%) | 7 (16.3%) |
| 18 to 34 Years | 0 (0.0%) | 0 (0.0%) |
| 35 to 64 Years | 1 (1.7%) | 8 (10.5%) |
| 65 to 74 Years | 0 (0.0%) | 0 (0.0%) |
| 75 Years and over | 2 (8.7%) | 11 (42.3%) |
Disability Class: Ambulatory Difficulty
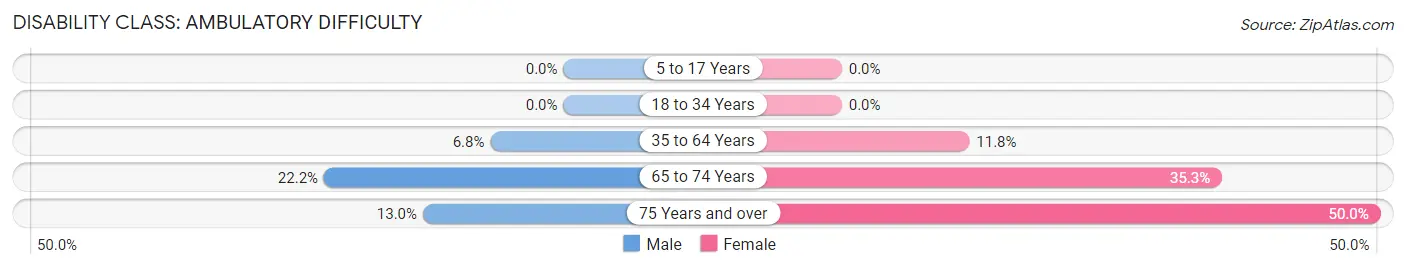
| Age Bracket | Male | Female |
| 5 to 17 Years | 0 (0.0%) | 0 (0.0%) |
| 18 to 34 Years | 0 (0.0%) | 0 (0.0%) |
| 35 to 64 Years | 4 (6.8%) | 9 (11.8%) |
| 65 to 74 Years | 2 (22.2%) | 6 (35.3%) |
| 75 Years and over | 3 (13.0%) | 13 (50.0%) |
Disability Class: Self-Care Difficulty
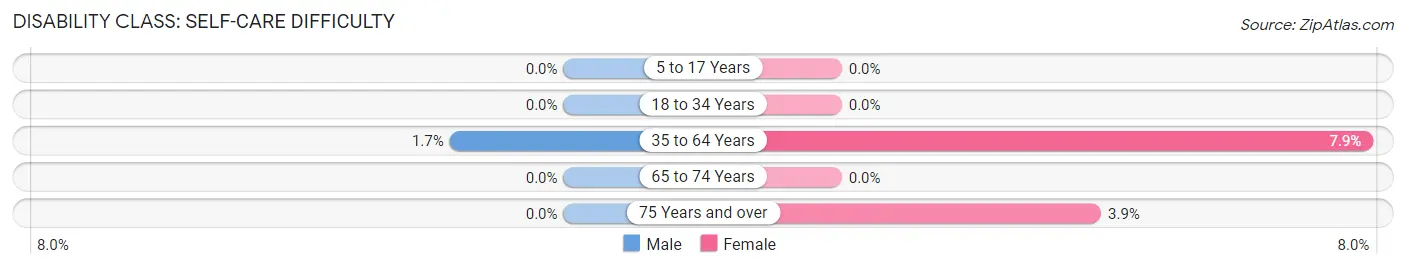
| Age Bracket | Male | Female |
| 5 to 17 Years | 0 (0.0%) | 0 (0.0%) |
| 18 to 34 Years | 0 (0.0%) | 0 (0.0%) |
| 35 to 64 Years | 1 (1.7%) | 6 (7.9%) |
| 65 to 74 Years | 0 (0.0%) | 0 (0.0%) |
| 75 Years and over | 0 (0.0%) | 1 (3.8%) |
Technology Access in Petersburg borough
Computing Device Access in Petersburg borough
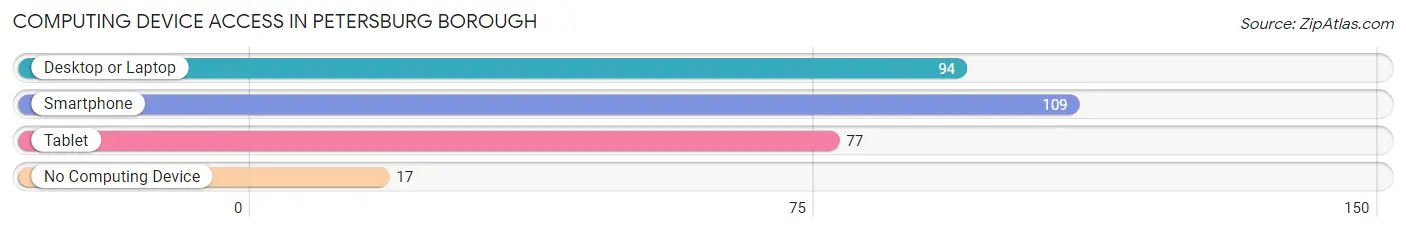
| Device Type | # Households | % Households |
| Desktop or Laptop | 94 | 63.9% |
| Smartphone | 109 | 74.2% |
| Tablet | 77 | 52.4% |
| No Computing Device | 17 | 11.6% |
| Total | 147 | 100.0% |
Internet Access in Petersburg borough
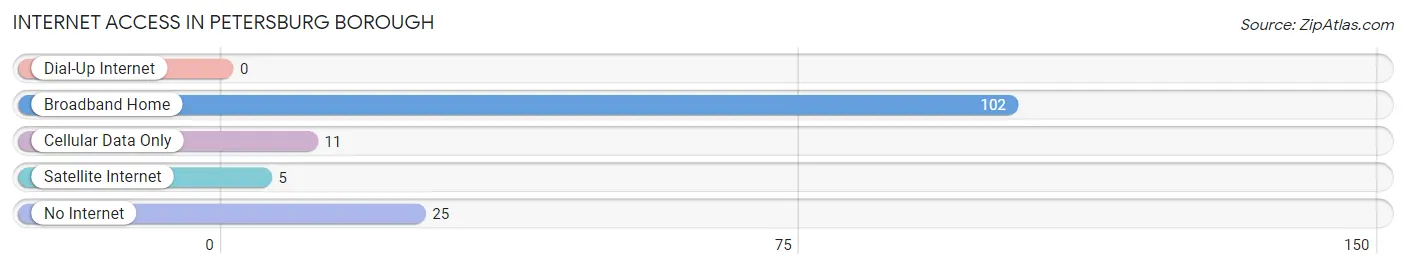
| Internet Type | # Households | % Households |
| Dial-Up Internet | 0 | 0.0% |
| Broadband Home | 102 | 69.4% |
| Cellular Data Only | 11 | 7.5% |
| Satellite Internet | 5 | 3.4% |
| No Internet | 25 | 17.0% |
| Total | 147 | 100.0% |
Petersburg borough Summary
Petersburg Borough is a borough located in the northwest corner of Bedford County, Pennsylvania. It is situated in the foothills of the Allegheny Mountains and is part of the Altoona Metropolitan Statistical Area. The borough was incorporated in 1876 and has a population of approximately 1,400 people.
Geography
Petersburg Borough is located in the northwest corner of Bedford County, Pennsylvania. It is situated in the foothills of the Allegheny Mountains and is part of the Altoona Metropolitan Statistical Area. The borough is bordered by the townships of West Providence, East Providence, and South Woodbury. The borough is located approximately 25 miles from Altoona and is accessible by US Route 220.
The borough is situated on a plateau that is surrounded by hills and valleys. The terrain is mostly flat with some rolling hills. The elevation of the borough is 1,400 feet above sea level. The climate is humid continental with cold winters and warm summers.
History
Petersburg Borough was founded in 1876 by a group of settlers from the nearby town of Bedford. The settlers were looking for a place to build a new community and chose the area due to its proximity to the Allegheny Mountains. The borough was named after the nearby town of Petersburg, which was named after Peter Shaffer, an early settler.
The borough was incorporated in 1876 and has a population of approximately 1,400 people. The borough was originally a farming community and the main industry was dairy farming. The borough also had a few small businesses, such as a general store and a blacksmith shop.
In the early 1900s, the borough began to grow and develop. The population increased and new businesses were established. The borough also became a popular tourist destination due to its proximity to the Allegheny Mountains.
Economy
The economy of Petersburg Borough is largely based on tourism and agriculture. The borough is home to several tourist attractions, such as the Allegheny Mountains, the Bedford County Fairgrounds, and the Bedford County Historical Society. The borough also has several small businesses, such as restaurants, shops, and a few manufacturing companies.
The borough is also home to several farms, which produce a variety of crops, such as corn, soybeans, hay, and wheat. The borough also has several dairy farms, which produce milk, cheese, and other dairy products.
Demographics
As of the 2010 census, the population of Petersburg Borough was 1,400 people. The racial makeup of the borough was 97.6% White, 0.7% African American, 0.1% Native American, 0.3% Asian, and 1.3% from other races. The median household income was $41,250 and the median family income was $50,000.
The borough is home to several churches, including the First United Methodist Church, the St. Paul Lutheran Church, and the St. John's Episcopal Church. The borough also has several schools, including the Petersburg Elementary School, the Petersburg Middle School, and the Petersburg High School.
Conclusion
Petersburg Borough is a small borough located in the northwest corner of Bedford County, Pennsylvania. It is situated in the foothills of the Allegheny Mountains and is part of the Altoona Metropolitan Statistical Area. The borough was incorporated in 1876 and has a population of approximately 1,400 people. The economy of the borough is largely based on tourism and agriculture. The racial makeup of the borough is 97.6% White, 0.7% African American, 0.1% Native American, 0.3% Asian, and 1.3% from other races. The median household income was $41,250 and the median family income was $50,000. The borough is home to several churches, schools, and tourist attractions.
Common Questions
What is Per Capita Income in Petersburg borough?
Per Capita income in Petersburg borough is $30,235.
What is the Median Family Income in Petersburg borough?
Median Family Income in Petersburg borough is $62,750.
What is the Median Household income in Petersburg borough?
Median Household Income in Petersburg borough is $58,125.
What is Income or Wage Gap in Petersburg borough?
Income or Wage Gap in Petersburg borough is 48.5%.
Women in Petersburg borough earn 51.5 cents for every dollar earned by a man.
What is Inequality or Gini Index in Petersburg borough?
Inequality or Gini Index in Petersburg borough is 0.39.
What is the Total Population of Petersburg borough?
Total Population of Petersburg borough is 383.
What is the Total Male Population of Petersburg borough?
Total Male Population of Petersburg borough is 177.
What is the Total Female Population of Petersburg borough?
Total Female Population of Petersburg borough is 206.
What is the Ratio of Males per 100 Females in Petersburg borough?
There are 85.92 Males per 100 Females in Petersburg borough.
What is the Ratio of Females per 100 Males in Petersburg borough?
There are 116.38 Females per 100 Males in Petersburg borough.
What is the Median Population Age in Petersburg borough?
Median Population Age in Petersburg borough is 39.8 Years.
What is the Average Family Size in Petersburg borough
Average Family Size in Petersburg borough is 3.4 People.
What is the Average Household Size in Petersburg borough
Average Household Size in Petersburg borough is 2.6 People.
How Large is the Labor Force in Petersburg borough?
There are 196 People in the Labor Forcein in Petersburg borough.
What is the Percentage of People in the Labor Force in Petersburg borough?
64.3% of People are in the Labor Force in Petersburg borough.
What is the Unemployment Rate in Petersburg borough?
Unemployment Rate in Petersburg borough is 10.2%.