Berlin borough, PA Map & Demographics
Berlin borough Overview
$26,608
PER CAPITA INCOME
$57,976
AVG FAMILY INCOME
$51,318
AVG HOUSEHOLD INCOME
27.6%
WAGE / INCOME GAP [ % ]
72.4¢/ $1
WAGE / INCOME GAP [ $ ]
0.36
INEQUALITY / GINI INDEX
2,297
TOTAL POPULATION
1,135
MALE POPULATION
1,162
FEMALE POPULATION
97.68
MALES / 100 FEMALES
102.38
FEMALES / 100 MALES
52.8
MEDIAN AGE
2.9
AVG FAMILY SIZE
2.3
AVG HOUSEHOLD SIZE
832
LABOR FORCE [ PEOPLE ]
45.7%
PERCENT IN LABOR FORCE
6.1%
UNEMPLOYMENT RATE
Income in Berlin borough
Income Overview in Berlin borough
Per Capita Income in Berlin borough is $26,608, while median incomes of families and households are $57,976 and $51,318 respectively.
| Characteristic | Number | Measure |
| Per Capita Income | 2,297 | $26,608 |
| Median Family Income | 610 | $57,976 |
| Mean Family Income | 610 | $69,348 |
| Median Household Income | 932 | $51,318 |
| Mean Household Income | 932 | $60,482 |
| Income Deficit | 610 | $0 |
| Wage / Income Gap (%) | 2,297 | 27.58% |
| Wage / Income Gap ($) | 2,297 | 72.42¢ per $1 |
| Gini / Inequality Index | 2,297 | 0.36 |
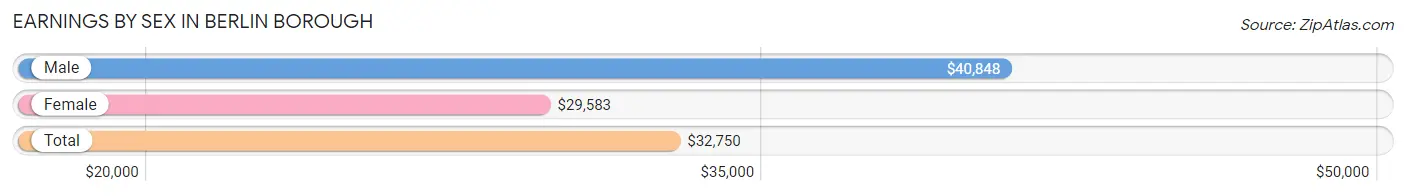
Earnings by Sex in Berlin borough
Average Earnings in Berlin borough are $32,750, $40,848 for men and $29,583 for women, a difference of 27.6%.
| Sex | Number | Average Earnings |
| Male | 557 (62.4%) | $40,848 |
| Female | 336 (37.6%) | $29,583 |
| Total | 893 (100.0%) | $32,750 |
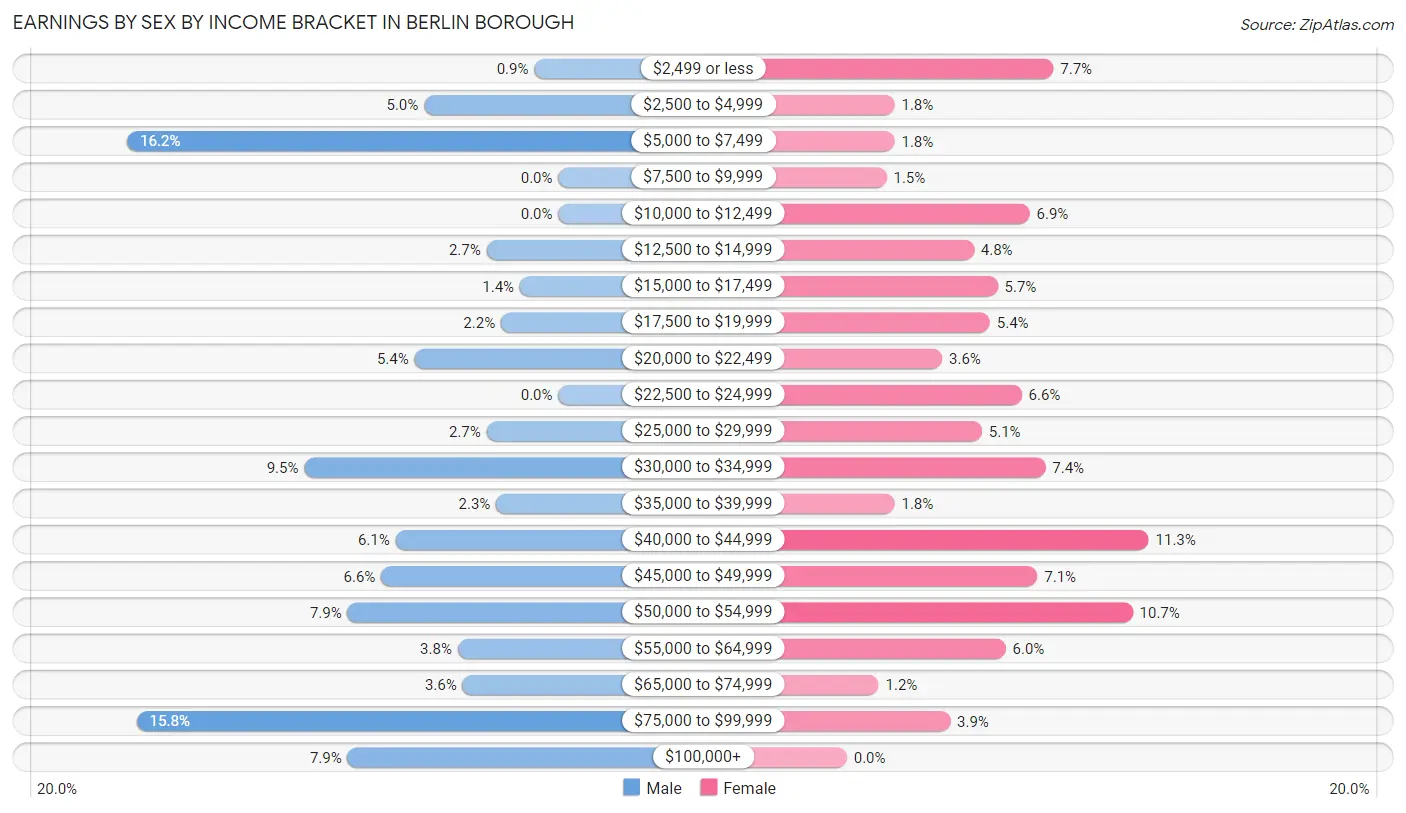
Earnings by Sex by Income Bracket in Berlin borough
The most common earnings brackets in Berlin borough are $5,000 to $7,499 for men (90 | 16.2%) and $40,000 to $44,999 for women (38 | 11.3%).
| Income | Male | Female |
| $2,499 or less | 5 (0.9%) | 26 (7.7%) |
| $2,500 to $4,999 | 28 (5.0%) | 6 (1.8%) |
| $5,000 to $7,499 | 90 (16.2%) | 6 (1.8%) |
| $7,500 to $9,999 | 0 (0.0%) | 5 (1.5%) |
| $10,000 to $12,499 | 0 (0.0%) | 23 (6.9%) |
| $12,500 to $14,999 | 15 (2.7%) | 16 (4.8%) |
| $15,000 to $17,499 | 8 (1.4%) | 19 (5.7%) |
| $17,500 to $19,999 | 12 (2.1%) | 18 (5.4%) |
| $20,000 to $22,499 | 30 (5.4%) | 12 (3.6%) |
| $22,500 to $24,999 | 0 (0.0%) | 22 (6.6%) |
| $25,000 to $29,999 | 15 (2.7%) | 17 (5.1%) |
| $30,000 to $34,999 | 53 (9.5%) | 25 (7.4%) |
| $35,000 to $39,999 | 13 (2.3%) | 6 (1.8%) |
| $40,000 to $44,999 | 34 (6.1%) | 38 (11.3%) |
| $45,000 to $49,999 | 37 (6.6%) | 24 (7.1%) |
| $50,000 to $54,999 | 44 (7.9%) | 36 (10.7%) |
| $55,000 to $64,999 | 21 (3.8%) | 20 (5.9%) |
| $65,000 to $74,999 | 20 (3.6%) | 4 (1.2%) |
| $75,000 to $99,999 | 88 (15.8%) | 13 (3.9%) |
| $100,000+ | 44 (7.9%) | 0 (0.0%) |
| Total | 557 (100.0%) | 336 (100.0%) |
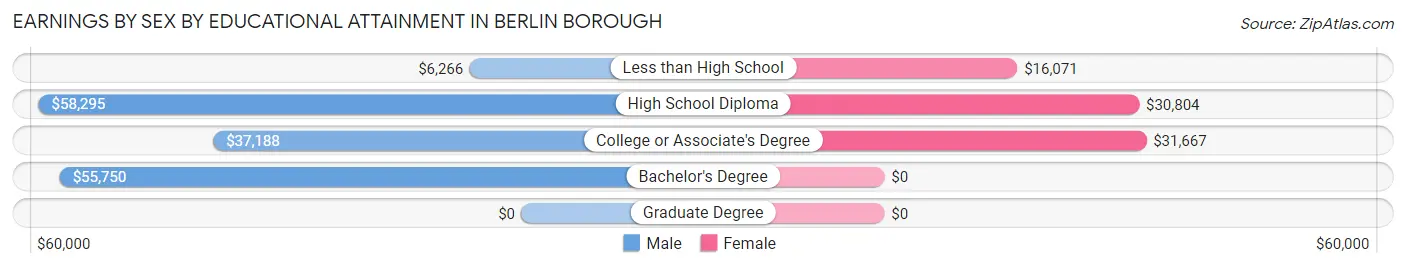
Earnings by Sex by Educational Attainment in Berlin borough
Average earnings in Berlin borough are $42,009 for men and $29,583 for women, a difference of 29.6%. Men with an educational attainment of high school diploma enjoy the highest average annual earnings of $58,295, while those with less than high school education earn the least with $6,266. Women with an educational attainment of college or associate's degree earn the most with the average annual earnings of $31,667, while those with less than high school education have the smallest earnings of $16,071.
| Educational Attainment | Male Income | Female Income |
| Less than High School | $6,266 | $16,071 |
| High School Diploma | $58,295 | $30,804 |
| College or Associate's Degree | $37,188 | $31,667 |
| Bachelor's Degree | $55,750 | $0 |
| Graduate Degree | - | - |
| Total | $42,009 | $29,583 |
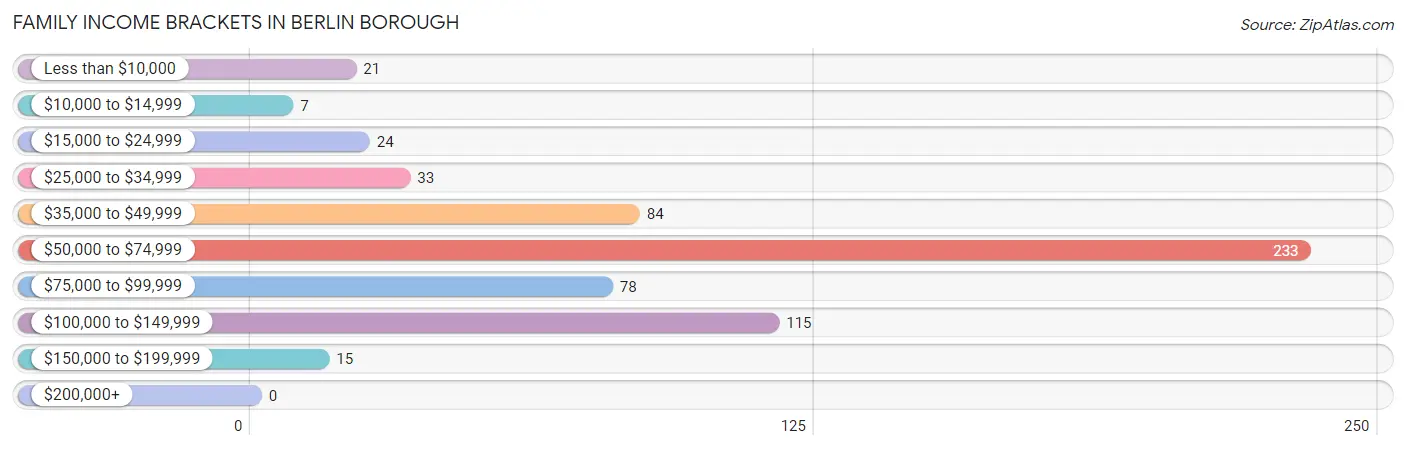
Family Income in Berlin borough
Family Income Brackets in Berlin borough
According to the Berlin borough family income data, there are 233 families falling into the $50,000 to $74,999 income range, which is the most common income bracket and makes up 38.2% of all families.
| Income Bracket | # Families | % Families |
| Less than $10,000 | 21 | 3.4% |
| $10,000 to $14,999 | 7 | 1.1% |
| $15,000 to $24,999 | 24 | 3.9% |
| $25,000 to $34,999 | 33 | 5.4% |
| $35,000 to $49,999 | 84 | 13.8% |
| $50,000 to $74,999 | 233 | 38.2% |
| $75,000 to $99,999 | 78 | 12.8% |
| $100,000 to $149,999 | 115 | 18.9% |
| $150,000 to $199,999 | 15 | 2.5% |
| $200,000+ | 0 | 0.0% |
Family Income by Famaliy Size in Berlin borough
4-person families (49 | 8.0%) account for the highest median family income in Berlin borough with $104,688 per family, while 2-person families (389 | 63.8%) have the highest median income of $29,340 per family member.
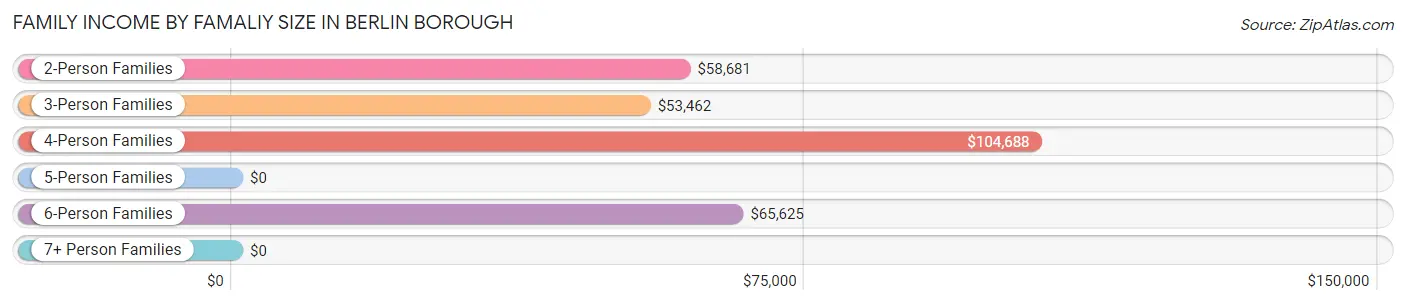
| Income Bracket | # Families | Median Income |
| 2-Person Families | 389 (63.8%) | $58,681 |
| 3-Person Families | 118 (19.3%) | $53,462 |
| 4-Person Families | 49 (8.0%) | $104,688 |
| 5-Person Families | 26 (4.3%) | $0 |
| 6-Person Families | 28 (4.6%) | $65,625 |
| 7+ Person Families | 0 (0.0%) | $0 |
| Total | 610 (100.0%) | $57,976 |
Family Income by Number of Earners in Berlin borough
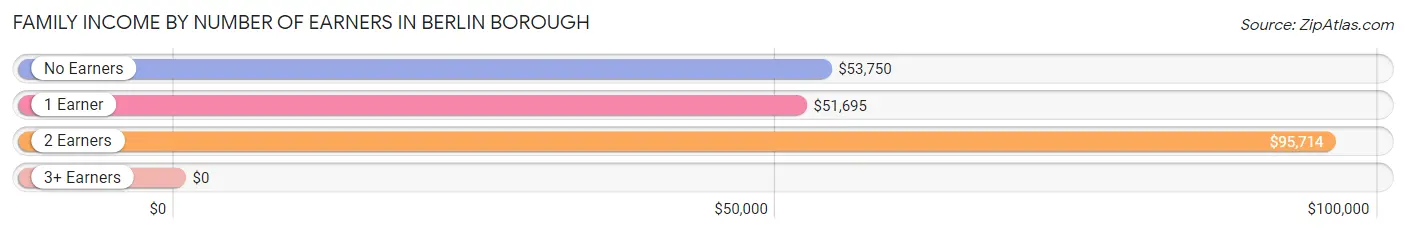
| Number of Earners | # Families | Median Income |
| No Earners | 145 (23.8%) | $53,750 |
| 1 Earner | 295 (48.4%) | $51,695 |
| 2 Earners | 162 (26.6%) | $95,714 |
| 3+ Earners | 8 (1.3%) | $0 |
| Total | 610 (100.0%) | $57,976 |
Household Income in Berlin borough
Household Income Brackets in Berlin borough
With 259 households falling in the category, the $50,000 to $74,999 income range is the most frequent in Berlin borough, accounting for 27.8% of all households.
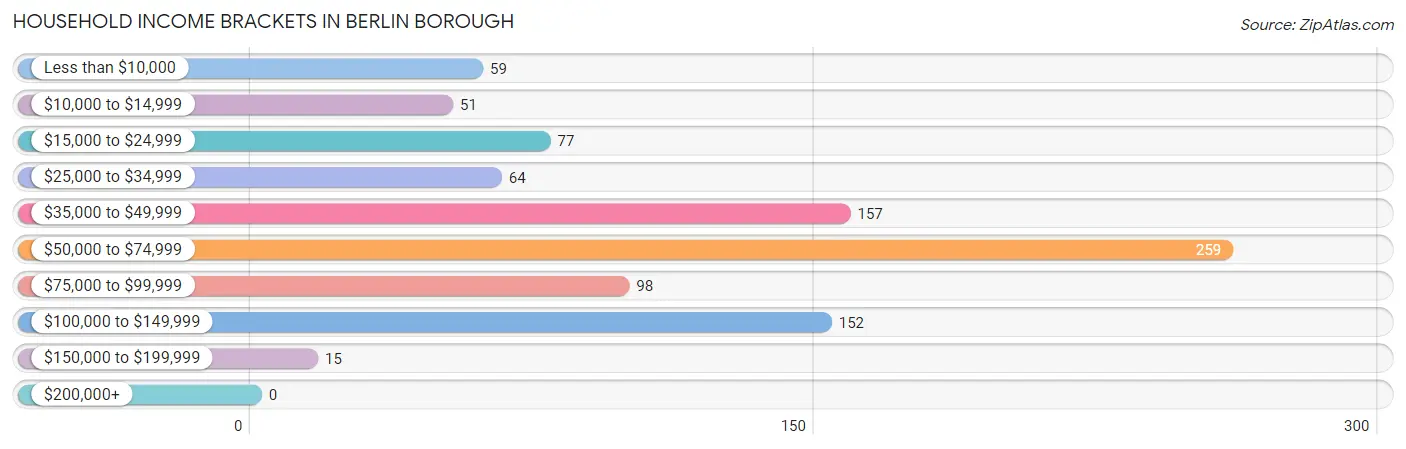
| Income Bracket | # Households | % Households |
| Less than $10,000 | 59 | 6.3% |
| $10,000 to $14,999 | 51 | 5.5% |
| $15,000 to $24,999 | 77 | 8.3% |
| $25,000 to $34,999 | 64 | 6.9% |
| $35,000 to $49,999 | 157 | 16.8% |
| $50,000 to $74,999 | 259 | 27.8% |
| $75,000 to $99,999 | 98 | 10.5% |
| $100,000 to $149,999 | 152 | 16.3% |
| $150,000 to $199,999 | 15 | 1.6% |
| $200,000+ | 0 | 0.0% |
Household Income by Householder Age in Berlin borough
The median household income in Berlin borough is $51,318, with the highest median household income of $78,750 found in the 25 to 44 years age bracket for the primary householder. A total of 222 households (23.8%) fall into this category. Meanwhile, the 15 to 24 years age bracket for the primary householder has the lowest median household income of $36,250, with 30 households (3.2%) in this group.
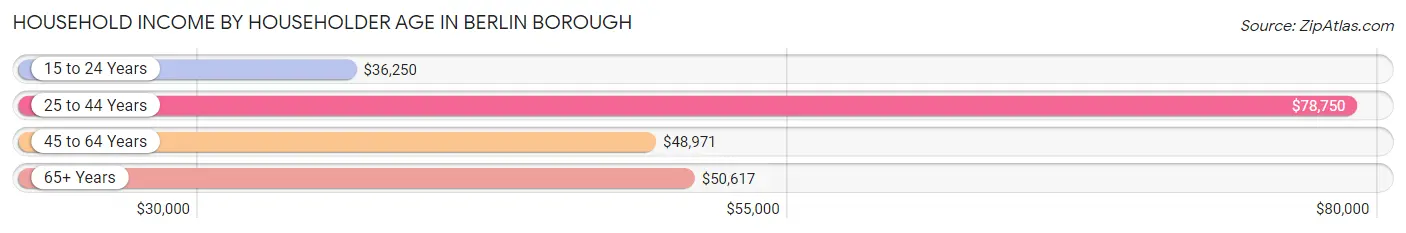
| Income Bracket | # Households | Median Income |
| 15 to 24 Years | 30 (3.2%) | $36,250 |
| 25 to 44 Years | 222 (23.8%) | $78,750 |
| 45 to 64 Years | 276 (29.6%) | $48,971 |
| 65+ Years | 404 (43.3%) | $50,617 |
| Total | 932 (100.0%) | $51,318 |
Poverty in Berlin borough
Income Below Poverty by Sex and Age in Berlin borough
With 9.4% poverty level for males and 16.4% for females among the residents of Berlin borough, 18 to 24 year old males and under 5 year old females are the most vulnerable to poverty, with 27 males (73.0%) and 18 females (47.4%) in their respective age groups living below the poverty level.
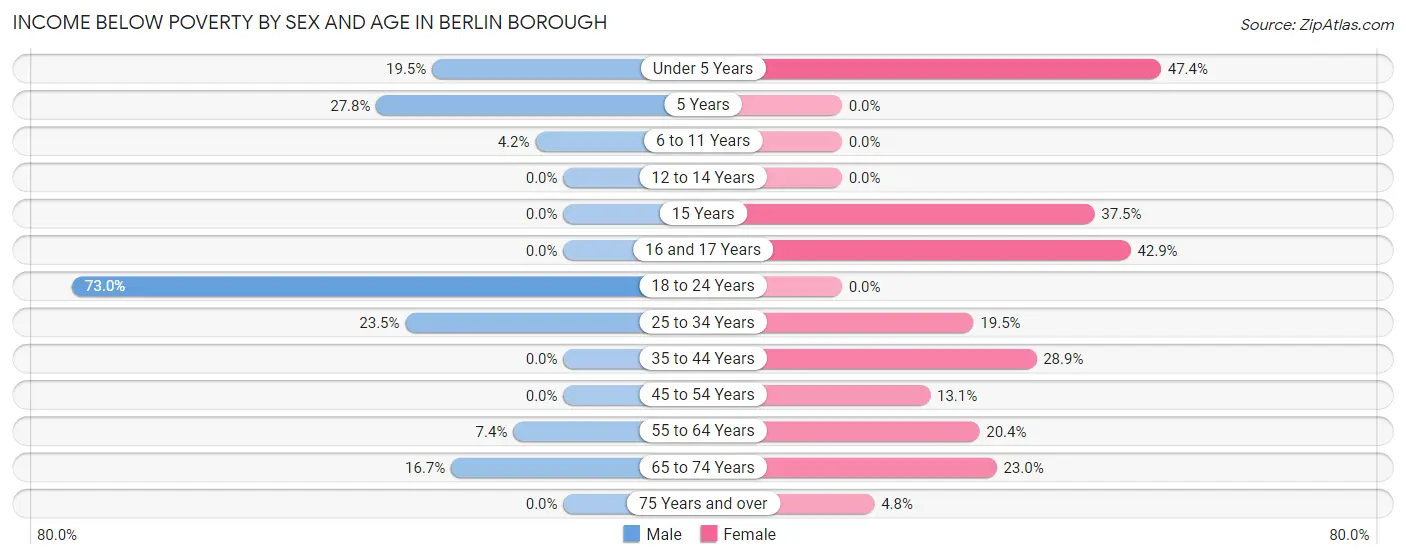
| Age Bracket | Male | Female |
| Under 5 Years | 23 (19.5%) | 18 (47.4%) |
| 5 Years | 5 (27.8%) | 0 (0.0%) |
| 6 to 11 Years | 5 (4.2%) | 0 (0.0%) |
| 12 to 14 Years | 0 (0.0%) | 0 (0.0%) |
| 15 Years | 0 (0.0%) | 6 (37.5%) |
| 16 and 17 Years | 0 (0.0%) | 12 (42.9%) |
| 18 to 24 Years | 27 (73.0%) | 0 (0.0%) |
| 25 to 34 Years | 19 (23.5%) | 17 (19.5%) |
| 35 to 44 Years | 0 (0.0%) | 28 (28.9%) |
| 45 to 54 Years | 0 (0.0%) | 11 (13.1%) |
| 55 to 64 Years | 9 (7.4%) | 29 (20.4%) |
| 65 to 74 Years | 17 (16.7%) | 34 (23.0%) |
| 75 Years and over | 0 (0.0%) | 10 (4.8%) |
| Total | 105 (9.4%) | 165 (16.4%) |
Income Above Poverty by Sex and Age in Berlin borough
According to the poverty statistics in Berlin borough, males aged 12 to 14 years and females aged 5 years are the age groups that are most secure financially, with 100.0% of males and 100.0% of females in these age groups living above the poverty line.
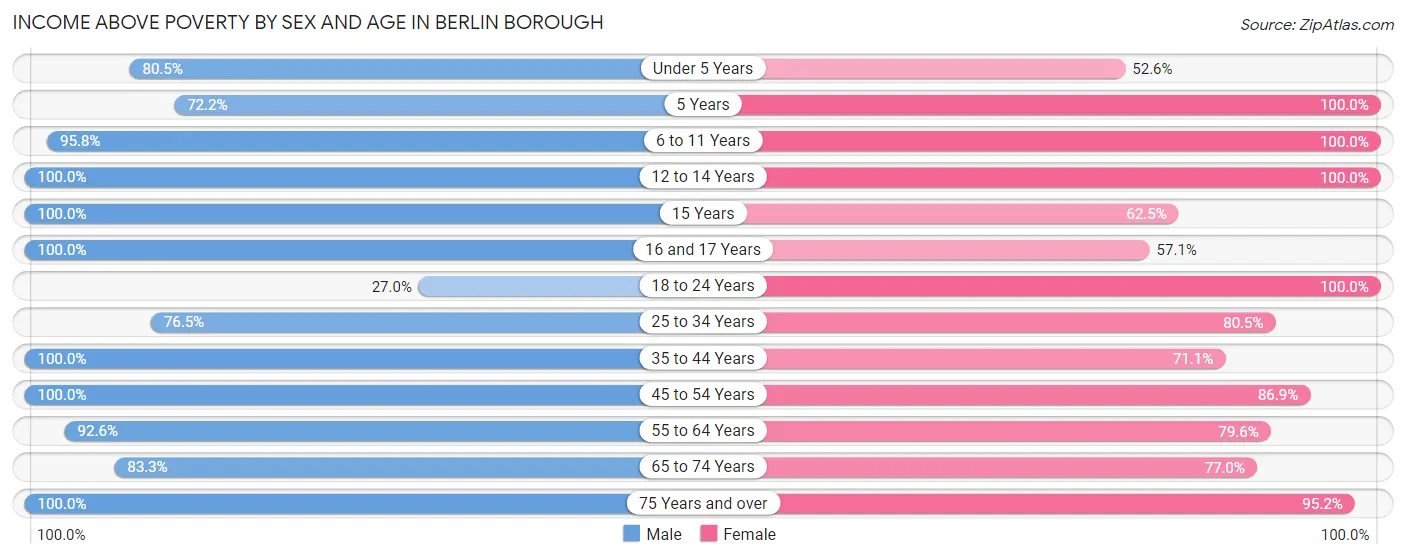
| Age Bracket | Male | Female |
| Under 5 Years | 95 (80.5%) | 20 (52.6%) |
| 5 Years | 13 (72.2%) | 16 (100.0%) |
| 6 to 11 Years | 115 (95.8%) | 57 (100.0%) |
| 12 to 14 Years | 26 (100.0%) | 30 (100.0%) |
| 15 Years | 12 (100.0%) | 10 (62.5%) |
| 16 and 17 Years | 18 (100.0%) | 16 (57.1%) |
| 18 to 24 Years | 10 (27.0%) | 58 (100.0%) |
| 25 to 34 Years | 62 (76.5%) | 70 (80.5%) |
| 35 to 44 Years | 121 (100.0%) | 69 (71.1%) |
| 45 to 54 Years | 125 (100.0%) | 73 (86.9%) |
| 55 to 64 Years | 112 (92.6%) | 113 (79.6%) |
| 65 to 74 Years | 85 (83.3%) | 114 (77.0%) |
| 75 Years and over | 221 (100.0%) | 198 (95.2%) |
| Total | 1,015 (90.6%) | 844 (83.7%) |
Income Below Poverty Among Married-Couple Families in Berlin borough
The poverty statistics for married-couple families in Berlin borough show that 4.3% or 21 of the total 491 families live below the poverty line. Families with 1 or 2 children have the highest poverty rate of 18.8%, comprising of 15 families. On the other hand, families with 3 or 4 children have the lowest poverty rate of 0.0%, which includes 0 families.
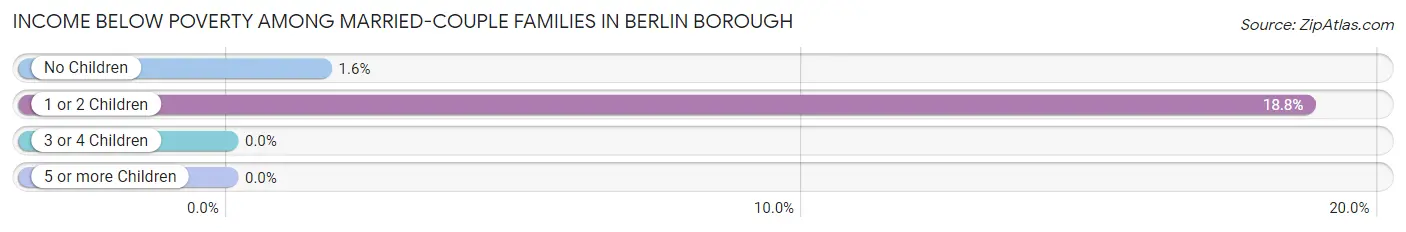
| Children | Above Poverty | Below Poverty |
| No Children | 363 (98.4%) | 6 (1.6%) |
| 1 or 2 Children | 65 (81.2%) | 15 (18.8%) |
| 3 or 4 Children | 42 (100.0%) | 0 (0.0%) |
| 5 or more Children | 0 (0.0%) | 0 (0.0%) |
| Total | 470 (95.7%) | 21 (4.3%) |
Income Below Poverty Among Single-Parent Households in Berlin borough
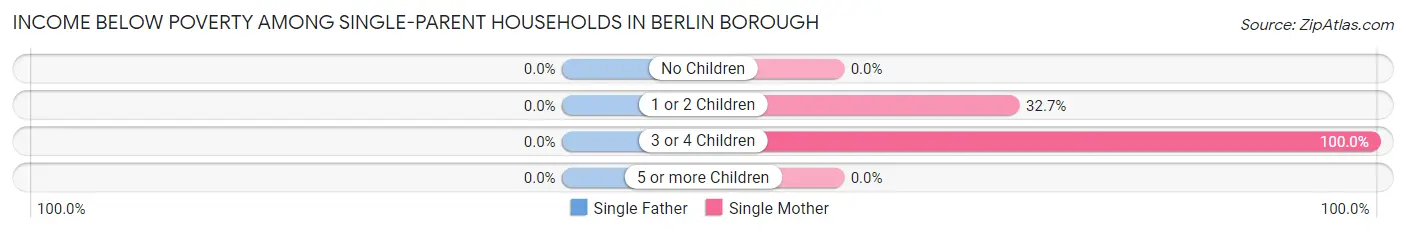
| Children | Single Father | Single Mother |
| No Children | 0 (0.0%) | 0 (0.0%) |
| 1 or 2 Children | 0 (0.0%) | 17 (32.7%) |
| 3 or 4 Children | 0 (0.0%) | 12 (100.0%) |
| 5 or more Children | 0 (0.0%) | 0 (0.0%) |
| Total | 0 (0.0%) | 29 (39.7%) |
Income Below Poverty Among Married-Couple vs Single-Parent Households in Berlin borough
The poverty data for Berlin borough shows that 21 of the married-couple family households (4.3%) and 29 of the single-parent households (24.4%) are living below the poverty level. Within the married-couple family households, those with 1 or 2 children have the highest poverty rate, with 15 households (18.8%) falling below the poverty line. Among the single-parent households, those with 3 or 4 children have the highest poverty rate, with 12 household (75.0%) living below poverty.
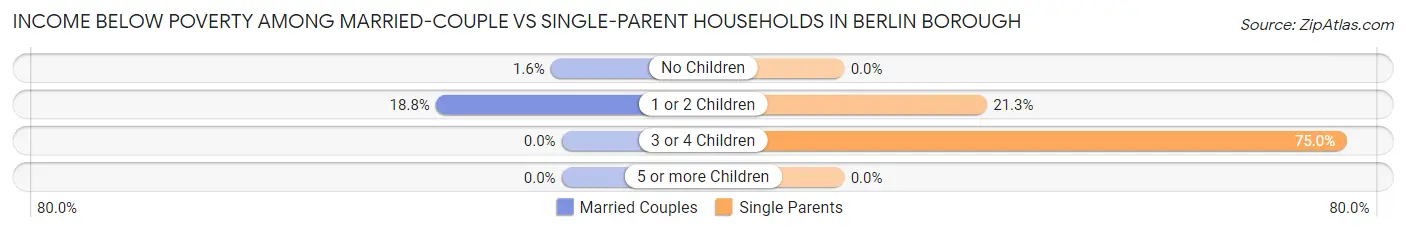
| Children | Married-Couple Families | Single-Parent Households |
| No Children | 6 (1.6%) | 0 (0.0%) |
| 1 or 2 Children | 15 (18.8%) | 17 (21.2%) |
| 3 or 4 Children | 0 (0.0%) | 12 (75.0%) |
| 5 or more Children | 0 (0.0%) | 0 (0.0%) |
| Total | 21 (4.3%) | 29 (24.4%) |
Race in Berlin borough
The most populous races in Berlin borough are White / Caucasian (2,228 | 97.0%), Two or more Races (56 | 2.4%), and Hispanic or Latino (36 | 1.6%).
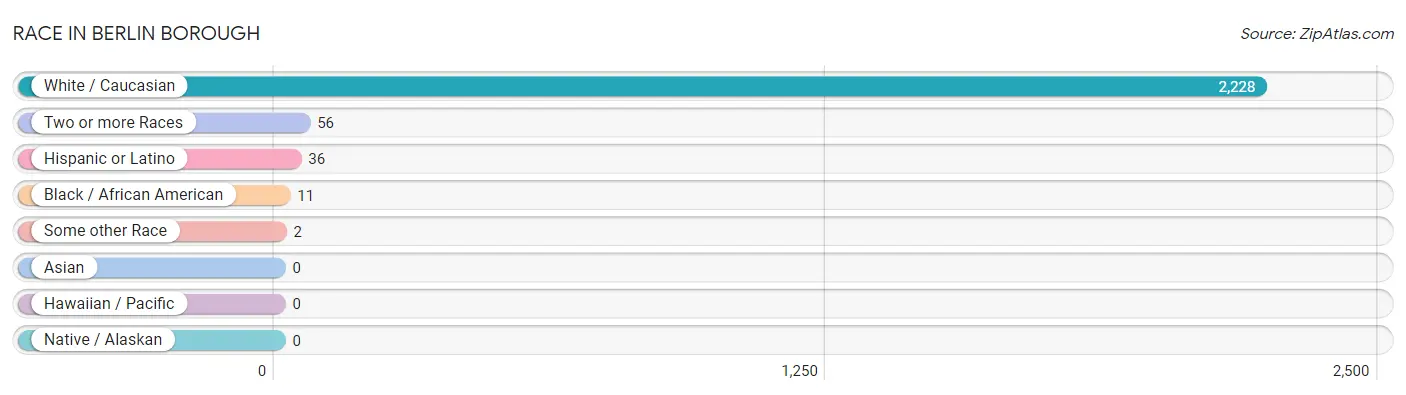
| Race | # Population | % Population |
| Asian | 0 | 0.0% |
| Black / African American | 11 | 0.5% |
| Hawaiian / Pacific | 0 | 0.0% |
| Hispanic or Latino | 36 | 1.6% |
| Native / Alaskan | 0 | 0.0% |
| White / Caucasian | 2,228 | 97.0% |
| Two or more Races | 56 | 2.4% |
| Some other Race | 2 | 0.1% |
| Total | 2,297 | 100.0% |
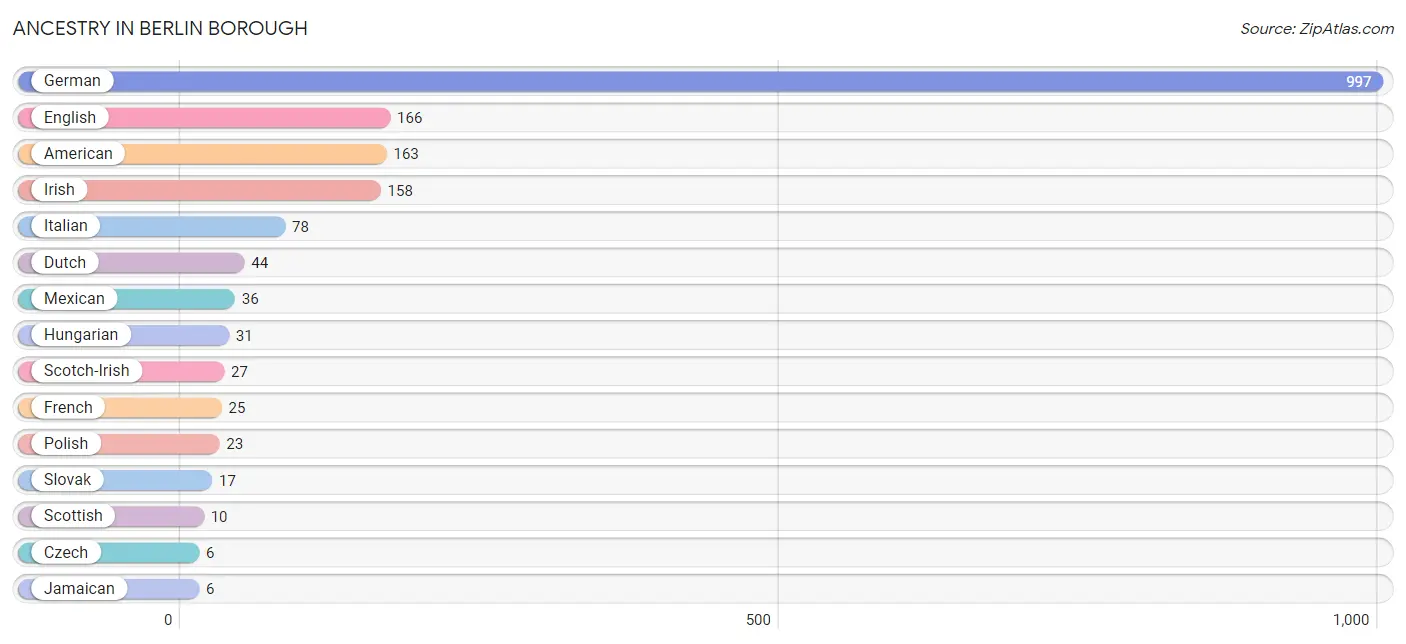
Ancestry in Berlin borough
The most populous ancestries reported in Berlin borough are German (997 | 43.4%), English (166 | 7.2%), American (163 | 7.1%), Irish (158 | 6.9%), and Italian (78 | 3.4%), together accounting for 68.0% of all Berlin borough residents.
| Ancestry | # Population | % Population |
| American | 163 | 7.1% |
| Croatian | 5 | 0.2% |
| Czech | 6 | 0.3% |
| Danish | 5 | 0.2% |
| Dutch | 44 | 1.9% |
| Eastern European | 5 | 0.2% |
| English | 166 | 7.2% |
| European | 4 | 0.2% |
| French | 25 | 1.1% |
| German | 997 | 43.4% |
| Greek | 5 | 0.2% |
| Hungarian | 31 | 1.3% |
| Irish | 158 | 6.9% |
| Italian | 78 | 3.4% |
| Jamaican | 6 | 0.3% |
| Mexican | 36 | 1.6% |
| Pennsylvania German | 6 | 0.3% |
| Polish | 23 | 1.0% |
| Russian | 4 | 0.2% |
| Scotch-Irish | 27 | 1.2% |
| Scottish | 10 | 0.4% |
| Slovak | 17 | 0.7% |
| Swedish | 6 | 0.3% |
| Swiss | 5 | 0.2% |
| Welsh | 5 | 0.2% | View All 25 Rows |
Immigrants in Berlin borough

| Immigration Origin | # Population | % Population | View All 0 Rows |
Sex and Age in Berlin borough
Sex and Age in Berlin borough
The most populous age groups in Berlin borough are 85 Years and over (159 | 14.0%) for men and 70 to 74 Years (117 | 10.1%) for women.
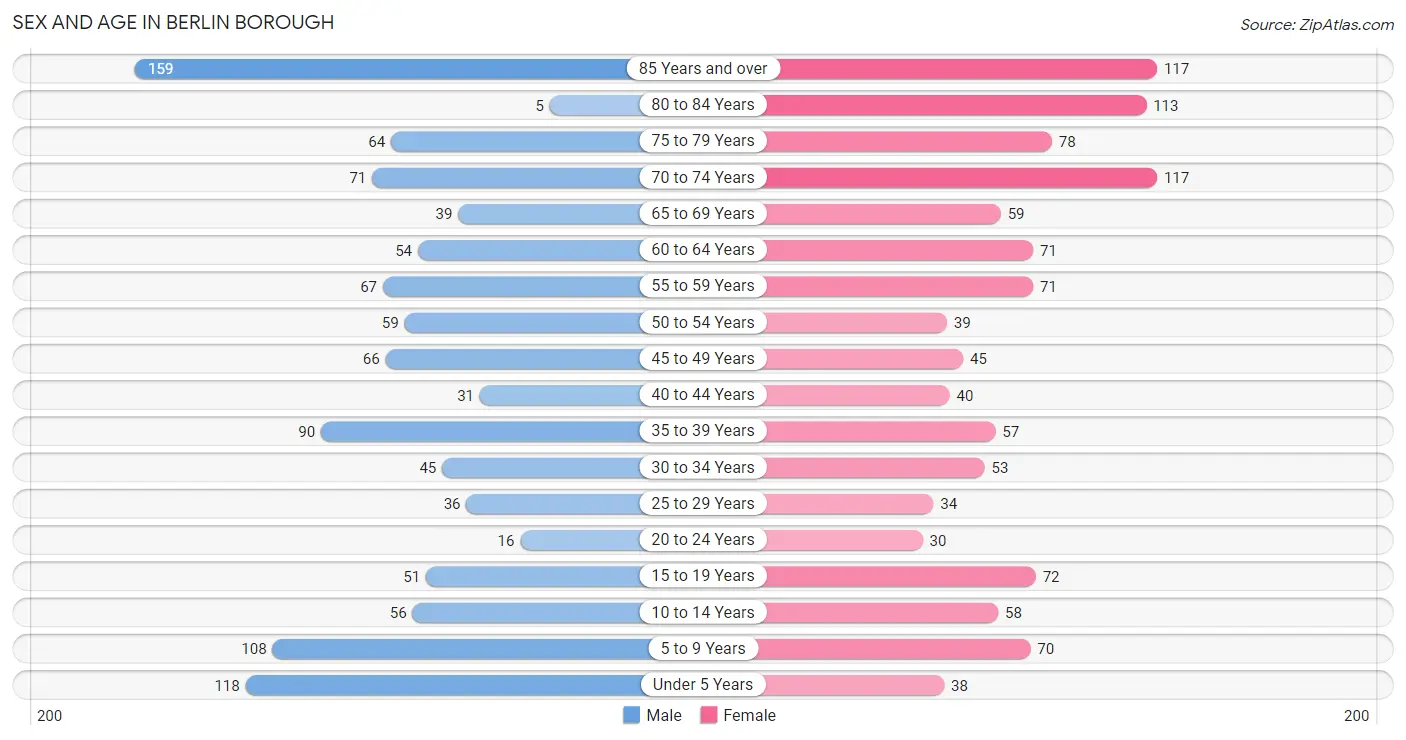
| Age Bracket | Male | Female |
| Under 5 Years | 118 (10.4%) | 38 (3.3%) |
| 5 to 9 Years | 108 (9.5%) | 70 (6.0%) |
| 10 to 14 Years | 56 (4.9%) | 58 (5.0%) |
| 15 to 19 Years | 51 (4.5%) | 72 (6.2%) |
| 20 to 24 Years | 16 (1.4%) | 30 (2.6%) |
| 25 to 29 Years | 36 (3.2%) | 34 (2.9%) |
| 30 to 34 Years | 45 (4.0%) | 53 (4.6%) |
| 35 to 39 Years | 90 (7.9%) | 57 (4.9%) |
| 40 to 44 Years | 31 (2.7%) | 40 (3.4%) |
| 45 to 49 Years | 66 (5.8%) | 45 (3.9%) |
| 50 to 54 Years | 59 (5.2%) | 39 (3.4%) |
| 55 to 59 Years | 67 (5.9%) | 71 (6.1%) |
| 60 to 64 Years | 54 (4.8%) | 71 (6.1%) |
| 65 to 69 Years | 39 (3.4%) | 59 (5.1%) |
| 70 to 74 Years | 71 (6.3%) | 117 (10.1%) |
| 75 to 79 Years | 64 (5.6%) | 78 (6.7%) |
| 80 to 84 Years | 5 (0.4%) | 113 (9.7%) |
| 85 Years and over | 159 (14.0%) | 117 (10.1%) |
| Total | 1,135 (100.0%) | 1,162 (100.0%) |
Families and Households in Berlin borough
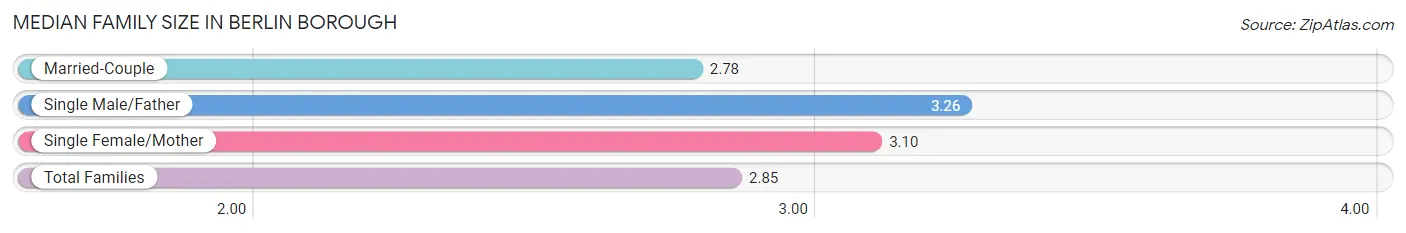
Median Family Size in Berlin borough
The median family size in Berlin borough is 2.85 persons per family, with single male/father families (46 | 7.5%) accounting for the largest median family size of 3.26 persons per family. On the other hand, married-couple families (491 | 80.5%) represent the smallest median family size with 2.78 persons per family.
| Family Type | # Families | Family Size |
| Married-Couple | 491 (80.5%) | 2.78 |
| Single Male/Father | 46 (7.5%) | 3.26 |
| Single Female/Mother | 73 (12.0%) | 3.10 |
| Total Families | 610 (100.0%) | 2.85 |
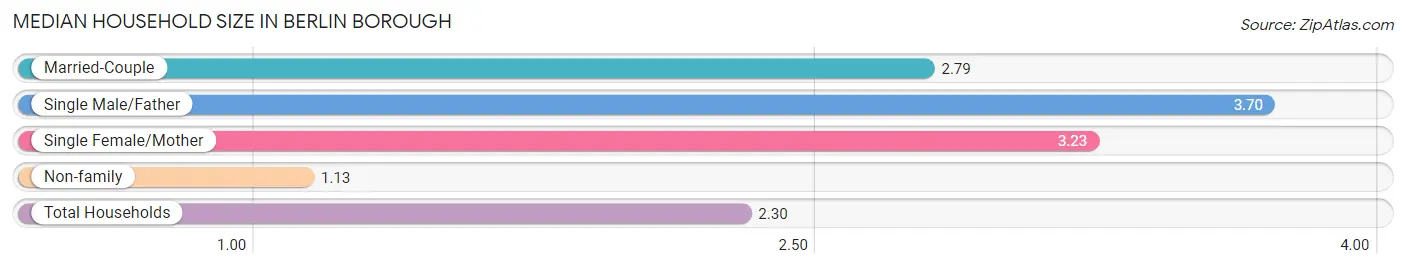
Median Household Size in Berlin borough
The median household size in Berlin borough is 2.30 persons per household, with single male/father households (46 | 4.9%) accounting for the largest median household size of 3.7 persons per household. non-family households (322 | 34.5%) represent the smallest median household size with 1.13 persons per household.
| Household Type | # Households | Household Size |
| Married-Couple | 491 (52.7%) | 2.79 |
| Single Male/Father | 46 (4.9%) | 3.70 |
| Single Female/Mother | 73 (7.8%) | 3.23 |
| Non-family | 322 (34.5%) | 1.13 |
| Total Households | 932 (100.0%) | 2.30 |
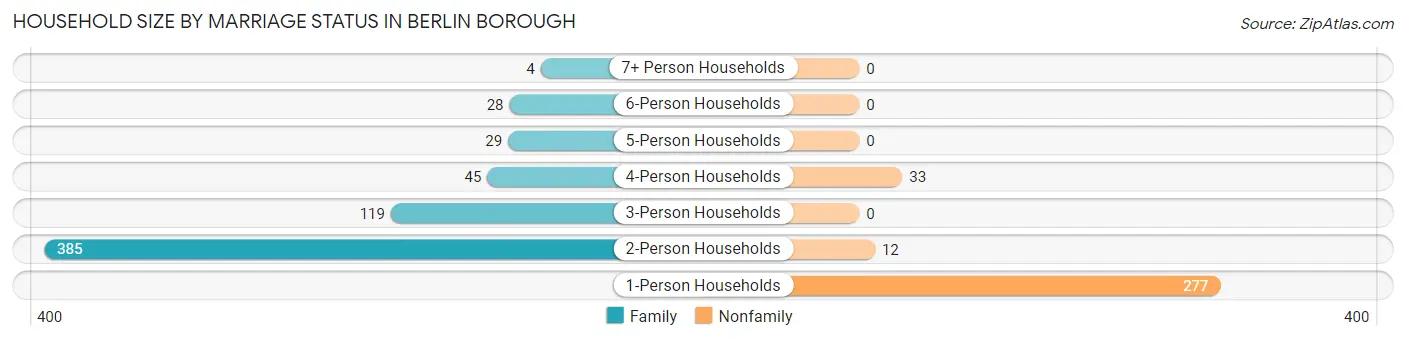
Household Size by Marriage Status in Berlin borough
Out of a total of 932 households in Berlin borough, 610 (65.4%) are family households, while 322 (34.5%) are nonfamily households. The most numerous type of family households are 2-person households, comprising 385, and the most common type of nonfamily households are 1-person households, comprising 277.
| Household Size | Family Households | Nonfamily Households |
| 1-Person Households | - | 277 (29.7%) |
| 2-Person Households | 385 (41.3%) | 12 (1.3%) |
| 3-Person Households | 119 (12.8%) | 0 (0.0%) |
| 4-Person Households | 45 (4.8%) | 33 (3.5%) |
| 5-Person Households | 29 (3.1%) | 0 (0.0%) |
| 6-Person Households | 28 (3.0%) | 0 (0.0%) |
| 7+ Person Households | 4 (0.4%) | 0 (0.0%) |
| Total | 610 (65.4%) | 322 (34.5%) |
Female Fertility in Berlin borough
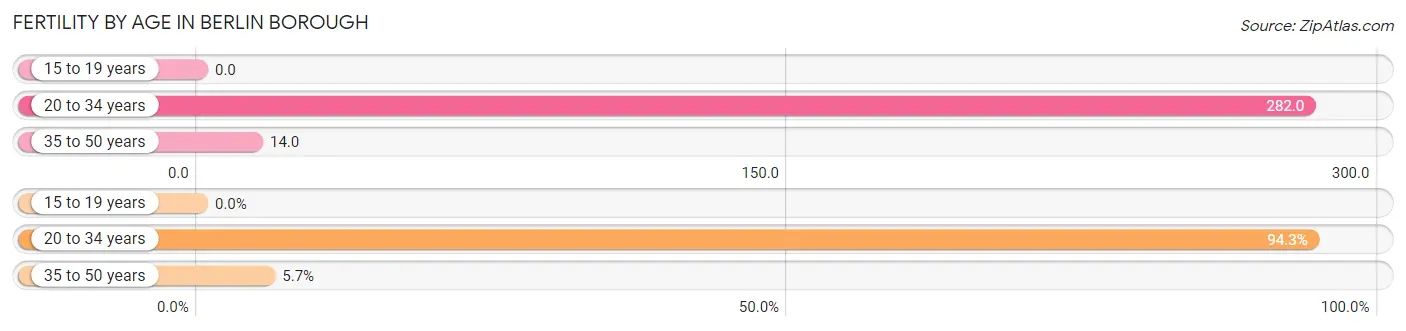
Fertility by Age in Berlin borough
Average fertility rate in Berlin borough is 106.0 births per 1,000 women. Women in the age bracket of 20 to 34 years have the highest fertility rate with 282.0 births per 1,000 women. Women in the age bracket of 20 to 34 years acount for 94.3% of all women with births.
| Age Bracket | Women with Births | Births / 1,000 Women |
| 15 to 19 years | 0 (0.0%) | 0.0 |
| 20 to 34 years | 33 (94.3%) | 282.0 |
| 35 to 50 years | 2 (5.7%) | 14.0 |
| Total | 35 (100.0%) | 106.0 |
Fertility by Age by Marriage Status in Berlin borough
88.6% of women with births (35) in Berlin borough are married. The highest percentage of unmarried women with births falls into 20 to 34 years age bracket with 12.1% of them unmarried at the time of birth, while the lowest percentage of unmarried women with births belong to 35 to 50 years age bracket with 0.0% of them unmarried.
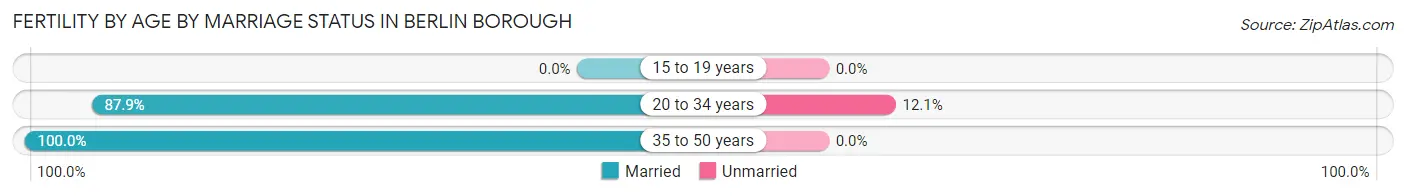
| Age Bracket | Married | Unmarried |
| 15 to 19 years | 0 (0.0%) | 0 (0.0%) |
| 20 to 34 years | 29 (87.9%) | 4 (12.1%) |
| 35 to 50 years | 2 (100.0%) | 0 (0.0%) |
| Total | 31 (88.6%) | 4 (11.4%) |
Fertility by Education in Berlin borough
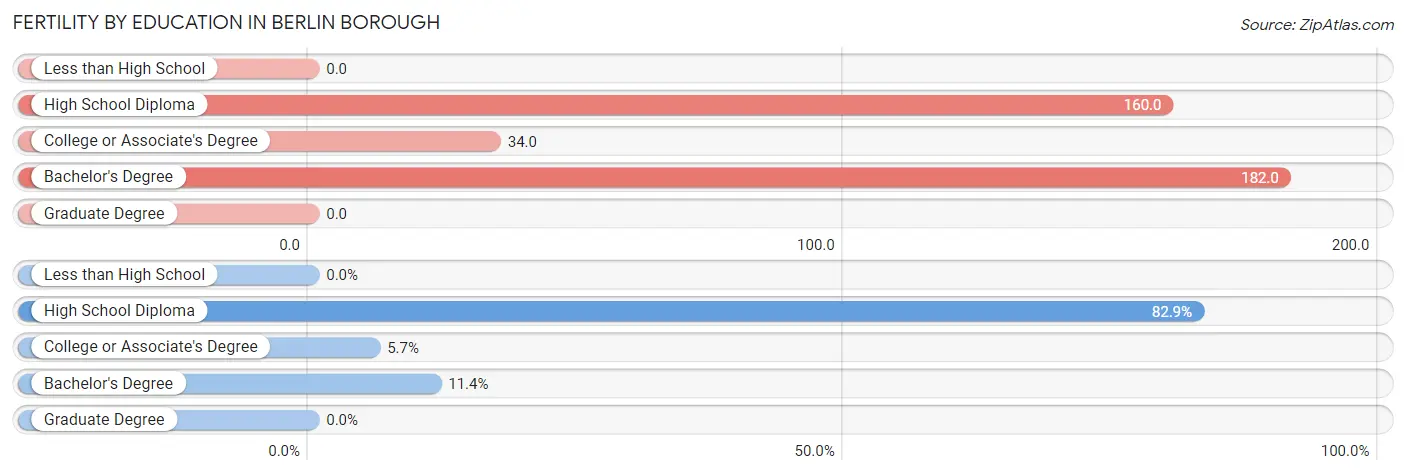
| Educational Attainment | Women with Births | Births / 1,000 Women |
| Less than High School | 0 (0.0%) | 0.0 |
| High School Diploma | 29 (82.9%) | 160.0 |
| College or Associate's Degree | 2 (5.7%) | 34.0 |
| Bachelor's Degree | 4 (11.4%) | 182.0 |
| Graduate Degree | 0 (0.0%) | 0.0 |
| Total | 35 (100.0%) | 106.0 |
Fertility by Education by Marriage Status in Berlin borough
11.4% of women with births in Berlin borough are unmarried. Women with the educational attainment of high school diploma are most likely to be married with 100.0% of them married at childbirth, while women with the educational attainment of bachelor's degree are least likely to be married with 100.0% of them unmarried at childbirth.
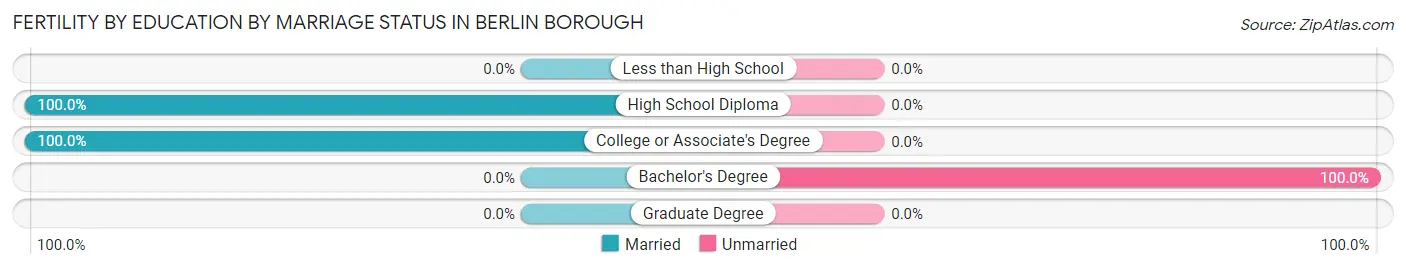
| Educational Attainment | Married | Unmarried |
| Less than High School | 0 (0.0%) | 0 (0.0%) |
| High School Diploma | 29 (100.0%) | 0 (0.0%) |
| College or Associate's Degree | 2 (100.0%) | 0 (0.0%) |
| Bachelor's Degree | 0 (0.0%) | 4 (100.0%) |
| Graduate Degree | 0 (0.0%) | 0 (0.0%) |
| Total | 31 (88.6%) | 4 (11.4%) |
Employment Characteristics in Berlin borough
Employment by Class of Employer in Berlin borough
Among the 690 employed individuals in Berlin borough, private company employees (423 | 61.3%), local government employees (102 | 14.8%), and state government employees (54 | 7.8%) make up the most common classes of employment.
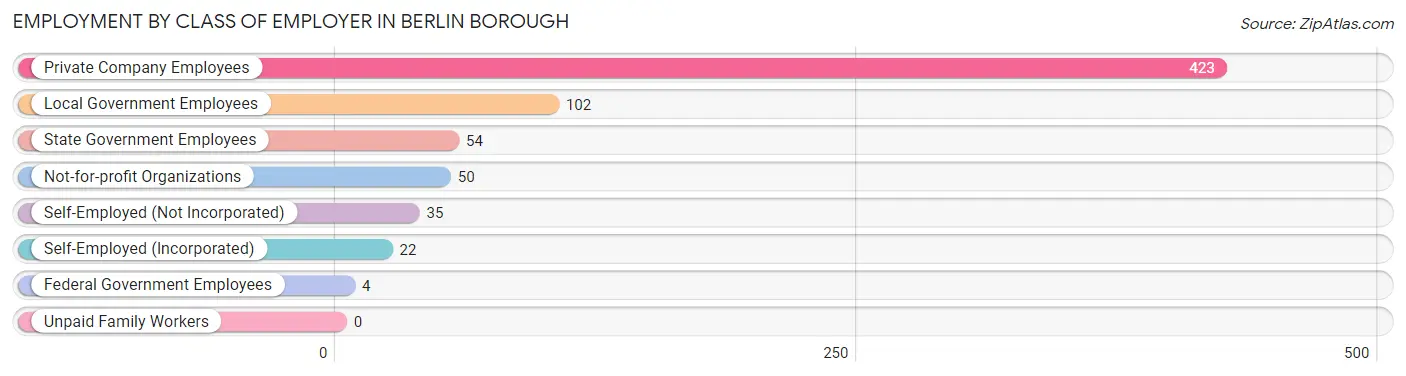
| Employer Class | # Employees | % Employees |
| Private Company Employees | 423 | 61.3% |
| Self-Employed (Incorporated) | 22 | 3.2% |
| Self-Employed (Not Incorporated) | 35 | 5.1% |
| Not-for-profit Organizations | 50 | 7.2% |
| Local Government Employees | 102 | 14.8% |
| State Government Employees | 54 | 7.8% |
| Federal Government Employees | 4 | 0.6% |
| Unpaid Family Workers | 0 | 0.0% |
| Total | 690 | 100.0% |
Employment Status by Age in Berlin borough
According to the labor force statistics for Berlin borough, out of the total population over 16 years of age (1,821), 45.7% or 832 individuals are in the labor force, with 6.1% or 51 of them unemployed. The age group with the highest labor force participation rate is 20 to 24 years, with 91.3% or 42 individuals in the labor force. Within the labor force, the 16 to 19 years age range has the highest percentage of unemployed individuals, with 100.0% or 10 of them being unemployed.
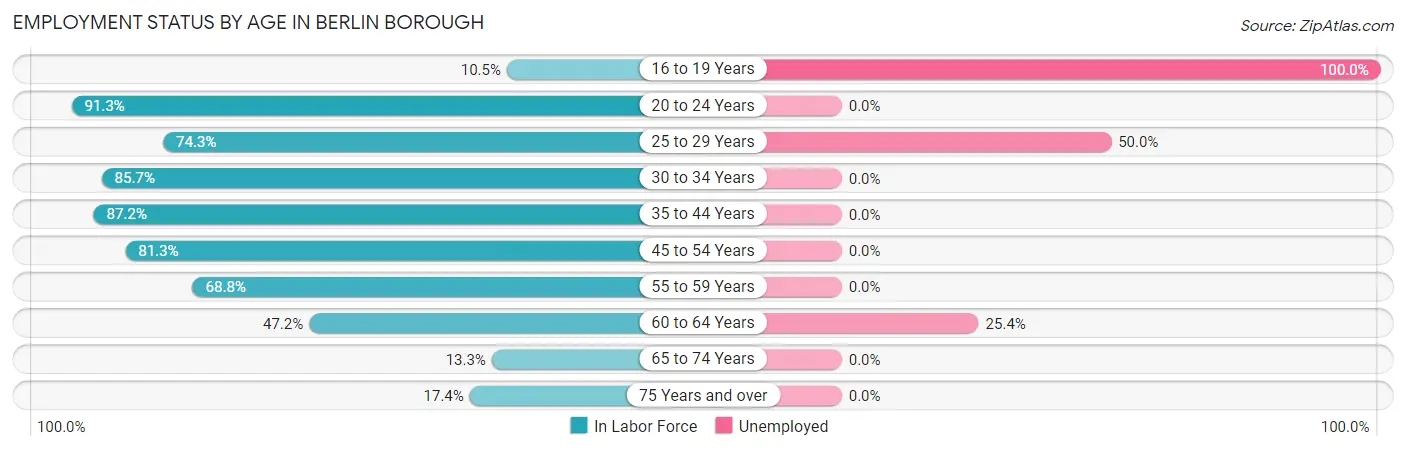
| Age Bracket | In Labor Force | Unemployed |
| 16 to 19 Years | 10 (10.5%) | 10 (100.0%) |
| 20 to 24 Years | 42 (91.3%) | 0 (0.0%) |
| 25 to 29 Years | 52 (74.3%) | 26 (50.0%) |
| 30 to 34 Years | 84 (85.7%) | 0 (0.0%) |
| 35 to 44 Years | 190 (87.2%) | 0 (0.0%) |
| 45 to 54 Years | 170 (81.3%) | 0 (0.0%) |
| 55 to 59 Years | 95 (68.8%) | 0 (0.0%) |
| 60 to 64 Years | 59 (47.2%) | 15 (25.4%) |
| 65 to 74 Years | 38 (13.3%) | 0 (0.0%) |
| 75 Years and over | 93 (17.4%) | 0 (0.0%) |
| Total | 832 (45.7%) | 51 (6.1%) |
Employment Status by Educational Attainment in Berlin borough
According to labor force statistics for Berlin borough, 75.8% of individuals (650) out of the total population between 25 and 64 years of age (858) are in the labor force, with 6.3% or 41 of them being unemployed. The group with the highest labor force participation rate are those with the educational attainment of college / associate degree, with 86.1% or 210 individuals in the labor force. Within the labor force, individuals with less than high school education have the highest percentage of unemployment, with 15.0% or 6 of them being unemployed.
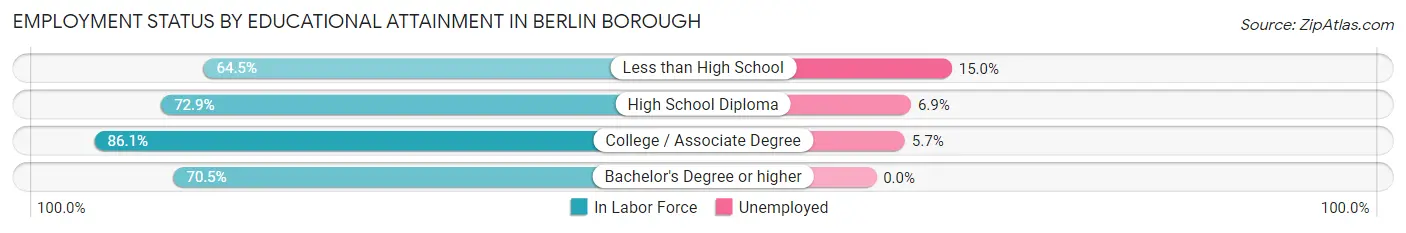
| Educational Attainment | In Labor Force | Unemployed |
| Less than High School | 40 (64.5%) | 9 (15.0%) |
| High School Diploma | 333 (72.9%) | 32 (6.9%) |
| College / Associate Degree | 210 (86.1%) | 14 (5.7%) |
| Bachelor's Degree or higher | 67 (70.5%) | 0 (0.0%) |
| Total | 650 (75.8%) | 54 (6.3%) |
Employment Occupations by Sex in Berlin borough
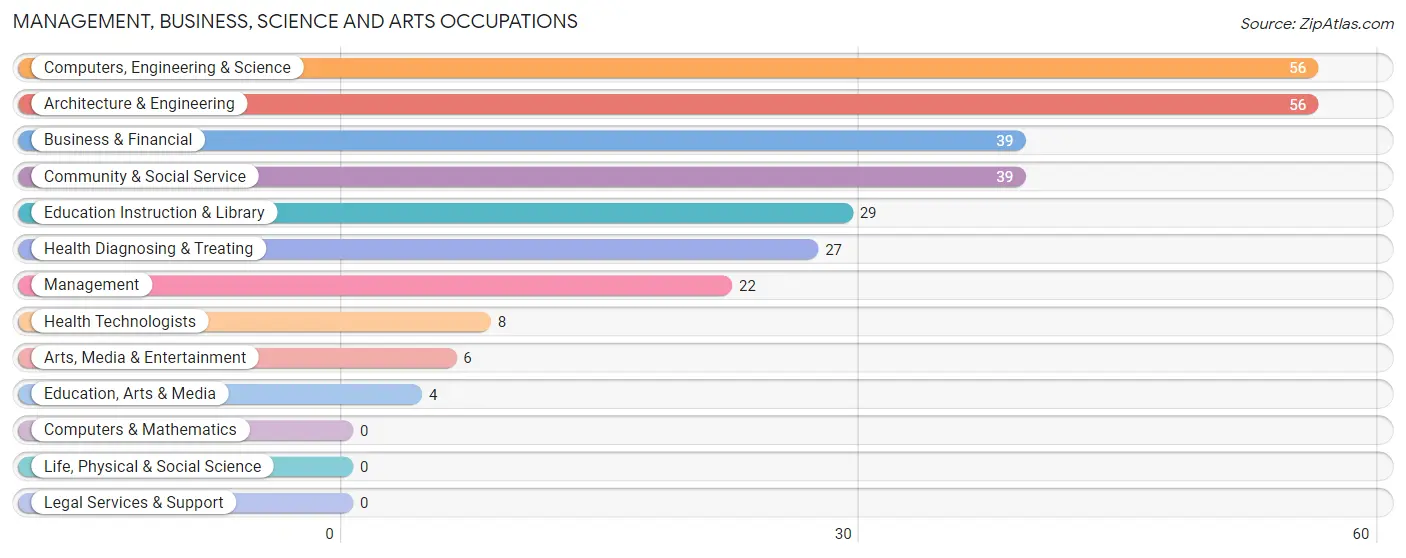
Management, Business, Science and Arts Occupations
The most common Management, Business, Science and Arts occupations in Berlin borough are Computers, Engineering & Science (56 | 7.2%), Architecture & Engineering (56 | 7.2%), Business & Financial (39 | 5.0%), Community & Social Service (39 | 5.0%), and Education Instruction & Library (29 | 3.7%).
Management, Business, Science and Arts Occupations by Sex
Within the Management, Business, Science and Arts occupations in Berlin borough, the most male-oriented occupations are Arts, Media & Entertainment (100.0%), Computers, Engineering & Science (80.4%), and Architecture & Engineering (80.4%), while the most female-oriented occupations are Education, Arts & Media (100.0%), Health Diagnosing & Treating (100.0%), and Health Technologists (100.0%).
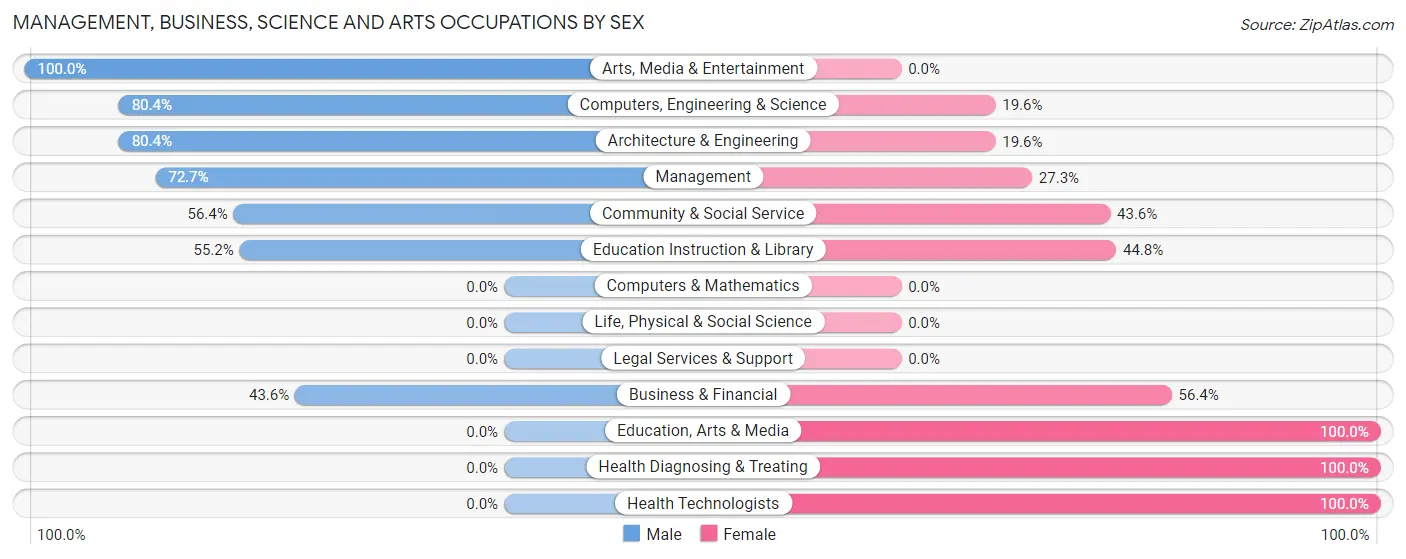
| Occupation | Male | Female |
| Management | 16 (72.7%) | 6 (27.3%) |
| Business & Financial | 17 (43.6%) | 22 (56.4%) |
| Computers, Engineering & Science | 45 (80.4%) | 11 (19.6%) |
| Computers & Mathematics | 0 (0.0%) | 0 (0.0%) |
| Architecture & Engineering | 45 (80.4%) | 11 (19.6%) |
| Life, Physical & Social Science | 0 (0.0%) | 0 (0.0%) |
| Community & Social Service | 22 (56.4%) | 17 (43.6%) |
| Education, Arts & Media | 0 (0.0%) | 4 (100.0%) |
| Legal Services & Support | 0 (0.0%) | 0 (0.0%) |
| Education Instruction & Library | 16 (55.2%) | 13 (44.8%) |
| Arts, Media & Entertainment | 6 (100.0%) | 0 (0.0%) |
| Health Diagnosing & Treating | 0 (0.0%) | 27 (100.0%) |
| Health Technologists | 0 (0.0%) | 8 (100.0%) |
| Total (Category) | 100 (54.6%) | 83 (45.4%) |
| Total (Overall) | 479 (61.3%) | 303 (38.8%) |
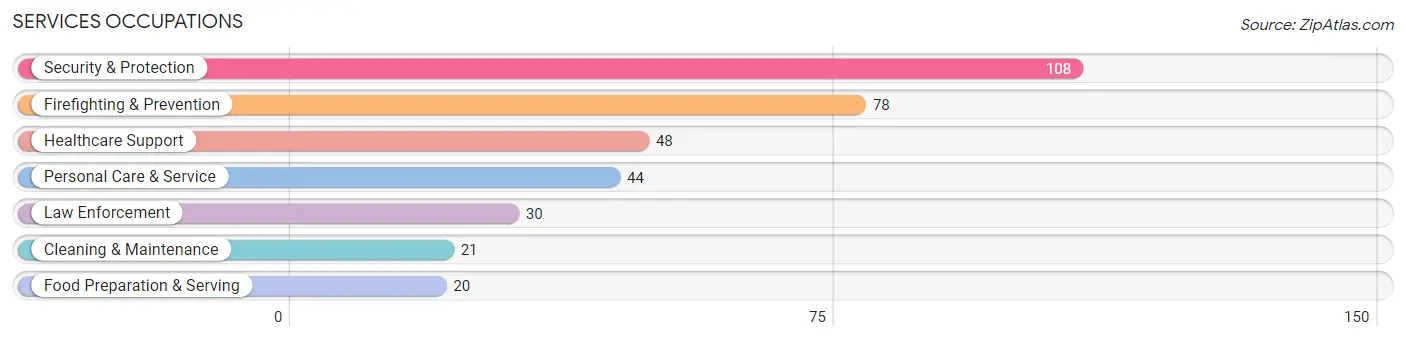
Services Occupations
The most common Services occupations in Berlin borough are Security & Protection (108 | 13.8%), Firefighting & Prevention (78 | 10.0%), Healthcare Support (48 | 6.1%), Personal Care & Service (44 | 5.6%), and Law Enforcement (30 | 3.8%).
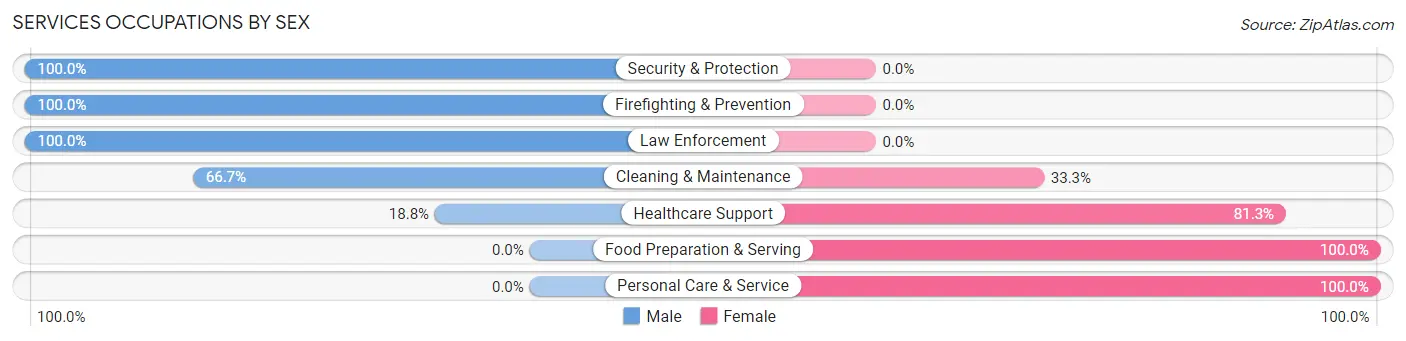
Services Occupations by Sex
Within the Services occupations in Berlin borough, the most male-oriented occupations are Security & Protection (100.0%), Firefighting & Prevention (100.0%), and Law Enforcement (100.0%), while the most female-oriented occupations are Food Preparation & Serving (100.0%), Personal Care & Service (100.0%), and Healthcare Support (81.2%).
| Occupation | Male | Female |
| Healthcare Support | 9 (18.8%) | 39 (81.2%) |
| Security & Protection | 108 (100.0%) | 0 (0.0%) |
| Firefighting & Prevention | 78 (100.0%) | 0 (0.0%) |
| Law Enforcement | 30 (100.0%) | 0 (0.0%) |
| Food Preparation & Serving | 0 (0.0%) | 20 (100.0%) |
| Cleaning & Maintenance | 14 (66.7%) | 7 (33.3%) |
| Personal Care & Service | 0 (0.0%) | 44 (100.0%) |
| Total (Category) | 131 (54.4%) | 110 (45.6%) |
| Total (Overall) | 479 (61.3%) | 303 (38.8%) |
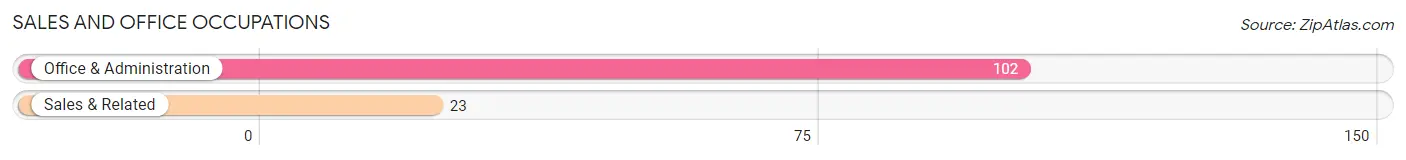
Sales and Office Occupations
The most common Sales and Office occupations in Berlin borough are Office & Administration (102 | 13.0%), and Sales & Related (23 | 2.9%).
Sales and Office Occupations by Sex
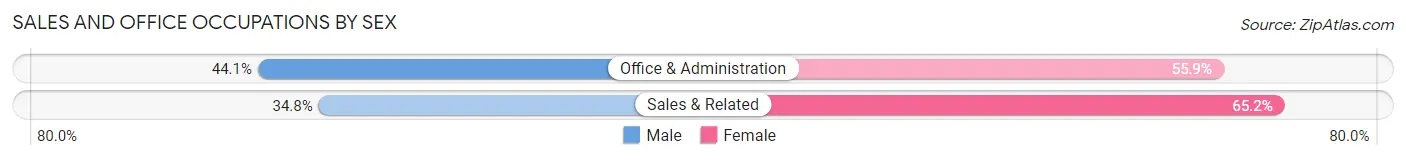
| Occupation | Male | Female |
| Sales & Related | 8 (34.8%) | 15 (65.2%) |
| Office & Administration | 45 (44.1%) | 57 (55.9%) |
| Total (Category) | 53 (42.4%) | 72 (57.6%) |
| Total (Overall) | 479 (61.3%) | 303 (38.8%) |
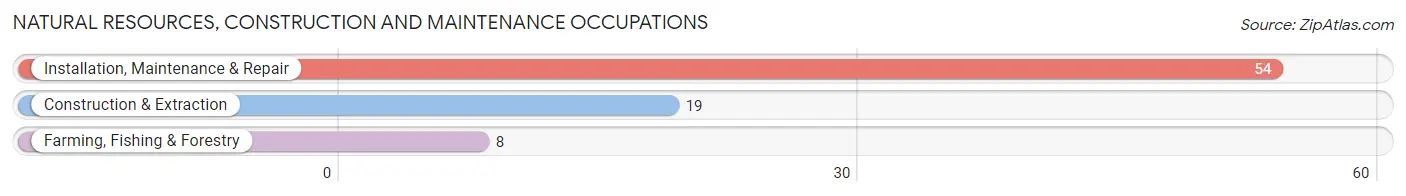
Natural Resources, Construction and Maintenance Occupations
The most common Natural Resources, Construction and Maintenance occupations in Berlin borough are Installation, Maintenance & Repair (54 | 6.9%), Construction & Extraction (19 | 2.4%), and Farming, Fishing & Forestry (8 | 1.0%).
Natural Resources, Construction and Maintenance Occupations by Sex
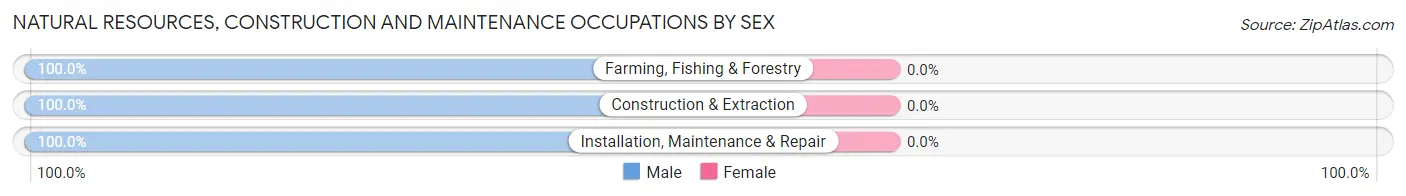
| Occupation | Male | Female |
| Farming, Fishing & Forestry | 8 (100.0%) | 0 (0.0%) |
| Construction & Extraction | 19 (100.0%) | 0 (0.0%) |
| Installation, Maintenance & Repair | 54 (100.0%) | 0 (0.0%) |
| Total (Category) | 81 (100.0%) | 0 (0.0%) |
| Total (Overall) | 479 (61.3%) | 303 (38.8%) |
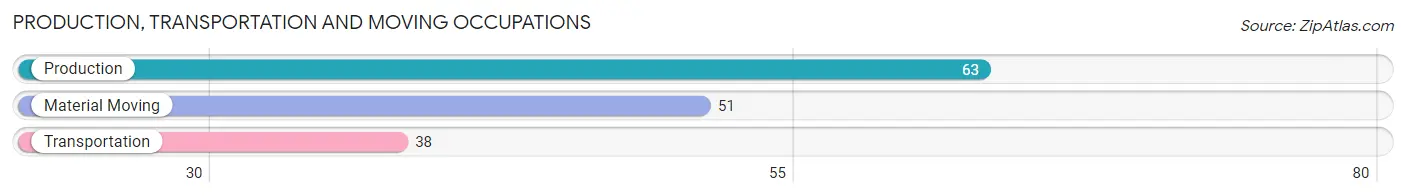
Production, Transportation and Moving Occupations
The most common Production, Transportation and Moving occupations in Berlin borough are Production (63 | 8.1%), Material Moving (51 | 6.5%), and Transportation (38 | 4.9%).
Production, Transportation and Moving Occupations by Sex
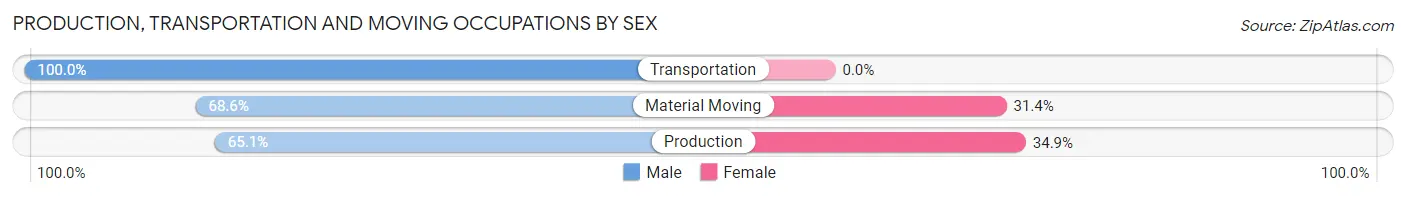
| Occupation | Male | Female |
| Production | 41 (65.1%) | 22 (34.9%) |
| Transportation | 38 (100.0%) | 0 (0.0%) |
| Material Moving | 35 (68.6%) | 16 (31.4%) |
| Total (Category) | 114 (75.0%) | 38 (25.0%) |
| Total (Overall) | 479 (61.3%) | 303 (38.8%) |
Employment Industries by Sex in Berlin borough
Employment Industries in Berlin borough
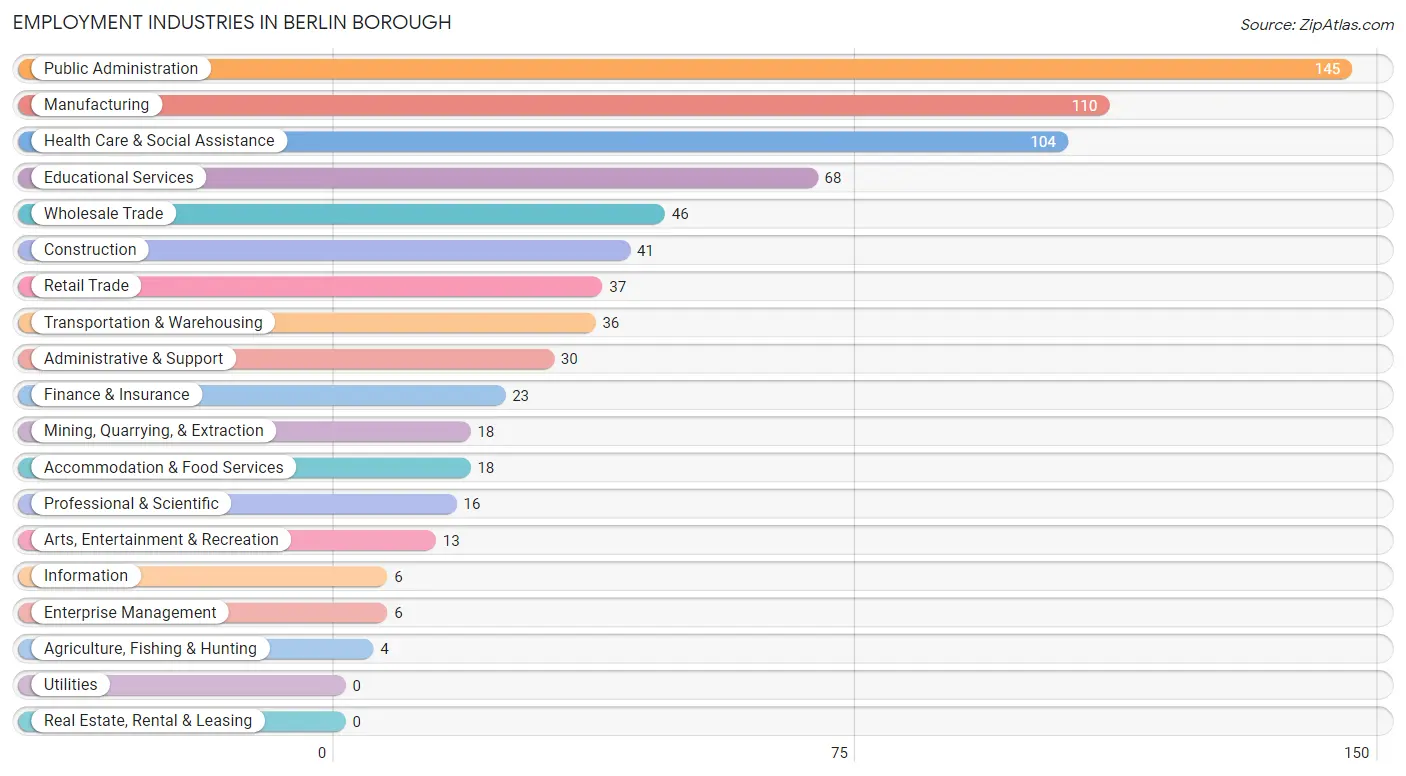
The major employment industries in Berlin borough include Public Administration (145 | 18.5%), Manufacturing (110 | 14.1%), Health Care & Social Assistance (104 | 13.3%), Educational Services (68 | 8.7%), and Wholesale Trade (46 | 5.9%).
Employment Industries by Sex in Berlin borough
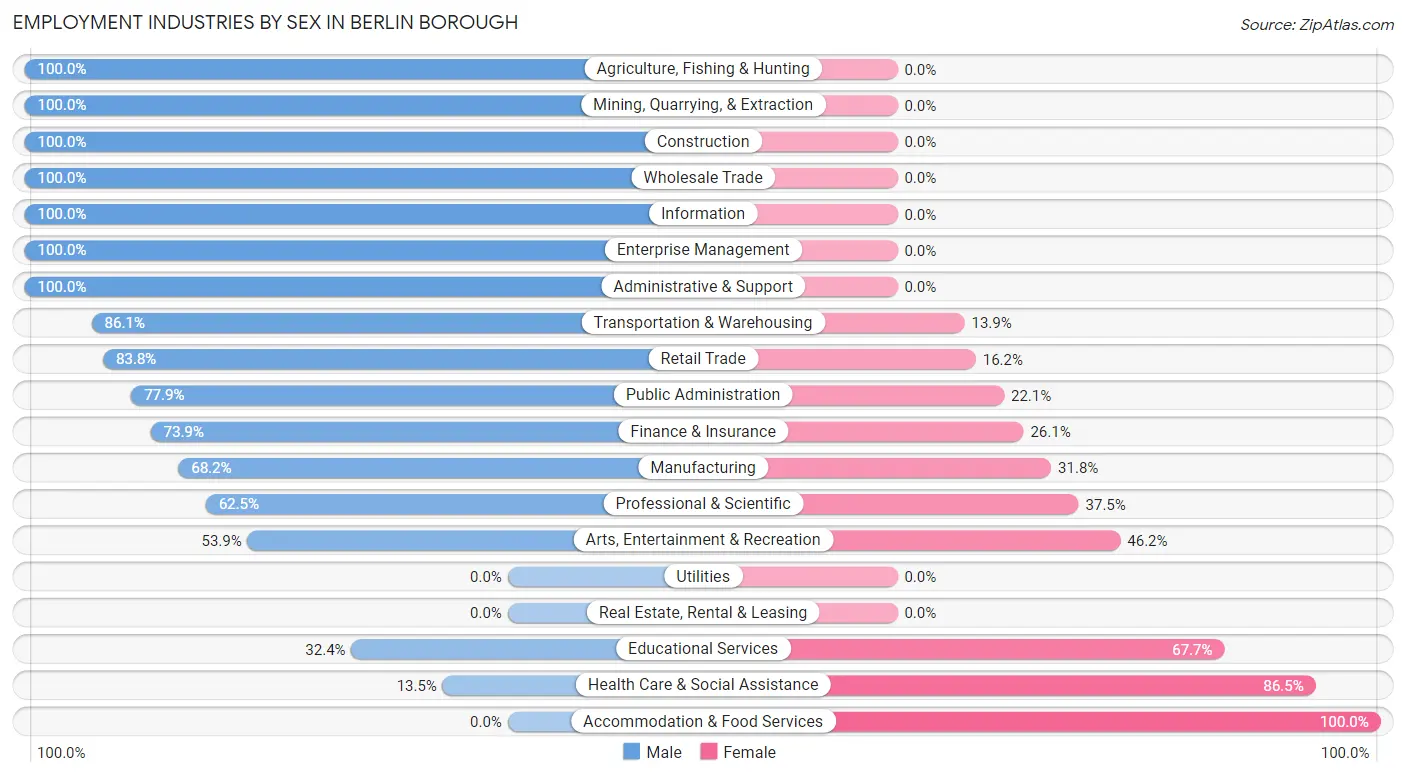
The Berlin borough industries that see more men than women are Agriculture, Fishing & Hunting (100.0%), Mining, Quarrying, & Extraction (100.0%), and Construction (100.0%), whereas the industries that tend to have a higher number of women are Accommodation & Food Services (100.0%), Health Care & Social Assistance (86.5%), and Educational Services (67.6%).
| Industry | Male | Female |
| Agriculture, Fishing & Hunting | 4 (100.0%) | 0 (0.0%) |
| Mining, Quarrying, & Extraction | 18 (100.0%) | 0 (0.0%) |
| Construction | 41 (100.0%) | 0 (0.0%) |
| Manufacturing | 75 (68.2%) | 35 (31.8%) |
| Wholesale Trade | 46 (100.0%) | 0 (0.0%) |
| Retail Trade | 31 (83.8%) | 6 (16.2%) |
| Transportation & Warehousing | 31 (86.1%) | 5 (13.9%) |
| Utilities | 0 (0.0%) | 0 (0.0%) |
| Information | 6 (100.0%) | 0 (0.0%) |
| Finance & Insurance | 17 (73.9%) | 6 (26.1%) |
| Real Estate, Rental & Leasing | 0 (0.0%) | 0 (0.0%) |
| Professional & Scientific | 10 (62.5%) | 6 (37.5%) |
| Enterprise Management | 6 (100.0%) | 0 (0.0%) |
| Administrative & Support | 30 (100.0%) | 0 (0.0%) |
| Educational Services | 22 (32.4%) | 46 (67.6%) |
| Health Care & Social Assistance | 14 (13.5%) | 90 (86.5%) |
| Arts, Entertainment & Recreation | 7 (53.8%) | 6 (46.2%) |
| Accommodation & Food Services | 0 (0.0%) | 18 (100.0%) |
| Public Administration | 113 (77.9%) | 32 (22.1%) |
| Total | 479 (61.3%) | 303 (38.8%) |
Education in Berlin borough
School Enrollment in Berlin borough
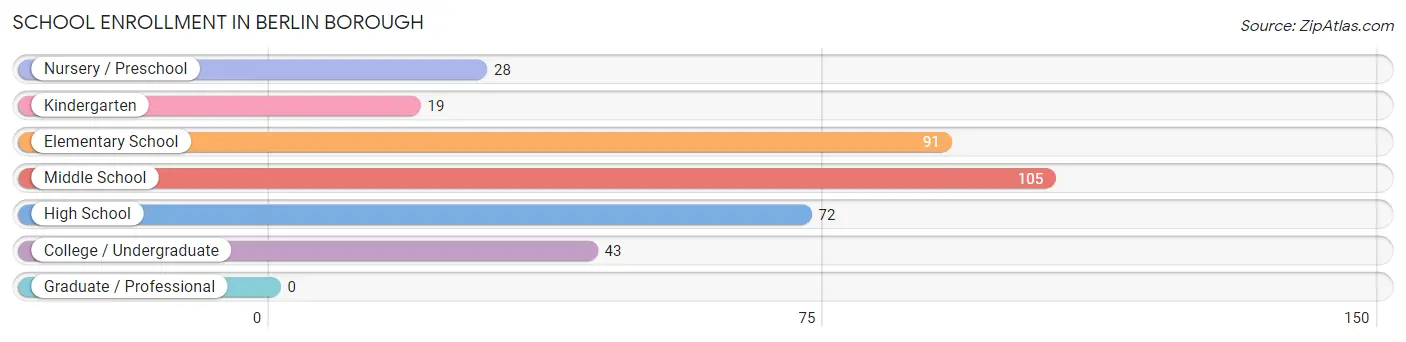
The most common levels of schooling among the 358 students in Berlin borough are middle school (105 | 29.3%), elementary school (91 | 25.4%), and high school (72 | 20.1%).
| School Level | # Students | % Students |
| Nursery / Preschool | 28 | 7.8% |
| Kindergarten | 19 | 5.3% |
| Elementary School | 91 | 25.4% |
| Middle School | 105 | 29.3% |
| High School | 72 | 20.1% |
| College / Undergraduate | 43 | 12.0% |
| Graduate / Professional | 0 | 0.0% |
| Total | 358 | 100.0% |
School Enrollment by Age by Funding Source in Berlin borough
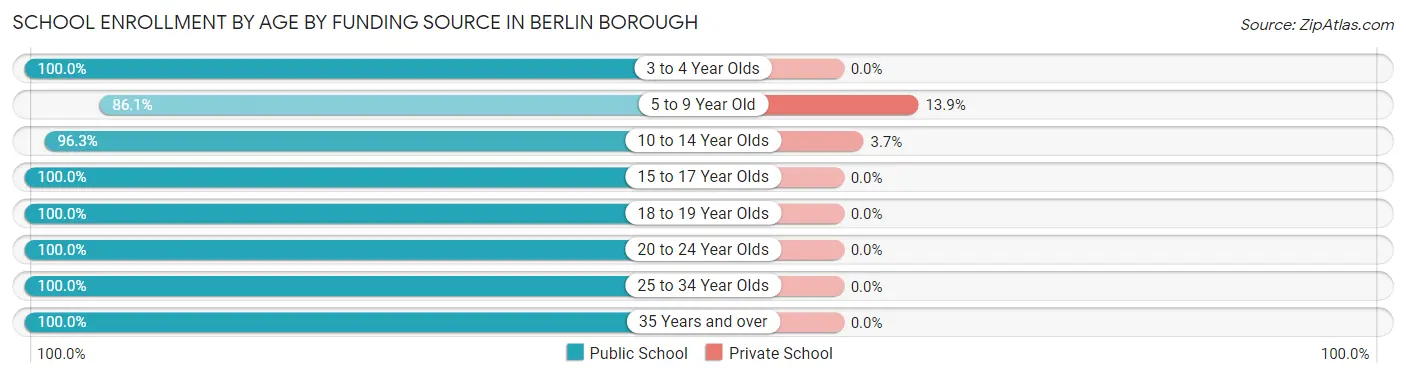
Out of a total of 358 students who are enrolled in schools in Berlin borough, 21 (5.9%) attend a private institution, while the remaining 337 (94.1%) are enrolled in public schools. The age group of 5 to 9 year old has the highest likelihood of being enrolled in private schools, with 17 (13.9% in the age bracket) enrolled. Conversely, the age group of 3 to 4 year olds has the lowest likelihood of being enrolled in a private school, with 13 (100.0% in the age bracket) attending a public institution.
| Age Bracket | Public School | Private School |
| 3 to 4 Year Olds | 13 (100.0%) | 0 (0.0%) |
| 5 to 9 Year Old | 105 (86.1%) | 17 (13.9%) |
| 10 to 14 Year Olds | 104 (96.3%) | 4 (3.7%) |
| 15 to 17 Year Olds | 62 (100.0%) | 0 (0.0%) |
| 18 to 19 Year Olds | 10 (100.0%) | 0 (0.0%) |
| 20 to 24 Year Olds | 4 (100.0%) | 0 (0.0%) |
| 25 to 34 Year Olds | 31 (100.0%) | 0 (0.0%) |
| 35 Years and over | 8 (100.0%) | 0 (0.0%) |
| Total | 337 (94.1%) | 21 (5.9%) |
Educational Attainment by Field of Study in Berlin borough
Education (88 | 43.1%), business (26 | 12.8%), communications (24 | 11.8%), science & technology (20 | 9.8%), and psychology (19 | 9.3%) are the most common fields of study among 204 individuals in Berlin borough who have obtained a bachelor's degree or higher.
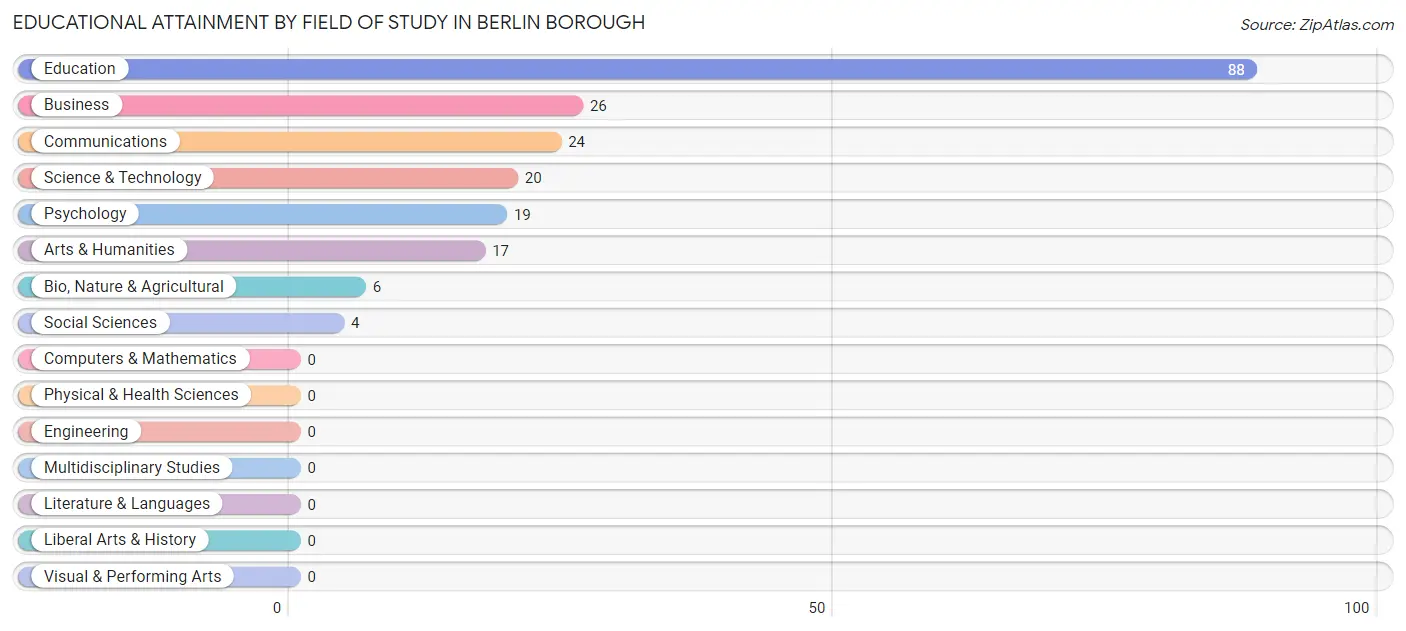
| Field of Study | # Graduates | % Graduates |
| Computers & Mathematics | 0 | 0.0% |
| Bio, Nature & Agricultural | 6 | 2.9% |
| Physical & Health Sciences | 0 | 0.0% |
| Psychology | 19 | 9.3% |
| Social Sciences | 4 | 2.0% |
| Engineering | 0 | 0.0% |
| Multidisciplinary Studies | 0 | 0.0% |
| Science & Technology | 20 | 9.8% |
| Business | 26 | 12.8% |
| Education | 88 | 43.1% |
| Literature & Languages | 0 | 0.0% |
| Liberal Arts & History | 0 | 0.0% |
| Visual & Performing Arts | 0 | 0.0% |
| Communications | 24 | 11.8% |
| Arts & Humanities | 17 | 8.3% |
| Total | 204 | 100.0% |
Transportation & Commute in Berlin borough
Vehicle Availability by Sex in Berlin borough
The most prevalent vehicle ownership categories in Berlin borough are males with 2 vehicles (270, accounting for 68.7%) and females with 2 vehicles (161, making up 91.5%).
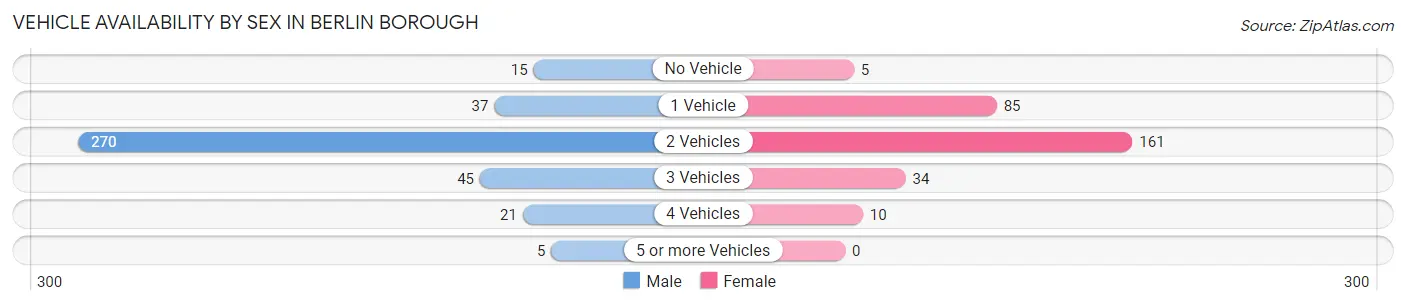
| Vehicles Available | Male | Female |
| No Vehicle | 15 (3.8%) | 5 (1.7%) |
| 1 Vehicle | 37 (9.4%) | 85 (28.8%) |
| 2 Vehicles | 270 (68.7%) | 161 (54.6%) |
| 3 Vehicles | 45 (11.5%) | 34 (11.5%) |
| 4 Vehicles | 21 (5.3%) | 10 (3.4%) |
| 5 or more Vehicles | 5 (1.3%) | 0 (0.0%) |
| Total | 393 (100.0%) | 295 (100.0%) |
Commute Time in Berlin borough
The most frequently occuring commute durations in Berlin borough are 20 to 24 minutes (183 commuters, 27.7%), 15 to 19 minutes (162 commuters, 24.5%), and 5 to 9 minutes (84 commuters, 12.7%).
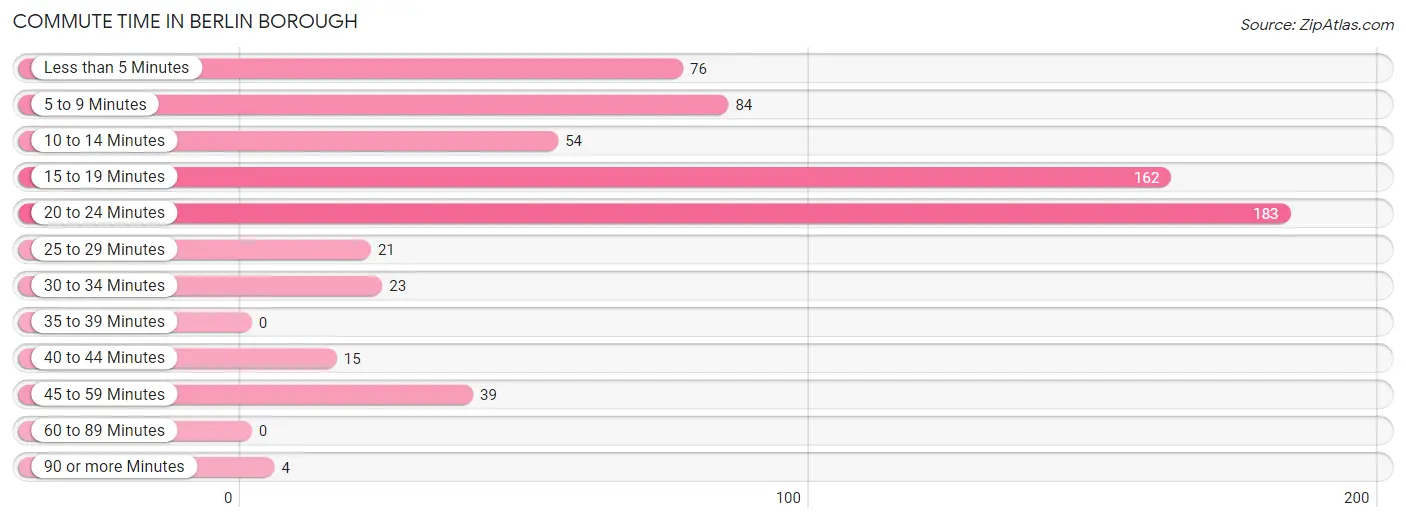
| Commute Time | # Commuters | % Commuters |
| Less than 5 Minutes | 76 | 11.5% |
| 5 to 9 Minutes | 84 | 12.7% |
| 10 to 14 Minutes | 54 | 8.2% |
| 15 to 19 Minutes | 162 | 24.5% |
| 20 to 24 Minutes | 183 | 27.7% |
| 25 to 29 Minutes | 21 | 3.2% |
| 30 to 34 Minutes | 23 | 3.5% |
| 35 to 39 Minutes | 0 | 0.0% |
| 40 to 44 Minutes | 15 | 2.3% |
| 45 to 59 Minutes | 39 | 5.9% |
| 60 to 89 Minutes | 0 | 0.0% |
| 90 or more Minutes | 4 | 0.6% |
Commute Time by Sex in Berlin borough
The most common commute times in Berlin borough are 20 to 24 minutes (122 commuters, 31.7%) for males and 15 to 19 minutes (93 commuters, 33.7%) for females.
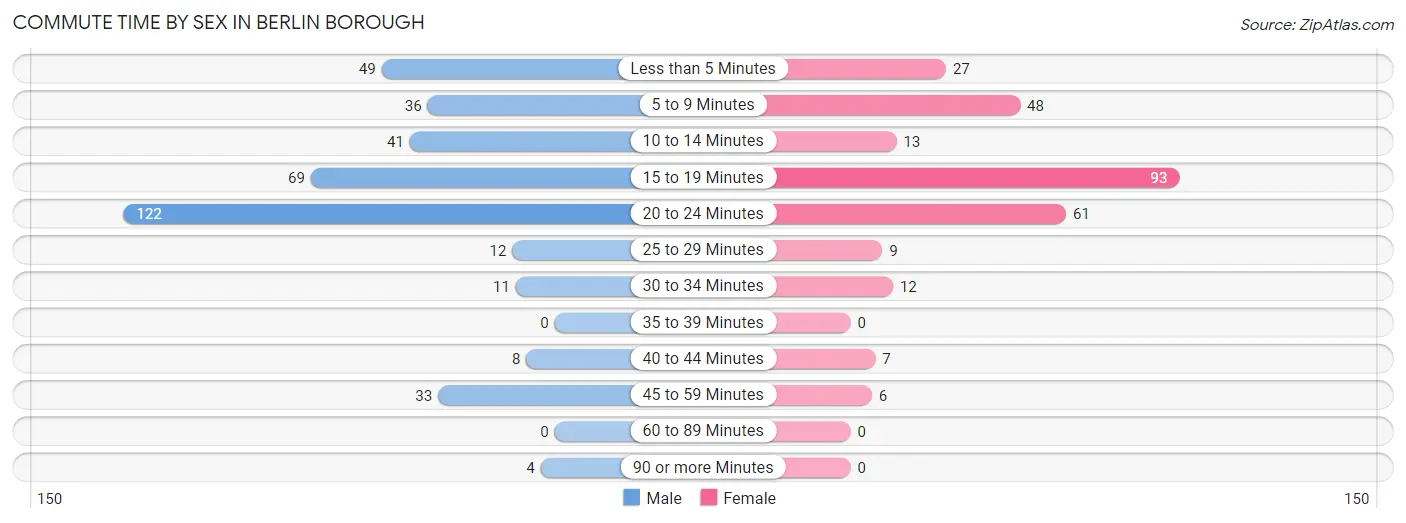
| Commute Time | Male | Female |
| Less than 5 Minutes | 49 (12.7%) | 27 (9.8%) |
| 5 to 9 Minutes | 36 (9.3%) | 48 (17.4%) |
| 10 to 14 Minutes | 41 (10.6%) | 13 (4.7%) |
| 15 to 19 Minutes | 69 (17.9%) | 93 (33.7%) |
| 20 to 24 Minutes | 122 (31.7%) | 61 (22.1%) |
| 25 to 29 Minutes | 12 (3.1%) | 9 (3.3%) |
| 30 to 34 Minutes | 11 (2.9%) | 12 (4.3%) |
| 35 to 39 Minutes | 0 (0.0%) | 0 (0.0%) |
| 40 to 44 Minutes | 8 (2.1%) | 7 (2.5%) |
| 45 to 59 Minutes | 33 (8.6%) | 6 (2.2%) |
| 60 to 89 Minutes | 0 (0.0%) | 0 (0.0%) |
| 90 or more Minutes | 4 (1.0%) | 0 (0.0%) |
Time of Departure to Work by Sex in Berlin borough
The most frequent times of departure to work in Berlin borough are 12:00 AM to 4:59 AM (120, 31.2%) for males and 8:00 AM to 8:29 AM (54, 19.6%) for females.
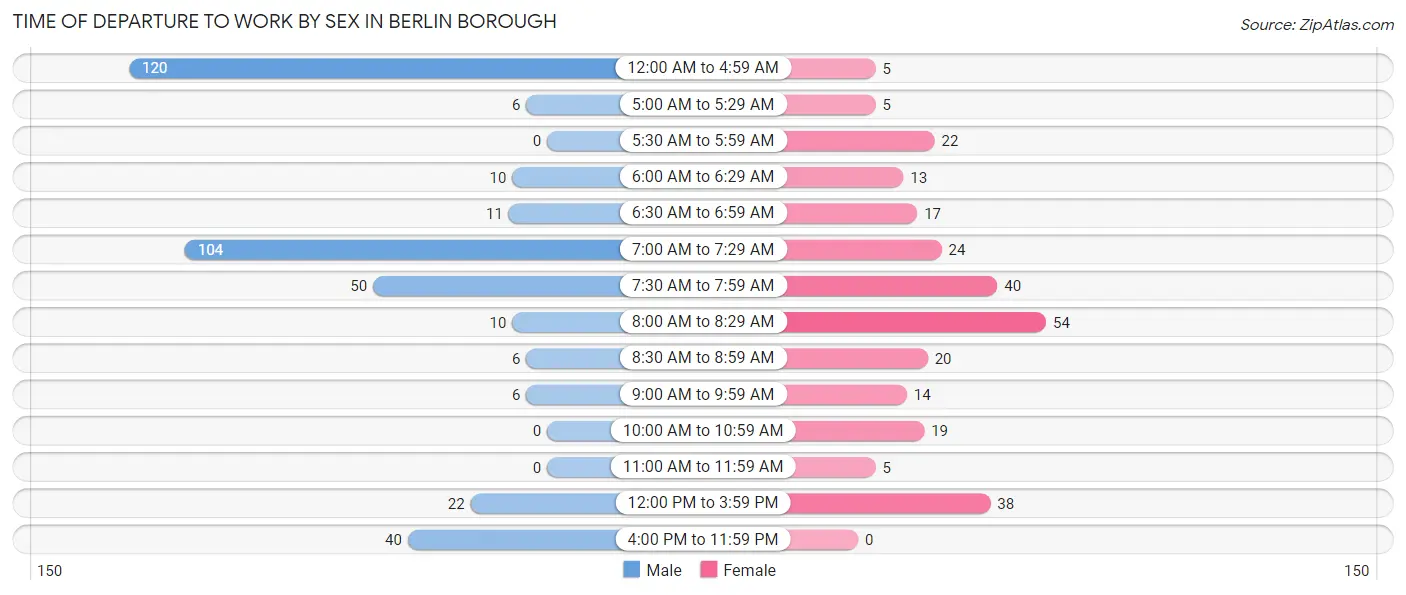
| Time of Departure | Male | Female |
| 12:00 AM to 4:59 AM | 120 (31.2%) | 5 (1.8%) |
| 5:00 AM to 5:29 AM | 6 (1.6%) | 5 (1.8%) |
| 5:30 AM to 5:59 AM | 0 (0.0%) | 22 (8.0%) |
| 6:00 AM to 6:29 AM | 10 (2.6%) | 13 (4.7%) |
| 6:30 AM to 6:59 AM | 11 (2.9%) | 17 (6.2%) |
| 7:00 AM to 7:29 AM | 104 (27.0%) | 24 (8.7%) |
| 7:30 AM to 7:59 AM | 50 (13.0%) | 40 (14.5%) |
| 8:00 AM to 8:29 AM | 10 (2.6%) | 54 (19.6%) |
| 8:30 AM to 8:59 AM | 6 (1.6%) | 20 (7.2%) |
| 9:00 AM to 9:59 AM | 6 (1.6%) | 14 (5.1%) |
| 10:00 AM to 10:59 AM | 0 (0.0%) | 19 (6.9%) |
| 11:00 AM to 11:59 AM | 0 (0.0%) | 5 (1.8%) |
| 12:00 PM to 3:59 PM | 22 (5.7%) | 38 (13.8%) |
| 4:00 PM to 11:59 PM | 40 (10.4%) | 0 (0.0%) |
| Total | 385 (100.0%) | 276 (100.0%) |
Housing Occupancy in Berlin borough
Occupancy by Ownership in Berlin borough
Of the total 932 dwellings in Berlin borough, owner-occupied units account for 639 (68.6%), while renter-occupied units make up 293 (31.4%).
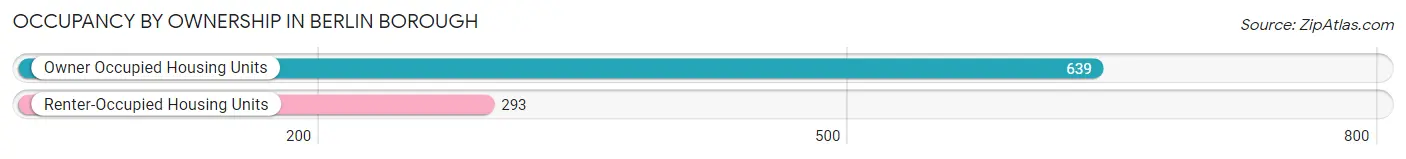
| Occupancy | # Housing Units | % Housing Units |
| Owner Occupied Housing Units | 639 | 68.6% |
| Renter-Occupied Housing Units | 293 | 31.4% |
| Total Occupied Housing Units | 932 | 100.0% |
Occupancy by Household Size in Berlin borough
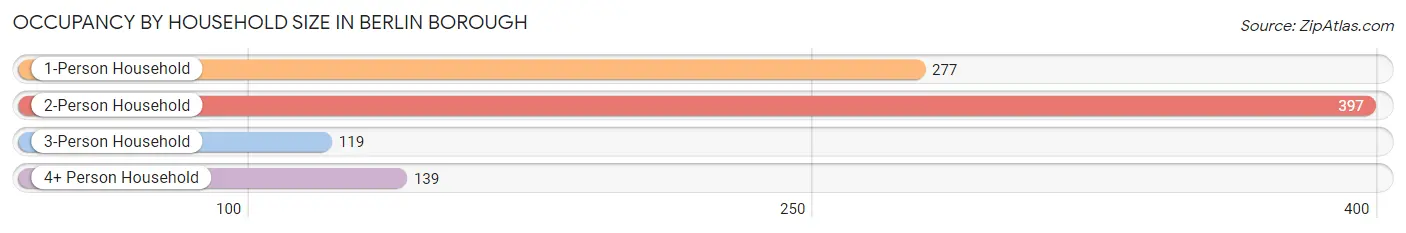
| Household Size | # Housing Units | % Housing Units |
| 1-Person Household | 277 | 29.7% |
| 2-Person Household | 397 | 42.6% |
| 3-Person Household | 119 | 12.8% |
| 4+ Person Household | 139 | 14.9% |
| Total Housing Units | 932 | 100.0% |
Occupancy by Ownership by Household Size in Berlin borough
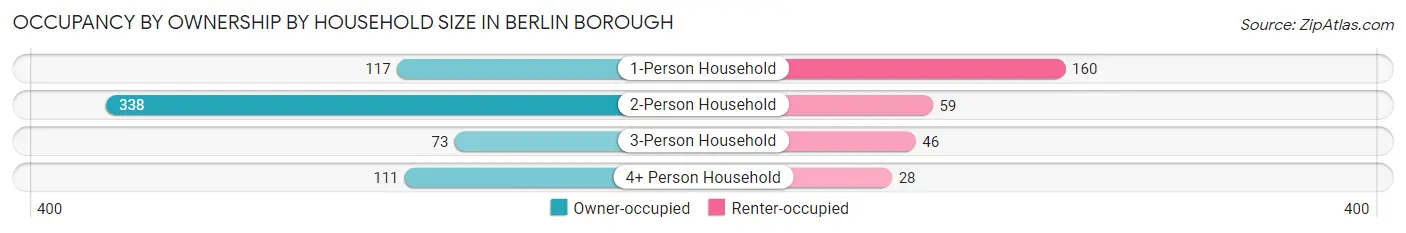
| Household Size | Owner-occupied | Renter-occupied |
| 1-Person Household | 117 (42.2%) | 160 (57.8%) |
| 2-Person Household | 338 (85.1%) | 59 (14.9%) |
| 3-Person Household | 73 (61.3%) | 46 (38.7%) |
| 4+ Person Household | 111 (79.9%) | 28 (20.1%) |
| Total Housing Units | 639 (68.6%) | 293 (31.4%) |
Occupancy by Educational Attainment in Berlin borough
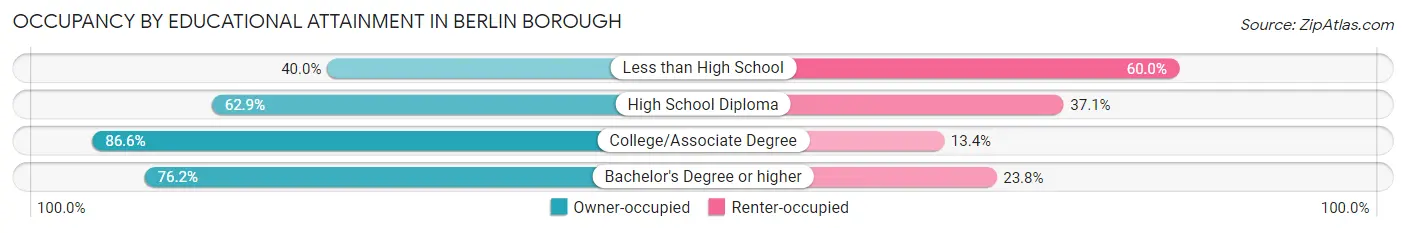
| Household Size | Owner-occupied | Renter-occupied |
| Less than High School | 20 (40.0%) | 30 (60.0%) |
| High School Diploma | 349 (62.9%) | 206 (37.1%) |
| College/Associate Degree | 174 (86.6%) | 27 (13.4%) |
| Bachelor's Degree or higher | 96 (76.2%) | 30 (23.8%) |
Occupancy by Age of Householder in Berlin borough
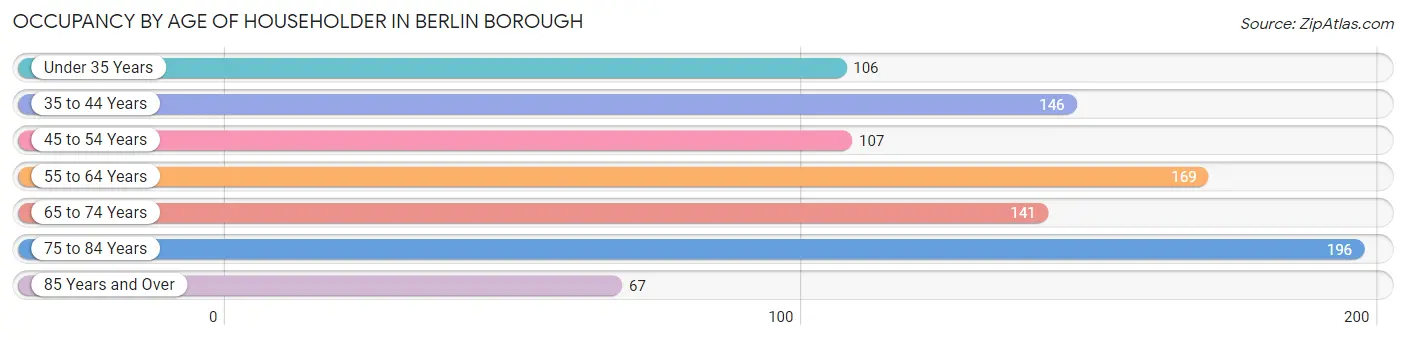
| Age Bracket | # Households | % Households |
| Under 35 Years | 106 | 11.4% |
| 35 to 44 Years | 146 | 15.7% |
| 45 to 54 Years | 107 | 11.5% |
| 55 to 64 Years | 169 | 18.1% |
| 65 to 74 Years | 141 | 15.1% |
| 75 to 84 Years | 196 | 21.0% |
| 85 Years and Over | 67 | 7.2% |
| Total | 932 | 100.0% |
Housing Finances in Berlin borough
Median Income by Occupancy in Berlin borough
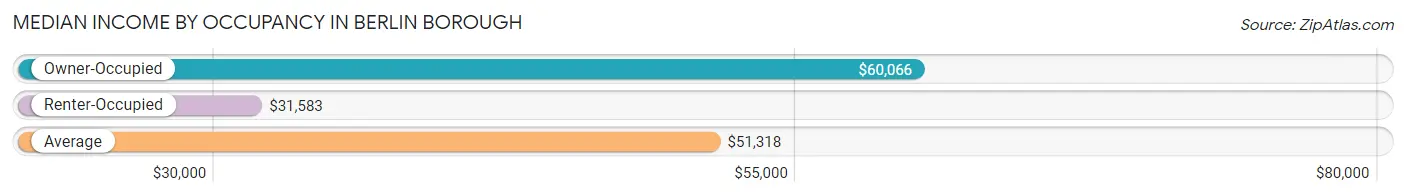
| Occupancy Type | # Households | Median Income |
| Owner-Occupied | 639 (68.6%) | $60,066 |
| Renter-Occupied | 293 (31.4%) | $31,583 |
| Average | 932 (100.0%) | $51,318 |
Occupancy by Householder Income Bracket in Berlin borough
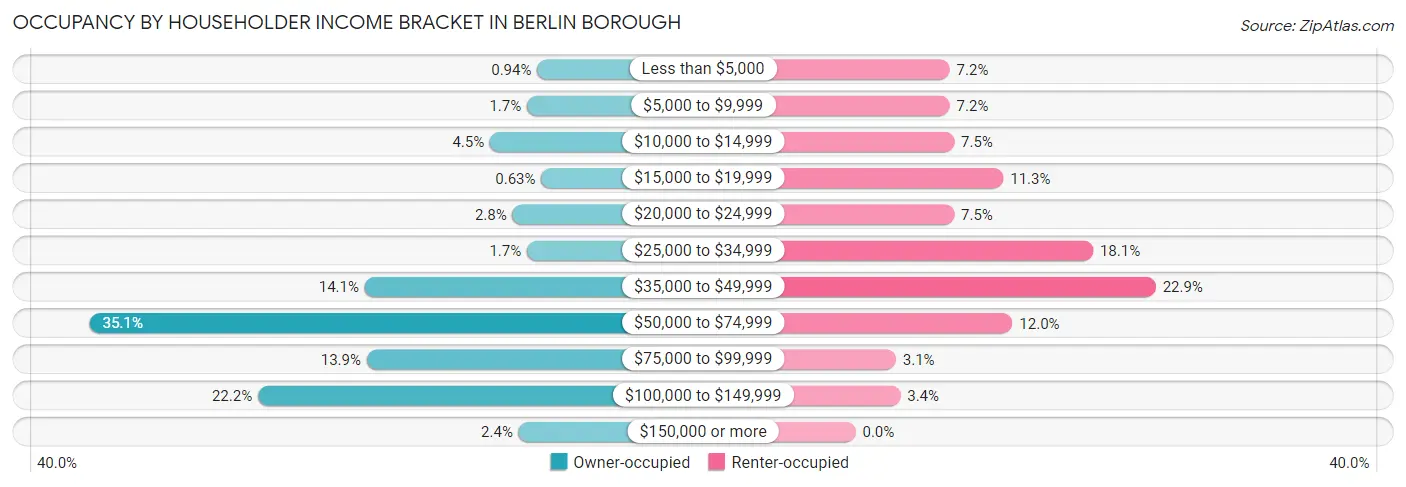
| Income Bracket | Owner-occupied | Renter-occupied |
| Less than $5,000 | 6 (0.9%) | 21 (7.2%) |
| $5,000 to $9,999 | 11 (1.7%) | 21 (7.2%) |
| $10,000 to $14,999 | 29 (4.5%) | 22 (7.5%) |
| $15,000 to $19,999 | 4 (0.6%) | 33 (11.3%) |
| $20,000 to $24,999 | 18 (2.8%) | 22 (7.5%) |
| $25,000 to $34,999 | 11 (1.7%) | 53 (18.1%) |
| $35,000 to $49,999 | 90 (14.1%) | 67 (22.9%) |
| $50,000 to $74,999 | 224 (35.0%) | 35 (11.9%) |
| $75,000 to $99,999 | 89 (13.9%) | 9 (3.1%) |
| $100,000 to $149,999 | 142 (22.2%) | 10 (3.4%) |
| $150,000 or more | 15 (2.4%) | 0 (0.0%) |
| Total | 639 (100.0%) | 293 (100.0%) |
Monthly Housing Cost Tiers in Berlin borough
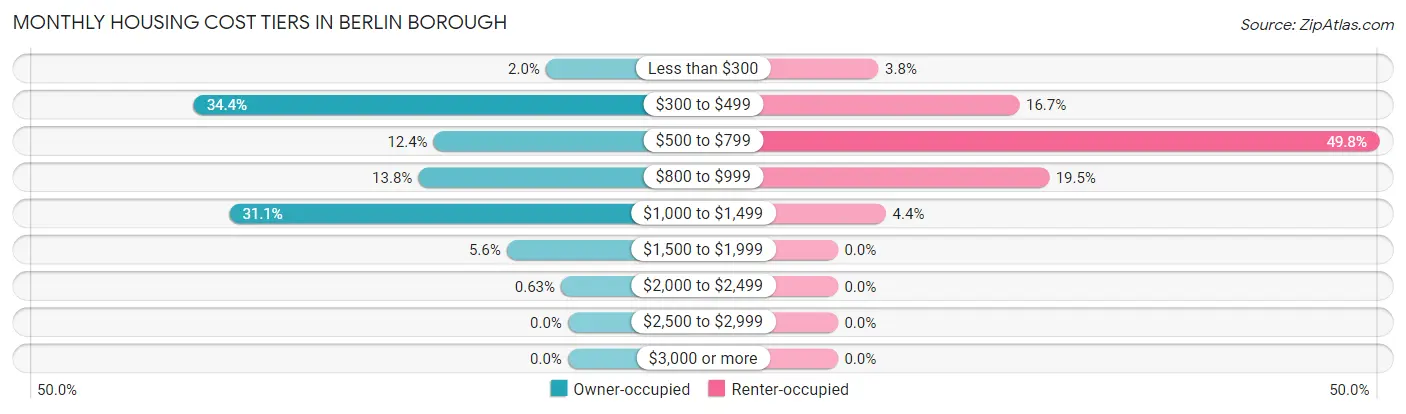
| Monthly Cost | Owner-occupied | Renter-occupied |
| Less than $300 | 13 (2.0%) | 11 (3.7%) |
| $300 to $499 | 220 (34.4%) | 49 (16.7%) |
| $500 to $799 | 79 (12.4%) | 146 (49.8%) |
| $800 to $999 | 88 (13.8%) | 57 (19.5%) |
| $1,000 to $1,499 | 199 (31.1%) | 13 (4.4%) |
| $1,500 to $1,999 | 36 (5.6%) | 0 (0.0%) |
| $2,000 to $2,499 | 4 (0.6%) | 0 (0.0%) |
| $2,500 to $2,999 | 0 (0.0%) | 0 (0.0%) |
| $3,000 or more | 0 (0.0%) | 0 (0.0%) |
| Total | 639 (100.0%) | 293 (100.0%) |
Physical Housing Characteristics in Berlin borough
Housing Structures in Berlin borough
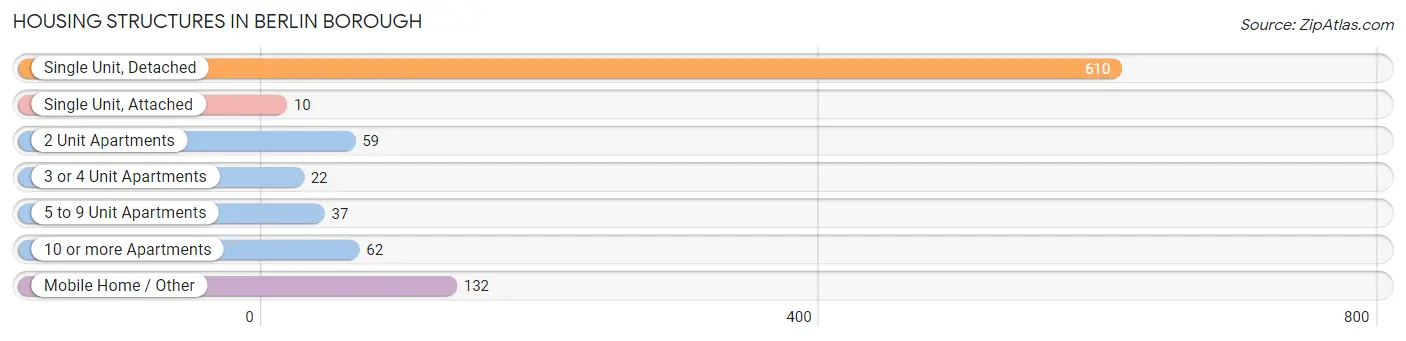
| Structure Type | # Housing Units | % Housing Units |
| Single Unit, Detached | 610 | 65.4% |
| Single Unit, Attached | 10 | 1.1% |
| 2 Unit Apartments | 59 | 6.3% |
| 3 or 4 Unit Apartments | 22 | 2.4% |
| 5 to 9 Unit Apartments | 37 | 4.0% |
| 10 or more Apartments | 62 | 6.7% |
| Mobile Home / Other | 132 | 14.2% |
| Total | 932 | 100.0% |
Housing Structures by Occupancy in Berlin borough
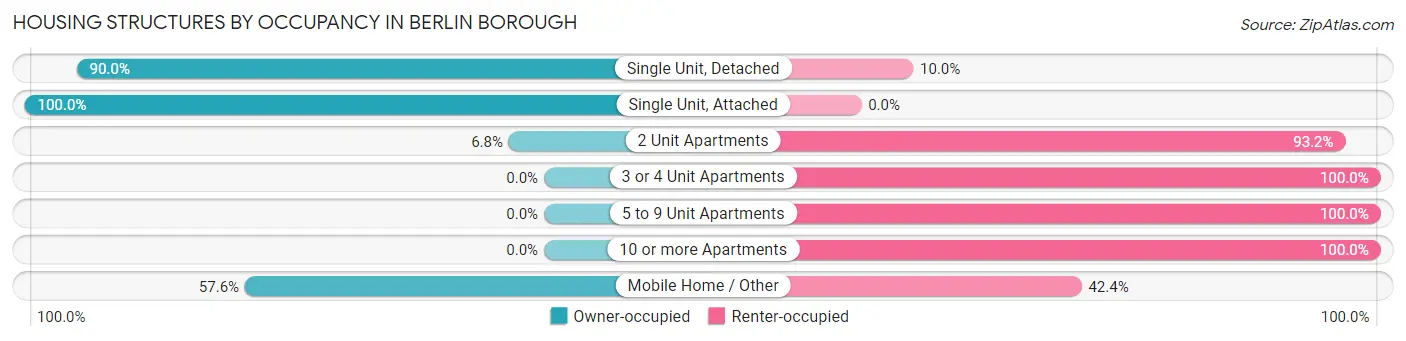
| Structure Type | Owner-occupied | Renter-occupied |
| Single Unit, Detached | 549 (90.0%) | 61 (10.0%) |
| Single Unit, Attached | 10 (100.0%) | 0 (0.0%) |
| 2 Unit Apartments | 4 (6.8%) | 55 (93.2%) |
| 3 or 4 Unit Apartments | 0 (0.0%) | 22 (100.0%) |
| 5 to 9 Unit Apartments | 0 (0.0%) | 37 (100.0%) |
| 10 or more Apartments | 0 (0.0%) | 62 (100.0%) |
| Mobile Home / Other | 76 (57.6%) | 56 (42.4%) |
| Total | 639 (68.6%) | 293 (31.4%) |
Housing Structures by Number of Rooms in Berlin borough
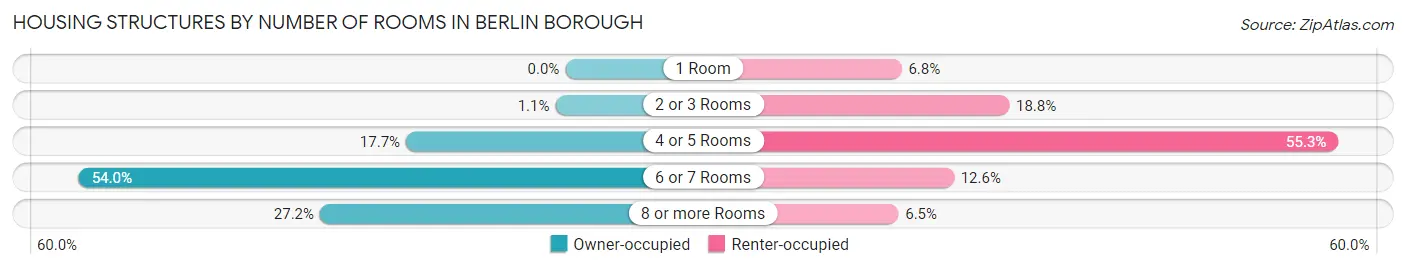
| Number of Rooms | Owner-occupied | Renter-occupied |
| 1 Room | 0 (0.0%) | 20 (6.8%) |
| 2 or 3 Rooms | 7 (1.1%) | 55 (18.8%) |
| 4 or 5 Rooms | 113 (17.7%) | 162 (55.3%) |
| 6 or 7 Rooms | 345 (54.0%) | 37 (12.6%) |
| 8 or more Rooms | 174 (27.2%) | 19 (6.5%) |
| Total | 639 (100.0%) | 293 (100.0%) |
Housing Structure by Heating Type in Berlin borough
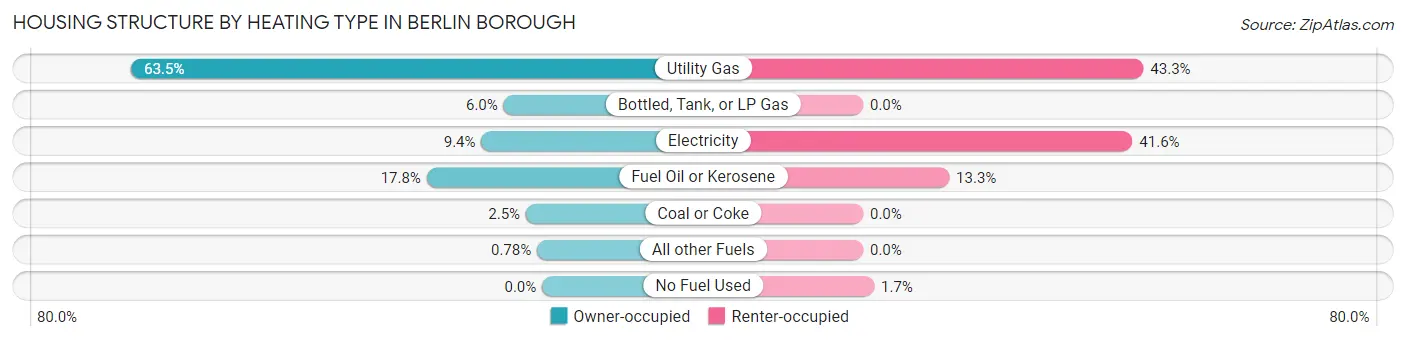
| Heating Type | Owner-occupied | Renter-occupied |
| Utility Gas | 406 (63.5%) | 127 (43.3%) |
| Bottled, Tank, or LP Gas | 38 (5.9%) | 0 (0.0%) |
| Electricity | 60 (9.4%) | 122 (41.6%) |
| Fuel Oil or Kerosene | 114 (17.8%) | 39 (13.3%) |
| Coal or Coke | 16 (2.5%) | 0 (0.0%) |
| All other Fuels | 5 (0.8%) | 0 (0.0%) |
| No Fuel Used | 0 (0.0%) | 5 (1.7%) |
| Total | 639 (100.0%) | 293 (100.0%) |
Household Vehicle Usage in Berlin borough
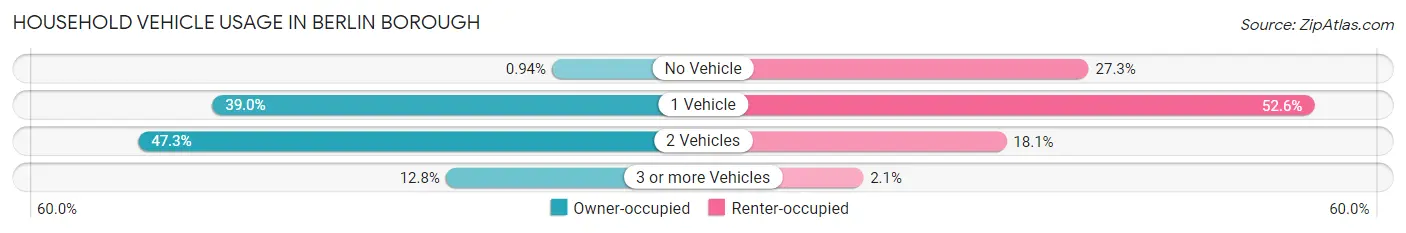
| Vehicles per Household | Owner-occupied | Renter-occupied |
| No Vehicle | 6 (0.9%) | 80 (27.3%) |
| 1 Vehicle | 249 (39.0%) | 154 (52.6%) |
| 2 Vehicles | 302 (47.3%) | 53 (18.1%) |
| 3 or more Vehicles | 82 (12.8%) | 6 (2.1%) |
| Total | 639 (100.0%) | 293 (100.0%) |
Real Estate & Mortgages in Berlin borough
Real Estate and Mortgage Overview in Berlin borough
| Characteristic | Without Mortgage | With Mortgage |
| Housing Units | 322 | 317 |
| Median Property Value | $110,600 | $152,600 |
| Median Household Income | $50,951 | $15 |
| Monthly Housing Costs | $436 | $0 |
| Real Estate Taxes | $1,211 | $13 |
Property Value by Mortgage Status in Berlin borough
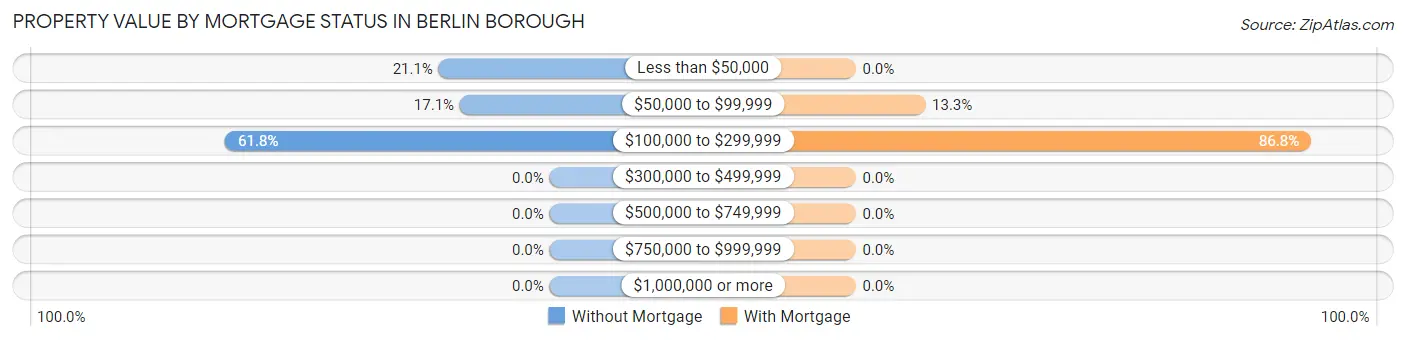
| Property Value | Without Mortgage | With Mortgage |
| Less than $50,000 | 68 (21.1%) | 0 (0.0%) |
| $50,000 to $99,999 | 55 (17.1%) | 42 (13.3%) |
| $100,000 to $299,999 | 199 (61.8%) | 275 (86.8%) |
| $300,000 to $499,999 | 0 (0.0%) | 0 (0.0%) |
| $500,000 to $749,999 | 0 (0.0%) | 0 (0.0%) |
| $750,000 to $999,999 | 0 (0.0%) | 0 (0.0%) |
| $1,000,000 or more | 0 (0.0%) | 0 (0.0%) |
| Total | 322 (100.0%) | 317 (100.0%) |
Household Income by Mortgage Status in Berlin borough
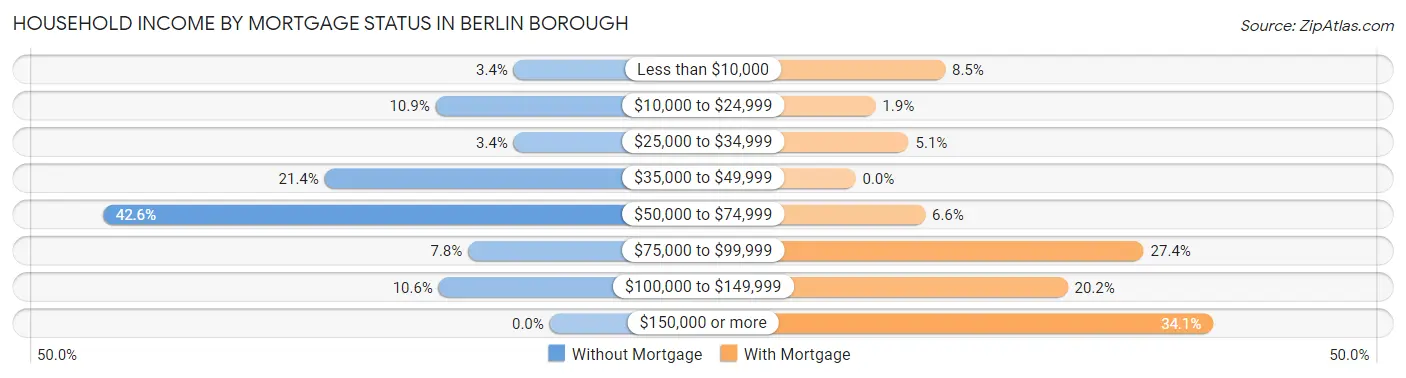
| Household Income | Without Mortgage | With Mortgage |
| Less than $10,000 | 11 (3.4%) | 27 (8.5%) |
| $10,000 to $24,999 | 35 (10.9%) | 6 (1.9%) |
| $25,000 to $34,999 | 11 (3.4%) | 16 (5.1%) |
| $35,000 to $49,999 | 69 (21.4%) | 0 (0.0%) |
| $50,000 to $74,999 | 137 (42.5%) | 21 (6.6%) |
| $75,000 to $99,999 | 25 (7.8%) | 87 (27.4%) |
| $100,000 to $149,999 | 34 (10.6%) | 64 (20.2%) |
| $150,000 or more | 0 (0.0%) | 108 (34.1%) |
| Total | 322 (100.0%) | 317 (100.0%) |
Property Value to Household Income Ratio in Berlin borough
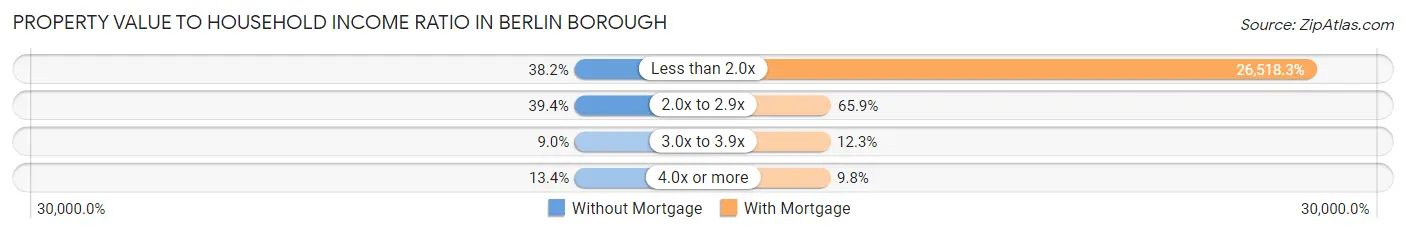
| Value-to-Income Ratio | Without Mortgage | With Mortgage |
| Less than 2.0x | 123 (38.2%) | 84,063 (26,518.3%) |
| 2.0x to 2.9x | 127 (39.4%) | 209 (65.9%) |
| 3.0x to 3.9x | 29 (9.0%) | 39 (12.3%) |
| 4.0x or more | 43 (13.4%) | 31 (9.8%) |
| Total | 322 (100.0%) | 317 (100.0%) |
Real Estate Taxes by Mortgage Status in Berlin borough
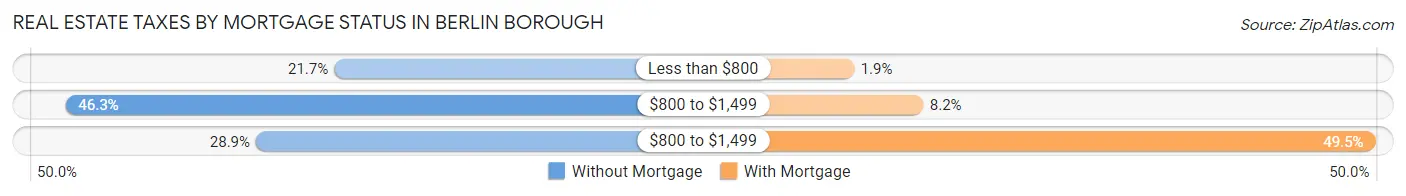
| Property Taxes | Without Mortgage | With Mortgage |
| Less than $800 | 70 (21.7%) | 6 (1.9%) |
| $800 to $1,499 | 149 (46.3%) | 26 (8.2%) |
| $800 to $1,499 | 93 (28.9%) | 157 (49.5%) |
| Total | 322 (100.0%) | 317 (100.0%) |
Health & Disability in Berlin borough
Health Insurance Coverage by Age in Berlin borough
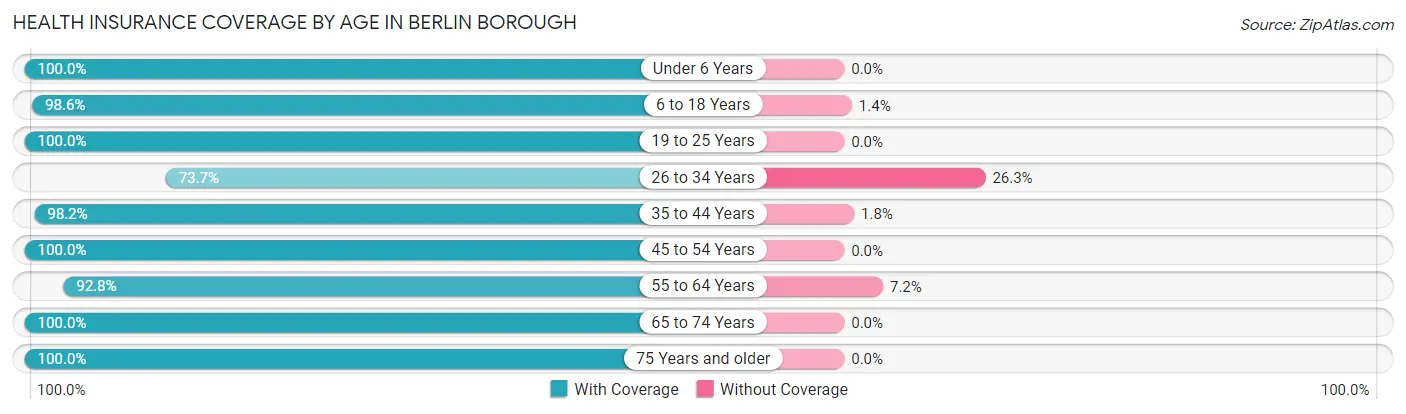
| Age Bracket | With Coverage | Without Coverage |
| Under 6 Years | 190 (100.0%) | 0 (0.0%) |
| 6 to 18 Years | 348 (98.6%) | 5 (1.4%) |
| 19 to 25 Years | 90 (100.0%) | 0 (0.0%) |
| 26 to 34 Years | 112 (73.7%) | 40 (26.3%) |
| 35 to 44 Years | 214 (98.2%) | 4 (1.8%) |
| 45 to 54 Years | 209 (100.0%) | 0 (0.0%) |
| 55 to 64 Years | 244 (92.8%) | 19 (7.2%) |
| 65 to 74 Years | 250 (100.0%) | 0 (0.0%) |
| 75 Years and older | 429 (100.0%) | 0 (0.0%) |
| Total | 2,086 (96.8%) | 68 (3.2%) |
Health Insurance Coverage by Citizenship Status in Berlin borough
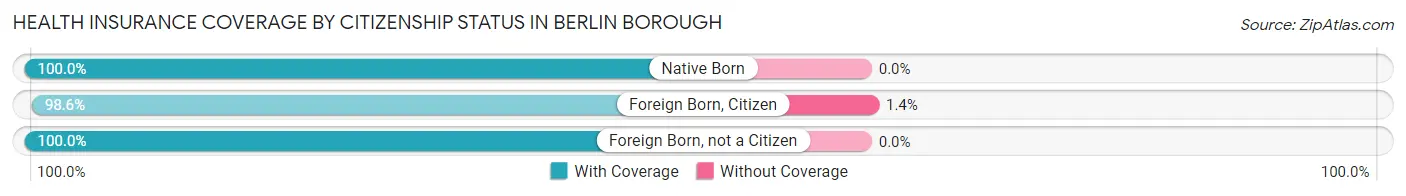
| Citizenship Status | With Coverage | Without Coverage |
| Native Born | 190 (100.0%) | 0 (0.0%) |
| Foreign Born, Citizen | 348 (98.6%) | 5 (1.4%) |
| Foreign Born, not a Citizen | 90 (100.0%) | 0 (0.0%) |
Health Insurance Coverage by Household Income in Berlin borough
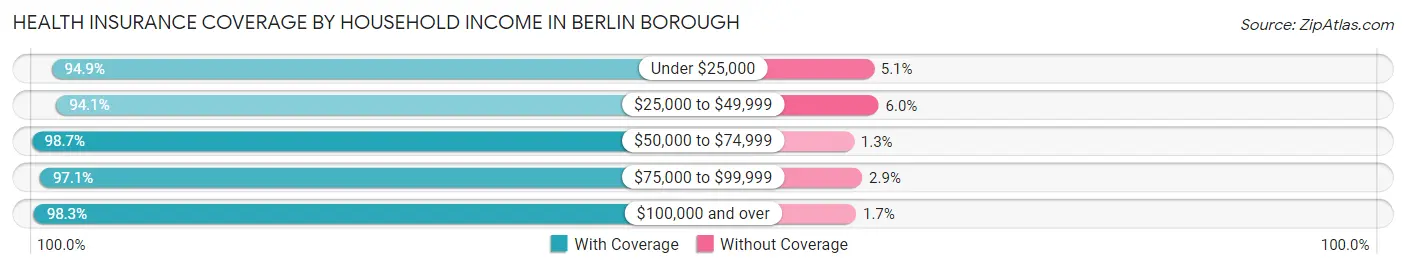
| Household Income | With Coverage | Without Coverage |
| Under $25,000 | 244 (94.9%) | 13 (5.1%) |
| $25,000 to $49,999 | 474 (94.1%) | 30 (5.9%) |
| $50,000 to $74,999 | 596 (98.7%) | 8 (1.3%) |
| $75,000 to $99,999 | 304 (97.1%) | 9 (2.9%) |
| $100,000 and over | 454 (98.3%) | 8 (1.7%) |
Public vs Private Health Insurance Coverage by Age in Berlin borough
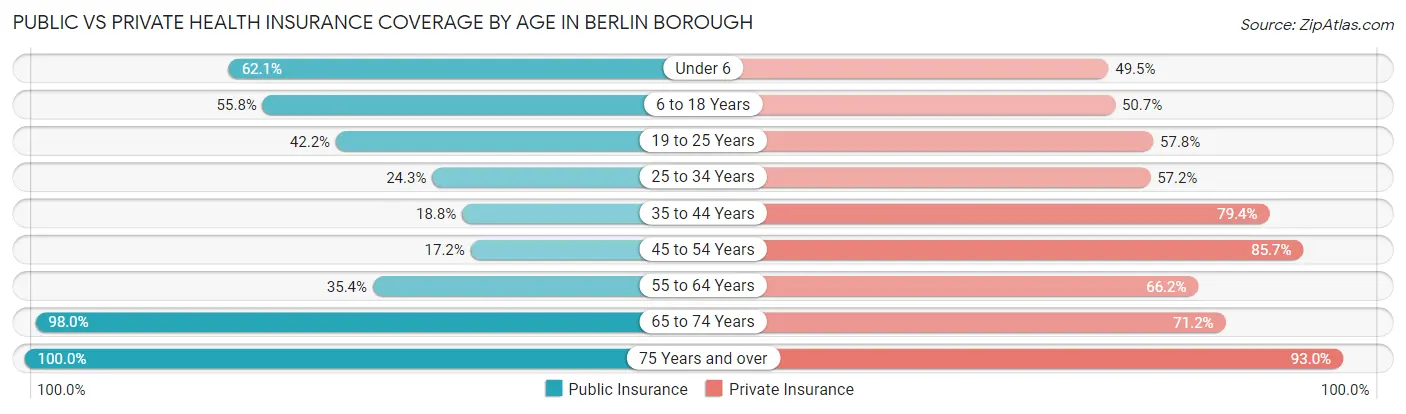
| Age Bracket | Public Insurance | Private Insurance |
| Under 6 | 118 (62.1%) | 94 (49.5%) |
| 6 to 18 Years | 197 (55.8%) | 179 (50.7%) |
| 19 to 25 Years | 38 (42.2%) | 52 (57.8%) |
| 25 to 34 Years | 37 (24.3%) | 87 (57.2%) |
| 35 to 44 Years | 41 (18.8%) | 173 (79.4%) |
| 45 to 54 Years | 36 (17.2%) | 179 (85.7%) |
| 55 to 64 Years | 93 (35.4%) | 174 (66.2%) |
| 65 to 74 Years | 245 (98.0%) | 178 (71.2%) |
| 75 Years and over | 429 (100.0%) | 399 (93.0%) |
| Total | 1,234 (57.3%) | 1,515 (70.3%) |
Disability Status by Sex by Age in Berlin borough
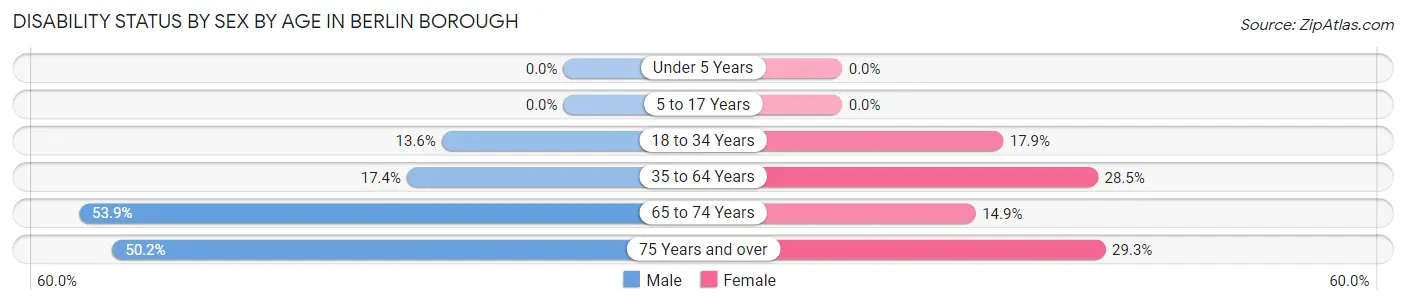
| Age Bracket | Male | Female |
| Under 5 Years | 0 (0.0%) | 0 (0.0%) |
| 5 to 17 Years | 0 (0.0%) | 0 (0.0%) |
| 18 to 34 Years | 16 (13.6%) | 26 (17.9%) |
| 35 to 64 Years | 64 (17.4%) | 92 (28.5%) |
| 65 to 74 Years | 55 (53.9%) | 22 (14.9%) |
| 75 Years and over | 111 (50.2%) | 61 (29.3%) |
Disability Class by Sex by Age in Berlin borough
Disability Class: Hearing Difficulty
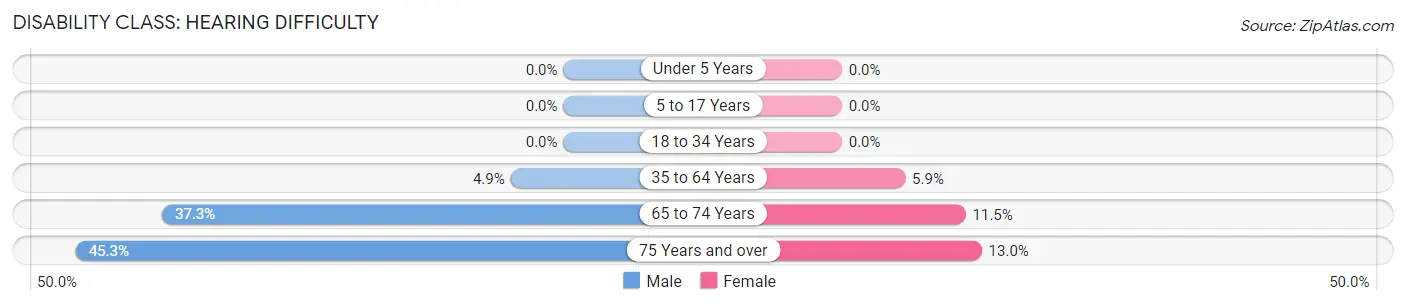
| Age Bracket | Male | Female |
| Under 5 Years | 0 (0.0%) | 0 (0.0%) |
| 5 to 17 Years | 0 (0.0%) | 0 (0.0%) |
| 18 to 34 Years | 0 (0.0%) | 0 (0.0%) |
| 35 to 64 Years | 18 (4.9%) | 19 (5.9%) |
| 65 to 74 Years | 38 (37.2%) | 17 (11.5%) |
| 75 Years and over | 100 (45.3%) | 27 (13.0%) |
Disability Class: Vision Difficulty
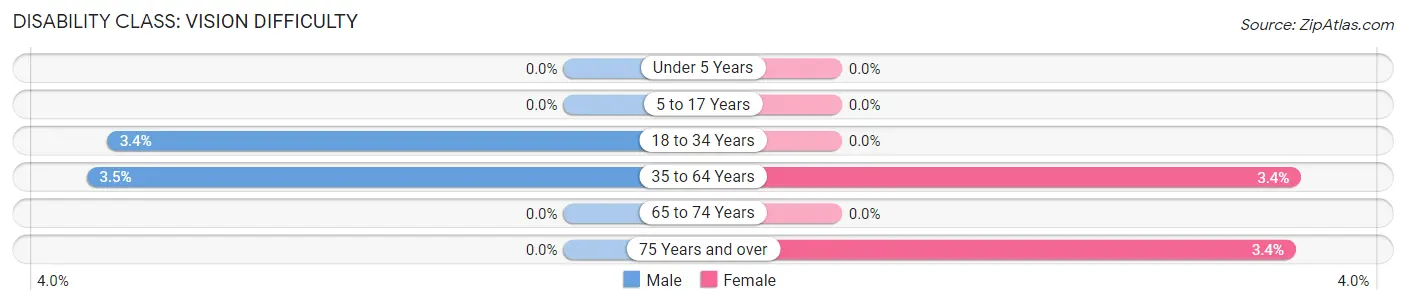
| Age Bracket | Male | Female |
| Under 5 Years | 0 (0.0%) | 0 (0.0%) |
| 5 to 17 Years | 0 (0.0%) | 0 (0.0%) |
| 18 to 34 Years | 4 (3.4%) | 0 (0.0%) |
| 35 to 64 Years | 13 (3.5%) | 11 (3.4%) |
| 65 to 74 Years | 0 (0.0%) | 0 (0.0%) |
| 75 Years and over | 0 (0.0%) | 7 (3.4%) |
Disability Class: Cognitive Difficulty
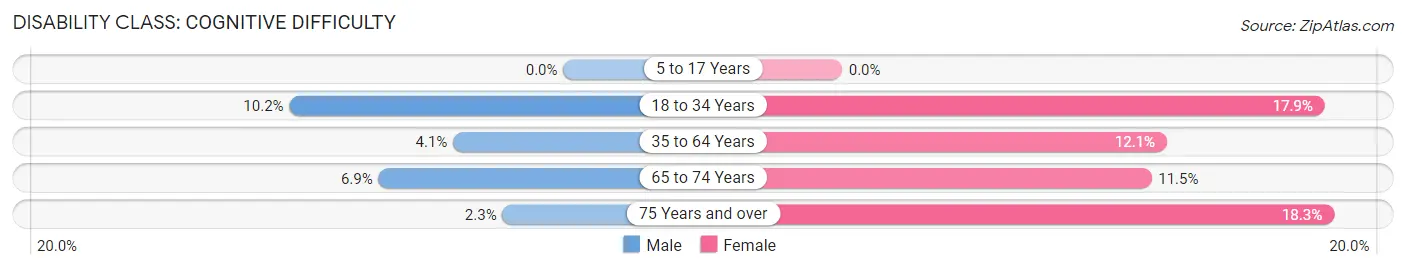
| Age Bracket | Male | Female |
| 5 to 17 Years | 0 (0.0%) | 0 (0.0%) |
| 18 to 34 Years | 12 (10.2%) | 26 (17.9%) |
| 35 to 64 Years | 15 (4.1%) | 39 (12.1%) |
| 65 to 74 Years | 7 (6.9%) | 17 (11.5%) |
| 75 Years and over | 5 (2.3%) | 38 (18.3%) |
Disability Class: Ambulatory Difficulty
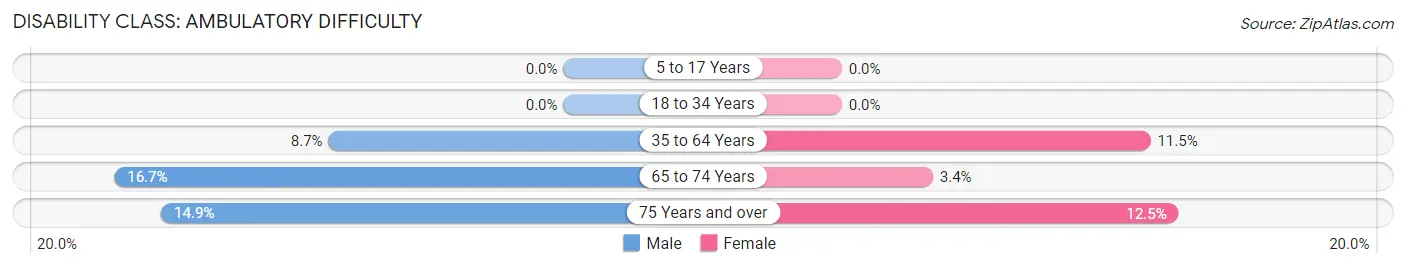
| Age Bracket | Male | Female |
| 5 to 17 Years | 0 (0.0%) | 0 (0.0%) |
| 18 to 34 Years | 0 (0.0%) | 0 (0.0%) |
| 35 to 64 Years | 32 (8.7%) | 37 (11.5%) |
| 65 to 74 Years | 17 (16.7%) | 5 (3.4%) |
| 75 Years and over | 33 (14.9%) | 26 (12.5%) |
Disability Class: Self-Care Difficulty
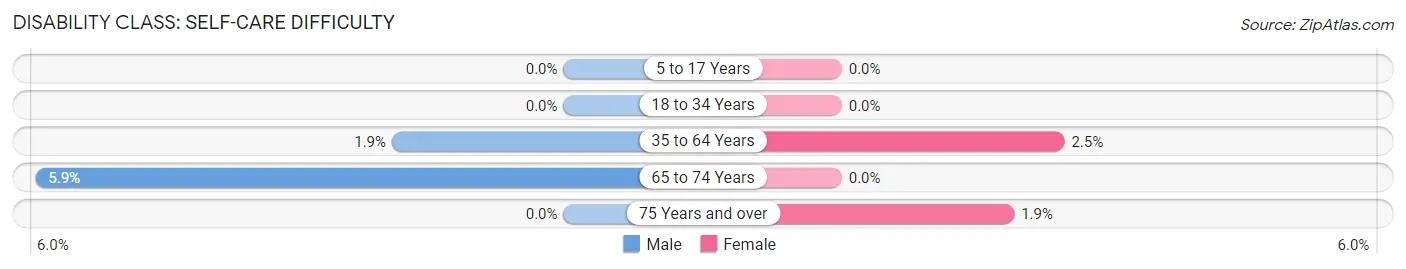
| Age Bracket | Male | Female |
| 5 to 17 Years | 0 (0.0%) | 0 (0.0%) |
| 18 to 34 Years | 0 (0.0%) | 0 (0.0%) |
| 35 to 64 Years | 7 (1.9%) | 8 (2.5%) |
| 65 to 74 Years | 6 (5.9%) | 0 (0.0%) |
| 75 Years and over | 0 (0.0%) | 4 (1.9%) |
Technology Access in Berlin borough
Computing Device Access in Berlin borough
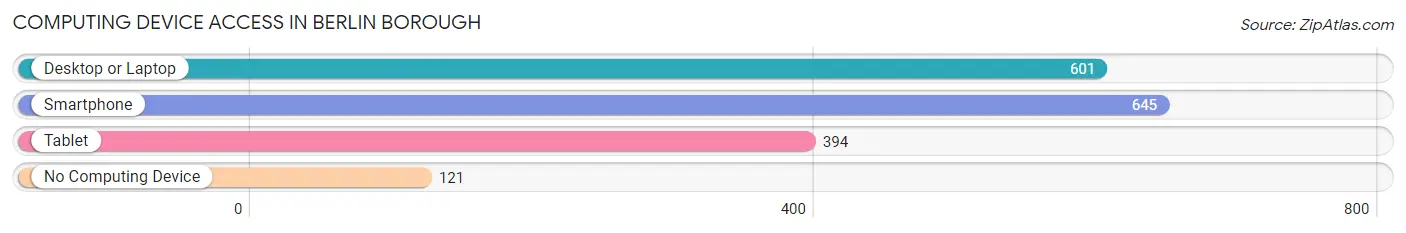
| Device Type | # Households | % Households |
| Desktop or Laptop | 601 | 64.5% |
| Smartphone | 645 | 69.2% |
| Tablet | 394 | 42.3% |
| No Computing Device | 121 | 13.0% |
| Total | 932 | 100.0% |
Internet Access in Berlin borough
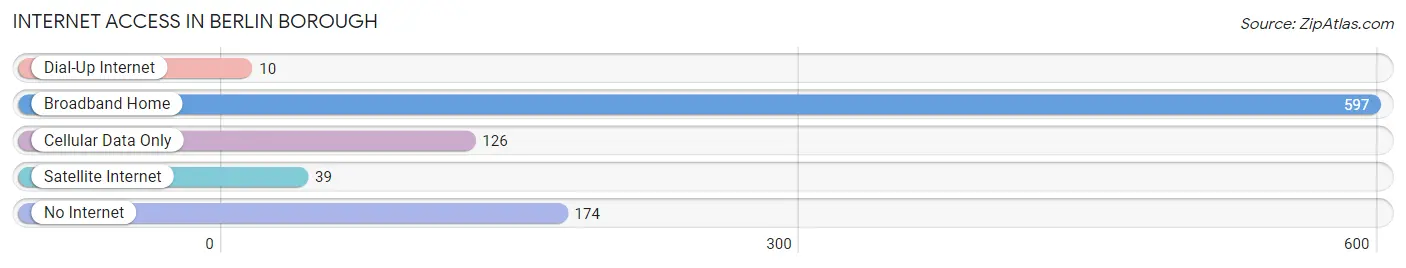
| Internet Type | # Households | % Households |
| Dial-Up Internet | 10 | 1.1% |
| Broadband Home | 597 | 64.1% |
| Cellular Data Only | 126 | 13.5% |
| Satellite Internet | 39 | 4.2% |
| No Internet | 174 | 18.7% |
| Total | 932 | 100.0% |
Berlin borough Summary
Berlin Borough is a borough located in Camden County, New Jersey, United States. It is part of the Camden metropolitan area. As of the 2010 United States Census, the borough's population was 2,719, reflecting an increase of 517 (+23.5%) from the 2,202 counted in the 2000 Census, which had in turn increased by 517 (+30.6%) from the 1,685 counted in the 1990 Census.
History
Berlin Borough was incorporated as a borough by an act of the New Jersey Legislature on March 8, 1927, from portions of Berlin Township, based on the results of a referendum held on April 12, 1927.
Geography
Berlin Borough is located in the eastern part of Camden County, New Jersey. It is bordered to the north by Berlin Township, to the east by Pine Hill, to the south by Lindenwold, and to the west by Waterford Township.
According to the United States Census Bureau, the borough had a total area of 1.945 square miles (5.033 km2), including 1.937 square miles (5.010 km2) of land and 0.008 square miles (0.023 km2) of water (0.41%).
Demographics
As of the 2010 United States Census, there were 2,719 people, 1,093 households, and 717.9 families residing in the borough. The population density was 1,408.3 per square mile (544.3/km2). There were 1,164 housing units at an average density of 600.9 per square mile (232.3/km2). The racial makeup of the borough was 87.90% (2,399) White, 5.90% (161) Black or African American, 0.22% (6) Native American, 1.90% (52) Asian, 0.07% (2) Pacific Islander, 2.45% (67) from other races, and 2.46% (67) from two or more races. Hispanic or Latino of any race were 8.17% (223) of the population.
Economy
Berlin Borough is home to a variety of businesses, including retail stores, restaurants, and professional services. The borough is also home to a number of industrial and manufacturing businesses. The borough is served by the Berlin Borough School District, which serves students in kindergarten through eighth grade.
The median income for a household in the borough was $50,972, and the median income for a family was $60,972. Males had a median income of $41,972 versus $30,972 for females. The per capita income for the borough was $23,972. About 4.2% of families and 5.7% of the population were below the poverty line, including 6.7% of those under age 18 and 6.7% of those age 65 or over.
Common Questions
What is Per Capita Income in Berlin borough?
Per Capita income in Berlin borough is $26,608.
What is the Median Family Income in Berlin borough?
Median Family Income in Berlin borough is $57,976.
What is the Median Household income in Berlin borough?
Median Household Income in Berlin borough is $51,318.
What is Income or Wage Gap in Berlin borough?
Income or Wage Gap in Berlin borough is 27.6%.
Women in Berlin borough earn 72.4 cents for every dollar earned by a man.
What is Inequality or Gini Index in Berlin borough?
Inequality or Gini Index in Berlin borough is 0.36.
What is the Total Population of Berlin borough?
Total Population of Berlin borough is 2,297.
What is the Total Male Population of Berlin borough?
Total Male Population of Berlin borough is 1,135.
What is the Total Female Population of Berlin borough?
Total Female Population of Berlin borough is 1,162.
What is the Ratio of Males per 100 Females in Berlin borough?
There are 97.68 Males per 100 Females in Berlin borough.
What is the Ratio of Females per 100 Males in Berlin borough?
There are 102.38 Females per 100 Males in Berlin borough.
What is the Median Population Age in Berlin borough?
Median Population Age in Berlin borough is 52.8 Years.
What is the Average Family Size in Berlin borough
Average Family Size in Berlin borough is 2.9 People.
What is the Average Household Size in Berlin borough
Average Household Size in Berlin borough is 2.3 People.
How Large is the Labor Force in Berlin borough?
There are 832 People in the Labor Forcein in Berlin borough.
What is the Percentage of People in the Labor Force in Berlin borough?
45.7% of People are in the Labor Force in Berlin borough.
What is the Unemployment Rate in Berlin borough?
Unemployment Rate in Berlin borough is 6.1%.