Collegeville borough, PA Map & Demographics
Collegeville borough Overview
$45,874
PER CAPITA INCOME
$188,750
AVG FAMILY INCOME
$99,271
AVG HOUSEHOLD INCOME
84.8%
WAGE / INCOME GAP [ % ]
15.2¢/ $1
WAGE / INCOME GAP [ $ ]
0.47
INEQUALITY / GINI INDEX
5,172
TOTAL POPULATION
2,192
MALE POPULATION
2,980
FEMALE POPULATION
73.56
MALES / 100 FEMALES
135.95
FEMALES / 100 MALES
24.4
MEDIAN AGE
3.1
AVG FAMILY SIZE
2.1
AVG HOUSEHOLD SIZE
2,964
LABOR FORCE [ PEOPLE ]
64.6%
PERCENT IN LABOR FORCE
7.2%
UNEMPLOYMENT RATE
Income in Collegeville borough
Income Overview in Collegeville borough
Per Capita Income in Collegeville borough is $45,874, while median incomes of families and households are $188,750 and $99,271 respectively.
| Characteristic | Number | Measure |
| Per Capita Income | 5,172 | $45,874 |
| Median Family Income | 814 | $188,750 |
| Mean Family Income | 814 | $209,656 |
| Median Household Income | 1,533 | $99,271 |
| Mean Household Income | 1,533 | $143,189 |
| Income Deficit | 814 | $0 |
| Wage / Income Gap (%) | 5,172 | 84.84% |
| Wage / Income Gap ($) | 5,172 | 15.16¢ per $1 |
| Gini / Inequality Index | 5,172 | 0.47 |
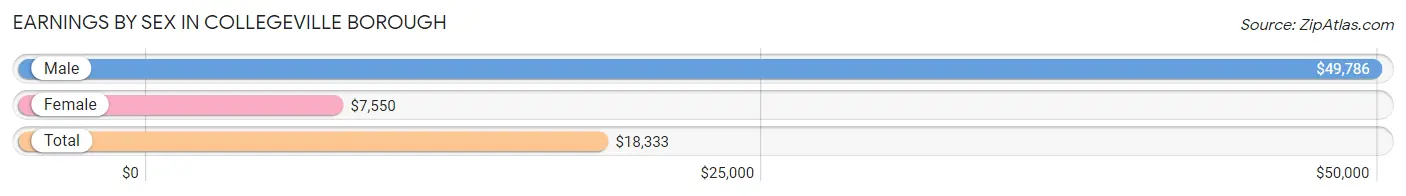
Earnings by Sex in Collegeville borough
Average Earnings in Collegeville borough are $18,333, $49,786 for men and $7,550 for women, a difference of 84.8%.
| Sex | Number | Average Earnings |
| Male | 1,478 (44.4%) | $49,786 |
| Female | 1,848 (55.6%) | $7,550 |
| Total | 3,326 (100.0%) | $18,333 |
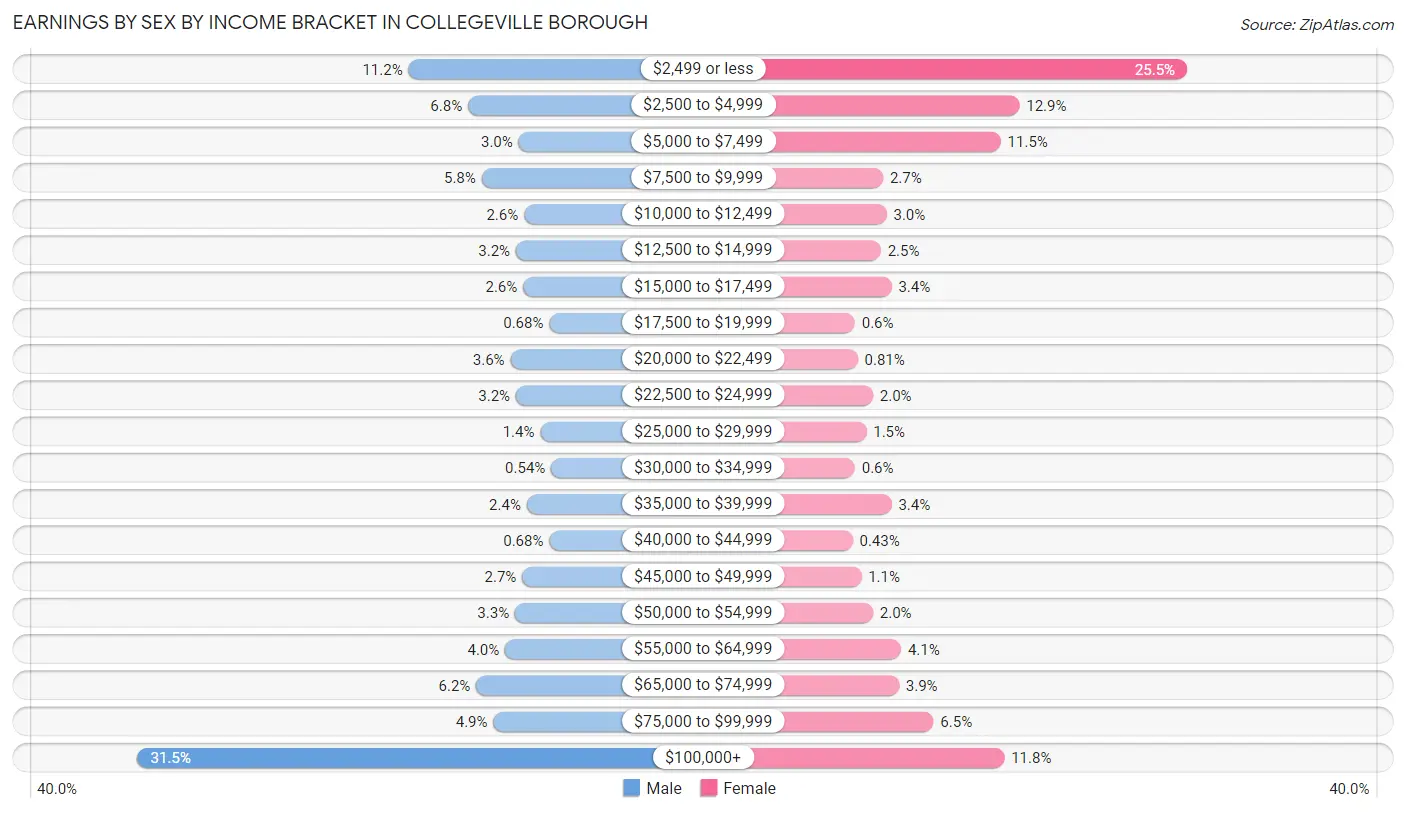
Earnings by Sex by Income Bracket in Collegeville borough
The most common earnings brackets in Collegeville borough are $100,000+ for men (466 | 31.5%) and $2,499 or less for women (471 | 25.5%).
| Income | Male | Female |
| $2,499 or less | 166 (11.2%) | 471 (25.5%) |
| $2,500 to $4,999 | 100 (6.8%) | 239 (12.9%) |
| $5,000 to $7,499 | 44 (3.0%) | 213 (11.5%) |
| $7,500 to $9,999 | 85 (5.8%) | 50 (2.7%) |
| $10,000 to $12,499 | 38 (2.6%) | 55 (3.0%) |
| $12,500 to $14,999 | 47 (3.2%) | 47 (2.5%) |
| $15,000 to $17,499 | 39 (2.6%) | 62 (3.4%) |
| $17,500 to $19,999 | 10 (0.7%) | 11 (0.6%) |
| $20,000 to $22,499 | 53 (3.6%) | 15 (0.8%) |
| $22,500 to $24,999 | 47 (3.2%) | 36 (1.9%) |
| $25,000 to $29,999 | 20 (1.3%) | 27 (1.5%) |
| $30,000 to $34,999 | 8 (0.5%) | 11 (0.6%) |
| $35,000 to $39,999 | 35 (2.4%) | 62 (3.4%) |
| $40,000 to $44,999 | 10 (0.7%) | 8 (0.4%) |
| $45,000 to $49,999 | 40 (2.7%) | 20 (1.1%) |
| $50,000 to $54,999 | 48 (3.3%) | 36 (1.9%) |
| $55,000 to $64,999 | 59 (4.0%) | 75 (4.1%) |
| $65,000 to $74,999 | 91 (6.2%) | 72 (3.9%) |
| $75,000 to $99,999 | 72 (4.9%) | 120 (6.5%) |
| $100,000+ | 466 (31.5%) | 218 (11.8%) |
| Total | 1,478 (100.0%) | 1,848 (100.0%) |
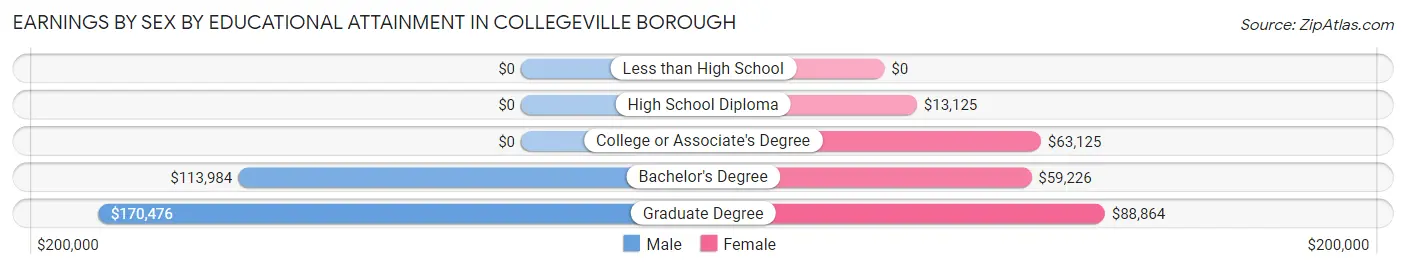
Earnings by Sex by Educational Attainment in Collegeville borough
Average earnings in Collegeville borough are $96,111 for men and $64,051 for women, a difference of 33.4%. Men with an educational attainment of graduate degree enjoy the highest average annual earnings of $170,476, while those with bachelor's degree education earn the least with $113,984. Women with an educational attainment of graduate degree earn the most with the average annual earnings of $88,864, while those with high school diploma education have the smallest earnings of $13,125.
| Educational Attainment | Male Income | Female Income |
| Less than High School | - | - |
| High School Diploma | - | - |
| College or Associate's Degree | - | - |
| Bachelor's Degree | $113,984 | $59,226 |
| Graduate Degree | $170,476 | $88,864 |
| Total | $96,111 | $64,051 |
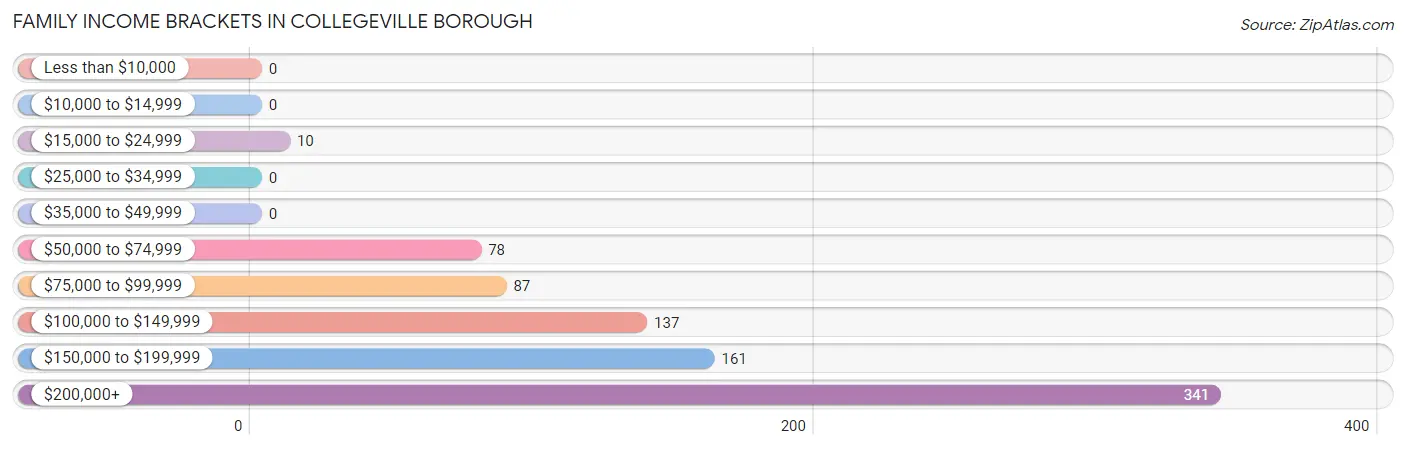
Family Income in Collegeville borough
Family Income Brackets in Collegeville borough
According to the Collegeville borough family income data, there are 341 families falling into the $200,000+ income range, which is the most common income bracket and makes up 41.9% of all families.
| Income Bracket | # Families | % Families |
| Less than $10,000 | 0 | 0.0% |
| $10,000 to $14,999 | 0 | 0.0% |
| $15,000 to $24,999 | 10 | 1.2% |
| $25,000 to $34,999 | 0 | 0.0% |
| $35,000 to $49,999 | 0 | 0.0% |
| $50,000 to $74,999 | 78 | 9.6% |
| $75,000 to $99,999 | 87 | 10.7% |
| $100,000 to $149,999 | 137 | 16.8% |
| $150,000 to $199,999 | 161 | 19.8% |
| $200,000+ | 341 | 41.9% |
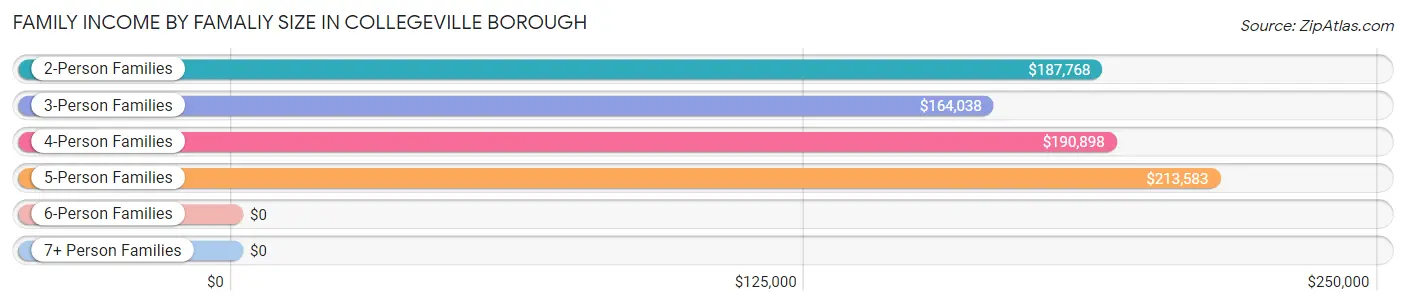
Family Income by Famaliy Size in Collegeville borough
5-person families (51 | 6.3%) account for the highest median family income in Collegeville borough with $213,583 per family, while 2-person families (385 | 47.3%) have the highest median income of $93,884 per family member.
| Income Bracket | # Families | Median Income |
| 2-Person Families | 385 (47.3%) | $187,768 |
| 3-Person Families | 164 (20.2%) | $164,038 |
| 4-Person Families | 177 (21.7%) | $190,898 |
| 5-Person Families | 51 (6.3%) | $213,583 |
| 6-Person Families | 21 (2.6%) | $0 |
| 7+ Person Families | 16 (2.0%) | $0 |
| Total | 814 (100.0%) | $188,750 |
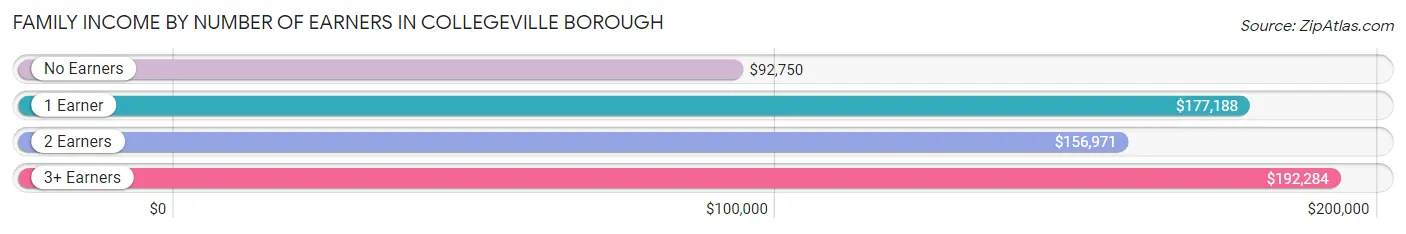
Family Income by Number of Earners in Collegeville borough
The median family income in Collegeville borough is $188,750, with families comprising 3+ earners (141) having the highest median family income of $192,284, while families with no earners (64) have the lowest median family income of $92,750, accounting for 17.3% and 7.9% of families, respectively.
| Number of Earners | # Families | Median Income |
| No Earners | 64 (7.9%) | $92,750 |
| 1 Earner | 152 (18.7%) | $177,188 |
| 2 Earners | 457 (56.1%) | $156,971 |
| 3+ Earners | 141 (17.3%) | $192,284 |
| Total | 814 (100.0%) | $188,750 |
Household Income in Collegeville borough
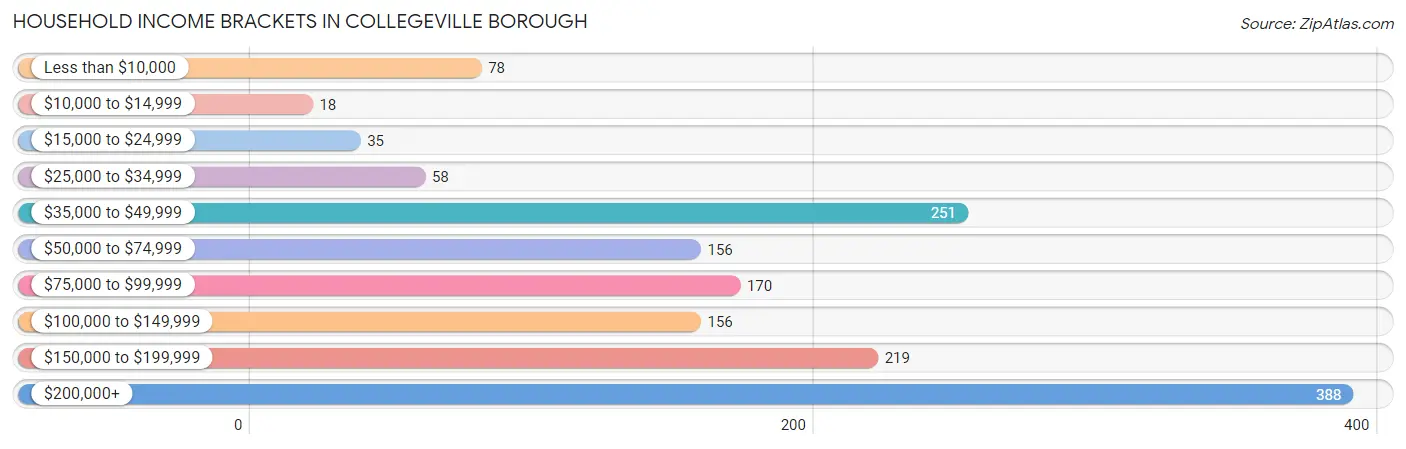
Household Income Brackets in Collegeville borough
With 388 households falling in the category, the $200,000+ income range is the most frequent in Collegeville borough, accounting for 25.3% of all households. In contrast, only 18 households (1.2%) fall into the $10,000 to $14,999 income bracket, making it the least populous group.
| Income Bracket | # Households | % Households |
| Less than $10,000 | 78 | 5.1% |
| $10,000 to $14,999 | 18 | 1.2% |
| $15,000 to $24,999 | 35 | 2.3% |
| $25,000 to $34,999 | 58 | 3.8% |
| $35,000 to $49,999 | 251 | 16.4% |
| $50,000 to $74,999 | 156 | 10.2% |
| $75,000 to $99,999 | 170 | 11.1% |
| $100,000 to $149,999 | 156 | 10.2% |
| $150,000 to $199,999 | 219 | 14.3% |
| $200,000+ | 388 | 25.3% |
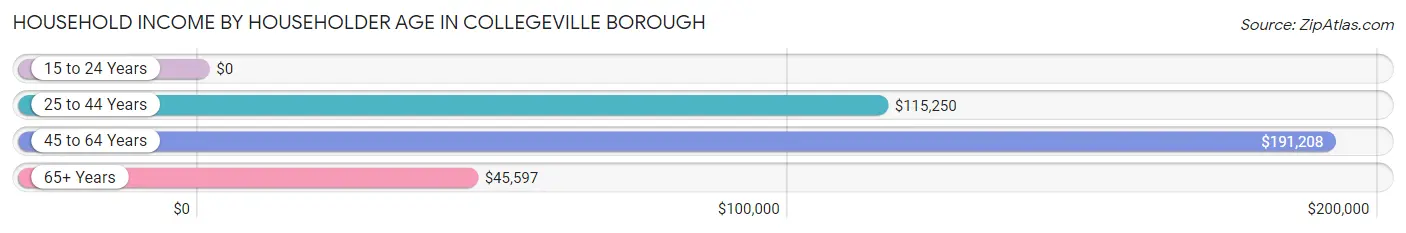
Household Income by Householder Age in Collegeville borough
The median household income in Collegeville borough is $99,271, with the highest median household income of $191,208 found in the 45 to 64 years age bracket for the primary householder. A total of 649 households (42.3%) fall into this category. Meanwhile, the 15 to 24 years age bracket for the primary householder has the lowest median household income of $0, with 24 households (1.6%) in this group.
| Income Bracket | # Households | Median Income |
| 15 to 24 Years | 24 (1.6%) | $0 |
| 25 to 44 Years | 402 (26.2%) | $115,250 |
| 45 to 64 Years | 649 (42.3%) | $191,208 |
| 65+ Years | 458 (29.9%) | $45,597 |
| Total | 1,533 (100.0%) | $99,271 |
Poverty in Collegeville borough
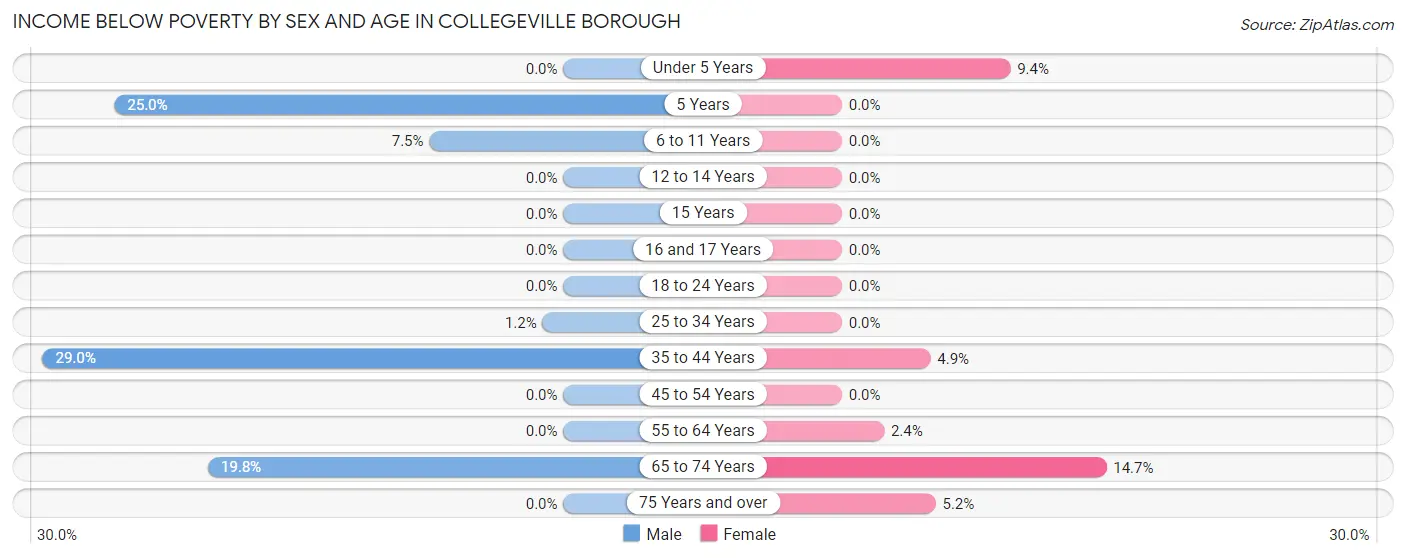
Income Below Poverty by Sex and Age in Collegeville borough
With 6.8% poverty level for males and 3.4% for females among the residents of Collegeville borough, 35 to 44 year old males and 65 to 74 year old females are the most vulnerable to poverty, with 67 males (29.0%) and 19 females (14.7%) in their respective age groups living below the poverty level.
| Age Bracket | Male | Female |
| Under 5 Years | 0 (0.0%) | 9 (9.4%) |
| 5 Years | 10 (25.0%) | 0 (0.0%) |
| 6 to 11 Years | 10 (7.5%) | 0 (0.0%) |
| 12 to 14 Years | 0 (0.0%) | 0 (0.0%) |
| 15 Years | 0 (0.0%) | 0 (0.0%) |
| 16 and 17 Years | 0 (0.0%) | 0 (0.0%) |
| 18 to 24 Years | 0 (0.0%) | 0 (0.0%) |
| 25 to 34 Years | 2 (1.2%) | 0 (0.0%) |
| 35 to 44 Years | 67 (29.0%) | 10 (4.9%) |
| 45 to 54 Years | 0 (0.0%) | 0 (0.0%) |
| 55 to 64 Years | 0 (0.0%) | 8 (2.4%) |
| 65 to 74 Years | 19 (19.8%) | 19 (14.7%) |
| 75 Years and over | 0 (0.0%) | 13 (5.2%) |
| Total | 108 (6.8%) | 59 (3.4%) |
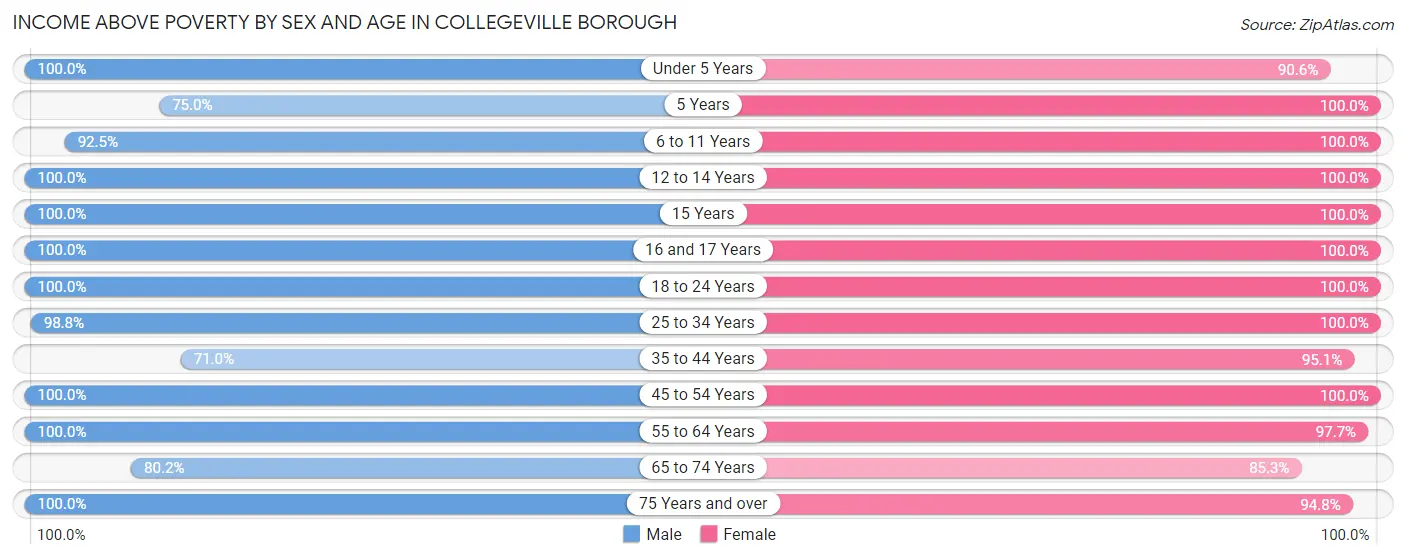
Income Above Poverty by Sex and Age in Collegeville borough
According to the poverty statistics in Collegeville borough, males aged under 5 years and females aged 5 years are the age groups that are most secure financially, with 100.0% of males and 100.0% of females in these age groups living above the poverty line.
| Age Bracket | Male | Female |
| Under 5 Years | 65 (100.0%) | 87 (90.6%) |
| 5 Years | 30 (75.0%) | 12 (100.0%) |
| 6 to 11 Years | 124 (92.5%) | 117 (100.0%) |
| 12 to 14 Years | 17 (100.0%) | 53 (100.0%) |
| 15 Years | 14 (100.0%) | 36 (100.0%) |
| 16 and 17 Years | 55 (100.0%) | 25 (100.0%) |
| 18 to 24 Years | 86 (100.0%) | 58 (100.0%) |
| 25 to 34 Years | 170 (98.8%) | 204 (100.0%) |
| 35 to 44 Years | 164 (71.0%) | 193 (95.1%) |
| 45 to 54 Years | 204 (100.0%) | 200 (100.0%) |
| 55 to 64 Years | 316 (100.0%) | 332 (97.7%) |
| 65 to 74 Years | 77 (80.2%) | 110 (85.3%) |
| 75 Years and over | 149 (100.0%) | 236 (94.8%) |
| Total | 1,471 (93.2%) | 1,663 (96.6%) |
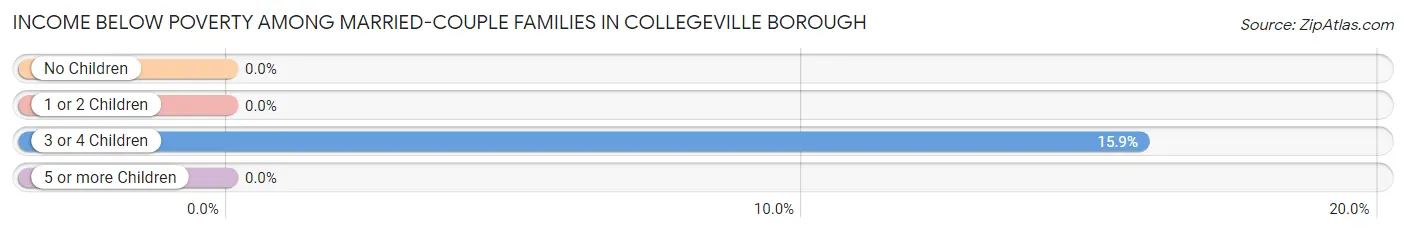
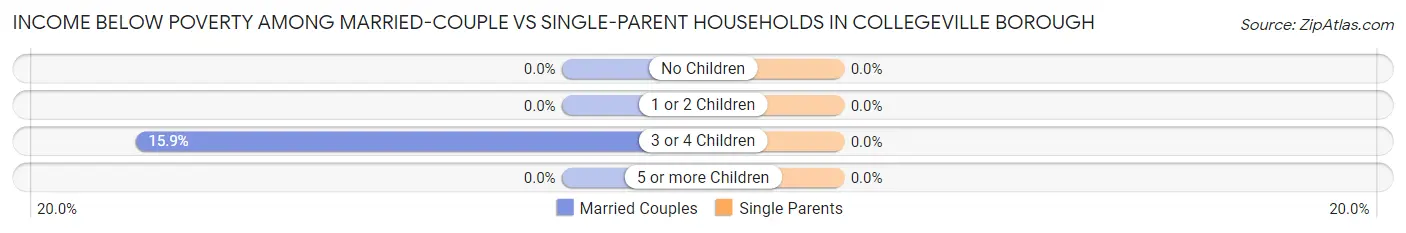
Income Below Poverty Among Married-Couple Families in Collegeville borough
The poverty statistics for married-couple families in Collegeville borough show that 1.4% or 10 of the total 726 families live below the poverty line. Families with 3 or 4 children have the highest poverty rate of 15.9%, comprising of 10 families. On the other hand, families with no children have the lowest poverty rate of 0.0%, which includes 0 families.
| Children | Above Poverty | Below Poverty |
| No Children | 440 (100.0%) | 0 (0.0%) |
| 1 or 2 Children | 207 (100.0%) | 0 (0.0%) |
| 3 or 4 Children | 53 (84.1%) | 10 (15.9%) |
| 5 or more Children | 16 (100.0%) | 0 (0.0%) |
| Total | 716 (98.6%) | 10 (1.4%) |
Income Below Poverty Among Single-Parent Households in Collegeville borough
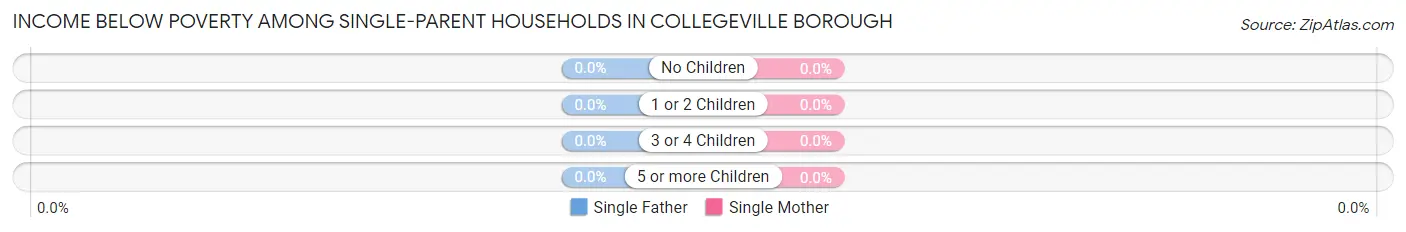
| Children | Single Father | Single Mother |
| No Children | 0 (0.0%) | 0 (0.0%) |
| 1 or 2 Children | 0 (0.0%) | 0 (0.0%) |
| 3 or 4 Children | 0 (0.0%) | 0 (0.0%) |
| 5 or more Children | 0 (0.0%) | 0 (0.0%) |
| Total | 0 (0.0%) | 0 (0.0%) |
Income Below Poverty Among Married-Couple vs Single-Parent Households in Collegeville borough
| Children | Married-Couple Families | Single-Parent Households |
| No Children | 0 (0.0%) | 0 (0.0%) |
| 1 or 2 Children | 0 (0.0%) | 0 (0.0%) |
| 3 or 4 Children | 10 (15.9%) | 0 (0.0%) |
| 5 or more Children | 0 (0.0%) | 0 (0.0%) |
| Total | 10 (1.4%) | 0 (0.0%) |
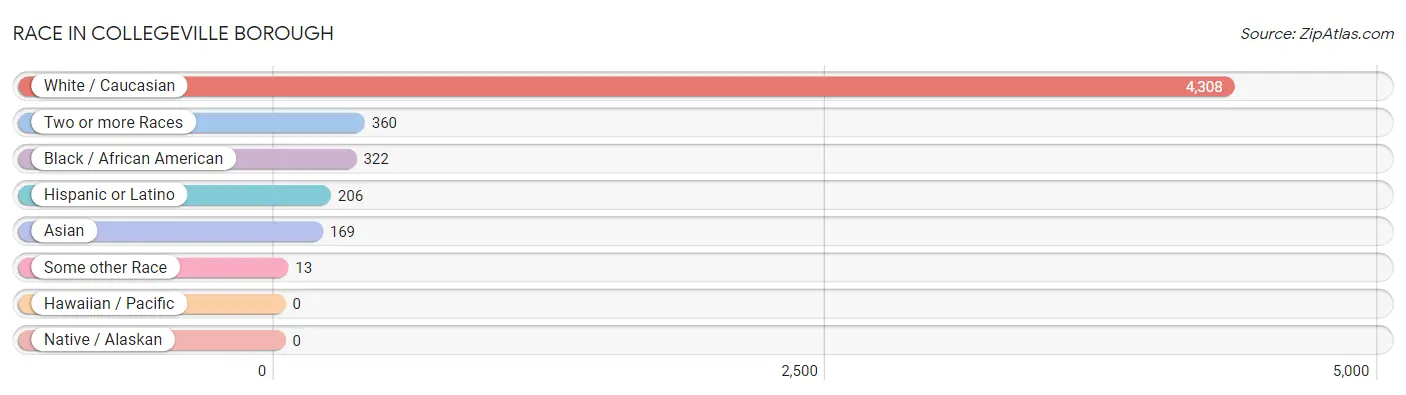
Race in Collegeville borough
The most populous races in Collegeville borough are White / Caucasian (4,308 | 83.3%), Two or more Races (360 | 7.0%), and Black / African American (322 | 6.2%).
| Race | # Population | % Population |
| Asian | 169 | 3.3% |
| Black / African American | 322 | 6.2% |
| Hawaiian / Pacific | 0 | 0.0% |
| Hispanic or Latino | 206 | 4.0% |
| Native / Alaskan | 0 | 0.0% |
| White / Caucasian | 4,308 | 83.3% |
| Two or more Races | 360 | 7.0% |
| Some other Race | 13 | 0.3% |
| Total | 5,172 | 100.0% |
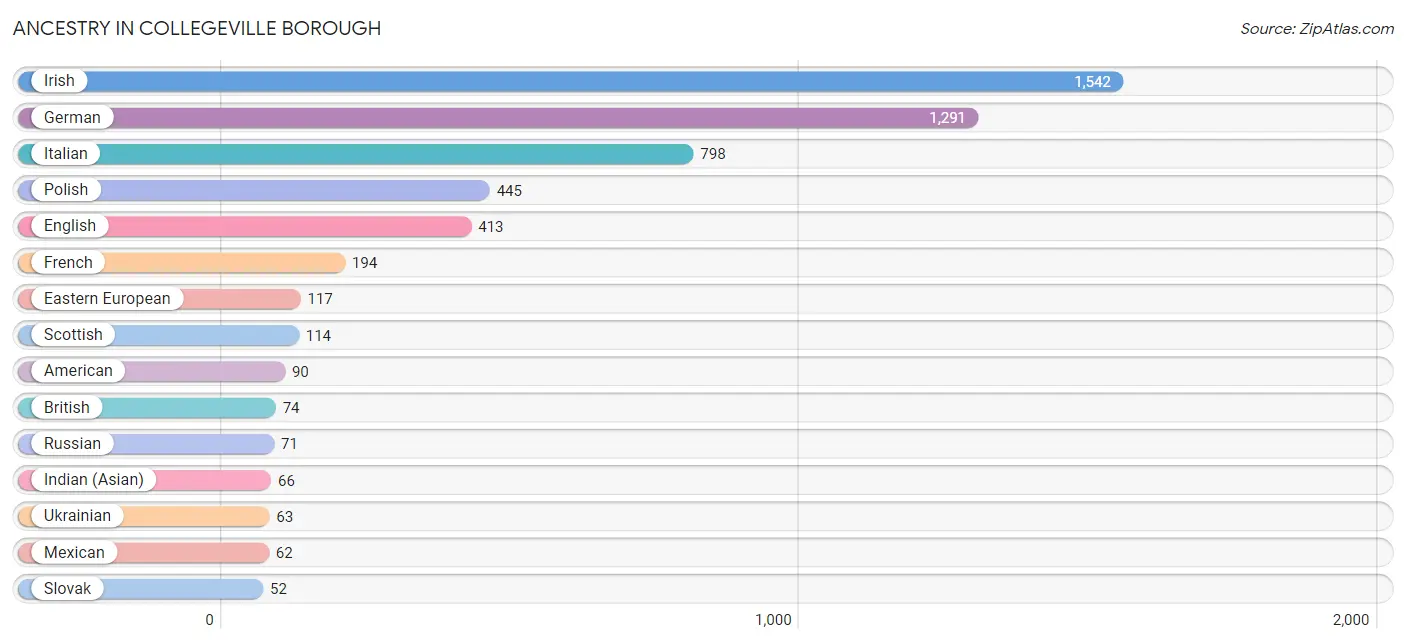
Ancestry in Collegeville borough
The most populous ancestries reported in Collegeville borough are Irish (1,542 | 29.8%), German (1,291 | 25.0%), Italian (798 | 15.4%), Polish (445 | 8.6%), and English (413 | 8.0%), together accounting for 86.8% of all Collegeville borough residents.
| Ancestry | # Population | % Population |
| African | 30 | 0.6% |
| Alsatian | 4 | 0.1% |
| American | 90 | 1.7% |
| Arab | 10 | 0.2% |
| Argentinean | 22 | 0.4% |
| Armenian | 4 | 0.1% |
| Austrian | 36 | 0.7% |
| Blackfeet | 5 | 0.1% |
| Brazilian | 18 | 0.4% |
| British | 74 | 1.4% |
| Burmese | 26 | 0.5% |
| Central American | 26 | 0.5% |
| Colombian | 9 | 0.2% |
| Costa Rican | 15 | 0.3% |
| Cuban | 12 | 0.2% |
| Czech | 24 | 0.5% |
| Czechoslovakian | 16 | 0.3% |
| Danish | 5 | 0.1% |
| Dominican | 25 | 0.5% |
| Dutch | 10 | 0.2% |
| Eastern European | 117 | 2.3% |
| Egyptian | 10 | 0.2% |
| English | 413 | 8.0% |
| European | 33 | 0.6% |
| French | 194 | 3.7% |
| French American Indian | 9 | 0.2% |
| French Canadian | 18 | 0.4% |
| German | 1,291 | 25.0% |
| Ghanaian | 17 | 0.3% |
| Greek | 29 | 0.6% |
| Haitian | 4 | 0.1% |
| Hungarian | 24 | 0.5% |
| Indian (Asian) | 66 | 1.3% |
| Iranian | 18 | 0.4% |
| Irish | 1,542 | 29.8% |
| Italian | 798 | 15.4% |
| Jamaican | 22 | 0.4% |
| Korean | 5 | 0.1% |
| Mexican | 62 | 1.2% |
| Mongolian | 5 | 0.1% |
| Nigerian | 1 | 0.0% |
| Northern European | 14 | 0.3% |
| Norwegian | 17 | 0.3% |
| Panamanian | 6 | 0.1% |
| Polish | 445 | 8.6% |
| Portuguese | 6 | 0.1% |
| Puerto Rican | 33 | 0.6% |
| Romanian | 1 | 0.0% |
| Russian | 71 | 1.4% |
| Salvadoran | 5 | 0.1% |
| Scandinavian | 13 | 0.3% |
| Scotch-Irish | 9 | 0.2% |
| Scottish | 114 | 2.2% |
| Senegalese | 2 | 0.0% |
| Slovak | 52 | 1.0% |
| South American | 31 | 0.6% |
| Spaniard | 5 | 0.1% |
| Sri Lankan | 27 | 0.5% |
| Subsaharan African | 50 | 1.0% |
| Swedish | 30 | 0.6% |
| Swiss | 6 | 0.1% |
| Thai | 48 | 0.9% |
| Trinidadian and Tobagonian | 2 | 0.0% |
| Turkish | 8 | 0.2% |
| Ukrainian | 63 | 1.2% |
| Welsh | 14 | 0.3% | View All 66 Rows |
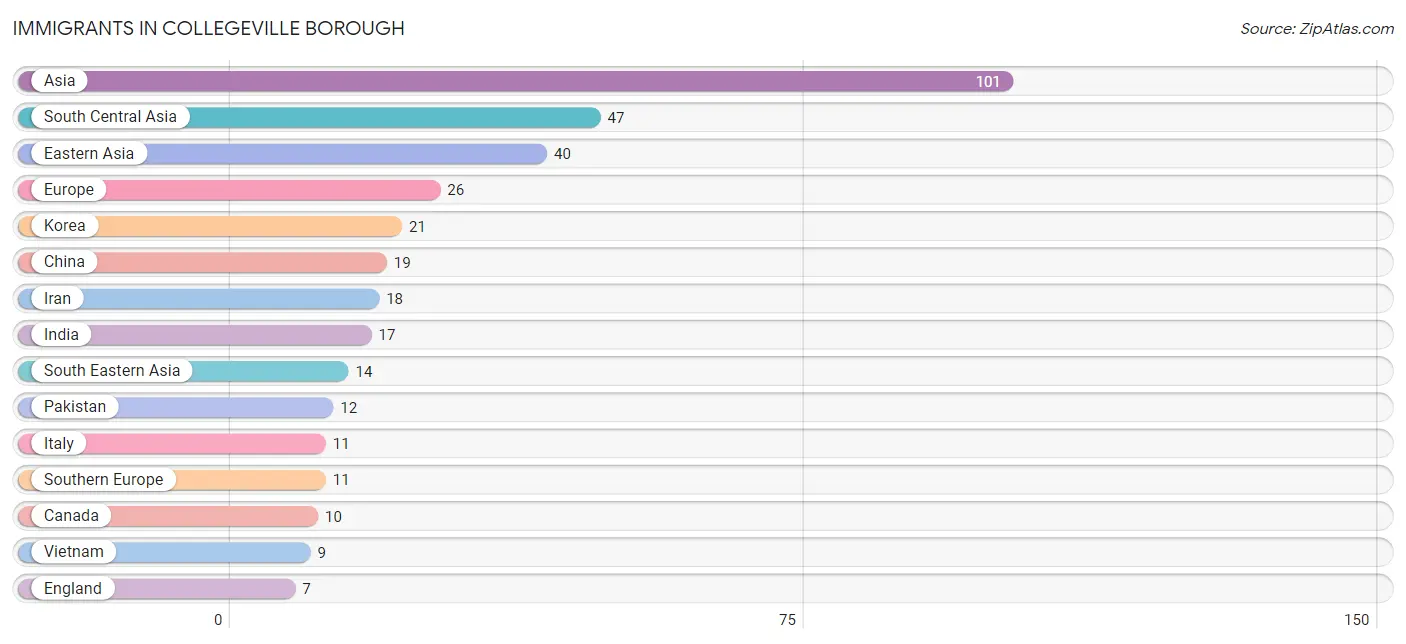
Immigrants in Collegeville borough
The most numerous immigrant groups reported in Collegeville borough came from Asia (101 | 1.9%), South Central Asia (47 | 0.9%), Eastern Asia (40 | 0.8%), Europe (26 | 0.5%), and Korea (21 | 0.4%), together accounting for 4.5% of all Collegeville borough residents.
| Immigration Origin | # Population | % Population |
| Asia | 101 | 1.9% |
| Canada | 10 | 0.2% |
| China | 19 | 0.4% |
| Eastern Asia | 40 | 0.8% |
| Eastern Europe | 6 | 0.1% |
| England | 7 | 0.1% |
| Europe | 26 | 0.5% |
| France | 2 | 0.0% |
| India | 17 | 0.3% |
| Iran | 18 | 0.4% |
| Italy | 11 | 0.2% |
| Korea | 21 | 0.4% |
| Northern Europe | 7 | 0.1% |
| Pakistan | 12 | 0.2% |
| Romania | 1 | 0.0% |
| Singapore | 5 | 0.1% |
| South Central Asia | 47 | 0.9% |
| South Eastern Asia | 14 | 0.3% |
| Southern Europe | 11 | 0.2% |
| Ukraine | 5 | 0.1% |
| Vietnam | 9 | 0.2% |
| Western Europe | 2 | 0.0% | View All 22 Rows |
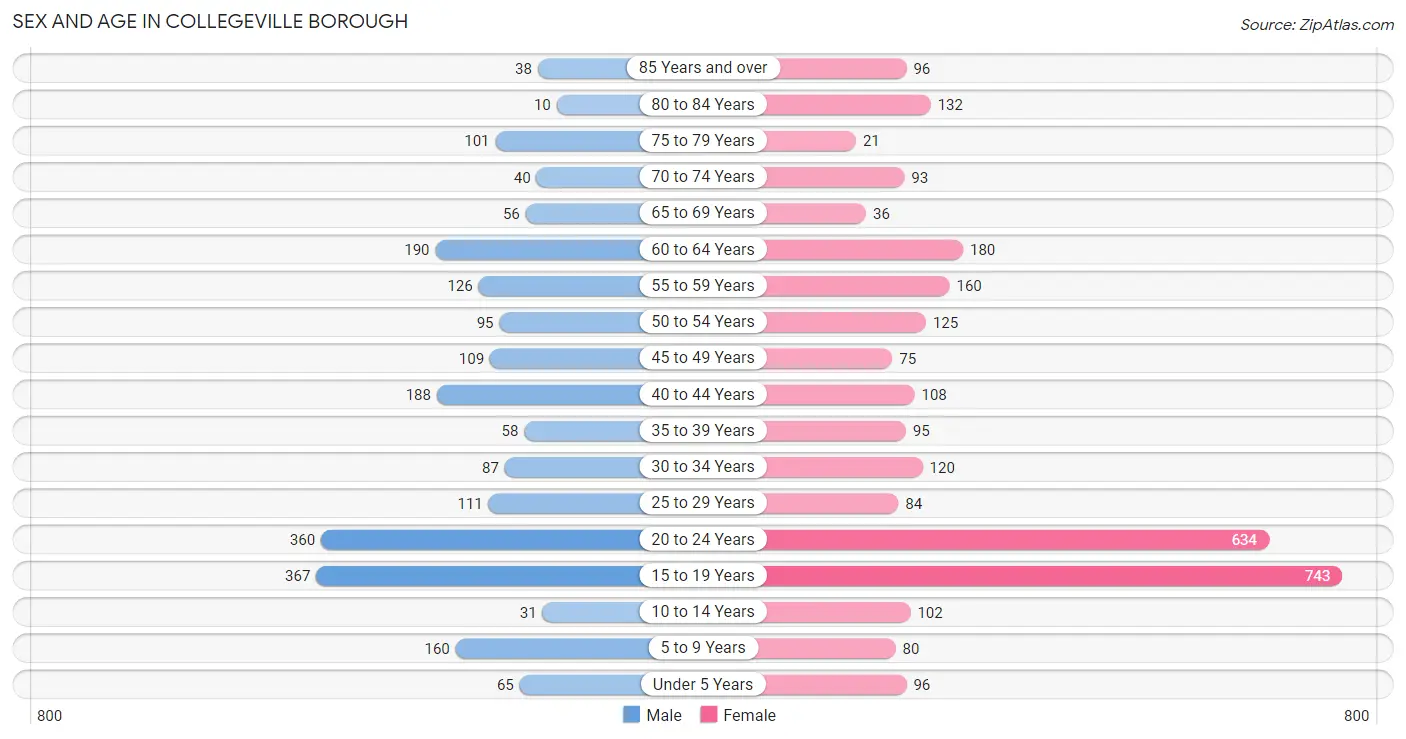
Sex and Age in Collegeville borough
Sex and Age in Collegeville borough
The most populous age groups in Collegeville borough are 15 to 19 Years (367 | 16.7%) for men and 15 to 19 Years (743 | 24.9%) for women.
| Age Bracket | Male | Female |
| Under 5 Years | 65 (3.0%) | 96 (3.2%) |
| 5 to 9 Years | 160 (7.3%) | 80 (2.7%) |
| 10 to 14 Years | 31 (1.4%) | 102 (3.4%) |
| 15 to 19 Years | 367 (16.7%) | 743 (24.9%) |
| 20 to 24 Years | 360 (16.4%) | 634 (21.3%) |
| 25 to 29 Years | 111 (5.1%) | 84 (2.8%) |
| 30 to 34 Years | 87 (4.0%) | 120 (4.0%) |
| 35 to 39 Years | 58 (2.6%) | 95 (3.2%) |
| 40 to 44 Years | 188 (8.6%) | 108 (3.6%) |
| 45 to 49 Years | 109 (5.0%) | 75 (2.5%) |
| 50 to 54 Years | 95 (4.3%) | 125 (4.2%) |
| 55 to 59 Years | 126 (5.8%) | 160 (5.4%) |
| 60 to 64 Years | 190 (8.7%) | 180 (6.0%) |
| 65 to 69 Years | 56 (2.5%) | 36 (1.2%) |
| 70 to 74 Years | 40 (1.8%) | 93 (3.1%) |
| 75 to 79 Years | 101 (4.6%) | 21 (0.7%) |
| 80 to 84 Years | 10 (0.5%) | 132 (4.4%) |
| 85 Years and over | 38 (1.7%) | 96 (3.2%) |
| Total | 2,192 (100.0%) | 2,980 (100.0%) |
Families and Households in Collegeville borough
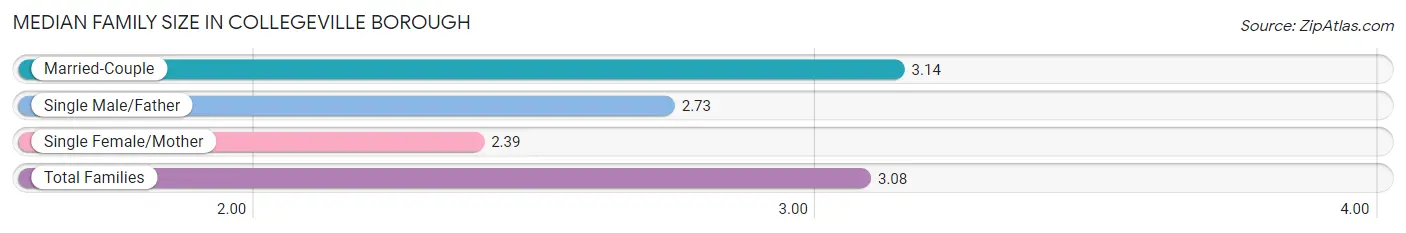
Median Family Size in Collegeville borough
The median family size in Collegeville borough is 3.08 persons per family, with married-couple families (726 | 89.2%) accounting for the largest median family size of 3.14 persons per family. On the other hand, single female/mother families (44 | 5.4%) represent the smallest median family size with 2.39 persons per family.
| Family Type | # Families | Family Size |
| Married-Couple | 726 (89.2%) | 3.14 |
| Single Male/Father | 44 (5.4%) | 2.73 |
| Single Female/Mother | 44 (5.4%) | 2.39 |
| Total Families | 814 (100.0%) | 3.08 |
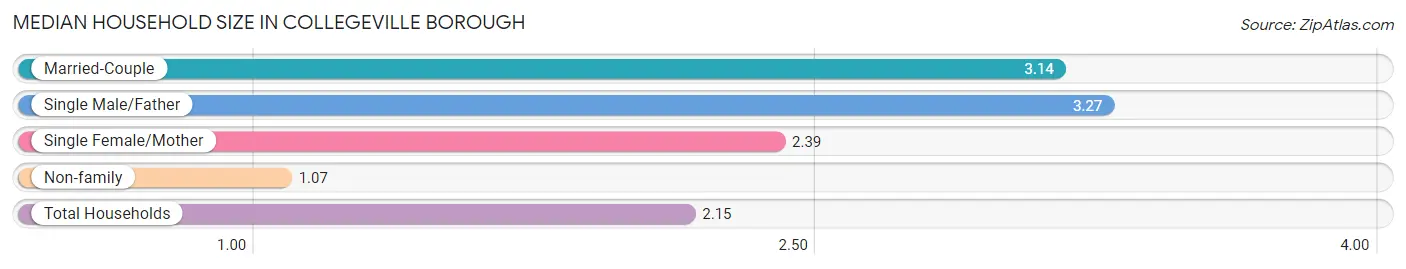
Median Household Size in Collegeville borough
The median household size in Collegeville borough is 2.15 persons per household, with single male/father households (44 | 2.9%) accounting for the largest median household size of 3.27 persons per household. non-family households (719 | 46.9%) represent the smallest median household size with 1.07 persons per household.
| Household Type | # Households | Household Size |
| Married-Couple | 726 (47.4%) | 3.14 |
| Single Male/Father | 44 (2.9%) | 3.27 |
| Single Female/Mother | 44 (2.9%) | 2.39 |
| Non-family | 719 (46.9%) | 1.07 |
| Total Households | 1,533 (100.0%) | 2.15 |
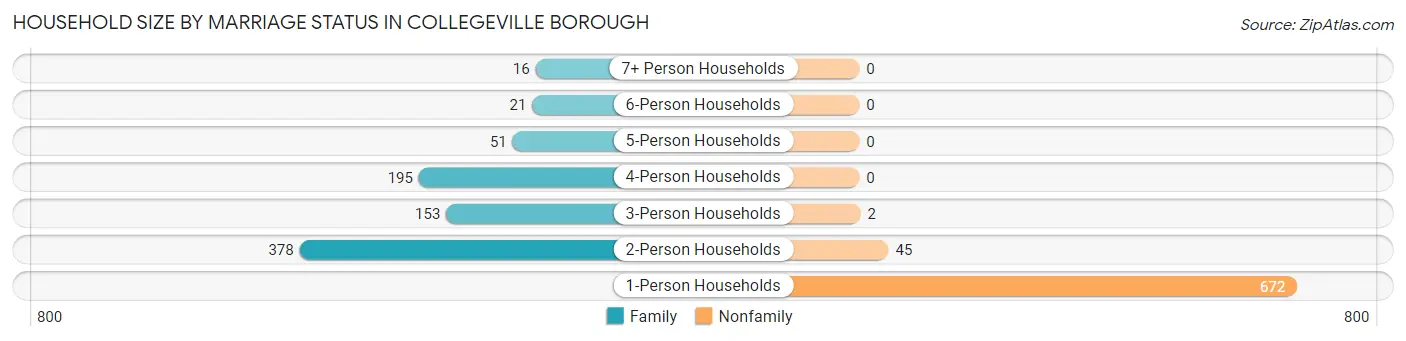
Household Size by Marriage Status in Collegeville borough
Out of a total of 1,533 households in Collegeville borough, 814 (53.1%) are family households, while 719 (46.9%) are nonfamily households. The most numerous type of family households are 2-person households, comprising 378, and the most common type of nonfamily households are 1-person households, comprising 672.
| Household Size | Family Households | Nonfamily Households |
| 1-Person Households | - | 672 (43.8%) |
| 2-Person Households | 378 (24.7%) | 45 (2.9%) |
| 3-Person Households | 153 (10.0%) | 2 (0.1%) |
| 4-Person Households | 195 (12.7%) | 0 (0.0%) |
| 5-Person Households | 51 (3.3%) | 0 (0.0%) |
| 6-Person Households | 21 (1.4%) | 0 (0.0%) |
| 7+ Person Households | 16 (1.0%) | 0 (0.0%) |
| Total | 814 (53.1%) | 719 (46.9%) |
Female Fertility in Collegeville borough
Fertility by Age in Collegeville borough
Average fertility rate in Collegeville borough is 12.0 births per 1,000 women. Women in the age bracket of 35 to 50 years have the highest fertility rate with 35.0 births per 1,000 women. Women in the age bracket of 20 to 34 years acount for 54.5% of all women with births.
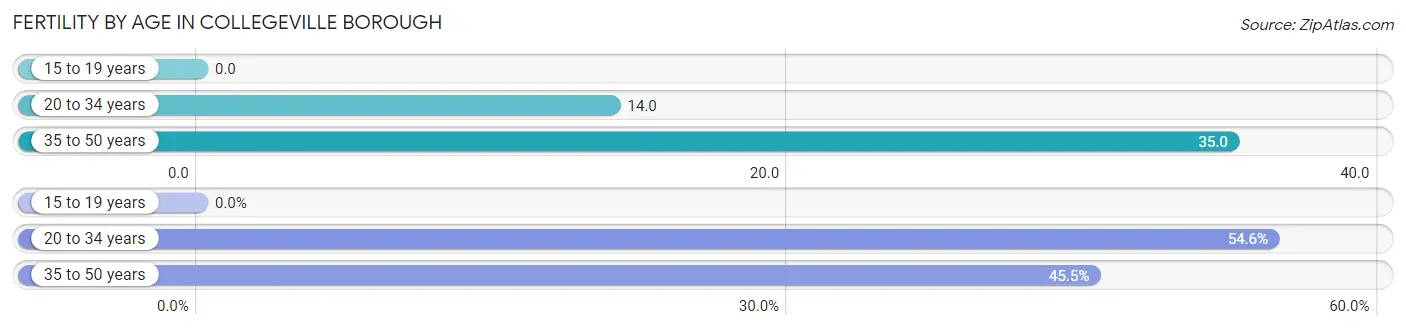
| Age Bracket | Women with Births | Births / 1,000 Women |
| 15 to 19 years | 0 (0.0%) | 0.0 |
| 20 to 34 years | 12 (54.5%) | 14.0 |
| 35 to 50 years | 10 (45.5%) | 35.0 |
| Total | 22 (100.0%) | 12.0 |
Fertility by Age by Marriage Status in Collegeville borough
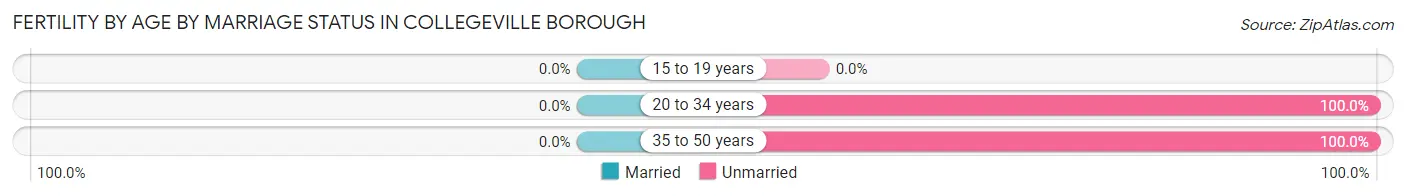
| Age Bracket | Married | Unmarried |
| 15 to 19 years | 0 (0.0%) | 0 (0.0%) |
| 20 to 34 years | 0 (0.0%) | 12 (100.0%) |
| 35 to 50 years | 0 (0.0%) | 10 (100.0%) |
| Total | 0 (0.0%) | 22 (100.0%) |
Fertility by Education in Collegeville borough
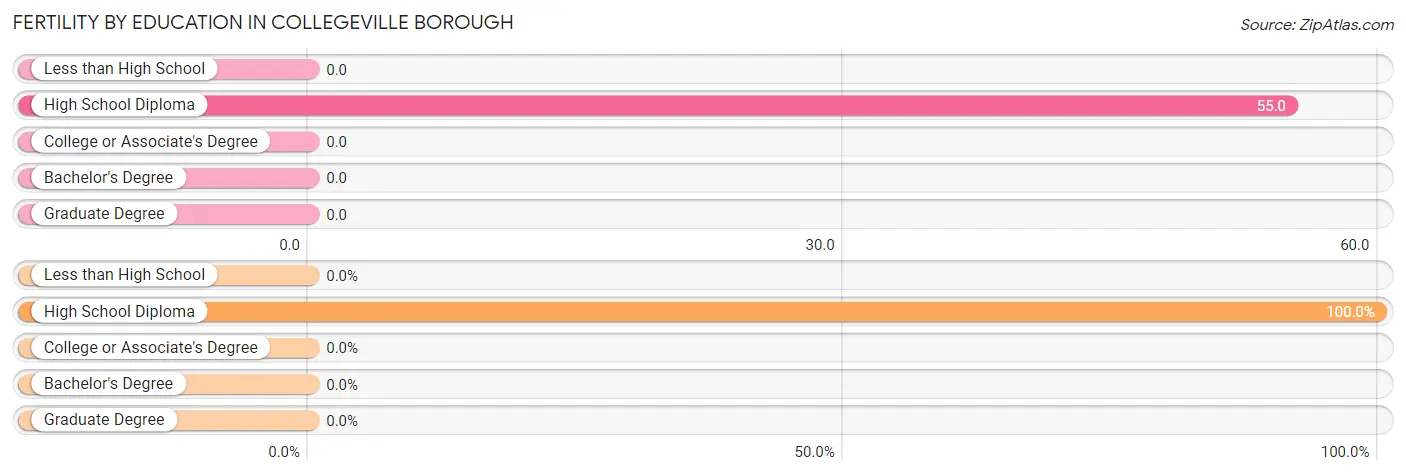
| Educational Attainment | Women with Births | Births / 1,000 Women |
| Less than High School | 0 (0.0%) | 0.0 |
| High School Diploma | 22 (100.0%) | 55.0 |
| College or Associate's Degree | 0 (0.0%) | 0.0 |
| Bachelor's Degree | 0 (0.0%) | 0.0 |
| Graduate Degree | 0 (0.0%) | 0.0 |
| Total | 22 (100.0%) | 12.0 |
Fertility by Education by Marriage Status in Collegeville borough
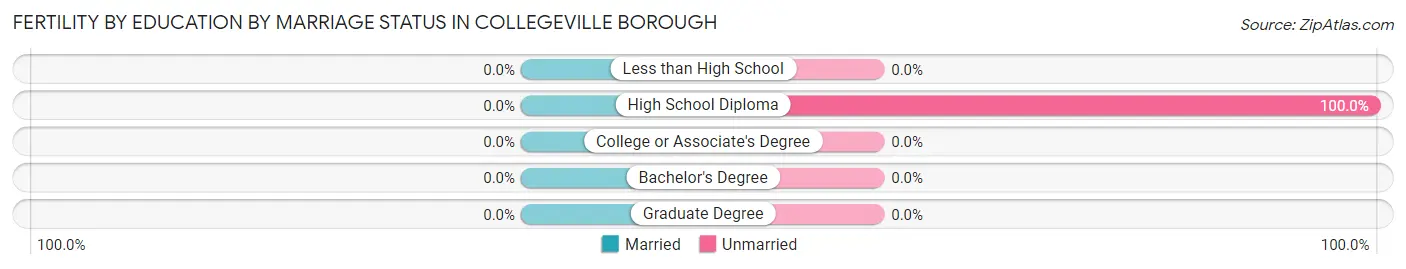
| Educational Attainment | Married | Unmarried |
| Less than High School | 0 (0.0%) | 0 (0.0%) |
| High School Diploma | 0 (0.0%) | 22 (100.0%) |
| College or Associate's Degree | 0 (0.0%) | 0 (0.0%) |
| Bachelor's Degree | 0 (0.0%) | 0 (0.0%) |
| Graduate Degree | 0 (0.0%) | 0 (0.0%) |
| Total | 0 (0.0%) | 22 (100.0%) |
Employment Characteristics in Collegeville borough
Employment by Class of Employer in Collegeville borough
Among the 2,696 employed individuals in Collegeville borough, private company employees (1,839 | 68.2%), not-for-profit organizations (428 | 15.9%), and local government employees (146 | 5.4%) make up the most common classes of employment.
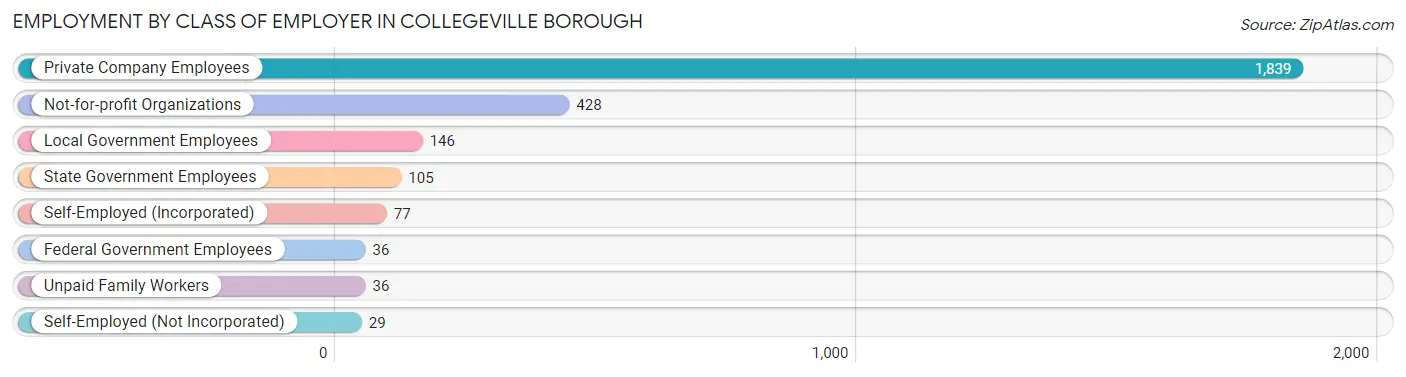
| Employer Class | # Employees | % Employees |
| Private Company Employees | 1,839 | 68.2% |
| Self-Employed (Incorporated) | 77 | 2.9% |
| Self-Employed (Not Incorporated) | 29 | 1.1% |
| Not-for-profit Organizations | 428 | 15.9% |
| Local Government Employees | 146 | 5.4% |
| State Government Employees | 105 | 3.9% |
| Federal Government Employees | 36 | 1.3% |
| Unpaid Family Workers | 36 | 1.3% |
| Total | 2,696 | 100.0% |
Employment Status by Age in Collegeville borough
According to the labor force statistics for Collegeville borough, out of the total population over 16 years of age (4,588), 64.6% or 2,964 individuals are in the labor force, with 7.2% or 213 of them unemployed. The age group with the highest labor force participation rate is 30 to 34 years, with 99.0% or 205 individuals in the labor force. Within the labor force, the 35 to 44 years age range has the highest percentage of unemployed individuals, with 18.8% or 77 of them being unemployed.
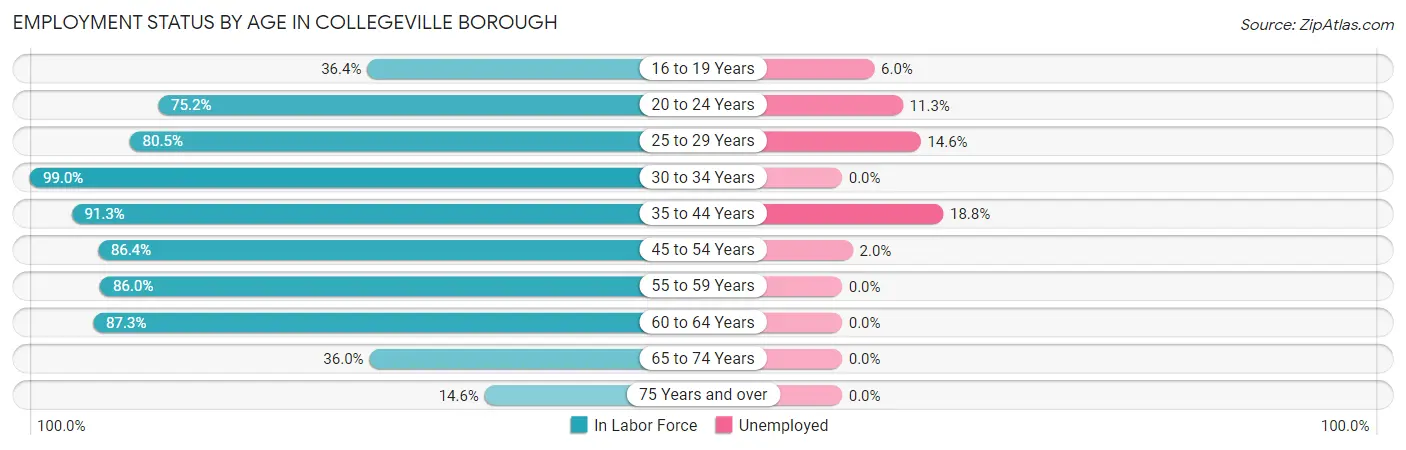
| Age Bracket | In Labor Force | Unemployed |
| 16 to 19 Years | 386 (36.4%) | 23 (6.0%) |
| 20 to 24 Years | 747 (75.2%) | 84 (11.3%) |
| 25 to 29 Years | 157 (80.5%) | 23 (14.6%) |
| 30 to 34 Years | 205 (99.0%) | 0 (0.0%) |
| 35 to 44 Years | 410 (91.3%) | 77 (18.8%) |
| 45 to 54 Years | 349 (86.4%) | 7 (2.0%) |
| 55 to 59 Years | 246 (86.0%) | 0 (0.0%) |
| 60 to 64 Years | 323 (87.3%) | 0 (0.0%) |
| 65 to 74 Years | 81 (36.0%) | 0 (0.0%) |
| 75 Years and over | 58 (14.6%) | 0 (0.0%) |
| Total | 2,964 (64.6%) | 213 (7.2%) |
Employment Status by Educational Attainment in Collegeville borough
According to labor force statistics for Collegeville borough, 88.4% of individuals (1,689) out of the total population between 25 and 64 years of age (1,911) are in the labor force, with 6.3% or 106 of them being unemployed. The group with the highest labor force participation rate are those with the educational attainment of bachelor's degree or higher, with 92.9% or 1,196 individuals in the labor force. Within the labor force, individuals with high school diploma education have the highest percentage of unemployment, with 41.4% or 89 of them being unemployed.
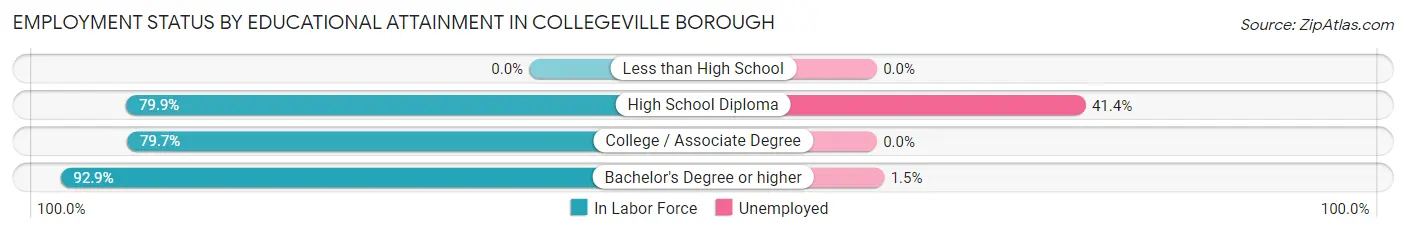
| Educational Attainment | In Labor Force | Unemployed |
| Less than High School | 0 (0.0%) | 0 (0.0%) |
| High School Diploma | 215 (79.9%) | 111 (41.4%) |
| College / Associate Degree | 279 (79.7%) | 0 (0.0%) |
| Bachelor's Degree or higher | 1,196 (92.9%) | 19 (1.5%) |
| Total | 1,689 (88.4%) | 120 (6.3%) |
Employment Occupations by Sex in Collegeville borough
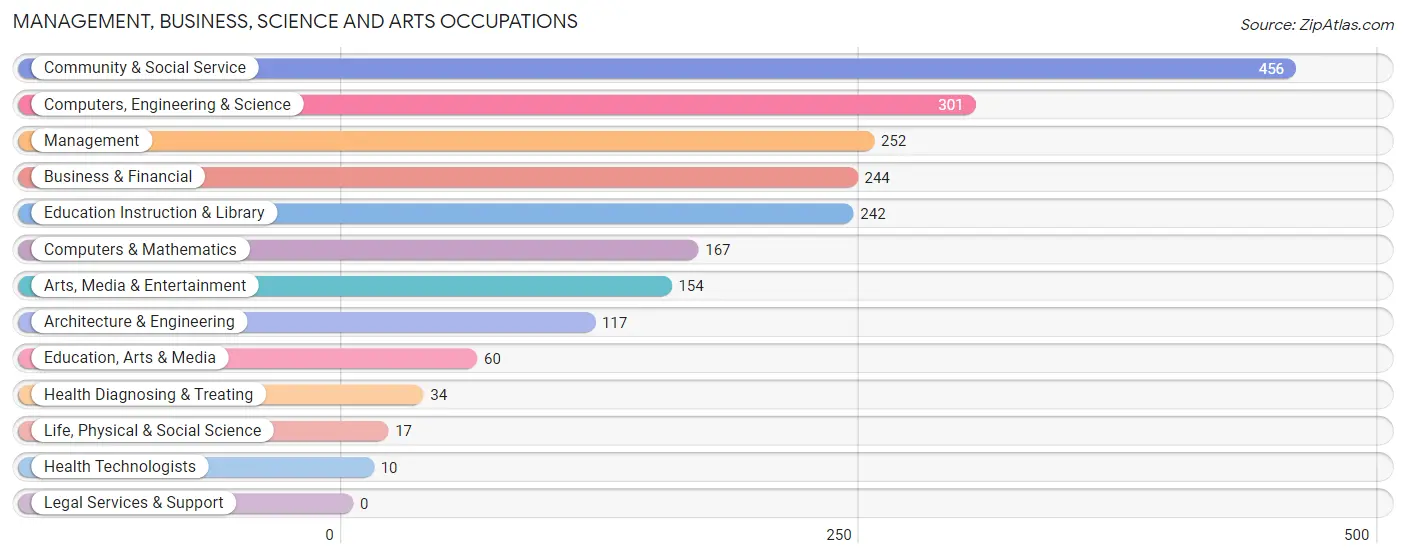
Management, Business, Science and Arts Occupations
The most common Management, Business, Science and Arts occupations in Collegeville borough are Community & Social Service (456 | 16.6%), Computers, Engineering & Science (301 | 11.0%), Management (252 | 9.2%), Business & Financial (244 | 8.9%), and Education Instruction & Library (242 | 8.8%).
Management, Business, Science and Arts Occupations by Sex
Within the Management, Business, Science and Arts occupations in Collegeville borough, the most male-oriented occupations are Architecture & Engineering (100.0%), Computers, Engineering & Science (83.1%), and Computers & Mathematics (79.6%), while the most female-oriented occupations are Life, Physical & Social Science (100.0%), Health Diagnosing & Treating (100.0%), and Health Technologists (100.0%).
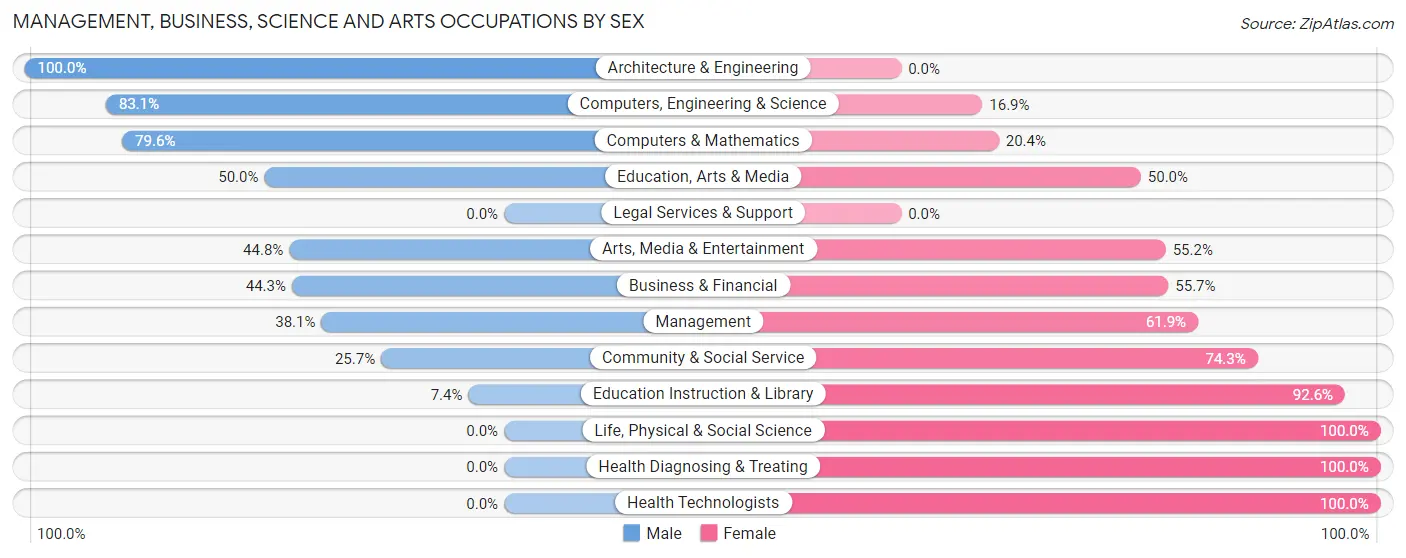
| Occupation | Male | Female |
| Management | 96 (38.1%) | 156 (61.9%) |
| Business & Financial | 108 (44.3%) | 136 (55.7%) |
| Computers, Engineering & Science | 250 (83.1%) | 51 (16.9%) |
| Computers & Mathematics | 133 (79.6%) | 34 (20.4%) |
| Architecture & Engineering | 117 (100.0%) | 0 (0.0%) |
| Life, Physical & Social Science | 0 (0.0%) | 17 (100.0%) |
| Community & Social Service | 117 (25.7%) | 339 (74.3%) |
| Education, Arts & Media | 30 (50.0%) | 30 (50.0%) |
| Legal Services & Support | 0 (0.0%) | 0 (0.0%) |
| Education Instruction & Library | 18 (7.4%) | 224 (92.6%) |
| Arts, Media & Entertainment | 69 (44.8%) | 85 (55.2%) |
| Health Diagnosing & Treating | 0 (0.0%) | 34 (100.0%) |
| Health Technologists | 0 (0.0%) | 10 (100.0%) |
| Total (Category) | 571 (44.4%) | 716 (55.6%) |
| Total (Overall) | 1,255 (45.8%) | 1,487 (54.2%) |
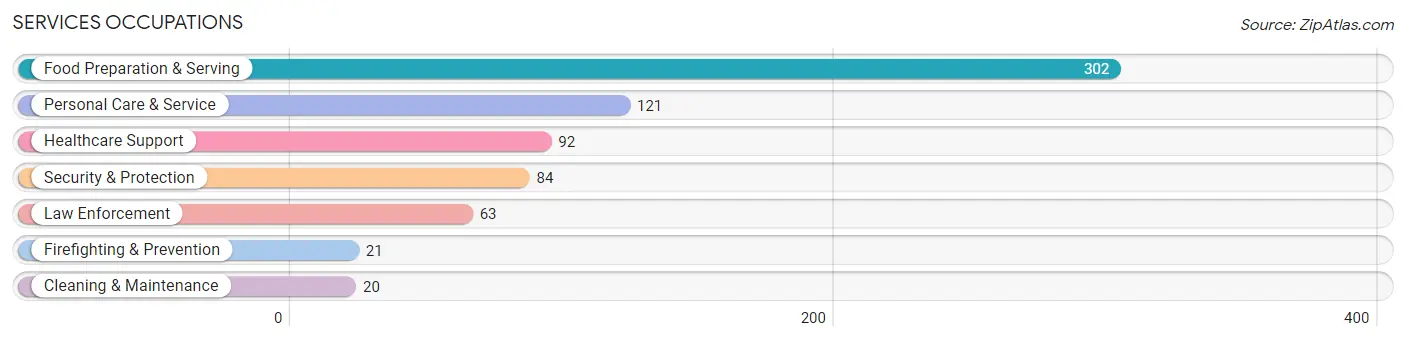
Services Occupations
The most common Services occupations in Collegeville borough are Food Preparation & Serving (302 | 11.0%), Personal Care & Service (121 | 4.4%), Healthcare Support (92 | 3.4%), Security & Protection (84 | 3.1%), and Law Enforcement (63 | 2.3%).
Services Occupations by Sex
Within the Services occupations in Collegeville borough, the most male-oriented occupations are Cleaning & Maintenance (100.0%), Firefighting & Prevention (66.7%), and Security & Protection (61.9%), while the most female-oriented occupations are Healthcare Support (91.3%), Personal Care & Service (72.7%), and Food Preparation & Serving (57.3%).
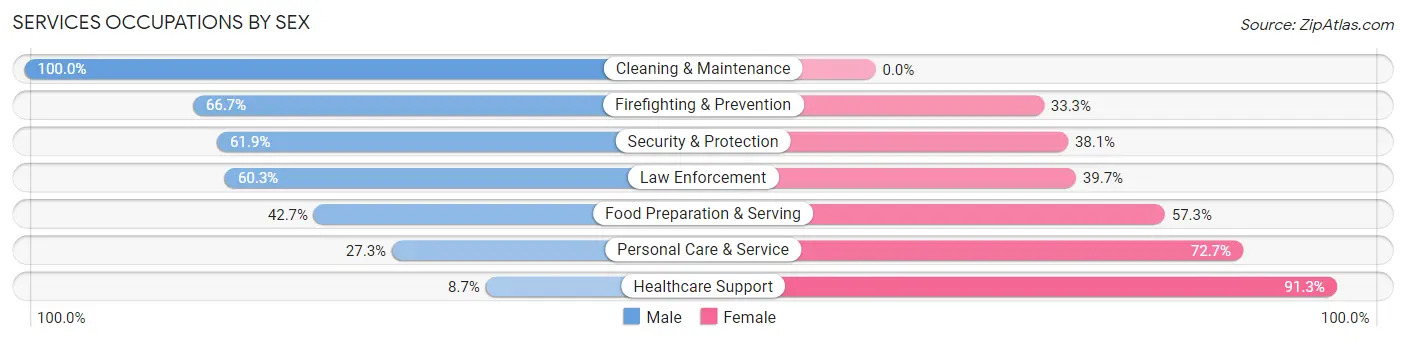
| Occupation | Male | Female |
| Healthcare Support | 8 (8.7%) | 84 (91.3%) |
| Security & Protection | 52 (61.9%) | 32 (38.1%) |
| Firefighting & Prevention | 14 (66.7%) | 7 (33.3%) |
| Law Enforcement | 38 (60.3%) | 25 (39.7%) |
| Food Preparation & Serving | 129 (42.7%) | 173 (57.3%) |
| Cleaning & Maintenance | 20 (100.0%) | 0 (0.0%) |
| Personal Care & Service | 33 (27.3%) | 88 (72.7%) |
| Total (Category) | 242 (39.1%) | 377 (60.9%) |
| Total (Overall) | 1,255 (45.8%) | 1,487 (54.2%) |
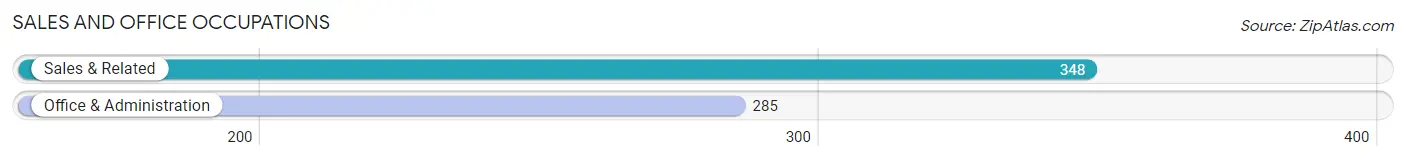
Sales and Office Occupations
The most common Sales and Office occupations in Collegeville borough are Sales & Related (348 | 12.7%), and Office & Administration (285 | 10.4%).
Sales and Office Occupations by Sex
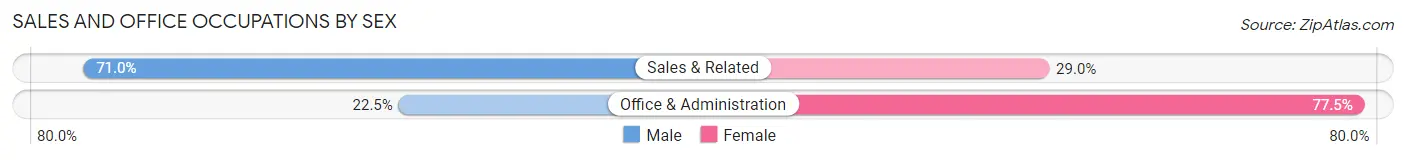
| Occupation | Male | Female |
| Sales & Related | 247 (71.0%) | 101 (29.0%) |
| Office & Administration | 64 (22.5%) | 221 (77.5%) |
| Total (Category) | 311 (49.1%) | 322 (50.9%) |
| Total (Overall) | 1,255 (45.8%) | 1,487 (54.2%) |
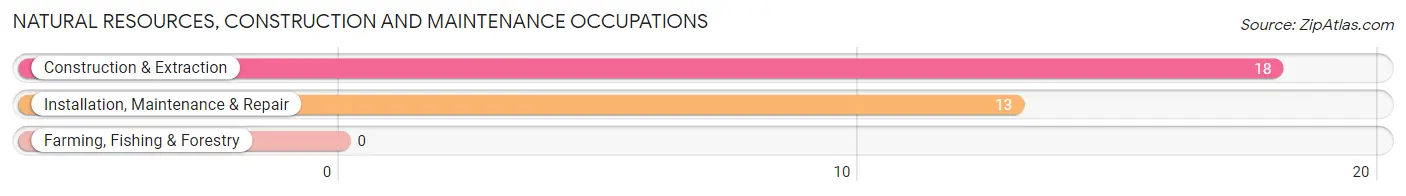
Natural Resources, Construction and Maintenance Occupations
The most common Natural Resources, Construction and Maintenance occupations in Collegeville borough are Construction & Extraction (18 | 0.7%), and Installation, Maintenance & Repair (13 | 0.5%).
Natural Resources, Construction and Maintenance Occupations by Sex
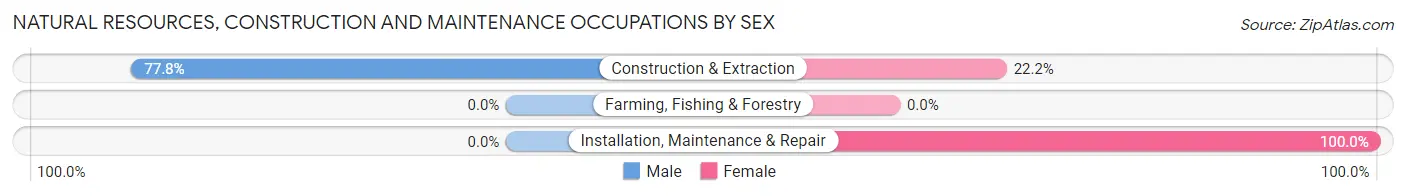
| Occupation | Male | Female |
| Farming, Fishing & Forestry | 0 (0.0%) | 0 (0.0%) |
| Construction & Extraction | 14 (77.8%) | 4 (22.2%) |
| Installation, Maintenance & Repair | 0 (0.0%) | 13 (100.0%) |
| Total (Category) | 14 (45.2%) | 17 (54.8%) |
| Total (Overall) | 1,255 (45.8%) | 1,487 (54.2%) |
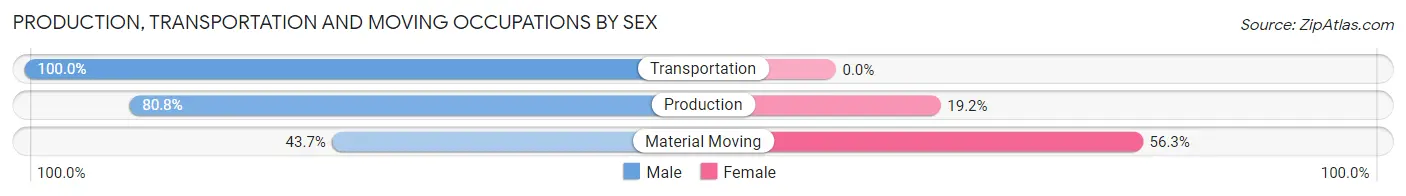
Production, Transportation and Moving Occupations
The most common Production, Transportation and Moving occupations in Collegeville borough are Production (78 | 2.8%), Material Moving (71 | 2.6%), and Transportation (23 | 0.8%).
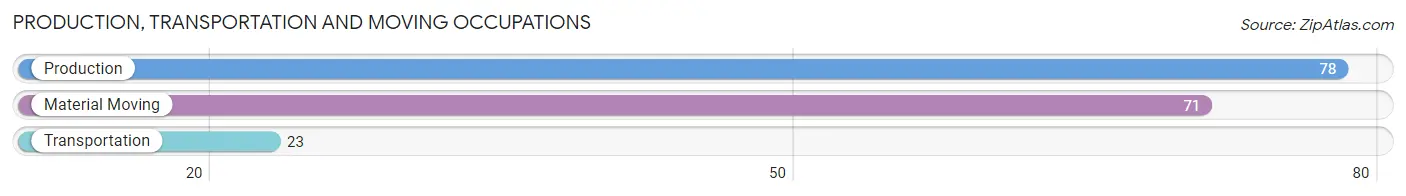
Production, Transportation and Moving Occupations by Sex
| Occupation | Male | Female |
| Production | 63 (80.8%) | 15 (19.2%) |
| Transportation | 23 (100.0%) | 0 (0.0%) |
| Material Moving | 31 (43.7%) | 40 (56.3%) |
| Total (Category) | 117 (68.0%) | 55 (32.0%) |
| Total (Overall) | 1,255 (45.8%) | 1,487 (54.2%) |
Employment Industries by Sex in Collegeville borough
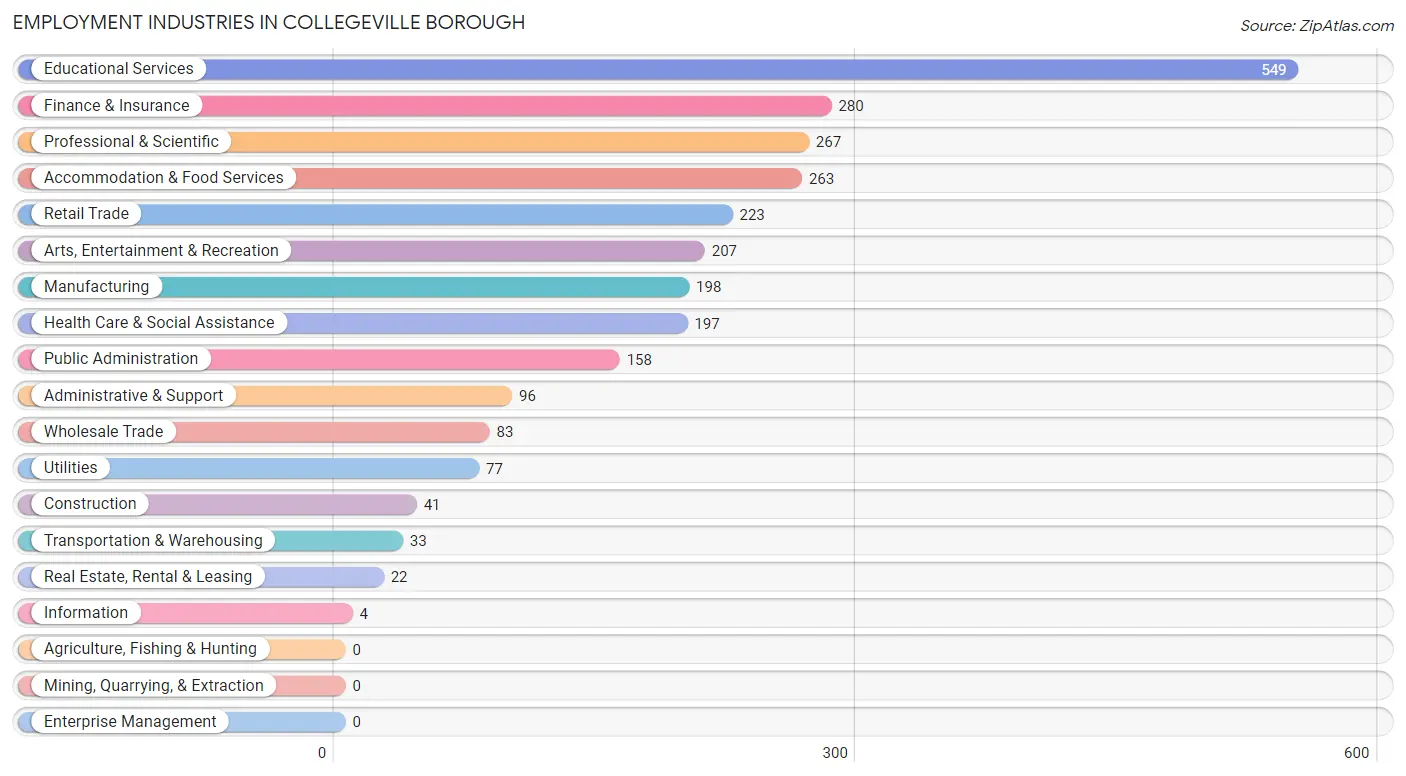
Employment Industries in Collegeville borough
The major employment industries in Collegeville borough include Educational Services (549 | 20.0%), Finance & Insurance (280 | 10.2%), Professional & Scientific (267 | 9.7%), Accommodation & Food Services (263 | 9.6%), and Retail Trade (223 | 8.1%).
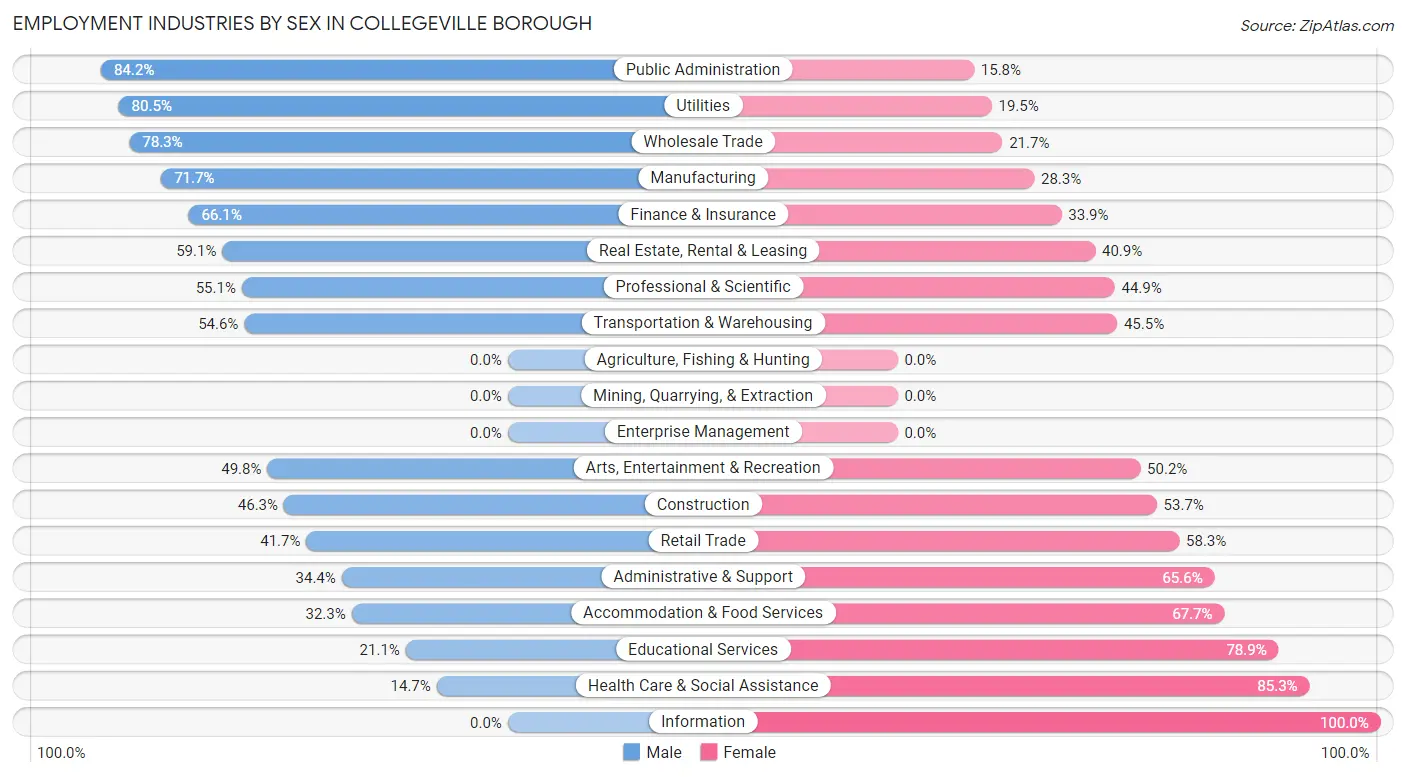
Employment Industries by Sex in Collegeville borough
The Collegeville borough industries that see more men than women are Public Administration (84.2%), Utilities (80.5%), and Wholesale Trade (78.3%), whereas the industries that tend to have a higher number of women are Information (100.0%), Health Care & Social Assistance (85.3%), and Educational Services (78.9%).
| Industry | Male | Female |
| Agriculture, Fishing & Hunting | 0 (0.0%) | 0 (0.0%) |
| Mining, Quarrying, & Extraction | 0 (0.0%) | 0 (0.0%) |
| Construction | 19 (46.3%) | 22 (53.7%) |
| Manufacturing | 142 (71.7%) | 56 (28.3%) |
| Wholesale Trade | 65 (78.3%) | 18 (21.7%) |
| Retail Trade | 93 (41.7%) | 130 (58.3%) |
| Transportation & Warehousing | 18 (54.5%) | 15 (45.5%) |
| Utilities | 62 (80.5%) | 15 (19.5%) |
| Information | 0 (0.0%) | 4 (100.0%) |
| Finance & Insurance | 185 (66.1%) | 95 (33.9%) |
| Real Estate, Rental & Leasing | 13 (59.1%) | 9 (40.9%) |
| Professional & Scientific | 147 (55.1%) | 120 (44.9%) |
| Enterprise Management | 0 (0.0%) | 0 (0.0%) |
| Administrative & Support | 33 (34.4%) | 63 (65.6%) |
| Educational Services | 116 (21.1%) | 433 (78.9%) |
| Health Care & Social Assistance | 29 (14.7%) | 168 (85.3%) |
| Arts, Entertainment & Recreation | 103 (49.8%) | 104 (50.2%) |
| Accommodation & Food Services | 85 (32.3%) | 178 (67.7%) |
| Public Administration | 133 (84.2%) | 25 (15.8%) |
| Total | 1,255 (45.8%) | 1,487 (54.2%) |
Education in Collegeville borough
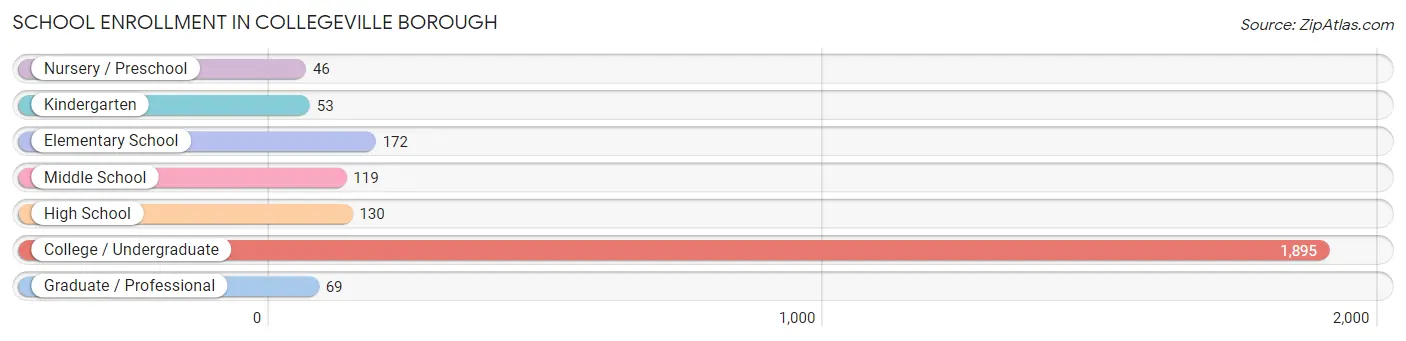
School Enrollment in Collegeville borough
The most common levels of schooling among the 2,484 students in Collegeville borough are college / undergraduate (1,895 | 76.3%), elementary school (172 | 6.9%), and high school (130 | 5.2%).
| School Level | # Students | % Students |
| Nursery / Preschool | 46 | 1.8% |
| Kindergarten | 53 | 2.1% |
| Elementary School | 172 | 6.9% |
| Middle School | 119 | 4.8% |
| High School | 130 | 5.2% |
| College / Undergraduate | 1,895 | 76.3% |
| Graduate / Professional | 69 | 2.8% |
| Total | 2,484 | 100.0% |
School Enrollment by Age by Funding Source in Collegeville borough
Out of a total of 2,484 students who are enrolled in schools in Collegeville borough, 1,918 (77.2%) attend a private institution, while the remaining 566 (22.8%) are enrolled in public schools. The age group of 35 years and over has the highest likelihood of being enrolled in private schools, with 28 (100.0% in the age bracket) enrolled. Conversely, the age group of 10 to 14 year olds has the lowest likelihood of being enrolled in a private school, with 133 (100.0% in the age bracket) attending a public institution.
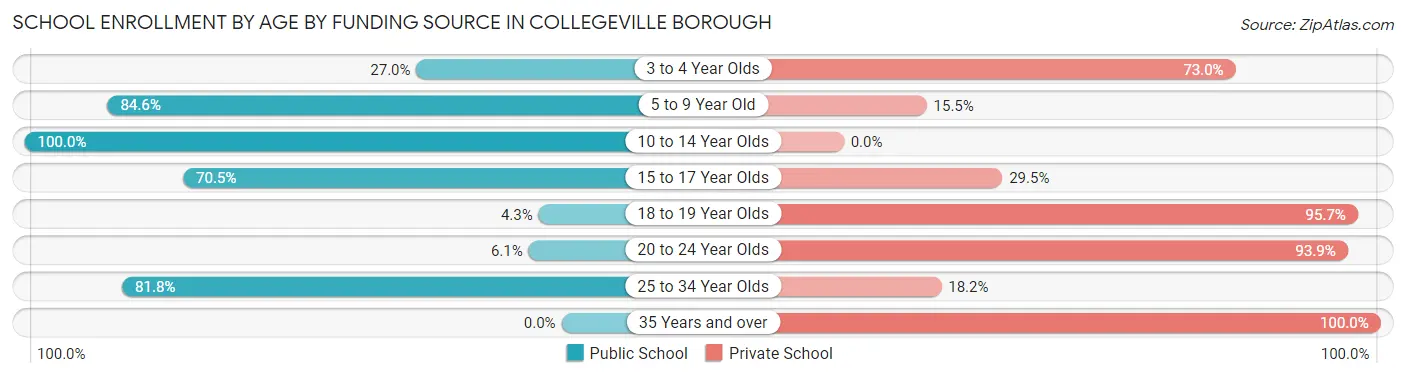
| Age Bracket | Public School | Private School |
| 3 to 4 Year Olds | 10 (27.0%) | 27 (73.0%) |
| 5 to 9 Year Old | 186 (84.6%) | 34 (15.4%) |
| 10 to 14 Year Olds | 133 (100.0%) | 0 (0.0%) |
| 15 to 17 Year Olds | 105 (70.5%) | 44 (29.5%) |
| 18 to 19 Year Olds | 41 (4.3%) | 920 (95.7%) |
| 20 to 24 Year Olds | 56 (6.1%) | 856 (93.9%) |
| 25 to 34 Year Olds | 36 (81.8%) | 8 (18.2%) |
| 35 Years and over | 0 (0.0%) | 28 (100.0%) |
| Total | 566 (22.8%) | 1,918 (77.2%) |
Educational Attainment by Field of Study in Collegeville borough
Business (317 | 19.9%), education (172 | 10.8%), social sciences (166 | 10.4%), engineering (162 | 10.2%), and computers & mathematics (128 | 8.1%) are the most common fields of study among 1,590 individuals in Collegeville borough who have obtained a bachelor's degree or higher.
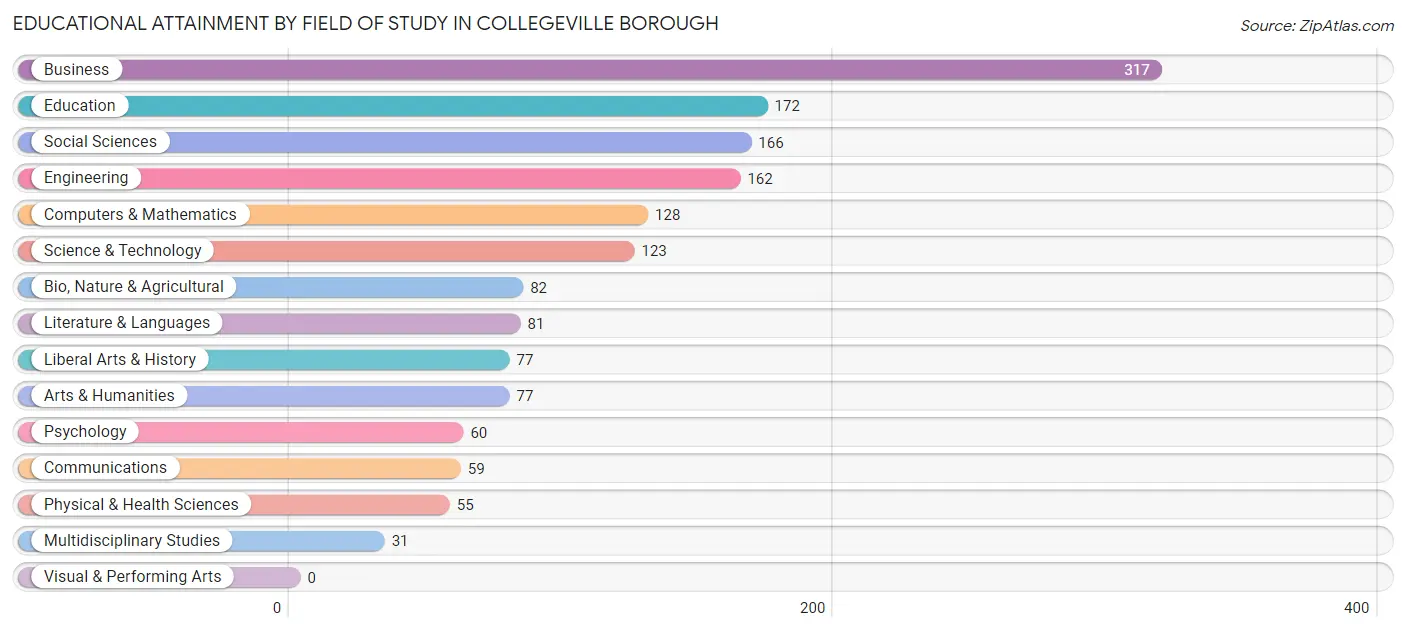
| Field of Study | # Graduates | % Graduates |
| Computers & Mathematics | 128 | 8.1% |
| Bio, Nature & Agricultural | 82 | 5.2% |
| Physical & Health Sciences | 55 | 3.5% |
| Psychology | 60 | 3.8% |
| Social Sciences | 166 | 10.4% |
| Engineering | 162 | 10.2% |
| Multidisciplinary Studies | 31 | 1.9% |
| Science & Technology | 123 | 7.7% |
| Business | 317 | 19.9% |
| Education | 172 | 10.8% |
| Literature & Languages | 81 | 5.1% |
| Liberal Arts & History | 77 | 4.8% |
| Visual & Performing Arts | 0 | 0.0% |
| Communications | 59 | 3.7% |
| Arts & Humanities | 77 | 4.8% |
| Total | 1,590 | 100.0% |
Transportation & Commute in Collegeville borough
Vehicle Availability by Sex in Collegeville borough
The most prevalent vehicle ownership categories in Collegeville borough are males with 2 vehicles (566, accounting for 54.3%) and females with 2 vehicles (446, making up 69.2%).
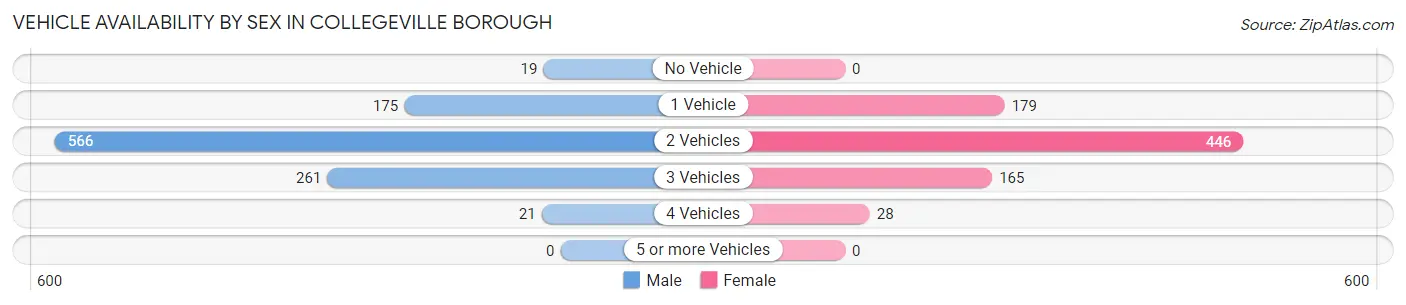
| Vehicles Available | Male | Female |
| No Vehicle | 19 (1.8%) | 0 (0.0%) |
| 1 Vehicle | 175 (16.8%) | 179 (21.9%) |
| 2 Vehicles | 566 (54.3%) | 446 (54.5%) |
| 3 Vehicles | 261 (25.1%) | 165 (20.2%) |
| 4 Vehicles | 21 (2.0%) | 28 (3.4%) |
| 5 or more Vehicles | 0 (0.0%) | 0 (0.0%) |
| Total | 1,042 (100.0%) | 818 (100.0%) |
Commute Time in Collegeville borough
The most frequently occuring commute durations in Collegeville borough are 10 to 14 minutes (353 commuters, 16.6%), 5 to 9 minutes (327 commuters, 15.3%), and 30 to 34 minutes (283 commuters, 13.3%).
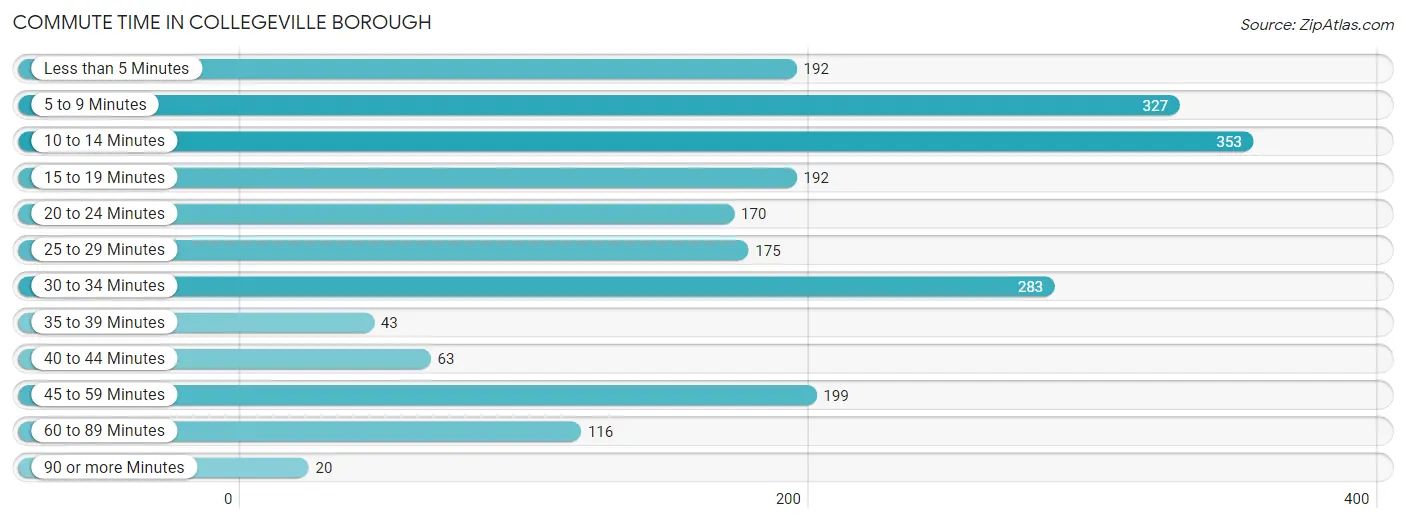
| Commute Time | # Commuters | % Commuters |
| Less than 5 Minutes | 192 | 9.0% |
| 5 to 9 Minutes | 327 | 15.3% |
| 10 to 14 Minutes | 353 | 16.6% |
| 15 to 19 Minutes | 192 | 9.0% |
| 20 to 24 Minutes | 170 | 8.0% |
| 25 to 29 Minutes | 175 | 8.2% |
| 30 to 34 Minutes | 283 | 13.3% |
| 35 to 39 Minutes | 43 | 2.0% |
| 40 to 44 Minutes | 63 | 2.9% |
| 45 to 59 Minutes | 199 | 9.3% |
| 60 to 89 Minutes | 116 | 5.4% |
| 90 or more Minutes | 20 | 0.9% |
Commute Time by Sex in Collegeville borough
The most common commute times in Collegeville borough are 5 to 9 minutes (166 commuters, 17.6%) for males and 10 to 14 minutes (188 commuters, 15.8%) for females.
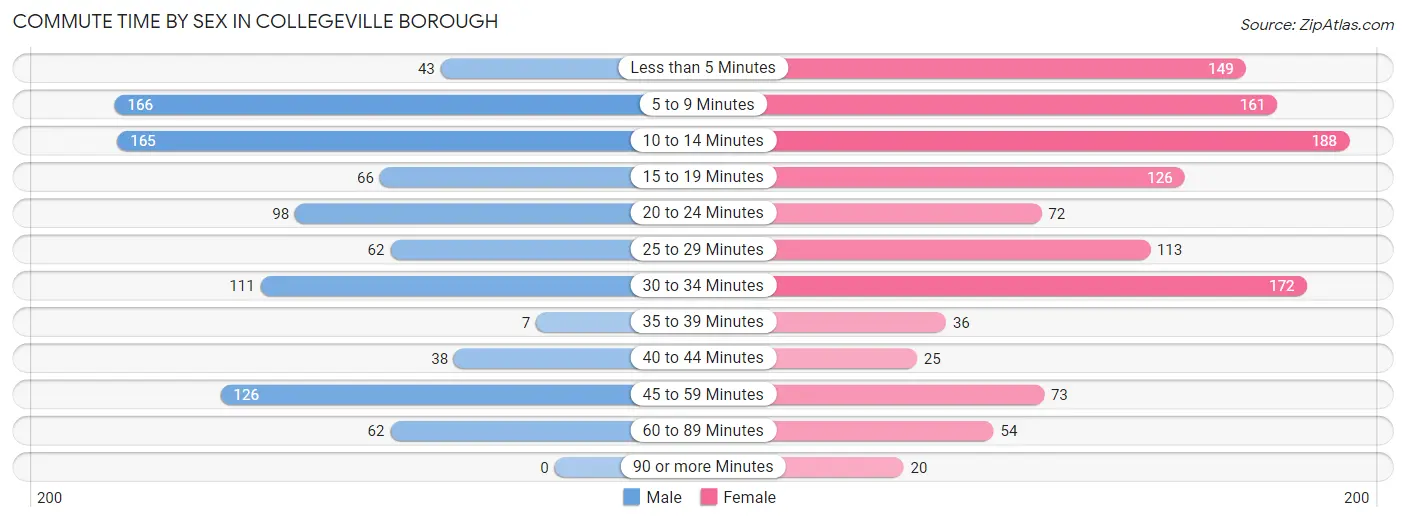
| Commute Time | Male | Female |
| Less than 5 Minutes | 43 (4.6%) | 149 (12.5%) |
| 5 to 9 Minutes | 166 (17.6%) | 161 (13.5%) |
| 10 to 14 Minutes | 165 (17.5%) | 188 (15.8%) |
| 15 to 19 Minutes | 66 (7.0%) | 126 (10.6%) |
| 20 to 24 Minutes | 98 (10.4%) | 72 (6.1%) |
| 25 to 29 Minutes | 62 (6.6%) | 113 (9.5%) |
| 30 to 34 Minutes | 111 (11.8%) | 172 (14.5%) |
| 35 to 39 Minutes | 7 (0.7%) | 36 (3.0%) |
| 40 to 44 Minutes | 38 (4.0%) | 25 (2.1%) |
| 45 to 59 Minutes | 126 (13.4%) | 73 (6.1%) |
| 60 to 89 Minutes | 62 (6.6%) | 54 (4.5%) |
| 90 or more Minutes | 0 (0.0%) | 20 (1.7%) |
Time of Departure to Work by Sex in Collegeville borough
The most frequent times of departure to work in Collegeville borough are 8:00 AM to 8:29 AM (189, 20.0%) for males and 4:00 PM to 11:59 PM (199, 16.7%) for females.
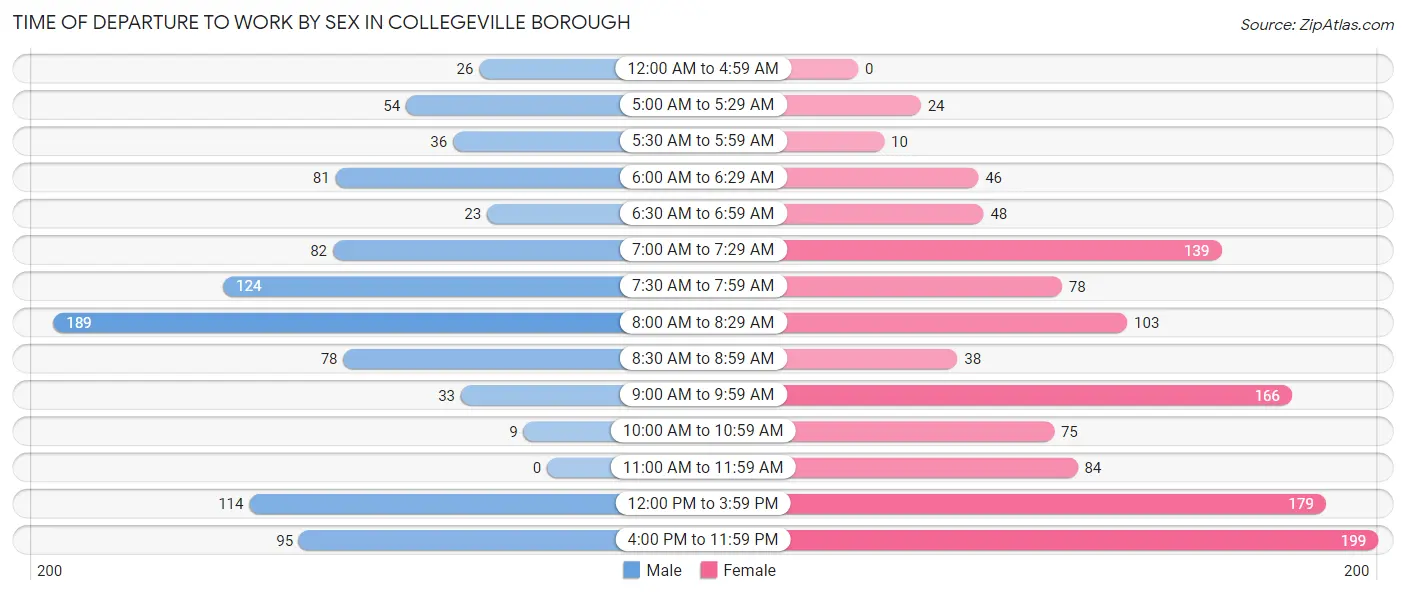
| Time of Departure | Male | Female |
| 12:00 AM to 4:59 AM | 26 (2.8%) | 0 (0.0%) |
| 5:00 AM to 5:29 AM | 54 (5.7%) | 24 (2.0%) |
| 5:30 AM to 5:59 AM | 36 (3.8%) | 10 (0.8%) |
| 6:00 AM to 6:29 AM | 81 (8.6%) | 46 (3.9%) |
| 6:30 AM to 6:59 AM | 23 (2.4%) | 48 (4.0%) |
| 7:00 AM to 7:29 AM | 82 (8.7%) | 139 (11.7%) |
| 7:30 AM to 7:59 AM | 124 (13.1%) | 78 (6.6%) |
| 8:00 AM to 8:29 AM | 189 (20.0%) | 103 (8.7%) |
| 8:30 AM to 8:59 AM | 78 (8.3%) | 38 (3.2%) |
| 9:00 AM to 9:59 AM | 33 (3.5%) | 166 (14.0%) |
| 10:00 AM to 10:59 AM | 9 (0.9%) | 75 (6.3%) |
| 11:00 AM to 11:59 AM | 0 (0.0%) | 84 (7.1%) |
| 12:00 PM to 3:59 PM | 114 (12.1%) | 179 (15.0%) |
| 4:00 PM to 11:59 PM | 95 (10.1%) | 199 (16.7%) |
| Total | 944 (100.0%) | 1,189 (100.0%) |
Housing Occupancy in Collegeville borough
Occupancy by Ownership in Collegeville borough
Of the total 1,533 dwellings in Collegeville borough, owner-occupied units account for 1,124 (73.3%), while renter-occupied units make up 409 (26.7%).
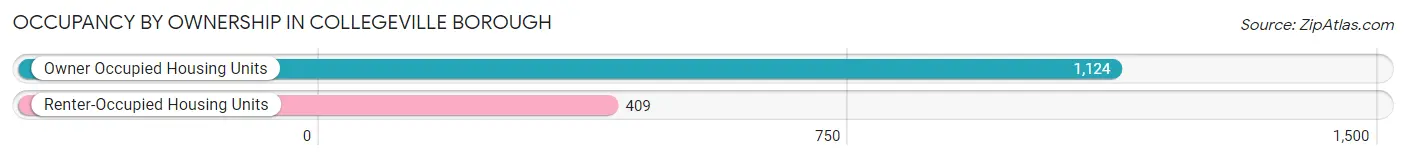
| Occupancy | # Housing Units | % Housing Units |
| Owner Occupied Housing Units | 1,124 | 73.3% |
| Renter-Occupied Housing Units | 409 | 26.7% |
| Total Occupied Housing Units | 1,533 | 100.0% |
Occupancy by Household Size in Collegeville borough
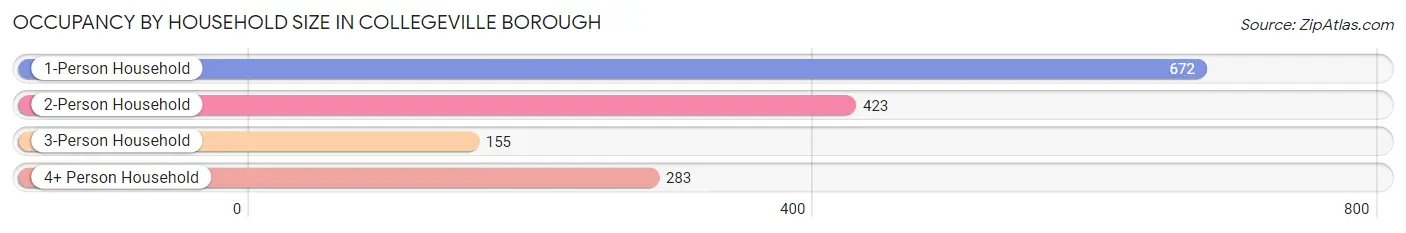
| Household Size | # Housing Units | % Housing Units |
| 1-Person Household | 672 | 43.8% |
| 2-Person Household | 423 | 27.6% |
| 3-Person Household | 155 | 10.1% |
| 4+ Person Household | 283 | 18.5% |
| Total Housing Units | 1,533 | 100.0% |
Occupancy by Ownership by Household Size in Collegeville borough
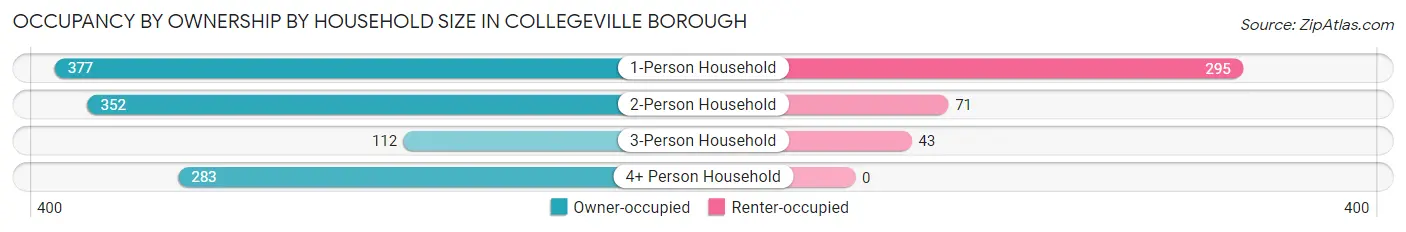
| Household Size | Owner-occupied | Renter-occupied |
| 1-Person Household | 377 (56.1%) | 295 (43.9%) |
| 2-Person Household | 352 (83.2%) | 71 (16.8%) |
| 3-Person Household | 112 (72.3%) | 43 (27.7%) |
| 4+ Person Household | 283 (100.0%) | 0 (0.0%) |
| Total Housing Units | 1,124 (73.3%) | 409 (26.7%) |
Occupancy by Educational Attainment in Collegeville borough
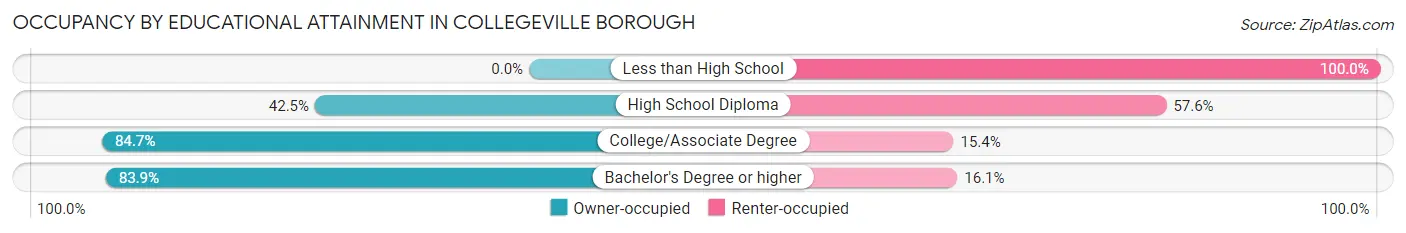
| Household Size | Owner-occupied | Renter-occupied |
| Less than High School | 0 (0.0%) | 22 (100.0%) |
| High School Diploma | 149 (42.4%) | 202 (57.6%) |
| College/Associate Degree | 204 (84.7%) | 37 (15.3%) |
| Bachelor's Degree or higher | 771 (83.9%) | 148 (16.1%) |
Occupancy by Age of Householder in Collegeville borough
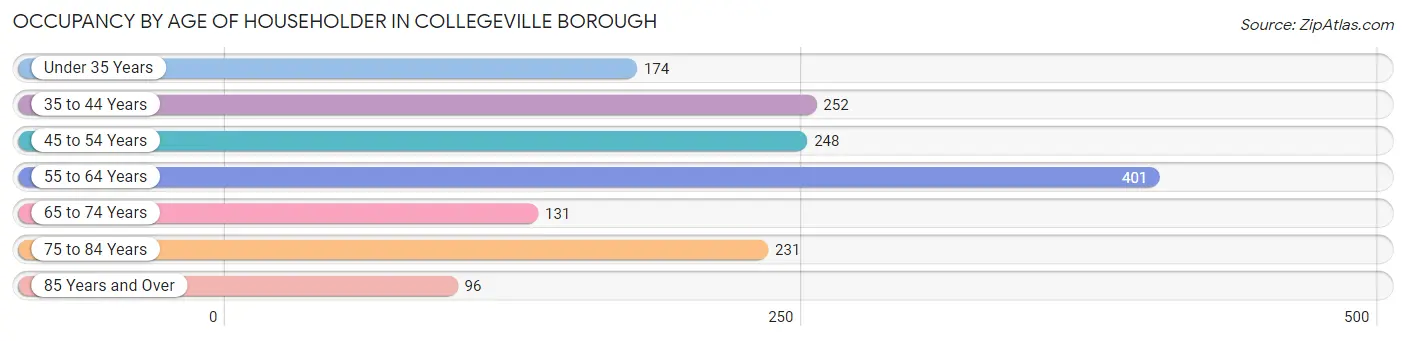
| Age Bracket | # Households | % Households |
| Under 35 Years | 174 | 11.4% |
| 35 to 44 Years | 252 | 16.4% |
| 45 to 54 Years | 248 | 16.2% |
| 55 to 64 Years | 401 | 26.2% |
| 65 to 74 Years | 131 | 8.6% |
| 75 to 84 Years | 231 | 15.1% |
| 85 Years and Over | 96 | 6.3% |
| Total | 1,533 | 100.0% |
Housing Finances in Collegeville borough
Median Income by Occupancy in Collegeville borough
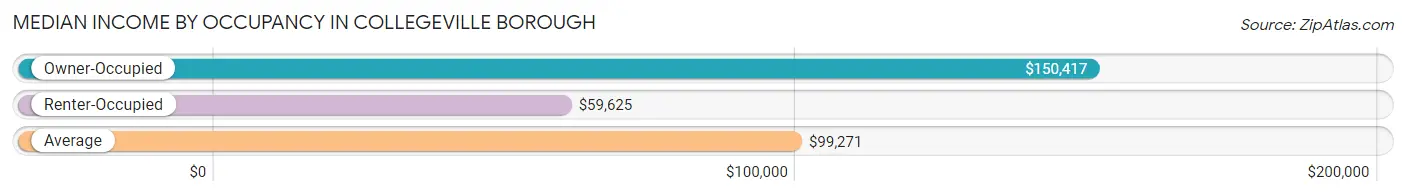
| Occupancy Type | # Households | Median Income |
| Owner-Occupied | 1,124 (73.3%) | $150,417 |
| Renter-Occupied | 409 (26.7%) | $59,625 |
| Average | 1,533 (100.0%) | $99,271 |
Occupancy by Householder Income Bracket in Collegeville borough
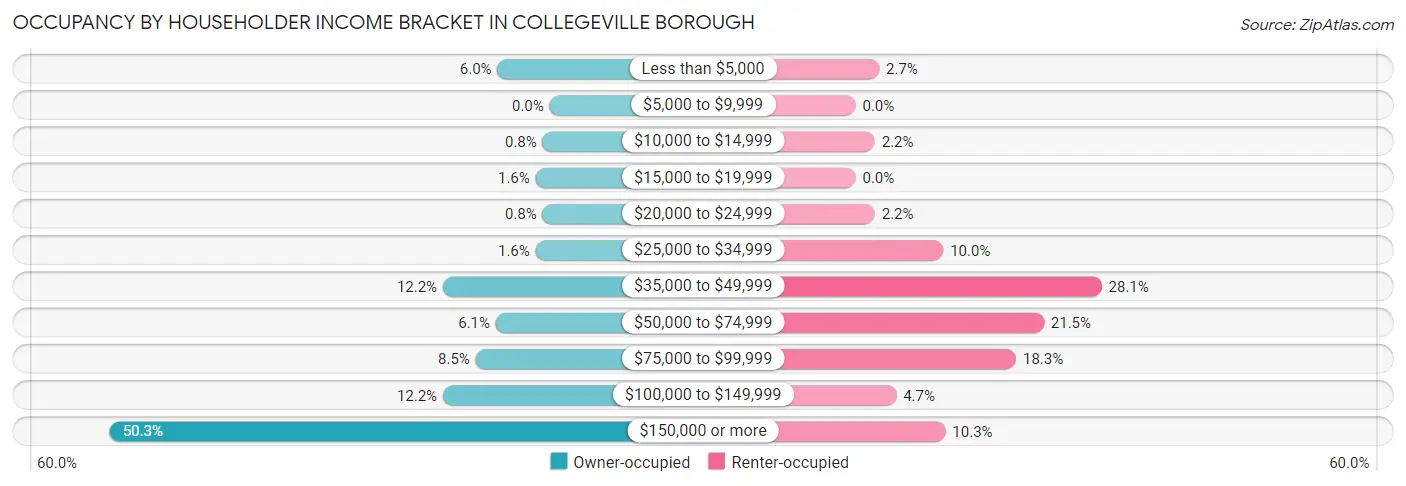
| Income Bracket | Owner-occupied | Renter-occupied |
| Less than $5,000 | 67 (6.0%) | 11 (2.7%) |
| $5,000 to $9,999 | 0 (0.0%) | 0 (0.0%) |
| $10,000 to $14,999 | 9 (0.8%) | 9 (2.2%) |
| $15,000 to $19,999 | 18 (1.6%) | 0 (0.0%) |
| $20,000 to $24,999 | 9 (0.8%) | 9 (2.2%) |
| $25,000 to $34,999 | 18 (1.6%) | 41 (10.0%) |
| $35,000 to $49,999 | 137 (12.2%) | 115 (28.1%) |
| $50,000 to $74,999 | 69 (6.1%) | 88 (21.5%) |
| $75,000 to $99,999 | 95 (8.5%) | 75 (18.3%) |
| $100,000 to $149,999 | 137 (12.2%) | 19 (4.6%) |
| $150,000 or more | 565 (50.3%) | 42 (10.3%) |
| Total | 1,124 (100.0%) | 409 (100.0%) |
Monthly Housing Cost Tiers in Collegeville borough
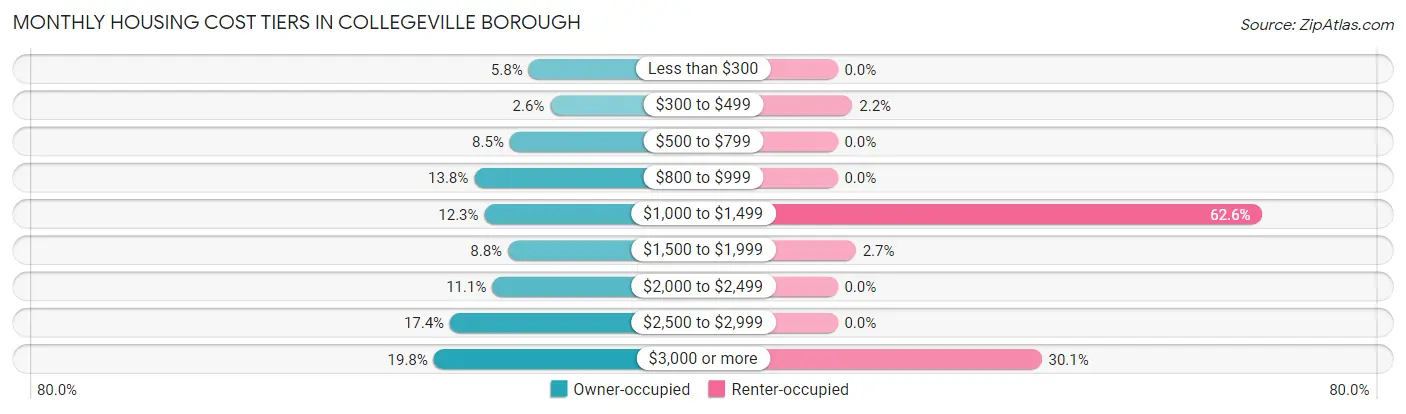
| Monthly Cost | Owner-occupied | Renter-occupied |
| Less than $300 | 65 (5.8%) | 0 (0.0%) |
| $300 to $499 | 29 (2.6%) | 9 (2.2%) |
| $500 to $799 | 96 (8.5%) | 0 (0.0%) |
| $800 to $999 | 155 (13.8%) | 0 (0.0%) |
| $1,000 to $1,499 | 138 (12.3%) | 256 (62.6%) |
| $1,500 to $1,999 | 99 (8.8%) | 11 (2.7%) |
| $2,000 to $2,499 | 125 (11.1%) | 0 (0.0%) |
| $2,500 to $2,999 | 195 (17.3%) | 0 (0.0%) |
| $3,000 or more | 222 (19.8%) | 123 (30.1%) |
| Total | 1,124 (100.0%) | 409 (100.0%) |
Physical Housing Characteristics in Collegeville borough
Housing Structures in Collegeville borough
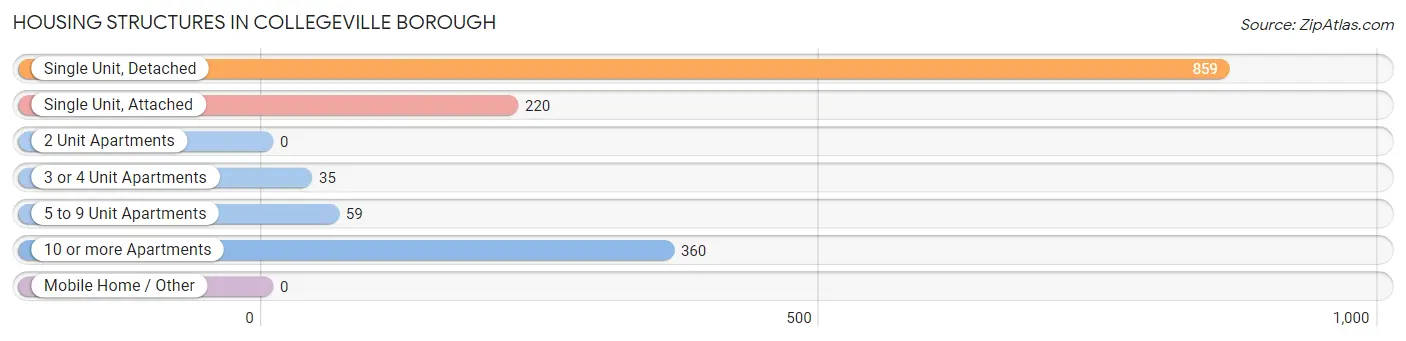
| Structure Type | # Housing Units | % Housing Units |
| Single Unit, Detached | 859 | 56.0% |
| Single Unit, Attached | 220 | 14.3% |
| 2 Unit Apartments | 0 | 0.0% |
| 3 or 4 Unit Apartments | 35 | 2.3% |
| 5 to 9 Unit Apartments | 59 | 3.8% |
| 10 or more Apartments | 360 | 23.5% |
| Mobile Home / Other | 0 | 0.0% |
| Total | 1,533 | 100.0% |
Housing Structures by Occupancy in Collegeville borough
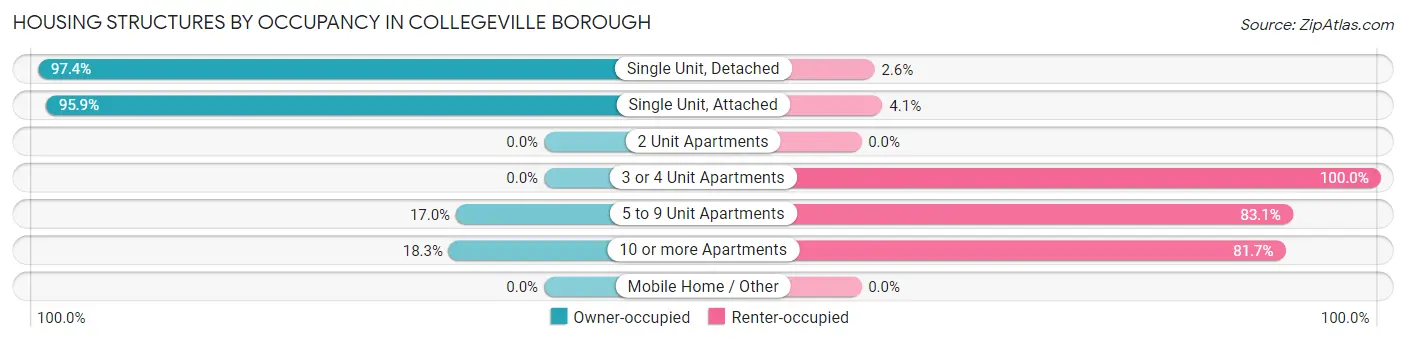
| Structure Type | Owner-occupied | Renter-occupied |
| Single Unit, Detached | 837 (97.4%) | 22 (2.6%) |
| Single Unit, Attached | 211 (95.9%) | 9 (4.1%) |
| 2 Unit Apartments | 0 (0.0%) | 0 (0.0%) |
| 3 or 4 Unit Apartments | 0 (0.0%) | 35 (100.0%) |
| 5 to 9 Unit Apartments | 10 (17.0%) | 49 (83.1%) |
| 10 or more Apartments | 66 (18.3%) | 294 (81.7%) |
| Mobile Home / Other | 0 (0.0%) | 0 (0.0%) |
| Total | 1,124 (73.3%) | 409 (26.7%) |
Housing Structures by Number of Rooms in Collegeville borough
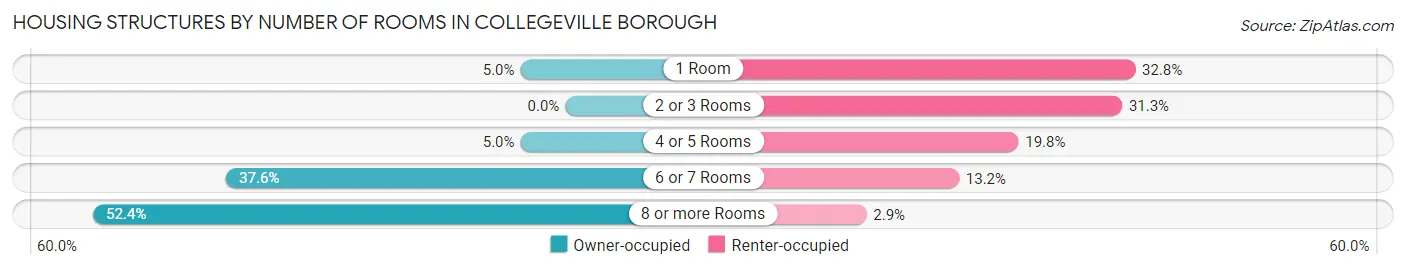
| Number of Rooms | Owner-occupied | Renter-occupied |
| 1 Room | 56 (5.0%) | 134 (32.8%) |
| 2 or 3 Rooms | 0 (0.0%) | 128 (31.3%) |
| 4 or 5 Rooms | 56 (5.0%) | 81 (19.8%) |
| 6 or 7 Rooms | 423 (37.6%) | 54 (13.2%) |
| 8 or more Rooms | 589 (52.4%) | 12 (2.9%) |
| Total | 1,124 (100.0%) | 409 (100.0%) |
Housing Structure by Heating Type in Collegeville borough
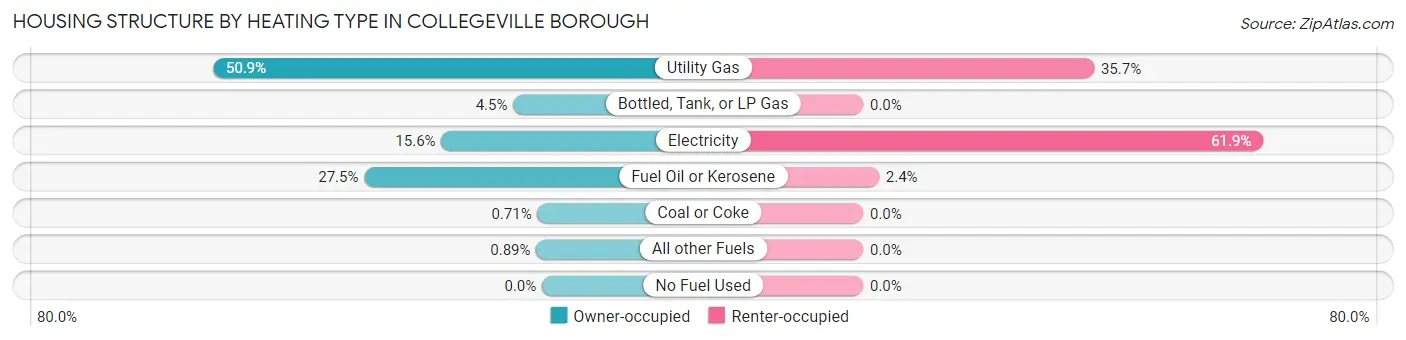
| Heating Type | Owner-occupied | Renter-occupied |
| Utility Gas | 572 (50.9%) | 146 (35.7%) |
| Bottled, Tank, or LP Gas | 50 (4.4%) | 0 (0.0%) |
| Electricity | 175 (15.6%) | 253 (61.9%) |
| Fuel Oil or Kerosene | 309 (27.5%) | 10 (2.4%) |
| Coal or Coke | 8 (0.7%) | 0 (0.0%) |
| All other Fuels | 10 (0.9%) | 0 (0.0%) |
| No Fuel Used | 0 (0.0%) | 0 (0.0%) |
| Total | 1,124 (100.0%) | 409 (100.0%) |
Household Vehicle Usage in Collegeville borough
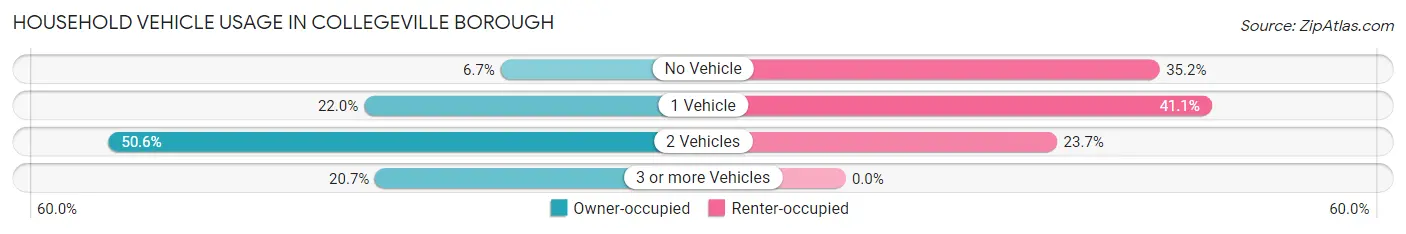
| Vehicles per Household | Owner-occupied | Renter-occupied |
| No Vehicle | 75 (6.7%) | 144 (35.2%) |
| 1 Vehicle | 247 (22.0%) | 168 (41.1%) |
| 2 Vehicles | 569 (50.6%) | 97 (23.7%) |
| 3 or more Vehicles | 233 (20.7%) | 0 (0.0%) |
| Total | 1,124 (100.0%) | 409 (100.0%) |
Real Estate & Mortgages in Collegeville borough
Real Estate and Mortgage Overview in Collegeville borough
| Characteristic | Without Mortgage | With Mortgage |
| Housing Units | 410 | 714 |
| Median Property Value | $298,300 | $432,200 |
| Median Household Income | - | - |
| Monthly Housing Costs | $907 | $222 |
| Real Estate Taxes | $4,989 | $0 |
Property Value by Mortgage Status in Collegeville borough
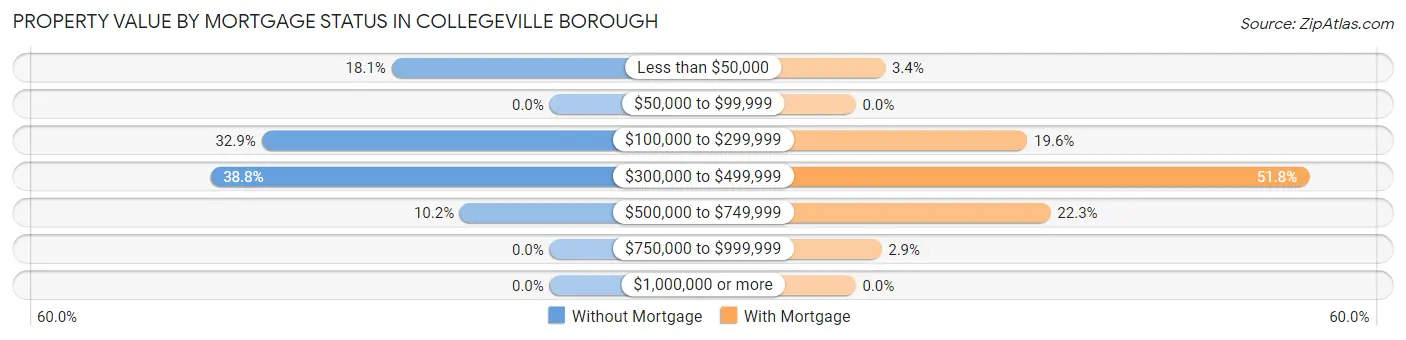
| Property Value | Without Mortgage | With Mortgage |
| Less than $50,000 | 74 (18.0%) | 24 (3.4%) |
| $50,000 to $99,999 | 0 (0.0%) | 0 (0.0%) |
| $100,000 to $299,999 | 135 (32.9%) | 140 (19.6%) |
| $300,000 to $499,999 | 159 (38.8%) | 370 (51.8%) |
| $500,000 to $749,999 | 42 (10.2%) | 159 (22.3%) |
| $750,000 to $999,999 | 0 (0.0%) | 21 (2.9%) |
| $1,000,000 or more | 0 (0.0%) | 0 (0.0%) |
| Total | 410 (100.0%) | 714 (100.0%) |
Household Income by Mortgage Status in Collegeville borough
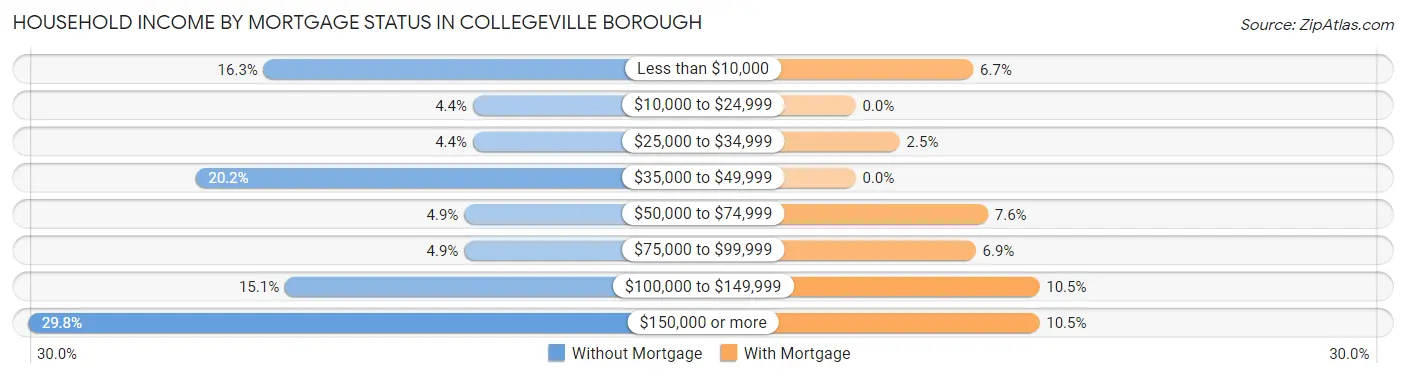
| Household Income | Without Mortgage | With Mortgage |
| Less than $10,000 | 67 (16.3%) | 48 (6.7%) |
| $10,000 to $24,999 | 18 (4.4%) | 0 (0.0%) |
| $25,000 to $34,999 | 18 (4.4%) | 18 (2.5%) |
| $35,000 to $49,999 | 83 (20.2%) | 0 (0.0%) |
| $50,000 to $74,999 | 20 (4.9%) | 54 (7.6%) |
| $75,000 to $99,999 | 20 (4.9%) | 49 (6.9%) |
| $100,000 to $149,999 | 62 (15.1%) | 75 (10.5%) |
| $150,000 or more | 122 (29.8%) | 75 (10.5%) |
| Total | 410 (100.0%) | 714 (100.0%) |
Property Value to Household Income Ratio in Collegeville borough
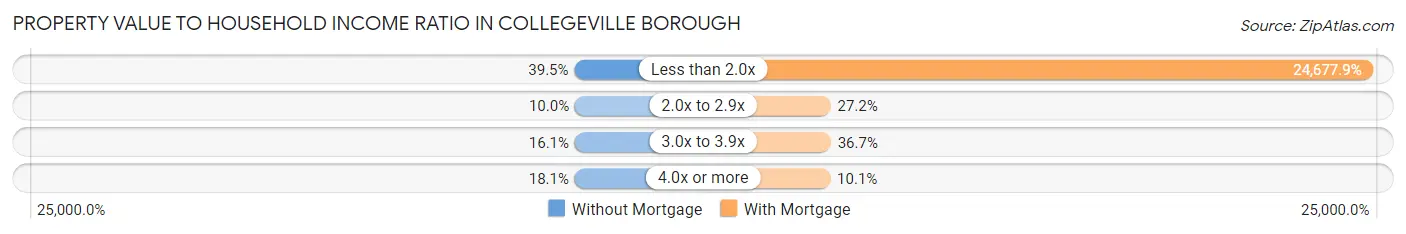
| Value-to-Income Ratio | Without Mortgage | With Mortgage |
| Less than 2.0x | 162 (39.5%) | 176,200 (24,677.9%) |
| 2.0x to 2.9x | 41 (10.0%) | 194 (27.2%) |
| 3.0x to 3.9x | 66 (16.1%) | 262 (36.7%) |
| 4.0x or more | 74 (18.0%) | 72 (10.1%) |
| Total | 410 (100.0%) | 714 (100.0%) |
Real Estate Taxes by Mortgage Status in Collegeville borough
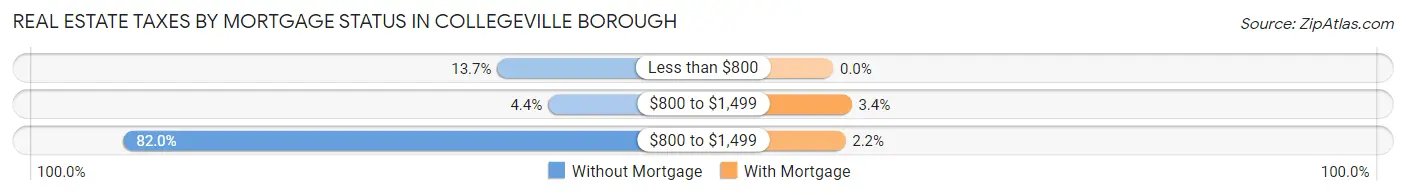
| Property Taxes | Without Mortgage | With Mortgage |
| Less than $800 | 56 (13.7%) | 0 (0.0%) |
| $800 to $1,499 | 18 (4.4%) | 24 (3.4%) |
| $800 to $1,499 | 336 (82.0%) | 16 (2.2%) |
| Total | 410 (100.0%) | 714 (100.0%) |
Health & Disability in Collegeville borough
Health Insurance Coverage by Age in Collegeville borough
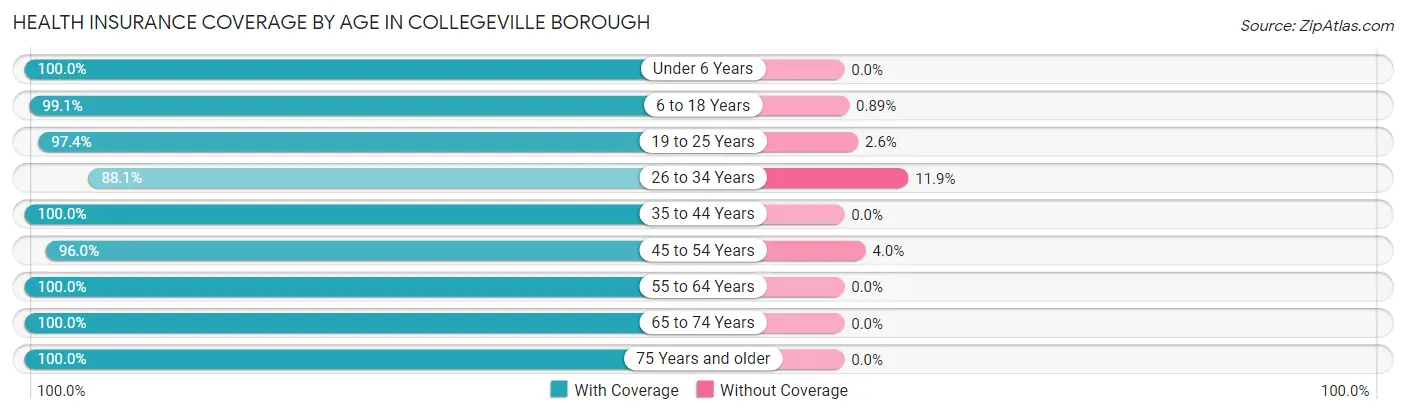
| Age Bracket | With Coverage | Without Coverage |
| Under 6 Years | 213 (100.0%) | 0 (0.0%) |
| 6 to 18 Years | 1,007 (99.1%) | 9 (0.9%) |
| 19 to 25 Years | 1,440 (97.4%) | 38 (2.6%) |
| 26 to 34 Years | 288 (88.1%) | 39 (11.9%) |
| 35 to 44 Years | 449 (100.0%) | 0 (0.0%) |
| 45 to 54 Years | 388 (96.0%) | 16 (4.0%) |
| 55 to 64 Years | 656 (100.0%) | 0 (0.0%) |
| 65 to 74 Years | 225 (100.0%) | 0 (0.0%) |
| 75 Years and older | 398 (100.0%) | 0 (0.0%) |
| Total | 5,064 (98.0%) | 102 (2.0%) |
Health Insurance Coverage by Citizenship Status in Collegeville borough
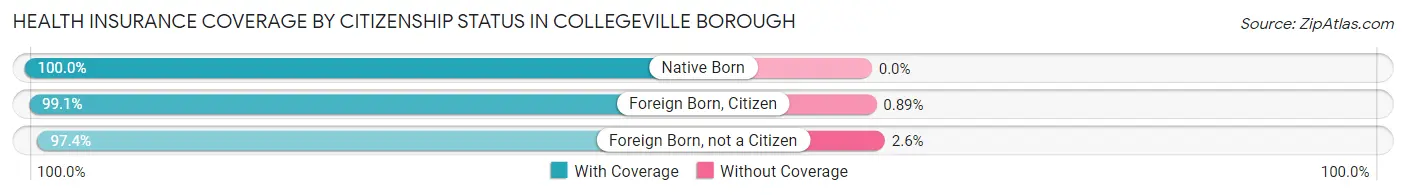
| Citizenship Status | With Coverage | Without Coverage |
| Native Born | 213 (100.0%) | 0 (0.0%) |
| Foreign Born, Citizen | 1,007 (99.1%) | 9 (0.9%) |
| Foreign Born, not a Citizen | 1,440 (97.4%) | 38 (2.6%) |
Health Insurance Coverage by Household Income in Collegeville borough
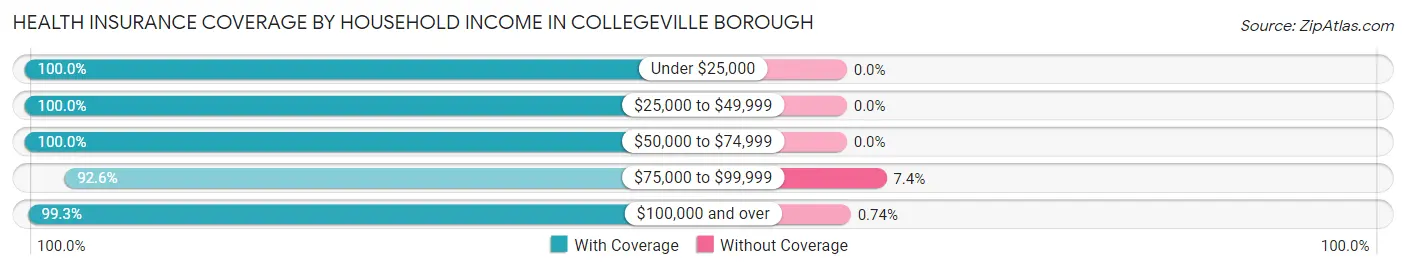
| Household Income | With Coverage | Without Coverage |
| Under $25,000 | 181 (100.0%) | 0 (0.0%) |
| $25,000 to $49,999 | 314 (100.0%) | 0 (0.0%) |
| $50,000 to $74,999 | 234 (100.0%) | 0 (0.0%) |
| $75,000 to $99,999 | 374 (92.6%) | 30 (7.4%) |
| $100,000 and over | 2,150 (99.3%) | 16 (0.7%) |
Public vs Private Health Insurance Coverage by Age in Collegeville borough
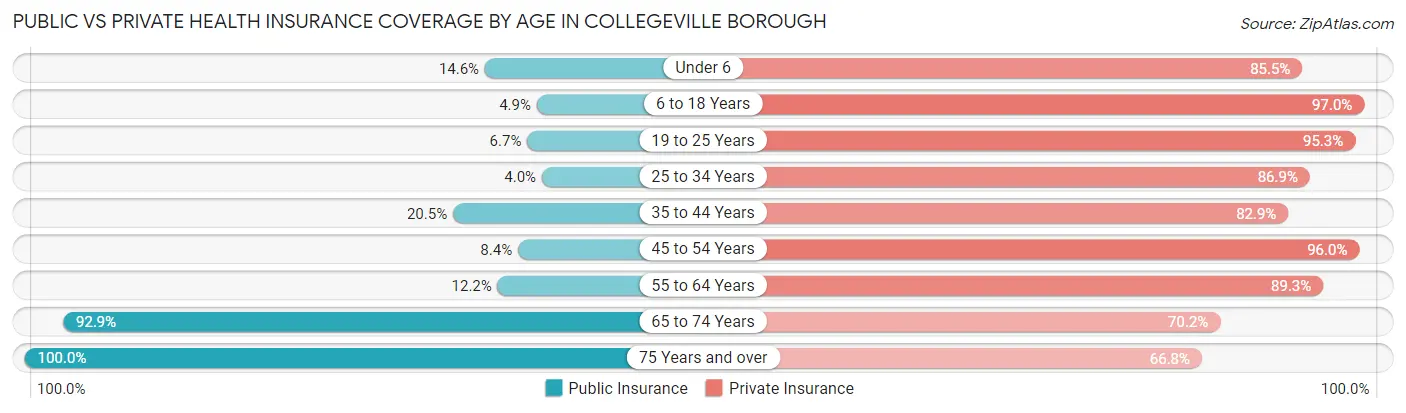
| Age Bracket | Public Insurance | Private Insurance |
| Under 6 | 31 (14.5%) | 182 (85.5%) |
| 6 to 18 Years | 50 (4.9%) | 985 (97.0%) |
| 19 to 25 Years | 99 (6.7%) | 1,408 (95.3%) |
| 25 to 34 Years | 13 (4.0%) | 284 (86.9%) |
| 35 to 44 Years | 92 (20.5%) | 372 (82.9%) |
| 45 to 54 Years | 34 (8.4%) | 388 (96.0%) |
| 55 to 64 Years | 80 (12.2%) | 586 (89.3%) |
| 65 to 74 Years | 209 (92.9%) | 158 (70.2%) |
| 75 Years and over | 398 (100.0%) | 266 (66.8%) |
| Total | 1,006 (19.5%) | 4,629 (89.6%) |
Disability Status by Sex by Age in Collegeville borough
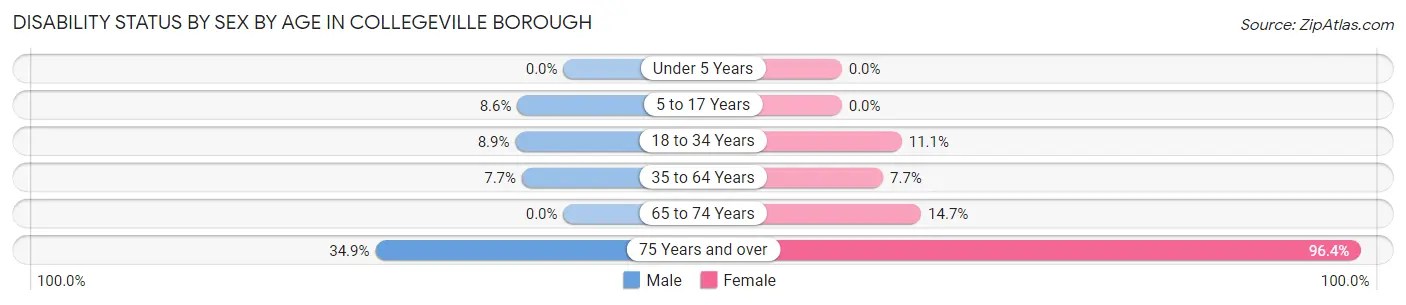
| Age Bracket | Male | Female |
| Under 5 Years | 0 (0.0%) | 0 (0.0%) |
| 5 to 17 Years | 23 (8.6%) | 0 (0.0%) |
| 18 to 34 Years | 75 (8.9%) | 168 (11.1%) |
| 35 to 64 Years | 59 (7.7%) | 57 (7.7%) |
| 65 to 74 Years | 0 (0.0%) | 19 (14.7%) |
| 75 Years and over | 52 (34.9%) | 240 (96.4%) |
Disability Class by Sex by Age in Collegeville borough
Disability Class: Hearing Difficulty
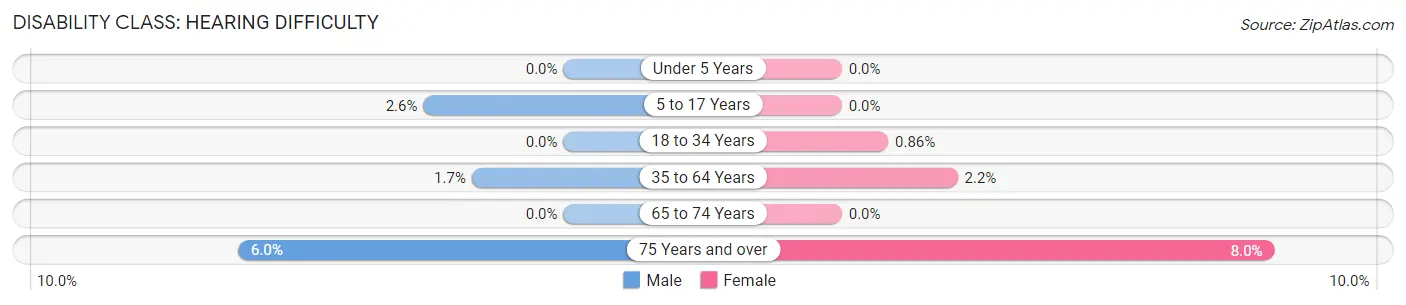
| Age Bracket | Male | Female |
| Under 5 Years | 0 (0.0%) | 0 (0.0%) |
| 5 to 17 Years | 7 (2.6%) | 0 (0.0%) |
| 18 to 34 Years | 0 (0.0%) | 13 (0.9%) |
| 35 to 64 Years | 13 (1.7%) | 16 (2.1%) |
| 65 to 74 Years | 0 (0.0%) | 0 (0.0%) |
| 75 Years and over | 9 (6.0%) | 20 (8.0%) |
Disability Class: Vision Difficulty
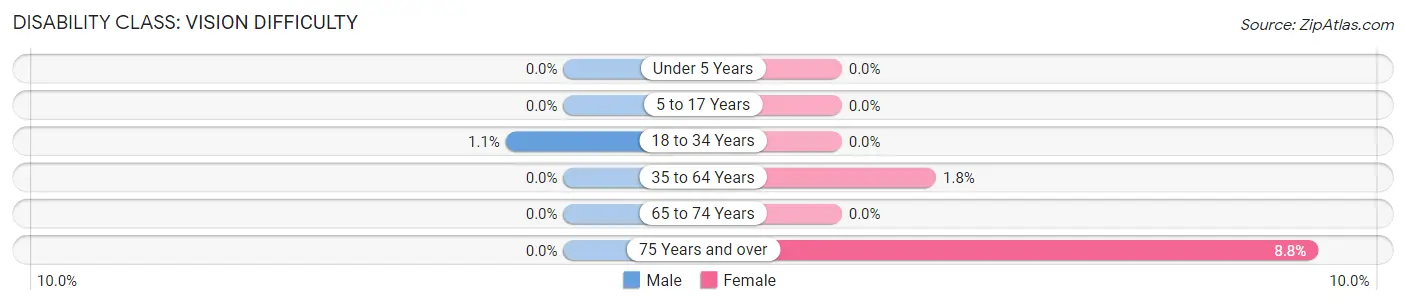
| Age Bracket | Male | Female |
| Under 5 Years | 0 (0.0%) | 0 (0.0%) |
| 5 to 17 Years | 0 (0.0%) | 0 (0.0%) |
| 18 to 34 Years | 9 (1.1%) | 0 (0.0%) |
| 35 to 64 Years | 0 (0.0%) | 13 (1.8%) |
| 65 to 74 Years | 0 (0.0%) | 0 (0.0%) |
| 75 Years and over | 0 (0.0%) | 22 (8.8%) |
Disability Class: Cognitive Difficulty
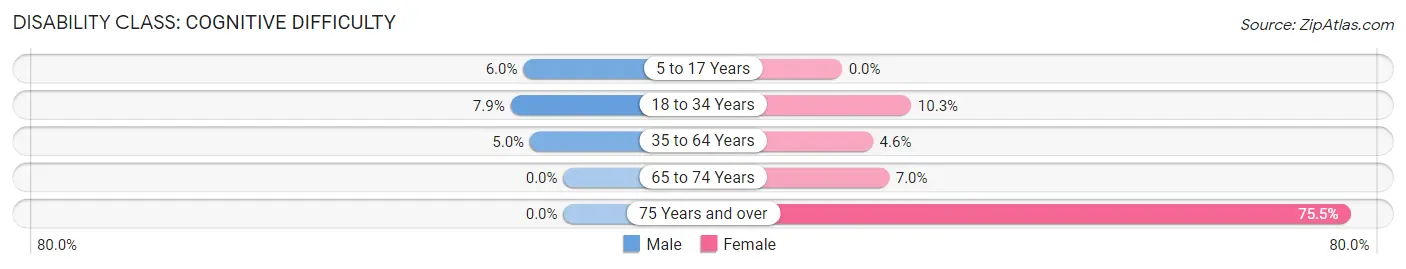
| Age Bracket | Male | Female |
| 5 to 17 Years | 16 (5.9%) | 0 (0.0%) |
| 18 to 34 Years | 66 (7.9%) | 155 (10.3%) |
| 35 to 64 Years | 38 (5.0%) | 34 (4.6%) |
| 65 to 74 Years | 0 (0.0%) | 9 (7.0%) |
| 75 Years and over | 0 (0.0%) | 188 (75.5%) |
Disability Class: Ambulatory Difficulty
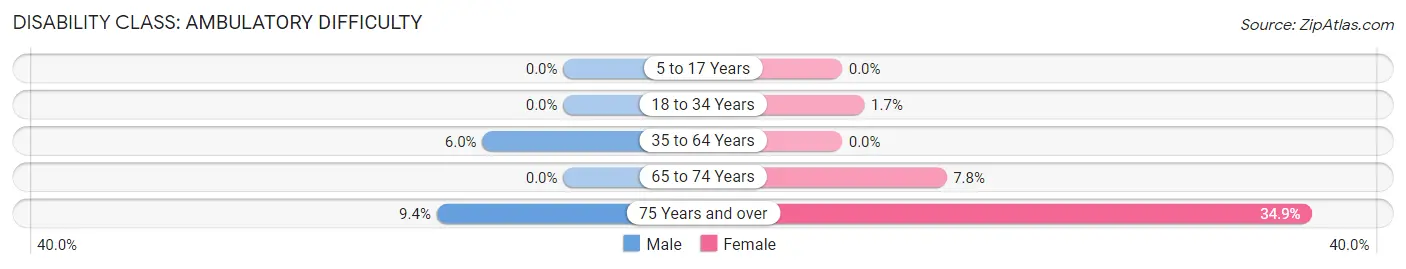
| Age Bracket | Male | Female |
| 5 to 17 Years | 0 (0.0%) | 0 (0.0%) |
| 18 to 34 Years | 0 (0.0%) | 25 (1.7%) |
| 35 to 64 Years | 46 (6.0%) | 0 (0.0%) |
| 65 to 74 Years | 0 (0.0%) | 10 (7.7%) |
| 75 Years and over | 14 (9.4%) | 87 (34.9%) |
Disability Class: Self-Care Difficulty
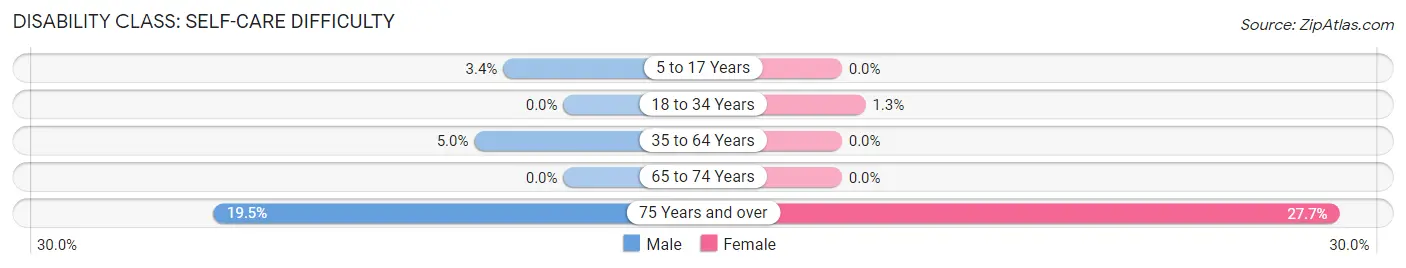
| Age Bracket | Male | Female |
| 5 to 17 Years | 9 (3.4%) | 0 (0.0%) |
| 18 to 34 Years | 0 (0.0%) | 20 (1.3%) |
| 35 to 64 Years | 38 (5.0%) | 0 (0.0%) |
| 65 to 74 Years | 0 (0.0%) | 0 (0.0%) |
| 75 Years and over | 29 (19.5%) | 69 (27.7%) |
Technology Access in Collegeville borough
Computing Device Access in Collegeville borough
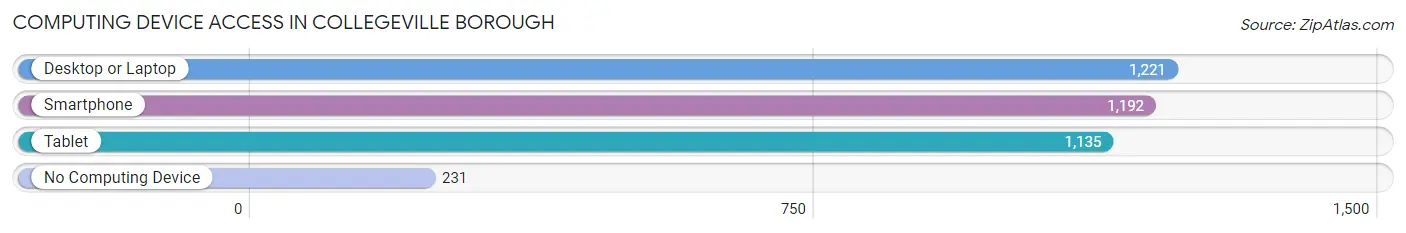
| Device Type | # Households | % Households |
| Desktop or Laptop | 1,221 | 79.6% |
| Smartphone | 1,192 | 77.8% |
| Tablet | 1,135 | 74.0% |
| No Computing Device | 231 | 15.1% |
| Total | 1,533 | 100.0% |
Internet Access in Collegeville borough
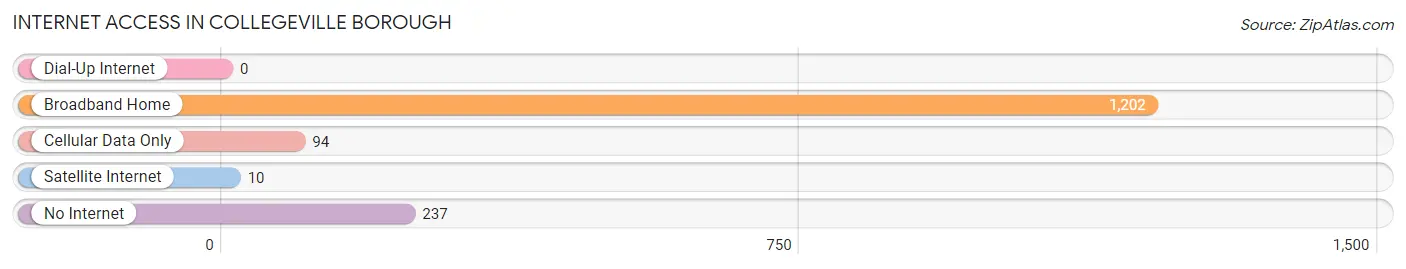
| Internet Type | # Households | % Households |
| Dial-Up Internet | 0 | 0.0% |
| Broadband Home | 1,202 | 78.4% |
| Cellular Data Only | 94 | 6.1% |
| Satellite Internet | 10 | 0.6% |
| No Internet | 237 | 15.5% |
| Total | 1,533 | 100.0% |
Collegeville borough Summary
Introduction
Collegeville Borough is a small borough located in Montgomery County, Pennsylvania. It is situated in the southeastern part of the county, approximately 25 miles northwest of Philadelphia. The borough is home to Ursinus College, a private liberal arts college, and is part of the Perkiomen Valley School District. Collegeville Borough has a population of 4,902 as of the 2010 census.
History
The area that is now Collegeville Borough was originally inhabited by the Lenni Lenape Native Americans. The first European settlers arrived in the area in the late 17th century. The area was originally known as Perkiomen Bridge, named after the Perkiomen Creek which runs through the area. The name was changed to Collegeville in 1838 when Ursinus College was founded.
The borough was officially incorporated in 1869. The first mayor of Collegeville was John F. Kriebel, who served from 1869 to 1871. The borough has since grown and developed, with the addition of several businesses and residential areas.
Geography
Collegeville Borough is located in southeastern Montgomery County, Pennsylvania. It is situated in the Perkiomen Valley, which is part of the Great Valley region of Pennsylvania. The borough is bordered by Upper Providence Township to the north, Trappe Borough to the east, Perkiomen Township to the south, and Skippack Township to the west.
The borough covers an area of 1.3 square miles, all of which is land. The Perkiomen Creek runs through the borough, and there are several small lakes and ponds in the area. The borough is located approximately 25 miles northwest of Philadelphia.
Economy
The economy of Collegeville Borough is largely based on education and healthcare. Ursinus College is the largest employer in the borough, with over 1,000 employees. Other major employers include the Collegeville Medical Center, the Collegeville Shopping Center, and the Collegeville Inn.
The borough also has a number of small businesses, including restaurants, retail stores, and professional services. The borough is home to several technology companies, including the software company SAP America, which is headquartered in Collegeville.
Demographics
As of the 2010 census, the population of Collegeville Borough was 4,902. The racial makeup of the borough was 87.3% White, 5.2% African American, 0.3% Native American, 4.2% Asian, 0.1% Pacific Islander, and 2.9% from other races. Hispanic or Latino of any race were 4.2% of the population.
The median household income in Collegeville Borough was $76,944, and the median family income was $90,917. The per capita income was $35,945. About 4.2% of families and 5.7% of the population were below the poverty line.
Conclusion
Collegeville Borough is a small borough located in southeastern Montgomery County, Pennsylvania. It is home to Ursinus College and is part of the Perkiomen Valley School District. The borough has a population of 4,902 as of the 2010 census. The economy of Collegeville Borough is largely based on education and healthcare, with Ursinus College being the largest employer in the borough. The racial makeup of the borough is 87.3% White, 5.2% African American, 0.3% Native American, 4.2% Asian, 0.1% Pacific Islander, and 2.9% from other races. The median household income in Collegeville Borough was $76,944, and the median family income was $90,917.
Common Questions
What is Per Capita Income in Collegeville borough?
Per Capita income in Collegeville borough is $45,874.
What is the Median Family Income in Collegeville borough?
Median Family Income in Collegeville borough is $188,750.
What is the Median Household income in Collegeville borough?
Median Household Income in Collegeville borough is $99,271.
What is Income or Wage Gap in Collegeville borough?
Income or Wage Gap in Collegeville borough is 84.8%.
Women in Collegeville borough earn 15.2 cents for every dollar earned by a man.
What is Inequality or Gini Index in Collegeville borough?
Inequality or Gini Index in Collegeville borough is 0.47.
What is the Total Population of Collegeville borough?
Total Population of Collegeville borough is 5,172.
What is the Total Male Population of Collegeville borough?
Total Male Population of Collegeville borough is 2,192.
What is the Total Female Population of Collegeville borough?
Total Female Population of Collegeville borough is 2,980.
What is the Ratio of Males per 100 Females in Collegeville borough?
There are 73.56 Males per 100 Females in Collegeville borough.
What is the Ratio of Females per 100 Males in Collegeville borough?
There are 135.95 Females per 100 Males in Collegeville borough.
What is the Median Population Age in Collegeville borough?
Median Population Age in Collegeville borough is 24.4 Years.
What is the Average Family Size in Collegeville borough
Average Family Size in Collegeville borough is 3.1 People.
What is the Average Household Size in Collegeville borough
Average Household Size in Collegeville borough is 2.1 People.
How Large is the Labor Force in Collegeville borough?
There are 2,964 People in the Labor Forcein in Collegeville borough.
What is the Percentage of People in the Labor Force in Collegeville borough?
64.6% of People are in the Labor Force in Collegeville borough.
What is the Unemployment Rate in Collegeville borough?
Unemployment Rate in Collegeville borough is 7.2%.