Paint borough, PA Map & Demographics
Paint borough Overview
$26,154
PER CAPITA INCOME
$53,583
AVG FAMILY INCOME
$44,028
AVG HOUSEHOLD INCOME
12.8%
WAGE / INCOME GAP [ % ]
87.2¢/ $1
WAGE / INCOME GAP [ $ ]
0.37
INEQUALITY / GINI INDEX
1,122
TOTAL POPULATION
527
MALE POPULATION
595
FEMALE POPULATION
88.57
MALES / 100 FEMALES
112.90
FEMALES / 100 MALES
48.0
MEDIAN AGE
3.0
AVG FAMILY SIZE
2.5
AVG HOUSEHOLD SIZE
447
LABOR FORCE [ PEOPLE ]
49.6%
PERCENT IN LABOR FORCE
11.0%
UNEMPLOYMENT RATE
Income in Paint borough
Income Overview in Paint borough
Per Capita Income in Paint borough is $26,154, while median incomes of families and households are $53,583 and $44,028 respectively.
| Characteristic | Number | Measure |
| Per Capita Income | 1,122 | $26,154 |
| Median Family Income | 279 | $53,583 |
| Mean Family Income | 279 | $69,050 |
| Median Household Income | 409 | $44,028 |
| Mean Household Income | 409 | $61,179 |
| Income Deficit | 279 | $0 |
| Wage / Income Gap (%) | 1,122 | 12.76% |
| Wage / Income Gap ($) | 1,122 | 87.24¢ per $1 |
| Gini / Inequality Index | 1,122 | 0.37 |
Earnings by Sex in Paint borough
Average Earnings in Paint borough are $38,244, $39,722 for men and $34,653 for women, a difference of 12.8%.
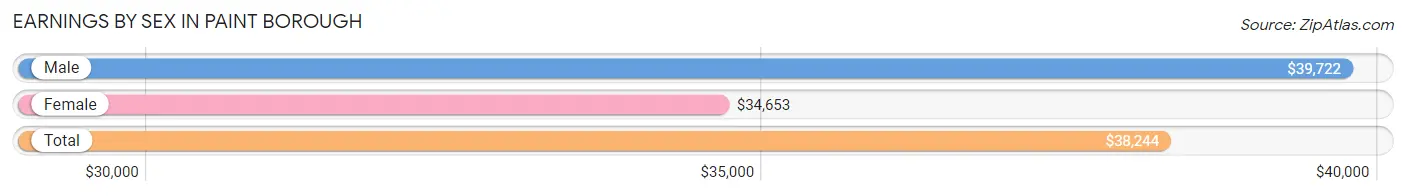
| Sex | Number | Average Earnings |
| Male | 278 (60.8%) | $39,722 |
| Female | 179 (39.2%) | $34,653 |
| Total | 457 (100.0%) | $38,244 |
Earnings by Sex by Income Bracket in Paint borough
The most common earnings brackets in Paint borough are $30,000 to $34,999 for men (44 | 15.8%) and $30,000 to $34,999 for women (26 | 14.5%).
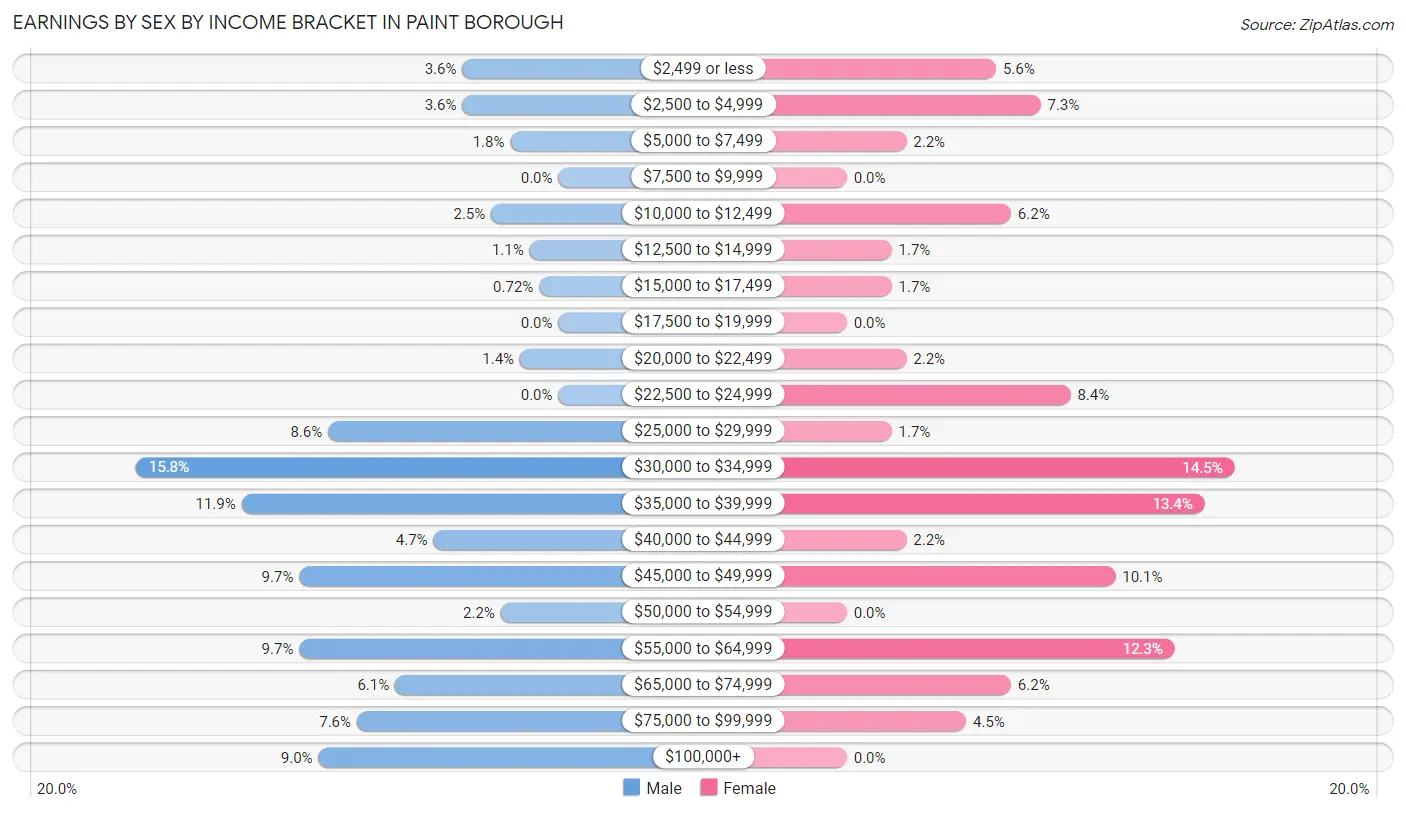
| Income | Male | Female |
| $2,499 or less | 10 (3.6%) | 10 (5.6%) |
| $2,500 to $4,999 | 10 (3.6%) | 13 (7.3%) |
| $5,000 to $7,499 | 5 (1.8%) | 4 (2.2%) |
| $7,500 to $9,999 | 0 (0.0%) | 0 (0.0%) |
| $10,000 to $12,499 | 7 (2.5%) | 11 (6.1%) |
| $12,500 to $14,999 | 3 (1.1%) | 3 (1.7%) |
| $15,000 to $17,499 | 2 (0.7%) | 3 (1.7%) |
| $17,500 to $19,999 | 0 (0.0%) | 0 (0.0%) |
| $20,000 to $22,499 | 4 (1.4%) | 4 (2.2%) |
| $22,500 to $24,999 | 0 (0.0%) | 15 (8.4%) |
| $25,000 to $29,999 | 24 (8.6%) | 3 (1.7%) |
| $30,000 to $34,999 | 44 (15.8%) | 26 (14.5%) |
| $35,000 to $39,999 | 33 (11.9%) | 24 (13.4%) |
| $40,000 to $44,999 | 13 (4.7%) | 4 (2.2%) |
| $45,000 to $49,999 | 27 (9.7%) | 18 (10.1%) |
| $50,000 to $54,999 | 6 (2.2%) | 0 (0.0%) |
| $55,000 to $64,999 | 27 (9.7%) | 22 (12.3%) |
| $65,000 to $74,999 | 17 (6.1%) | 11 (6.1%) |
| $75,000 to $99,999 | 21 (7.5%) | 8 (4.5%) |
| $100,000+ | 25 (9.0%) | 0 (0.0%) |
| Total | 278 (100.0%) | 179 (100.0%) |
Earnings by Sex by Educational Attainment in Paint borough
Average earnings in Paint borough are $45,833 for men and $36,528 for women, a difference of 20.3%. Men with an educational attainment of graduate degree enjoy the highest average annual earnings of $55,972, while those with college or associate's degree education earn the least with $33,594. Women with an educational attainment of bachelor's degree earn the most with the average annual earnings of $58,583, while those with graduate degree education have the smallest earnings of $2,499.
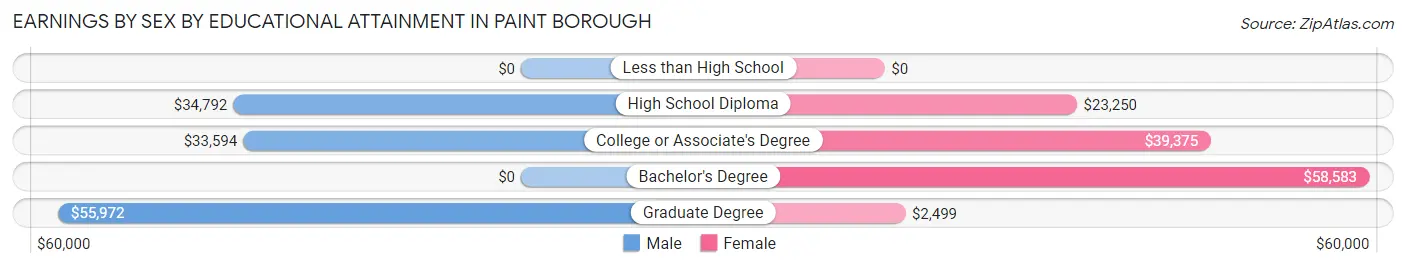
| Educational Attainment | Male Income | Female Income |
| Less than High School | - | - |
| High School Diploma | $34,792 | $23,250 |
| College or Associate's Degree | $33,594 | $39,375 |
| Bachelor's Degree | - | - |
| Graduate Degree | $55,972 | $2,499 |
| Total | $45,833 | $36,528 |
Family Income in Paint borough
Family Income Brackets in Paint borough
According to the Paint borough family income data, there are 72 families falling into the $25,000 to $34,999 income range, which is the most common income bracket and makes up 25.8% of all families.
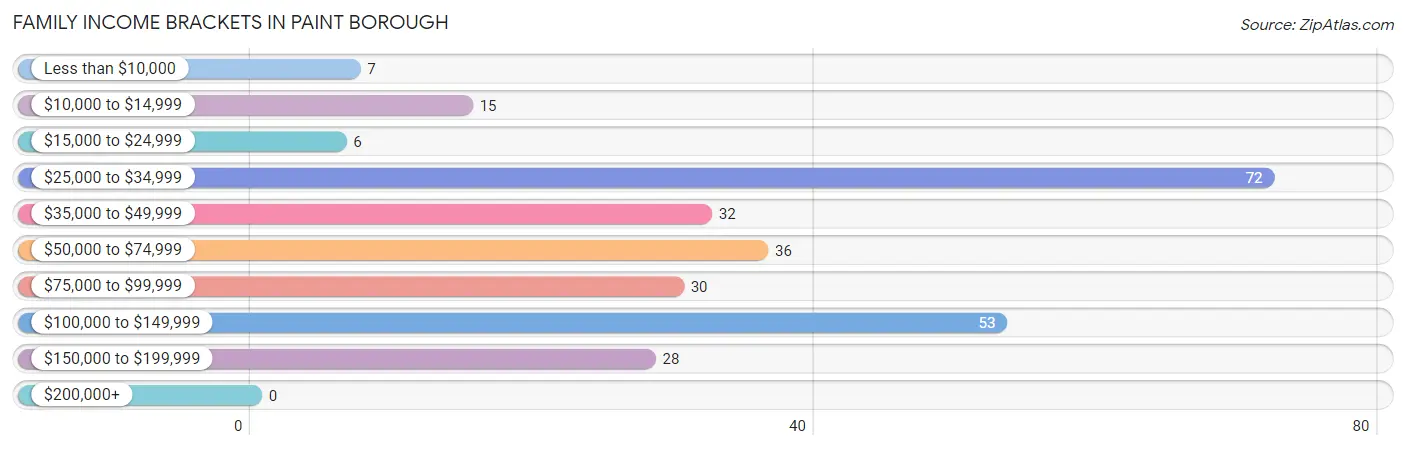
| Income Bracket | # Families | % Families |
| Less than $10,000 | 7 | 2.5% |
| $10,000 to $14,999 | 15 | 5.4% |
| $15,000 to $24,999 | 6 | 2.2% |
| $25,000 to $34,999 | 72 | 25.8% |
| $35,000 to $49,999 | 32 | 11.5% |
| $50,000 to $74,999 | 36 | 12.9% |
| $75,000 to $99,999 | 30 | 10.8% |
| $100,000 to $149,999 | 53 | 19.0% |
| $150,000 to $199,999 | 28 | 10.0% |
| $200,000+ | 0 | 0.0% |
Family Income by Famaliy Size in Paint borough
4-person families (44 | 15.8%) account for the highest median family income in Paint borough with $76,875 per family, while 2-person families (146 | 52.3%) have the highest median income of $27,084 per family member.
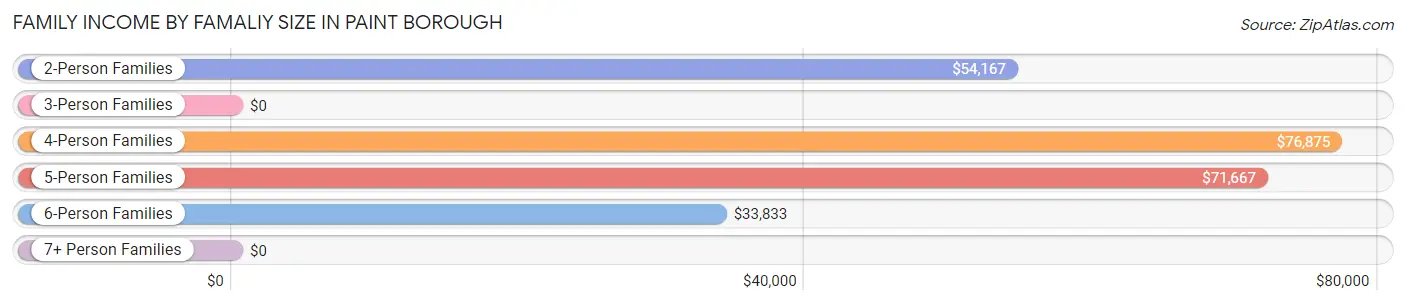
| Income Bracket | # Families | Median Income |
| 2-Person Families | 146 (52.3%) | $54,167 |
| 3-Person Families | 39 (14.0%) | $0 |
| 4-Person Families | 44 (15.8%) | $76,875 |
| 5-Person Families | 10 (3.6%) | $71,667 |
| 6-Person Families | 40 (14.3%) | $33,833 |
| 7+ Person Families | 0 (0.0%) | $0 |
| Total | 279 (100.0%) | $53,583 |
Family Income by Number of Earners in Paint borough
The median family income in Paint borough is $53,583, with families comprising 3+ earners (33) having the highest median family income of $129,063, while families with 1 earner (110) have the lowest median family income of $34,750, accounting for 11.8% and 39.4% of families, respectively.
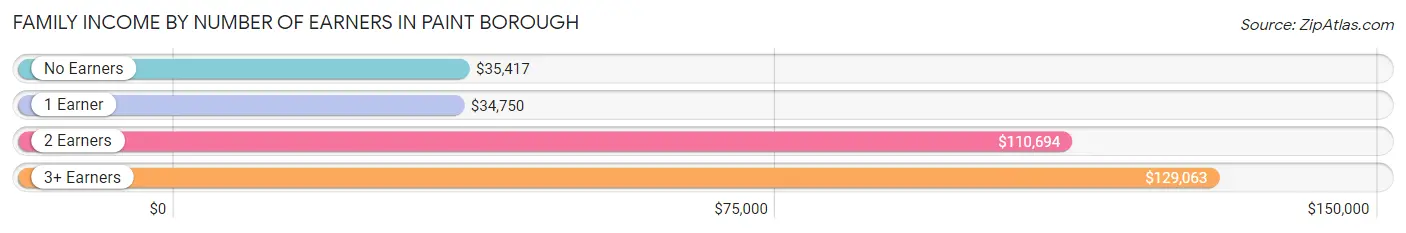
| Number of Earners | # Families | Median Income |
| No Earners | 80 (28.7%) | $35,417 |
| 1 Earner | 110 (39.4%) | $34,750 |
| 2 Earners | 56 (20.1%) | $110,694 |
| 3+ Earners | 33 (11.8%) | $129,063 |
| Total | 279 (100.0%) | $53,583 |
Household Income in Paint borough
Household Income Brackets in Paint borough
With 122 households falling in the category, the $25,000 to $34,999 income range is the most frequent in Paint borough, accounting for 29.8% of all households.
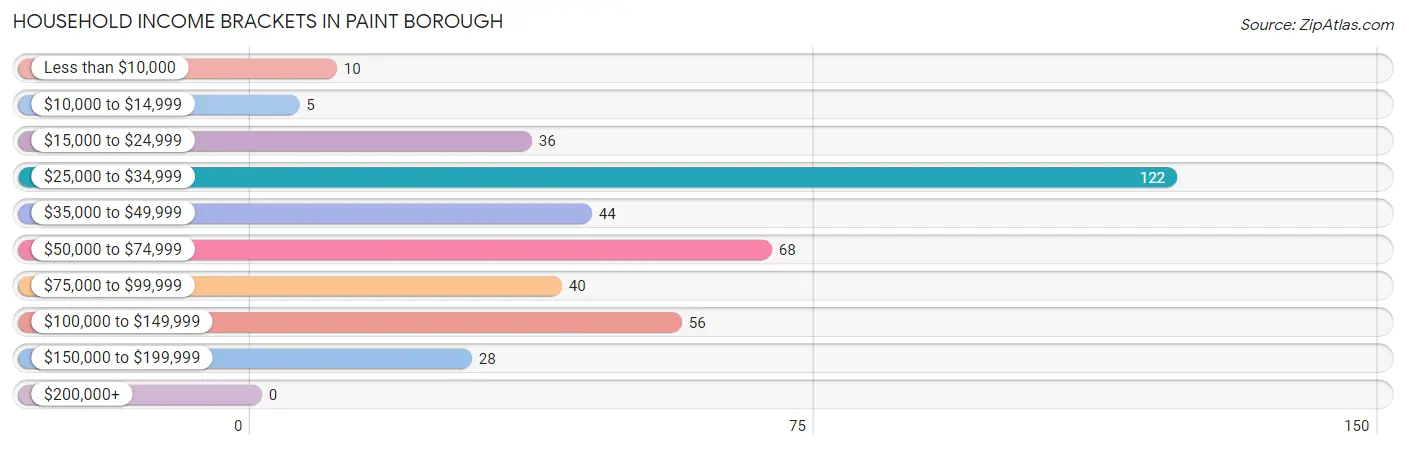
| Income Bracket | # Households | % Households |
| Less than $10,000 | 10 | 2.4% |
| $10,000 to $14,999 | 5 | 1.2% |
| $15,000 to $24,999 | 36 | 8.8% |
| $25,000 to $34,999 | 122 | 29.8% |
| $35,000 to $49,999 | 44 | 10.8% |
| $50,000 to $74,999 | 68 | 16.6% |
| $75,000 to $99,999 | 40 | 9.8% |
| $100,000 to $149,999 | 56 | 13.7% |
| $150,000 to $199,999 | 28 | 6.8% |
| $200,000+ | 0 | 0.0% |
Household Income by Householder Age in Paint borough
The median household income in Paint borough is $44,028, with the highest median household income of $65,417 found in the 25 to 44 years age bracket for the primary householder. A total of 133 households (32.5%) fall into this category. Meanwhile, the 15 to 24 years age bracket for the primary householder has the lowest median household income of $0, with 10 households (2.4%) in this group.
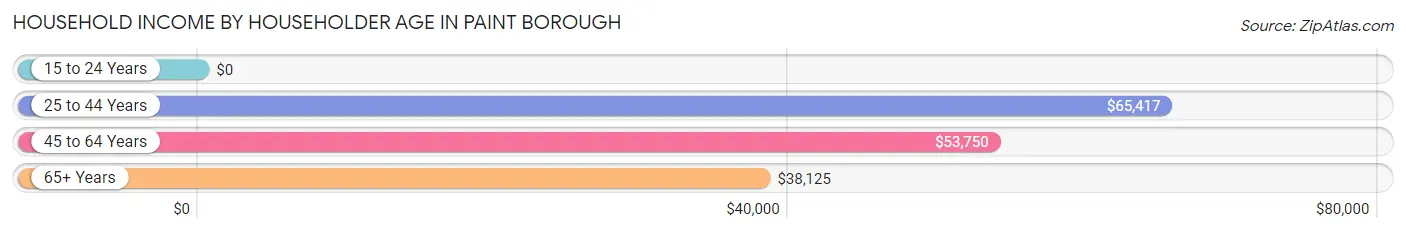
| Income Bracket | # Households | Median Income |
| 15 to 24 Years | 10 (2.4%) | $0 |
| 25 to 44 Years | 133 (32.5%) | $65,417 |
| 45 to 64 Years | 95 (23.2%) | $53,750 |
| 65+ Years | 171 (41.8%) | $38,125 |
| Total | 409 (100.0%) | $44,028 |
Poverty in Paint borough
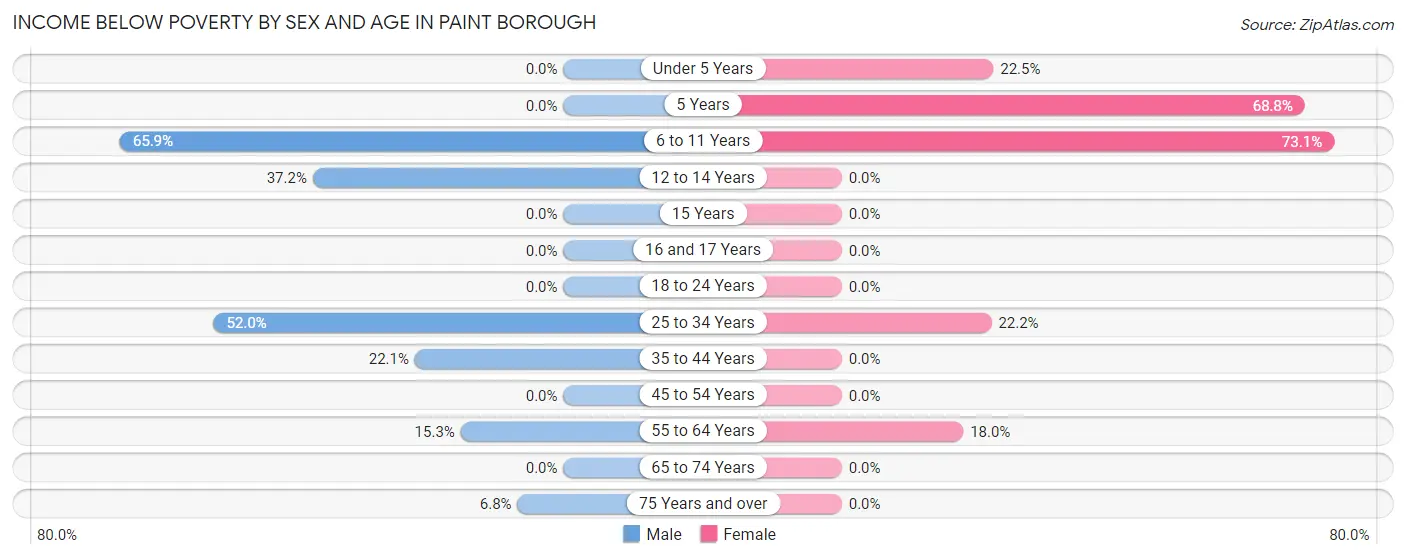
Income Below Poverty by Sex and Age in Paint borough
With 22.5% poverty level for males and 17.1% for females among the residents of Paint borough, 6 to 11 year old males and 6 to 11 year old females are the most vulnerable to poverty, with 27 males (65.8%) and 38 females (73.1%) in their respective age groups living below the poverty level.
| Age Bracket | Male | Female |
| Under 5 Years | 0 (0.0%) | 9 (22.5%) |
| 5 Years | 0 (0.0%) | 11 (68.8%) |
| 6 to 11 Years | 27 (65.8%) | 38 (73.1%) |
| 12 to 14 Years | 16 (37.2%) | 0 (0.0%) |
| 15 Years | 0 (0.0%) | 0 (0.0%) |
| 16 and 17 Years | 0 (0.0%) | 0 (0.0%) |
| 18 to 24 Years | 0 (0.0%) | 0 (0.0%) |
| 25 to 34 Years | 40 (51.9%) | 20 (22.2%) |
| 35 to 44 Years | 15 (22.1%) | 0 (0.0%) |
| 45 to 54 Years | 0 (0.0%) | 0 (0.0%) |
| 55 to 64 Years | 9 (15.2%) | 11 (18.0%) |
| 65 to 74 Years | 0 (0.0%) | 0 (0.0%) |
| 75 Years and over | 3 (6.8%) | 0 (0.0%) |
| Total | 110 (22.5%) | 89 (17.1%) |
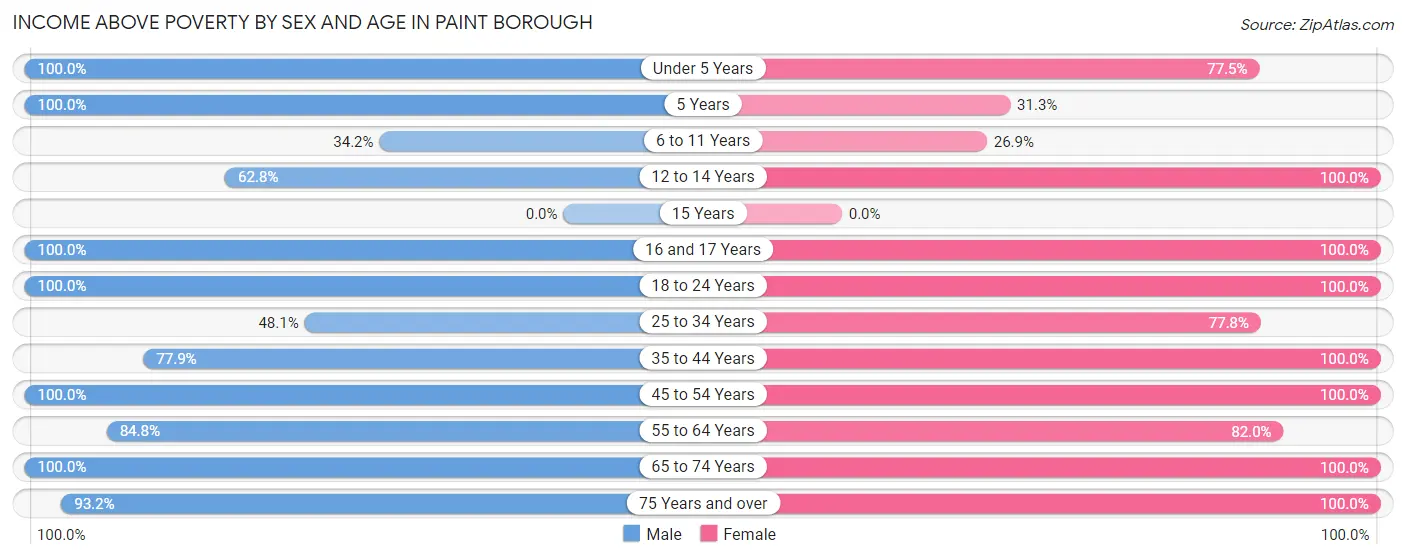
Income Above Poverty by Sex and Age in Paint borough
According to the poverty statistics in Paint borough, males aged under 5 years and females aged 12 to 14 years are the age groups that are most secure financially, with 100.0% of males and 100.0% of females in these age groups living above the poverty line.
| Age Bracket | Male | Female |
| Under 5 Years | 9 (100.0%) | 31 (77.5%) |
| 5 Years | 5 (100.0%) | 5 (31.2%) |
| 6 to 11 Years | 14 (34.2%) | 14 (26.9%) |
| 12 to 14 Years | 27 (62.8%) | 14 (100.0%) |
| 15 Years | 0 (0.0%) | 0 (0.0%) |
| 16 and 17 Years | 10 (100.0%) | 3 (100.0%) |
| 18 to 24 Years | 36 (100.0%) | 26 (100.0%) |
| 25 to 34 Years | 37 (48.0%) | 70 (77.8%) |
| 35 to 44 Years | 53 (77.9%) | 19 (100.0%) |
| 45 to 54 Years | 48 (100.0%) | 36 (100.0%) |
| 55 to 64 Years | 50 (84.8%) | 50 (82.0%) |
| 65 to 74 Years | 48 (100.0%) | 44 (100.0%) |
| 75 Years and over | 41 (93.2%) | 120 (100.0%) |
| Total | 378 (77.5%) | 432 (82.9%) |
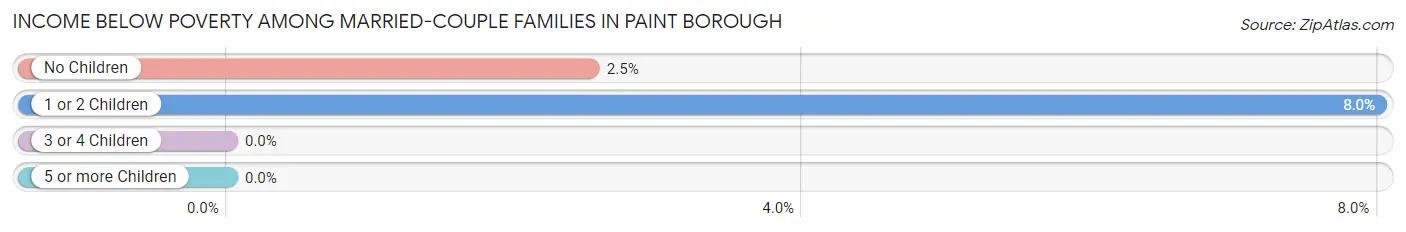
Income Below Poverty Among Married-Couple Families in Paint borough
The poverty statistics for married-couple families in Paint borough show that 4.0% or 7 of the total 176 families live below the poverty line. Families with 1 or 2 children have the highest poverty rate of 8.0%, comprising of 4 families. On the other hand, families with 3 or 4 children have the lowest poverty rate of 0.0%, which includes 0 families.
| Children | Above Poverty | Below Poverty |
| No Children | 116 (97.5%) | 3 (2.5%) |
| 1 or 2 Children | 46 (92.0%) | 4 (8.0%) |
| 3 or 4 Children | 7 (100.0%) | 0 (0.0%) |
| 5 or more Children | 0 (0.0%) | 0 (0.0%) |
| Total | 169 (96.0%) | 7 (4.0%) |
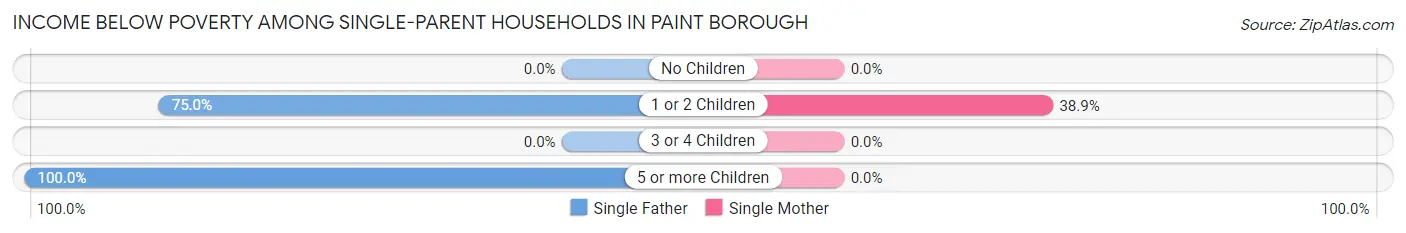
Income Below Poverty Among Single-Parent Households in Paint borough
According to the poverty data in Paint borough, 84.9% or 45 single-father households and 14.0% or 7 single-mother households are living below the poverty line. Among single-father households, those with 5 or more children have the highest poverty rate, with 30 households (100.0%) experiencing poverty. Likewise, among single-mother households, those with 1 or 2 children have the highest poverty rate, with 7 households (38.9%) falling below the poverty line.
| Children | Single Father | Single Mother |
| No Children | 0 (0.0%) | 0 (0.0%) |
| 1 or 2 Children | 15 (75.0%) | 7 (38.9%) |
| 3 or 4 Children | 0 (0.0%) | 0 (0.0%) |
| 5 or more Children | 30 (100.0%) | 0 (0.0%) |
| Total | 45 (84.9%) | 7 (14.0%) |
Income Below Poverty Among Married-Couple vs Single-Parent Households in Paint borough
The poverty data for Paint borough shows that 7 of the married-couple family households (4.0%) and 52 of the single-parent households (50.5%) are living below the poverty level. Within the married-couple family households, those with 1 or 2 children have the highest poverty rate, with 4 households (8.0%) falling below the poverty line. Among the single-parent households, those with 5 or more children have the highest poverty rate, with 30 household (100.0%) living below poverty.
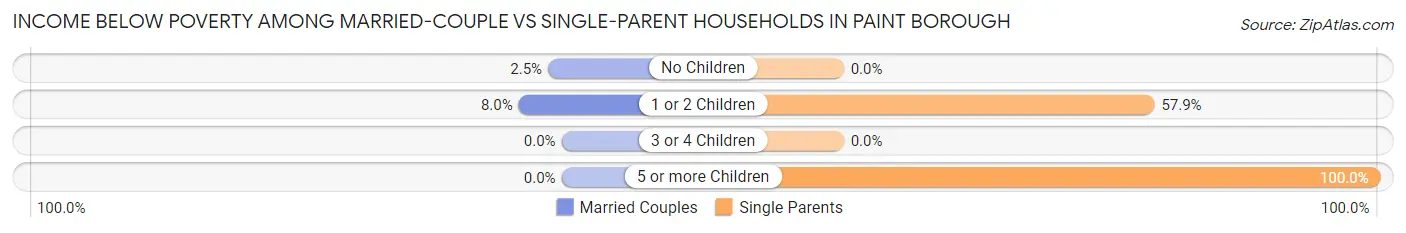
| Children | Married-Couple Families | Single-Parent Households |
| No Children | 3 (2.5%) | 0 (0.0%) |
| 1 or 2 Children | 4 (8.0%) | 22 (57.9%) |
| 3 or 4 Children | 0 (0.0%) | 0 (0.0%) |
| 5 or more Children | 0 (0.0%) | 30 (100.0%) |
| Total | 7 (4.0%) | 52 (50.5%) |
Race in Paint borough
The most populous races in Paint borough are White / Caucasian (1,076 | 95.9%), Hispanic or Latino (79 | 7.0%), and Two or more Races (41 | 3.6%).
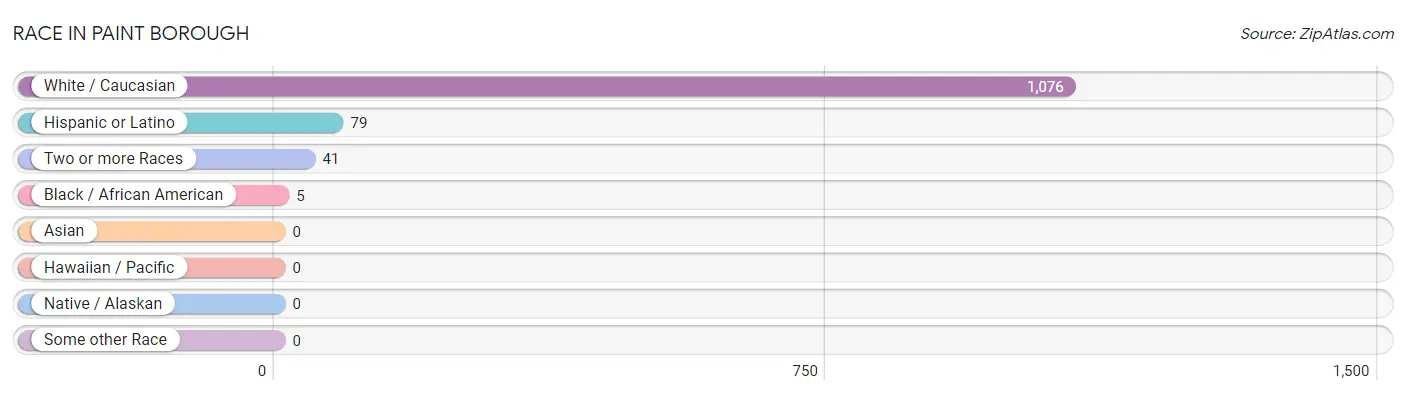
| Race | # Population | % Population |
| Asian | 0 | 0.0% |
| Black / African American | 5 | 0.4% |
| Hawaiian / Pacific | 0 | 0.0% |
| Hispanic or Latino | 79 | 7.0% |
| Native / Alaskan | 0 | 0.0% |
| White / Caucasian | 1,076 | 95.9% |
| Two or more Races | 41 | 3.6% |
| Some other Race | 0 | 0.0% |
| Total | 1,122 | 100.0% |
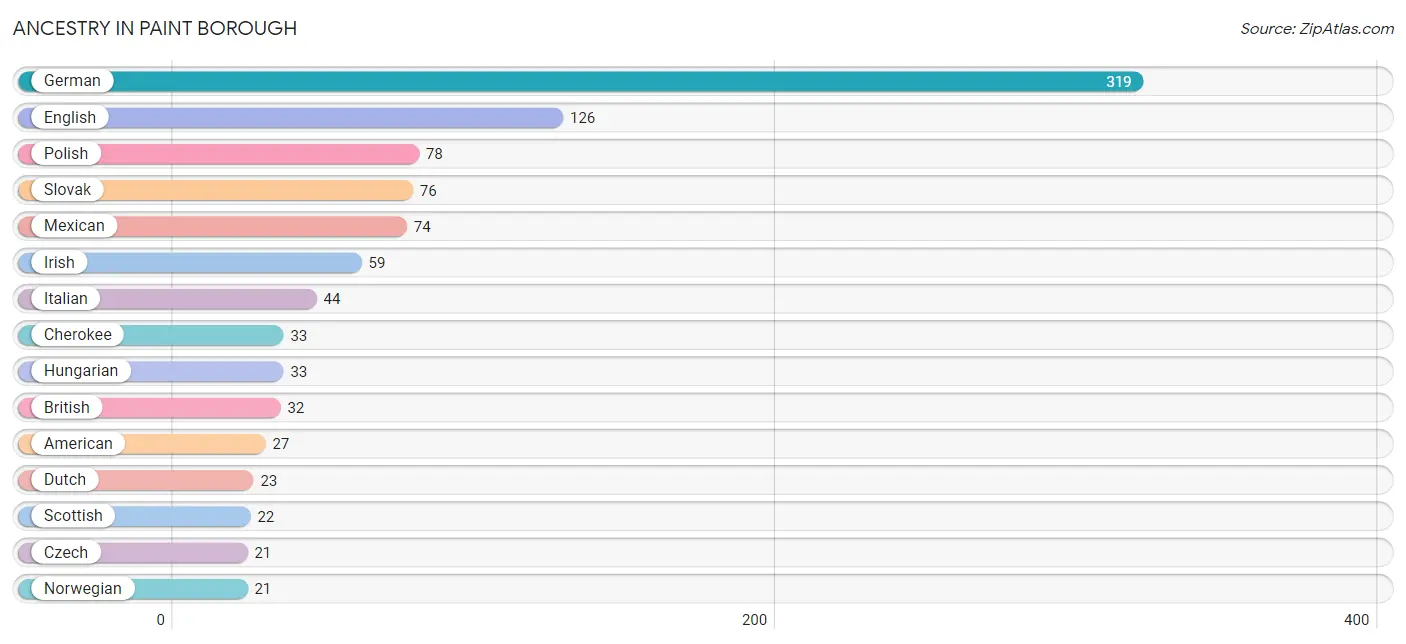
Ancestry in Paint borough
The most populous ancestries reported in Paint borough are German (319 | 28.4%), English (126 | 11.2%), Polish (78 | 7.0%), Slovak (76 | 6.8%), and Mexican (74 | 6.6%), together accounting for 60.0% of all Paint borough residents.
| Ancestry | # Population | % Population |
| American | 27 | 2.4% |
| Bhutanese | 7 | 0.6% |
| British | 32 | 2.9% |
| Carpatho Rusyn | 7 | 0.6% |
| Celtic | 13 | 1.2% |
| Cherokee | 33 | 2.9% |
| Czech | 21 | 1.9% |
| Dutch | 23 | 2.1% |
| English | 126 | 11.2% |
| European | 10 | 0.9% |
| French | 8 | 0.7% |
| German | 319 | 28.4% |
| Hungarian | 33 | 2.9% |
| Irish | 59 | 5.3% |
| Italian | 44 | 3.9% |
| Mexican | 74 | 6.6% |
| Norwegian | 21 | 1.9% |
| Pennsylvania German | 7 | 0.6% |
| Polish | 78 | 7.0% |
| Russian | 2 | 0.2% |
| Scotch-Irish | 16 | 1.4% |
| Scottish | 22 | 2.0% |
| Slavic | 7 | 0.6% |
| Slovak | 76 | 6.8% |
| Slovene | 5 | 0.4% |
| Swedish | 2 | 0.2% |
| Welsh | 19 | 1.7% | View All 27 Rows |
Immigrants in Paint borough

| Immigration Origin | # Population | % Population | View All 0 Rows |
Sex and Age in Paint borough
Sex and Age in Paint borough
The most populous age groups in Paint borough are 10 to 14 Years (46 | 8.7%) for men and 85 Years and over (91 | 15.3%) for women.
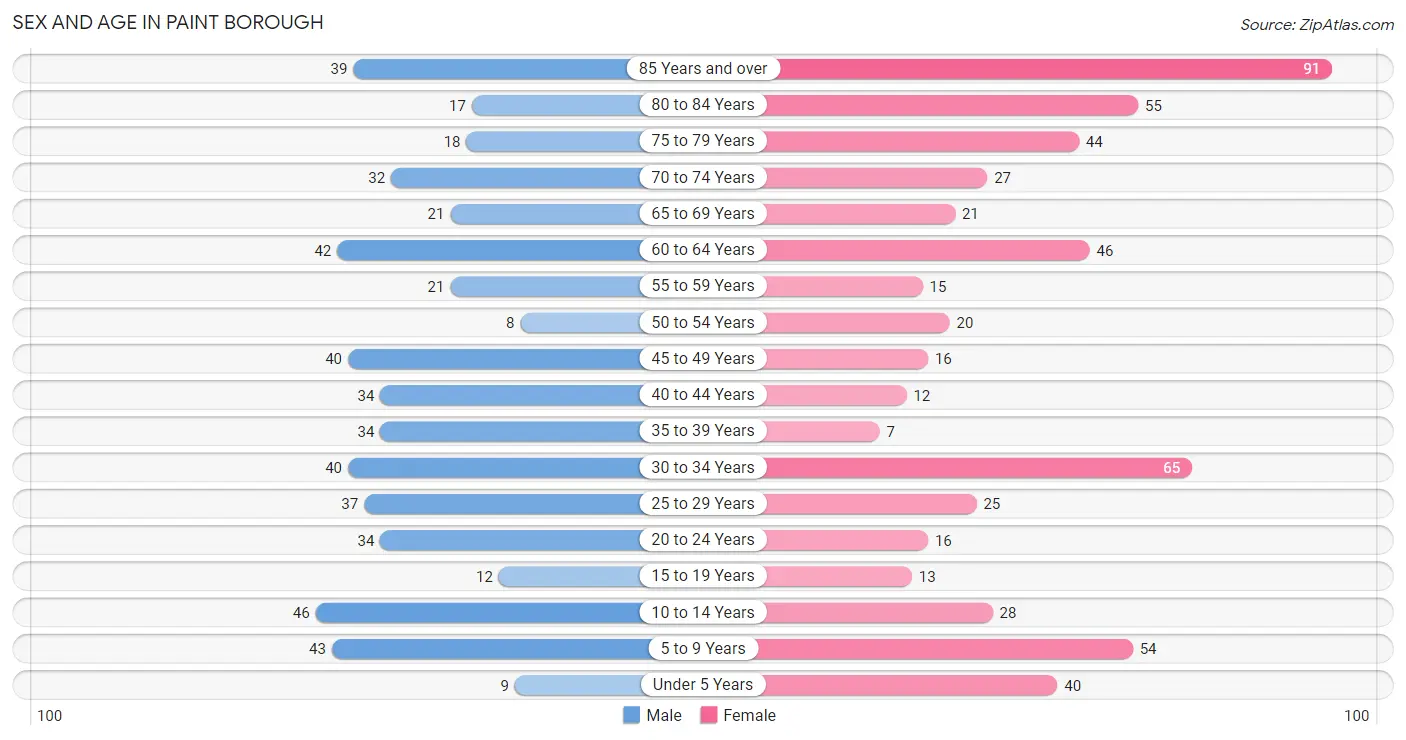
| Age Bracket | Male | Female |
| Under 5 Years | 9 (1.7%) | 40 (6.7%) |
| 5 to 9 Years | 43 (8.2%) | 54 (9.1%) |
| 10 to 14 Years | 46 (8.7%) | 28 (4.7%) |
| 15 to 19 Years | 12 (2.3%) | 13 (2.2%) |
| 20 to 24 Years | 34 (6.5%) | 16 (2.7%) |
| 25 to 29 Years | 37 (7.0%) | 25 (4.2%) |
| 30 to 34 Years | 40 (7.6%) | 65 (10.9%) |
| 35 to 39 Years | 34 (6.5%) | 7 (1.2%) |
| 40 to 44 Years | 34 (6.5%) | 12 (2.0%) |
| 45 to 49 Years | 40 (7.6%) | 16 (2.7%) |
| 50 to 54 Years | 8 (1.5%) | 20 (3.4%) |
| 55 to 59 Years | 21 (4.0%) | 15 (2.5%) |
| 60 to 64 Years | 42 (8.0%) | 46 (7.7%) |
| 65 to 69 Years | 21 (4.0%) | 21 (3.5%) |
| 70 to 74 Years | 32 (6.1%) | 27 (4.5%) |
| 75 to 79 Years | 18 (3.4%) | 44 (7.4%) |
| 80 to 84 Years | 17 (3.2%) | 55 (9.2%) |
| 85 Years and over | 39 (7.4%) | 91 (15.3%) |
| Total | 527 (100.0%) | 595 (100.0%) |
Families and Households in Paint borough
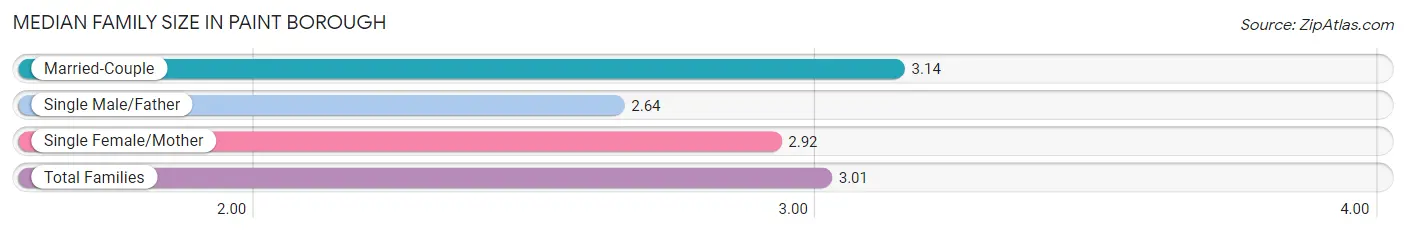
Median Family Size in Paint borough
The median family size in Paint borough is 3.01 persons per family, with married-couple families (176 | 63.1%) accounting for the largest median family size of 3.14 persons per family. On the other hand, single male/father families (53 | 19.0%) represent the smallest median family size with 2.64 persons per family.
| Family Type | # Families | Family Size |
| Married-Couple | 176 (63.1%) | 3.14 |
| Single Male/Father | 53 (19.0%) | 2.64 |
| Single Female/Mother | 50 (17.9%) | 2.92 |
| Total Families | 279 (100.0%) | 3.01 |
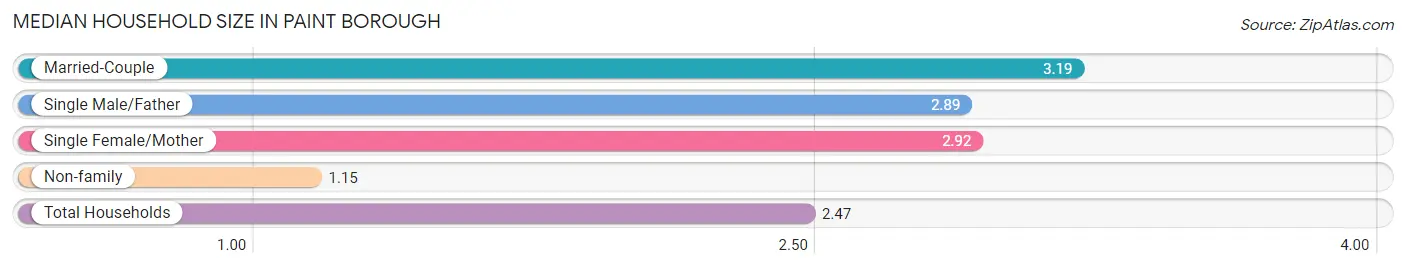
Median Household Size in Paint borough
The median household size in Paint borough is 2.47 persons per household, with married-couple households (176 | 43.0%) accounting for the largest median household size of 3.19 persons per household. non-family households (130 | 31.8%) represent the smallest median household size with 1.15 persons per household.
| Household Type | # Households | Household Size |
| Married-Couple | 176 (43.0%) | 3.19 |
| Single Male/Father | 53 (13.0%) | 2.89 |
| Single Female/Mother | 50 (12.2%) | 2.92 |
| Non-family | 130 (31.8%) | 1.15 |
| Total Households | 409 (100.0%) | 2.47 |
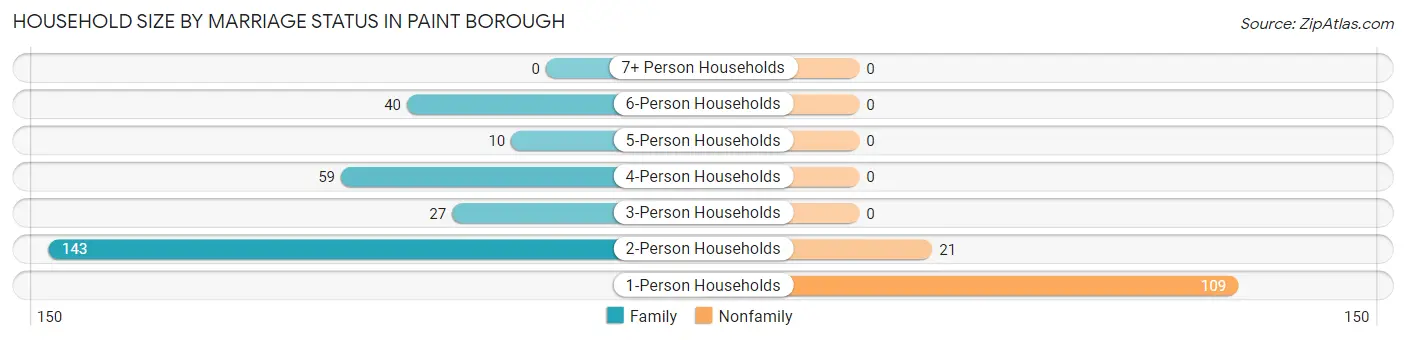
Household Size by Marriage Status in Paint borough
Out of a total of 409 households in Paint borough, 279 (68.2%) are family households, while 130 (31.8%) are nonfamily households. The most numerous type of family households are 2-person households, comprising 143, and the most common type of nonfamily households are 1-person households, comprising 109.
| Household Size | Family Households | Nonfamily Households |
| 1-Person Households | - | 109 (26.7%) |
| 2-Person Households | 143 (35.0%) | 21 (5.1%) |
| 3-Person Households | 27 (6.6%) | 0 (0.0%) |
| 4-Person Households | 59 (14.4%) | 0 (0.0%) |
| 5-Person Households | 10 (2.4%) | 0 (0.0%) |
| 6-Person Households | 40 (9.8%) | 0 (0.0%) |
| 7+ Person Households | 0 (0.0%) | 0 (0.0%) |
| Total | 279 (68.2%) | 130 (31.8%) |
Female Fertility in Paint borough
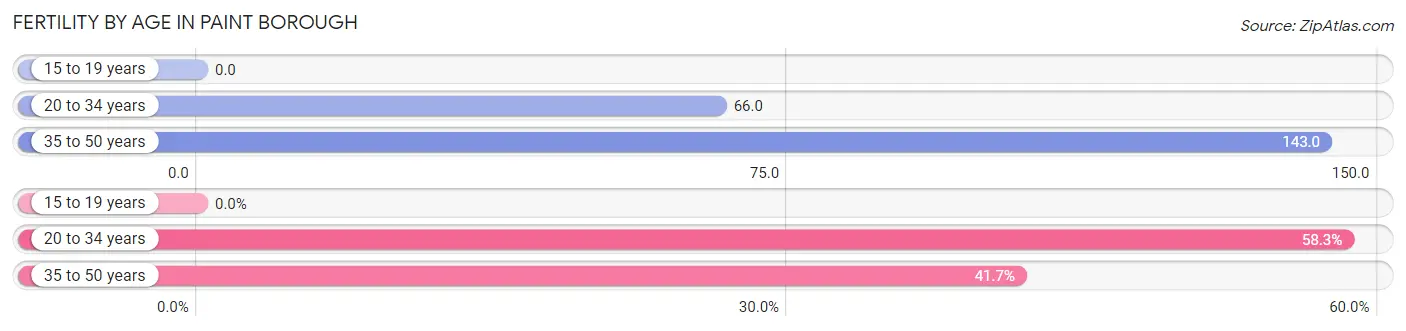
Fertility by Age in Paint borough
Average fertility rate in Paint borough is 78.0 births per 1,000 women. Women in the age bracket of 35 to 50 years have the highest fertility rate with 143.0 births per 1,000 women. Women in the age bracket of 20 to 34 years acount for 58.3% of all women with births.
| Age Bracket | Women with Births | Births / 1,000 Women |
| 15 to 19 years | 0 (0.0%) | 0.0 |
| 20 to 34 years | 7 (58.3%) | 66.0 |
| 35 to 50 years | 5 (41.7%) | 143.0 |
| Total | 12 (100.0%) | 78.0 |
Fertility by Age by Marriage Status in Paint borough
41.7% of women with births (12) in Paint borough are married. The highest percentage of unmarried women with births falls into 20 to 34 years age bracket with 100.0% of them unmarried at the time of birth, while the lowest percentage of unmarried women with births belong to 35 to 50 years age bracket with 0.0% of them unmarried.
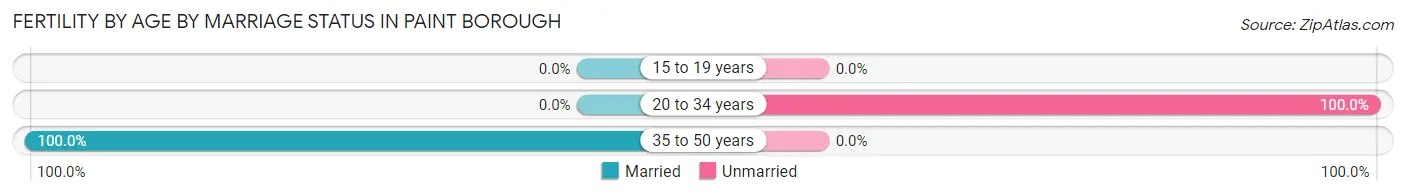
| Age Bracket | Married | Unmarried |
| 15 to 19 years | 0 (0.0%) | 0 (0.0%) |
| 20 to 34 years | 0 (0.0%) | 7 (100.0%) |
| 35 to 50 years | 5 (100.0%) | 0 (0.0%) |
| Total | 5 (41.7%) | 7 (58.3%) |
Fertility by Education in Paint borough
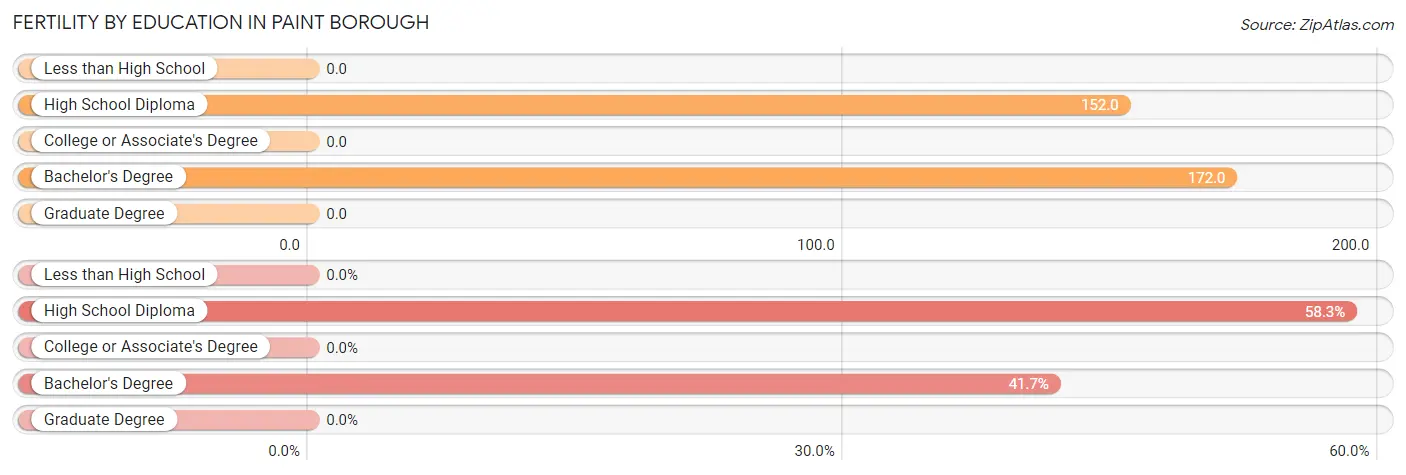
| Educational Attainment | Women with Births | Births / 1,000 Women |
| Less than High School | 0 (0.0%) | 0.0 |
| High School Diploma | 7 (58.3%) | 152.0 |
| College or Associate's Degree | 0 (0.0%) | 0.0 |
| Bachelor's Degree | 5 (41.7%) | 172.0 |
| Graduate Degree | 0 (0.0%) | 0.0 |
| Total | 12 (100.0%) | 78.0 |
Fertility by Education by Marriage Status in Paint borough
58.3% of women with births in Paint borough are unmarried. Women with the educational attainment of bachelor's degree are most likely to be married with 100.0% of them married at childbirth, while women with the educational attainment of high school diploma are least likely to be married with 100.0% of them unmarried at childbirth.
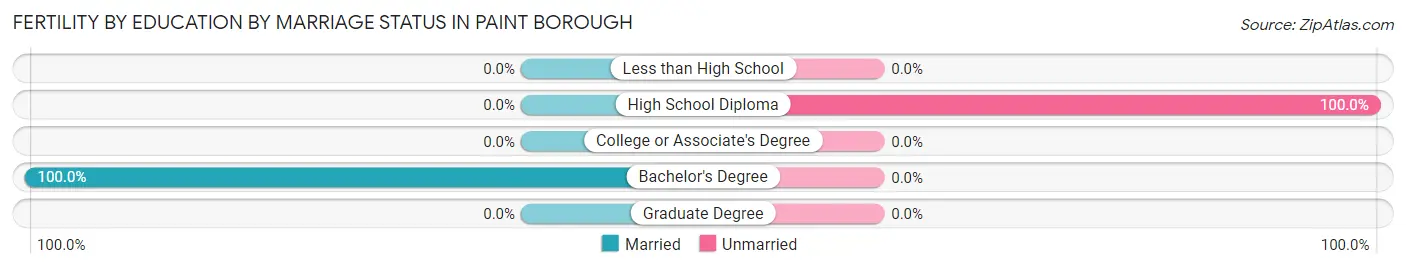
| Educational Attainment | Married | Unmarried |
| Less than High School | 0 (0.0%) | 0 (0.0%) |
| High School Diploma | 0 (0.0%) | 7 (100.0%) |
| College or Associate's Degree | 0 (0.0%) | 0 (0.0%) |
| Bachelor's Degree | 5 (100.0%) | 0 (0.0%) |
| Graduate Degree | 0 (0.0%) | 0 (0.0%) |
| Total | 5 (41.7%) | 7 (58.3%) |
Employment Characteristics in Paint borough
Employment by Class of Employer in Paint borough
Among the 398 employed individuals in Paint borough, private company employees (258 | 64.8%), not-for-profit organizations (49 | 12.3%), and self-employed (not incorporated) (37 | 9.3%) make up the most common classes of employment.
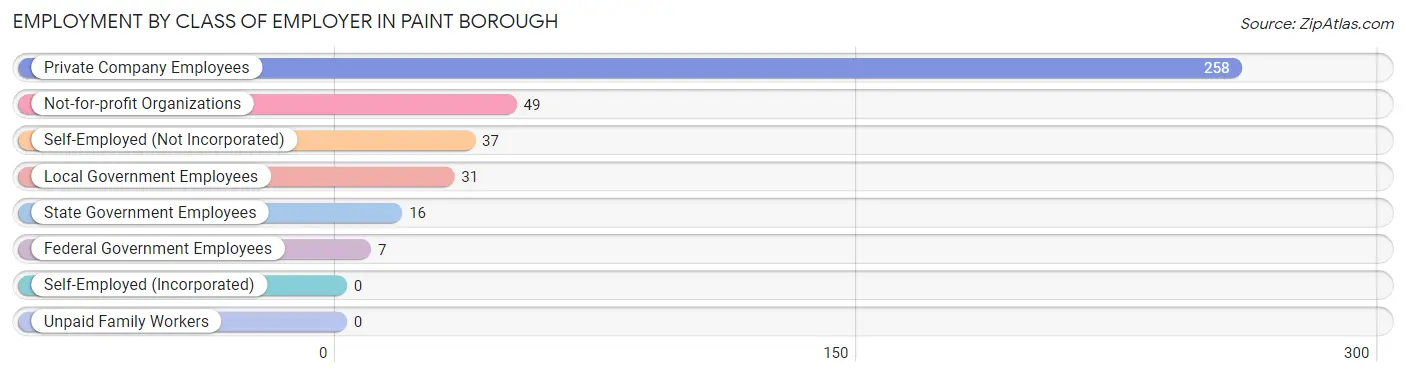
| Employer Class | # Employees | % Employees |
| Private Company Employees | 258 | 64.8% |
| Self-Employed (Incorporated) | 0 | 0.0% |
| Self-Employed (Not Incorporated) | 37 | 9.3% |
| Not-for-profit Organizations | 49 | 12.3% |
| Local Government Employees | 31 | 7.8% |
| State Government Employees | 16 | 4.0% |
| Federal Government Employees | 7 | 1.8% |
| Unpaid Family Workers | 0 | 0.0% |
| Total | 398 | 100.0% |
Employment Status by Age in Paint borough
According to the labor force statistics for Paint borough, out of the total population over 16 years of age (902), 49.6% or 447 individuals are in the labor force, with 11.0% or 49 of them unemployed. The age group with the highest labor force participation rate is 20 to 24 years, with 94.0% or 47 individuals in the labor force. Within the labor force, the 20 to 24 years age range has the highest percentage of unemployed individuals, with 51.1% or 24 of them being unemployed.
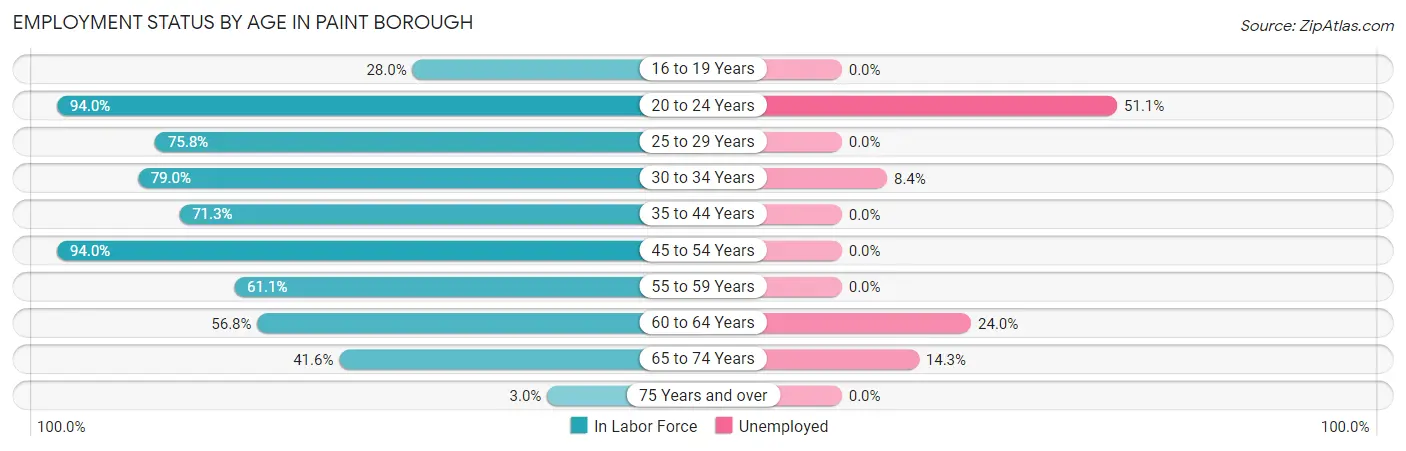
| Age Bracket | In Labor Force | Unemployed |
| 16 to 19 Years | 7 (28.0%) | 0 (0.0%) |
| 20 to 24 Years | 47 (94.0%) | 24 (51.1%) |
| 25 to 29 Years | 47 (75.8%) | 0 (0.0%) |
| 30 to 34 Years | 83 (79.0%) | 7 (8.4%) |
| 35 to 44 Years | 62 (71.3%) | 0 (0.0%) |
| 45 to 54 Years | 79 (94.0%) | 0 (0.0%) |
| 55 to 59 Years | 22 (61.1%) | 0 (0.0%) |
| 60 to 64 Years | 50 (56.8%) | 12 (24.0%) |
| 65 to 74 Years | 42 (41.6%) | 6 (14.3%) |
| 75 Years and over | 8 (3.0%) | 0 (0.0%) |
| Total | 447 (49.6%) | 49 (11.0%) |
Employment Status by Educational Attainment in Paint borough
According to labor force statistics for Paint borough, 74.2% of individuals (343) out of the total population between 25 and 64 years of age (462) are in the labor force, with 5.5% or 19 of them being unemployed. The group with the highest labor force participation rate are those with the educational attainment of bachelor's degree or higher, with 80.9% or 93 individuals in the labor force. Within the labor force, individuals with high school diploma education have the highest percentage of unemployment, with 8.0% or 13 of them being unemployed.
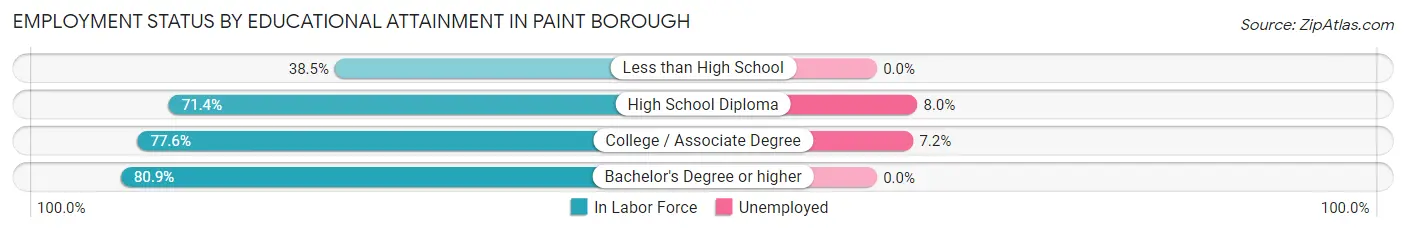
| Educational Attainment | In Labor Force | Unemployed |
| Less than High School | 5 (38.5%) | 0 (0.0%) |
| High School Diploma | 162 (71.4%) | 18 (8.0%) |
| College / Associate Degree | 83 (77.6%) | 8 (7.2%) |
| Bachelor's Degree or higher | 93 (80.9%) | 0 (0.0%) |
| Total | 343 (74.2%) | 25 (5.5%) |
Employment Occupations by Sex in Paint borough
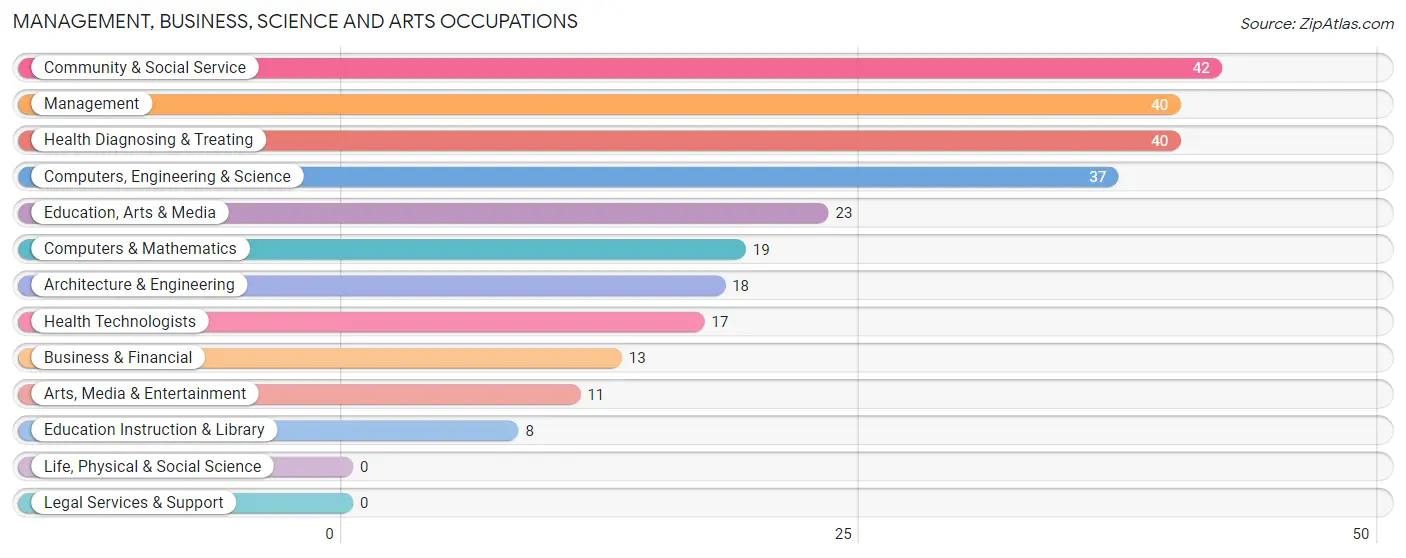
Management, Business, Science and Arts Occupations
The most common Management, Business, Science and Arts occupations in Paint borough are Community & Social Service (42 | 10.5%), Management (40 | 10.1%), Health Diagnosing & Treating (40 | 10.1%), Computers, Engineering & Science (37 | 9.3%), and Education, Arts & Media (23 | 5.8%).
Management, Business, Science and Arts Occupations by Sex
Within the Management, Business, Science and Arts occupations in Paint borough, the most male-oriented occupations are Computers, Engineering & Science (100.0%), Computers & Mathematics (100.0%), and Architecture & Engineering (100.0%), while the most female-oriented occupations are Education Instruction & Library (100.0%), Health Diagnosing & Treating (80.0%), and Health Technologists (76.5%).
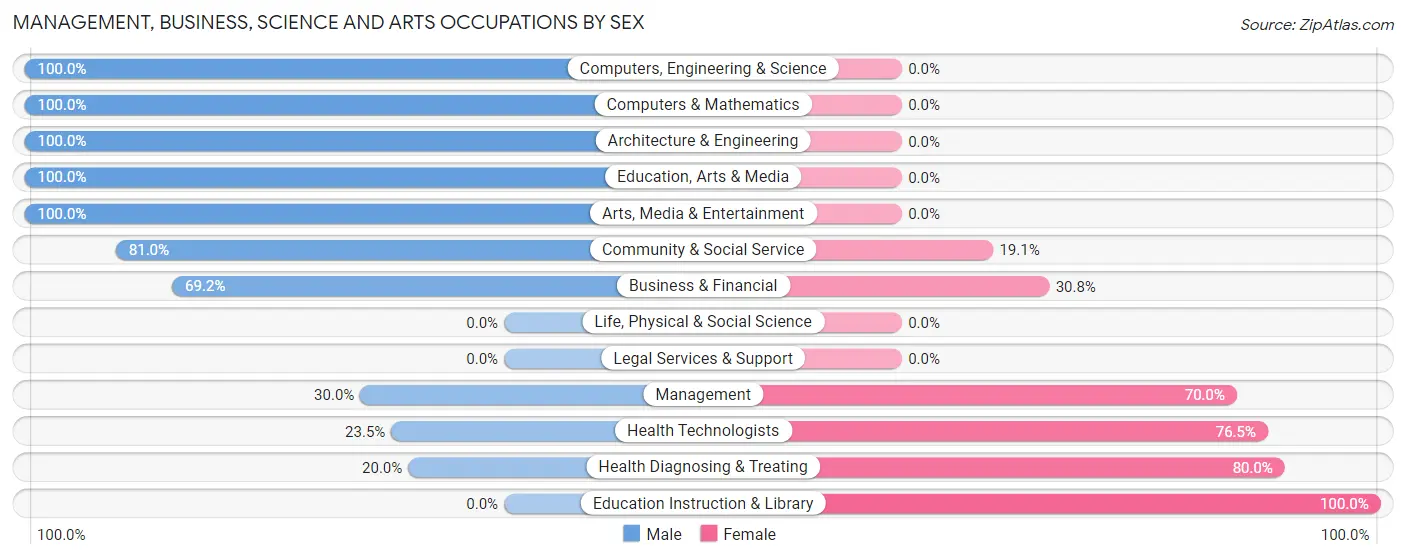
| Occupation | Male | Female |
| Management | 12 (30.0%) | 28 (70.0%) |
| Business & Financial | 9 (69.2%) | 4 (30.8%) |
| Computers, Engineering & Science | 37 (100.0%) | 0 (0.0%) |
| Computers & Mathematics | 19 (100.0%) | 0 (0.0%) |
| Architecture & Engineering | 18 (100.0%) | 0 (0.0%) |
| Life, Physical & Social Science | 0 (0.0%) | 0 (0.0%) |
| Community & Social Service | 34 (80.9%) | 8 (19.1%) |
| Education, Arts & Media | 23 (100.0%) | 0 (0.0%) |
| Legal Services & Support | 0 (0.0%) | 0 (0.0%) |
| Education Instruction & Library | 0 (0.0%) | 8 (100.0%) |
| Arts, Media & Entertainment | 11 (100.0%) | 0 (0.0%) |
| Health Diagnosing & Treating | 8 (20.0%) | 32 (80.0%) |
| Health Technologists | 4 (23.5%) | 13 (76.5%) |
| Total (Category) | 100 (58.1%) | 72 (41.9%) |
| Total (Overall) | 229 (57.5%) | 169 (42.5%) |
Services Occupations
The most common Services occupations in Paint borough are Healthcare Support (24 | 6.0%), Security & Protection (5 | 1.3%), Firefighting & Prevention (5 | 1.3%), Food Preparation & Serving (3 | 0.7%), and Cleaning & Maintenance (3 | 0.7%).
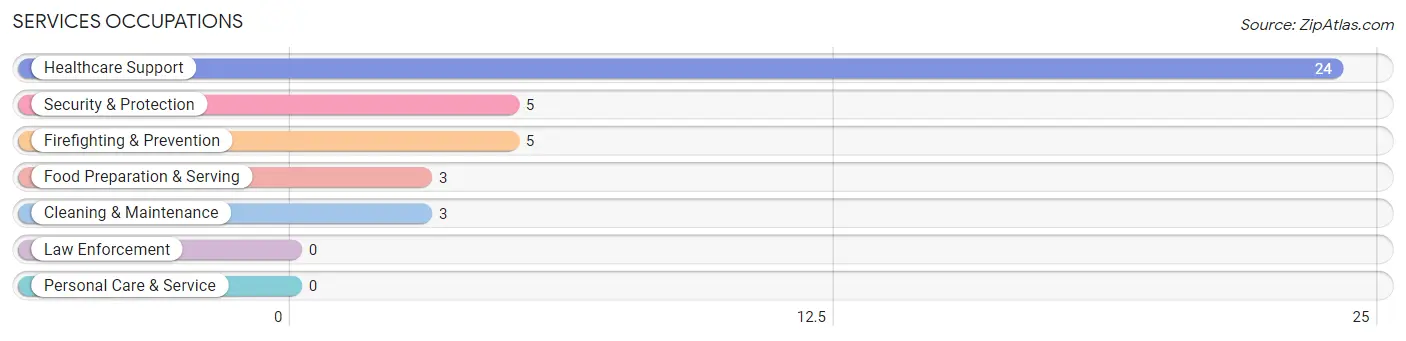
Services Occupations by Sex
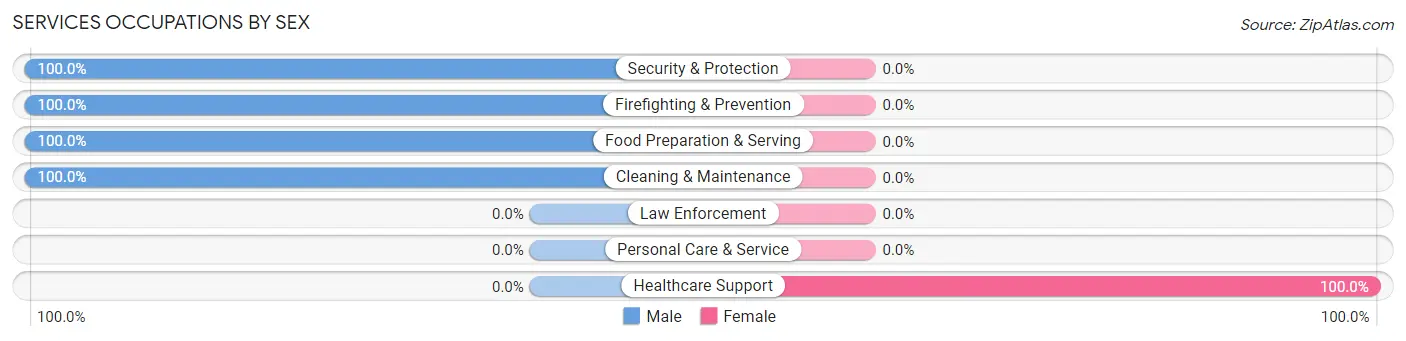
| Occupation | Male | Female |
| Healthcare Support | 0 (0.0%) | 24 (100.0%) |
| Security & Protection | 5 (100.0%) | 0 (0.0%) |
| Firefighting & Prevention | 5 (100.0%) | 0 (0.0%) |
| Law Enforcement | 0 (0.0%) | 0 (0.0%) |
| Food Preparation & Serving | 3 (100.0%) | 0 (0.0%) |
| Cleaning & Maintenance | 3 (100.0%) | 0 (0.0%) |
| Personal Care & Service | 0 (0.0%) | 0 (0.0%) |
| Total (Category) | 11 (31.4%) | 24 (68.6%) |
| Total (Overall) | 229 (57.5%) | 169 (42.5%) |
Sales and Office Occupations
The most common Sales and Office occupations in Paint borough are Sales & Related (34 | 8.5%), and Office & Administration (32 | 8.0%).
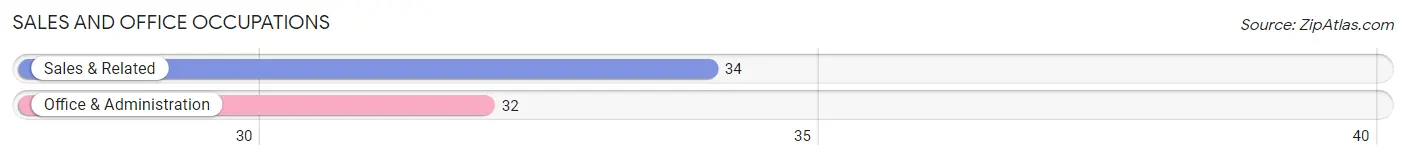
Sales and Office Occupations by Sex
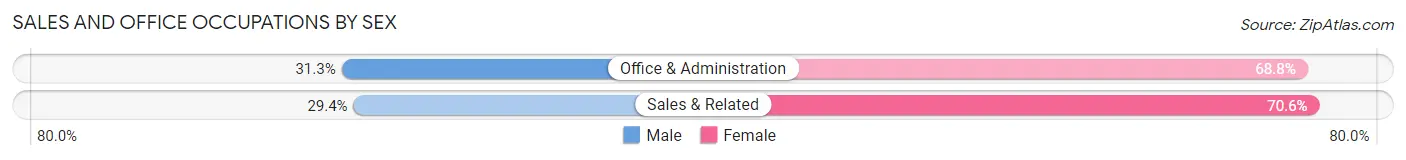
| Occupation | Male | Female |
| Sales & Related | 10 (29.4%) | 24 (70.6%) |
| Office & Administration | 10 (31.2%) | 22 (68.8%) |
| Total (Category) | 20 (30.3%) | 46 (69.7%) |
| Total (Overall) | 229 (57.5%) | 169 (42.5%) |
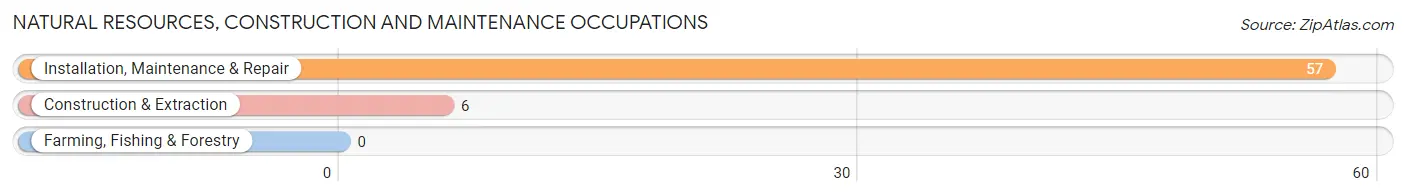
Natural Resources, Construction and Maintenance Occupations
The most common Natural Resources, Construction and Maintenance occupations in Paint borough are Installation, Maintenance & Repair (57 | 14.3%), and Construction & Extraction (6 | 1.5%).
Natural Resources, Construction and Maintenance Occupations by Sex
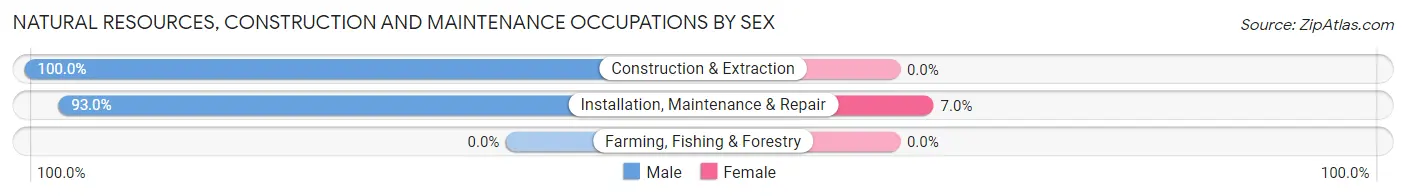
| Occupation | Male | Female |
| Farming, Fishing & Forestry | 0 (0.0%) | 0 (0.0%) |
| Construction & Extraction | 6 (100.0%) | 0 (0.0%) |
| Installation, Maintenance & Repair | 53 (93.0%) | 4 (7.0%) |
| Total (Category) | 59 (93.6%) | 4 (6.4%) |
| Total (Overall) | 229 (57.5%) | 169 (42.5%) |
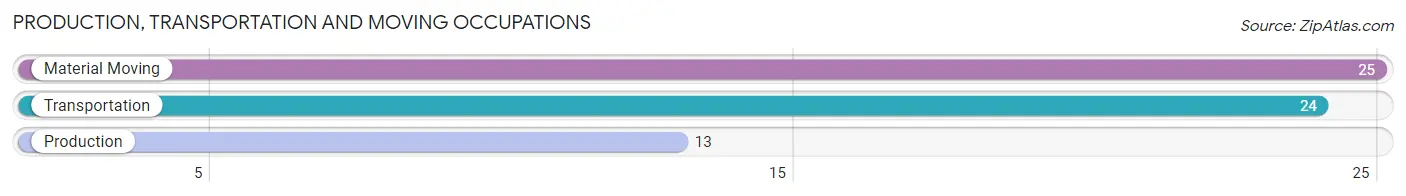
Production, Transportation and Moving Occupations
The most common Production, Transportation and Moving occupations in Paint borough are Material Moving (25 | 6.3%), Transportation (24 | 6.0%), and Production (13 | 3.3%).
Production, Transportation and Moving Occupations by Sex
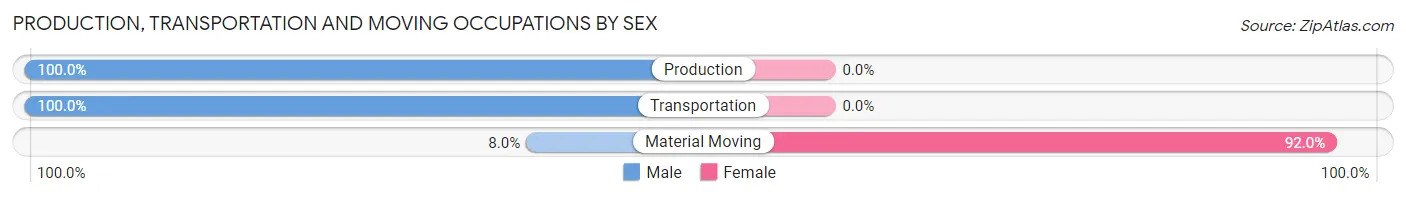
| Occupation | Male | Female |
| Production | 13 (100.0%) | 0 (0.0%) |
| Transportation | 24 (100.0%) | 0 (0.0%) |
| Material Moving | 2 (8.0%) | 23 (92.0%) |
| Total (Category) | 39 (62.9%) | 23 (37.1%) |
| Total (Overall) | 229 (57.5%) | 169 (42.5%) |
Employment Industries by Sex in Paint borough
Employment Industries in Paint borough
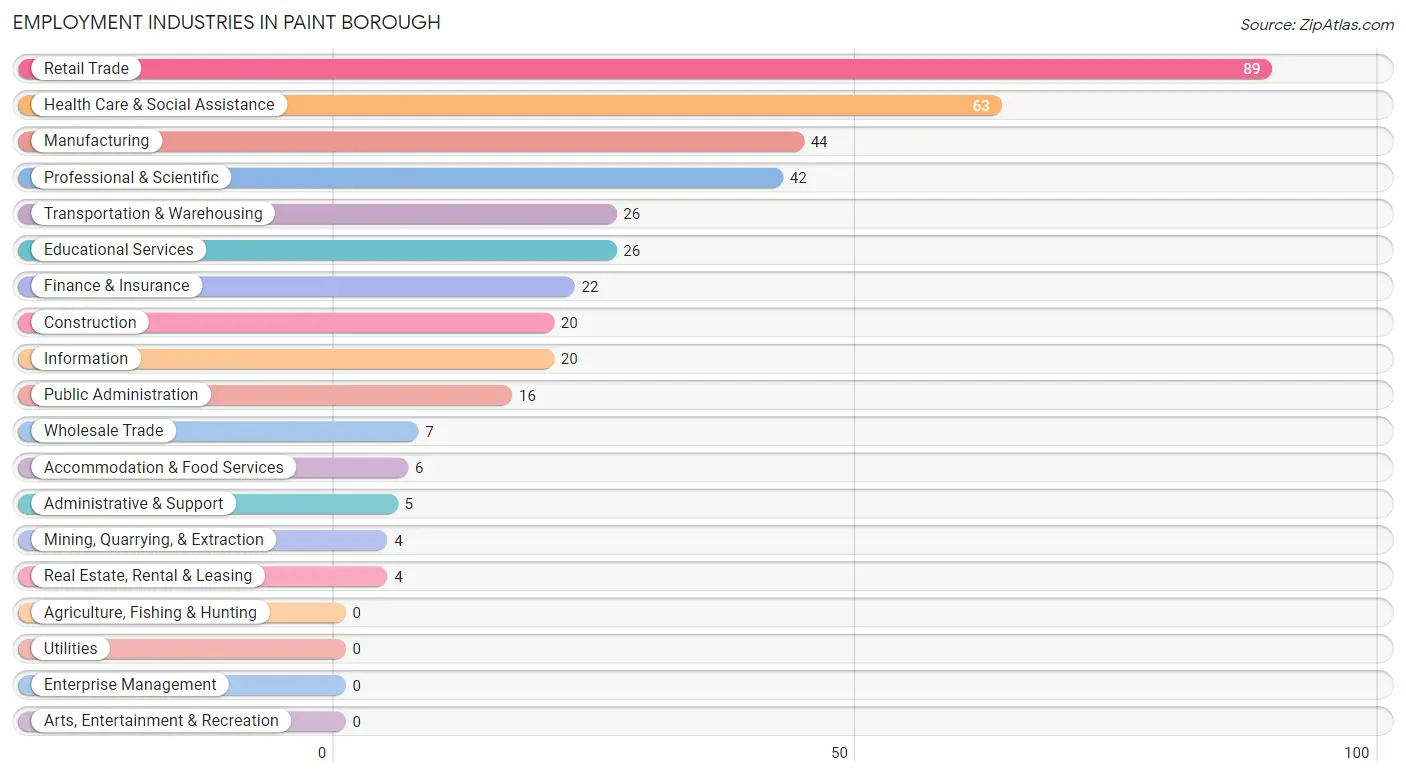
The major employment industries in Paint borough include Retail Trade (89 | 22.4%), Health Care & Social Assistance (63 | 15.8%), Manufacturing (44 | 11.1%), Professional & Scientific (42 | 10.5%), and Transportation & Warehousing (26 | 6.5%).
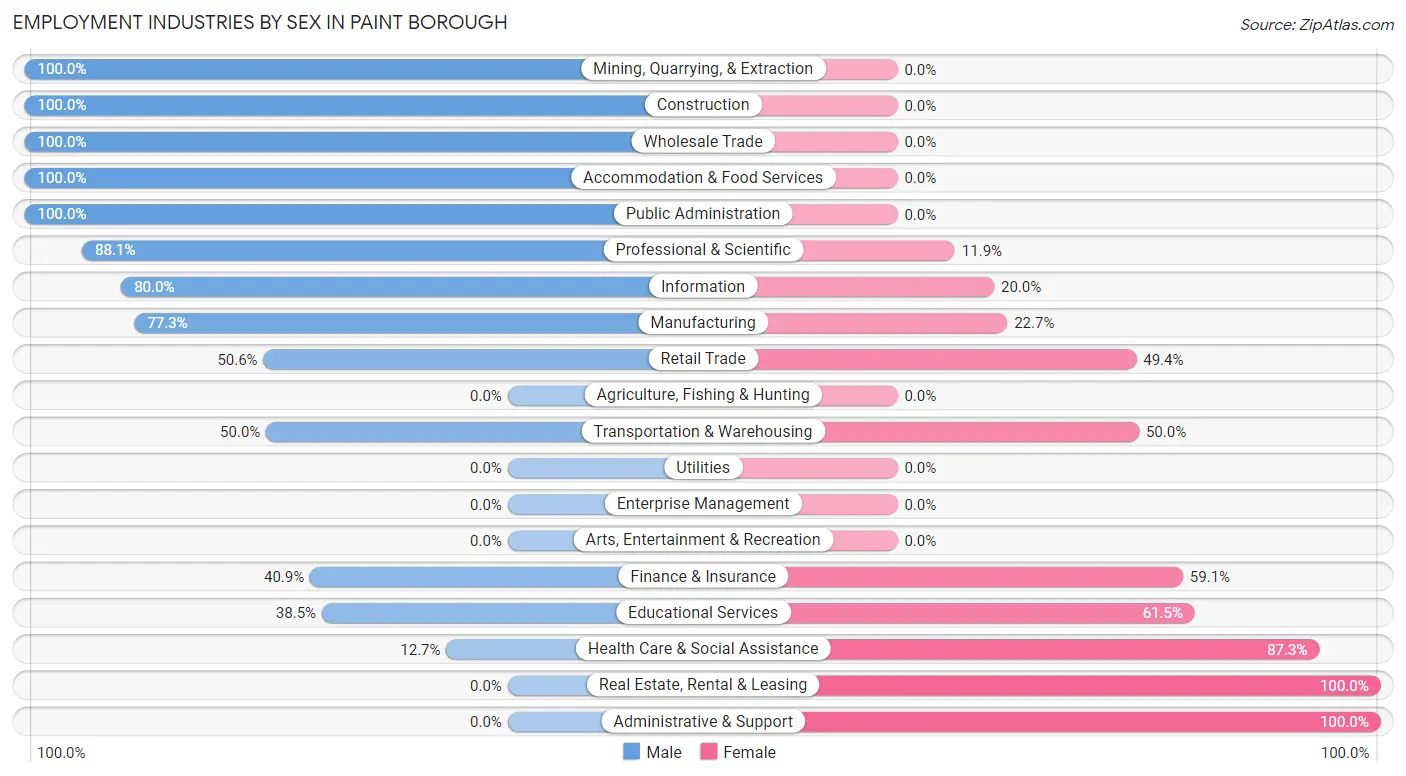
Employment Industries by Sex in Paint borough
The Paint borough industries that see more men than women are Mining, Quarrying, & Extraction (100.0%), Construction (100.0%), and Wholesale Trade (100.0%), whereas the industries that tend to have a higher number of women are Real Estate, Rental & Leasing (100.0%), Administrative & Support (100.0%), and Health Care & Social Assistance (87.3%).
| Industry | Male | Female |
| Agriculture, Fishing & Hunting | 0 (0.0%) | 0 (0.0%) |
| Mining, Quarrying, & Extraction | 4 (100.0%) | 0 (0.0%) |
| Construction | 20 (100.0%) | 0 (0.0%) |
| Manufacturing | 34 (77.3%) | 10 (22.7%) |
| Wholesale Trade | 7 (100.0%) | 0 (0.0%) |
| Retail Trade | 45 (50.6%) | 44 (49.4%) |
| Transportation & Warehousing | 13 (50.0%) | 13 (50.0%) |
| Utilities | 0 (0.0%) | 0 (0.0%) |
| Information | 16 (80.0%) | 4 (20.0%) |
| Finance & Insurance | 9 (40.9%) | 13 (59.1%) |
| Real Estate, Rental & Leasing | 0 (0.0%) | 4 (100.0%) |
| Professional & Scientific | 37 (88.1%) | 5 (11.9%) |
| Enterprise Management | 0 (0.0%) | 0 (0.0%) |
| Administrative & Support | 0 (0.0%) | 5 (100.0%) |
| Educational Services | 10 (38.5%) | 16 (61.5%) |
| Health Care & Social Assistance | 8 (12.7%) | 55 (87.3%) |
| Arts, Entertainment & Recreation | 0 (0.0%) | 0 (0.0%) |
| Accommodation & Food Services | 6 (100.0%) | 0 (0.0%) |
| Public Administration | 16 (100.0%) | 0 (0.0%) |
| Total | 229 (57.5%) | 169 (42.5%) |
Education in Paint borough
School Enrollment in Paint borough
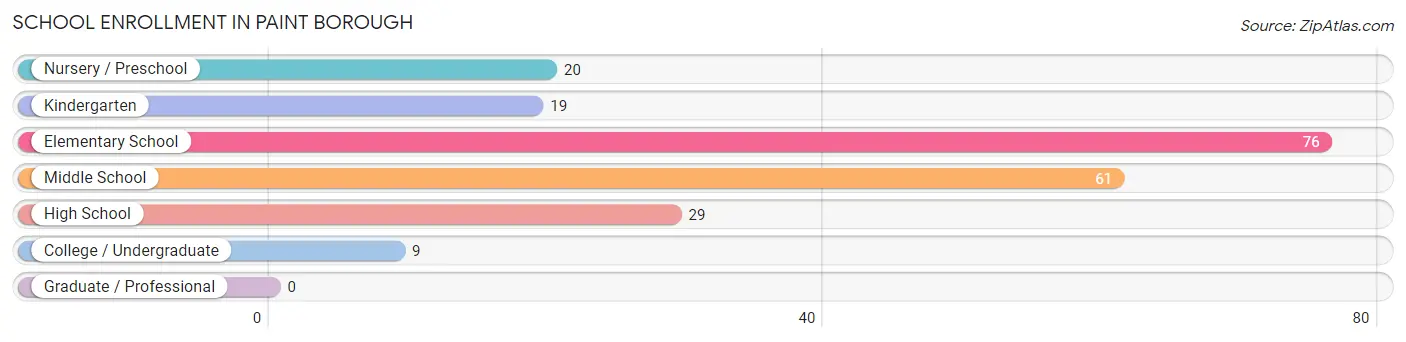
The most common levels of schooling among the 214 students in Paint borough are elementary school (76 | 35.5%), middle school (61 | 28.5%), and high school (29 | 13.6%).
| School Level | # Students | % Students |
| Nursery / Preschool | 20 | 9.3% |
| Kindergarten | 19 | 8.9% |
| Elementary School | 76 | 35.5% |
| Middle School | 61 | 28.5% |
| High School | 29 | 13.6% |
| College / Undergraduate | 9 | 4.2% |
| Graduate / Professional | 0 | 0.0% |
| Total | 214 | 100.0% |
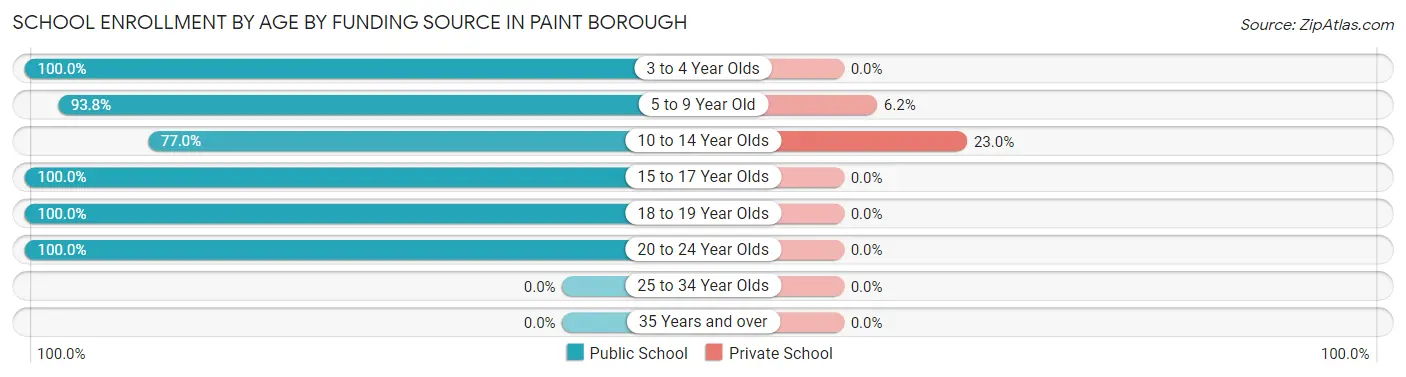
School Enrollment by Age by Funding Source in Paint borough
Out of a total of 214 students who are enrolled in schools in Paint borough, 23 (10.7%) attend a private institution, while the remaining 191 (89.3%) are enrolled in public schools. The age group of 10 to 14 year olds has the highest likelihood of being enrolled in private schools, with 17 (23.0% in the age bracket) enrolled. Conversely, the age group of 3 to 4 year olds has the lowest likelihood of being enrolled in a private school, with 15 (100.0% in the age bracket) attending a public institution.
| Age Bracket | Public School | Private School |
| 3 to 4 Year Olds | 15 (100.0%) | 0 (0.0%) |
| 5 to 9 Year Old | 91 (93.8%) | 6 (6.2%) |
| 10 to 14 Year Olds | 57 (77.0%) | 17 (23.0%) |
| 15 to 17 Year Olds | 13 (100.0%) | 0 (0.0%) |
| 18 to 19 Year Olds | 8 (100.0%) | 0 (0.0%) |
| 20 to 24 Year Olds | 7 (100.0%) | 0 (0.0%) |
| 25 to 34 Year Olds | 0 (0.0%) | 0 (0.0%) |
| 35 Years and over | 0 (0.0%) | 0 (0.0%) |
| Total | 191 (89.3%) | 23 (10.7%) |
Educational Attainment by Field of Study in Paint borough
Business (31 | 20.5%), computers & mathematics (19 | 12.6%), education (16 | 10.6%), arts & humanities (15 | 9.9%), and liberal arts & history (14 | 9.3%) are the most common fields of study among 151 individuals in Paint borough who have obtained a bachelor's degree or higher.
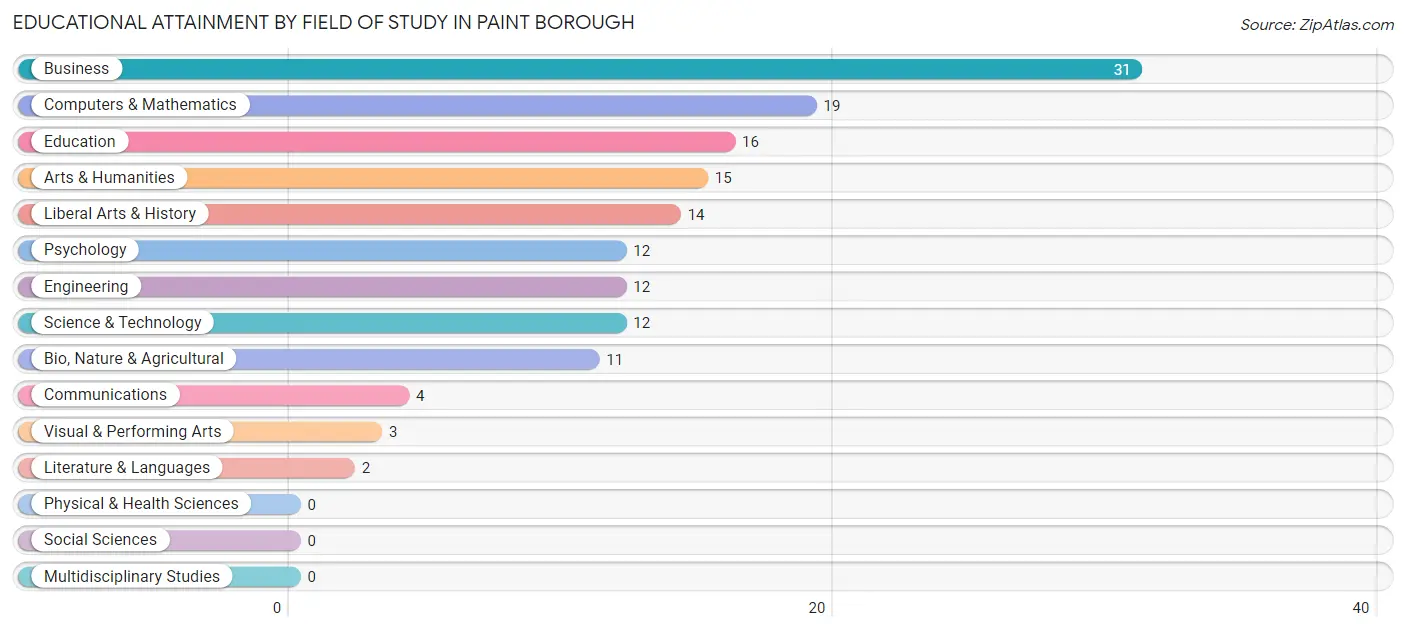
| Field of Study | # Graduates | % Graduates |
| Computers & Mathematics | 19 | 12.6% |
| Bio, Nature & Agricultural | 11 | 7.3% |
| Physical & Health Sciences | 0 | 0.0% |
| Psychology | 12 | 8.0% |
| Social Sciences | 0 | 0.0% |
| Engineering | 12 | 8.0% |
| Multidisciplinary Studies | 0 | 0.0% |
| Science & Technology | 12 | 8.0% |
| Business | 31 | 20.5% |
| Education | 16 | 10.6% |
| Literature & Languages | 2 | 1.3% |
| Liberal Arts & History | 14 | 9.3% |
| Visual & Performing Arts | 3 | 2.0% |
| Communications | 4 | 2.6% |
| Arts & Humanities | 15 | 9.9% |
| Total | 151 | 100.0% |
Transportation & Commute in Paint borough
Vehicle Availability by Sex in Paint borough
The most prevalent vehicle ownership categories in Paint borough are males with 2 vehicles (107, accounting for 46.7%) and females with 2 vehicles (73, making up 63.3%).
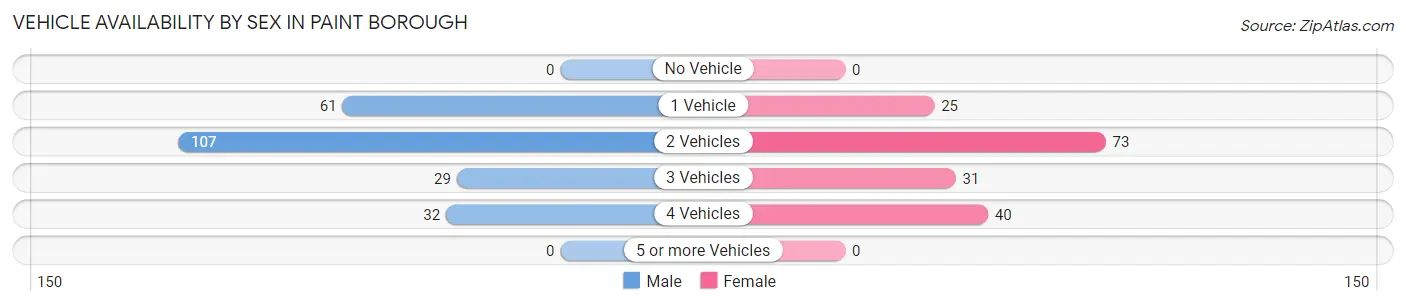
| Vehicles Available | Male | Female |
| No Vehicle | 0 (0.0%) | 0 (0.0%) |
| 1 Vehicle | 61 (26.6%) | 25 (14.8%) |
| 2 Vehicles | 107 (46.7%) | 73 (43.2%) |
| 3 Vehicles | 29 (12.7%) | 31 (18.3%) |
| 4 Vehicles | 32 (14.0%) | 40 (23.7%) |
| 5 or more Vehicles | 0 (0.0%) | 0 (0.0%) |
| Total | 229 (100.0%) | 169 (100.0%) |
Commute Time in Paint borough
The most frequently occuring commute durations in Paint borough are 10 to 14 minutes (93 commuters, 25.2%), 15 to 19 minutes (65 commuters, 17.6%), and less than 5 minutes (52 commuters, 14.1%).
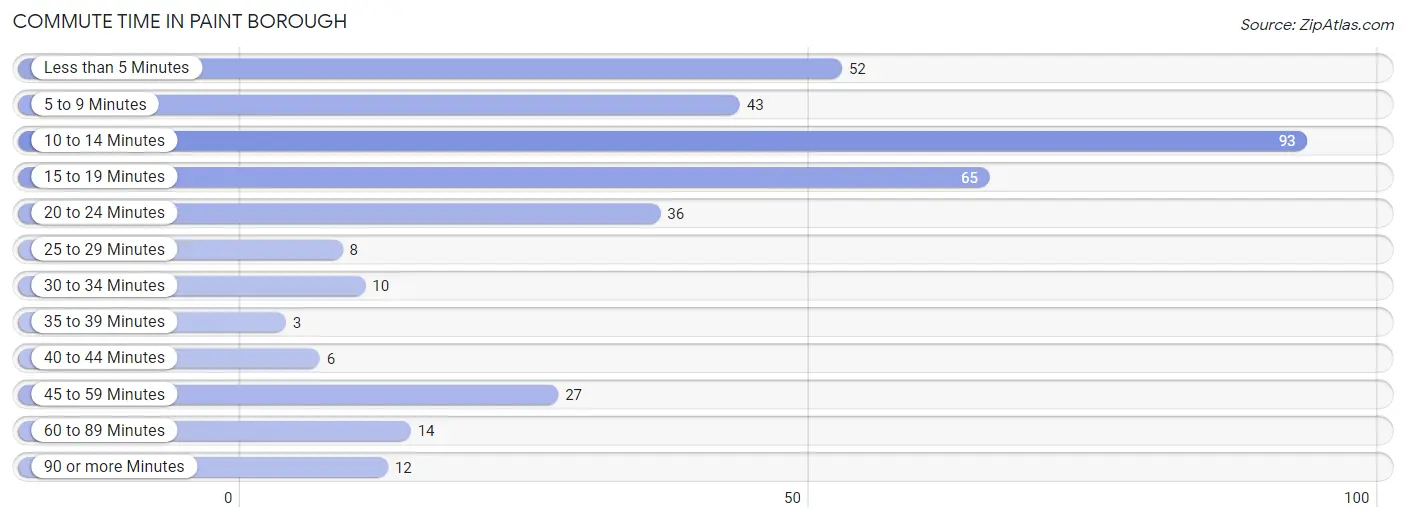
| Commute Time | # Commuters | % Commuters |
| Less than 5 Minutes | 52 | 14.1% |
| 5 to 9 Minutes | 43 | 11.7% |
| 10 to 14 Minutes | 93 | 25.2% |
| 15 to 19 Minutes | 65 | 17.6% |
| 20 to 24 Minutes | 36 | 9.8% |
| 25 to 29 Minutes | 8 | 2.2% |
| 30 to 34 Minutes | 10 | 2.7% |
| 35 to 39 Minutes | 3 | 0.8% |
| 40 to 44 Minutes | 6 | 1.6% |
| 45 to 59 Minutes | 27 | 7.3% |
| 60 to 89 Minutes | 14 | 3.8% |
| 90 or more Minutes | 12 | 3.3% |
Commute Time by Sex in Paint borough
The most common commute times in Paint borough are 10 to 14 minutes (47 commuters, 21.9%) for males and 10 to 14 minutes (46 commuters, 29.9%) for females.
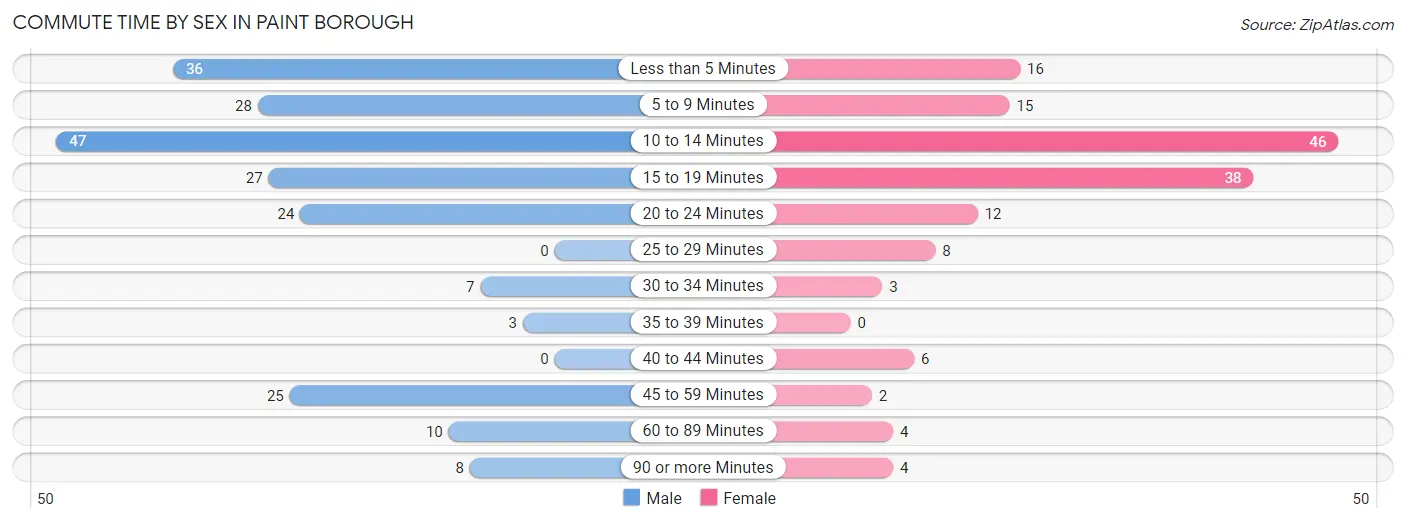
| Commute Time | Male | Female |
| Less than 5 Minutes | 36 (16.7%) | 16 (10.4%) |
| 5 to 9 Minutes | 28 (13.0%) | 15 (9.7%) |
| 10 to 14 Minutes | 47 (21.9%) | 46 (29.9%) |
| 15 to 19 Minutes | 27 (12.6%) | 38 (24.7%) |
| 20 to 24 Minutes | 24 (11.2%) | 12 (7.8%) |
| 25 to 29 Minutes | 0 (0.0%) | 8 (5.2%) |
| 30 to 34 Minutes | 7 (3.3%) | 3 (1.9%) |
| 35 to 39 Minutes | 3 (1.4%) | 0 (0.0%) |
| 40 to 44 Minutes | 0 (0.0%) | 6 (3.9%) |
| 45 to 59 Minutes | 25 (11.6%) | 2 (1.3%) |
| 60 to 89 Minutes | 10 (4.6%) | 4 (2.6%) |
| 90 or more Minutes | 8 (3.7%) | 4 (2.6%) |
Time of Departure to Work by Sex in Paint borough
The most frequent times of departure to work in Paint borough are 7:30 AM to 7:59 AM (66, 30.7%) for males and 7:00 AM to 7:29 AM (41, 26.6%) for females.
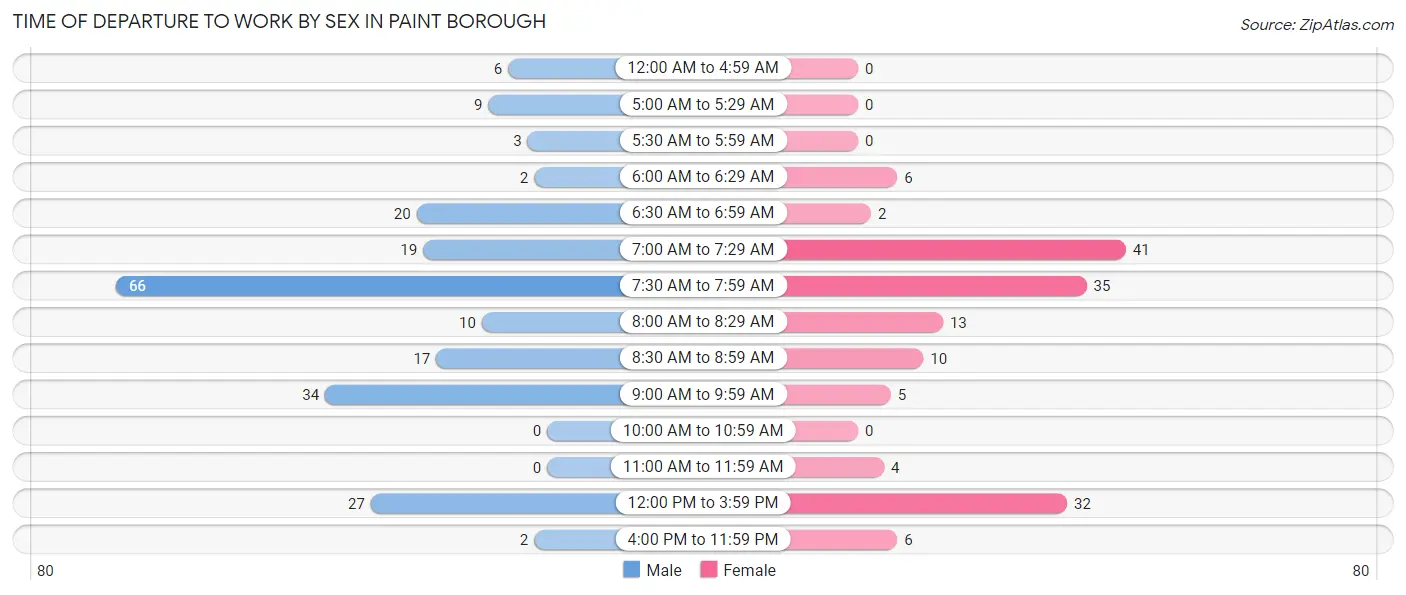
| Time of Departure | Male | Female |
| 12:00 AM to 4:59 AM | 6 (2.8%) | 0 (0.0%) |
| 5:00 AM to 5:29 AM | 9 (4.2%) | 0 (0.0%) |
| 5:30 AM to 5:59 AM | 3 (1.4%) | 0 (0.0%) |
| 6:00 AM to 6:29 AM | 2 (0.9%) | 6 (3.9%) |
| 6:30 AM to 6:59 AM | 20 (9.3%) | 2 (1.3%) |
| 7:00 AM to 7:29 AM | 19 (8.8%) | 41 (26.6%) |
| 7:30 AM to 7:59 AM | 66 (30.7%) | 35 (22.7%) |
| 8:00 AM to 8:29 AM | 10 (4.6%) | 13 (8.4%) |
| 8:30 AM to 8:59 AM | 17 (7.9%) | 10 (6.5%) |
| 9:00 AM to 9:59 AM | 34 (15.8%) | 5 (3.3%) |
| 10:00 AM to 10:59 AM | 0 (0.0%) | 0 (0.0%) |
| 11:00 AM to 11:59 AM | 0 (0.0%) | 4 (2.6%) |
| 12:00 PM to 3:59 PM | 27 (12.6%) | 32 (20.8%) |
| 4:00 PM to 11:59 PM | 2 (0.9%) | 6 (3.9%) |
| Total | 215 (100.0%) | 154 (100.0%) |
Housing Occupancy in Paint borough
Occupancy by Ownership in Paint borough
Of the total 409 dwellings in Paint borough, owner-occupied units account for 310 (75.8%), while renter-occupied units make up 99 (24.2%).
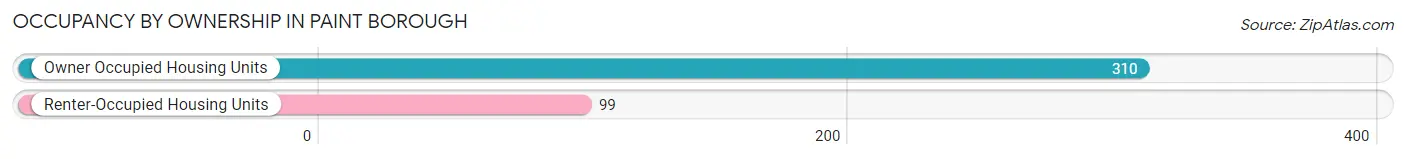
| Occupancy | # Housing Units | % Housing Units |
| Owner Occupied Housing Units | 310 | 75.8% |
| Renter-Occupied Housing Units | 99 | 24.2% |
| Total Occupied Housing Units | 409 | 100.0% |
Occupancy by Household Size in Paint borough
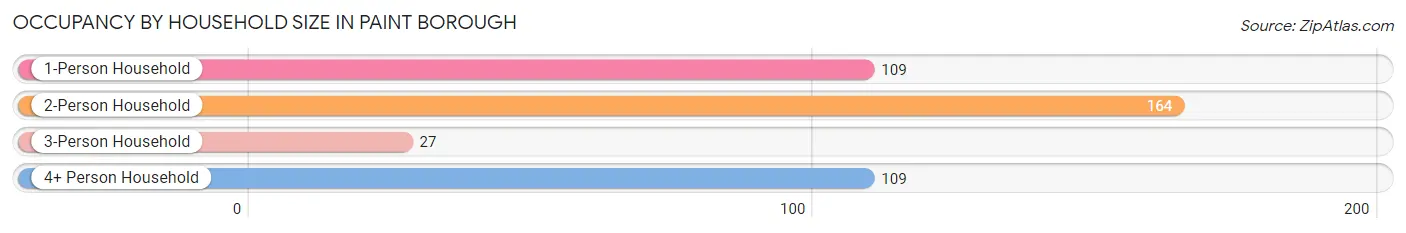
| Household Size | # Housing Units | % Housing Units |
| 1-Person Household | 109 | 26.7% |
| 2-Person Household | 164 | 40.1% |
| 3-Person Household | 27 | 6.6% |
| 4+ Person Household | 109 | 26.7% |
| Total Housing Units | 409 | 100.0% |
Occupancy by Ownership by Household Size in Paint borough
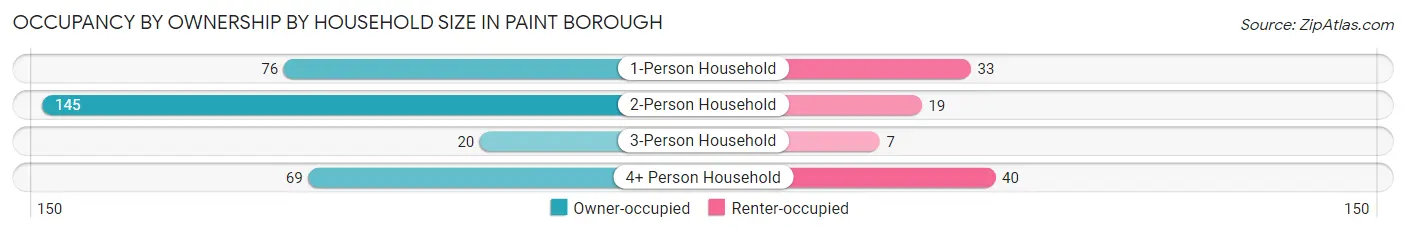
| Household Size | Owner-occupied | Renter-occupied |
| 1-Person Household | 76 (69.7%) | 33 (30.3%) |
| 2-Person Household | 145 (88.4%) | 19 (11.6%) |
| 3-Person Household | 20 (74.1%) | 7 (25.9%) |
| 4+ Person Household | 69 (63.3%) | 40 (36.7%) |
| Total Housing Units | 310 (75.8%) | 99 (24.2%) |
Occupancy by Educational Attainment in Paint borough
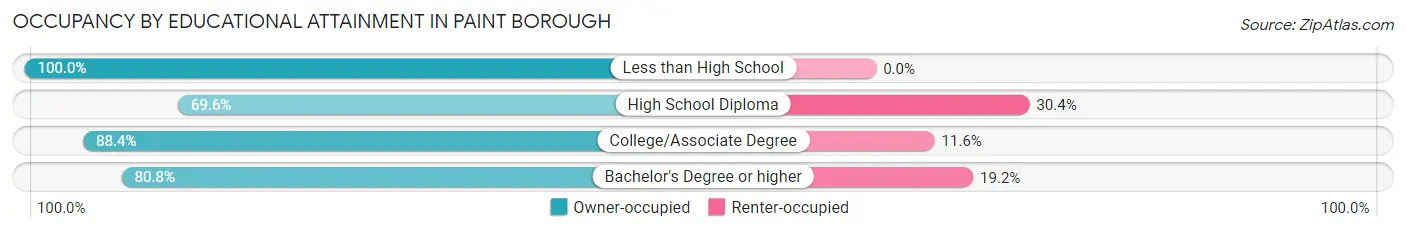
| Household Size | Owner-occupied | Renter-occupied |
| Less than High School | 12 (100.0%) | 0 (0.0%) |
| High School Diploma | 174 (69.6%) | 76 (30.4%) |
| College/Associate Degree | 61 (88.4%) | 8 (11.6%) |
| Bachelor's Degree or higher | 63 (80.8%) | 15 (19.2%) |
Occupancy by Age of Householder in Paint borough
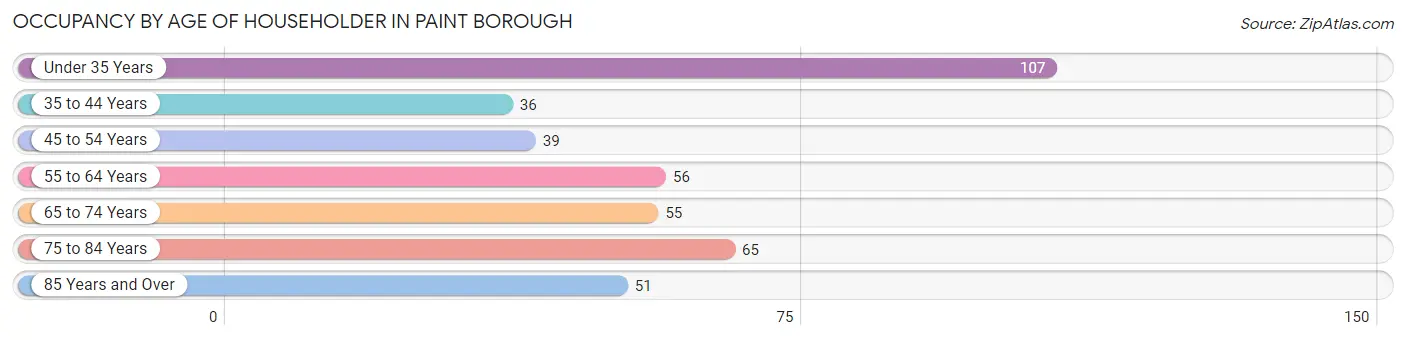
| Age Bracket | # Households | % Households |
| Under 35 Years | 107 | 26.2% |
| 35 to 44 Years | 36 | 8.8% |
| 45 to 54 Years | 39 | 9.5% |
| 55 to 64 Years | 56 | 13.7% |
| 65 to 74 Years | 55 | 13.5% |
| 75 to 84 Years | 65 | 15.9% |
| 85 Years and Over | 51 | 12.5% |
| Total | 409 | 100.0% |
Housing Finances in Paint borough
Median Income by Occupancy in Paint borough
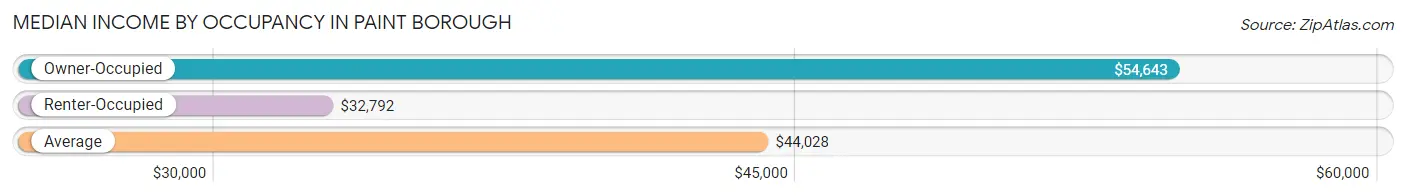
| Occupancy Type | # Households | Median Income |
| Owner-Occupied | 310 (75.8%) | $54,643 |
| Renter-Occupied | 99 (24.2%) | $32,792 |
| Average | 409 (100.0%) | $44,028 |
Occupancy by Householder Income Bracket in Paint borough
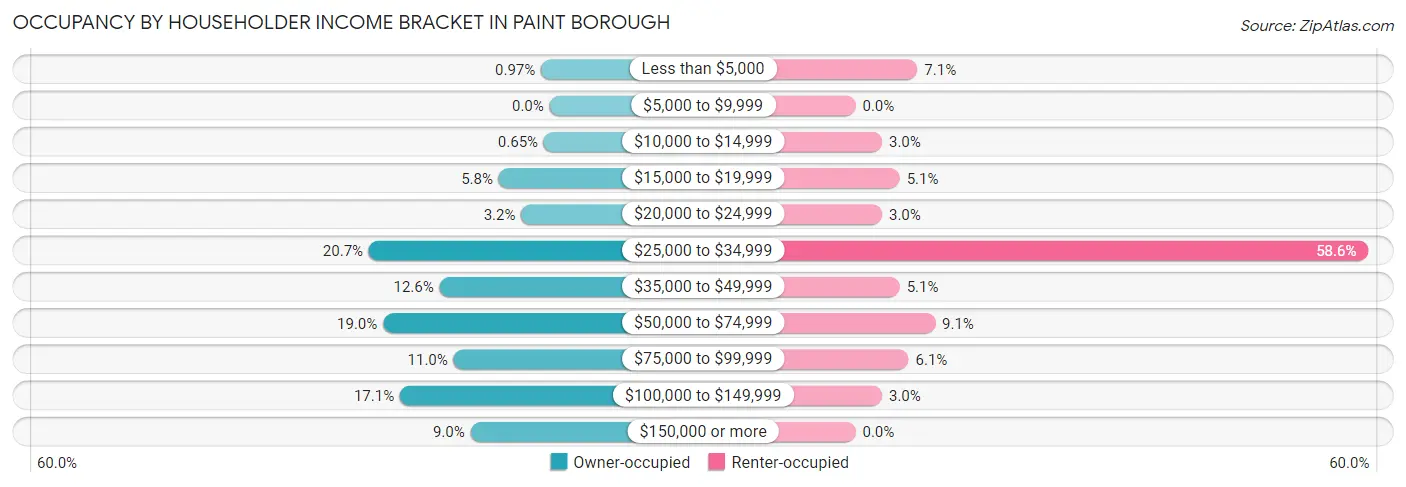
| Income Bracket | Owner-occupied | Renter-occupied |
| Less than $5,000 | 3 (1.0%) | 7 (7.1%) |
| $5,000 to $9,999 | 0 (0.0%) | 0 (0.0%) |
| $10,000 to $14,999 | 2 (0.6%) | 3 (3.0%) |
| $15,000 to $19,999 | 18 (5.8%) | 5 (5.1%) |
| $20,000 to $24,999 | 10 (3.2%) | 3 (3.0%) |
| $25,000 to $34,999 | 64 (20.6%) | 58 (58.6%) |
| $35,000 to $49,999 | 39 (12.6%) | 5 (5.1%) |
| $50,000 to $74,999 | 59 (19.0%) | 9 (9.1%) |
| $75,000 to $99,999 | 34 (11.0%) | 6 (6.1%) |
| $100,000 to $149,999 | 53 (17.1%) | 3 (3.0%) |
| $150,000 or more | 28 (9.0%) | 0 (0.0%) |
| Total | 310 (100.0%) | 99 (100.0%) |
Monthly Housing Cost Tiers in Paint borough
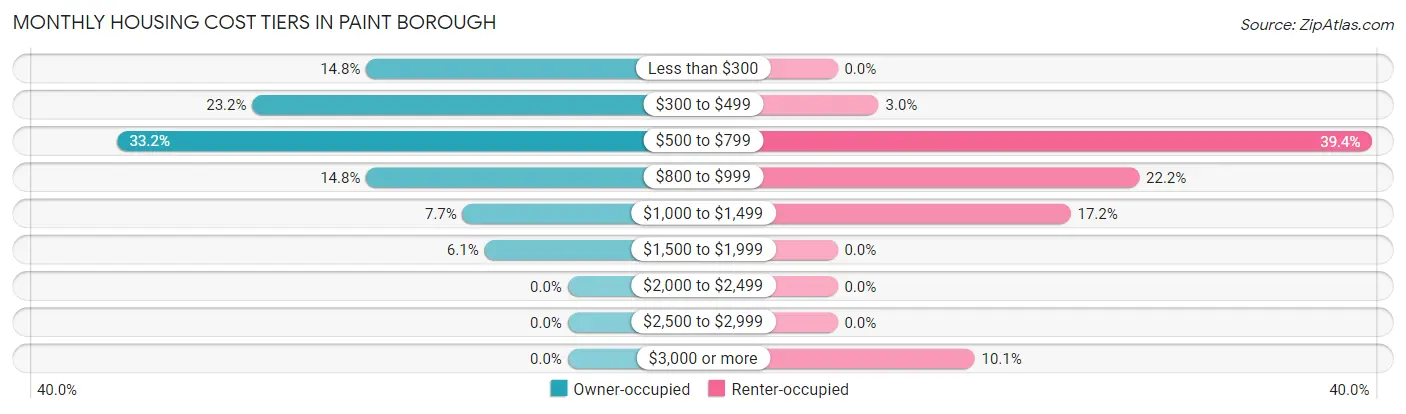
| Monthly Cost | Owner-occupied | Renter-occupied |
| Less than $300 | 46 (14.8%) | 0 (0.0%) |
| $300 to $499 | 72 (23.2%) | 3 (3.0%) |
| $500 to $799 | 103 (33.2%) | 39 (39.4%) |
| $800 to $999 | 46 (14.8%) | 22 (22.2%) |
| $1,000 to $1,499 | 24 (7.7%) | 17 (17.2%) |
| $1,500 to $1,999 | 19 (6.1%) | 0 (0.0%) |
| $2,000 to $2,499 | 0 (0.0%) | 0 (0.0%) |
| $2,500 to $2,999 | 0 (0.0%) | 0 (0.0%) |
| $3,000 or more | 0 (0.0%) | 10 (10.1%) |
| Total | 310 (100.0%) | 99 (100.0%) |
Physical Housing Characteristics in Paint borough
Housing Structures in Paint borough
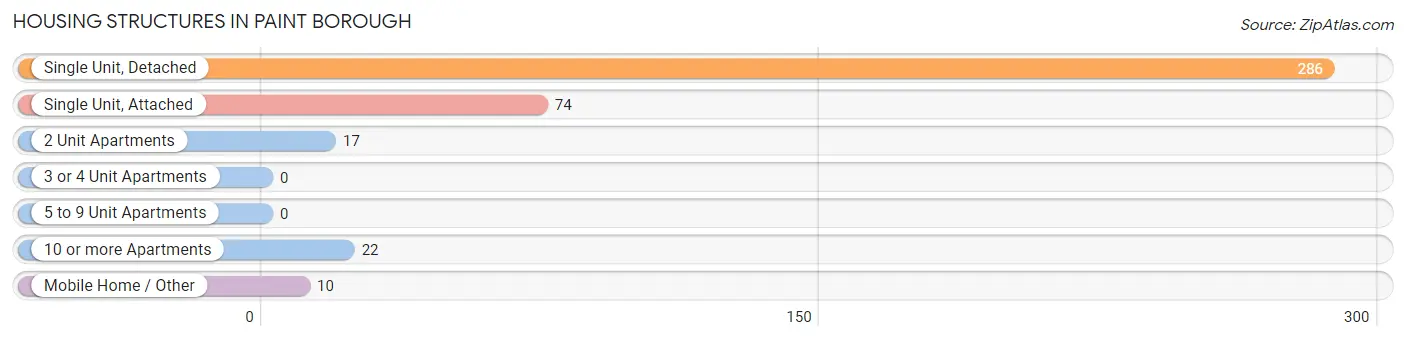
| Structure Type | # Housing Units | % Housing Units |
| Single Unit, Detached | 286 | 69.9% |
| Single Unit, Attached | 74 | 18.1% |
| 2 Unit Apartments | 17 | 4.2% |
| 3 or 4 Unit Apartments | 0 | 0.0% |
| 5 to 9 Unit Apartments | 0 | 0.0% |
| 10 or more Apartments | 22 | 5.4% |
| Mobile Home / Other | 10 | 2.4% |
| Total | 409 | 100.0% |
Housing Structures by Occupancy in Paint borough
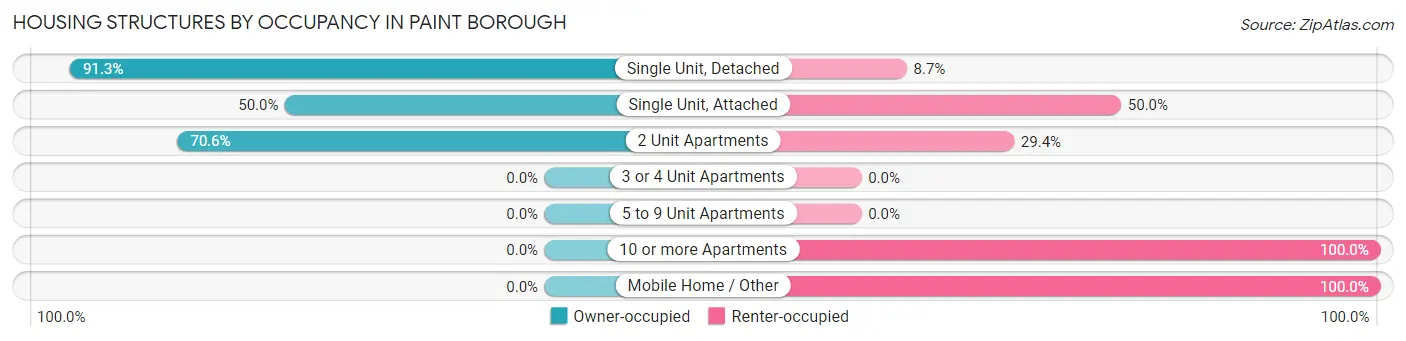
| Structure Type | Owner-occupied | Renter-occupied |
| Single Unit, Detached | 261 (91.3%) | 25 (8.7%) |
| Single Unit, Attached | 37 (50.0%) | 37 (50.0%) |
| 2 Unit Apartments | 12 (70.6%) | 5 (29.4%) |
| 3 or 4 Unit Apartments | 0 (0.0%) | 0 (0.0%) |
| 5 to 9 Unit Apartments | 0 (0.0%) | 0 (0.0%) |
| 10 or more Apartments | 0 (0.0%) | 22 (100.0%) |
| Mobile Home / Other | 0 (0.0%) | 10 (100.0%) |
| Total | 310 (75.8%) | 99 (24.2%) |
Housing Structures by Number of Rooms in Paint borough
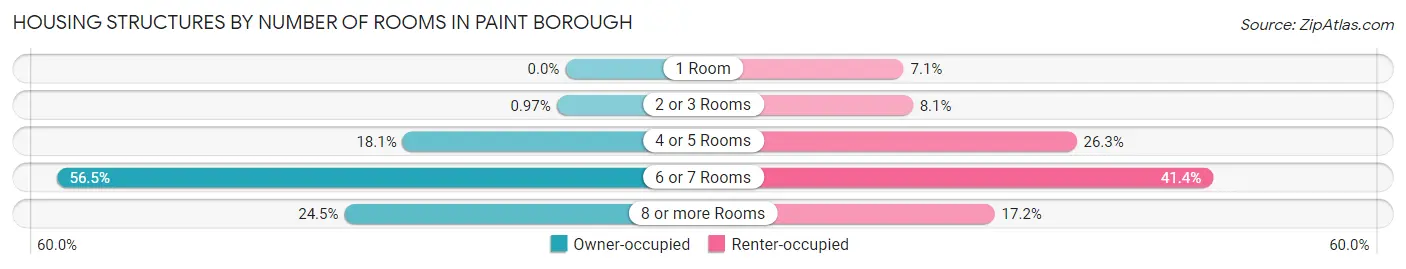
| Number of Rooms | Owner-occupied | Renter-occupied |
| 1 Room | 0 (0.0%) | 7 (7.1%) |
| 2 or 3 Rooms | 3 (1.0%) | 8 (8.1%) |
| 4 or 5 Rooms | 56 (18.1%) | 26 (26.3%) |
| 6 or 7 Rooms | 175 (56.5%) | 41 (41.4%) |
| 8 or more Rooms | 76 (24.5%) | 17 (17.2%) |
| Total | 310 (100.0%) | 99 (100.0%) |
Housing Structure by Heating Type in Paint borough
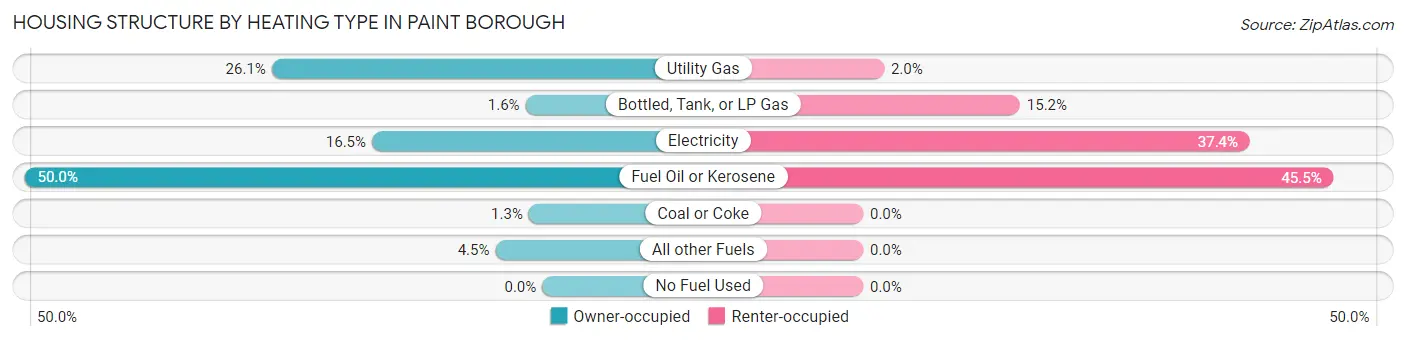
| Heating Type | Owner-occupied | Renter-occupied |
| Utility Gas | 81 (26.1%) | 2 (2.0%) |
| Bottled, Tank, or LP Gas | 5 (1.6%) | 15 (15.1%) |
| Electricity | 51 (16.5%) | 37 (37.4%) |
| Fuel Oil or Kerosene | 155 (50.0%) | 45 (45.5%) |
| Coal or Coke | 4 (1.3%) | 0 (0.0%) |
| All other Fuels | 14 (4.5%) | 0 (0.0%) |
| No Fuel Used | 0 (0.0%) | 0 (0.0%) |
| Total | 310 (100.0%) | 99 (100.0%) |
Household Vehicle Usage in Paint borough
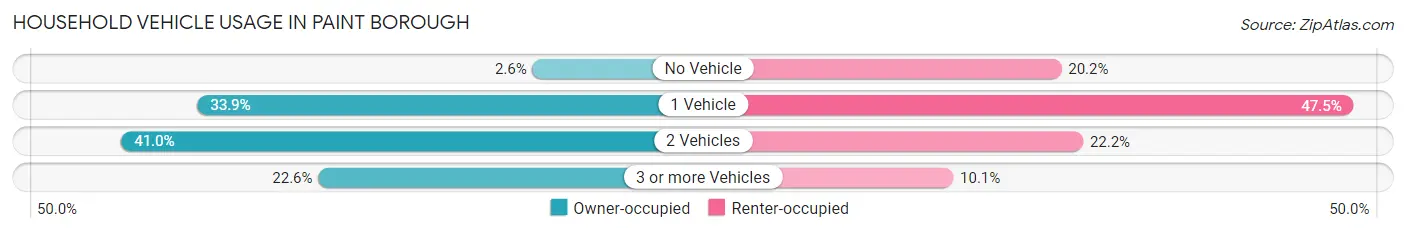
| Vehicles per Household | Owner-occupied | Renter-occupied |
| No Vehicle | 8 (2.6%) | 20 (20.2%) |
| 1 Vehicle | 105 (33.9%) | 47 (47.5%) |
| 2 Vehicles | 127 (41.0%) | 22 (22.2%) |
| 3 or more Vehicles | 70 (22.6%) | 10 (10.1%) |
| Total | 310 (100.0%) | 99 (100.0%) |
Real Estate & Mortgages in Paint borough
Real Estate and Mortgage Overview in Paint borough
| Characteristic | Without Mortgage | With Mortgage |
| Housing Units | 170 | 140 |
| Median Property Value | $97,500 | $90,600 |
| Median Household Income | $45,000 | $11 |
| Monthly Housing Costs | $403 | $0 |
| Real Estate Taxes | $784 | $2 |
Property Value by Mortgage Status in Paint borough
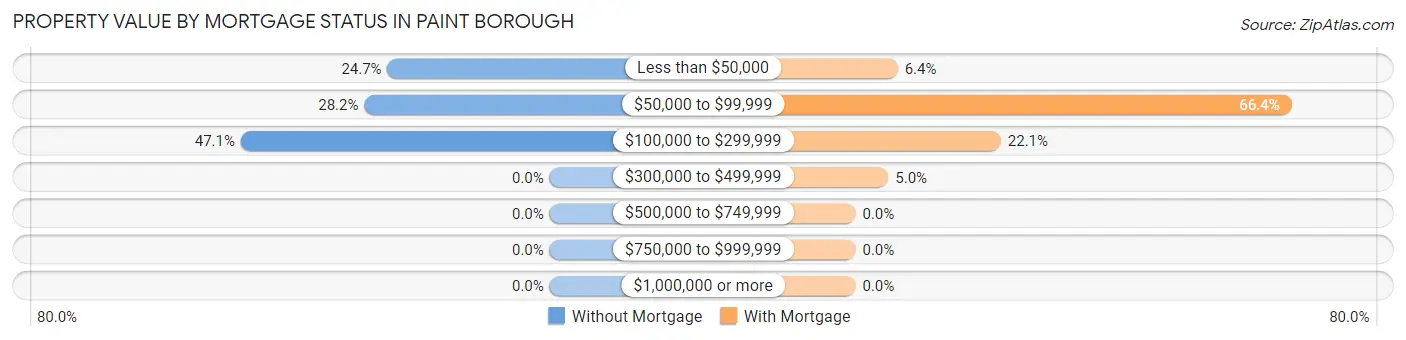
| Property Value | Without Mortgage | With Mortgage |
| Less than $50,000 | 42 (24.7%) | 9 (6.4%) |
| $50,000 to $99,999 | 48 (28.2%) | 93 (66.4%) |
| $100,000 to $299,999 | 80 (47.1%) | 31 (22.1%) |
| $300,000 to $499,999 | 0 (0.0%) | 7 (5.0%) |
| $500,000 to $749,999 | 0 (0.0%) | 0 (0.0%) |
| $750,000 to $999,999 | 0 (0.0%) | 0 (0.0%) |
| $1,000,000 or more | 0 (0.0%) | 0 (0.0%) |
| Total | 170 (100.0%) | 140 (100.0%) |
Household Income by Mortgage Status in Paint borough
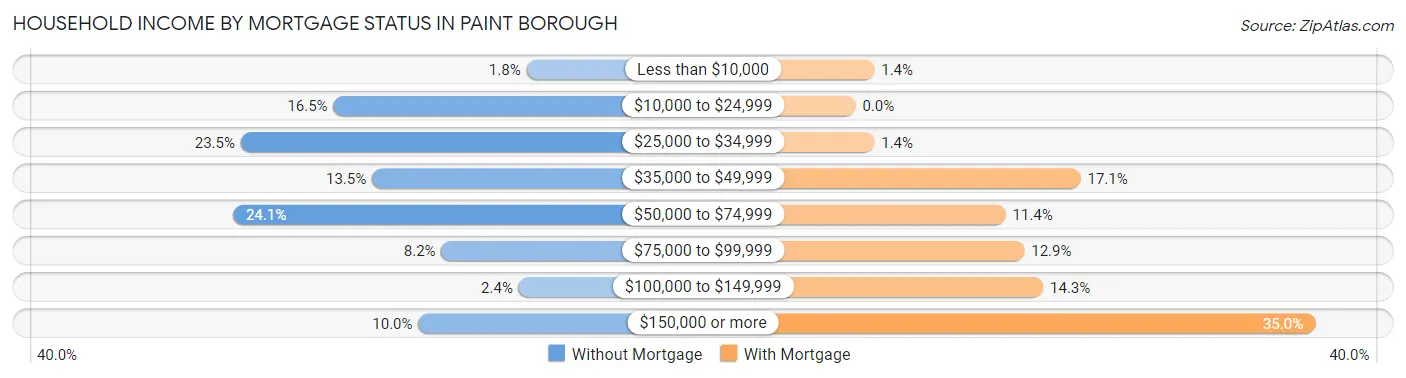
| Household Income | Without Mortgage | With Mortgage |
| Less than $10,000 | 3 (1.8%) | 2 (1.4%) |
| $10,000 to $24,999 | 28 (16.5%) | 0 (0.0%) |
| $25,000 to $34,999 | 40 (23.5%) | 2 (1.4%) |
| $35,000 to $49,999 | 23 (13.5%) | 24 (17.1%) |
| $50,000 to $74,999 | 41 (24.1%) | 16 (11.4%) |
| $75,000 to $99,999 | 14 (8.2%) | 18 (12.9%) |
| $100,000 to $149,999 | 4 (2.4%) | 20 (14.3%) |
| $150,000 or more | 17 (10.0%) | 49 (35.0%) |
| Total | 170 (100.0%) | 140 (100.0%) |
Property Value to Household Income Ratio in Paint borough
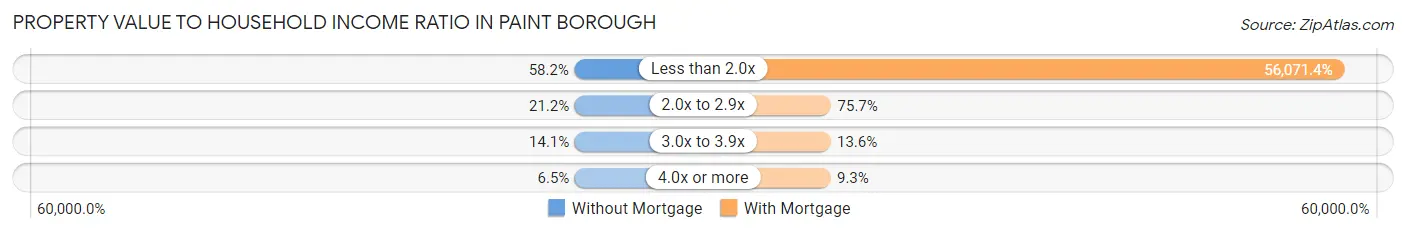
| Value-to-Income Ratio | Without Mortgage | With Mortgage |
| Less than 2.0x | 99 (58.2%) | 78,500 (56,071.4%) |
| 2.0x to 2.9x | 36 (21.2%) | 106 (75.7%) |
| 3.0x to 3.9x | 24 (14.1%) | 19 (13.6%) |
| 4.0x or more | 11 (6.5%) | 13 (9.3%) |
| Total | 170 (100.0%) | 140 (100.0%) |
Real Estate Taxes by Mortgage Status in Paint borough
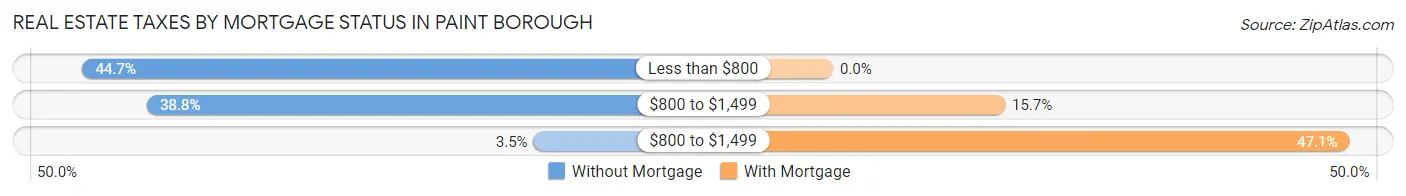
| Property Taxes | Without Mortgage | With Mortgage |
| Less than $800 | 76 (44.7%) | 0 (0.0%) |
| $800 to $1,499 | 66 (38.8%) | 22 (15.7%) |
| $800 to $1,499 | 6 (3.5%) | 66 (47.1%) |
| Total | 170 (100.0%) | 140 (100.0%) |
Health & Disability in Paint borough
Health Insurance Coverage by Age in Paint borough
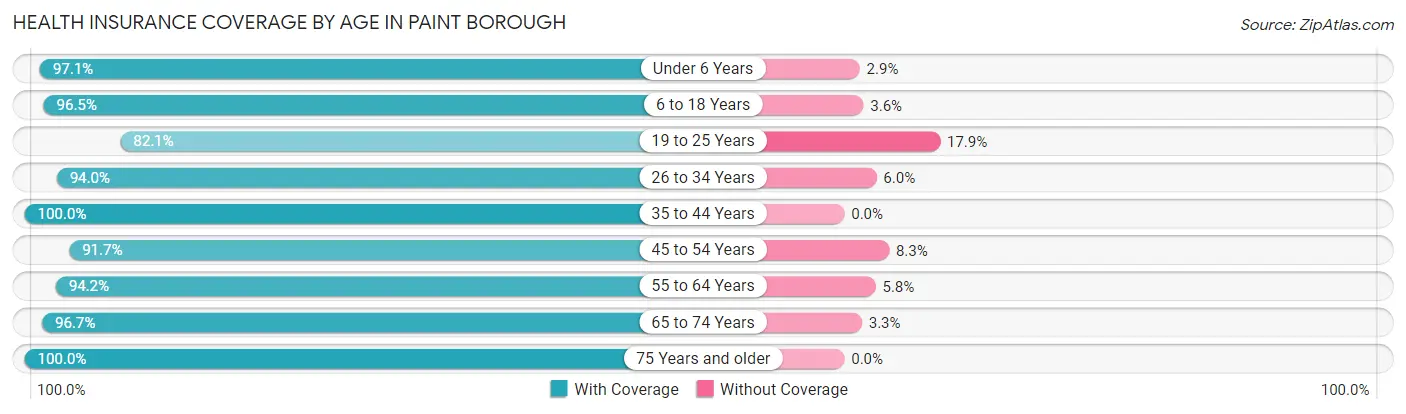
| Age Bracket | With Coverage | Without Coverage |
| Under 6 Years | 68 (97.1%) | 2 (2.9%) |
| 6 to 18 Years | 163 (96.5%) | 6 (3.5%) |
| 19 to 25 Years | 46 (82.1%) | 10 (17.9%) |
| 26 to 34 Years | 157 (94.0%) | 10 (6.0%) |
| 35 to 44 Years | 87 (100.0%) | 0 (0.0%) |
| 45 to 54 Years | 77 (91.7%) | 7 (8.3%) |
| 55 to 64 Years | 113 (94.2%) | 7 (5.8%) |
| 65 to 74 Years | 89 (96.7%) | 3 (3.3%) |
| 75 Years and older | 164 (100.0%) | 0 (0.0%) |
| Total | 964 (95.5%) | 45 (4.5%) |
Health Insurance Coverage by Citizenship Status in Paint borough
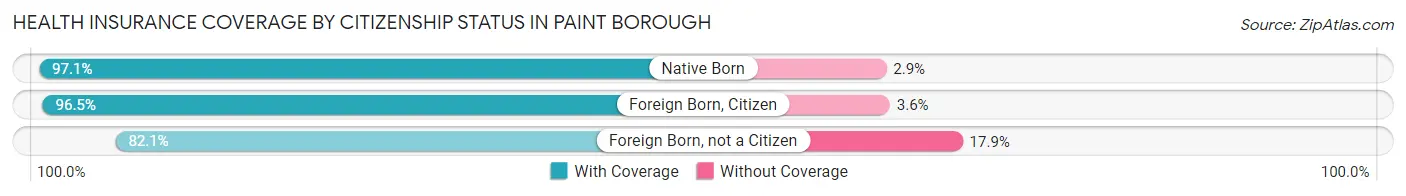
| Citizenship Status | With Coverage | Without Coverage |
| Native Born | 68 (97.1%) | 2 (2.9%) |
| Foreign Born, Citizen | 163 (96.5%) | 6 (3.5%) |
| Foreign Born, not a Citizen | 46 (82.1%) | 10 (17.9%) |
Health Insurance Coverage by Household Income in Paint borough
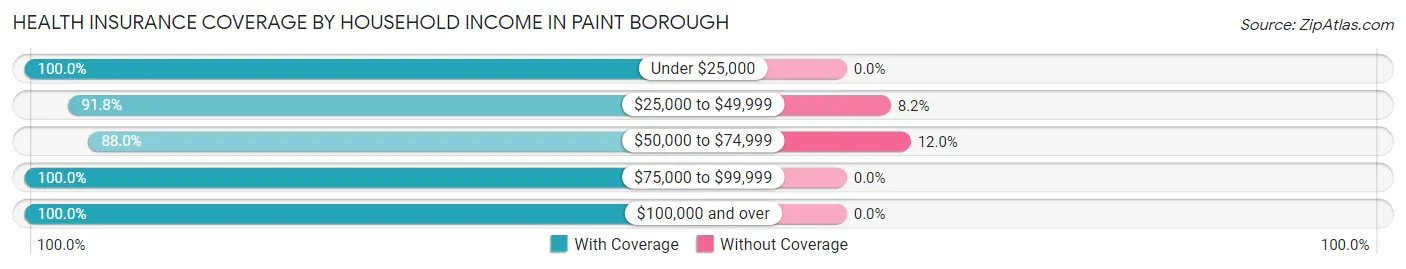
| Household Income | With Coverage | Without Coverage |
| Under $25,000 | 118 (100.0%) | 0 (0.0%) |
| $25,000 to $49,999 | 312 (91.8%) | 28 (8.2%) |
| $50,000 to $74,999 | 125 (88.0%) | 17 (12.0%) |
| $75,000 to $99,999 | 134 (100.0%) | 0 (0.0%) |
| $100,000 and over | 275 (100.0%) | 0 (0.0%) |
Public vs Private Health Insurance Coverage by Age in Paint borough
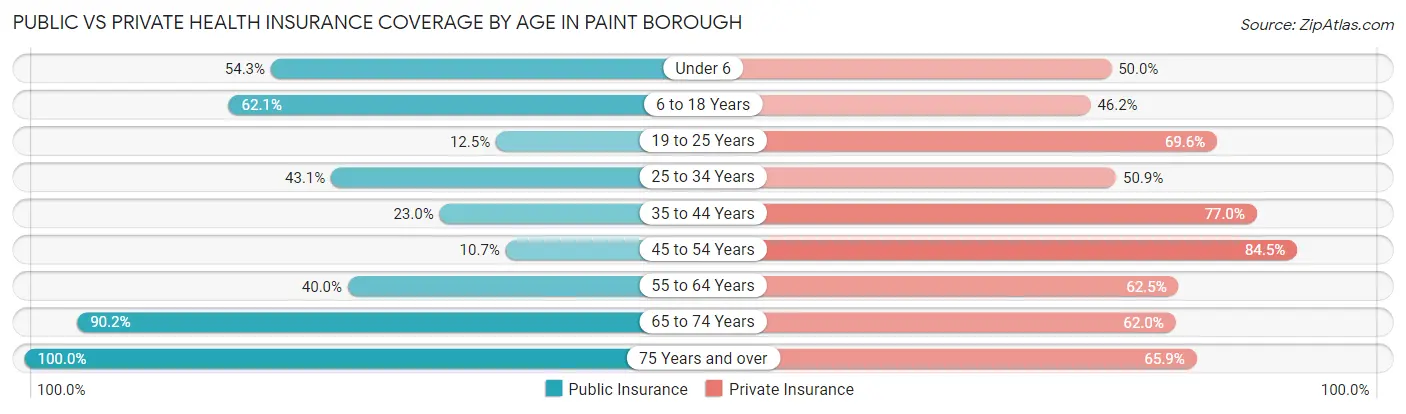
| Age Bracket | Public Insurance | Private Insurance |
| Under 6 | 38 (54.3%) | 35 (50.0%) |
| 6 to 18 Years | 105 (62.1%) | 78 (46.2%) |
| 19 to 25 Years | 7 (12.5%) | 39 (69.6%) |
| 25 to 34 Years | 72 (43.1%) | 85 (50.9%) |
| 35 to 44 Years | 20 (23.0%) | 67 (77.0%) |
| 45 to 54 Years | 9 (10.7%) | 71 (84.5%) |
| 55 to 64 Years | 48 (40.0%) | 75 (62.5%) |
| 65 to 74 Years | 83 (90.2%) | 57 (62.0%) |
| 75 Years and over | 164 (100.0%) | 108 (65.8%) |
| Total | 546 (54.1%) | 615 (61.0%) |
Disability Status by Sex by Age in Paint borough
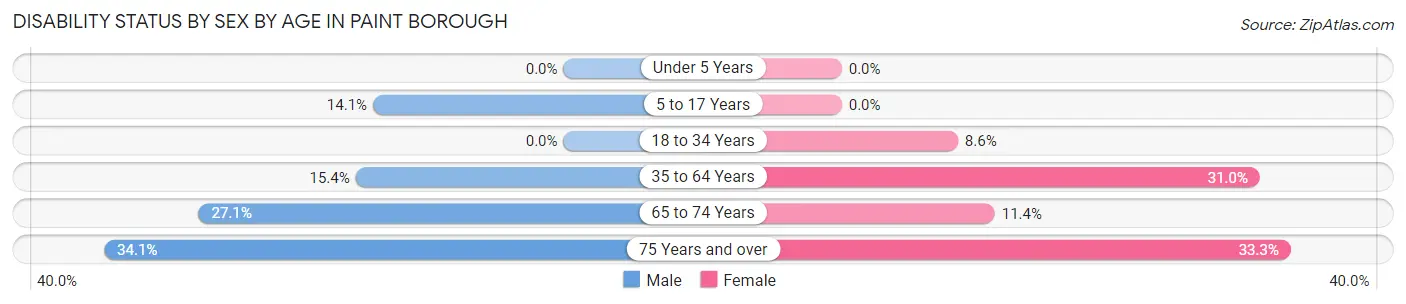
| Age Bracket | Male | Female |
| Under 5 Years | 0 (0.0%) | 0 (0.0%) |
| 5 to 17 Years | 14 (14.1%) | 0 (0.0%) |
| 18 to 34 Years | 0 (0.0%) | 10 (8.6%) |
| 35 to 64 Years | 27 (15.4%) | 36 (31.0%) |
| 65 to 74 Years | 13 (27.1%) | 5 (11.4%) |
| 75 Years and over | 15 (34.1%) | 40 (33.3%) |
Disability Class by Sex by Age in Paint borough
Disability Class: Hearing Difficulty
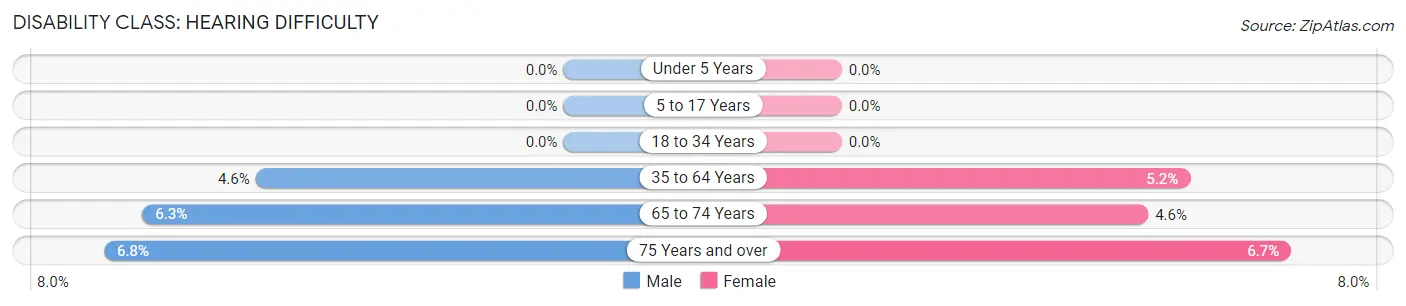
| Age Bracket | Male | Female |
| Under 5 Years | 0 (0.0%) | 0 (0.0%) |
| 5 to 17 Years | 0 (0.0%) | 0 (0.0%) |
| 18 to 34 Years | 0 (0.0%) | 0 (0.0%) |
| 35 to 64 Years | 8 (4.6%) | 6 (5.2%) |
| 65 to 74 Years | 3 (6.2%) | 2 (4.5%) |
| 75 Years and over | 3 (6.8%) | 8 (6.7%) |
Disability Class: Vision Difficulty
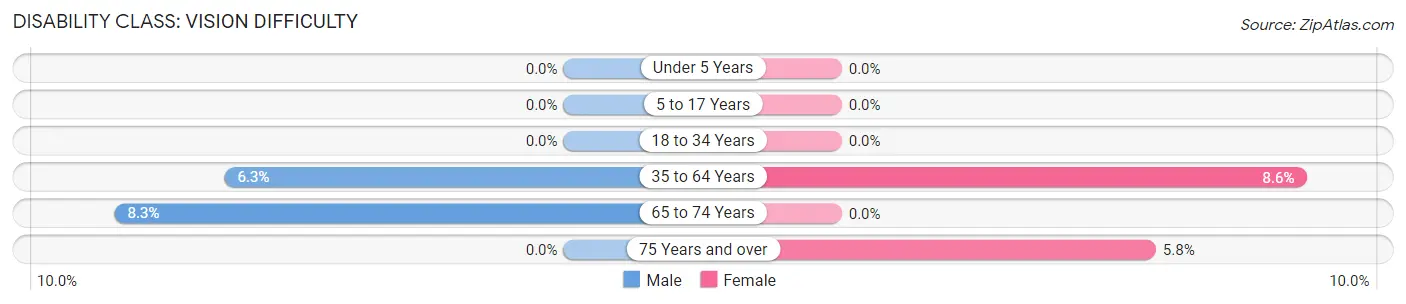
| Age Bracket | Male | Female |
| Under 5 Years | 0 (0.0%) | 0 (0.0%) |
| 5 to 17 Years | 0 (0.0%) | 0 (0.0%) |
| 18 to 34 Years | 0 (0.0%) | 0 (0.0%) |
| 35 to 64 Years | 11 (6.3%) | 10 (8.6%) |
| 65 to 74 Years | 4 (8.3%) | 0 (0.0%) |
| 75 Years and over | 0 (0.0%) | 7 (5.8%) |
Disability Class: Cognitive Difficulty
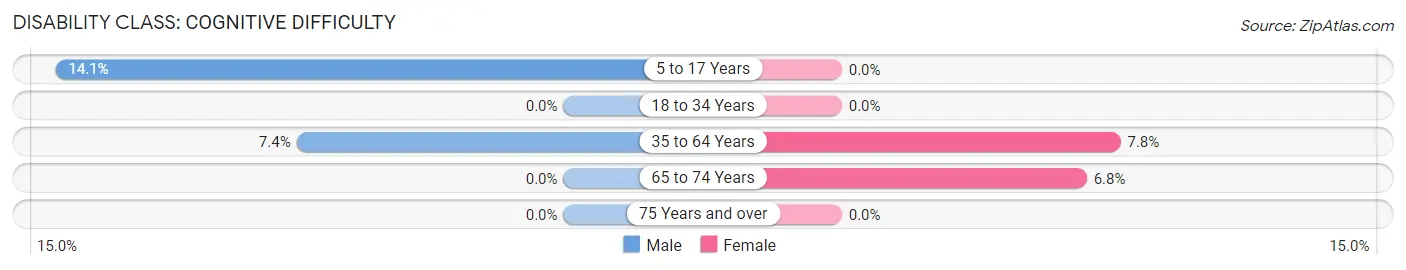
| Age Bracket | Male | Female |
| 5 to 17 Years | 14 (14.1%) | 0 (0.0%) |
| 18 to 34 Years | 0 (0.0%) | 0 (0.0%) |
| 35 to 64 Years | 13 (7.4%) | 9 (7.8%) |
| 65 to 74 Years | 0 (0.0%) | 3 (6.8%) |
| 75 Years and over | 0 (0.0%) | 0 (0.0%) |
Disability Class: Ambulatory Difficulty
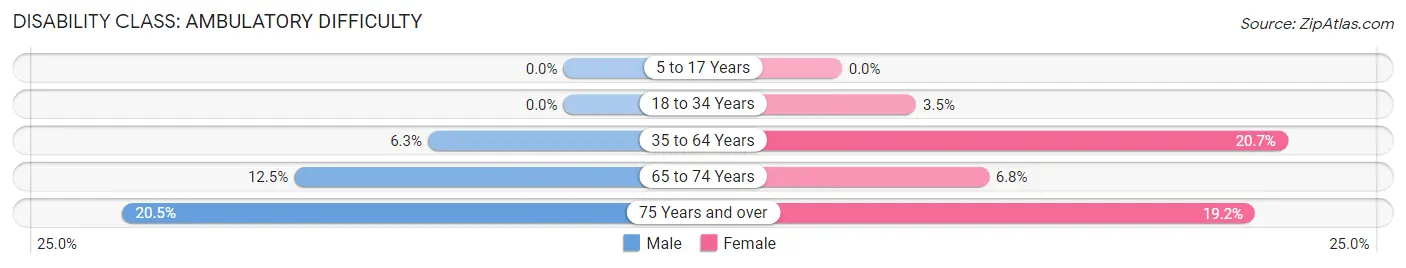
| Age Bracket | Male | Female |
| 5 to 17 Years | 0 (0.0%) | 0 (0.0%) |
| 18 to 34 Years | 0 (0.0%) | 4 (3.5%) |
| 35 to 64 Years | 11 (6.3%) | 24 (20.7%) |
| 65 to 74 Years | 6 (12.5%) | 3 (6.8%) |
| 75 Years and over | 9 (20.4%) | 23 (19.2%) |
Disability Class: Self-Care Difficulty
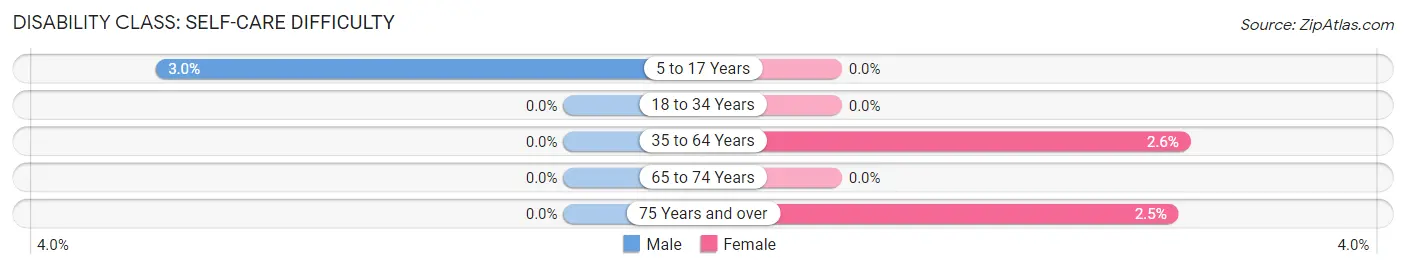
| Age Bracket | Male | Female |
| 5 to 17 Years | 3 (3.0%) | 0 (0.0%) |
| 18 to 34 Years | 0 (0.0%) | 0 (0.0%) |
| 35 to 64 Years | 0 (0.0%) | 3 (2.6%) |
| 65 to 74 Years | 0 (0.0%) | 0 (0.0%) |
| 75 Years and over | 0 (0.0%) | 3 (2.5%) |
Technology Access in Paint borough
Computing Device Access in Paint borough
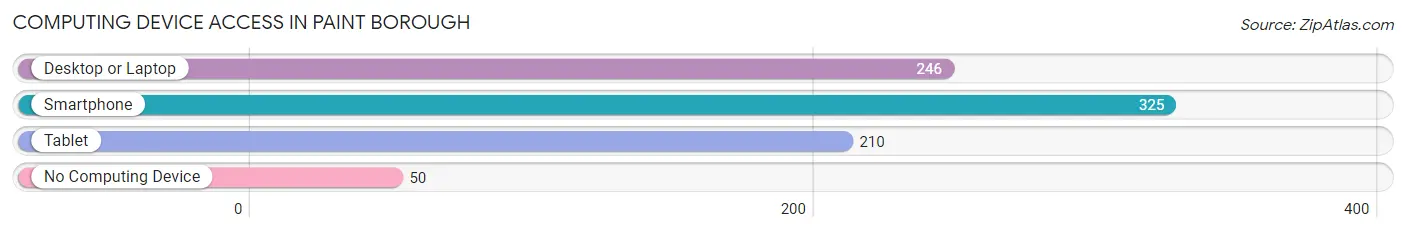
| Device Type | # Households | % Households |
| Desktop or Laptop | 246 | 60.2% |
| Smartphone | 325 | 79.5% |
| Tablet | 210 | 51.3% |
| No Computing Device | 50 | 12.2% |
| Total | 409 | 100.0% |
Internet Access in Paint borough
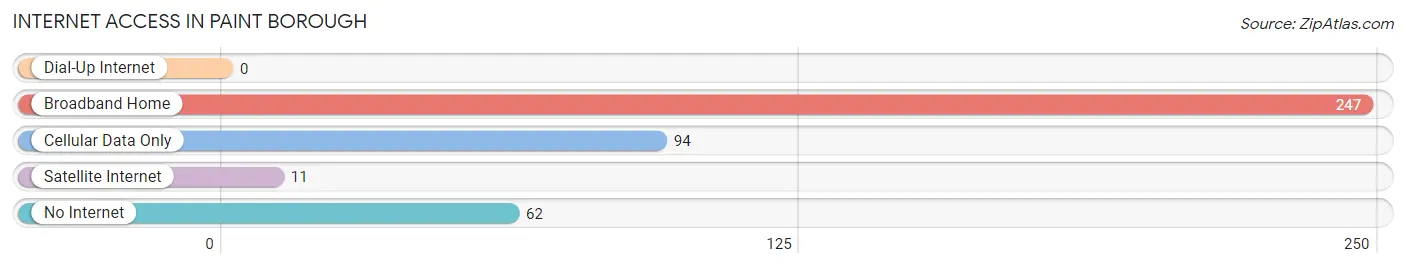
| Internet Type | # Households | % Households |
| Dial-Up Internet | 0 | 0.0% |
| Broadband Home | 247 | 60.4% |
| Cellular Data Only | 94 | 23.0% |
| Satellite Internet | 11 | 2.7% |
| No Internet | 62 | 15.2% |
| Total | 409 | 100.0% |
Paint borough Summary
Borough of Paint Pennsylvania
The Borough of Paint is a small borough located in the heart of Pennsylvania’s Allegheny Mountains. It is situated in the northern part of Huntingdon County, approximately 20 miles south of Altoona and 30 miles east of State College. The borough is home to a population of just over 1,000 people, making it one of the smallest boroughs in the state.
History
The area that is now the Borough of Paint was first settled in the late 1700s by a group of German immigrants. The town was originally known as “Paint Creek”, named after the creek that runs through the area. The town was officially incorporated as a borough in 1876.
In the late 1800s, the town was a bustling center of industry, with several coal mines, sawmills, and other businesses. The town was also home to a large number of churches, including the First Presbyterian Church, which was founded in 1877.
The town’s economy began to decline in the early 1900s, as the coal industry began to decline and the sawmills closed. The town’s population also began to decline, as many of the town’s residents moved away in search of better economic opportunities.
Geography
The Borough of Paint is located in the northern part of Huntingdon County, in the Allegheny Mountains. The borough is situated on the banks of Paint Creek, which runs through the center of town. The borough is surrounded by several small towns, including Huntingdon, Shirleysburg, and Orbisonia.
The borough is located at an elevation of 1,400 feet, and the surrounding area is mostly forested. The borough is located approximately 20 miles south of Altoona and 30 miles east of State College.
Economy
The economy of the Borough of Paint is largely based on tourism and agriculture. The town is home to several small businesses, including a few restaurants, a grocery store, and a few small shops. The town is also home to a few small farms, which produce a variety of crops, including corn, soybeans, and hay.
The town is also home to a few small manufacturing businesses, which produce a variety of products, including furniture, clothing, and wood products.
Demographics
As of the 2010 census, the population of the Borough of Paint was 1,072. The population is largely white (97.2%), with a small percentage of African Americans (1.2%) and Hispanics (1.6%). The median household income is $37,500, and the median age is 43.
The town is home to a number of churches, including the First Presbyterian Church, which was founded in 1877. The town is also home to a few small schools, including a public elementary school and a private Christian school.
Conclusion
The Borough of Paint is a small borough located in the heart of Pennsylvania’s Allegheny Mountains. It is home to a population of just over 1,000 people, and the economy is largely based on tourism and agriculture. The town is home to a number of churches and schools, and the median household income is $37,500. The town is a quiet and peaceful place to live, and it is a great place to raise a family.
Common Questions
What is Per Capita Income in Paint borough?
Per Capita income in Paint borough is $26,154.
What is the Median Family Income in Paint borough?
Median Family Income in Paint borough is $53,583.
What is the Median Household income in Paint borough?
Median Household Income in Paint borough is $44,028.
What is Income or Wage Gap in Paint borough?
Income or Wage Gap in Paint borough is 12.8%.
Women in Paint borough earn 87.2 cents for every dollar earned by a man.
What is Inequality or Gini Index in Paint borough?
Inequality or Gini Index in Paint borough is 0.37.
What is the Total Population of Paint borough?
Total Population of Paint borough is 1,122.
What is the Total Male Population of Paint borough?
Total Male Population of Paint borough is 527.
What is the Total Female Population of Paint borough?
Total Female Population of Paint borough is 595.
What is the Ratio of Males per 100 Females in Paint borough?
There are 88.57 Males per 100 Females in Paint borough.
What is the Ratio of Females per 100 Males in Paint borough?
There are 112.90 Females per 100 Males in Paint borough.
What is the Median Population Age in Paint borough?
Median Population Age in Paint borough is 48.0 Years.
What is the Average Family Size in Paint borough
Average Family Size in Paint borough is 3.0 People.
What is the Average Household Size in Paint borough
Average Household Size in Paint borough is 2.5 People.
How Large is the Labor Force in Paint borough?
There are 447 People in the Labor Forcein in Paint borough.
What is the Percentage of People in the Labor Force in Paint borough?
49.6% of People are in the Labor Force in Paint borough.
What is the Unemployment Rate in Paint borough?
Unemployment Rate in Paint borough is 11.0%.