New Hope borough, PA Map & Demographics
New Hope borough Overview
$113,683
PER CAPITA INCOME
$218,750
AVG FAMILY INCOME
$117,143
AVG HOUSEHOLD INCOME
65.9%
WAGE / INCOME GAP [ % ]
34.1¢/ $1
WAGE / INCOME GAP [ $ ]
0.56
INEQUALITY / GINI INDEX
2,624
TOTAL POPULATION
1,386
MALE POPULATION
1,238
FEMALE POPULATION
111.95
MALES / 100 FEMALES
89.32
FEMALES / 100 MALES
56.8
MEDIAN AGE
3.0
AVG FAMILY SIZE
1.9
AVG HOUSEHOLD SIZE
1,395
LABOR FORCE [ PEOPLE ]
58.6%
PERCENT IN LABOR FORCE
8.5%
UNEMPLOYMENT RATE
Income in New Hope borough
Income Overview in New Hope borough
Per Capita Income in New Hope borough is $113,683, while median incomes of families and households are $218,750 and $117,143 respectively.
| Characteristic | Number | Measure |
| Per Capita Income | 2,624 | $113,683 |
| Median Family Income | 598 | $218,750 |
| Mean Family Income | 598 | $336,971 |
| Median Household Income | 1,356 | $117,143 |
| Mean Household Income | 1,356 | $213,968 |
| Income Deficit | 598 | $0 |
| Wage / Income Gap (%) | 2,624 | 65.86% |
| Wage / Income Gap ($) | 2,624 | 34.14¢ per $1 |
| Gini / Inequality Index | 2,624 | 0.56 |
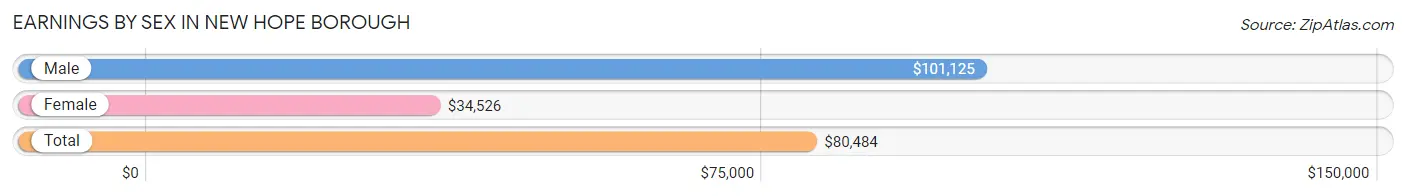
Earnings by Sex in New Hope borough
Average Earnings in New Hope borough are $80,484, $101,125 for men and $34,526 for women, a difference of 65.9%.
| Sex | Number | Average Earnings |
| Male | 861 (61.5%) | $101,125 |
| Female | 539 (38.5%) | $34,526 |
| Total | 1,400 (100.0%) | $80,484 |
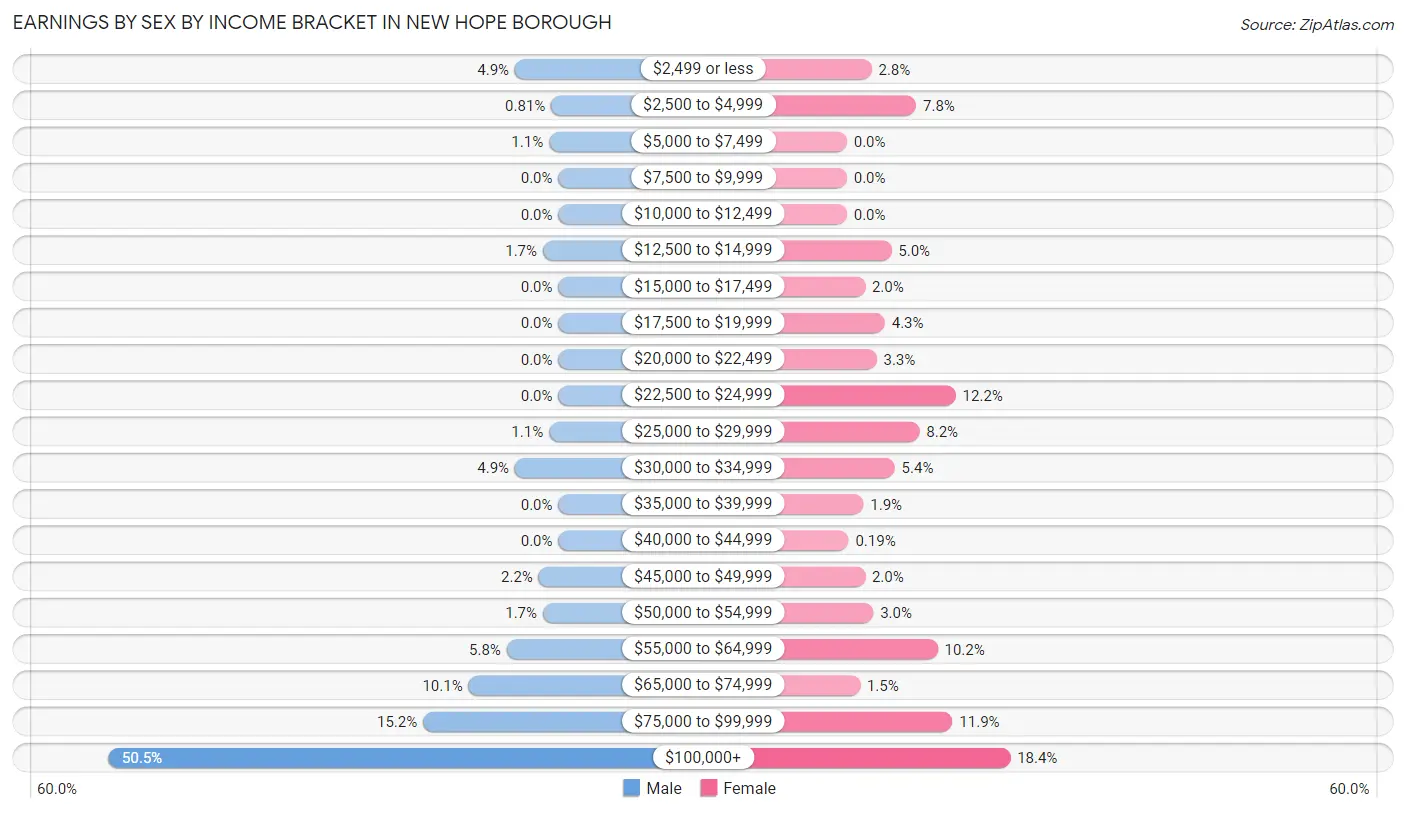
Earnings by Sex by Income Bracket in New Hope borough
The most common earnings brackets in New Hope borough are $100,000+ for men (435 | 50.5%) and $100,000+ for women (99 | 18.4%).
| Income | Male | Female |
| $2,499 or less | 42 (4.9%) | 15 (2.8%) |
| $2,500 to $4,999 | 7 (0.8%) | 42 (7.8%) |
| $5,000 to $7,499 | 9 (1.1%) | 0 (0.0%) |
| $7,500 to $9,999 | 0 (0.0%) | 0 (0.0%) |
| $10,000 to $12,499 | 0 (0.0%) | 0 (0.0%) |
| $12,500 to $14,999 | 15 (1.7%) | 27 (5.0%) |
| $15,000 to $17,499 | 0 (0.0%) | 11 (2.0%) |
| $17,500 to $19,999 | 0 (0.0%) | 23 (4.3%) |
| $20,000 to $22,499 | 0 (0.0%) | 18 (3.3%) |
| $22,500 to $24,999 | 0 (0.0%) | 66 (12.2%) |
| $25,000 to $29,999 | 9 (1.1%) | 44 (8.2%) |
| $30,000 to $34,999 | 42 (4.9%) | 29 (5.4%) |
| $35,000 to $39,999 | 0 (0.0%) | 10 (1.9%) |
| $40,000 to $44,999 | 0 (0.0%) | 1 (0.2%) |
| $45,000 to $49,999 | 19 (2.2%) | 11 (2.0%) |
| $50,000 to $54,999 | 15 (1.7%) | 16 (3.0%) |
| $55,000 to $64,999 | 50 (5.8%) | 55 (10.2%) |
| $65,000 to $74,999 | 87 (10.1%) | 8 (1.5%) |
| $75,000 to $99,999 | 131 (15.2%) | 64 (11.9%) |
| $100,000+ | 435 (50.5%) | 99 (18.4%) |
| Total | 861 (100.0%) | 539 (100.0%) |
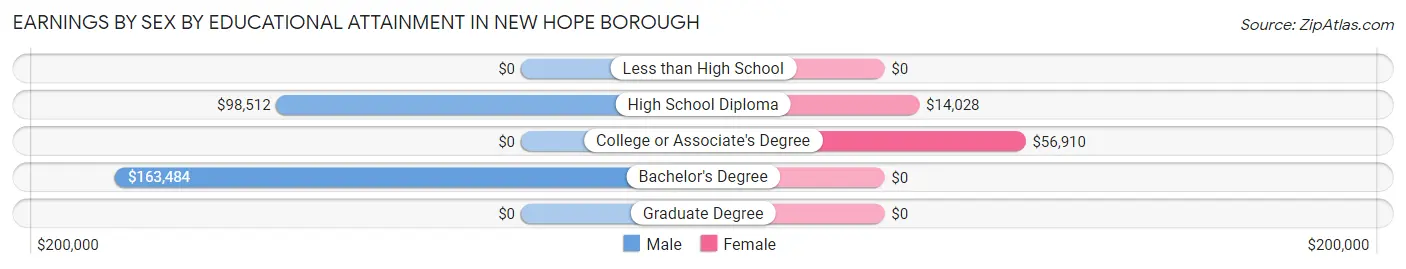
Earnings by Sex by Educational Attainment in New Hope borough
Average earnings in New Hope borough are $116,563 for men and $48,295 for women, a difference of 58.6%. Men with an educational attainment of bachelor's degree enjoy the highest average annual earnings of $163,484, while those with high school diploma education earn the least with $98,512. Women with an educational attainment of college or associate's degree earn the most with the average annual earnings of $56,910, while those with high school diploma education have the smallest earnings of $14,028.
| Educational Attainment | Male Income | Female Income |
| Less than High School | - | - |
| High School Diploma | $98,512 | $14,028 |
| College or Associate's Degree | - | - |
| Bachelor's Degree | $163,484 | $0 |
| Graduate Degree | - | - |
| Total | $116,563 | $48,295 |
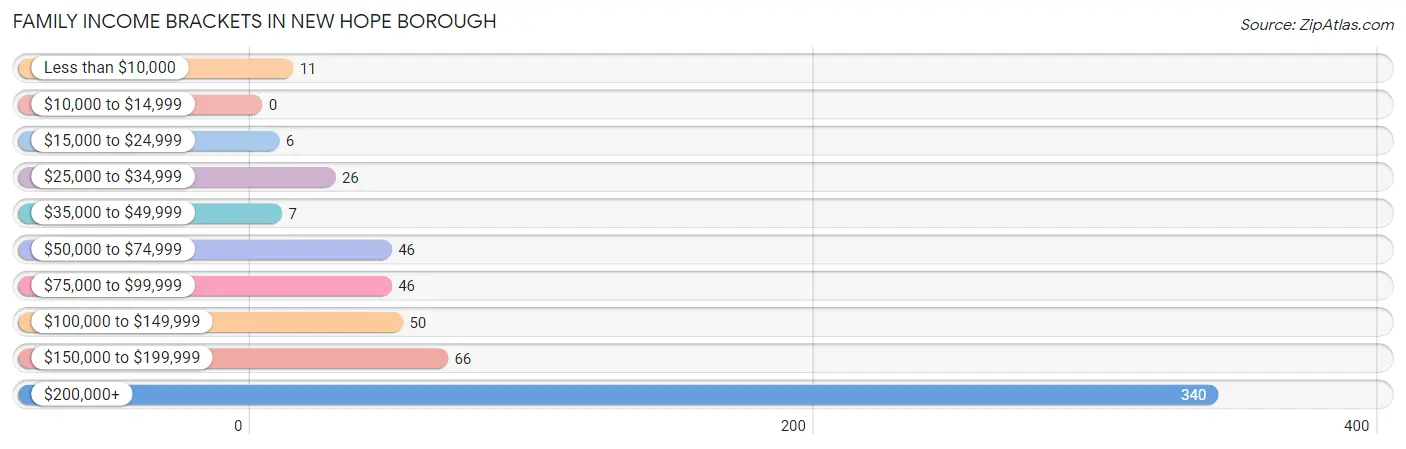
Family Income in New Hope borough
Family Income Brackets in New Hope borough
According to the New Hope borough family income data, there are 340 families falling into the $200,000+ income range, which is the most common income bracket and makes up 56.9% of all families.
| Income Bracket | # Families | % Families |
| Less than $10,000 | 11 | 1.8% |
| $10,000 to $14,999 | 0 | 0.0% |
| $15,000 to $24,999 | 6 | 1.0% |
| $25,000 to $34,999 | 26 | 4.3% |
| $35,000 to $49,999 | 7 | 1.2% |
| $50,000 to $74,999 | 46 | 7.7% |
| $75,000 to $99,999 | 46 | 7.7% |
| $100,000 to $149,999 | 50 | 8.4% |
| $150,000 to $199,999 | 66 | 11.0% |
| $200,000+ | 340 | 56.9% |
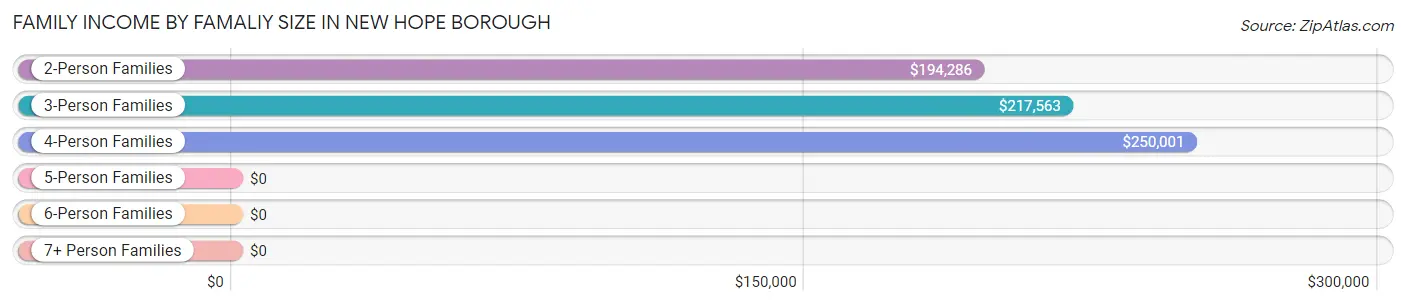
Family Income by Famaliy Size in New Hope borough
4-person families (77 | 12.9%) account for the highest median family income in New Hope borough with $250,001 per family, while 2-person families (322 | 53.8%) have the highest median income of $97,143 per family member.
| Income Bracket | # Families | Median Income |
| 2-Person Families | 322 (53.8%) | $194,286 |
| 3-Person Families | 147 (24.6%) | $217,563 |
| 4-Person Families | 77 (12.9%) | $250,001 |
| 5-Person Families | 32 (5.3%) | $0 |
| 6-Person Families | 0 (0.0%) | $0 |
| 7+ Person Families | 20 (3.3%) | $0 |
| Total | 598 (100.0%) | $218,750 |
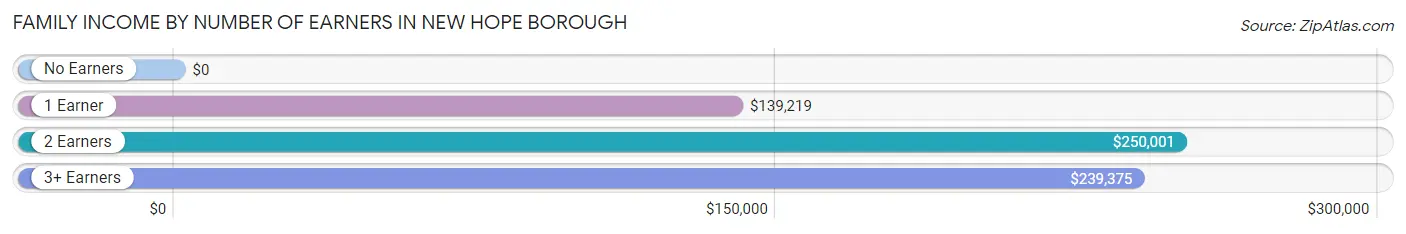
Family Income by Number of Earners in New Hope borough
| Number of Earners | # Families | Median Income |
| No Earners | 88 (14.7%) | $0 |
| 1 Earner | 165 (27.6%) | $139,219 |
| 2 Earners | 304 (50.8%) | $250,001 |
| 3+ Earners | 41 (6.9%) | $239,375 |
| Total | 598 (100.0%) | $218,750 |
Household Income in New Hope borough
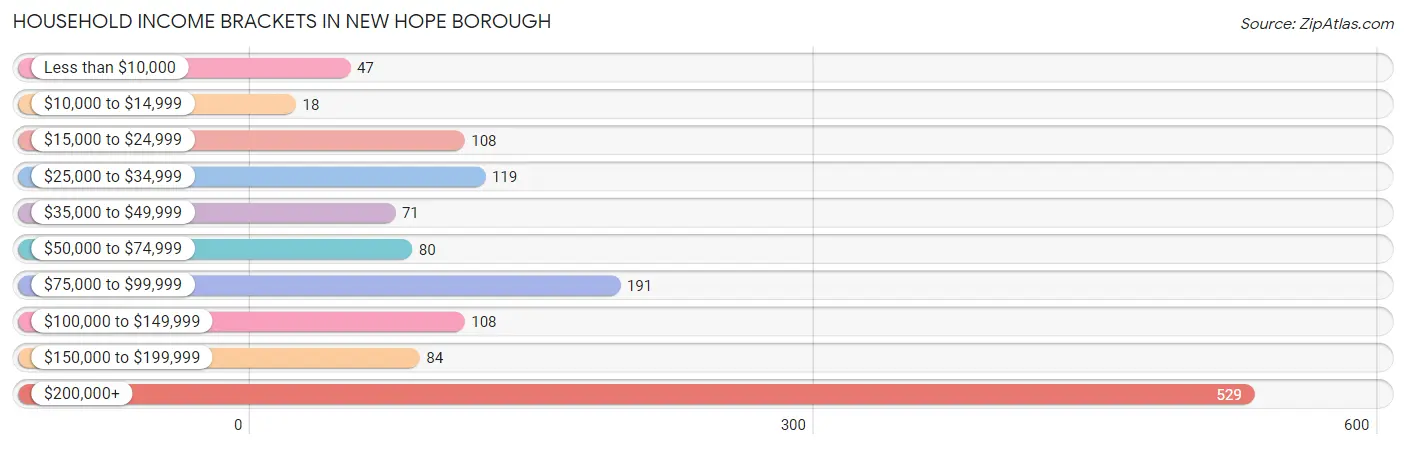
Household Income Brackets in New Hope borough
With 529 households falling in the category, the $200,000+ income range is the most frequent in New Hope borough, accounting for 39.0% of all households. In contrast, only 18 households (1.3%) fall into the $10,000 to $14,999 income bracket, making it the least populous group.
| Income Bracket | # Households | % Households |
| Less than $10,000 | 47 | 3.5% |
| $10,000 to $14,999 | 18 | 1.3% |
| $15,000 to $24,999 | 108 | 8.0% |
| $25,000 to $34,999 | 119 | 8.8% |
| $35,000 to $49,999 | 71 | 5.2% |
| $50,000 to $74,999 | 80 | 5.9% |
| $75,000 to $99,999 | 191 | 14.1% |
| $100,000 to $149,999 | 108 | 8.0% |
| $150,000 to $199,999 | 84 | 6.2% |
| $200,000+ | 529 | 39.0% |
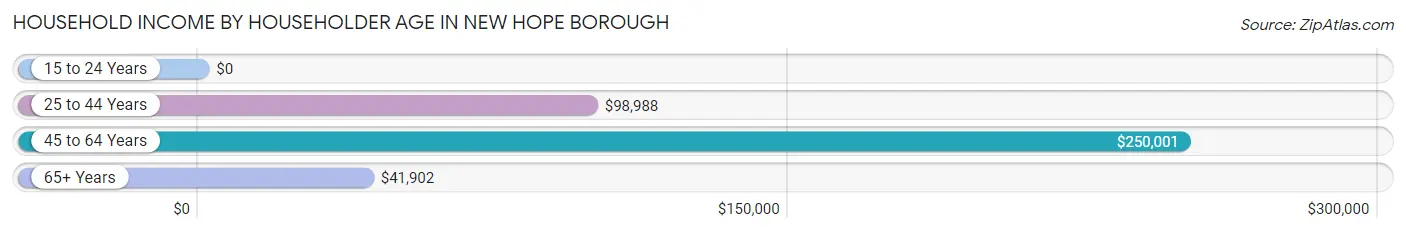
Household Income by Householder Age in New Hope borough
The median household income in New Hope borough is $117,143, with the highest median household income of $250,001 found in the 45 to 64 years age bracket for the primary householder. A total of 624 households (46.0%) fall into this category.
| Income Bracket | # Households | Median Income |
| 15 to 24 Years | 0 (0.0%) | $0 |
| 25 to 44 Years | 259 (19.1%) | $98,988 |
| 45 to 64 Years | 624 (46.0%) | $250,001 |
| 65+ Years | 473 (34.9%) | $41,902 |
| Total | 1,356 (100.0%) | $117,143 |
Poverty in New Hope borough
Income Below Poverty by Sex and Age in New Hope borough
With 3.5% poverty level for males and 4.5% for females among the residents of New Hope borough, 35 to 44 year old males and 55 to 64 year old females are the most vulnerable to poverty, with 23 males (17.8%) and 41 females (13.8%) in their respective age groups living below the poverty level.
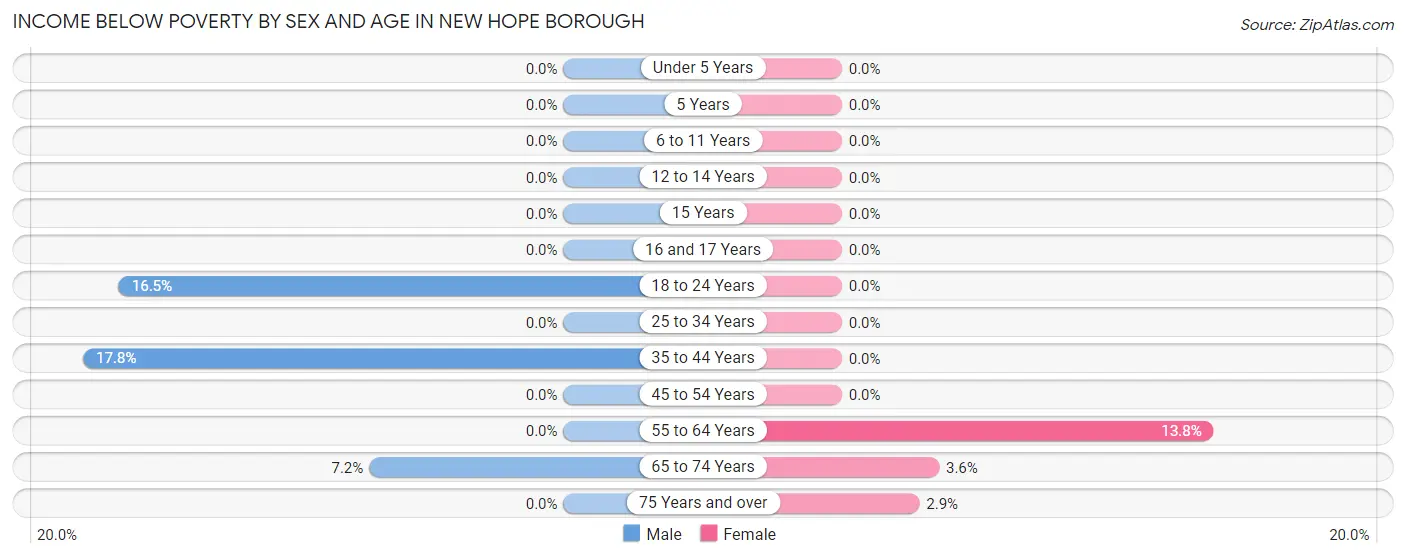
| Age Bracket | Male | Female |
| Under 5 Years | 0 (0.0%) | 0 (0.0%) |
| 5 Years | 0 (0.0%) | 0 (0.0%) |
| 6 to 11 Years | 0 (0.0%) | 0 (0.0%) |
| 12 to 14 Years | 0 (0.0%) | 0 (0.0%) |
| 15 Years | 0 (0.0%) | 0 (0.0%) |
| 16 and 17 Years | 0 (0.0%) | 0 (0.0%) |
| 18 to 24 Years | 17 (16.5%) | 0 (0.0%) |
| 25 to 34 Years | 0 (0.0%) | 0 (0.0%) |
| 35 to 44 Years | 23 (17.8%) | 0 (0.0%) |
| 45 to 54 Years | 0 (0.0%) | 0 (0.0%) |
| 55 to 64 Years | 0 (0.0%) | 41 (13.8%) |
| 65 to 74 Years | 8 (7.2%) | 6 (3.6%) |
| 75 Years and over | 0 (0.0%) | 9 (2.9%) |
| Total | 48 (3.5%) | 56 (4.5%) |
Income Above Poverty by Sex and Age in New Hope borough
According to the poverty statistics in New Hope borough, males aged under 5 years and females aged under 5 years are the age groups that are most secure financially, with 100.0% of males and 100.0% of females in these age groups living above the poverty line.
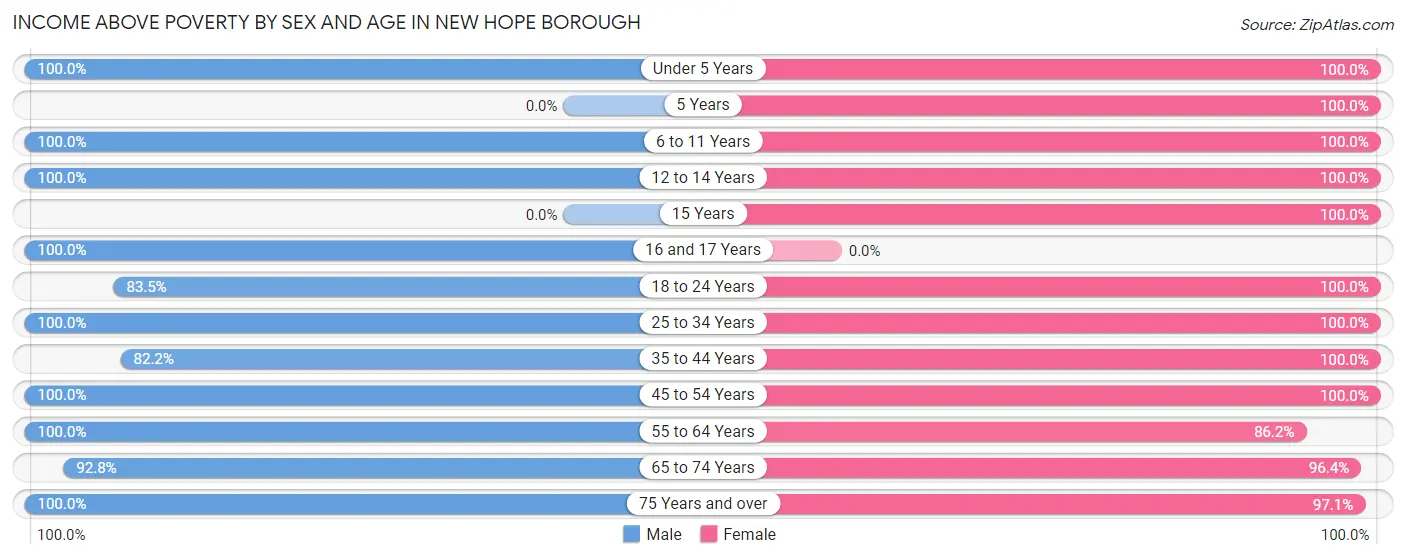
| Age Bracket | Male | Female |
| Under 5 Years | 53 (100.0%) | 20 (100.0%) |
| 5 Years | 0 (0.0%) | 19 (100.0%) |
| 6 to 11 Years | 19 (100.0%) | 59 (100.0%) |
| 12 to 14 Years | 53 (100.0%) | 10 (100.0%) |
| 15 Years | 0 (0.0%) | 11 (100.0%) |
| 16 and 17 Years | 68 (100.0%) | 0 (0.0%) |
| 18 to 24 Years | 86 (83.5%) | 40 (100.0%) |
| 25 to 34 Years | 108 (100.0%) | 78 (100.0%) |
| 35 to 44 Years | 106 (82.2%) | 102 (100.0%) |
| 45 to 54 Years | 187 (100.0%) | 124 (100.0%) |
| 55 to 64 Years | 449 (100.0%) | 256 (86.2%) |
| 65 to 74 Years | 103 (92.8%) | 160 (96.4%) |
| 75 Years and over | 106 (100.0%) | 303 (97.1%) |
| Total | 1,338 (96.5%) | 1,182 (95.5%) |
Income Below Poverty Among Married-Couple Families in New Hope borough
| Children | Above Poverty | Below Poverty |
| No Children | 418 (100.0%) | 0 (0.0%) |
| 1 or 2 Children | 130 (100.0%) | 0 (0.0%) |
| 3 or 4 Children | 0 (0.0%) | 0 (0.0%) |
| 5 or more Children | 20 (100.0%) | 0 (0.0%) |
| Total | 568 (100.0%) | 0 (0.0%) |
Income Below Poverty Among Single-Parent Households in New Hope borough
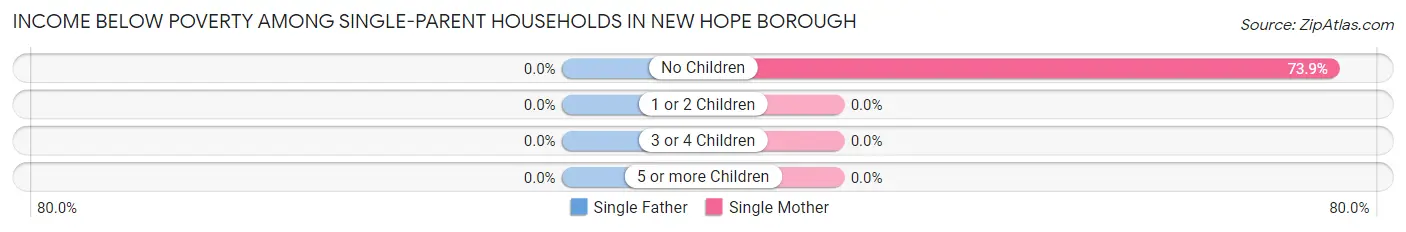
| Children | Single Father | Single Mother |
| No Children | 0 (0.0%) | 17 (73.9%) |
| 1 or 2 Children | 0 (0.0%) | 0 (0.0%) |
| 3 or 4 Children | 0 (0.0%) | 0 (0.0%) |
| 5 or more Children | 0 (0.0%) | 0 (0.0%) |
| Total | 0 (0.0%) | 17 (56.7%) |
Income Below Poverty Among Married-Couple vs Single-Parent Households in New Hope borough
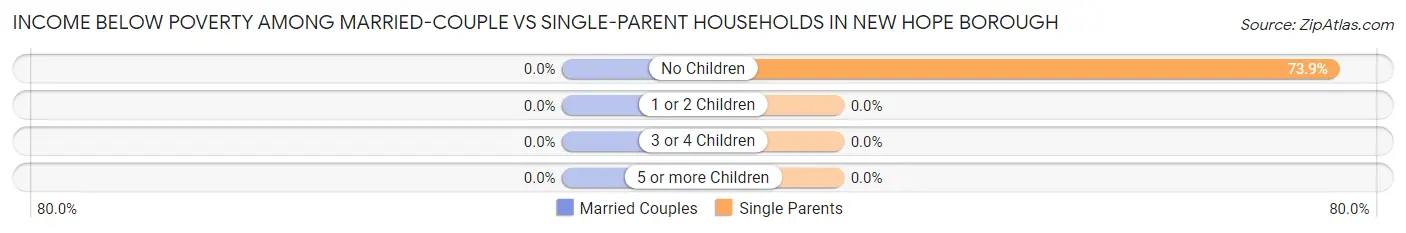
| Children | Married-Couple Families | Single-Parent Households |
| No Children | 0 (0.0%) | 17 (73.9%) |
| 1 or 2 Children | 0 (0.0%) | 0 (0.0%) |
| 3 or 4 Children | 0 (0.0%) | 0 (0.0%) |
| 5 or more Children | 0 (0.0%) | 0 (0.0%) |
| Total | 0 (0.0%) | 17 (56.7%) |
Race in New Hope borough
The most populous races in New Hope borough are White / Caucasian (2,387 | 91.0%), Hispanic or Latino (226 | 8.6%), and Two or more Races (154 | 5.9%).
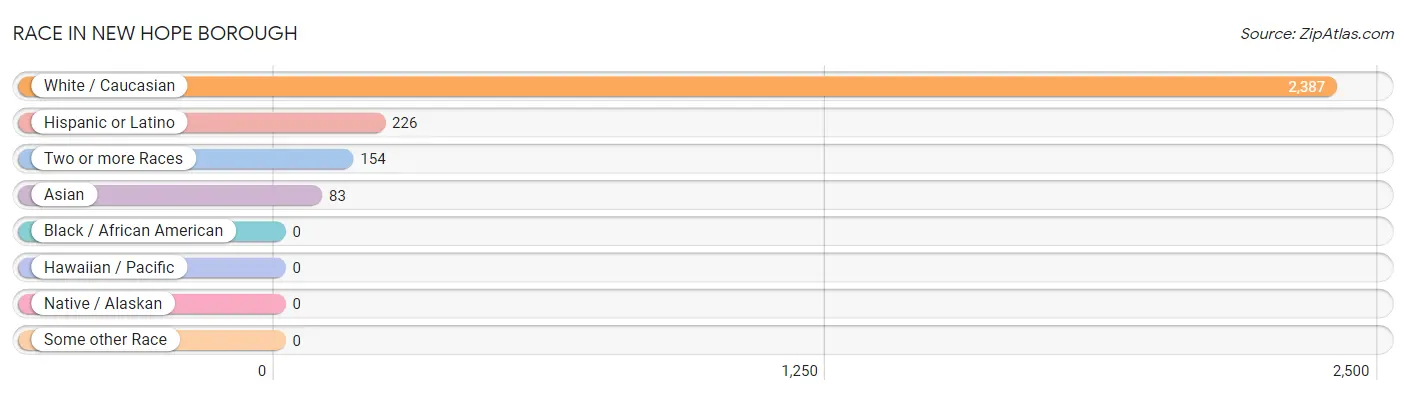
| Race | # Population | % Population |
| Asian | 83 | 3.2% |
| Black / African American | 0 | 0.0% |
| Hawaiian / Pacific | 0 | 0.0% |
| Hispanic or Latino | 226 | 8.6% |
| Native / Alaskan | 0 | 0.0% |
| White / Caucasian | 2,387 | 91.0% |
| Two or more Races | 154 | 5.9% |
| Some other Race | 0 | 0.0% |
| Total | 2,624 | 100.0% |
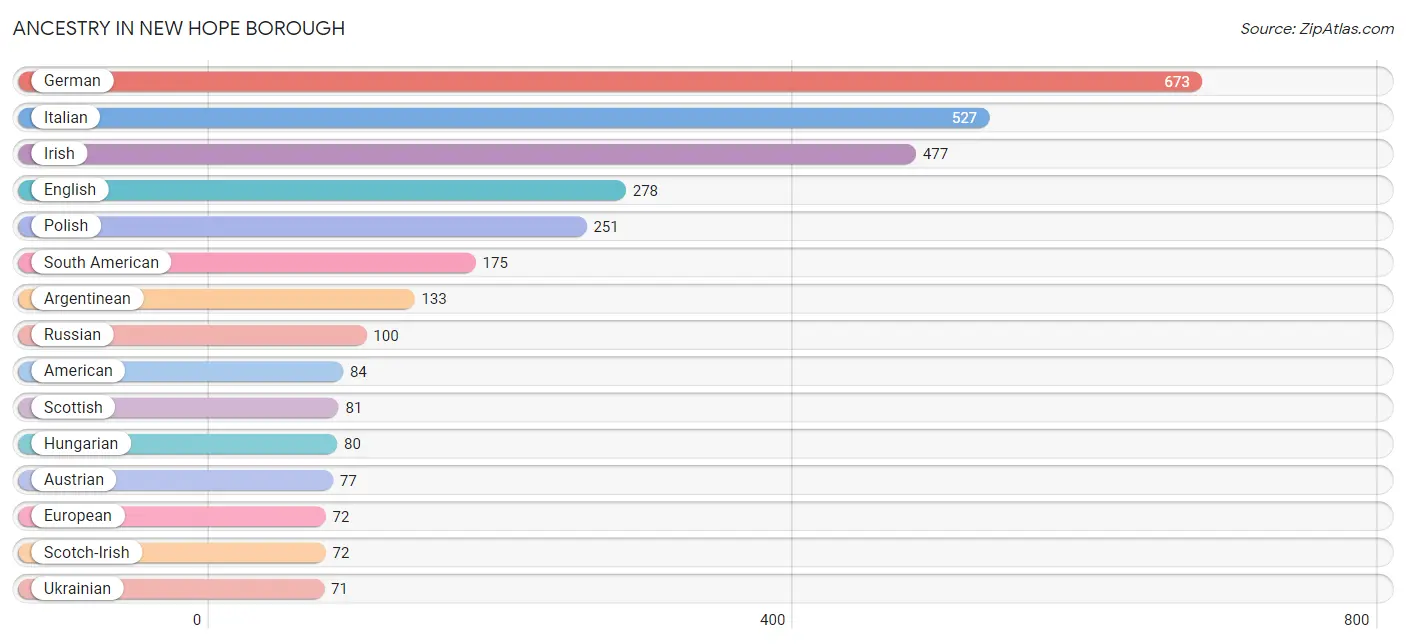
Ancestry in New Hope borough
The most populous ancestries reported in New Hope borough are German (673 | 25.7%), Italian (527 | 20.1%), Irish (477 | 18.2%), English (278 | 10.6%), and Polish (251 | 9.6%), together accounting for 84.1% of all New Hope borough residents.
| Ancestry | # Population | % Population |
| American | 84 | 3.2% |
| Arab | 1 | 0.0% |
| Argentinean | 133 | 5.1% |
| Austrian | 77 | 2.9% |
| British | 6 | 0.2% |
| Colombian | 15 | 0.6% |
| Croatian | 11 | 0.4% |
| Cuban | 25 | 0.9% |
| Czech | 9 | 0.3% |
| Danish | 7 | 0.3% |
| Dutch | 48 | 1.8% |
| Eastern European | 20 | 0.8% |
| English | 278 | 10.6% |
| Estonian | 36 | 1.4% |
| European | 72 | 2.7% |
| French | 61 | 2.3% |
| French Canadian | 13 | 0.5% |
| German | 673 | 25.7% |
| Greek | 47 | 1.8% |
| Hungarian | 80 | 3.0% |
| Indian (Asian) | 22 | 0.8% |
| Irish | 477 | 18.2% |
| Italian | 527 | 20.1% |
| Lithuanian | 1 | 0.0% |
| Mexican | 26 | 1.0% |
| Northern European | 22 | 0.8% |
| Peruvian | 27 | 1.0% |
| Polish | 251 | 9.6% |
| Romanian | 9 | 0.3% |
| Russian | 100 | 3.8% |
| Scandinavian | 10 | 0.4% |
| Scotch-Irish | 72 | 2.7% |
| Scottish | 81 | 3.1% |
| Slavic | 33 | 1.3% |
| South American | 175 | 6.7% |
| Sri Lankan | 37 | 1.4% |
| Swedish | 4 | 0.2% |
| Swiss | 20 | 0.8% |
| Syrian | 1 | 0.0% |
| Thai | 49 | 1.9% |
| Ukrainian | 71 | 2.7% |
| Welsh | 8 | 0.3% | View All 42 Rows |
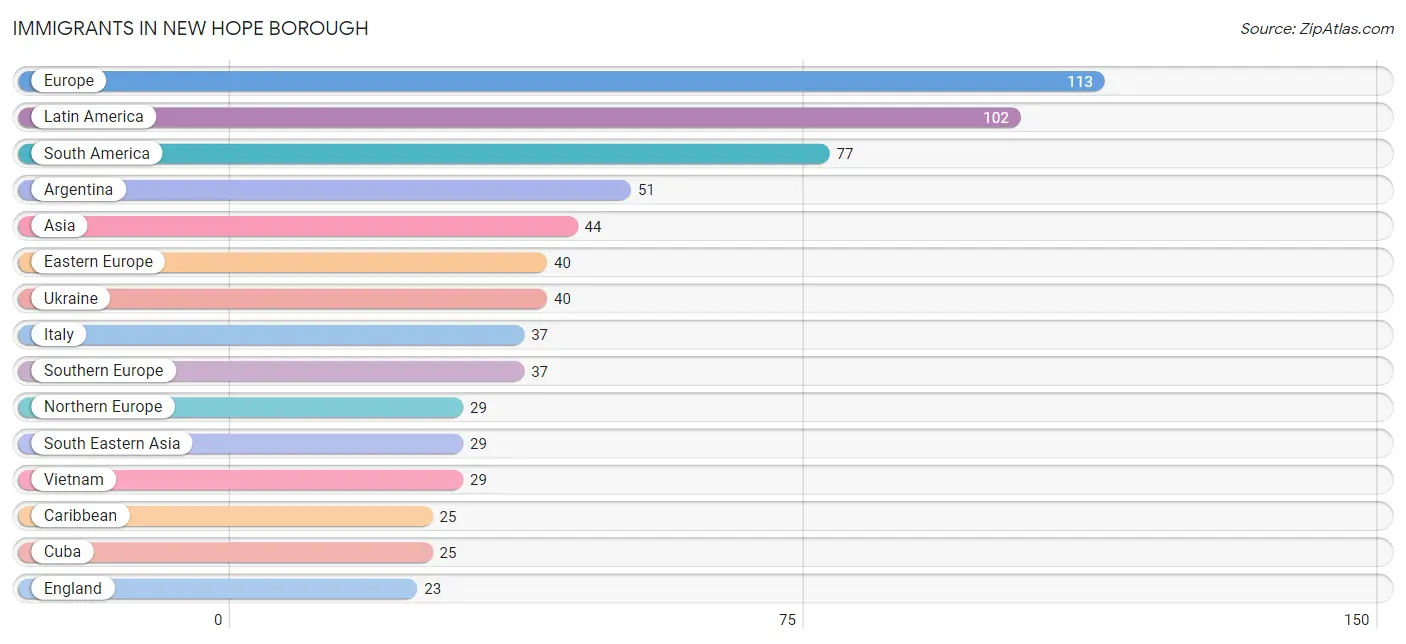
Immigrants in New Hope borough
The most numerous immigrant groups reported in New Hope borough came from Europe (113 | 4.3%), Latin America (102 | 3.9%), South America (77 | 2.9%), Argentina (51 | 1.9%), and Asia (44 | 1.7%), together accounting for 14.7% of all New Hope borough residents.
| Immigration Origin | # Population | % Population |
| Argentina | 51 | 1.9% |
| Asia | 44 | 1.7% |
| Caribbean | 25 | 0.9% |
| Colombia | 15 | 0.6% |
| Cuba | 25 | 0.9% |
| Eastern Europe | 40 | 1.5% |
| England | 23 | 0.9% |
| Europe | 113 | 4.3% |
| France | 7 | 0.3% |
| India | 15 | 0.6% |
| Italy | 37 | 1.4% |
| Latin America | 102 | 3.9% |
| Northern Europe | 29 | 1.1% |
| Peru | 11 | 0.4% |
| South America | 77 | 2.9% |
| South Central Asia | 15 | 0.6% |
| South Eastern Asia | 29 | 1.1% |
| Southern Europe | 37 | 1.4% |
| Ukraine | 40 | 1.5% |
| Vietnam | 29 | 1.1% |
| Western Europe | 7 | 0.3% | View All 21 Rows |
Sex and Age in New Hope borough
Sex and Age in New Hope borough
The most populous age groups in New Hope borough are 60 to 64 Years (300 | 21.6%) for men and 60 to 64 Years (171 | 13.8%) for women.
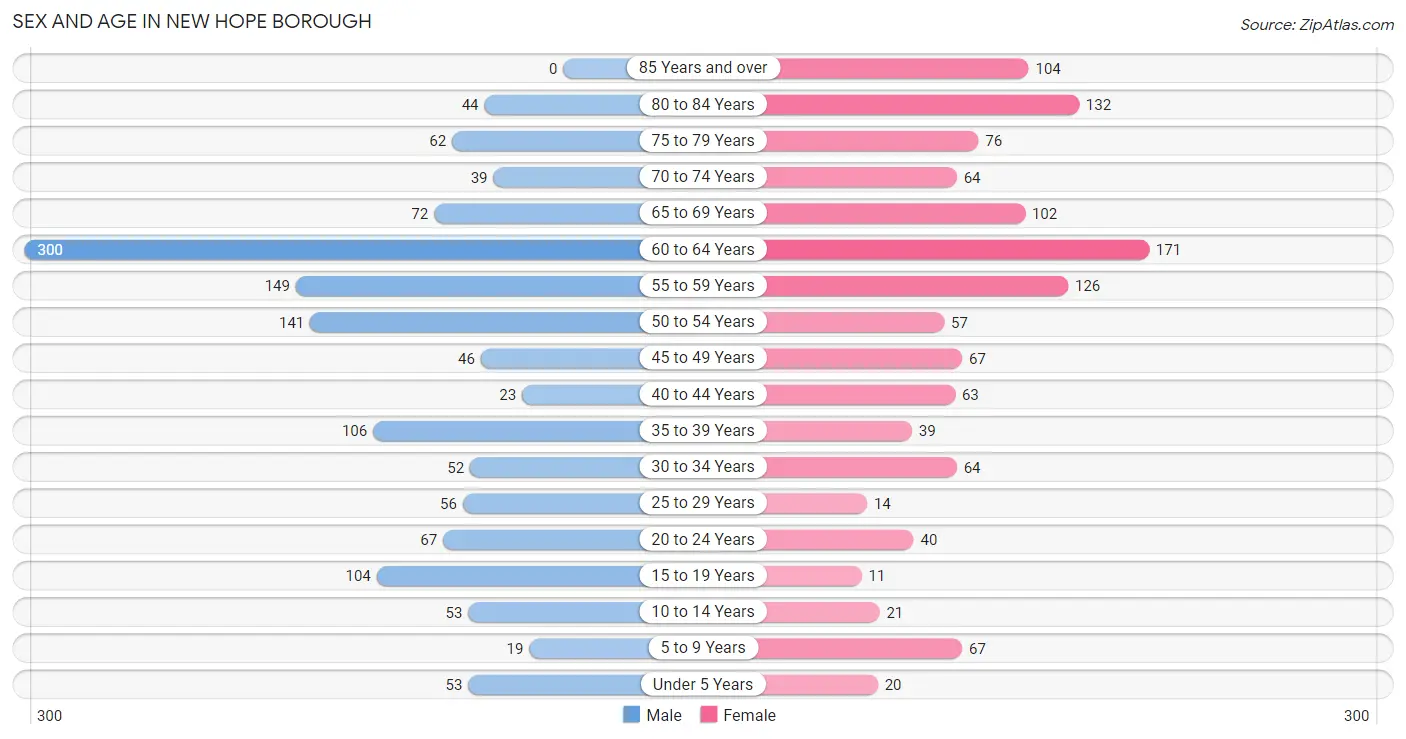
| Age Bracket | Male | Female |
| Under 5 Years | 53 (3.8%) | 20 (1.6%) |
| 5 to 9 Years | 19 (1.4%) | 67 (5.4%) |
| 10 to 14 Years | 53 (3.8%) | 21 (1.7%) |
| 15 to 19 Years | 104 (7.5%) | 11 (0.9%) |
| 20 to 24 Years | 67 (4.8%) | 40 (3.2%) |
| 25 to 29 Years | 56 (4.0%) | 14 (1.1%) |
| 30 to 34 Years | 52 (3.7%) | 64 (5.2%) |
| 35 to 39 Years | 106 (7.6%) | 39 (3.2%) |
| 40 to 44 Years | 23 (1.7%) | 63 (5.1%) |
| 45 to 49 Years | 46 (3.3%) | 67 (5.4%) |
| 50 to 54 Years | 141 (10.2%) | 57 (4.6%) |
| 55 to 59 Years | 149 (10.7%) | 126 (10.2%) |
| 60 to 64 Years | 300 (21.6%) | 171 (13.8%) |
| 65 to 69 Years | 72 (5.2%) | 102 (8.2%) |
| 70 to 74 Years | 39 (2.8%) | 64 (5.2%) |
| 75 to 79 Years | 62 (4.5%) | 76 (6.1%) |
| 80 to 84 Years | 44 (3.2%) | 132 (10.7%) |
| 85 Years and over | 0 (0.0%) | 104 (8.4%) |
| Total | 1,386 (100.0%) | 1,238 (100.0%) |
Families and Households in New Hope borough
Median Family Size in New Hope borough
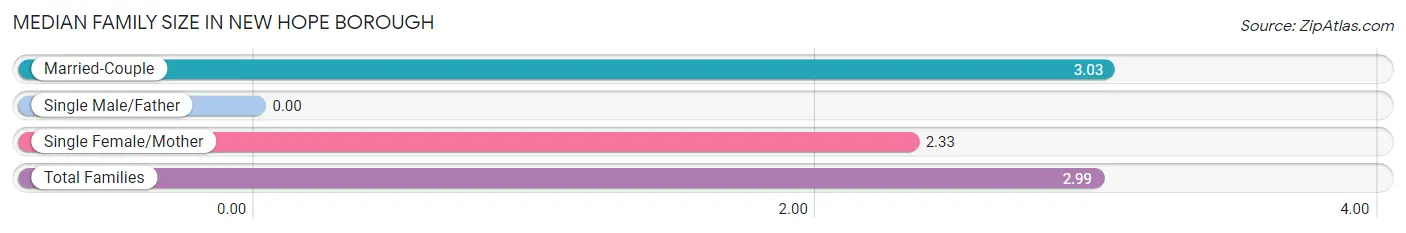
| Family Type | # Families | Family Size |
| Married-Couple | 568 (95.0%) | 3.03 |
| Single Male/Father | 0 (0.0%) | - |
| Single Female/Mother | 30 (5.0%) | 2.33 |
| Total Families | 598 (100.0%) | 2.99 |
Median Household Size in New Hope borough
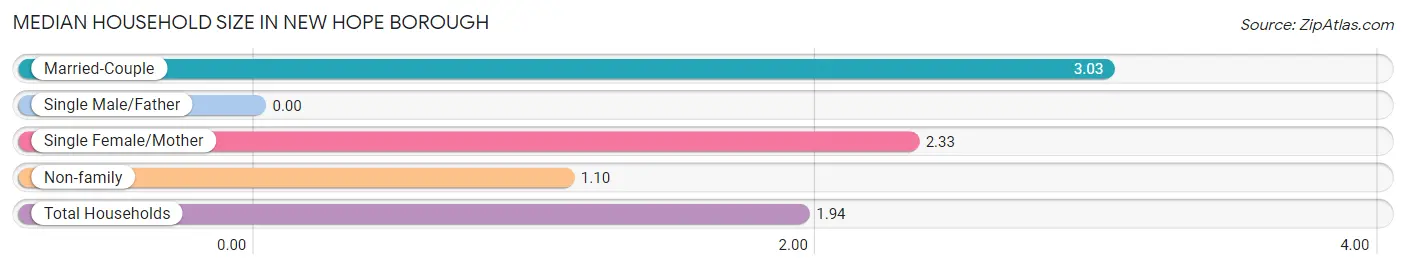
| Household Type | # Households | Household Size |
| Married-Couple | 568 (41.9%) | 3.03 |
| Single Male/Father | 0 (0.0%) | - |
| Single Female/Mother | 30 (2.2%) | 2.33 |
| Non-family | 758 (55.9%) | 1.10 |
| Total Households | 1,356 (100.0%) | 1.94 |
Household Size by Marriage Status in New Hope borough
Out of a total of 1,356 households in New Hope borough, 598 (44.1%) are family households, while 758 (55.9%) are nonfamily households. The most numerous type of family households are 2-person households, comprising 322, and the most common type of nonfamily households are 1-person households, comprising 695.
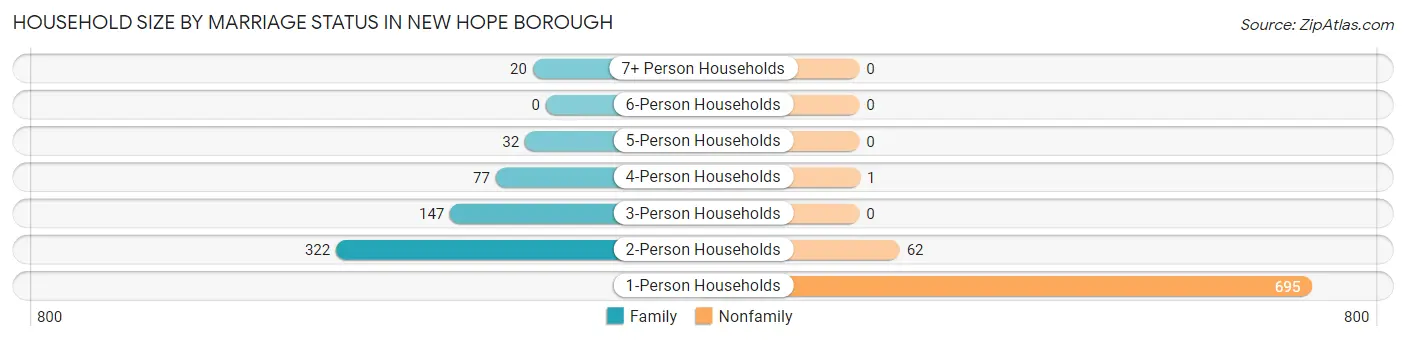
| Household Size | Family Households | Nonfamily Households |
| 1-Person Households | - | 695 (51.2%) |
| 2-Person Households | 322 (23.7%) | 62 (4.6%) |
| 3-Person Households | 147 (10.8%) | 0 (0.0%) |
| 4-Person Households | 77 (5.7%) | 1 (0.1%) |
| 5-Person Households | 32 (2.4%) | 0 (0.0%) |
| 6-Person Households | 0 (0.0%) | 0 (0.0%) |
| 7+ Person Households | 20 (1.5%) | 0 (0.0%) |
| Total | 598 (44.1%) | 758 (55.9%) |
Female Fertility in New Hope borough
Fertility by Age in New Hope borough
| Age Bracket | Women with Births | Births / 1,000 Women |
| 15 to 19 years | 0 (0.0%) | 0.0 |
| 20 to 34 years | 0 (0.0%) | 0.0 |
| 35 to 50 years | 0 (0.0%) | 0.0 |
| Total | 0 (0.0%) | 0.0 |
Fertility by Age by Marriage Status in New Hope borough
| Age Bracket | Married | Unmarried |
| 15 to 19 years | 0 (0.0%) | 0 (0.0%) |
| 20 to 34 years | 0 (0.0%) | 0 (0.0%) |
| 35 to 50 years | 0 (0.0%) | 0 (0.0%) |
| Total | 0 (0.0%) | 0 (0.0%) |
Fertility by Education in New Hope borough
| Educational Attainment | Women with Births | Births / 1,000 Women |
| Less than High School | 0 (0.0%) | 0.0 |
| High School Diploma | 0 (0.0%) | 0.0 |
| College or Associate's Degree | 0 (0.0%) | 0.0 |
| Bachelor's Degree | 0 (0.0%) | 0.0 |
| Graduate Degree | 0 (0.0%) | 0.0 |
| Total | 0 (0.0%) | 0.0 |
Fertility by Education by Marriage Status in New Hope borough
| Educational Attainment | Married | Unmarried |
| Less than High School | 0 (0.0%) | 0 (0.0%) |
| High School Diploma | 0 (0.0%) | 0 (0.0%) |
| College or Associate's Degree | 0 (0.0%) | 0 (0.0%) |
| Bachelor's Degree | 0 (0.0%) | 0 (0.0%) |
| Graduate Degree | 0 (0.0%) | 0 (0.0%) |
| Total | 0 (0.0%) | 0 (0.0%) |
Employment Characteristics in New Hope borough
Employment by Class of Employer in New Hope borough
Among the 1,265 employed individuals in New Hope borough, private company employees (779 | 61.6%), not-for-profit organizations (220 | 17.4%), and self-employed (incorporated) (117 | 9.2%) make up the most common classes of employment.

| Employer Class | # Employees | % Employees |
| Private Company Employees | 779 | 61.6% |
| Self-Employed (Incorporated) | 117 | 9.2% |
| Self-Employed (Not Incorporated) | 96 | 7.6% |
| Not-for-profit Organizations | 220 | 17.4% |
| Local Government Employees | 53 | 4.2% |
| State Government Employees | 0 | 0.0% |
| Federal Government Employees | 0 | 0.0% |
| Unpaid Family Workers | 0 | 0.0% |
| Total | 1,265 | 100.0% |
Employment Status by Age in New Hope borough
According to the labor force statistics for New Hope borough, out of the total population over 16 years of age (2,380), 58.6% or 1,395 individuals are in the labor force, with 8.5% or 119 of them unemployed. The age group with the highest labor force participation rate is 25 to 29 years, with 100.0% or 70 individuals in the labor force. Within the labor force, the 35 to 44 years age range has the highest percentage of unemployed individuals, with 31.9% or 66 of them being unemployed.
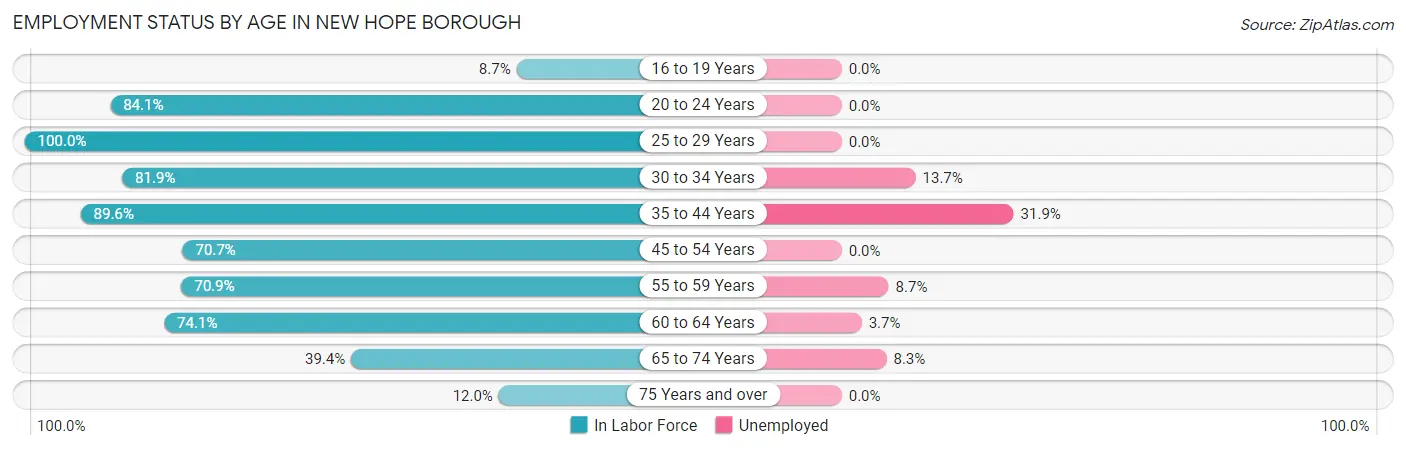
| Age Bracket | In Labor Force | Unemployed |
| 16 to 19 Years | 9 (8.7%) | 0 (0.0%) |
| 20 to 24 Years | 90 (84.1%) | 0 (0.0%) |
| 25 to 29 Years | 70 (100.0%) | 0 (0.0%) |
| 30 to 34 Years | 95 (81.9%) | 13 (13.7%) |
| 35 to 44 Years | 207 (89.6%) | 66 (31.9%) |
| 45 to 54 Years | 220 (70.7%) | 0 (0.0%) |
| 55 to 59 Years | 195 (70.9%) | 17 (8.7%) |
| 60 to 64 Years | 349 (74.1%) | 13 (3.7%) |
| 65 to 74 Years | 109 (39.4%) | 9 (8.3%) |
| 75 Years and over | 50 (12.0%) | 0 (0.0%) |
| Total | 1,395 (58.6%) | 119 (8.5%) |
Employment Status by Educational Attainment in New Hope borough
According to labor force statistics for New Hope borough, 77.1% of individuals (1,136) out of the total population between 25 and 64 years of age (1,474) are in the labor force, with 9.6% or 109 of them being unemployed. The group with the highest labor force participation rate are those with the educational attainment of bachelor's degree or higher, with 80.4% or 920 individuals in the labor force. Within the labor force, individuals with high school diploma education have the highest percentage of unemployment, with 26.1% or 23 of them being unemployed.
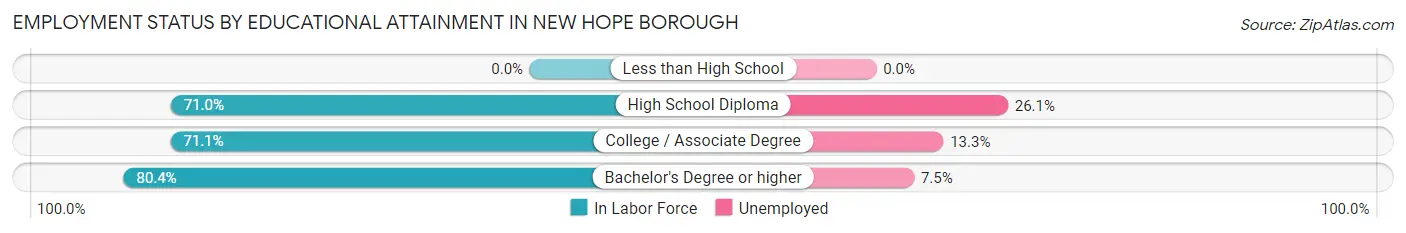
| Educational Attainment | In Labor Force | Unemployed |
| Less than High School | 0 (0.0%) | 0 (0.0%) |
| High School Diploma | 88 (71.0%) | 32 (26.1%) |
| College / Associate Degree | 128 (71.1%) | 24 (13.3%) |
| Bachelor's Degree or higher | 920 (80.4%) | 86 (7.5%) |
| Total | 1,136 (77.1%) | 142 (9.6%) |
Employment Occupations by Sex in New Hope borough
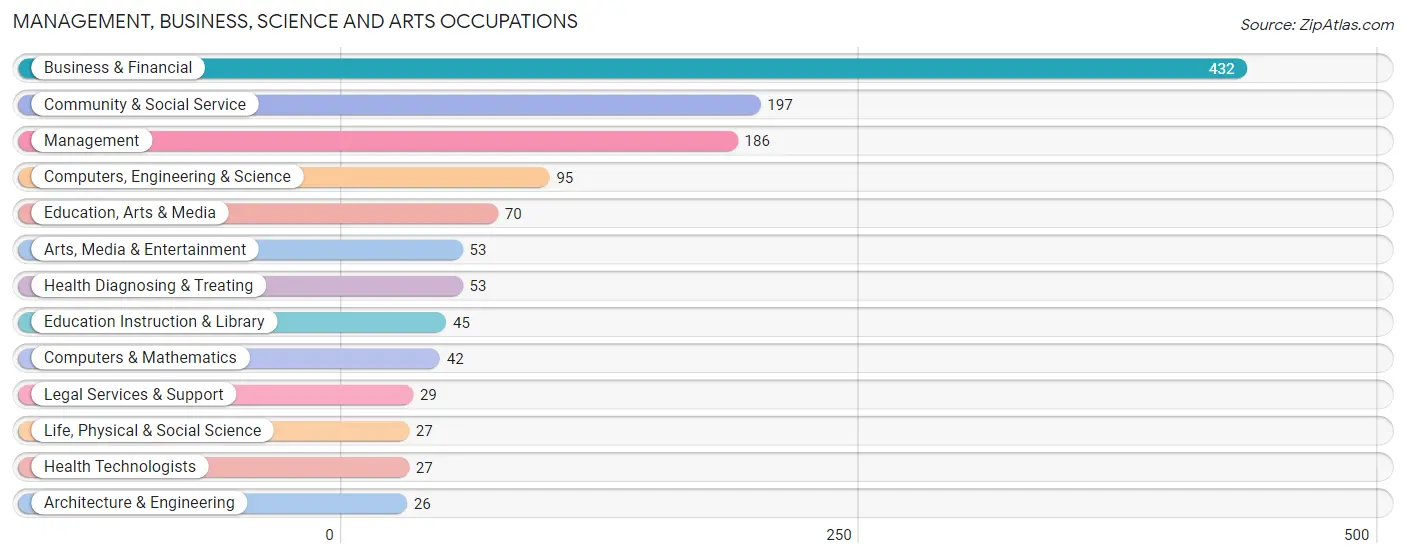
Management, Business, Science and Arts Occupations
The most common Management, Business, Science and Arts occupations in New Hope borough are Business & Financial (432 | 33.9%), Community & Social Service (197 | 15.4%), Management (186 | 14.6%), Computers, Engineering & Science (95 | 7.4%), and Education, Arts & Media (70 | 5.5%).
Management, Business, Science and Arts Occupations by Sex
Within the Management, Business, Science and Arts occupations in New Hope borough, the most male-oriented occupations are Computers & Mathematics (100.0%), Architecture & Engineering (100.0%), and Education, Arts & Media (100.0%), while the most female-oriented occupations are Arts, Media & Entertainment (86.8%), Health Technologists (66.7%), and Education Instruction & Library (62.2%).
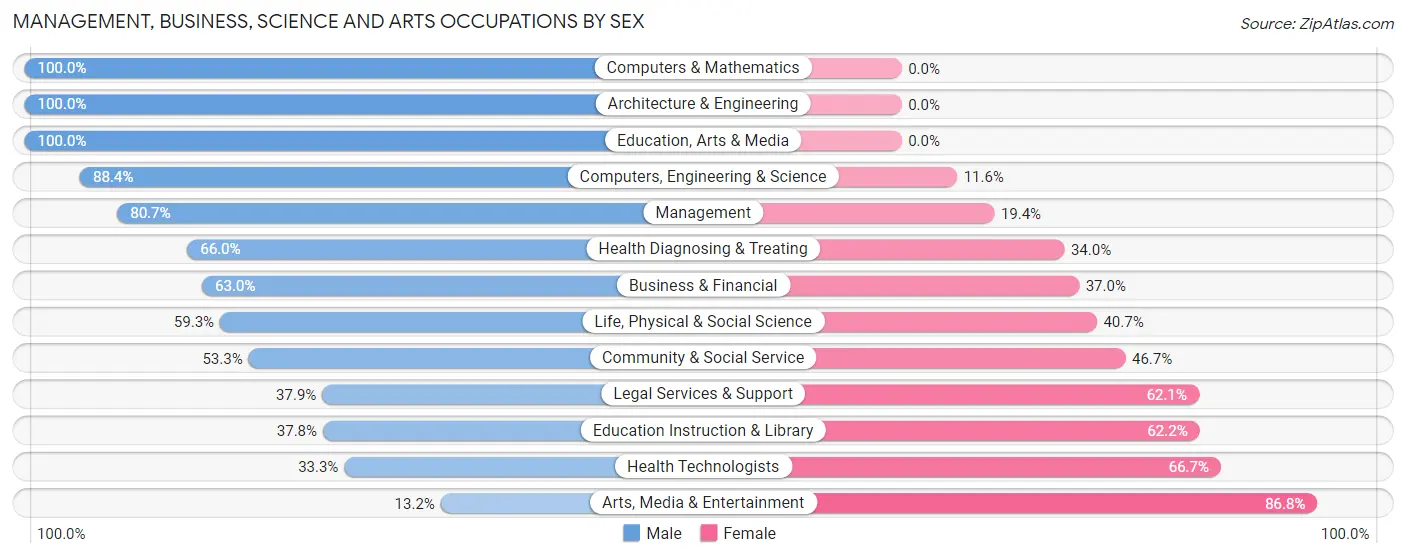
| Occupation | Male | Female |
| Management | 150 (80.6%) | 36 (19.4%) |
| Business & Financial | 272 (63.0%) | 160 (37.0%) |
| Computers, Engineering & Science | 84 (88.4%) | 11 (11.6%) |
| Computers & Mathematics | 42 (100.0%) | 0 (0.0%) |
| Architecture & Engineering | 26 (100.0%) | 0 (0.0%) |
| Life, Physical & Social Science | 16 (59.3%) | 11 (40.7%) |
| Community & Social Service | 105 (53.3%) | 92 (46.7%) |
| Education, Arts & Media | 70 (100.0%) | 0 (0.0%) |
| Legal Services & Support | 11 (37.9%) | 18 (62.1%) |
| Education Instruction & Library | 17 (37.8%) | 28 (62.2%) |
| Arts, Media & Entertainment | 7 (13.2%) | 46 (86.8%) |
| Health Diagnosing & Treating | 35 (66.0%) | 18 (34.0%) |
| Health Technologists | 9 (33.3%) | 18 (66.7%) |
| Total (Category) | 646 (67.1%) | 317 (32.9%) |
| Total (Overall) | 829 (65.0%) | 447 (35.0%) |
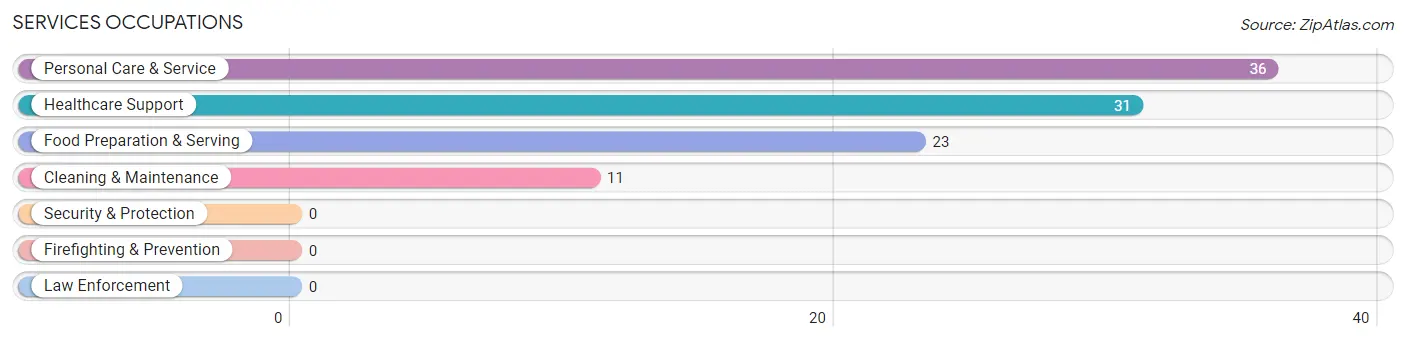
Services Occupations
The most common Services occupations in New Hope borough are Personal Care & Service (36 | 2.8%), Healthcare Support (31 | 2.4%), Food Preparation & Serving (23 | 1.8%), and Cleaning & Maintenance (11 | 0.9%).
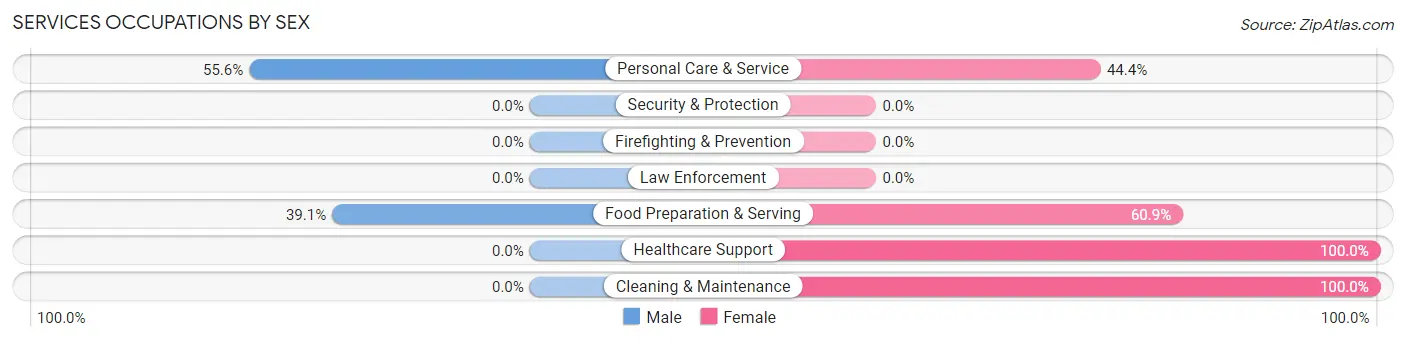
Services Occupations by Sex
Within the Services occupations in New Hope borough, the most male-oriented occupations are Personal Care & Service (55.6%), and Food Preparation & Serving (39.1%), while the most female-oriented occupations are Healthcare Support (100.0%), Cleaning & Maintenance (100.0%), and Food Preparation & Serving (60.9%).
| Occupation | Male | Female |
| Healthcare Support | 0 (0.0%) | 31 (100.0%) |
| Security & Protection | 0 (0.0%) | 0 (0.0%) |
| Firefighting & Prevention | 0 (0.0%) | 0 (0.0%) |
| Law Enforcement | 0 (0.0%) | 0 (0.0%) |
| Food Preparation & Serving | 9 (39.1%) | 14 (60.9%) |
| Cleaning & Maintenance | 0 (0.0%) | 11 (100.0%) |
| Personal Care & Service | 20 (55.6%) | 16 (44.4%) |
| Total (Category) | 29 (28.7%) | 72 (71.3%) |
| Total (Overall) | 829 (65.0%) | 447 (35.0%) |
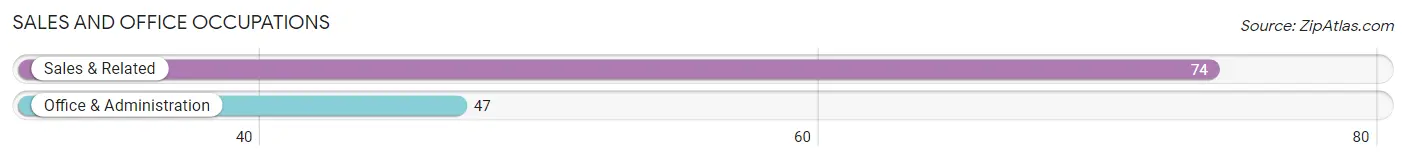
Sales and Office Occupations
The most common Sales and Office occupations in New Hope borough are Sales & Related (74 | 5.8%), and Office & Administration (47 | 3.7%).
Sales and Office Occupations by Sex

| Occupation | Male | Female |
| Sales & Related | 63 (85.1%) | 11 (14.9%) |
| Office & Administration | 0 (0.0%) | 47 (100.0%) |
| Total (Category) | 63 (52.1%) | 58 (47.9%) |
| Total (Overall) | 829 (65.0%) | 447 (35.0%) |
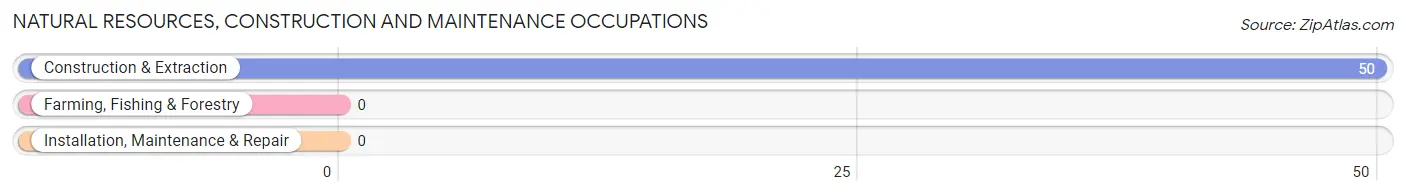
Natural Resources, Construction and Maintenance Occupations
The most common Natural Resources, Construction and Maintenance occupations in New Hope borough are , and Construction & Extraction (50 | 3.9%).
Natural Resources, Construction and Maintenance Occupations by Sex
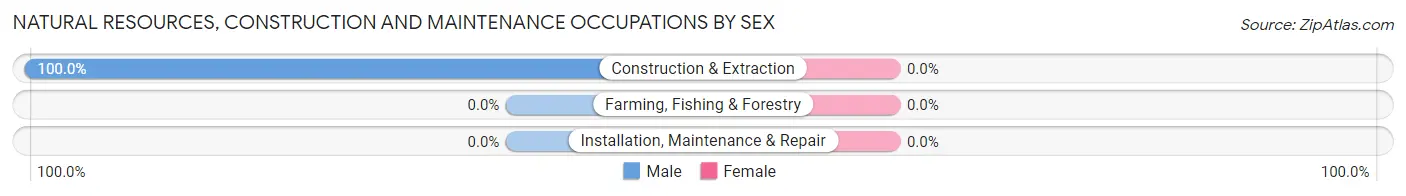
| Occupation | Male | Female |
| Farming, Fishing & Forestry | 0 (0.0%) | 0 (0.0%) |
| Construction & Extraction | 50 (100.0%) | 0 (0.0%) |
| Installation, Maintenance & Repair | 0 (0.0%) | 0 (0.0%) |
| Total (Category) | 50 (100.0%) | 0 (0.0%) |
| Total (Overall) | 829 (65.0%) | 447 (35.0%) |
Production, Transportation and Moving Occupations
The most common Production, Transportation and Moving occupations in New Hope borough are , and Transportation (41 | 3.2%).
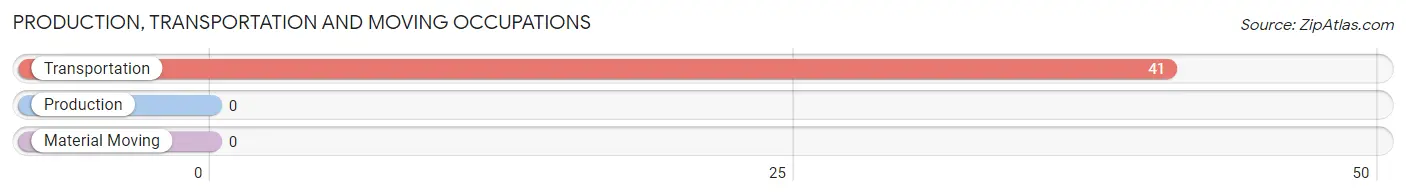
Production, Transportation and Moving Occupations by Sex
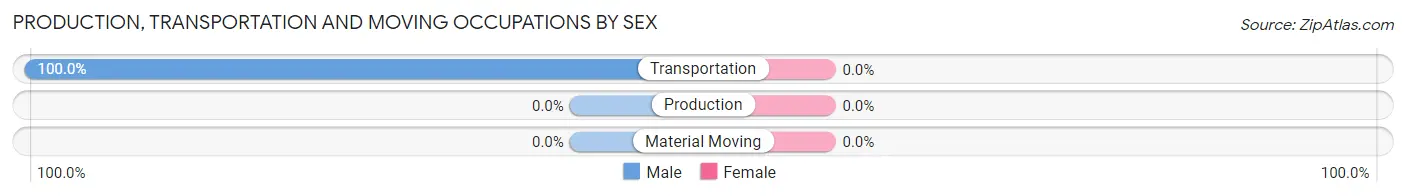
| Occupation | Male | Female |
| Production | 0 (0.0%) | 0 (0.0%) |
| Transportation | 41 (100.0%) | 0 (0.0%) |
| Material Moving | 0 (0.0%) | 0 (0.0%) |
| Total (Category) | 41 (100.0%) | 0 (0.0%) |
| Total (Overall) | 829 (65.0%) | 447 (35.0%) |
Employment Industries by Sex in New Hope borough
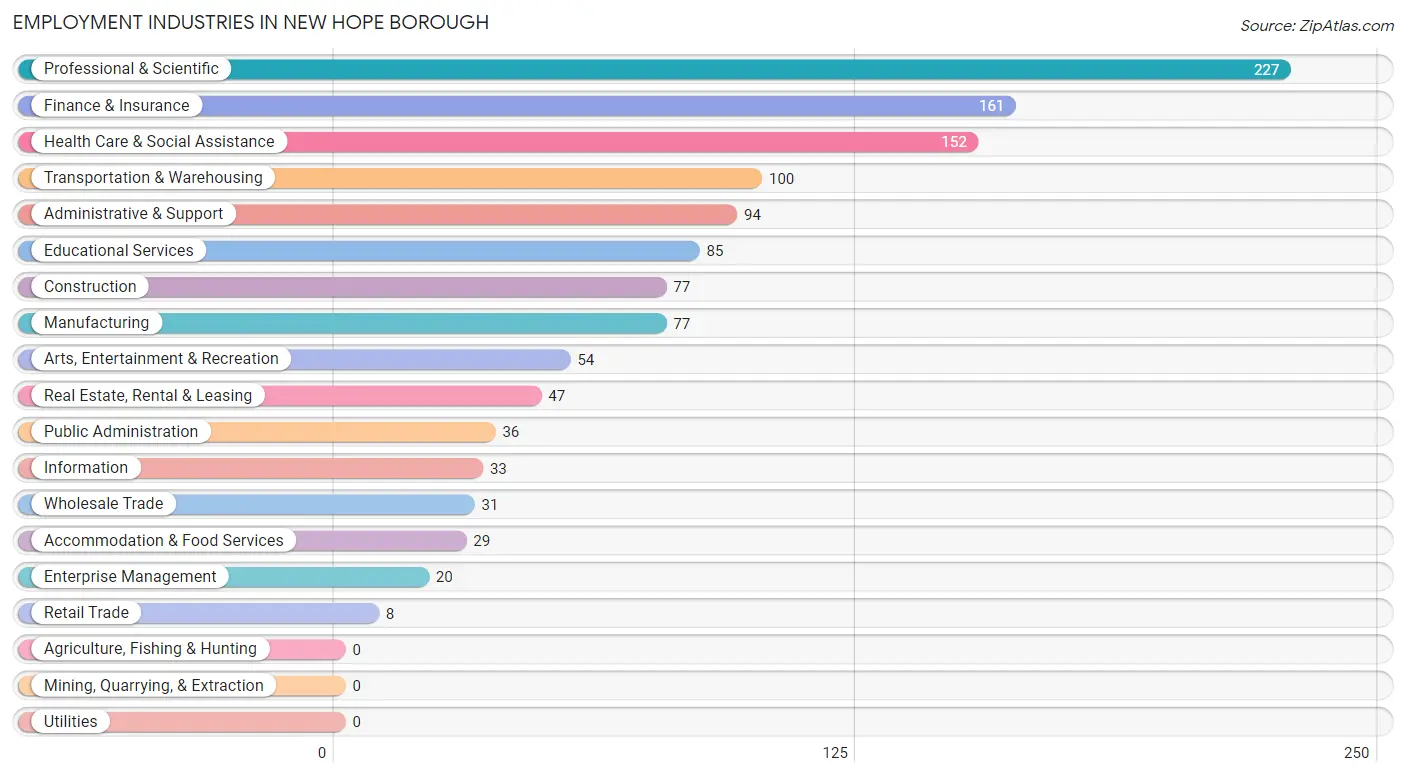
Employment Industries in New Hope borough
The major employment industries in New Hope borough include Professional & Scientific (227 | 17.8%), Finance & Insurance (161 | 12.6%), Health Care & Social Assistance (152 | 11.9%), Transportation & Warehousing (100 | 7.8%), and Administrative & Support (94 | 7.4%).
Employment Industries by Sex in New Hope borough
The New Hope borough industries that see more men than women are Construction (100.0%), Wholesale Trade (100.0%), and Real Estate, Rental & Leasing (100.0%), whereas the industries that tend to have a higher number of women are Retail Trade (100.0%), Enterprise Management (100.0%), and Public Administration (100.0%).
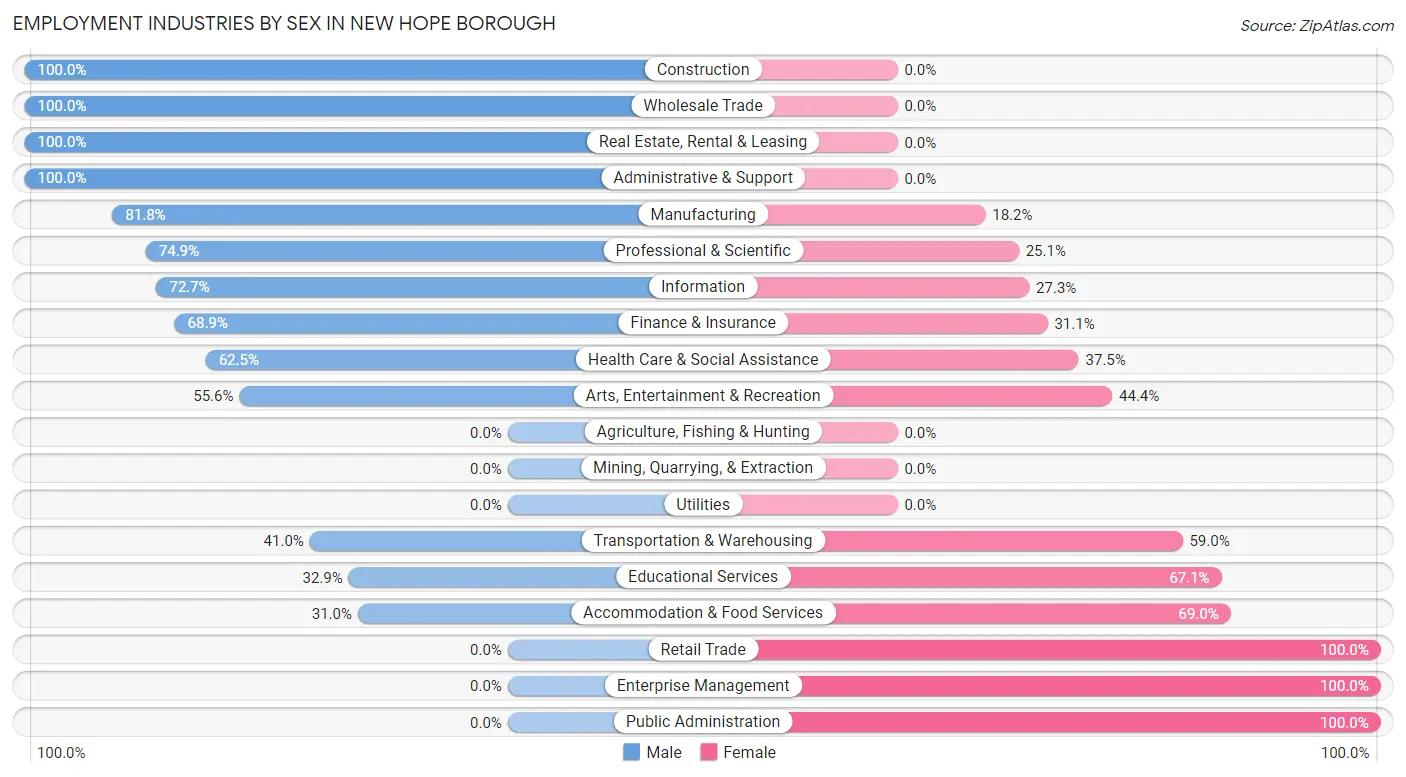
| Industry | Male | Female |
| Agriculture, Fishing & Hunting | 0 (0.0%) | 0 (0.0%) |
| Mining, Quarrying, & Extraction | 0 (0.0%) | 0 (0.0%) |
| Construction | 77 (100.0%) | 0 (0.0%) |
| Manufacturing | 63 (81.8%) | 14 (18.2%) |
| Wholesale Trade | 31 (100.0%) | 0 (0.0%) |
| Retail Trade | 0 (0.0%) | 8 (100.0%) |
| Transportation & Warehousing | 41 (41.0%) | 59 (59.0%) |
| Utilities | 0 (0.0%) | 0 (0.0%) |
| Information | 24 (72.7%) | 9 (27.3%) |
| Finance & Insurance | 111 (68.9%) | 50 (31.1%) |
| Real Estate, Rental & Leasing | 47 (100.0%) | 0 (0.0%) |
| Professional & Scientific | 170 (74.9%) | 57 (25.1%) |
| Enterprise Management | 0 (0.0%) | 20 (100.0%) |
| Administrative & Support | 94 (100.0%) | 0 (0.0%) |
| Educational Services | 28 (32.9%) | 57 (67.1%) |
| Health Care & Social Assistance | 95 (62.5%) | 57 (37.5%) |
| Arts, Entertainment & Recreation | 30 (55.6%) | 24 (44.4%) |
| Accommodation & Food Services | 9 (31.0%) | 20 (69.0%) |
| Public Administration | 0 (0.0%) | 36 (100.0%) |
| Total | 829 (65.0%) | 447 (35.0%) |
Education in New Hope borough
School Enrollment in New Hope borough
The most common levels of schooling among the 454 students in New Hope borough are graduate / professional (117 | 25.8%), high school (111 | 24.4%), and elementary school (58 | 12.8%).
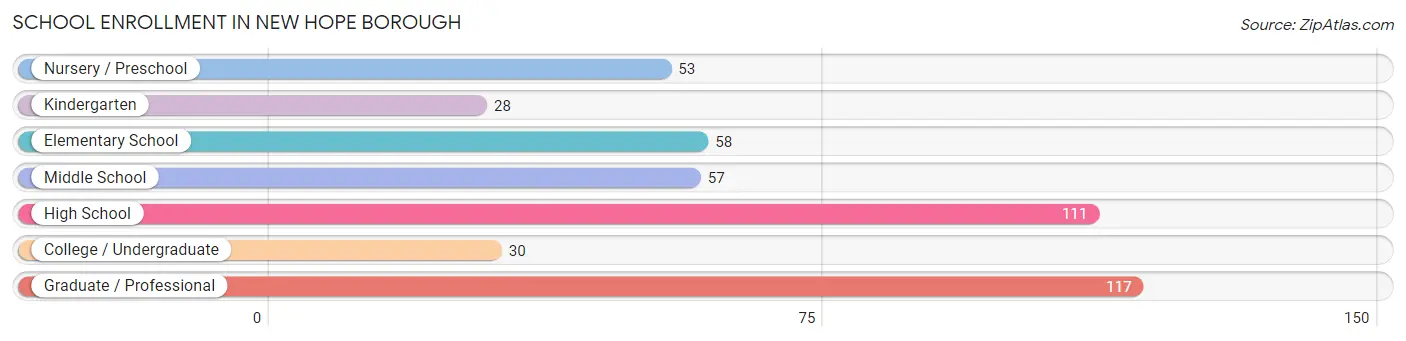
| School Level | # Students | % Students |
| Nursery / Preschool | 53 | 11.7% |
| Kindergarten | 28 | 6.2% |
| Elementary School | 58 | 12.8% |
| Middle School | 57 | 12.6% |
| High School | 111 | 24.4% |
| College / Undergraduate | 30 | 6.6% |
| Graduate / Professional | 117 | 25.8% |
| Total | 454 | 100.0% |
School Enrollment by Age by Funding Source in New Hope borough
Out of a total of 454 students who are enrolled in schools in New Hope borough, 78 (17.2%) attend a private institution, while the remaining 376 (82.8%) are enrolled in public schools. The age group of 35 years and over has the highest likelihood of being enrolled in private schools, with 56 (50.4% in the age bracket) enrolled. Conversely, the age group of 3 to 4 year olds has the lowest likelihood of being enrolled in a private school, with 53 (100.0% in the age bracket) attending a public institution.
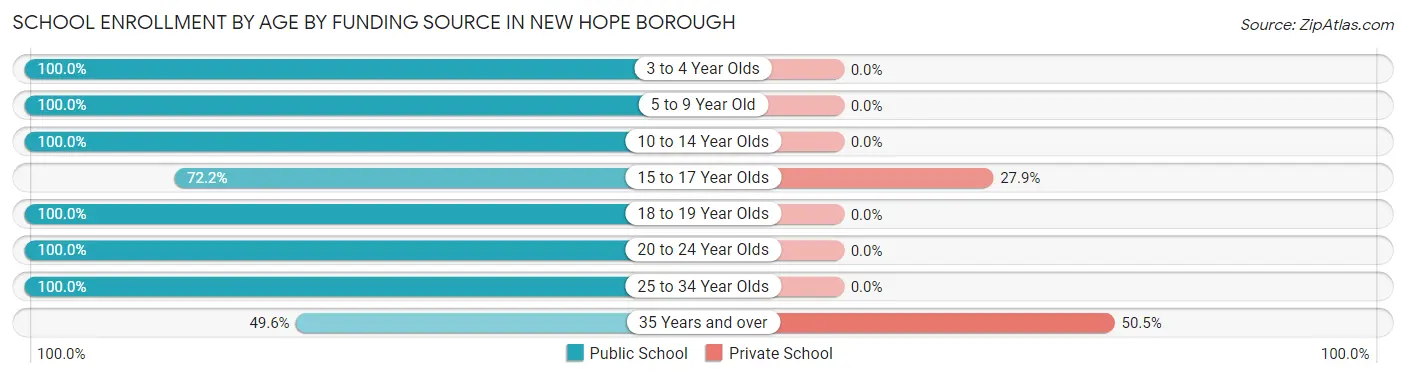
| Age Bracket | Public School | Private School |
| 3 to 4 Year Olds | 53 (100.0%) | 0 (0.0%) |
| 5 to 9 Year Old | 86 (100.0%) | 0 (0.0%) |
| 10 to 14 Year Olds | 74 (100.0%) | 0 (0.0%) |
| 15 to 17 Year Olds | 57 (72.2%) | 22 (27.9%) |
| 18 to 19 Year Olds | 15 (100.0%) | 0 (0.0%) |
| 20 to 24 Year Olds | 22 (100.0%) | 0 (0.0%) |
| 25 to 34 Year Olds | 14 (100.0%) | 0 (0.0%) |
| 35 Years and over | 55 (49.5%) | 56 (50.4%) |
| Total | 376 (82.8%) | 78 (17.2%) |
Educational Attainment by Field of Study in New Hope borough
Business (404 | 26.3%), literature & languages (229 | 14.9%), education (123 | 8.0%), social sciences (120 | 7.8%), and science & technology (94 | 6.1%) are the most common fields of study among 1,537 individuals in New Hope borough who have obtained a bachelor's degree or higher.
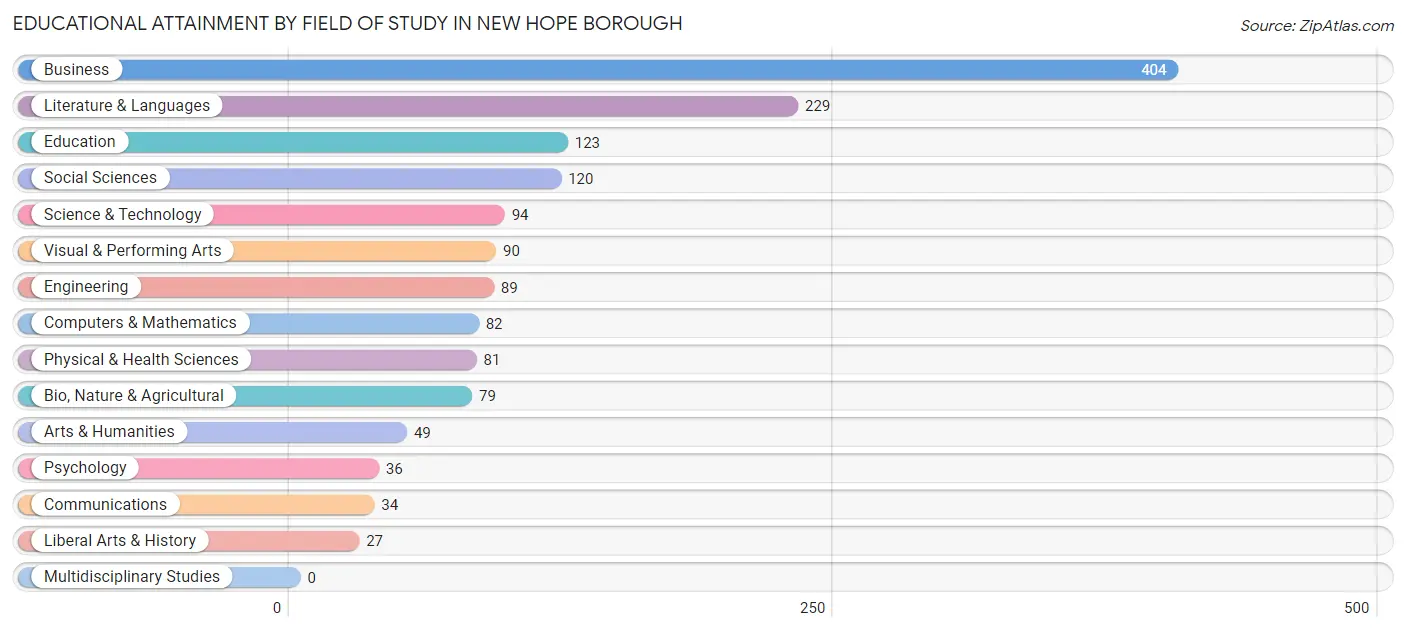
| Field of Study | # Graduates | % Graduates |
| Computers & Mathematics | 82 | 5.3% |
| Bio, Nature & Agricultural | 79 | 5.1% |
| Physical & Health Sciences | 81 | 5.3% |
| Psychology | 36 | 2.3% |
| Social Sciences | 120 | 7.8% |
| Engineering | 89 | 5.8% |
| Multidisciplinary Studies | 0 | 0.0% |
| Science & Technology | 94 | 6.1% |
| Business | 404 | 26.3% |
| Education | 123 | 8.0% |
| Literature & Languages | 229 | 14.9% |
| Liberal Arts & History | 27 | 1.8% |
| Visual & Performing Arts | 90 | 5.9% |
| Communications | 34 | 2.2% |
| Arts & Humanities | 49 | 3.2% |
| Total | 1,537 | 100.0% |
Transportation & Commute in New Hope borough
Vehicle Availability by Sex in New Hope borough
The most prevalent vehicle ownership categories in New Hope borough are males with 2 vehicles (396, accounting for 47.8%) and females with 2 vehicles (204, making up 90.8%).
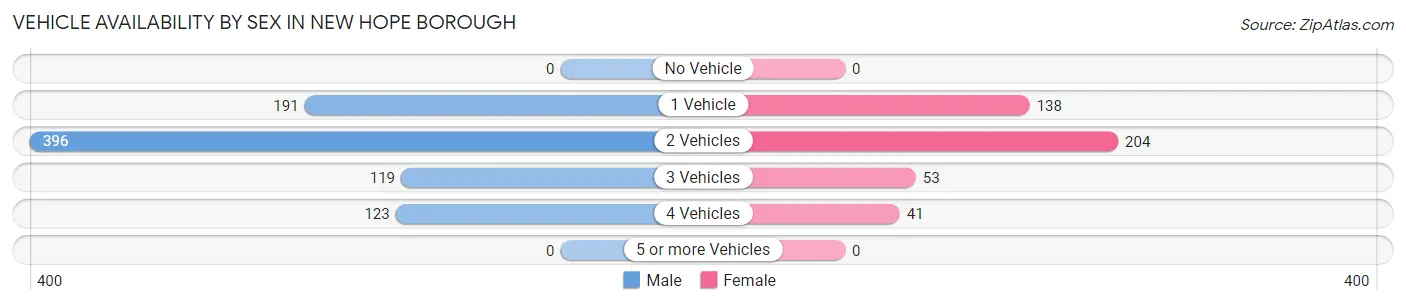
| Vehicles Available | Male | Female |
| No Vehicle | 0 (0.0%) | 0 (0.0%) |
| 1 Vehicle | 191 (23.0%) | 138 (31.7%) |
| 2 Vehicles | 396 (47.8%) | 204 (46.8%) |
| 3 Vehicles | 119 (14.3%) | 53 (12.2%) |
| 4 Vehicles | 123 (14.8%) | 41 (9.4%) |
| 5 or more Vehicles | 0 (0.0%) | 0 (0.0%) |
| Total | 829 (100.0%) | 436 (100.0%) |
Commute Time in New Hope borough
The most frequently occuring commute durations in New Hope borough are 30 to 34 minutes (146 commuters, 17.5%), 20 to 24 minutes (118 commuters, 14.2%), and 45 to 59 minutes (110 commuters, 13.2%).
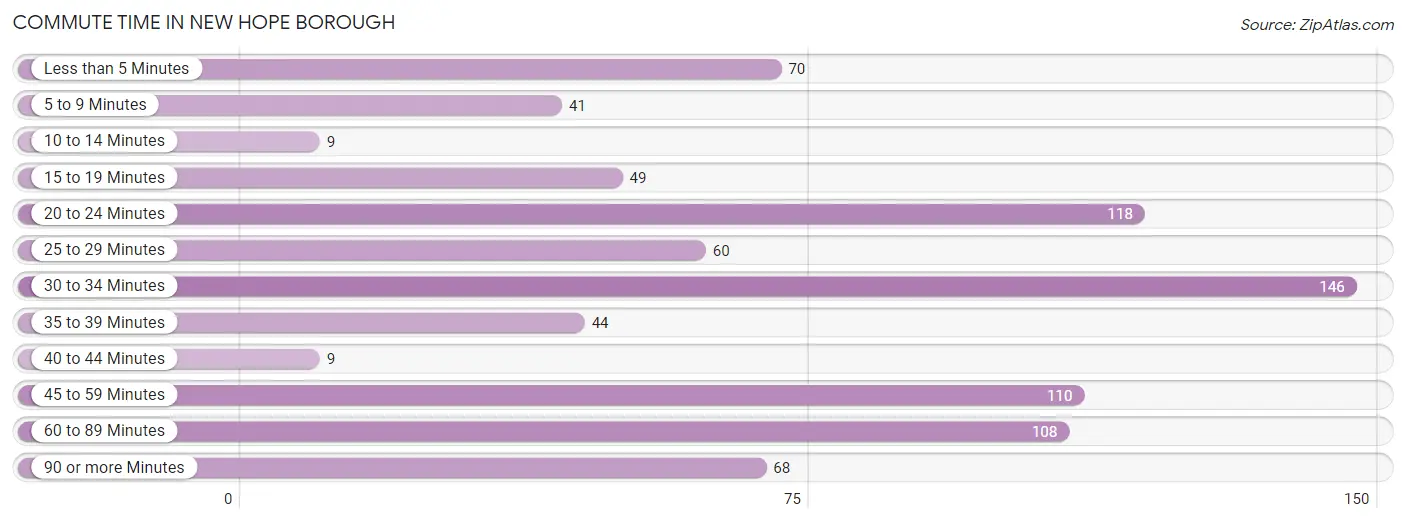
| Commute Time | # Commuters | % Commuters |
| Less than 5 Minutes | 70 | 8.4% |
| 5 to 9 Minutes | 41 | 4.9% |
| 10 to 14 Minutes | 9 | 1.1% |
| 15 to 19 Minutes | 49 | 5.9% |
| 20 to 24 Minutes | 118 | 14.2% |
| 25 to 29 Minutes | 60 | 7.2% |
| 30 to 34 Minutes | 146 | 17.5% |
| 35 to 39 Minutes | 44 | 5.3% |
| 40 to 44 Minutes | 9 | 1.1% |
| 45 to 59 Minutes | 110 | 13.2% |
| 60 to 89 Minutes | 108 | 13.0% |
| 90 or more Minutes | 68 | 8.2% |
Commute Time by Sex in New Hope borough
The most common commute times in New Hope borough are 20 to 24 minutes (101 commuters, 18.6%) for males and less than 5 minutes (50 commuters, 17.4%) for females.
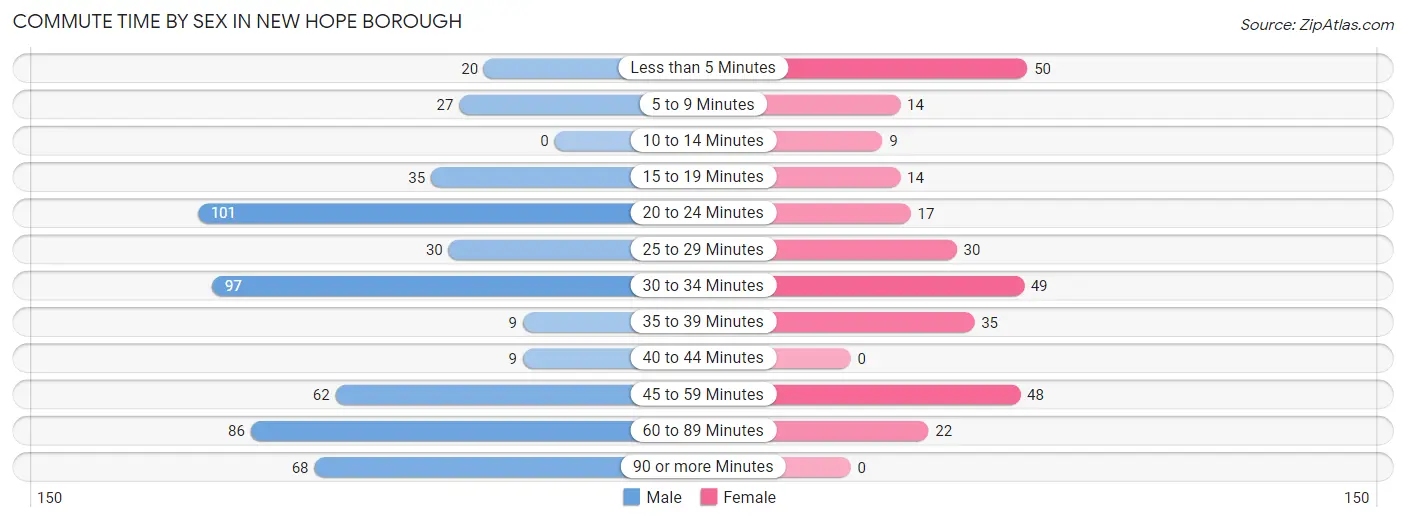
| Commute Time | Male | Female |
| Less than 5 Minutes | 20 (3.7%) | 50 (17.4%) |
| 5 to 9 Minutes | 27 (5.0%) | 14 (4.9%) |
| 10 to 14 Minutes | 0 (0.0%) | 9 (3.1%) |
| 15 to 19 Minutes | 35 (6.4%) | 14 (4.9%) |
| 20 to 24 Minutes | 101 (18.6%) | 17 (5.9%) |
| 25 to 29 Minutes | 30 (5.5%) | 30 (10.4%) |
| 30 to 34 Minutes | 97 (17.8%) | 49 (17.0%) |
| 35 to 39 Minutes | 9 (1.7%) | 35 (12.1%) |
| 40 to 44 Minutes | 9 (1.7%) | 0 (0.0%) |
| 45 to 59 Minutes | 62 (11.4%) | 48 (16.7%) |
| 60 to 89 Minutes | 86 (15.8%) | 22 (7.6%) |
| 90 or more Minutes | 68 (12.5%) | 0 (0.0%) |
Time of Departure to Work by Sex in New Hope borough
The most frequent times of departure to work in New Hope borough are 8:00 AM to 8:29 AM (140, 25.7%) for males and 8:00 AM to 8:29 AM (83, 28.8%) for females.
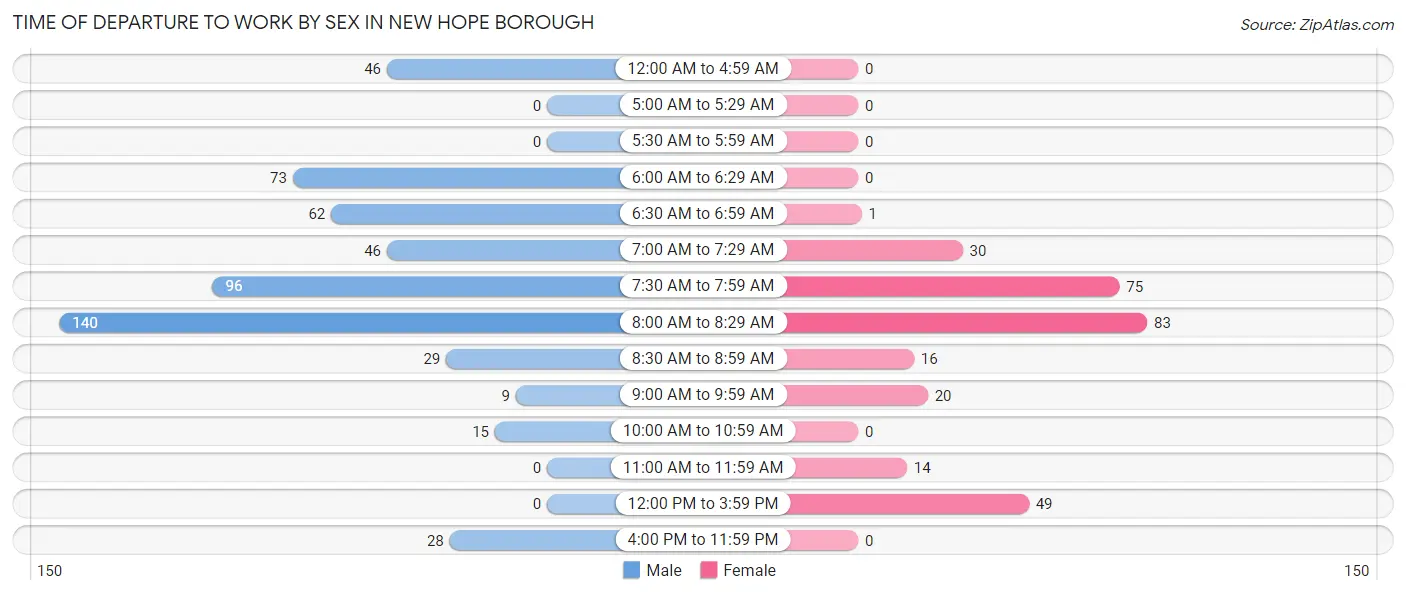
| Time of Departure | Male | Female |
| 12:00 AM to 4:59 AM | 46 (8.5%) | 0 (0.0%) |
| 5:00 AM to 5:29 AM | 0 (0.0%) | 0 (0.0%) |
| 5:30 AM to 5:59 AM | 0 (0.0%) | 0 (0.0%) |
| 6:00 AM to 6:29 AM | 73 (13.4%) | 0 (0.0%) |
| 6:30 AM to 6:59 AM | 62 (11.4%) | 1 (0.4%) |
| 7:00 AM to 7:29 AM | 46 (8.5%) | 30 (10.4%) |
| 7:30 AM to 7:59 AM | 96 (17.6%) | 75 (26.0%) |
| 8:00 AM to 8:29 AM | 140 (25.7%) | 83 (28.8%) |
| 8:30 AM to 8:59 AM | 29 (5.3%) | 16 (5.6%) |
| 9:00 AM to 9:59 AM | 9 (1.7%) | 20 (6.9%) |
| 10:00 AM to 10:59 AM | 15 (2.8%) | 0 (0.0%) |
| 11:00 AM to 11:59 AM | 0 (0.0%) | 14 (4.9%) |
| 12:00 PM to 3:59 PM | 0 (0.0%) | 49 (17.0%) |
| 4:00 PM to 11:59 PM | 28 (5.1%) | 0 (0.0%) |
| Total | 544 (100.0%) | 288 (100.0%) |
Housing Occupancy in New Hope borough
Occupancy by Ownership in New Hope borough
Of the total 1,356 dwellings in New Hope borough, owner-occupied units account for 847 (62.5%), while renter-occupied units make up 509 (37.5%).
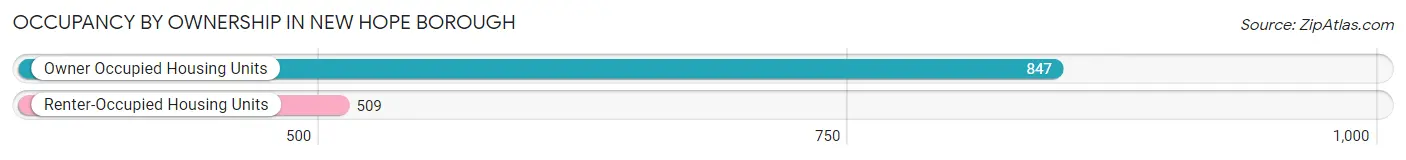
| Occupancy | # Housing Units | % Housing Units |
| Owner Occupied Housing Units | 847 | 62.5% |
| Renter-Occupied Housing Units | 509 | 37.5% |
| Total Occupied Housing Units | 1,356 | 100.0% |
Occupancy by Household Size in New Hope borough
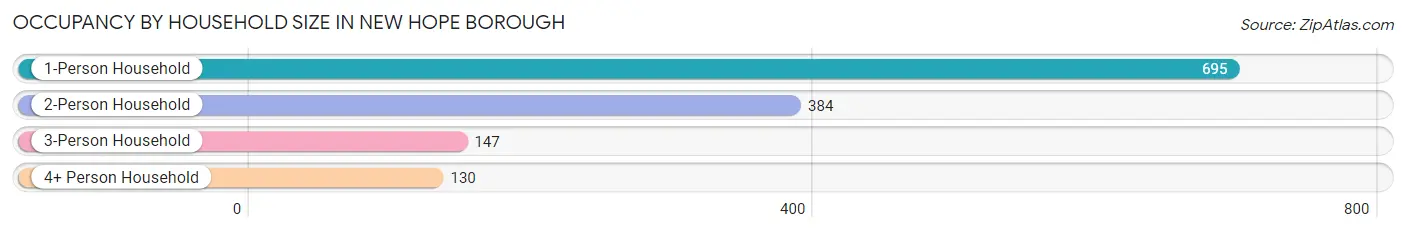
| Household Size | # Housing Units | % Housing Units |
| 1-Person Household | 695 | 51.2% |
| 2-Person Household | 384 | 28.3% |
| 3-Person Household | 147 | 10.8% |
| 4+ Person Household | 130 | 9.6% |
| Total Housing Units | 1,356 | 100.0% |
Occupancy by Ownership by Household Size in New Hope borough
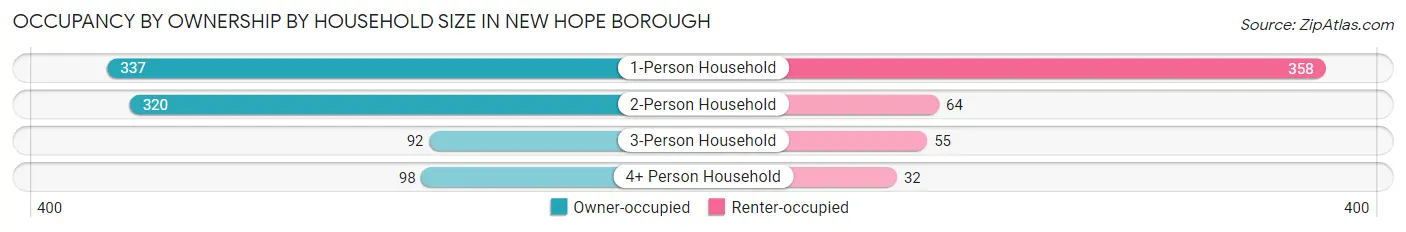
| Household Size | Owner-occupied | Renter-occupied |
| 1-Person Household | 337 (48.5%) | 358 (51.5%) |
| 2-Person Household | 320 (83.3%) | 64 (16.7%) |
| 3-Person Household | 92 (62.6%) | 55 (37.4%) |
| 4+ Person Household | 98 (75.4%) | 32 (24.6%) |
| Total Housing Units | 847 (62.5%) | 509 (37.5%) |
Occupancy by Educational Attainment in New Hope borough
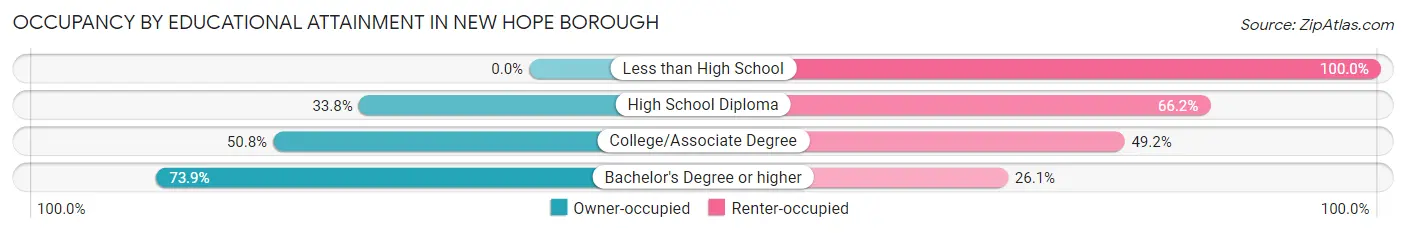
| Household Size | Owner-occupied | Renter-occupied |
| Less than High School | 0 (0.0%) | 33 (100.0%) |
| High School Diploma | 72 (33.8%) | 141 (66.2%) |
| College/Associate Degree | 99 (50.8%) | 96 (49.2%) |
| Bachelor's Degree or higher | 676 (73.9%) | 239 (26.1%) |
Occupancy by Age of Householder in New Hope borough
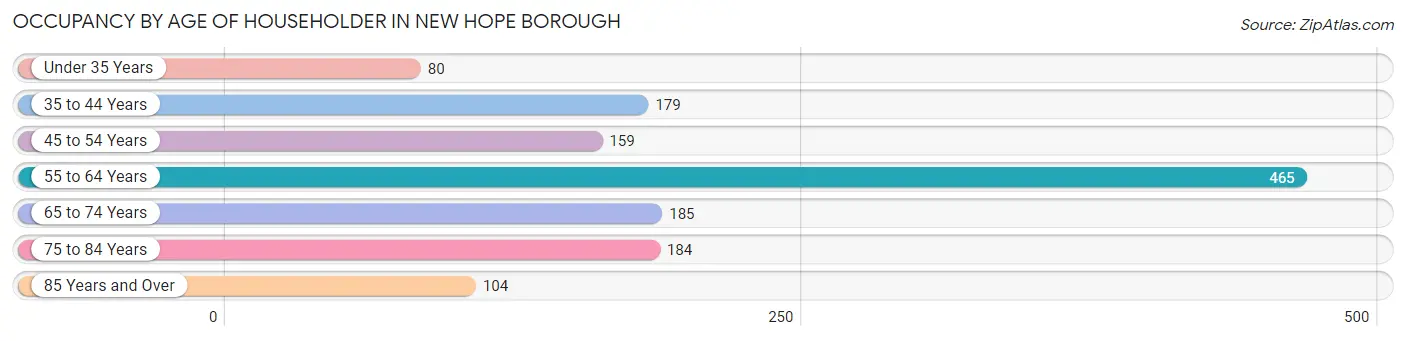
| Age Bracket | # Households | % Households |
| Under 35 Years | 80 | 5.9% |
| 35 to 44 Years | 179 | 13.2% |
| 45 to 54 Years | 159 | 11.7% |
| 55 to 64 Years | 465 | 34.3% |
| 65 to 74 Years | 185 | 13.6% |
| 75 to 84 Years | 184 | 13.6% |
| 85 Years and Over | 104 | 7.7% |
| Total | 1,356 | 100.0% |
Housing Finances in New Hope borough
Median Income by Occupancy in New Hope borough
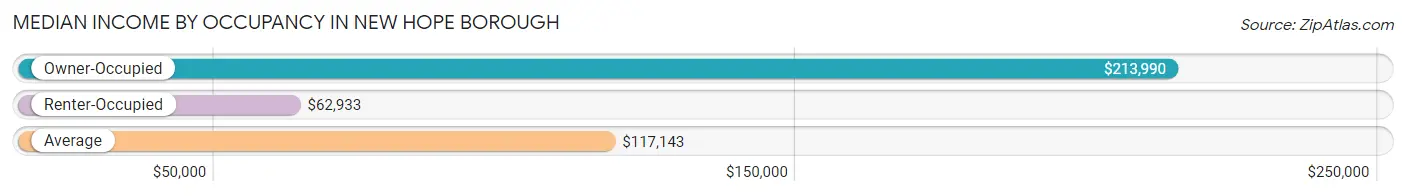
| Occupancy Type | # Households | Median Income |
| Owner-Occupied | 847 (62.5%) | $213,990 |
| Renter-Occupied | 509 (37.5%) | $62,933 |
| Average | 1,356 (100.0%) | $117,143 |
Occupancy by Householder Income Bracket in New Hope borough
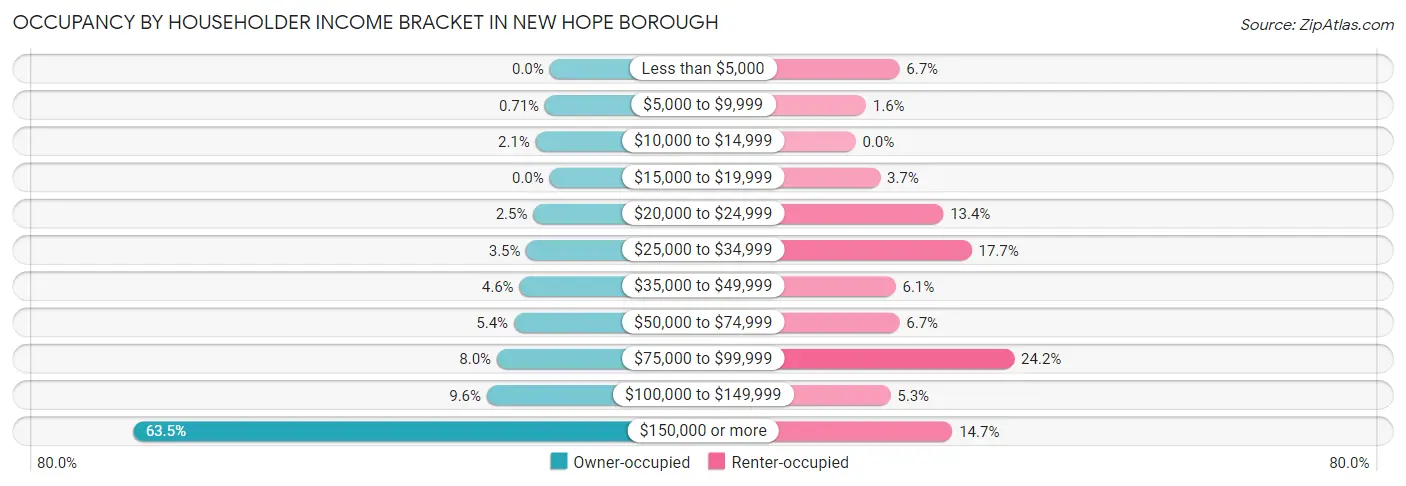
| Income Bracket | Owner-occupied | Renter-occupied |
| Less than $5,000 | 0 (0.0%) | 34 (6.7%) |
| $5,000 to $9,999 | 6 (0.7%) | 8 (1.6%) |
| $10,000 to $14,999 | 18 (2.1%) | 0 (0.0%) |
| $15,000 to $19,999 | 0 (0.0%) | 19 (3.7%) |
| $20,000 to $24,999 | 21 (2.5%) | 68 (13.4%) |
| $25,000 to $34,999 | 30 (3.5%) | 90 (17.7%) |
| $35,000 to $49,999 | 39 (4.6%) | 31 (6.1%) |
| $50,000 to $74,999 | 46 (5.4%) | 34 (6.7%) |
| $75,000 to $99,999 | 68 (8.0%) | 123 (24.2%) |
| $100,000 to $149,999 | 81 (9.6%) | 27 (5.3%) |
| $150,000 or more | 538 (63.5%) | 75 (14.7%) |
| Total | 847 (100.0%) | 509 (100.0%) |
Monthly Housing Cost Tiers in New Hope borough
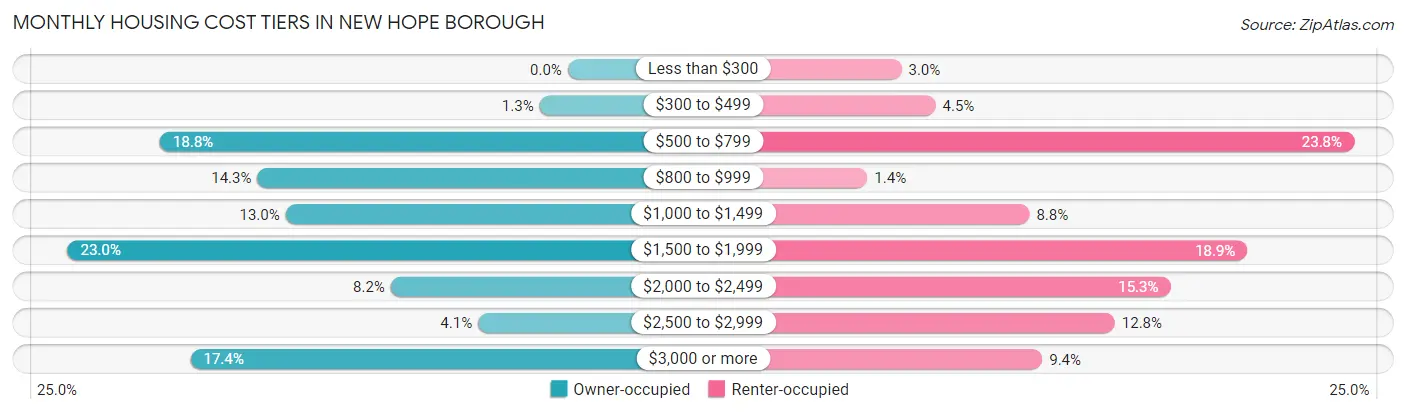
| Monthly Cost | Owner-occupied | Renter-occupied |
| Less than $300 | 0 (0.0%) | 15 (2.9%) |
| $300 to $499 | 11 (1.3%) | 23 (4.5%) |
| $500 to $799 | 159 (18.8%) | 121 (23.8%) |
| $800 to $999 | 121 (14.3%) | 7 (1.4%) |
| $1,000 to $1,499 | 110 (13.0%) | 45 (8.8%) |
| $1,500 to $1,999 | 195 (23.0%) | 96 (18.9%) |
| $2,000 to $2,499 | 69 (8.2%) | 78 (15.3%) |
| $2,500 to $2,999 | 35 (4.1%) | 65 (12.8%) |
| $3,000 or more | 147 (17.4%) | 48 (9.4%) |
| Total | 847 (100.0%) | 509 (100.0%) |
Physical Housing Characteristics in New Hope borough
Housing Structures in New Hope borough
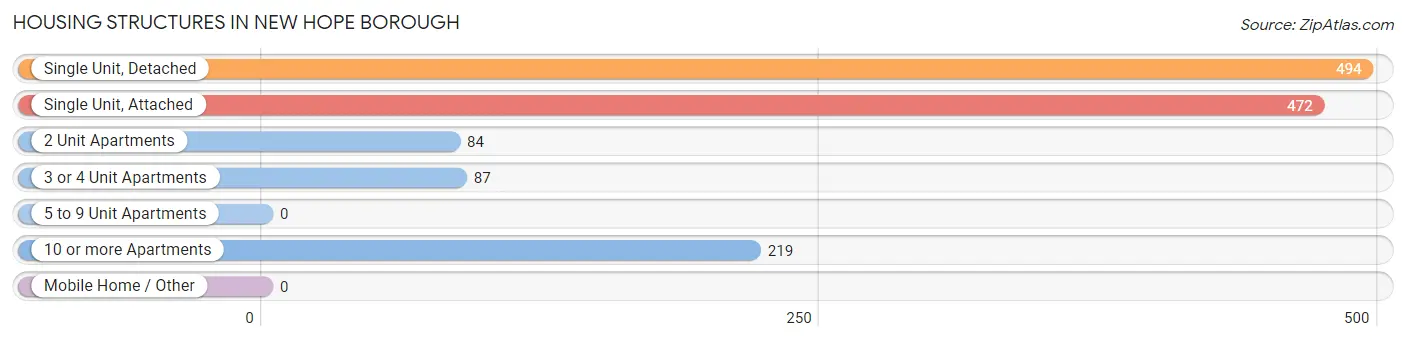
| Structure Type | # Housing Units | % Housing Units |
| Single Unit, Detached | 494 | 36.4% |
| Single Unit, Attached | 472 | 34.8% |
| 2 Unit Apartments | 84 | 6.2% |
| 3 or 4 Unit Apartments | 87 | 6.4% |
| 5 to 9 Unit Apartments | 0 | 0.0% |
| 10 or more Apartments | 219 | 16.2% |
| Mobile Home / Other | 0 | 0.0% |
| Total | 1,356 | 100.0% |
Housing Structures by Occupancy in New Hope borough
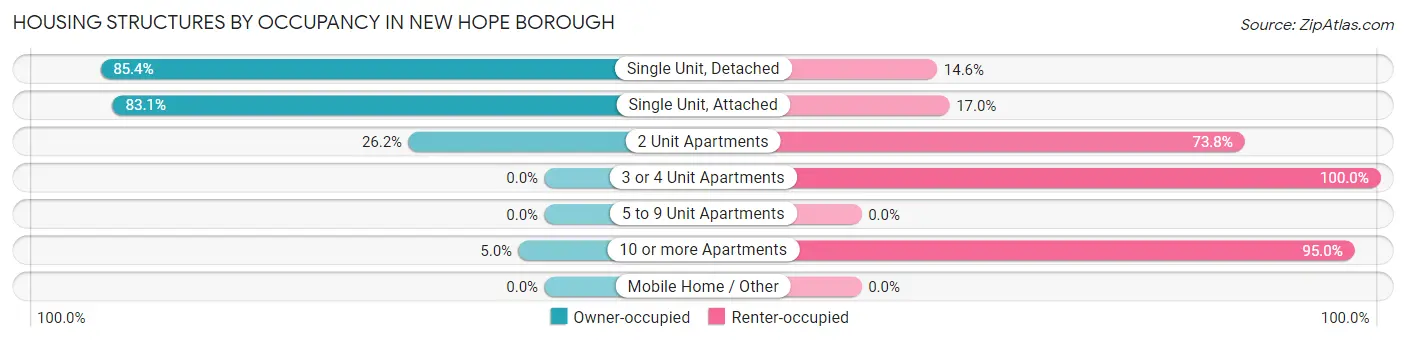
| Structure Type | Owner-occupied | Renter-occupied |
| Single Unit, Detached | 422 (85.4%) | 72 (14.6%) |
| Single Unit, Attached | 392 (83.1%) | 80 (17.0%) |
| 2 Unit Apartments | 22 (26.2%) | 62 (73.8%) |
| 3 or 4 Unit Apartments | 0 (0.0%) | 87 (100.0%) |
| 5 to 9 Unit Apartments | 0 (0.0%) | 0 (0.0%) |
| 10 or more Apartments | 11 (5.0%) | 208 (95.0%) |
| Mobile Home / Other | 0 (0.0%) | 0 (0.0%) |
| Total | 847 (62.5%) | 509 (37.5%) |
Housing Structures by Number of Rooms in New Hope borough
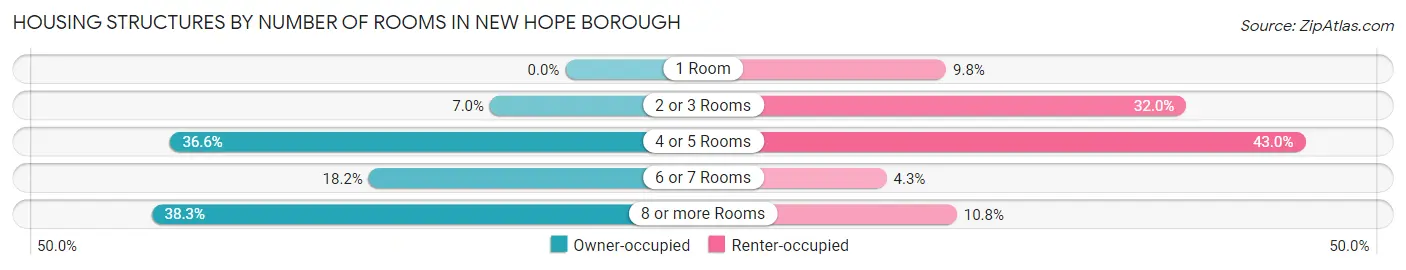
| Number of Rooms | Owner-occupied | Renter-occupied |
| 1 Room | 0 (0.0%) | 50 (9.8%) |
| 2 or 3 Rooms | 59 (7.0%) | 163 (32.0%) |
| 4 or 5 Rooms | 310 (36.6%) | 219 (43.0%) |
| 6 or 7 Rooms | 154 (18.2%) | 22 (4.3%) |
| 8 or more Rooms | 324 (38.3%) | 55 (10.8%) |
| Total | 847 (100.0%) | 509 (100.0%) |
Housing Structure by Heating Type in New Hope borough
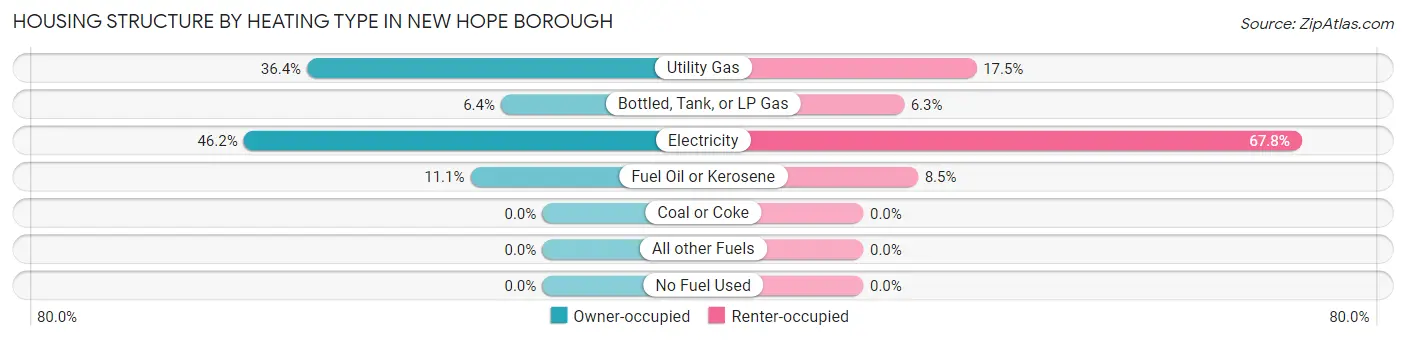
| Heating Type | Owner-occupied | Renter-occupied |
| Utility Gas | 308 (36.4%) | 89 (17.5%) |
| Bottled, Tank, or LP Gas | 54 (6.4%) | 32 (6.3%) |
| Electricity | 391 (46.2%) | 345 (67.8%) |
| Fuel Oil or Kerosene | 94 (11.1%) | 43 (8.5%) |
| Coal or Coke | 0 (0.0%) | 0 (0.0%) |
| All other Fuels | 0 (0.0%) | 0 (0.0%) |
| No Fuel Used | 0 (0.0%) | 0 (0.0%) |
| Total | 847 (100.0%) | 509 (100.0%) |
Household Vehicle Usage in New Hope borough
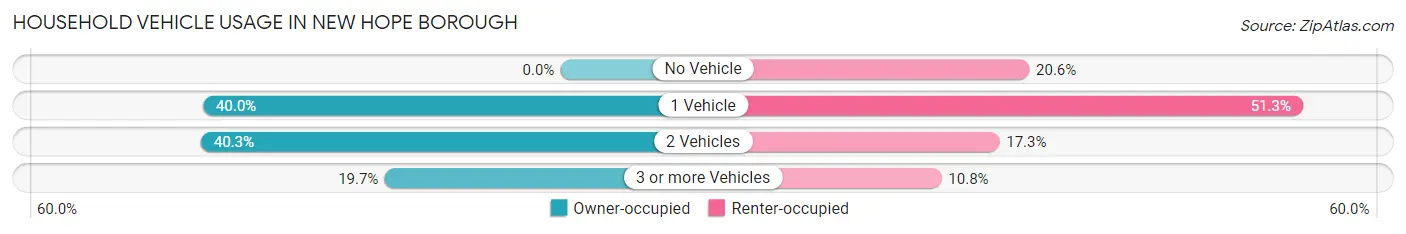
| Vehicles per Household | Owner-occupied | Renter-occupied |
| No Vehicle | 0 (0.0%) | 105 (20.6%) |
| 1 Vehicle | 339 (40.0%) | 261 (51.3%) |
| 2 Vehicles | 341 (40.3%) | 88 (17.3%) |
| 3 or more Vehicles | 167 (19.7%) | 55 (10.8%) |
| Total | 847 (100.0%) | 509 (100.0%) |
Real Estate & Mortgages in New Hope borough
Real Estate and Mortgage Overview in New Hope borough
| Characteristic | Without Mortgage | With Mortgage |
| Housing Units | 497 | 350 |
| Median Property Value | $587,800 | $606,400 |
| Median Household Income | $250,001 | $233 |
| Monthly Housing Costs | $912 | $147 |
| Real Estate Taxes | $6,362 | $0 |
Property Value by Mortgage Status in New Hope borough
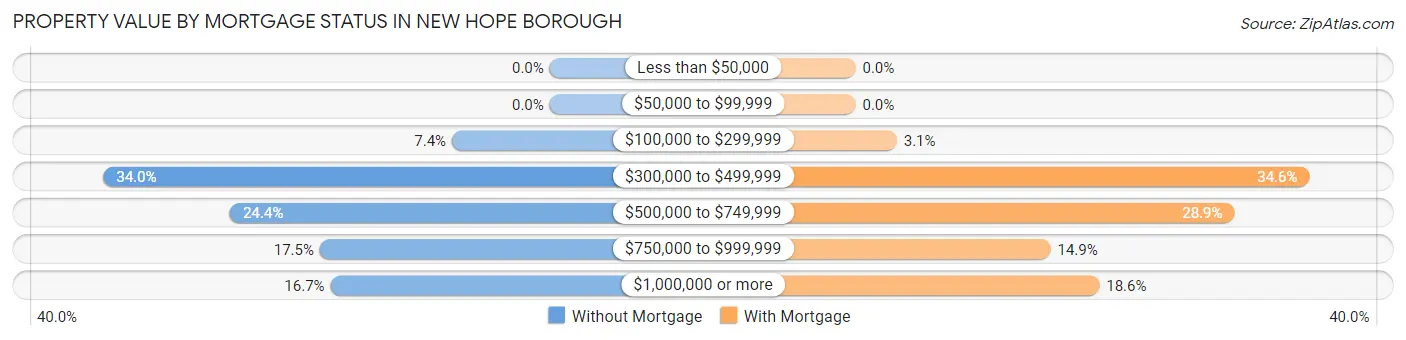
| Property Value | Without Mortgage | With Mortgage |
| Less than $50,000 | 0 (0.0%) | 0 (0.0%) |
| $50,000 to $99,999 | 0 (0.0%) | 0 (0.0%) |
| $100,000 to $299,999 | 37 (7.4%) | 11 (3.1%) |
| $300,000 to $499,999 | 169 (34.0%) | 121 (34.6%) |
| $500,000 to $749,999 | 121 (24.3%) | 101 (28.9%) |
| $750,000 to $999,999 | 87 (17.5%) | 52 (14.9%) |
| $1,000,000 or more | 83 (16.7%) | 65 (18.6%) |
| Total | 497 (100.0%) | 350 (100.0%) |
Household Income by Mortgage Status in New Hope borough
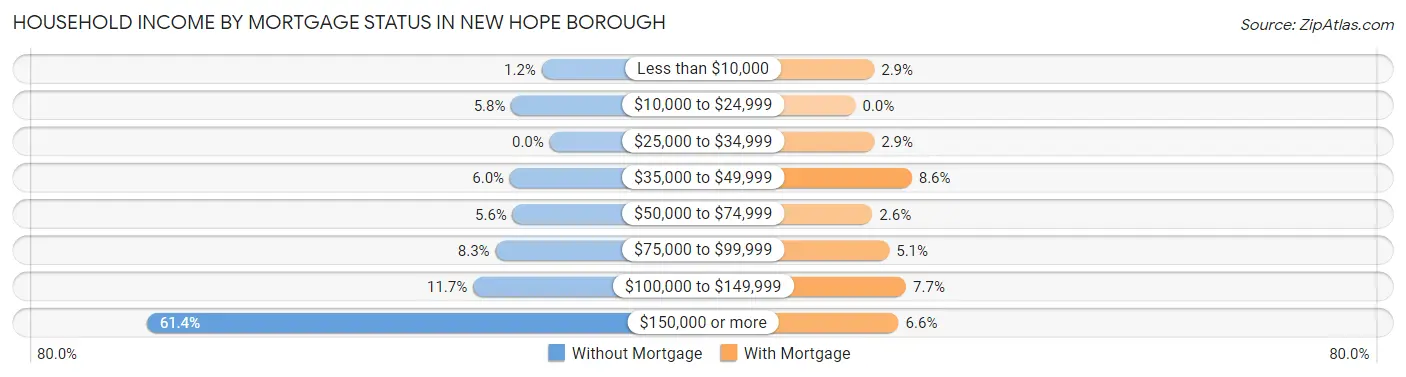
| Household Income | Without Mortgage | With Mortgage |
| Less than $10,000 | 6 (1.2%) | 10 (2.9%) |
| $10,000 to $24,999 | 29 (5.8%) | 0 (0.0%) |
| $25,000 to $34,999 | 0 (0.0%) | 10 (2.9%) |
| $35,000 to $49,999 | 30 (6.0%) | 30 (8.6%) |
| $50,000 to $74,999 | 28 (5.6%) | 9 (2.6%) |
| $75,000 to $99,999 | 41 (8.3%) | 18 (5.1%) |
| $100,000 to $149,999 | 58 (11.7%) | 27 (7.7%) |
| $150,000 or more | 305 (61.4%) | 23 (6.6%) |
| Total | 497 (100.0%) | 350 (100.0%) |
Property Value to Household Income Ratio in New Hope borough
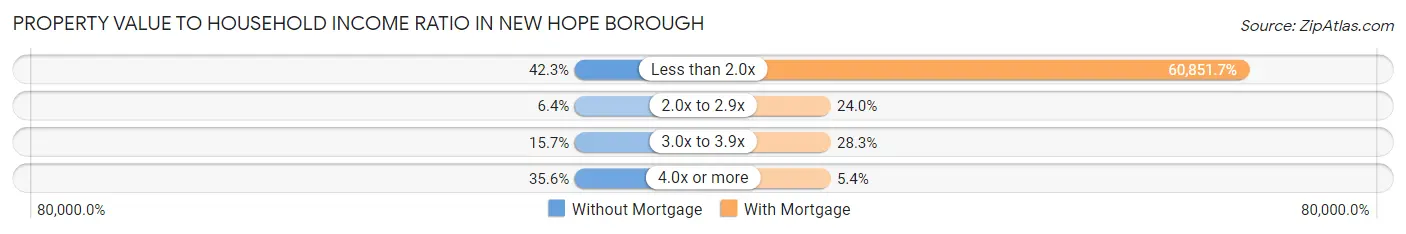
| Value-to-Income Ratio | Without Mortgage | With Mortgage |
| Less than 2.0x | 210 (42.2%) | 212,981 (60,851.7%) |
| 2.0x to 2.9x | 32 (6.4%) | 84 (24.0%) |
| 3.0x to 3.9x | 78 (15.7%) | 99 (28.3%) |
| 4.0x or more | 177 (35.6%) | 19 (5.4%) |
| Total | 497 (100.0%) | 350 (100.0%) |
Real Estate Taxes by Mortgage Status in New Hope borough
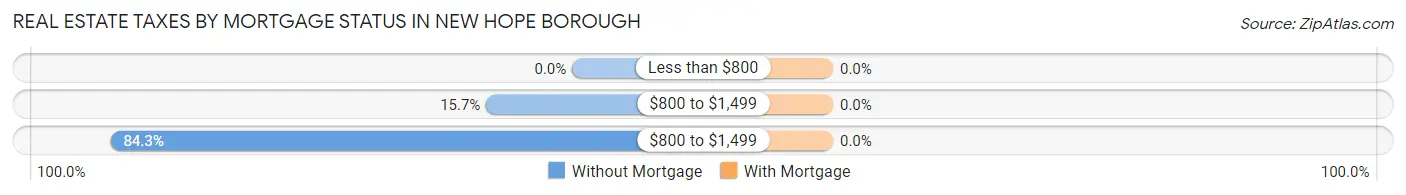
| Property Taxes | Without Mortgage | With Mortgage |
| Less than $800 | 0 (0.0%) | 0 (0.0%) |
| $800 to $1,499 | 78 (15.7%) | 0 (0.0%) |
| $800 to $1,499 | 419 (84.3%) | 0 (0.0%) |
| Total | 497 (100.0%) | 350 (100.0%) |
Health & Disability in New Hope borough
Health Insurance Coverage by Age in New Hope borough
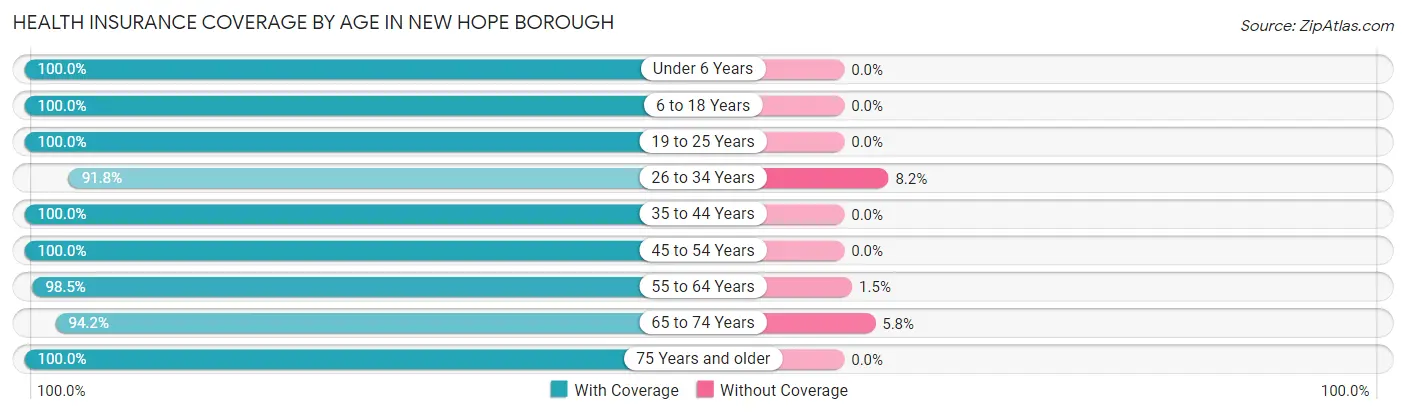
| Age Bracket | With Coverage | Without Coverage |
| Under 6 Years | 92 (100.0%) | 0 (0.0%) |
| 6 to 18 Years | 235 (100.0%) | 0 (0.0%) |
| 19 to 25 Years | 144 (100.0%) | 0 (0.0%) |
| 26 to 34 Years | 156 (91.8%) | 14 (8.2%) |
| 35 to 44 Years | 231 (100.0%) | 0 (0.0%) |
| 45 to 54 Years | 311 (100.0%) | 0 (0.0%) |
| 55 to 64 Years | 735 (98.5%) | 11 (1.5%) |
| 65 to 74 Years | 261 (94.2%) | 16 (5.8%) |
| 75 Years and older | 418 (100.0%) | 0 (0.0%) |
| Total | 2,583 (98.4%) | 41 (1.6%) |
Health Insurance Coverage by Citizenship Status in New Hope borough
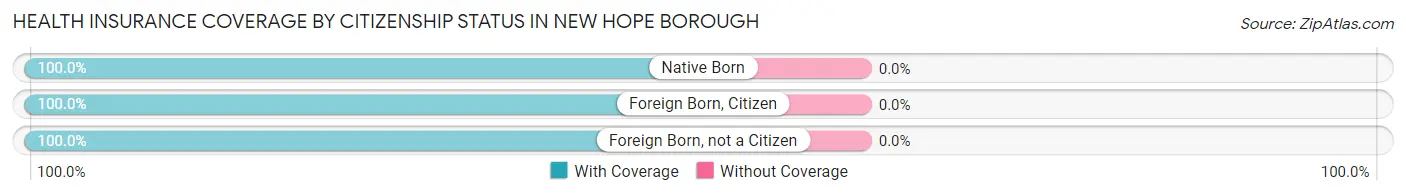
| Citizenship Status | With Coverage | Without Coverage |
| Native Born | 92 (100.0%) | 0 (0.0%) |
| Foreign Born, Citizen | 235 (100.0%) | 0 (0.0%) |
| Foreign Born, not a Citizen | 144 (100.0%) | 0 (0.0%) |
Health Insurance Coverage by Household Income in New Hope borough
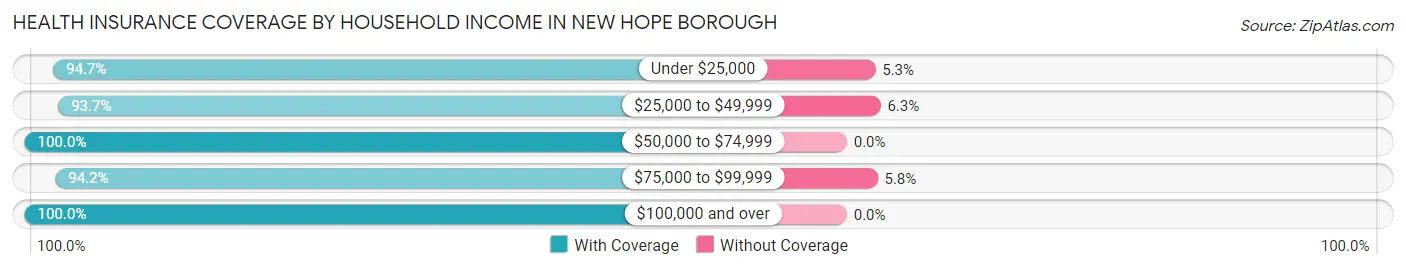
| Household Income | With Coverage | Without Coverage |
| Under $25,000 | 195 (94.7%) | 11 (5.3%) |
| $25,000 to $49,999 | 208 (93.7%) | 14 (6.3%) |
| $50,000 to $74,999 | 149 (100.0%) | 0 (0.0%) |
| $75,000 to $99,999 | 262 (94.2%) | 16 (5.8%) |
| $100,000 and over | 1,769 (100.0%) | 0 (0.0%) |
Public vs Private Health Insurance Coverage by Age in New Hope borough
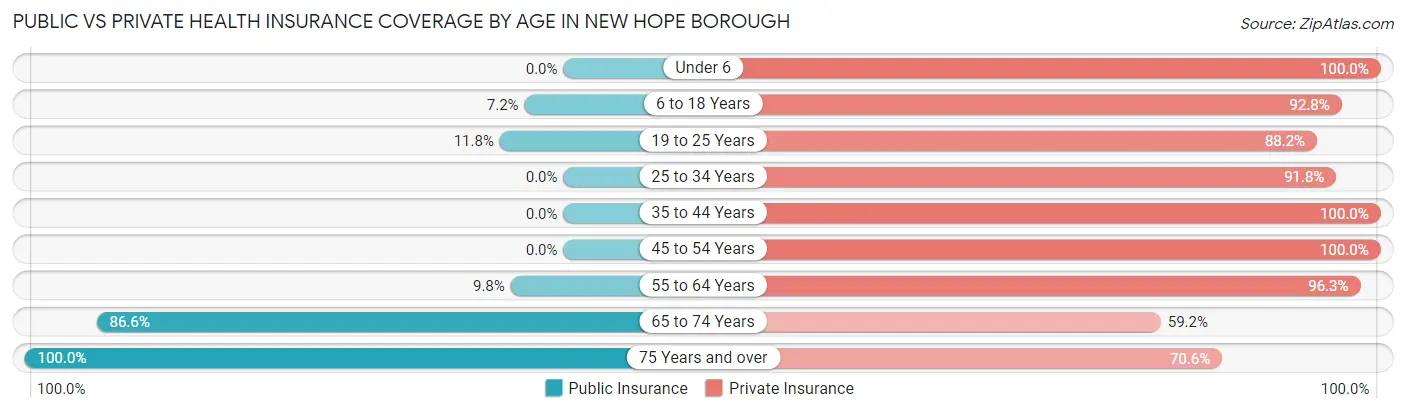
| Age Bracket | Public Insurance | Private Insurance |
| Under 6 | 0 (0.0%) | 92 (100.0%) |
| 6 to 18 Years | 17 (7.2%) | 218 (92.8%) |
| 19 to 25 Years | 17 (11.8%) | 127 (88.2%) |
| 25 to 34 Years | 0 (0.0%) | 156 (91.8%) |
| 35 to 44 Years | 0 (0.0%) | 231 (100.0%) |
| 45 to 54 Years | 0 (0.0%) | 311 (100.0%) |
| 55 to 64 Years | 73 (9.8%) | 718 (96.3%) |
| 65 to 74 Years | 240 (86.6%) | 164 (59.2%) |
| 75 Years and over | 418 (100.0%) | 295 (70.6%) |
| Total | 765 (29.1%) | 2,312 (88.1%) |
Disability Status by Sex by Age in New Hope borough
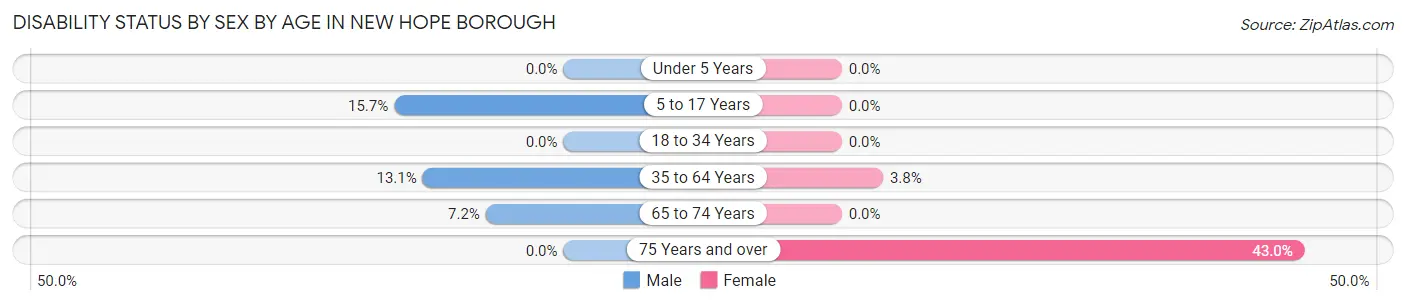
| Age Bracket | Male | Female |
| Under 5 Years | 0 (0.0%) | 0 (0.0%) |
| 5 to 17 Years | 22 (15.7%) | 0 (0.0%) |
| 18 to 34 Years | 0 (0.0%) | 0 (0.0%) |
| 35 to 64 Years | 100 (13.1%) | 20 (3.8%) |
| 65 to 74 Years | 8 (7.2%) | 0 (0.0%) |
| 75 Years and over | 0 (0.0%) | 134 (42.9%) |
Disability Class by Sex by Age in New Hope borough
Disability Class: Hearing Difficulty
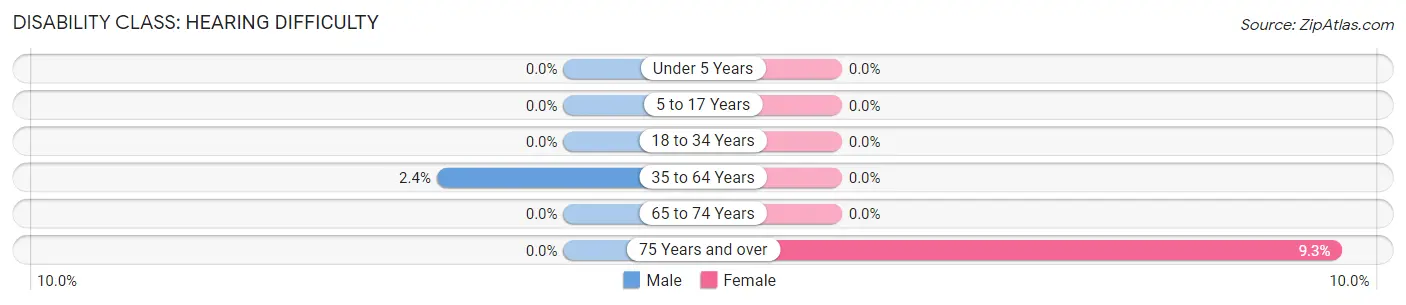
| Age Bracket | Male | Female |
| Under 5 Years | 0 (0.0%) | 0 (0.0%) |
| 5 to 17 Years | 0 (0.0%) | 0 (0.0%) |
| 18 to 34 Years | 0 (0.0%) | 0 (0.0%) |
| 35 to 64 Years | 18 (2.4%) | 0 (0.0%) |
| 65 to 74 Years | 0 (0.0%) | 0 (0.0%) |
| 75 Years and over | 0 (0.0%) | 29 (9.3%) |
Disability Class: Vision Difficulty
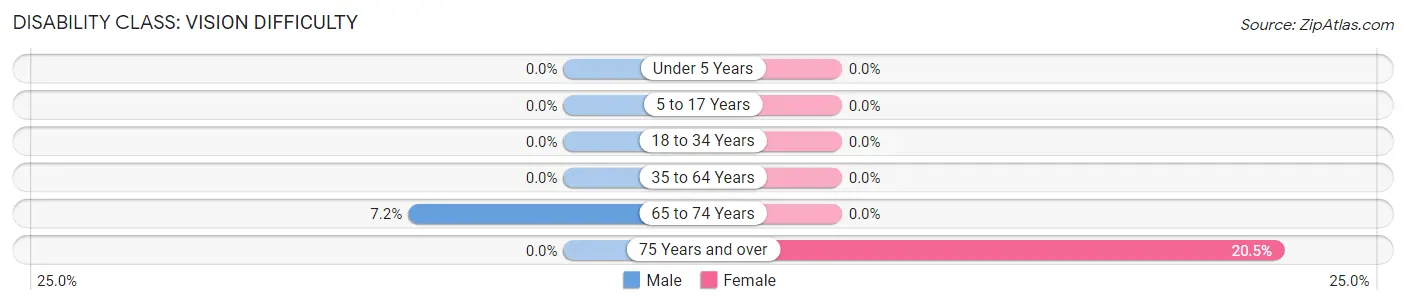
| Age Bracket | Male | Female |
| Under 5 Years | 0 (0.0%) | 0 (0.0%) |
| 5 to 17 Years | 0 (0.0%) | 0 (0.0%) |
| 18 to 34 Years | 0 (0.0%) | 0 (0.0%) |
| 35 to 64 Years | 0 (0.0%) | 0 (0.0%) |
| 65 to 74 Years | 8 (7.2%) | 0 (0.0%) |
| 75 Years and over | 0 (0.0%) | 64 (20.5%) |
Disability Class: Cognitive Difficulty
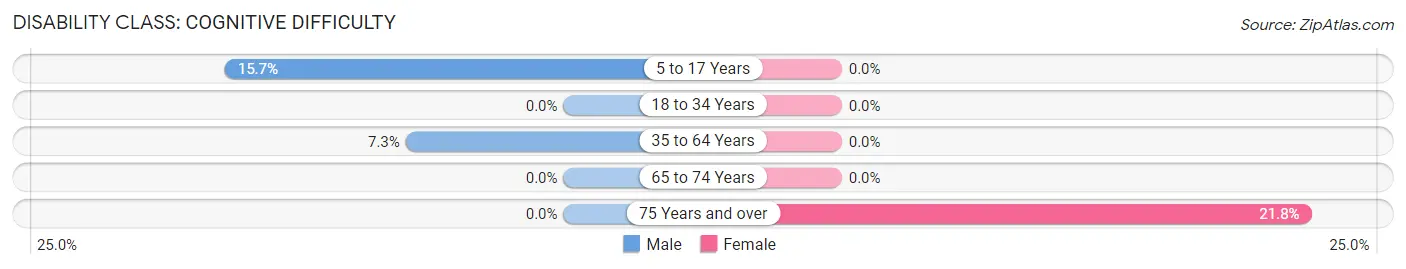
| Age Bracket | Male | Female |
| 5 to 17 Years | 22 (15.7%) | 0 (0.0%) |
| 18 to 34 Years | 0 (0.0%) | 0 (0.0%) |
| 35 to 64 Years | 56 (7.3%) | 0 (0.0%) |
| 65 to 74 Years | 0 (0.0%) | 0 (0.0%) |
| 75 Years and over | 0 (0.0%) | 68 (21.8%) |
Disability Class: Ambulatory Difficulty
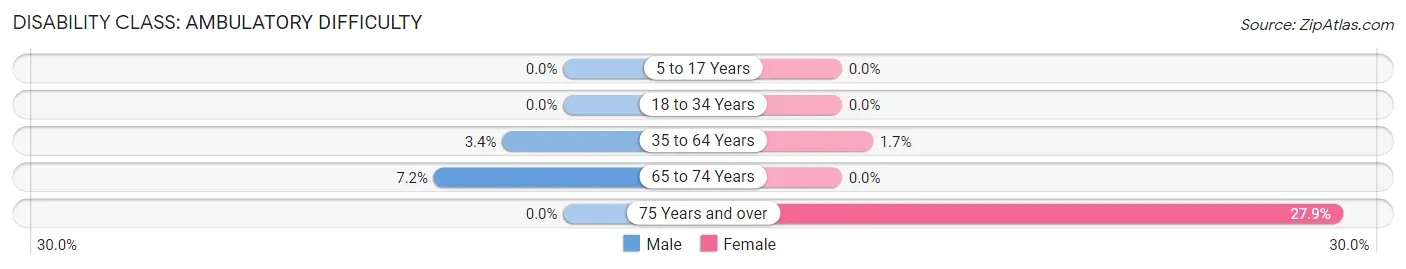
| Age Bracket | Male | Female |
| 5 to 17 Years | 0 (0.0%) | 0 (0.0%) |
| 18 to 34 Years | 0 (0.0%) | 0 (0.0%) |
| 35 to 64 Years | 26 (3.4%) | 9 (1.7%) |
| 65 to 74 Years | 8 (7.2%) | 0 (0.0%) |
| 75 Years and over | 0 (0.0%) | 87 (27.9%) |
Disability Class: Self-Care Difficulty
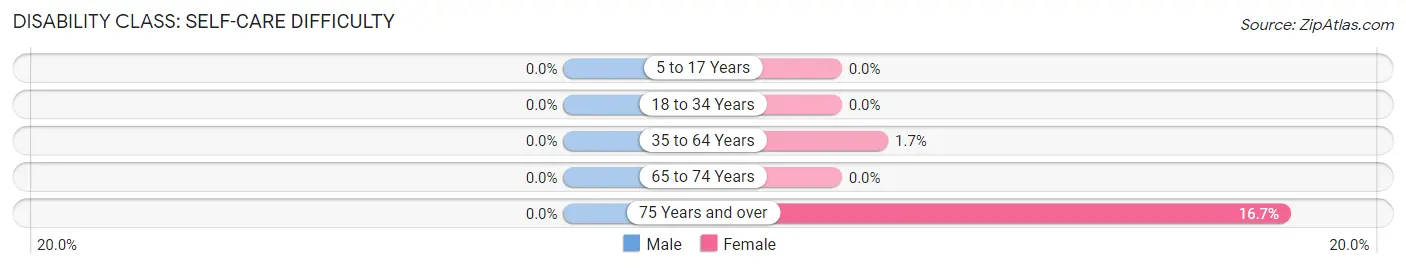
| Age Bracket | Male | Female |
| 5 to 17 Years | 0 (0.0%) | 0 (0.0%) |
| 18 to 34 Years | 0 (0.0%) | 0 (0.0%) |
| 35 to 64 Years | 0 (0.0%) | 9 (1.7%) |
| 65 to 74 Years | 0 (0.0%) | 0 (0.0%) |
| 75 Years and over | 0 (0.0%) | 52 (16.7%) |
Technology Access in New Hope borough
Computing Device Access in New Hope borough
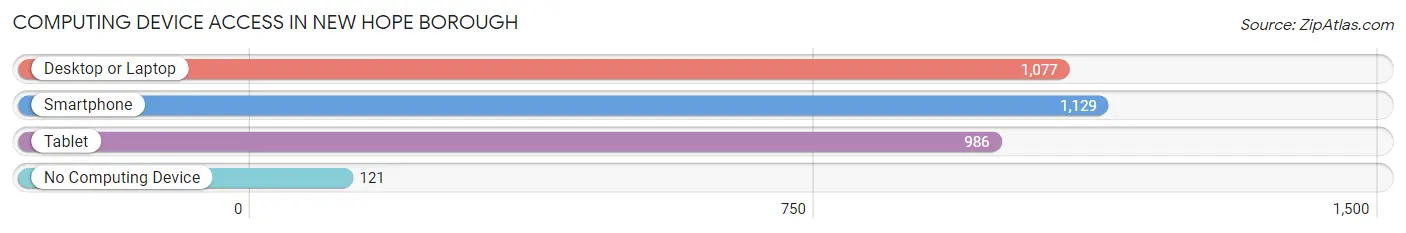
| Device Type | # Households | % Households |
| Desktop or Laptop | 1,077 | 79.4% |
| Smartphone | 1,129 | 83.3% |
| Tablet | 986 | 72.7% |
| No Computing Device | 121 | 8.9% |
| Total | 1,356 | 100.0% |
Internet Access in New Hope borough
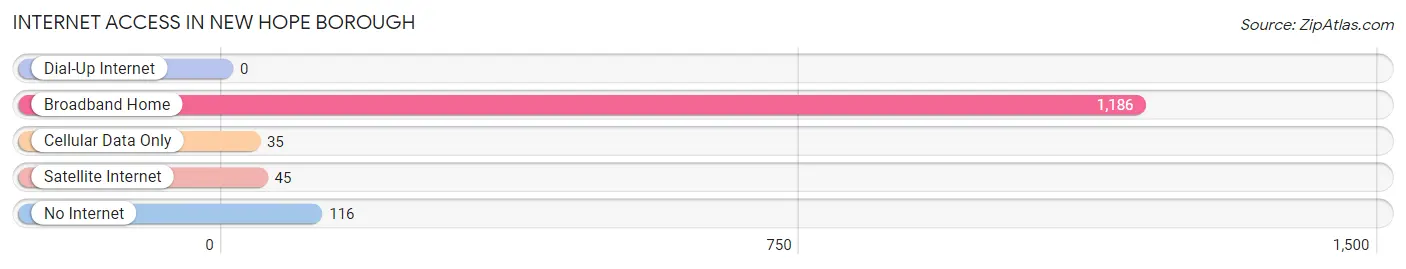
| Internet Type | # Households | % Households |
| Dial-Up Internet | 0 | 0.0% |
| Broadband Home | 1,186 | 87.5% |
| Cellular Data Only | 35 | 2.6% |
| Satellite Internet | 45 | 3.3% |
| No Internet | 116 | 8.6% |
| Total | 1,356 | 100.0% |
New Hope borough Summary
New Hope Borough is a small borough located in Bucks County, Pennsylvania. It is situated along the Delaware River, approximately 40 miles north of Philadelphia. The borough is known for its quaint downtown area, which is lined with historic buildings, shops, restaurants, and galleries. The borough is also home to a vibrant arts and culture scene, with numerous festivals and events held throughout the year.
History
New Hope Borough was founded in 1790 by William Penn's sons, Thomas and Richard. The town was originally named Coryell's Ferry, after the ferry service that operated on the Delaware River. In 1831, the name was changed to New Hope, after the nearby village of New Hope.
The borough was an important stop on the Underground Railroad, with many escaped slaves passing through the area. During the Civil War, the borough was a major supply center for the Union Army.
Geography
New Hope Borough is located in Bucks County, Pennsylvania, along the Delaware River. The borough covers an area of 1.3 square miles, with a population of 2,528 as of the 2010 census.
The borough is situated in a rural area, with rolling hills and wooded areas. The downtown area is located along the Delaware River, and is lined with historic buildings, shops, restaurants, and galleries.
Economy
The economy of New Hope Borough is largely based on tourism. The borough is a popular destination for visitors from Philadelphia and other nearby cities. The downtown area is home to numerous shops, restaurants, and galleries, as well as a variety of festivals and events throughout the year.
The borough is also home to several small businesses, including a brewery, a winery, and a distillery. The borough is also home to a number of technology companies, including a software development firm and a web design firm.
Demographics
As of the 2010 census, the population of New Hope Borough was 2,528. The racial makeup of the borough was 94.3% White, 2.2% African American, 0.4% Native American, 0.9% Asian, 0.1% Pacific Islander, 0.7% from other races, and 1.4% from two or more races. Hispanic or Latino of any race were 2.2% of the population.
The median household income in New Hope Borough was $63,750, and the median family income was $76,250. The per capita income was $35,945. About 4.3% of families and 6.2% of the population were below the poverty line, including 8.2% of those under age 18 and 4.2% of those age 65 or over.
Common Questions
What is Per Capita Income in New Hope borough?
Per Capita income in New Hope borough is $113,683.
What is the Median Family Income in New Hope borough?
Median Family Income in New Hope borough is $218,750.
What is the Median Household income in New Hope borough?
Median Household Income in New Hope borough is $117,143.
What is Income or Wage Gap in New Hope borough?
Income or Wage Gap in New Hope borough is 65.9%.
Women in New Hope borough earn 34.1 cents for every dollar earned by a man.
What is Inequality or Gini Index in New Hope borough?
Inequality or Gini Index in New Hope borough is 0.56.
What is the Total Population of New Hope borough?
Total Population of New Hope borough is 2,624.
What is the Total Male Population of New Hope borough?
Total Male Population of New Hope borough is 1,386.
What is the Total Female Population of New Hope borough?
Total Female Population of New Hope borough is 1,238.
What is the Ratio of Males per 100 Females in New Hope borough?
There are 111.95 Males per 100 Females in New Hope borough.
What is the Ratio of Females per 100 Males in New Hope borough?
There are 89.32 Females per 100 Males in New Hope borough.
What is the Median Population Age in New Hope borough?
Median Population Age in New Hope borough is 56.8 Years.
What is the Average Family Size in New Hope borough
Average Family Size in New Hope borough is 3.0 People.
What is the Average Household Size in New Hope borough
Average Household Size in New Hope borough is 1.9 People.
How Large is the Labor Force in New Hope borough?
There are 1,395 People in the Labor Forcein in New Hope borough.
What is the Percentage of People in the Labor Force in New Hope borough?
58.6% of People are in the Labor Force in New Hope borough.
What is the Unemployment Rate in New Hope borough?
Unemployment Rate in New Hope borough is 8.5%.