North Belle Vernon borough, PA Map & Demographics
North Belle Vernon borough Overview
$37,472
PER CAPITA INCOME
$64,412
AVG FAMILY INCOME
$51,293
AVG HOUSEHOLD INCOME
3.9%
WAGE / INCOME GAP [ % ]
96.1¢/ $1
WAGE / INCOME GAP [ $ ]
0.55
INEQUALITY / GINI INDEX
1,598
TOTAL POPULATION
758
MALE POPULATION
840
FEMALE POPULATION
90.24
MALES / 100 FEMALES
110.82
FEMALES / 100 MALES
46.0
MEDIAN AGE
2.9
AVG FAMILY SIZE
2.1
AVG HOUSEHOLD SIZE
830
LABOR FORCE [ PEOPLE ]
60.5%
PERCENT IN LABOR FORCE
8.3%
UNEMPLOYMENT RATE
Income in North Belle Vernon borough
Income Overview in North Belle Vernon borough
Per Capita Income in North Belle Vernon borough is $37,472, while median incomes of families and households are $64,412 and $51,293 respectively.
| Characteristic | Number | Measure |
| Per Capita Income | 1,598 | $37,472 |
| Median Family Income | 390 | $64,412 |
| Mean Family Income | 390 | $90,382 |
| Median Household Income | 750 | $51,293 |
| Mean Household Income | 750 | $78,967 |
| Income Deficit | 390 | $0 |
| Wage / Income Gap (%) | 1,598 | 3.95% |
| Wage / Income Gap ($) | 1,598 | 96.05¢ per $1 |
| Gini / Inequality Index | 1,598 | 0.55 |
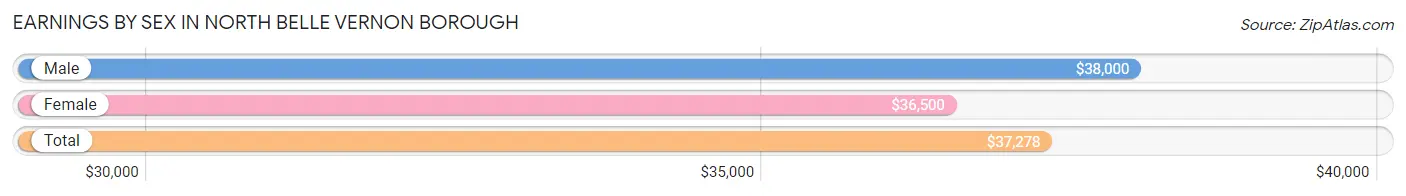
Earnings by Sex in North Belle Vernon borough
Average Earnings in North Belle Vernon borough are $37,278, $38,000 for men and $36,500 for women, a difference of 4.0%.
| Sex | Number | Average Earnings |
| Male | 432 (51.8%) | $38,000 |
| Female | 402 (48.2%) | $36,500 |
| Total | 834 (100.0%) | $37,278 |
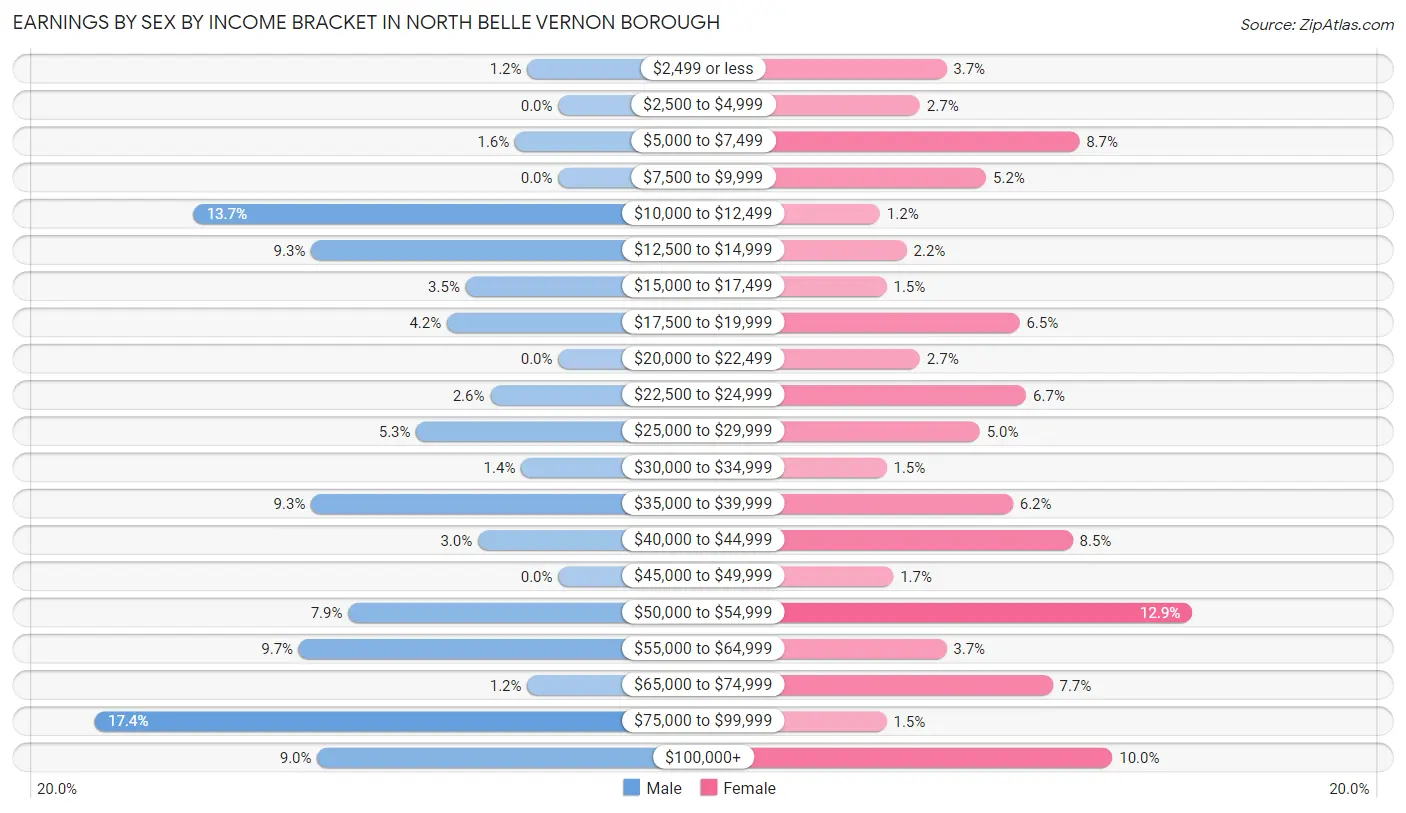
Earnings by Sex by Income Bracket in North Belle Vernon borough
The most common earnings brackets in North Belle Vernon borough are $75,000 to $99,999 for men (75 | 17.4%) and $50,000 to $54,999 for women (52 | 12.9%).
| Income | Male | Female |
| $2,499 or less | 5 (1.2%) | 15 (3.7%) |
| $2,500 to $4,999 | 0 (0.0%) | 11 (2.7%) |
| $5,000 to $7,499 | 7 (1.6%) | 35 (8.7%) |
| $7,500 to $9,999 | 0 (0.0%) | 21 (5.2%) |
| $10,000 to $12,499 | 59 (13.7%) | 5 (1.2%) |
| $12,500 to $14,999 | 40 (9.3%) | 9 (2.2%) |
| $15,000 to $17,499 | 15 (3.5%) | 6 (1.5%) |
| $17,500 to $19,999 | 18 (4.2%) | 26 (6.5%) |
| $20,000 to $22,499 | 0 (0.0%) | 11 (2.7%) |
| $22,500 to $24,999 | 11 (2.5%) | 27 (6.7%) |
| $25,000 to $29,999 | 23 (5.3%) | 20 (5.0%) |
| $30,000 to $34,999 | 6 (1.4%) | 6 (1.5%) |
| $35,000 to $39,999 | 40 (9.3%) | 25 (6.2%) |
| $40,000 to $44,999 | 13 (3.0%) | 34 (8.5%) |
| $45,000 to $49,999 | 0 (0.0%) | 7 (1.7%) |
| $50,000 to $54,999 | 34 (7.9%) | 52 (12.9%) |
| $55,000 to $64,999 | 42 (9.7%) | 15 (3.7%) |
| $65,000 to $74,999 | 5 (1.2%) | 31 (7.7%) |
| $75,000 to $99,999 | 75 (17.4%) | 6 (1.5%) |
| $100,000+ | 39 (9.0%) | 40 (10.0%) |
| Total | 432 (100.0%) | 402 (100.0%) |
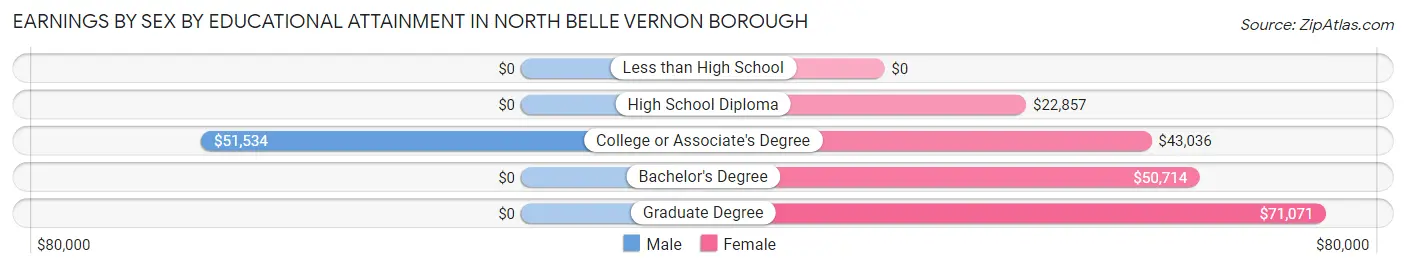
Earnings by Sex by Educational Attainment in North Belle Vernon borough
Average earnings in North Belle Vernon borough are $41,442 for men and $40,438 for women, a difference of 2.4%. Men with an educational attainment of college or associate's degree enjoy the highest average annual earnings of $51,534, while those with college or associate's degree education earn the least with $51,534. Women with an educational attainment of graduate degree earn the most with the average annual earnings of $71,071, while those with high school diploma education have the smallest earnings of $22,857.
| Educational Attainment | Male Income | Female Income |
| Less than High School | - | - |
| High School Diploma | - | - |
| College or Associate's Degree | $51,534 | $43,036 |
| Bachelor's Degree | - | - |
| Graduate Degree | - | - |
| Total | $41,442 | $40,438 |
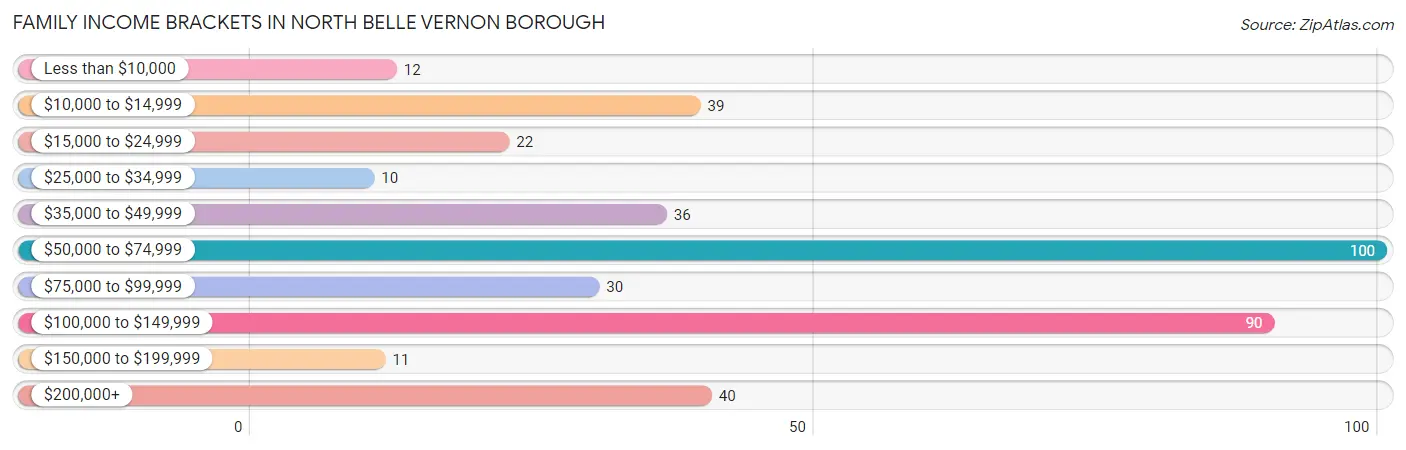
Family Income in North Belle Vernon borough
Family Income Brackets in North Belle Vernon borough
According to the North Belle Vernon borough family income data, there are 100 families falling into the $50,000 to $74,999 income range, which is the most common income bracket and makes up 25.6% of all families. Conversely, the $25,000 to $34,999 income bracket is the least frequent group with only 10 families (2.6%) belonging to this category.
| Income Bracket | # Families | % Families |
| Less than $10,000 | 12 | 3.1% |
| $10,000 to $14,999 | 39 | 10.0% |
| $15,000 to $24,999 | 22 | 5.6% |
| $25,000 to $34,999 | 10 | 2.6% |
| $35,000 to $49,999 | 36 | 9.2% |
| $50,000 to $74,999 | 100 | 25.6% |
| $75,000 to $99,999 | 30 | 7.7% |
| $100,000 to $149,999 | 90 | 23.1% |
| $150,000 to $199,999 | 11 | 2.8% |
| $200,000+ | 40 | 10.3% |
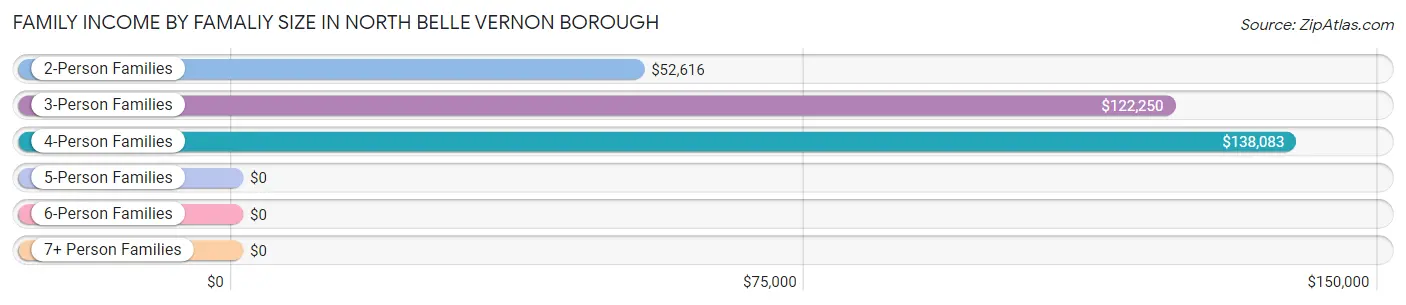
Family Income by Famaliy Size in North Belle Vernon borough
4-person families (73 | 18.7%) account for the highest median family income in North Belle Vernon borough with $138,083 per family, while 3-person families (63 | 16.2%) have the highest median income of $40,750 per family member.
| Income Bracket | # Families | Median Income |
| 2-Person Families | 222 (56.9%) | $52,616 |
| 3-Person Families | 63 (16.2%) | $122,250 |
| 4-Person Families | 73 (18.7%) | $138,083 |
| 5-Person Families | 25 (6.4%) | $0 |
| 6-Person Families | 7 (1.8%) | $0 |
| 7+ Person Families | 0 (0.0%) | $0 |
| Total | 390 (100.0%) | $64,412 |
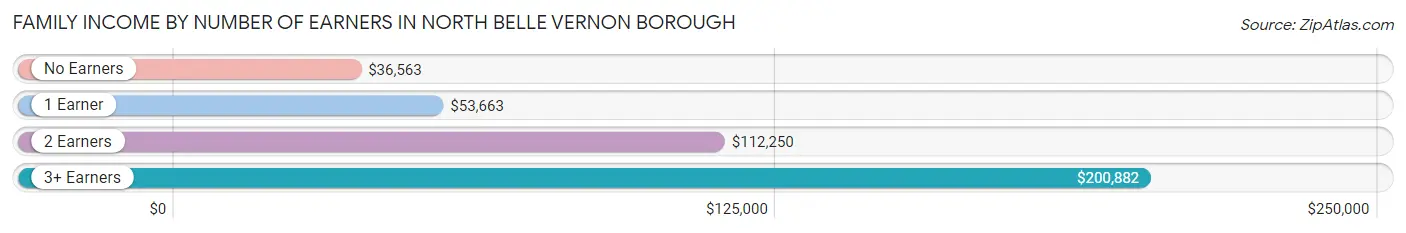
Family Income by Number of Earners in North Belle Vernon borough
The median family income in North Belle Vernon borough is $64,412, with families comprising 3+ earners (44) having the highest median family income of $200,882, while families with no earners (63) have the lowest median family income of $36,563, accounting for 11.3% and 16.2% of families, respectively.
| Number of Earners | # Families | Median Income |
| No Earners | 63 (16.2%) | $36,563 |
| 1 Earner | 176 (45.1%) | $53,663 |
| 2 Earners | 107 (27.4%) | $112,250 |
| 3+ Earners | 44 (11.3%) | $200,882 |
| Total | 390 (100.0%) | $64,412 |
Household Income in North Belle Vernon borough
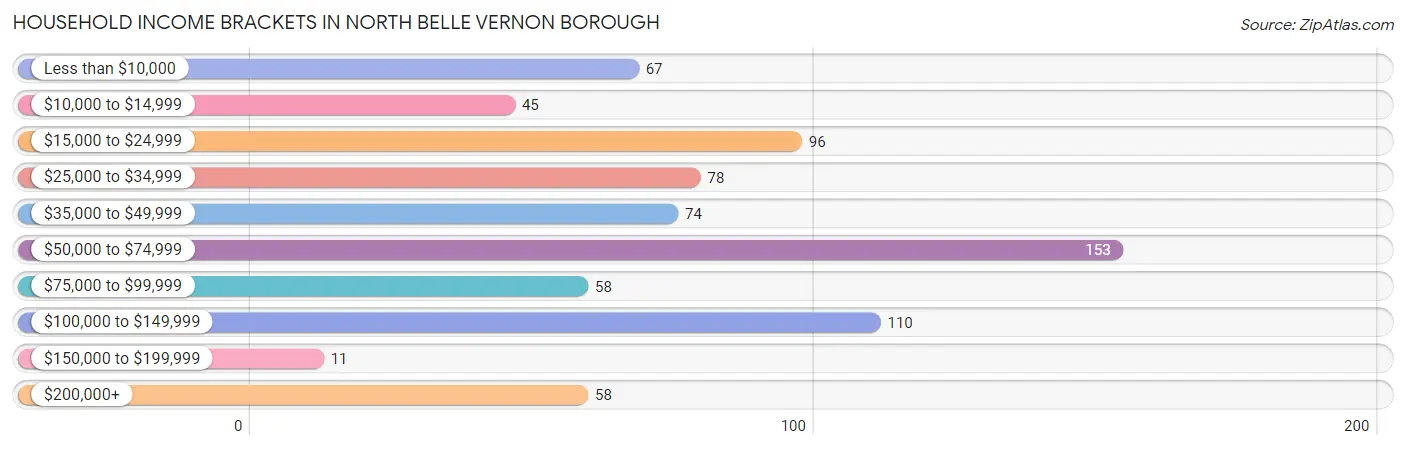
Household Income Brackets in North Belle Vernon borough
With 153 households falling in the category, the $50,000 to $74,999 income range is the most frequent in North Belle Vernon borough, accounting for 20.4% of all households. In contrast, only 11 households (1.5%) fall into the $150,000 to $199,999 income bracket, making it the least populous group.
| Income Bracket | # Households | % Households |
| Less than $10,000 | 67 | 8.9% |
| $10,000 to $14,999 | 45 | 6.0% |
| $15,000 to $24,999 | 96 | 12.8% |
| $25,000 to $34,999 | 78 | 10.4% |
| $35,000 to $49,999 | 74 | 9.9% |
| $50,000 to $74,999 | 153 | 20.4% |
| $75,000 to $99,999 | 58 | 7.7% |
| $100,000 to $149,999 | 110 | 14.7% |
| $150,000 to $199,999 | 11 | 1.5% |
| $200,000+ | 58 | 7.7% |
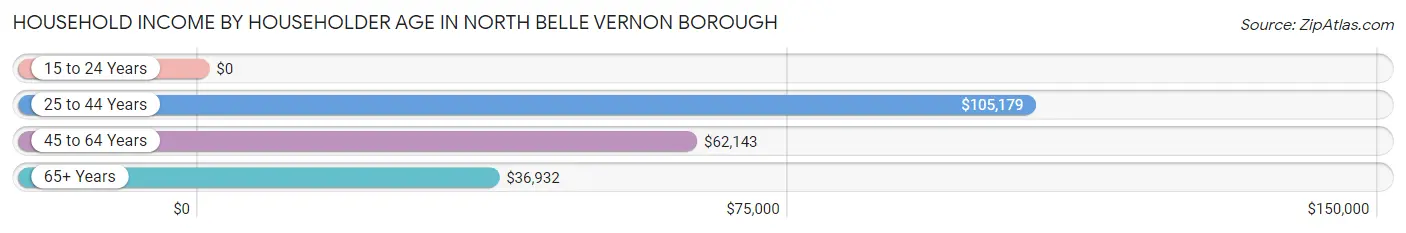
Household Income by Householder Age in North Belle Vernon borough
The median household income in North Belle Vernon borough is $51,293, with the highest median household income of $105,179 found in the 25 to 44 years age bracket for the primary householder. A total of 148 households (19.7%) fall into this category. Meanwhile, the 15 to 24 years age bracket for the primary householder has the lowest median household income of $0, with 35 households (4.7%) in this group.
| Income Bracket | # Households | Median Income |
| 15 to 24 Years | 35 (4.7%) | $0 |
| 25 to 44 Years | 148 (19.7%) | $105,179 |
| 45 to 64 Years | 316 (42.1%) | $62,143 |
| 65+ Years | 251 (33.5%) | $36,932 |
| Total | 750 (100.0%) | $51,293 |
Poverty in North Belle Vernon borough
Income Below Poverty by Sex and Age in North Belle Vernon borough
With 21.6% poverty level for males and 15.4% for females among the residents of North Belle Vernon borough, 12 to 14 year old males and 5 year old females are the most vulnerable to poverty, with 37 males (62.7%) and 6 females (100.0%) in their respective age groups living below the poverty level.
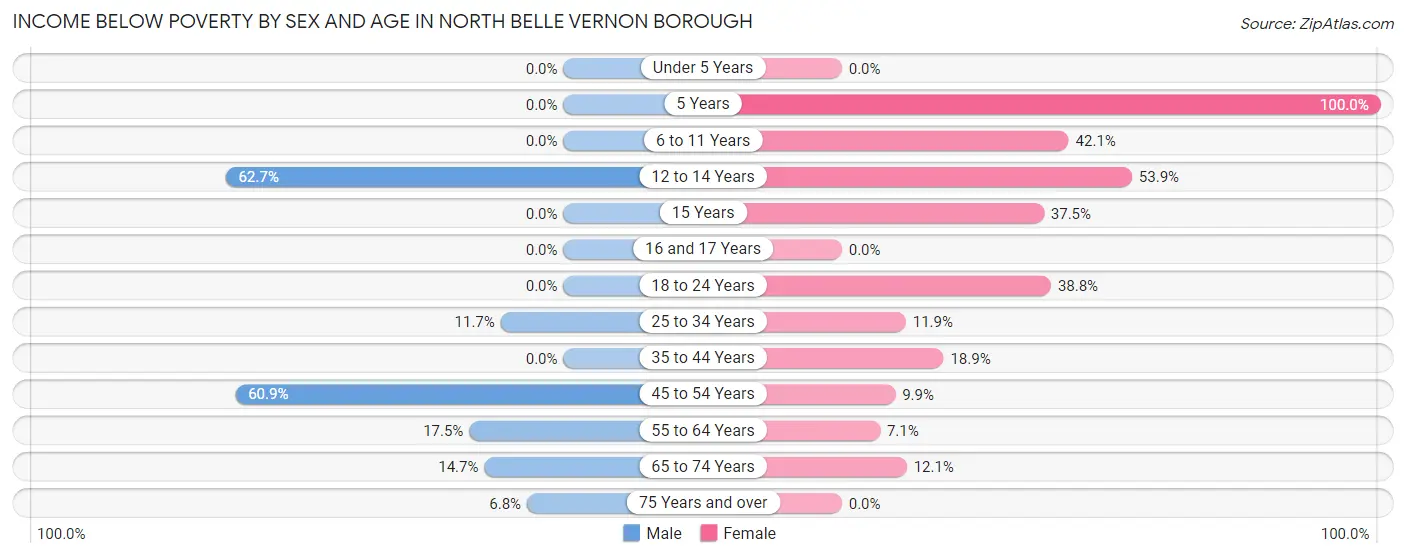
| Age Bracket | Male | Female |
| Under 5 Years | 0 (0.0%) | 0 (0.0%) |
| 5 Years | 0 (0.0%) | 6 (100.0%) |
| 6 to 11 Years | 0 (0.0%) | 24 (42.1%) |
| 12 to 14 Years | 37 (62.7%) | 7 (53.8%) |
| 15 Years | 0 (0.0%) | 6 (37.5%) |
| 16 and 17 Years | 0 (0.0%) | 0 (0.0%) |
| 18 to 24 Years | 0 (0.0%) | 33 (38.8%) |
| 25 to 34 Years | 12 (11.7%) | 12 (11.9%) |
| 35 to 44 Years | 0 (0.0%) | 10 (18.9%) |
| 45 to 54 Years | 81 (60.9%) | 11 (9.9%) |
| 55 to 64 Years | 18 (17.5%) | 10 (7.1%) |
| 65 to 74 Years | 11 (14.7%) | 10 (12.0%) |
| 75 Years and over | 5 (6.8%) | 0 (0.0%) |
| Total | 164 (21.6%) | 129 (15.4%) |
Income Above Poverty by Sex and Age in North Belle Vernon borough
According to the poverty statistics in North Belle Vernon borough, males aged under 5 years and females aged under 5 years are the age groups that are most secure financially, with 100.0% of males and 100.0% of females in these age groups living above the poverty line.
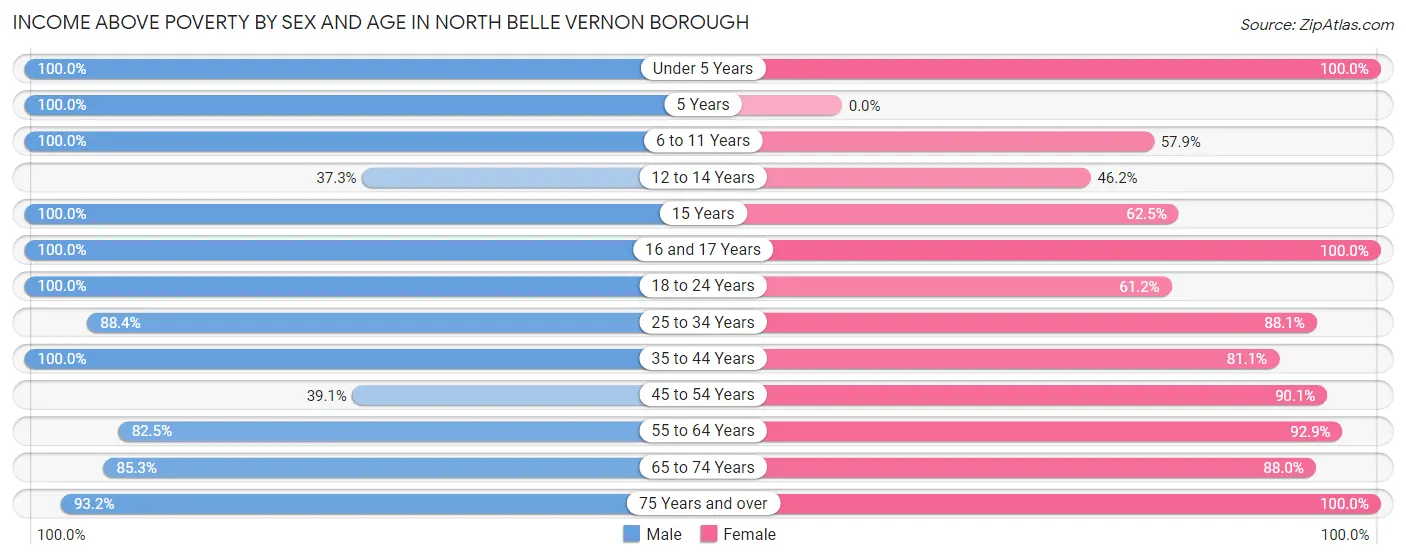
| Age Bracket | Male | Female |
| Under 5 Years | 12 (100.0%) | 43 (100.0%) |
| 5 Years | 9 (100.0%) | 0 (0.0%) |
| 6 to 11 Years | 5 (100.0%) | 33 (57.9%) |
| 12 to 14 Years | 22 (37.3%) | 6 (46.2%) |
| 15 Years | 6 (100.0%) | 10 (62.5%) |
| 16 and 17 Years | 33 (100.0%) | 38 (100.0%) |
| 18 to 24 Years | 87 (100.0%) | 52 (61.2%) |
| 25 to 34 Years | 91 (88.3%) | 89 (88.1%) |
| 35 to 44 Years | 59 (100.0%) | 43 (81.1%) |
| 45 to 54 Years | 52 (39.1%) | 100 (90.1%) |
| 55 to 64 Years | 85 (82.5%) | 131 (92.9%) |
| 65 to 74 Years | 64 (85.3%) | 73 (87.9%) |
| 75 Years and over | 69 (93.2%) | 93 (100.0%) |
| Total | 594 (78.4%) | 711 (84.6%) |
Income Below Poverty Among Married-Couple Families in North Belle Vernon borough
The poverty statistics for married-couple families in North Belle Vernon borough show that 4.5% or 10 of the total 220 families live below the poverty line. Families with 1 or 2 children have the highest poverty rate of 6.0%, comprising of 5 families. On the other hand, families with 3 or 4 children have the lowest poverty rate of 0.0%, which includes 0 families.
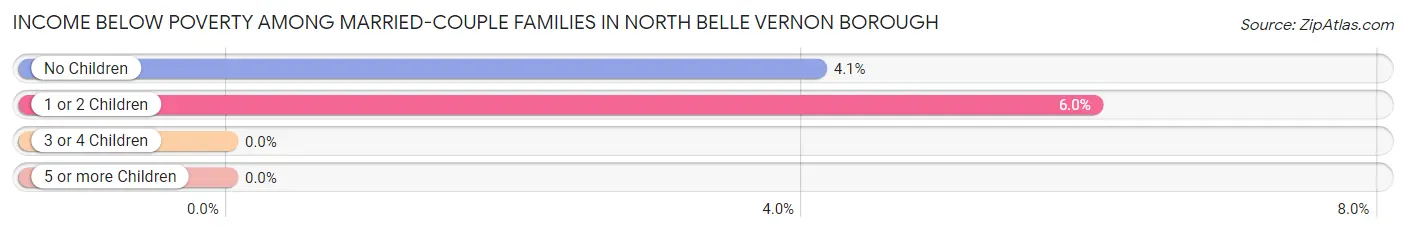
| Children | Above Poverty | Below Poverty |
| No Children | 117 (95.9%) | 5 (4.1%) |
| 1 or 2 Children | 78 (94.0%) | 5 (6.0%) |
| 3 or 4 Children | 15 (100.0%) | 0 (0.0%) |
| 5 or more Children | 0 (0.0%) | 0 (0.0%) |
| Total | 210 (95.5%) | 10 (4.5%) |
Income Below Poverty Among Single-Parent Households in North Belle Vernon borough
According to the poverty data in North Belle Vernon borough, 52.3% or 34 single-father households and 16.2% or 17 single-mother households are living below the poverty line. Among single-father households, those with 1 or 2 children have the highest poverty rate, with 34 households (100.0%) experiencing poverty. Likewise, among single-mother households, those with 3 or 4 children have the highest poverty rate, with 12 households (100.0%) falling below the poverty line.
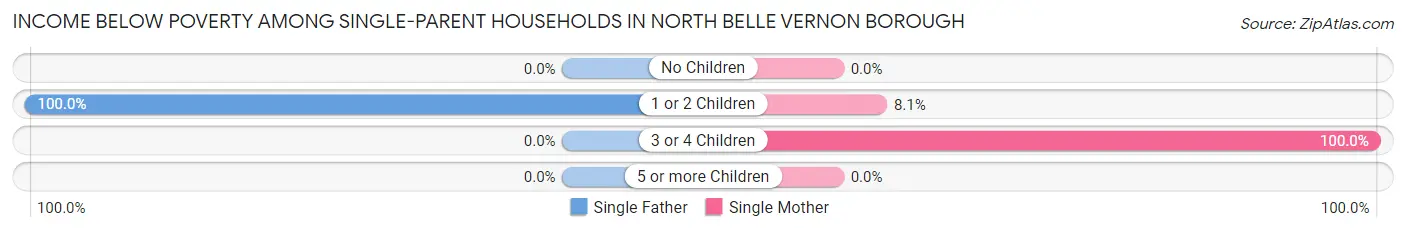
| Children | Single Father | Single Mother |
| No Children | 0 (0.0%) | 0 (0.0%) |
| 1 or 2 Children | 34 (100.0%) | 5 (8.1%) |
| 3 or 4 Children | 0 (0.0%) | 12 (100.0%) |
| 5 or more Children | 0 (0.0%) | 0 (0.0%) |
| Total | 34 (52.3%) | 17 (16.2%) |
Income Below Poverty Among Married-Couple vs Single-Parent Households in North Belle Vernon borough
The poverty data for North Belle Vernon borough shows that 10 of the married-couple family households (4.5%) and 51 of the single-parent households (30.0%) are living below the poverty level. Within the married-couple family households, those with 1 or 2 children have the highest poverty rate, with 5 households (6.0%) falling below the poverty line. Among the single-parent households, those with 3 or 4 children have the highest poverty rate, with 12 household (100.0%) living below poverty.
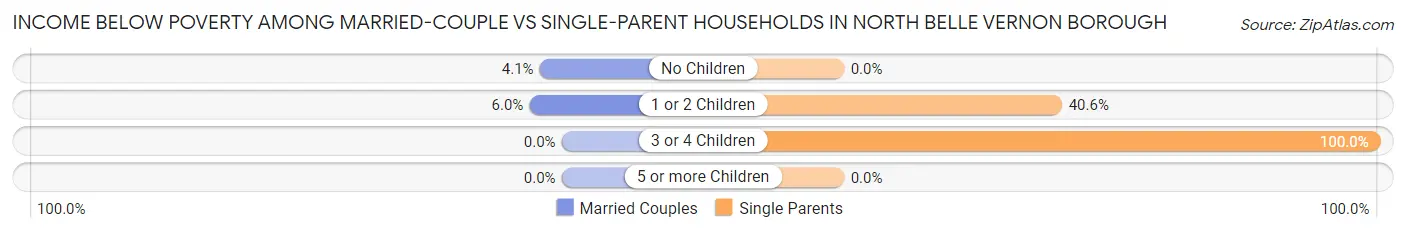
| Children | Married-Couple Families | Single-Parent Households |
| No Children | 5 (4.1%) | 0 (0.0%) |
| 1 or 2 Children | 5 (6.0%) | 39 (40.6%) |
| 3 or 4 Children | 0 (0.0%) | 12 (100.0%) |
| 5 or more Children | 0 (0.0%) | 0 (0.0%) |
| Total | 10 (4.5%) | 51 (30.0%) |
Race in North Belle Vernon borough
The most populous races in North Belle Vernon borough are White / Caucasian (1,451 | 90.8%), Black / African American (53 | 3.3%), and Asian (45 | 2.8%).
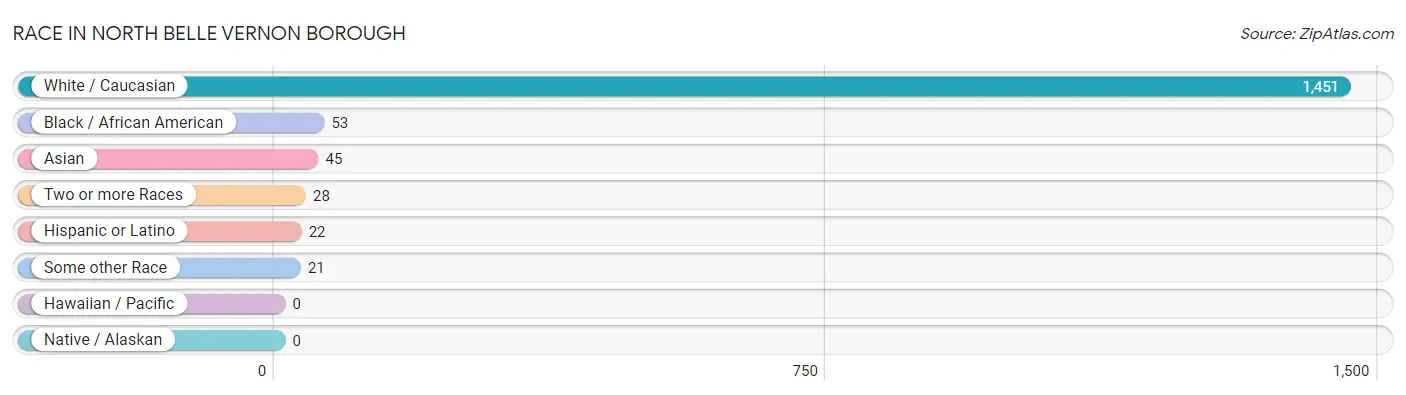
| Race | # Population | % Population |
| Asian | 45 | 2.8% |
| Black / African American | 53 | 3.3% |
| Hawaiian / Pacific | 0 | 0.0% |
| Hispanic or Latino | 22 | 1.4% |
| Native / Alaskan | 0 | 0.0% |
| White / Caucasian | 1,451 | 90.8% |
| Two or more Races | 28 | 1.8% |
| Some other Race | 21 | 1.3% |
| Total | 1,598 | 100.0% |
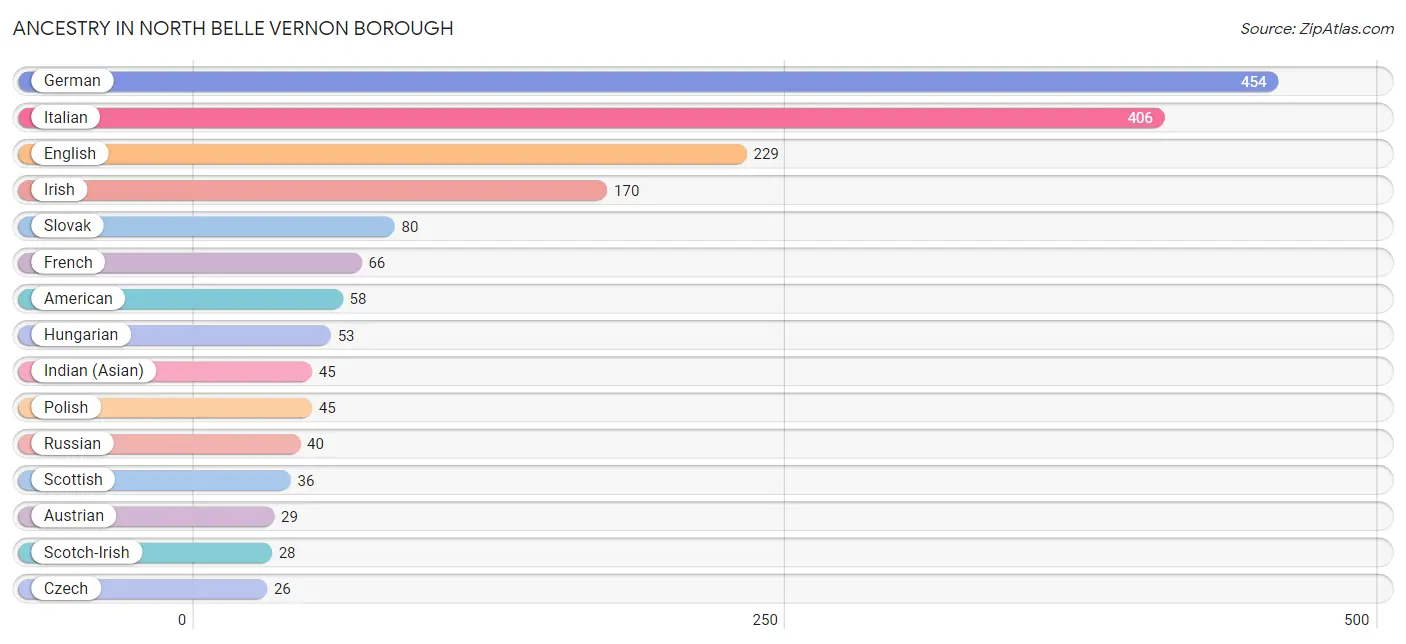
Ancestry in North Belle Vernon borough
The most populous ancestries reported in North Belle Vernon borough are German (454 | 28.4%), Italian (406 | 25.4%), English (229 | 14.3%), Irish (170 | 10.6%), and Slovak (80 | 5.0%), together accounting for 83.8% of all North Belle Vernon borough residents.
| Ancestry | # Population | % Population |
| American | 58 | 3.6% |
| Arab | 16 | 1.0% |
| Austrian | 29 | 1.8% |
| Blackfeet | 5 | 0.3% |
| Central American | 21 | 1.3% |
| Cherokee | 5 | 0.3% |
| Croatian | 23 | 1.4% |
| Czech | 26 | 1.6% |
| Czechoslovakian | 16 | 1.0% |
| Dutch | 10 | 0.6% |
| Eastern European | 8 | 0.5% |
| English | 229 | 14.3% |
| Finnish | 12 | 0.7% |
| French | 66 | 4.1% |
| German | 454 | 28.4% |
| Greek | 13 | 0.8% |
| Guatemalan | 21 | 1.3% |
| Hungarian | 53 | 3.3% |
| Indian (Asian) | 45 | 2.8% |
| Irish | 170 | 10.6% |
| Italian | 406 | 25.4% |
| Mexican | 1 | 0.1% |
| Polish | 45 | 2.8% |
| Russian | 40 | 2.5% |
| Scandinavian | 4 | 0.3% |
| Scotch-Irish | 28 | 1.8% |
| Scottish | 36 | 2.2% |
| Slovak | 80 | 5.0% |
| Slovene | 23 | 1.4% |
| Swedish | 6 | 0.4% |
| Syrian | 16 | 1.0% |
| Ukrainian | 4 | 0.3% |
| Welsh | 18 | 1.1% | View All 33 Rows |
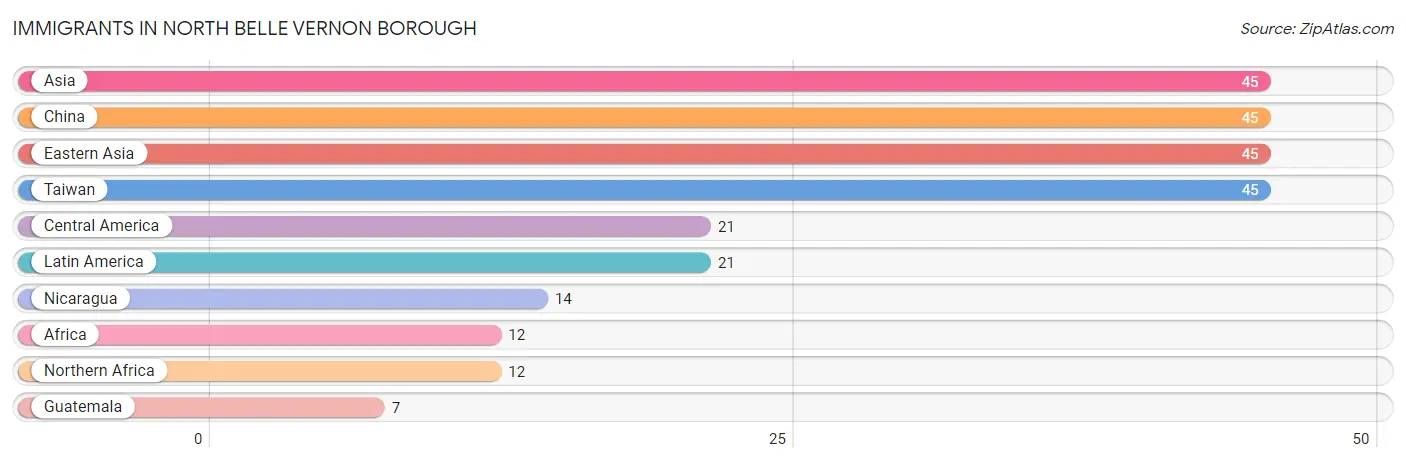
Immigrants in North Belle Vernon borough
The most numerous immigrant groups reported in North Belle Vernon borough came from Asia (45 | 2.8%), China (45 | 2.8%), Eastern Asia (45 | 2.8%), Taiwan (45 | 2.8%), and Central America (21 | 1.3%), together accounting for 12.6% of all North Belle Vernon borough residents.
| Immigration Origin | # Population | % Population |
| Africa | 12 | 0.7% |
| Asia | 45 | 2.8% |
| Central America | 21 | 1.3% |
| China | 45 | 2.8% |
| Eastern Asia | 45 | 2.8% |
| Guatemala | 7 | 0.4% |
| Latin America | 21 | 1.3% |
| Nicaragua | 14 | 0.9% |
| Northern Africa | 12 | 0.7% |
| Taiwan | 45 | 2.8% | View All 10 Rows |
Sex and Age in North Belle Vernon borough
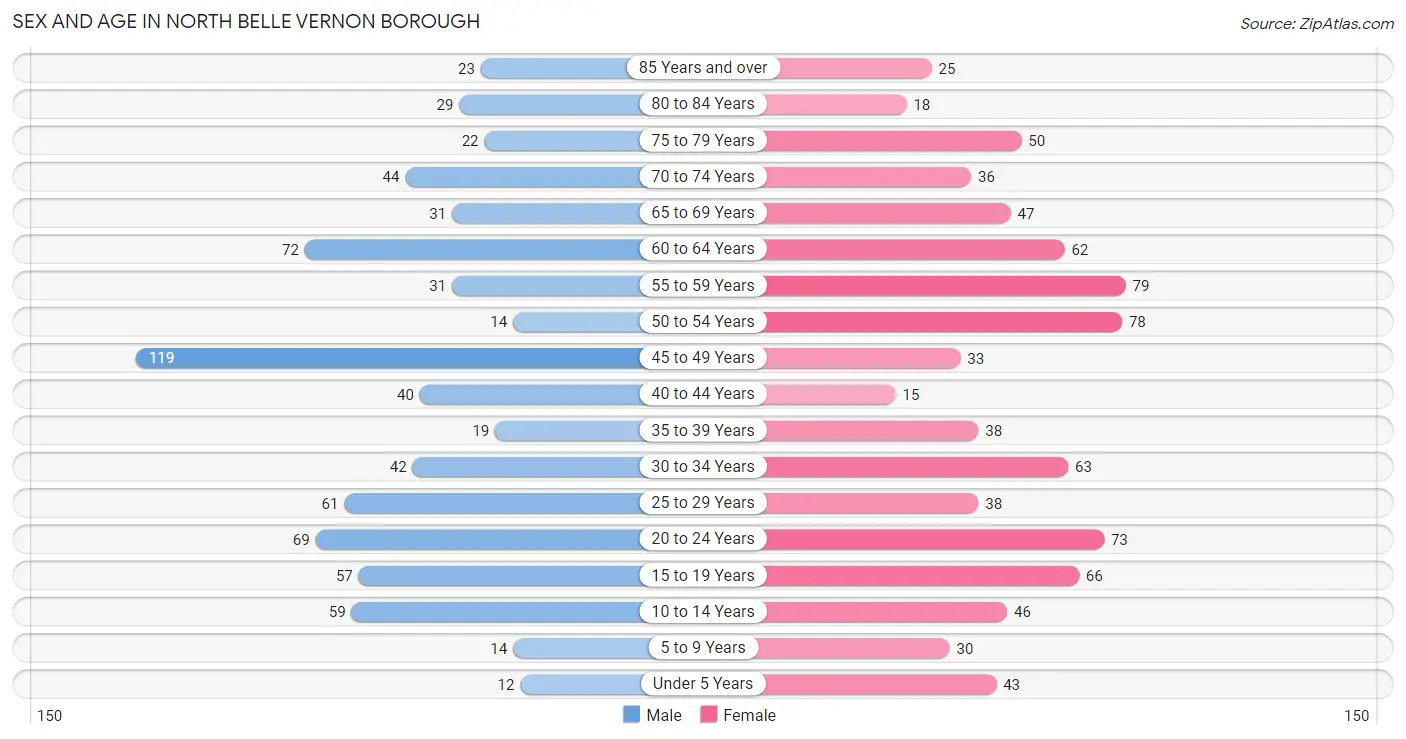
Sex and Age in North Belle Vernon borough
The most populous age groups in North Belle Vernon borough are 45 to 49 Years (119 | 15.7%) for men and 55 to 59 Years (79 | 9.4%) for women.
| Age Bracket | Male | Female |
| Under 5 Years | 12 (1.6%) | 43 (5.1%) |
| 5 to 9 Years | 14 (1.8%) | 30 (3.6%) |
| 10 to 14 Years | 59 (7.8%) | 46 (5.5%) |
| 15 to 19 Years | 57 (7.5%) | 66 (7.9%) |
| 20 to 24 Years | 69 (9.1%) | 73 (8.7%) |
| 25 to 29 Years | 61 (8.1%) | 38 (4.5%) |
| 30 to 34 Years | 42 (5.5%) | 63 (7.5%) |
| 35 to 39 Years | 19 (2.5%) | 38 (4.5%) |
| 40 to 44 Years | 40 (5.3%) | 15 (1.8%) |
| 45 to 49 Years | 119 (15.7%) | 33 (3.9%) |
| 50 to 54 Years | 14 (1.8%) | 78 (9.3%) |
| 55 to 59 Years | 31 (4.1%) | 79 (9.4%) |
| 60 to 64 Years | 72 (9.5%) | 62 (7.4%) |
| 65 to 69 Years | 31 (4.1%) | 47 (5.6%) |
| 70 to 74 Years | 44 (5.8%) | 36 (4.3%) |
| 75 to 79 Years | 22 (2.9%) | 50 (5.9%) |
| 80 to 84 Years | 29 (3.8%) | 18 (2.1%) |
| 85 Years and over | 23 (3.0%) | 25 (3.0%) |
| Total | 758 (100.0%) | 840 (100.0%) |
Families and Households in North Belle Vernon borough
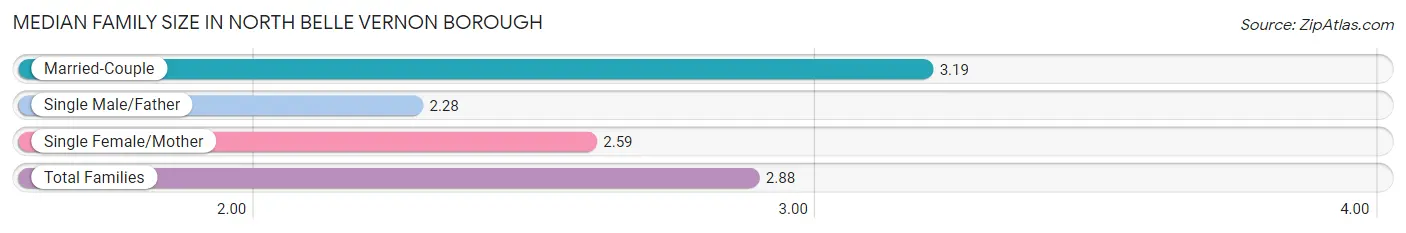
Median Family Size in North Belle Vernon borough
The median family size in North Belle Vernon borough is 2.88 persons per family, with married-couple families (220 | 56.4%) accounting for the largest median family size of 3.19 persons per family. On the other hand, single male/father families (65 | 16.7%) represent the smallest median family size with 2.28 persons per family.
| Family Type | # Families | Family Size |
| Married-Couple | 220 (56.4%) | 3.19 |
| Single Male/Father | 65 (16.7%) | 2.28 |
| Single Female/Mother | 105 (26.9%) | 2.59 |
| Total Families | 390 (100.0%) | 2.88 |
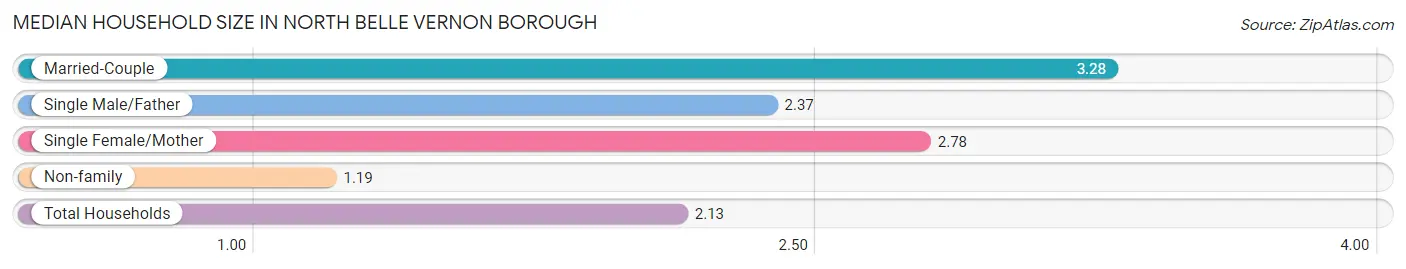
Median Household Size in North Belle Vernon borough
The median household size in North Belle Vernon borough is 2.13 persons per household, with married-couple households (220 | 29.3%) accounting for the largest median household size of 3.28 persons per household. non-family households (360 | 48.0%) represent the smallest median household size with 1.19 persons per household.
| Household Type | # Households | Household Size |
| Married-Couple | 220 (29.3%) | 3.28 |
| Single Male/Father | 65 (8.7%) | 2.37 |
| Single Female/Mother | 105 (14.0%) | 2.78 |
| Non-family | 360 (48.0%) | 1.19 |
| Total Households | 750 (100.0%) | 2.13 |
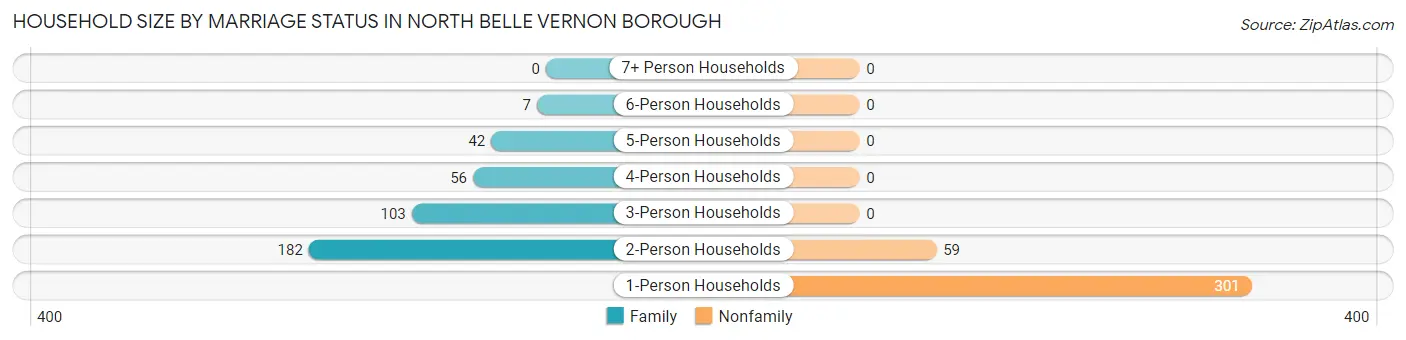
Household Size by Marriage Status in North Belle Vernon borough
Out of a total of 750 households in North Belle Vernon borough, 390 (52.0%) are family households, while 360 (48.0%) are nonfamily households. The most numerous type of family households are 2-person households, comprising 182, and the most common type of nonfamily households are 1-person households, comprising 301.
| Household Size | Family Households | Nonfamily Households |
| 1-Person Households | - | 301 (40.1%) |
| 2-Person Households | 182 (24.3%) | 59 (7.9%) |
| 3-Person Households | 103 (13.7%) | 0 (0.0%) |
| 4-Person Households | 56 (7.5%) | 0 (0.0%) |
| 5-Person Households | 42 (5.6%) | 0 (0.0%) |
| 6-Person Households | 7 (0.9%) | 0 (0.0%) |
| 7+ Person Households | 0 (0.0%) | 0 (0.0%) |
| Total | 390 (52.0%) | 360 (48.0%) |
Female Fertility in North Belle Vernon borough
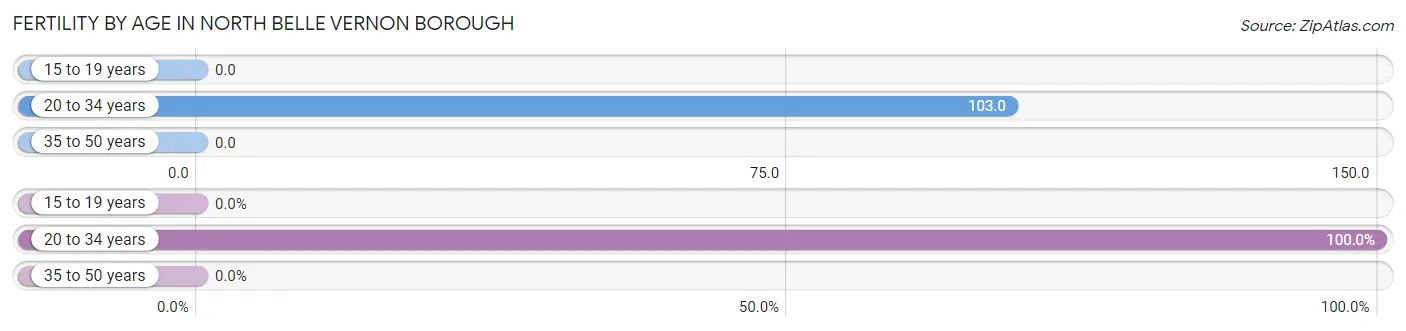
Fertility by Age in North Belle Vernon borough
Average fertility rate in North Belle Vernon borough is 53.0 births per 1,000 women. Women in the age bracket of 20 to 34 years have the highest fertility rate with 103.0 births per 1,000 women. Women in the age bracket of 20 to 34 years acount for 100.0% of all women with births.
| Age Bracket | Women with Births | Births / 1,000 Women |
| 15 to 19 years | 0 (0.0%) | 0.0 |
| 20 to 34 years | 18 (100.0%) | 103.0 |
| 35 to 50 years | 0 (0.0%) | 0.0 |
| Total | 18 (100.0%) | 53.0 |
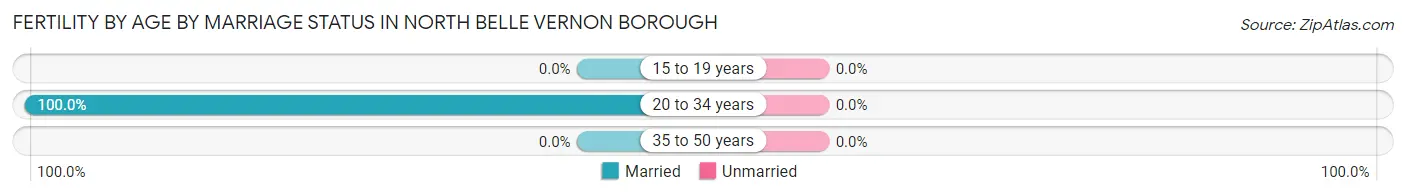
Fertility by Age by Marriage Status in North Belle Vernon borough
| Age Bracket | Married | Unmarried |
| 15 to 19 years | 0 (0.0%) | 0 (0.0%) |
| 20 to 34 years | 18 (100.0%) | 0 (0.0%) |
| 35 to 50 years | 0 (0.0%) | 0 (0.0%) |
| Total | 18 (100.0%) | 0 (0.0%) |
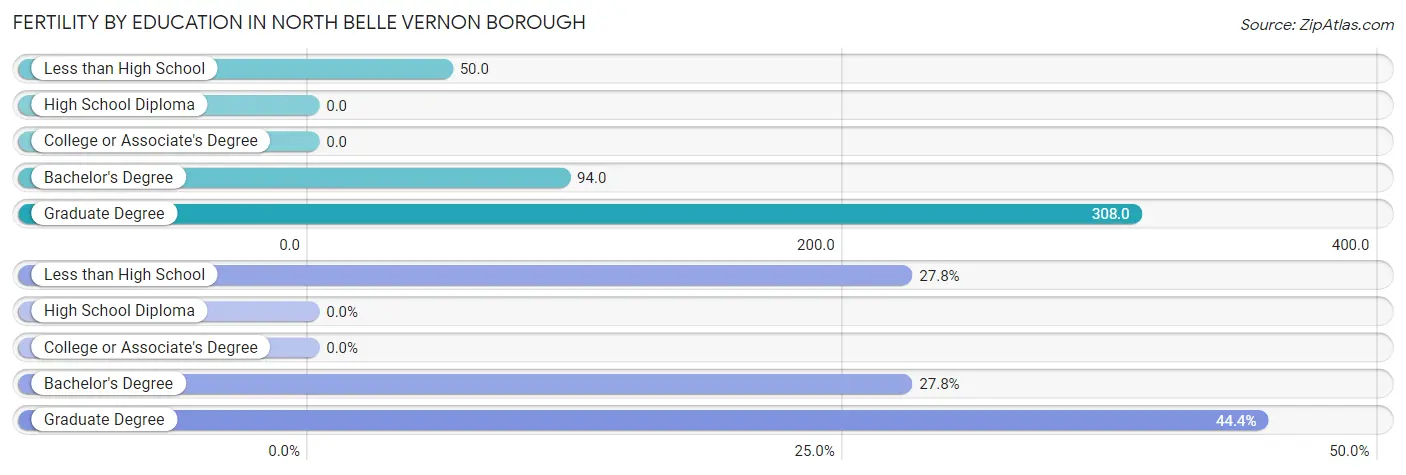
Fertility by Education in North Belle Vernon borough
| Educational Attainment | Women with Births | Births / 1,000 Women |
| Less than High School | 5 (27.8%) | 50.0 |
| High School Diploma | 0 (0.0%) | 0.0 |
| College or Associate's Degree | 0 (0.0%) | 0.0 |
| Bachelor's Degree | 5 (27.8%) | 94.0 |
| Graduate Degree | 8 (44.4%) | 308.0 |
| Total | 18 (100.0%) | 53.0 |
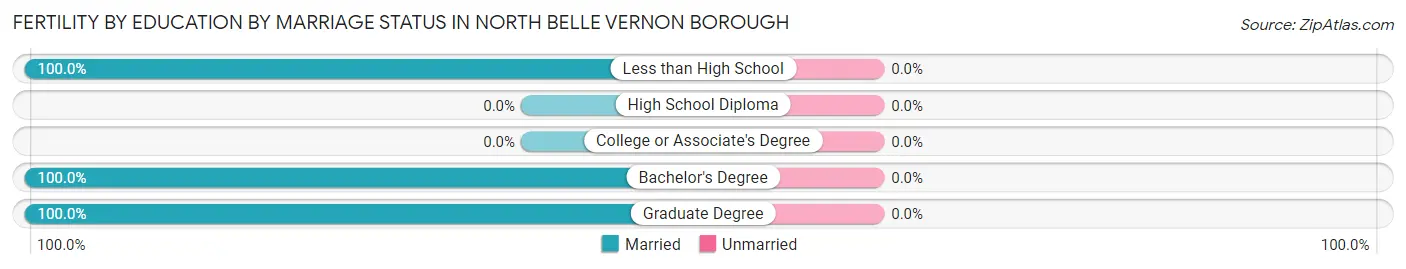
Fertility by Education by Marriage Status in North Belle Vernon borough
| Educational Attainment | Married | Unmarried |
| Less than High School | 5 (100.0%) | 0 (0.0%) |
| High School Diploma | 0 (0.0%) | 0 (0.0%) |
| College or Associate's Degree | 0 (0.0%) | 0 (0.0%) |
| Bachelor's Degree | 5 (100.0%) | 0 (0.0%) |
| Graduate Degree | 8 (100.0%) | 0 (0.0%) |
| Total | 18 (100.0%) | 0 (0.0%) |
Employment Characteristics in North Belle Vernon borough
Employment by Class of Employer in North Belle Vernon borough
Among the 744 employed individuals in North Belle Vernon borough, private company employees (536 | 72.0%), not-for-profit organizations (99 | 13.3%), and local government employees (50 | 6.7%) make up the most common classes of employment.
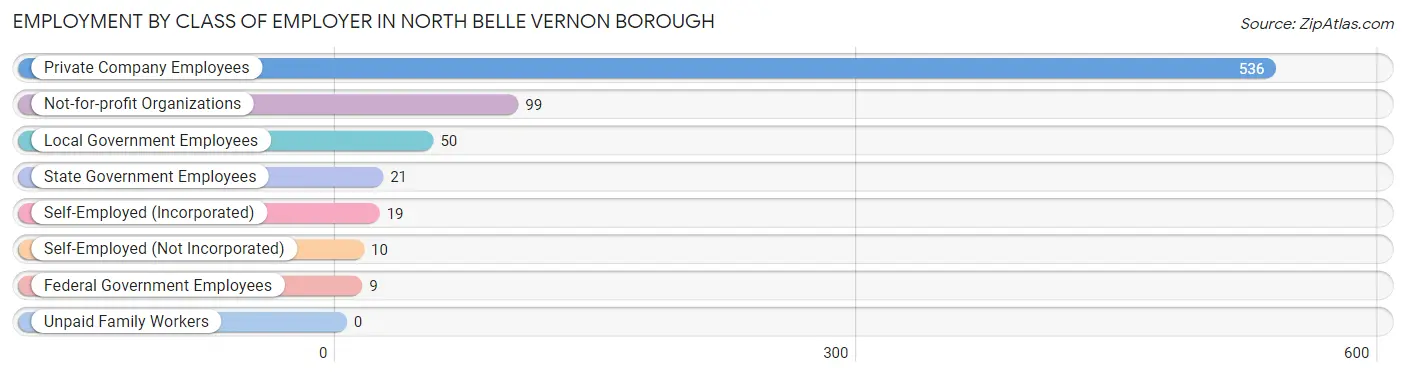
| Employer Class | # Employees | % Employees |
| Private Company Employees | 536 | 72.0% |
| Self-Employed (Incorporated) | 19 | 2.5% |
| Self-Employed (Not Incorporated) | 10 | 1.3% |
| Not-for-profit Organizations | 99 | 13.3% |
| Local Government Employees | 50 | 6.7% |
| State Government Employees | 21 | 2.8% |
| Federal Government Employees | 9 | 1.2% |
| Unpaid Family Workers | 0 | 0.0% |
| Total | 744 | 100.0% |
Employment Status by Age in North Belle Vernon borough
According to the labor force statistics for North Belle Vernon borough, out of the total population over 16 years of age (1,372), 60.5% or 830 individuals are in the labor force, with 8.3% or 69 of them unemployed. The age group with the highest labor force participation rate is 25 to 29 years, with 93.9% or 93 individuals in the labor force. Within the labor force, the 16 to 19 years age range has the highest percentage of unemployed individuals, with 78.3% or 18 of them being unemployed.
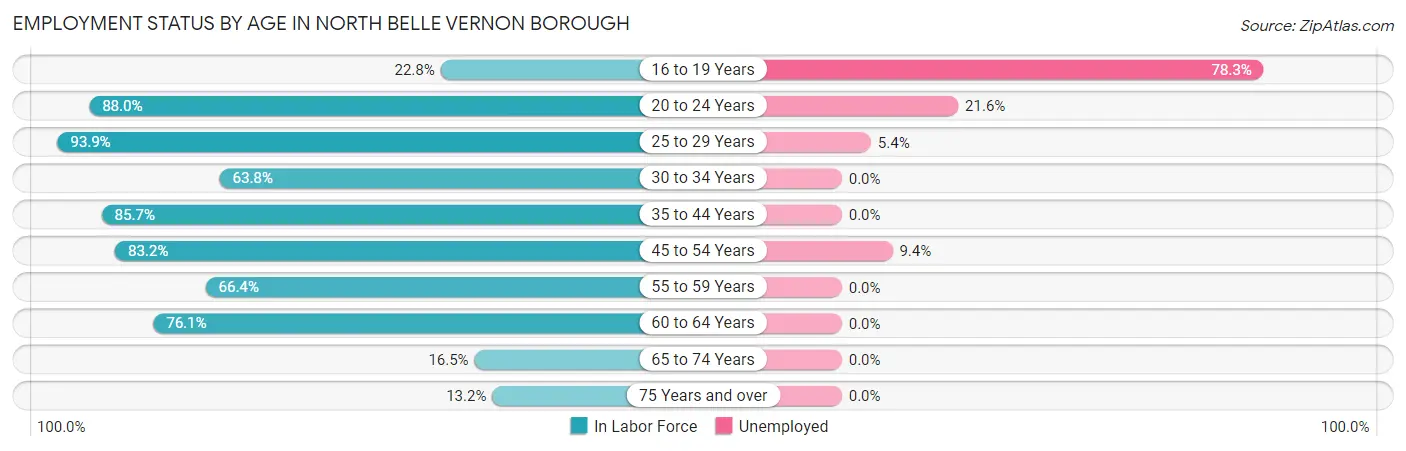
| Age Bracket | In Labor Force | Unemployed |
| 16 to 19 Years | 23 (22.8%) | 18 (78.3%) |
| 20 to 24 Years | 125 (88.0%) | 27 (21.6%) |
| 25 to 29 Years | 93 (93.9%) | 5 (5.4%) |
| 30 to 34 Years | 67 (63.8%) | 0 (0.0%) |
| 35 to 44 Years | 96 (85.7%) | 0 (0.0%) |
| 45 to 54 Years | 203 (83.2%) | 19 (9.4%) |
| 55 to 59 Years | 73 (66.4%) | 0 (0.0%) |
| 60 to 64 Years | 102 (76.1%) | 0 (0.0%) |
| 65 to 74 Years | 26 (16.5%) | 0 (0.0%) |
| 75 Years and over | 22 (13.2%) | 0 (0.0%) |
| Total | 830 (60.5%) | 69 (8.3%) |
Employment Status by Educational Attainment in North Belle Vernon borough
According to labor force statistics for North Belle Vernon borough, 78.9% of individuals (634) out of the total population between 25 and 64 years of age (804) are in the labor force, with 3.8% or 24 of them being unemployed. The group with the highest labor force participation rate are those with the educational attainment of bachelor's degree or higher, with 86.8% or 243 individuals in the labor force. Within the labor force, individuals with high school diploma education have the highest percentage of unemployment, with 17.5% or 24 of them being unemployed.
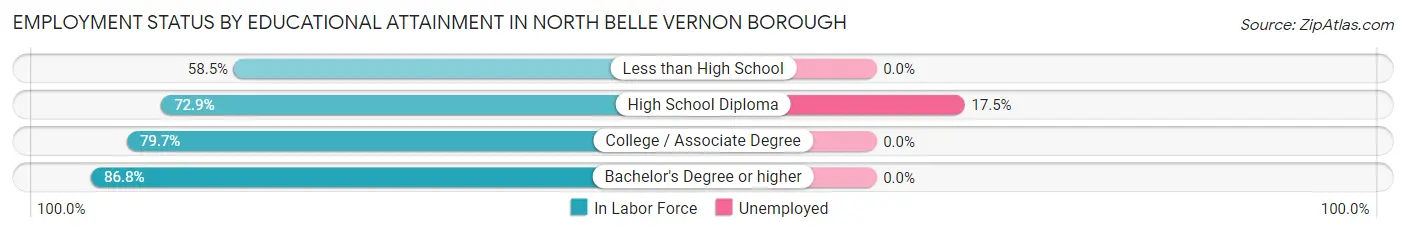
| Educational Attainment | In Labor Force | Unemployed |
| Less than High School | 38 (58.5%) | 0 (0.0%) |
| High School Diploma | 137 (72.9%) | 33 (17.5%) |
| College / Associate Degree | 216 (79.7%) | 0 (0.0%) |
| Bachelor's Degree or higher | 243 (86.8%) | 0 (0.0%) |
| Total | 634 (78.9%) | 31 (3.8%) |
Employment Occupations by Sex in North Belle Vernon borough
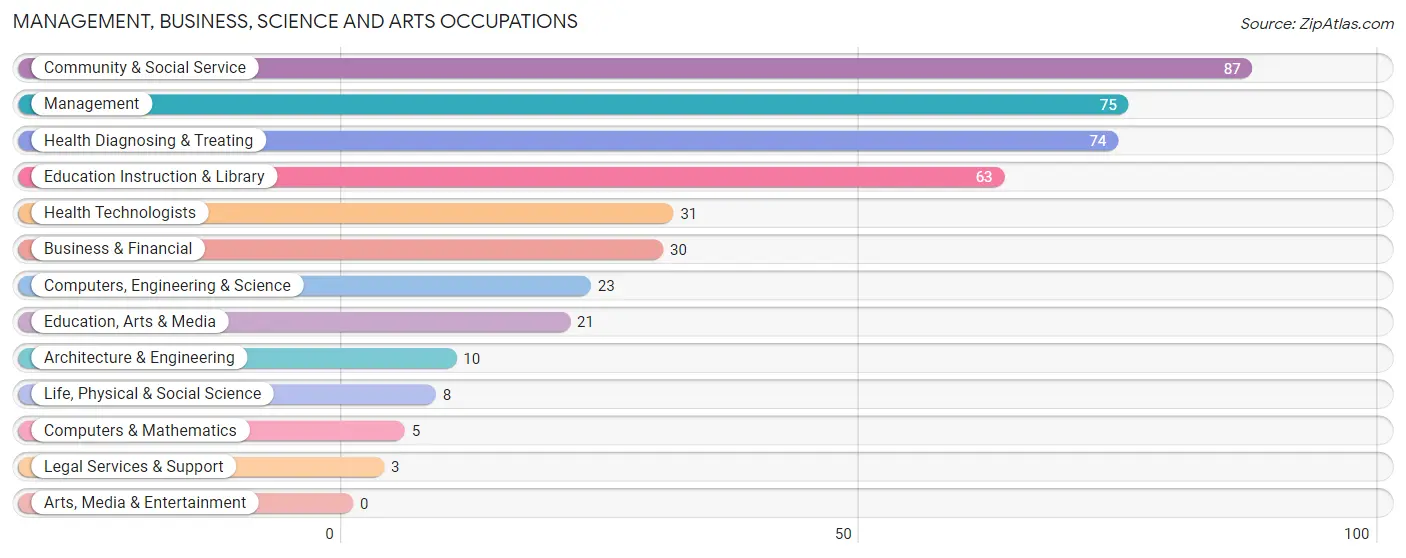
Management, Business, Science and Arts Occupations
The most common Management, Business, Science and Arts occupations in North Belle Vernon borough are Community & Social Service (87 | 11.4%), Management (75 | 9.9%), Health Diagnosing & Treating (74 | 9.7%), Education Instruction & Library (63 | 8.3%), and Health Technologists (31 | 4.1%).
Management, Business, Science and Arts Occupations by Sex
Within the Management, Business, Science and Arts occupations in North Belle Vernon borough, the most male-oriented occupations are Computers & Mathematics (100.0%), Life, Physical & Social Science (100.0%), and Education, Arts & Media (100.0%), while the most female-oriented occupations are Legal Services & Support (100.0%), Health Diagnosing & Treating (89.2%), and Health Technologists (77.4%).
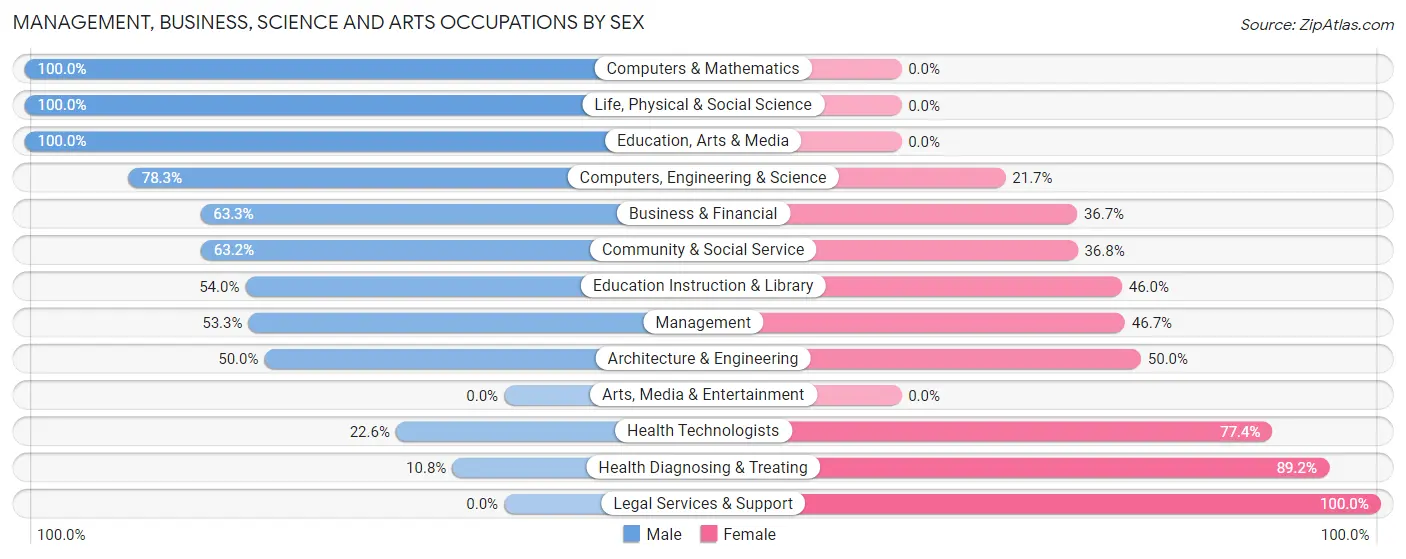
| Occupation | Male | Female |
| Management | 40 (53.3%) | 35 (46.7%) |
| Business & Financial | 19 (63.3%) | 11 (36.7%) |
| Computers, Engineering & Science | 18 (78.3%) | 5 (21.7%) |
| Computers & Mathematics | 5 (100.0%) | 0 (0.0%) |
| Architecture & Engineering | 5 (50.0%) | 5 (50.0%) |
| Life, Physical & Social Science | 8 (100.0%) | 0 (0.0%) |
| Community & Social Service | 55 (63.2%) | 32 (36.8%) |
| Education, Arts & Media | 21 (100.0%) | 0 (0.0%) |
| Legal Services & Support | 0 (0.0%) | 3 (100.0%) |
| Education Instruction & Library | 34 (54.0%) | 29 (46.0%) |
| Arts, Media & Entertainment | 0 (0.0%) | 0 (0.0%) |
| Health Diagnosing & Treating | 8 (10.8%) | 66 (89.2%) |
| Health Technologists | 7 (22.6%) | 24 (77.4%) |
| Total (Category) | 140 (48.4%) | 149 (51.6%) |
| Total (Overall) | 385 (50.6%) | 376 (49.4%) |
Services Occupations
The most common Services occupations in North Belle Vernon borough are Food Preparation & Serving (62 | 8.2%), Healthcare Support (40 | 5.3%), Cleaning & Maintenance (14 | 1.8%), Personal Care & Service (11 | 1.5%), and Security & Protection (5 | 0.7%).
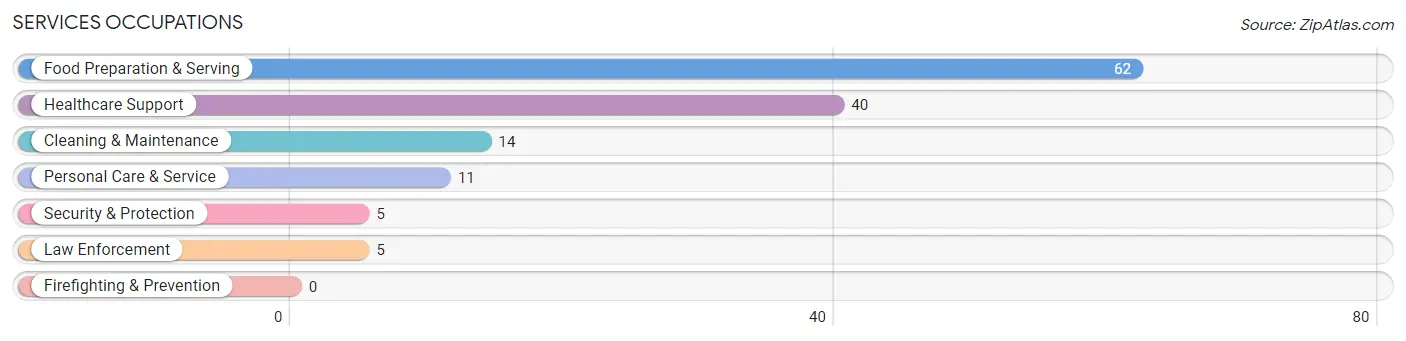
Services Occupations by Sex
Within the Services occupations in North Belle Vernon borough, the most male-oriented occupations are Security & Protection (100.0%), Law Enforcement (100.0%), and Cleaning & Maintenance (100.0%), while the most female-oriented occupations are Healthcare Support (87.5%), Personal Care & Service (45.5%), and Food Preparation & Serving (11.3%).
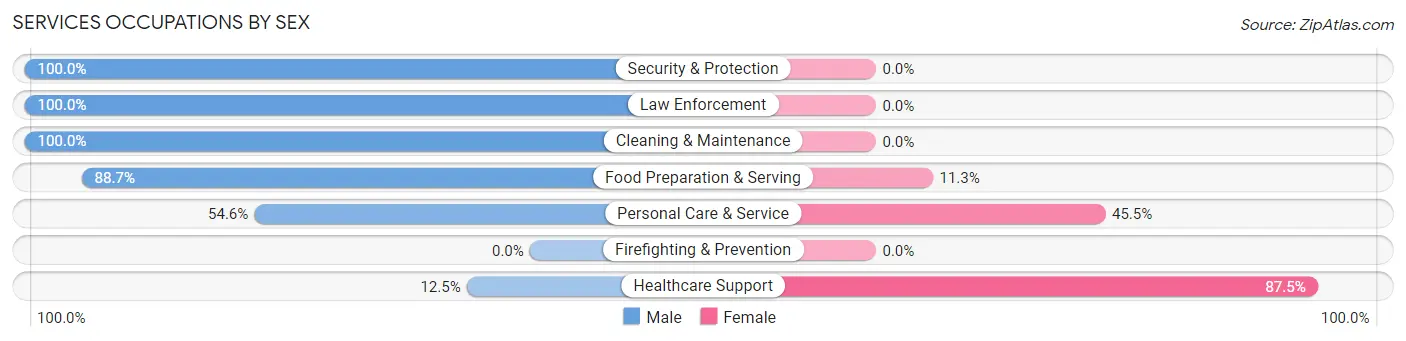
| Occupation | Male | Female |
| Healthcare Support | 5 (12.5%) | 35 (87.5%) |
| Security & Protection | 5 (100.0%) | 0 (0.0%) |
| Firefighting & Prevention | 0 (0.0%) | 0 (0.0%) |
| Law Enforcement | 5 (100.0%) | 0 (0.0%) |
| Food Preparation & Serving | 55 (88.7%) | 7 (11.3%) |
| Cleaning & Maintenance | 14 (100.0%) | 0 (0.0%) |
| Personal Care & Service | 6 (54.5%) | 5 (45.5%) |
| Total (Category) | 85 (64.4%) | 47 (35.6%) |
| Total (Overall) | 385 (50.6%) | 376 (49.4%) |
Sales and Office Occupations
The most common Sales and Office occupations in North Belle Vernon borough are Office & Administration (85 | 11.2%), and Sales & Related (81 | 10.6%).
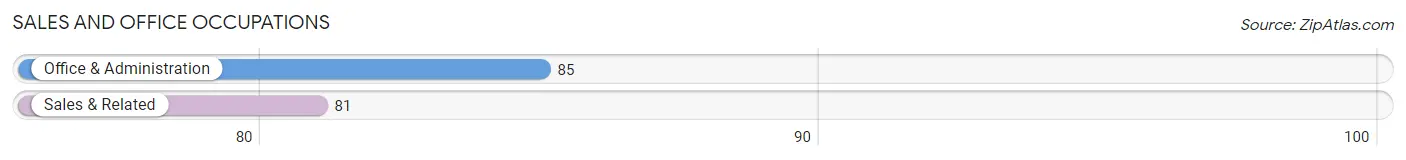
Sales and Office Occupations by Sex
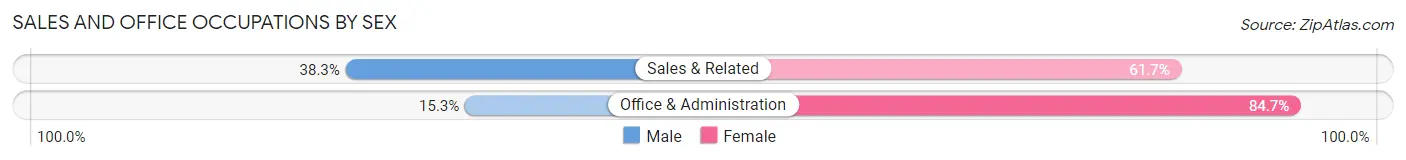
| Occupation | Male | Female |
| Sales & Related | 31 (38.3%) | 50 (61.7%) |
| Office & Administration | 13 (15.3%) | 72 (84.7%) |
| Total (Category) | 44 (26.5%) | 122 (73.5%) |
| Total (Overall) | 385 (50.6%) | 376 (49.4%) |
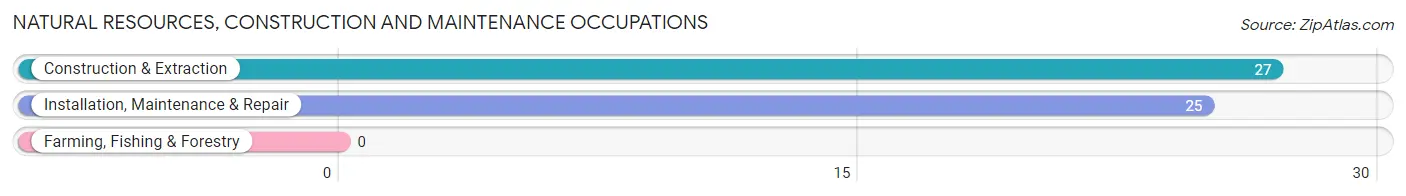
Natural Resources, Construction and Maintenance Occupations
The most common Natural Resources, Construction and Maintenance occupations in North Belle Vernon borough are Construction & Extraction (27 | 3.5%), and Installation, Maintenance & Repair (25 | 3.3%).
Natural Resources, Construction and Maintenance Occupations by Sex
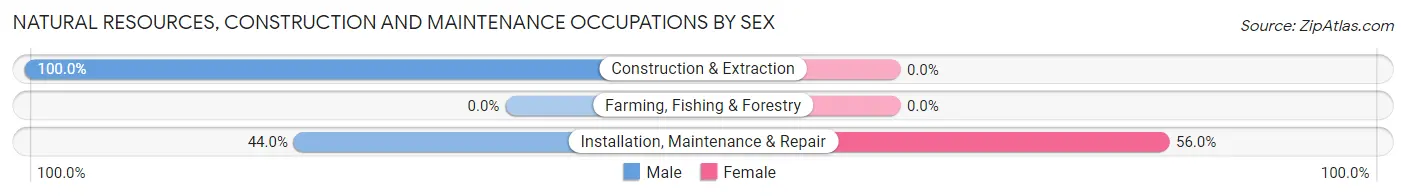
| Occupation | Male | Female |
| Farming, Fishing & Forestry | 0 (0.0%) | 0 (0.0%) |
| Construction & Extraction | 27 (100.0%) | 0 (0.0%) |
| Installation, Maintenance & Repair | 11 (44.0%) | 14 (56.0%) |
| Total (Category) | 38 (73.1%) | 14 (26.9%) |
| Total (Overall) | 385 (50.6%) | 376 (49.4%) |
Production, Transportation and Moving Occupations
The most common Production, Transportation and Moving occupations in North Belle Vernon borough are Material Moving (80 | 10.5%), Production (36 | 4.7%), and Transportation (6 | 0.8%).
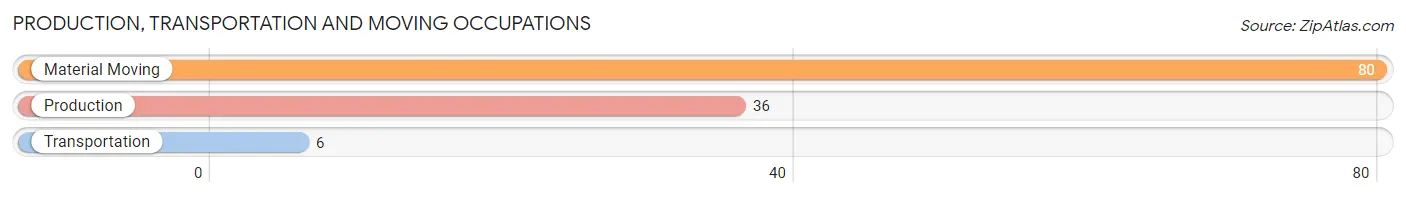
Production, Transportation and Moving Occupations by Sex
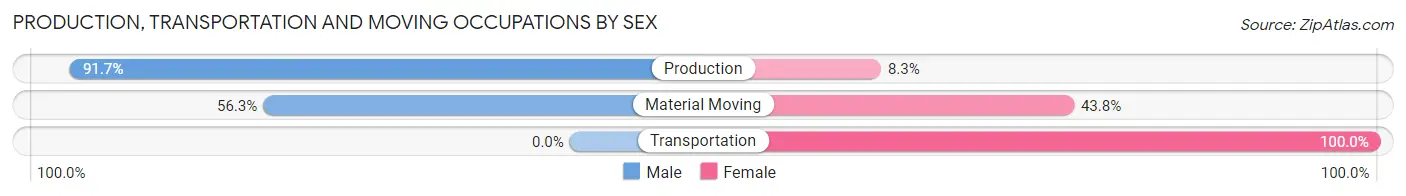
| Occupation | Male | Female |
| Production | 33 (91.7%) | 3 (8.3%) |
| Transportation | 0 (0.0%) | 6 (100.0%) |
| Material Moving | 45 (56.2%) | 35 (43.8%) |
| Total (Category) | 78 (63.9%) | 44 (36.1%) |
| Total (Overall) | 385 (50.6%) | 376 (49.4%) |
Employment Industries by Sex in North Belle Vernon borough
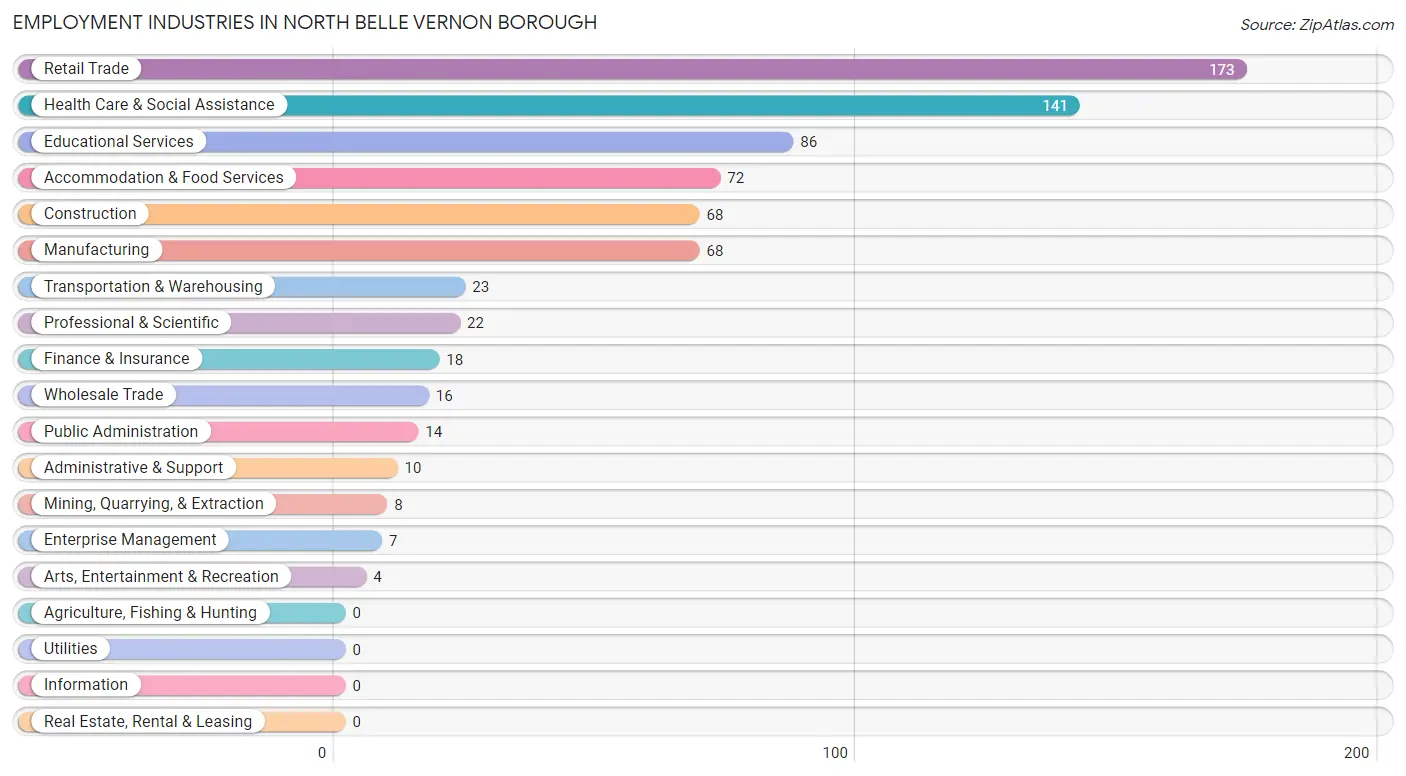
Employment Industries in North Belle Vernon borough
The major employment industries in North Belle Vernon borough include Retail Trade (173 | 22.7%), Health Care & Social Assistance (141 | 18.5%), Educational Services (86 | 11.3%), Accommodation & Food Services (72 | 9.5%), and Construction (68 | 8.9%).
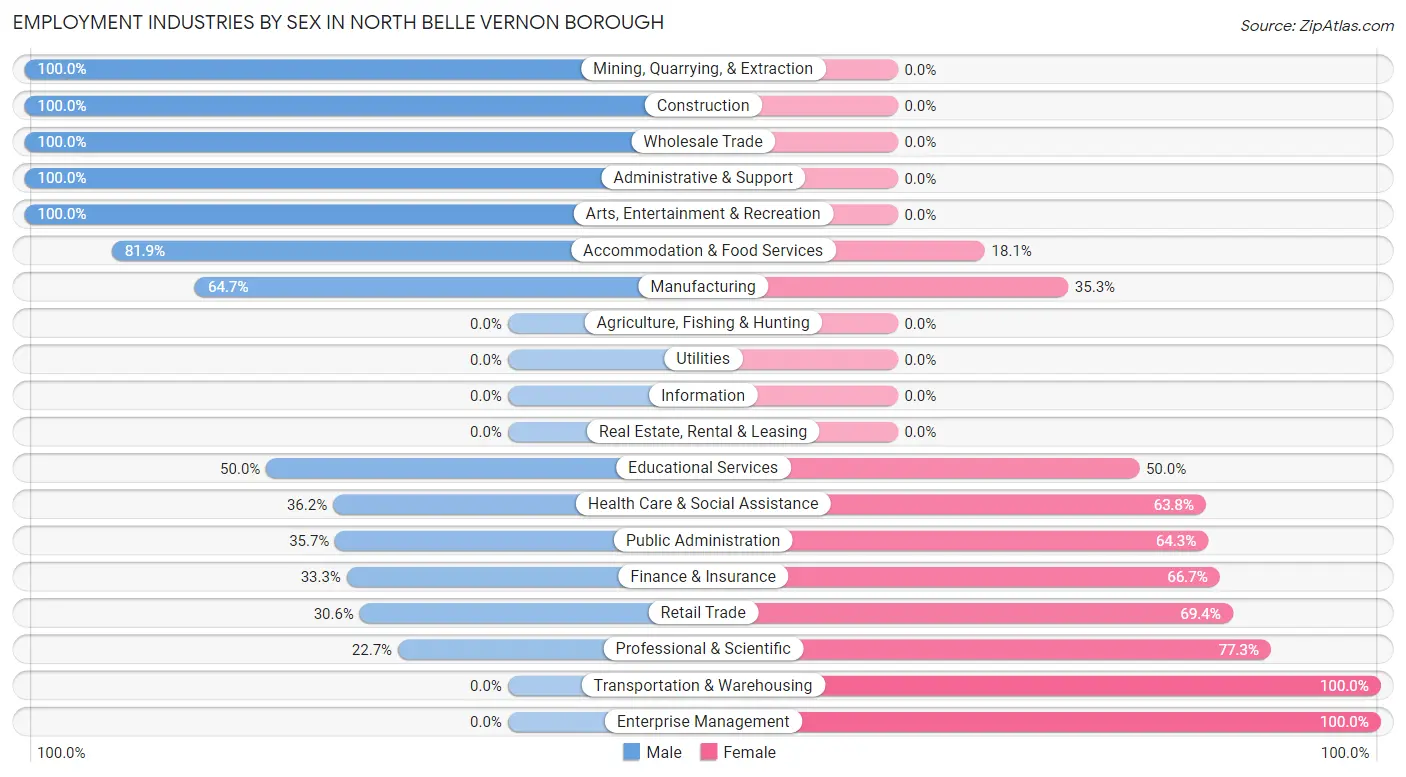
Employment Industries by Sex in North Belle Vernon borough
The North Belle Vernon borough industries that see more men than women are Mining, Quarrying, & Extraction (100.0%), Construction (100.0%), and Wholesale Trade (100.0%), whereas the industries that tend to have a higher number of women are Transportation & Warehousing (100.0%), Enterprise Management (100.0%), and Professional & Scientific (77.3%).
| Industry | Male | Female |
| Agriculture, Fishing & Hunting | 0 (0.0%) | 0 (0.0%) |
| Mining, Quarrying, & Extraction | 8 (100.0%) | 0 (0.0%) |
| Construction | 68 (100.0%) | 0 (0.0%) |
| Manufacturing | 44 (64.7%) | 24 (35.3%) |
| Wholesale Trade | 16 (100.0%) | 0 (0.0%) |
| Retail Trade | 53 (30.6%) | 120 (69.4%) |
| Transportation & Warehousing | 0 (0.0%) | 23 (100.0%) |
| Utilities | 0 (0.0%) | 0 (0.0%) |
| Information | 0 (0.0%) | 0 (0.0%) |
| Finance & Insurance | 6 (33.3%) | 12 (66.7%) |
| Real Estate, Rental & Leasing | 0 (0.0%) | 0 (0.0%) |
| Professional & Scientific | 5 (22.7%) | 17 (77.3%) |
| Enterprise Management | 0 (0.0%) | 7 (100.0%) |
| Administrative & Support | 10 (100.0%) | 0 (0.0%) |
| Educational Services | 43 (50.0%) | 43 (50.0%) |
| Health Care & Social Assistance | 51 (36.2%) | 90 (63.8%) |
| Arts, Entertainment & Recreation | 4 (100.0%) | 0 (0.0%) |
| Accommodation & Food Services | 59 (81.9%) | 13 (18.1%) |
| Public Administration | 5 (35.7%) | 9 (64.3%) |
| Total | 385 (50.6%) | 376 (49.4%) |
Education in North Belle Vernon borough
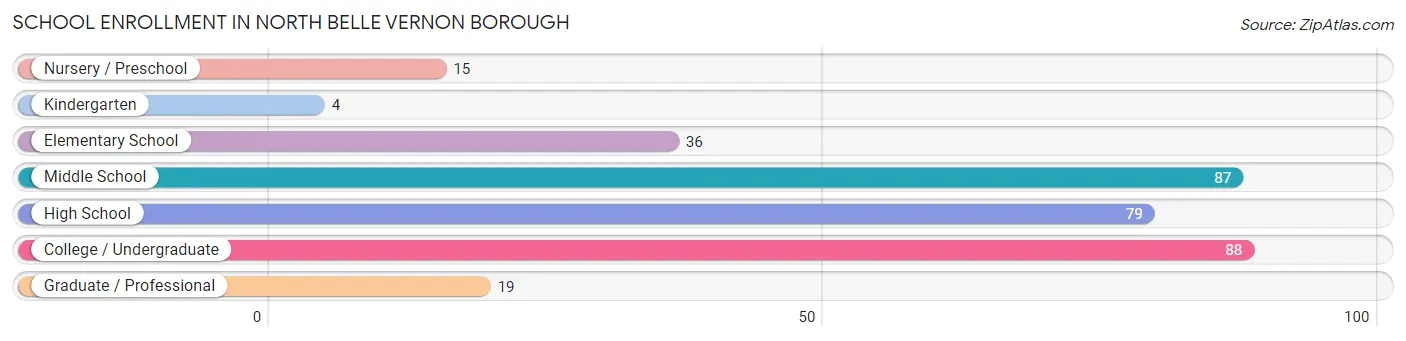
School Enrollment in North Belle Vernon borough
The most common levels of schooling among the 328 students in North Belle Vernon borough are college / undergraduate (88 | 26.8%), middle school (87 | 26.5%), and high school (79 | 24.1%).
| School Level | # Students | % Students |
| Nursery / Preschool | 15 | 4.6% |
| Kindergarten | 4 | 1.2% |
| Elementary School | 36 | 11.0% |
| Middle School | 87 | 26.5% |
| High School | 79 | 24.1% |
| College / Undergraduate | 88 | 26.8% |
| Graduate / Professional | 19 | 5.8% |
| Total | 328 | 100.0% |
School Enrollment by Age by Funding Source in North Belle Vernon borough
Out of a total of 328 students who are enrolled in schools in North Belle Vernon borough, 58 (17.7%) attend a private institution, while the remaining 270 (82.3%) are enrolled in public schools. The age group of 20 to 24 year olds has the highest likelihood of being enrolled in private schools, with 29 (51.8% in the age bracket) enrolled. Conversely, the age group of 15 to 17 year olds has the lowest likelihood of being enrolled in a private school, with 60 (100.0% in the age bracket) attending a public institution.
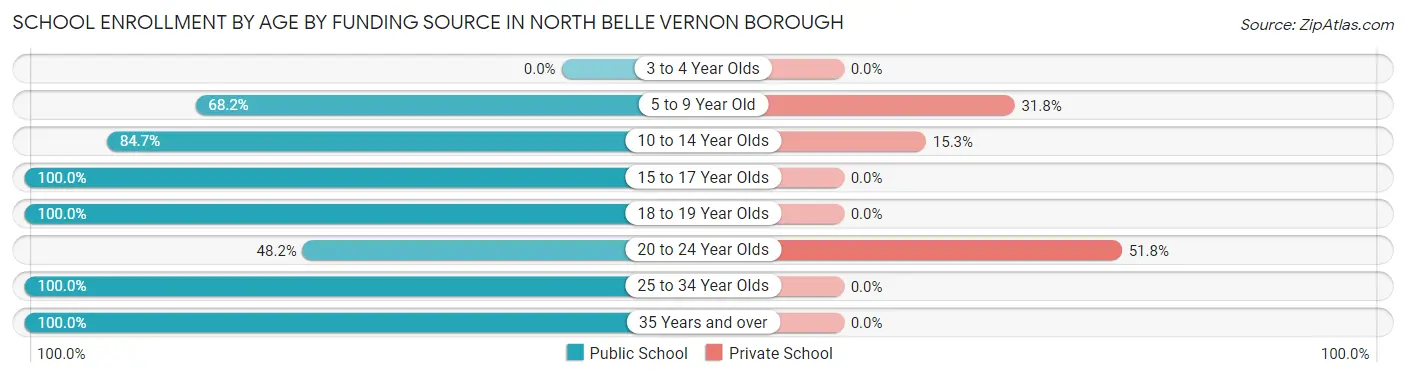
| Age Bracket | Public School | Private School |
| 3 to 4 Year Olds | 0 (0.0%) | 0 (0.0%) |
| 5 to 9 Year Old | 30 (68.2%) | 14 (31.8%) |
| 10 to 14 Year Olds | 83 (84.7%) | 15 (15.3%) |
| 15 to 17 Year Olds | 60 (100.0%) | 0 (0.0%) |
| 18 to 19 Year Olds | 19 (100.0%) | 0 (0.0%) |
| 20 to 24 Year Olds | 27 (48.2%) | 29 (51.8%) |
| 25 to 34 Year Olds | 50 (100.0%) | 0 (0.0%) |
| 35 Years and over | 1 (100.0%) | 0 (0.0%) |
| Total | 270 (82.3%) | 58 (17.7%) |
Educational Attainment by Field of Study in North Belle Vernon borough
Education (62 | 18.6%), science & technology (53 | 15.9%), business (53 | 15.9%), psychology (33 | 9.9%), and bio, nature & agricultural (32 | 9.6%) are the most common fields of study among 334 individuals in North Belle Vernon borough who have obtained a bachelor's degree or higher.
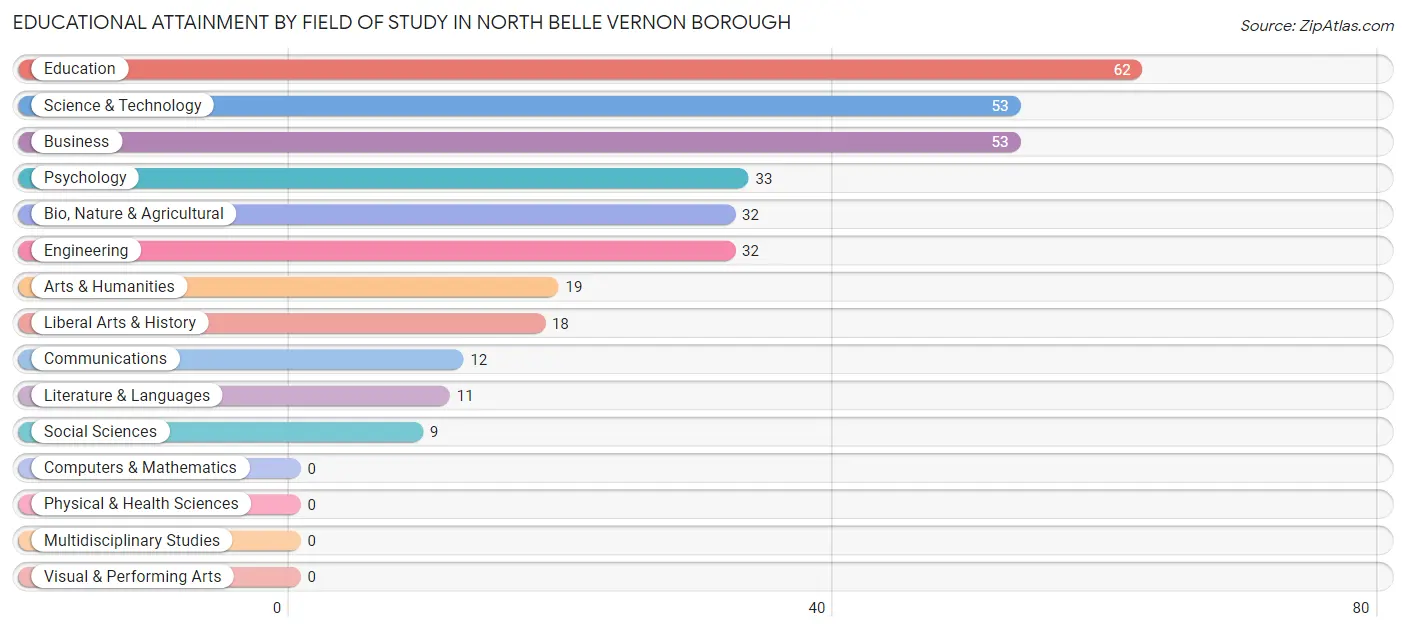
| Field of Study | # Graduates | % Graduates |
| Computers & Mathematics | 0 | 0.0% |
| Bio, Nature & Agricultural | 32 | 9.6% |
| Physical & Health Sciences | 0 | 0.0% |
| Psychology | 33 | 9.9% |
| Social Sciences | 9 | 2.7% |
| Engineering | 32 | 9.6% |
| Multidisciplinary Studies | 0 | 0.0% |
| Science & Technology | 53 | 15.9% |
| Business | 53 | 15.9% |
| Education | 62 | 18.6% |
| Literature & Languages | 11 | 3.3% |
| Liberal Arts & History | 18 | 5.4% |
| Visual & Performing Arts | 0 | 0.0% |
| Communications | 12 | 3.6% |
| Arts & Humanities | 19 | 5.7% |
| Total | 334 | 100.0% |
Transportation & Commute in North Belle Vernon borough
Vehicle Availability by Sex in North Belle Vernon borough
The most prevalent vehicle ownership categories in North Belle Vernon borough are males with 1 vehicle (127, accounting for 33.3%) and females with 1 vehicle (150, making up 35.0%).
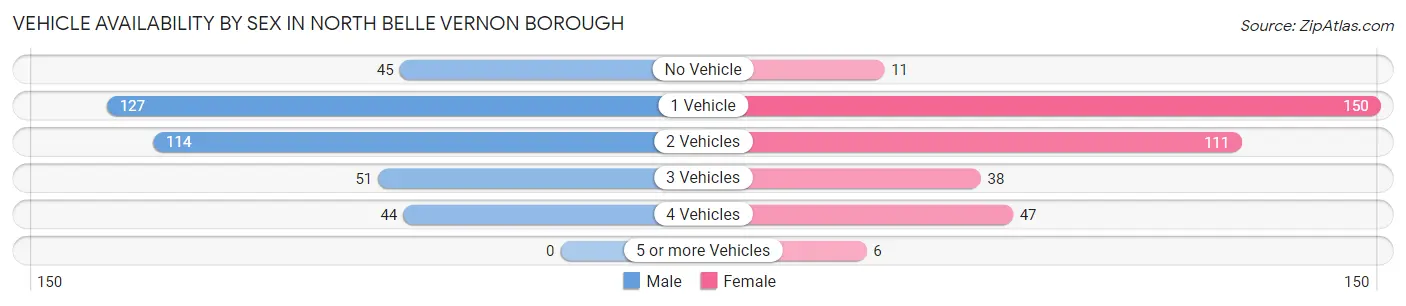
| Vehicles Available | Male | Female |
| No Vehicle | 45 (11.8%) | 11 (3.0%) |
| 1 Vehicle | 127 (33.3%) | 150 (41.3%) |
| 2 Vehicles | 114 (29.9%) | 111 (30.6%) |
| 3 Vehicles | 51 (13.4%) | 38 (10.5%) |
| 4 Vehicles | 44 (11.6%) | 47 (13.0%) |
| 5 or more Vehicles | 0 (0.0%) | 6 (1.7%) |
| Total | 381 (100.0%) | 363 (100.0%) |
Commute Time in North Belle Vernon borough
The most frequently occuring commute durations in North Belle Vernon borough are 10 to 14 minutes (117 commuters, 17.1%), 5 to 9 minutes (107 commuters, 15.7%), and 35 to 39 minutes (93 commuters, 13.6%).
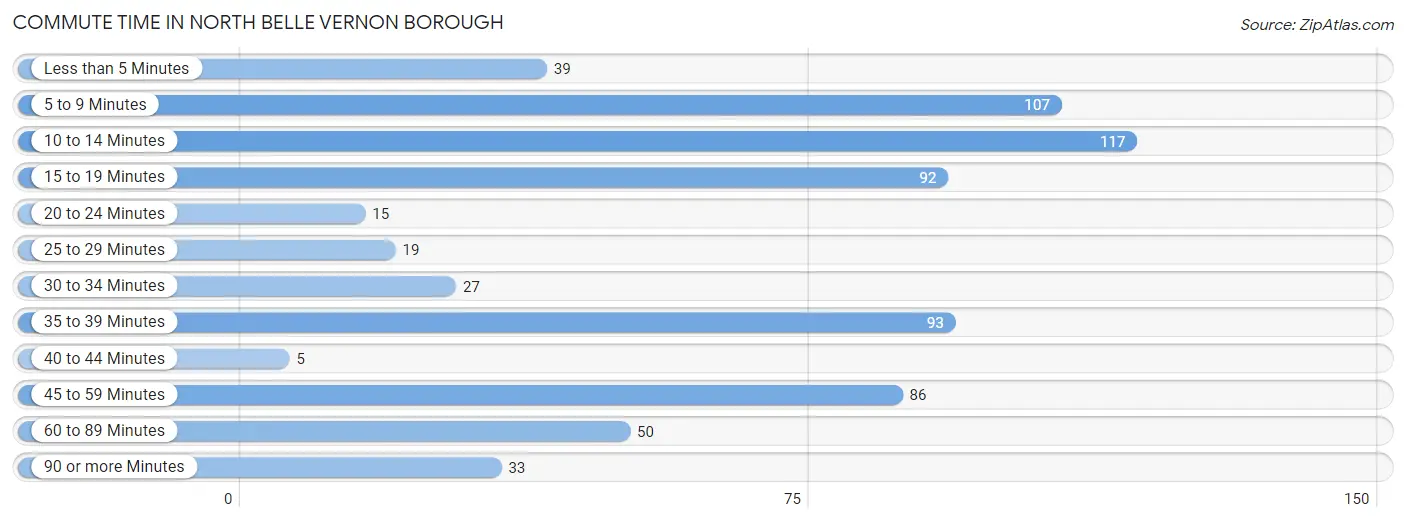
| Commute Time | # Commuters | % Commuters |
| Less than 5 Minutes | 39 | 5.7% |
| 5 to 9 Minutes | 107 | 15.7% |
| 10 to 14 Minutes | 117 | 17.1% |
| 15 to 19 Minutes | 92 | 13.5% |
| 20 to 24 Minutes | 15 | 2.2% |
| 25 to 29 Minutes | 19 | 2.8% |
| 30 to 34 Minutes | 27 | 4.0% |
| 35 to 39 Minutes | 93 | 13.6% |
| 40 to 44 Minutes | 5 | 0.7% |
| 45 to 59 Minutes | 86 | 12.6% |
| 60 to 89 Minutes | 50 | 7.3% |
| 90 or more Minutes | 33 | 4.8% |
Commute Time by Sex in North Belle Vernon borough
The most common commute times in North Belle Vernon borough are 45 to 59 minutes (78 commuters, 20.5%) for males and 5 to 9 minutes (64 commuters, 21.2%) for females.
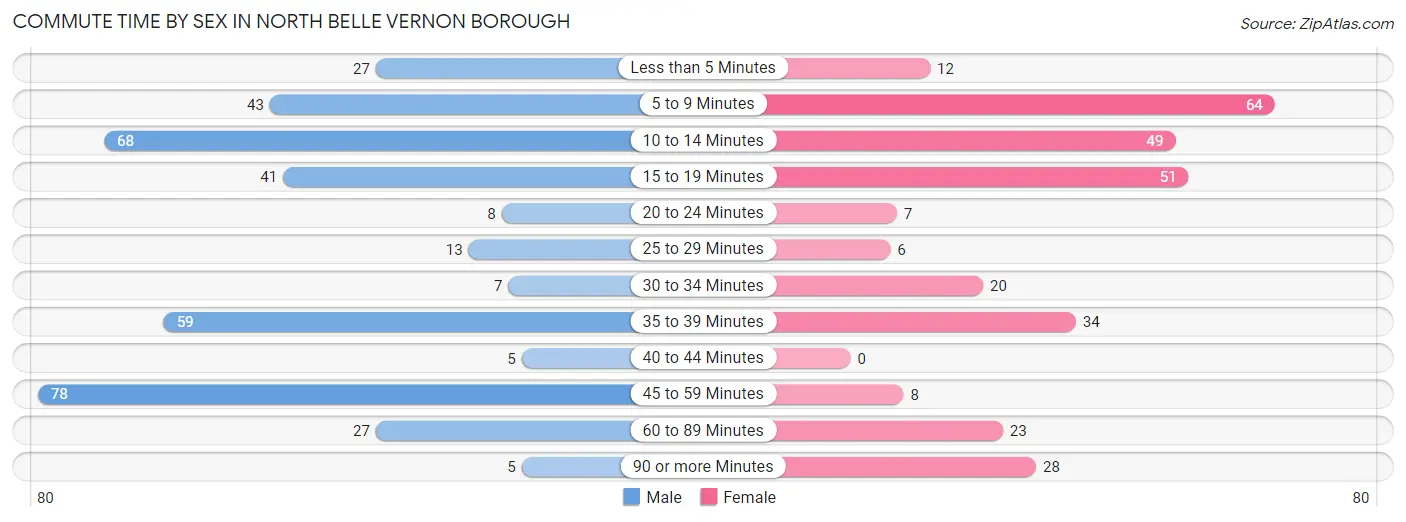
| Commute Time | Male | Female |
| Less than 5 Minutes | 27 (7.1%) | 12 (4.0%) |
| 5 to 9 Minutes | 43 (11.3%) | 64 (21.2%) |
| 10 to 14 Minutes | 68 (17.8%) | 49 (16.2%) |
| 15 to 19 Minutes | 41 (10.8%) | 51 (16.9%) |
| 20 to 24 Minutes | 8 (2.1%) | 7 (2.3%) |
| 25 to 29 Minutes | 13 (3.4%) | 6 (2.0%) |
| 30 to 34 Minutes | 7 (1.8%) | 20 (6.6%) |
| 35 to 39 Minutes | 59 (15.5%) | 34 (11.3%) |
| 40 to 44 Minutes | 5 (1.3%) | 0 (0.0%) |
| 45 to 59 Minutes | 78 (20.5%) | 8 (2.6%) |
| 60 to 89 Minutes | 27 (7.1%) | 23 (7.6%) |
| 90 or more Minutes | 5 (1.3%) | 28 (9.3%) |
Time of Departure to Work by Sex in North Belle Vernon borough
The most frequent times of departure to work in North Belle Vernon borough are 7:00 AM to 7:29 AM (73, 19.2%) for males and 7:00 AM to 7:29 AM (80, 26.5%) for females.
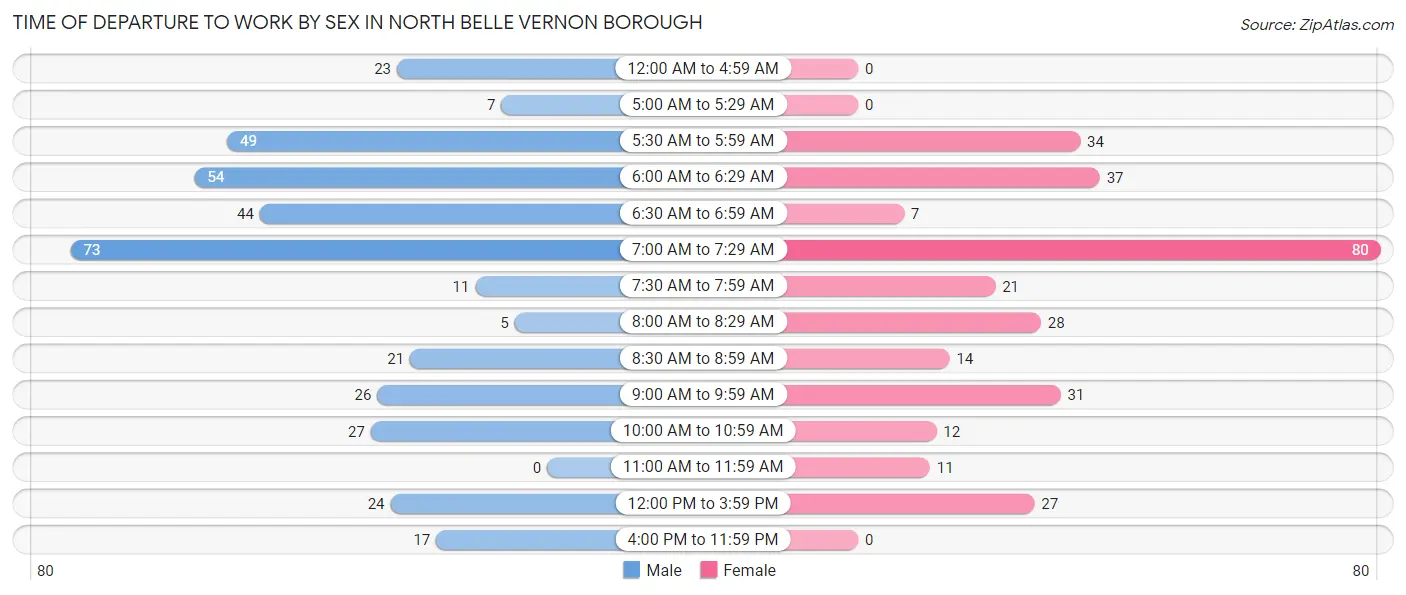
| Time of Departure | Male | Female |
| 12:00 AM to 4:59 AM | 23 (6.0%) | 0 (0.0%) |
| 5:00 AM to 5:29 AM | 7 (1.8%) | 0 (0.0%) |
| 5:30 AM to 5:59 AM | 49 (12.9%) | 34 (11.3%) |
| 6:00 AM to 6:29 AM | 54 (14.2%) | 37 (12.2%) |
| 6:30 AM to 6:59 AM | 44 (11.6%) | 7 (2.3%) |
| 7:00 AM to 7:29 AM | 73 (19.2%) | 80 (26.5%) |
| 7:30 AM to 7:59 AM | 11 (2.9%) | 21 (7.0%) |
| 8:00 AM to 8:29 AM | 5 (1.3%) | 28 (9.3%) |
| 8:30 AM to 8:59 AM | 21 (5.5%) | 14 (4.6%) |
| 9:00 AM to 9:59 AM | 26 (6.8%) | 31 (10.3%) |
| 10:00 AM to 10:59 AM | 27 (7.1%) | 12 (4.0%) |
| 11:00 AM to 11:59 AM | 0 (0.0%) | 11 (3.6%) |
| 12:00 PM to 3:59 PM | 24 (6.3%) | 27 (8.9%) |
| 4:00 PM to 11:59 PM | 17 (4.5%) | 0 (0.0%) |
| Total | 381 (100.0%) | 302 (100.0%) |
Housing Occupancy in North Belle Vernon borough
Occupancy by Ownership in North Belle Vernon borough
Of the total 750 dwellings in North Belle Vernon borough, owner-occupied units account for 525 (70.0%), while renter-occupied units make up 225 (30.0%).
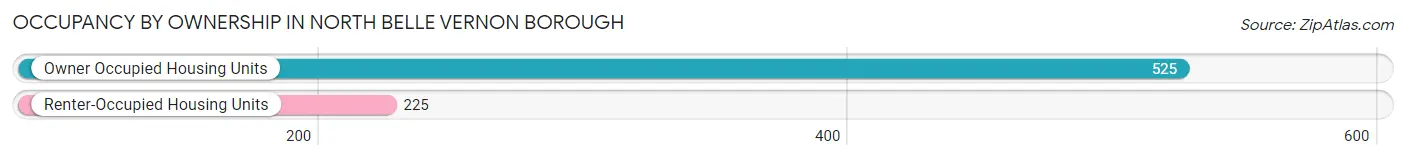
| Occupancy | # Housing Units | % Housing Units |
| Owner Occupied Housing Units | 525 | 70.0% |
| Renter-Occupied Housing Units | 225 | 30.0% |
| Total Occupied Housing Units | 750 | 100.0% |
Occupancy by Household Size in North Belle Vernon borough
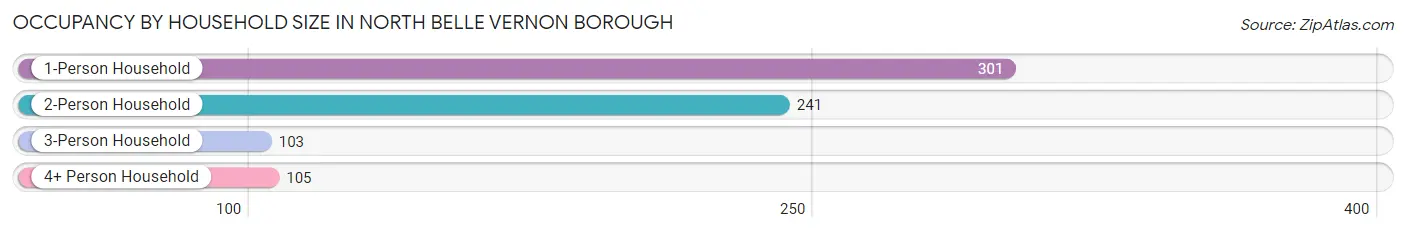
| Household Size | # Housing Units | % Housing Units |
| 1-Person Household | 301 | 40.1% |
| 2-Person Household | 241 | 32.1% |
| 3-Person Household | 103 | 13.7% |
| 4+ Person Household | 105 | 14.0% |
| Total Housing Units | 750 | 100.0% |
Occupancy by Ownership by Household Size in North Belle Vernon borough
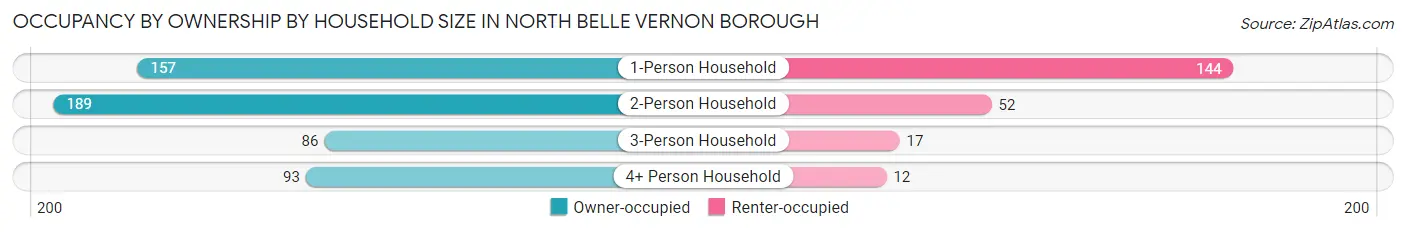
| Household Size | Owner-occupied | Renter-occupied |
| 1-Person Household | 157 (52.2%) | 144 (47.8%) |
| 2-Person Household | 189 (78.4%) | 52 (21.6%) |
| 3-Person Household | 86 (83.5%) | 17 (16.5%) |
| 4+ Person Household | 93 (88.6%) | 12 (11.4%) |
| Total Housing Units | 525 (70.0%) | 225 (30.0%) |
Occupancy by Educational Attainment in North Belle Vernon borough
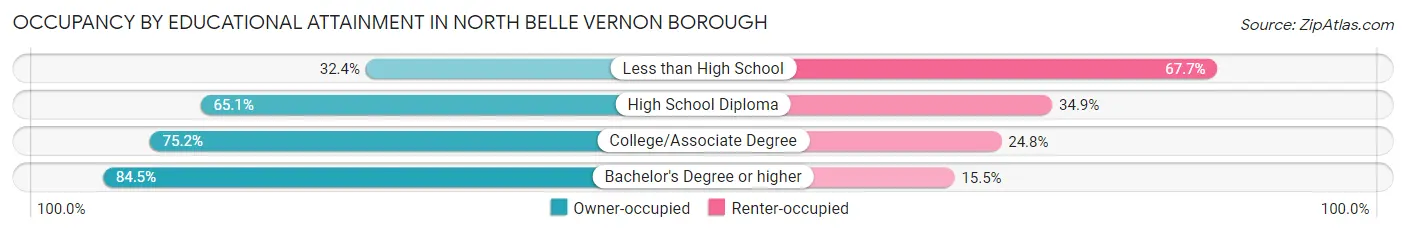
| Household Size | Owner-occupied | Renter-occupied |
| Less than High School | 22 (32.4%) | 46 (67.6%) |
| High School Diploma | 168 (65.1%) | 90 (34.9%) |
| College/Associate Degree | 188 (75.2%) | 62 (24.8%) |
| Bachelor's Degree or higher | 147 (84.5%) | 27 (15.5%) |
Occupancy by Age of Householder in North Belle Vernon borough
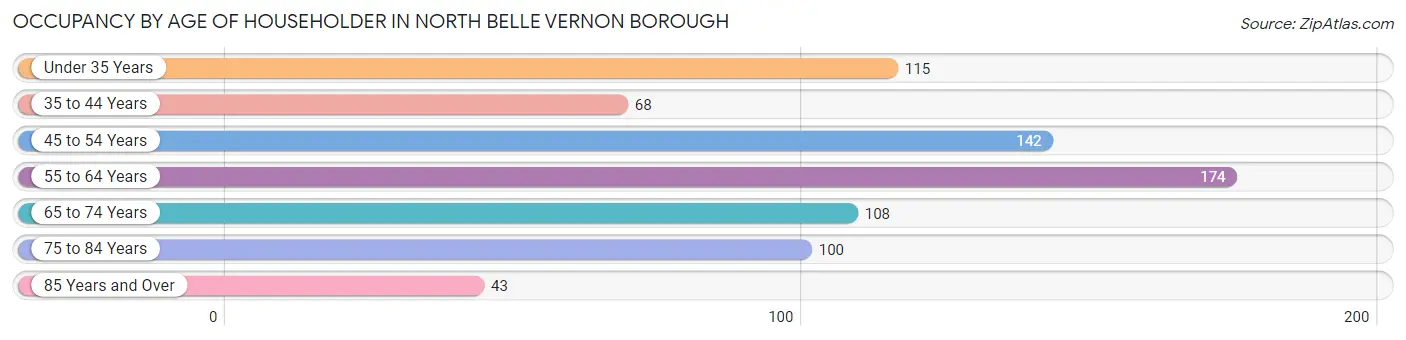
| Age Bracket | # Households | % Households |
| Under 35 Years | 115 | 15.3% |
| 35 to 44 Years | 68 | 9.1% |
| 45 to 54 Years | 142 | 18.9% |
| 55 to 64 Years | 174 | 23.2% |
| 65 to 74 Years | 108 | 14.4% |
| 75 to 84 Years | 100 | 13.3% |
| 85 Years and Over | 43 | 5.7% |
| Total | 750 | 100.0% |
Housing Finances in North Belle Vernon borough
Median Income by Occupancy in North Belle Vernon borough
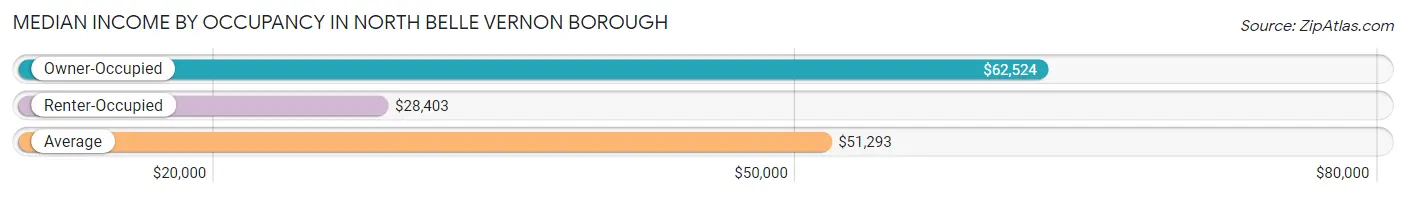
| Occupancy Type | # Households | Median Income |
| Owner-Occupied | 525 (70.0%) | $62,524 |
| Renter-Occupied | 225 (30.0%) | $28,403 |
| Average | 750 (100.0%) | $51,293 |
Occupancy by Householder Income Bracket in North Belle Vernon borough
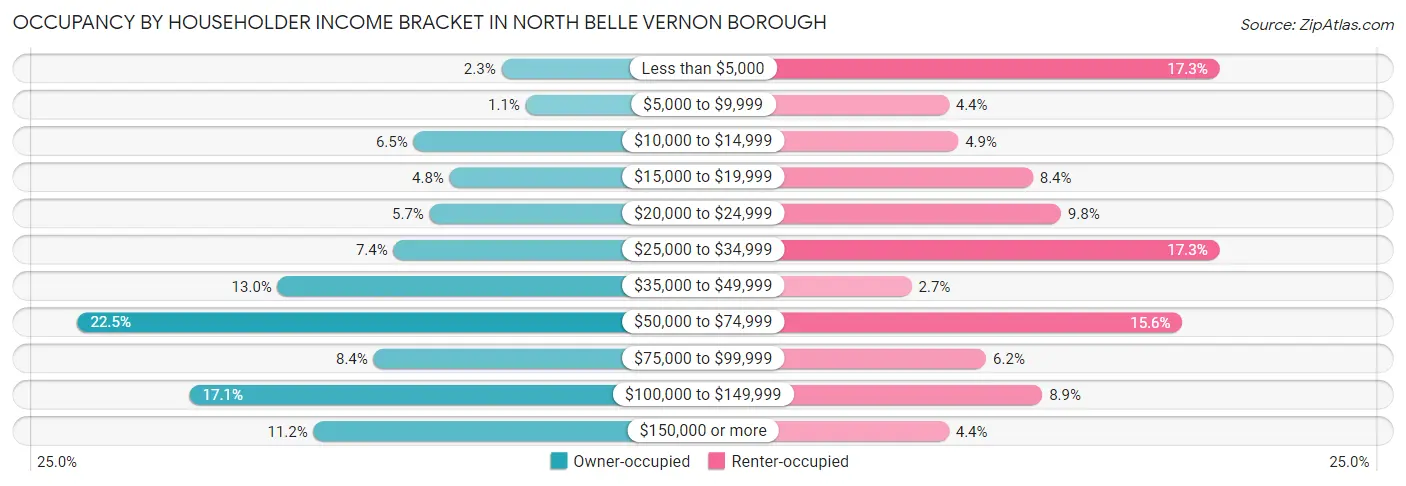
| Income Bracket | Owner-occupied | Renter-occupied |
| Less than $5,000 | 12 (2.3%) | 39 (17.3%) |
| $5,000 to $9,999 | 6 (1.1%) | 10 (4.4%) |
| $10,000 to $14,999 | 34 (6.5%) | 11 (4.9%) |
| $15,000 to $19,999 | 25 (4.8%) | 19 (8.4%) |
| $20,000 to $24,999 | 30 (5.7%) | 22 (9.8%) |
| $25,000 to $34,999 | 39 (7.4%) | 39 (17.3%) |
| $35,000 to $49,999 | 68 (13.0%) | 6 (2.7%) |
| $50,000 to $74,999 | 118 (22.5%) | 35 (15.6%) |
| $75,000 to $99,999 | 44 (8.4%) | 14 (6.2%) |
| $100,000 to $149,999 | 90 (17.1%) | 20 (8.9%) |
| $150,000 or more | 59 (11.2%) | 10 (4.4%) |
| Total | 525 (100.0%) | 225 (100.0%) |
Monthly Housing Cost Tiers in North Belle Vernon borough
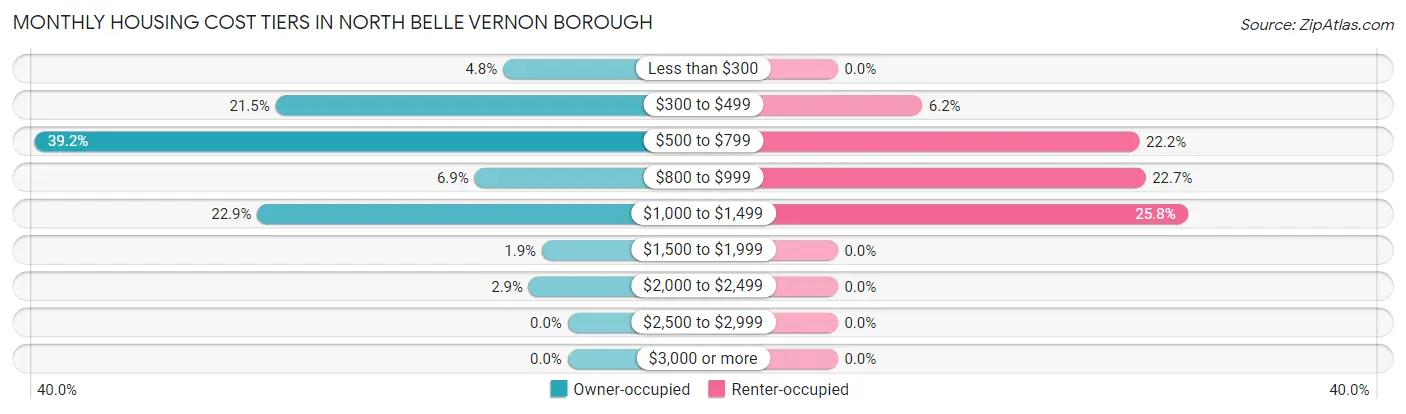
| Monthly Cost | Owner-occupied | Renter-occupied |
| Less than $300 | 25 (4.8%) | 0 (0.0%) |
| $300 to $499 | 113 (21.5%) | 14 (6.2%) |
| $500 to $799 | 206 (39.2%) | 50 (22.2%) |
| $800 to $999 | 36 (6.9%) | 51 (22.7%) |
| $1,000 to $1,499 | 120 (22.9%) | 58 (25.8%) |
| $1,500 to $1,999 | 10 (1.9%) | 0 (0.0%) |
| $2,000 to $2,499 | 15 (2.9%) | 0 (0.0%) |
| $2,500 to $2,999 | 0 (0.0%) | 0 (0.0%) |
| $3,000 or more | 0 (0.0%) | 0 (0.0%) |
| Total | 525 (100.0%) | 225 (100.0%) |
Physical Housing Characteristics in North Belle Vernon borough
Housing Structures in North Belle Vernon borough
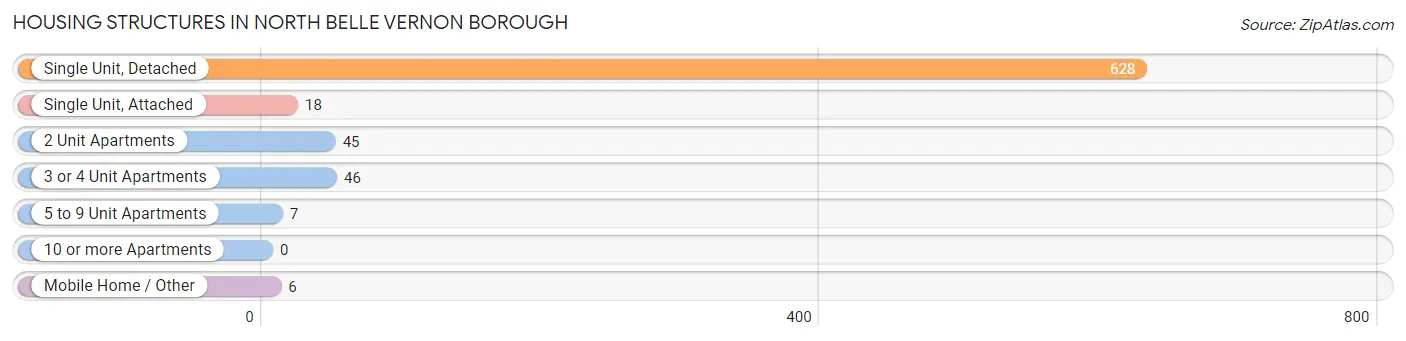
| Structure Type | # Housing Units | % Housing Units |
| Single Unit, Detached | 628 | 83.7% |
| Single Unit, Attached | 18 | 2.4% |
| 2 Unit Apartments | 45 | 6.0% |
| 3 or 4 Unit Apartments | 46 | 6.1% |
| 5 to 9 Unit Apartments | 7 | 0.9% |
| 10 or more Apartments | 0 | 0.0% |
| Mobile Home / Other | 6 | 0.8% |
| Total | 750 | 100.0% |
Housing Structures by Occupancy in North Belle Vernon borough
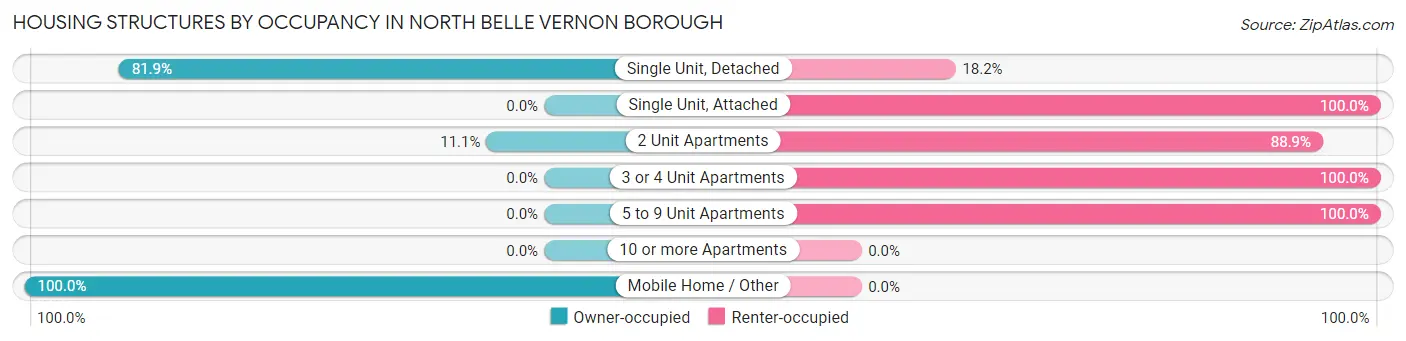
| Structure Type | Owner-occupied | Renter-occupied |
| Single Unit, Detached | 514 (81.9%) | 114 (18.1%) |
| Single Unit, Attached | 0 (0.0%) | 18 (100.0%) |
| 2 Unit Apartments | 5 (11.1%) | 40 (88.9%) |
| 3 or 4 Unit Apartments | 0 (0.0%) | 46 (100.0%) |
| 5 to 9 Unit Apartments | 0 (0.0%) | 7 (100.0%) |
| 10 or more Apartments | 0 (0.0%) | 0 (0.0%) |
| Mobile Home / Other | 6 (100.0%) | 0 (0.0%) |
| Total | 525 (70.0%) | 225 (30.0%) |
Housing Structures by Number of Rooms in North Belle Vernon borough
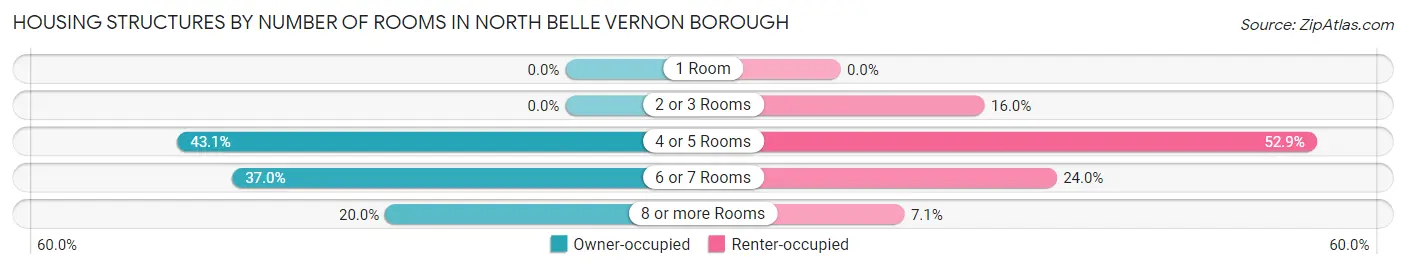
| Number of Rooms | Owner-occupied | Renter-occupied |
| 1 Room | 0 (0.0%) | 0 (0.0%) |
| 2 or 3 Rooms | 0 (0.0%) | 36 (16.0%) |
| 4 or 5 Rooms | 226 (43.0%) | 119 (52.9%) |
| 6 or 7 Rooms | 194 (36.9%) | 54 (24.0%) |
| 8 or more Rooms | 105 (20.0%) | 16 (7.1%) |
| Total | 525 (100.0%) | 225 (100.0%) |
Housing Structure by Heating Type in North Belle Vernon borough
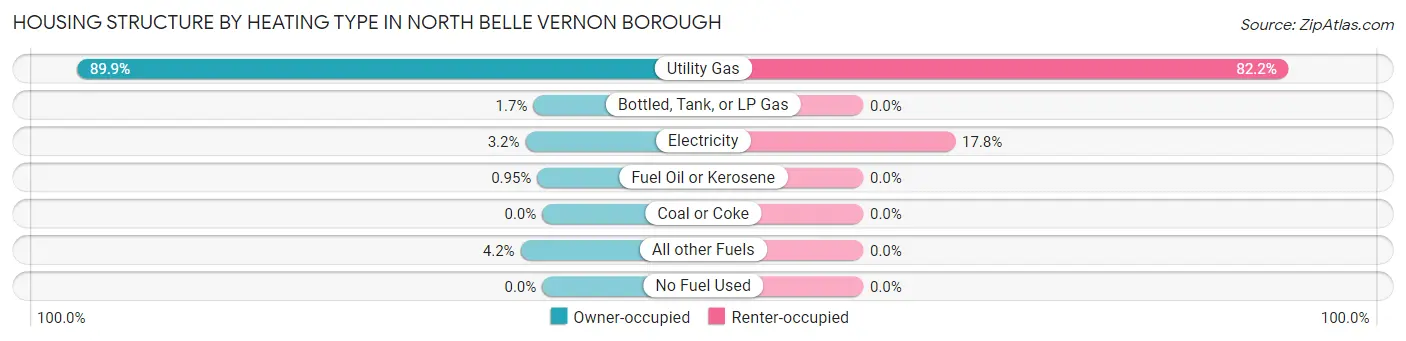
| Heating Type | Owner-occupied | Renter-occupied |
| Utility Gas | 472 (89.9%) | 185 (82.2%) |
| Bottled, Tank, or LP Gas | 9 (1.7%) | 0 (0.0%) |
| Electricity | 17 (3.2%) | 40 (17.8%) |
| Fuel Oil or Kerosene | 5 (0.9%) | 0 (0.0%) |
| Coal or Coke | 0 (0.0%) | 0 (0.0%) |
| All other Fuels | 22 (4.2%) | 0 (0.0%) |
| No Fuel Used | 0 (0.0%) | 0 (0.0%) |
| Total | 525 (100.0%) | 225 (100.0%) |
Household Vehicle Usage in North Belle Vernon borough
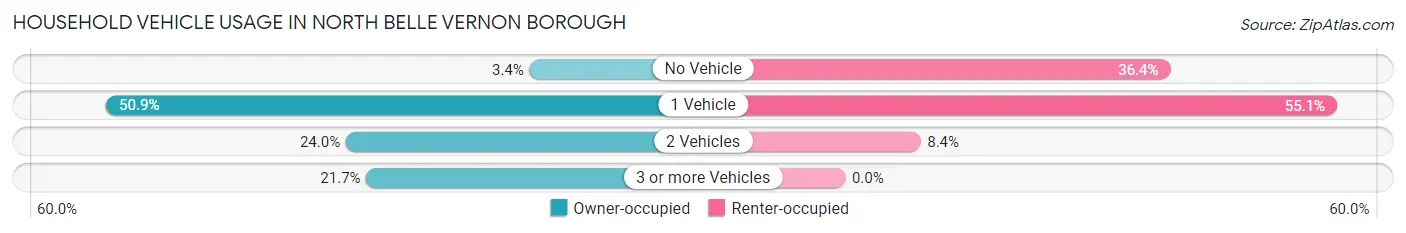
| Vehicles per Household | Owner-occupied | Renter-occupied |
| No Vehicle | 18 (3.4%) | 82 (36.4%) |
| 1 Vehicle | 267 (50.9%) | 124 (55.1%) |
| 2 Vehicles | 126 (24.0%) | 19 (8.4%) |
| 3 or more Vehicles | 114 (21.7%) | 0 (0.0%) |
| Total | 525 (100.0%) | 225 (100.0%) |
Real Estate & Mortgages in North Belle Vernon borough
Real Estate and Mortgage Overview in North Belle Vernon borough
| Characteristic | Without Mortgage | With Mortgage |
| Housing Units | 279 | 246 |
| Median Property Value | $104,400 | $112,300 |
| Median Household Income | $50,852 | $42 |
| Monthly Housing Costs | $506 | $0 |
| Real Estate Taxes | $2,227 | $0 |
Property Value by Mortgage Status in North Belle Vernon borough
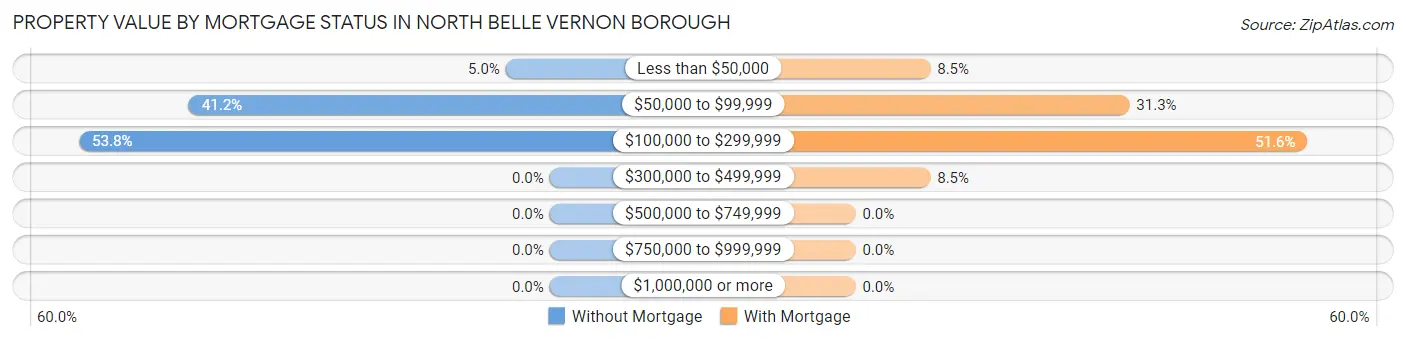
| Property Value | Without Mortgage | With Mortgage |
| Less than $50,000 | 14 (5.0%) | 21 (8.5%) |
| $50,000 to $99,999 | 115 (41.2%) | 77 (31.3%) |
| $100,000 to $299,999 | 150 (53.8%) | 127 (51.6%) |
| $300,000 to $499,999 | 0 (0.0%) | 21 (8.5%) |
| $500,000 to $749,999 | 0 (0.0%) | 0 (0.0%) |
| $750,000 to $999,999 | 0 (0.0%) | 0 (0.0%) |
| $1,000,000 or more | 0 (0.0%) | 0 (0.0%) |
| Total | 279 (100.0%) | 246 (100.0%) |
Household Income by Mortgage Status in North Belle Vernon borough
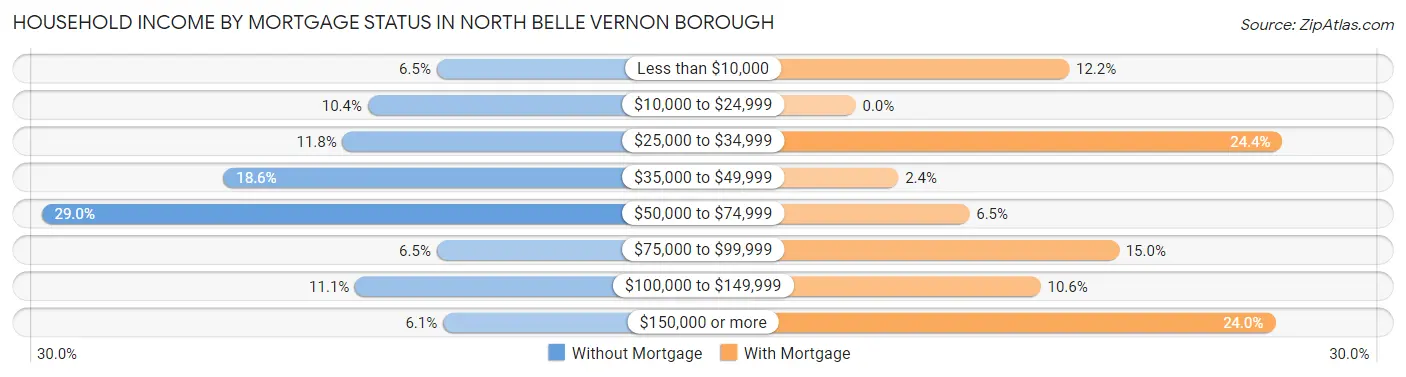
| Household Income | Without Mortgage | With Mortgage |
| Less than $10,000 | 18 (6.5%) | 30 (12.2%) |
| $10,000 to $24,999 | 29 (10.4%) | 0 (0.0%) |
| $25,000 to $34,999 | 33 (11.8%) | 60 (24.4%) |
| $35,000 to $49,999 | 52 (18.6%) | 6 (2.4%) |
| $50,000 to $74,999 | 81 (29.0%) | 16 (6.5%) |
| $75,000 to $99,999 | 18 (6.5%) | 37 (15.0%) |
| $100,000 to $149,999 | 31 (11.1%) | 26 (10.6%) |
| $150,000 or more | 17 (6.1%) | 59 (24.0%) |
| Total | 279 (100.0%) | 246 (100.0%) |
Property Value to Household Income Ratio in North Belle Vernon borough
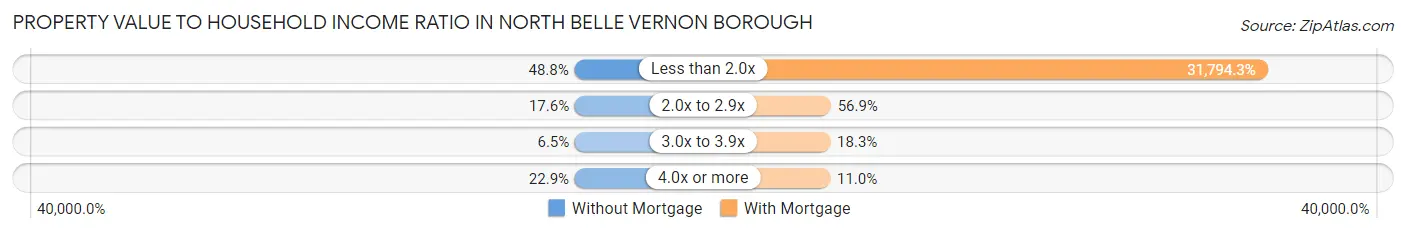
| Value-to-Income Ratio | Without Mortgage | With Mortgage |
| Less than 2.0x | 136 (48.7%) | 78,214 (31,794.3%) |
| 2.0x to 2.9x | 49 (17.6%) | 140 (56.9%) |
| 3.0x to 3.9x | 18 (6.5%) | 45 (18.3%) |
| 4.0x or more | 64 (22.9%) | 27 (11.0%) |
| Total | 279 (100.0%) | 246 (100.0%) |
Real Estate Taxes by Mortgage Status in North Belle Vernon borough
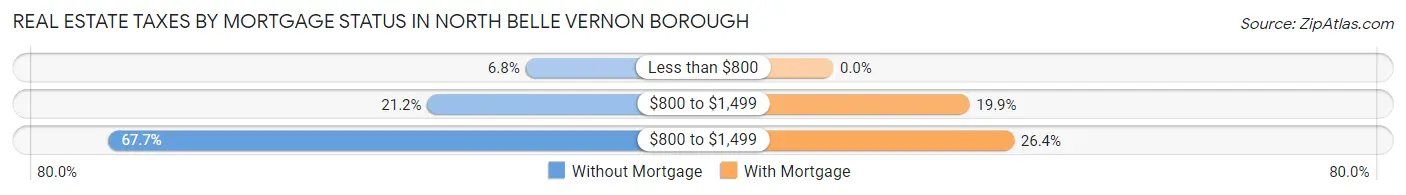
| Property Taxes | Without Mortgage | With Mortgage |
| Less than $800 | 19 (6.8%) | 0 (0.0%) |
| $800 to $1,499 | 59 (21.1%) | 49 (19.9%) |
| $800 to $1,499 | 189 (67.7%) | 65 (26.4%) |
| Total | 279 (100.0%) | 246 (100.0%) |
Health & Disability in North Belle Vernon borough
Health Insurance Coverage by Age in North Belle Vernon borough
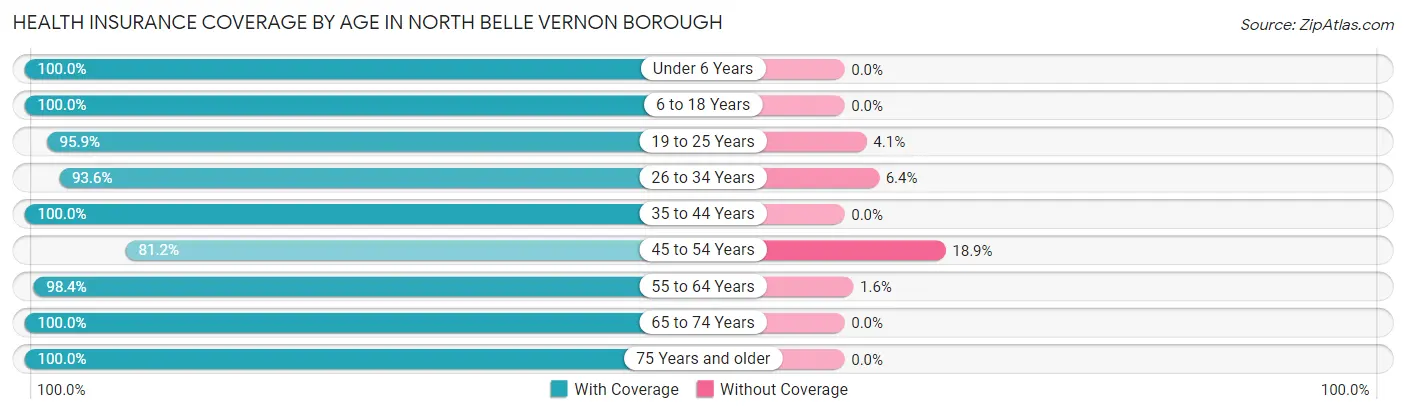
| Age Bracket | With Coverage | Without Coverage |
| Under 6 Years | 70 (100.0%) | 0 (0.0%) |
| 6 to 18 Years | 246 (100.0%) | 0 (0.0%) |
| 19 to 25 Years | 163 (95.9%) | 7 (4.1%) |
| 26 to 34 Years | 175 (93.6%) | 12 (6.4%) |
| 35 to 44 Years | 112 (100.0%) | 0 (0.0%) |
| 45 to 54 Years | 198 (81.1%) | 46 (18.9%) |
| 55 to 64 Years | 240 (98.4%) | 4 (1.6%) |
| 65 to 74 Years | 158 (100.0%) | 0 (0.0%) |
| 75 Years and older | 167 (100.0%) | 0 (0.0%) |
| Total | 1,529 (95.7%) | 69 (4.3%) |
Health Insurance Coverage by Citizenship Status in North Belle Vernon borough
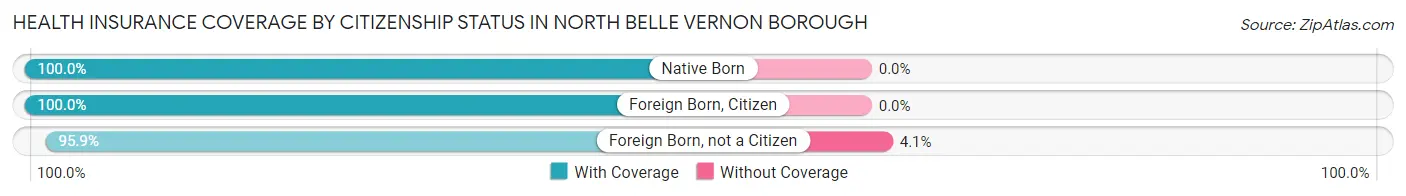
| Citizenship Status | With Coverage | Without Coverage |
| Native Born | 70 (100.0%) | 0 (0.0%) |
| Foreign Born, Citizen | 246 (100.0%) | 0 (0.0%) |
| Foreign Born, not a Citizen | 163 (95.9%) | 7 (4.1%) |
Health Insurance Coverage by Household Income in North Belle Vernon borough
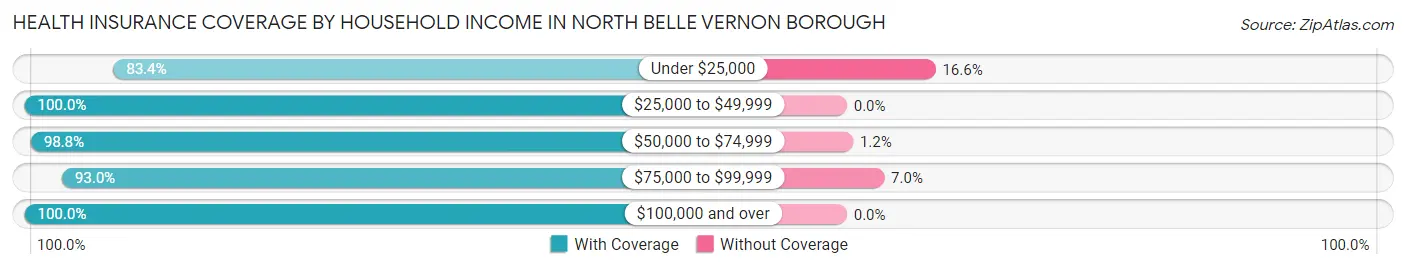
| Household Income | With Coverage | Without Coverage |
| Under $25,000 | 291 (83.4%) | 58 (16.6%) |
| $25,000 to $49,999 | 237 (100.0%) | 0 (0.0%) |
| $50,000 to $74,999 | 340 (98.8%) | 4 (1.2%) |
| $75,000 to $99,999 | 93 (93.0%) | 7 (7.0%) |
| $100,000 and over | 568 (100.0%) | 0 (0.0%) |
Public vs Private Health Insurance Coverage by Age in North Belle Vernon borough
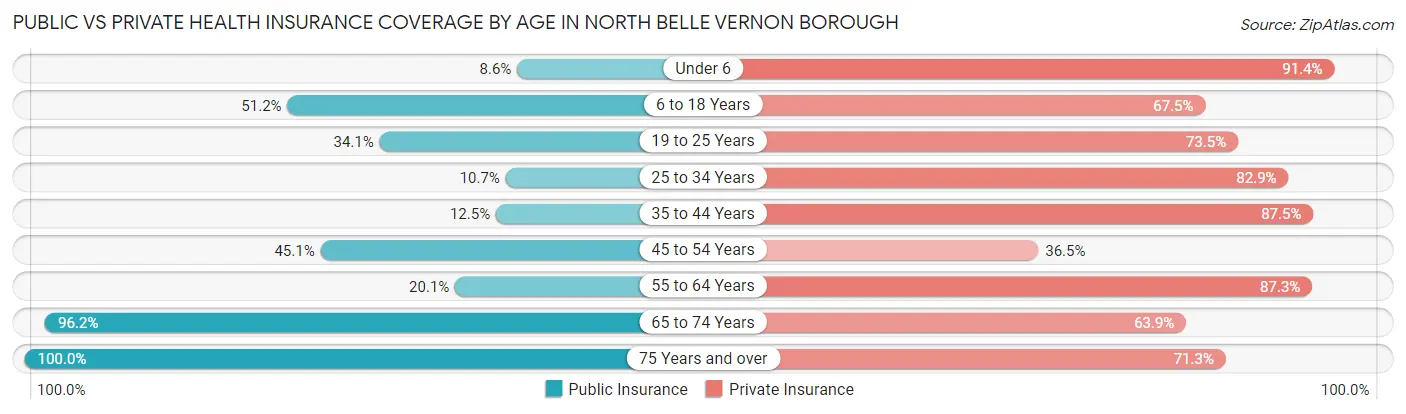
| Age Bracket | Public Insurance | Private Insurance |
| Under 6 | 6 (8.6%) | 64 (91.4%) |
| 6 to 18 Years | 126 (51.2%) | 166 (67.5%) |
| 19 to 25 Years | 58 (34.1%) | 125 (73.5%) |
| 25 to 34 Years | 20 (10.7%) | 155 (82.9%) |
| 35 to 44 Years | 14 (12.5%) | 98 (87.5%) |
| 45 to 54 Years | 110 (45.1%) | 89 (36.5%) |
| 55 to 64 Years | 49 (20.1%) | 213 (87.3%) |
| 65 to 74 Years | 152 (96.2%) | 101 (63.9%) |
| 75 Years and over | 167 (100.0%) | 119 (71.3%) |
| Total | 702 (43.9%) | 1,130 (70.7%) |
Disability Status by Sex by Age in North Belle Vernon borough
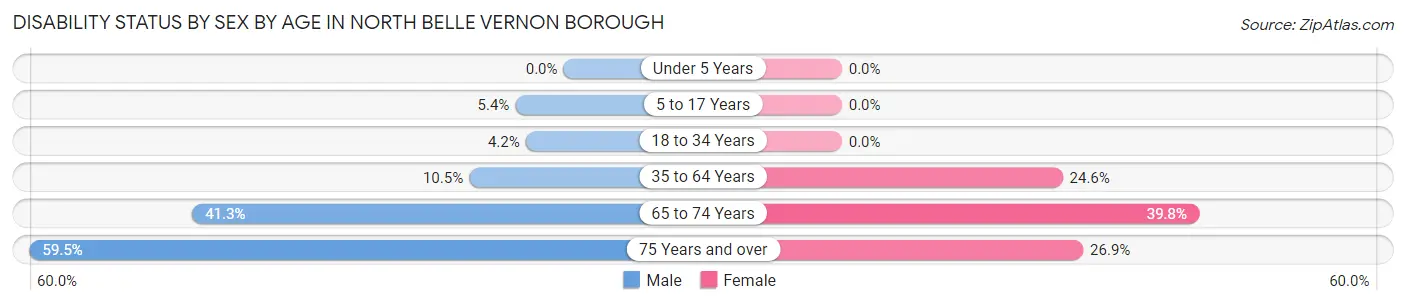
| Age Bracket | Male | Female |
| Under 5 Years | 0 (0.0%) | 0 (0.0%) |
| 5 to 17 Years | 6 (5.4%) | 0 (0.0%) |
| 18 to 34 Years | 8 (4.2%) | 0 (0.0%) |
| 35 to 64 Years | 31 (10.5%) | 75 (24.6%) |
| 65 to 74 Years | 31 (41.3%) | 33 (39.8%) |
| 75 Years and over | 44 (59.5%) | 25 (26.9%) |
Disability Class by Sex by Age in North Belle Vernon borough
Disability Class: Hearing Difficulty
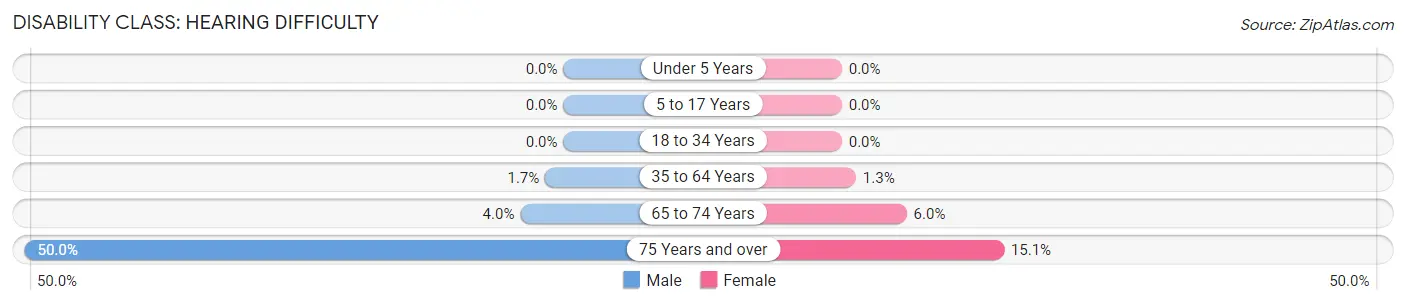
| Age Bracket | Male | Female |
| Under 5 Years | 0 (0.0%) | 0 (0.0%) |
| 5 to 17 Years | 0 (0.0%) | 0 (0.0%) |
| 18 to 34 Years | 0 (0.0%) | 0 (0.0%) |
| 35 to 64 Years | 5 (1.7%) | 4 (1.3%) |
| 65 to 74 Years | 3 (4.0%) | 5 (6.0%) |
| 75 Years and over | 37 (50.0%) | 14 (15.0%) |
Disability Class: Vision Difficulty
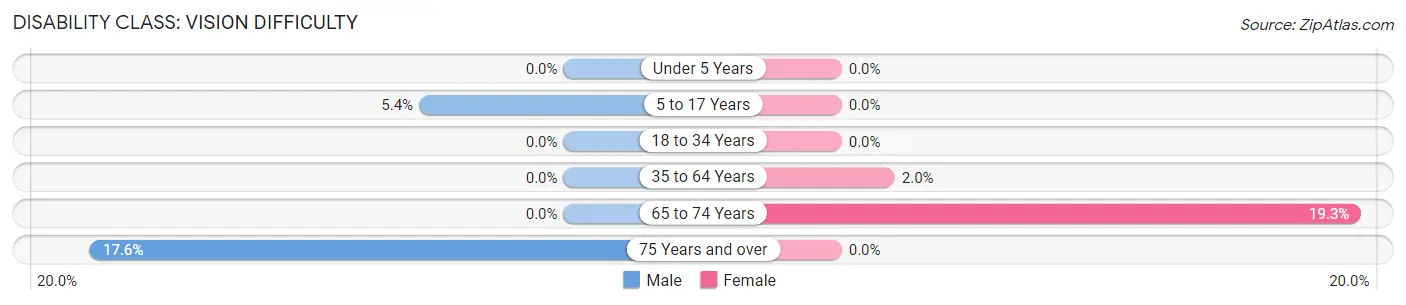
| Age Bracket | Male | Female |
| Under 5 Years | 0 (0.0%) | 0 (0.0%) |
| 5 to 17 Years | 6 (5.4%) | 0 (0.0%) |
| 18 to 34 Years | 0 (0.0%) | 0 (0.0%) |
| 35 to 64 Years | 0 (0.0%) | 6 (2.0%) |
| 65 to 74 Years | 0 (0.0%) | 16 (19.3%) |
| 75 Years and over | 13 (17.6%) | 0 (0.0%) |
Disability Class: Cognitive Difficulty
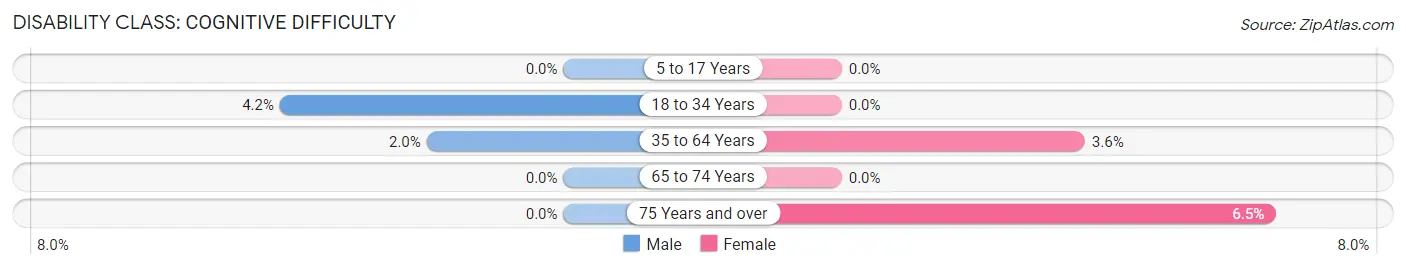
| Age Bracket | Male | Female |
| 5 to 17 Years | 0 (0.0%) | 0 (0.0%) |
| 18 to 34 Years | 8 (4.2%) | 0 (0.0%) |
| 35 to 64 Years | 6 (2.0%) | 11 (3.6%) |
| 65 to 74 Years | 0 (0.0%) | 0 (0.0%) |
| 75 Years and over | 0 (0.0%) | 6 (6.5%) |
Disability Class: Ambulatory Difficulty
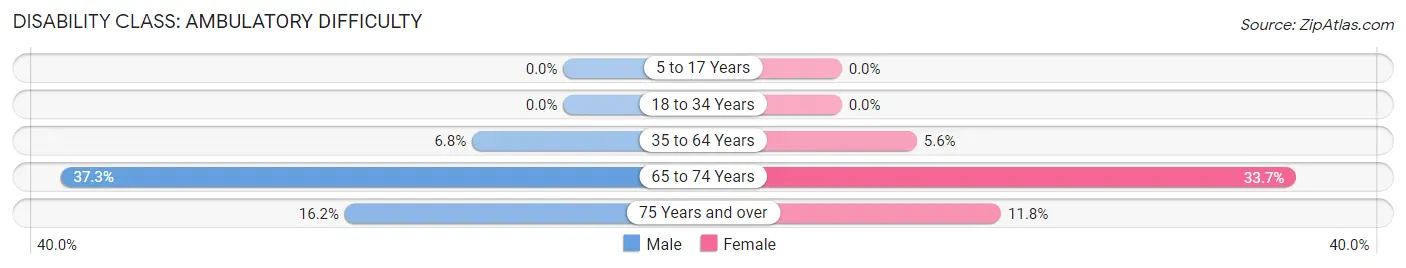
| Age Bracket | Male | Female |
| 5 to 17 Years | 0 (0.0%) | 0 (0.0%) |
| 18 to 34 Years | 0 (0.0%) | 0 (0.0%) |
| 35 to 64 Years | 20 (6.8%) | 17 (5.6%) |
| 65 to 74 Years | 28 (37.3%) | 28 (33.7%) |
| 75 Years and over | 12 (16.2%) | 11 (11.8%) |
Disability Class: Self-Care Difficulty
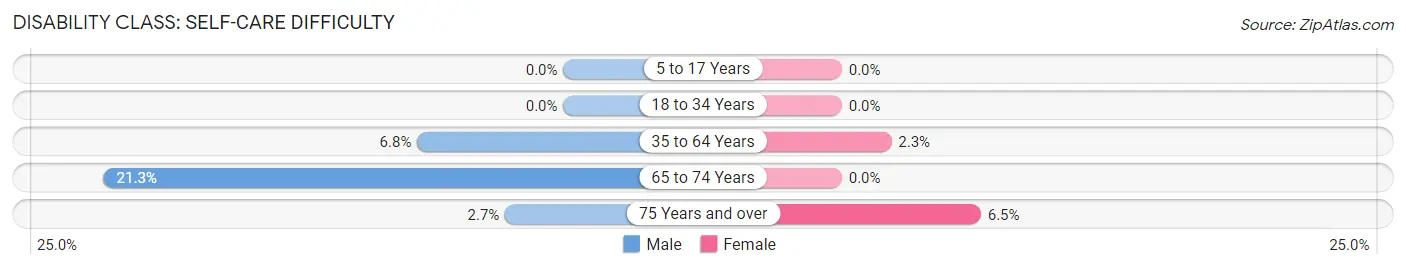
| Age Bracket | Male | Female |
| 5 to 17 Years | 0 (0.0%) | 0 (0.0%) |
| 18 to 34 Years | 0 (0.0%) | 0 (0.0%) |
| 35 to 64 Years | 20 (6.8%) | 7 (2.3%) |
| 65 to 74 Years | 16 (21.3%) | 0 (0.0%) |
| 75 Years and over | 2 (2.7%) | 6 (6.5%) |
Technology Access in North Belle Vernon borough
Computing Device Access in North Belle Vernon borough
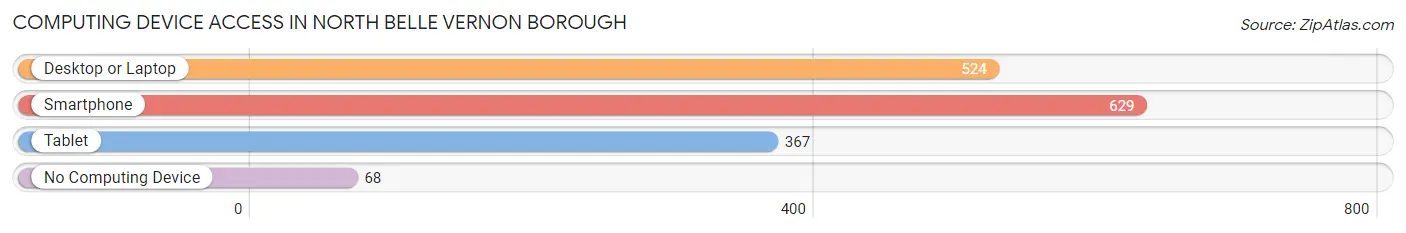
| Device Type | # Households | % Households |
| Desktop or Laptop | 524 | 69.9% |
| Smartphone | 629 | 83.9% |
| Tablet | 367 | 48.9% |
| No Computing Device | 68 | 9.1% |
| Total | 750 | 100.0% |
Internet Access in North Belle Vernon borough
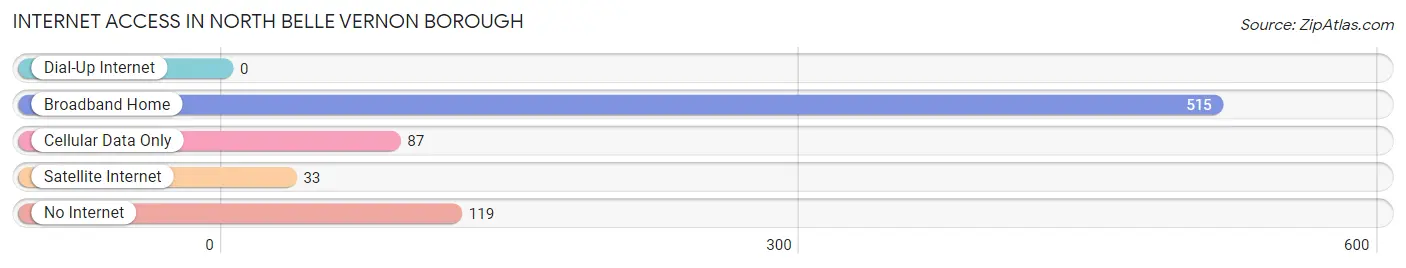
| Internet Type | # Households | % Households |
| Dial-Up Internet | 0 | 0.0% |
| Broadband Home | 515 | 68.7% |
| Cellular Data Only | 87 | 11.6% |
| Satellite Internet | 33 | 4.4% |
| No Internet | 119 | 15.9% |
| Total | 750 | 100.0% |
North Belle Vernon borough Summary
Belle Vernon Borough is a small borough located in Fayette County, Pennsylvania. It is situated along the Monongahela River, approximately 25 miles south of Pittsburgh. The borough has a population of approximately 2,500 people and covers an area of 0.7 square miles.
History
Belle Vernon was founded in 1817 by John and Mary Belle, who purchased the land from the local Native Americans. The town was originally known as Belle’s Ferry, named after the ferry service that operated across the Monongahela River. In 1836, the town was renamed Belle Vernon in honor of the Belle family.
In the late 19th century, Belle Vernon was a thriving industrial center. The town was home to several coal mines, steel mills, and glass factories. The town also had a thriving commercial district, with several stores, banks, and other businesses.
In the early 20th century, the town’s economy began to decline as the steel and coal industries moved away. The town’s population also began to decline as people moved away in search of better job opportunities.
Geography
Belle Vernon is located in Fayette County, Pennsylvania. It is situated along the Monongahela River, approximately 25 miles south of Pittsburgh. The borough has a total area of 0.7 square miles, all of which is land.
The borough is located in the Appalachian Mountains region of Pennsylvania. The terrain is mostly hilly, with some flat areas near the river. The climate is humid continental, with hot summers and cold winters.
Economy
Belle Vernon’s economy is largely based on the service industry. The town is home to several restaurants, bars, and other businesses. The town also has a few manufacturing companies, including a steel mill and a glass factory.
The town’s economy is also supported by tourism. The town is home to several historic sites, including the Belle Vernon Bridge, which was built in 1836. The town also has several parks and recreational areas, including the Belle Vernon Recreation Area.
Demographics
As of the 2010 census, Belle Vernon had a population of 2,500 people. The racial makeup of the town was 97.2% White, 0.8% African American, 0.4% Native American, 0.4% Asian, and 1.2% from other races.
The median household income in Belle Vernon was $37,500, and the median family income was $45,000. The per capita income was $19,000. About 11.2% of the population was below the poverty line.
Belle Vernon is served by the Belle Vernon Area School District. The town is home to several churches, including the First United Methodist Church and the St. John’s Lutheran Church. The town also has a public library and a post office.
Common Questions
What is Per Capita Income in North Belle Vernon borough?
Per Capita income in North Belle Vernon borough is $37,472.
What is the Median Family Income in North Belle Vernon borough?
Median Family Income in North Belle Vernon borough is $64,412.
What is the Median Household income in North Belle Vernon borough?
Median Household Income in North Belle Vernon borough is $51,293.
What is Income or Wage Gap in North Belle Vernon borough?
Income or Wage Gap in North Belle Vernon borough is 3.9%.
Women in North Belle Vernon borough earn 96.1 cents for every dollar earned by a man.
What is Inequality or Gini Index in North Belle Vernon borough?
Inequality or Gini Index in North Belle Vernon borough is 0.55.
What is the Total Population of North Belle Vernon borough?
Total Population of North Belle Vernon borough is 1,598.
What is the Total Male Population of North Belle Vernon borough?
Total Male Population of North Belle Vernon borough is 758.
What is the Total Female Population of North Belle Vernon borough?
Total Female Population of North Belle Vernon borough is 840.
What is the Ratio of Males per 100 Females in North Belle Vernon borough?
There are 90.24 Males per 100 Females in North Belle Vernon borough.
What is the Ratio of Females per 100 Males in North Belle Vernon borough?
There are 110.82 Females per 100 Males in North Belle Vernon borough.
What is the Median Population Age in North Belle Vernon borough?
Median Population Age in North Belle Vernon borough is 46.0 Years.
What is the Average Family Size in North Belle Vernon borough
Average Family Size in North Belle Vernon borough is 2.9 People.
What is the Average Household Size in North Belle Vernon borough
Average Household Size in North Belle Vernon borough is 2.1 People.
How Large is the Labor Force in North Belle Vernon borough?
There are 830 People in the Labor Forcein in North Belle Vernon borough.
What is the Percentage of People in the Labor Force in North Belle Vernon borough?
60.5% of People are in the Labor Force in North Belle Vernon borough.
What is the Unemployment Rate in North Belle Vernon borough?
Unemployment Rate in North Belle Vernon borough is 8.3%.