Northern Cambria borough, PA Map & Demographics
Northern Cambria borough Overview
$24,373
PER CAPITA INCOME
$66,020
AVG FAMILY INCOME
$49,750
AVG HOUSEHOLD INCOME
1.6%
WAGE / INCOME GAP [ % ]
98.4¢/ $1
WAGE / INCOME GAP [ $ ]
0.44
INEQUALITY / GINI INDEX
3,548
TOTAL POPULATION
1,876
MALE POPULATION
1,672
FEMALE POPULATION
112.20
MALES / 100 FEMALES
89.13
FEMALES / 100 MALES
38.1
MEDIAN AGE
3.2
AVG FAMILY SIZE
2.5
AVG HOUSEHOLD SIZE
1,593
LABOR FORCE [ PEOPLE ]
59.9%
PERCENT IN LABOR FORCE
5.3%
UNEMPLOYMENT RATE
Income in Northern Cambria borough
Income Overview in Northern Cambria borough
Per Capita Income in Northern Cambria borough is $24,373, while median incomes of families and households are $66,020 and $49,750 respectively.
| Characteristic | Number | Measure |
| Per Capita Income | 3,548 | $24,373 |
| Median Family Income | 912 | $66,020 |
| Mean Family Income | 912 | $71,467 |
| Median Household Income | 1,388 | $49,750 |
| Mean Household Income | 1,388 | $60,494 |
| Income Deficit | 912 | $0 |
| Wage / Income Gap (%) | 3,548 | 1.61% |
| Wage / Income Gap ($) | 3,548 | 98.39¢ per $1 |
| Gini / Inequality Index | 3,548 | 0.44 |
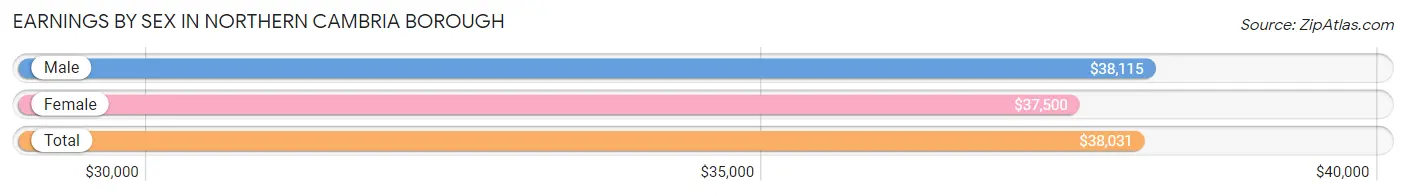
Earnings by Sex in Northern Cambria borough
Average Earnings in Northern Cambria borough are $38,031, $38,115 for men and $37,500 for women, a difference of 1.6%.
| Sex | Number | Average Earnings |
| Male | 957 (60.5%) | $38,115 |
| Female | 624 (39.5%) | $37,500 |
| Total | 1,581 (100.0%) | $38,031 |
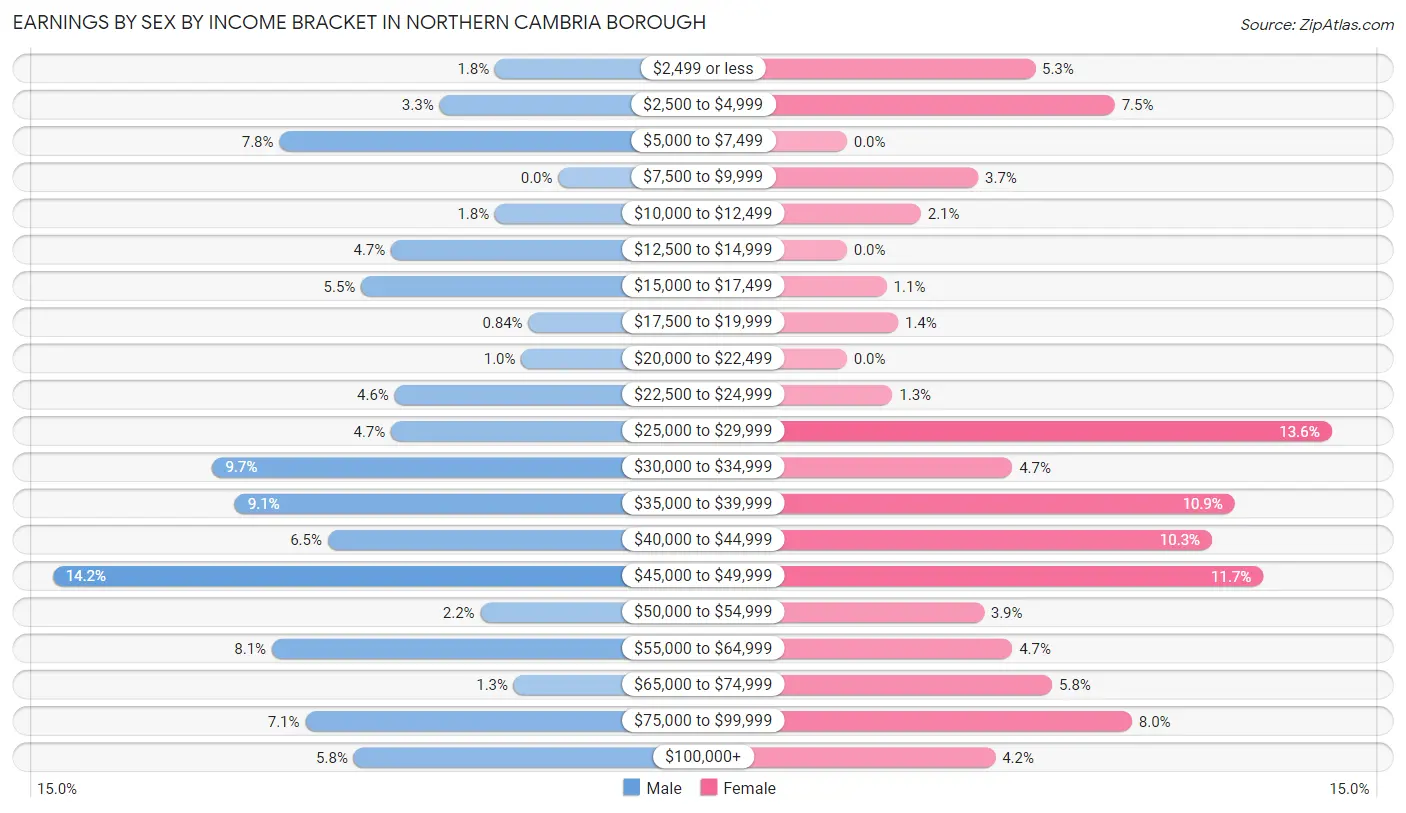
Earnings by Sex by Income Bracket in Northern Cambria borough
The most common earnings brackets in Northern Cambria borough are $45,000 to $49,999 for men (136 | 14.2%) and $25,000 to $29,999 for women (85 | 13.6%).
| Income | Male | Female |
| $2,499 or less | 17 (1.8%) | 33 (5.3%) |
| $2,500 to $4,999 | 32 (3.3%) | 47 (7.5%) |
| $5,000 to $7,499 | 75 (7.8%) | 0 (0.0%) |
| $7,500 to $9,999 | 0 (0.0%) | 23 (3.7%) |
| $10,000 to $12,499 | 17 (1.8%) | 13 (2.1%) |
| $12,500 to $14,999 | 45 (4.7%) | 0 (0.0%) |
| $15,000 to $17,499 | 53 (5.5%) | 7 (1.1%) |
| $17,500 to $19,999 | 8 (0.8%) | 9 (1.4%) |
| $20,000 to $22,499 | 10 (1.0%) | 0 (0.0%) |
| $22,500 to $24,999 | 44 (4.6%) | 8 (1.3%) |
| $25,000 to $29,999 | 45 (4.7%) | 85 (13.6%) |
| $30,000 to $34,999 | 93 (9.7%) | 29 (4.6%) |
| $35,000 to $39,999 | 87 (9.1%) | 68 (10.9%) |
| $40,000 to $44,999 | 62 (6.5%) | 64 (10.3%) |
| $45,000 to $49,999 | 136 (14.2%) | 73 (11.7%) |
| $50,000 to $54,999 | 21 (2.2%) | 24 (3.8%) |
| $55,000 to $64,999 | 77 (8.1%) | 29 (4.6%) |
| $65,000 to $74,999 | 12 (1.3%) | 36 (5.8%) |
| $75,000 to $99,999 | 68 (7.1%) | 50 (8.0%) |
| $100,000+ | 55 (5.8%) | 26 (4.2%) |
| Total | 957 (100.0%) | 624 (100.0%) |
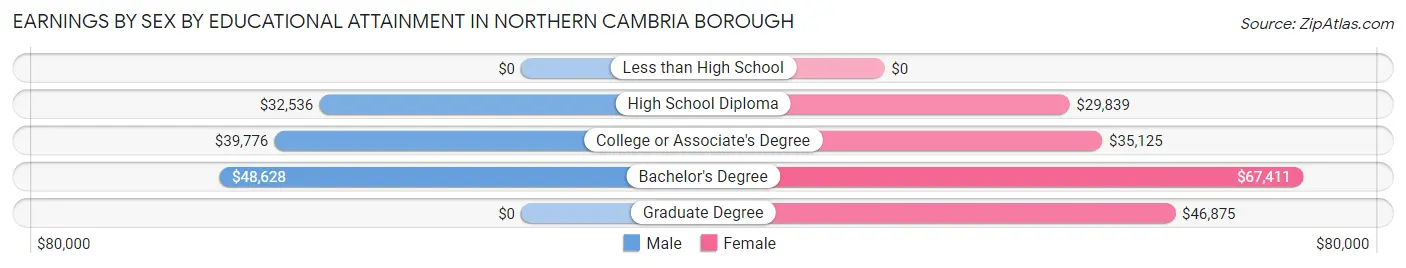
Earnings by Sex by Educational Attainment in Northern Cambria borough
Average earnings in Northern Cambria borough are $38,988 for men and $40,786 for women, a difference of 4.4%. Men with an educational attainment of bachelor's degree enjoy the highest average annual earnings of $48,628, while those with high school diploma education earn the least with $32,536. Women with an educational attainment of bachelor's degree earn the most with the average annual earnings of $67,411, while those with high school diploma education have the smallest earnings of $29,839.
| Educational Attainment | Male Income | Female Income |
| Less than High School | - | - |
| High School Diploma | $32,536 | $29,839 |
| College or Associate's Degree | $39,776 | $35,125 |
| Bachelor's Degree | $48,628 | $67,411 |
| Graduate Degree | - | - |
| Total | $38,988 | $40,786 |
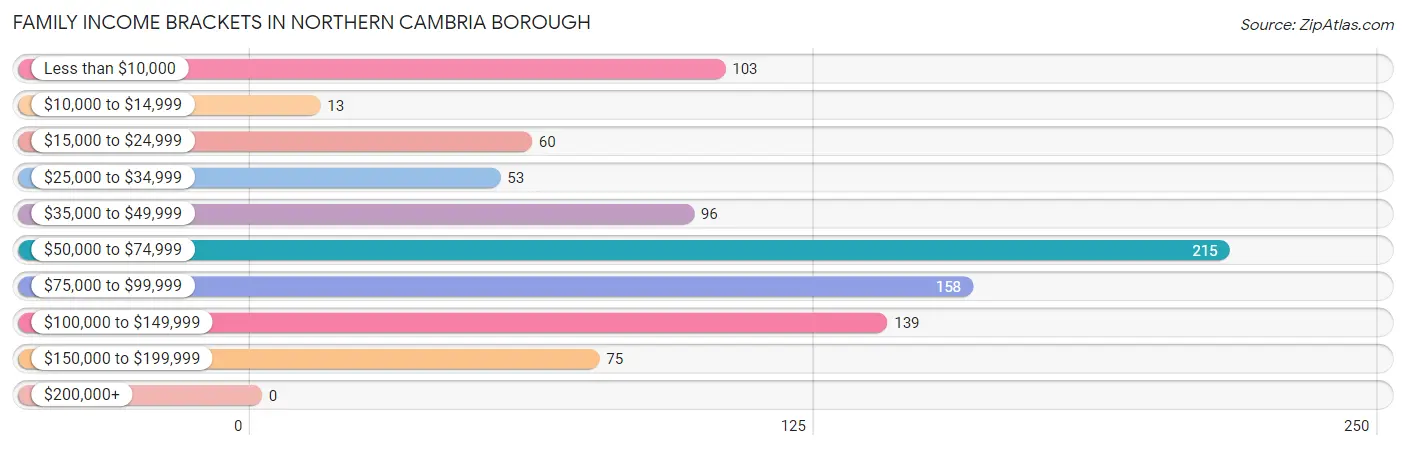
Family Income in Northern Cambria borough
Family Income Brackets in Northern Cambria borough
According to the Northern Cambria borough family income data, there are 215 families falling into the $50,000 to $74,999 income range, which is the most common income bracket and makes up 23.6% of all families.
| Income Bracket | # Families | % Families |
| Less than $10,000 | 103 | 11.3% |
| $10,000 to $14,999 | 13 | 1.4% |
| $15,000 to $24,999 | 60 | 6.6% |
| $25,000 to $34,999 | 53 | 5.8% |
| $35,000 to $49,999 | 96 | 10.5% |
| $50,000 to $74,999 | 215 | 23.6% |
| $75,000 to $99,999 | 158 | 17.3% |
| $100,000 to $149,999 | 139 | 15.2% |
| $150,000 to $199,999 | 75 | 8.2% |
| $200,000+ | 0 | 0.0% |
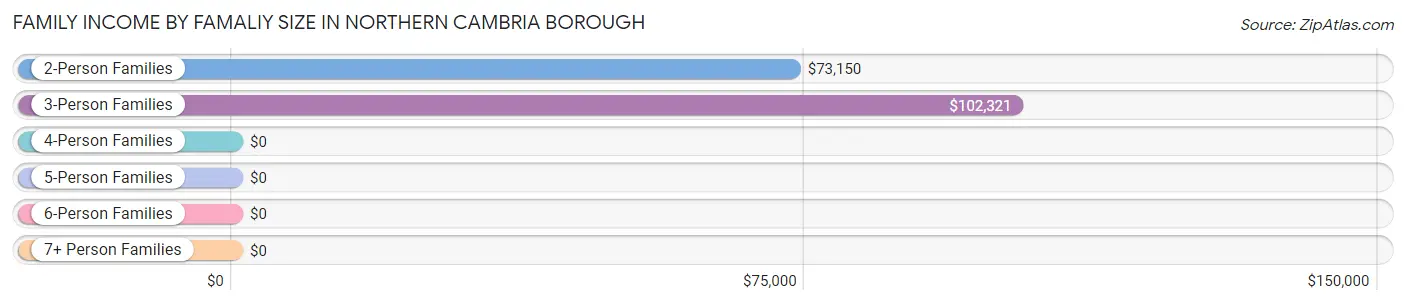
Family Income by Famaliy Size in Northern Cambria borough
3-person families (213 | 23.4%) account for the highest median family income in Northern Cambria borough with $102,321 per family, while 2-person families (427 | 46.8%) have the highest median income of $36,575 per family member.
| Income Bracket | # Families | Median Income |
| 2-Person Families | 427 (46.8%) | $73,150 |
| 3-Person Families | 213 (23.4%) | $102,321 |
| 4-Person Families | 179 (19.6%) | $0 |
| 5-Person Families | 65 (7.1%) | $0 |
| 6-Person Families | 28 (3.1%) | $0 |
| 7+ Person Families | 0 (0.0%) | $0 |
| Total | 912 (100.0%) | $66,020 |
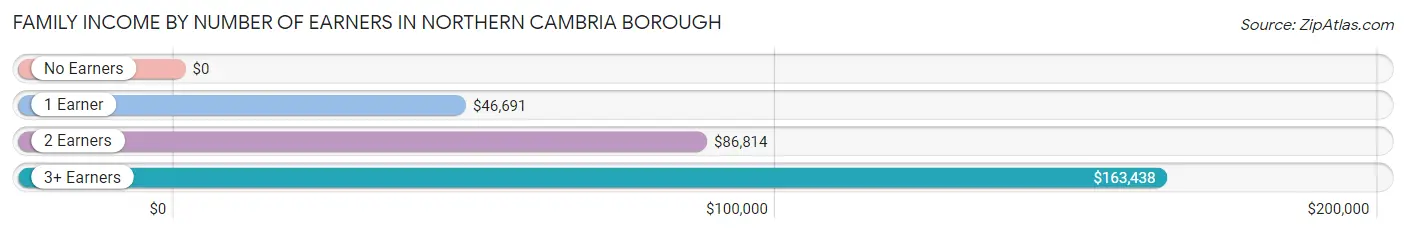
Family Income by Number of Earners in Northern Cambria borough
| Number of Earners | # Families | Median Income |
| No Earners | 189 (20.7%) | $0 |
| 1 Earner | 242 (26.5%) | $46,691 |
| 2 Earners | 428 (46.9%) | $86,814 |
| 3+ Earners | 53 (5.8%) | $163,438 |
| Total | 912 (100.0%) | $66,020 |
Household Income in Northern Cambria borough
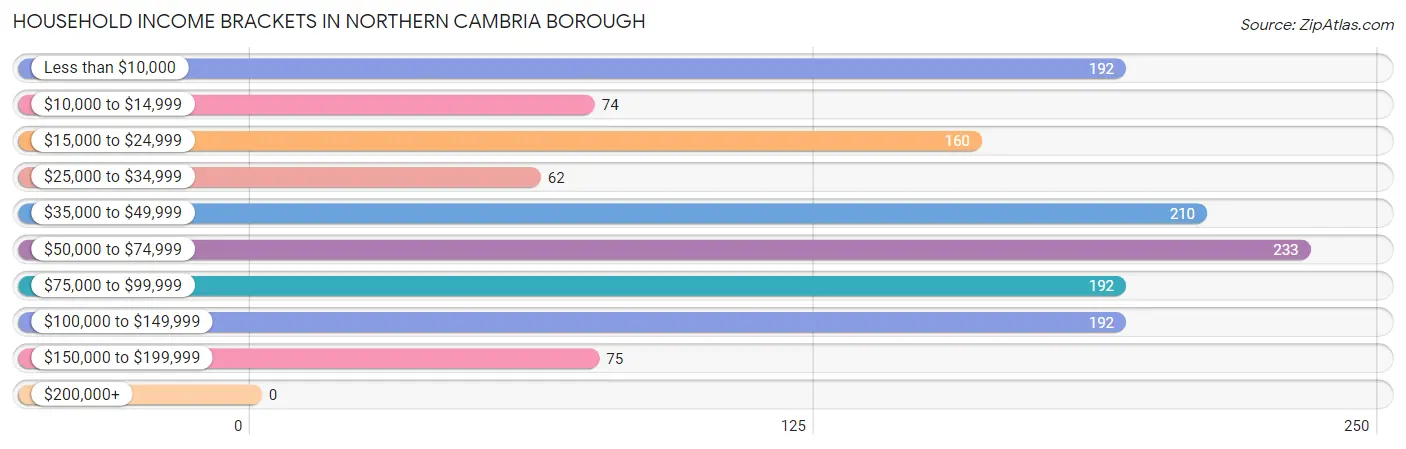
Household Income Brackets in Northern Cambria borough
With 233 households falling in the category, the $50,000 to $74,999 income range is the most frequent in Northern Cambria borough, accounting for 16.8% of all households.
| Income Bracket | # Households | % Households |
| Less than $10,000 | 192 | 13.8% |
| $10,000 to $14,999 | 74 | 5.3% |
| $15,000 to $24,999 | 160 | 11.5% |
| $25,000 to $34,999 | 62 | 4.5% |
| $35,000 to $49,999 | 210 | 15.1% |
| $50,000 to $74,999 | 233 | 16.8% |
| $75,000 to $99,999 | 192 | 13.8% |
| $100,000 to $149,999 | 192 | 13.8% |
| $150,000 to $199,999 | 75 | 5.4% |
| $200,000+ | 0 | 0.0% |
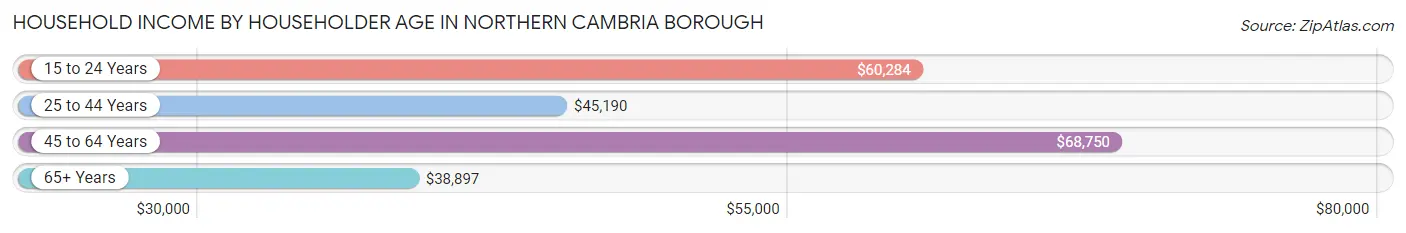
Household Income by Householder Age in Northern Cambria borough
The median household income in Northern Cambria borough is $49,750, with the highest median household income of $68,750 found in the 45 to 64 years age bracket for the primary householder. A total of 575 households (41.4%) fall into this category. Meanwhile, the 65+ years age bracket for the primary householder has the lowest median household income of $38,897, with 347 households (25.0%) in this group.
| Income Bracket | # Households | Median Income |
| 15 to 24 Years | 53 (3.8%) | $60,284 |
| 25 to 44 Years | 413 (29.8%) | $45,190 |
| 45 to 64 Years | 575 (41.4%) | $68,750 |
| 65+ Years | 347 (25.0%) | $38,897 |
| Total | 1,388 (100.0%) | $49,750 |
Poverty in Northern Cambria borough
Income Below Poverty by Sex and Age in Northern Cambria borough
With 24.6% poverty level for males and 33.5% for females among the residents of Northern Cambria borough, 12 to 14 year old males and 5 year old females are the most vulnerable to poverty, with 74 males (84.1%) and 73 females (76.0%) in their respective age groups living below the poverty level.
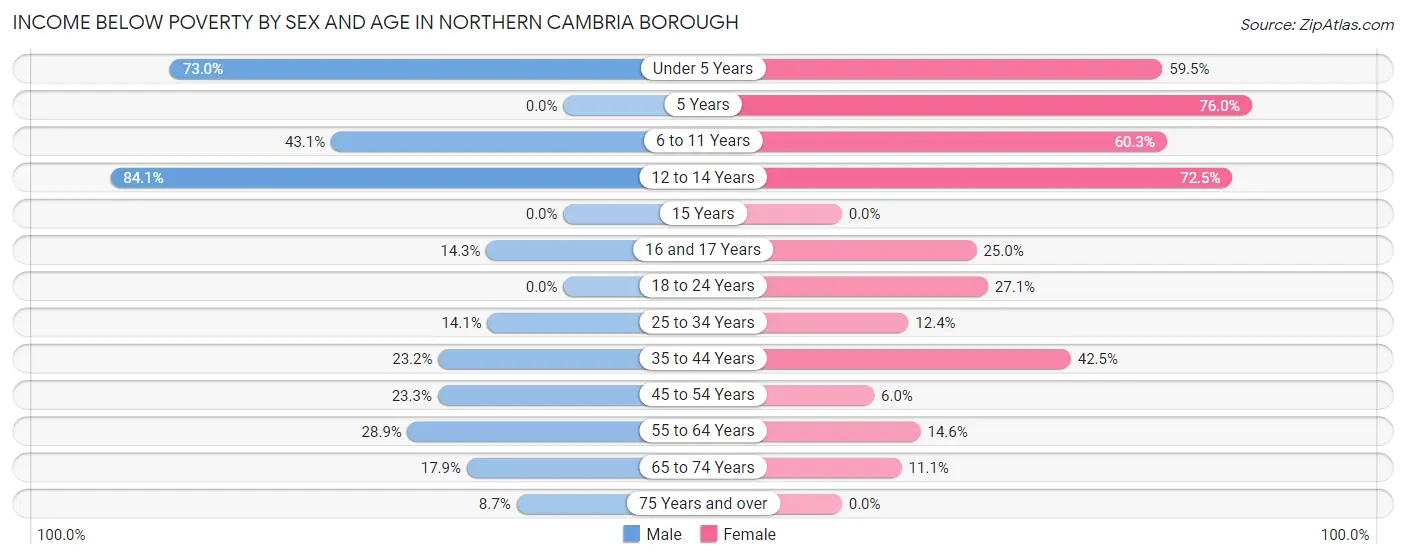
| Age Bracket | Male | Female |
| Under 5 Years | 65 (73.0%) | 141 (59.5%) |
| 5 Years | 0 (0.0%) | 73 (76.0%) |
| 6 to 11 Years | 47 (43.1%) | 79 (60.3%) |
| 12 to 14 Years | 74 (84.1%) | 79 (72.5%) |
| 15 Years | 0 (0.0%) | 0 (0.0%) |
| 16 and 17 Years | 9 (14.3%) | 9 (25.0%) |
| 18 to 24 Years | 0 (0.0%) | 16 (27.1%) |
| 25 to 34 Years | 30 (14.1%) | 11 (12.4%) |
| 35 to 44 Years | 55 (23.2%) | 85 (42.5%) |
| 45 to 54 Years | 45 (23.3%) | 10 (6.0%) |
| 55 to 64 Years | 87 (28.9%) | 45 (14.6%) |
| 65 to 74 Years | 43 (17.9%) | 12 (11.1%) |
| 75 Years and over | 6 (8.7%) | 0 (0.0%) |
| Total | 461 (24.6%) | 560 (33.5%) |
Income Above Poverty by Sex and Age in Northern Cambria borough
According to the poverty statistics in Northern Cambria borough, males aged 5 years and females aged 15 years are the age groups that are most secure financially, with 100.0% of males and 100.0% of females in these age groups living above the poverty line.
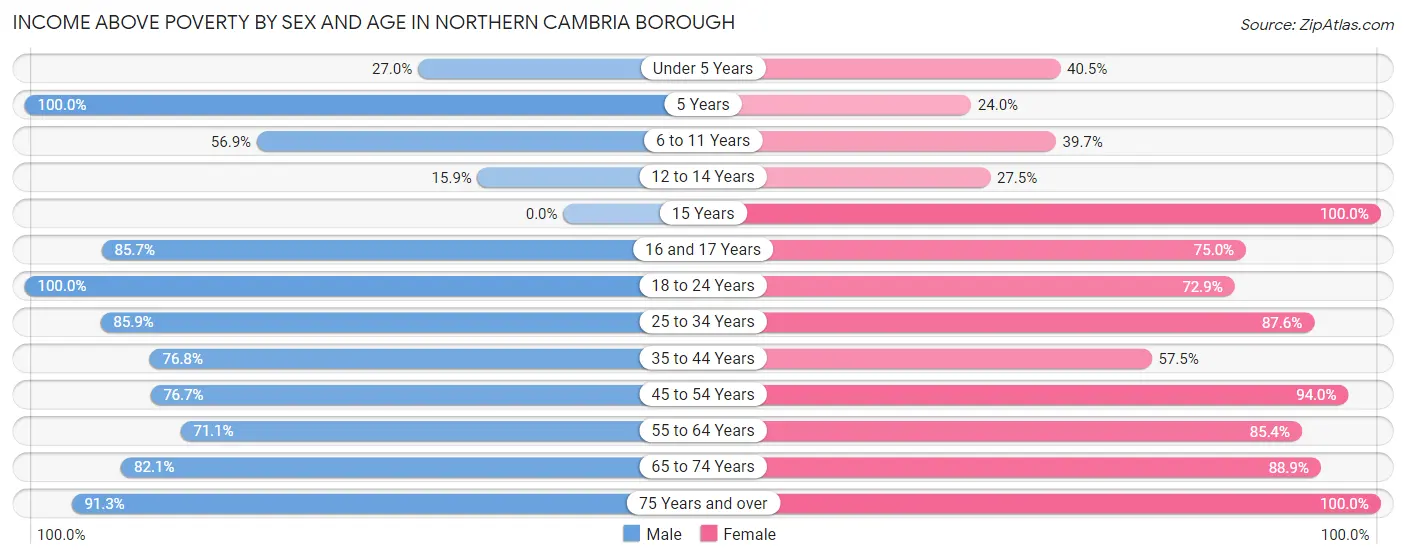
| Age Bracket | Male | Female |
| Under 5 Years | 24 (27.0%) | 96 (40.5%) |
| 5 Years | 18 (100.0%) | 23 (24.0%) |
| 6 to 11 Years | 62 (56.9%) | 52 (39.7%) |
| 12 to 14 Years | 14 (15.9%) | 30 (27.5%) |
| 15 Years | 0 (0.0%) | 11 (100.0%) |
| 16 and 17 Years | 54 (85.7%) | 27 (75.0%) |
| 18 to 24 Years | 256 (100.0%) | 43 (72.9%) |
| 25 to 34 Years | 183 (85.9%) | 78 (87.6%) |
| 35 to 44 Years | 182 (76.8%) | 115 (57.5%) |
| 45 to 54 Years | 148 (76.7%) | 157 (94.0%) |
| 55 to 64 Years | 214 (71.1%) | 263 (85.4%) |
| 65 to 74 Years | 197 (82.1%) | 96 (88.9%) |
| 75 Years and over | 63 (91.3%) | 121 (100.0%) |
| Total | 1,415 (75.4%) | 1,112 (66.5%) |
Income Below Poverty Among Married-Couple Families in Northern Cambria borough
The poverty statistics for married-couple families in Northern Cambria borough show that 4.8% or 27 of the total 559 families live below the poverty line. Families with no children have the highest poverty rate of 6.0%, comprising of 27 families. On the other hand, families with 1 or 2 children have the lowest poverty rate of 0.0%, which includes 0 families.
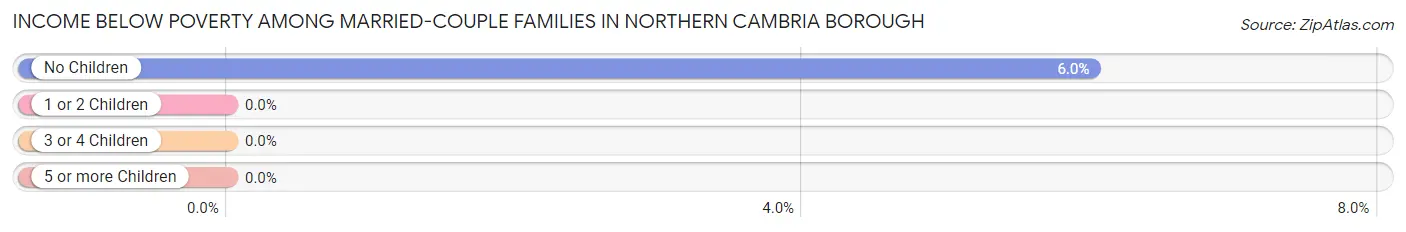
| Children | Above Poverty | Below Poverty |
| No Children | 422 (94.0%) | 27 (6.0%) |
| 1 or 2 Children | 82 (100.0%) | 0 (0.0%) |
| 3 or 4 Children | 28 (100.0%) | 0 (0.0%) |
| 5 or more Children | 0 (0.0%) | 0 (0.0%) |
| Total | 532 (95.2%) | 27 (4.8%) |
Income Below Poverty Among Single-Parent Households in Northern Cambria borough
According to the poverty data in Northern Cambria borough, 37.9% or 44 single-father households and 41.3% or 98 single-mother households are living below the poverty line. Among single-father households, those with 3 or 4 children have the highest poverty rate, with 44 households (88.0%) experiencing poverty. Likewise, among single-mother households, those with 3 or 4 children have the highest poverty rate, with 80 households (79.2%) falling below the poverty line.
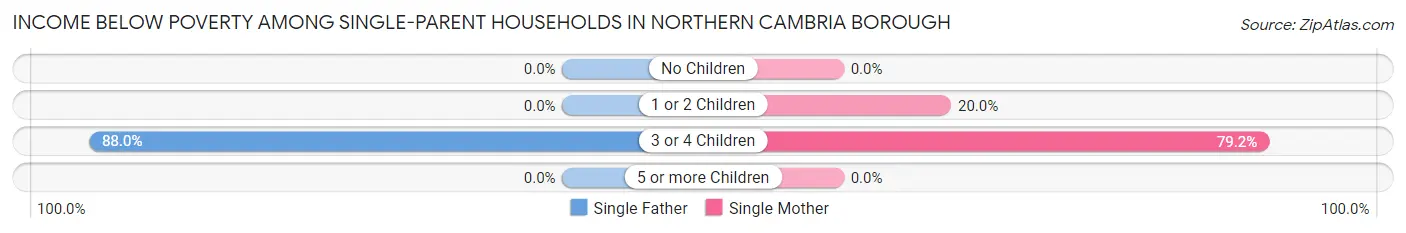
| Children | Single Father | Single Mother |
| No Children | 0 (0.0%) | 0 (0.0%) |
| 1 or 2 Children | 0 (0.0%) | 18 (20.0%) |
| 3 or 4 Children | 44 (88.0%) | 80 (79.2%) |
| 5 or more Children | 0 (0.0%) | 0 (0.0%) |
| Total | 44 (37.9%) | 98 (41.3%) |
Income Below Poverty Among Married-Couple vs Single-Parent Households in Northern Cambria borough
The poverty data for Northern Cambria borough shows that 27 of the married-couple family households (4.8%) and 142 of the single-parent households (40.2%) are living below the poverty level. Within the married-couple family households, those with no children have the highest poverty rate, with 27 households (6.0%) falling below the poverty line. Among the single-parent households, those with 3 or 4 children have the highest poverty rate, with 124 household (82.1%) living below poverty.
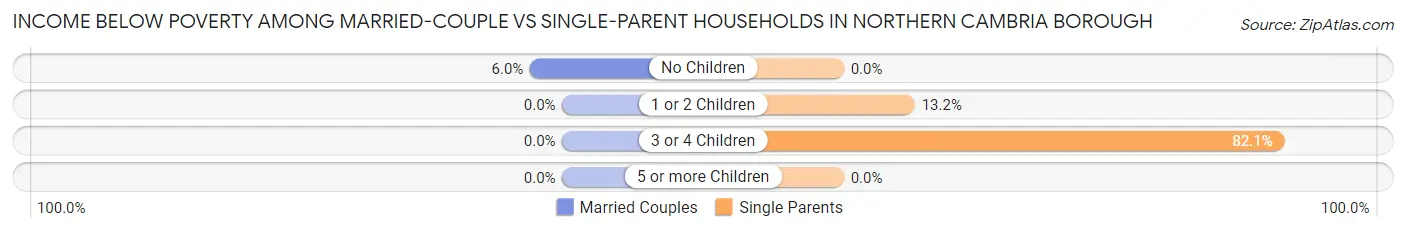
| Children | Married-Couple Families | Single-Parent Households |
| No Children | 27 (6.0%) | 0 (0.0%) |
| 1 or 2 Children | 0 (0.0%) | 18 (13.2%) |
| 3 or 4 Children | 0 (0.0%) | 124 (82.1%) |
| 5 or more Children | 0 (0.0%) | 0 (0.0%) |
| Total | 27 (4.8%) | 142 (40.2%) |
Race in Northern Cambria borough
The most populous races in Northern Cambria borough are White / Caucasian (3,455 | 97.4%), Asian (76 | 2.1%), and Two or more Races (17 | 0.5%).
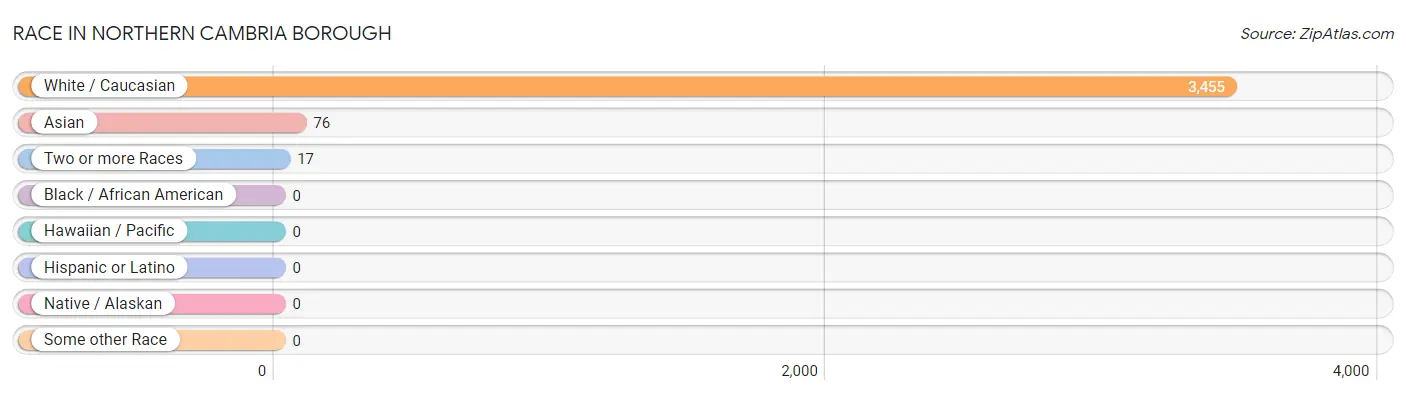
| Race | # Population | % Population |
| Asian | 76 | 2.1% |
| Black / African American | 0 | 0.0% |
| Hawaiian / Pacific | 0 | 0.0% |
| Hispanic or Latino | 0 | 0.0% |
| Native / Alaskan | 0 | 0.0% |
| White / Caucasian | 3,455 | 97.4% |
| Two or more Races | 17 | 0.5% |
| Some other Race | 0 | 0.0% |
| Total | 3,548 | 100.0% |
Ancestry in Northern Cambria borough
The most populous ancestries reported in Northern Cambria borough are German (856 | 24.1%), Irish (832 | 23.4%), Italian (506 | 14.3%), Polish (377 | 10.6%), and Slovak (297 | 8.4%), together accounting for 80.8% of all Northern Cambria borough residents.
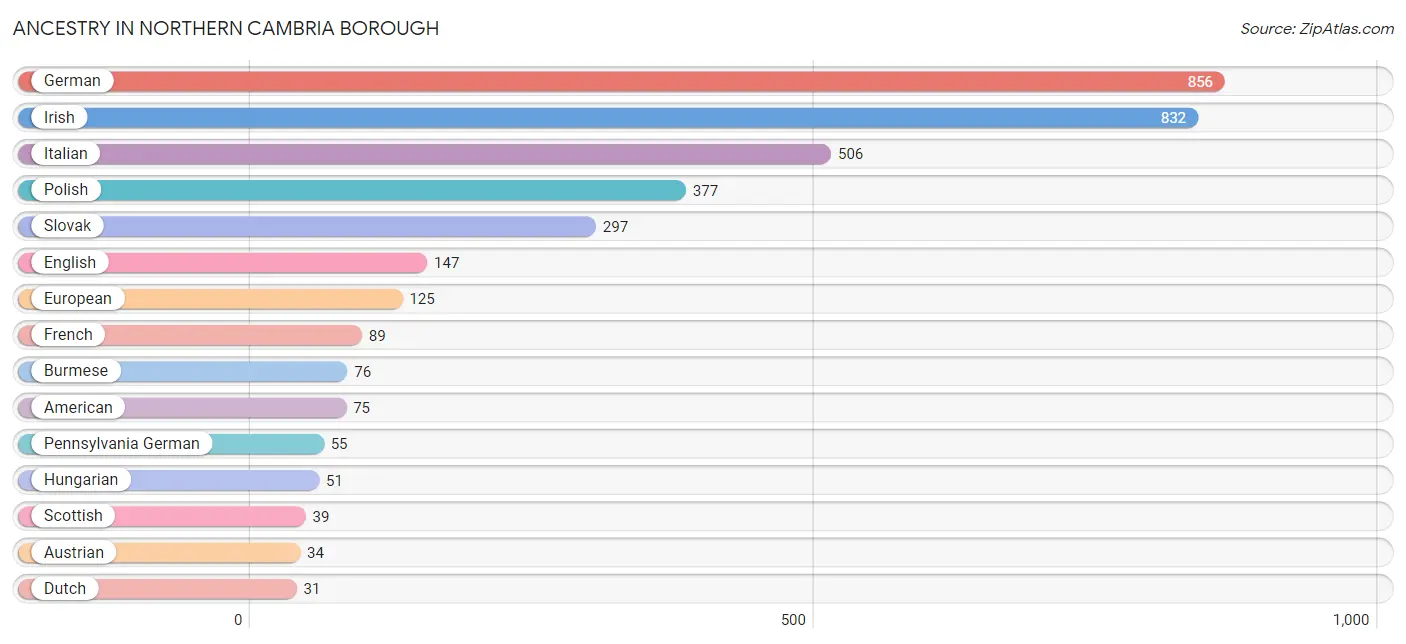
| Ancestry | # Population | % Population |
| American | 75 | 2.1% |
| Arab | 8 | 0.2% |
| Austrian | 34 | 1.0% |
| Burmese | 76 | 2.1% |
| Czech | 12 | 0.3% |
| Czechoslovakian | 26 | 0.7% |
| Dutch | 31 | 0.9% |
| English | 147 | 4.1% |
| European | 125 | 3.5% |
| French | 89 | 2.5% |
| German | 856 | 24.1% |
| Hungarian | 51 | 1.4% |
| Irish | 832 | 23.4% |
| Italian | 506 | 14.3% |
| Lebanese | 8 | 0.2% |
| Pennsylvania German | 55 | 1.5% |
| Polish | 377 | 10.6% |
| Scotch-Irish | 8 | 0.2% |
| Scottish | 39 | 1.1% |
| Slovak | 297 | 8.4% |
| Swedish | 8 | 0.2% |
| Ukrainian | 8 | 0.2% |
| Welsh | 21 | 0.6% | View All 23 Rows |
Immigrants in Northern Cambria borough

| Immigration Origin | # Population | % Population | View All 0 Rows |
Sex and Age in Northern Cambria borough
Sex and Age in Northern Cambria borough
The most populous age groups in Northern Cambria borough are 20 to 24 Years (223 | 11.9%) for men and Under 5 Years (237 | 14.2%) for women.
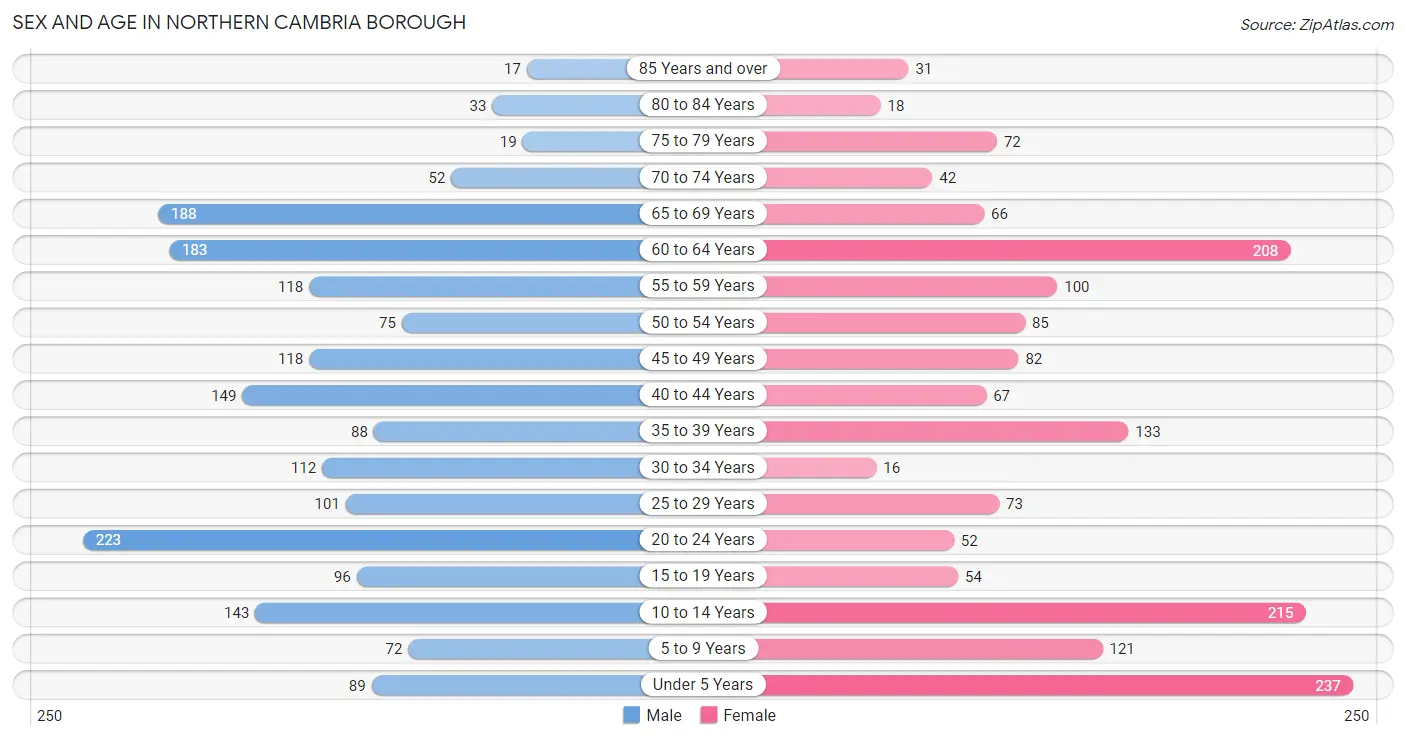
| Age Bracket | Male | Female |
| Under 5 Years | 89 (4.7%) | 237 (14.2%) |
| 5 to 9 Years | 72 (3.8%) | 121 (7.2%) |
| 10 to 14 Years | 143 (7.6%) | 215 (12.9%) |
| 15 to 19 Years | 96 (5.1%) | 54 (3.2%) |
| 20 to 24 Years | 223 (11.9%) | 52 (3.1%) |
| 25 to 29 Years | 101 (5.4%) | 73 (4.4%) |
| 30 to 34 Years | 112 (6.0%) | 16 (1.0%) |
| 35 to 39 Years | 88 (4.7%) | 133 (8.0%) |
| 40 to 44 Years | 149 (7.9%) | 67 (4.0%) |
| 45 to 49 Years | 118 (6.3%) | 82 (4.9%) |
| 50 to 54 Years | 75 (4.0%) | 85 (5.1%) |
| 55 to 59 Years | 118 (6.3%) | 100 (6.0%) |
| 60 to 64 Years | 183 (9.8%) | 208 (12.4%) |
| 65 to 69 Years | 188 (10.0%) | 66 (4.0%) |
| 70 to 74 Years | 52 (2.8%) | 42 (2.5%) |
| 75 to 79 Years | 19 (1.0%) | 72 (4.3%) |
| 80 to 84 Years | 33 (1.8%) | 18 (1.1%) |
| 85 Years and over | 17 (0.9%) | 31 (1.8%) |
| Total | 1,876 (100.0%) | 1,672 (100.0%) |
Families and Households in Northern Cambria borough
Median Family Size in Northern Cambria borough
The median family size in Northern Cambria borough is 3.17 persons per family, with single male/father families (116 | 12.7%) accounting for the largest median family size of 4.34 persons per family. On the other hand, married-couple families (559 | 61.3%) represent the smallest median family size with 2.68 persons per family.
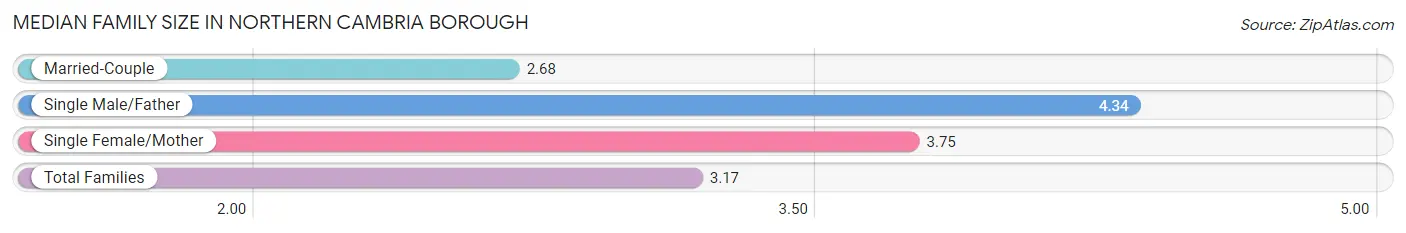
| Family Type | # Families | Family Size |
| Married-Couple | 559 (61.3%) | 2.68 |
| Single Male/Father | 116 (12.7%) | 4.34 |
| Single Female/Mother | 237 (26.0%) | 3.75 |
| Total Families | 912 (100.0%) | 3.17 |
Median Household Size in Northern Cambria borough
The median household size in Northern Cambria borough is 2.54 persons per household, with single male/father households (116 | 8.4%) accounting for the largest median household size of 4.41 persons per household. non-family households (476 | 34.3%) represent the smallest median household size with 1.12 persons per household.
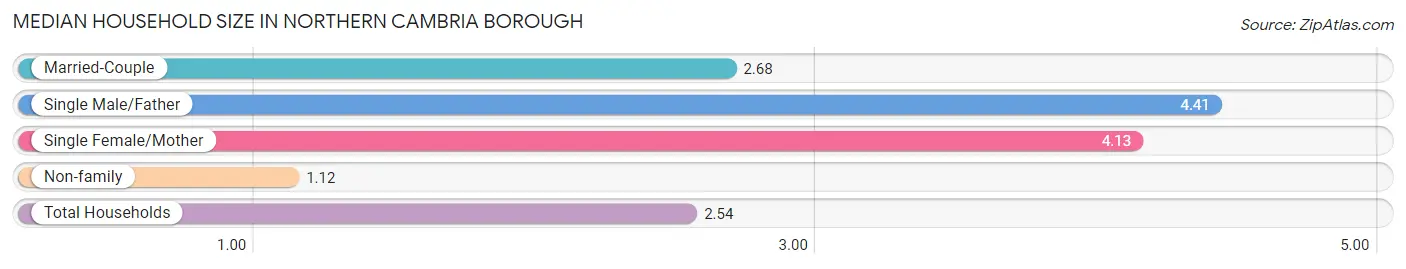
| Household Type | # Households | Household Size |
| Married-Couple | 559 (40.3%) | 2.68 |
| Single Male/Father | 116 (8.4%) | 4.41 |
| Single Female/Mother | 237 (17.1%) | 4.13 |
| Non-family | 476 (34.3%) | 1.12 |
| Total Households | 1,388 (100.0%) | 2.54 |
Household Size by Marriage Status in Northern Cambria borough
Out of a total of 1,388 households in Northern Cambria borough, 912 (65.7%) are family households, while 476 (34.3%) are nonfamily households. The most numerous type of family households are 2-person households, comprising 418, and the most common type of nonfamily households are 1-person households, comprising 426.
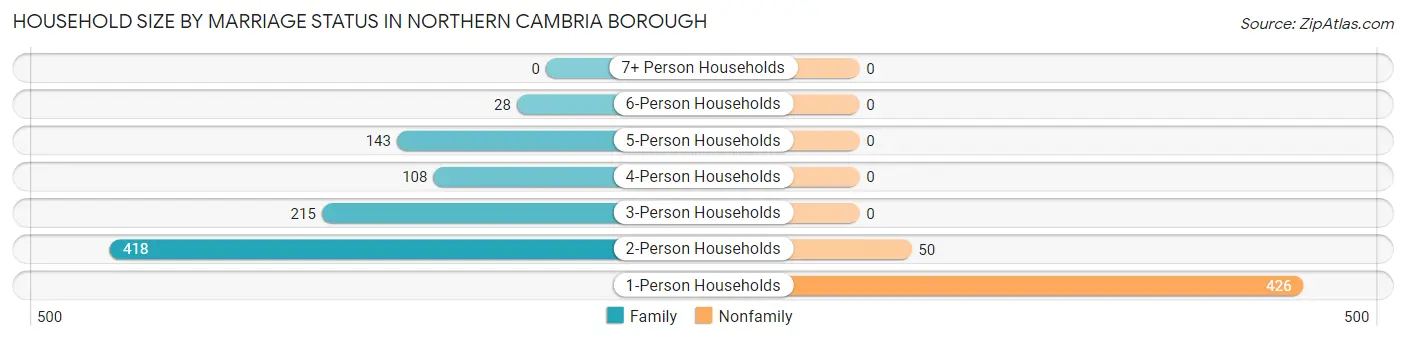
| Household Size | Family Households | Nonfamily Households |
| 1-Person Households | - | 426 (30.7%) |
| 2-Person Households | 418 (30.1%) | 50 (3.6%) |
| 3-Person Households | 215 (15.5%) | 0 (0.0%) |
| 4-Person Households | 108 (7.8%) | 0 (0.0%) |
| 5-Person Households | 143 (10.3%) | 0 (0.0%) |
| 6-Person Households | 28 (2.0%) | 0 (0.0%) |
| 7+ Person Households | 0 (0.0%) | 0 (0.0%) |
| Total | 912 (65.7%) | 476 (34.3%) |
Female Fertility in Northern Cambria borough
Fertility by Age in Northern Cambria borough
Average fertility rate in Northern Cambria borough is 90.0 births per 1,000 women. Women in the age bracket of 35 to 50 years have the highest fertility rate with 121.0 births per 1,000 women. Women in the age bracket of 35 to 50 years acount for 79.1% of all women with births.
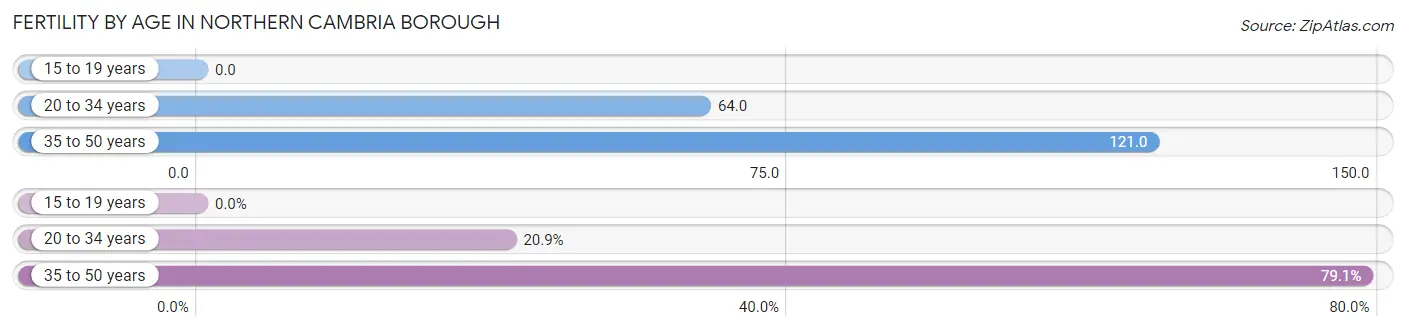
| Age Bracket | Women with Births | Births / 1,000 Women |
| 15 to 19 years | 0 (0.0%) | 0.0 |
| 20 to 34 years | 9 (20.9%) | 64.0 |
| 35 to 50 years | 34 (79.1%) | 121.0 |
| Total | 43 (100.0%) | 90.0 |
Fertility by Age by Marriage Status in Northern Cambria borough
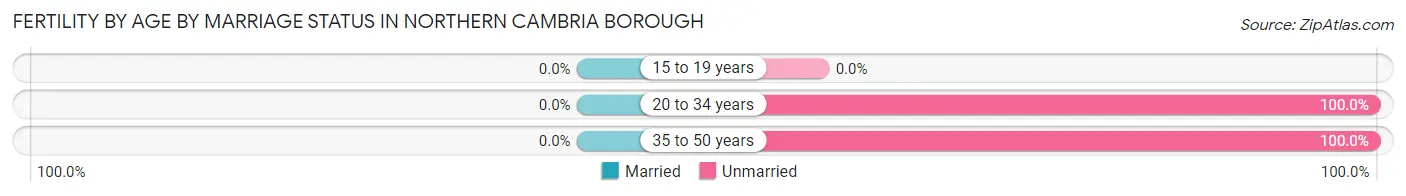
| Age Bracket | Married | Unmarried |
| 15 to 19 years | 0 (0.0%) | 0 (0.0%) |
| 20 to 34 years | 0 (0.0%) | 9 (100.0%) |
| 35 to 50 years | 0 (0.0%) | 34 (100.0%) |
| Total | 0 (0.0%) | 43 (100.0%) |
Fertility by Education in Northern Cambria borough
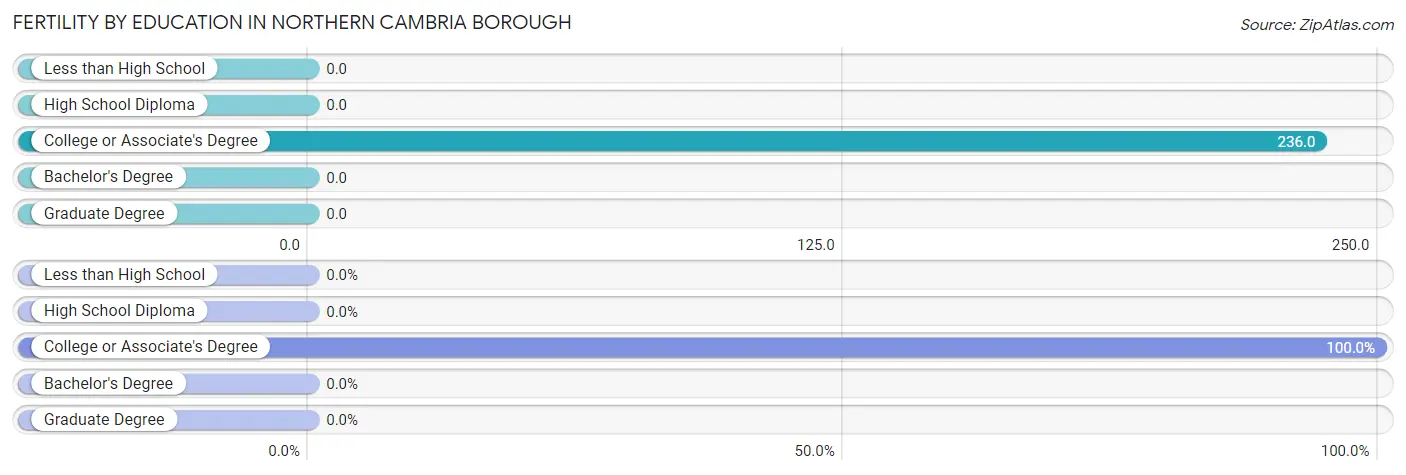
| Educational Attainment | Women with Births | Births / 1,000 Women |
| Less than High School | 0 (0.0%) | 0.0 |
| High School Diploma | 0 (0.0%) | 0.0 |
| College or Associate's Degree | 43 (100.0%) | 236.0 |
| Bachelor's Degree | 0 (0.0%) | 0.0 |
| Graduate Degree | 0 (0.0%) | 0.0 |
| Total | 43 (100.0%) | 90.0 |
Fertility by Education by Marriage Status in Northern Cambria borough
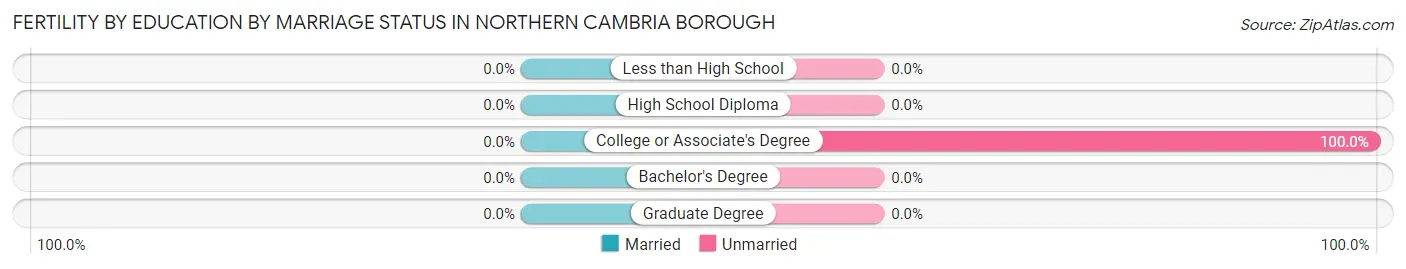
| Educational Attainment | Married | Unmarried |
| Less than High School | 0 (0.0%) | 0 (0.0%) |
| High School Diploma | 0 (0.0%) | 0 (0.0%) |
| College or Associate's Degree | 0 (0.0%) | 43 (100.0%) |
| Bachelor's Degree | 0 (0.0%) | 0 (0.0%) |
| Graduate Degree | 0 (0.0%) | 0 (0.0%) |
| Total | 0 (0.0%) | 43 (100.0%) |
Employment Characteristics in Northern Cambria borough
Employment by Class of Employer in Northern Cambria borough
Among the 1,448 employed individuals in Northern Cambria borough, private company employees (1,019 | 70.4%), local government employees (145 | 10.0%), and not-for-profit organizations (79 | 5.5%) make up the most common classes of employment.
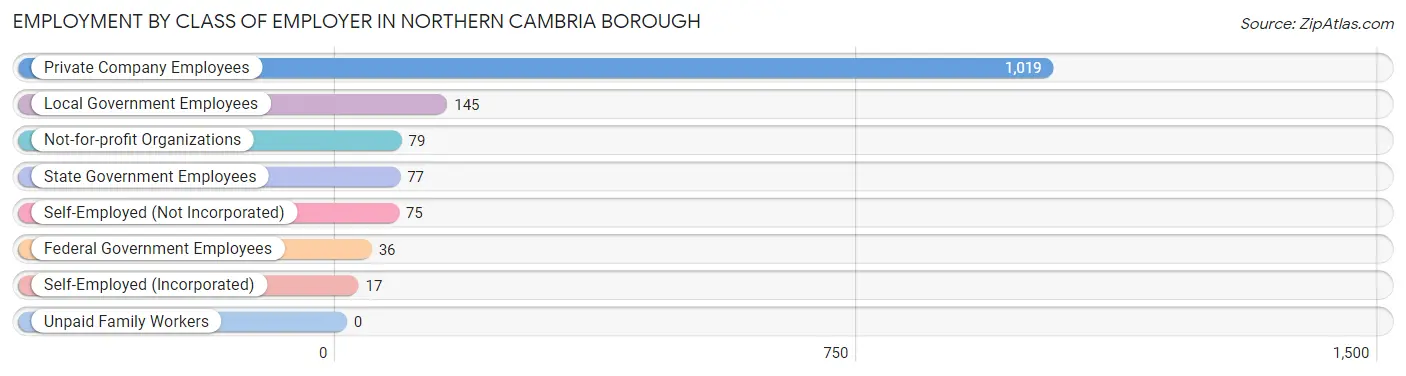
| Employer Class | # Employees | % Employees |
| Private Company Employees | 1,019 | 70.4% |
| Self-Employed (Incorporated) | 17 | 1.2% |
| Self-Employed (Not Incorporated) | 75 | 5.2% |
| Not-for-profit Organizations | 79 | 5.5% |
| Local Government Employees | 145 | 10.0% |
| State Government Employees | 77 | 5.3% |
| Federal Government Employees | 36 | 2.5% |
| Unpaid Family Workers | 0 | 0.0% |
| Total | 1,448 | 100.0% |
Employment Status by Age in Northern Cambria borough
According to the labor force statistics for Northern Cambria borough, out of the total population over 16 years of age (2,660), 59.9% or 1,593 individuals are in the labor force, with 5.3% or 84 of them unemployed. The age group with the highest labor force participation rate is 55 to 59 years, with 95.0% or 207 individuals in the labor force. Within the labor force, the 35 to 44 years age range has the highest percentage of unemployed individuals, with 17.1% or 67 of them being unemployed.
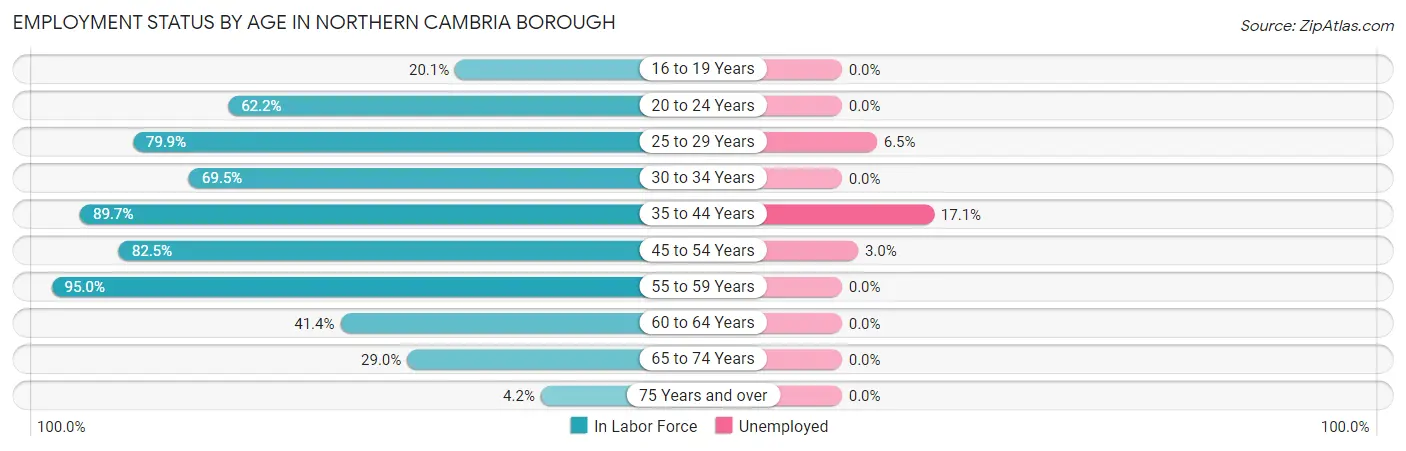
| Age Bracket | In Labor Force | Unemployed |
| 16 to 19 Years | 28 (20.1%) | 0 (0.0%) |
| 20 to 24 Years | 171 (62.2%) | 0 (0.0%) |
| 25 to 29 Years | 139 (79.9%) | 9 (6.5%) |
| 30 to 34 Years | 89 (69.5%) | 0 (0.0%) |
| 35 to 44 Years | 392 (89.7%) | 67 (17.1%) |
| 45 to 54 Years | 297 (82.5%) | 9 (3.0%) |
| 55 to 59 Years | 207 (95.0%) | 0 (0.0%) |
| 60 to 64 Years | 162 (41.4%) | 0 (0.0%) |
| 65 to 74 Years | 101 (29.0%) | 0 (0.0%) |
| 75 Years and over | 8 (4.2%) | 0 (0.0%) |
| Total | 1,593 (59.9%) | 84 (5.3%) |
Employment Status by Educational Attainment in Northern Cambria borough
According to labor force statistics for Northern Cambria borough, 75.3% of individuals (1,286) out of the total population between 25 and 64 years of age (1,708) are in the labor force, with 6.6% or 85 of them being unemployed. The group with the highest labor force participation rate are those with the educational attainment of bachelor's degree or higher, with 88.0% or 307 individuals in the labor force. Within the labor force, individuals with college / associate degree education have the highest percentage of unemployment, with 18.4% or 76 of them being unemployed.
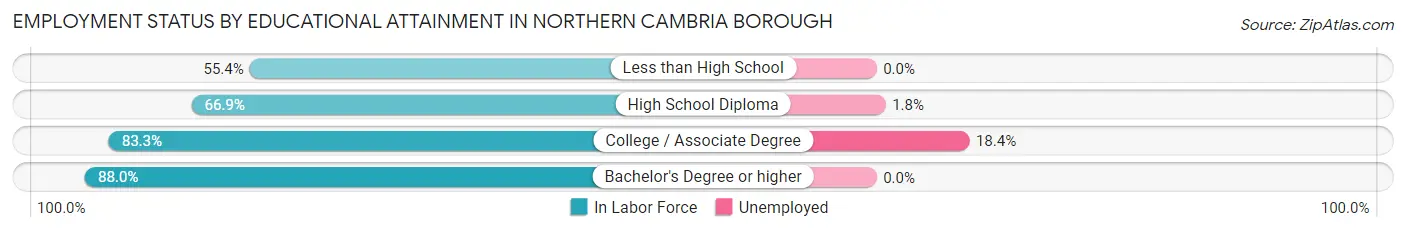
| Educational Attainment | In Labor Force | Unemployed |
| Less than High School | 56 (55.4%) | 0 (0.0%) |
| High School Diploma | 510 (66.9%) | 14 (1.8%) |
| College / Associate Degree | 413 (83.3%) | 91 (18.4%) |
| Bachelor's Degree or higher | 307 (88.0%) | 0 (0.0%) |
| Total | 1,286 (75.3%) | 113 (6.6%) |
Employment Occupations by Sex in Northern Cambria borough
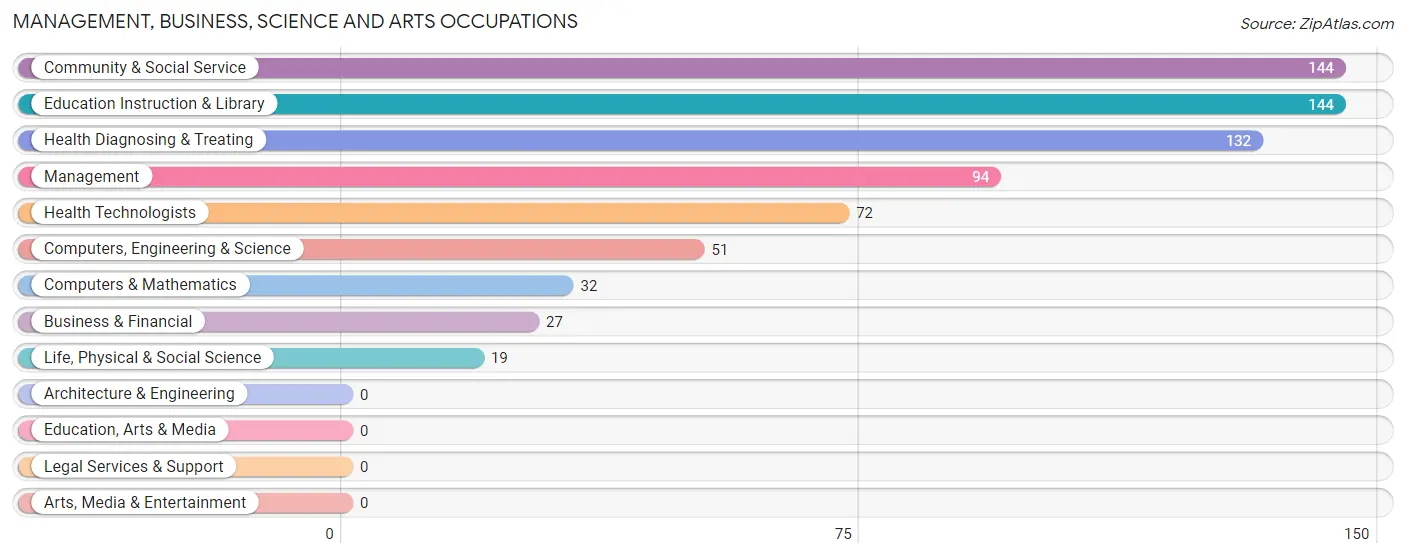
Management, Business, Science and Arts Occupations
The most common Management, Business, Science and Arts occupations in Northern Cambria borough are Community & Social Service (144 | 9.5%), Education Instruction & Library (144 | 9.5%), Health Diagnosing & Treating (132 | 8.7%), Management (94 | 6.2%), and Health Technologists (72 | 4.8%).
Management, Business, Science and Arts Occupations by Sex
Within the Management, Business, Science and Arts occupations in Northern Cambria borough, the most male-oriented occupations are Computers & Mathematics (100.0%), Management (67.0%), and Business & Financial (63.0%), while the most female-oriented occupations are Life, Physical & Social Science (100.0%), Health Diagnosing & Treating (91.7%), and Health Technologists (84.7%).
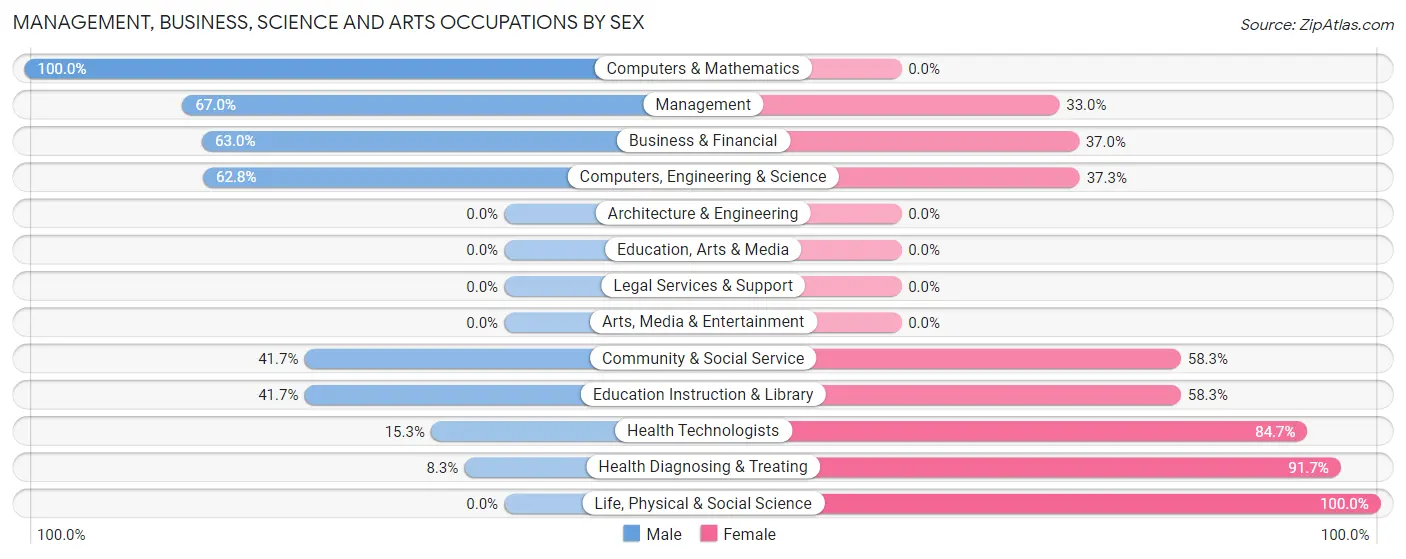
| Occupation | Male | Female |
| Management | 63 (67.0%) | 31 (33.0%) |
| Business & Financial | 17 (63.0%) | 10 (37.0%) |
| Computers, Engineering & Science | 32 (62.7%) | 19 (37.2%) |
| Computers & Mathematics | 32 (100.0%) | 0 (0.0%) |
| Architecture & Engineering | 0 (0.0%) | 0 (0.0%) |
| Life, Physical & Social Science | 0 (0.0%) | 19 (100.0%) |
| Community & Social Service | 60 (41.7%) | 84 (58.3%) |
| Education, Arts & Media | 0 (0.0%) | 0 (0.0%) |
| Legal Services & Support | 0 (0.0%) | 0 (0.0%) |
| Education Instruction & Library | 60 (41.7%) | 84 (58.3%) |
| Arts, Media & Entertainment | 0 (0.0%) | 0 (0.0%) |
| Health Diagnosing & Treating | 11 (8.3%) | 121 (91.7%) |
| Health Technologists | 11 (15.3%) | 61 (84.7%) |
| Total (Category) | 183 (40.8%) | 265 (59.2%) |
| Total (Overall) | 930 (61.6%) | 579 (38.4%) |
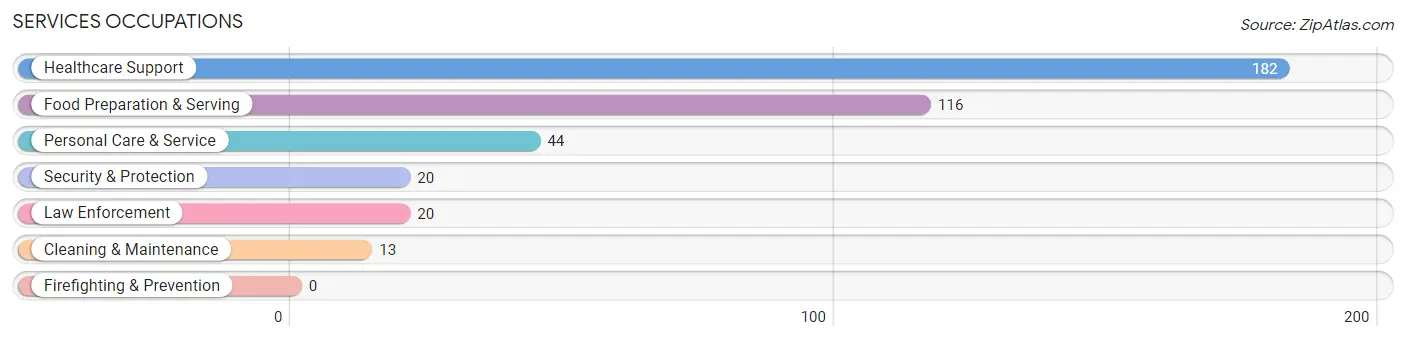
Services Occupations
The most common Services occupations in Northern Cambria borough are Healthcare Support (182 | 12.1%), Food Preparation & Serving (116 | 7.7%), Personal Care & Service (44 | 2.9%), Security & Protection (20 | 1.3%), and Law Enforcement (20 | 1.3%).
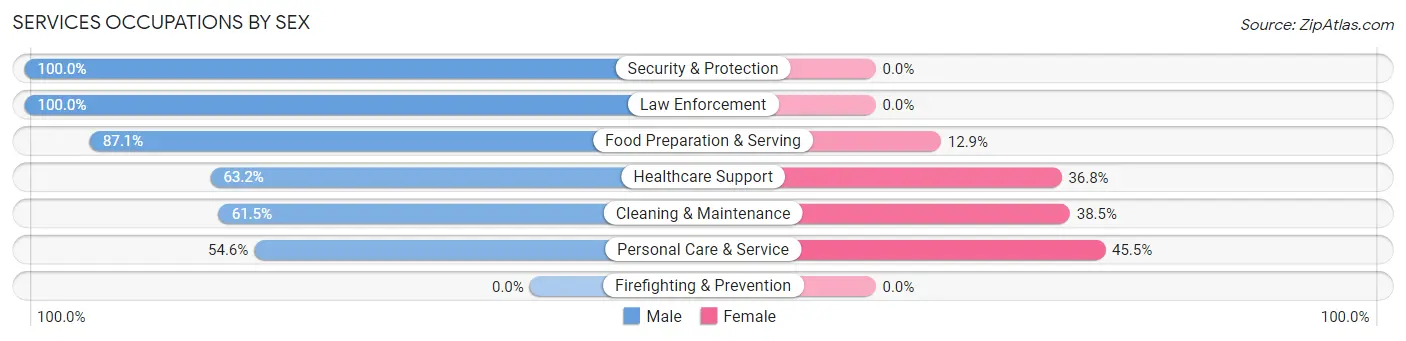
Services Occupations by Sex
Within the Services occupations in Northern Cambria borough, the most male-oriented occupations are Security & Protection (100.0%), Law Enforcement (100.0%), and Food Preparation & Serving (87.1%), while the most female-oriented occupations are Personal Care & Service (45.5%), Cleaning & Maintenance (38.5%), and Healthcare Support (36.8%).
| Occupation | Male | Female |
| Healthcare Support | 115 (63.2%) | 67 (36.8%) |
| Security & Protection | 20 (100.0%) | 0 (0.0%) |
| Firefighting & Prevention | 0 (0.0%) | 0 (0.0%) |
| Law Enforcement | 20 (100.0%) | 0 (0.0%) |
| Food Preparation & Serving | 101 (87.1%) | 15 (12.9%) |
| Cleaning & Maintenance | 8 (61.5%) | 5 (38.5%) |
| Personal Care & Service | 24 (54.5%) | 20 (45.5%) |
| Total (Category) | 268 (71.5%) | 107 (28.5%) |
| Total (Overall) | 930 (61.6%) | 579 (38.4%) |
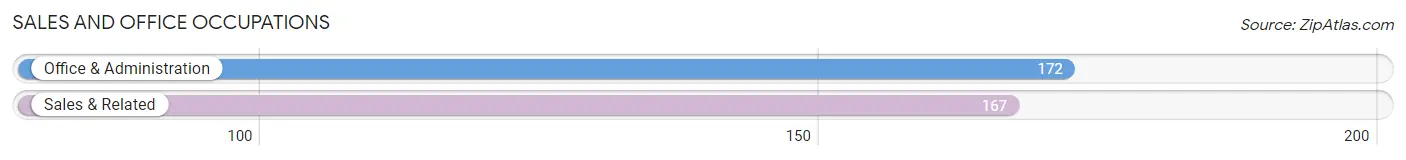
Sales and Office Occupations
The most common Sales and Office occupations in Northern Cambria borough are Office & Administration (172 | 11.4%), and Sales & Related (167 | 11.1%).
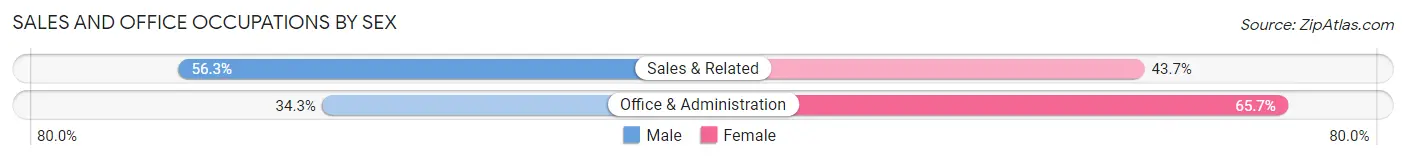
Sales and Office Occupations by Sex
| Occupation | Male | Female |
| Sales & Related | 94 (56.3%) | 73 (43.7%) |
| Office & Administration | 59 (34.3%) | 113 (65.7%) |
| Total (Category) | 153 (45.1%) | 186 (54.9%) |
| Total (Overall) | 930 (61.6%) | 579 (38.4%) |
Natural Resources, Construction and Maintenance Occupations
The most common Natural Resources, Construction and Maintenance occupations in Northern Cambria borough are Construction & Extraction (77 | 5.1%), Installation, Maintenance & Repair (52 | 3.5%), and Farming, Fishing & Forestry (6 | 0.4%).
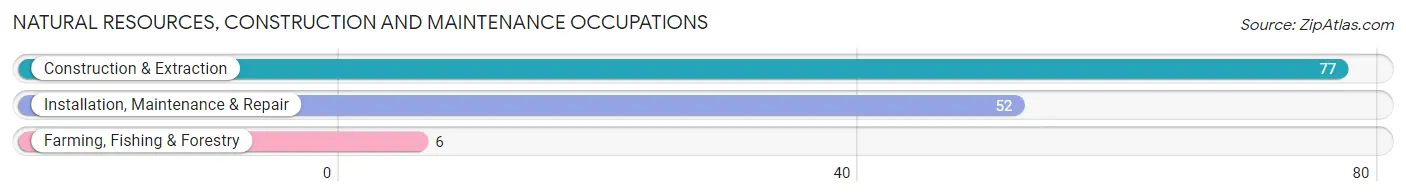
Natural Resources, Construction and Maintenance Occupations by Sex
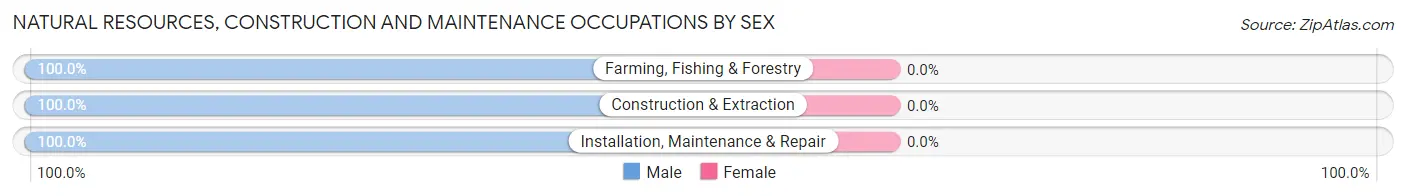
| Occupation | Male | Female |
| Farming, Fishing & Forestry | 6 (100.0%) | 0 (0.0%) |
| Construction & Extraction | 77 (100.0%) | 0 (0.0%) |
| Installation, Maintenance & Repair | 52 (100.0%) | 0 (0.0%) |
| Total (Category) | 135 (100.0%) | 0 (0.0%) |
| Total (Overall) | 930 (61.6%) | 579 (38.4%) |
Production, Transportation and Moving Occupations
The most common Production, Transportation and Moving occupations in Northern Cambria borough are Material Moving (106 | 7.0%), Production (75 | 5.0%), and Transportation (31 | 2.1%).
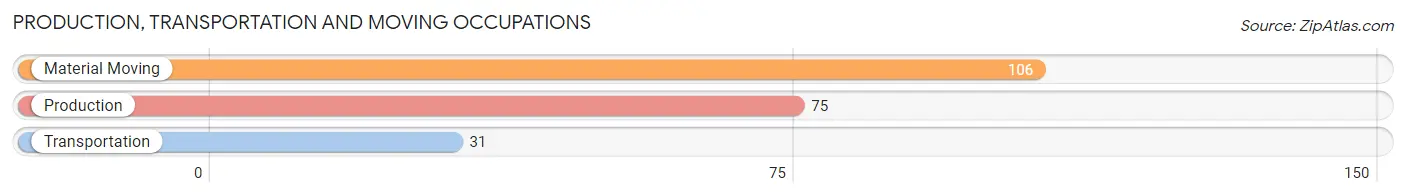
Production, Transportation and Moving Occupations by Sex
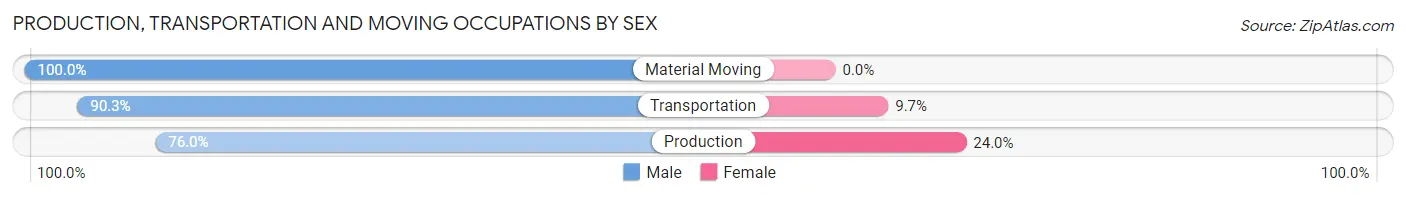
| Occupation | Male | Female |
| Production | 57 (76.0%) | 18 (24.0%) |
| Transportation | 28 (90.3%) | 3 (9.7%) |
| Material Moving | 106 (100.0%) | 0 (0.0%) |
| Total (Category) | 191 (90.1%) | 21 (9.9%) |
| Total (Overall) | 930 (61.6%) | 579 (38.4%) |
Employment Industries by Sex in Northern Cambria borough
Employment Industries in Northern Cambria borough
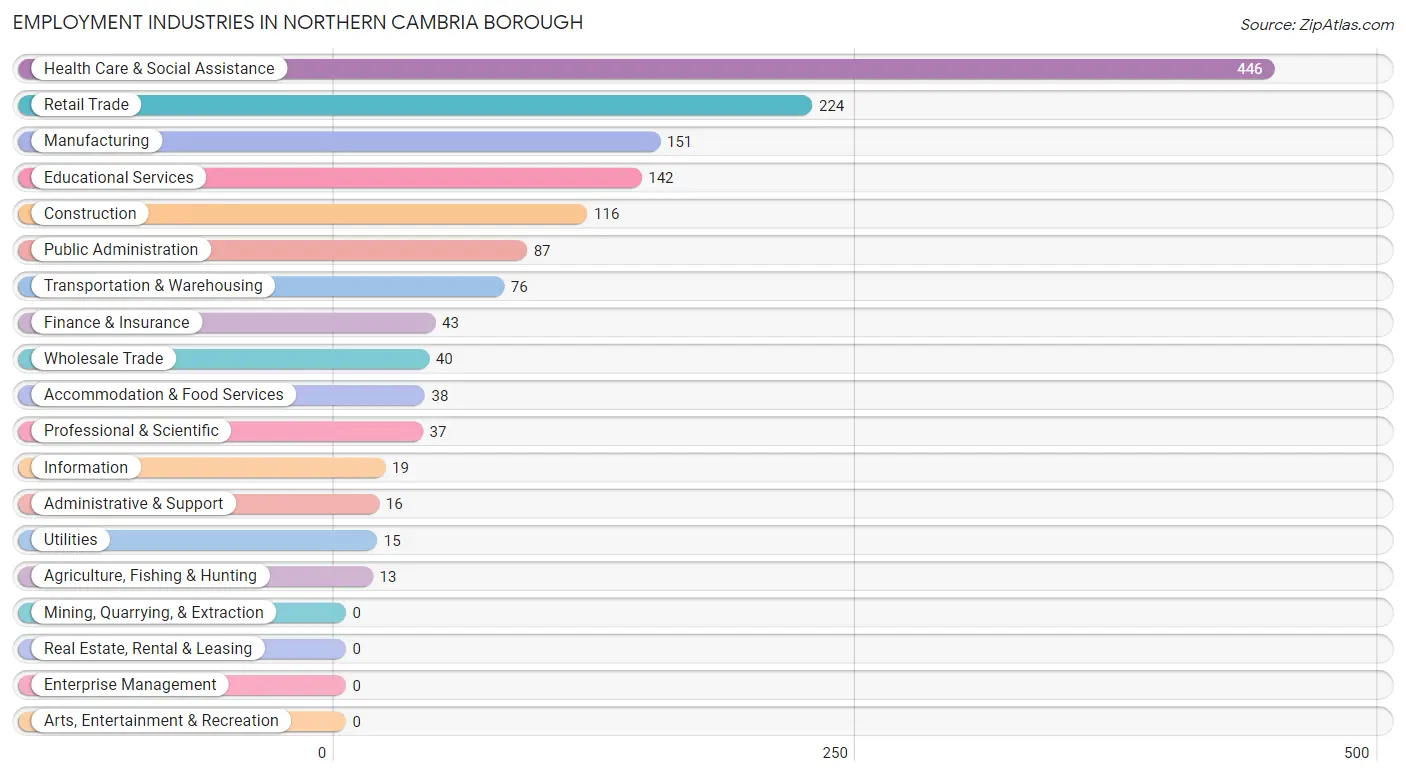
The major employment industries in Northern Cambria borough include Health Care & Social Assistance (446 | 29.6%), Retail Trade (224 | 14.8%), Manufacturing (151 | 10.0%), Educational Services (142 | 9.4%), and Construction (116 | 7.7%).
Employment Industries by Sex in Northern Cambria borough
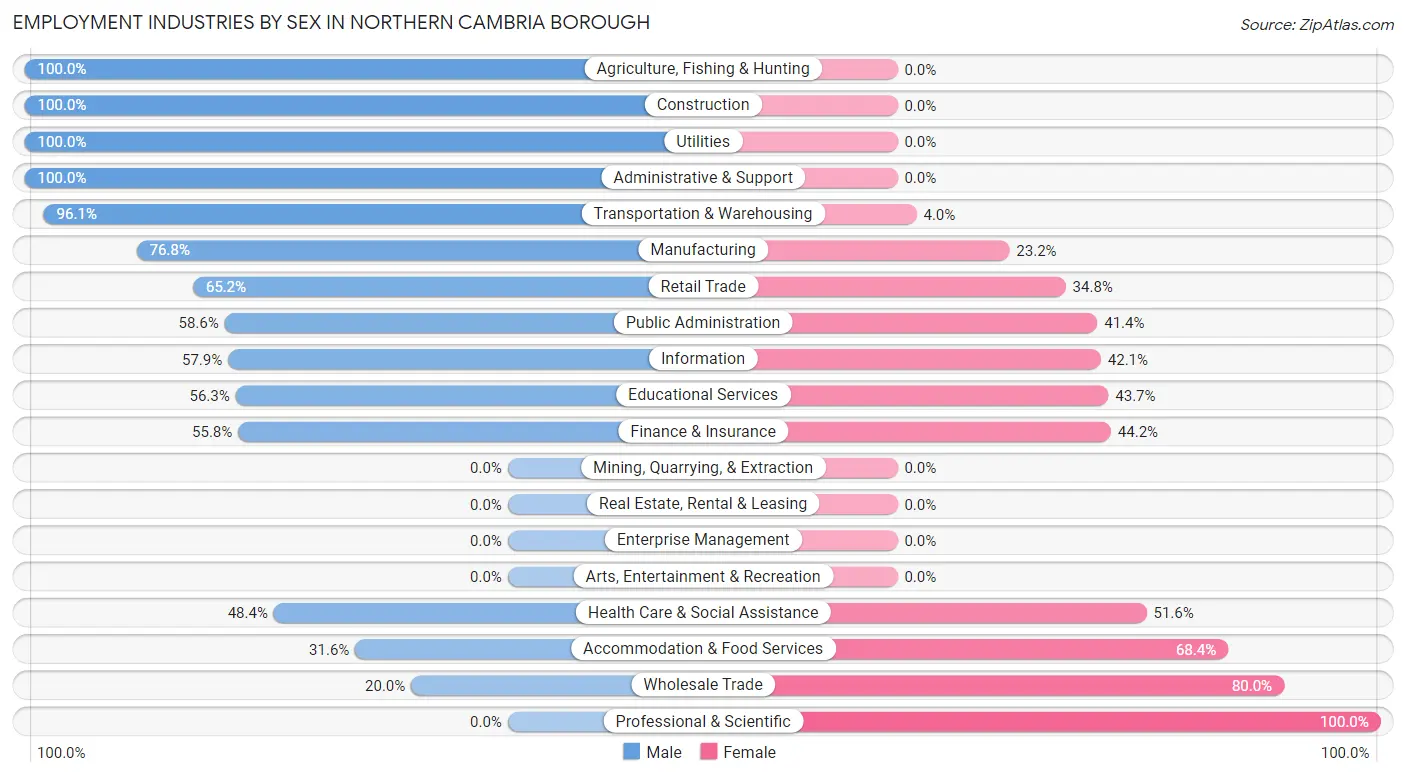
The Northern Cambria borough industries that see more men than women are Agriculture, Fishing & Hunting (100.0%), Construction (100.0%), and Utilities (100.0%), whereas the industries that tend to have a higher number of women are Professional & Scientific (100.0%), Wholesale Trade (80.0%), and Accommodation & Food Services (68.4%).
| Industry | Male | Female |
| Agriculture, Fishing & Hunting | 13 (100.0%) | 0 (0.0%) |
| Mining, Quarrying, & Extraction | 0 (0.0%) | 0 (0.0%) |
| Construction | 116 (100.0%) | 0 (0.0%) |
| Manufacturing | 116 (76.8%) | 35 (23.2%) |
| Wholesale Trade | 8 (20.0%) | 32 (80.0%) |
| Retail Trade | 146 (65.2%) | 78 (34.8%) |
| Transportation & Warehousing | 73 (96.1%) | 3 (4.0%) |
| Utilities | 15 (100.0%) | 0 (0.0%) |
| Information | 11 (57.9%) | 8 (42.1%) |
| Finance & Insurance | 24 (55.8%) | 19 (44.2%) |
| Real Estate, Rental & Leasing | 0 (0.0%) | 0 (0.0%) |
| Professional & Scientific | 0 (0.0%) | 37 (100.0%) |
| Enterprise Management | 0 (0.0%) | 0 (0.0%) |
| Administrative & Support | 16 (100.0%) | 0 (0.0%) |
| Educational Services | 80 (56.3%) | 62 (43.7%) |
| Health Care & Social Assistance | 216 (48.4%) | 230 (51.6%) |
| Arts, Entertainment & Recreation | 0 (0.0%) | 0 (0.0%) |
| Accommodation & Food Services | 12 (31.6%) | 26 (68.4%) |
| Public Administration | 51 (58.6%) | 36 (41.4%) |
| Total | 930 (61.6%) | 579 (38.4%) |
Education in Northern Cambria borough
School Enrollment in Northern Cambria borough
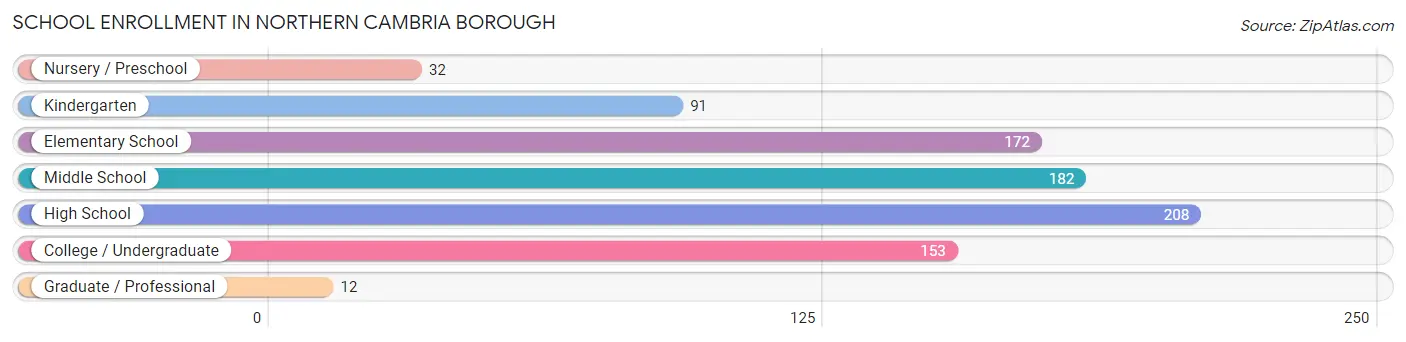
The most common levels of schooling among the 850 students in Northern Cambria borough are high school (208 | 24.5%), middle school (182 | 21.4%), and elementary school (172 | 20.2%).
| School Level | # Students | % Students |
| Nursery / Preschool | 32 | 3.8% |
| Kindergarten | 91 | 10.7% |
| Elementary School | 172 | 20.2% |
| Middle School | 182 | 21.4% |
| High School | 208 | 24.5% |
| College / Undergraduate | 153 | 18.0% |
| Graduate / Professional | 12 | 1.4% |
| Total | 850 | 100.0% |
School Enrollment by Age by Funding Source in Northern Cambria borough
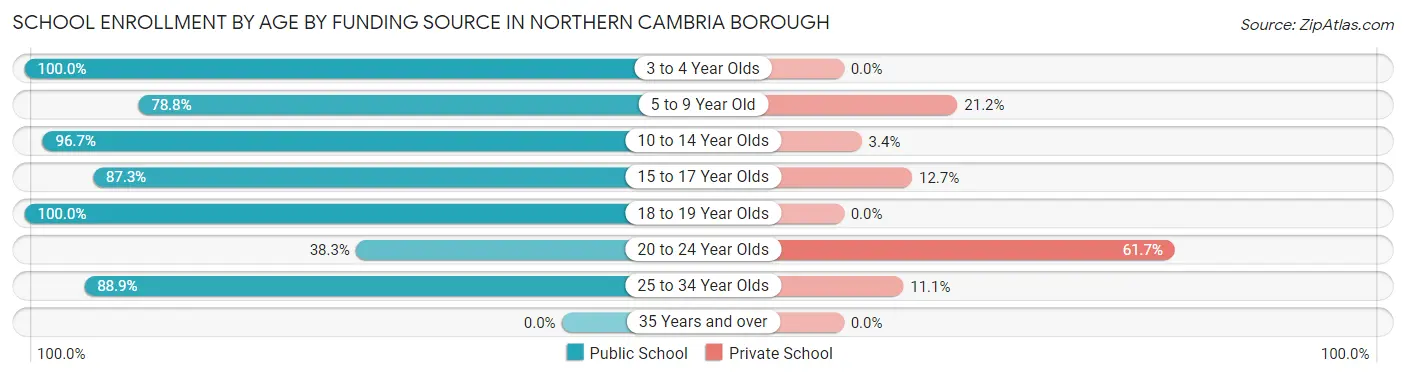
Out of a total of 850 students who are enrolled in schools in Northern Cambria borough, 139 (16.4%) attend a private institution, while the remaining 711 (83.6%) are enrolled in public schools. The age group of 20 to 24 year olds has the highest likelihood of being enrolled in private schools, with 74 (61.7% in the age bracket) enrolled. Conversely, the age group of 3 to 4 year olds has the lowest likelihood of being enrolled in a private school, with 32 (100.0% in the age bracket) attending a public institution.
| Age Bracket | Public School | Private School |
| 3 to 4 Year Olds | 32 (100.0%) | 0 (0.0%) |
| 5 to 9 Year Old | 134 (78.8%) | 36 (21.2%) |
| 10 to 14 Year Olds | 346 (96.7%) | 12 (3.4%) |
| 15 to 17 Year Olds | 96 (87.3%) | 14 (12.7%) |
| 18 to 19 Year Olds | 33 (100.0%) | 0 (0.0%) |
| 20 to 24 Year Olds | 46 (38.3%) | 74 (61.7%) |
| 25 to 34 Year Olds | 24 (88.9%) | 3 (11.1%) |
| 35 Years and over | 0 (0.0%) | 0 (0.0%) |
| Total | 711 (83.6%) | 139 (16.4%) |
Educational Attainment by Field of Study in Northern Cambria borough
Business (132 | 31.7%), education (91 | 21.8%), psychology (75 | 18.0%), social sciences (45 | 10.8%), and arts & humanities (23 | 5.5%) are the most common fields of study among 417 individuals in Northern Cambria borough who have obtained a bachelor's degree or higher.
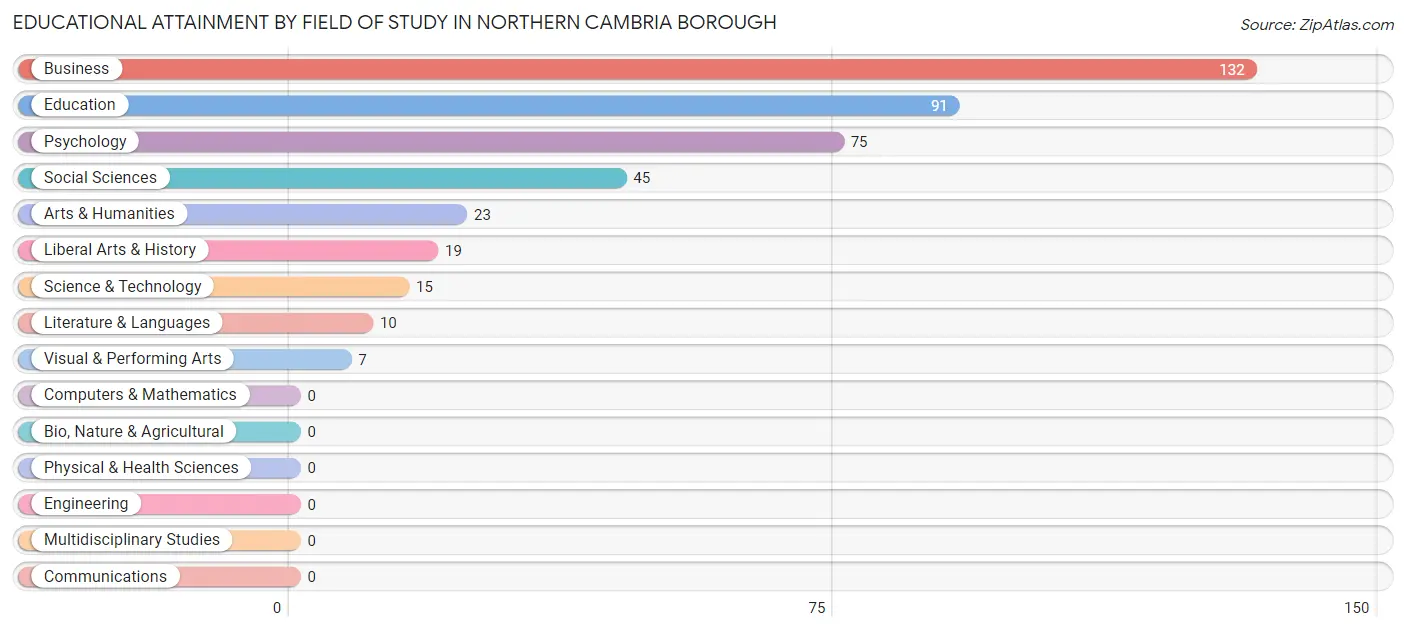
| Field of Study | # Graduates | % Graduates |
| Computers & Mathematics | 0 | 0.0% |
| Bio, Nature & Agricultural | 0 | 0.0% |
| Physical & Health Sciences | 0 | 0.0% |
| Psychology | 75 | 18.0% |
| Social Sciences | 45 | 10.8% |
| Engineering | 0 | 0.0% |
| Multidisciplinary Studies | 0 | 0.0% |
| Science & Technology | 15 | 3.6% |
| Business | 132 | 31.7% |
| Education | 91 | 21.8% |
| Literature & Languages | 10 | 2.4% |
| Liberal Arts & History | 19 | 4.6% |
| Visual & Performing Arts | 7 | 1.7% |
| Communications | 0 | 0.0% |
| Arts & Humanities | 23 | 5.5% |
| Total | 417 | 100.0% |
Transportation & Commute in Northern Cambria borough
Vehicle Availability by Sex in Northern Cambria borough
The most prevalent vehicle ownership categories in Northern Cambria borough are males with 2 vehicles (267, accounting for 30.7%) and females with 2 vehicles (175, making up 46.1%).
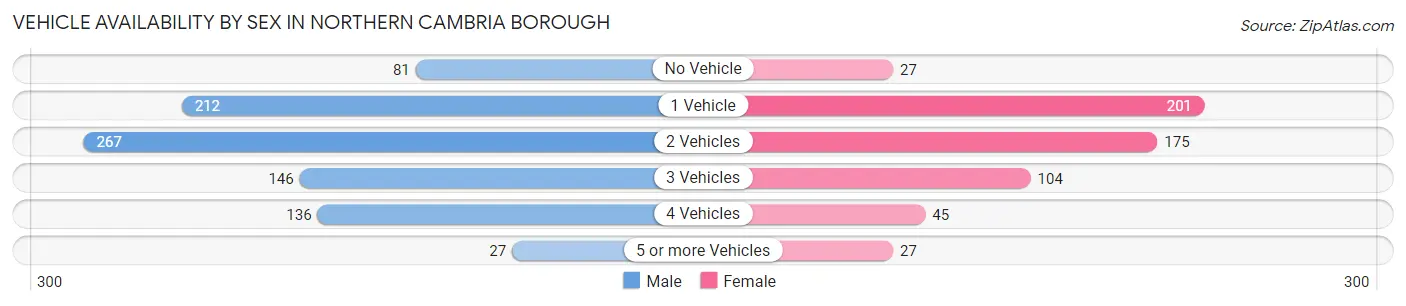
| Vehicles Available | Male | Female |
| No Vehicle | 81 (9.3%) | 27 (4.7%) |
| 1 Vehicle | 212 (24.4%) | 201 (34.7%) |
| 2 Vehicles | 267 (30.7%) | 175 (30.2%) |
| 3 Vehicles | 146 (16.8%) | 104 (18.0%) |
| 4 Vehicles | 136 (15.7%) | 45 (7.8%) |
| 5 or more Vehicles | 27 (3.1%) | 27 (4.7%) |
| Total | 869 (100.0%) | 579 (100.0%) |
Commute Time in Northern Cambria borough
The most frequently occuring commute durations in Northern Cambria borough are 5 to 9 minutes (260 commuters, 18.4%), 40 to 44 minutes (227 commuters, 16.0%), and 10 to 14 minutes (190 commuters, 13.4%).
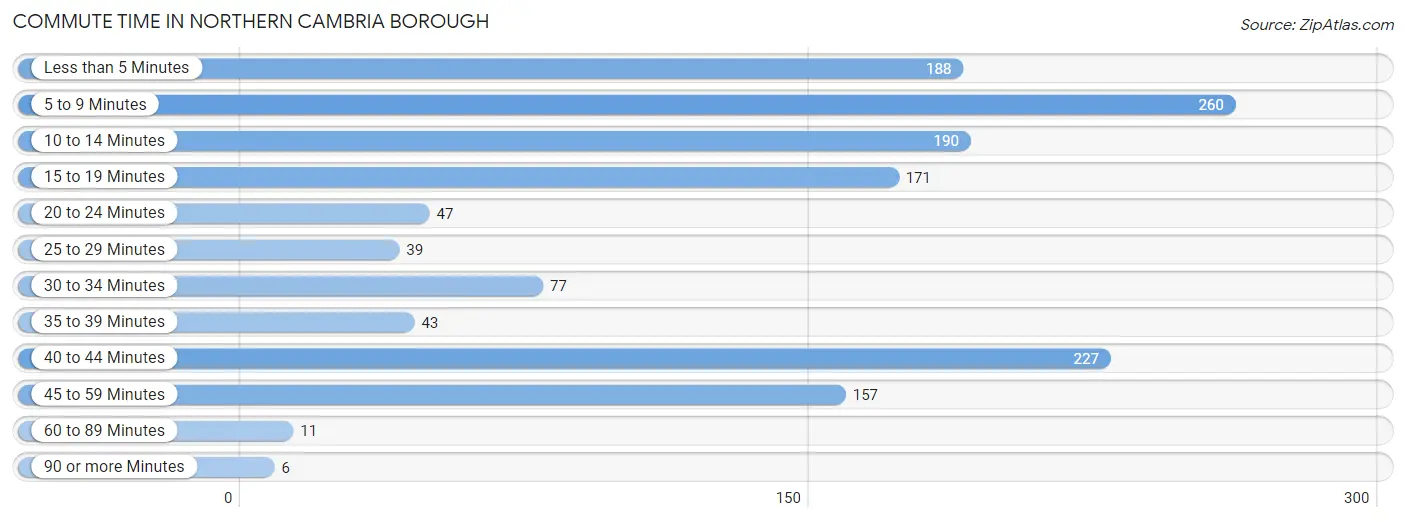
| Commute Time | # Commuters | % Commuters |
| Less than 5 Minutes | 188 | 13.3% |
| 5 to 9 Minutes | 260 | 18.4% |
| 10 to 14 Minutes | 190 | 13.4% |
| 15 to 19 Minutes | 171 | 12.1% |
| 20 to 24 Minutes | 47 | 3.3% |
| 25 to 29 Minutes | 39 | 2.8% |
| 30 to 34 Minutes | 77 | 5.4% |
| 35 to 39 Minutes | 43 | 3.0% |
| 40 to 44 Minutes | 227 | 16.0% |
| 45 to 59 Minutes | 157 | 11.1% |
| 60 to 89 Minutes | 11 | 0.8% |
| 90 or more Minutes | 6 | 0.4% |
Commute Time by Sex in Northern Cambria borough
The most common commute times in Northern Cambria borough are 5 to 9 minutes (163 commuters, 19.1%) for males and less than 5 minutes (108 commuters, 19.2%) for females.
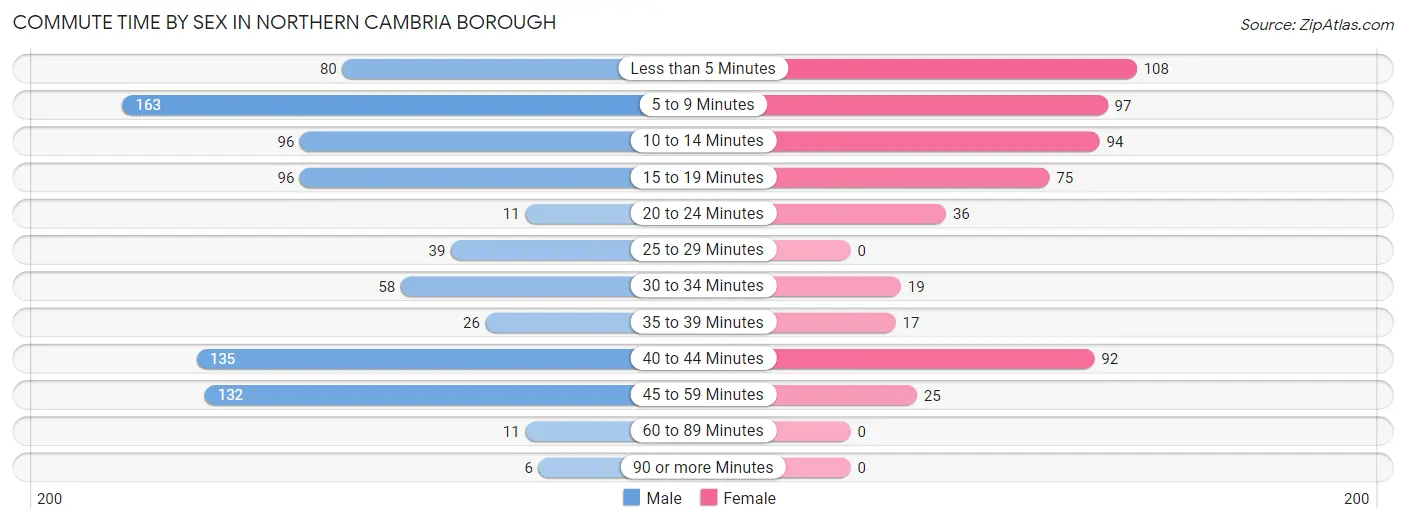
| Commute Time | Male | Female |
| Less than 5 Minutes | 80 (9.4%) | 108 (19.2%) |
| 5 to 9 Minutes | 163 (19.1%) | 97 (17.2%) |
| 10 to 14 Minutes | 96 (11.3%) | 94 (16.7%) |
| 15 to 19 Minutes | 96 (11.3%) | 75 (13.3%) |
| 20 to 24 Minutes | 11 (1.3%) | 36 (6.4%) |
| 25 to 29 Minutes | 39 (4.6%) | 0 (0.0%) |
| 30 to 34 Minutes | 58 (6.8%) | 19 (3.4%) |
| 35 to 39 Minutes | 26 (3.0%) | 17 (3.0%) |
| 40 to 44 Minutes | 135 (15.8%) | 92 (16.3%) |
| 45 to 59 Minutes | 132 (15.5%) | 25 (4.4%) |
| 60 to 89 Minutes | 11 (1.3%) | 0 (0.0%) |
| 90 or more Minutes | 6 (0.7%) | 0 (0.0%) |
Time of Departure to Work by Sex in Northern Cambria borough
The most frequent times of departure to work in Northern Cambria borough are 7:30 AM to 7:59 AM (142, 16.7%) for males and 6:30 AM to 6:59 AM (169, 30.0%) for females.
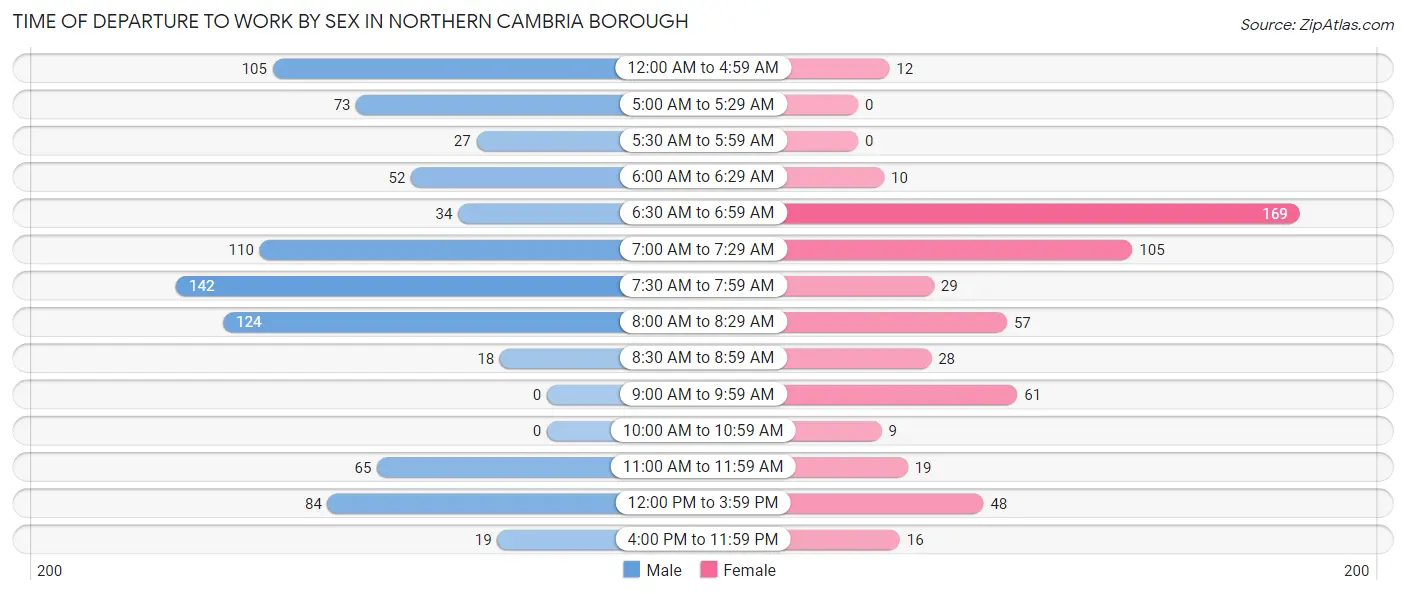
| Time of Departure | Male | Female |
| 12:00 AM to 4:59 AM | 105 (12.3%) | 12 (2.1%) |
| 5:00 AM to 5:29 AM | 73 (8.6%) | 0 (0.0%) |
| 5:30 AM to 5:59 AM | 27 (3.2%) | 0 (0.0%) |
| 6:00 AM to 6:29 AM | 52 (6.1%) | 10 (1.8%) |
| 6:30 AM to 6:59 AM | 34 (4.0%) | 169 (30.0%) |
| 7:00 AM to 7:29 AM | 110 (12.9%) | 105 (18.6%) |
| 7:30 AM to 7:59 AM | 142 (16.7%) | 29 (5.1%) |
| 8:00 AM to 8:29 AM | 124 (14.5%) | 57 (10.1%) |
| 8:30 AM to 8:59 AM | 18 (2.1%) | 28 (5.0%) |
| 9:00 AM to 9:59 AM | 0 (0.0%) | 61 (10.8%) |
| 10:00 AM to 10:59 AM | 0 (0.0%) | 9 (1.6%) |
| 11:00 AM to 11:59 AM | 65 (7.6%) | 19 (3.4%) |
| 12:00 PM to 3:59 PM | 84 (9.9%) | 48 (8.5%) |
| 4:00 PM to 11:59 PM | 19 (2.2%) | 16 (2.8%) |
| Total | 853 (100.0%) | 563 (100.0%) |
Housing Occupancy in Northern Cambria borough
Occupancy by Ownership in Northern Cambria borough
Of the total 1,388 dwellings in Northern Cambria borough, owner-occupied units account for 969 (69.8%), while renter-occupied units make up 419 (30.2%).
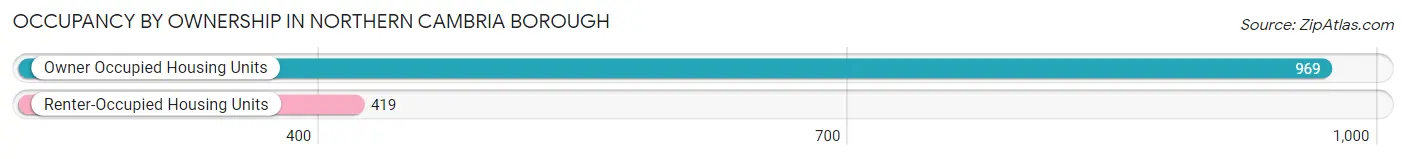
| Occupancy | # Housing Units | % Housing Units |
| Owner Occupied Housing Units | 969 | 69.8% |
| Renter-Occupied Housing Units | 419 | 30.2% |
| Total Occupied Housing Units | 1,388 | 100.0% |
Occupancy by Household Size in Northern Cambria borough
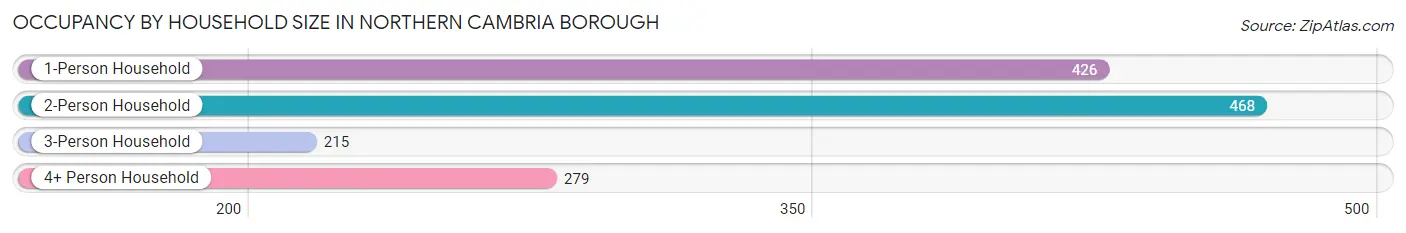
| Household Size | # Housing Units | % Housing Units |
| 1-Person Household | 426 | 30.7% |
| 2-Person Household | 468 | 33.7% |
| 3-Person Household | 215 | 15.5% |
| 4+ Person Household | 279 | 20.1% |
| Total Housing Units | 1,388 | 100.0% |
Occupancy by Ownership by Household Size in Northern Cambria borough
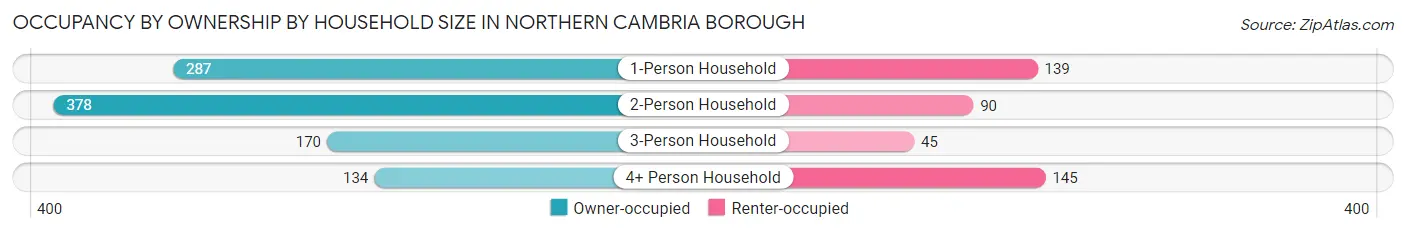
| Household Size | Owner-occupied | Renter-occupied |
| 1-Person Household | 287 (67.4%) | 139 (32.6%) |
| 2-Person Household | 378 (80.8%) | 90 (19.2%) |
| 3-Person Household | 170 (79.1%) | 45 (20.9%) |
| 4+ Person Household | 134 (48.0%) | 145 (52.0%) |
| Total Housing Units | 969 (69.8%) | 419 (30.2%) |
Occupancy by Educational Attainment in Northern Cambria borough
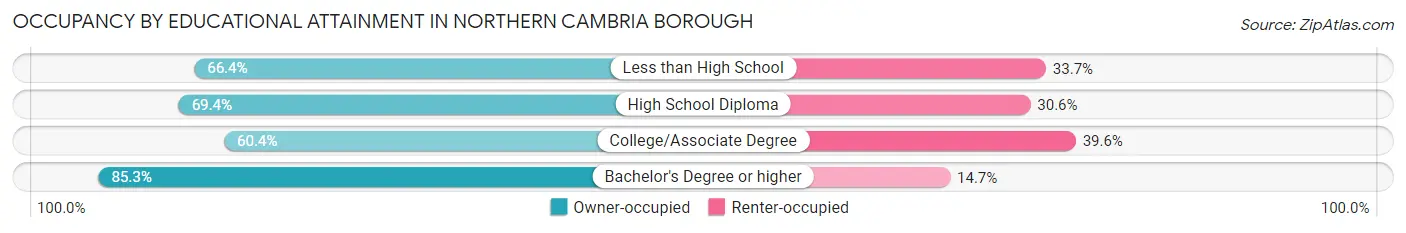
| Household Size | Owner-occupied | Renter-occupied |
| Less than High School | 69 (66.3%) | 35 (33.7%) |
| High School Diploma | 511 (69.4%) | 225 (30.6%) |
| College/Associate Degree | 191 (60.4%) | 125 (39.6%) |
| Bachelor's Degree or higher | 198 (85.3%) | 34 (14.7%) |
Occupancy by Age of Householder in Northern Cambria borough
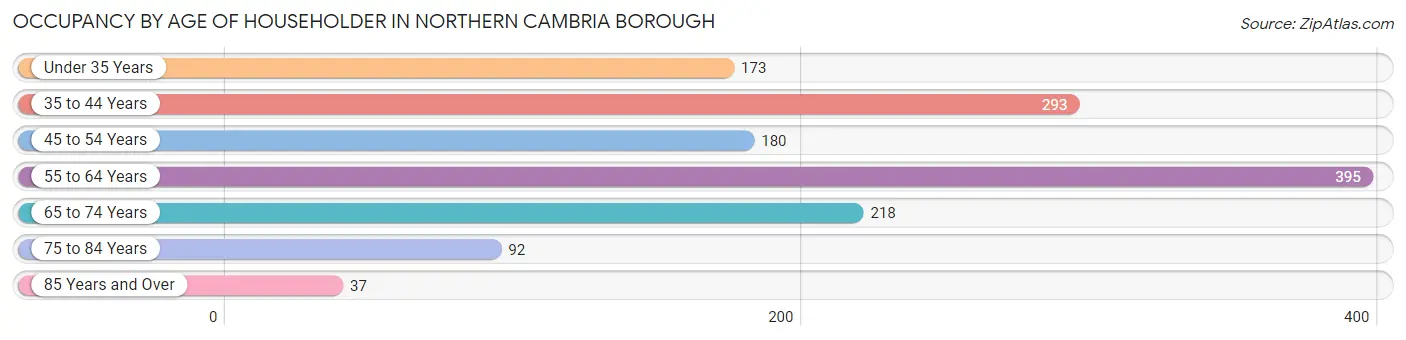
| Age Bracket | # Households | % Households |
| Under 35 Years | 173 | 12.5% |
| 35 to 44 Years | 293 | 21.1% |
| 45 to 54 Years | 180 | 13.0% |
| 55 to 64 Years | 395 | 28.5% |
| 65 to 74 Years | 218 | 15.7% |
| 75 to 84 Years | 92 | 6.6% |
| 85 Years and Over | 37 | 2.7% |
| Total | 1,388 | 100.0% |
Housing Finances in Northern Cambria borough
Median Income by Occupancy in Northern Cambria borough
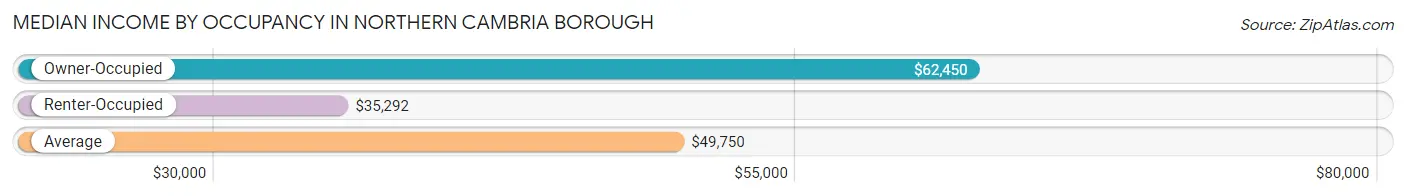
| Occupancy Type | # Households | Median Income |
| Owner-Occupied | 969 (69.8%) | $62,450 |
| Renter-Occupied | 419 (30.2%) | $35,292 |
| Average | 1,388 (100.0%) | $49,750 |
Occupancy by Householder Income Bracket in Northern Cambria borough
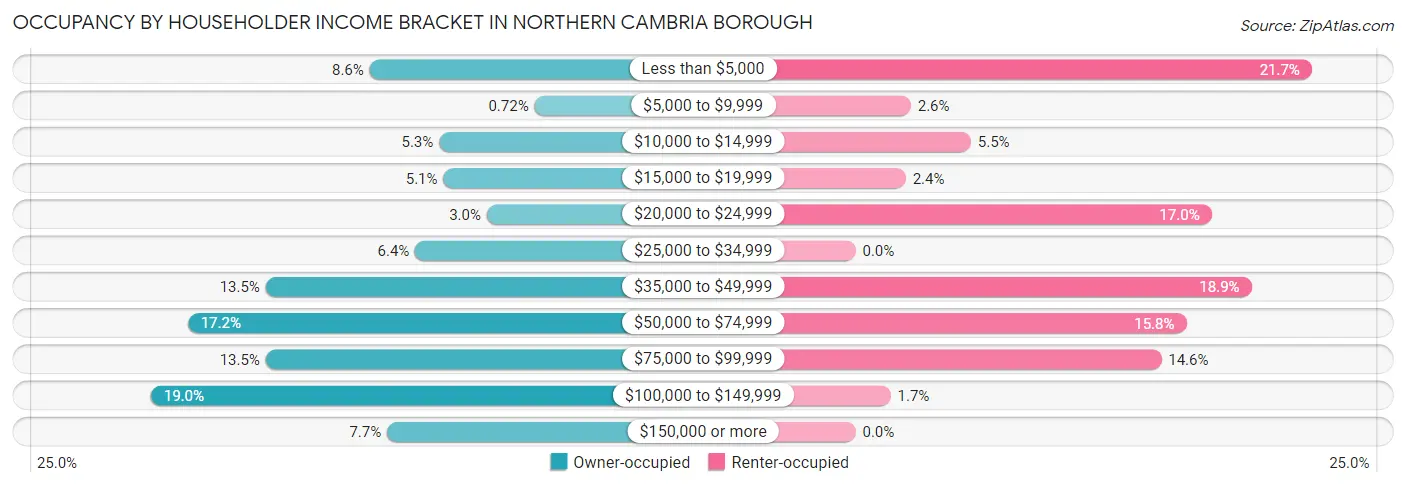
| Income Bracket | Owner-occupied | Renter-occupied |
| Less than $5,000 | 83 (8.6%) | 91 (21.7%) |
| $5,000 to $9,999 | 7 (0.7%) | 11 (2.6%) |
| $10,000 to $14,999 | 51 (5.3%) | 23 (5.5%) |
| $15,000 to $19,999 | 49 (5.1%) | 10 (2.4%) |
| $20,000 to $24,999 | 29 (3.0%) | 71 (17.0%) |
| $25,000 to $34,999 | 62 (6.4%) | 0 (0.0%) |
| $35,000 to $49,999 | 131 (13.5%) | 79 (18.9%) |
| $50,000 to $74,999 | 167 (17.2%) | 66 (15.8%) |
| $75,000 to $99,999 | 131 (13.5%) | 61 (14.6%) |
| $100,000 to $149,999 | 184 (19.0%) | 7 (1.7%) |
| $150,000 or more | 75 (7.7%) | 0 (0.0%) |
| Total | 969 (100.0%) | 419 (100.0%) |
Monthly Housing Cost Tiers in Northern Cambria borough
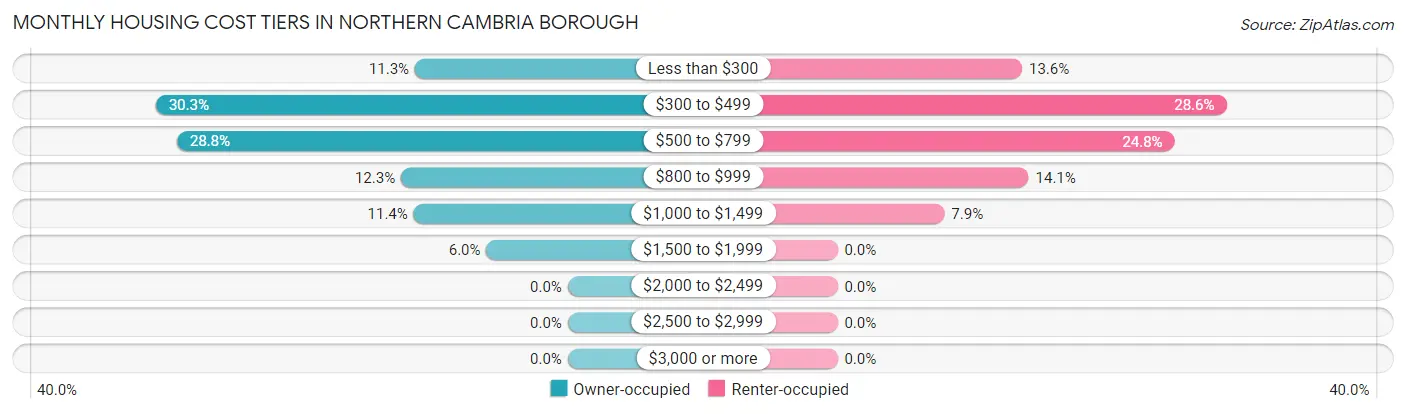
| Monthly Cost | Owner-occupied | Renter-occupied |
| Less than $300 | 109 (11.3%) | 57 (13.6%) |
| $300 to $499 | 294 (30.3%) | 120 (28.6%) |
| $500 to $799 | 279 (28.8%) | 104 (24.8%) |
| $800 to $999 | 119 (12.3%) | 59 (14.1%) |
| $1,000 to $1,499 | 110 (11.4%) | 33 (7.9%) |
| $1,500 to $1,999 | 58 (6.0%) | 0 (0.0%) |
| $2,000 to $2,499 | 0 (0.0%) | 0 (0.0%) |
| $2,500 to $2,999 | 0 (0.0%) | 0 (0.0%) |
| $3,000 or more | 0 (0.0%) | 0 (0.0%) |
| Total | 969 (100.0%) | 419 (100.0%) |
Physical Housing Characteristics in Northern Cambria borough
Housing Structures in Northern Cambria borough
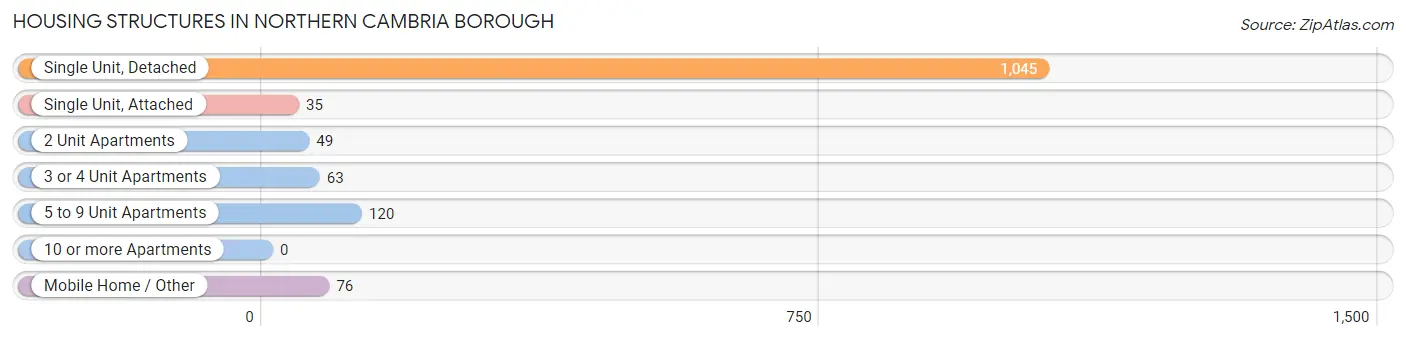
| Structure Type | # Housing Units | % Housing Units |
| Single Unit, Detached | 1,045 | 75.3% |
| Single Unit, Attached | 35 | 2.5% |
| 2 Unit Apartments | 49 | 3.5% |
| 3 or 4 Unit Apartments | 63 | 4.5% |
| 5 to 9 Unit Apartments | 120 | 8.6% |
| 10 or more Apartments | 0 | 0.0% |
| Mobile Home / Other | 76 | 5.5% |
| Total | 1,388 | 100.0% |
Housing Structures by Occupancy in Northern Cambria borough
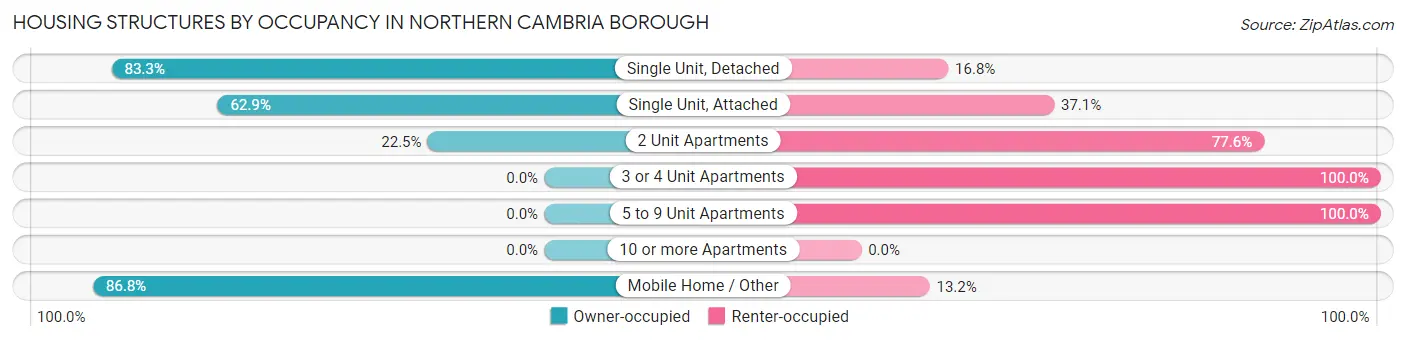
| Structure Type | Owner-occupied | Renter-occupied |
| Single Unit, Detached | 870 (83.3%) | 175 (16.8%) |
| Single Unit, Attached | 22 (62.9%) | 13 (37.1%) |
| 2 Unit Apartments | 11 (22.5%) | 38 (77.5%) |
| 3 or 4 Unit Apartments | 0 (0.0%) | 63 (100.0%) |
| 5 to 9 Unit Apartments | 0 (0.0%) | 120 (100.0%) |
| 10 or more Apartments | 0 (0.0%) | 0 (0.0%) |
| Mobile Home / Other | 66 (86.8%) | 10 (13.2%) |
| Total | 969 (69.8%) | 419 (30.2%) |
Housing Structures by Number of Rooms in Northern Cambria borough
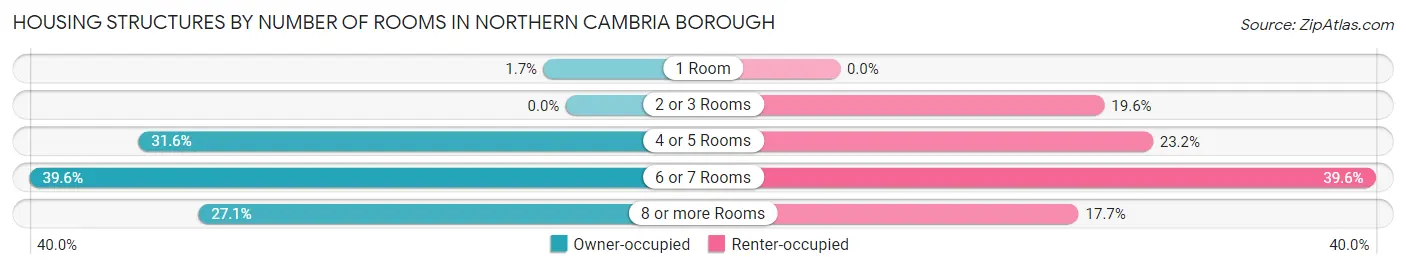
| Number of Rooms | Owner-occupied | Renter-occupied |
| 1 Room | 16 (1.7%) | 0 (0.0%) |
| 2 or 3 Rooms | 0 (0.0%) | 82 (19.6%) |
| 4 or 5 Rooms | 306 (31.6%) | 97 (23.2%) |
| 6 or 7 Rooms | 384 (39.6%) | 166 (39.6%) |
| 8 or more Rooms | 263 (27.1%) | 74 (17.7%) |
| Total | 969 (100.0%) | 419 (100.0%) |
Housing Structure by Heating Type in Northern Cambria borough
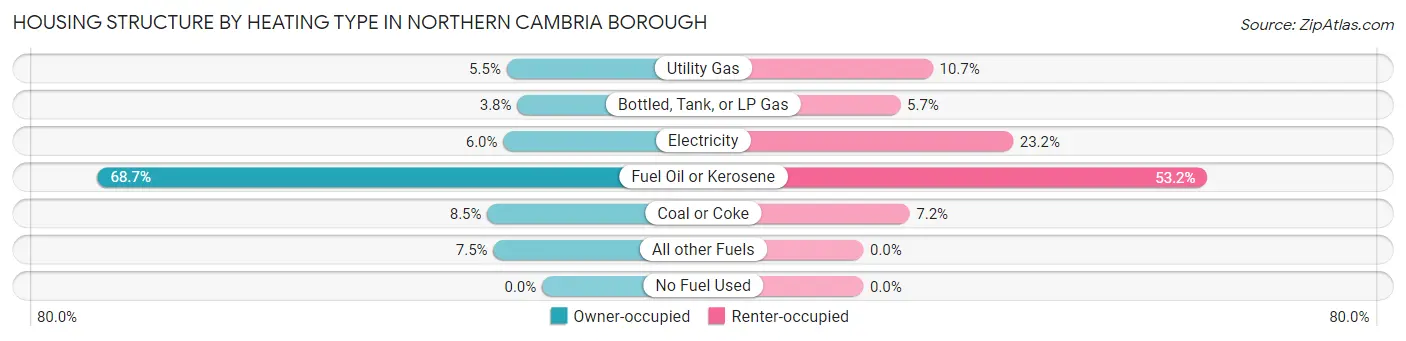
| Heating Type | Owner-occupied | Renter-occupied |
| Utility Gas | 53 (5.5%) | 45 (10.7%) |
| Bottled, Tank, or LP Gas | 37 (3.8%) | 24 (5.7%) |
| Electricity | 58 (6.0%) | 97 (23.2%) |
| Fuel Oil or Kerosene | 666 (68.7%) | 223 (53.2%) |
| Coal or Coke | 82 (8.5%) | 30 (7.2%) |
| All other Fuels | 73 (7.5%) | 0 (0.0%) |
| No Fuel Used | 0 (0.0%) | 0 (0.0%) |
| Total | 969 (100.0%) | 419 (100.0%) |
Household Vehicle Usage in Northern Cambria borough
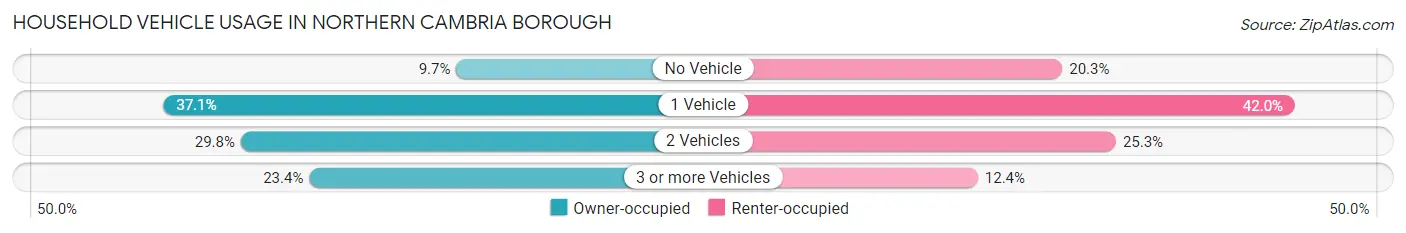
| Vehicles per Household | Owner-occupied | Renter-occupied |
| No Vehicle | 94 (9.7%) | 85 (20.3%) |
| 1 Vehicle | 359 (37.0%) | 176 (42.0%) |
| 2 Vehicles | 289 (29.8%) | 106 (25.3%) |
| 3 or more Vehicles | 227 (23.4%) | 52 (12.4%) |
| Total | 969 (100.0%) | 419 (100.0%) |
Real Estate & Mortgages in Northern Cambria borough
Real Estate and Mortgage Overview in Northern Cambria borough
| Characteristic | Without Mortgage | With Mortgage |
| Housing Units | 681 | 288 |
| Median Property Value | $81,900 | $91,900 |
| Median Household Income | $52,625 | $43 |
| Monthly Housing Costs | $463 | $0 |
| Real Estate Taxes | $1,228 | $11 |
Property Value by Mortgage Status in Northern Cambria borough
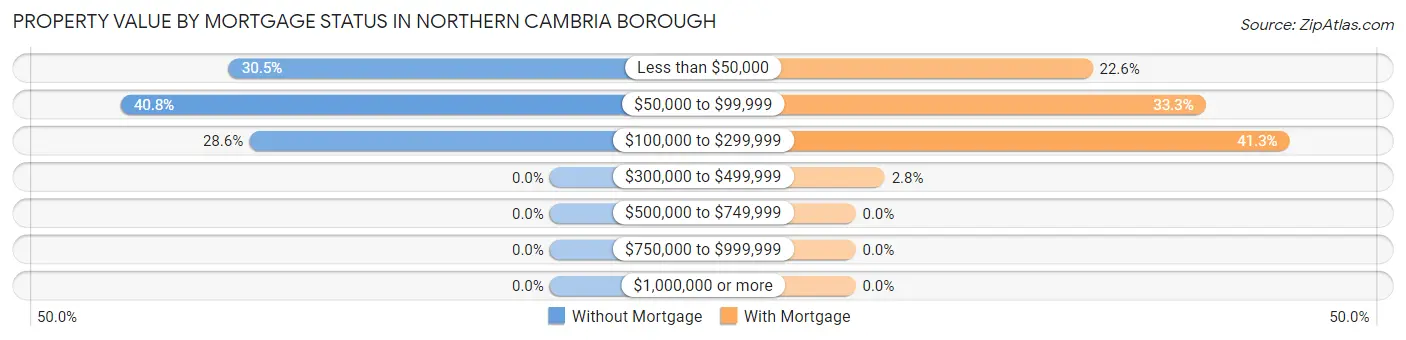
| Property Value | Without Mortgage | With Mortgage |
| Less than $50,000 | 208 (30.5%) | 65 (22.6%) |
| $50,000 to $99,999 | 278 (40.8%) | 96 (33.3%) |
| $100,000 to $299,999 | 195 (28.6%) | 119 (41.3%) |
| $300,000 to $499,999 | 0 (0.0%) | 8 (2.8%) |
| $500,000 to $749,999 | 0 (0.0%) | 0 (0.0%) |
| $750,000 to $999,999 | 0 (0.0%) | 0 (0.0%) |
| $1,000,000 or more | 0 (0.0%) | 0 (0.0%) |
| Total | 681 (100.0%) | 288 (100.0%) |
Household Income by Mortgage Status in Northern Cambria borough
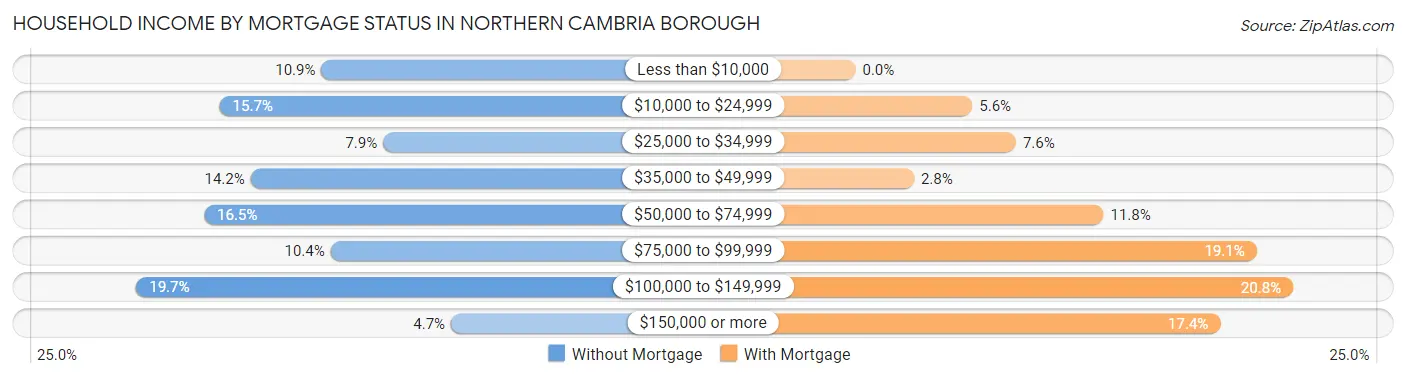
| Household Income | Without Mortgage | With Mortgage |
| Less than $10,000 | 74 (10.9%) | 0 (0.0%) |
| $10,000 to $24,999 | 107 (15.7%) | 16 (5.6%) |
| $25,000 to $34,999 | 54 (7.9%) | 22 (7.6%) |
| $35,000 to $49,999 | 97 (14.2%) | 8 (2.8%) |
| $50,000 to $74,999 | 112 (16.5%) | 34 (11.8%) |
| $75,000 to $99,999 | 71 (10.4%) | 55 (19.1%) |
| $100,000 to $149,999 | 134 (19.7%) | 60 (20.8%) |
| $150,000 or more | 32 (4.7%) | 50 (17.4%) |
| Total | 681 (100.0%) | 288 (100.0%) |
Property Value to Household Income Ratio in Northern Cambria borough
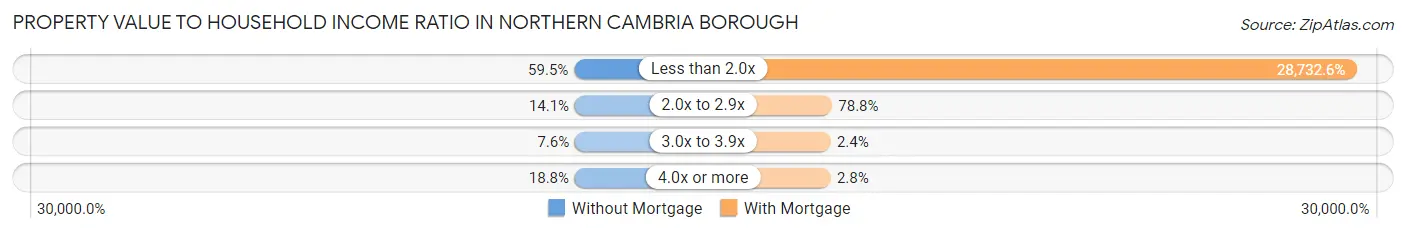
| Value-to-Income Ratio | Without Mortgage | With Mortgage |
| Less than 2.0x | 405 (59.5%) | 82,750 (28,732.6%) |
| 2.0x to 2.9x | 96 (14.1%) | 227 (78.8%) |
| 3.0x to 3.9x | 52 (7.6%) | 7 (2.4%) |
| 4.0x or more | 128 (18.8%) | 8 (2.8%) |
| Total | 681 (100.0%) | 288 (100.0%) |
Real Estate Taxes by Mortgage Status in Northern Cambria borough
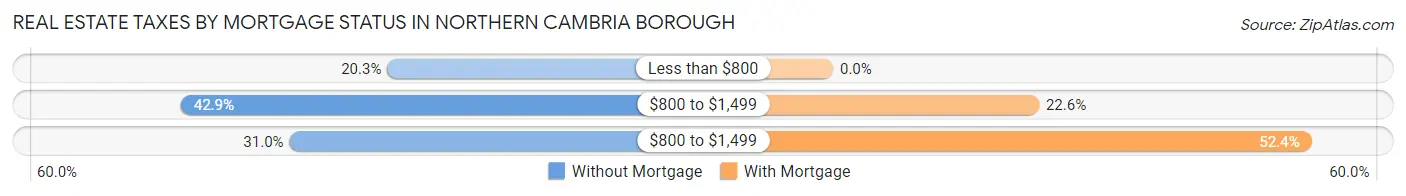
| Property Taxes | Without Mortgage | With Mortgage |
| Less than $800 | 138 (20.3%) | 0 (0.0%) |
| $800 to $1,499 | 292 (42.9%) | 65 (22.6%) |
| $800 to $1,499 | 211 (31.0%) | 151 (52.4%) |
| Total | 681 (100.0%) | 288 (100.0%) |
Health & Disability in Northern Cambria borough
Health Insurance Coverage by Age in Northern Cambria borough
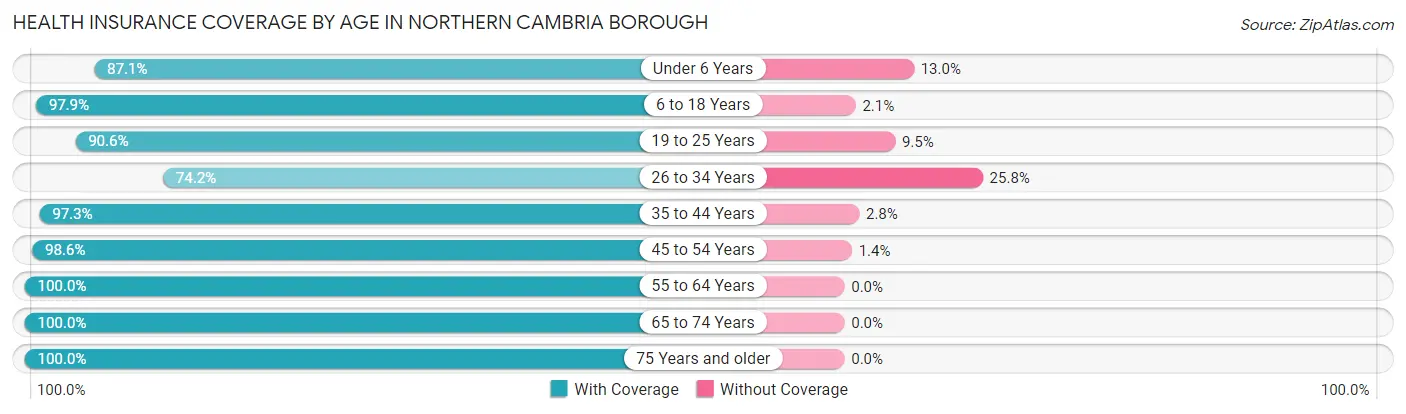
| Age Bracket | With Coverage | Without Coverage |
| Under 6 Years | 383 (87.1%) | 57 (13.0%) |
| 6 to 18 Years | 562 (97.9%) | 12 (2.1%) |
| 19 to 25 Years | 278 (90.5%) | 29 (9.5%) |
| 26 to 34 Years | 210 (74.2%) | 73 (25.8%) |
| 35 to 44 Years | 425 (97.3%) | 12 (2.8%) |
| 45 to 54 Years | 355 (98.6%) | 5 (1.4%) |
| 55 to 64 Years | 609 (100.0%) | 0 (0.0%) |
| 65 to 74 Years | 348 (100.0%) | 0 (0.0%) |
| 75 Years and older | 190 (100.0%) | 0 (0.0%) |
| Total | 3,360 (94.7%) | 188 (5.3%) |
Health Insurance Coverage by Citizenship Status in Northern Cambria borough
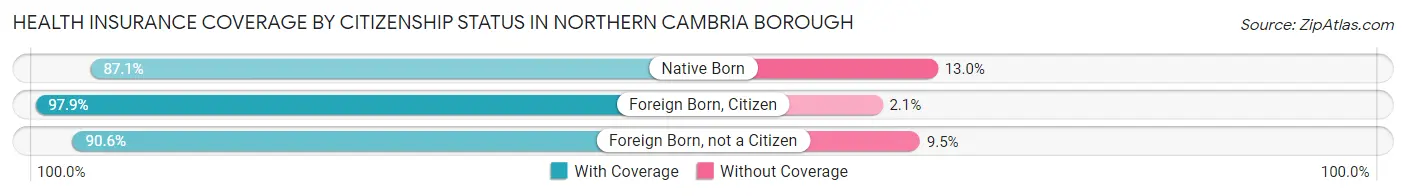
| Citizenship Status | With Coverage | Without Coverage |
| Native Born | 383 (87.1%) | 57 (13.0%) |
| Foreign Born, Citizen | 562 (97.9%) | 12 (2.1%) |
| Foreign Born, not a Citizen | 278 (90.5%) | 29 (9.5%) |
Health Insurance Coverage by Household Income in Northern Cambria borough
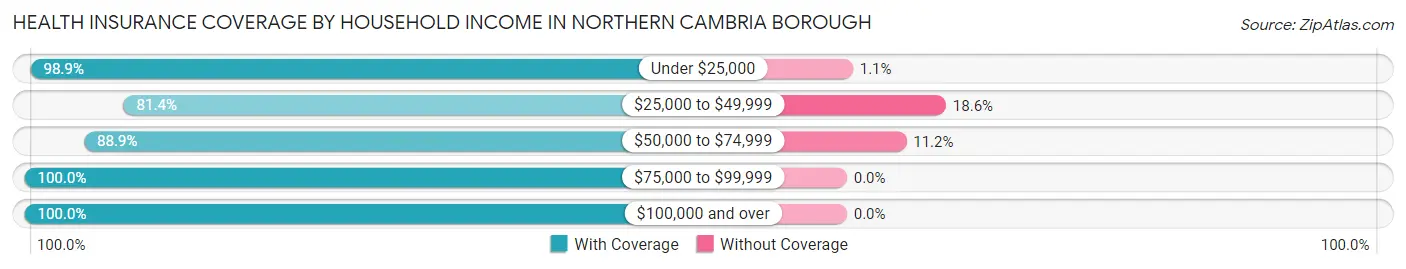
| Household Income | With Coverage | Without Coverage |
| Under $25,000 | 1,062 (98.9%) | 12 (1.1%) |
| $25,000 to $49,999 | 500 (81.4%) | 114 (18.6%) |
| $50,000 to $74,999 | 494 (88.8%) | 62 (11.2%) |
| $75,000 to $99,999 | 405 (100.0%) | 0 (0.0%) |
| $100,000 and over | 876 (100.0%) | 0 (0.0%) |
Public vs Private Health Insurance Coverage by Age in Northern Cambria borough
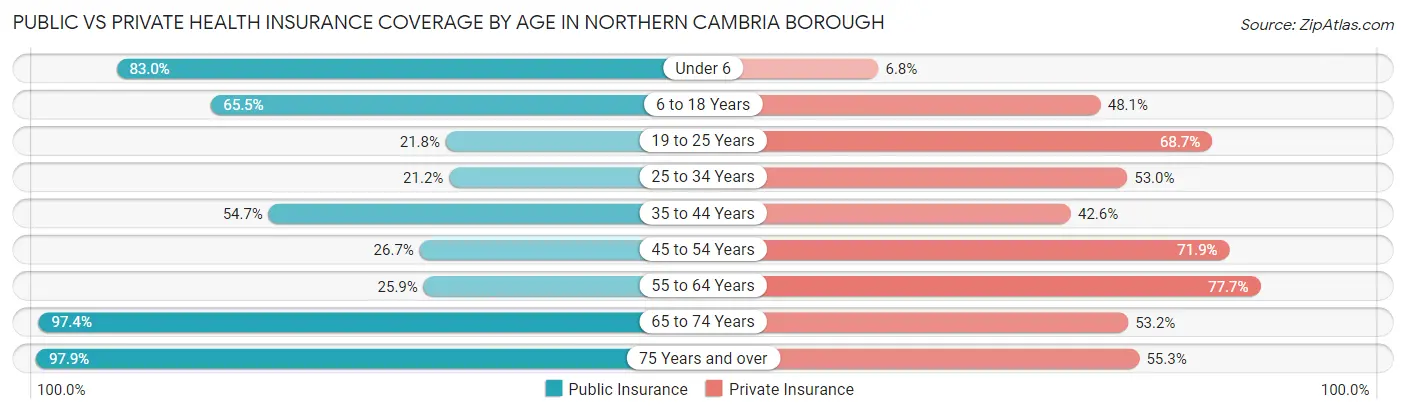
| Age Bracket | Public Insurance | Private Insurance |
| Under 6 | 365 (83.0%) | 30 (6.8%) |
| 6 to 18 Years | 376 (65.5%) | 276 (48.1%) |
| 19 to 25 Years | 67 (21.8%) | 211 (68.7%) |
| 25 to 34 Years | 60 (21.2%) | 150 (53.0%) |
| 35 to 44 Years | 239 (54.7%) | 186 (42.6%) |
| 45 to 54 Years | 96 (26.7%) | 259 (71.9%) |
| 55 to 64 Years | 158 (25.9%) | 473 (77.7%) |
| 65 to 74 Years | 339 (97.4%) | 185 (53.2%) |
| 75 Years and over | 186 (97.9%) | 105 (55.3%) |
| Total | 1,886 (53.2%) | 1,875 (52.8%) |
Disability Status by Sex by Age in Northern Cambria borough
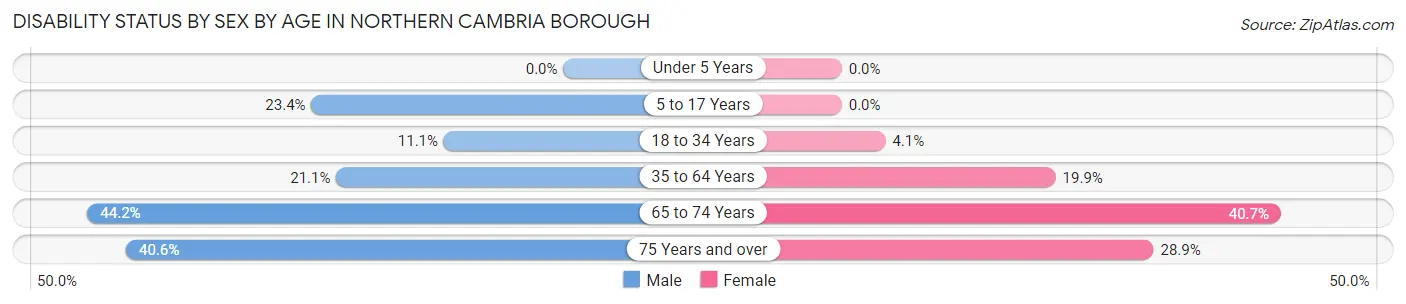
| Age Bracket | Male | Female |
| Under 5 Years | 0 (0.0%) | 0 (0.0%) |
| 5 to 17 Years | 65 (23.4%) | 0 (0.0%) |
| 18 to 34 Years | 52 (11.1%) | 6 (4.1%) |
| 35 to 64 Years | 154 (21.1%) | 134 (19.9%) |
| 65 to 74 Years | 106 (44.2%) | 44 (40.7%) |
| 75 Years and over | 28 (40.6%) | 35 (28.9%) |
Disability Class by Sex by Age in Northern Cambria borough
Disability Class: Hearing Difficulty
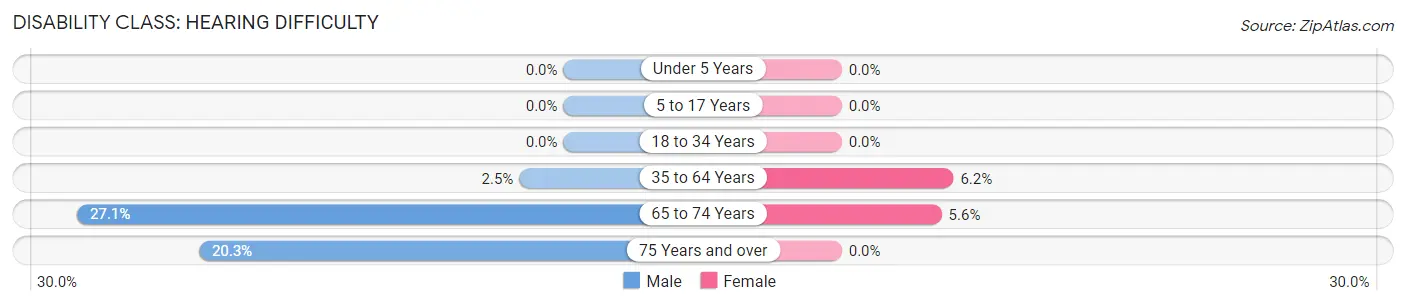
| Age Bracket | Male | Female |
| Under 5 Years | 0 (0.0%) | 0 (0.0%) |
| 5 to 17 Years | 0 (0.0%) | 0 (0.0%) |
| 18 to 34 Years | 0 (0.0%) | 0 (0.0%) |
| 35 to 64 Years | 18 (2.5%) | 42 (6.2%) |
| 65 to 74 Years | 65 (27.1%) | 6 (5.6%) |
| 75 Years and over | 14 (20.3%) | 0 (0.0%) |
Disability Class: Vision Difficulty
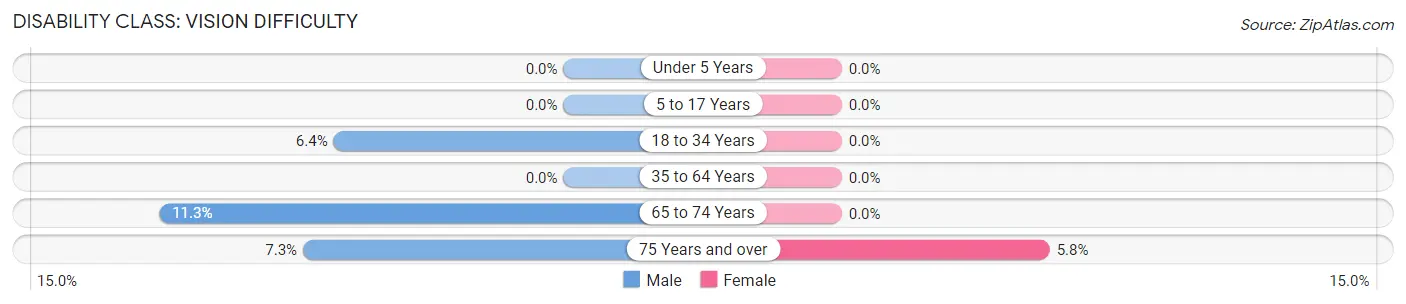
| Age Bracket | Male | Female |
| Under 5 Years | 0 (0.0%) | 0 (0.0%) |
| 5 to 17 Years | 0 (0.0%) | 0 (0.0%) |
| 18 to 34 Years | 30 (6.4%) | 0 (0.0%) |
| 35 to 64 Years | 0 (0.0%) | 0 (0.0%) |
| 65 to 74 Years | 27 (11.3%) | 0 (0.0%) |
| 75 Years and over | 5 (7.2%) | 7 (5.8%) |
Disability Class: Cognitive Difficulty
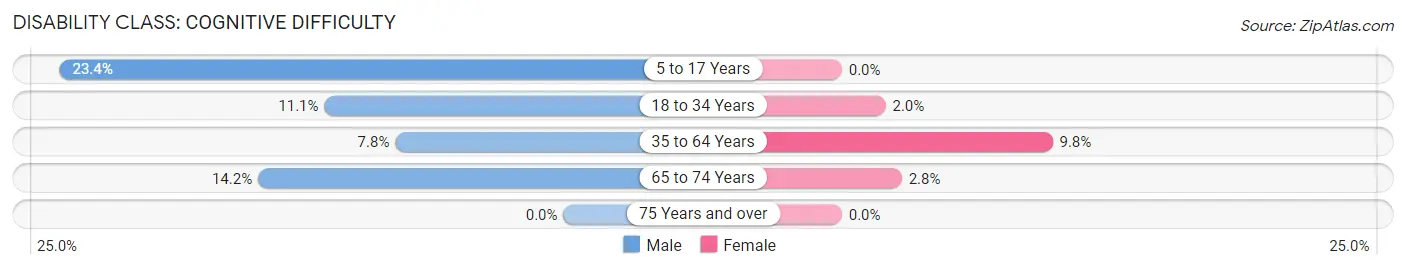
| Age Bracket | Male | Female |
| 5 to 17 Years | 65 (23.4%) | 0 (0.0%) |
| 18 to 34 Years | 52 (11.1%) | 3 (2.0%) |
| 35 to 64 Years | 57 (7.8%) | 66 (9.8%) |
| 65 to 74 Years | 34 (14.2%) | 3 (2.8%) |
| 75 Years and over | 0 (0.0%) | 0 (0.0%) |
Disability Class: Ambulatory Difficulty
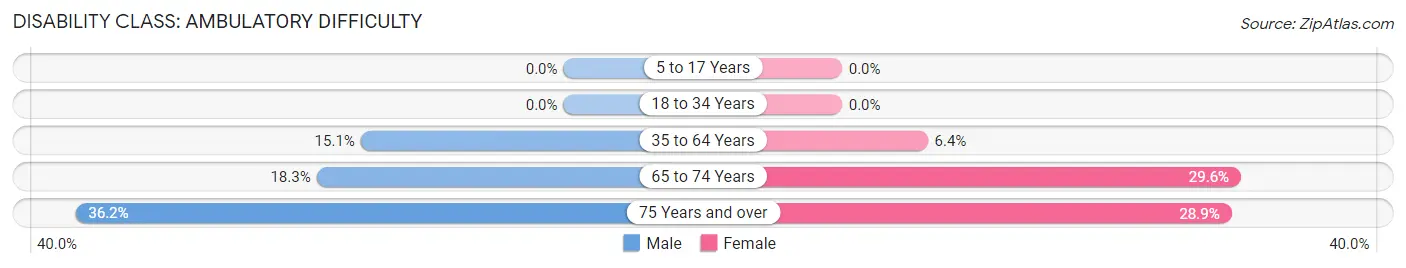
| Age Bracket | Male | Female |
| 5 to 17 Years | 0 (0.0%) | 0 (0.0%) |
| 18 to 34 Years | 0 (0.0%) | 0 (0.0%) |
| 35 to 64 Years | 110 (15.0%) | 43 (6.4%) |
| 65 to 74 Years | 44 (18.3%) | 32 (29.6%) |
| 75 Years and over | 25 (36.2%) | 35 (28.9%) |
Disability Class: Self-Care Difficulty
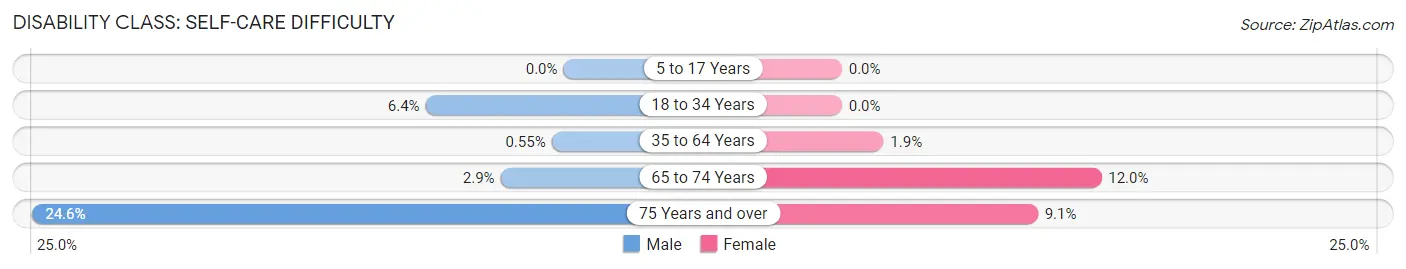
| Age Bracket | Male | Female |
| 5 to 17 Years | 0 (0.0%) | 0 (0.0%) |
| 18 to 34 Years | 30 (6.4%) | 0 (0.0%) |
| 35 to 64 Years | 4 (0.5%) | 13 (1.9%) |
| 65 to 74 Years | 7 (2.9%) | 13 (12.0%) |
| 75 Years and over | 17 (24.6%) | 11 (9.1%) |
Technology Access in Northern Cambria borough
Computing Device Access in Northern Cambria borough
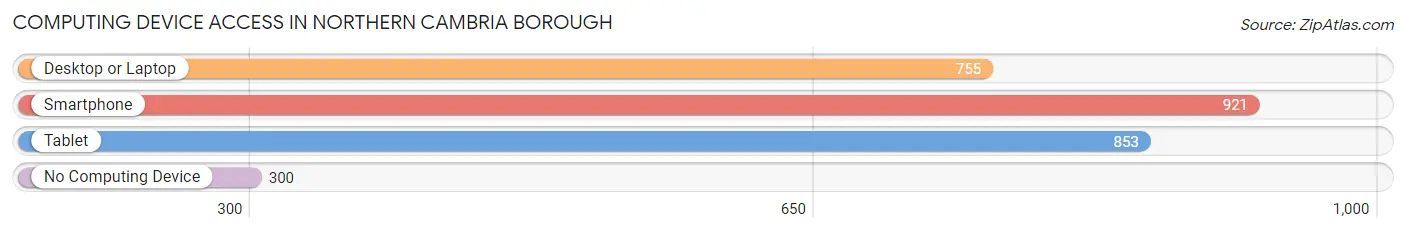
| Device Type | # Households | % Households |
| Desktop or Laptop | 755 | 54.4% |
| Smartphone | 921 | 66.3% |
| Tablet | 853 | 61.5% |
| No Computing Device | 300 | 21.6% |
| Total | 1,388 | 100.0% |
Internet Access in Northern Cambria borough
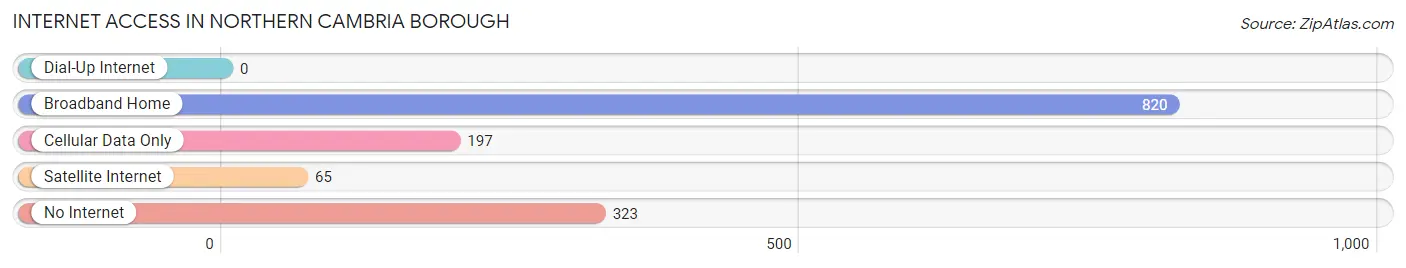
| Internet Type | # Households | % Households |
| Dial-Up Internet | 0 | 0.0% |
| Broadband Home | 820 | 59.1% |
| Cellular Data Only | 197 | 14.2% |
| Satellite Internet | 65 | 4.7% |
| No Internet | 323 | 23.3% |
| Total | 1,388 | 100.0% |
Northern Cambria borough Summary
Introduction
Northern Cambria Borough is a small borough located in Cambria County, Pennsylvania. It is situated in the foothills of the Allegheny Mountains and is part of the Johnstown Metropolitan Statistical Area. The borough has a population of approximately 2,000 people and is known for its rich history, diverse geography, and vibrant economy. This paper will provide an overview of the history, geography, economy, and demographics of Northern Cambria Borough.
History
Northern Cambria Borough was founded in 1872 and was originally known as “Cambria City”. The borough was named after the Cambria Iron Company, which was founded in 1852 and was the first iron company in the area. The company was responsible for the development of the borough and the surrounding area. The borough was officially incorporated in 1873 and was renamed “Northern Cambria” in 1875.
The borough was home to a variety of industries, including coal mining, steel production, and lumbering. The Cambria Iron Company was the largest employer in the area and was responsible for the construction of the first railroad in the borough. The railroad was used to transport coal and other goods to the nearby cities of Johnstown and Altoona.
The borough was also home to a variety of ethnic groups, including German, Irish, and Italian immigrants. These immigrants were responsible for the development of the borough’s culture and economy.
Geography
Northern Cambria Borough is located in the foothills of the Allegheny Mountains in Cambria County, Pennsylvania. The borough is situated along the banks of the Little Conemaugh River and is surrounded by the towns of Ebensburg, Carrolltown, and Portage. The borough is approximately 10 miles from the city of Johnstown and is approximately 50 miles from the city of Pittsburgh.
The borough has a total area of 1.2 square miles and is located at an elevation of 1,400 feet. The borough is home to a variety of terrain, including rolling hills, forests, and streams. The borough is also home to a variety of wildlife, including deer, foxes, and turkeys.
Economy
Northern Cambria Borough is home to a variety of businesses and industries. The borough is home to a variety of retail stores, restaurants, and other businesses. The borough is also home to a variety of manufacturing and industrial businesses, including a steel mill, a lumber mill, and a coal mine.
The borough is also home to a variety of healthcare facilities, including a hospital, a nursing home, and a variety of medical offices. The borough is also home to a variety of educational institutions, including a public school district and a community college.
Demographics
As of the 2010 census, the population of Northern Cambria Borough was 2,000 people. The population is approximately 97% white, 1% African American, and 1% Hispanic. The median household income is approximately $35,000 and the median home value is approximately $90,000.
Conclusion
Northern Cambria Borough is a small borough located in Cambria County, Pennsylvania. The borough has a rich history, diverse geography, and vibrant economy. The borough is home to a variety of businesses and industries and is home to a variety of ethnic groups. The population of the borough is approximately 2,000 people and the median household income is approximately $35,000.
Common Questions
What is Per Capita Income in Northern Cambria borough?
Per Capita income in Northern Cambria borough is $24,373.
What is the Median Family Income in Northern Cambria borough?
Median Family Income in Northern Cambria borough is $66,020.
What is the Median Household income in Northern Cambria borough?
Median Household Income in Northern Cambria borough is $49,750.
What is Income or Wage Gap in Northern Cambria borough?
Income or Wage Gap in Northern Cambria borough is 1.6%.
Women in Northern Cambria borough earn 98.4 cents for every dollar earned by a man.
What is Inequality or Gini Index in Northern Cambria borough?
Inequality or Gini Index in Northern Cambria borough is 0.44.
What is the Total Population of Northern Cambria borough?
Total Population of Northern Cambria borough is 3,548.
What is the Total Male Population of Northern Cambria borough?
Total Male Population of Northern Cambria borough is 1,876.
What is the Total Female Population of Northern Cambria borough?
Total Female Population of Northern Cambria borough is 1,672.
What is the Ratio of Males per 100 Females in Northern Cambria borough?
There are 112.20 Males per 100 Females in Northern Cambria borough.
What is the Ratio of Females per 100 Males in Northern Cambria borough?
There are 89.13 Females per 100 Males in Northern Cambria borough.
What is the Median Population Age in Northern Cambria borough?
Median Population Age in Northern Cambria borough is 38.1 Years.
What is the Average Family Size in Northern Cambria borough
Average Family Size in Northern Cambria borough is 3.2 People.
What is the Average Household Size in Northern Cambria borough
Average Household Size in Northern Cambria borough is 2.5 People.
How Large is the Labor Force in Northern Cambria borough?
There are 1,593 People in the Labor Forcein in Northern Cambria borough.
What is the Percentage of People in the Labor Force in Northern Cambria borough?
59.9% of People are in the Labor Force in Northern Cambria borough.
What is the Unemployment Rate in Northern Cambria borough?
Unemployment Rate in Northern Cambria borough is 5.3%.