Rural Valley borough, PA Map & Demographics
Rural Valley borough Overview
$32,629
PER CAPITA INCOME
$83,523
AVG FAMILY INCOME
$66,667
AVG HOUSEHOLD INCOME
28.4%
WAGE / INCOME GAP [ % ]
71.6¢/ $1
WAGE / INCOME GAP [ $ ]
$15,373
FAMILY INCOME DEFICIT
0.36
INEQUALITY / GINI INDEX
946
TOTAL POPULATION
485
MALE POPULATION
461
FEMALE POPULATION
105.21
MALES / 100 FEMALES
95.05
FEMALES / 100 MALES
50.0
MEDIAN AGE
2.9
AVG FAMILY SIZE
2.5
AVG HOUSEHOLD SIZE
441
LABOR FORCE [ PEOPLE ]
53.6%
PERCENT IN LABOR FORCE
12.5%
UNEMPLOYMENT RATE
Income in Rural Valley borough
Income Overview in Rural Valley borough
Per Capita Income in Rural Valley borough is $32,629, while median incomes of families and households are $83,523 and $66,667 respectively.
| Characteristic | Number | Measure |
| Per Capita Income | 946 | $32,629 |
| Median Family Income | 271 | $83,523 |
| Mean Family Income | 271 | $93,356 |
| Median Household Income | 382 | $66,667 |
| Mean Household Income | 382 | $79,442 |
| Income Deficit | 271 | $15,373 |
| Wage / Income Gap (%) | 946 | 28.41% |
| Wage / Income Gap ($) | 946 | 71.59¢ per $1 |
| Gini / Inequality Index | 946 | 0.36 |
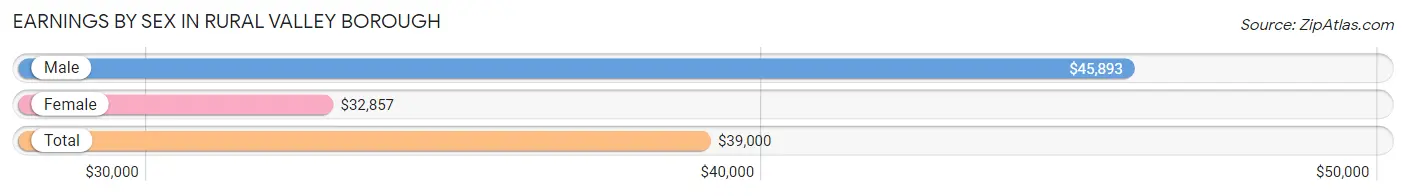
Earnings by Sex in Rural Valley borough
Average Earnings in Rural Valley borough are $39,000, $45,893 for men and $32,857 for women, a difference of 28.4%.
| Sex | Number | Average Earnings |
| Male | 274 (60.9%) | $45,893 |
| Female | 176 (39.1%) | $32,857 |
| Total | 450 (100.0%) | $39,000 |
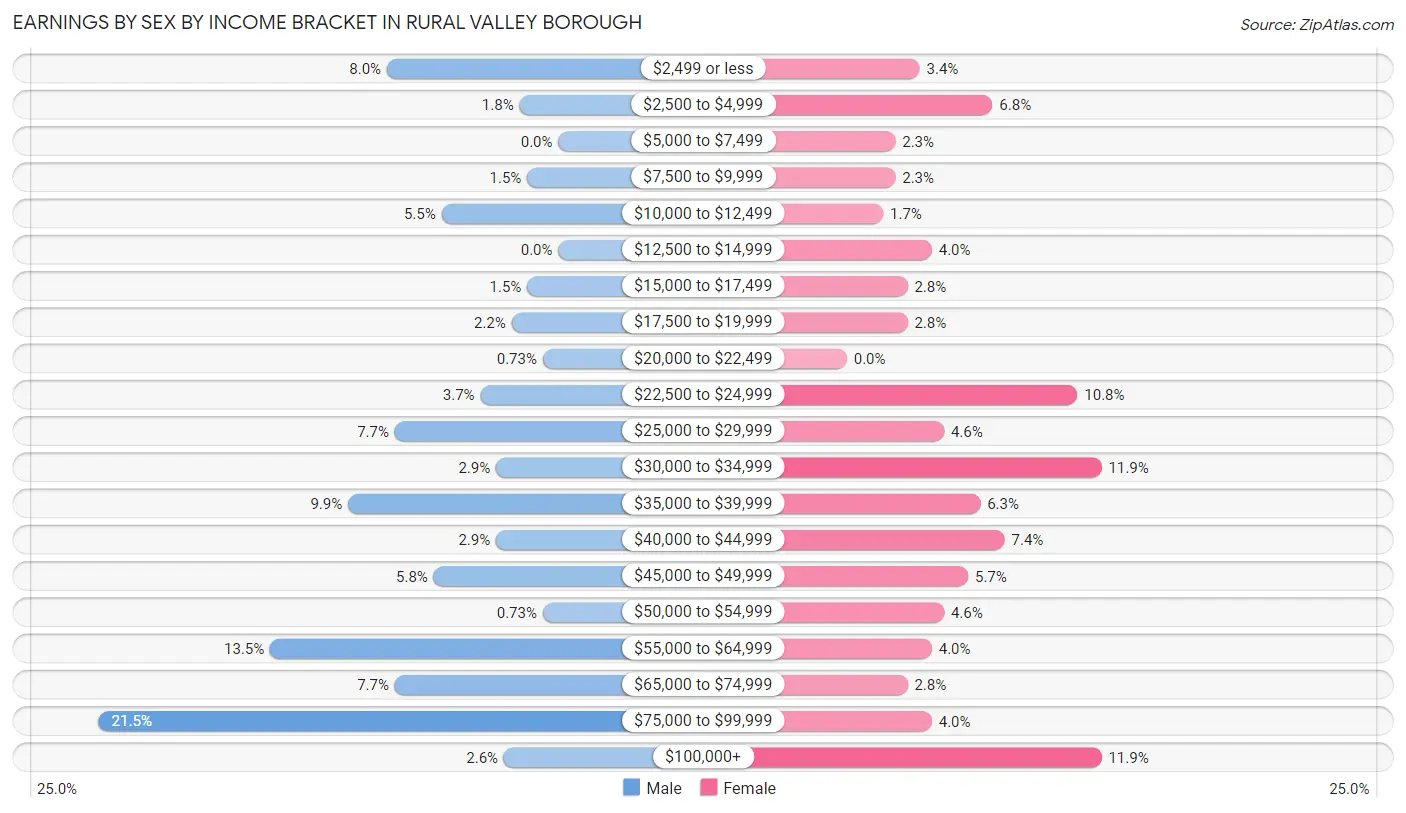
Earnings by Sex by Income Bracket in Rural Valley borough
The most common earnings brackets in Rural Valley borough are $75,000 to $99,999 for men (59 | 21.5%) and $30,000 to $34,999 for women (21 | 11.9%).
| Income | Male | Female |
| $2,499 or less | 22 (8.0%) | 6 (3.4%) |
| $2,500 to $4,999 | 5 (1.8%) | 12 (6.8%) |
| $5,000 to $7,499 | 0 (0.0%) | 4 (2.3%) |
| $7,500 to $9,999 | 4 (1.5%) | 4 (2.3%) |
| $10,000 to $12,499 | 15 (5.5%) | 3 (1.7%) |
| $12,500 to $14,999 | 0 (0.0%) | 7 (4.0%) |
| $15,000 to $17,499 | 4 (1.5%) | 5 (2.8%) |
| $17,500 to $19,999 | 6 (2.2%) | 5 (2.8%) |
| $20,000 to $22,499 | 2 (0.7%) | 0 (0.0%) |
| $22,500 to $24,999 | 10 (3.6%) | 19 (10.8%) |
| $25,000 to $29,999 | 21 (7.7%) | 8 (4.5%) |
| $30,000 to $34,999 | 8 (2.9%) | 21 (11.9%) |
| $35,000 to $39,999 | 27 (9.9%) | 11 (6.2%) |
| $40,000 to $44,999 | 8 (2.9%) | 13 (7.4%) |
| $45,000 to $49,999 | 16 (5.8%) | 10 (5.7%) |
| $50,000 to $54,999 | 2 (0.7%) | 8 (4.5%) |
| $55,000 to $64,999 | 37 (13.5%) | 7 (4.0%) |
| $65,000 to $74,999 | 21 (7.7%) | 5 (2.8%) |
| $75,000 to $99,999 | 59 (21.5%) | 7 (4.0%) |
| $100,000+ | 7 (2.5%) | 21 (11.9%) |
| Total | 274 (100.0%) | 176 (100.0%) |
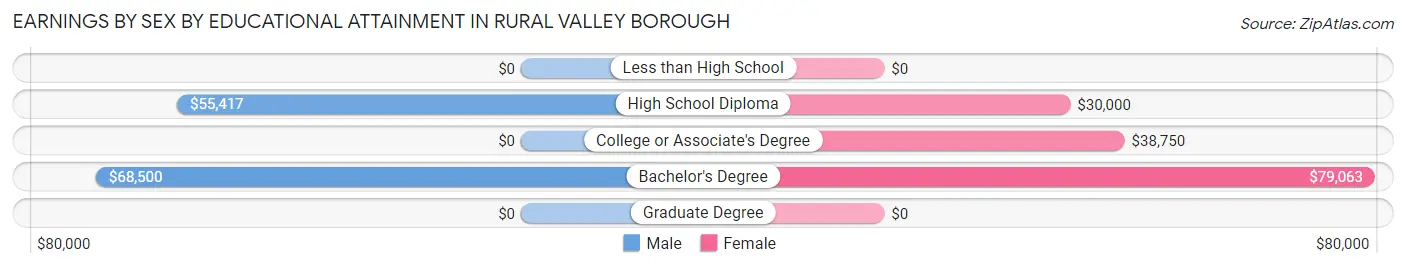
Earnings by Sex by Educational Attainment in Rural Valley borough
Average earnings in Rural Valley borough are $57,417 for men and $36,042 for women, a difference of 37.2%. Men with an educational attainment of bachelor's degree enjoy the highest average annual earnings of $68,500, while those with high school diploma education earn the least with $55,417. Women with an educational attainment of bachelor's degree earn the most with the average annual earnings of $79,063, while those with high school diploma education have the smallest earnings of $30,000.
| Educational Attainment | Male Income | Female Income |
| Less than High School | - | - |
| High School Diploma | $55,417 | $30,000 |
| College or Associate's Degree | - | - |
| Bachelor's Degree | $68,500 | $79,063 |
| Graduate Degree | - | - |
| Total | $57,417 | $36,042 |
Family Income in Rural Valley borough
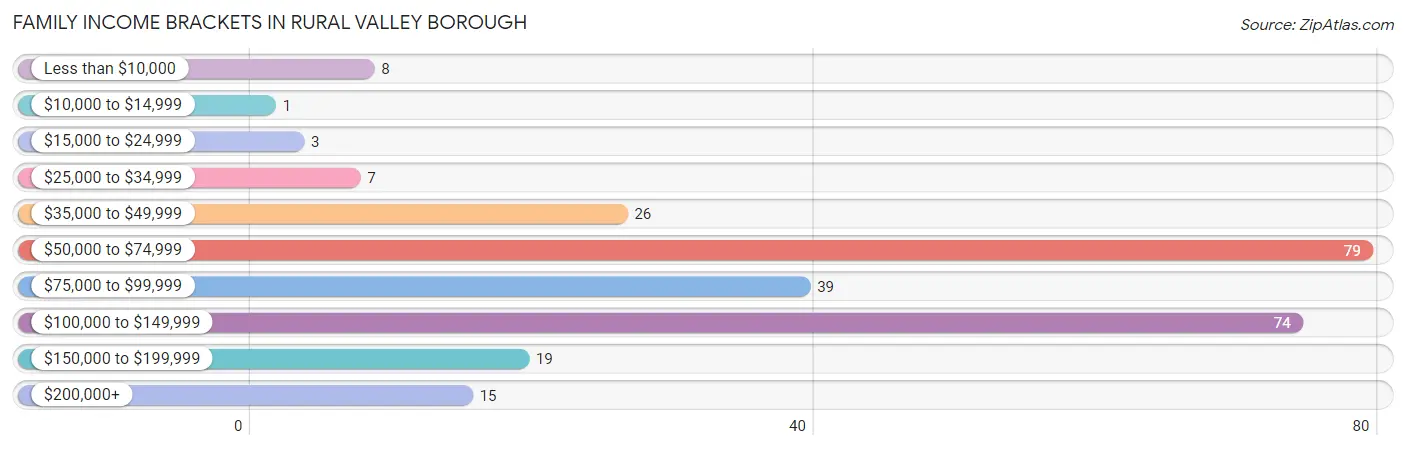
Family Income Brackets in Rural Valley borough
According to the Rural Valley borough family income data, there are 79 families falling into the $50,000 to $74,999 income range, which is the most common income bracket and makes up 29.1% of all families. Conversely, the $10,000 to $14,999 income bracket is the least frequent group with only 1 families (0.4%) belonging to this category.
| Income Bracket | # Families | % Families |
| Less than $10,000 | 8 | 3.0% |
| $10,000 to $14,999 | 1 | 0.4% |
| $15,000 to $24,999 | 3 | 1.1% |
| $25,000 to $34,999 | 7 | 2.6% |
| $35,000 to $49,999 | 26 | 9.6% |
| $50,000 to $74,999 | 79 | 29.2% |
| $75,000 to $99,999 | 39 | 14.4% |
| $100,000 to $149,999 | 74 | 27.3% |
| $150,000 to $199,999 | 19 | 7.0% |
| $200,000+ | 15 | 5.5% |
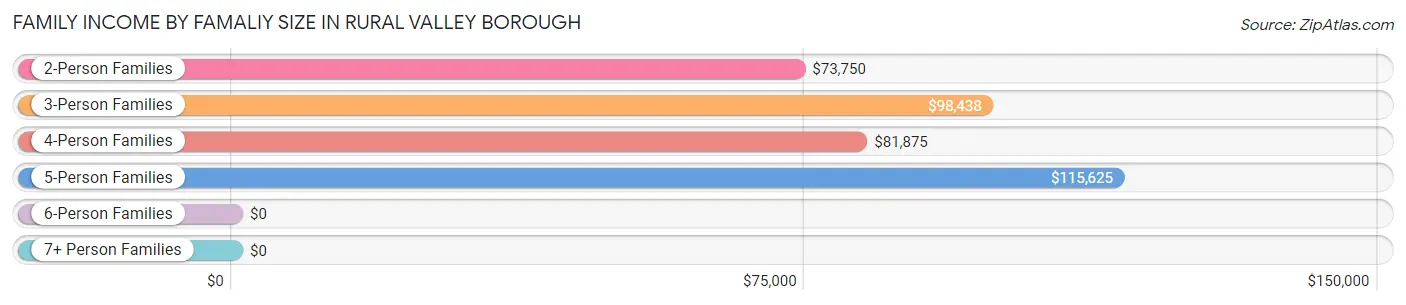
Family Income by Famaliy Size in Rural Valley borough
5-person families (13 | 4.8%) account for the highest median family income in Rural Valley borough with $115,625 per family, while 2-person families (163 | 60.2%) have the highest median income of $36,875 per family member.
| Income Bracket | # Families | Median Income |
| 2-Person Families | 163 (60.2%) | $73,750 |
| 3-Person Families | 45 (16.6%) | $98,438 |
| 4-Person Families | 49 (18.1%) | $81,875 |
| 5-Person Families | 13 (4.8%) | $115,625 |
| 6-Person Families | 0 (0.0%) | $0 |
| 7+ Person Families | 1 (0.4%) | $0 |
| Total | 271 (100.0%) | $83,523 |
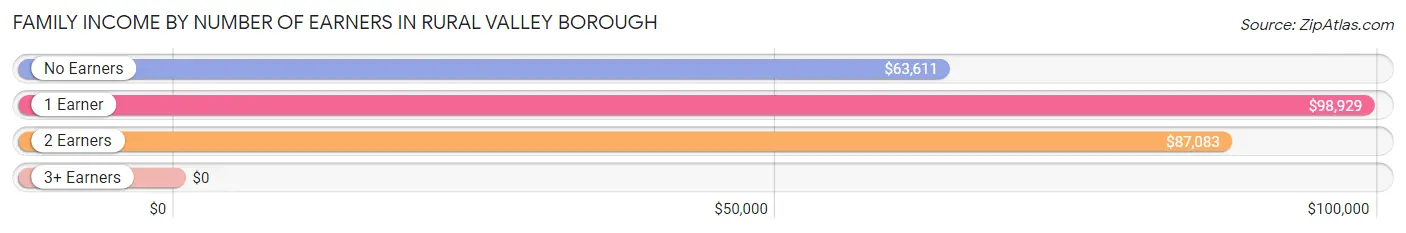
Family Income by Number of Earners in Rural Valley borough
| Number of Earners | # Families | Median Income |
| No Earners | 64 (23.6%) | $63,611 |
| 1 Earner | 106 (39.1%) | $98,929 |
| 2 Earners | 69 (25.5%) | $87,083 |
| 3+ Earners | 32 (11.8%) | $0 |
| Total | 271 (100.0%) | $83,523 |
Household Income in Rural Valley borough
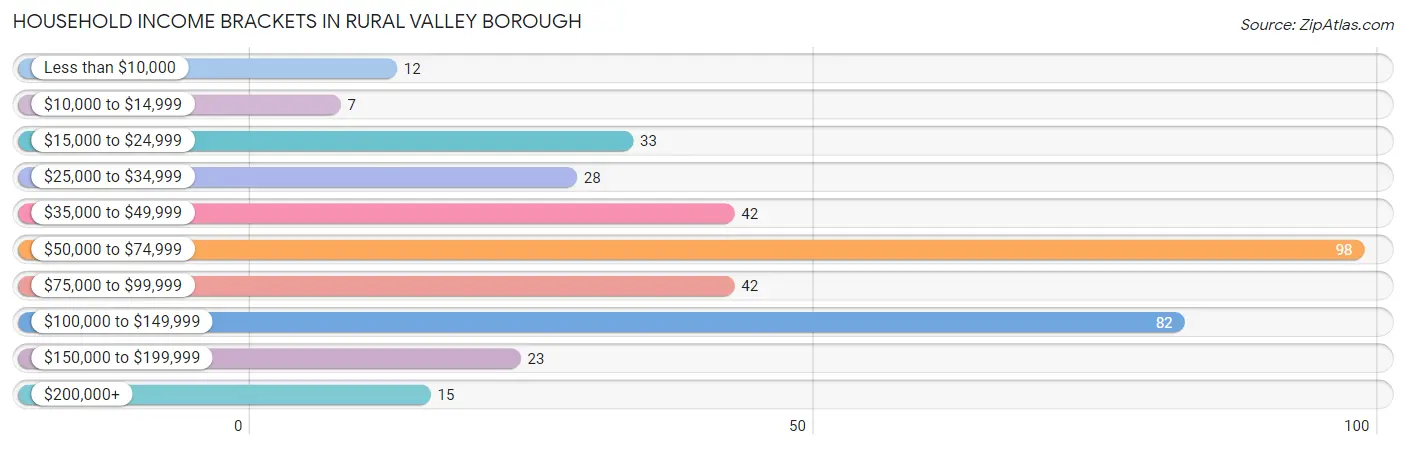
Household Income Brackets in Rural Valley borough
With 98 households falling in the category, the $50,000 to $74,999 income range is the most frequent in Rural Valley borough, accounting for 25.7% of all households. In contrast, only 7 households (1.8%) fall into the $10,000 to $14,999 income bracket, making it the least populous group.
| Income Bracket | # Households | % Households |
| Less than $10,000 | 12 | 3.1% |
| $10,000 to $14,999 | 7 | 1.8% |
| $15,000 to $24,999 | 33 | 8.6% |
| $25,000 to $34,999 | 28 | 7.3% |
| $35,000 to $49,999 | 42 | 11.0% |
| $50,000 to $74,999 | 98 | 25.7% |
| $75,000 to $99,999 | 42 | 11.0% |
| $100,000 to $149,999 | 82 | 21.5% |
| $150,000 to $199,999 | 23 | 6.0% |
| $200,000+ | 15 | 3.9% |
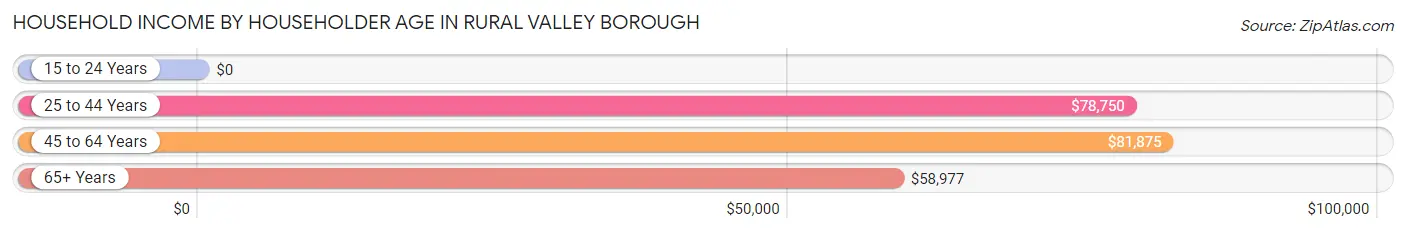
Household Income by Householder Age in Rural Valley borough
The median household income in Rural Valley borough is $66,667, with the highest median household income of $81,875 found in the 45 to 64 years age bracket for the primary householder. A total of 169 households (44.2%) fall into this category. Meanwhile, the 15 to 24 years age bracket for the primary householder has the lowest median household income of $0, with 12 households (3.1%) in this group.
| Income Bracket | # Households | Median Income |
| 15 to 24 Years | 12 (3.1%) | $0 |
| 25 to 44 Years | 58 (15.2%) | $78,750 |
| 45 to 64 Years | 169 (44.2%) | $81,875 |
| 65+ Years | 143 (37.4%) | $58,977 |
| Total | 382 (100.0%) | $66,667 |
Poverty in Rural Valley borough
Income Below Poverty by Sex and Age in Rural Valley borough
With 7.7% poverty level for males and 8.7% for females among the residents of Rural Valley borough, under 5 year old males and 18 to 24 year old females are the most vulnerable to poverty, with 4 males (30.8%) and 5 females (27.8%) in their respective age groups living below the poverty level.
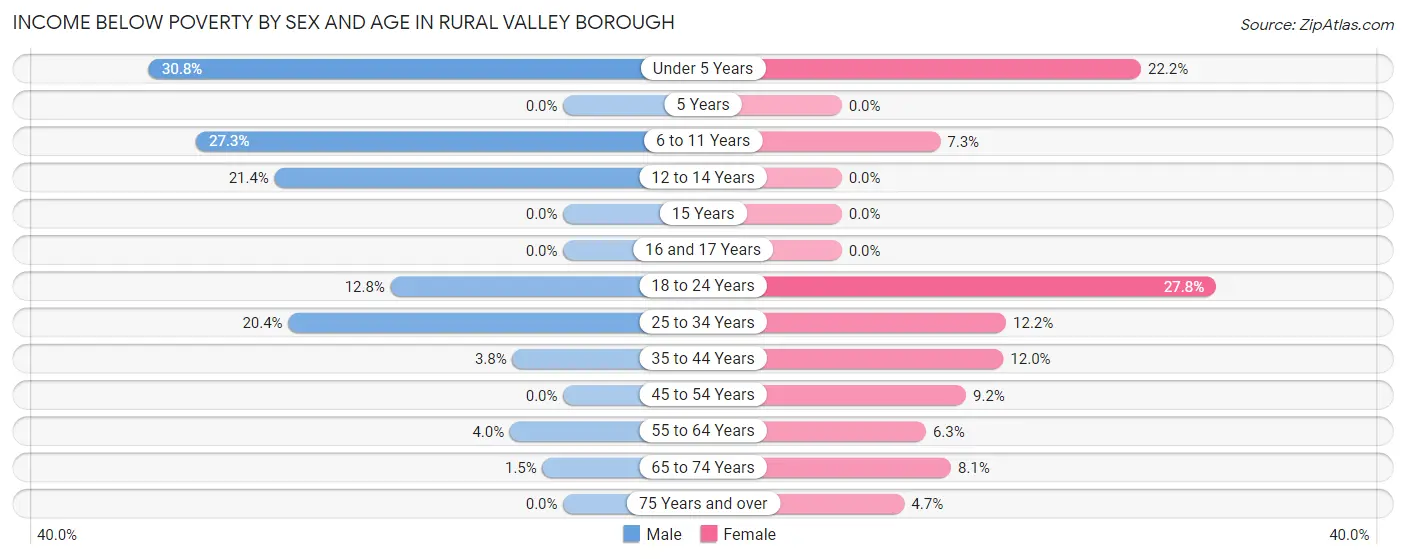
| Age Bracket | Male | Female |
| Under 5 Years | 4 (30.8%) | 4 (22.2%) |
| 5 Years | 0 (0.0%) | 0 (0.0%) |
| 6 to 11 Years | 3 (27.3%) | 3 (7.3%) |
| 12 to 14 Years | 3 (21.4%) | 0 (0.0%) |
| 15 Years | 0 (0.0%) | 0 (0.0%) |
| 16 and 17 Years | 0 (0.0%) | 0 (0.0%) |
| 18 to 24 Years | 10 (12.8%) | 5 (27.8%) |
| 25 to 34 Years | 10 (20.4%) | 5 (12.2%) |
| 35 to 44 Years | 2 (3.8%) | 3 (12.0%) |
| 45 to 54 Years | 0 (0.0%) | 6 (9.2%) |
| 55 to 64 Years | 4 (4.0%) | 6 (6.2%) |
| 65 to 74 Years | 1 (1.5%) | 6 (8.1%) |
| 75 Years and over | 0 (0.0%) | 2 (4.6%) |
| Total | 37 (7.7%) | 40 (8.7%) |
Income Above Poverty by Sex and Age in Rural Valley borough
According to the poverty statistics in Rural Valley borough, males aged 15 years and females aged 5 years are the age groups that are most secure financially, with 100.0% of males and 100.0% of females in these age groups living above the poverty line.
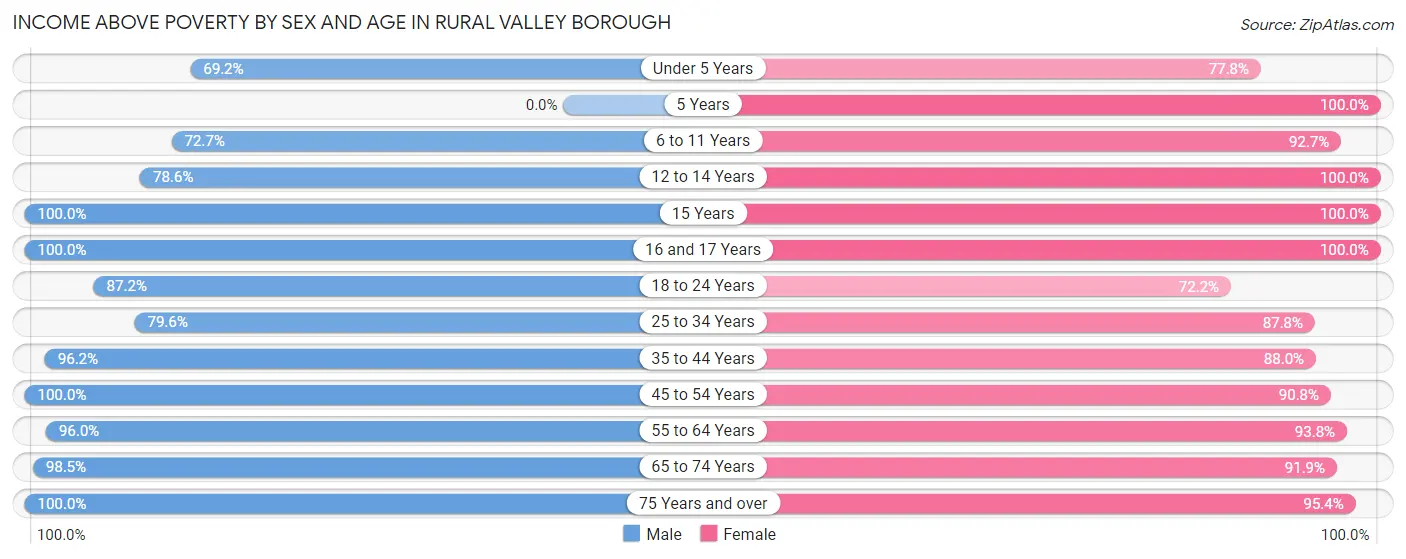
| Age Bracket | Male | Female |
| Under 5 Years | 9 (69.2%) | 14 (77.8%) |
| 5 Years | 0 (0.0%) | 3 (100.0%) |
| 6 to 11 Years | 8 (72.7%) | 38 (92.7%) |
| 12 to 14 Years | 11 (78.6%) | 13 (100.0%) |
| 15 Years | 3 (100.0%) | 7 (100.0%) |
| 16 and 17 Years | 15 (100.0%) | 17 (100.0%) |
| 18 to 24 Years | 68 (87.2%) | 13 (72.2%) |
| 25 to 34 Years | 39 (79.6%) | 36 (87.8%) |
| 35 to 44 Years | 51 (96.2%) | 22 (88.0%) |
| 45 to 54 Years | 37 (100.0%) | 59 (90.8%) |
| 55 to 64 Years | 97 (96.0%) | 90 (93.8%) |
| 65 to 74 Years | 64 (98.5%) | 68 (91.9%) |
| 75 Years and over | 41 (100.0%) | 41 (95.4%) |
| Total | 443 (92.3%) | 421 (91.3%) |
Income Below Poverty Among Married-Couple Families in Rural Valley borough
The poverty statistics for married-couple families in Rural Valley borough show that 1.7% or 4 of the total 230 families live below the poverty line. Families with 3 or 4 children have the highest poverty rate of 14.3%, comprising of 1 families. On the other hand, families with no children have the lowest poverty rate of 0.6%, which includes 1 families.
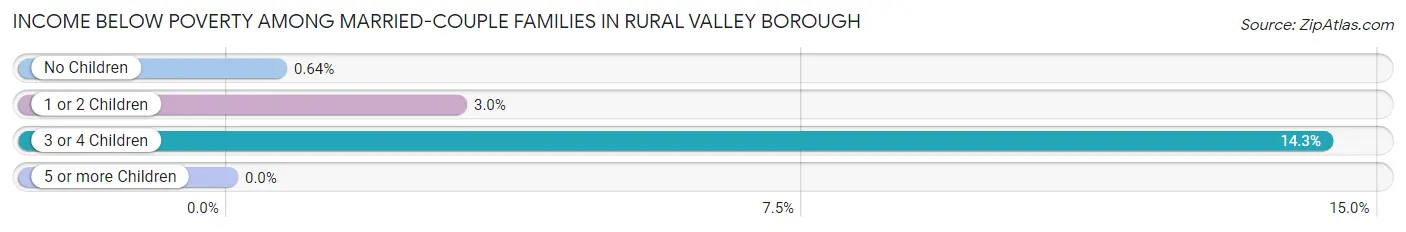
| Children | Above Poverty | Below Poverty |
| No Children | 155 (99.4%) | 1 (0.6%) |
| 1 or 2 Children | 65 (97.0%) | 2 (3.0%) |
| 3 or 4 Children | 6 (85.7%) | 1 (14.3%) |
| 5 or more Children | 0 (0.0%) | 0 (0.0%) |
| Total | 226 (98.3%) | 4 (1.7%) |
Income Below Poverty Among Single-Parent Households in Rural Valley borough
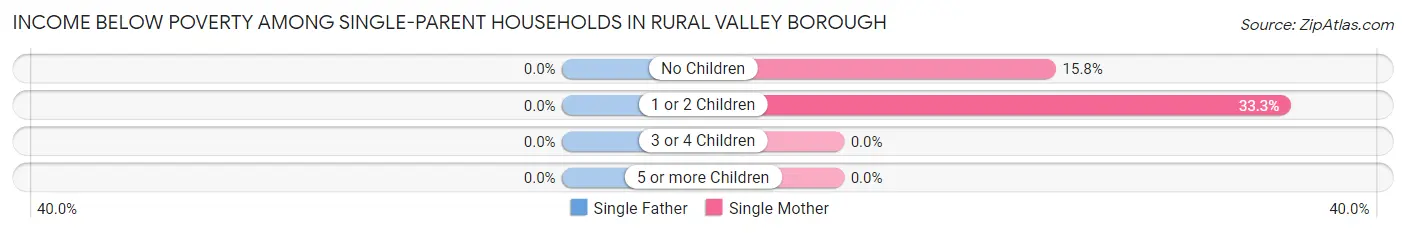
| Children | Single Father | Single Mother |
| No Children | 0 (0.0%) | 3 (15.8%) |
| 1 or 2 Children | 0 (0.0%) | 4 (33.3%) |
| 3 or 4 Children | 0 (0.0%) | 0 (0.0%) |
| 5 or more Children | 0 (0.0%) | 0 (0.0%) |
| Total | 0 (0.0%) | 7 (22.6%) |
Income Below Poverty Among Married-Couple vs Single-Parent Households in Rural Valley borough
The poverty data for Rural Valley borough shows that 4 of the married-couple family households (1.7%) and 7 of the single-parent households (17.1%) are living below the poverty level. Within the married-couple family households, those with 3 or 4 children have the highest poverty rate, with 1 households (14.3%) falling below the poverty line. Among the single-parent households, those with 1 or 2 children have the highest poverty rate, with 4 household (18.2%) living below poverty.
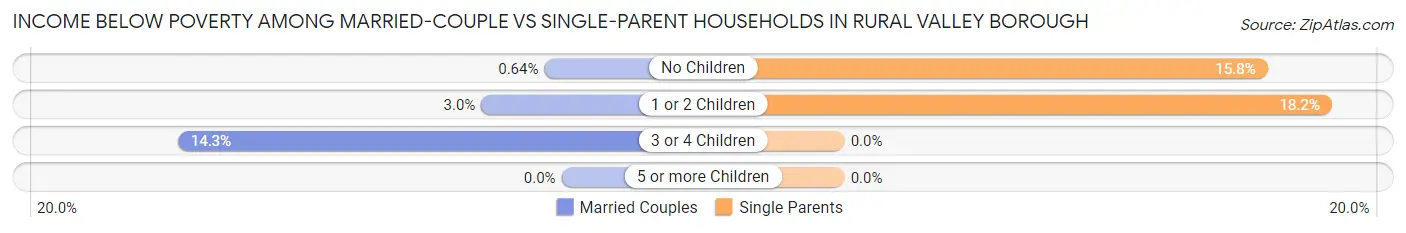
| Children | Married-Couple Families | Single-Parent Households |
| No Children | 1 (0.6%) | 3 (15.8%) |
| 1 or 2 Children | 2 (3.0%) | 4 (18.2%) |
| 3 or 4 Children | 1 (14.3%) | 0 (0.0%) |
| 5 or more Children | 0 (0.0%) | 0 (0.0%) |
| Total | 4 (1.7%) | 7 (17.1%) |
Race in Rural Valley borough
The most populous races in Rural Valley borough are White / Caucasian (919 | 97.2%), Two or more Races (27 | 2.9%), and Hispanic or Latino (3 | 0.3%).
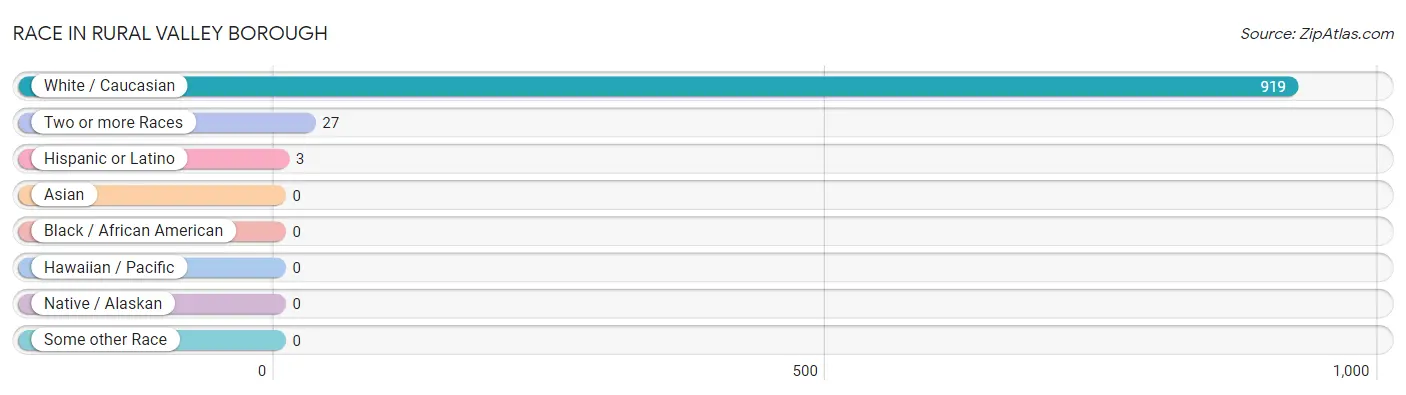
| Race | # Population | % Population |
| Asian | 0 | 0.0% |
| Black / African American | 0 | 0.0% |
| Hawaiian / Pacific | 0 | 0.0% |
| Hispanic or Latino | 3 | 0.3% |
| Native / Alaskan | 0 | 0.0% |
| White / Caucasian | 919 | 97.2% |
| Two or more Races | 27 | 2.9% |
| Some other Race | 0 | 0.0% |
| Total | 946 | 100.0% |
Ancestry in Rural Valley borough
The most populous ancestries reported in Rural Valley borough are German (231 | 24.4%), Italian (149 | 15.8%), English (108 | 11.4%), Irish (58 | 6.1%), and American (46 | 4.9%), together accounting for 62.6% of all Rural Valley borough residents.
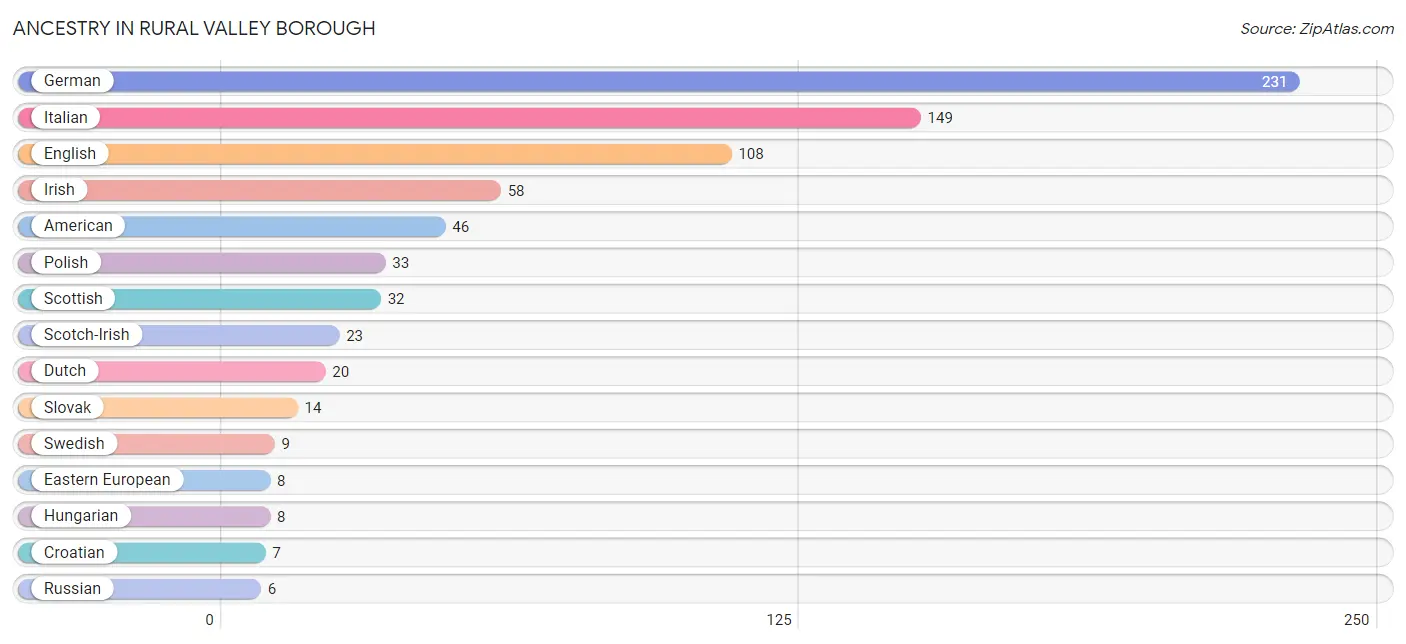
| Ancestry | # Population | % Population |
| American | 46 | 4.9% |
| Austrian | 3 | 0.3% |
| Cherokee | 1 | 0.1% |
| Croatian | 7 | 0.7% |
| Cuban | 3 | 0.3% |
| Dutch | 20 | 2.1% |
| Eastern European | 8 | 0.9% |
| English | 108 | 11.4% |
| European | 3 | 0.3% |
| French | 3 | 0.3% |
| German | 231 | 24.4% |
| Greek | 3 | 0.3% |
| Hungarian | 8 | 0.9% |
| Irish | 58 | 6.1% |
| Iroquois | 1 | 0.1% |
| Italian | 149 | 15.8% |
| Pennsylvania German | 3 | 0.3% |
| Polish | 33 | 3.5% |
| Russian | 6 | 0.6% |
| Scotch-Irish | 23 | 2.4% |
| Scottish | 32 | 3.4% |
| Slovak | 14 | 1.5% |
| Swedish | 9 | 0.9% |
| Ukrainian | 6 | 0.6% | View All 24 Rows |
Immigrants in Rural Valley borough

| Immigration Origin | # Population | % Population | View All 0 Rows |
Sex and Age in Rural Valley borough
Sex and Age in Rural Valley borough
The most populous age groups in Rural Valley borough are 60 to 64 Years (93 | 19.2%) for men and 60 to 64 Years (70 | 15.2%) for women.
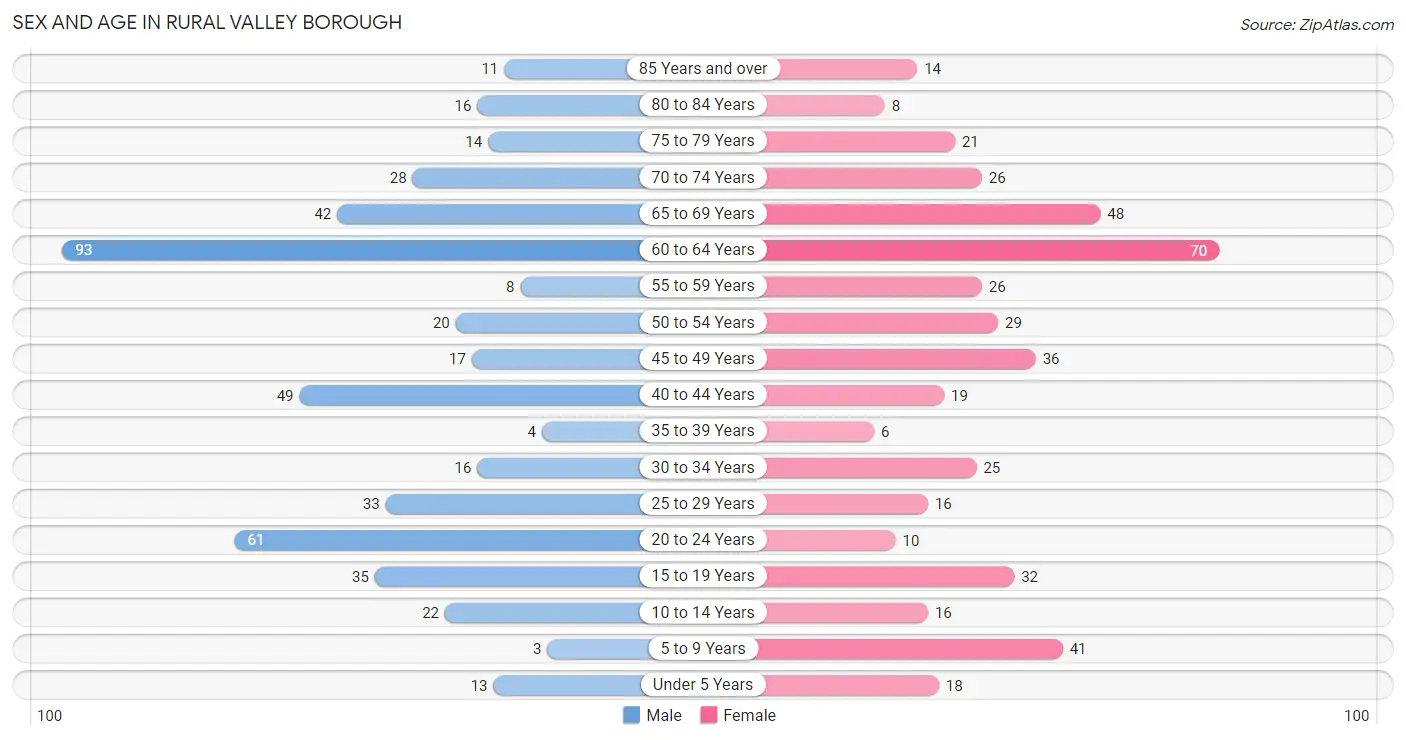
| Age Bracket | Male | Female |
| Under 5 Years | 13 (2.7%) | 18 (3.9%) |
| 5 to 9 Years | 3 (0.6%) | 41 (8.9%) |
| 10 to 14 Years | 22 (4.5%) | 16 (3.5%) |
| 15 to 19 Years | 35 (7.2%) | 32 (6.9%) |
| 20 to 24 Years | 61 (12.6%) | 10 (2.2%) |
| 25 to 29 Years | 33 (6.8%) | 16 (3.5%) |
| 30 to 34 Years | 16 (3.3%) | 25 (5.4%) |
| 35 to 39 Years | 4 (0.8%) | 6 (1.3%) |
| 40 to 44 Years | 49 (10.1%) | 19 (4.1%) |
| 45 to 49 Years | 17 (3.5%) | 36 (7.8%) |
| 50 to 54 Years | 20 (4.1%) | 29 (6.3%) |
| 55 to 59 Years | 8 (1.7%) | 26 (5.6%) |
| 60 to 64 Years | 93 (19.2%) | 70 (15.2%) |
| 65 to 69 Years | 42 (8.7%) | 48 (10.4%) |
| 70 to 74 Years | 28 (5.8%) | 26 (5.6%) |
| 75 to 79 Years | 14 (2.9%) | 21 (4.6%) |
| 80 to 84 Years | 16 (3.3%) | 8 (1.7%) |
| 85 Years and over | 11 (2.3%) | 14 (3.0%) |
| Total | 485 (100.0%) | 461 (100.0%) |
Families and Households in Rural Valley borough
Median Family Size in Rural Valley borough
The median family size in Rural Valley borough is 2.86 persons per family, with married-couple families (230 | 84.9%) accounting for the largest median family size of 2.94 persons per family. On the other hand, single male/father families (10 | 3.7%) represent the smallest median family size with 2.10 persons per family.
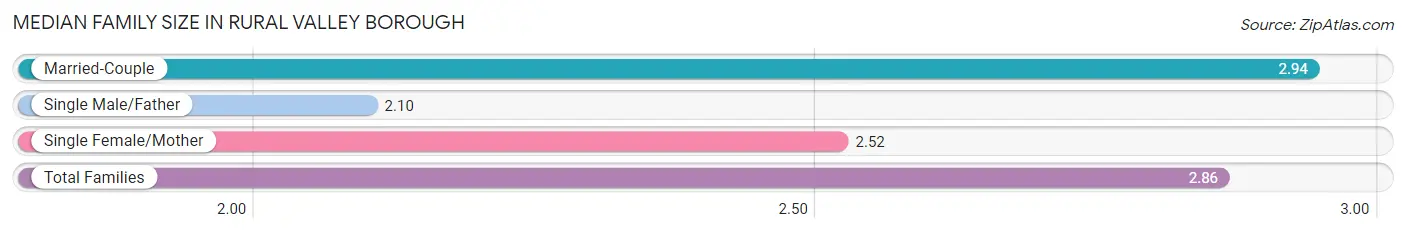
| Family Type | # Families | Family Size |
| Married-Couple | 230 (84.9%) | 2.94 |
| Single Male/Father | 10 (3.7%) | 2.10 |
| Single Female/Mother | 31 (11.4%) | 2.52 |
| Total Families | 271 (100.0%) | 2.86 |
Median Household Size in Rural Valley borough
The median household size in Rural Valley borough is 2.46 persons per household, with single female/mother households (31 | 8.1%) accounting for the largest median household size of 3 persons per household. non-family households (111 | 29.1%) represent the smallest median household size with 1.29 persons per household.
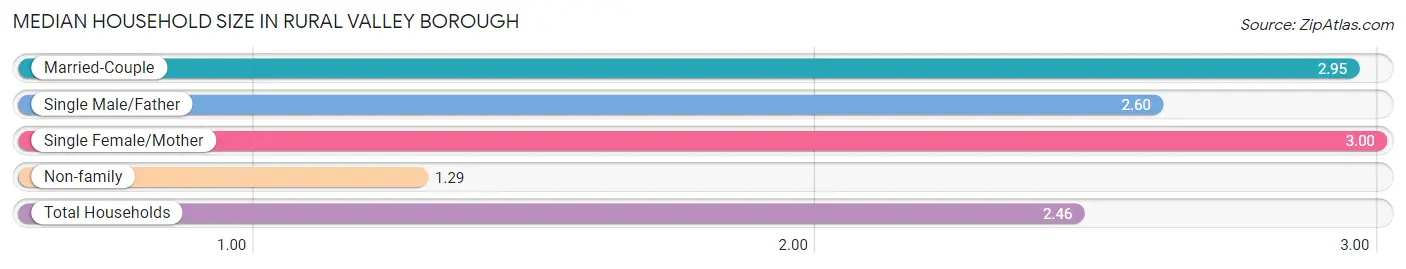
| Household Type | # Households | Household Size |
| Married-Couple | 230 (60.2%) | 2.95 |
| Single Male/Father | 10 (2.6%) | 2.60 |
| Single Female/Mother | 31 (8.1%) | 3.00 |
| Non-family | 111 (29.1%) | 1.29 |
| Total Households | 382 (100.0%) | 2.46 |
Household Size by Marriage Status in Rural Valley borough
Out of a total of 382 households in Rural Valley borough, 271 (70.9%) are family households, while 111 (29.1%) are nonfamily households. The most numerous type of family households are 2-person households, comprising 157, and the most common type of nonfamily households are 1-person households, comprising 91.
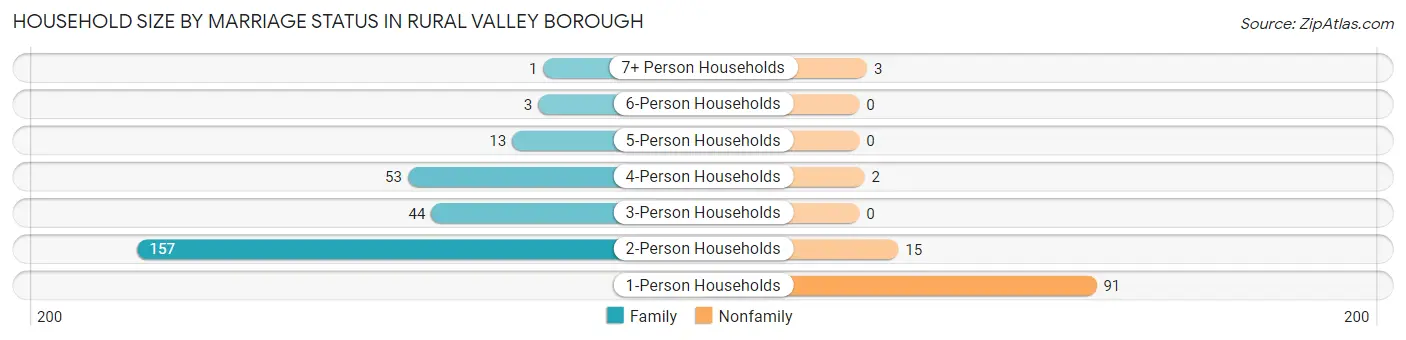
| Household Size | Family Households | Nonfamily Households |
| 1-Person Households | - | 91 (23.8%) |
| 2-Person Households | 157 (41.1%) | 15 (3.9%) |
| 3-Person Households | 44 (11.5%) | 0 (0.0%) |
| 4-Person Households | 53 (13.9%) | 2 (0.5%) |
| 5-Person Households | 13 (3.4%) | 0 (0.0%) |
| 6-Person Households | 3 (0.8%) | 0 (0.0%) |
| 7+ Person Households | 1 (0.3%) | 3 (0.8%) |
| Total | 271 (70.9%) | 111 (29.1%) |
Female Fertility in Rural Valley borough
Fertility by Age in Rural Valley borough
Average fertility rate in Rural Valley borough is 124.0 births per 1,000 women. Women in the age bracket of 20 to 34 years have the highest fertility rate with 392.0 births per 1,000 women. Women in the age bracket of 20 to 34 years acount for 100.0% of all women with births.
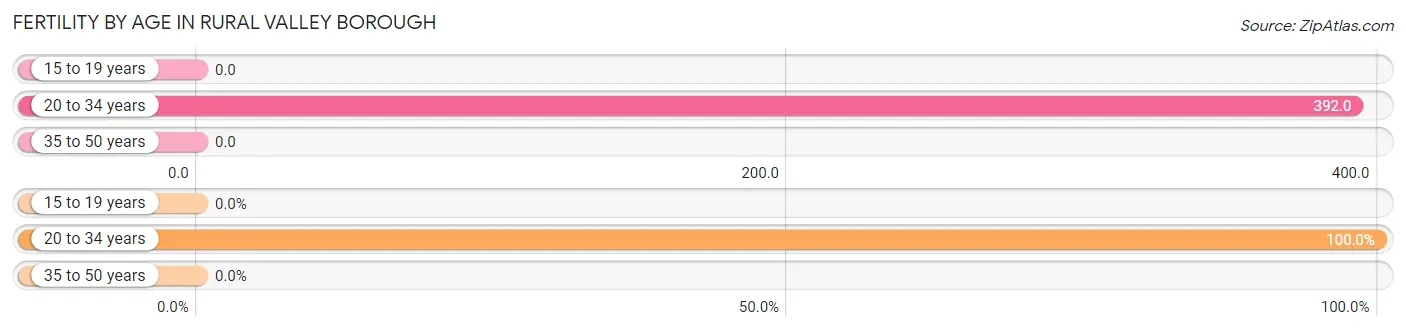
| Age Bracket | Women with Births | Births / 1,000 Women |
| 15 to 19 years | 0 (0.0%) | 0.0 |
| 20 to 34 years | 20 (100.0%) | 392.0 |
| 35 to 50 years | 0 (0.0%) | 0.0 |
| Total | 20 (100.0%) | 124.0 |
Fertility by Age by Marriage Status in Rural Valley borough
65.0% of women with births (20) in Rural Valley borough are married. The highest percentage of unmarried women with births falls into 20 to 34 years age bracket with 35.0% of them unmarried at the time of birth, while the lowest percentage of unmarried women with births belong to 20 to 34 years age bracket with 35.0% of them unmarried.
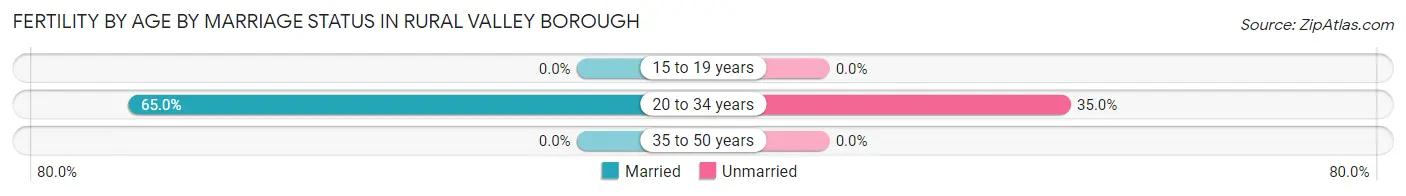
| Age Bracket | Married | Unmarried |
| 15 to 19 years | 0 (0.0%) | 0 (0.0%) |
| 20 to 34 years | 13 (65.0%) | 7 (35.0%) |
| 35 to 50 years | 0 (0.0%) | 0 (0.0%) |
| Total | 13 (65.0%) | 7 (35.0%) |
Fertility by Education in Rural Valley borough
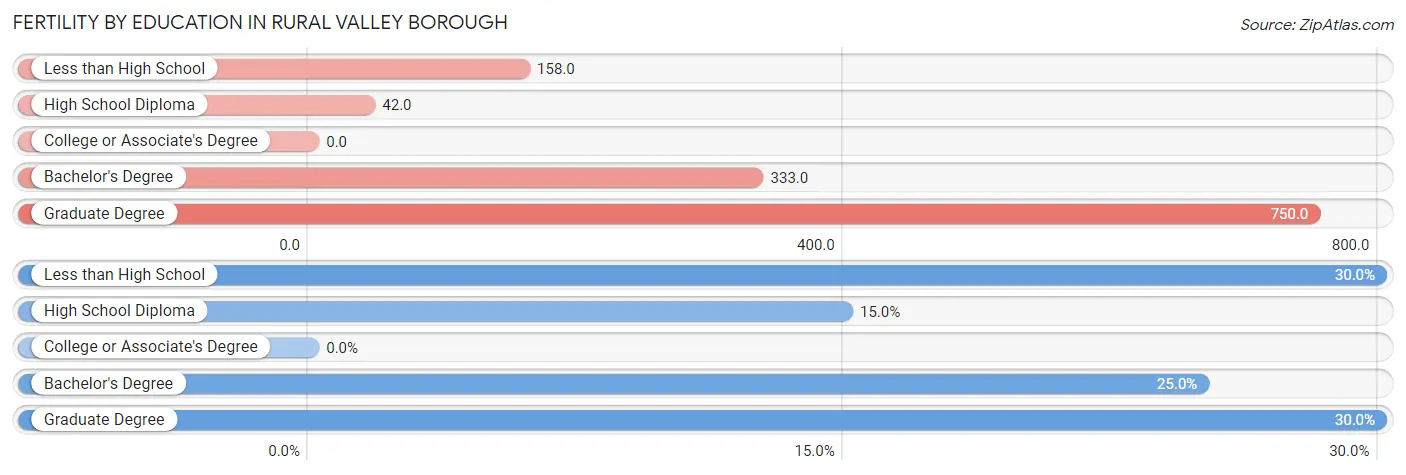
| Educational Attainment | Women with Births | Births / 1,000 Women |
| Less than High School | 6 (30.0%) | 158.0 |
| High School Diploma | 3 (15.0%) | 42.0 |
| College or Associate's Degree | 0 (0.0%) | 0.0 |
| Bachelor's Degree | 5 (25.0%) | 333.0 |
| Graduate Degree | 6 (30.0%) | 750.0 |
| Total | 20 (100.0%) | 124.0 |
Fertility by Education by Marriage Status in Rural Valley borough
35.0% of women with births in Rural Valley borough are unmarried. Women with the educational attainment of bachelor's degree are most likely to be married with 100.0% of them married at childbirth, while women with the educational attainment of less than high school are least likely to be married with 100.0% of them unmarried at childbirth.
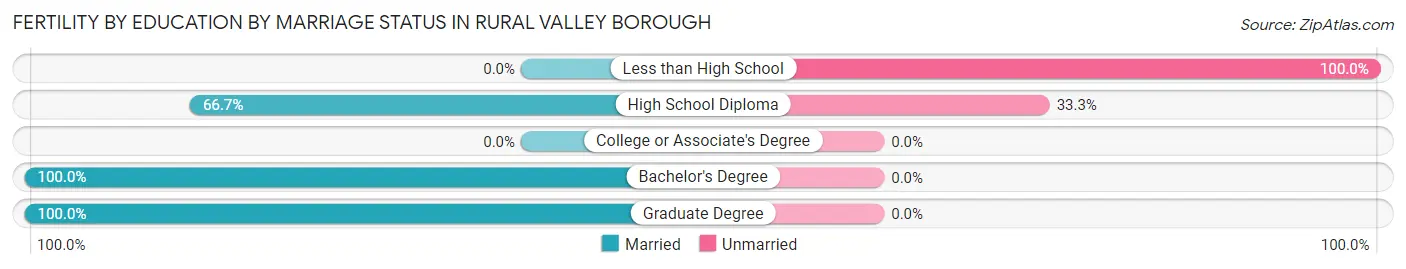
| Educational Attainment | Married | Unmarried |
| Less than High School | 0 (0.0%) | 6 (100.0%) |
| High School Diploma | 2 (66.7%) | 1 (33.3%) |
| College or Associate's Degree | 0 (0.0%) | 0 (0.0%) |
| Bachelor's Degree | 5 (100.0%) | 0 (0.0%) |
| Graduate Degree | 6 (100.0%) | 0 (0.0%) |
| Total | 13 (65.0%) | 7 (35.0%) |
Employment Characteristics in Rural Valley borough
Employment by Class of Employer in Rural Valley borough
Among the 381 employed individuals in Rural Valley borough, private company employees (267 | 70.1%), not-for-profit organizations (46 | 12.1%), and state government employees (20 | 5.2%) make up the most common classes of employment.
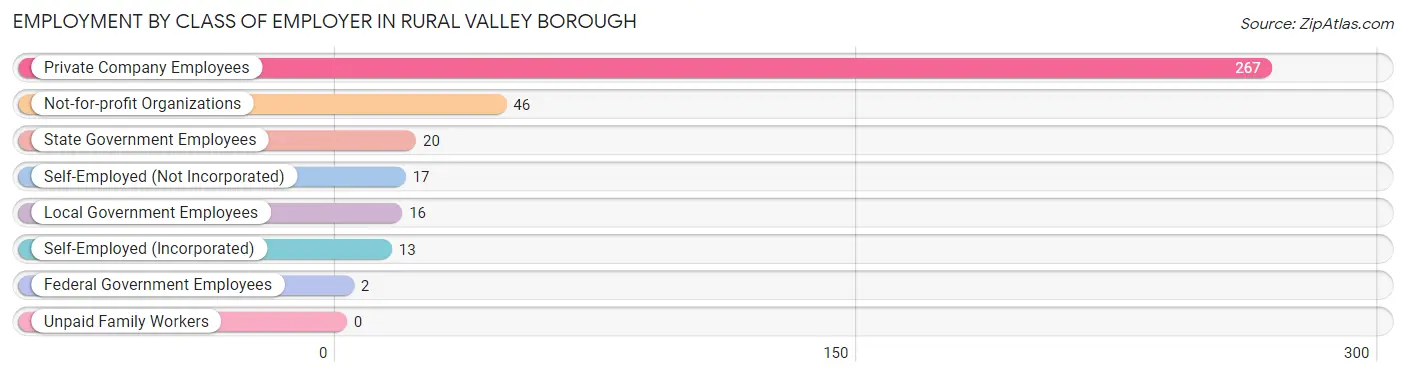
| Employer Class | # Employees | % Employees |
| Private Company Employees | 267 | 70.1% |
| Self-Employed (Incorporated) | 13 | 3.4% |
| Self-Employed (Not Incorporated) | 17 | 4.5% |
| Not-for-profit Organizations | 46 | 12.1% |
| Local Government Employees | 16 | 4.2% |
| State Government Employees | 20 | 5.2% |
| Federal Government Employees | 2 | 0.5% |
| Unpaid Family Workers | 0 | 0.0% |
| Total | 381 | 100.0% |
Employment Status by Age in Rural Valley borough
According to the labor force statistics for Rural Valley borough, out of the total population over 16 years of age (823), 53.6% or 441 individuals are in the labor force, with 12.5% or 55 of them unemployed. The age group with the highest labor force participation rate is 25 to 29 years, with 89.8% or 44 individuals in the labor force. Within the labor force, the 60 to 64 years age range has the highest percentage of unemployed individuals, with 37.9% or 36 of them being unemployed.
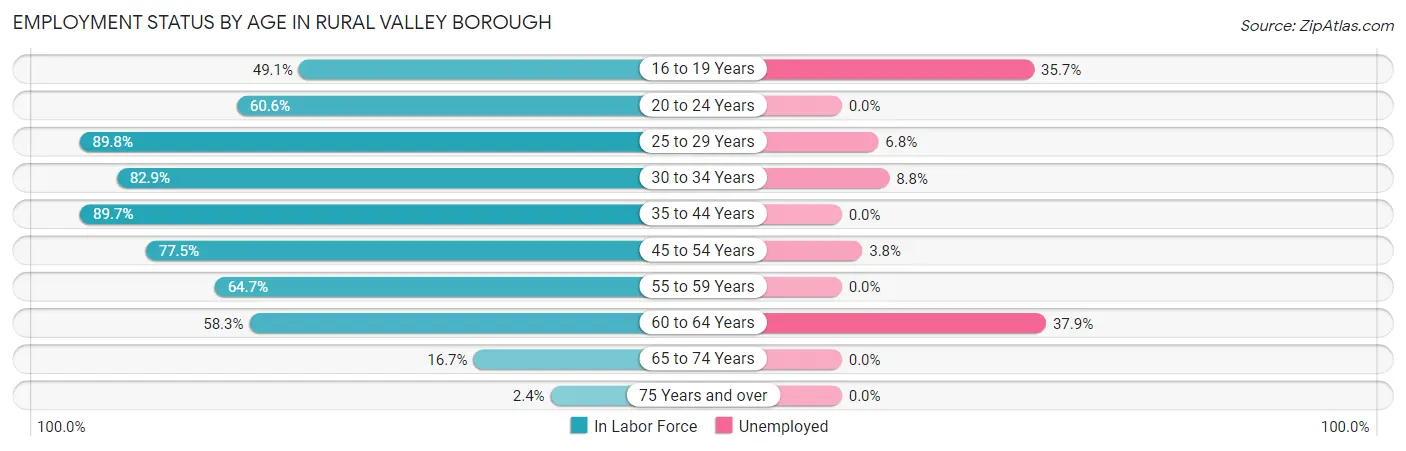
| Age Bracket | In Labor Force | Unemployed |
| 16 to 19 Years | 28 (49.1%) | 10 (35.7%) |
| 20 to 24 Years | 43 (60.6%) | 0 (0.0%) |
| 25 to 29 Years | 44 (89.8%) | 3 (6.8%) |
| 30 to 34 Years | 34 (82.9%) | 3 (8.8%) |
| 35 to 44 Years | 70 (89.7%) | 0 (0.0%) |
| 45 to 54 Years | 79 (77.5%) | 3 (3.8%) |
| 55 to 59 Years | 22 (64.7%) | 0 (0.0%) |
| 60 to 64 Years | 95 (58.3%) | 36 (37.9%) |
| 65 to 74 Years | 24 (16.7%) | 0 (0.0%) |
| 75 Years and over | 2 (2.4%) | 0 (0.0%) |
| Total | 441 (53.6%) | 55 (12.5%) |
Employment Status by Educational Attainment in Rural Valley borough
According to labor force statistics for Rural Valley borough, 73.7% of individuals (344) out of the total population between 25 and 64 years of age (467) are in the labor force, with 13.1% or 45 of them being unemployed. The group with the highest labor force participation rate are those with the educational attainment of bachelor's degree or higher, with 95.9% or 70 individuals in the labor force. Within the labor force, individuals with high school diploma education have the highest percentage of unemployment, with 21.2% or 39 of them being unemployed.
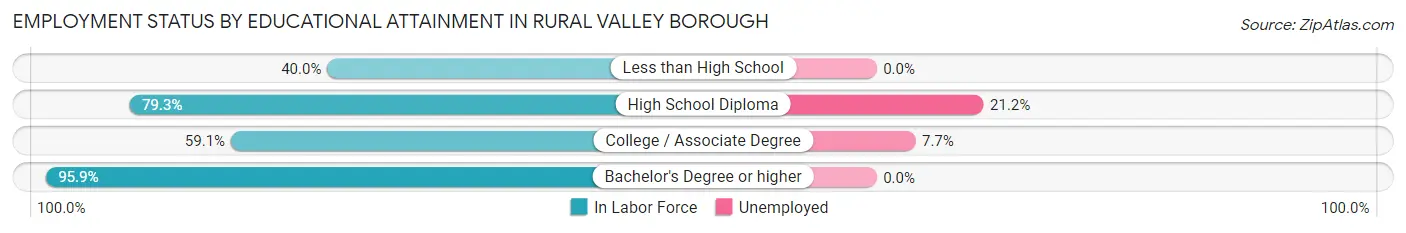
| Educational Attainment | In Labor Force | Unemployed |
| Less than High School | 12 (40.0%) | 0 (0.0%) |
| High School Diploma | 184 (79.3%) | 49 (21.2%) |
| College / Associate Degree | 78 (59.1%) | 10 (7.7%) |
| Bachelor's Degree or higher | 70 (95.9%) | 0 (0.0%) |
| Total | 344 (73.7%) | 61 (13.1%) |
Employment Occupations by Sex in Rural Valley borough
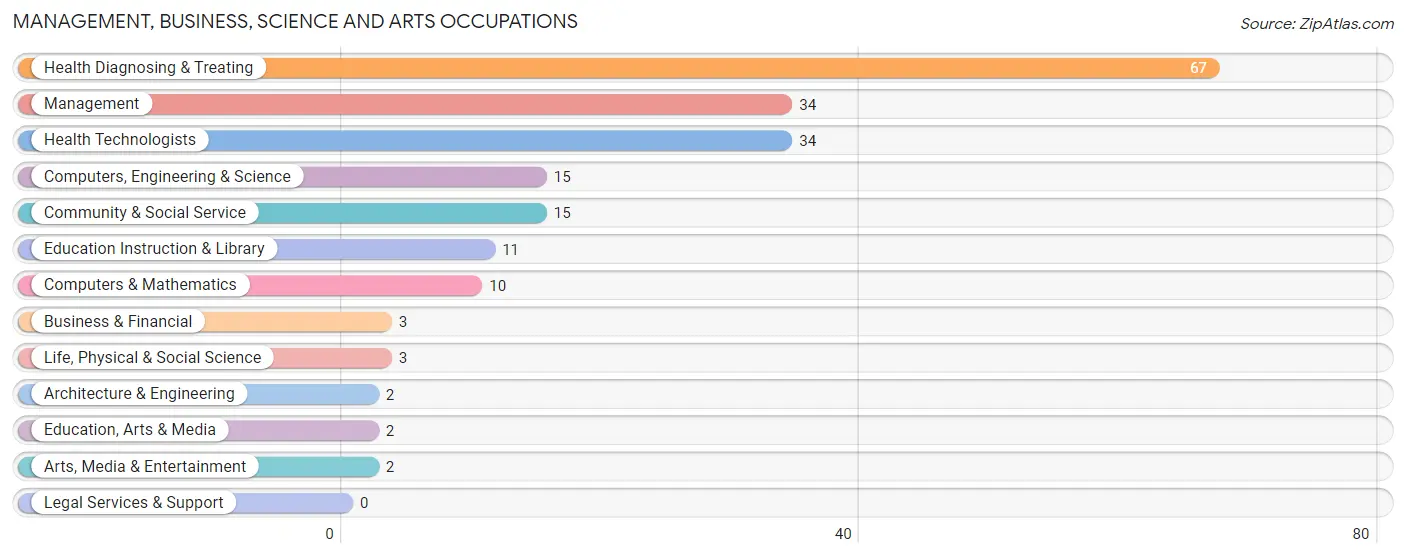
Management, Business, Science and Arts Occupations
The most common Management, Business, Science and Arts occupations in Rural Valley borough are Health Diagnosing & Treating (67 | 17.4%), Management (34 | 8.8%), Health Technologists (34 | 8.8%), Computers, Engineering & Science (15 | 3.9%), and Community & Social Service (15 | 3.9%).
Management, Business, Science and Arts Occupations by Sex
Within the Management, Business, Science and Arts occupations in Rural Valley borough, the most male-oriented occupations are Computers & Mathematics (100.0%), Life, Physical & Social Science (100.0%), and Arts, Media & Entertainment (100.0%), while the most female-oriented occupations are Business & Financial (100.0%), Architecture & Engineering (100.0%), and Education, Arts & Media (100.0%).
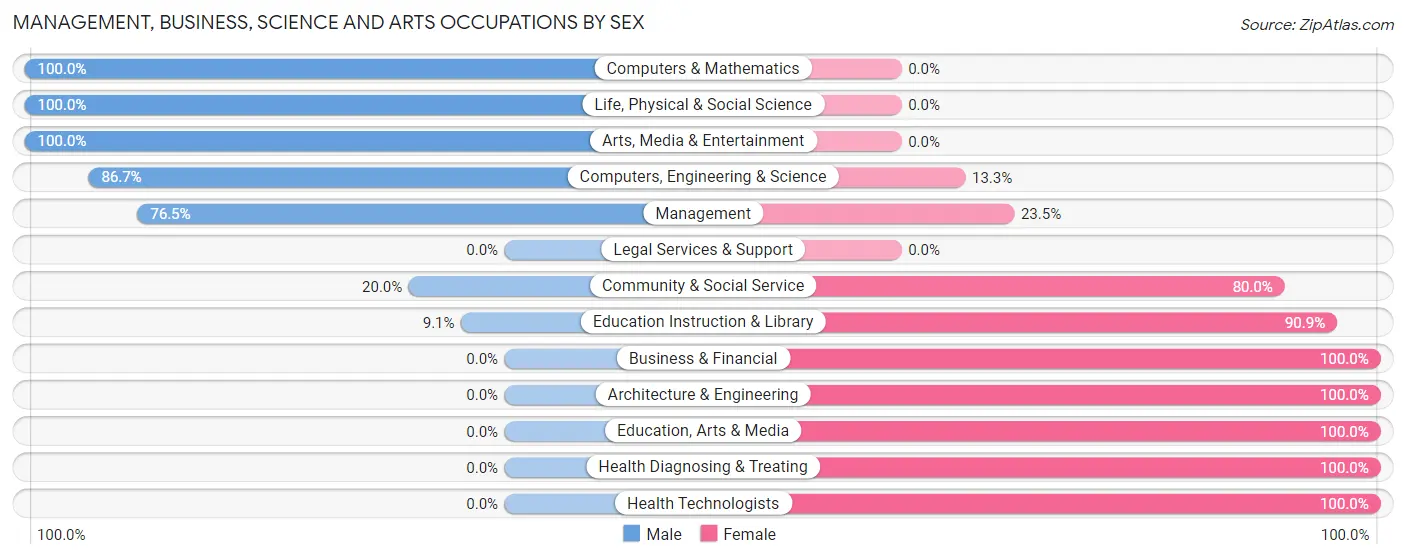
| Occupation | Male | Female |
| Management | 26 (76.5%) | 8 (23.5%) |
| Business & Financial | 0 (0.0%) | 3 (100.0%) |
| Computers, Engineering & Science | 13 (86.7%) | 2 (13.3%) |
| Computers & Mathematics | 10 (100.0%) | 0 (0.0%) |
| Architecture & Engineering | 0 (0.0%) | 2 (100.0%) |
| Life, Physical & Social Science | 3 (100.0%) | 0 (0.0%) |
| Community & Social Service | 3 (20.0%) | 12 (80.0%) |
| Education, Arts & Media | 0 (0.0%) | 2 (100.0%) |
| Legal Services & Support | 0 (0.0%) | 0 (0.0%) |
| Education Instruction & Library | 1 (9.1%) | 10 (90.9%) |
| Arts, Media & Entertainment | 2 (100.0%) | 0 (0.0%) |
| Health Diagnosing & Treating | 0 (0.0%) | 67 (100.0%) |
| Health Technologists | 0 (0.0%) | 34 (100.0%) |
| Total (Category) | 42 (31.3%) | 92 (68.7%) |
| Total (Overall) | 221 (57.3%) | 165 (42.7%) |
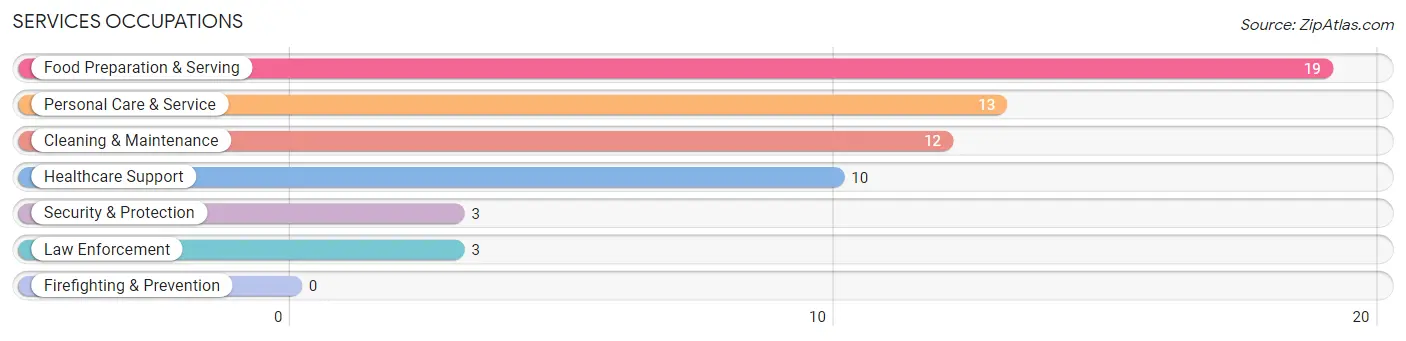
Services Occupations
The most common Services occupations in Rural Valley borough are Food Preparation & Serving (19 | 4.9%), Personal Care & Service (13 | 3.4%), Cleaning & Maintenance (12 | 3.1%), Healthcare Support (10 | 2.6%), and Security & Protection (3 | 0.8%).
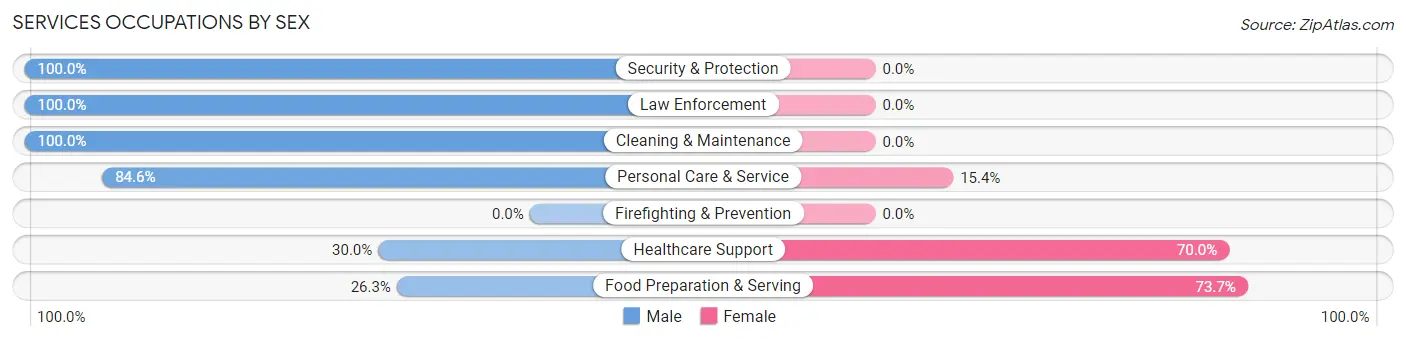
Services Occupations by Sex
Within the Services occupations in Rural Valley borough, the most male-oriented occupations are Security & Protection (100.0%), Law Enforcement (100.0%), and Cleaning & Maintenance (100.0%), while the most female-oriented occupations are Food Preparation & Serving (73.7%), Healthcare Support (70.0%), and Personal Care & Service (15.4%).
| Occupation | Male | Female |
| Healthcare Support | 3 (30.0%) | 7 (70.0%) |
| Security & Protection | 3 (100.0%) | 0 (0.0%) |
| Firefighting & Prevention | 0 (0.0%) | 0 (0.0%) |
| Law Enforcement | 3 (100.0%) | 0 (0.0%) |
| Food Preparation & Serving | 5 (26.3%) | 14 (73.7%) |
| Cleaning & Maintenance | 12 (100.0%) | 0 (0.0%) |
| Personal Care & Service | 11 (84.6%) | 2 (15.4%) |
| Total (Category) | 34 (59.7%) | 23 (40.4%) |
| Total (Overall) | 221 (57.3%) | 165 (42.7%) |
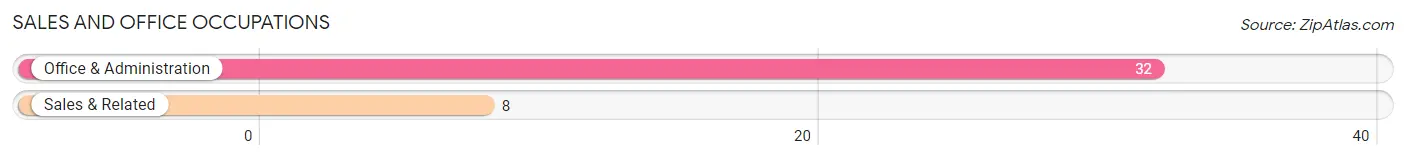
Sales and Office Occupations
The most common Sales and Office occupations in Rural Valley borough are Office & Administration (32 | 8.3%), and Sales & Related (8 | 2.1%).
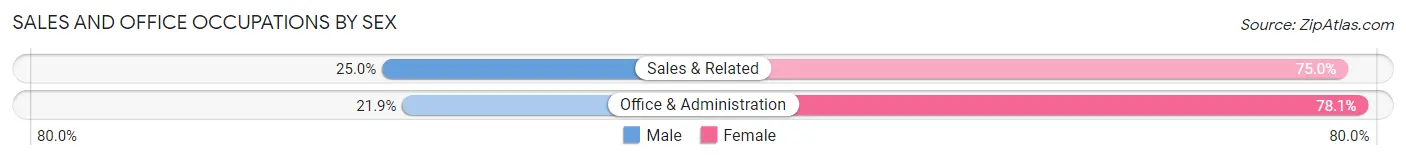
Sales and Office Occupations by Sex
| Occupation | Male | Female |
| Sales & Related | 2 (25.0%) | 6 (75.0%) |
| Office & Administration | 7 (21.9%) | 25 (78.1%) |
| Total (Category) | 9 (22.5%) | 31 (77.5%) |
| Total (Overall) | 221 (57.3%) | 165 (42.7%) |
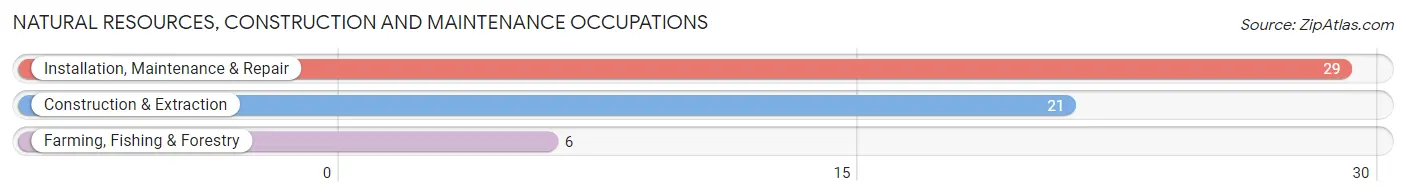
Natural Resources, Construction and Maintenance Occupations
The most common Natural Resources, Construction and Maintenance occupations in Rural Valley borough are Installation, Maintenance & Repair (29 | 7.5%), Construction & Extraction (21 | 5.4%), and Farming, Fishing & Forestry (6 | 1.5%).
Natural Resources, Construction and Maintenance Occupations by Sex
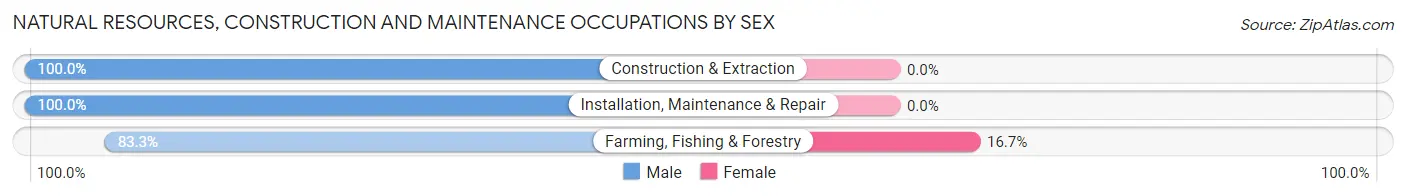
| Occupation | Male | Female |
| Farming, Fishing & Forestry | 5 (83.3%) | 1 (16.7%) |
| Construction & Extraction | 21 (100.0%) | 0 (0.0%) |
| Installation, Maintenance & Repair | 29 (100.0%) | 0 (0.0%) |
| Total (Category) | 55 (98.2%) | 1 (1.8%) |
| Total (Overall) | 221 (57.3%) | 165 (42.7%) |
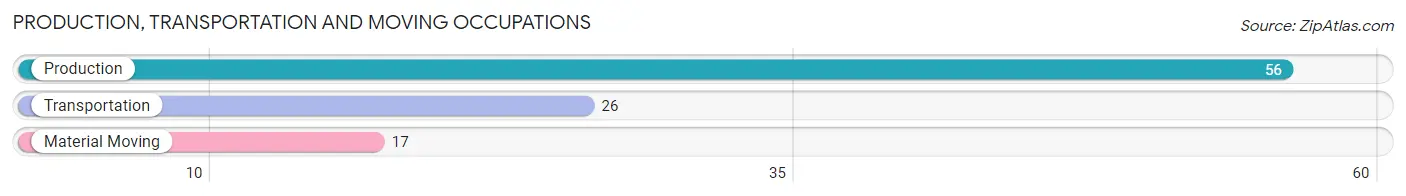
Production, Transportation and Moving Occupations
The most common Production, Transportation and Moving occupations in Rural Valley borough are Production (56 | 14.5%), Transportation (26 | 6.7%), and Material Moving (17 | 4.4%).
Production, Transportation and Moving Occupations by Sex
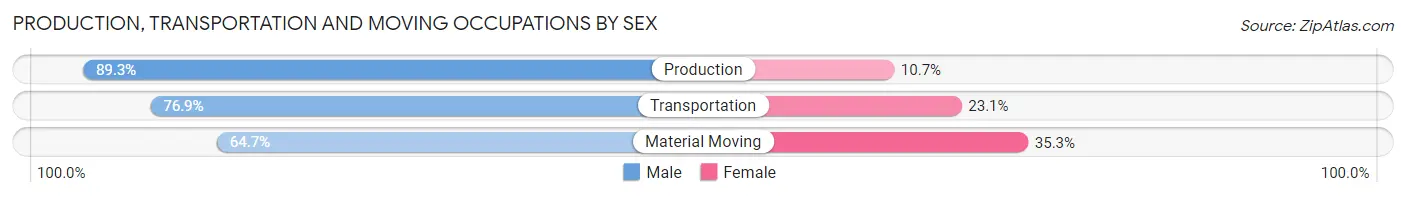
| Occupation | Male | Female |
| Production | 50 (89.3%) | 6 (10.7%) |
| Transportation | 20 (76.9%) | 6 (23.1%) |
| Material Moving | 11 (64.7%) | 6 (35.3%) |
| Total (Category) | 81 (81.8%) | 18 (18.2%) |
| Total (Overall) | 221 (57.3%) | 165 (42.7%) |
Employment Industries by Sex in Rural Valley borough
Employment Industries in Rural Valley borough
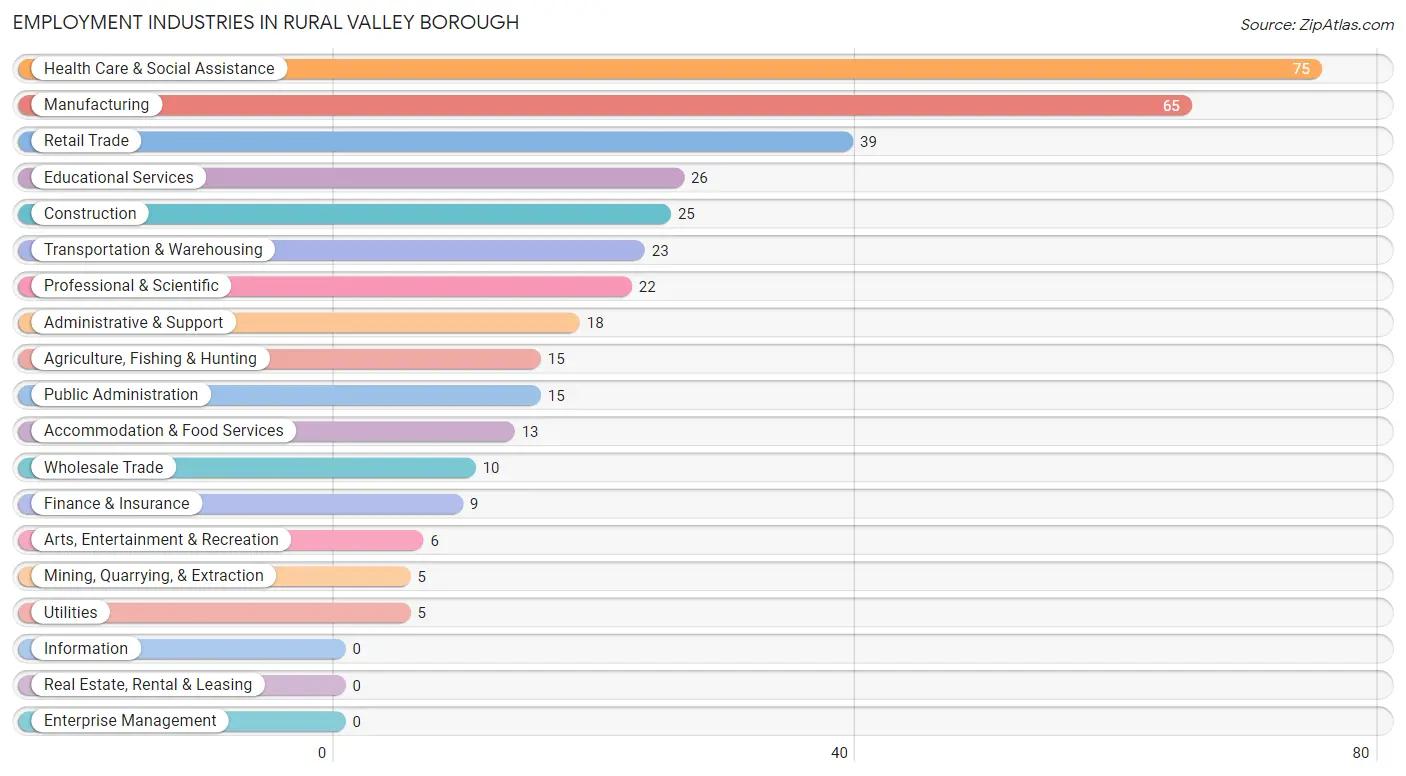
The major employment industries in Rural Valley borough include Health Care & Social Assistance (75 | 19.4%), Manufacturing (65 | 16.8%), Retail Trade (39 | 10.1%), Educational Services (26 | 6.7%), and Construction (25 | 6.5%).
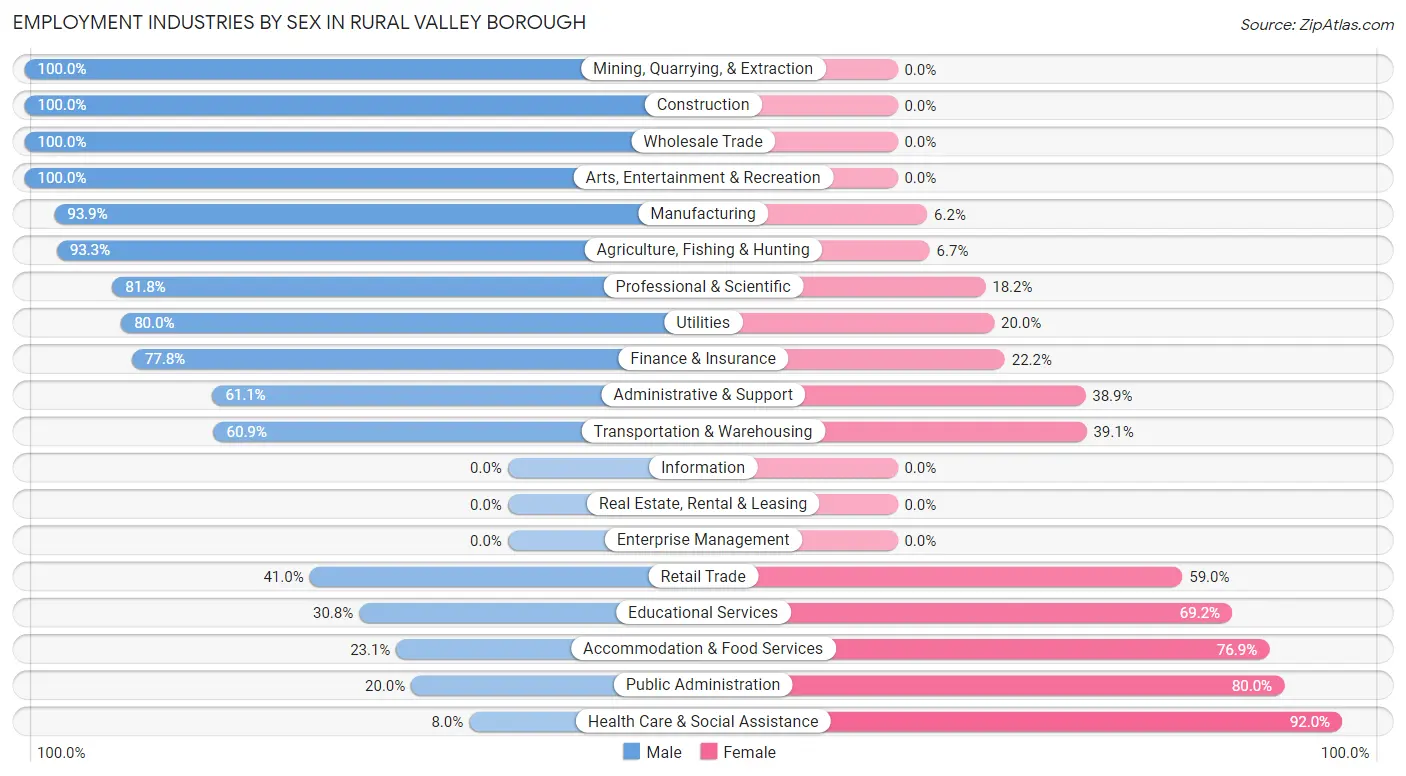
Employment Industries by Sex in Rural Valley borough
The Rural Valley borough industries that see more men than women are Mining, Quarrying, & Extraction (100.0%), Construction (100.0%), and Wholesale Trade (100.0%), whereas the industries that tend to have a higher number of women are Health Care & Social Assistance (92.0%), Public Administration (80.0%), and Accommodation & Food Services (76.9%).
| Industry | Male | Female |
| Agriculture, Fishing & Hunting | 14 (93.3%) | 1 (6.7%) |
| Mining, Quarrying, & Extraction | 5 (100.0%) | 0 (0.0%) |
| Construction | 25 (100.0%) | 0 (0.0%) |
| Manufacturing | 61 (93.9%) | 4 (6.1%) |
| Wholesale Trade | 10 (100.0%) | 0 (0.0%) |
| Retail Trade | 16 (41.0%) | 23 (59.0%) |
| Transportation & Warehousing | 14 (60.9%) | 9 (39.1%) |
| Utilities | 4 (80.0%) | 1 (20.0%) |
| Information | 0 (0.0%) | 0 (0.0%) |
| Finance & Insurance | 7 (77.8%) | 2 (22.2%) |
| Real Estate, Rental & Leasing | 0 (0.0%) | 0 (0.0%) |
| Professional & Scientific | 18 (81.8%) | 4 (18.2%) |
| Enterprise Management | 0 (0.0%) | 0 (0.0%) |
| Administrative & Support | 11 (61.1%) | 7 (38.9%) |
| Educational Services | 8 (30.8%) | 18 (69.2%) |
| Health Care & Social Assistance | 6 (8.0%) | 69 (92.0%) |
| Arts, Entertainment & Recreation | 6 (100.0%) | 0 (0.0%) |
| Accommodation & Food Services | 3 (23.1%) | 10 (76.9%) |
| Public Administration | 3 (20.0%) | 12 (80.0%) |
| Total | 221 (57.3%) | 165 (42.7%) |
Education in Rural Valley borough
School Enrollment in Rural Valley borough
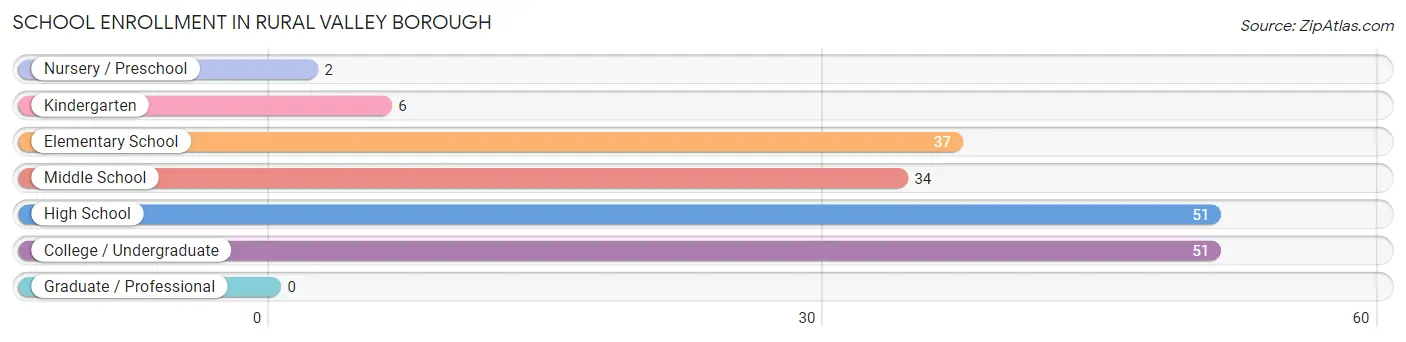
The most common levels of schooling among the 181 students in Rural Valley borough are high school (51 | 28.2%), college / undergraduate (51 | 28.2%), and elementary school (37 | 20.4%).
| School Level | # Students | % Students |
| Nursery / Preschool | 2 | 1.1% |
| Kindergarten | 6 | 3.3% |
| Elementary School | 37 | 20.4% |
| Middle School | 34 | 18.8% |
| High School | 51 | 28.2% |
| College / Undergraduate | 51 | 28.2% |
| Graduate / Professional | 0 | 0.0% |
| Total | 181 | 100.0% |
School Enrollment by Age by Funding Source in Rural Valley borough
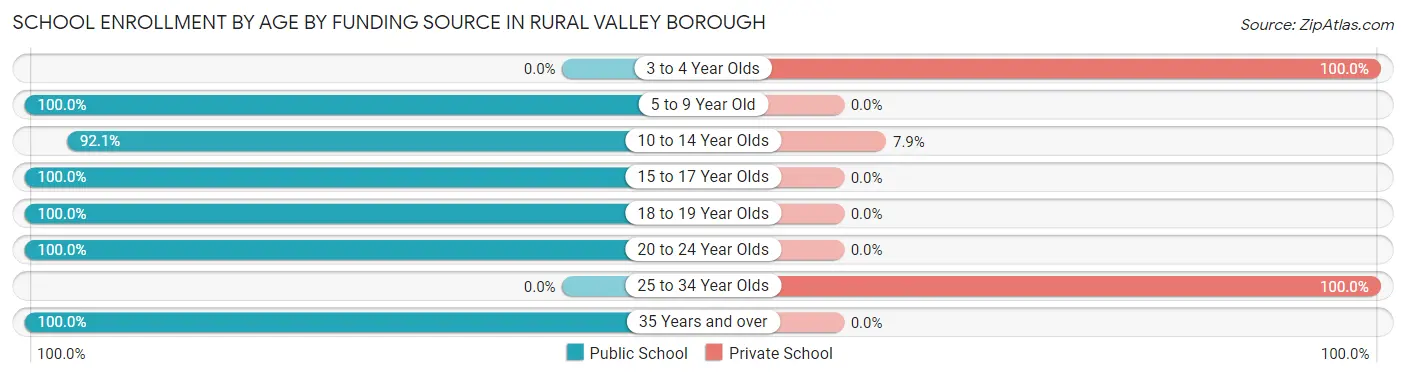
Out of a total of 181 students who are enrolled in schools in Rural Valley borough, 8 (4.4%) attend a private institution, while the remaining 173 (95.6%) are enrolled in public schools. The age group of 3 to 4 year olds has the highest likelihood of being enrolled in private schools, with 2 (100.0% in the age bracket) enrolled. Conversely, the age group of 5 to 9 year old has the lowest likelihood of being enrolled in a private school, with 41 (100.0% in the age bracket) attending a public institution.
| Age Bracket | Public School | Private School |
| 3 to 4 Year Olds | 0 (0.0%) | 2 (100.0%) |
| 5 to 9 Year Old | 41 (100.0%) | 0 (0.0%) |
| 10 to 14 Year Olds | 35 (92.1%) | 3 (7.9%) |
| 15 to 17 Year Olds | 42 (100.0%) | 0 (0.0%) |
| 18 to 19 Year Olds | 10 (100.0%) | 0 (0.0%) |
| 20 to 24 Year Olds | 41 (100.0%) | 0 (0.0%) |
| 25 to 34 Year Olds | 0 (0.0%) | 3 (100.0%) |
| 35 Years and over | 4 (100.0%) | 0 (0.0%) |
| Total | 173 (95.6%) | 8 (4.4%) |
Educational Attainment by Field of Study in Rural Valley borough
Education (37 | 30.8%), business (20 | 16.7%), science & technology (18 | 15.0%), social sciences (11 | 9.2%), and physical & health sciences (9 | 7.5%) are the most common fields of study among 120 individuals in Rural Valley borough who have obtained a bachelor's degree or higher.
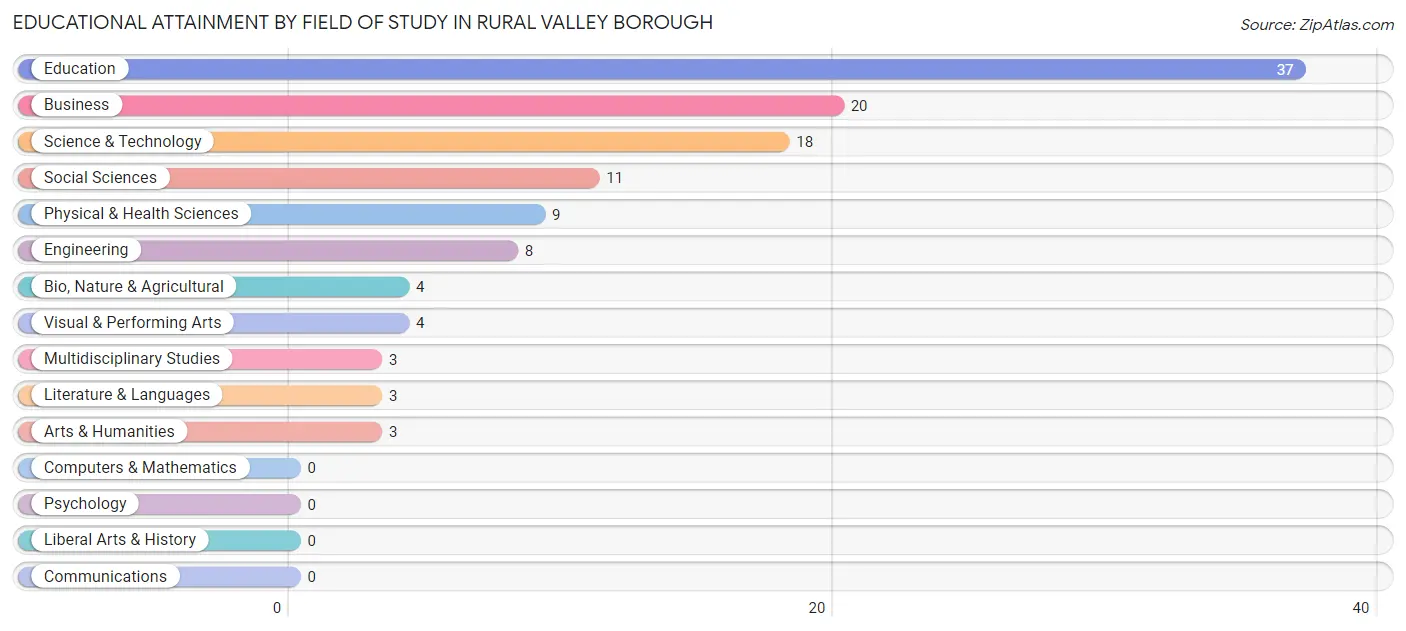
| Field of Study | # Graduates | % Graduates |
| Computers & Mathematics | 0 | 0.0% |
| Bio, Nature & Agricultural | 4 | 3.3% |
| Physical & Health Sciences | 9 | 7.5% |
| Psychology | 0 | 0.0% |
| Social Sciences | 11 | 9.2% |
| Engineering | 8 | 6.7% |
| Multidisciplinary Studies | 3 | 2.5% |
| Science & Technology | 18 | 15.0% |
| Business | 20 | 16.7% |
| Education | 37 | 30.8% |
| Literature & Languages | 3 | 2.5% |
| Liberal Arts & History | 0 | 0.0% |
| Visual & Performing Arts | 4 | 3.3% |
| Communications | 0 | 0.0% |
| Arts & Humanities | 3 | 2.5% |
| Total | 120 | 100.0% |
Transportation & Commute in Rural Valley borough
Vehicle Availability by Sex in Rural Valley borough
The most prevalent vehicle ownership categories in Rural Valley borough are males with 2 vehicles (78, accounting for 35.6%) and females with 2 vehicles (65, making up 48.1%).
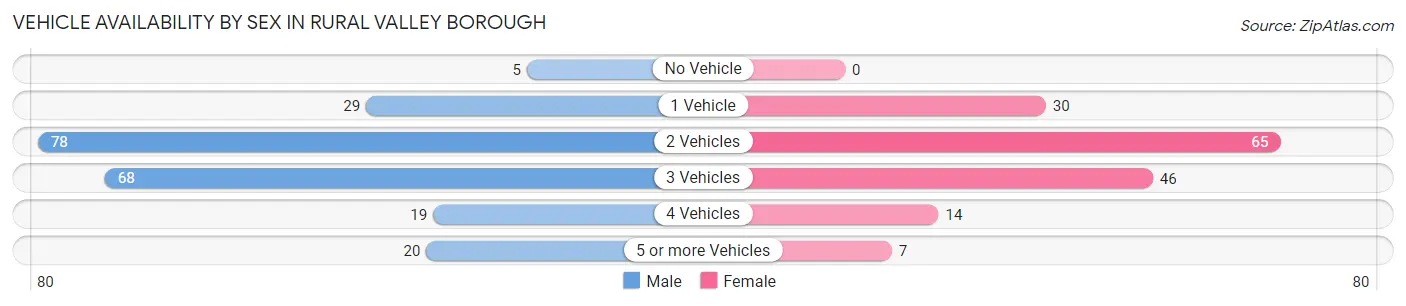
| Vehicles Available | Male | Female |
| No Vehicle | 5 (2.3%) | 0 (0.0%) |
| 1 Vehicle | 29 (13.2%) | 30 (18.5%) |
| 2 Vehicles | 78 (35.6%) | 65 (40.1%) |
| 3 Vehicles | 68 (31.0%) | 46 (28.4%) |
| 4 Vehicles | 19 (8.7%) | 14 (8.6%) |
| 5 or more Vehicles | 20 (9.1%) | 7 (4.3%) |
| Total | 219 (100.0%) | 162 (100.0%) |
Commute Time in Rural Valley borough
The most frequently occuring commute durations in Rural Valley borough are 45 to 59 minutes (78 commuters, 21.9%), 5 to 9 minutes (50 commuters, 14.0%), and 25 to 29 minutes (49 commuters, 13.8%).
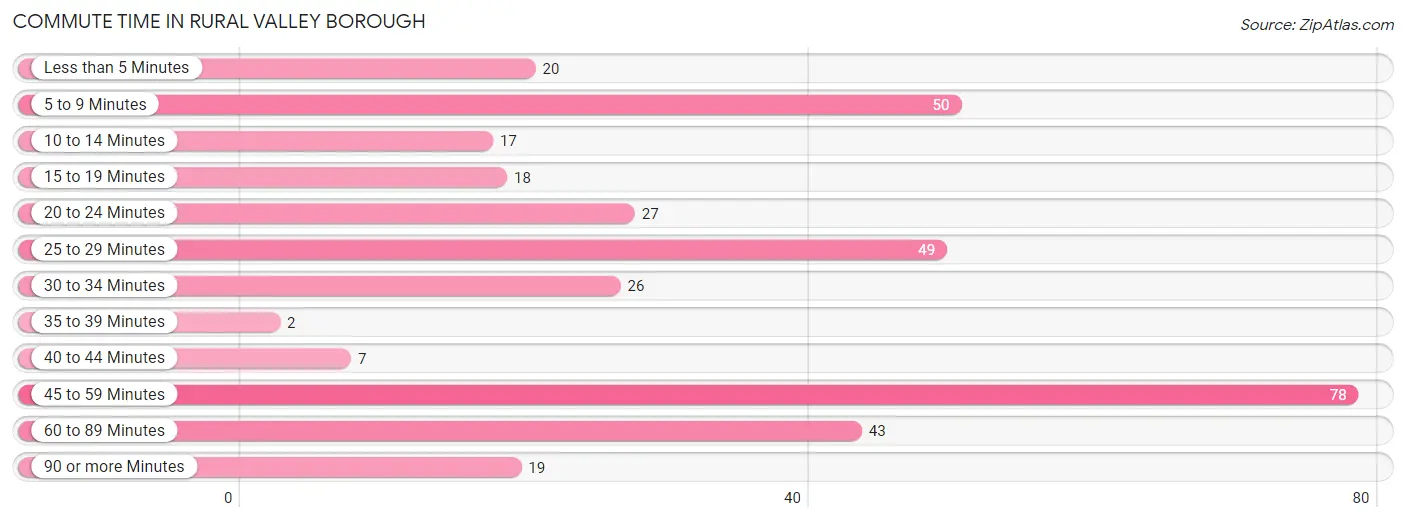
| Commute Time | # Commuters | % Commuters |
| Less than 5 Minutes | 20 | 5.6% |
| 5 to 9 Minutes | 50 | 14.0% |
| 10 to 14 Minutes | 17 | 4.8% |
| 15 to 19 Minutes | 18 | 5.1% |
| 20 to 24 Minutes | 27 | 7.6% |
| 25 to 29 Minutes | 49 | 13.8% |
| 30 to 34 Minutes | 26 | 7.3% |
| 35 to 39 Minutes | 2 | 0.6% |
| 40 to 44 Minutes | 7 | 2.0% |
| 45 to 59 Minutes | 78 | 21.9% |
| 60 to 89 Minutes | 43 | 12.1% |
| 90 or more Minutes | 19 | 5.3% |
Commute Time by Sex in Rural Valley borough
The most common commute times in Rural Valley borough are 45 to 59 minutes (73 commuters, 34.6%) for males and 25 to 29 minutes (41 commuters, 28.3%) for females.
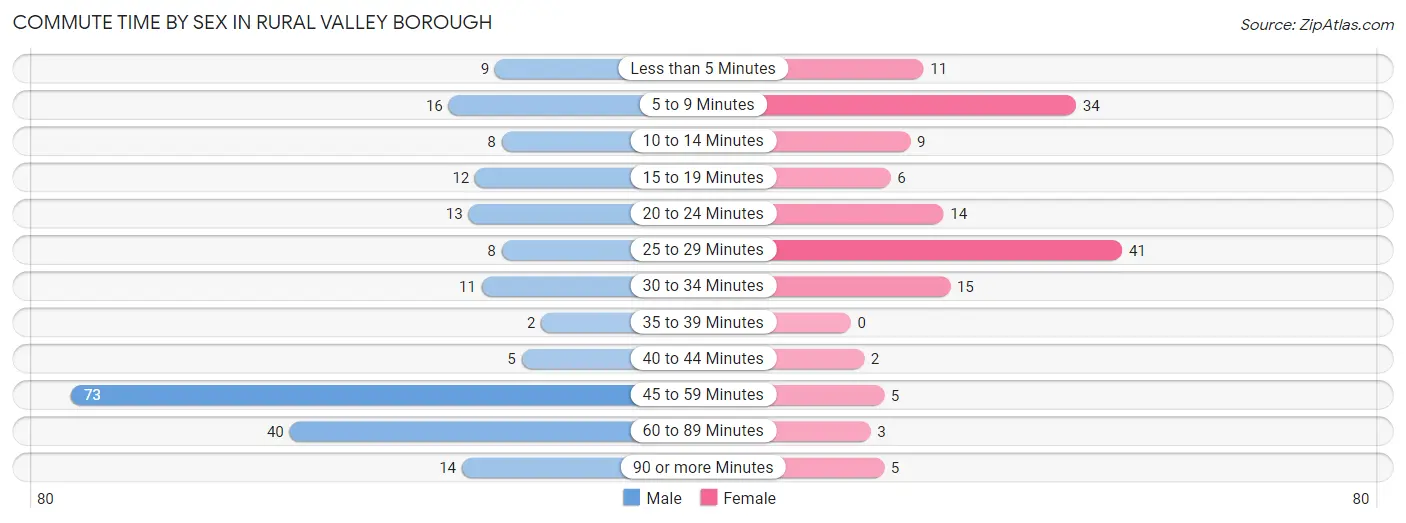
| Commute Time | Male | Female |
| Less than 5 Minutes | 9 (4.3%) | 11 (7.6%) |
| 5 to 9 Minutes | 16 (7.6%) | 34 (23.4%) |
| 10 to 14 Minutes | 8 (3.8%) | 9 (6.2%) |
| 15 to 19 Minutes | 12 (5.7%) | 6 (4.1%) |
| 20 to 24 Minutes | 13 (6.2%) | 14 (9.7%) |
| 25 to 29 Minutes | 8 (3.8%) | 41 (28.3%) |
| 30 to 34 Minutes | 11 (5.2%) | 15 (10.3%) |
| 35 to 39 Minutes | 2 (0.9%) | 0 (0.0%) |
| 40 to 44 Minutes | 5 (2.4%) | 2 (1.4%) |
| 45 to 59 Minutes | 73 (34.6%) | 5 (3.5%) |
| 60 to 89 Minutes | 40 (19.0%) | 3 (2.1%) |
| 90 or more Minutes | 14 (6.6%) | 5 (3.5%) |
Time of Departure to Work by Sex in Rural Valley borough
The most frequent times of departure to work in Rural Valley borough are 5:00 AM to 5:29 AM (32, 15.2%) for males and 7:00 AM to 7:29 AM (32, 22.1%) for females.
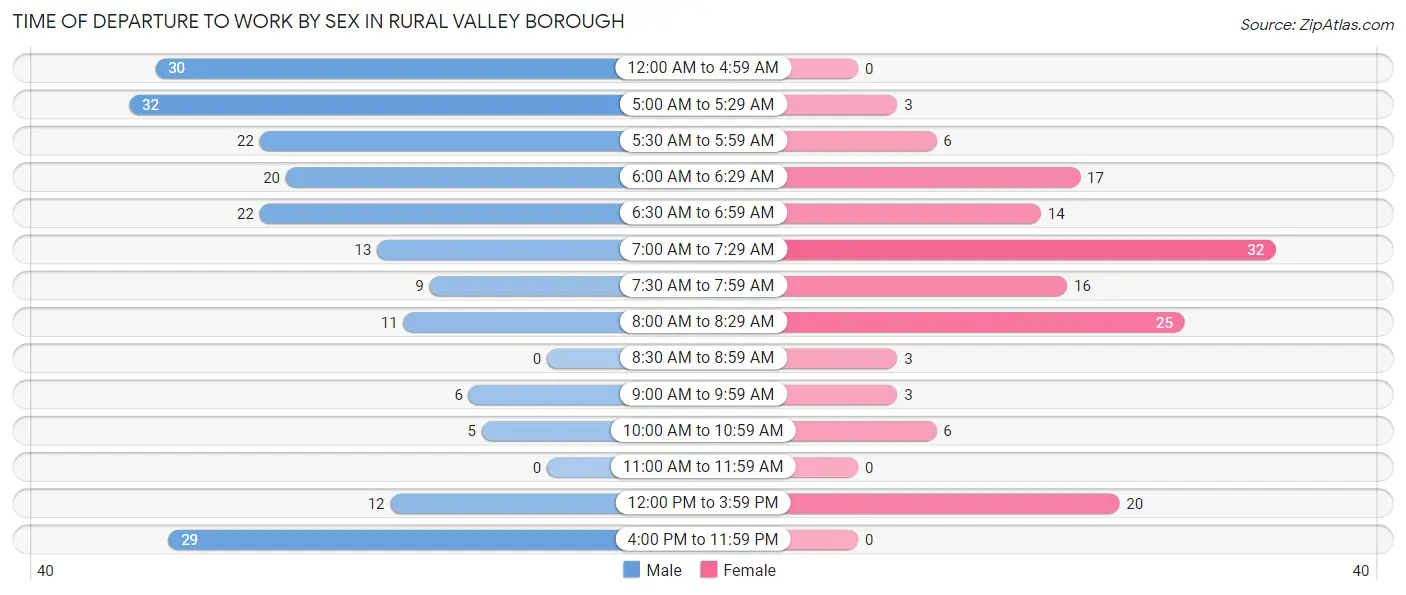
| Time of Departure | Male | Female |
| 12:00 AM to 4:59 AM | 30 (14.2%) | 0 (0.0%) |
| 5:00 AM to 5:29 AM | 32 (15.2%) | 3 (2.1%) |
| 5:30 AM to 5:59 AM | 22 (10.4%) | 6 (4.1%) |
| 6:00 AM to 6:29 AM | 20 (9.5%) | 17 (11.7%) |
| 6:30 AM to 6:59 AM | 22 (10.4%) | 14 (9.7%) |
| 7:00 AM to 7:29 AM | 13 (6.2%) | 32 (22.1%) |
| 7:30 AM to 7:59 AM | 9 (4.3%) | 16 (11.0%) |
| 8:00 AM to 8:29 AM | 11 (5.2%) | 25 (17.2%) |
| 8:30 AM to 8:59 AM | 0 (0.0%) | 3 (2.1%) |
| 9:00 AM to 9:59 AM | 6 (2.8%) | 3 (2.1%) |
| 10:00 AM to 10:59 AM | 5 (2.4%) | 6 (4.1%) |
| 11:00 AM to 11:59 AM | 0 (0.0%) | 0 (0.0%) |
| 12:00 PM to 3:59 PM | 12 (5.7%) | 20 (13.8%) |
| 4:00 PM to 11:59 PM | 29 (13.7%) | 0 (0.0%) |
| Total | 211 (100.0%) | 145 (100.0%) |
Housing Occupancy in Rural Valley borough
Occupancy by Ownership in Rural Valley borough
Of the total 382 dwellings in Rural Valley borough, owner-occupied units account for 277 (72.5%), while renter-occupied units make up 105 (27.5%).
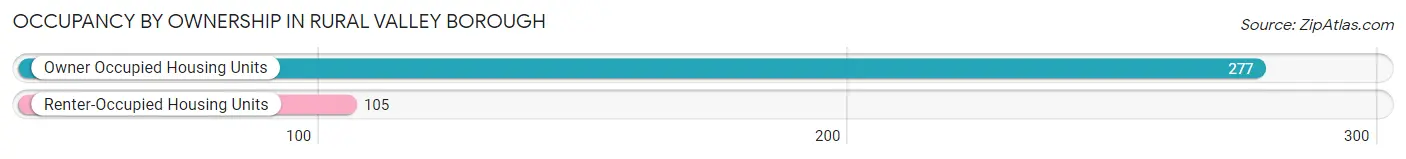
| Occupancy | # Housing Units | % Housing Units |
| Owner Occupied Housing Units | 277 | 72.5% |
| Renter-Occupied Housing Units | 105 | 27.5% |
| Total Occupied Housing Units | 382 | 100.0% |
Occupancy by Household Size in Rural Valley borough
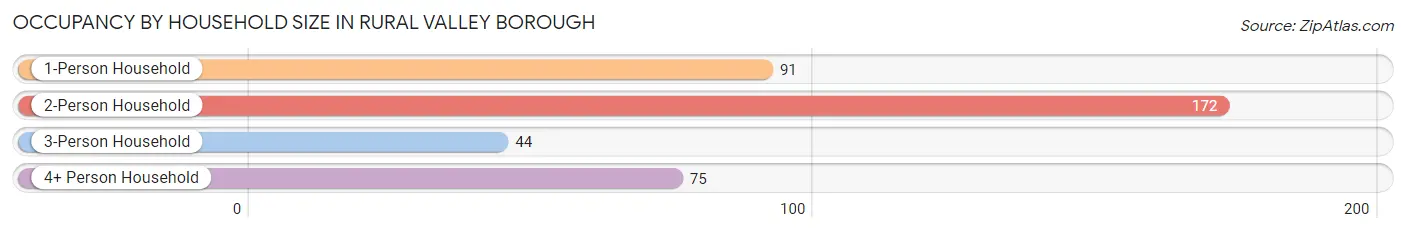
| Household Size | # Housing Units | % Housing Units |
| 1-Person Household | 91 | 23.8% |
| 2-Person Household | 172 | 45.0% |
| 3-Person Household | 44 | 11.5% |
| 4+ Person Household | 75 | 19.6% |
| Total Housing Units | 382 | 100.0% |
Occupancy by Ownership by Household Size in Rural Valley borough
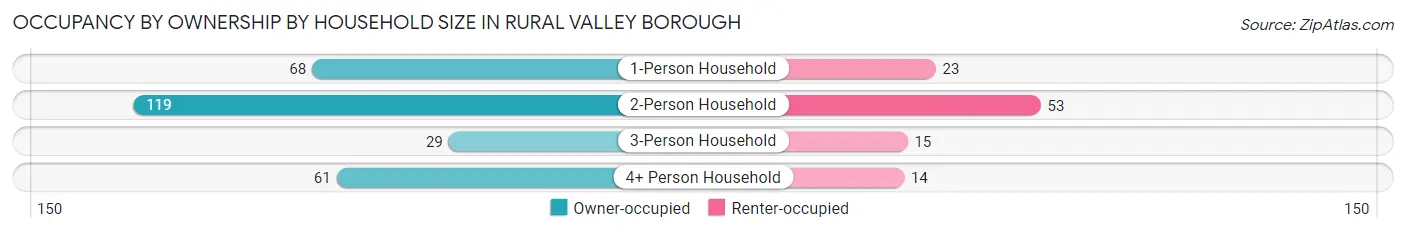
| Household Size | Owner-occupied | Renter-occupied |
| 1-Person Household | 68 (74.7%) | 23 (25.3%) |
| 2-Person Household | 119 (69.2%) | 53 (30.8%) |
| 3-Person Household | 29 (65.9%) | 15 (34.1%) |
| 4+ Person Household | 61 (81.3%) | 14 (18.7%) |
| Total Housing Units | 277 (72.5%) | 105 (27.5%) |
Occupancy by Educational Attainment in Rural Valley borough
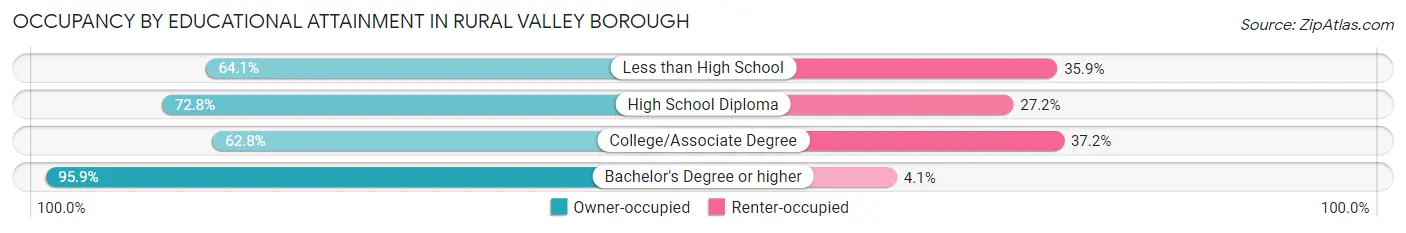
| Household Size | Owner-occupied | Renter-occupied |
| Less than High School | 25 (64.1%) | 14 (35.9%) |
| High School Diploma | 91 (72.8%) | 34 (27.2%) |
| College/Associate Degree | 91 (62.8%) | 54 (37.2%) |
| Bachelor's Degree or higher | 70 (95.9%) | 3 (4.1%) |
Occupancy by Age of Householder in Rural Valley borough
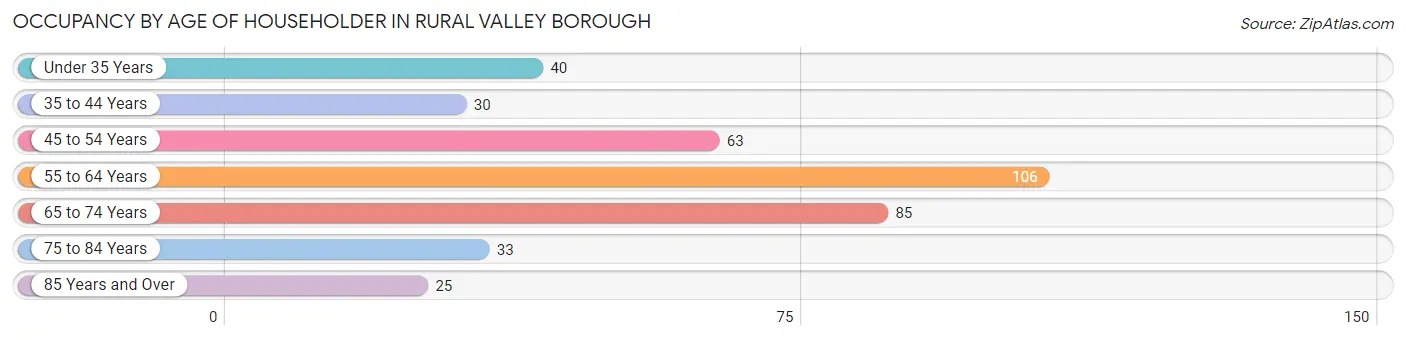
| Age Bracket | # Households | % Households |
| Under 35 Years | 40 | 10.5% |
| 35 to 44 Years | 30 | 7.9% |
| 45 to 54 Years | 63 | 16.5% |
| 55 to 64 Years | 106 | 27.8% |
| 65 to 74 Years | 85 | 22.3% |
| 75 to 84 Years | 33 | 8.6% |
| 85 Years and Over | 25 | 6.5% |
| Total | 382 | 100.0% |
Housing Finances in Rural Valley borough
Median Income by Occupancy in Rural Valley borough
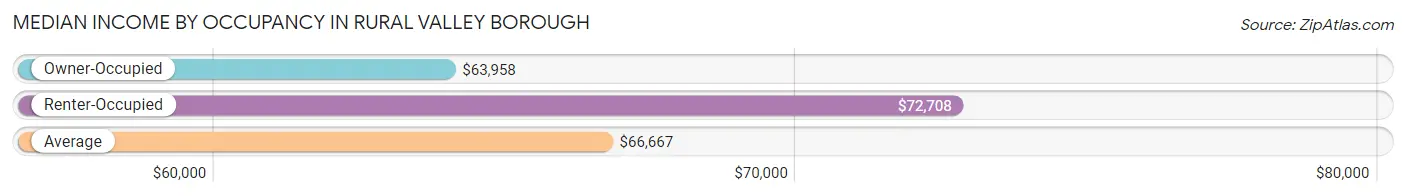
| Occupancy Type | # Households | Median Income |
| Owner-Occupied | 277 (72.5%) | $63,958 |
| Renter-Occupied | 105 (27.5%) | $72,708 |
| Average | 382 (100.0%) | $66,667 |
Occupancy by Householder Income Bracket in Rural Valley borough
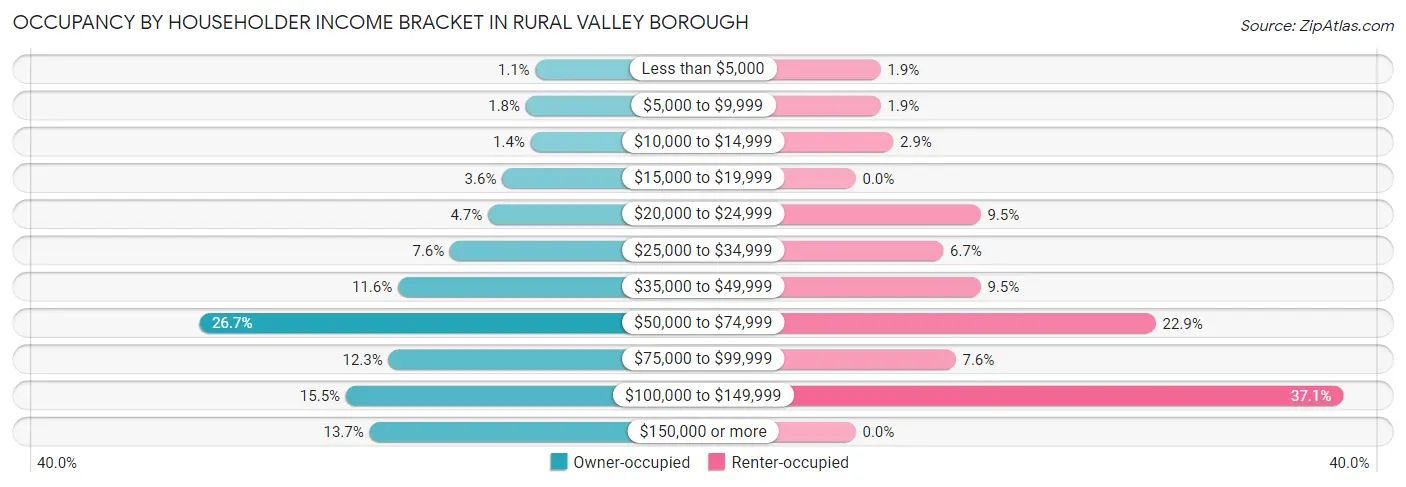
| Income Bracket | Owner-occupied | Renter-occupied |
| Less than $5,000 | 3 (1.1%) | 2 (1.9%) |
| $5,000 to $9,999 | 5 (1.8%) | 2 (1.9%) |
| $10,000 to $14,999 | 4 (1.4%) | 3 (2.9%) |
| $15,000 to $19,999 | 10 (3.6%) | 0 (0.0%) |
| $20,000 to $24,999 | 13 (4.7%) | 10 (9.5%) |
| $25,000 to $34,999 | 21 (7.6%) | 7 (6.7%) |
| $35,000 to $49,999 | 32 (11.6%) | 10 (9.5%) |
| $50,000 to $74,999 | 74 (26.7%) | 24 (22.9%) |
| $75,000 to $99,999 | 34 (12.3%) | 8 (7.6%) |
| $100,000 to $149,999 | 43 (15.5%) | 39 (37.1%) |
| $150,000 or more | 38 (13.7%) | 0 (0.0%) |
| Total | 277 (100.0%) | 105 (100.0%) |
Monthly Housing Cost Tiers in Rural Valley borough
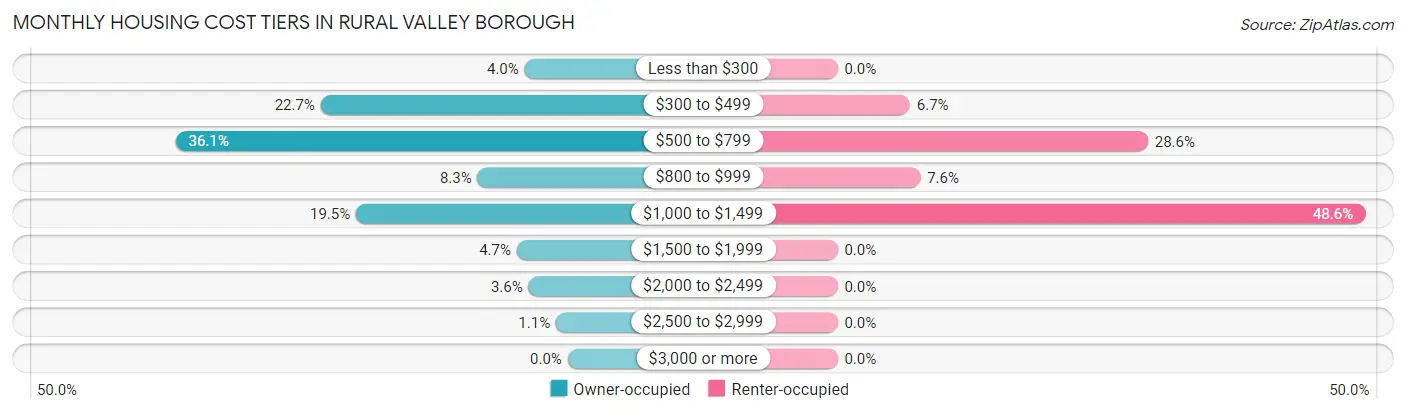
| Monthly Cost | Owner-occupied | Renter-occupied |
| Less than $300 | 11 (4.0%) | 0 (0.0%) |
| $300 to $499 | 63 (22.7%) | 7 (6.7%) |
| $500 to $799 | 100 (36.1%) | 30 (28.6%) |
| $800 to $999 | 23 (8.3%) | 8 (7.6%) |
| $1,000 to $1,499 | 54 (19.5%) | 51 (48.6%) |
| $1,500 to $1,999 | 13 (4.7%) | 0 (0.0%) |
| $2,000 to $2,499 | 10 (3.6%) | 0 (0.0%) |
| $2,500 to $2,999 | 3 (1.1%) | 0 (0.0%) |
| $3,000 or more | 0 (0.0%) | 0 (0.0%) |
| Total | 277 (100.0%) | 105 (100.0%) |
Physical Housing Characteristics in Rural Valley borough
Housing Structures in Rural Valley borough
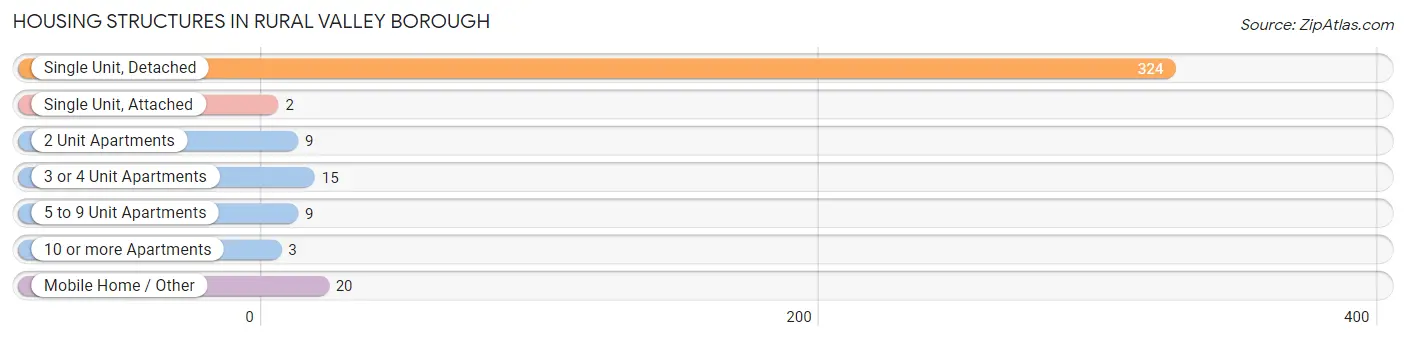
| Structure Type | # Housing Units | % Housing Units |
| Single Unit, Detached | 324 | 84.8% |
| Single Unit, Attached | 2 | 0.5% |
| 2 Unit Apartments | 9 | 2.4% |
| 3 or 4 Unit Apartments | 15 | 3.9% |
| 5 to 9 Unit Apartments | 9 | 2.4% |
| 10 or more Apartments | 3 | 0.8% |
| Mobile Home / Other | 20 | 5.2% |
| Total | 382 | 100.0% |
Housing Structures by Occupancy in Rural Valley borough
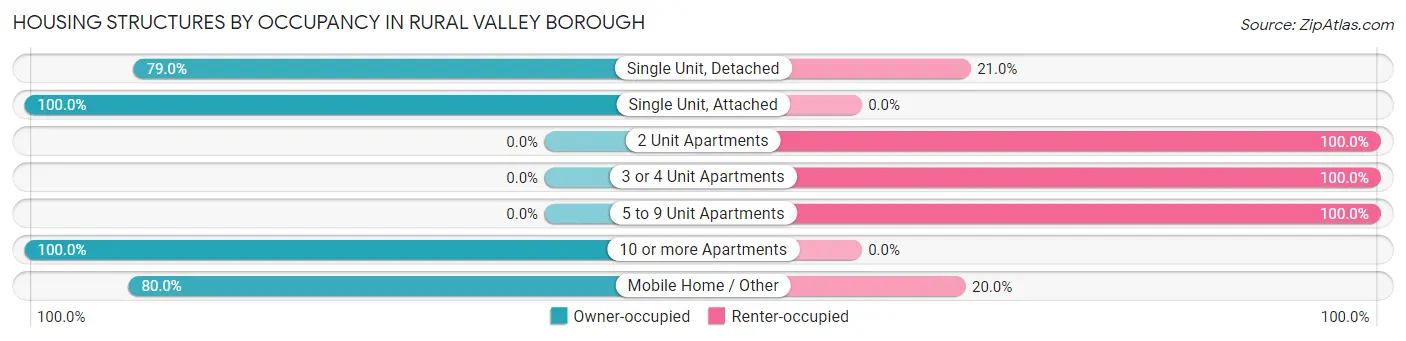
| Structure Type | Owner-occupied | Renter-occupied |
| Single Unit, Detached | 256 (79.0%) | 68 (21.0%) |
| Single Unit, Attached | 2 (100.0%) | 0 (0.0%) |
| 2 Unit Apartments | 0 (0.0%) | 9 (100.0%) |
| 3 or 4 Unit Apartments | 0 (0.0%) | 15 (100.0%) |
| 5 to 9 Unit Apartments | 0 (0.0%) | 9 (100.0%) |
| 10 or more Apartments | 3 (100.0%) | 0 (0.0%) |
| Mobile Home / Other | 16 (80.0%) | 4 (20.0%) |
| Total | 277 (72.5%) | 105 (27.5%) |
Housing Structures by Number of Rooms in Rural Valley borough
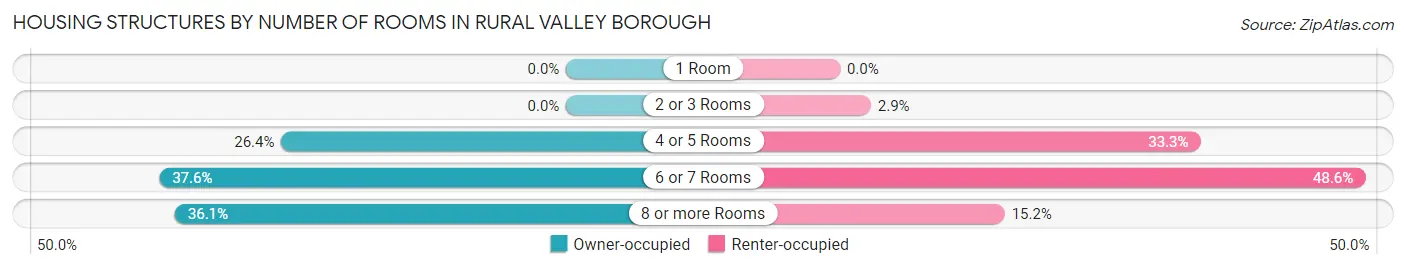
| Number of Rooms | Owner-occupied | Renter-occupied |
| 1 Room | 0 (0.0%) | 0 (0.0%) |
| 2 or 3 Rooms | 0 (0.0%) | 3 (2.9%) |
| 4 or 5 Rooms | 73 (26.4%) | 35 (33.3%) |
| 6 or 7 Rooms | 104 (37.6%) | 51 (48.6%) |
| 8 or more Rooms | 100 (36.1%) | 16 (15.2%) |
| Total | 277 (100.0%) | 105 (100.0%) |
Housing Structure by Heating Type in Rural Valley borough
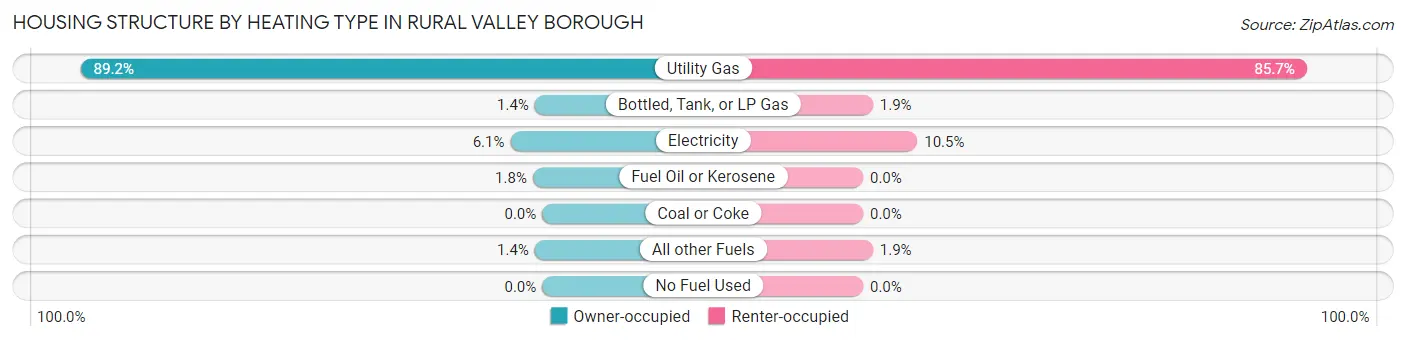
| Heating Type | Owner-occupied | Renter-occupied |
| Utility Gas | 247 (89.2%) | 90 (85.7%) |
| Bottled, Tank, or LP Gas | 4 (1.4%) | 2 (1.9%) |
| Electricity | 17 (6.1%) | 11 (10.5%) |
| Fuel Oil or Kerosene | 5 (1.8%) | 0 (0.0%) |
| Coal or Coke | 0 (0.0%) | 0 (0.0%) |
| All other Fuels | 4 (1.4%) | 2 (1.9%) |
| No Fuel Used | 0 (0.0%) | 0 (0.0%) |
| Total | 277 (100.0%) | 105 (100.0%) |
Household Vehicle Usage in Rural Valley borough
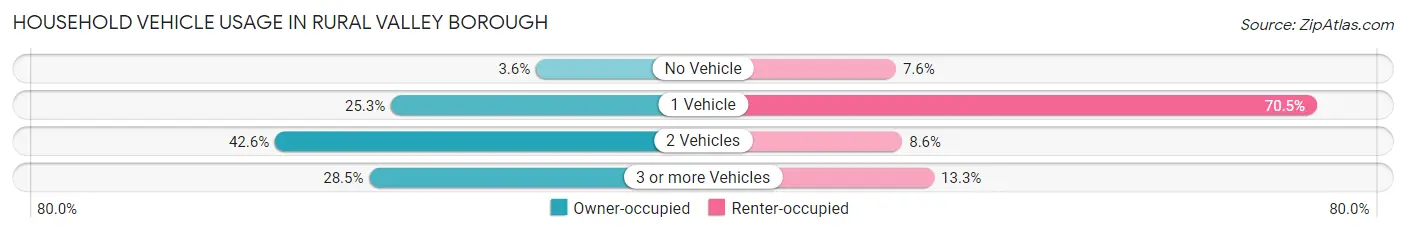
| Vehicles per Household | Owner-occupied | Renter-occupied |
| No Vehicle | 10 (3.6%) | 8 (7.6%) |
| 1 Vehicle | 70 (25.3%) | 74 (70.5%) |
| 2 Vehicles | 118 (42.6%) | 9 (8.6%) |
| 3 or more Vehicles | 79 (28.5%) | 14 (13.3%) |
| Total | 277 (100.0%) | 105 (100.0%) |
Real Estate & Mortgages in Rural Valley borough
Real Estate and Mortgage Overview in Rural Valley borough
| Characteristic | Without Mortgage | With Mortgage |
| Housing Units | 155 | 122 |
| Median Property Value | $136,600 | $124,300 |
| Median Household Income | $59,671 | $21 |
| Monthly Housing Costs | $515 | $0 |
| Real Estate Taxes | $2,309 | $6 |
Property Value by Mortgage Status in Rural Valley borough
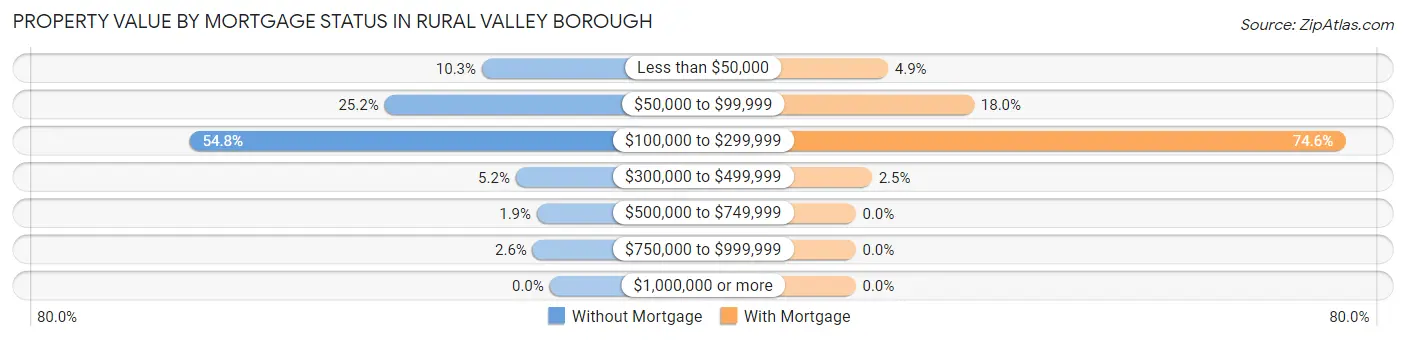
| Property Value | Without Mortgage | With Mortgage |
| Less than $50,000 | 16 (10.3%) | 6 (4.9%) |
| $50,000 to $99,999 | 39 (25.2%) | 22 (18.0%) |
| $100,000 to $299,999 | 85 (54.8%) | 91 (74.6%) |
| $300,000 to $499,999 | 8 (5.2%) | 3 (2.5%) |
| $500,000 to $749,999 | 3 (1.9%) | 0 (0.0%) |
| $750,000 to $999,999 | 4 (2.6%) | 0 (0.0%) |
| $1,000,000 or more | 0 (0.0%) | 0 (0.0%) |
| Total | 155 (100.0%) | 122 (100.0%) |
Household Income by Mortgage Status in Rural Valley borough
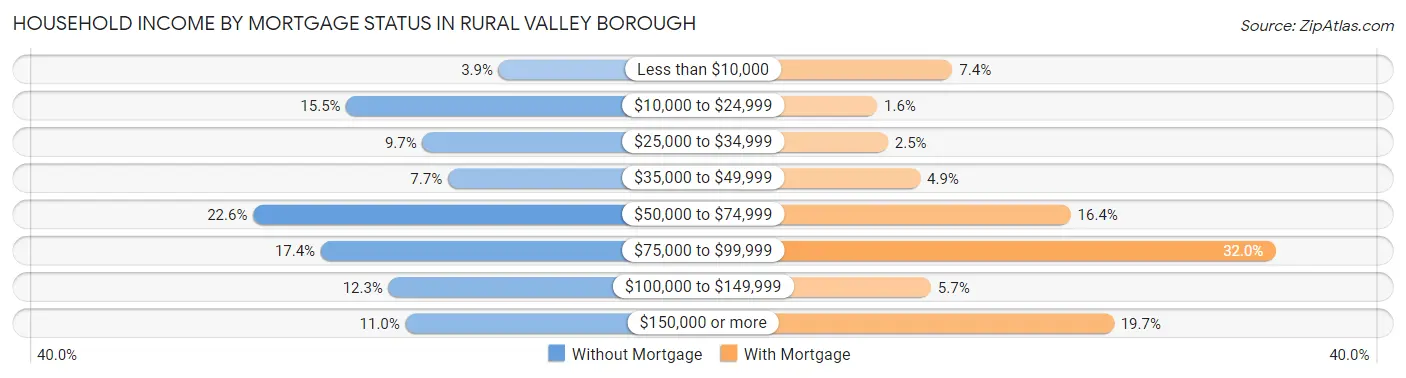
| Household Income | Without Mortgage | With Mortgage |
| Less than $10,000 | 6 (3.9%) | 9 (7.4%) |
| $10,000 to $24,999 | 24 (15.5%) | 2 (1.6%) |
| $25,000 to $34,999 | 15 (9.7%) | 3 (2.5%) |
| $35,000 to $49,999 | 12 (7.7%) | 6 (4.9%) |
| $50,000 to $74,999 | 35 (22.6%) | 20 (16.4%) |
| $75,000 to $99,999 | 27 (17.4%) | 39 (32.0%) |
| $100,000 to $149,999 | 19 (12.3%) | 7 (5.7%) |
| $150,000 or more | 17 (11.0%) | 24 (19.7%) |
| Total | 155 (100.0%) | 122 (100.0%) |
Property Value to Household Income Ratio in Rural Valley borough
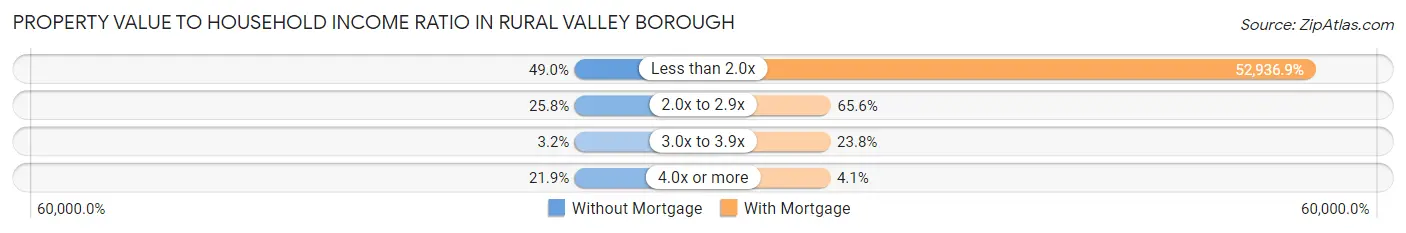
| Value-to-Income Ratio | Without Mortgage | With Mortgage |
| Less than 2.0x | 76 (49.0%) | 64,583 (52,936.9%) |
| 2.0x to 2.9x | 40 (25.8%) | 80 (65.6%) |
| 3.0x to 3.9x | 5 (3.2%) | 29 (23.8%) |
| 4.0x or more | 34 (21.9%) | 5 (4.1%) |
| Total | 155 (100.0%) | 122 (100.0%) |
Real Estate Taxes by Mortgage Status in Rural Valley borough
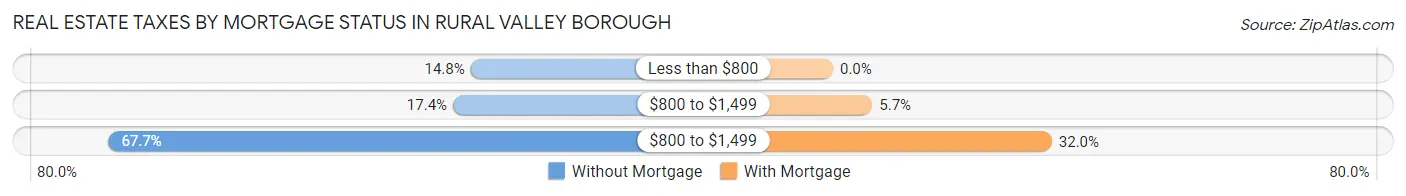
| Property Taxes | Without Mortgage | With Mortgage |
| Less than $800 | 23 (14.8%) | 0 (0.0%) |
| $800 to $1,499 | 27 (17.4%) | 7 (5.7%) |
| $800 to $1,499 | 105 (67.7%) | 39 (32.0%) |
| Total | 155 (100.0%) | 122 (100.0%) |
Health & Disability in Rural Valley borough
Health Insurance Coverage by Age in Rural Valley borough
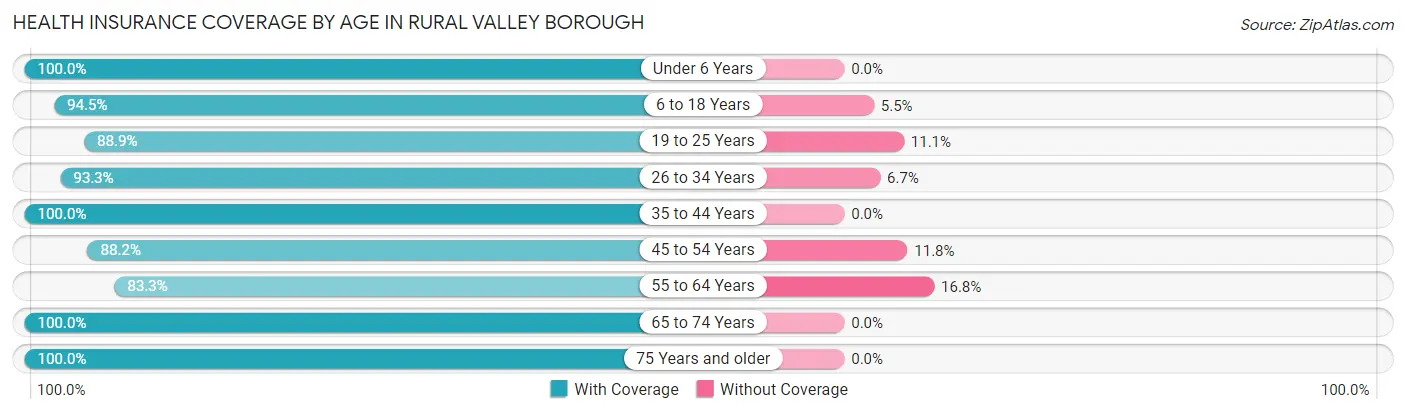
| Age Bracket | With Coverage | Without Coverage |
| Under 6 Years | 34 (100.0%) | 0 (0.0%) |
| 6 to 18 Years | 120 (94.5%) | 7 (5.5%) |
| 19 to 25 Years | 80 (88.9%) | 10 (11.1%) |
| 26 to 34 Years | 84 (93.3%) | 6 (6.7%) |
| 35 to 44 Years | 78 (100.0%) | 0 (0.0%) |
| 45 to 54 Years | 90 (88.2%) | 12 (11.8%) |
| 55 to 64 Years | 164 (83.3%) | 33 (16.8%) |
| 65 to 74 Years | 139 (100.0%) | 0 (0.0%) |
| 75 Years and older | 84 (100.0%) | 0 (0.0%) |
| Total | 873 (92.8%) | 68 (7.2%) |
Health Insurance Coverage by Citizenship Status in Rural Valley borough
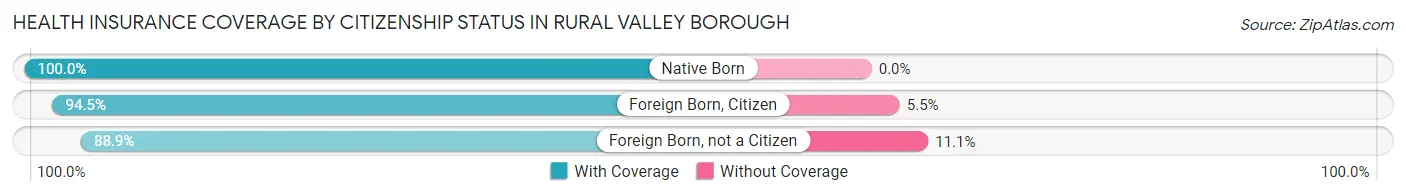
| Citizenship Status | With Coverage | Without Coverage |
| Native Born | 34 (100.0%) | 0 (0.0%) |
| Foreign Born, Citizen | 120 (94.5%) | 7 (5.5%) |
| Foreign Born, not a Citizen | 80 (88.9%) | 10 (11.1%) |
Health Insurance Coverage by Household Income in Rural Valley borough
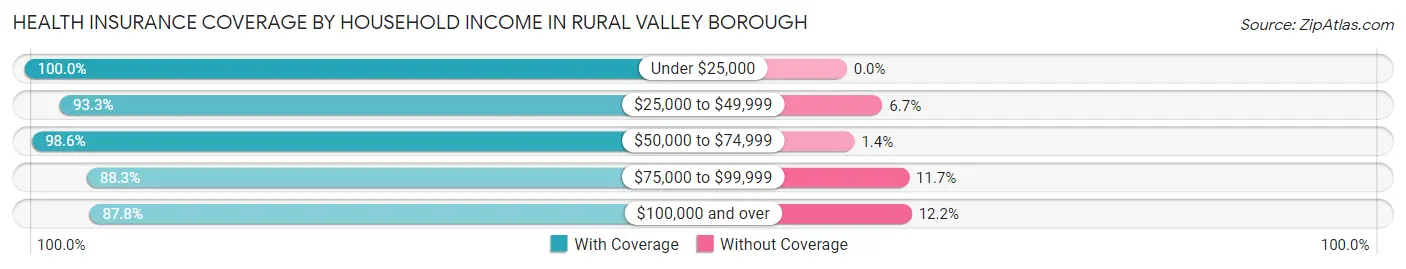
| Household Income | With Coverage | Without Coverage |
| Under $25,000 | 71 (100.0%) | 0 (0.0%) |
| $25,000 to $49,999 | 126 (93.3%) | 9 (6.7%) |
| $50,000 to $74,999 | 274 (98.6%) | 4 (1.4%) |
| $75,000 to $99,999 | 106 (88.3%) | 14 (11.7%) |
| $100,000 and over | 296 (87.8%) | 41 (12.2%) |
Public vs Private Health Insurance Coverage by Age in Rural Valley borough
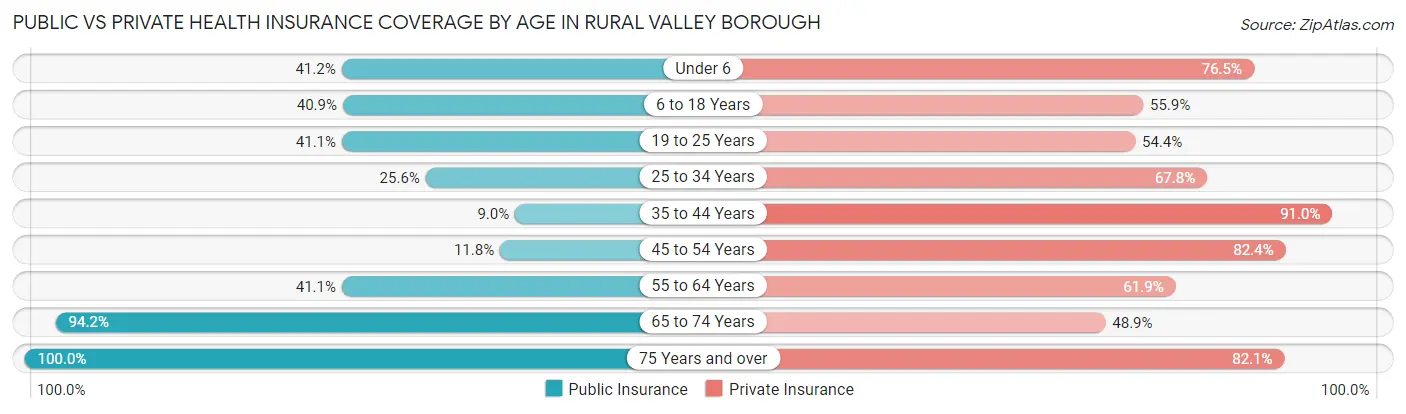
| Age Bracket | Public Insurance | Private Insurance |
| Under 6 | 14 (41.2%) | 26 (76.5%) |
| 6 to 18 Years | 52 (40.9%) | 71 (55.9%) |
| 19 to 25 Years | 37 (41.1%) | 49 (54.4%) |
| 25 to 34 Years | 23 (25.6%) | 61 (67.8%) |
| 35 to 44 Years | 7 (9.0%) | 71 (91.0%) |
| 45 to 54 Years | 12 (11.8%) | 84 (82.4%) |
| 55 to 64 Years | 81 (41.1%) | 122 (61.9%) |
| 65 to 74 Years | 131 (94.2%) | 68 (48.9%) |
| 75 Years and over | 84 (100.0%) | 69 (82.1%) |
| Total | 441 (46.9%) | 621 (66.0%) |
Disability Status by Sex by Age in Rural Valley borough
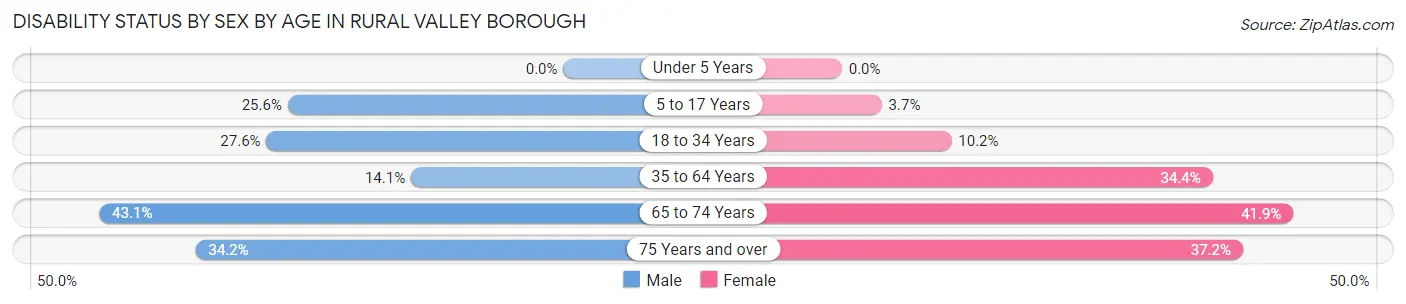
| Age Bracket | Male | Female |
| Under 5 Years | 0 (0.0%) | 0 (0.0%) |
| 5 to 17 Years | 11 (25.6%) | 3 (3.7%) |
| 18 to 34 Years | 35 (27.6%) | 6 (10.2%) |
| 35 to 64 Years | 27 (14.1%) | 64 (34.4%) |
| 65 to 74 Years | 28 (43.1%) | 31 (41.9%) |
| 75 Years and over | 14 (34.2%) | 16 (37.2%) |
Disability Class by Sex by Age in Rural Valley borough
Disability Class: Hearing Difficulty
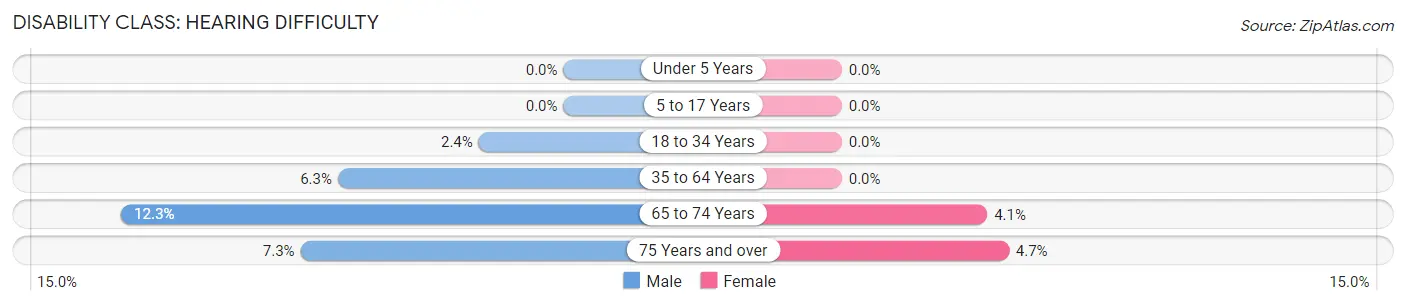
| Age Bracket | Male | Female |
| Under 5 Years | 0 (0.0%) | 0 (0.0%) |
| 5 to 17 Years | 0 (0.0%) | 0 (0.0%) |
| 18 to 34 Years | 3 (2.4%) | 0 (0.0%) |
| 35 to 64 Years | 12 (6.3%) | 0 (0.0%) |
| 65 to 74 Years | 8 (12.3%) | 3 (4.1%) |
| 75 Years and over | 3 (7.3%) | 2 (4.6%) |
Disability Class: Vision Difficulty
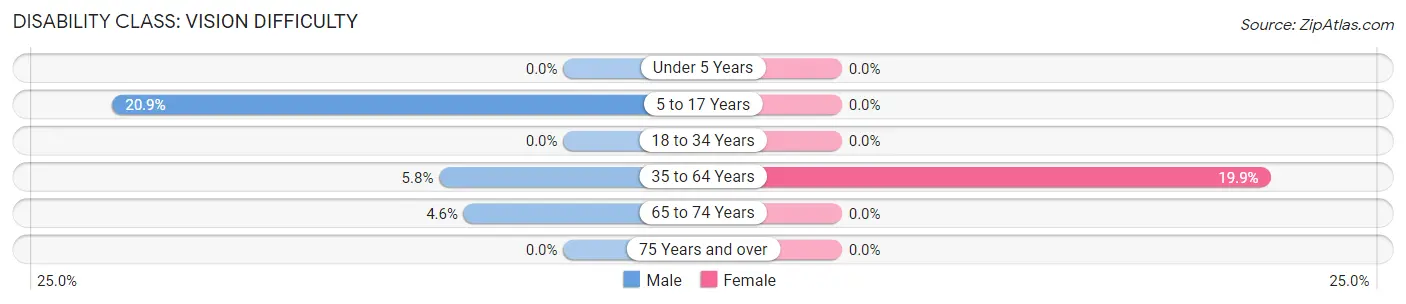
| Age Bracket | Male | Female |
| Under 5 Years | 0 (0.0%) | 0 (0.0%) |
| 5 to 17 Years | 9 (20.9%) | 0 (0.0%) |
| 18 to 34 Years | 0 (0.0%) | 0 (0.0%) |
| 35 to 64 Years | 11 (5.8%) | 37 (19.9%) |
| 65 to 74 Years | 3 (4.6%) | 0 (0.0%) |
| 75 Years and over | 0 (0.0%) | 0 (0.0%) |
Disability Class: Cognitive Difficulty
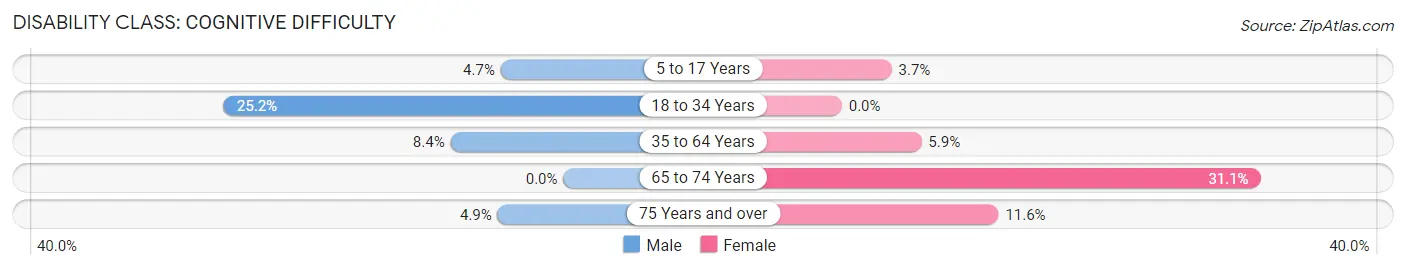
| Age Bracket | Male | Female |
| 5 to 17 Years | 2 (4.6%) | 3 (3.7%) |
| 18 to 34 Years | 32 (25.2%) | 0 (0.0%) |
| 35 to 64 Years | 16 (8.4%) | 11 (5.9%) |
| 65 to 74 Years | 0 (0.0%) | 23 (31.1%) |
| 75 Years and over | 2 (4.9%) | 5 (11.6%) |
Disability Class: Ambulatory Difficulty
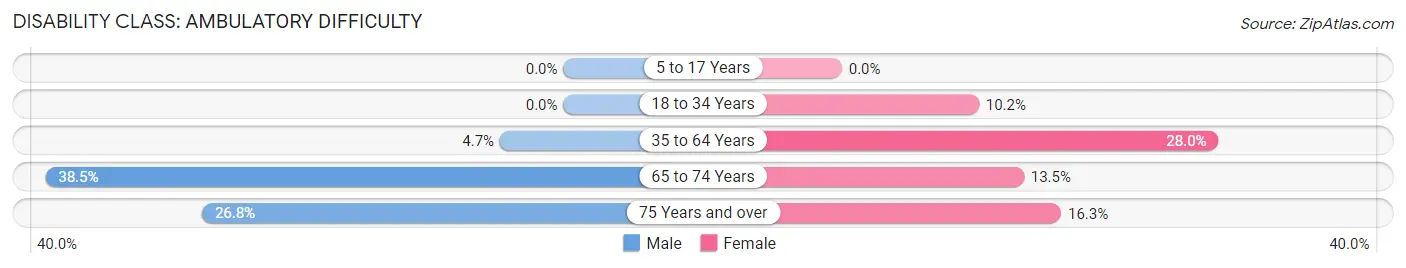
| Age Bracket | Male | Female |
| 5 to 17 Years | 0 (0.0%) | 0 (0.0%) |
| 18 to 34 Years | 0 (0.0%) | 6 (10.2%) |
| 35 to 64 Years | 9 (4.7%) | 52 (28.0%) |
| 65 to 74 Years | 25 (38.5%) | 10 (13.5%) |
| 75 Years and over | 11 (26.8%) | 7 (16.3%) |
Disability Class: Self-Care Difficulty
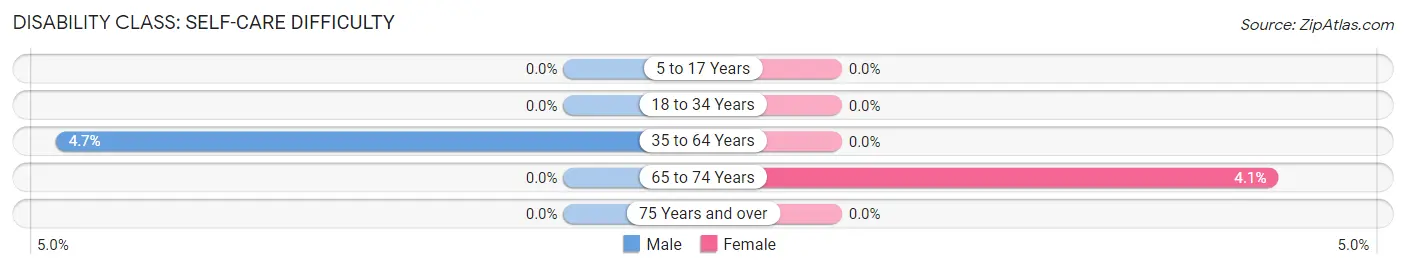
| Age Bracket | Male | Female |
| 5 to 17 Years | 0 (0.0%) | 0 (0.0%) |
| 18 to 34 Years | 0 (0.0%) | 0 (0.0%) |
| 35 to 64 Years | 9 (4.7%) | 0 (0.0%) |
| 65 to 74 Years | 0 (0.0%) | 3 (4.1%) |
| 75 Years and over | 0 (0.0%) | 0 (0.0%) |
Technology Access in Rural Valley borough
Computing Device Access in Rural Valley borough
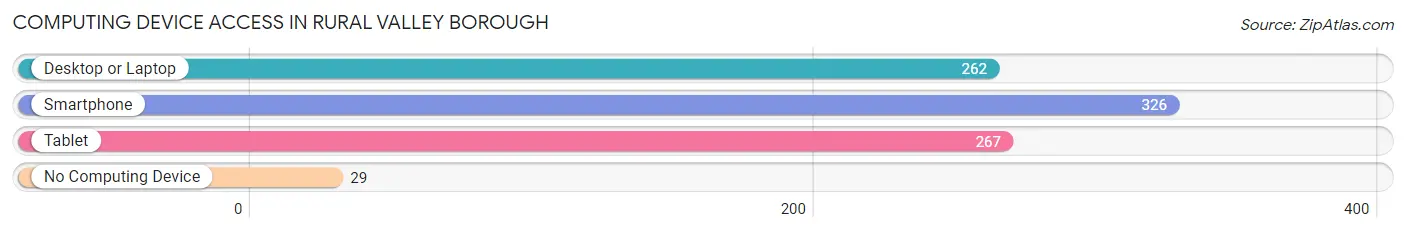
| Device Type | # Households | % Households |
| Desktop or Laptop | 262 | 68.6% |
| Smartphone | 326 | 85.3% |
| Tablet | 267 | 69.9% |
| No Computing Device | 29 | 7.6% |
| Total | 382 | 100.0% |
Internet Access in Rural Valley borough
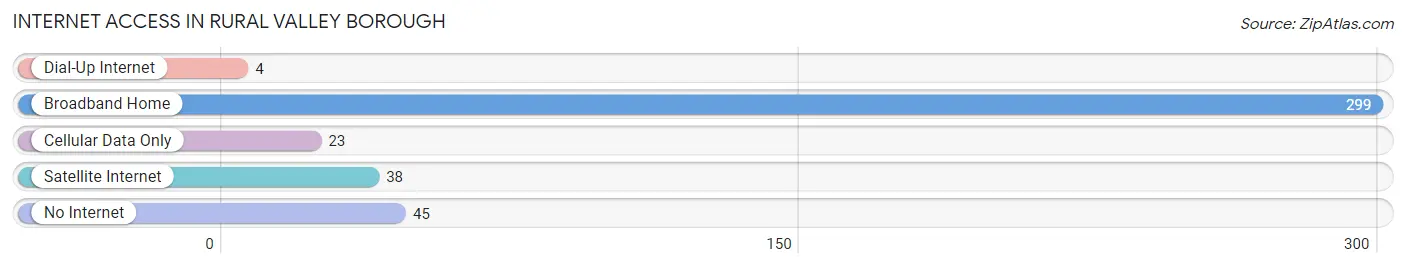
| Internet Type | # Households | % Households |
| Dial-Up Internet | 4 | 1.1% |
| Broadband Home | 299 | 78.3% |
| Cellular Data Only | 23 | 6.0% |
| Satellite Internet | 38 | 10.0% |
| No Internet | 45 | 11.8% |
| Total | 382 | 100.0% |
Rural Valley borough Summary
Rural Valley Borough is a small borough located in Armstrong County, Pennsylvania. It is situated in the foothills of the Allegheny Mountains, approximately 30 miles northeast of Pittsburgh. The borough is home to approximately 1,400 people and covers an area of 0.7 square miles.
History
Rural Valley Borough was founded in 1876 and was originally known as “Rural Valley Station”. The name was changed to “Rural Valley Borough” in 1883. The borough was originally a farming community, but it has since become a bedroom community for those who work in nearby cities such as Pittsburgh and Kittanning.
Geography
Rural Valley Borough is located in the foothills of the Allegheny Mountains. The borough is situated in the Mahoning Creek Valley, which is a tributary of the Allegheny River. The borough is surrounded by the townships of Wayne, Mahoning, and Cowanshannock. The borough is located approximately 30 miles northeast of Pittsburgh and is accessible via State Route 85.
Economy
Rural Valley Borough is primarily a bedroom community, with most of its residents commuting to nearby cities such as Pittsburgh and Kittanning for work. The borough does have a few small businesses, including a grocery store, a hardware store, and a few restaurants. The borough also has a few small manufacturing companies, such as a furniture manufacturer and a metal fabrication shop.
Demographics
As of the 2010 census, the population of Rural Valley Borough was 1,400. The racial makeup of the borough was 97.7% White, 0.6% African American, 0.3% Native American, 0.3% Asian, and 0.9% from other races. The median household income was $37,500, and the median family income was $45,000. The per capita income was $18,000.
Conclusion
Rural Valley Borough is a small borough located in Armstrong County, Pennsylvania. It is situated in the foothills of the Allegheny Mountains, approximately 30 miles northeast of Pittsburgh. The borough is home to approximately 1,400 people and covers an area of 0.7 square miles. The borough is primarily a bedroom community, with most of its residents commuting to nearby cities such as Pittsburgh and Kittanning for work. The racial makeup of the borough was 97.7% White, 0.6% African American, 0.3% Native American, 0.3% Asian, and 0.9% from other races. The median household income was $37,500, and the median family income was $45,000. The per capita income was $18,000.
Common Questions
What is Per Capita Income in Rural Valley borough?
Per Capita income in Rural Valley borough is $32,629.
What is the Median Family Income in Rural Valley borough?
Median Family Income in Rural Valley borough is $83,523.
What is the Median Household income in Rural Valley borough?
Median Household Income in Rural Valley borough is $66,667.
What is Income or Wage Gap in Rural Valley borough?
Income or Wage Gap in Rural Valley borough is 28.4%.
Women in Rural Valley borough earn 71.6 cents for every dollar earned by a man.
What is Family Income Deficit in Rural Valley borough?
Family Income Deficit in Rural Valley borough is $15,373.
Families that are below poverty line in Rural Valley borough earn $15,373 less on average than the poverty threshold level.
What is Inequality or Gini Index in Rural Valley borough?
Inequality or Gini Index in Rural Valley borough is 0.36.
What is the Total Population of Rural Valley borough?
Total Population of Rural Valley borough is 946.
What is the Total Male Population of Rural Valley borough?
Total Male Population of Rural Valley borough is 485.
What is the Total Female Population of Rural Valley borough?
Total Female Population of Rural Valley borough is 461.
What is the Ratio of Males per 100 Females in Rural Valley borough?
There are 105.21 Males per 100 Females in Rural Valley borough.
What is the Ratio of Females per 100 Males in Rural Valley borough?
There are 95.05 Females per 100 Males in Rural Valley borough.
What is the Median Population Age in Rural Valley borough?
Median Population Age in Rural Valley borough is 50.0 Years.
What is the Average Family Size in Rural Valley borough
Average Family Size in Rural Valley borough is 2.9 People.
What is the Average Household Size in Rural Valley borough
Average Household Size in Rural Valley borough is 2.5 People.
How Large is the Labor Force in Rural Valley borough?
There are 441 People in the Labor Forcein in Rural Valley borough.
What is the Percentage of People in the Labor Force in Rural Valley borough?
53.6% of People are in the Labor Force in Rural Valley borough.
What is the Unemployment Rate in Rural Valley borough?
Unemployment Rate in Rural Valley borough is 12.5%.