Brookhaven borough, PA Map & Demographics
Brookhaven borough Overview
$44,062
PER CAPITA INCOME
$102,184
AVG FAMILY INCOME
$90,264
AVG HOUSEHOLD INCOME
33.7%
WAGE / INCOME GAP [ % ]
66.3¢/ $1
WAGE / INCOME GAP [ $ ]
0.36
INEQUALITY / GINI INDEX
8,268
TOTAL POPULATION
4,372
MALE POPULATION
3,896
FEMALE POPULATION
112.22
MALES / 100 FEMALES
89.11
FEMALES / 100 MALES
43.6
MEDIAN AGE
2.9
AVG FAMILY SIZE
2.3
AVG HOUSEHOLD SIZE
4,650
LABOR FORCE [ PEOPLE ]
69.8%
PERCENT IN LABOR FORCE
3.6%
UNEMPLOYMENT RATE
Income in Brookhaven borough
Income Overview in Brookhaven borough
Per Capita Income in Brookhaven borough is $44,062, while median incomes of families and households are $102,184 and $90,264 respectively.
| Characteristic | Number | Measure |
| Per Capita Income | 8,268 | $44,062 |
| Median Family Income | 2,247 | $102,184 |
| Mean Family Income | 2,247 | $112,918 |
| Median Household Income | 3,631 | $90,264 |
| Mean Household Income | 3,631 | $99,358 |
| Income Deficit | 2,247 | $0 |
| Wage / Income Gap (%) | 8,268 | 33.67% |
| Wage / Income Gap ($) | 8,268 | 66.33¢ per $1 |
| Gini / Inequality Index | 8,268 | 0.36 |
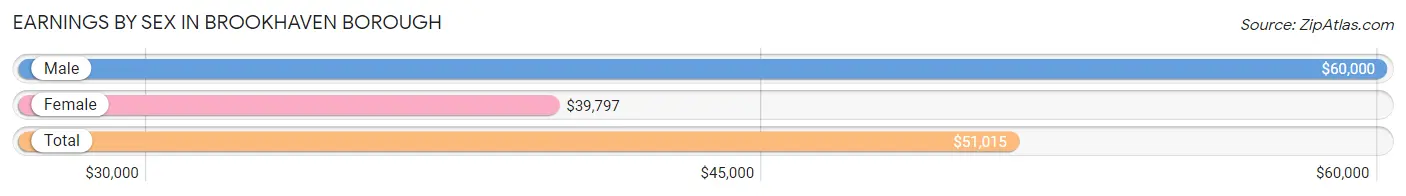
Earnings by Sex in Brookhaven borough
Average Earnings in Brookhaven borough are $51,015, $60,000 for men and $39,797 for women, a difference of 33.7%.
| Sex | Number | Average Earnings |
| Male | 2,572 (54.7%) | $60,000 |
| Female | 2,131 (45.3%) | $39,797 |
| Total | 4,703 (100.0%) | $51,015 |
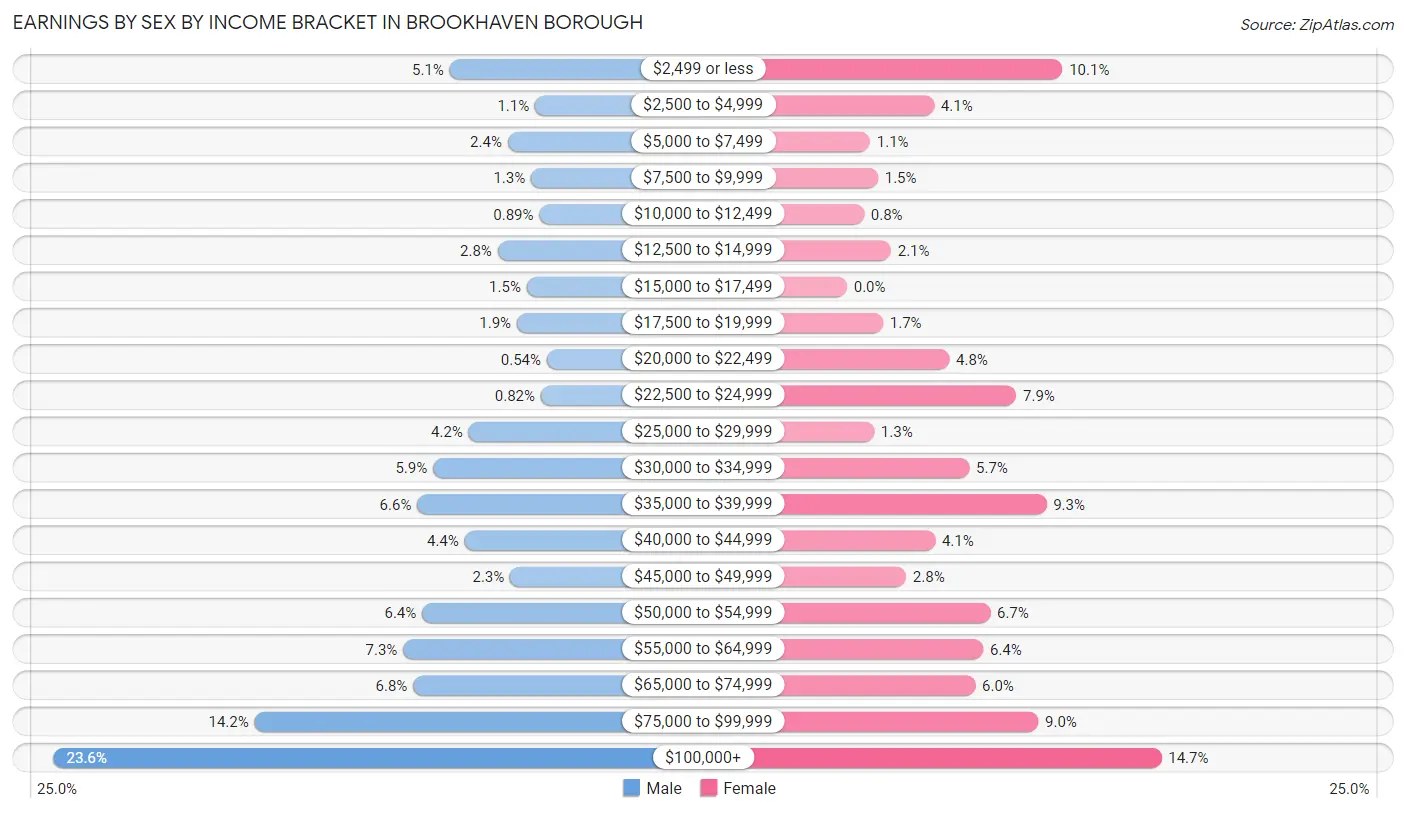
Earnings by Sex by Income Bracket in Brookhaven borough
The most common earnings brackets in Brookhaven borough are $100,000+ for men (608 | 23.6%) and $100,000+ for women (314 | 14.7%).
| Income | Male | Female |
| $2,499 or less | 131 (5.1%) | 215 (10.1%) |
| $2,500 to $4,999 | 28 (1.1%) | 87 (4.1%) |
| $5,000 to $7,499 | 61 (2.4%) | 23 (1.1%) |
| $7,500 to $9,999 | 33 (1.3%) | 31 (1.5%) |
| $10,000 to $12,499 | 23 (0.9%) | 17 (0.8%) |
| $12,500 to $14,999 | 73 (2.8%) | 44 (2.1%) |
| $15,000 to $17,499 | 38 (1.5%) | 0 (0.0%) |
| $17,500 to $19,999 | 50 (1.9%) | 36 (1.7%) |
| $20,000 to $22,499 | 14 (0.5%) | 102 (4.8%) |
| $22,500 to $24,999 | 21 (0.8%) | 169 (7.9%) |
| $25,000 to $29,999 | 108 (4.2%) | 27 (1.3%) |
| $30,000 to $34,999 | 151 (5.9%) | 122 (5.7%) |
| $35,000 to $39,999 | 170 (6.6%) | 199 (9.3%) |
| $40,000 to $44,999 | 113 (4.4%) | 88 (4.1%) |
| $45,000 to $49,999 | 58 (2.3%) | 59 (2.8%) |
| $50,000 to $54,999 | 164 (6.4%) | 143 (6.7%) |
| $55,000 to $64,999 | 187 (7.3%) | 136 (6.4%) |
| $65,000 to $74,999 | 175 (6.8%) | 128 (6.0%) |
| $75,000 to $99,999 | 366 (14.2%) | 191 (9.0%) |
| $100,000+ | 608 (23.6%) | 314 (14.7%) |
| Total | 2,572 (100.0%) | 2,131 (100.0%) |
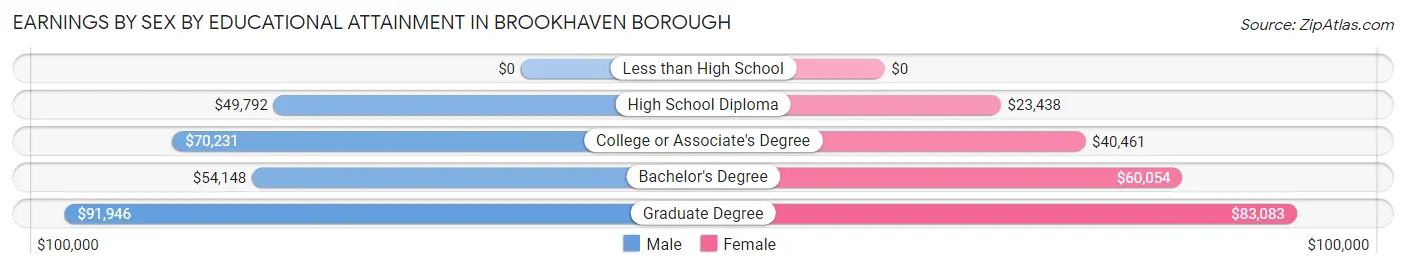
Earnings by Sex by Educational Attainment in Brookhaven borough
Average earnings in Brookhaven borough are $64,732 for men and $45,519 for women, a difference of 29.7%. Men with an educational attainment of graduate degree enjoy the highest average annual earnings of $91,946, while those with high school diploma education earn the least with $49,792. Women with an educational attainment of graduate degree earn the most with the average annual earnings of $83,083, while those with high school diploma education have the smallest earnings of $23,438.
| Educational Attainment | Male Income | Female Income |
| Less than High School | - | - |
| High School Diploma | $49,792 | $23,438 |
| College or Associate's Degree | $70,231 | $40,461 |
| Bachelor's Degree | $54,148 | $60,054 |
| Graduate Degree | $91,946 | $83,083 |
| Total | $64,732 | $45,519 |
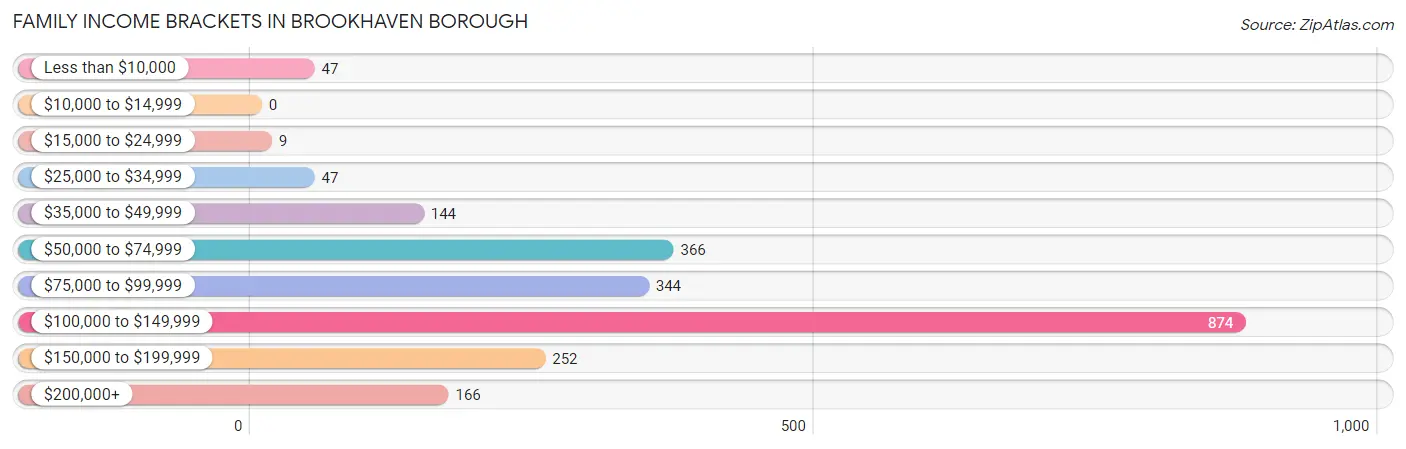
Family Income in Brookhaven borough
Family Income Brackets in Brookhaven borough
According to the Brookhaven borough family income data, there are 874 families falling into the $100,000 to $149,999 income range, which is the most common income bracket and makes up 38.9% of all families.
| Income Bracket | # Families | % Families |
| Less than $10,000 | 47 | 2.1% |
| $10,000 to $14,999 | 0 | 0.0% |
| $15,000 to $24,999 | 9 | 0.4% |
| $25,000 to $34,999 | 47 | 2.1% |
| $35,000 to $49,999 | 144 | 6.4% |
| $50,000 to $74,999 | 366 | 16.3% |
| $75,000 to $99,999 | 344 | 15.3% |
| $100,000 to $149,999 | 874 | 38.9% |
| $150,000 to $199,999 | 252 | 11.2% |
| $200,000+ | 166 | 7.4% |
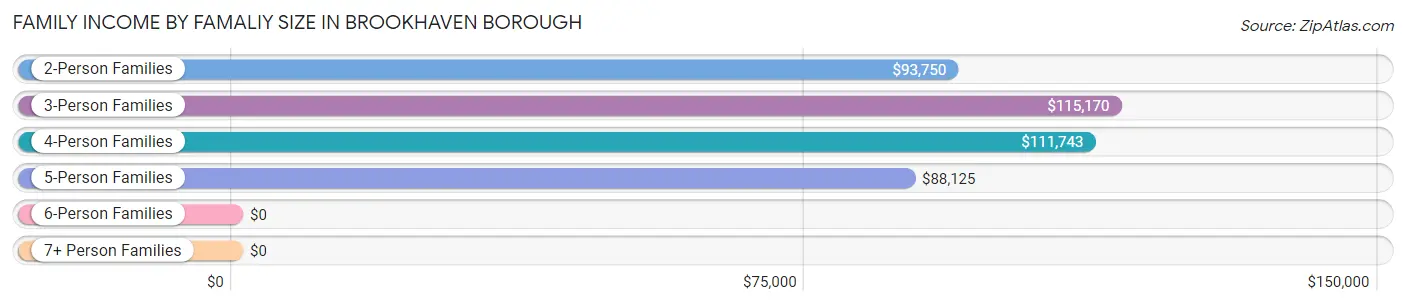
Family Income by Famaliy Size in Brookhaven borough
3-person families (641 | 28.5%) account for the highest median family income in Brookhaven borough with $115,170 per family, while 2-person families (1,008 | 44.9%) have the highest median income of $46,875 per family member.
| Income Bracket | # Families | Median Income |
| 2-Person Families | 1,008 (44.9%) | $93,750 |
| 3-Person Families | 641 (28.5%) | $115,170 |
| 4-Person Families | 509 (22.7%) | $111,743 |
| 5-Person Families | 49 (2.2%) | $88,125 |
| 6-Person Families | 40 (1.8%) | $0 |
| 7+ Person Families | 0 (0.0%) | $0 |
| Total | 2,247 (100.0%) | $102,184 |
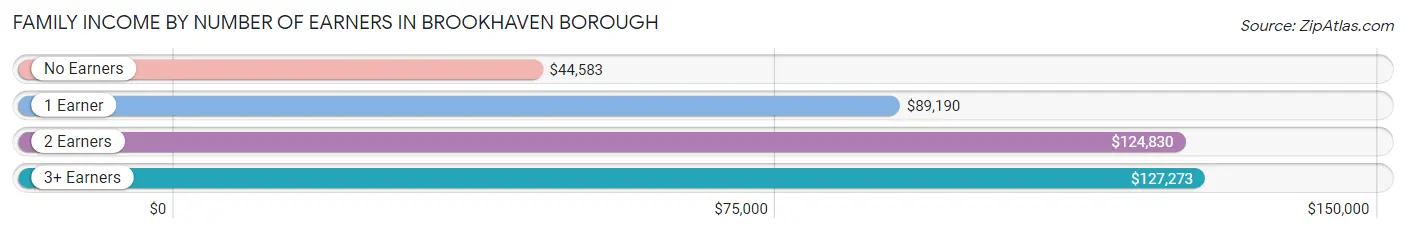
Family Income by Number of Earners in Brookhaven borough
The median family income in Brookhaven borough is $102,184, with families comprising 3+ earners (346) having the highest median family income of $127,273, while families with no earners (257) have the lowest median family income of $44,583, accounting for 15.4% and 11.4% of families, respectively.
| Number of Earners | # Families | Median Income |
| No Earners | 257 (11.4%) | $44,583 |
| 1 Earner | 775 (34.5%) | $89,190 |
| 2 Earners | 869 (38.7%) | $124,830 |
| 3+ Earners | 346 (15.4%) | $127,273 |
| Total | 2,247 (100.0%) | $102,184 |
Household Income in Brookhaven borough
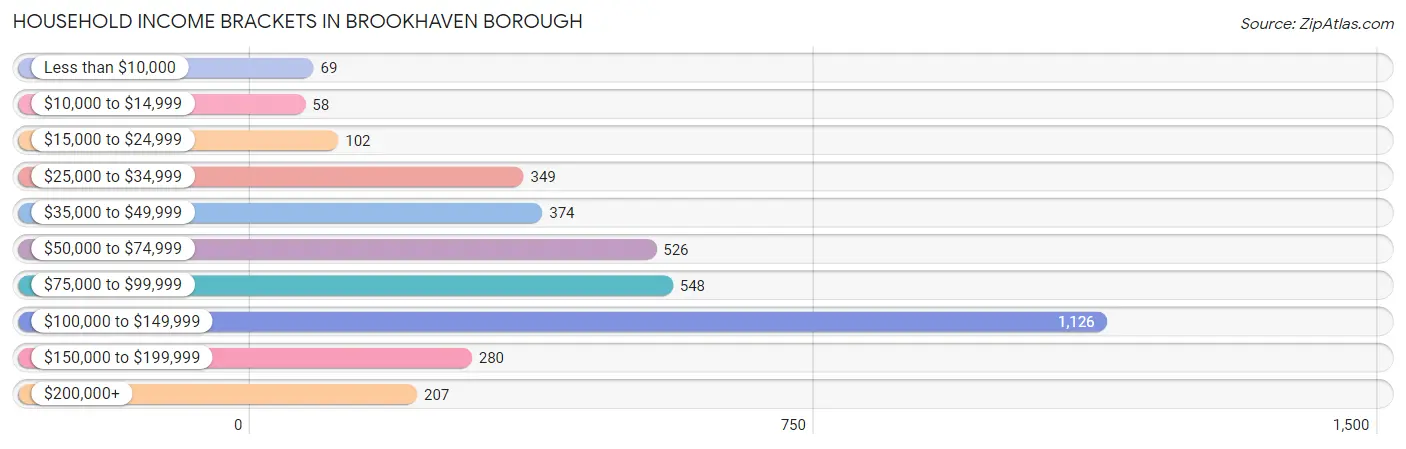
Household Income Brackets in Brookhaven borough
With 1,126 households falling in the category, the $100,000 to $149,999 income range is the most frequent in Brookhaven borough, accounting for 31.0% of all households. In contrast, only 58 households (1.6%) fall into the $10,000 to $14,999 income bracket, making it the least populous group.
| Income Bracket | # Households | % Households |
| Less than $10,000 | 69 | 1.9% |
| $10,000 to $14,999 | 58 | 1.6% |
| $15,000 to $24,999 | 102 | 2.8% |
| $25,000 to $34,999 | 349 | 9.6% |
| $35,000 to $49,999 | 374 | 10.3% |
| $50,000 to $74,999 | 526 | 14.5% |
| $75,000 to $99,999 | 548 | 15.1% |
| $100,000 to $149,999 | 1,126 | 31.0% |
| $150,000 to $199,999 | 280 | 7.7% |
| $200,000+ | 207 | 5.7% |
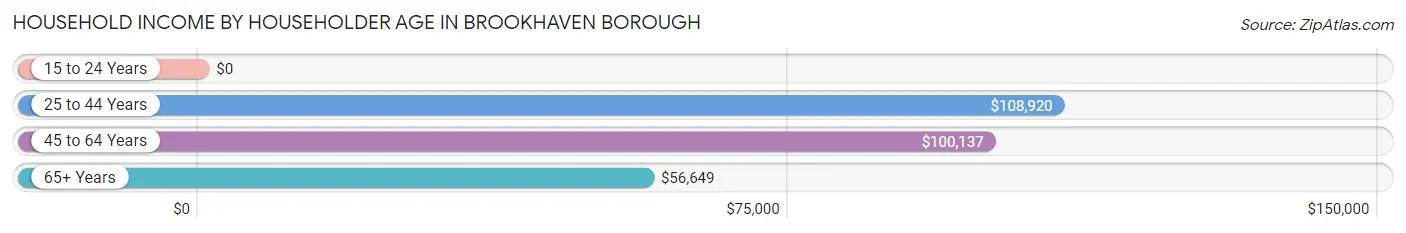
Household Income by Householder Age in Brookhaven borough
The median household income in Brookhaven borough is $90,264, with the highest median household income of $108,920 found in the 25 to 44 years age bracket for the primary householder. A total of 893 households (24.6%) fall into this category.
| Income Bracket | # Households | Median Income |
| 15 to 24 Years | 0 (0.0%) | $0 |
| 25 to 44 Years | 893 (24.6%) | $108,920 |
| 45 to 64 Years | 1,644 (45.3%) | $100,137 |
| 65+ Years | 1,094 (30.1%) | $56,649 |
| Total | 3,631 (100.0%) | $90,264 |
Poverty in Brookhaven borough
Income Below Poverty by Sex and Age in Brookhaven borough
With 3.3% poverty level for males and 5.0% for females among the residents of Brookhaven borough, 16 and 17 year old males and 6 to 11 year old females are the most vulnerable to poverty, with 15 males (78.9%) and 19 females (10.3%) in their respective age groups living below the poverty level.
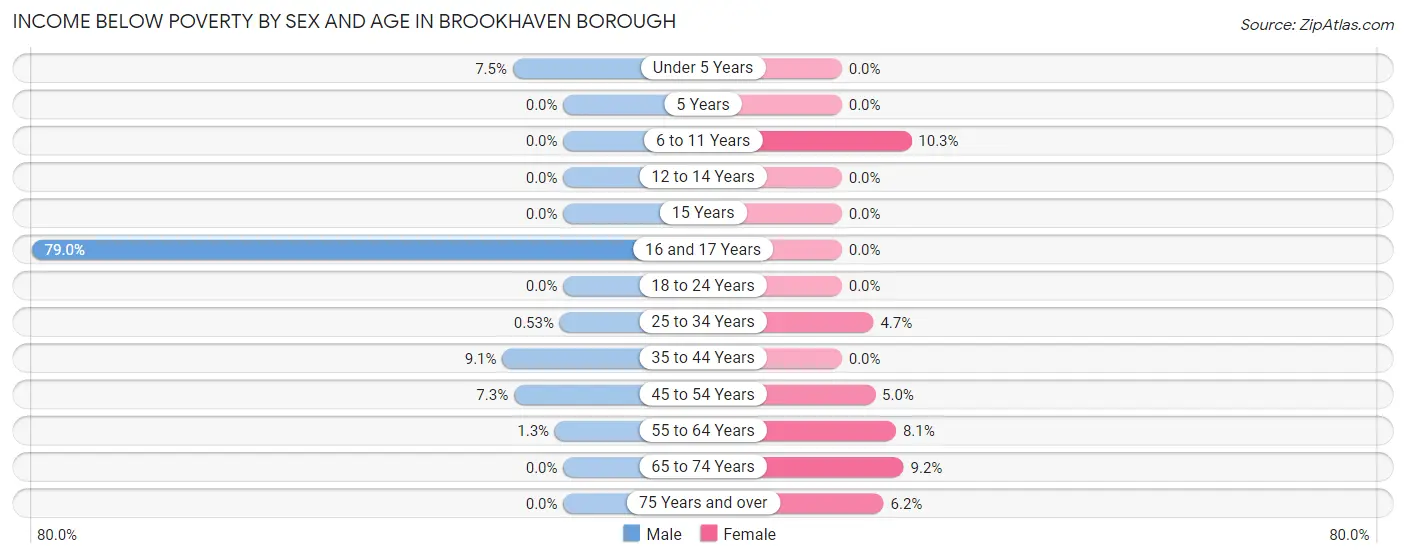
| Age Bracket | Male | Female |
| Under 5 Years | 28 (7.5%) | 0 (0.0%) |
| 5 Years | 0 (0.0%) | 0 (0.0%) |
| 6 to 11 Years | 0 (0.0%) | 19 (10.3%) |
| 12 to 14 Years | 0 (0.0%) | 0 (0.0%) |
| 15 Years | 0 (0.0%) | 0 (0.0%) |
| 16 and 17 Years | 15 (78.9%) | 0 (0.0%) |
| 18 to 24 Years | 0 (0.0%) | 0 (0.0%) |
| 25 to 34 Years | 3 (0.5%) | 29 (4.7%) |
| 35 to 44 Years | 46 (9.1%) | 0 (0.0%) |
| 45 to 54 Years | 43 (7.3%) | 21 (5.0%) |
| 55 to 64 Years | 9 (1.3%) | 60 (8.1%) |
| 65 to 74 Years | 0 (0.0%) | 39 (9.2%) |
| 75 Years and over | 0 (0.0%) | 26 (6.2%) |
| Total | 144 (3.3%) | 194 (5.0%) |
Income Above Poverty by Sex and Age in Brookhaven borough
According to the poverty statistics in Brookhaven borough, males aged 6 to 11 years and females aged under 5 years are the age groups that are most secure financially, with 100.0% of males and 100.0% of females in these age groups living above the poverty line.
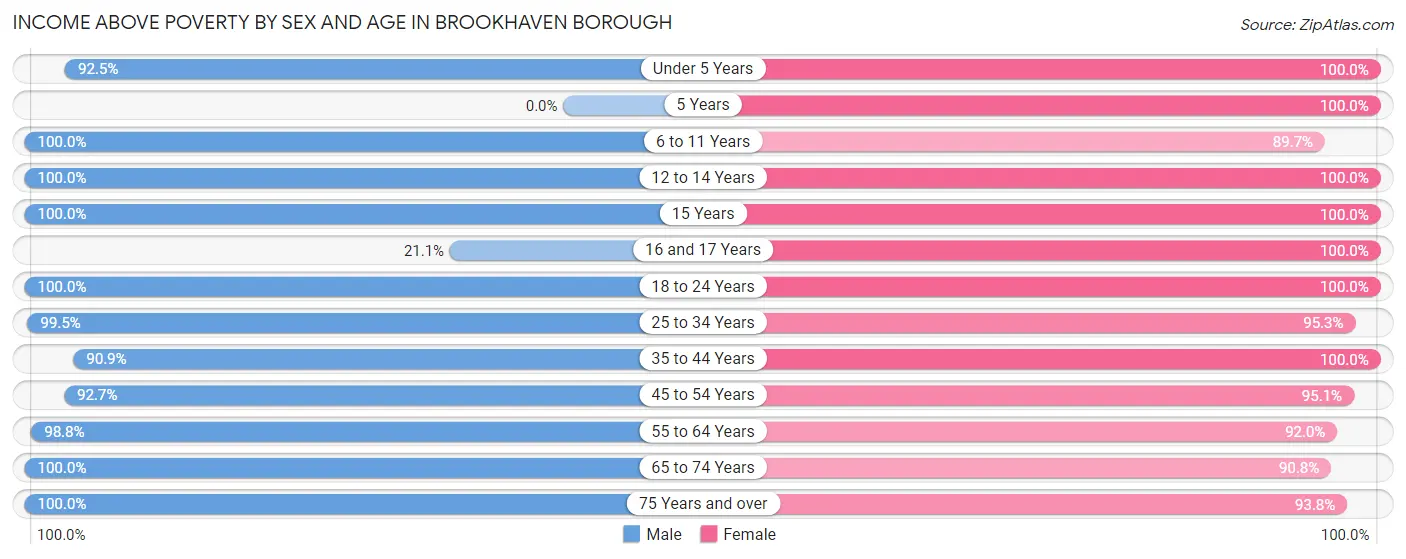
| Age Bracket | Male | Female |
| Under 5 Years | 345 (92.5%) | 229 (100.0%) |
| 5 Years | 0 (0.0%) | 9 (100.0%) |
| 6 to 11 Years | 255 (100.0%) | 165 (89.7%) |
| 12 to 14 Years | 316 (100.0%) | 75 (100.0%) |
| 15 Years | 41 (100.0%) | 106 (100.0%) |
| 16 and 17 Years | 4 (21.0%) | 26 (100.0%) |
| 18 to 24 Years | 278 (100.0%) | 204 (100.0%) |
| 25 to 34 Years | 560 (99.5%) | 588 (95.3%) |
| 35 to 44 Years | 462 (90.9%) | 424 (100.0%) |
| 45 to 54 Years | 544 (92.7%) | 403 (95.1%) |
| 55 to 64 Years | 709 (98.8%) | 685 (91.9%) |
| 65 to 74 Years | 325 (100.0%) | 386 (90.8%) |
| 75 Years and over | 380 (100.0%) | 393 (93.8%) |
| Total | 4,219 (96.7%) | 3,693 (95.0%) |
Income Below Poverty Among Married-Couple Families in Brookhaven borough
| Children | Above Poverty | Below Poverty |
| No Children | 885 (100.0%) | 0 (0.0%) |
| 1 or 2 Children | 618 (100.0%) | 0 (0.0%) |
| 3 or 4 Children | 30 (100.0%) | 0 (0.0%) |
| 5 or more Children | 0 (0.0%) | 0 (0.0%) |
| Total | 1,533 (100.0%) | 0 (0.0%) |
Income Below Poverty Among Single-Parent Households in Brookhaven borough
According to the poverty data in Brookhaven borough, 5.7% or 18 single-father households and 7.3% or 29 single-mother households are living below the poverty line. Among single-father households, those with 1 or 2 children have the highest poverty rate, with 18 households (7.0%) experiencing poverty. Likewise, among single-mother households, those with 1 or 2 children have the highest poverty rate, with 29 households (11.4%) falling below the poverty line.
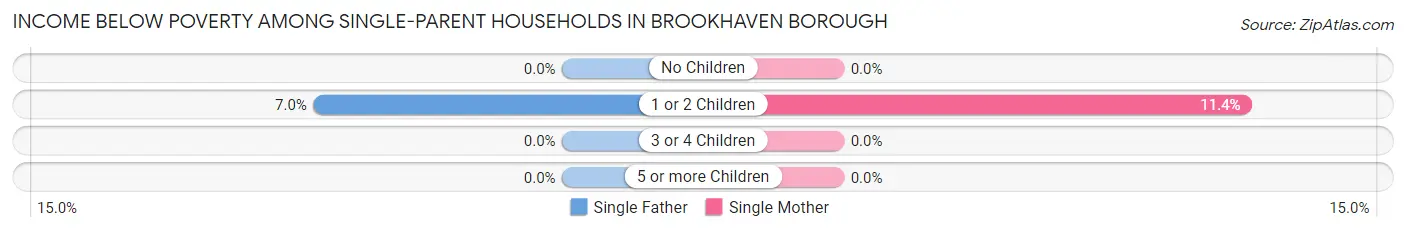
| Children | Single Father | Single Mother |
| No Children | 0 (0.0%) | 0 (0.0%) |
| 1 or 2 Children | 18 (7.0%) | 29 (11.4%) |
| 3 or 4 Children | 0 (0.0%) | 0 (0.0%) |
| 5 or more Children | 0 (0.0%) | 0 (0.0%) |
| Total | 18 (5.7%) | 29 (7.3%) |
Income Below Poverty Among Married-Couple vs Single-Parent Households in Brookhaven borough
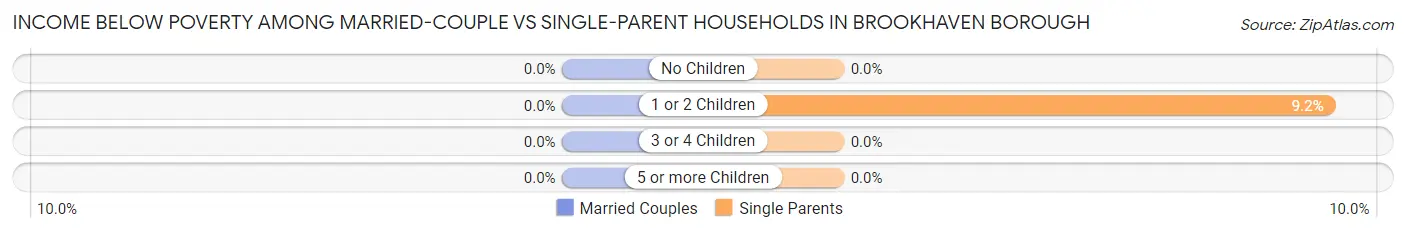
| Children | Married-Couple Families | Single-Parent Households |
| No Children | 0 (0.0%) | 0 (0.0%) |
| 1 or 2 Children | 0 (0.0%) | 47 (9.2%) |
| 3 or 4 Children | 0 (0.0%) | 0 (0.0%) |
| 5 or more Children | 0 (0.0%) | 0 (0.0%) |
| Total | 0 (0.0%) | 47 (6.6%) |
Race in Brookhaven borough
The most populous races in Brookhaven borough are White / Caucasian (7,185 | 86.9%), Black / African American (641 | 7.7%), and Two or more Races (360 | 4.3%).
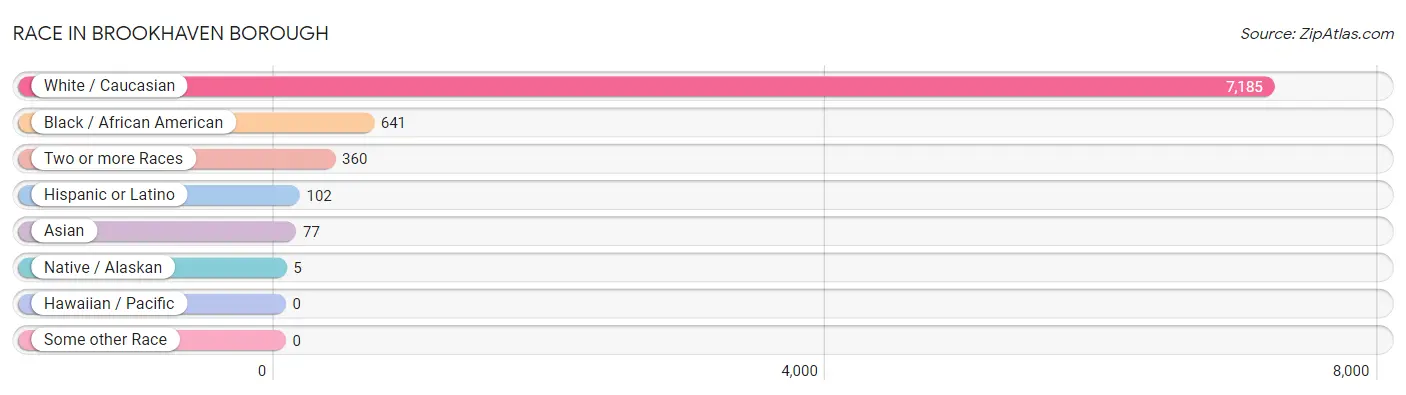
| Race | # Population | % Population |
| Asian | 77 | 0.9% |
| Black / African American | 641 | 7.7% |
| Hawaiian / Pacific | 0 | 0.0% |
| Hispanic or Latino | 102 | 1.2% |
| Native / Alaskan | 5 | 0.1% |
| White / Caucasian | 7,185 | 86.9% |
| Two or more Races | 360 | 4.3% |
| Some other Race | 0 | 0.0% |
| Total | 8,268 | 100.0% |
Ancestry in Brookhaven borough
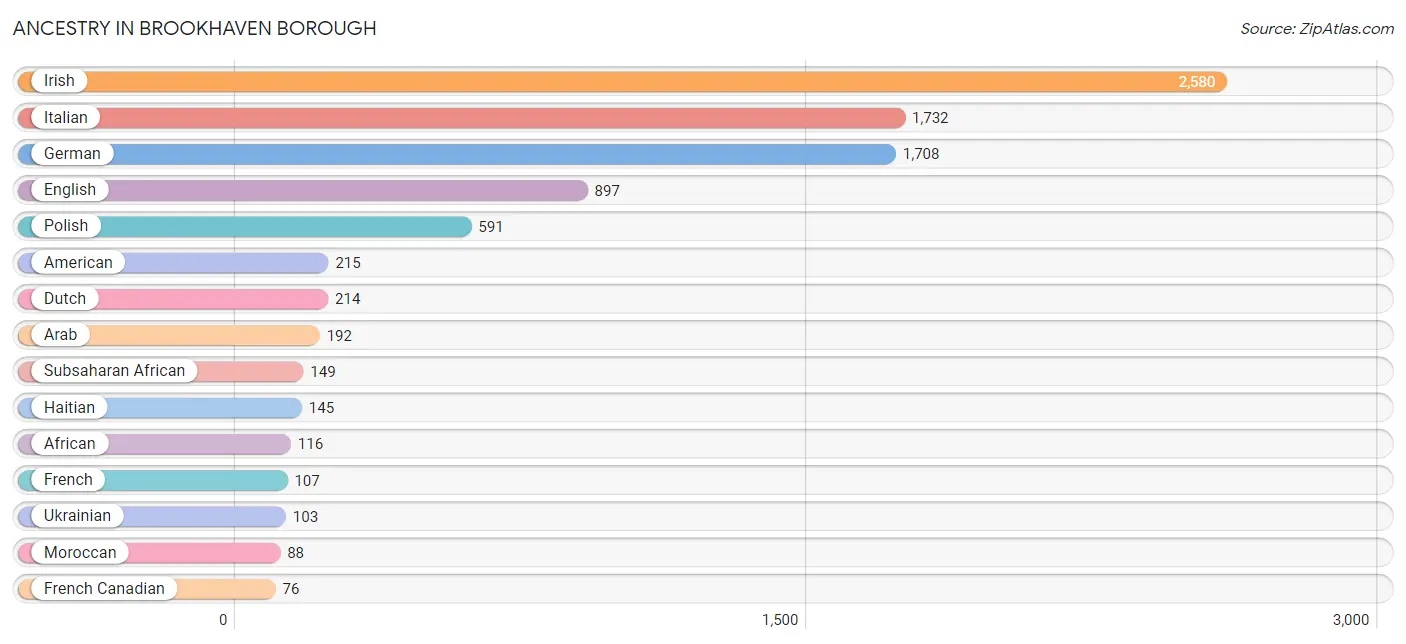
The most populous ancestries reported in Brookhaven borough are Irish (2,580 | 31.2%), Italian (1,732 | 20.9%), German (1,708 | 20.7%), English (897 | 10.8%), and Polish (591 | 7.1%), together accounting for 90.8% of all Brookhaven borough residents.
| Ancestry | # Population | % Population |
| African | 116 | 1.4% |
| Albanian | 65 | 0.8% |
| American | 215 | 2.6% |
| Arab | 192 | 2.3% |
| Armenian | 18 | 0.2% |
| Barbadian | 7 | 0.1% |
| British | 43 | 0.5% |
| Burmese | 45 | 0.5% |
| Canadian | 20 | 0.2% |
| Carpatho Rusyn | 19 | 0.2% |
| Central American Indian | 5 | 0.1% |
| Czech | 58 | 0.7% |
| Delaware | 27 | 0.3% |
| Dutch | 214 | 2.6% |
| Eastern European | 31 | 0.4% |
| English | 897 | 10.8% |
| European | 68 | 0.8% |
| Filipino | 35 | 0.4% |
| Finnish | 19 | 0.2% |
| French | 107 | 1.3% |
| French Canadian | 76 | 0.9% |
| German | 1,708 | 20.7% |
| Ghanaian | 11 | 0.1% |
| Greek | 54 | 0.6% |
| Haitian | 145 | 1.8% |
| Hungarian | 23 | 0.3% |
| Irish | 2,580 | 31.2% |
| Italian | 1,732 | 20.9% |
| Jordanian | 3 | 0.0% |
| Korean | 40 | 0.5% |
| Lebanese | 68 | 0.8% |
| Lithuanian | 36 | 0.4% |
| Mexican | 5 | 0.1% |
| Moroccan | 88 | 1.1% |
| Norwegian | 54 | 0.6% |
| Paraguayan | 33 | 0.4% |
| Pennsylvania German | 8 | 0.1% |
| Polish | 591 | 7.1% |
| Puerto Rican | 63 | 0.8% |
| Scandinavian | 9 | 0.1% |
| Scotch-Irish | 50 | 0.6% |
| Scottish | 56 | 0.7% |
| Slovak | 19 | 0.2% |
| South American | 33 | 0.4% |
| Subsaharan African | 149 | 1.8% |
| Swedish | 21 | 0.3% |
| Swiss | 52 | 0.6% |
| Syrian | 33 | 0.4% |
| Thai | 32 | 0.4% |
| Ukrainian | 103 | 1.3% |
| Welsh | 68 | 0.8% | View All 51 Rows |
Immigrants in Brookhaven borough
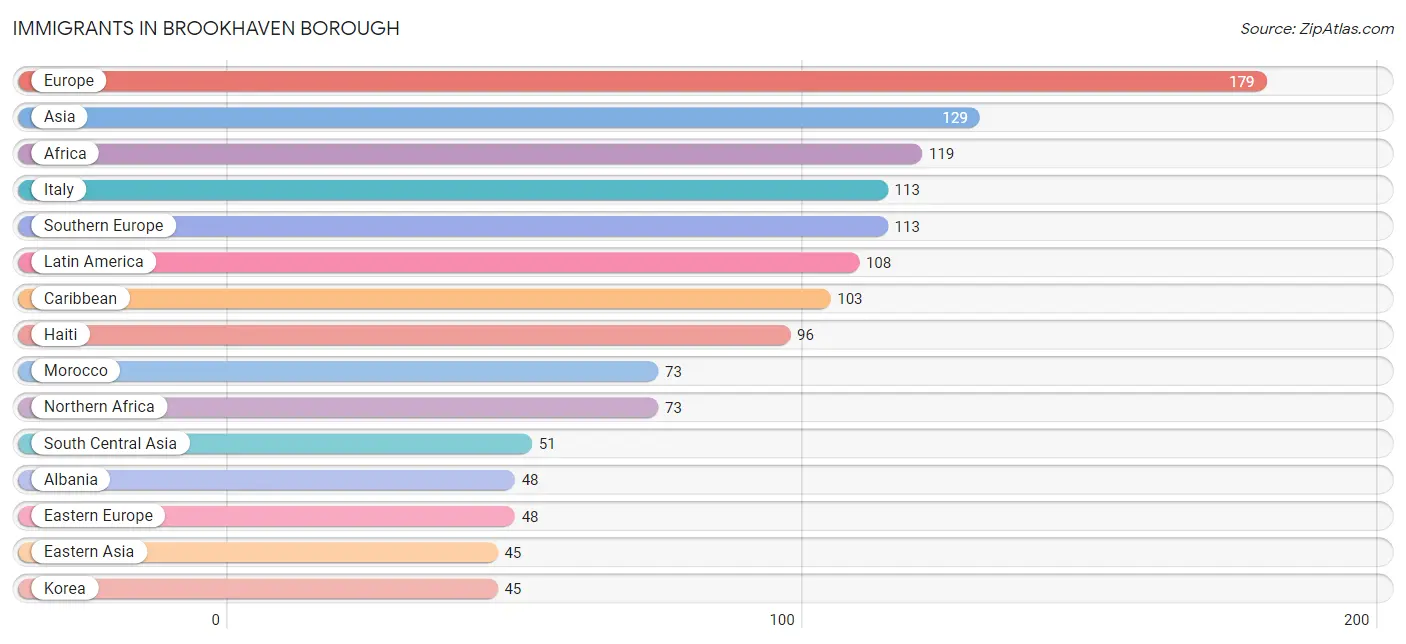
The most numerous immigrant groups reported in Brookhaven borough came from Europe (179 | 2.2%), Asia (129 | 1.6%), Africa (119 | 1.4%), Italy (113 | 1.4%), and Southern Europe (113 | 1.4%), together accounting for 7.9% of all Brookhaven borough residents.
| Immigration Origin | # Population | % Population |
| Africa | 119 | 1.4% |
| Albania | 48 | 0.6% |
| Asia | 129 | 1.6% |
| Barbados | 7 | 0.1% |
| Caribbean | 103 | 1.3% |
| Central America | 5 | 0.1% |
| Eastern Asia | 45 | 0.5% |
| Eastern Europe | 48 | 0.6% |
| England | 18 | 0.2% |
| Europe | 179 | 2.2% |
| Ghana | 11 | 0.1% |
| Haiti | 96 | 1.2% |
| India | 32 | 0.4% |
| Italy | 113 | 1.4% |
| Korea | 45 | 0.5% |
| Latin America | 108 | 1.3% |
| Mexico | 5 | 0.1% |
| Middle Africa | 22 | 0.3% |
| Morocco | 73 | 0.9% |
| Northern Africa | 73 | 0.9% |
| Northern Europe | 18 | 0.2% |
| Pakistan | 19 | 0.2% |
| South Central Asia | 51 | 0.6% |
| Southern Europe | 113 | 1.4% |
| Syria | 33 | 0.4% |
| Western Africa | 11 | 0.1% |
| Western Asia | 33 | 0.4% | View All 27 Rows |
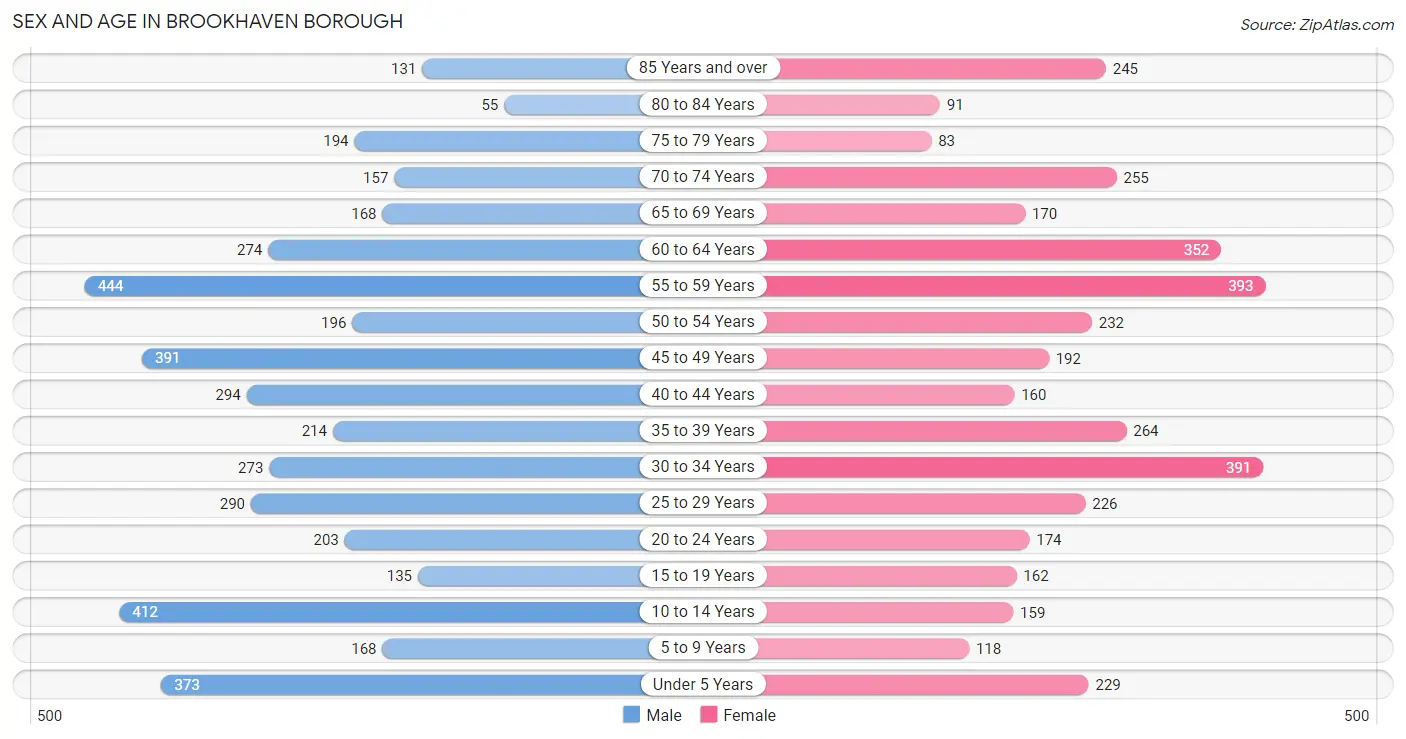
Sex and Age in Brookhaven borough
Sex and Age in Brookhaven borough
The most populous age groups in Brookhaven borough are 55 to 59 Years (444 | 10.2%) for men and 55 to 59 Years (393 | 10.1%) for women.
| Age Bracket | Male | Female |
| Under 5 Years | 373 (8.5%) | 229 (5.9%) |
| 5 to 9 Years | 168 (3.8%) | 118 (3.0%) |
| 10 to 14 Years | 412 (9.4%) | 159 (4.1%) |
| 15 to 19 Years | 135 (3.1%) | 162 (4.2%) |
| 20 to 24 Years | 203 (4.6%) | 174 (4.5%) |
| 25 to 29 Years | 290 (6.6%) | 226 (5.8%) |
| 30 to 34 Years | 273 (6.2%) | 391 (10.0%) |
| 35 to 39 Years | 214 (4.9%) | 264 (6.8%) |
| 40 to 44 Years | 294 (6.7%) | 160 (4.1%) |
| 45 to 49 Years | 391 (8.9%) | 192 (4.9%) |
| 50 to 54 Years | 196 (4.5%) | 232 (5.9%) |
| 55 to 59 Years | 444 (10.2%) | 393 (10.1%) |
| 60 to 64 Years | 274 (6.3%) | 352 (9.0%) |
| 65 to 69 Years | 168 (3.8%) | 170 (4.4%) |
| 70 to 74 Years | 157 (3.6%) | 255 (6.6%) |
| 75 to 79 Years | 194 (4.4%) | 83 (2.1%) |
| 80 to 84 Years | 55 (1.3%) | 91 (2.3%) |
| 85 Years and over | 131 (3.0%) | 245 (6.3%) |
| Total | 4,372 (100.0%) | 3,896 (100.0%) |
Families and Households in Brookhaven borough
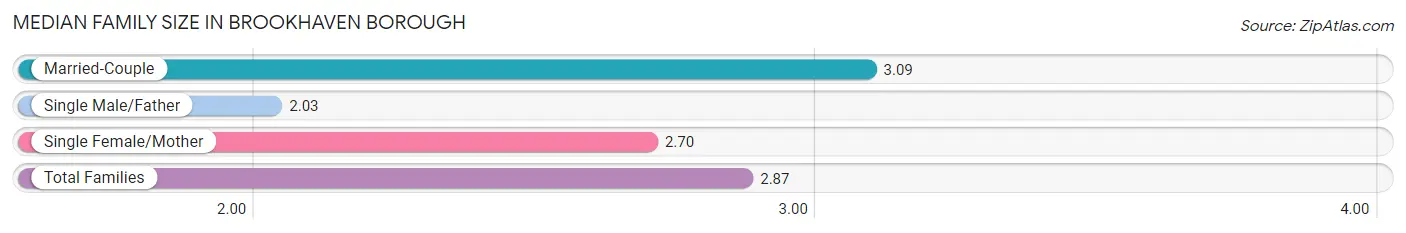
Median Family Size in Brookhaven borough
The median family size in Brookhaven borough is 2.87 persons per family, with married-couple families (1,533 | 68.2%) accounting for the largest median family size of 3.09 persons per family. On the other hand, single male/father families (318 | 14.1%) represent the smallest median family size with 2.03 persons per family.
| Family Type | # Families | Family Size |
| Married-Couple | 1,533 (68.2%) | 3.09 |
| Single Male/Father | 318 (14.1%) | 2.03 |
| Single Female/Mother | 396 (17.6%) | 2.70 |
| Total Families | 2,247 (100.0%) | 2.87 |
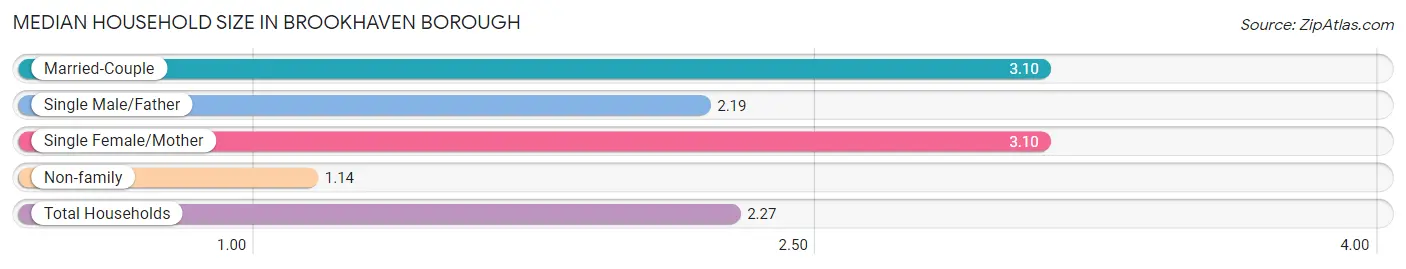
Median Household Size in Brookhaven borough
The median household size in Brookhaven borough is 2.27 persons per household, with married-couple households (1,533 | 42.2%) accounting for the largest median household size of 3.1 persons per household. non-family households (1,384 | 38.1%) represent the smallest median household size with 1.14 persons per household.
| Household Type | # Households | Household Size |
| Married-Couple | 1,533 (42.2%) | 3.10 |
| Single Male/Father | 318 (8.8%) | 2.19 |
| Single Female/Mother | 396 (10.9%) | 3.10 |
| Non-family | 1,384 (38.1%) | 1.14 |
| Total Households | 3,631 (100.0%) | 2.27 |
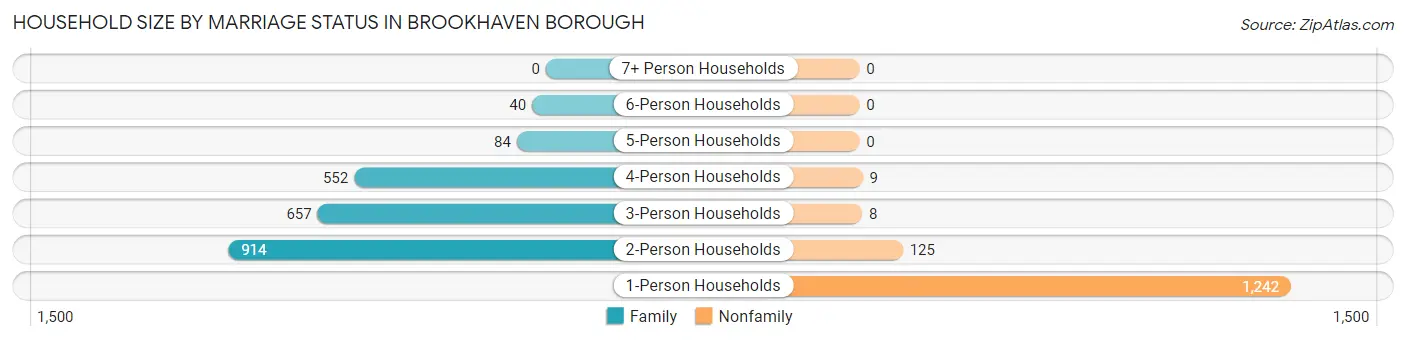
Household Size by Marriage Status in Brookhaven borough
Out of a total of 3,631 households in Brookhaven borough, 2,247 (61.9%) are family households, while 1,384 (38.1%) are nonfamily households. The most numerous type of family households are 2-person households, comprising 914, and the most common type of nonfamily households are 1-person households, comprising 1,242.
| Household Size | Family Households | Nonfamily Households |
| 1-Person Households | - | 1,242 (34.2%) |
| 2-Person Households | 914 (25.2%) | 125 (3.4%) |
| 3-Person Households | 657 (18.1%) | 8 (0.2%) |
| 4-Person Households | 552 (15.2%) | 9 (0.3%) |
| 5-Person Households | 84 (2.3%) | 0 (0.0%) |
| 6-Person Households | 40 (1.1%) | 0 (0.0%) |
| 7+ Person Households | 0 (0.0%) | 0 (0.0%) |
| Total | 2,247 (61.9%) | 1,384 (38.1%) |
Female Fertility in Brookhaven borough
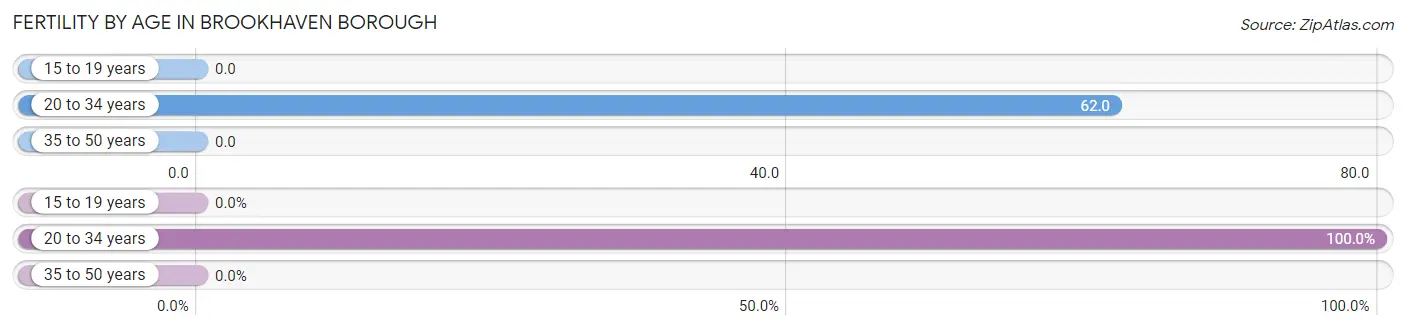
Fertility by Age in Brookhaven borough
Average fertility rate in Brookhaven borough is 31.0 births per 1,000 women. Women in the age bracket of 20 to 34 years have the highest fertility rate with 62.0 births per 1,000 women. Women in the age bracket of 20 to 34 years acount for 100.0% of all women with births.
| Age Bracket | Women with Births | Births / 1,000 Women |
| 15 to 19 years | 0 (0.0%) | 0.0 |
| 20 to 34 years | 49 (100.0%) | 62.0 |
| 35 to 50 years | 0 (0.0%) | 0.0 |
| Total | 49 (100.0%) | 31.0 |
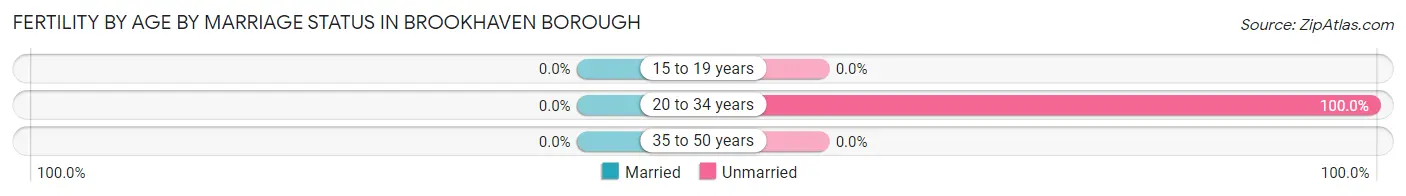
Fertility by Age by Marriage Status in Brookhaven borough
| Age Bracket | Married | Unmarried |
| 15 to 19 years | 0 (0.0%) | 0 (0.0%) |
| 20 to 34 years | 0 (0.0%) | 49 (100.0%) |
| 35 to 50 years | 0 (0.0%) | 0 (0.0%) |
| Total | 0 (0.0%) | 49 (100.0%) |
Fertility by Education in Brookhaven borough
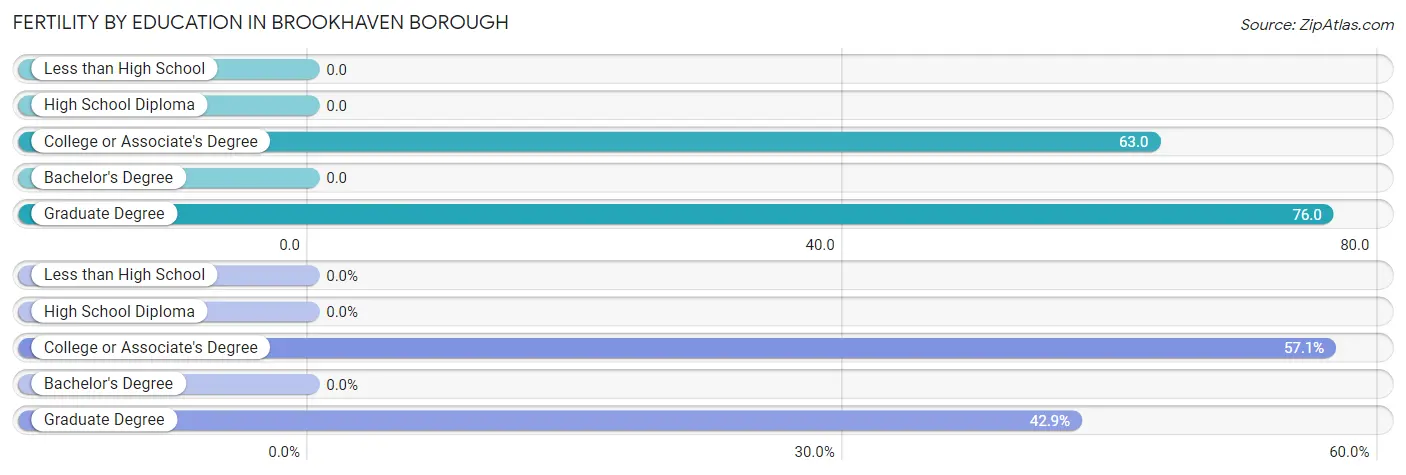
| Educational Attainment | Women with Births | Births / 1,000 Women |
| Less than High School | 0 (0.0%) | 0.0 |
| High School Diploma | 0 (0.0%) | 0.0 |
| College or Associate's Degree | 28 (57.1%) | 63.0 |
| Bachelor's Degree | 0 (0.0%) | 0.0 |
| Graduate Degree | 21 (42.9%) | 76.0 |
| Total | 49 (100.0%) | 31.0 |
Fertility by Education by Marriage Status in Brookhaven borough
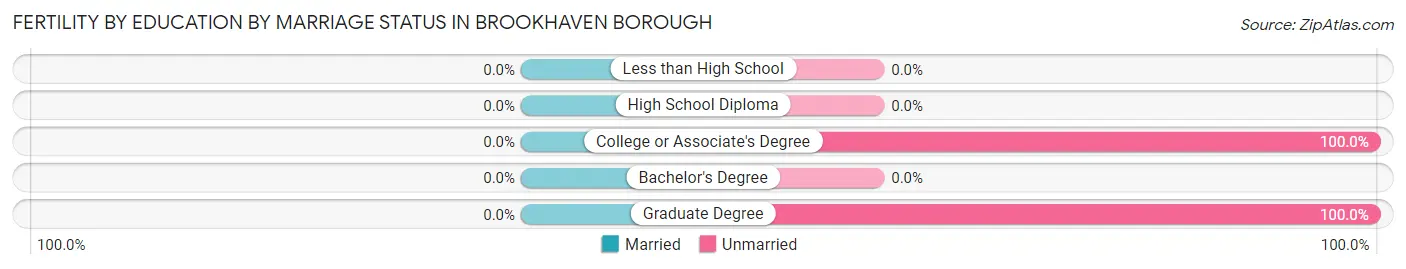
| Educational Attainment | Married | Unmarried |
| Less than High School | 0 (0.0%) | 0 (0.0%) |
| High School Diploma | 0 (0.0%) | 0 (0.0%) |
| College or Associate's Degree | 0 (0.0%) | 28 (100.0%) |
| Bachelor's Degree | 0 (0.0%) | 0 (0.0%) |
| Graduate Degree | 0 (0.0%) | 21 (100.0%) |
| Total | 0 (0.0%) | 49 (100.0%) |
Employment Characteristics in Brookhaven borough
Employment by Class of Employer in Brookhaven borough
Among the 4,444 employed individuals in Brookhaven borough, private company employees (2,822 | 63.5%), not-for-profit organizations (580 | 13.1%), and self-employed (not incorporated) (399 | 9.0%) make up the most common classes of employment.
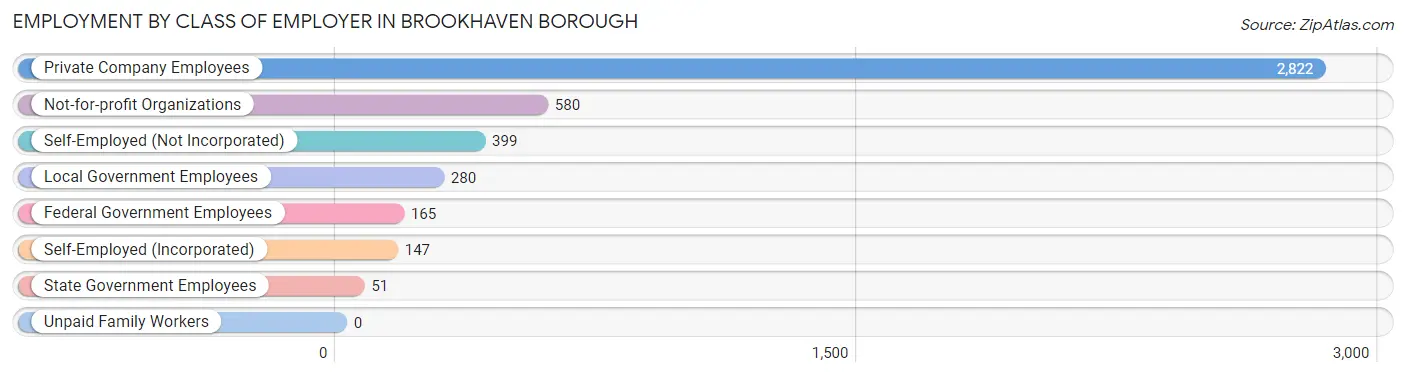
| Employer Class | # Employees | % Employees |
| Private Company Employees | 2,822 | 63.5% |
| Self-Employed (Incorporated) | 147 | 3.3% |
| Self-Employed (Not Incorporated) | 399 | 9.0% |
| Not-for-profit Organizations | 580 | 13.1% |
| Local Government Employees | 280 | 6.3% |
| State Government Employees | 51 | 1.1% |
| Federal Government Employees | 165 | 3.7% |
| Unpaid Family Workers | 0 | 0.0% |
| Total | 4,444 | 100.0% |
Employment Status by Age in Brookhaven borough
According to the labor force statistics for Brookhaven borough, out of the total population over 16 years of age (6,662), 69.8% or 4,650 individuals are in the labor force, with 3.6% or 167 of them unemployed. The age group with the highest labor force participation rate is 30 to 34 years, with 96.7% or 642 individuals in the labor force. Within the labor force, the 16 to 19 years age range has the highest percentage of unemployed individuals, with 60.0% or 27 of them being unemployed.
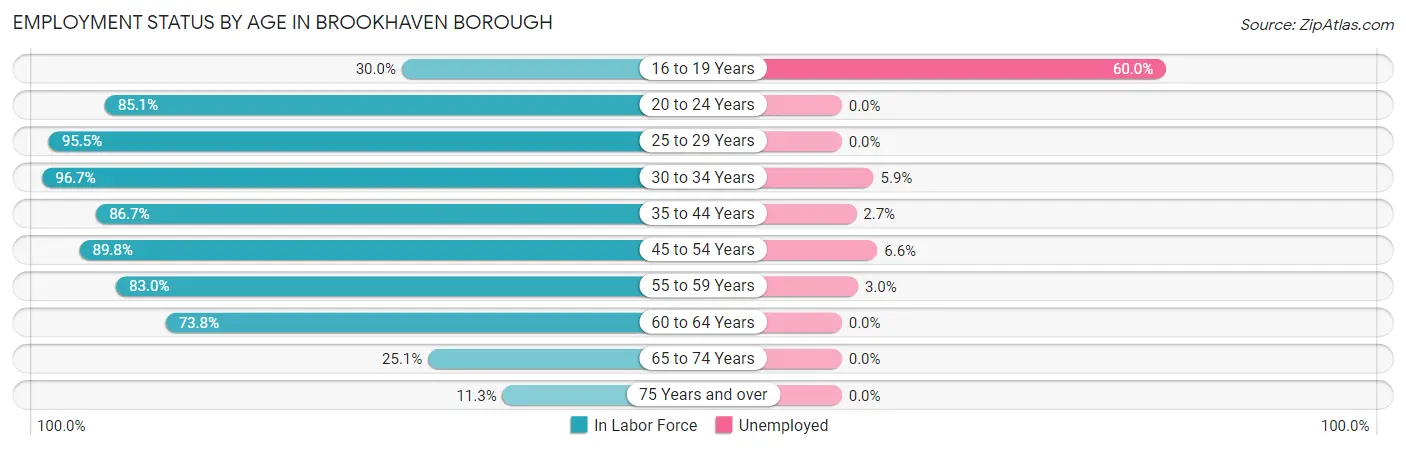
| Age Bracket | In Labor Force | Unemployed |
| 16 to 19 Years | 45 (30.0%) | 27 (60.0%) |
| 20 to 24 Years | 321 (85.1%) | 0 (0.0%) |
| 25 to 29 Years | 493 (95.5%) | 0 (0.0%) |
| 30 to 34 Years | 642 (96.7%) | 38 (5.9%) |
| 35 to 44 Years | 808 (86.7%) | 22 (2.7%) |
| 45 to 54 Years | 908 (89.8%) | 60 (6.6%) |
| 55 to 59 Years | 695 (83.0%) | 21 (3.0%) |
| 60 to 64 Years | 462 (73.8%) | 0 (0.0%) |
| 65 to 74 Years | 188 (25.1%) | 0 (0.0%) |
| 75 Years and over | 90 (11.3%) | 0 (0.0%) |
| Total | 4,650 (69.8%) | 167 (3.6%) |
Employment Status by Educational Attainment in Brookhaven borough
According to labor force statistics for Brookhaven borough, 87.4% of individuals (4,008) out of the total population between 25 and 64 years of age (4,586) are in the labor force, with 3.5% or 140 of them being unemployed. The group with the highest labor force participation rate are those with the educational attainment of college / associate degree, with 89.4% or 1,318 individuals in the labor force. Within the labor force, individuals with less than high school education have the highest percentage of unemployment, with 12.4% or 16 of them being unemployed.
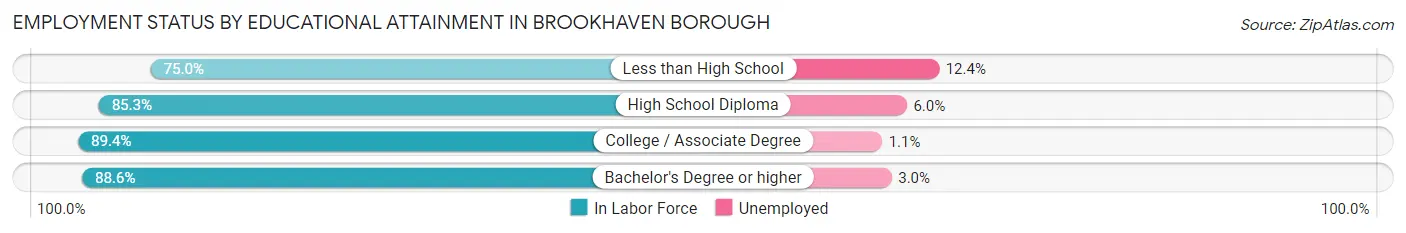
| Educational Attainment | In Labor Force | Unemployed |
| Less than High School | 129 (75.0%) | 21 (12.4%) |
| High School Diploma | 1,135 (85.3%) | 80 (6.0%) |
| College / Associate Degree | 1,318 (89.4%) | 16 (1.1%) |
| Bachelor's Degree or higher | 1,426 (88.6%) | 48 (3.0%) |
| Total | 4,008 (87.4%) | 161 (3.5%) |
Employment Occupations by Sex in Brookhaven borough
Management, Business, Science and Arts Occupations
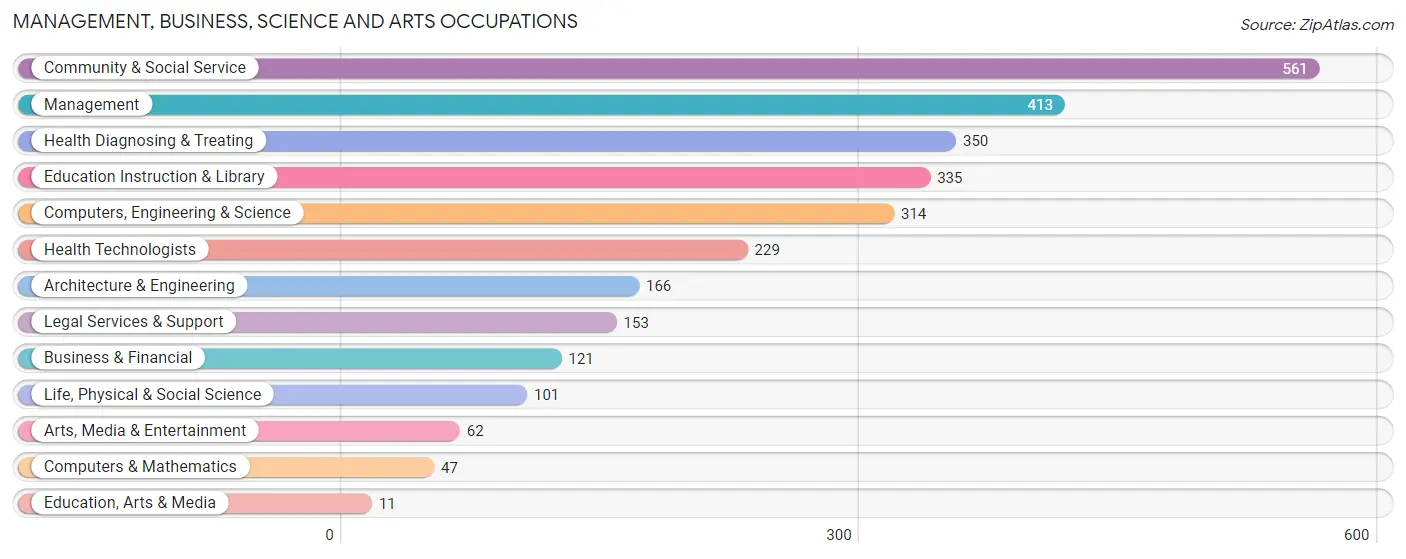
The most common Management, Business, Science and Arts occupations in Brookhaven borough are Community & Social Service (561 | 12.5%), Management (413 | 9.2%), Health Diagnosing & Treating (350 | 7.8%), Education Instruction & Library (335 | 7.5%), and Computers, Engineering & Science (314 | 7.0%).
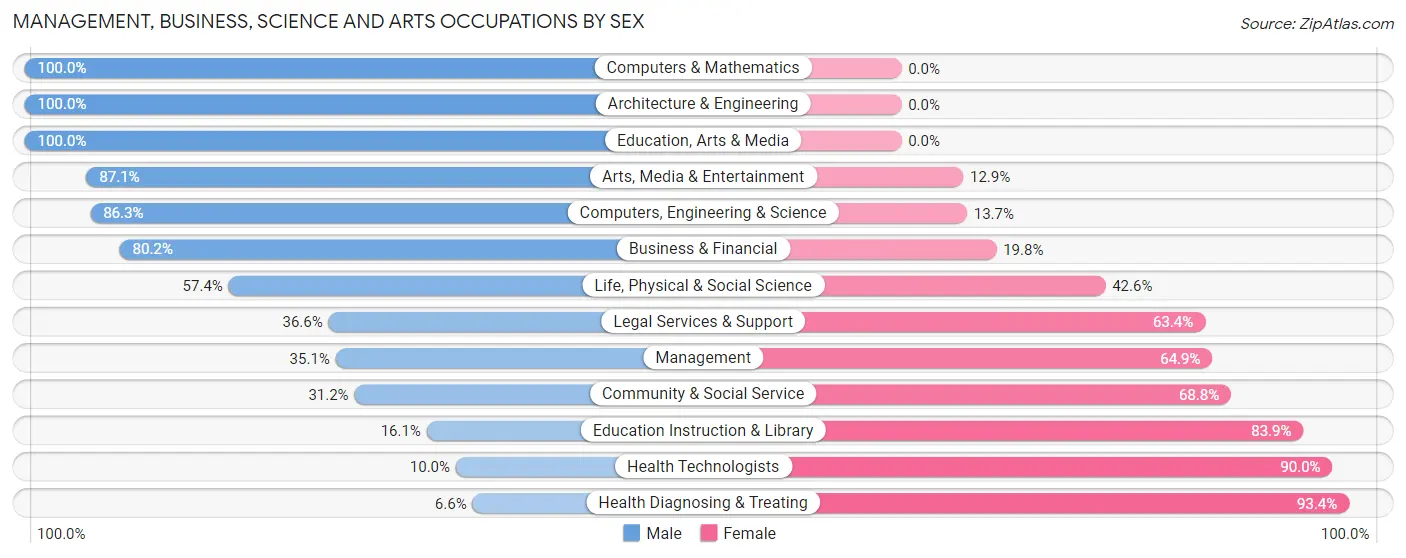
Management, Business, Science and Arts Occupations by Sex
Within the Management, Business, Science and Arts occupations in Brookhaven borough, the most male-oriented occupations are Computers & Mathematics (100.0%), Architecture & Engineering (100.0%), and Education, Arts & Media (100.0%), while the most female-oriented occupations are Health Diagnosing & Treating (93.4%), Health Technologists (90.0%), and Education Instruction & Library (83.9%).
| Occupation | Male | Female |
| Management | 145 (35.1%) | 268 (64.9%) |
| Business & Financial | 97 (80.2%) | 24 (19.8%) |
| Computers, Engineering & Science | 271 (86.3%) | 43 (13.7%) |
| Computers & Mathematics | 47 (100.0%) | 0 (0.0%) |
| Architecture & Engineering | 166 (100.0%) | 0 (0.0%) |
| Life, Physical & Social Science | 58 (57.4%) | 43 (42.6%) |
| Community & Social Service | 175 (31.2%) | 386 (68.8%) |
| Education, Arts & Media | 11 (100.0%) | 0 (0.0%) |
| Legal Services & Support | 56 (36.6%) | 97 (63.4%) |
| Education Instruction & Library | 54 (16.1%) | 281 (83.9%) |
| Arts, Media & Entertainment | 54 (87.1%) | 8 (12.9%) |
| Health Diagnosing & Treating | 23 (6.6%) | 327 (93.4%) |
| Health Technologists | 23 (10.0%) | 206 (90.0%) |
| Total (Category) | 711 (40.4%) | 1,048 (59.6%) |
| Total (Overall) | 2,418 (53.9%) | 2,066 (46.1%) |
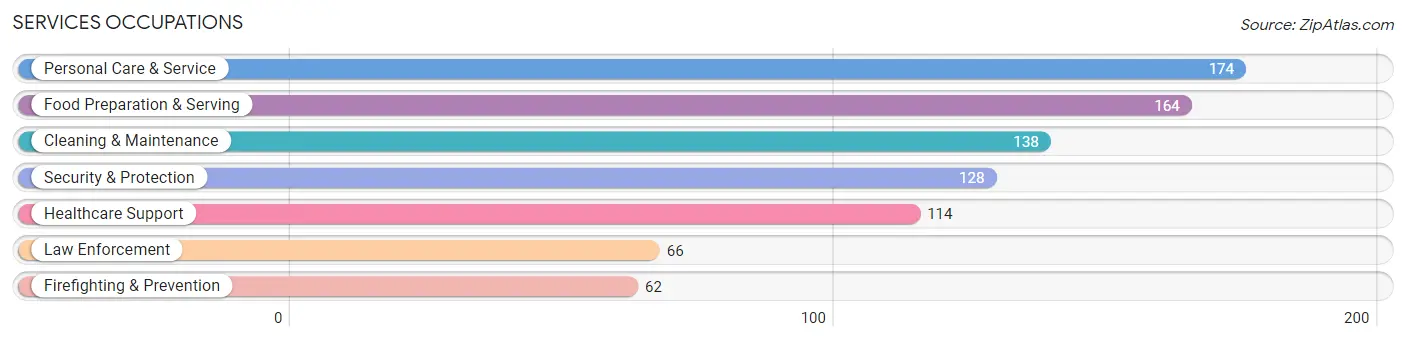
Services Occupations
The most common Services occupations in Brookhaven borough are Personal Care & Service (174 | 3.9%), Food Preparation & Serving (164 | 3.7%), Cleaning & Maintenance (138 | 3.1%), Security & Protection (128 | 2.9%), and Healthcare Support (114 | 2.5%).
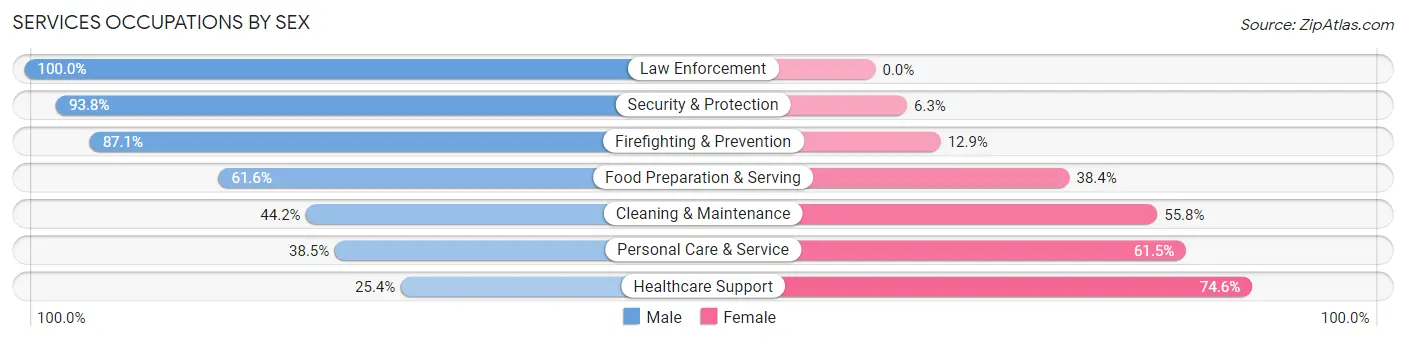
Services Occupations by Sex
Within the Services occupations in Brookhaven borough, the most male-oriented occupations are Law Enforcement (100.0%), Security & Protection (93.8%), and Firefighting & Prevention (87.1%), while the most female-oriented occupations are Healthcare Support (74.6%), Personal Care & Service (61.5%), and Cleaning & Maintenance (55.8%).
| Occupation | Male | Female |
| Healthcare Support | 29 (25.4%) | 85 (74.6%) |
| Security & Protection | 120 (93.8%) | 8 (6.2%) |
| Firefighting & Prevention | 54 (87.1%) | 8 (12.9%) |
| Law Enforcement | 66 (100.0%) | 0 (0.0%) |
| Food Preparation & Serving | 101 (61.6%) | 63 (38.4%) |
| Cleaning & Maintenance | 61 (44.2%) | 77 (55.8%) |
| Personal Care & Service | 67 (38.5%) | 107 (61.5%) |
| Total (Category) | 378 (52.6%) | 340 (47.3%) |
| Total (Overall) | 2,418 (53.9%) | 2,066 (46.1%) |
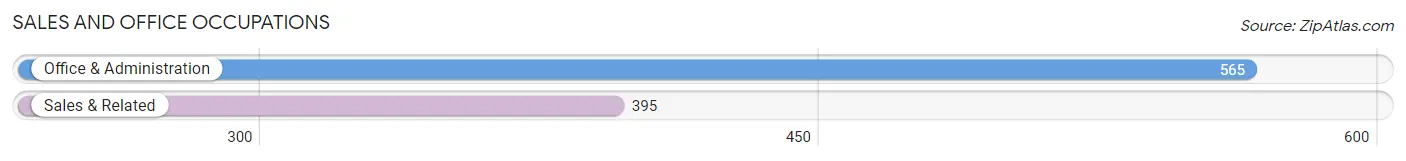
Sales and Office Occupations
The most common Sales and Office occupations in Brookhaven borough are Office & Administration (565 | 12.6%), and Sales & Related (395 | 8.8%).
Sales and Office Occupations by Sex
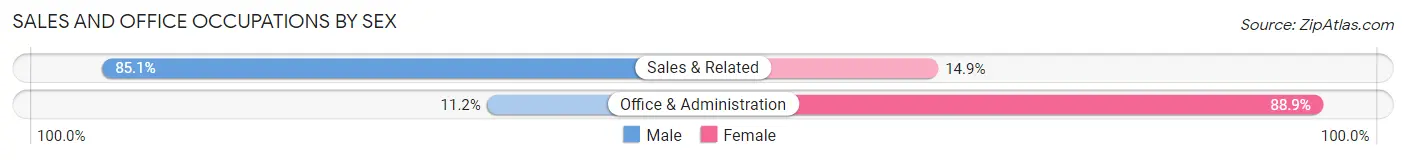
| Occupation | Male | Female |
| Sales & Related | 336 (85.1%) | 59 (14.9%) |
| Office & Administration | 63 (11.2%) | 502 (88.8%) |
| Total (Category) | 399 (41.6%) | 561 (58.4%) |
| Total (Overall) | 2,418 (53.9%) | 2,066 (46.1%) |
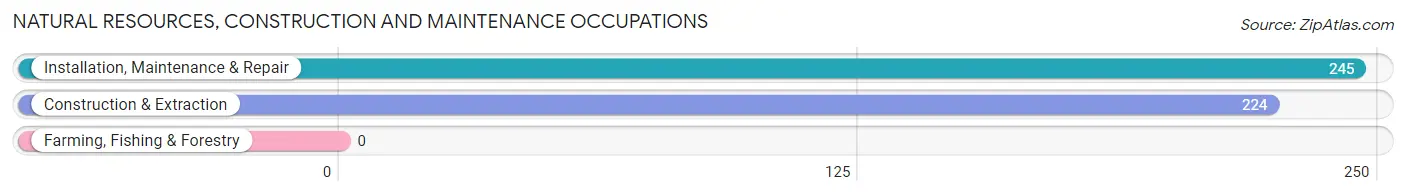
Natural Resources, Construction and Maintenance Occupations
The most common Natural Resources, Construction and Maintenance occupations in Brookhaven borough are Installation, Maintenance & Repair (245 | 5.5%), and Construction & Extraction (224 | 5.0%).
Natural Resources, Construction and Maintenance Occupations by Sex
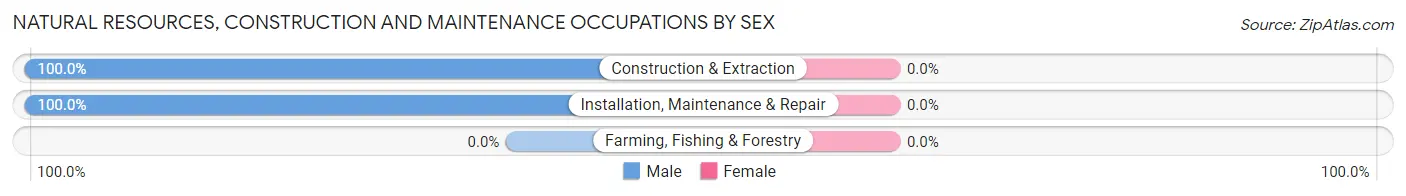
| Occupation | Male | Female |
| Farming, Fishing & Forestry | 0 (0.0%) | 0 (0.0%) |
| Construction & Extraction | 224 (100.0%) | 0 (0.0%) |
| Installation, Maintenance & Repair | 245 (100.0%) | 0 (0.0%) |
| Total (Category) | 469 (100.0%) | 0 (0.0%) |
| Total (Overall) | 2,418 (53.9%) | 2,066 (46.1%) |
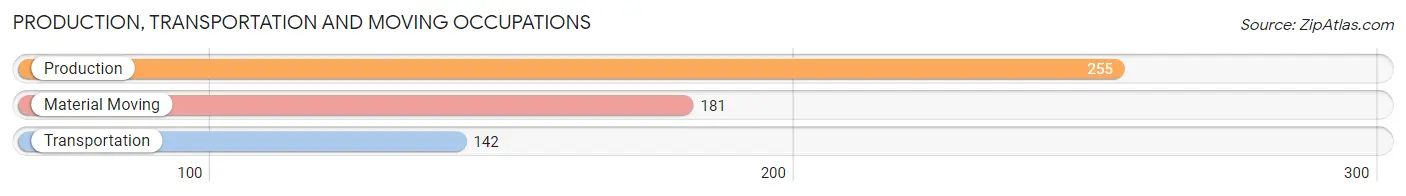
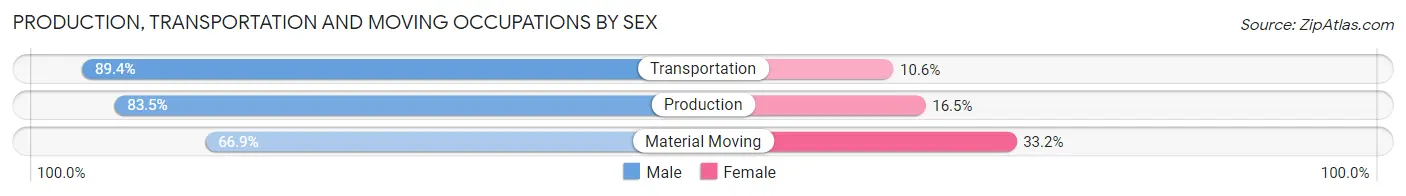
Production, Transportation and Moving Occupations
The most common Production, Transportation and Moving occupations in Brookhaven borough are Production (255 | 5.7%), Material Moving (181 | 4.0%), and Transportation (142 | 3.2%).
Production, Transportation and Moving Occupations by Sex
| Occupation | Male | Female |
| Production | 213 (83.5%) | 42 (16.5%) |
| Transportation | 127 (89.4%) | 15 (10.6%) |
| Material Moving | 121 (66.8%) | 60 (33.2%) |
| Total (Category) | 461 (79.8%) | 117 (20.2%) |
| Total (Overall) | 2,418 (53.9%) | 2,066 (46.1%) |
Employment Industries by Sex in Brookhaven borough
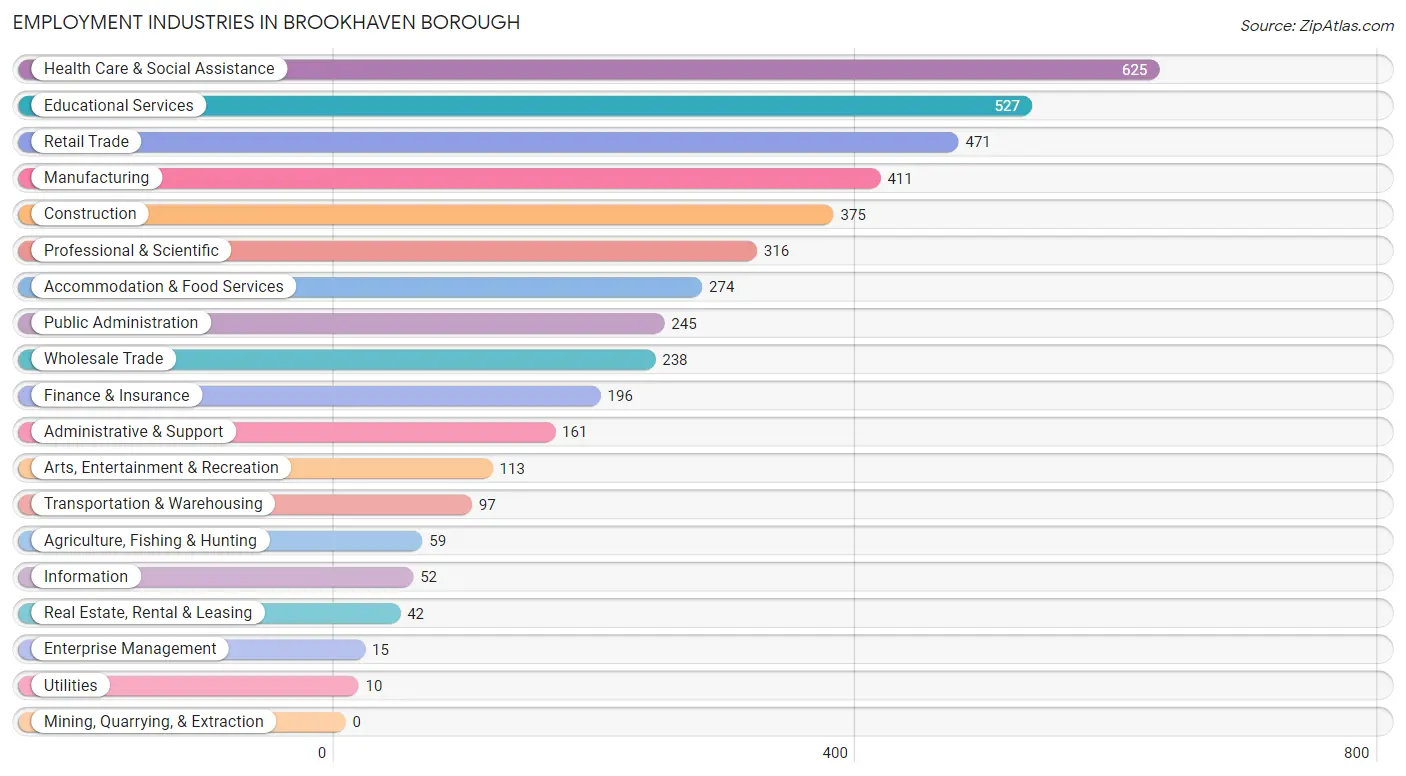
Employment Industries in Brookhaven borough
The major employment industries in Brookhaven borough include Health Care & Social Assistance (625 | 13.9%), Educational Services (527 | 11.7%), Retail Trade (471 | 10.5%), Manufacturing (411 | 9.2%), and Construction (375 | 8.4%).
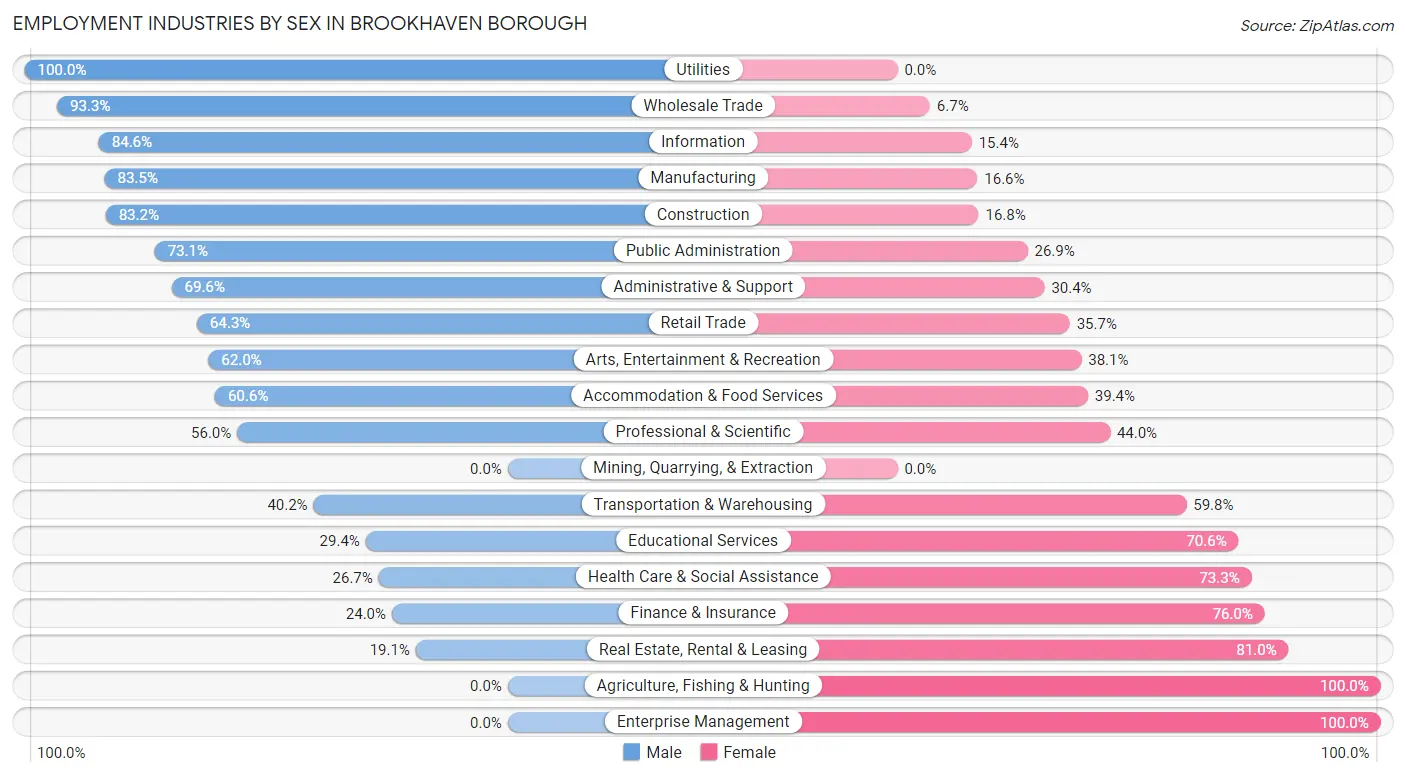
Employment Industries by Sex in Brookhaven borough
The Brookhaven borough industries that see more men than women are Utilities (100.0%), Wholesale Trade (93.3%), and Information (84.6%), whereas the industries that tend to have a higher number of women are Agriculture, Fishing & Hunting (100.0%), Enterprise Management (100.0%), and Real Estate, Rental & Leasing (80.9%).
| Industry | Male | Female |
| Agriculture, Fishing & Hunting | 0 (0.0%) | 59 (100.0%) |
| Mining, Quarrying, & Extraction | 0 (0.0%) | 0 (0.0%) |
| Construction | 312 (83.2%) | 63 (16.8%) |
| Manufacturing | 343 (83.5%) | 68 (16.6%) |
| Wholesale Trade | 222 (93.3%) | 16 (6.7%) |
| Retail Trade | 303 (64.3%) | 168 (35.7%) |
| Transportation & Warehousing | 39 (40.2%) | 58 (59.8%) |
| Utilities | 10 (100.0%) | 0 (0.0%) |
| Information | 44 (84.6%) | 8 (15.4%) |
| Finance & Insurance | 47 (24.0%) | 149 (76.0%) |
| Real Estate, Rental & Leasing | 8 (19.1%) | 34 (80.9%) |
| Professional & Scientific | 177 (56.0%) | 139 (44.0%) |
| Enterprise Management | 0 (0.0%) | 15 (100.0%) |
| Administrative & Support | 112 (69.6%) | 49 (30.4%) |
| Educational Services | 155 (29.4%) | 372 (70.6%) |
| Health Care & Social Assistance | 167 (26.7%) | 458 (73.3%) |
| Arts, Entertainment & Recreation | 70 (62.0%) | 43 (38.1%) |
| Accommodation & Food Services | 166 (60.6%) | 108 (39.4%) |
| Public Administration | 179 (73.1%) | 66 (26.9%) |
| Total | 2,418 (53.9%) | 2,066 (46.1%) |
Education in Brookhaven borough
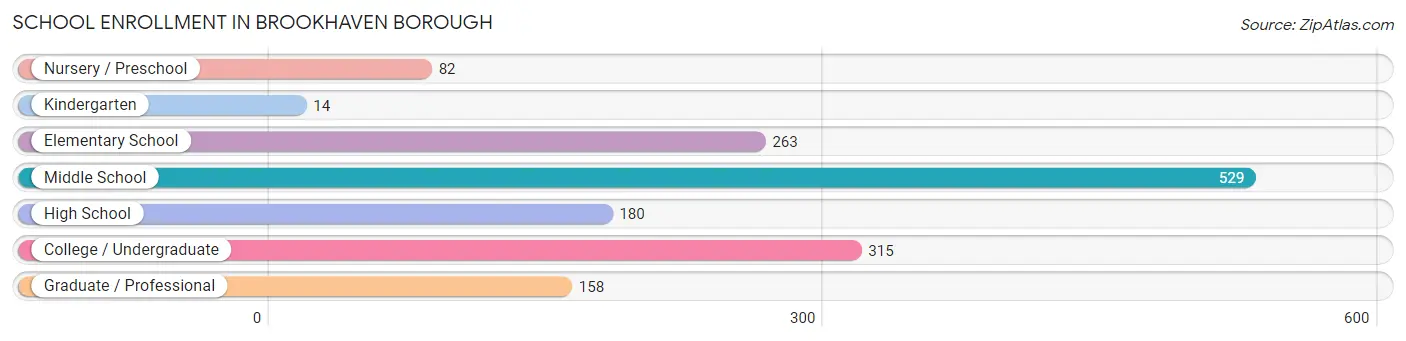
School Enrollment in Brookhaven borough
The most common levels of schooling among the 1,541 students in Brookhaven borough are middle school (529 | 34.3%), college / undergraduate (315 | 20.4%), and elementary school (263 | 17.1%).
| School Level | # Students | % Students |
| Nursery / Preschool | 82 | 5.3% |
| Kindergarten | 14 | 0.9% |
| Elementary School | 263 | 17.1% |
| Middle School | 529 | 34.3% |
| High School | 180 | 11.7% |
| College / Undergraduate | 315 | 20.4% |
| Graduate / Professional | 158 | 10.2% |
| Total | 1,541 | 100.0% |
School Enrollment by Age by Funding Source in Brookhaven borough
Out of a total of 1,541 students who are enrolled in schools in Brookhaven borough, 331 (21.5%) attend a private institution, while the remaining 1,210 (78.5%) are enrolled in public schools. The age group of 25 to 34 year olds has the highest likelihood of being enrolled in private schools, with 113 (57.7% in the age bracket) enrolled. Conversely, the age group of 3 to 4 year olds has the lowest likelihood of being enrolled in a private school, with 82 (100.0% in the age bracket) attending a public institution.
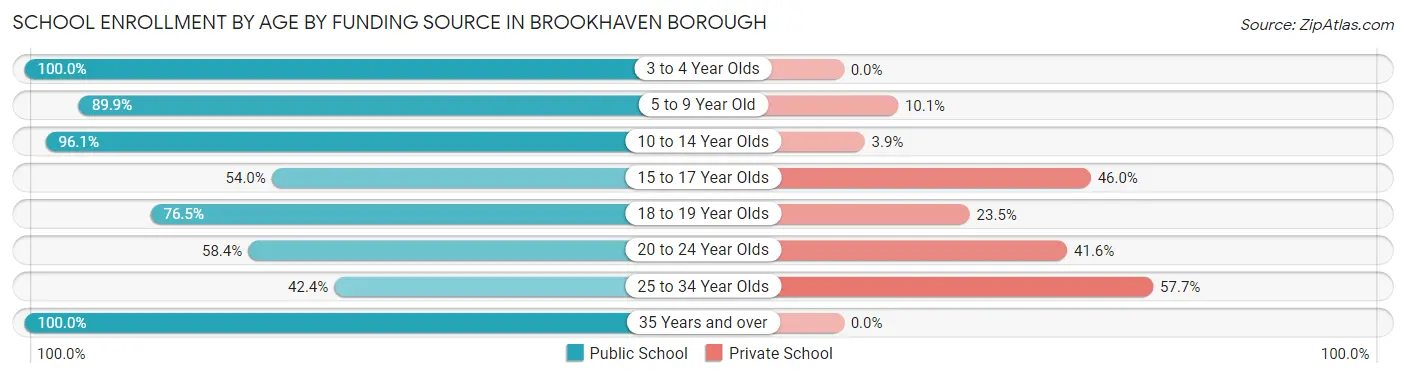
| Age Bracket | Public School | Private School |
| 3 to 4 Year Olds | 82 (100.0%) | 0 (0.0%) |
| 5 to 9 Year Old | 249 (89.9%) | 28 (10.1%) |
| 10 to 14 Year Olds | 518 (96.1%) | 21 (3.9%) |
| 15 to 17 Year Olds | 88 (54.0%) | 75 (46.0%) |
| 18 to 19 Year Olds | 75 (76.5%) | 23 (23.5%) |
| 20 to 24 Year Olds | 101 (58.4%) | 72 (41.6%) |
| 25 to 34 Year Olds | 83 (42.3%) | 113 (57.7%) |
| 35 Years and over | 13 (100.0%) | 0 (0.0%) |
| Total | 1,210 (78.5%) | 331 (21.5%) |
Educational Attainment by Field of Study in Brookhaven borough
Business (417 | 20.2%), education (341 | 16.6%), engineering (210 | 10.2%), science & technology (171 | 8.3%), and bio, nature & agricultural (148 | 7.2%) are the most common fields of study among 2,061 individuals in Brookhaven borough who have obtained a bachelor's degree or higher.
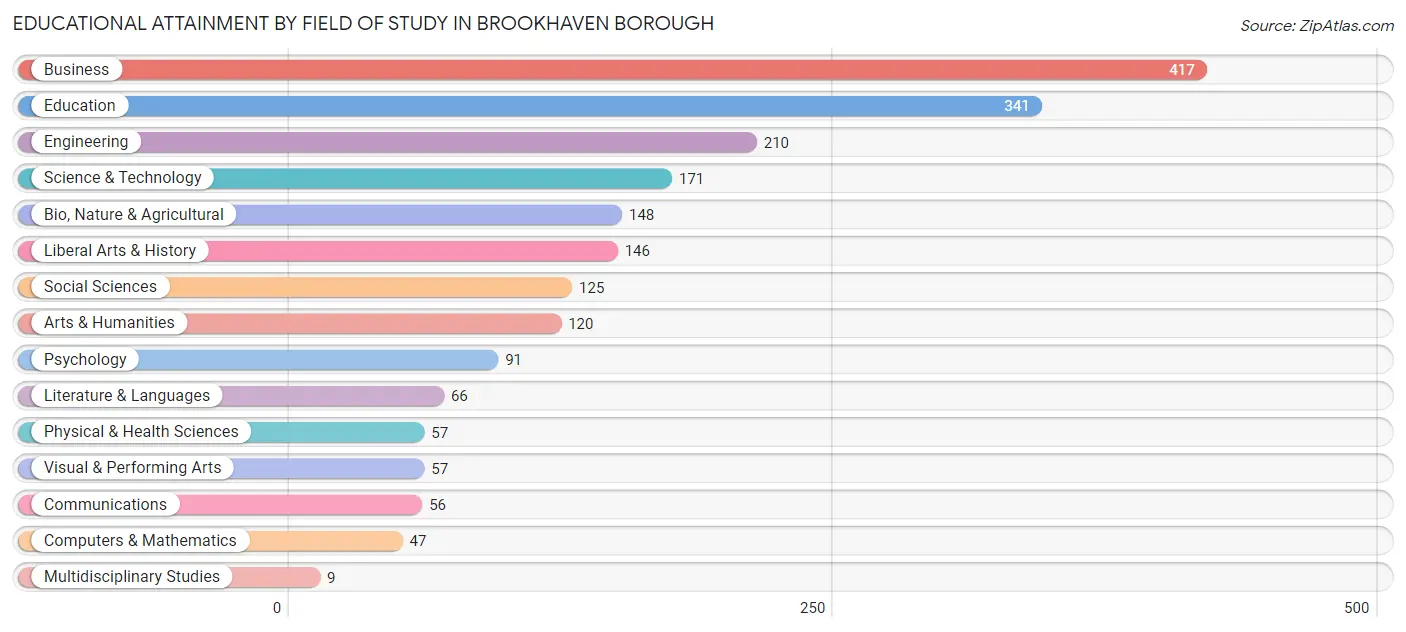
| Field of Study | # Graduates | % Graduates |
| Computers & Mathematics | 47 | 2.3% |
| Bio, Nature & Agricultural | 148 | 7.2% |
| Physical & Health Sciences | 57 | 2.8% |
| Psychology | 91 | 4.4% |
| Social Sciences | 125 | 6.1% |
| Engineering | 210 | 10.2% |
| Multidisciplinary Studies | 9 | 0.4% |
| Science & Technology | 171 | 8.3% |
| Business | 417 | 20.2% |
| Education | 341 | 16.6% |
| Literature & Languages | 66 | 3.2% |
| Liberal Arts & History | 146 | 7.1% |
| Visual & Performing Arts | 57 | 2.8% |
| Communications | 56 | 2.7% |
| Arts & Humanities | 120 | 5.8% |
| Total | 2,061 | 100.0% |
Transportation & Commute in Brookhaven borough
Vehicle Availability by Sex in Brookhaven borough
The most prevalent vehicle ownership categories in Brookhaven borough are males with 2 vehicles (848, accounting for 35.6%) and females with 2 vehicles (844, making up 41.3%).
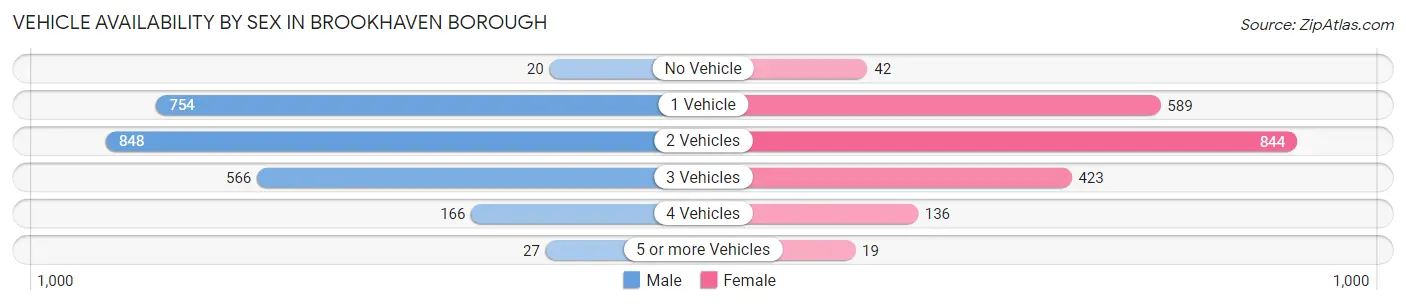
| Vehicles Available | Male | Female |
| No Vehicle | 20 (0.8%) | 42 (2.1%) |
| 1 Vehicle | 754 (31.7%) | 589 (28.7%) |
| 2 Vehicles | 848 (35.6%) | 844 (41.1%) |
| 3 Vehicles | 566 (23.8%) | 423 (20.6%) |
| 4 Vehicles | 166 (7.0%) | 136 (6.6%) |
| 5 or more Vehicles | 27 (1.1%) | 19 (0.9%) |
| Total | 2,381 (100.0%) | 2,053 (100.0%) |
Commute Time in Brookhaven borough
The most frequently occuring commute durations in Brookhaven borough are 15 to 19 minutes (569 commuters, 13.8%), 30 to 34 minutes (552 commuters, 13.4%), and 45 to 59 minutes (526 commuters, 12.8%).
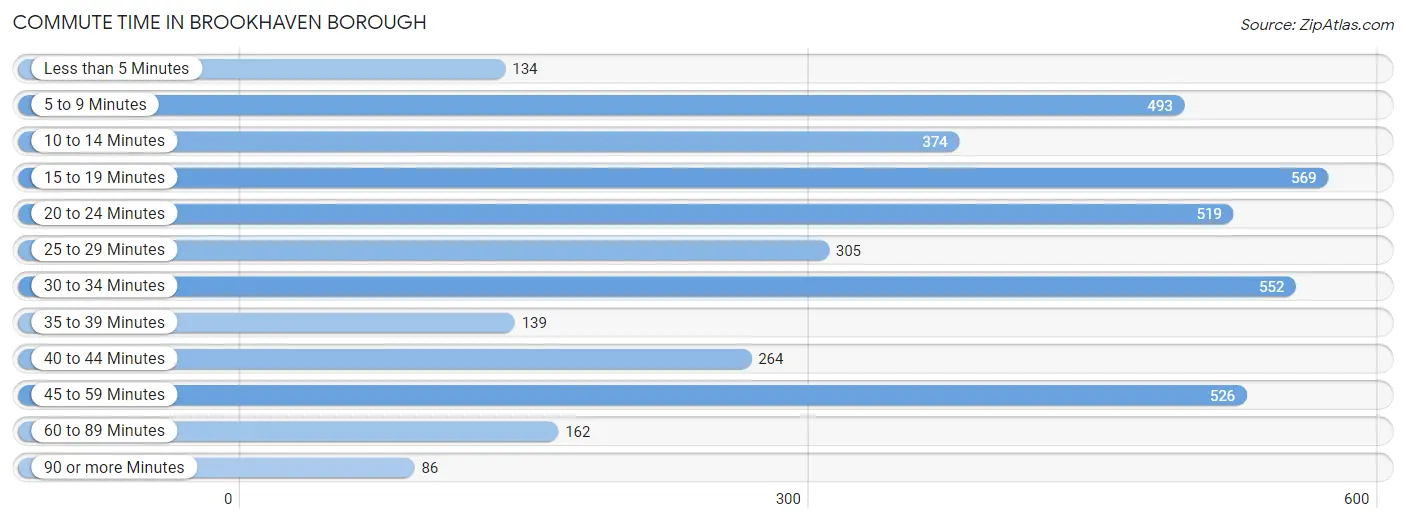
| Commute Time | # Commuters | % Commuters |
| Less than 5 Minutes | 134 | 3.3% |
| 5 to 9 Minutes | 493 | 12.0% |
| 10 to 14 Minutes | 374 | 9.1% |
| 15 to 19 Minutes | 569 | 13.8% |
| 20 to 24 Minutes | 519 | 12.6% |
| 25 to 29 Minutes | 305 | 7.4% |
| 30 to 34 Minutes | 552 | 13.4% |
| 35 to 39 Minutes | 139 | 3.4% |
| 40 to 44 Minutes | 264 | 6.4% |
| 45 to 59 Minutes | 526 | 12.8% |
| 60 to 89 Minutes | 162 | 3.9% |
| 90 or more Minutes | 86 | 2.1% |
Commute Time by Sex in Brookhaven borough
The most common commute times in Brookhaven borough are 15 to 19 minutes (365 commuters, 16.3%) for males and 30 to 34 minutes (315 commuters, 16.8%) for females.
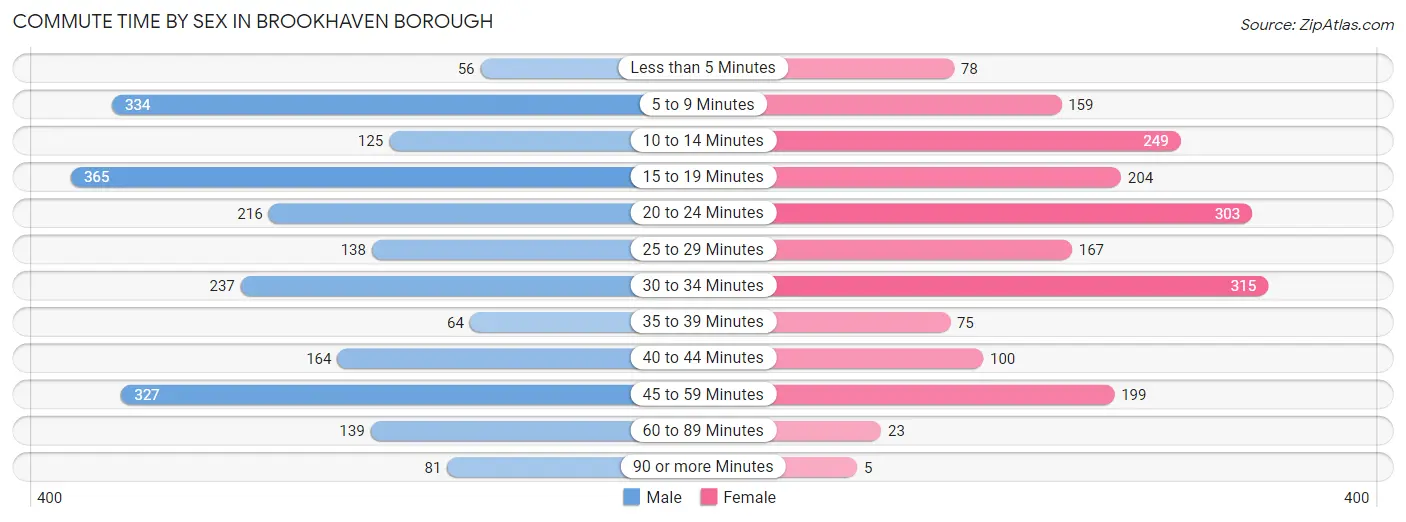
| Commute Time | Male | Female |
| Less than 5 Minutes | 56 (2.5%) | 78 (4.2%) |
| 5 to 9 Minutes | 334 (14.9%) | 159 (8.5%) |
| 10 to 14 Minutes | 125 (5.6%) | 249 (13.3%) |
| 15 to 19 Minutes | 365 (16.3%) | 204 (10.9%) |
| 20 to 24 Minutes | 216 (9.6%) | 303 (16.1%) |
| 25 to 29 Minutes | 138 (6.1%) | 167 (8.9%) |
| 30 to 34 Minutes | 237 (10.5%) | 315 (16.8%) |
| 35 to 39 Minutes | 64 (2.9%) | 75 (4.0%) |
| 40 to 44 Minutes | 164 (7.3%) | 100 (5.3%) |
| 45 to 59 Minutes | 327 (14.6%) | 199 (10.6%) |
| 60 to 89 Minutes | 139 (6.2%) | 23 (1.2%) |
| 90 or more Minutes | 81 (3.6%) | 5 (0.3%) |
Time of Departure to Work by Sex in Brookhaven borough
The most frequent times of departure to work in Brookhaven borough are 7:00 AM to 7:29 AM (477, 21.2%) for males and 7:30 AM to 7:59 AM (334, 17.8%) for females.
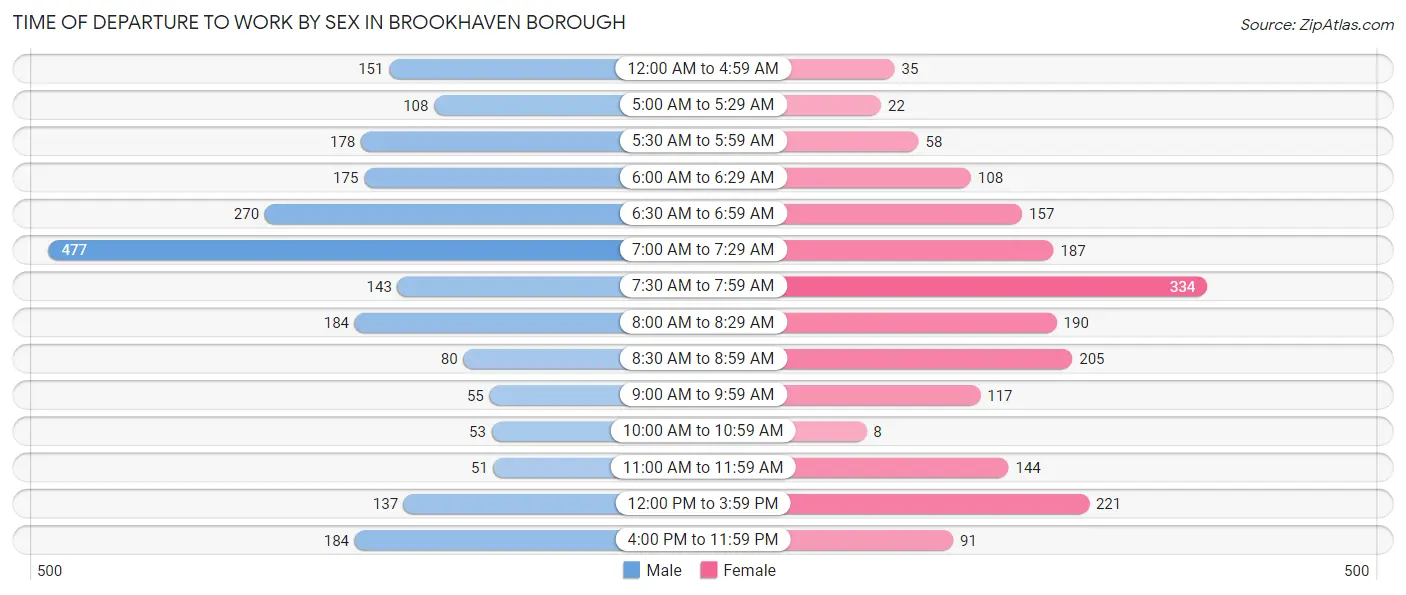
| Time of Departure | Male | Female |
| 12:00 AM to 4:59 AM | 151 (6.7%) | 35 (1.9%) |
| 5:00 AM to 5:29 AM | 108 (4.8%) | 22 (1.2%) |
| 5:30 AM to 5:59 AM | 178 (7.9%) | 58 (3.1%) |
| 6:00 AM to 6:29 AM | 175 (7.8%) | 108 (5.8%) |
| 6:30 AM to 6:59 AM | 270 (12.0%) | 157 (8.4%) |
| 7:00 AM to 7:29 AM | 477 (21.2%) | 187 (10.0%) |
| 7:30 AM to 7:59 AM | 143 (6.4%) | 334 (17.8%) |
| 8:00 AM to 8:29 AM | 184 (8.2%) | 190 (10.1%) |
| 8:30 AM to 8:59 AM | 80 (3.6%) | 205 (10.9%) |
| 9:00 AM to 9:59 AM | 55 (2.5%) | 117 (6.2%) |
| 10:00 AM to 10:59 AM | 53 (2.4%) | 8 (0.4%) |
| 11:00 AM to 11:59 AM | 51 (2.3%) | 144 (7.7%) |
| 12:00 PM to 3:59 PM | 137 (6.1%) | 221 (11.8%) |
| 4:00 PM to 11:59 PM | 184 (8.2%) | 91 (4.9%) |
| Total | 2,246 (100.0%) | 1,877 (100.0%) |
Housing Occupancy in Brookhaven borough
Occupancy by Ownership in Brookhaven borough
Of the total 3,631 dwellings in Brookhaven borough, owner-occupied units account for 3,147 (86.7%), while renter-occupied units make up 484 (13.3%).
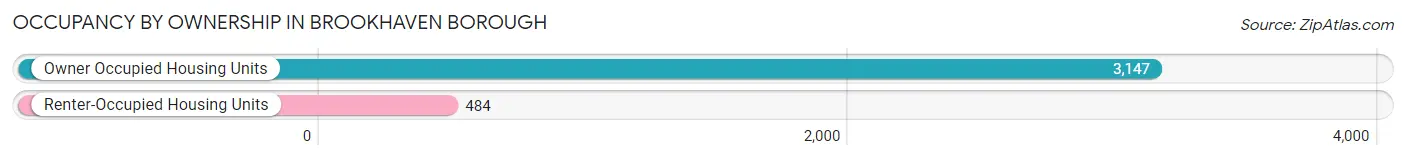
| Occupancy | # Housing Units | % Housing Units |
| Owner Occupied Housing Units | 3,147 | 86.7% |
| Renter-Occupied Housing Units | 484 | 13.3% |
| Total Occupied Housing Units | 3,631 | 100.0% |
Occupancy by Household Size in Brookhaven borough
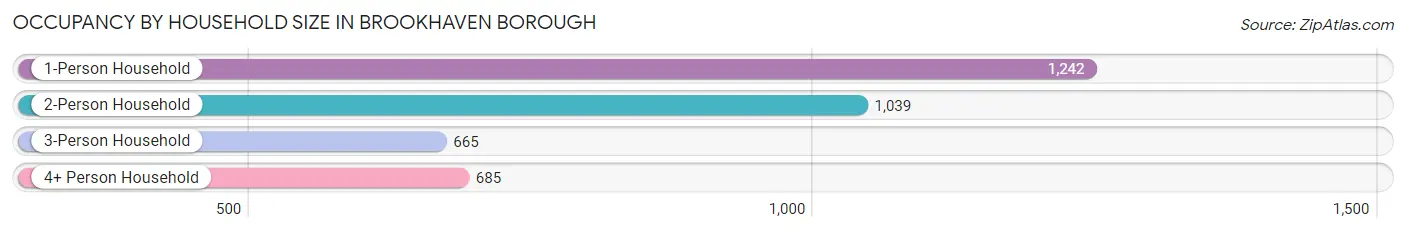
| Household Size | # Housing Units | % Housing Units |
| 1-Person Household | 1,242 | 34.2% |
| 2-Person Household | 1,039 | 28.6% |
| 3-Person Household | 665 | 18.3% |
| 4+ Person Household | 685 | 18.9% |
| Total Housing Units | 3,631 | 100.0% |
Occupancy by Ownership by Household Size in Brookhaven borough
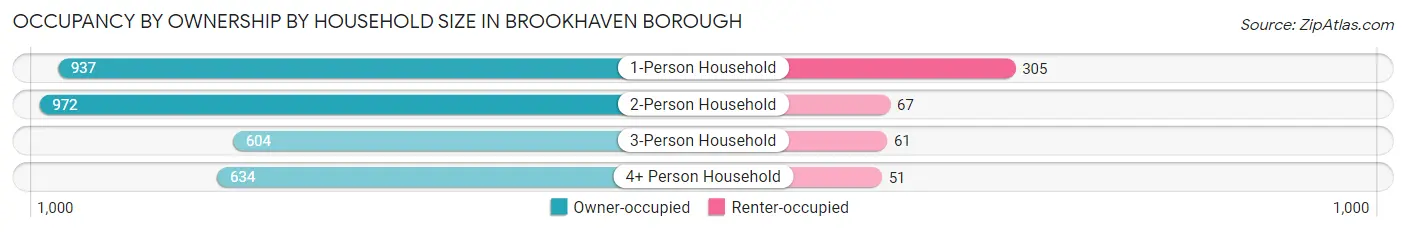
| Household Size | Owner-occupied | Renter-occupied |
| 1-Person Household | 937 (75.4%) | 305 (24.6%) |
| 2-Person Household | 972 (93.5%) | 67 (6.5%) |
| 3-Person Household | 604 (90.8%) | 61 (9.2%) |
| 4+ Person Household | 634 (92.5%) | 51 (7.4%) |
| Total Housing Units | 3,147 (86.7%) | 484 (13.3%) |
Occupancy by Educational Attainment in Brookhaven borough
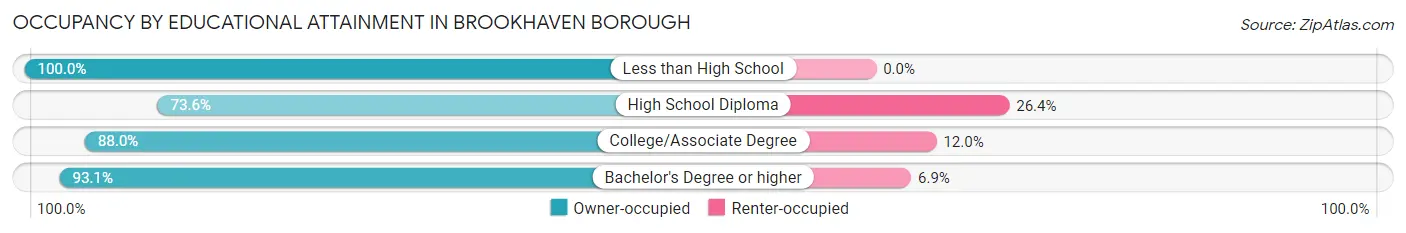
| Household Size | Owner-occupied | Renter-occupied |
| Less than High School | 208 (100.0%) | 0 (0.0%) |
| High School Diploma | 714 (73.6%) | 256 (26.4%) |
| College/Associate Degree | 1,016 (88.0%) | 138 (12.0%) |
| Bachelor's Degree or higher | 1,209 (93.1%) | 90 (6.9%) |
Occupancy by Age of Householder in Brookhaven borough
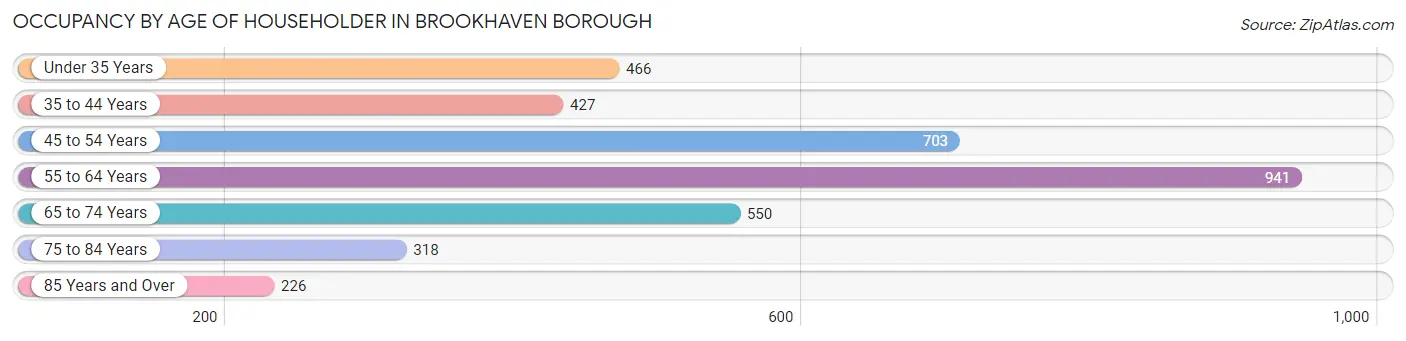
| Age Bracket | # Households | % Households |
| Under 35 Years | 466 | 12.8% |
| 35 to 44 Years | 427 | 11.8% |
| 45 to 54 Years | 703 | 19.4% |
| 55 to 64 Years | 941 | 25.9% |
| 65 to 74 Years | 550 | 15.1% |
| 75 to 84 Years | 318 | 8.8% |
| 85 Years and Over | 226 | 6.2% |
| Total | 3,631 | 100.0% |
Housing Finances in Brookhaven borough
Median Income by Occupancy in Brookhaven borough
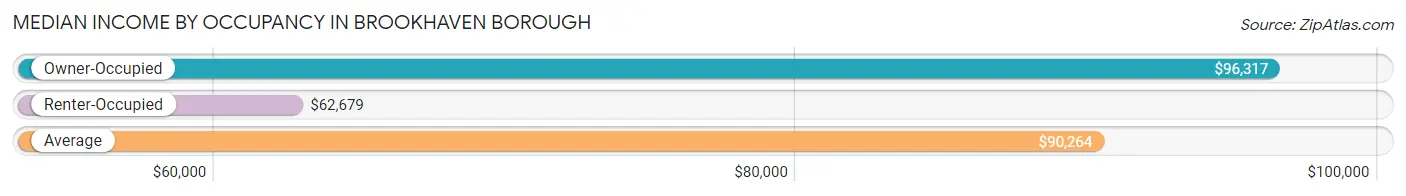
| Occupancy Type | # Households | Median Income |
| Owner-Occupied | 3,147 (86.7%) | $96,317 |
| Renter-Occupied | 484 (13.3%) | $62,679 |
| Average | 3,631 (100.0%) | $90,264 |
Occupancy by Householder Income Bracket in Brookhaven borough
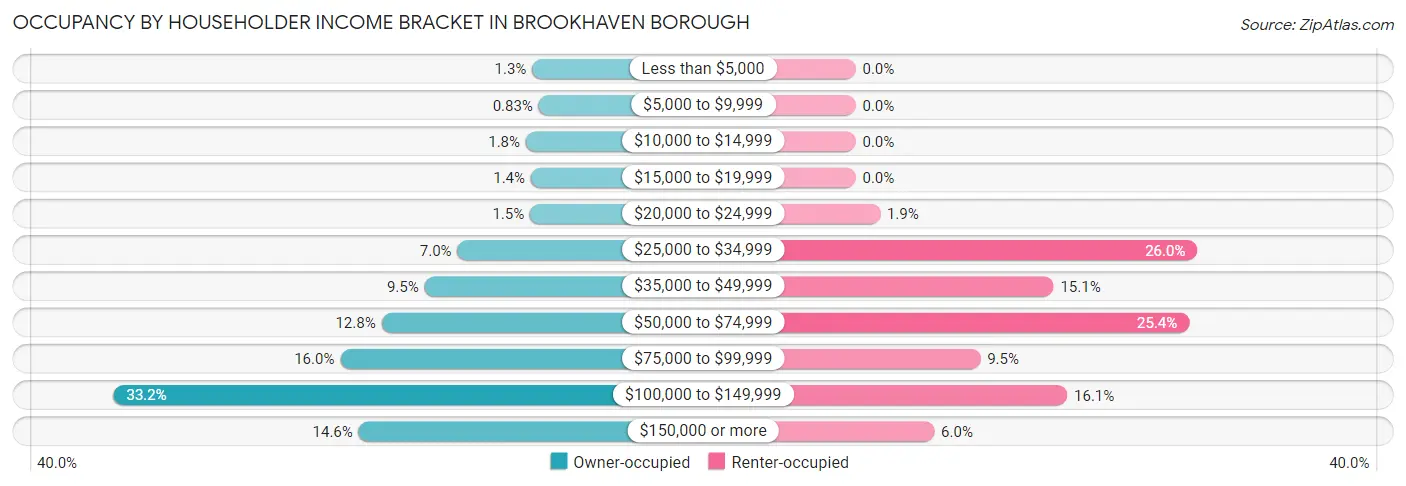
| Income Bracket | Owner-occupied | Renter-occupied |
| Less than $5,000 | 42 (1.3%) | 0 (0.0%) |
| $5,000 to $9,999 | 26 (0.8%) | 0 (0.0%) |
| $10,000 to $14,999 | 57 (1.8%) | 0 (0.0%) |
| $15,000 to $19,999 | 45 (1.4%) | 0 (0.0%) |
| $20,000 to $24,999 | 47 (1.5%) | 9 (1.9%) |
| $25,000 to $34,999 | 221 (7.0%) | 126 (26.0%) |
| $35,000 to $49,999 | 300 (9.5%) | 73 (15.1%) |
| $50,000 to $74,999 | 403 (12.8%) | 123 (25.4%) |
| $75,000 to $99,999 | 502 (16.0%) | 46 (9.5%) |
| $100,000 to $149,999 | 1,046 (33.2%) | 78 (16.1%) |
| $150,000 or more | 458 (14.5%) | 29 (6.0%) |
| Total | 3,147 (100.0%) | 484 (100.0%) |
Monthly Housing Cost Tiers in Brookhaven borough
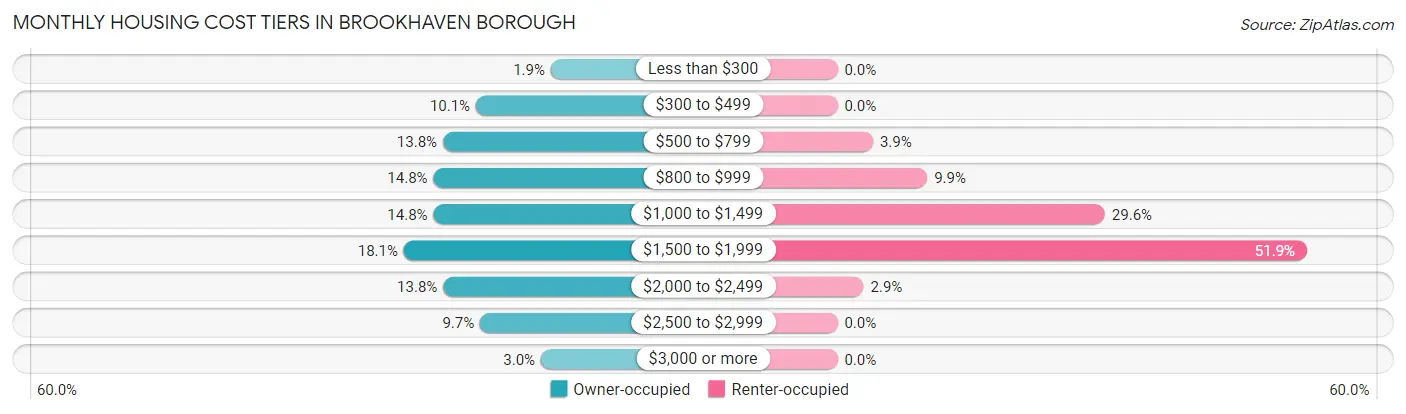
| Monthly Cost | Owner-occupied | Renter-occupied |
| Less than $300 | 59 (1.9%) | 0 (0.0%) |
| $300 to $499 | 319 (10.1%) | 0 (0.0%) |
| $500 to $799 | 434 (13.8%) | 19 (3.9%) |
| $800 to $999 | 467 (14.8%) | 48 (9.9%) |
| $1,000 to $1,499 | 467 (14.8%) | 143 (29.5%) |
| $1,500 to $1,999 | 570 (18.1%) | 251 (51.9%) |
| $2,000 to $2,499 | 433 (13.8%) | 14 (2.9%) |
| $2,500 to $2,999 | 305 (9.7%) | 0 (0.0%) |
| $3,000 or more | 93 (3.0%) | 0 (0.0%) |
| Total | 3,147 (100.0%) | 484 (100.0%) |
Physical Housing Characteristics in Brookhaven borough
Housing Structures in Brookhaven borough
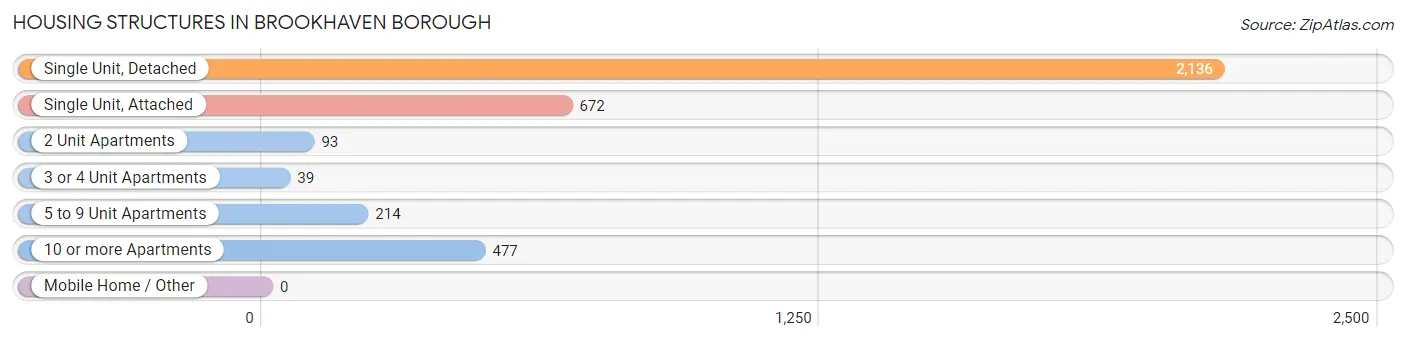
| Structure Type | # Housing Units | % Housing Units |
| Single Unit, Detached | 2,136 | 58.8% |
| Single Unit, Attached | 672 | 18.5% |
| 2 Unit Apartments | 93 | 2.6% |
| 3 or 4 Unit Apartments | 39 | 1.1% |
| 5 to 9 Unit Apartments | 214 | 5.9% |
| 10 or more Apartments | 477 | 13.1% |
| Mobile Home / Other | 0 | 0.0% |
| Total | 3,631 | 100.0% |
Housing Structures by Occupancy in Brookhaven borough
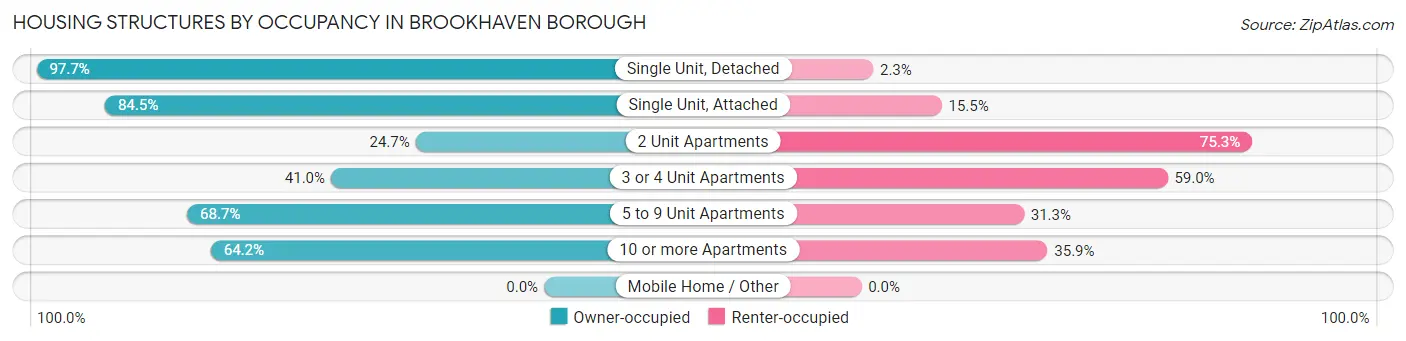
| Structure Type | Owner-occupied | Renter-occupied |
| Single Unit, Detached | 2,087 (97.7%) | 49 (2.3%) |
| Single Unit, Attached | 568 (84.5%) | 104 (15.5%) |
| 2 Unit Apartments | 23 (24.7%) | 70 (75.3%) |
| 3 or 4 Unit Apartments | 16 (41.0%) | 23 (59.0%) |
| 5 to 9 Unit Apartments | 147 (68.7%) | 67 (31.3%) |
| 10 or more Apartments | 306 (64.1%) | 171 (35.8%) |
| Mobile Home / Other | 0 (0.0%) | 0 (0.0%) |
| Total | 3,147 (86.7%) | 484 (13.3%) |
Housing Structures by Number of Rooms in Brookhaven borough
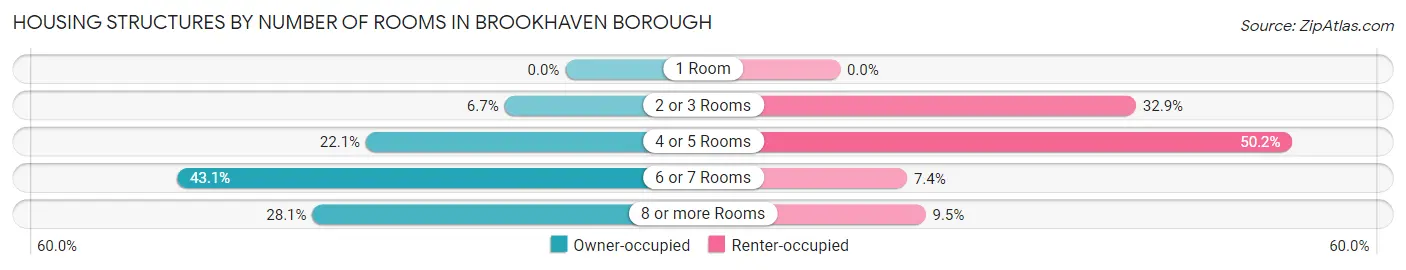
| Number of Rooms | Owner-occupied | Renter-occupied |
| 1 Room | 0 (0.0%) | 0 (0.0%) |
| 2 or 3 Rooms | 212 (6.7%) | 159 (32.9%) |
| 4 or 5 Rooms | 696 (22.1%) | 243 (50.2%) |
| 6 or 7 Rooms | 1,356 (43.1%) | 36 (7.4%) |
| 8 or more Rooms | 883 (28.1%) | 46 (9.5%) |
| Total | 3,147 (100.0%) | 484 (100.0%) |
Housing Structure by Heating Type in Brookhaven borough
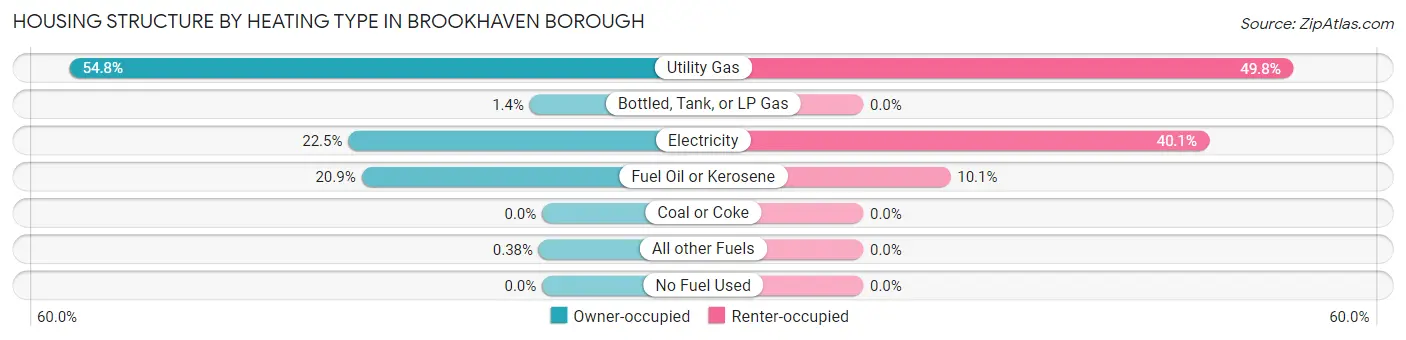
| Heating Type | Owner-occupied | Renter-occupied |
| Utility Gas | 1,724 (54.8%) | 241 (49.8%) |
| Bottled, Tank, or LP Gas | 45 (1.4%) | 0 (0.0%) |
| Electricity | 707 (22.5%) | 194 (40.1%) |
| Fuel Oil or Kerosene | 659 (20.9%) | 49 (10.1%) |
| Coal or Coke | 0 (0.0%) | 0 (0.0%) |
| All other Fuels | 12 (0.4%) | 0 (0.0%) |
| No Fuel Used | 0 (0.0%) | 0 (0.0%) |
| Total | 3,147 (100.0%) | 484 (100.0%) |
Household Vehicle Usage in Brookhaven borough
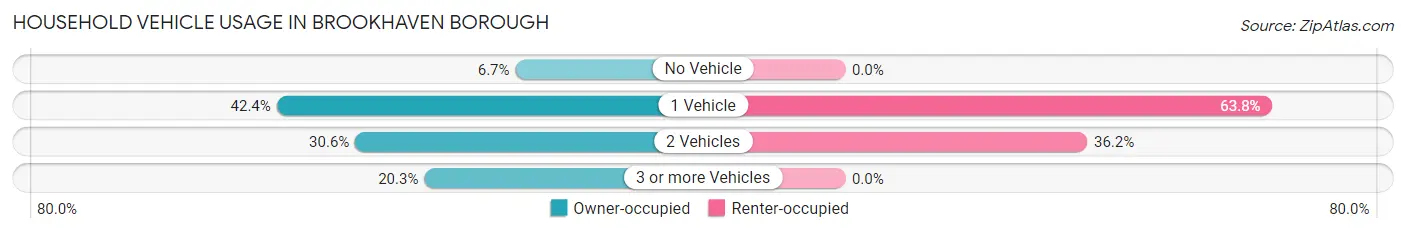
| Vehicles per Household | Owner-occupied | Renter-occupied |
| No Vehicle | 211 (6.7%) | 0 (0.0%) |
| 1 Vehicle | 1,333 (42.4%) | 309 (63.8%) |
| 2 Vehicles | 964 (30.6%) | 175 (36.2%) |
| 3 or more Vehicles | 639 (20.3%) | 0 (0.0%) |
| Total | 3,147 (100.0%) | 484 (100.0%) |
Real Estate & Mortgages in Brookhaven borough
Real Estate and Mortgage Overview in Brookhaven borough
| Characteristic | Without Mortgage | With Mortgage |
| Housing Units | 1,237 | 1,910 |
| Median Property Value | $241,100 | $260,300 |
| Median Household Income | $60,069 | $346 |
| Monthly Housing Costs | $682 | $93 |
| Real Estate Taxes | $3,907 | $0 |
Property Value by Mortgage Status in Brookhaven borough
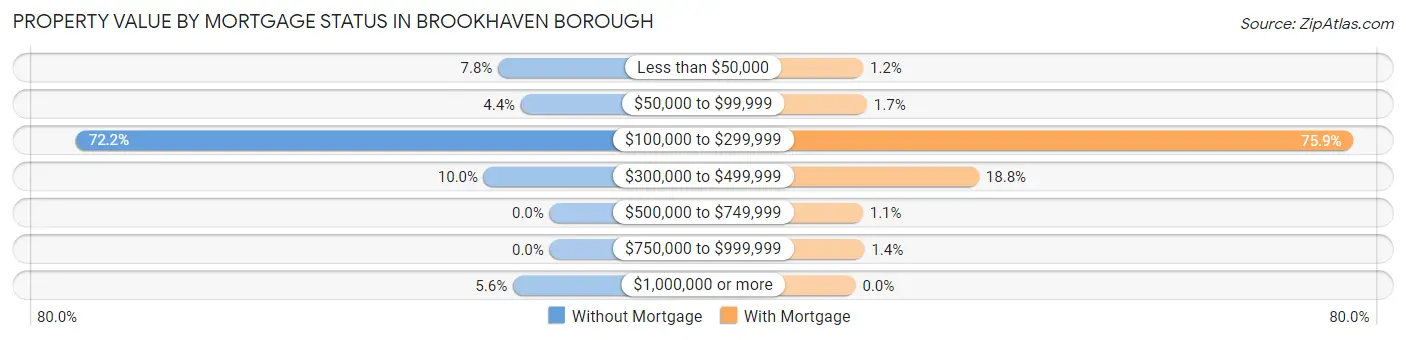
| Property Value | Without Mortgage | With Mortgage |
| Less than $50,000 | 97 (7.8%) | 22 (1.1%) |
| $50,000 to $99,999 | 54 (4.4%) | 33 (1.7%) |
| $100,000 to $299,999 | 893 (72.2%) | 1,449 (75.9%) |
| $300,000 to $499,999 | 124 (10.0%) | 359 (18.8%) |
| $500,000 to $749,999 | 0 (0.0%) | 21 (1.1%) |
| $750,000 to $999,999 | 0 (0.0%) | 26 (1.4%) |
| $1,000,000 or more | 69 (5.6%) | 0 (0.0%) |
| Total | 1,237 (100.0%) | 1,910 (100.0%) |
Household Income by Mortgage Status in Brookhaven borough
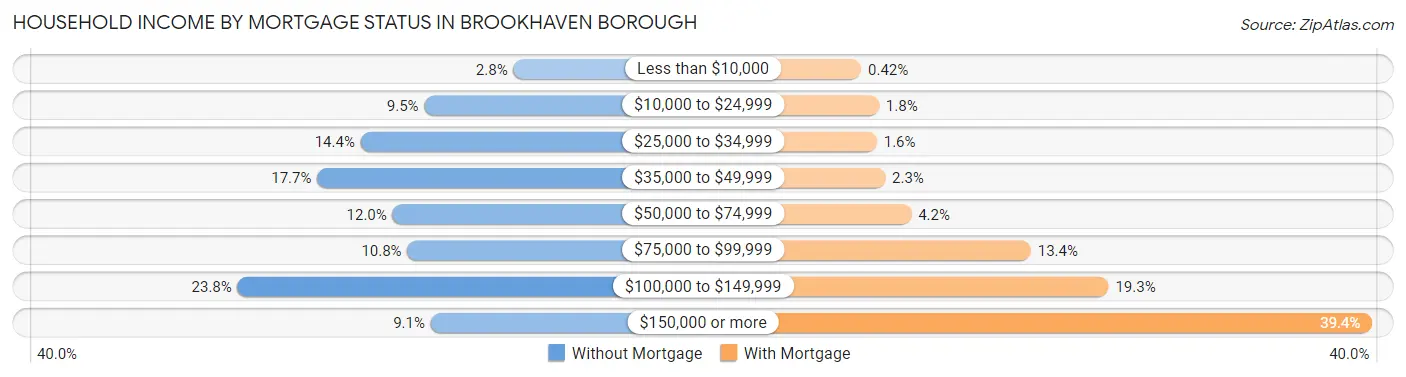
| Household Income | Without Mortgage | With Mortgage |
| Less than $10,000 | 34 (2.8%) | 8 (0.4%) |
| $10,000 to $24,999 | 118 (9.5%) | 34 (1.8%) |
| $25,000 to $34,999 | 178 (14.4%) | 31 (1.6%) |
| $35,000 to $49,999 | 219 (17.7%) | 43 (2.2%) |
| $50,000 to $74,999 | 148 (12.0%) | 81 (4.2%) |
| $75,000 to $99,999 | 134 (10.8%) | 255 (13.4%) |
| $100,000 to $149,999 | 294 (23.8%) | 368 (19.3%) |
| $150,000 or more | 112 (9.0%) | 752 (39.4%) |
| Total | 1,237 (100.0%) | 1,910 (100.0%) |
Property Value to Household Income Ratio in Brookhaven borough
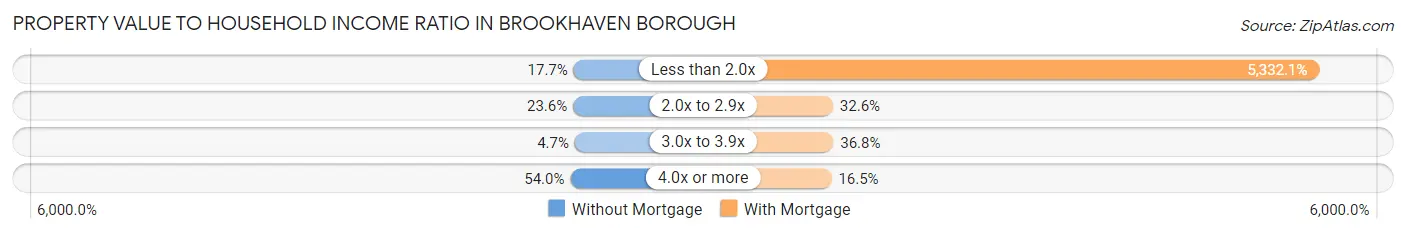
| Value-to-Income Ratio | Without Mortgage | With Mortgage |
| Less than 2.0x | 219 (17.7%) | 101,843 (5,332.1%) |
| 2.0x to 2.9x | 292 (23.6%) | 623 (32.6%) |
| 3.0x to 3.9x | 58 (4.7%) | 703 (36.8%) |
| 4.0x or more | 668 (54.0%) | 316 (16.5%) |
| Total | 1,237 (100.0%) | 1,910 (100.0%) |
Real Estate Taxes by Mortgage Status in Brookhaven borough
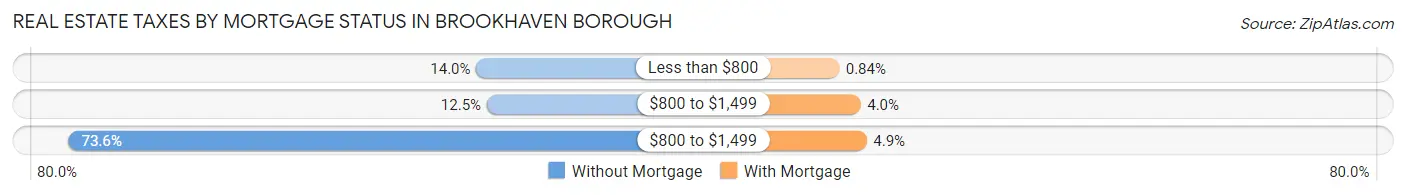
| Property Taxes | Without Mortgage | With Mortgage |
| Less than $800 | 173 (14.0%) | 16 (0.8%) |
| $800 to $1,499 | 154 (12.4%) | 76 (4.0%) |
| $800 to $1,499 | 910 (73.6%) | 93 (4.9%) |
| Total | 1,237 (100.0%) | 1,910 (100.0%) |
Health & Disability in Brookhaven borough
Health Insurance Coverage by Age in Brookhaven borough
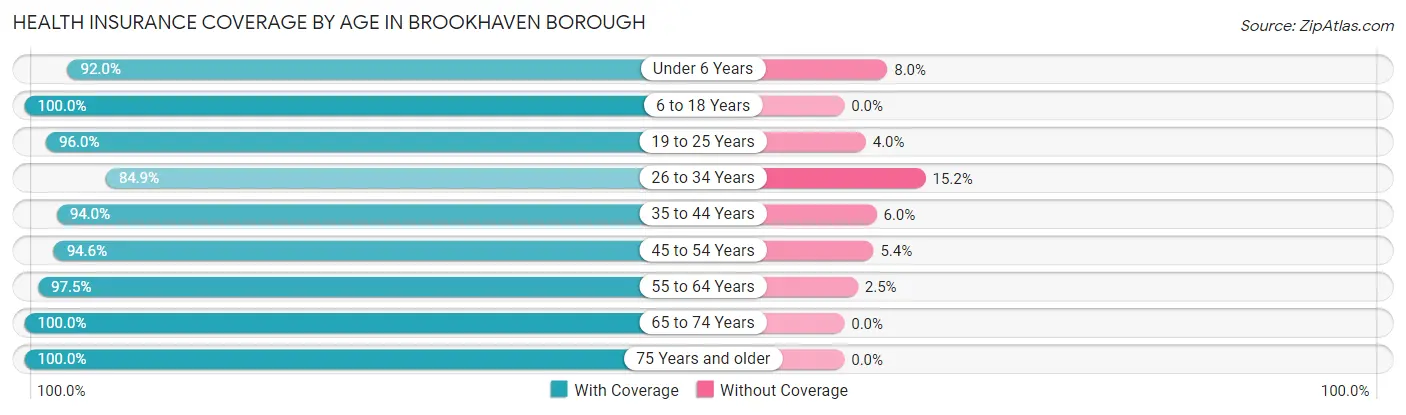
| Age Bracket | With Coverage | Without Coverage |
| Under 6 Years | 562 (92.0%) | 49 (8.0%) |
| 6 to 18 Years | 1,078 (100.0%) | 0 (0.0%) |
| 19 to 25 Years | 431 (96.0%) | 18 (4.0%) |
| 26 to 34 Years | 997 (84.9%) | 178 (15.1%) |
| 35 to 44 Years | 876 (94.0%) | 56 (6.0%) |
| 45 to 54 Years | 956 (94.6%) | 55 (5.4%) |
| 55 to 64 Years | 1,426 (97.5%) | 37 (2.5%) |
| 65 to 74 Years | 750 (100.0%) | 0 (0.0%) |
| 75 Years and older | 799 (100.0%) | 0 (0.0%) |
| Total | 7,875 (95.3%) | 393 (4.8%) |
Health Insurance Coverage by Citizenship Status in Brookhaven borough
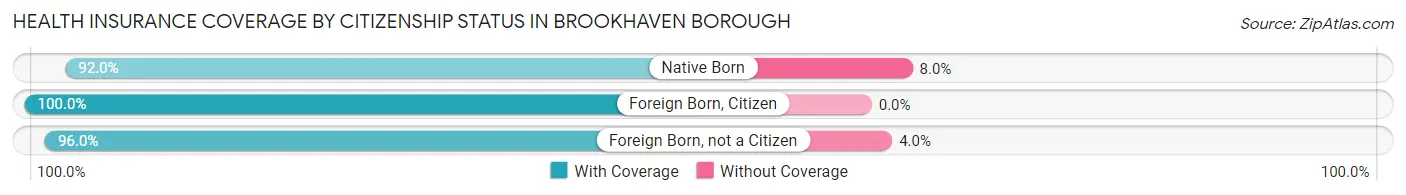
| Citizenship Status | With Coverage | Without Coverage |
| Native Born | 562 (92.0%) | 49 (8.0%) |
| Foreign Born, Citizen | 1,078 (100.0%) | 0 (0.0%) |
| Foreign Born, not a Citizen | 431 (96.0%) | 18 (4.0%) |
Health Insurance Coverage by Household Income in Brookhaven borough
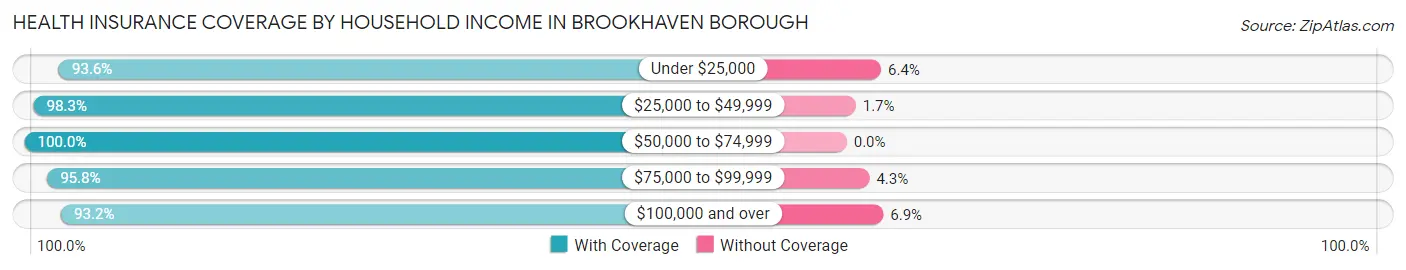
| Household Income | With Coverage | Without Coverage |
| Under $25,000 | 262 (93.6%) | 18 (6.4%) |
| $25,000 to $49,999 | 990 (98.3%) | 17 (1.7%) |
| $50,000 to $74,999 | 1,172 (100.0%) | 0 (0.0%) |
| $75,000 to $99,999 | 1,398 (95.8%) | 62 (4.3%) |
| $100,000 and over | 4,027 (93.1%) | 296 (6.9%) |
Public vs Private Health Insurance Coverage by Age in Brookhaven borough
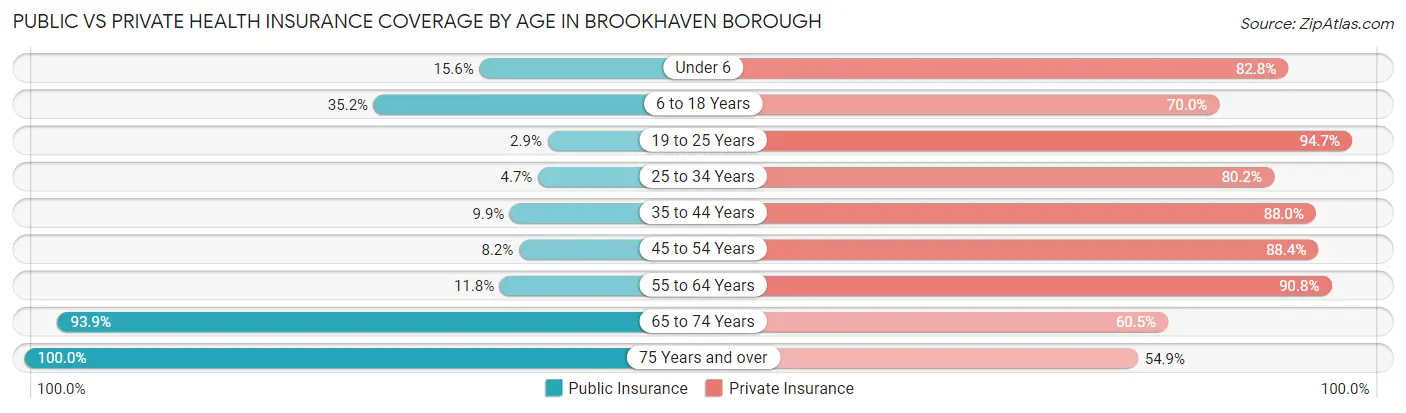
| Age Bracket | Public Insurance | Private Insurance |
| Under 6 | 95 (15.5%) | 506 (82.8%) |
| 6 to 18 Years | 379 (35.2%) | 755 (70.0%) |
| 19 to 25 Years | 13 (2.9%) | 425 (94.7%) |
| 25 to 34 Years | 55 (4.7%) | 942 (80.2%) |
| 35 to 44 Years | 92 (9.9%) | 820 (88.0%) |
| 45 to 54 Years | 83 (8.2%) | 894 (88.4%) |
| 55 to 64 Years | 172 (11.8%) | 1,329 (90.8%) |
| 65 to 74 Years | 704 (93.9%) | 454 (60.5%) |
| 75 Years and over | 799 (100.0%) | 439 (54.9%) |
| Total | 2,392 (28.9%) | 6,564 (79.4%) |
Disability Status by Sex by Age in Brookhaven borough
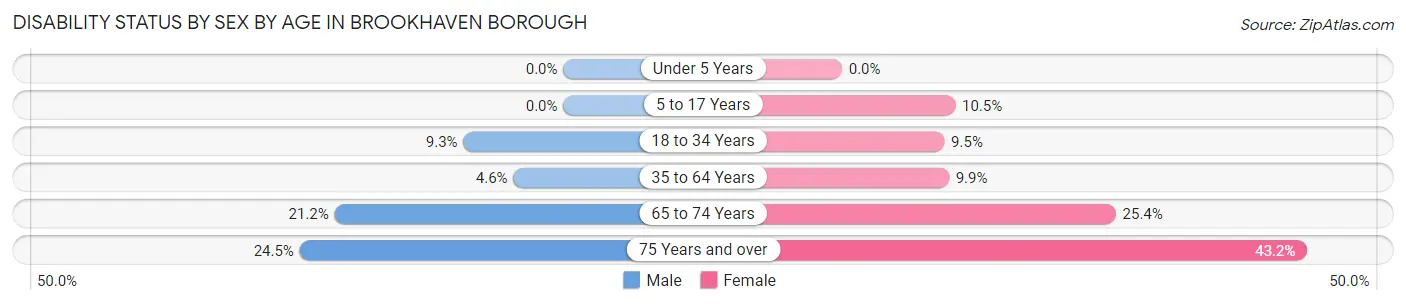
| Age Bracket | Male | Female |
| Under 5 Years | 0 (0.0%) | 0 (0.0%) |
| 5 to 17 Years | 0 (0.0%) | 43 (10.5%) |
| 18 to 34 Years | 78 (9.3%) | 78 (9.5%) |
| 35 to 64 Years | 84 (4.6%) | 158 (9.9%) |
| 65 to 74 Years | 69 (21.2%) | 108 (25.4%) |
| 75 Years and over | 93 (24.5%) | 181 (43.2%) |
Disability Class by Sex by Age in Brookhaven borough
Disability Class: Hearing Difficulty
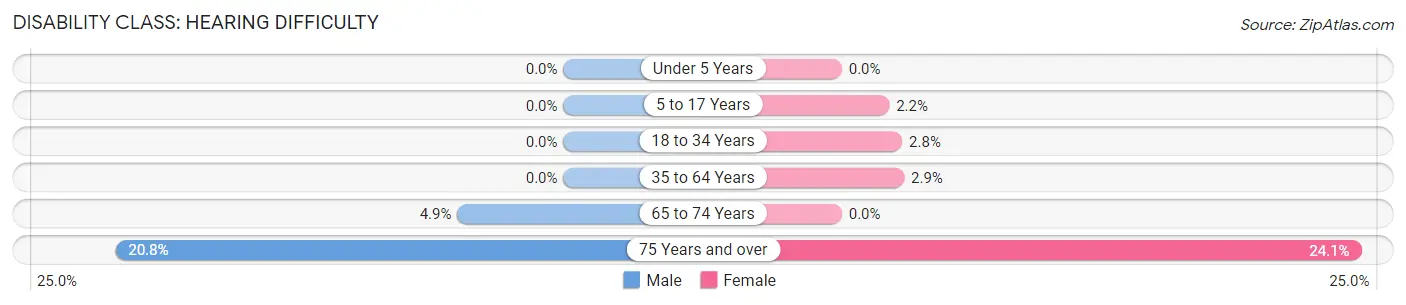
| Age Bracket | Male | Female |
| Under 5 Years | 0 (0.0%) | 0 (0.0%) |
| 5 to 17 Years | 0 (0.0%) | 9 (2.2%) |
| 18 to 34 Years | 0 (0.0%) | 23 (2.8%) |
| 35 to 64 Years | 0 (0.0%) | 46 (2.9%) |
| 65 to 74 Years | 16 (4.9%) | 0 (0.0%) |
| 75 Years and over | 79 (20.8%) | 101 (24.1%) |
Disability Class: Vision Difficulty
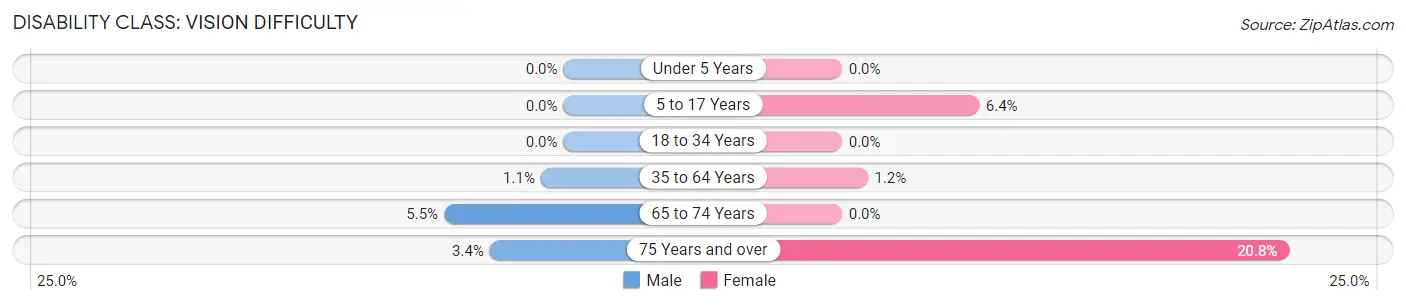
| Age Bracket | Male | Female |
| Under 5 Years | 0 (0.0%) | 0 (0.0%) |
| 5 to 17 Years | 0 (0.0%) | 26 (6.4%) |
| 18 to 34 Years | 0 (0.0%) | 0 (0.0%) |
| 35 to 64 Years | 19 (1.1%) | 19 (1.2%) |
| 65 to 74 Years | 18 (5.5%) | 0 (0.0%) |
| 75 Years and over | 13 (3.4%) | 87 (20.8%) |
Disability Class: Cognitive Difficulty
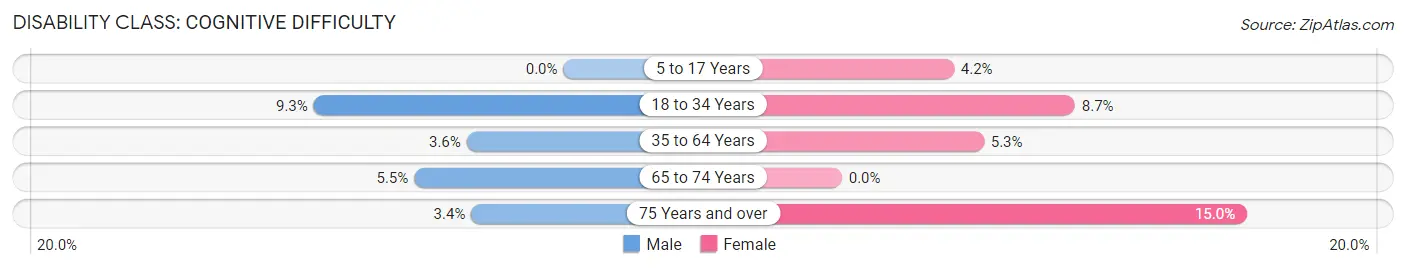
| Age Bracket | Male | Female |
| 5 to 17 Years | 0 (0.0%) | 17 (4.2%) |
| 18 to 34 Years | 78 (9.3%) | 71 (8.6%) |
| 35 to 64 Years | 65 (3.6%) | 84 (5.3%) |
| 65 to 74 Years | 18 (5.5%) | 0 (0.0%) |
| 75 Years and over | 13 (3.4%) | 63 (15.0%) |
Disability Class: Ambulatory Difficulty
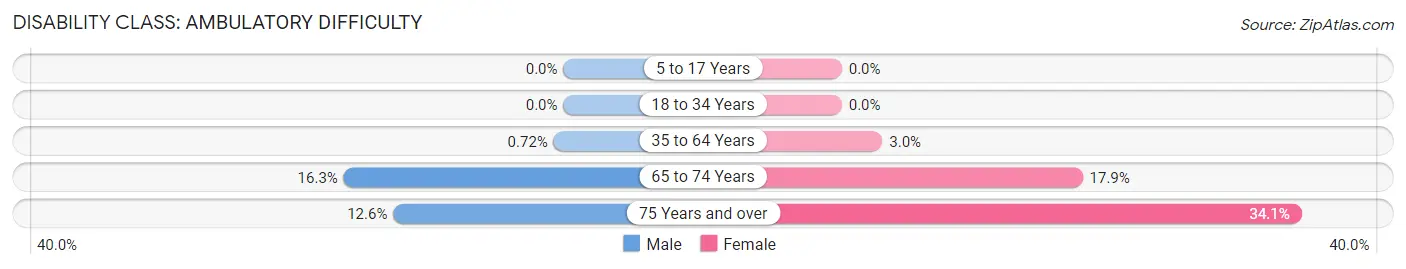
| Age Bracket | Male | Female |
| 5 to 17 Years | 0 (0.0%) | 0 (0.0%) |
| 18 to 34 Years | 0 (0.0%) | 0 (0.0%) |
| 35 to 64 Years | 13 (0.7%) | 48 (3.0%) |
| 65 to 74 Years | 53 (16.3%) | 76 (17.9%) |
| 75 Years and over | 48 (12.6%) | 143 (34.1%) |
Disability Class: Self-Care Difficulty
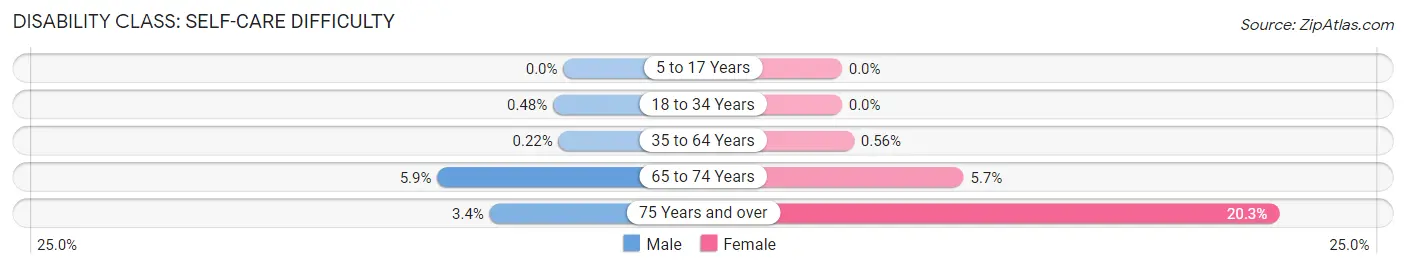
| Age Bracket | Male | Female |
| 5 to 17 Years | 0 (0.0%) | 0 (0.0%) |
| 18 to 34 Years | 4 (0.5%) | 0 (0.0%) |
| 35 to 64 Years | 4 (0.2%) | 9 (0.6%) |
| 65 to 74 Years | 19 (5.9%) | 24 (5.7%) |
| 75 Years and over | 13 (3.4%) | 85 (20.3%) |
Technology Access in Brookhaven borough
Computing Device Access in Brookhaven borough
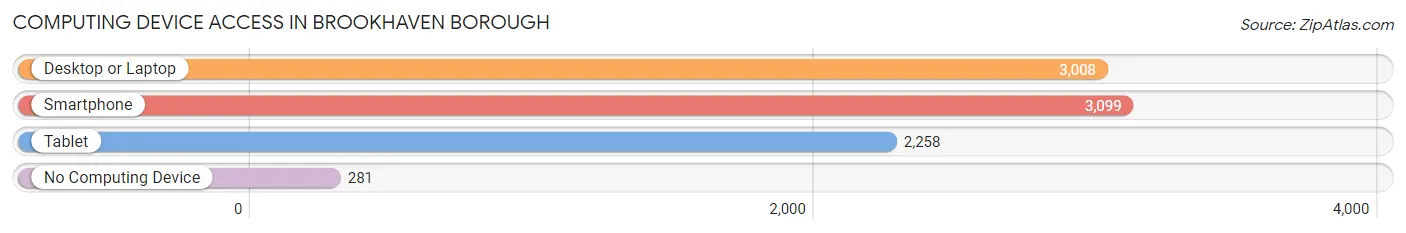
| Device Type | # Households | % Households |
| Desktop or Laptop | 3,008 | 82.8% |
| Smartphone | 3,099 | 85.4% |
| Tablet | 2,258 | 62.2% |
| No Computing Device | 281 | 7.7% |
| Total | 3,631 | 100.0% |
Internet Access in Brookhaven borough
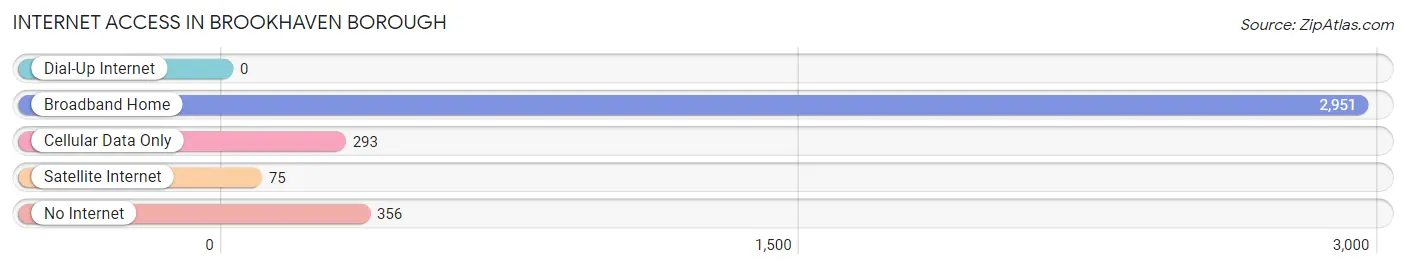
| Internet Type | # Households | % Households |
| Dial-Up Internet | 0 | 0.0% |
| Broadband Home | 2,951 | 81.3% |
| Cellular Data Only | 293 | 8.1% |
| Satellite Internet | 75 | 2.1% |
| No Internet | 356 | 9.8% |
| Total | 3,631 | 100.0% |
Brookhaven borough Summary
Introduction
Brookhaven Borough is a small borough located in Delaware County, Pennsylvania. It is situated in the southeastern corner of the state, just north of Philadelphia. The borough is home to a population of approximately 8,000 people and is known for its small-town charm and close-knit community. The borough is also known for its rich history, which dates back to the early 1700s.
History
The area that is now Brookhaven Borough was first settled by Europeans in the early 1700s. The first settlers were Quakers from England who established a small farming community. The area was known as “Brookhaven” due to the abundance of streams and brooks in the area. The borough was officially incorporated in 1868 and was named after the original settlement.
In the late 1800s, the borough began to experience a period of growth and development. The population increased and new businesses were established. The borough also became a popular destination for tourists, who were drawn to the area’s natural beauty and recreational opportunities.
In the early 1900s, the borough experienced a period of decline. The population decreased and businesses began to close. However, the borough experienced a resurgence in the mid-1900s, when new businesses and industries began to move into the area.
Geography
Brookhaven Borough is located in southeastern Pennsylvania, just north of Philadelphia. The borough is situated in Delaware County and is bordered by Ridley Township to the north, Nether Providence Township to the east, and Upper Providence Township to the south. The borough is approximately 4.5 square miles in size and is home to a population of approximately 8,000 people.
The borough is situated on a hilly terrain and is home to several small streams and brooks. The borough is also home to several parks and recreational areas, including the Brookhaven Borough Park and the Brookhaven Nature Preserve.
Economy
The economy of Brookhaven Borough is largely based on small businesses and industries. The borough is home to several small businesses, including restaurants, retail stores, and professional services. The borough is also home to several manufacturing companies, including a paper mill and a printing company.
The borough is also home to several educational institutions, including the Brookhaven School District and the Delaware County Community College. The borough is also home to several healthcare facilities, including the Brookhaven Hospital and the Brookhaven Medical Center.
Demographics
As of the 2010 census, the population of Brookhaven Borough was 8,000. The racial makeup of the borough was 87.3% White, 8.2% African American, 0.7% Asian, 0.3% Native American, and 3.5% from other races. The median household income was $50,000 and the median family income was $60,000.
Conclusion
Brookhaven Borough is a small borough located in Delaware County, Pennsylvania. The borough is home to a population of approximately 8,000 people and is known for its small-town charm and close-knit community. The borough is also known for its rich history, which dates back to the early 1700s. The economy of the borough is largely based on small businesses and industries, and the borough is home to several educational institutions and healthcare facilities. The population of the borough is largely White, with a small percentage of African Americans, Asians, and Native Americans.
Common Questions
What is Per Capita Income in Brookhaven borough?
Per Capita income in Brookhaven borough is $44,062.
What is the Median Family Income in Brookhaven borough?
Median Family Income in Brookhaven borough is $102,184.
What is the Median Household income in Brookhaven borough?
Median Household Income in Brookhaven borough is $90,264.
What is Income or Wage Gap in Brookhaven borough?
Income or Wage Gap in Brookhaven borough is 33.7%.
Women in Brookhaven borough earn 66.3 cents for every dollar earned by a man.
What is Inequality or Gini Index in Brookhaven borough?
Inequality or Gini Index in Brookhaven borough is 0.36.
What is the Total Population of Brookhaven borough?
Total Population of Brookhaven borough is 8,268.
What is the Total Male Population of Brookhaven borough?
Total Male Population of Brookhaven borough is 4,372.
What is the Total Female Population of Brookhaven borough?
Total Female Population of Brookhaven borough is 3,896.
What is the Ratio of Males per 100 Females in Brookhaven borough?
There are 112.22 Males per 100 Females in Brookhaven borough.
What is the Ratio of Females per 100 Males in Brookhaven borough?
There are 89.11 Females per 100 Males in Brookhaven borough.
What is the Median Population Age in Brookhaven borough?
Median Population Age in Brookhaven borough is 43.6 Years.
What is the Average Family Size in Brookhaven borough
Average Family Size in Brookhaven borough is 2.9 People.
What is the Average Household Size in Brookhaven borough
Average Household Size in Brookhaven borough is 2.3 People.
How Large is the Labor Force in Brookhaven borough?
There are 4,650 People in the Labor Forcein in Brookhaven borough.
What is the Percentage of People in the Labor Force in Brookhaven borough?
69.8% of People are in the Labor Force in Brookhaven borough.
What is the Unemployment Rate in Brookhaven borough?
Unemployment Rate in Brookhaven borough is 3.6%.