Thompsonville, PA Map & Demographics
Thompsonville Map
Thompsonville Overview
$56,279
PER CAPITA INCOME
$131,250
AVG FAMILY INCOME
$117,813
AVG HOUSEHOLD INCOME
68.3%
WAGE / INCOME GAP [ % ]
31.7¢/ $1
WAGE / INCOME GAP [ $ ]
0.36
INEQUALITY / GINI INDEX
3,859
TOTAL POPULATION
2,029
MALE POPULATION
1,830
FEMALE POPULATION
110.87
MALES / 100 FEMALES
90.19
FEMALES / 100 MALES
50.8
MEDIAN AGE
3.1
AVG FAMILY SIZE
2.6
AVG HOUSEHOLD SIZE
1,740
LABOR FORCE [ PEOPLE ]
56.8%
PERCENT IN LABOR FORCE
1.4%
UNEMPLOYMENT RATE
Income in Thompsonville
Income Overview in Thompsonville
Per Capita Income in Thompsonville is $56,279, while median incomes of families and households are $131,250 and $117,813 respectively.
| Characteristic | Number | Measure |
| Per Capita Income | 3,859 | $56,279 |
| Median Family Income | 1,055 | $131,250 |
| Mean Family Income | 1,055 | $163,668 |
| Median Household Income | 1,427 | $117,813 |
| Mean Household Income | 1,427 | $149,796 |
| Income Deficit | 1,055 | $0 |
| Wage / Income Gap (%) | 3,859 | 68.29% |
| Wage / Income Gap ($) | 3,859 | 31.71¢ per $1 |
| Gini / Inequality Index | 3,859 | 0.36 |
Earnings by Sex in Thompsonville
Average Earnings in Thompsonville are $72,527, $91,616 for men and $29,052 for women, a difference of 68.3%.
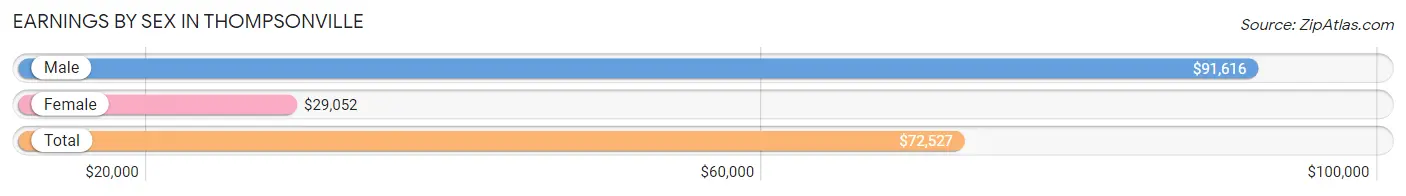
| Sex | Number | Average Earnings |
| Male | 1,087 (57.0%) | $91,616 |
| Female | 820 (43.0%) | $29,052 |
| Total | 1,907 (100.0%) | $72,527 |
Earnings by Sex by Income Bracket in Thompsonville
The most common earnings brackets in Thompsonville are $100,000+ for men (486 | 44.7%) and $100,000+ for women (142 | 17.3%).
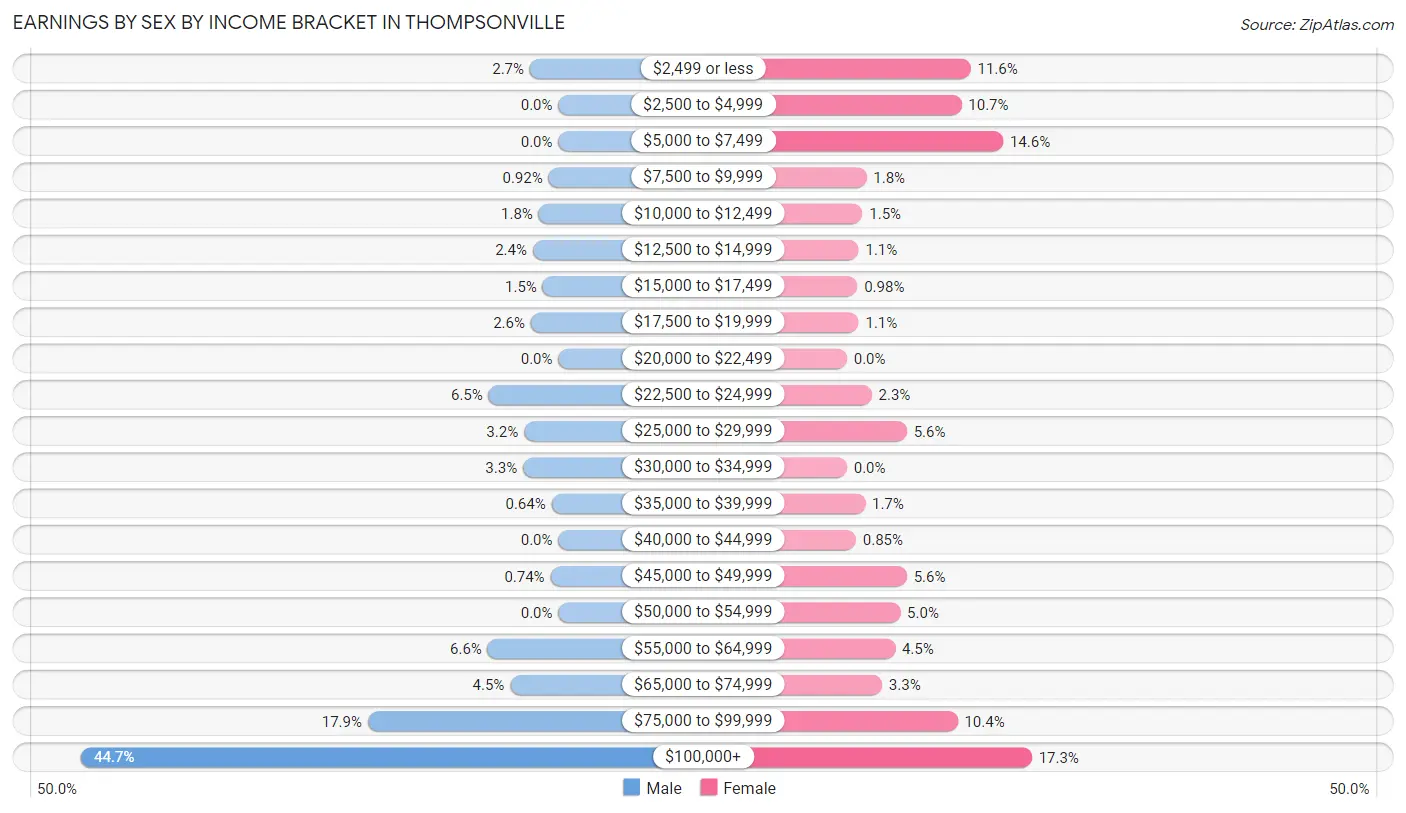
| Income | Male | Female |
| $2,499 or less | 29 (2.7%) | 95 (11.6%) |
| $2,500 to $4,999 | 0 (0.0%) | 88 (10.7%) |
| $5,000 to $7,499 | 0 (0.0%) | 120 (14.6%) |
| $7,500 to $9,999 | 10 (0.9%) | 15 (1.8%) |
| $10,000 to $12,499 | 20 (1.8%) | 12 (1.5%) |
| $12,500 to $14,999 | 26 (2.4%) | 9 (1.1%) |
| $15,000 to $17,499 | 16 (1.5%) | 8 (1.0%) |
| $17,500 to $19,999 | 28 (2.6%) | 9 (1.1%) |
| $20,000 to $22,499 | 0 (0.0%) | 0 (0.0%) |
| $22,500 to $24,999 | 71 (6.5%) | 19 (2.3%) |
| $25,000 to $29,999 | 35 (3.2%) | 46 (5.6%) |
| $30,000 to $34,999 | 36 (3.3%) | 0 (0.0%) |
| $35,000 to $39,999 | 7 (0.6%) | 14 (1.7%) |
| $40,000 to $44,999 | 0 (0.0%) | 7 (0.9%) |
| $45,000 to $49,999 | 8 (0.7%) | 46 (5.6%) |
| $50,000 to $54,999 | 0 (0.0%) | 41 (5.0%) |
| $55,000 to $64,999 | 72 (6.6%) | 37 (4.5%) |
| $65,000 to $74,999 | 49 (4.5%) | 27 (3.3%) |
| $75,000 to $99,999 | 194 (17.8%) | 85 (10.4%) |
| $100,000+ | 486 (44.7%) | 142 (17.3%) |
| Total | 1,087 (100.0%) | 820 (100.0%) |
Earnings by Sex by Educational Attainment in Thompsonville
Average earnings in Thompsonville are $92,091 for men and $46,607 for women, a difference of 49.4%. Men with an educational attainment of graduate degree enjoy the highest average annual earnings of $115,875, while those with college or associate's degree education earn the least with $64,500. Women with an educational attainment of graduate degree earn the most with the average annual earnings of $68,750, while those with high school diploma education have the smallest earnings of $14,167.
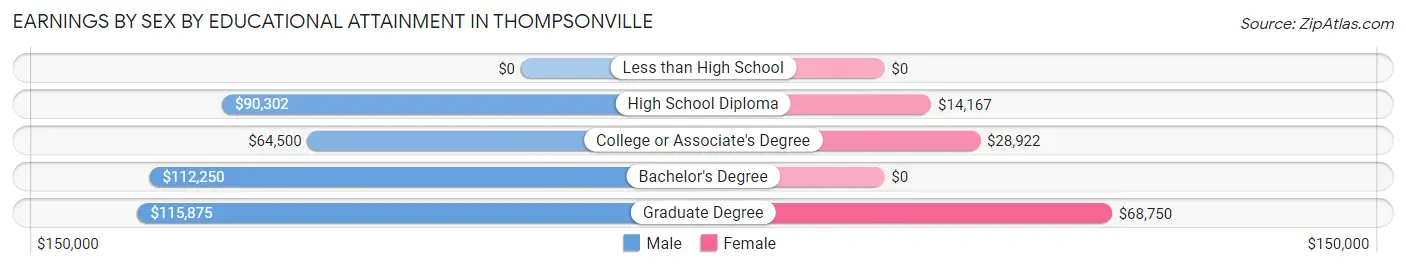
| Educational Attainment | Male Income | Female Income |
| Less than High School | - | - |
| High School Diploma | $90,302 | $14,167 |
| College or Associate's Degree | $64,500 | $28,922 |
| Bachelor's Degree | $112,250 | $0 |
| Graduate Degree | $115,875 | $68,750 |
| Total | $92,091 | $46,607 |
Family Income in Thompsonville
Family Income Brackets in Thompsonville
According to the Thompsonville family income data, there are 294 families falling into the $100,000 to $149,999 income range, which is the most common income bracket and makes up 27.9% of all families.
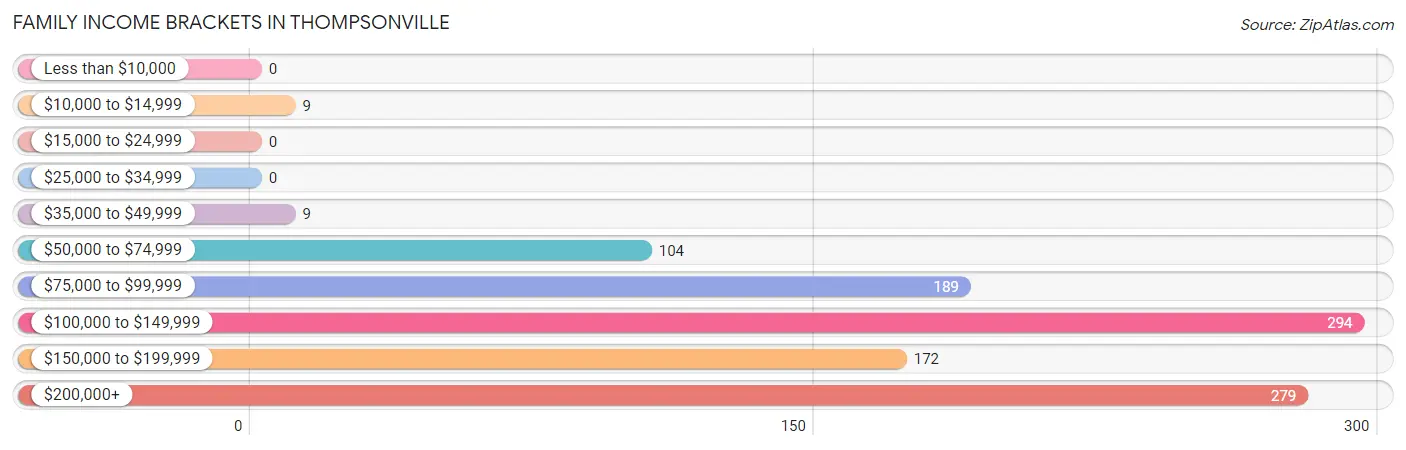
| Income Bracket | # Families | % Families |
| Less than $10,000 | 0 | 0.0% |
| $10,000 to $14,999 | 9 | 0.9% |
| $15,000 to $24,999 | 0 | 0.0% |
| $25,000 to $34,999 | 0 | 0.0% |
| $35,000 to $49,999 | 9 | 0.9% |
| $50,000 to $74,999 | 104 | 9.9% |
| $75,000 to $99,999 | 189 | 17.9% |
| $100,000 to $149,999 | 294 | 27.9% |
| $150,000 to $199,999 | 172 | 16.3% |
| $200,000+ | 279 | 26.4% |
Family Income by Famaliy Size in Thompsonville
4-person families (173 | 16.4%) account for the highest median family income in Thompsonville with $179,440 per family, while 2-person families (554 | 52.5%) have the highest median income of $56,440 per family member.
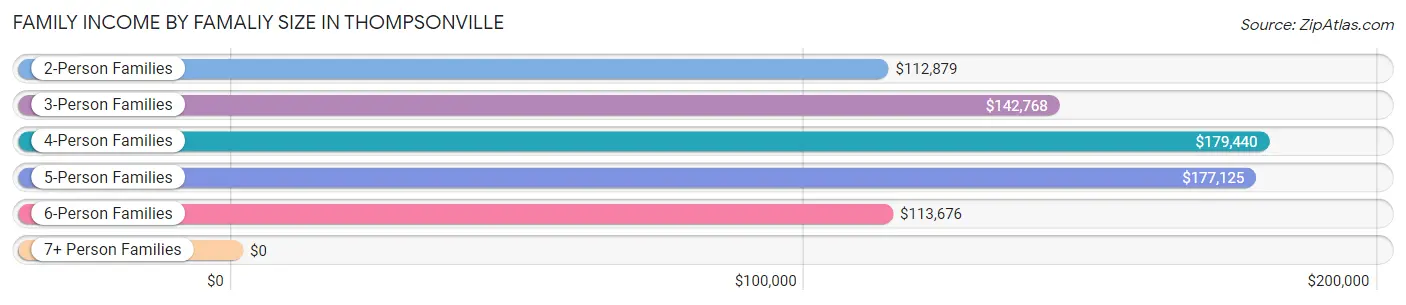
| Income Bracket | # Families | Median Income |
| 2-Person Families | 554 (52.5%) | $112,879 |
| 3-Person Families | 163 (15.4%) | $142,768 |
| 4-Person Families | 173 (16.4%) | $179,440 |
| 5-Person Families | 133 (12.6%) | $177,125 |
| 6-Person Families | 32 (3.0%) | $113,676 |
| 7+ Person Families | 0 (0.0%) | $0 |
| Total | 1,055 (100.0%) | $131,250 |
Family Income by Number of Earners in Thompsonville
The median family income in Thompsonville is $131,250, with families comprising 3+ earners (77) having the highest median family income of $183,875, while families with no earners (194) have the lowest median family income of $101,071, accounting for 7.3% and 18.4% of families, respectively.
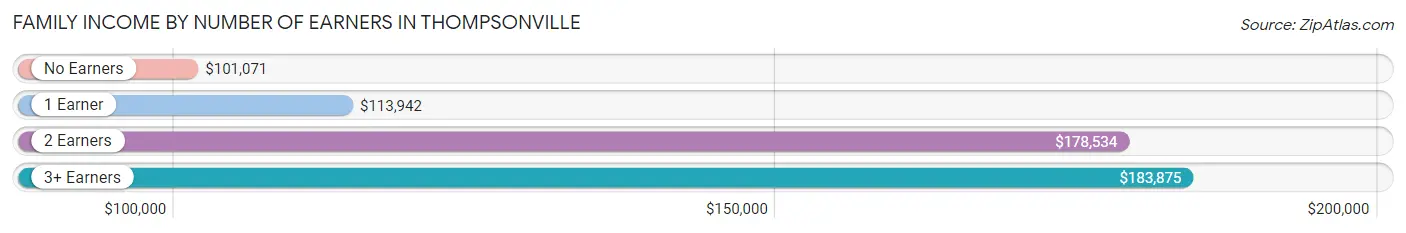
| Number of Earners | # Families | Median Income |
| No Earners | 194 (18.4%) | $101,071 |
| 1 Earner | 258 (24.4%) | $113,942 |
| 2 Earners | 526 (49.9%) | $178,534 |
| 3+ Earners | 77 (7.3%) | $183,875 |
| Total | 1,055 (100.0%) | $131,250 |
Household Income in Thompsonville
Household Income Brackets in Thompsonville
With 340 households falling in the category, the $100,000 to $149,999 income range is the most frequent in Thompsonville, accounting for 23.8% of all households.
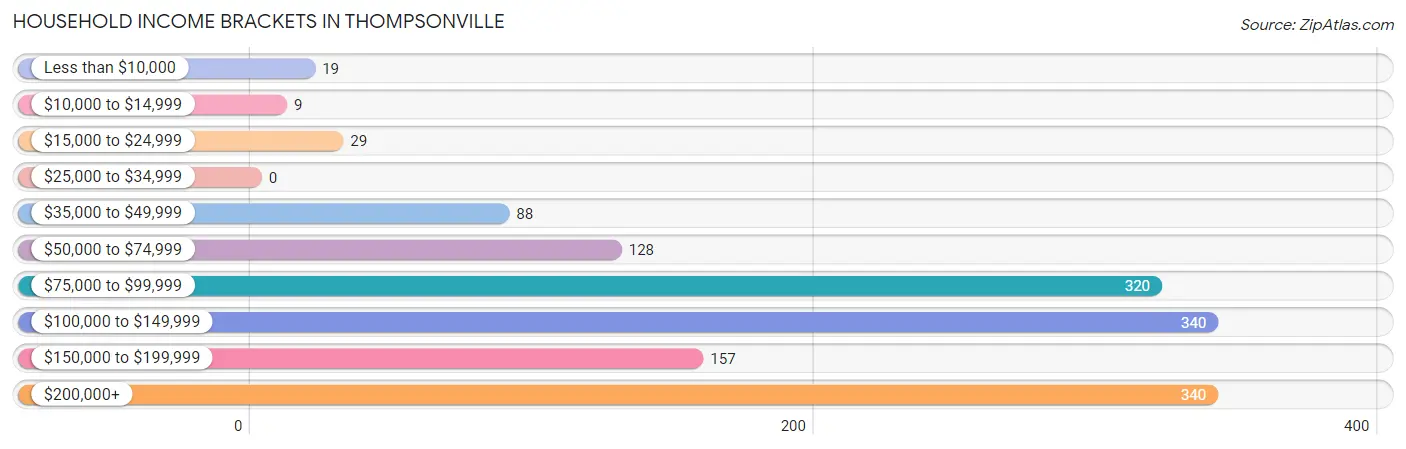
| Income Bracket | # Households | % Households |
| Less than $10,000 | 19 | 1.3% |
| $10,000 to $14,999 | 9 | 0.6% |
| $15,000 to $24,999 | 29 | 2.0% |
| $25,000 to $34,999 | 0 | 0.0% |
| $35,000 to $49,999 | 88 | 6.2% |
| $50,000 to $74,999 | 128 | 9.0% |
| $75,000 to $99,999 | 320 | 22.4% |
| $100,000 to $149,999 | 340 | 23.8% |
| $150,000 to $199,999 | 157 | 11.0% |
| $200,000+ | 340 | 23.8% |
Household Income by Householder Age in Thompsonville
The median household income in Thompsonville is $117,813, with the highest median household income of $146,522 found in the 45 to 64 years age bracket for the primary householder. A total of 554 households (38.8%) fall into this category. Meanwhile, the 15 to 24 years age bracket for the primary householder has the lowest median household income of $0, with 8 households (0.6%) in this group.
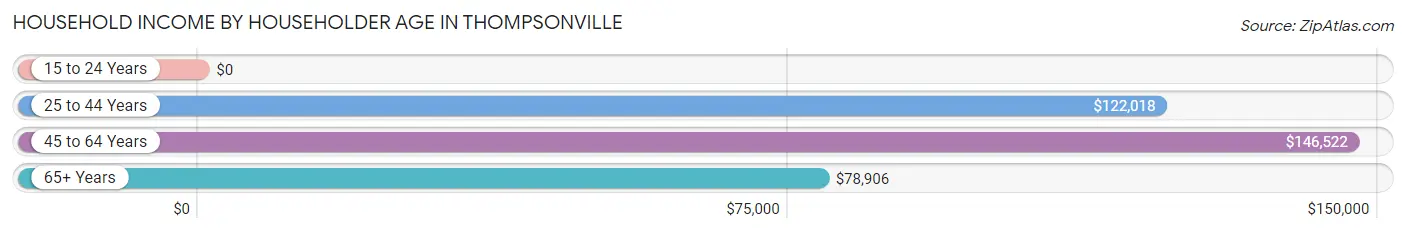
| Income Bracket | # Households | Median Income |
| 15 to 24 Years | 8 (0.6%) | $0 |
| 25 to 44 Years | 338 (23.7%) | $122,018 |
| 45 to 64 Years | 554 (38.8%) | $146,522 |
| 65+ Years | 527 (36.9%) | $78,906 |
| Total | 1,427 (100.0%) | $117,813 |
Poverty in Thompsonville
Income Below Poverty by Sex and Age in Thompsonville
With 0.4% poverty level for males and 2.0% for females among the residents of Thompsonville, 65 to 74 year old males and 65 to 74 year old females are the most vulnerable to poverty, with 7 males (2.4%) and 15 females (5.4%) in their respective age groups living below the poverty level.
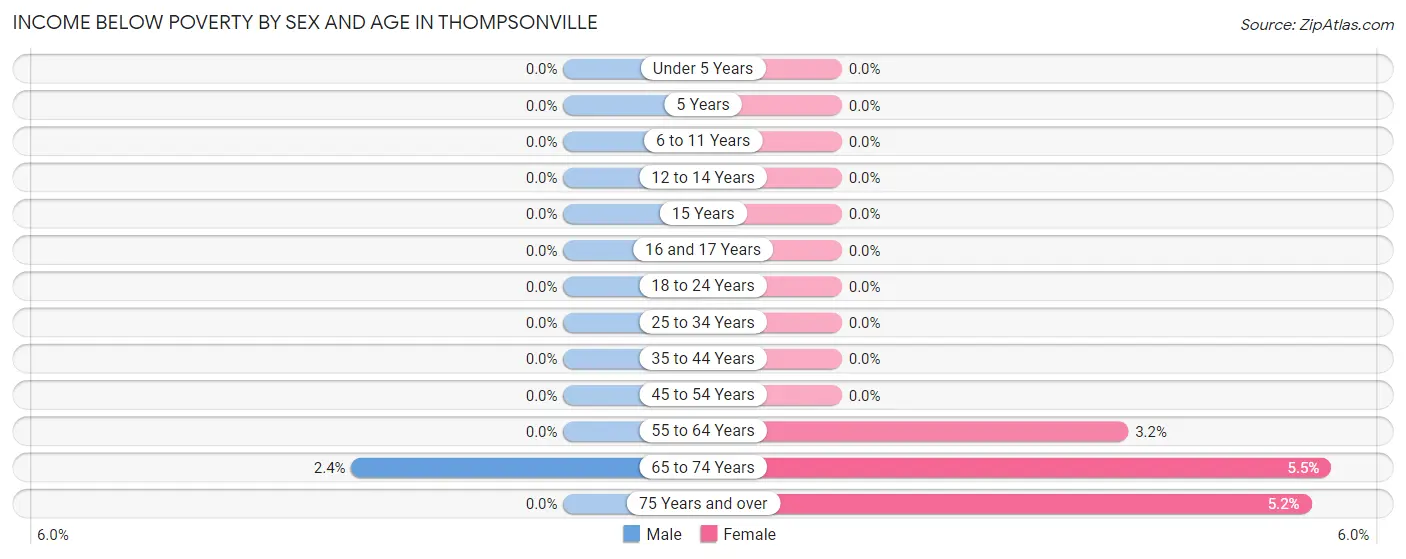
| Age Bracket | Male | Female |
| Under 5 Years | 0 (0.0%) | 0 (0.0%) |
| 5 Years | 0 (0.0%) | 0 (0.0%) |
| 6 to 11 Years | 0 (0.0%) | 0 (0.0%) |
| 12 to 14 Years | 0 (0.0%) | 0 (0.0%) |
| 15 Years | 0 (0.0%) | 0 (0.0%) |
| 16 and 17 Years | 0 (0.0%) | 0 (0.0%) |
| 18 to 24 Years | 0 (0.0%) | 0 (0.0%) |
| 25 to 34 Years | 0 (0.0%) | 0 (0.0%) |
| 35 to 44 Years | 0 (0.0%) | 0 (0.0%) |
| 45 to 54 Years | 0 (0.0%) | 0 (0.0%) |
| 55 to 64 Years | 0 (0.0%) | 11 (3.2%) |
| 65 to 74 Years | 7 (2.4%) | 15 (5.4%) |
| 75 Years and over | 0 (0.0%) | 9 (5.2%) |
| Total | 7 (0.4%) | 35 (2.0%) |
Income Above Poverty by Sex and Age in Thompsonville
According to the poverty statistics in Thompsonville, males aged under 5 years and females aged under 5 years are the age groups that are most secure financially, with 100.0% of males and 100.0% of females in these age groups living above the poverty line.
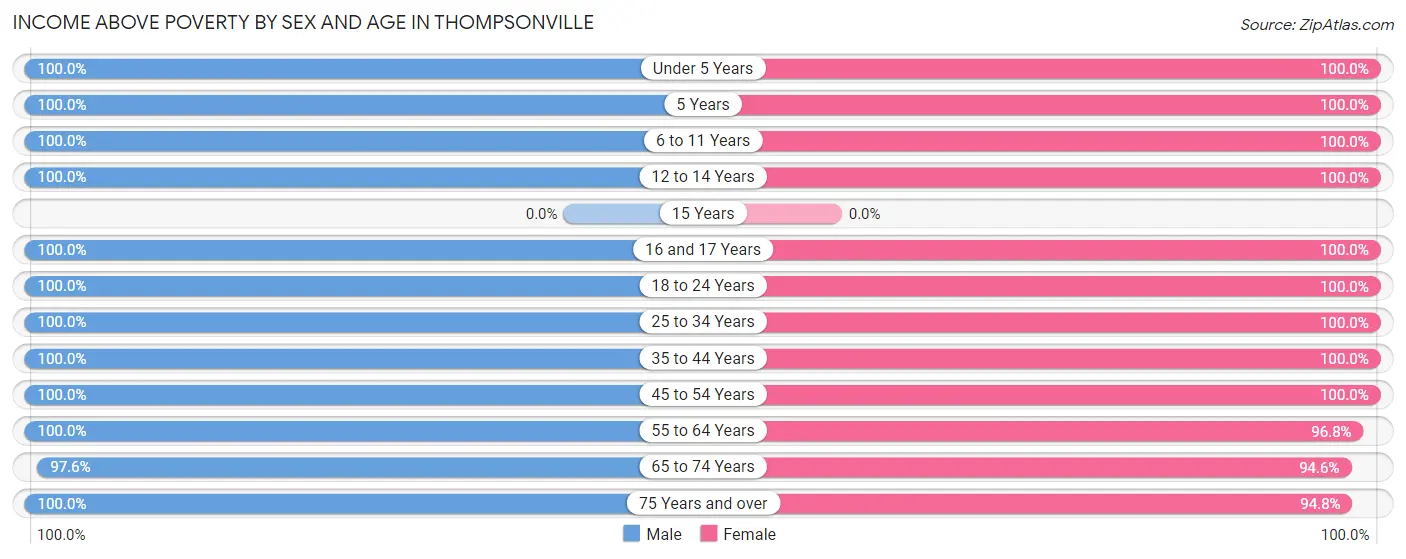
| Age Bracket | Male | Female |
| Under 5 Years | 99 (100.0%) | 69 (100.0%) |
| 5 Years | 78 (100.0%) | 29 (100.0%) |
| 6 to 11 Years | 302 (100.0%) | 90 (100.0%) |
| 12 to 14 Years | 42 (100.0%) | 86 (100.0%) |
| 15 Years | 0 (0.0%) | 0 (0.0%) |
| 16 and 17 Years | 46 (100.0%) | 113 (100.0%) |
| 18 to 24 Years | 8 (100.0%) | 76 (100.0%) |
| 25 to 34 Years | 70 (100.0%) | 66 (100.0%) |
| 35 to 44 Years | 311 (100.0%) | 304 (100.0%) |
| 45 to 54 Years | 147 (100.0%) | 109 (100.0%) |
| 55 to 64 Years | 367 (100.0%) | 334 (96.8%) |
| 65 to 74 Years | 289 (97.6%) | 260 (94.6%) |
| 75 Years and over | 189 (100.0%) | 163 (94.8%) |
| Total | 1,948 (99.6%) | 1,699 (98.0%) |
Income Below Poverty Among Married-Couple Families in Thompsonville
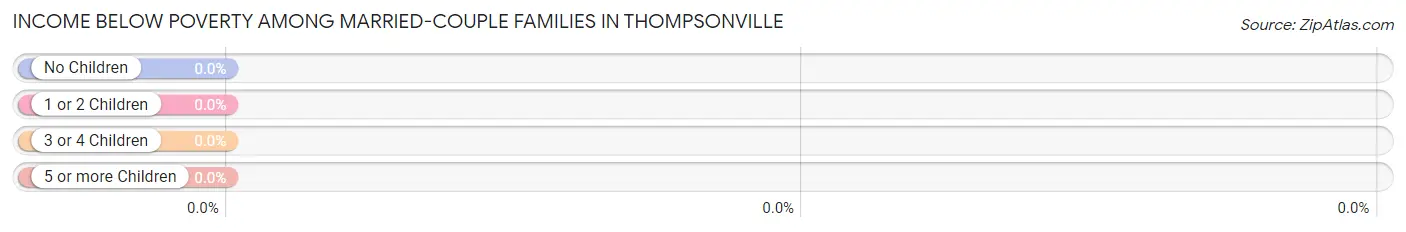
| Children | Above Poverty | Below Poverty |
| No Children | 621 (100.0%) | 0 (0.0%) |
| 1 or 2 Children | 183 (100.0%) | 0 (0.0%) |
| 3 or 4 Children | 144 (100.0%) | 0 (0.0%) |
| 5 or more Children | 0 (0.0%) | 0 (0.0%) |
| Total | 948 (100.0%) | 0 (0.0%) |
Income Below Poverty Among Single-Parent Households in Thompsonville
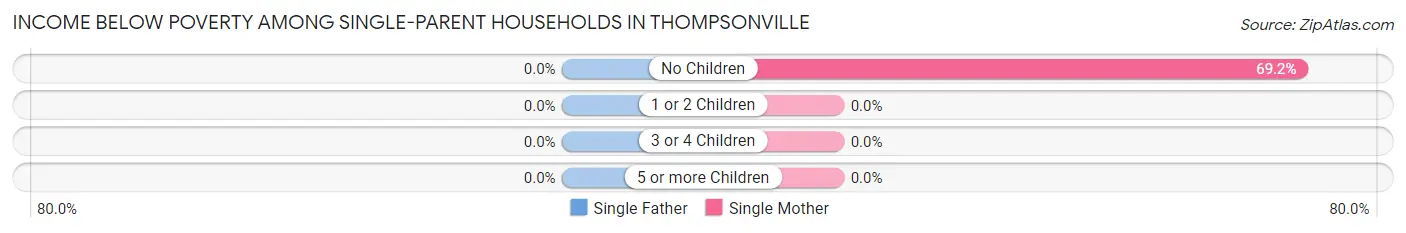
| Children | Single Father | Single Mother |
| No Children | 0 (0.0%) | 9 (69.2%) |
| 1 or 2 Children | 0 (0.0%) | 0 (0.0%) |
| 3 or 4 Children | 0 (0.0%) | 0 (0.0%) |
| 5 or more Children | 0 (0.0%) | 0 (0.0%) |
| Total | 0 (0.0%) | 9 (42.9%) |
Income Below Poverty Among Married-Couple vs Single-Parent Households in Thompsonville
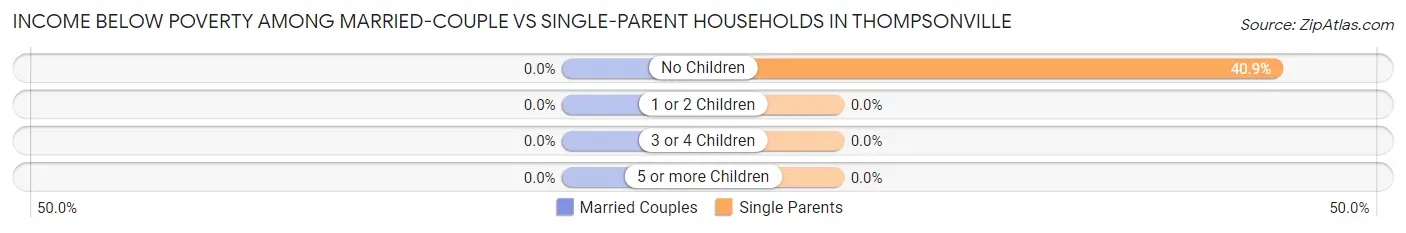
| Children | Married-Couple Families | Single-Parent Households |
| No Children | 0 (0.0%) | 9 (40.9%) |
| 1 or 2 Children | 0 (0.0%) | 0 (0.0%) |
| 3 or 4 Children | 0 (0.0%) | 0 (0.0%) |
| 5 or more Children | 0 (0.0%) | 0 (0.0%) |
| Total | 0 (0.0%) | 9 (8.4%) |
Race in Thompsonville
The most populous races in Thompsonville are White / Caucasian (3,763 | 97.5%), Asian (48 | 1.2%), and Two or more Races (42 | 1.1%).
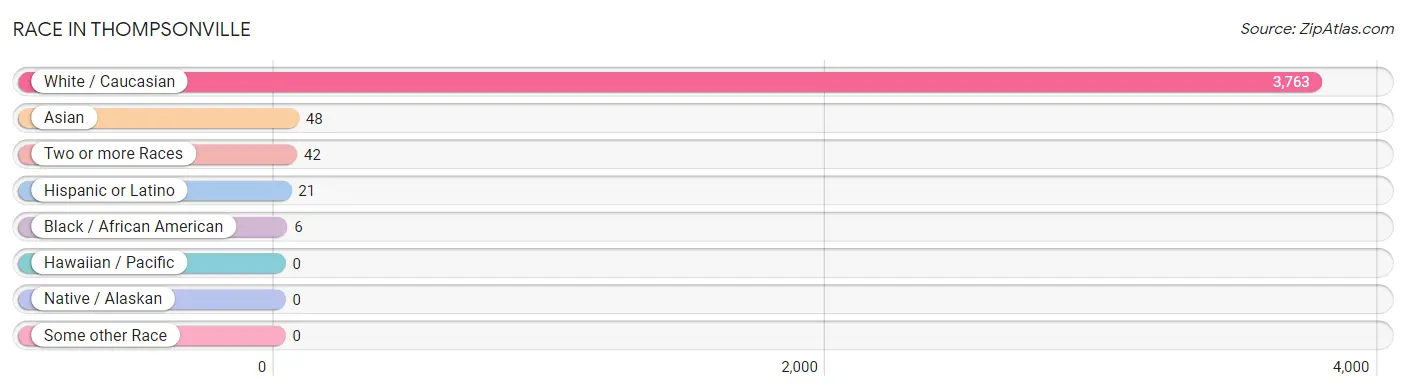
| Race | # Population | % Population |
| Asian | 48 | 1.2% |
| Black / African American | 6 | 0.2% |
| Hawaiian / Pacific | 0 | 0.0% |
| Hispanic or Latino | 21 | 0.5% |
| Native / Alaskan | 0 | 0.0% |
| White / Caucasian | 3,763 | 97.5% |
| Two or more Races | 42 | 1.1% |
| Some other Race | 0 | 0.0% |
| Total | 3,859 | 100.0% |
Ancestry in Thompsonville
The most populous ancestries reported in Thompsonville are German (960 | 24.9%), Irish (824 | 21.3%), Italian (676 | 17.5%), English (431 | 11.2%), and Polish (255 | 6.6%), together accounting for 81.5% of all Thompsonville residents.
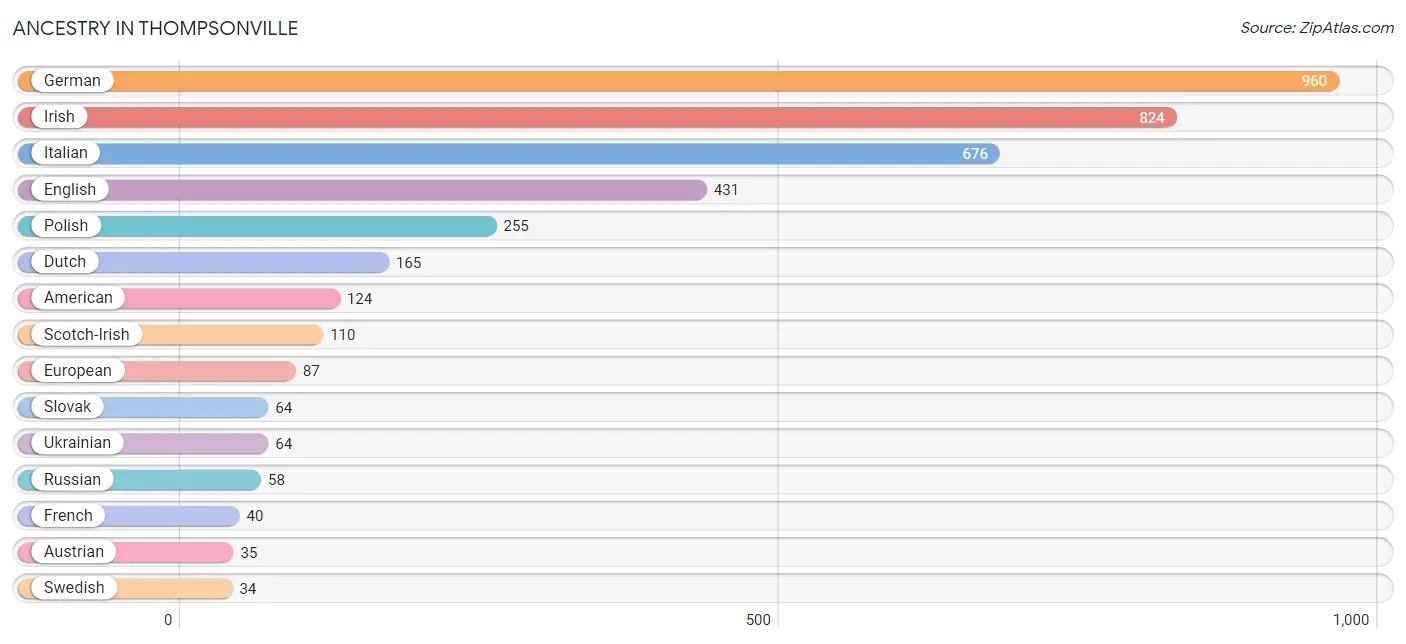
| Ancestry | # Population | % Population |
| American | 124 | 3.2% |
| Arab | 31 | 0.8% |
| Austrian | 35 | 0.9% |
| British | 8 | 0.2% |
| Cherokee | 8 | 0.2% |
| Croatian | 22 | 0.6% |
| Czech | 20 | 0.5% |
| Danish | 11 | 0.3% |
| Dominican | 8 | 0.2% |
| Dutch | 165 | 4.3% |
| English | 431 | 11.2% |
| European | 87 | 2.2% |
| French | 40 | 1.0% |
| French Canadian | 12 | 0.3% |
| German | 960 | 24.9% |
| Greek | 18 | 0.5% |
| Hungarian | 26 | 0.7% |
| Indian (Asian) | 19 | 0.5% |
| Irish | 824 | 21.3% |
| Italian | 676 | 17.5% |
| Korean | 5 | 0.1% |
| Lebanese | 23 | 0.6% |
| Lithuanian | 3 | 0.1% |
| Norwegian | 11 | 0.3% |
| Pennsylvania German | 3 | 0.1% |
| Polish | 255 | 6.6% |
| Puerto Rican | 7 | 0.2% |
| Russian | 58 | 1.5% |
| Scotch-Irish | 110 | 2.9% |
| Scottish | 31 | 0.8% |
| Slavic | 27 | 0.7% |
| Slovak | 64 | 1.7% |
| Slovene | 10 | 0.3% |
| Spanish | 6 | 0.2% |
| Swedish | 34 | 0.9% |
| Syrian | 8 | 0.2% |
| Thai | 24 | 0.6% |
| Ukrainian | 64 | 1.7% | View All 38 Rows |
Immigrants in Thompsonville
The most numerous immigrant groups reported in Thompsonville came from Asia (40 | 1.0%), Canada (20 | 0.5%), China (19 | 0.5%), Eastern Asia (19 | 0.5%), and Europe (14 | 0.4%), together accounting for 2.9% of all Thompsonville residents.
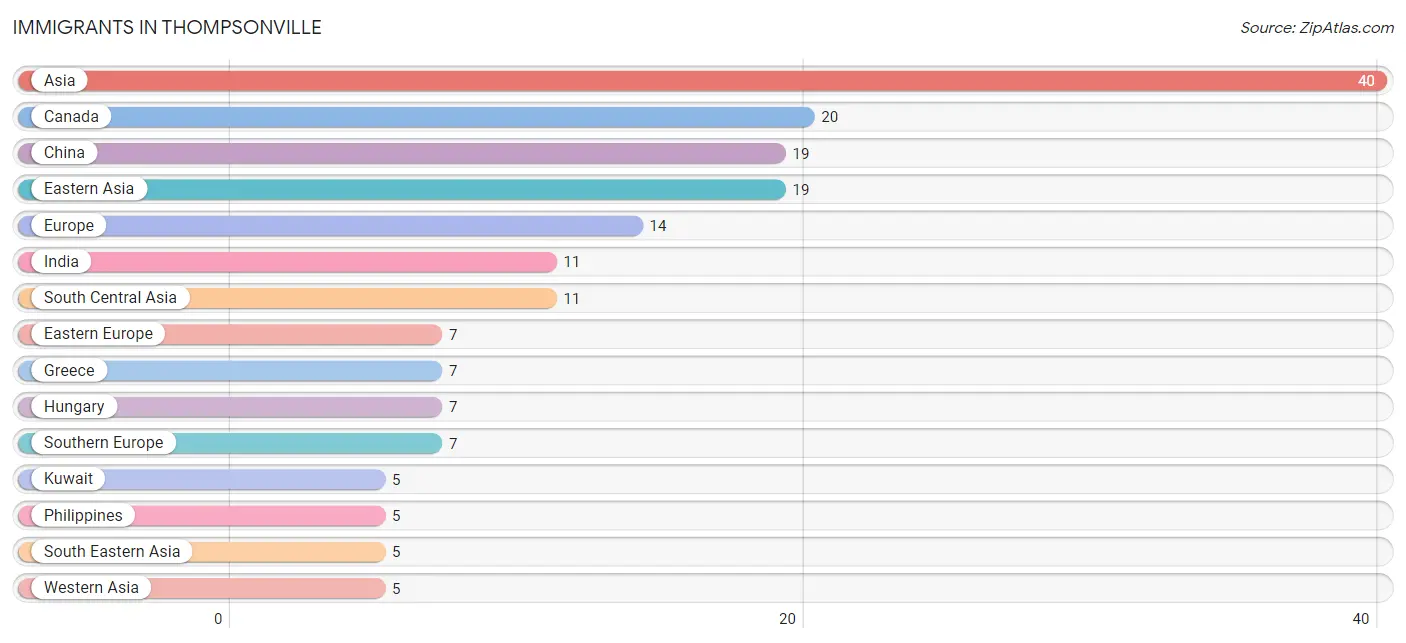
| Immigration Origin | # Population | % Population |
| Asia | 40 | 1.0% |
| Canada | 20 | 0.5% |
| China | 19 | 0.5% |
| Eastern Asia | 19 | 0.5% |
| Eastern Europe | 7 | 0.2% |
| Europe | 14 | 0.4% |
| Greece | 7 | 0.2% |
| Hungary | 7 | 0.2% |
| India | 11 | 0.3% |
| Kuwait | 5 | 0.1% |
| Philippines | 5 | 0.1% |
| South Central Asia | 11 | 0.3% |
| South Eastern Asia | 5 | 0.1% |
| Southern Europe | 7 | 0.2% |
| Western Asia | 5 | 0.1% | View All 15 Rows |
Sex and Age in Thompsonville
Sex and Age in Thompsonville
The most populous age groups in Thompsonville are 60 to 64 Years (258 | 12.7%) for men and 60 to 64 Years (254 | 13.9%) for women.
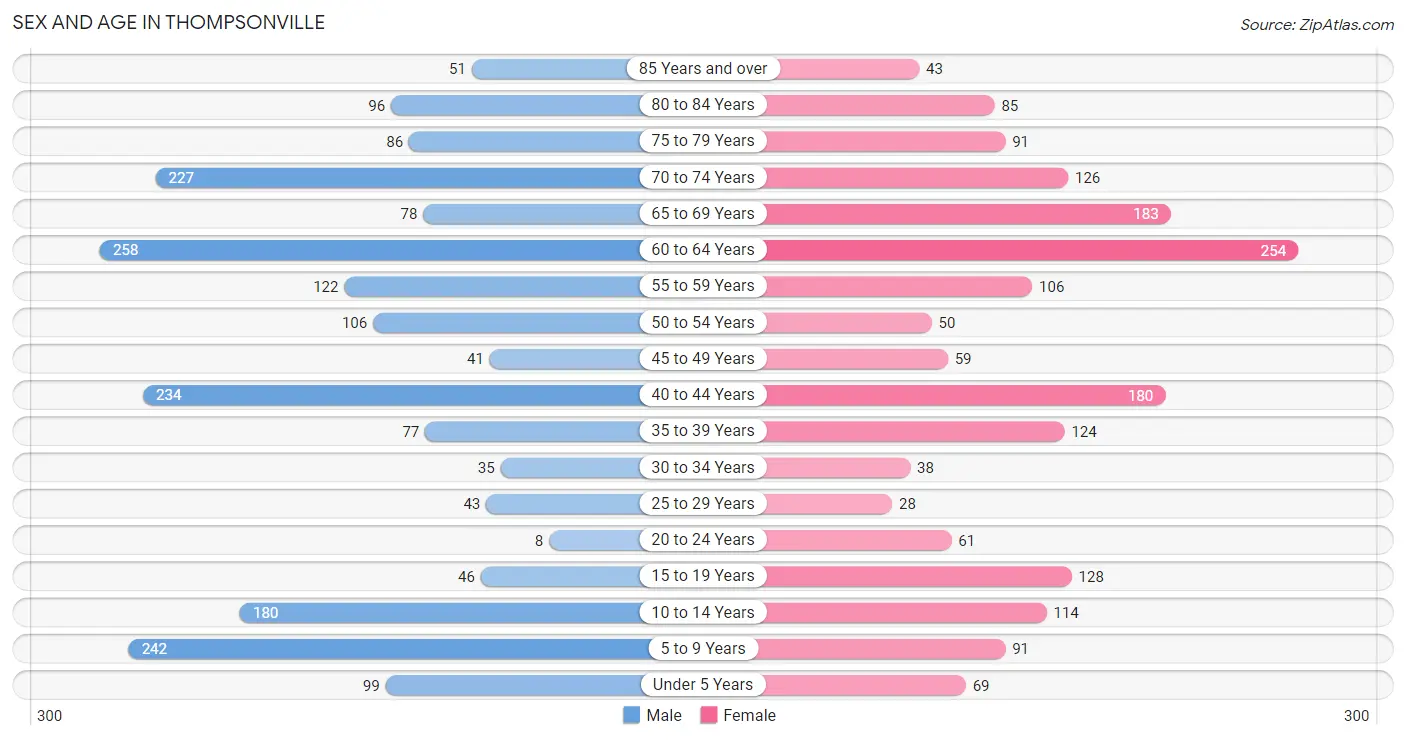
| Age Bracket | Male | Female |
| Under 5 Years | 99 (4.9%) | 69 (3.8%) |
| 5 to 9 Years | 242 (11.9%) | 91 (5.0%) |
| 10 to 14 Years | 180 (8.9%) | 114 (6.2%) |
| 15 to 19 Years | 46 (2.3%) | 128 (7.0%) |
| 20 to 24 Years | 8 (0.4%) | 61 (3.3%) |
| 25 to 29 Years | 43 (2.1%) | 28 (1.5%) |
| 30 to 34 Years | 35 (1.7%) | 38 (2.1%) |
| 35 to 39 Years | 77 (3.8%) | 124 (6.8%) |
| 40 to 44 Years | 234 (11.5%) | 180 (9.8%) |
| 45 to 49 Years | 41 (2.0%) | 59 (3.2%) |
| 50 to 54 Years | 106 (5.2%) | 50 (2.7%) |
| 55 to 59 Years | 122 (6.0%) | 106 (5.8%) |
| 60 to 64 Years | 258 (12.7%) | 254 (13.9%) |
| 65 to 69 Years | 78 (3.8%) | 183 (10.0%) |
| 70 to 74 Years | 227 (11.2%) | 126 (6.9%) |
| 75 to 79 Years | 86 (4.2%) | 91 (5.0%) |
| 80 to 84 Years | 96 (4.7%) | 85 (4.6%) |
| 85 Years and over | 51 (2.5%) | 43 (2.4%) |
| Total | 2,029 (100.0%) | 1,830 (100.0%) |
Families and Households in Thompsonville
Median Family Size in Thompsonville
The median family size in Thompsonville is 3.06 persons per family, with single male/father families (86 | 8.2%) accounting for the largest median family size of 3.53 persons per family. On the other hand, single female/mother families (21 | 2.0%) represent the smallest median family size with 2.81 persons per family.
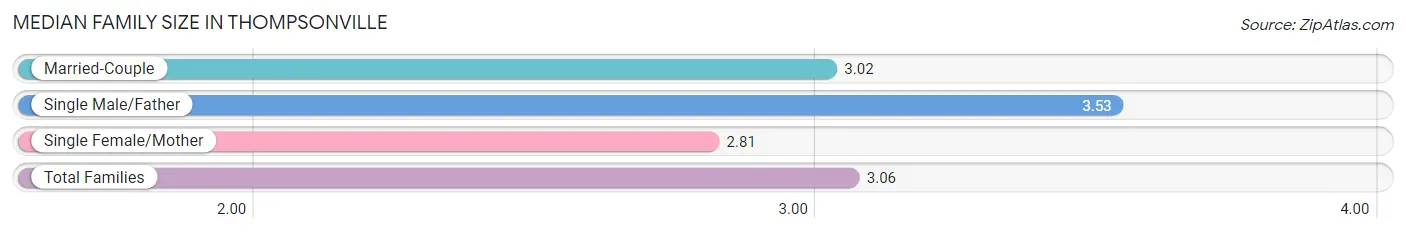
| Family Type | # Families | Family Size |
| Married-Couple | 948 (89.9%) | 3.02 |
| Single Male/Father | 86 (8.2%) | 3.53 |
| Single Female/Mother | 21 (2.0%) | 2.81 |
| Total Families | 1,055 (100.0%) | 3.06 |
Median Household Size in Thompsonville
The median household size in Thompsonville is 2.59 persons per household, with single male/father households (86 | 6.0%) accounting for the largest median household size of 3.98 persons per household. non-family households (372 | 26.1%) represent the smallest median household size with 1.14 persons per household.
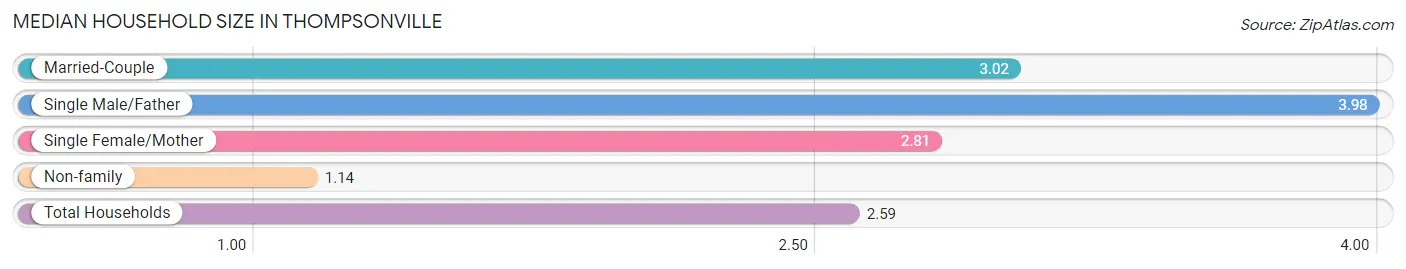
| Household Type | # Households | Household Size |
| Married-Couple | 948 (66.4%) | 3.02 |
| Single Male/Father | 86 (6.0%) | 3.98 |
| Single Female/Mother | 21 (1.5%) | 2.81 |
| Non-family | 372 (26.1%) | 1.14 |
| Total Households | 1,427 (100.0%) | 2.59 |
Household Size by Marriage Status in Thompsonville
Out of a total of 1,427 households in Thompsonville, 1,055 (73.9%) are family households, while 372 (26.1%) are nonfamily households. The most numerous type of family households are 2-person households, comprising 546, and the most common type of nonfamily households are 1-person households, comprising 322.
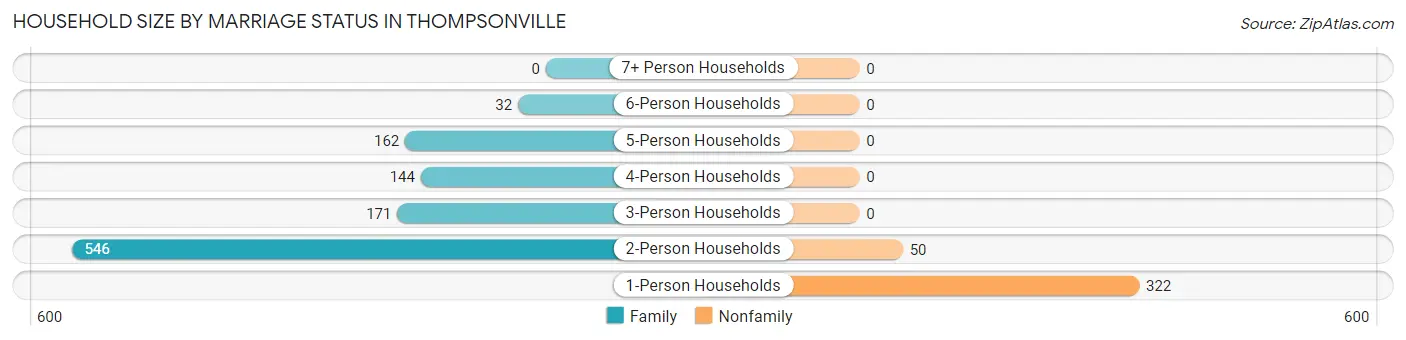
| Household Size | Family Households | Nonfamily Households |
| 1-Person Households | - | 322 (22.6%) |
| 2-Person Households | 546 (38.3%) | 50 (3.5%) |
| 3-Person Households | 171 (12.0%) | 0 (0.0%) |
| 4-Person Households | 144 (10.1%) | 0 (0.0%) |
| 5-Person Households | 162 (11.4%) | 0 (0.0%) |
| 6-Person Households | 32 (2.2%) | 0 (0.0%) |
| 7+ Person Households | 0 (0.0%) | 0 (0.0%) |
| Total | 1,055 (73.9%) | 372 (26.1%) |
Female Fertility in Thompsonville
Fertility by Age in Thompsonville
Average fertility rate in Thompsonville is 50.0 births per 1,000 women. Women in the age bracket of 20 to 34 years have the highest fertility rate with 244.0 births per 1,000 women. Women in the age bracket of 20 to 34 years acount for 100.0% of all women with births.
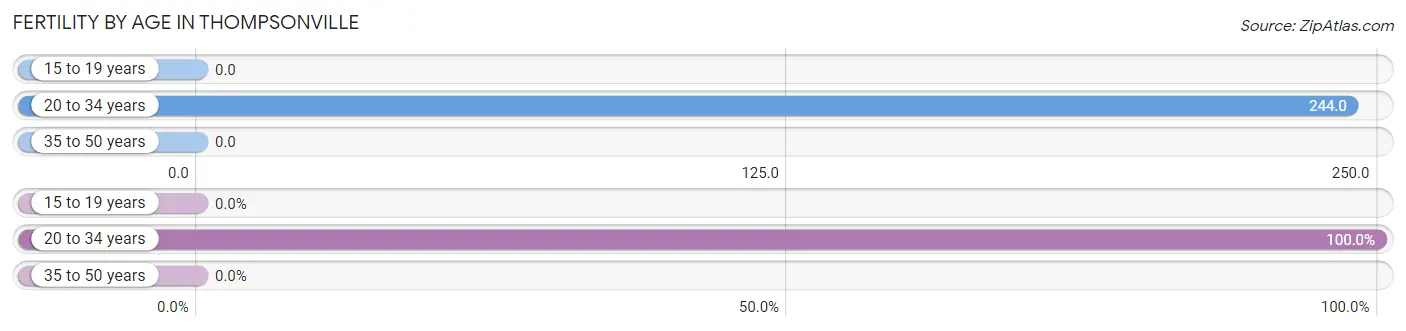
| Age Bracket | Women with Births | Births / 1,000 Women |
| 15 to 19 years | 0 (0.0%) | 0.0 |
| 20 to 34 years | 31 (100.0%) | 244.0 |
| 35 to 50 years | 0 (0.0%) | 0.0 |
| Total | 31 (100.0%) | 50.0 |
Fertility by Age by Marriage Status in Thompsonville
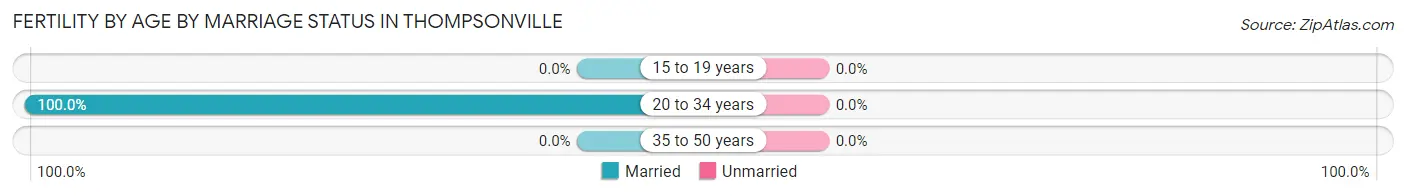
| Age Bracket | Married | Unmarried |
| 15 to 19 years | 0 (0.0%) | 0 (0.0%) |
| 20 to 34 years | 31 (100.0%) | 0 (0.0%) |
| 35 to 50 years | 0 (0.0%) | 0 (0.0%) |
| Total | 31 (100.0%) | 0 (0.0%) |
Fertility by Education in Thompsonville
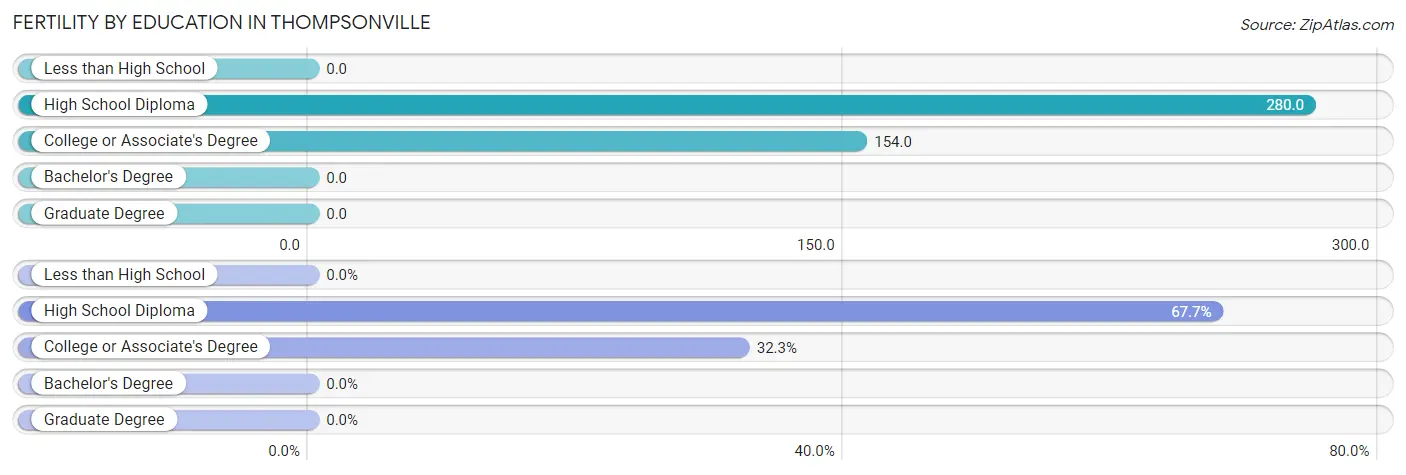
| Educational Attainment | Women with Births | Births / 1,000 Women |
| Less than High School | 0 (0.0%) | 0.0 |
| High School Diploma | 21 (67.7%) | 280.0 |
| College or Associate's Degree | 10 (32.3%) | 154.0 |
| Bachelor's Degree | 0 (0.0%) | 0.0 |
| Graduate Degree | 0 (0.0%) | 0.0 |
| Total | 31 (100.0%) | 50.0 |
Fertility by Education by Marriage Status in Thompsonville
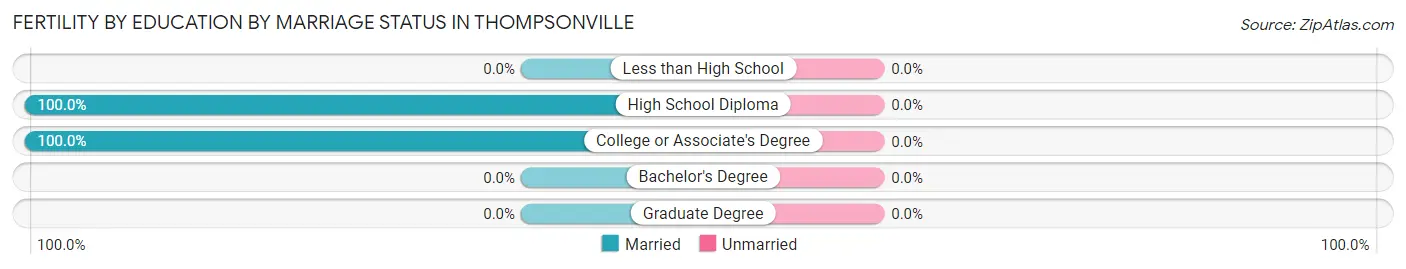
| Educational Attainment | Married | Unmarried |
| Less than High School | 0 (0.0%) | 0 (0.0%) |
| High School Diploma | 21 (100.0%) | 0 (0.0%) |
| College or Associate's Degree | 10 (100.0%) | 0 (0.0%) |
| Bachelor's Degree | 0 (0.0%) | 0 (0.0%) |
| Graduate Degree | 0 (0.0%) | 0 (0.0%) |
| Total | 31 (100.0%) | 0 (0.0%) |
Employment Characteristics in Thompsonville
Employment by Class of Employer in Thompsonville
Among the 1,672 employed individuals in Thompsonville, private company employees (1,202 | 71.9%), not-for-profit organizations (167 | 10.0%), and local government employees (81 | 4.8%) make up the most common classes of employment.
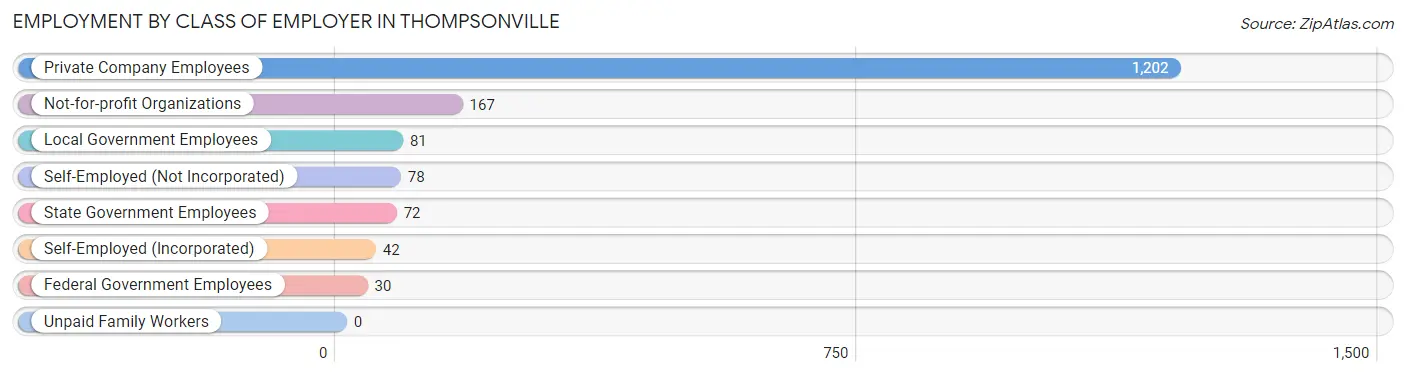
| Employer Class | # Employees | % Employees |
| Private Company Employees | 1,202 | 71.9% |
| Self-Employed (Incorporated) | 42 | 2.5% |
| Self-Employed (Not Incorporated) | 78 | 4.7% |
| Not-for-profit Organizations | 167 | 10.0% |
| Local Government Employees | 81 | 4.8% |
| State Government Employees | 72 | 4.3% |
| Federal Government Employees | 30 | 1.8% |
| Unpaid Family Workers | 0 | 0.0% |
| Total | 1,672 | 100.0% |
Employment Status by Age in Thompsonville
According to the labor force statistics for Thompsonville, out of the total population over 16 years of age (3,064), 56.8% or 1,740 individuals are in the labor force, with 1.4% or 24 of them unemployed. The age group with the highest labor force participation rate is 30 to 34 years, with 100.0% or 73 individuals in the labor force. Within the labor force, the 35 to 44 years age range has the highest percentage of unemployed individuals, with 4.4% or 24 of them being unemployed.
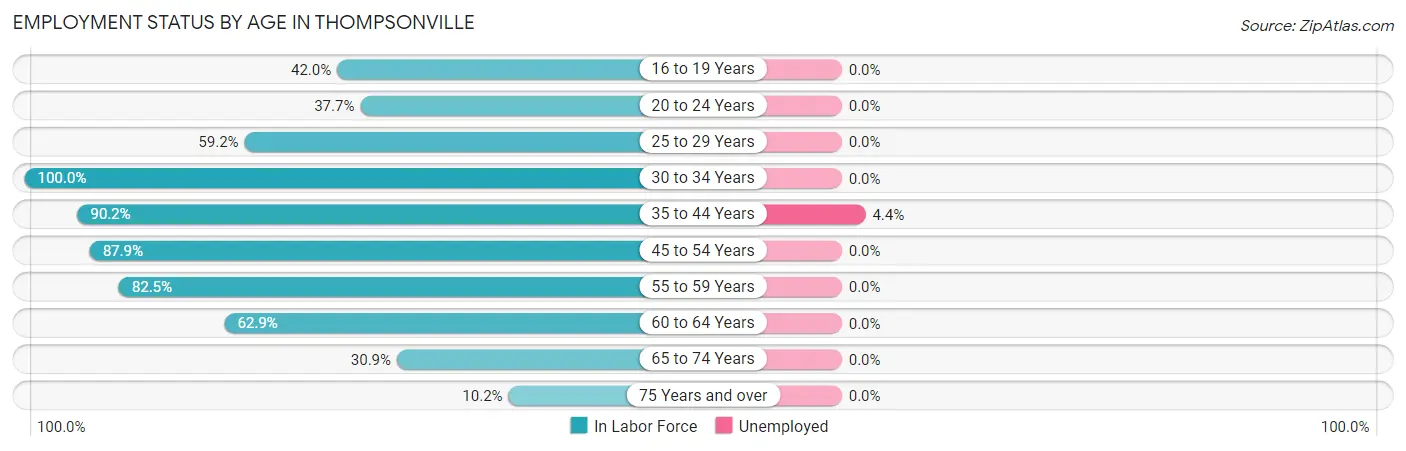
| Age Bracket | In Labor Force | Unemployed |
| 16 to 19 Years | 73 (42.0%) | 0 (0.0%) |
| 20 to 24 Years | 26 (37.7%) | 0 (0.0%) |
| 25 to 29 Years | 42 (59.2%) | 0 (0.0%) |
| 30 to 34 Years | 73 (100.0%) | 0 (0.0%) |
| 35 to 44 Years | 555 (90.2%) | 24 (4.4%) |
| 45 to 54 Years | 225 (87.9%) | 0 (0.0%) |
| 55 to 59 Years | 188 (82.5%) | 0 (0.0%) |
| 60 to 64 Years | 322 (62.9%) | 0 (0.0%) |
| 65 to 74 Years | 190 (30.9%) | 0 (0.0%) |
| 75 Years and over | 46 (10.2%) | 0 (0.0%) |
| Total | 1,740 (56.8%) | 24 (1.4%) |
Employment Status by Educational Attainment in Thompsonville
According to labor force statistics for Thompsonville, 80.1% of individuals (1,406) out of the total population between 25 and 64 years of age (1,755) are in the labor force, with 1.7% or 24 of them being unemployed. The group with the highest labor force participation rate are those with the educational attainment of bachelor's degree or higher, with 84.6% or 941 individuals in the labor force. Within the labor force, individuals with bachelor's degree or higher education have the highest percentage of unemployment, with 2.6% or 24 of them being unemployed.
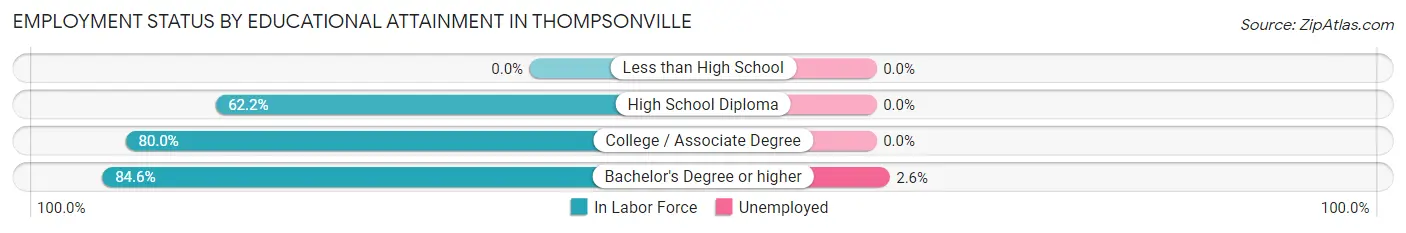
| Educational Attainment | In Labor Force | Unemployed |
| Less than High School | 0 (0.0%) | 0 (0.0%) |
| High School Diploma | 176 (62.2%) | 0 (0.0%) |
| College / Associate Degree | 288 (80.0%) | 0 (0.0%) |
| Bachelor's Degree or higher | 941 (84.6%) | 29 (2.6%) |
| Total | 1,406 (80.1%) | 30 (1.7%) |
Employment Occupations by Sex in Thompsonville
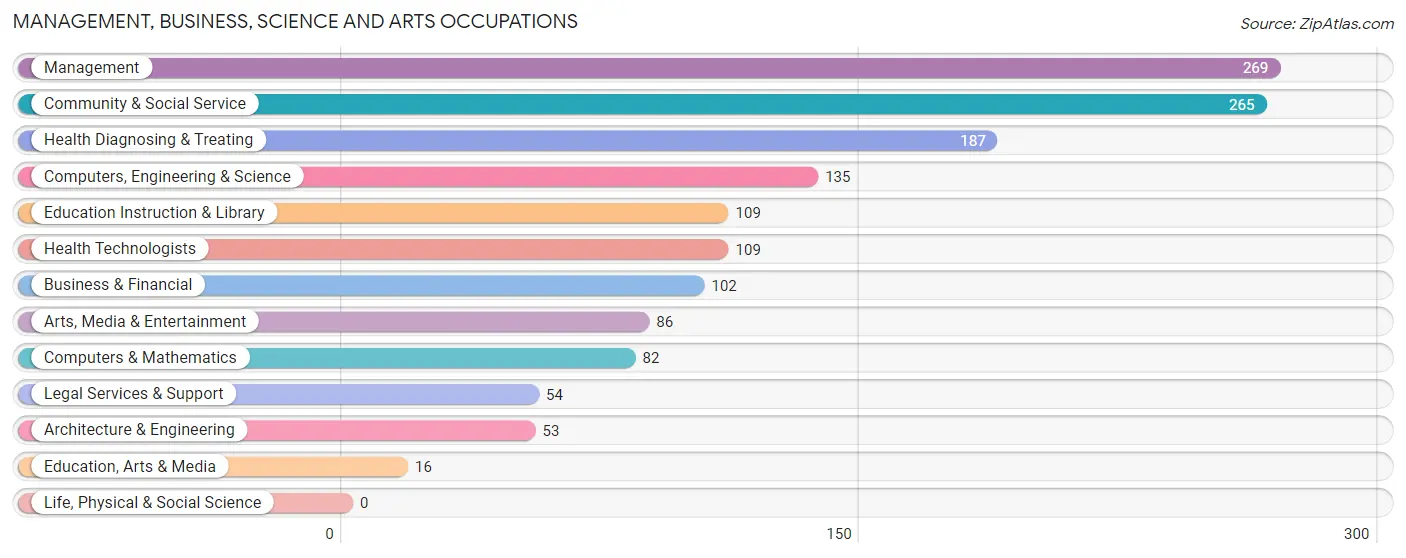
Management, Business, Science and Arts Occupations
The most common Management, Business, Science and Arts occupations in Thompsonville are Management (269 | 15.8%), Community & Social Service (265 | 15.5%), Health Diagnosing & Treating (187 | 11.0%), Computers, Engineering & Science (135 | 7.9%), and Education Instruction & Library (109 | 6.4%).
Management, Business, Science and Arts Occupations by Sex
Within the Management, Business, Science and Arts occupations in Thompsonville, the most male-oriented occupations are Computers & Mathematics (89.0%), Computers, Engineering & Science (85.9%), and Architecture & Engineering (81.1%), while the most female-oriented occupations are Health Technologists (78.0%), Health Diagnosing & Treating (65.8%), and Education Instruction & Library (55.0%).
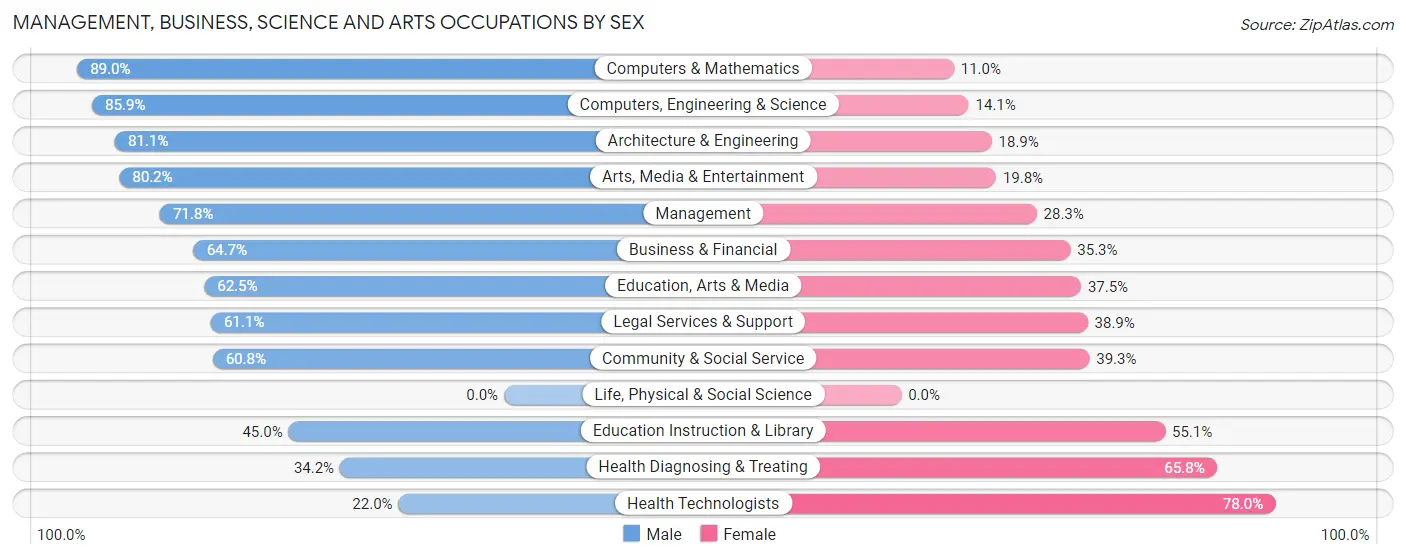
| Occupation | Male | Female |
| Management | 193 (71.8%) | 76 (28.2%) |
| Business & Financial | 66 (64.7%) | 36 (35.3%) |
| Computers, Engineering & Science | 116 (85.9%) | 19 (14.1%) |
| Computers & Mathematics | 73 (89.0%) | 9 (11.0%) |
| Architecture & Engineering | 43 (81.1%) | 10 (18.9%) |
| Life, Physical & Social Science | 0 (0.0%) | 0 (0.0%) |
| Community & Social Service | 161 (60.8%) | 104 (39.3%) |
| Education, Arts & Media | 10 (62.5%) | 6 (37.5%) |
| Legal Services & Support | 33 (61.1%) | 21 (38.9%) |
| Education Instruction & Library | 49 (45.0%) | 60 (55.0%) |
| Arts, Media & Entertainment | 69 (80.2%) | 17 (19.8%) |
| Health Diagnosing & Treating | 64 (34.2%) | 123 (65.8%) |
| Health Technologists | 24 (22.0%) | 85 (78.0%) |
| Total (Category) | 600 (62.6%) | 358 (37.4%) |
| Total (Overall) | 1,049 (61.4%) | 659 (38.6%) |
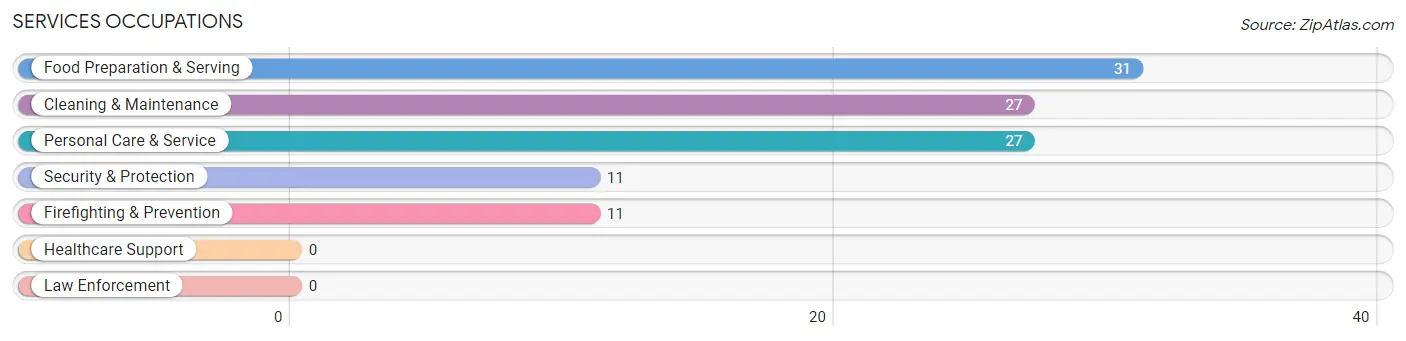
Services Occupations
The most common Services occupations in Thompsonville are Food Preparation & Serving (31 | 1.8%), Cleaning & Maintenance (27 | 1.6%), Personal Care & Service (27 | 1.6%), Security & Protection (11 | 0.6%), and Firefighting & Prevention (11 | 0.6%).
Services Occupations by Sex
Within the Services occupations in Thompsonville, the most male-oriented occupations are Security & Protection (100.0%), Firefighting & Prevention (100.0%), and Cleaning & Maintenance (100.0%), while the most female-oriented occupations are Food Preparation & Serving (100.0%), and Personal Care & Service (100.0%).
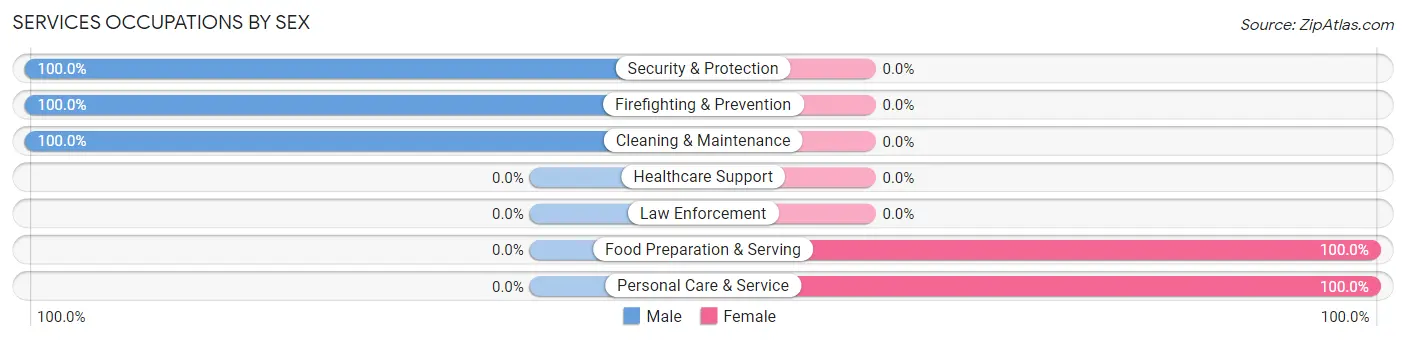
| Occupation | Male | Female |
| Healthcare Support | 0 (0.0%) | 0 (0.0%) |
| Security & Protection | 11 (100.0%) | 0 (0.0%) |
| Firefighting & Prevention | 11 (100.0%) | 0 (0.0%) |
| Law Enforcement | 0 (0.0%) | 0 (0.0%) |
| Food Preparation & Serving | 0 (0.0%) | 31 (100.0%) |
| Cleaning & Maintenance | 27 (100.0%) | 0 (0.0%) |
| Personal Care & Service | 0 (0.0%) | 27 (100.0%) |
| Total (Category) | 38 (39.6%) | 58 (60.4%) |
| Total (Overall) | 1,049 (61.4%) | 659 (38.6%) |
Sales and Office Occupations
The most common Sales and Office occupations in Thompsonville are Sales & Related (186 | 10.9%), and Office & Administration (132 | 7.7%).
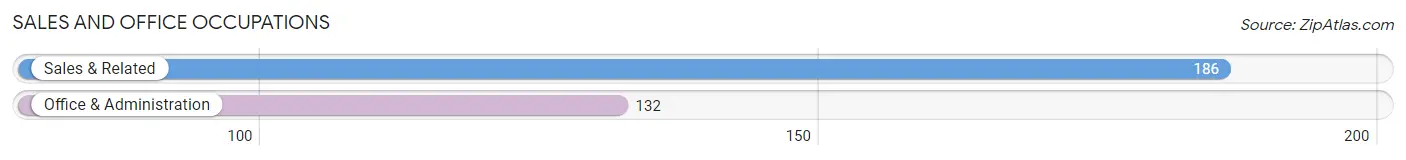
Sales and Office Occupations by Sex
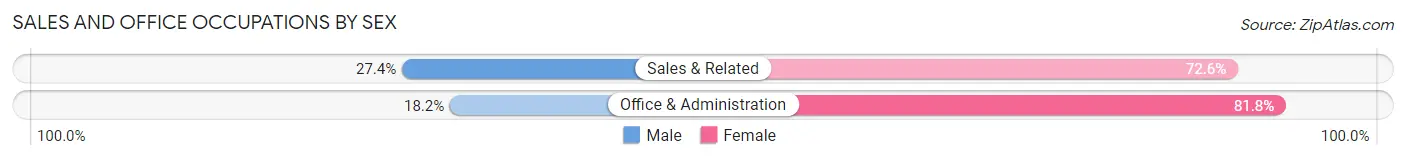
| Occupation | Male | Female |
| Sales & Related | 51 (27.4%) | 135 (72.6%) |
| Office & Administration | 24 (18.2%) | 108 (81.8%) |
| Total (Category) | 75 (23.6%) | 243 (76.4%) |
| Total (Overall) | 1,049 (61.4%) | 659 (38.6%) |
Natural Resources, Construction and Maintenance Occupations
The most common Natural Resources, Construction and Maintenance occupations in Thompsonville are Installation, Maintenance & Repair (84 | 4.9%), and Construction & Extraction (46 | 2.7%).
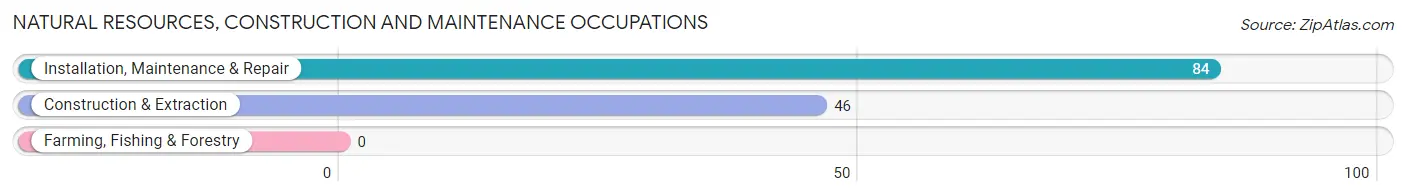
Natural Resources, Construction and Maintenance Occupations by Sex
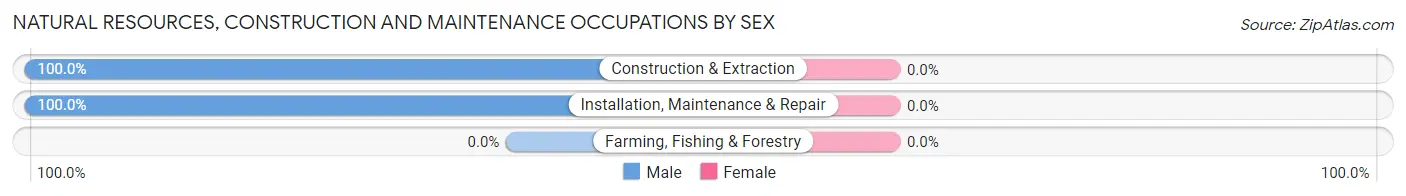
| Occupation | Male | Female |
| Farming, Fishing & Forestry | 0 (0.0%) | 0 (0.0%) |
| Construction & Extraction | 46 (100.0%) | 0 (0.0%) |
| Installation, Maintenance & Repair | 84 (100.0%) | 0 (0.0%) |
| Total (Category) | 130 (100.0%) | 0 (0.0%) |
| Total (Overall) | 1,049 (61.4%) | 659 (38.6%) |
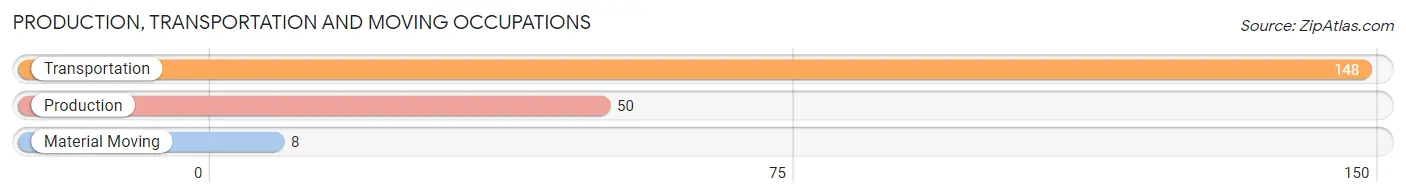
Production, Transportation and Moving Occupations
The most common Production, Transportation and Moving occupations in Thompsonville are Transportation (148 | 8.7%), Production (50 | 2.9%), and Material Moving (8 | 0.5%).
Production, Transportation and Moving Occupations by Sex
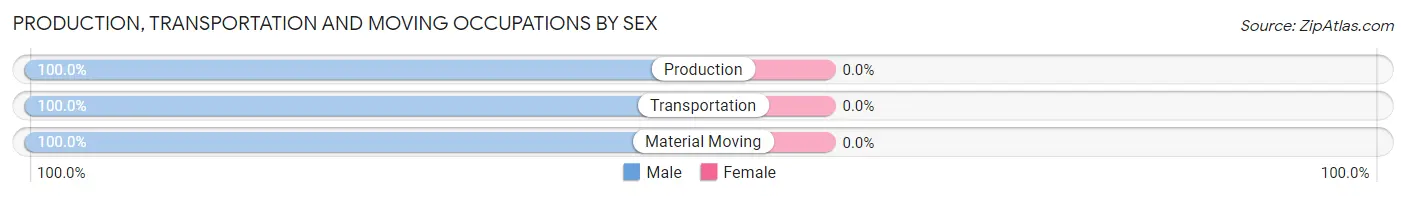
| Occupation | Male | Female |
| Production | 50 (100.0%) | 0 (0.0%) |
| Transportation | 148 (100.0%) | 0 (0.0%) |
| Material Moving | 8 (100.0%) | 0 (0.0%) |
| Total (Category) | 206 (100.0%) | 0 (0.0%) |
| Total (Overall) | 1,049 (61.4%) | 659 (38.6%) |
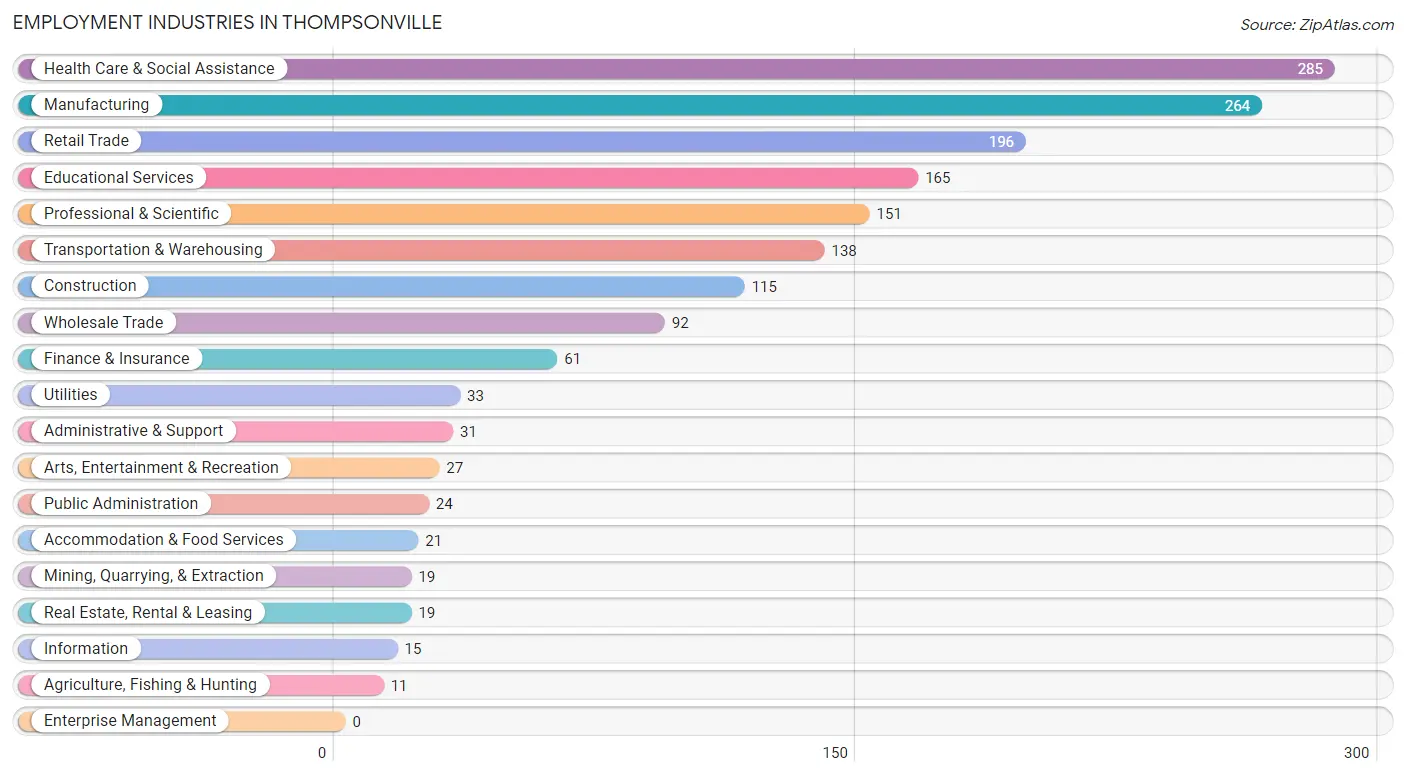
Employment Industries by Sex in Thompsonville
Employment Industries in Thompsonville
The major employment industries in Thompsonville include Health Care & Social Assistance (285 | 16.7%), Manufacturing (264 | 15.5%), Retail Trade (196 | 11.5%), Educational Services (165 | 9.7%), and Professional & Scientific (151 | 8.8%).
Employment Industries by Sex in Thompsonville
The Thompsonville industries that see more men than women are Agriculture, Fishing & Hunting (100.0%), Mining, Quarrying, & Extraction (100.0%), and Construction (100.0%), whereas the industries that tend to have a higher number of women are Accommodation & Food Services (100.0%), Administrative & Support (77.4%), and Retail Trade (66.8%).
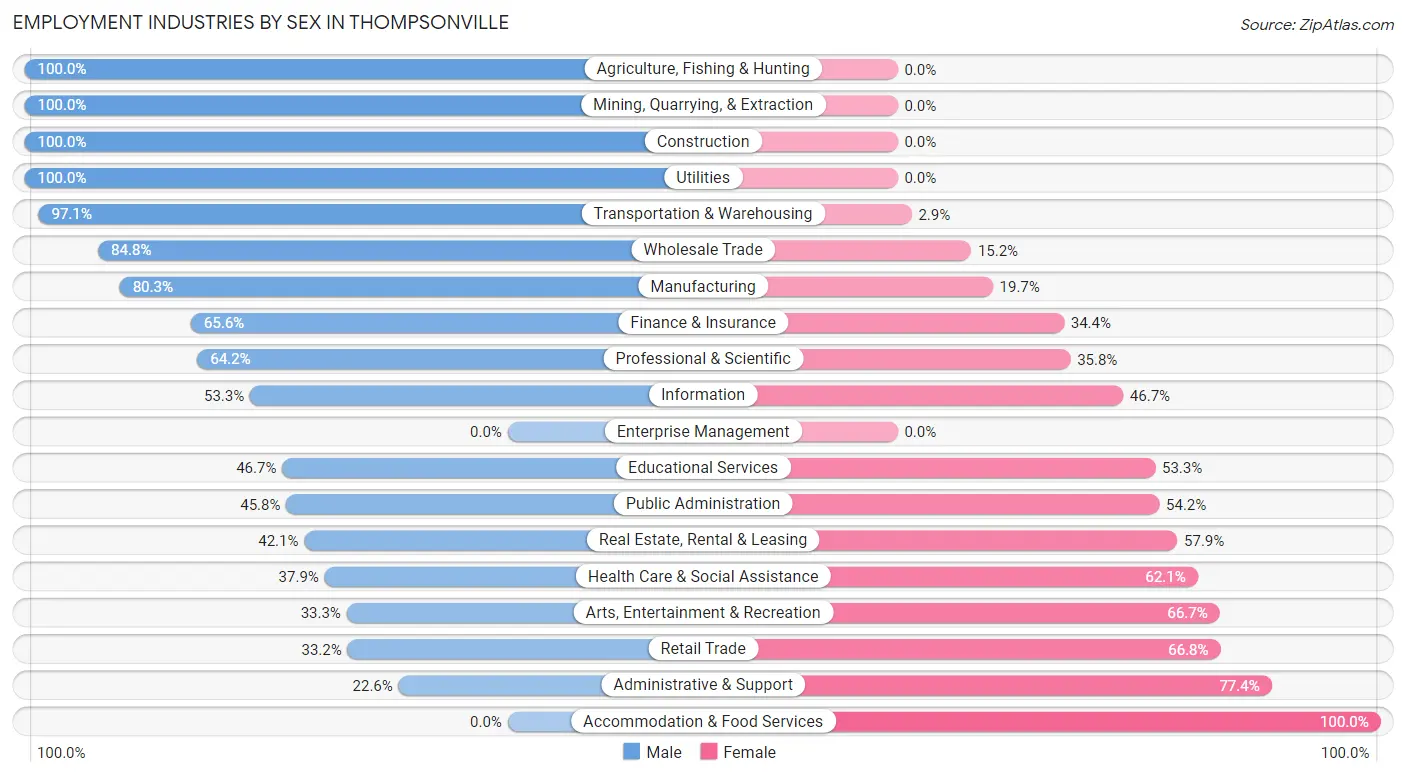
| Industry | Male | Female |
| Agriculture, Fishing & Hunting | 11 (100.0%) | 0 (0.0%) |
| Mining, Quarrying, & Extraction | 19 (100.0%) | 0 (0.0%) |
| Construction | 115 (100.0%) | 0 (0.0%) |
| Manufacturing | 212 (80.3%) | 52 (19.7%) |
| Wholesale Trade | 78 (84.8%) | 14 (15.2%) |
| Retail Trade | 65 (33.2%) | 131 (66.8%) |
| Transportation & Warehousing | 134 (97.1%) | 4 (2.9%) |
| Utilities | 33 (100.0%) | 0 (0.0%) |
| Information | 8 (53.3%) | 7 (46.7%) |
| Finance & Insurance | 40 (65.6%) | 21 (34.4%) |
| Real Estate, Rental & Leasing | 8 (42.1%) | 11 (57.9%) |
| Professional & Scientific | 97 (64.2%) | 54 (35.8%) |
| Enterprise Management | 0 (0.0%) | 0 (0.0%) |
| Administrative & Support | 7 (22.6%) | 24 (77.4%) |
| Educational Services | 77 (46.7%) | 88 (53.3%) |
| Health Care & Social Assistance | 108 (37.9%) | 177 (62.1%) |
| Arts, Entertainment & Recreation | 9 (33.3%) | 18 (66.7%) |
| Accommodation & Food Services | 0 (0.0%) | 21 (100.0%) |
| Public Administration | 11 (45.8%) | 13 (54.2%) |
| Total | 1,049 (61.4%) | 659 (38.6%) |
Education in Thompsonville
School Enrollment in Thompsonville
The most common levels of schooling among the 960 students in Thompsonville are elementary school (220 | 22.9%), high school (216 | 22.5%), and middle school (183 | 19.1%).
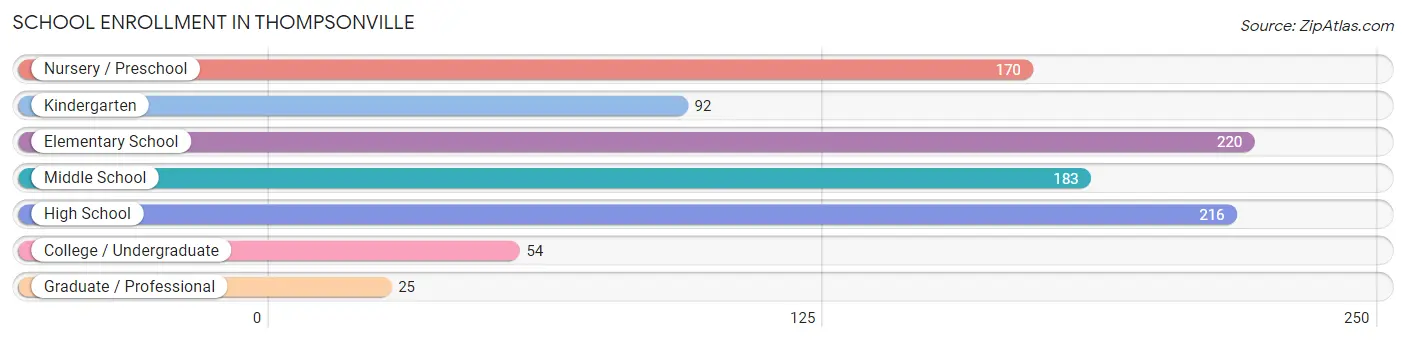
| School Level | # Students | % Students |
| Nursery / Preschool | 170 | 17.7% |
| Kindergarten | 92 | 9.6% |
| Elementary School | 220 | 22.9% |
| Middle School | 183 | 19.1% |
| High School | 216 | 22.5% |
| College / Undergraduate | 54 | 5.6% |
| Graduate / Professional | 25 | 2.6% |
| Total | 960 | 100.0% |
School Enrollment by Age by Funding Source in Thompsonville
Out of a total of 960 students who are enrolled in schools in Thompsonville, 220 (22.9%) attend a private institution, while the remaining 740 (77.1%) are enrolled in public schools. The age group of 25 to 34 year olds has the highest likelihood of being enrolled in private schools, with 7 (100.0% in the age bracket) enrolled. Conversely, the age group of 20 to 24 year olds has the lowest likelihood of being enrolled in a private school, with 43 (84.3% in the age bracket) attending a public institution.
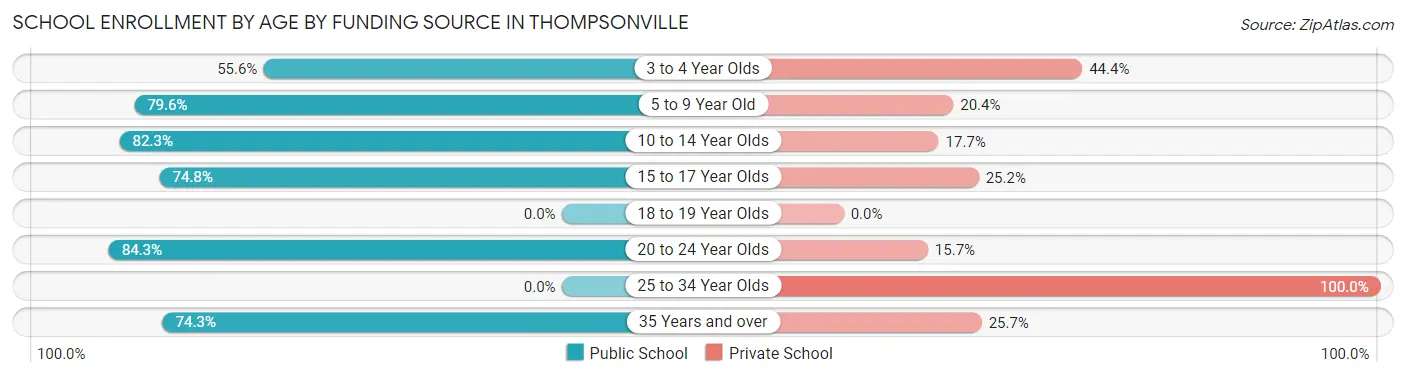
| Age Bracket | Public School | Private School |
| 3 to 4 Year Olds | 45 (55.6%) | 36 (44.4%) |
| 5 to 9 Year Old | 265 (79.6%) | 68 (20.4%) |
| 10 to 14 Year Olds | 242 (82.3%) | 52 (17.7%) |
| 15 to 17 Year Olds | 119 (74.8%) | 40 (25.2%) |
| 18 to 19 Year Olds | 0 (0.0%) | 0 (0.0%) |
| 20 to 24 Year Olds | 43 (84.3%) | 8 (15.7%) |
| 25 to 34 Year Olds | 0 (0.0%) | 7 (100.0%) |
| 35 Years and over | 26 (74.3%) | 9 (25.7%) |
| Total | 740 (77.1%) | 220 (22.9%) |
Educational Attainment by Field of Study in Thompsonville
Business (407 | 23.7%), education (308 | 17.9%), science & technology (179 | 10.4%), engineering (177 | 10.3%), and social sciences (169 | 9.9%) are the most common fields of study among 1,716 individuals in Thompsonville who have obtained a bachelor's degree or higher.
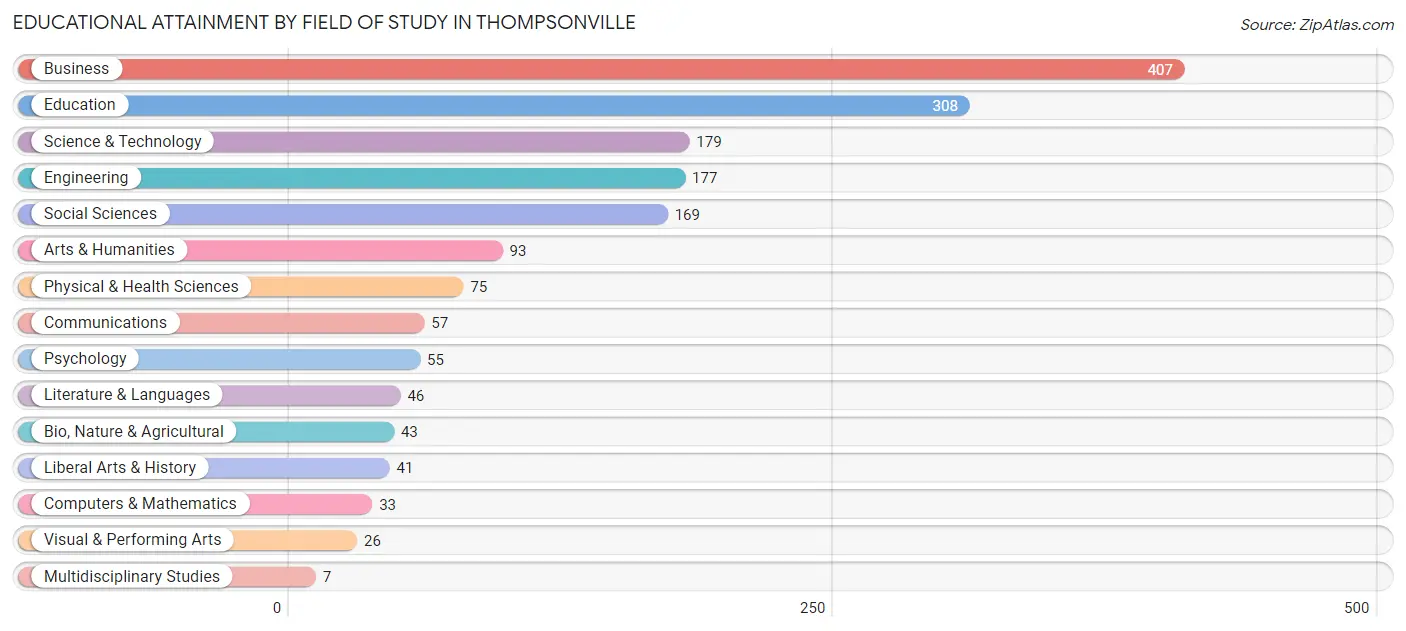
| Field of Study | # Graduates | % Graduates |
| Computers & Mathematics | 33 | 1.9% |
| Bio, Nature & Agricultural | 43 | 2.5% |
| Physical & Health Sciences | 75 | 4.4% |
| Psychology | 55 | 3.2% |
| Social Sciences | 169 | 9.9% |
| Engineering | 177 | 10.3% |
| Multidisciplinary Studies | 7 | 0.4% |
| Science & Technology | 179 | 10.4% |
| Business | 407 | 23.7% |
| Education | 308 | 17.9% |
| Literature & Languages | 46 | 2.7% |
| Liberal Arts & History | 41 | 2.4% |
| Visual & Performing Arts | 26 | 1.5% |
| Communications | 57 | 3.3% |
| Arts & Humanities | 93 | 5.4% |
| Total | 1,716 | 100.0% |
Transportation & Commute in Thompsonville
Vehicle Availability by Sex in Thompsonville
The most prevalent vehicle ownership categories in Thompsonville are males with 2 vehicles (605, accounting for 59.7%) and females with 2 vehicles (356, making up 91.8%).
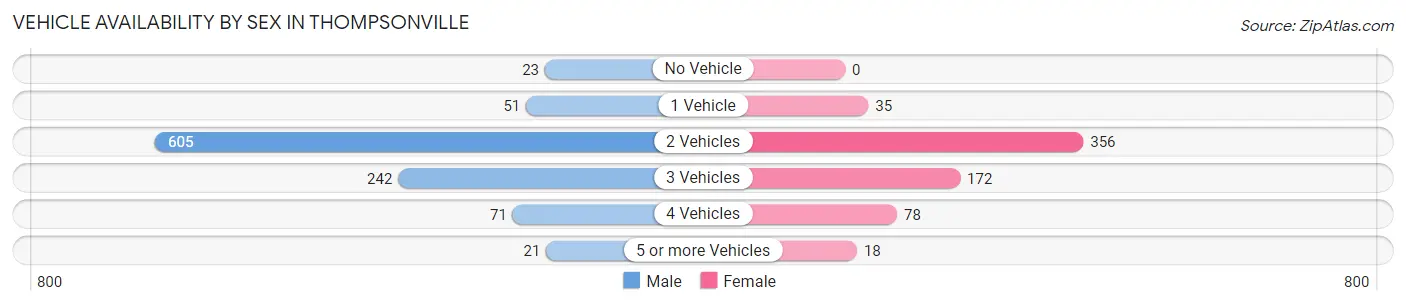
| Vehicles Available | Male | Female |
| No Vehicle | 23 (2.3%) | 0 (0.0%) |
| 1 Vehicle | 51 (5.0%) | 35 (5.3%) |
| 2 Vehicles | 605 (59.7%) | 356 (54.0%) |
| 3 Vehicles | 242 (23.9%) | 172 (26.1%) |
| 4 Vehicles | 71 (7.0%) | 78 (11.8%) |
| 5 or more Vehicles | 21 (2.1%) | 18 (2.7%) |
| Total | 1,013 (100.0%) | 659 (100.0%) |
Commute Time in Thompsonville
The most frequently occuring commute durations in Thompsonville are 15 to 19 minutes (326 commuters, 23.5%), 25 to 29 minutes (169 commuters, 12.2%), and 30 to 34 minutes (168 commuters, 12.1%).
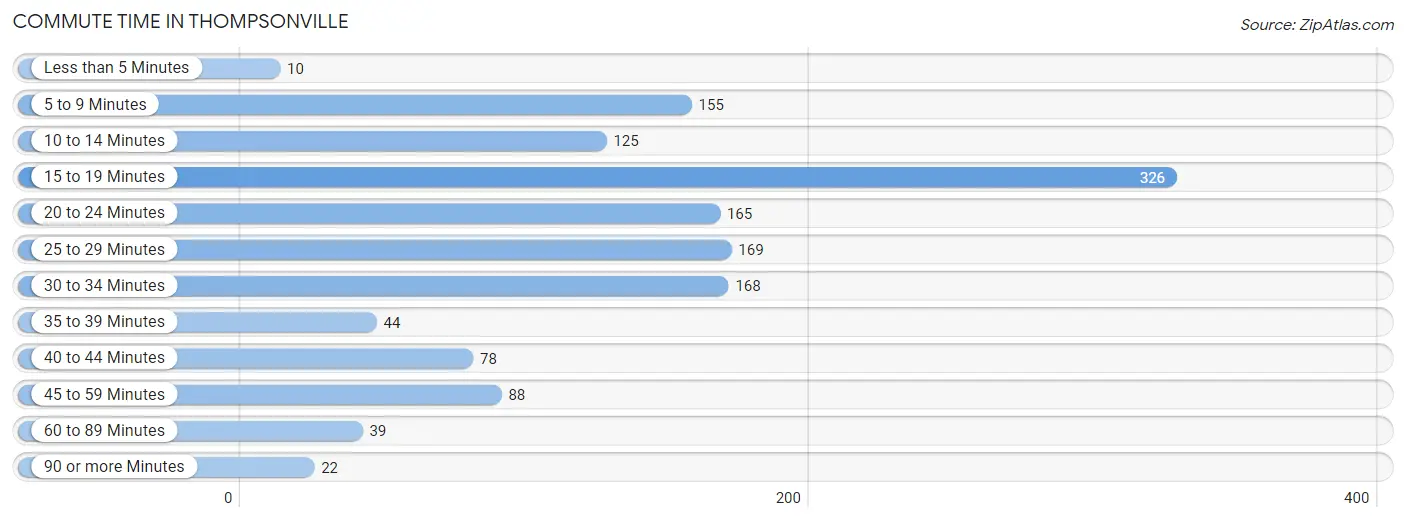
| Commute Time | # Commuters | % Commuters |
| Less than 5 Minutes | 10 | 0.7% |
| 5 to 9 Minutes | 155 | 11.2% |
| 10 to 14 Minutes | 125 | 9.0% |
| 15 to 19 Minutes | 326 | 23.5% |
| 20 to 24 Minutes | 165 | 11.9% |
| 25 to 29 Minutes | 169 | 12.2% |
| 30 to 34 Minutes | 168 | 12.1% |
| 35 to 39 Minutes | 44 | 3.2% |
| 40 to 44 Minutes | 78 | 5.6% |
| 45 to 59 Minutes | 88 | 6.3% |
| 60 to 89 Minutes | 39 | 2.8% |
| 90 or more Minutes | 22 | 1.6% |
Commute Time by Sex in Thompsonville
The most common commute times in Thompsonville are 15 to 19 minutes (249 commuters, 29.9%) for males and 25 to 29 minutes (108 commuters, 19.4%) for females.
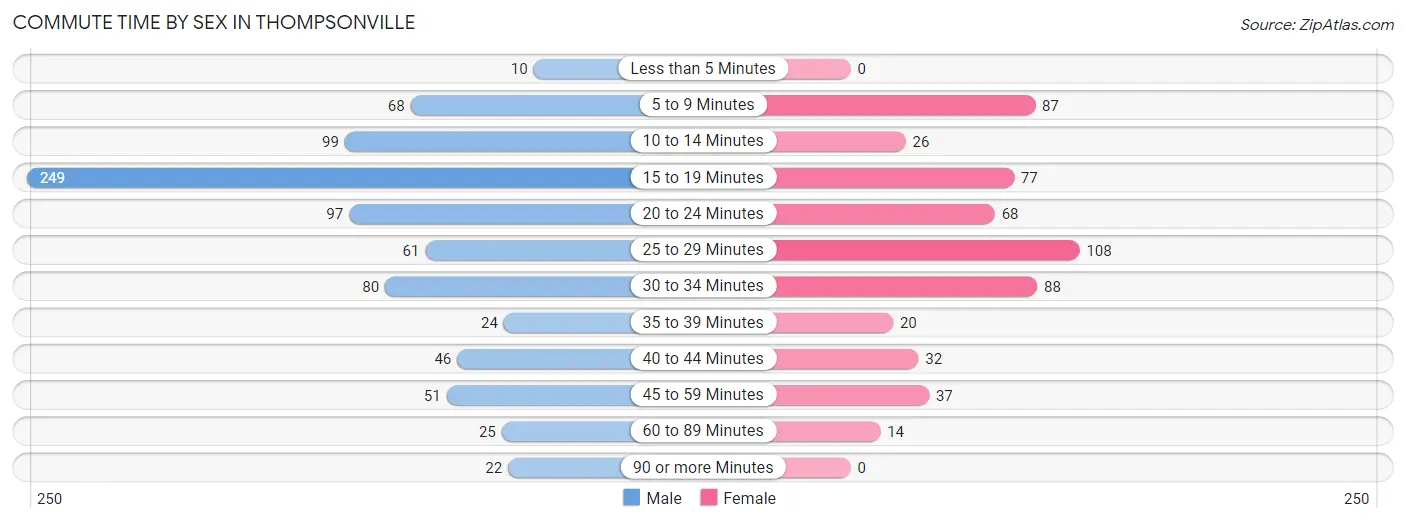
| Commute Time | Male | Female |
| Less than 5 Minutes | 10 (1.2%) | 0 (0.0%) |
| 5 to 9 Minutes | 68 (8.2%) | 87 (15.6%) |
| 10 to 14 Minutes | 99 (11.9%) | 26 (4.7%) |
| 15 to 19 Minutes | 249 (29.9%) | 77 (13.8%) |
| 20 to 24 Minutes | 97 (11.7%) | 68 (12.2%) |
| 25 to 29 Minutes | 61 (7.3%) | 108 (19.4%) |
| 30 to 34 Minutes | 80 (9.6%) | 88 (15.8%) |
| 35 to 39 Minutes | 24 (2.9%) | 20 (3.6%) |
| 40 to 44 Minutes | 46 (5.5%) | 32 (5.8%) |
| 45 to 59 Minutes | 51 (6.1%) | 37 (6.6%) |
| 60 to 89 Minutes | 25 (3.0%) | 14 (2.5%) |
| 90 or more Minutes | 22 (2.6%) | 0 (0.0%) |
Time of Departure to Work by Sex in Thompsonville
The most frequent times of departure to work in Thompsonville are 8:00 AM to 8:29 AM (257, 30.9%) for males and 8:00 AM to 8:29 AM (111, 19.9%) for females.

| Time of Departure | Male | Female |
| 12:00 AM to 4:59 AM | 0 (0.0%) | 0 (0.0%) |
| 5:00 AM to 5:29 AM | 58 (7.0%) | 0 (0.0%) |
| 5:30 AM to 5:59 AM | 18 (2.2%) | 4 (0.7%) |
| 6:00 AM to 6:29 AM | 112 (13.5%) | 29 (5.2%) |
| 6:30 AM to 6:59 AM | 50 (6.0%) | 28 (5.0%) |
| 7:00 AM to 7:29 AM | 76 (9.1%) | 98 (17.6%) |
| 7:30 AM to 7:59 AM | 78 (9.4%) | 34 (6.1%) |
| 8:00 AM to 8:29 AM | 257 (30.9%) | 111 (19.9%) |
| 8:30 AM to 8:59 AM | 77 (9.2%) | 79 (14.2%) |
| 9:00 AM to 9:59 AM | 15 (1.8%) | 57 (10.2%) |
| 10:00 AM to 10:59 AM | 24 (2.9%) | 71 (12.8%) |
| 11:00 AM to 11:59 AM | 20 (2.4%) | 0 (0.0%) |
| 12:00 PM to 3:59 PM | 36 (4.3%) | 33 (5.9%) |
| 4:00 PM to 11:59 PM | 11 (1.3%) | 13 (2.3%) |
| Total | 832 (100.0%) | 557 (100.0%) |
Housing Occupancy in Thompsonville
Occupancy by Ownership in Thompsonville
Of the total 1,427 dwellings in Thompsonville, owner-occupied units account for 1,385 (97.1%), while renter-occupied units make up 42 (2.9%).
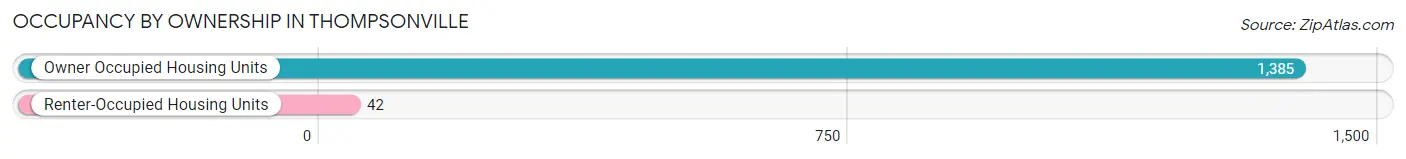
| Occupancy | # Housing Units | % Housing Units |
| Owner Occupied Housing Units | 1,385 | 97.1% |
| Renter-Occupied Housing Units | 42 | 2.9% |
| Total Occupied Housing Units | 1,427 | 100.0% |
Occupancy by Household Size in Thompsonville
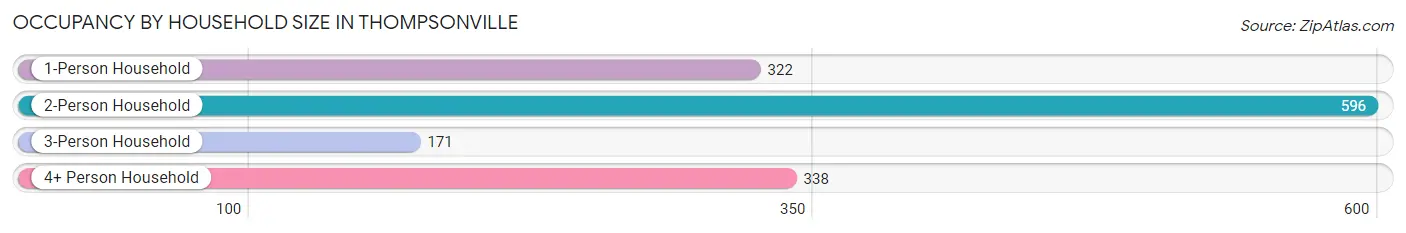
| Household Size | # Housing Units | % Housing Units |
| 1-Person Household | 322 | 22.6% |
| 2-Person Household | 596 | 41.8% |
| 3-Person Household | 171 | 12.0% |
| 4+ Person Household | 338 | 23.7% |
| Total Housing Units | 1,427 | 100.0% |
Occupancy by Ownership by Household Size in Thompsonville
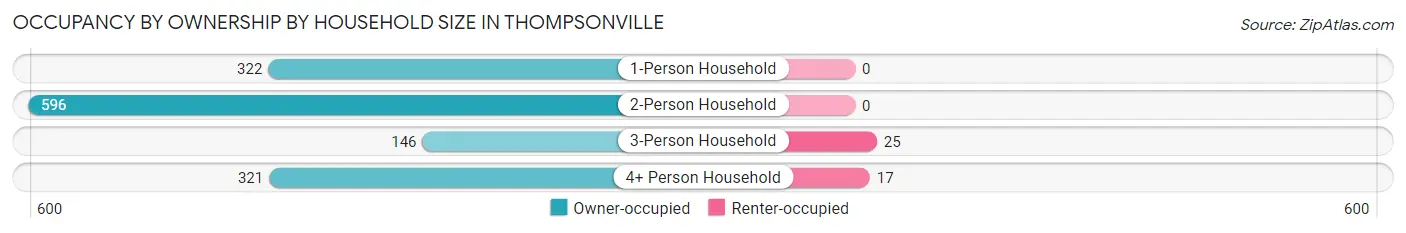
| Household Size | Owner-occupied | Renter-occupied |
| 1-Person Household | 322 (100.0%) | 0 (0.0%) |
| 2-Person Household | 596 (100.0%) | 0 (0.0%) |
| 3-Person Household | 146 (85.4%) | 25 (14.6%) |
| 4+ Person Household | 321 (95.0%) | 17 (5.0%) |
| Total Housing Units | 1,385 (97.1%) | 42 (2.9%) |
Occupancy by Educational Attainment in Thompsonville
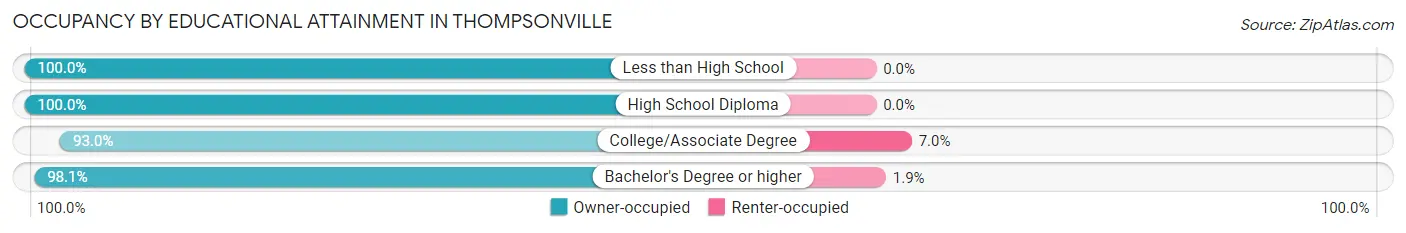
| Household Size | Owner-occupied | Renter-occupied |
| Less than High School | 20 (100.0%) | 0 (0.0%) |
| High School Diploma | 167 (100.0%) | 0 (0.0%) |
| College/Associate Degree | 330 (93.0%) | 25 (7.0%) |
| Bachelor's Degree or higher | 868 (98.1%) | 17 (1.9%) |
Occupancy by Age of Householder in Thompsonville
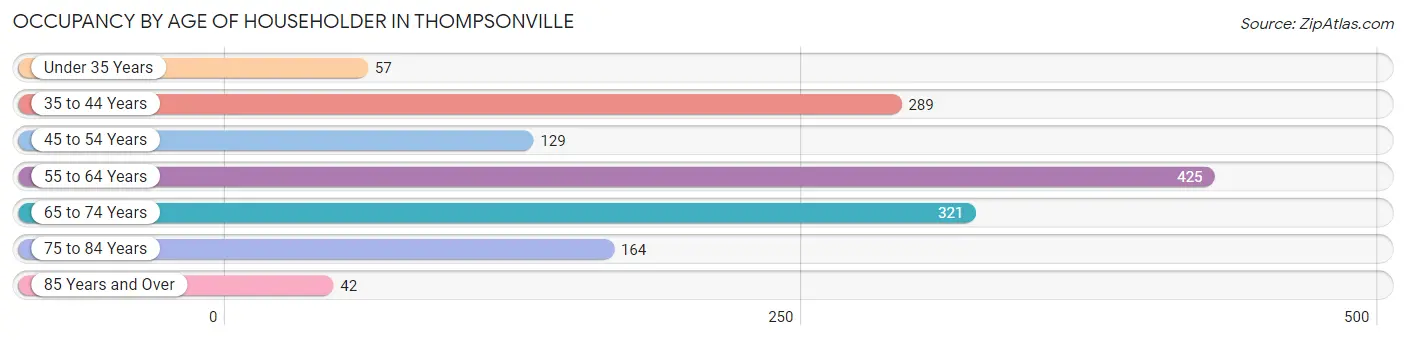
| Age Bracket | # Households | % Households |
| Under 35 Years | 57 | 4.0% |
| 35 to 44 Years | 289 | 20.3% |
| 45 to 54 Years | 129 | 9.0% |
| 55 to 64 Years | 425 | 29.8% |
| 65 to 74 Years | 321 | 22.5% |
| 75 to 84 Years | 164 | 11.5% |
| 85 Years and Over | 42 | 2.9% |
| Total | 1,427 | 100.0% |
Housing Finances in Thompsonville
Median Income by Occupancy in Thompsonville
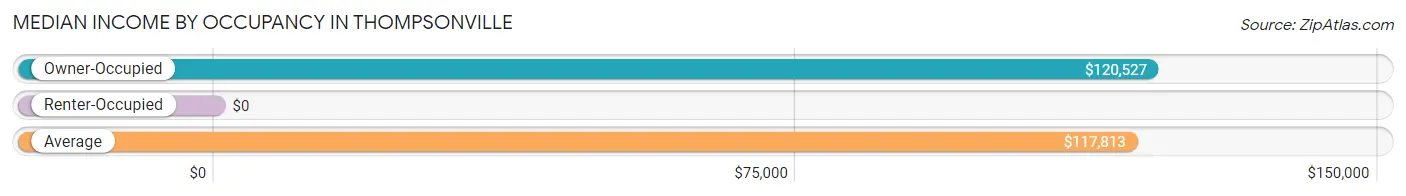
| Occupancy Type | # Households | Median Income |
| Owner-Occupied | 1,385 (97.1%) | $120,527 |
| Renter-Occupied | 42 (2.9%) | $0 |
| Average | 1,427 (100.0%) | $117,813 |
Occupancy by Householder Income Bracket in Thompsonville
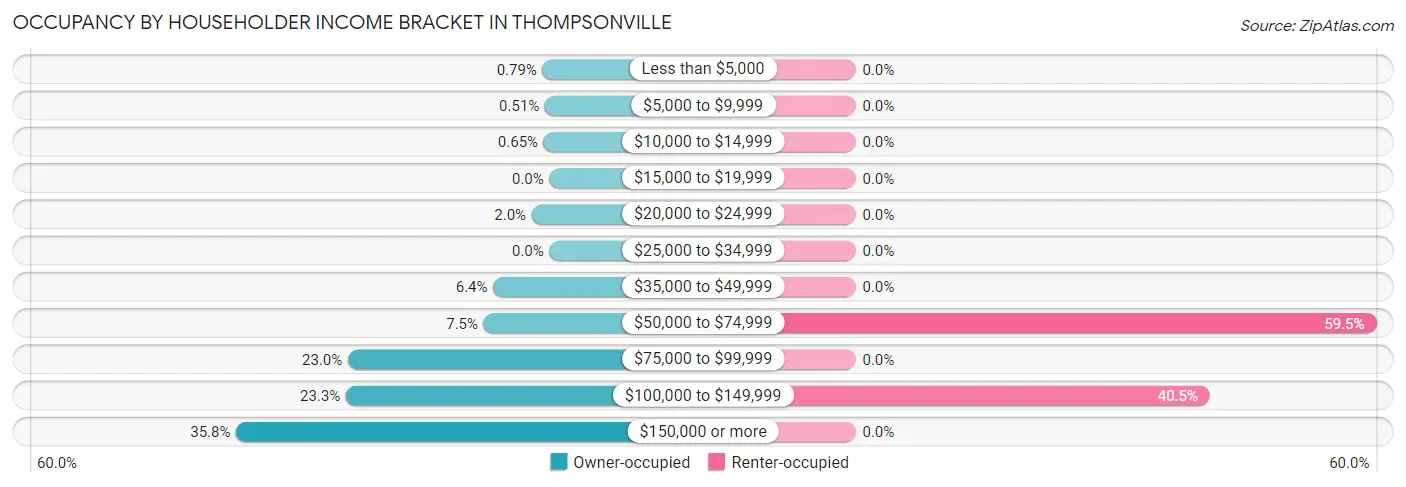
| Income Bracket | Owner-occupied | Renter-occupied |
| Less than $5,000 | 11 (0.8%) | 0 (0.0%) |
| $5,000 to $9,999 | 7 (0.5%) | 0 (0.0%) |
| $10,000 to $14,999 | 9 (0.6%) | 0 (0.0%) |
| $15,000 to $19,999 | 0 (0.0%) | 0 (0.0%) |
| $20,000 to $24,999 | 28 (2.0%) | 0 (0.0%) |
| $25,000 to $34,999 | 0 (0.0%) | 0 (0.0%) |
| $35,000 to $49,999 | 89 (6.4%) | 0 (0.0%) |
| $50,000 to $74,999 | 104 (7.5%) | 25 (59.5%) |
| $75,000 to $99,999 | 319 (23.0%) | 0 (0.0%) |
| $100,000 to $149,999 | 322 (23.3%) | 17 (40.5%) |
| $150,000 or more | 496 (35.8%) | 0 (0.0%) |
| Total | 1,385 (100.0%) | 42 (100.0%) |
Monthly Housing Cost Tiers in Thompsonville
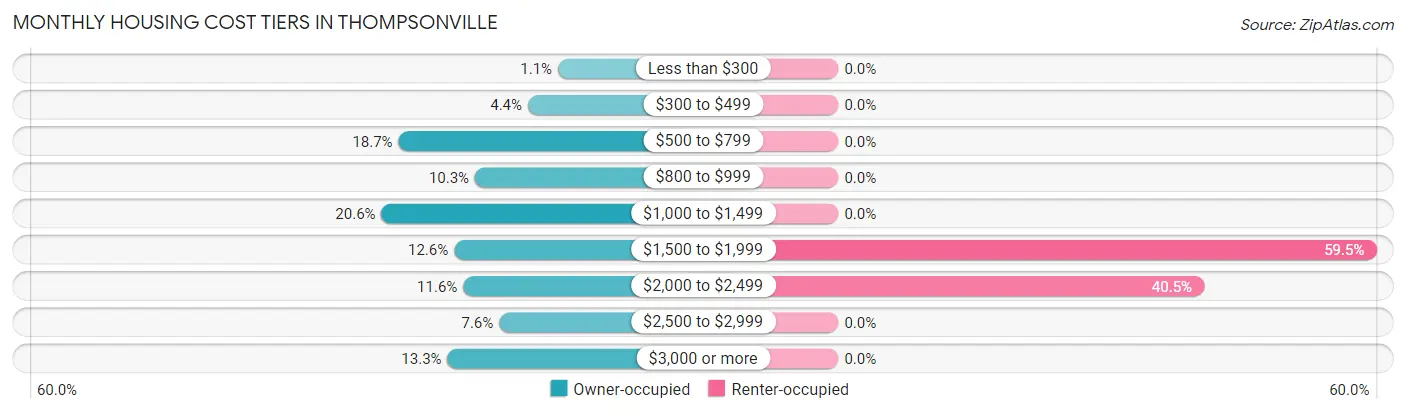
| Monthly Cost | Owner-occupied | Renter-occupied |
| Less than $300 | 15 (1.1%) | 0 (0.0%) |
| $300 to $499 | 61 (4.4%) | 0 (0.0%) |
| $500 to $799 | 259 (18.7%) | 0 (0.0%) |
| $800 to $999 | 142 (10.2%) | 0 (0.0%) |
| $1,000 to $1,499 | 285 (20.6%) | 0 (0.0%) |
| $1,500 to $1,999 | 174 (12.6%) | 25 (59.5%) |
| $2,000 to $2,499 | 160 (11.6%) | 17 (40.5%) |
| $2,500 to $2,999 | 105 (7.6%) | 0 (0.0%) |
| $3,000 or more | 184 (13.3%) | 0 (0.0%) |
| Total | 1,385 (100.0%) | 42 (100.0%) |
Physical Housing Characteristics in Thompsonville
Housing Structures in Thompsonville
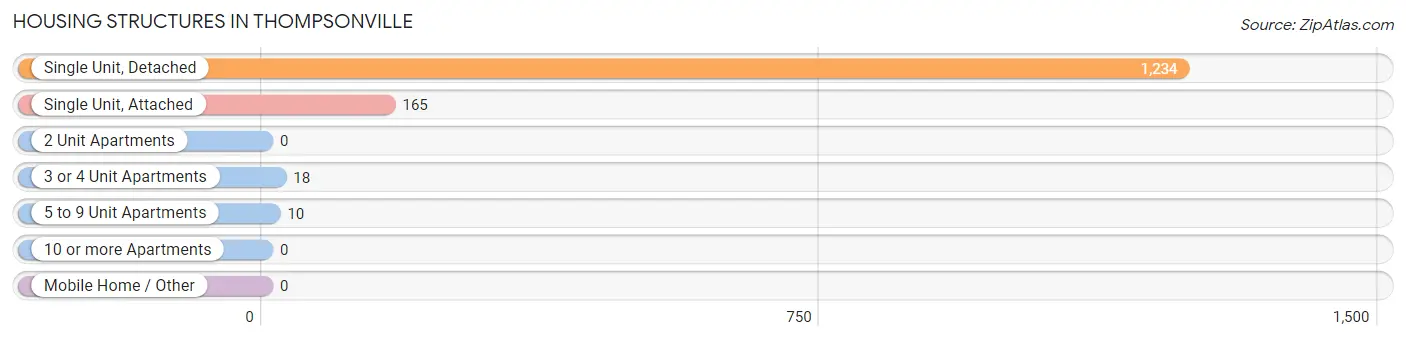
| Structure Type | # Housing Units | % Housing Units |
| Single Unit, Detached | 1,234 | 86.5% |
| Single Unit, Attached | 165 | 11.6% |
| 2 Unit Apartments | 0 | 0.0% |
| 3 or 4 Unit Apartments | 18 | 1.3% |
| 5 to 9 Unit Apartments | 10 | 0.7% |
| 10 or more Apartments | 0 | 0.0% |
| Mobile Home / Other | 0 | 0.0% |
| Total | 1,427 | 100.0% |
Housing Structures by Occupancy in Thompsonville
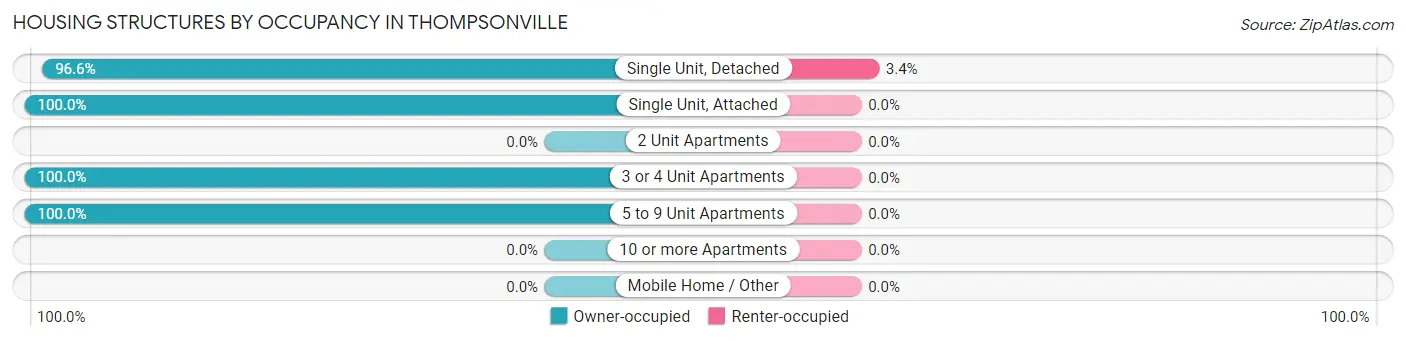
| Structure Type | Owner-occupied | Renter-occupied |
| Single Unit, Detached | 1,192 (96.6%) | 42 (3.4%) |
| Single Unit, Attached | 165 (100.0%) | 0 (0.0%) |
| 2 Unit Apartments | 0 (0.0%) | 0 (0.0%) |
| 3 or 4 Unit Apartments | 18 (100.0%) | 0 (0.0%) |
| 5 to 9 Unit Apartments | 10 (100.0%) | 0 (0.0%) |
| 10 or more Apartments | 0 (0.0%) | 0 (0.0%) |
| Mobile Home / Other | 0 (0.0%) | 0 (0.0%) |
| Total | 1,385 (97.1%) | 42 (2.9%) |
Housing Structures by Number of Rooms in Thompsonville
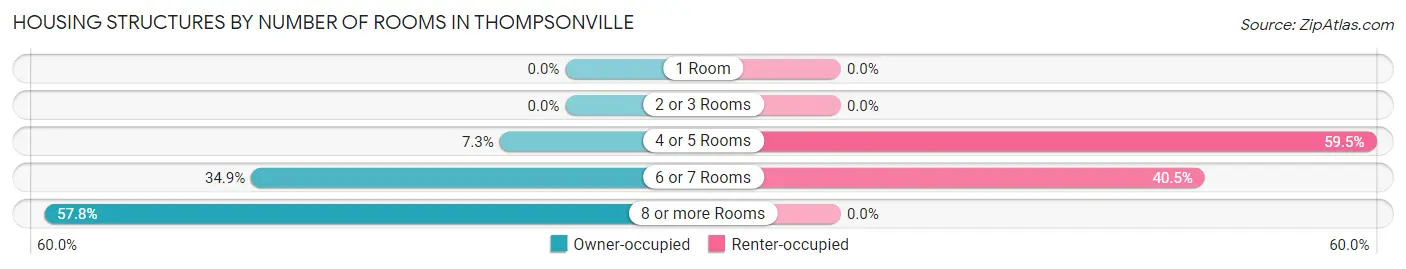
| Number of Rooms | Owner-occupied | Renter-occupied |
| 1 Room | 0 (0.0%) | 0 (0.0%) |
| 2 or 3 Rooms | 0 (0.0%) | 0 (0.0%) |
| 4 or 5 Rooms | 101 (7.3%) | 25 (59.5%) |
| 6 or 7 Rooms | 483 (34.9%) | 17 (40.5%) |
| 8 or more Rooms | 801 (57.8%) | 0 (0.0%) |
| Total | 1,385 (100.0%) | 42 (100.0%) |
Housing Structure by Heating Type in Thompsonville
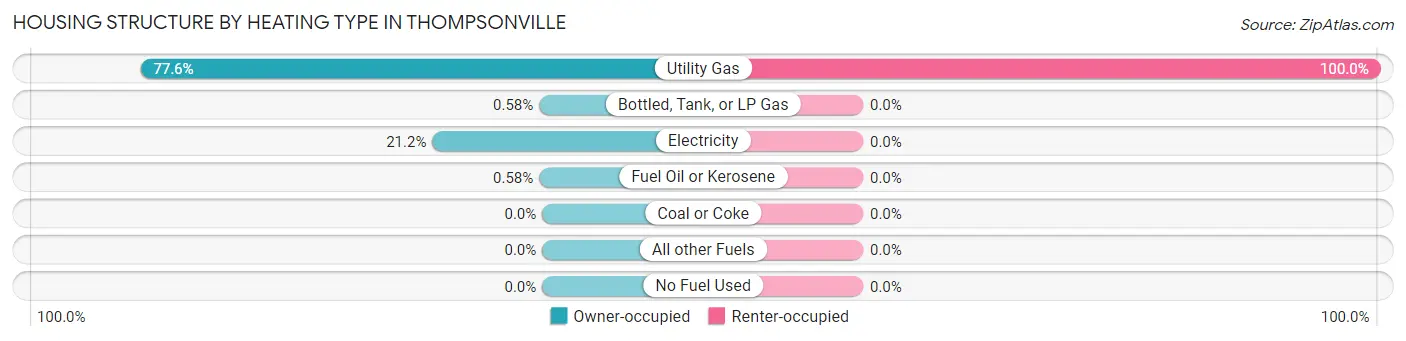
| Heating Type | Owner-occupied | Renter-occupied |
| Utility Gas | 1,075 (77.6%) | 42 (100.0%) |
| Bottled, Tank, or LP Gas | 8 (0.6%) | 0 (0.0%) |
| Electricity | 294 (21.2%) | 0 (0.0%) |
| Fuel Oil or Kerosene | 8 (0.6%) | 0 (0.0%) |
| Coal or Coke | 0 (0.0%) | 0 (0.0%) |
| All other Fuels | 0 (0.0%) | 0 (0.0%) |
| No Fuel Used | 0 (0.0%) | 0 (0.0%) |
| Total | 1,385 (100.0%) | 42 (100.0%) |
Household Vehicle Usage in Thompsonville
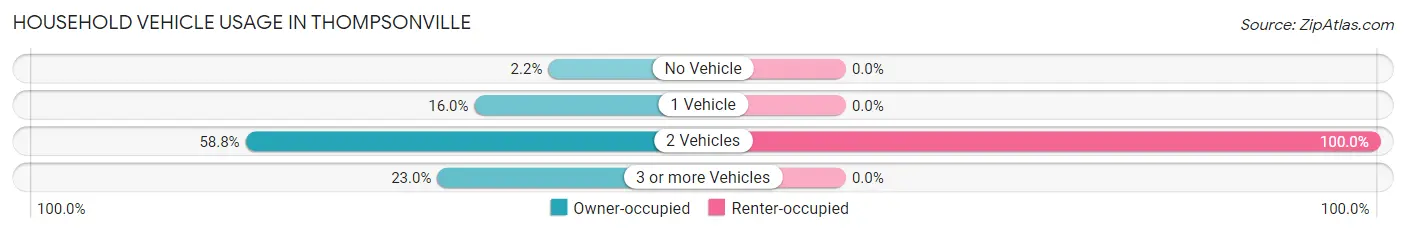
| Vehicles per Household | Owner-occupied | Renter-occupied |
| No Vehicle | 31 (2.2%) | 0 (0.0%) |
| 1 Vehicle | 222 (16.0%) | 0 (0.0%) |
| 2 Vehicles | 814 (58.8%) | 42 (100.0%) |
| 3 or more Vehicles | 318 (23.0%) | 0 (0.0%) |
| Total | 1,385 (100.0%) | 42 (100.0%) |
Real Estate & Mortgages in Thompsonville
Real Estate and Mortgage Overview in Thompsonville
| Characteristic | Without Mortgage | With Mortgage |
| Housing Units | 560 | 825 |
| Median Property Value | $352,700 | $367,600 |
| Median Household Income | $99,500 | $351 |
| Monthly Housing Costs | $778 | $184 |
| Real Estate Taxes | $4,350 | $0 |
Property Value by Mortgage Status in Thompsonville
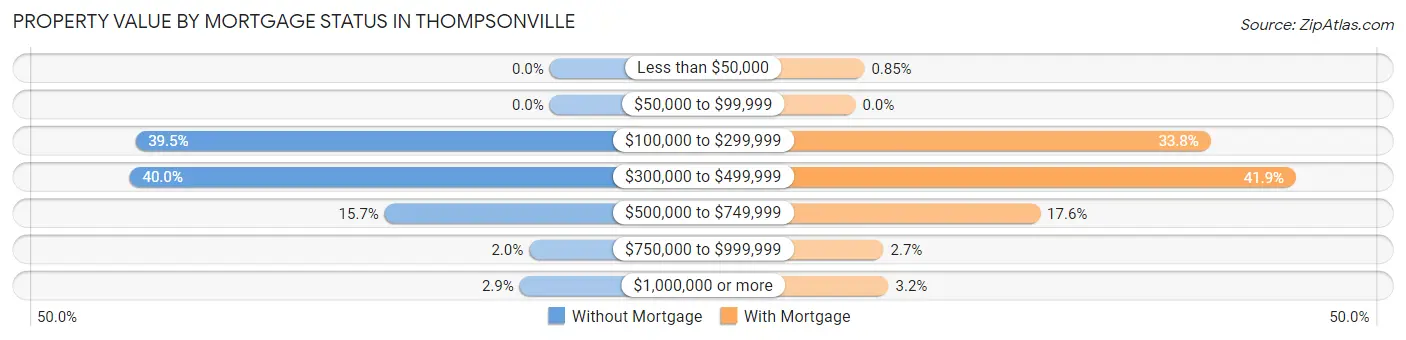
| Property Value | Without Mortgage | With Mortgage |
| Less than $50,000 | 0 (0.0%) | 7 (0.9%) |
| $50,000 to $99,999 | 0 (0.0%) | 0 (0.0%) |
| $100,000 to $299,999 | 221 (39.5%) | 279 (33.8%) |
| $300,000 to $499,999 | 224 (40.0%) | 346 (41.9%) |
| $500,000 to $749,999 | 88 (15.7%) | 145 (17.6%) |
| $750,000 to $999,999 | 11 (2.0%) | 22 (2.7%) |
| $1,000,000 or more | 16 (2.9%) | 26 (3.2%) |
| Total | 560 (100.0%) | 825 (100.0%) |
Household Income by Mortgage Status in Thompsonville
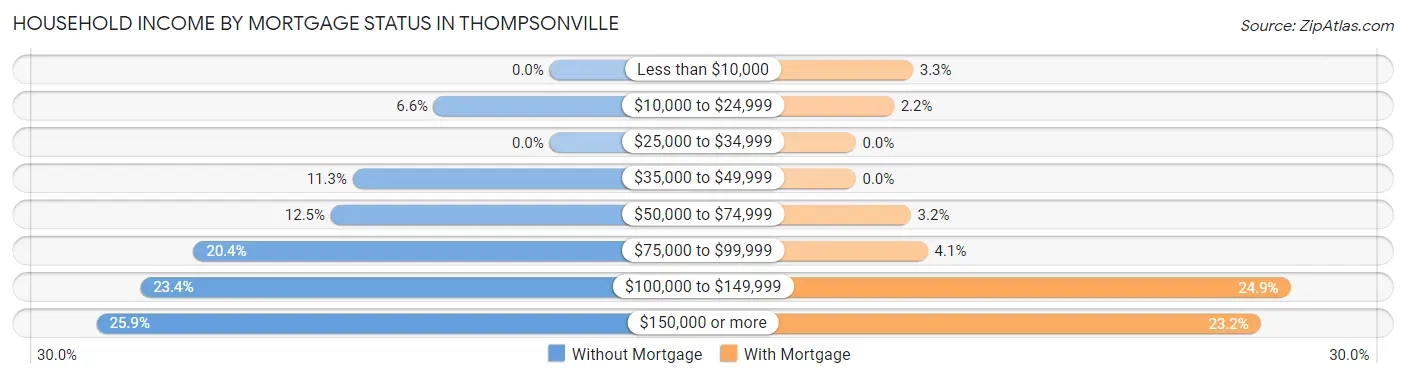
| Household Income | Without Mortgage | With Mortgage |
| Less than $10,000 | 0 (0.0%) | 27 (3.3%) |
| $10,000 to $24,999 | 37 (6.6%) | 18 (2.2%) |
| $25,000 to $34,999 | 0 (0.0%) | 0 (0.0%) |
| $35,000 to $49,999 | 63 (11.3%) | 0 (0.0%) |
| $50,000 to $74,999 | 70 (12.5%) | 26 (3.2%) |
| $75,000 to $99,999 | 114 (20.4%) | 34 (4.1%) |
| $100,000 to $149,999 | 131 (23.4%) | 205 (24.8%) |
| $150,000 or more | 145 (25.9%) | 191 (23.2%) |
| Total | 560 (100.0%) | 825 (100.0%) |
Property Value to Household Income Ratio in Thompsonville
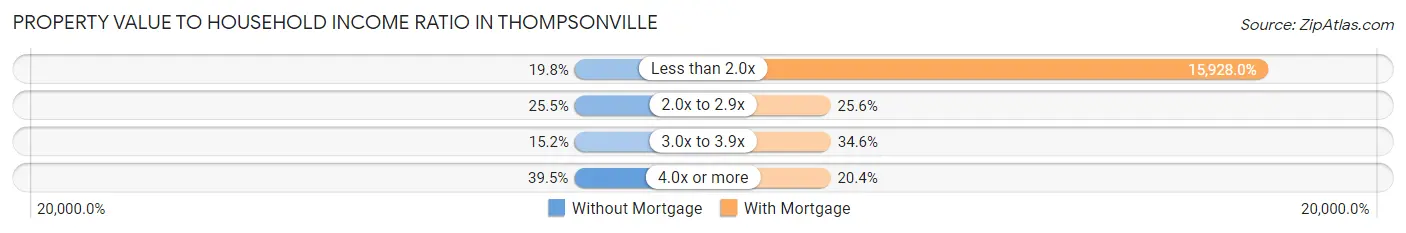
| Value-to-Income Ratio | Without Mortgage | With Mortgage |
| Less than 2.0x | 111 (19.8%) | 131,406 (15,928.0%) |
| 2.0x to 2.9x | 143 (25.5%) | 211 (25.6%) |
| 3.0x to 3.9x | 85 (15.2%) | 285 (34.5%) |
| 4.0x or more | 221 (39.5%) | 168 (20.4%) |
| Total | 560 (100.0%) | 825 (100.0%) |
Real Estate Taxes by Mortgage Status in Thompsonville
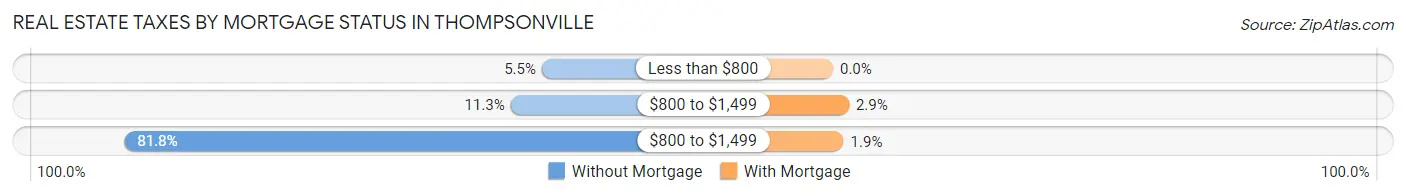
| Property Taxes | Without Mortgage | With Mortgage |
| Less than $800 | 31 (5.5%) | 0 (0.0%) |
| $800 to $1,499 | 63 (11.3%) | 24 (2.9%) |
| $800 to $1,499 | 458 (81.8%) | 16 (1.9%) |
| Total | 560 (100.0%) | 825 (100.0%) |
Health & Disability in Thompsonville
Health Insurance Coverage by Age in Thompsonville
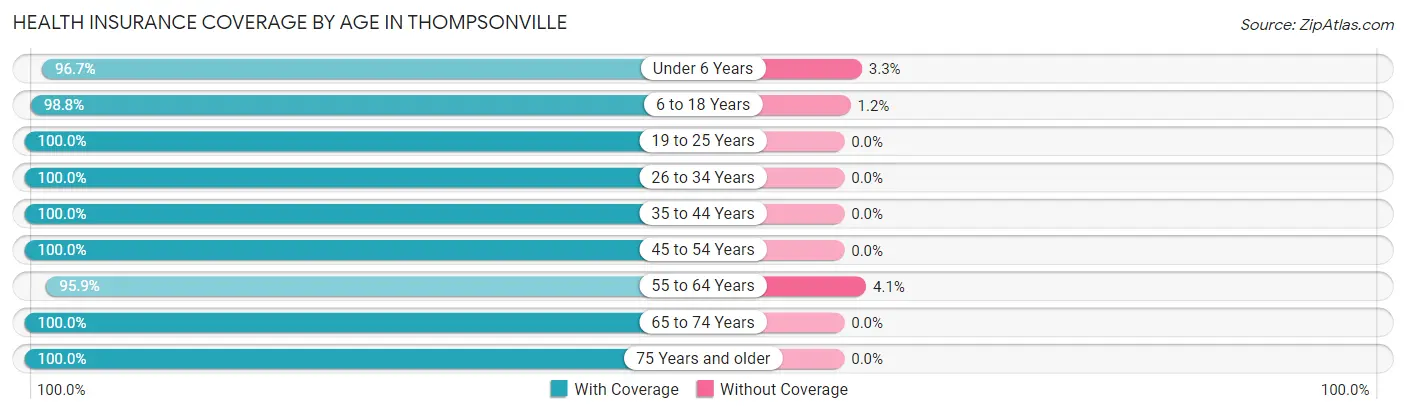
| Age Bracket | With Coverage | Without Coverage |
| Under 6 Years | 266 (96.7%) | 9 (3.3%) |
| 6 to 18 Years | 671 (98.8%) | 8 (1.2%) |
| 19 to 25 Years | 84 (100.0%) | 0 (0.0%) |
| 26 to 34 Years | 136 (100.0%) | 0 (0.0%) |
| 35 to 44 Years | 607 (100.0%) | 0 (0.0%) |
| 45 to 54 Years | 256 (100.0%) | 0 (0.0%) |
| 55 to 64 Years | 683 (95.9%) | 29 (4.1%) |
| 65 to 74 Years | 571 (100.0%) | 0 (0.0%) |
| 75 Years and older | 361 (100.0%) | 0 (0.0%) |
| Total | 3,635 (98.8%) | 46 (1.3%) |
Health Insurance Coverage by Citizenship Status in Thompsonville
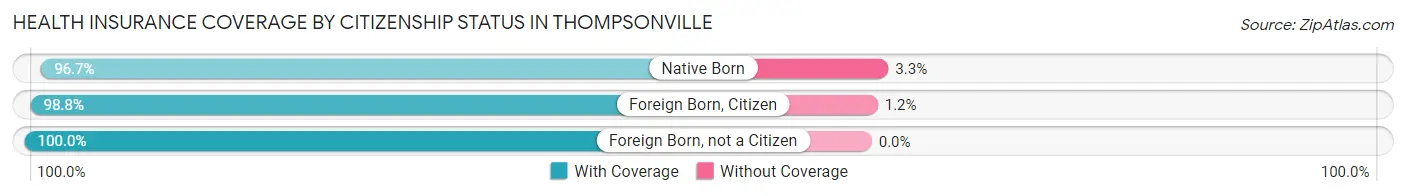
| Citizenship Status | With Coverage | Without Coverage |
| Native Born | 266 (96.7%) | 9 (3.3%) |
| Foreign Born, Citizen | 671 (98.8%) | 8 (1.2%) |
| Foreign Born, not a Citizen | 84 (100.0%) | 0 (0.0%) |
Health Insurance Coverage by Household Income in Thompsonville
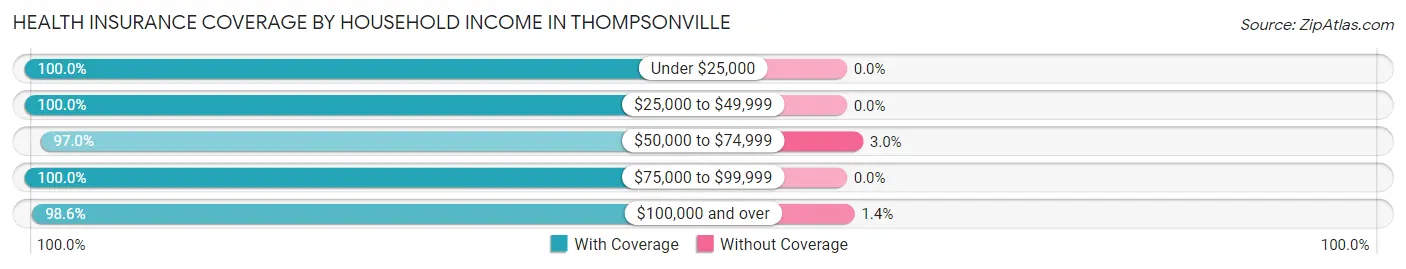
| Household Income | With Coverage | Without Coverage |
| Under $25,000 | 63 (100.0%) | 0 (0.0%) |
| $25,000 to $49,999 | 105 (100.0%) | 0 (0.0%) |
| $50,000 to $74,999 | 258 (97.0%) | 8 (3.0%) |
| $75,000 to $99,999 | 615 (100.0%) | 0 (0.0%) |
| $100,000 and over | 2,594 (98.6%) | 38 (1.4%) |
Public vs Private Health Insurance Coverage by Age in Thompsonville
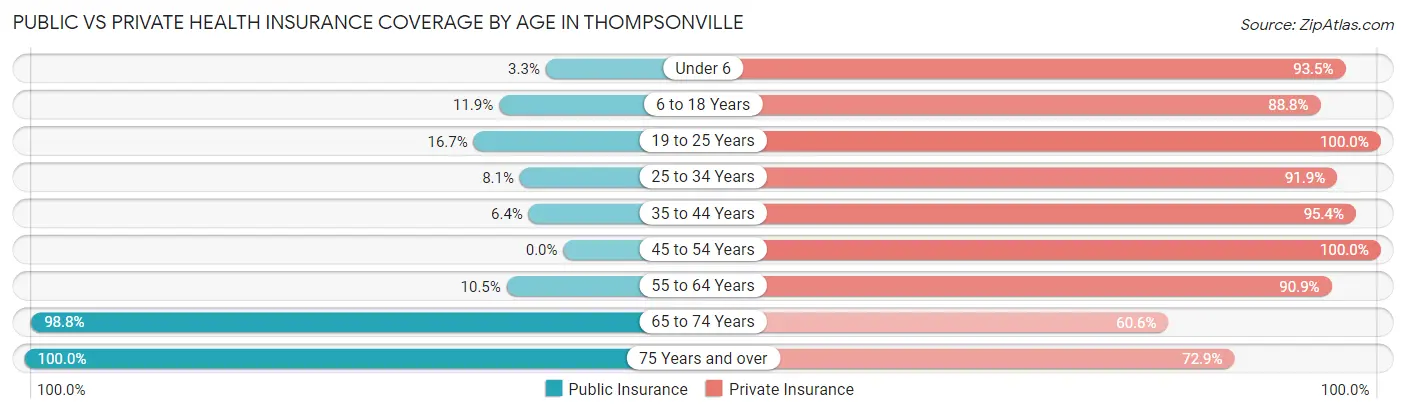
| Age Bracket | Public Insurance | Private Insurance |
| Under 6 | 9 (3.3%) | 257 (93.4%) |
| 6 to 18 Years | 81 (11.9%) | 603 (88.8%) |
| 19 to 25 Years | 14 (16.7%) | 84 (100.0%) |
| 25 to 34 Years | 11 (8.1%) | 125 (91.9%) |
| 35 to 44 Years | 39 (6.4%) | 579 (95.4%) |
| 45 to 54 Years | 0 (0.0%) | 256 (100.0%) |
| 55 to 64 Years | 75 (10.5%) | 647 (90.9%) |
| 65 to 74 Years | 564 (98.8%) | 346 (60.6%) |
| 75 Years and over | 361 (100.0%) | 263 (72.9%) |
| Total | 1,154 (31.4%) | 3,160 (85.9%) |
Disability Status by Sex by Age in Thompsonville
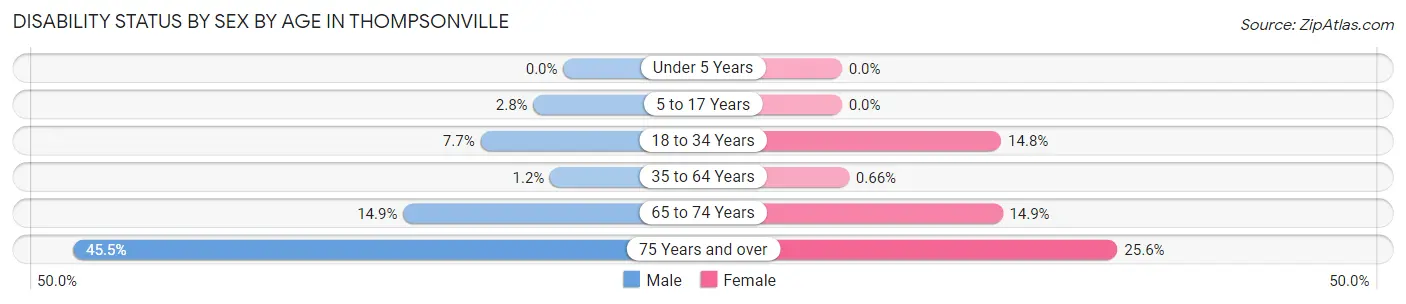
| Age Bracket | Male | Female |
| Under 5 Years | 0 (0.0%) | 0 (0.0%) |
| 5 to 17 Years | 13 (2.8%) | 0 (0.0%) |
| 18 to 34 Years | 6 (7.7%) | 21 (14.8%) |
| 35 to 64 Years | 10 (1.2%) | 5 (0.7%) |
| 65 to 74 Years | 44 (14.9%) | 41 (14.9%) |
| 75 Years and over | 86 (45.5%) | 44 (25.6%) |
Disability Class by Sex by Age in Thompsonville
Disability Class: Hearing Difficulty
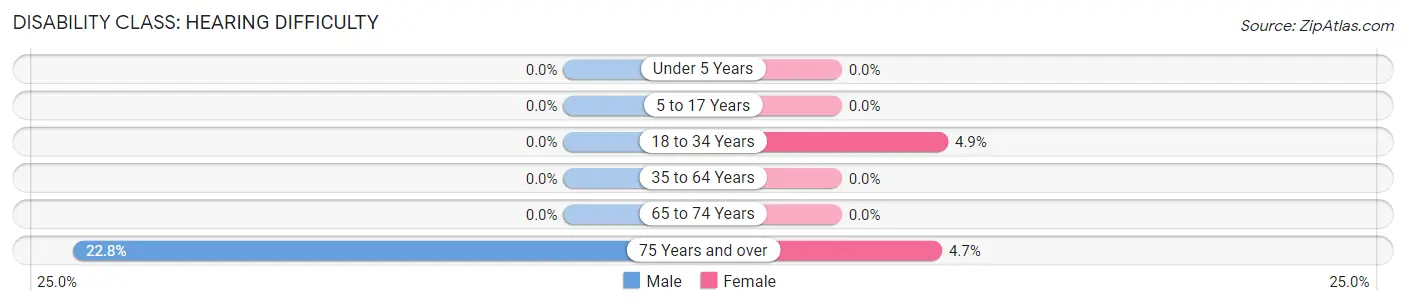
| Age Bracket | Male | Female |
| Under 5 Years | 0 (0.0%) | 0 (0.0%) |
| 5 to 17 Years | 0 (0.0%) | 0 (0.0%) |
| 18 to 34 Years | 0 (0.0%) | 7 (4.9%) |
| 35 to 64 Years | 0 (0.0%) | 0 (0.0%) |
| 65 to 74 Years | 0 (0.0%) | 0 (0.0%) |
| 75 Years and over | 43 (22.8%) | 8 (4.6%) |
Disability Class: Vision Difficulty
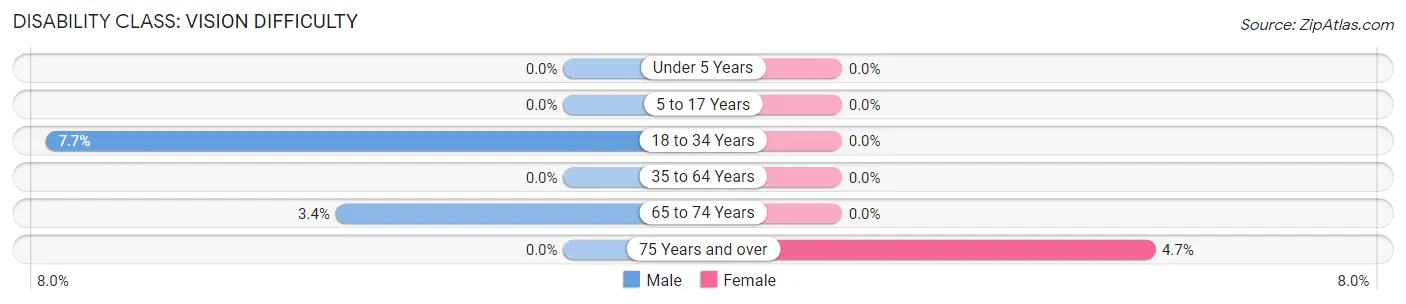
| Age Bracket | Male | Female |
| Under 5 Years | 0 (0.0%) | 0 (0.0%) |
| 5 to 17 Years | 0 (0.0%) | 0 (0.0%) |
| 18 to 34 Years | 6 (7.7%) | 0 (0.0%) |
| 35 to 64 Years | 0 (0.0%) | 0 (0.0%) |
| 65 to 74 Years | 10 (3.4%) | 0 (0.0%) |
| 75 Years and over | 0 (0.0%) | 8 (4.6%) |
Disability Class: Cognitive Difficulty
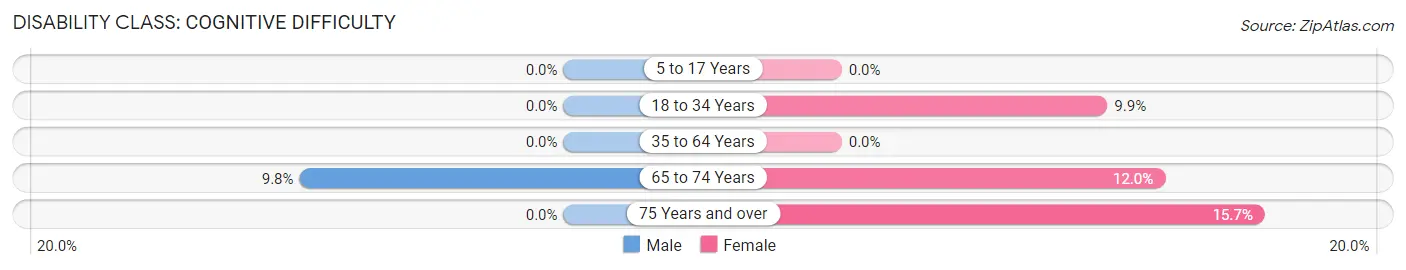
| Age Bracket | Male | Female |
| 5 to 17 Years | 0 (0.0%) | 0 (0.0%) |
| 18 to 34 Years | 0 (0.0%) | 14 (9.9%) |
| 35 to 64 Years | 0 (0.0%) | 0 (0.0%) |
| 65 to 74 Years | 29 (9.8%) | 33 (12.0%) |
| 75 Years and over | 0 (0.0%) | 27 (15.7%) |
Disability Class: Ambulatory Difficulty
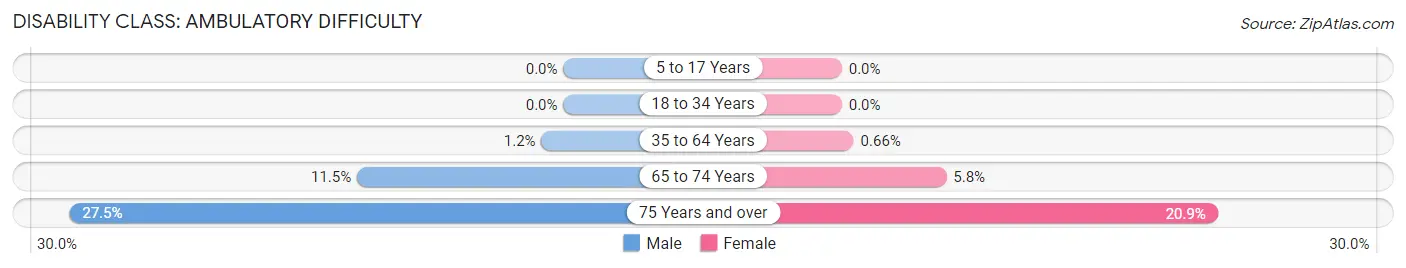
| Age Bracket | Male | Female |
| 5 to 17 Years | 0 (0.0%) | 0 (0.0%) |
| 18 to 34 Years | 0 (0.0%) | 0 (0.0%) |
| 35 to 64 Years | 10 (1.2%) | 5 (0.7%) |
| 65 to 74 Years | 34 (11.5%) | 16 (5.8%) |
| 75 Years and over | 52 (27.5%) | 36 (20.9%) |
Disability Class: Self-Care Difficulty
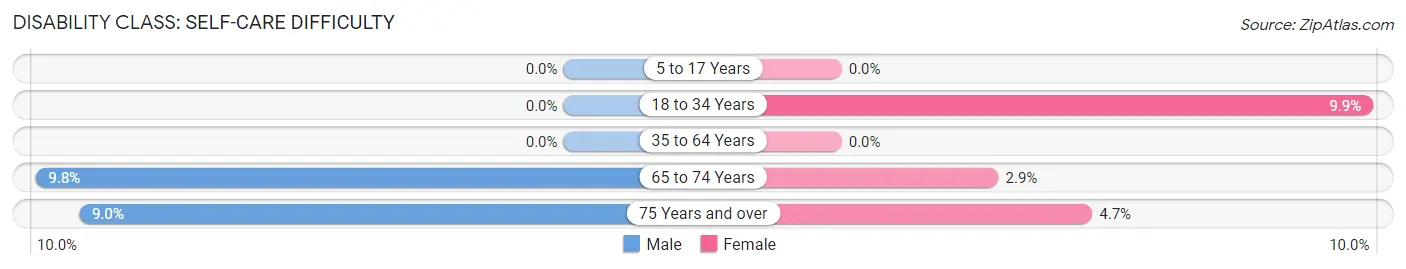
| Age Bracket | Male | Female |
| 5 to 17 Years | 0 (0.0%) | 0 (0.0%) |
| 18 to 34 Years | 0 (0.0%) | 14 (9.9%) |
| 35 to 64 Years | 0 (0.0%) | 0 (0.0%) |
| 65 to 74 Years | 29 (9.8%) | 8 (2.9%) |
| 75 Years and over | 17 (9.0%) | 8 (4.6%) |
Technology Access in Thompsonville
Computing Device Access in Thompsonville
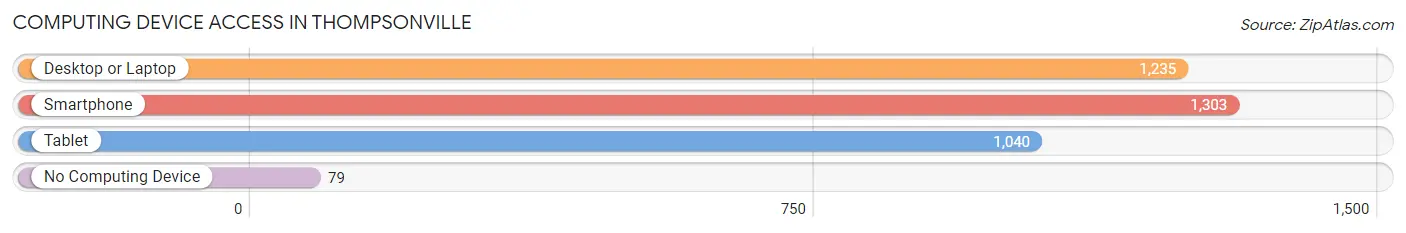
| Device Type | # Households | % Households |
| Desktop or Laptop | 1,235 | 86.6% |
| Smartphone | 1,303 | 91.3% |
| Tablet | 1,040 | 72.9% |
| No Computing Device | 79 | 5.5% |
| Total | 1,427 | 100.0% |
Internet Access in Thompsonville
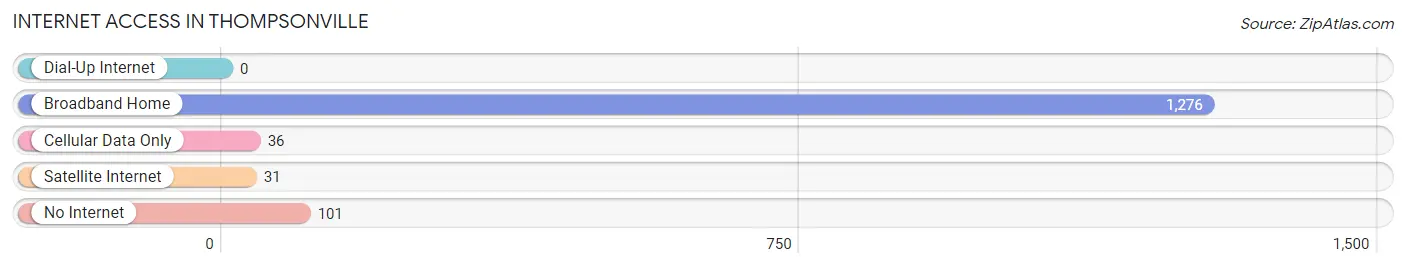
| Internet Type | # Households | % Households |
| Dial-Up Internet | 0 | 0.0% |
| Broadband Home | 1,276 | 89.4% |
| Cellular Data Only | 36 | 2.5% |
| Satellite Internet | 31 | 2.2% |
| No Internet | 101 | 7.1% |
| Total | 1,427 | 100.0% |
Thompsonville Summary
Thompsonville is a small unincorporated community located in the western part of Pennsylvania, in the United States. It is situated in the Allegheny Mountains, in the Allegheny National Forest. The community is located in the township of Tionesta, in Forest County. The population of Thompsonville was estimated to be around 200 people in the year 2000.
History
The history of Thompsonville dates back to the late 1800s, when the area was first settled by a group of settlers from the nearby town of Tionesta. The settlers were attracted to the area due to its abundance of natural resources, including timber and coal. The first settlers built a sawmill and a gristmill, which were used to process the timber and coal. The community was named after the first settler, John Thompson, who was a prominent figure in the area.
In the early 1900s, the community began to grow and develop. The sawmill and gristmill were replaced by a larger sawmill and a coal mine. The coal mine provided employment for many of the residents of Thompsonville. The community also had a post office, a general store, and a school.
Geography
Thompsonville is located in the western part of Pennsylvania, in the Allegheny Mountains. The community is situated in the Allegheny National Forest, in the township of Tionesta, in Forest County. The area is known for its rugged terrain and dense forests. The Allegheny River runs through the area, providing a source of water for the community.
The climate in Thompsonville is generally mild, with temperatures ranging from the low 30s in the winter to the mid-80s in the summer. The area receives an average of 40 inches of precipitation per year, with most of it falling in the form of snow.
Economy
The economy of Thompsonville is largely based on the timber and coal industries. The timber industry is the main source of employment for the residents of the community. The coal industry is also important to the local economy, as it provides jobs for many of the residents.
In addition to the timber and coal industries, Thompsonville also has a small tourism industry. The area is known for its scenic beauty and outdoor activities, such as fishing, hunting, and camping. There are also several small businesses in the community, including restaurants, stores, and other services.
Demographics
The population of Thompsonville was estimated to be around 200 people in the year 2000. The majority of the population is white, with a small percentage of African Americans and Native Americans. The median household income in the community is around $30,000 per year. The median age of the population is around 40 years old.
Conclusion
Thompsonville is a small unincorporated community located in the western part of Pennsylvania, in the United States. The community has a long history, dating back to the late 1800s. The economy of Thompsonville is largely based on the timber and coal industries, with a small tourism industry. The population of the community is estimated to be around 200 people, with a median household income of around $30,000 per year.
Common Questions
What is Per Capita Income in Thompsonville?
Per Capita income in Thompsonville is $56,279.
What is the Median Family Income in Thompsonville?
Median Family Income in Thompsonville is $131,250.
What is the Median Household income in Thompsonville?
Median Household Income in Thompsonville is $117,813.
What is Income or Wage Gap in Thompsonville?
Income or Wage Gap in Thompsonville is 68.3%.
Women in Thompsonville earn 31.7 cents for every dollar earned by a man.
What is Inequality or Gini Index in Thompsonville?
Inequality or Gini Index in Thompsonville is 0.36.
What is the Total Population of Thompsonville?
Total Population of Thompsonville is 3,859.
What is the Total Male Population of Thompsonville?
Total Male Population of Thompsonville is 2,029.
What is the Total Female Population of Thompsonville?
Total Female Population of Thompsonville is 1,830.
What is the Ratio of Males per 100 Females in Thompsonville?
There are 110.87 Males per 100 Females in Thompsonville.
What is the Ratio of Females per 100 Males in Thompsonville?
There are 90.19 Females per 100 Males in Thompsonville.
What is the Median Population Age in Thompsonville?
Median Population Age in Thompsonville is 50.8 Years.
What is the Average Family Size in Thompsonville
Average Family Size in Thompsonville is 3.1 People.
What is the Average Household Size in Thompsonville
Average Household Size in Thompsonville is 2.6 People.
How Large is the Labor Force in Thompsonville?
There are 1,740 People in the Labor Forcein in Thompsonville.
What is the Percentage of People in the Labor Force in Thompsonville?
56.8% of People are in the Labor Force in Thompsonville.
What is the Unemployment Rate in Thompsonville?
Unemployment Rate in Thompsonville is 1.4%.