Wrightsville borough, PA Map & Demographics
Wrightsville borough Overview
$31,783
PER CAPITA INCOME
$86,000
AVG FAMILY INCOME
$70,179
AVG HOUSEHOLD INCOME
21.3%
WAGE / INCOME GAP [ % ]
78.7¢/ $1
WAGE / INCOME GAP [ $ ]
$12,504
FAMILY INCOME DEFICIT
0.33
INEQUALITY / GINI INDEX
2,204
TOTAL POPULATION
1,082
MALE POPULATION
1,122
FEMALE POPULATION
96.43
MALES / 100 FEMALES
103.70
FEMALES / 100 MALES
36.3
MEDIAN AGE
3.0
AVG FAMILY SIZE
2.6
AVG HOUSEHOLD SIZE
1,183
LABOR FORCE [ PEOPLE ]
71.8%
PERCENT IN LABOR FORCE
3.0%
UNEMPLOYMENT RATE
Income in Wrightsville borough
Income Overview in Wrightsville borough
Per Capita Income in Wrightsville borough is $31,783, while median incomes of families and households are $86,000 and $70,179 respectively.
| Characteristic | Number | Measure |
| Per Capita Income | 2,204 | $31,783 |
| Median Family Income | 610 | $86,000 |
| Mean Family Income | 610 | $87,550 |
| Median Household Income | 855 | $70,179 |
| Mean Household Income | 855 | $79,778 |
| Income Deficit | 610 | $12,504 |
| Wage / Income Gap (%) | 2,204 | 21.27% |
| Wage / Income Gap ($) | 2,204 | 78.73¢ per $1 |
| Gini / Inequality Index | 2,204 | 0.33 |
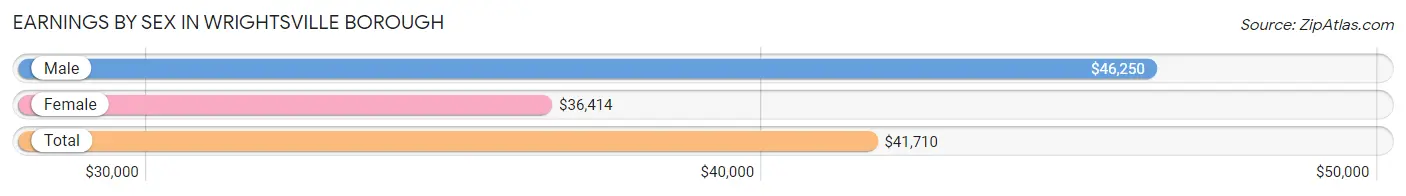
Earnings by Sex in Wrightsville borough
Average Earnings in Wrightsville borough are $41,710, $46,250 for men and $36,414 for women, a difference of 21.3%.
| Sex | Number | Average Earnings |
| Male | 664 (54.4%) | $46,250 |
| Female | 557 (45.6%) | $36,414 |
| Total | 1,221 (100.0%) | $41,710 |
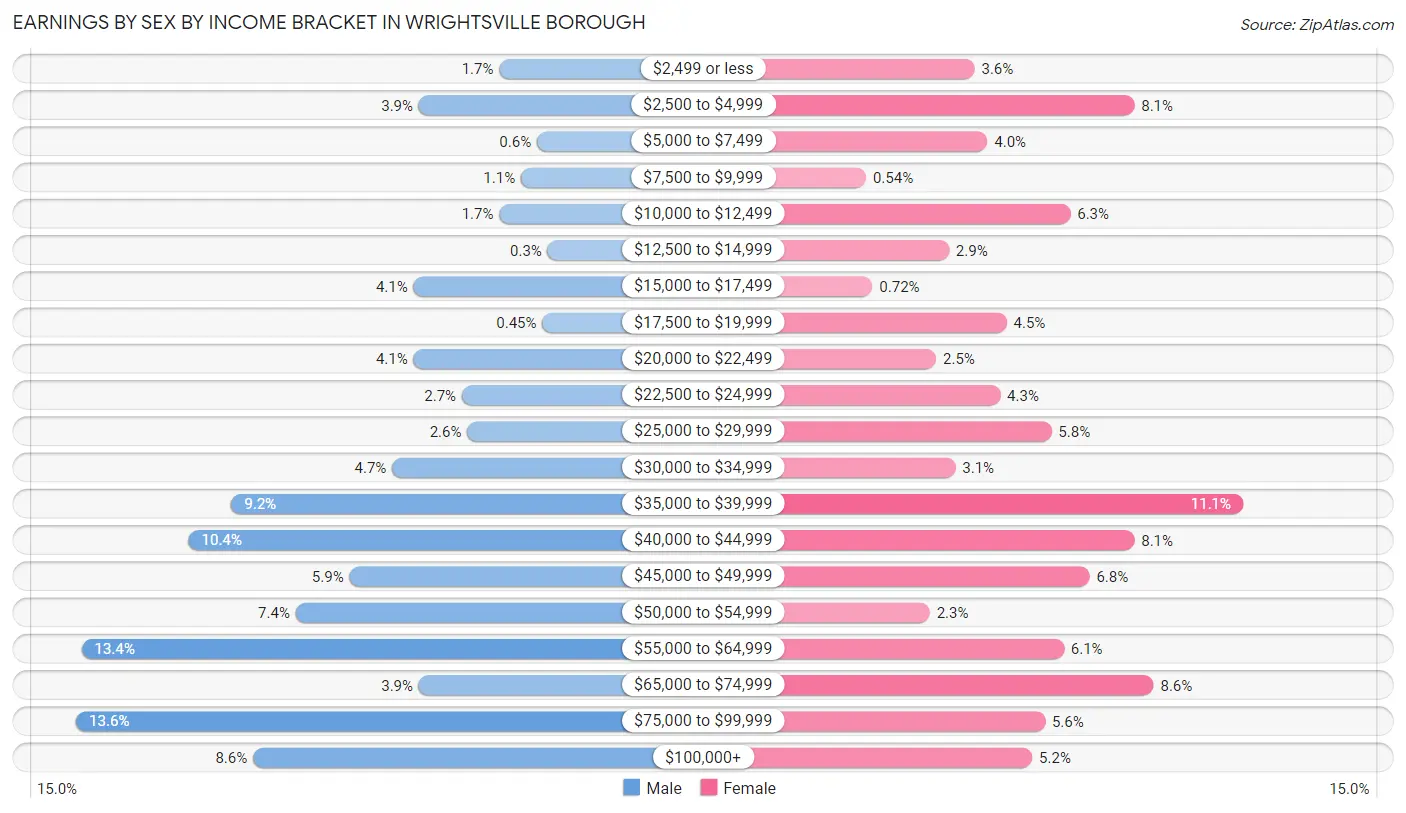
Earnings by Sex by Income Bracket in Wrightsville borough
The most common earnings brackets in Wrightsville borough are $75,000 to $99,999 for men (90 | 13.6%) and $35,000 to $39,999 for women (62 | 11.1%).
| Income | Male | Female |
| $2,499 or less | 11 (1.7%) | 20 (3.6%) |
| $2,500 to $4,999 | 26 (3.9%) | 45 (8.1%) |
| $5,000 to $7,499 | 4 (0.6%) | 22 (4.0%) |
| $7,500 to $9,999 | 7 (1.1%) | 3 (0.5%) |
| $10,000 to $12,499 | 11 (1.7%) | 35 (6.3%) |
| $12,500 to $14,999 | 2 (0.3%) | 16 (2.9%) |
| $15,000 to $17,499 | 27 (4.1%) | 4 (0.7%) |
| $17,500 to $19,999 | 3 (0.4%) | 25 (4.5%) |
| $20,000 to $22,499 | 27 (4.1%) | 14 (2.5%) |
| $22,500 to $24,999 | 18 (2.7%) | 24 (4.3%) |
| $25,000 to $29,999 | 17 (2.6%) | 32 (5.8%) |
| $30,000 to $34,999 | 31 (4.7%) | 17 (3.0%) |
| $35,000 to $39,999 | 61 (9.2%) | 62 (11.1%) |
| $40,000 to $44,999 | 69 (10.4%) | 45 (8.1%) |
| $45,000 to $49,999 | 39 (5.9%) | 38 (6.8%) |
| $50,000 to $54,999 | 49 (7.4%) | 13 (2.3%) |
| $55,000 to $64,999 | 89 (13.4%) | 34 (6.1%) |
| $65,000 to $74,999 | 26 (3.9%) | 48 (8.6%) |
| $75,000 to $99,999 | 90 (13.6%) | 31 (5.6%) |
| $100,000+ | 57 (8.6%) | 29 (5.2%) |
| Total | 664 (100.0%) | 557 (100.0%) |
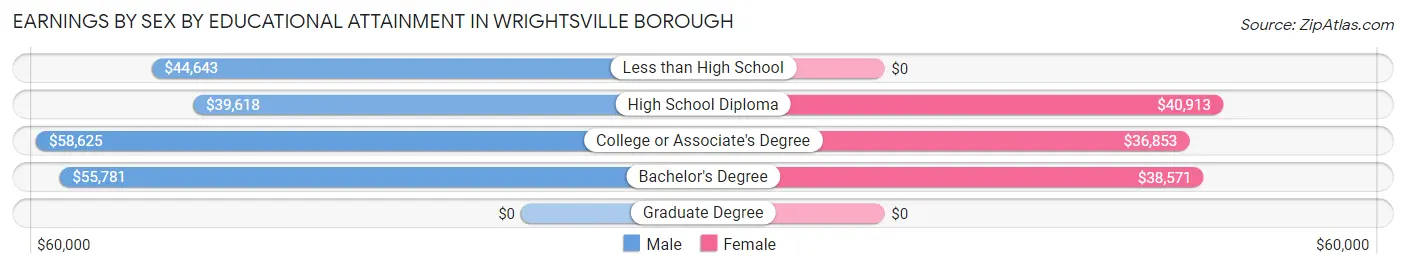
Earnings by Sex by Educational Attainment in Wrightsville borough
Average earnings in Wrightsville borough are $46,806 for men and $37,656 for women, a difference of 19.6%. Men with an educational attainment of college or associate's degree enjoy the highest average annual earnings of $58,625, while those with high school diploma education earn the least with $39,618. Women with an educational attainment of high school diploma earn the most with the average annual earnings of $40,913, while those with college or associate's degree education have the smallest earnings of $36,853.
| Educational Attainment | Male Income | Female Income |
| Less than High School | $44,643 | $0 |
| High School Diploma | $39,618 | $40,913 |
| College or Associate's Degree | $58,625 | $36,853 |
| Bachelor's Degree | $55,781 | $38,571 |
| Graduate Degree | - | - |
| Total | $46,806 | $37,656 |
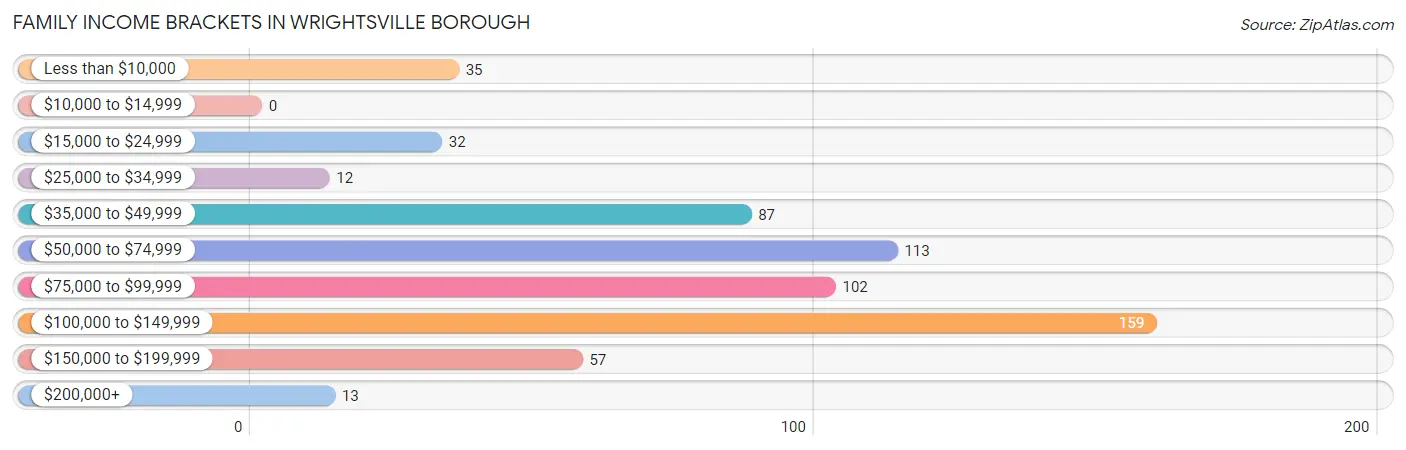
Family Income in Wrightsville borough
Family Income Brackets in Wrightsville borough
According to the Wrightsville borough family income data, there are 159 families falling into the $100,000 to $149,999 income range, which is the most common income bracket and makes up 26.1% of all families.
| Income Bracket | # Families | % Families |
| Less than $10,000 | 35 | 5.7% |
| $10,000 to $14,999 | 0 | 0.0% |
| $15,000 to $24,999 | 32 | 5.2% |
| $25,000 to $34,999 | 12 | 2.0% |
| $35,000 to $49,999 | 87 | 14.3% |
| $50,000 to $74,999 | 113 | 18.5% |
| $75,000 to $99,999 | 102 | 16.7% |
| $100,000 to $149,999 | 159 | 26.1% |
| $150,000 to $199,999 | 57 | 9.3% |
| $200,000+ | 13 | 2.1% |
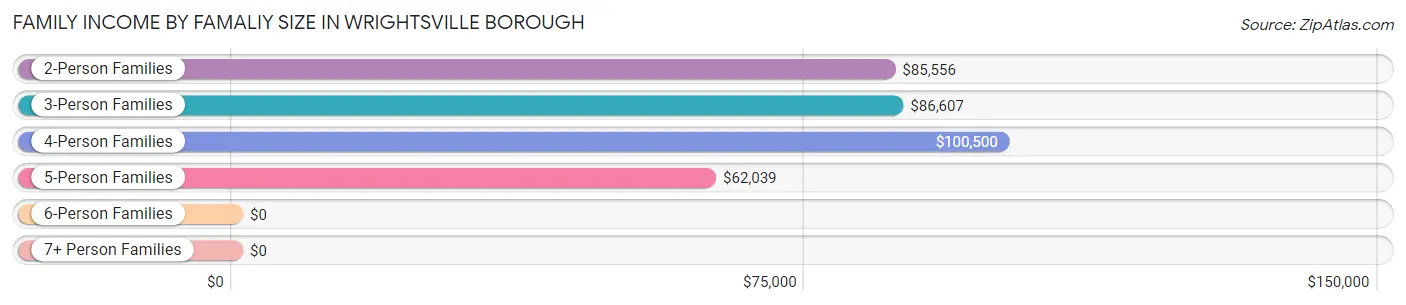
Family Income by Famaliy Size in Wrightsville borough
4-person families (116 | 19.0%) account for the highest median family income in Wrightsville borough with $100,500 per family, while 2-person families (282 | 46.2%) have the highest median income of $42,778 per family member.
| Income Bracket | # Families | Median Income |
| 2-Person Families | 282 (46.2%) | $85,556 |
| 3-Person Families | 139 (22.8%) | $86,607 |
| 4-Person Families | 116 (19.0%) | $100,500 |
| 5-Person Families | 59 (9.7%) | $62,039 |
| 6-Person Families | 14 (2.3%) | $0 |
| 7+ Person Families | 0 (0.0%) | $0 |
| Total | 610 (100.0%) | $86,000 |
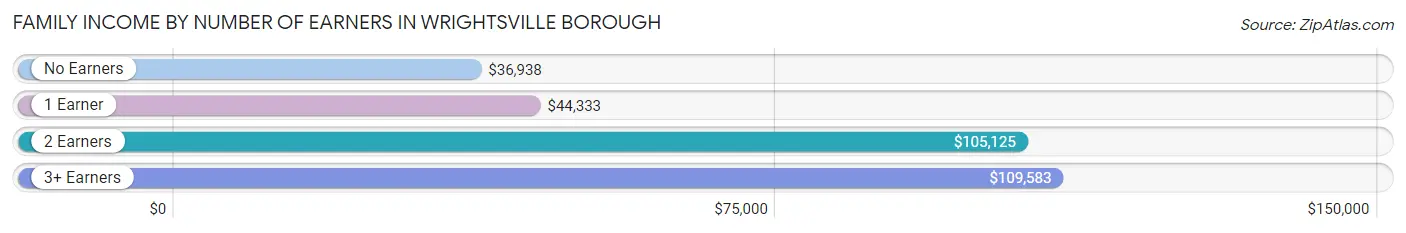
Family Income by Number of Earners in Wrightsville borough
The median family income in Wrightsville borough is $86,000, with families comprising 3+ earners (55) having the highest median family income of $109,583, while families with no earners (85) have the lowest median family income of $36,938, accounting for 9.0% and 13.9% of families, respectively.
| Number of Earners | # Families | Median Income |
| No Earners | 85 (13.9%) | $36,938 |
| 1 Earner | 160 (26.2%) | $44,333 |
| 2 Earners | 310 (50.8%) | $105,125 |
| 3+ Earners | 55 (9.0%) | $109,583 |
| Total | 610 (100.0%) | $86,000 |
Household Income in Wrightsville borough
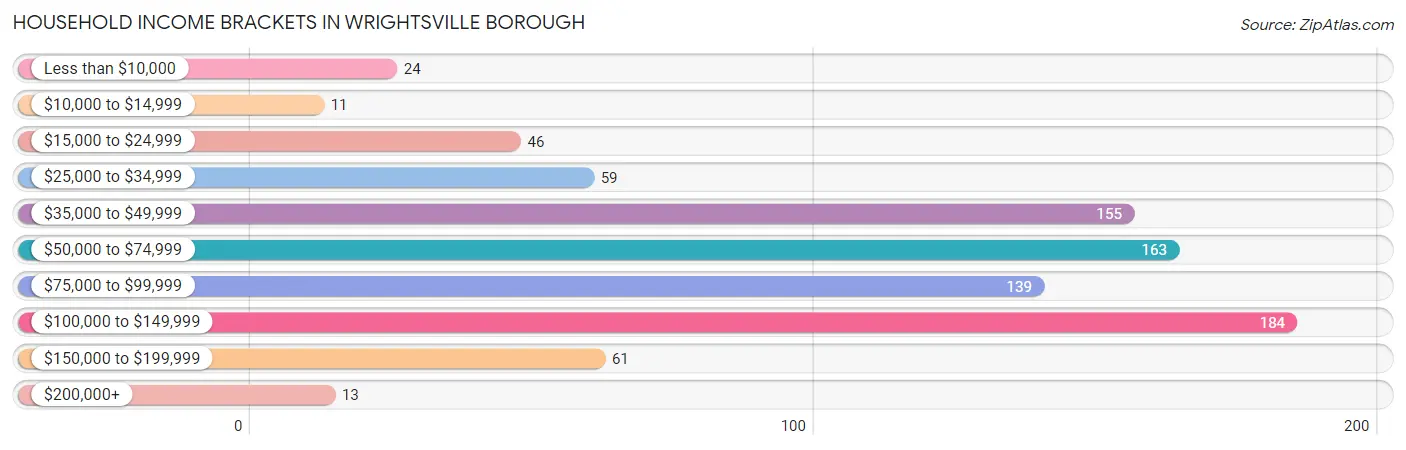
Household Income Brackets in Wrightsville borough
With 184 households falling in the category, the $100,000 to $149,999 income range is the most frequent in Wrightsville borough, accounting for 21.5% of all households. In contrast, only 11 households (1.3%) fall into the $10,000 to $14,999 income bracket, making it the least populous group.
| Income Bracket | # Households | % Households |
| Less than $10,000 | 24 | 2.8% |
| $10,000 to $14,999 | 11 | 1.3% |
| $15,000 to $24,999 | 46 | 5.4% |
| $25,000 to $34,999 | 59 | 6.9% |
| $35,000 to $49,999 | 155 | 18.1% |
| $50,000 to $74,999 | 163 | 19.1% |
| $75,000 to $99,999 | 139 | 16.3% |
| $100,000 to $149,999 | 184 | 21.5% |
| $150,000 to $199,999 | 61 | 7.1% |
| $200,000+ | 13 | 1.5% |
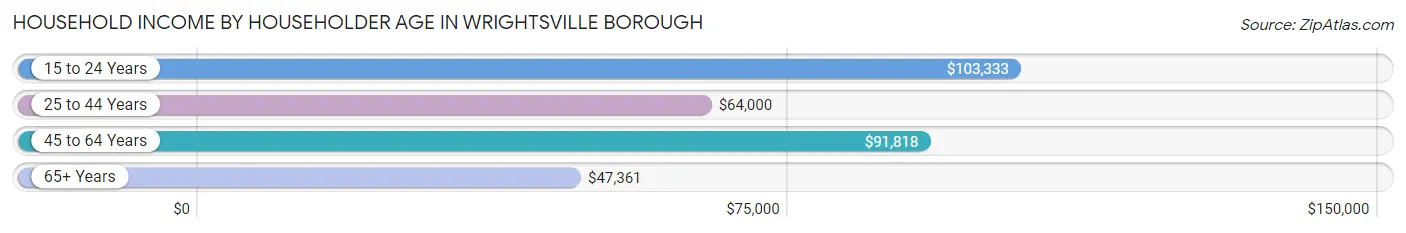
Household Income by Householder Age in Wrightsville borough
The median household income in Wrightsville borough is $70,179, with the highest median household income of $103,333 found in the 15 to 24 years age bracket for the primary householder. A total of 24 households (2.8%) fall into this category. Meanwhile, the 65+ years age bracket for the primary householder has the lowest median household income of $47,361, with 179 households (20.9%) in this group.
| Income Bracket | # Households | Median Income |
| 15 to 24 Years | 24 (2.8%) | $103,333 |
| 25 to 44 Years | 350 (40.9%) | $64,000 |
| 45 to 64 Years | 302 (35.3%) | $91,818 |
| 65+ Years | 179 (20.9%) | $47,361 |
| Total | 855 (100.0%) | $70,179 |
Poverty in Wrightsville borough
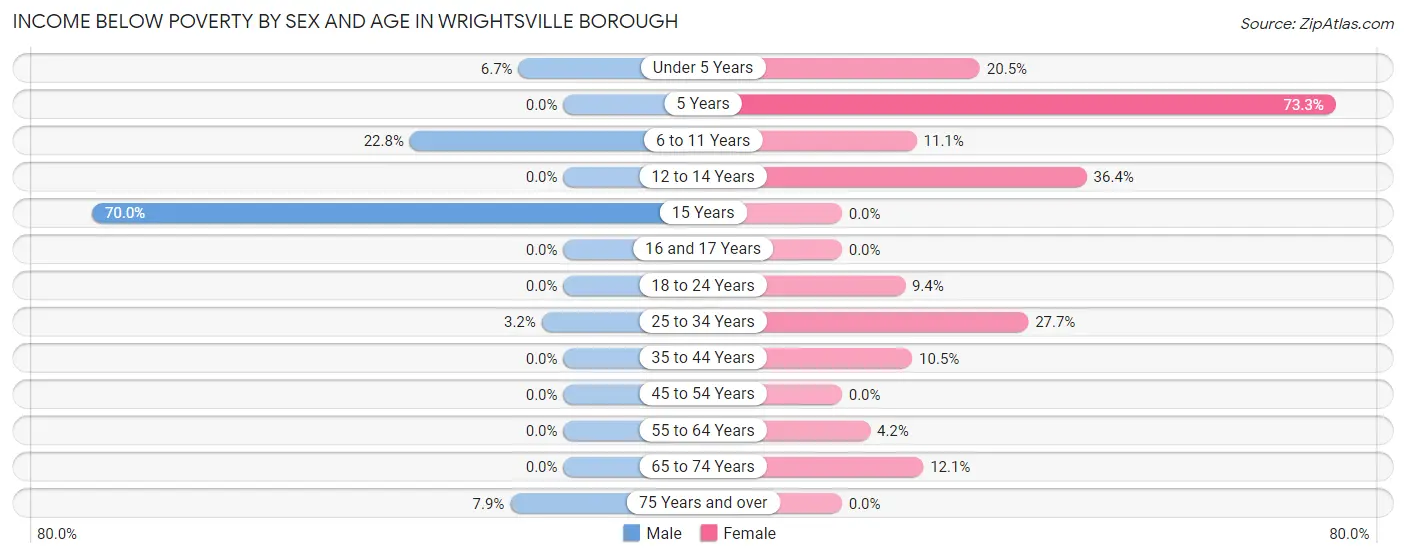
Income Below Poverty by Sex and Age in Wrightsville borough
With 5.4% poverty level for males and 13.6% for females among the residents of Wrightsville borough, 15 year old males and 5 year old females are the most vulnerable to poverty, with 14 males (70.0%) and 11 females (73.3%) in their respective age groups living below the poverty level.
| Age Bracket | Male | Female |
| Under 5 Years | 9 (6.7%) | 16 (20.5%) |
| 5 Years | 0 (0.0%) | 11 (73.3%) |
| 6 to 11 Years | 26 (22.8%) | 14 (11.1%) |
| 12 to 14 Years | 0 (0.0%) | 12 (36.4%) |
| 15 Years | 14 (70.0%) | 0 (0.0%) |
| 16 and 17 Years | 0 (0.0%) | 0 (0.0%) |
| 18 to 24 Years | 0 (0.0%) | 6 (9.4%) |
| 25 to 34 Years | 6 (3.2%) | 62 (27.7%) |
| 35 to 44 Years | 0 (0.0%) | 14 (10.4%) |
| 45 to 54 Years | 0 (0.0%) | 0 (0.0%) |
| 55 to 64 Years | 0 (0.0%) | 7 (4.2%) |
| 65 to 74 Years | 0 (0.0%) | 11 (12.1%) |
| 75 Years and over | 3 (7.9%) | 0 (0.0%) |
| Total | 58 (5.4%) | 153 (13.6%) |
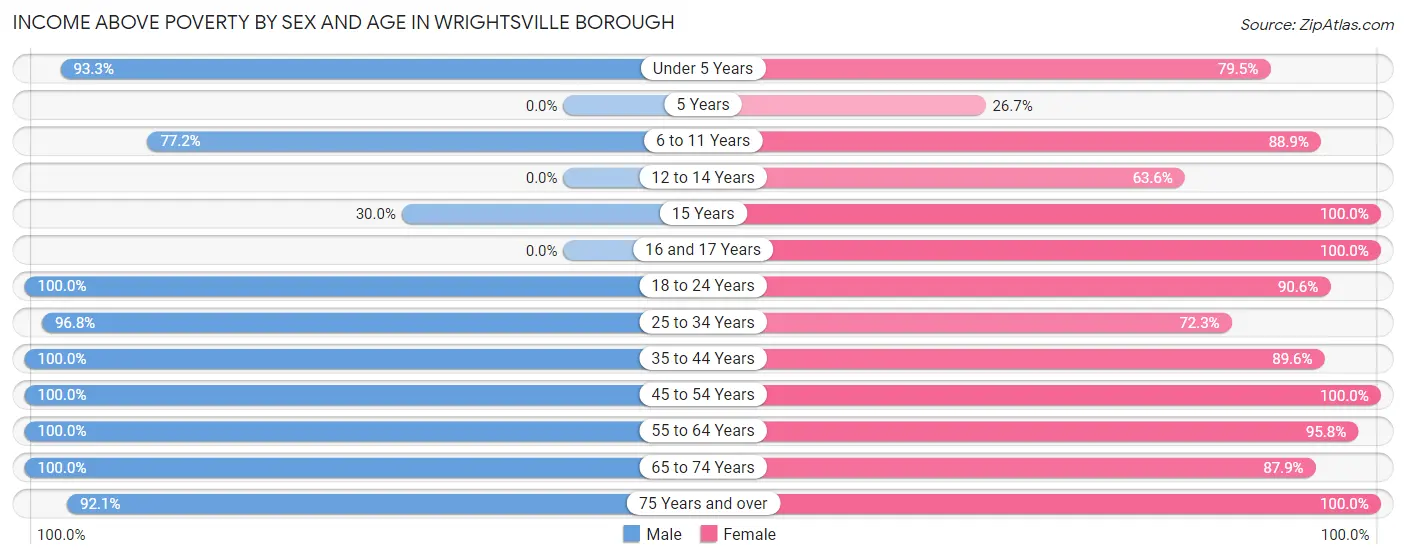
Income Above Poverty by Sex and Age in Wrightsville borough
According to the poverty statistics in Wrightsville borough, males aged 18 to 24 years and females aged 15 years are the age groups that are most secure financially, with 100.0% of males and 100.0% of females in these age groups living above the poverty line.
| Age Bracket | Male | Female |
| Under 5 Years | 126 (93.3%) | 62 (79.5%) |
| 5 Years | 0 (0.0%) | 4 (26.7%) |
| 6 to 11 Years | 88 (77.2%) | 112 (88.9%) |
| 12 to 14 Years | 0 (0.0%) | 21 (63.6%) |
| 15 Years | 6 (30.0%) | 25 (100.0%) |
| 16 and 17 Years | 0 (0.0%) | 6 (100.0%) |
| 18 to 24 Years | 32 (100.0%) | 58 (90.6%) |
| 25 to 34 Years | 180 (96.8%) | 162 (72.3%) |
| 35 to 44 Years | 182 (100.0%) | 120 (89.5%) |
| 45 to 54 Years | 86 (100.0%) | 91 (100.0%) |
| 55 to 64 Years | 154 (100.0%) | 160 (95.8%) |
| 65 to 74 Years | 124 (100.0%) | 80 (87.9%) |
| 75 Years and over | 35 (92.1%) | 68 (100.0%) |
| Total | 1,013 (94.6%) | 969 (86.4%) |
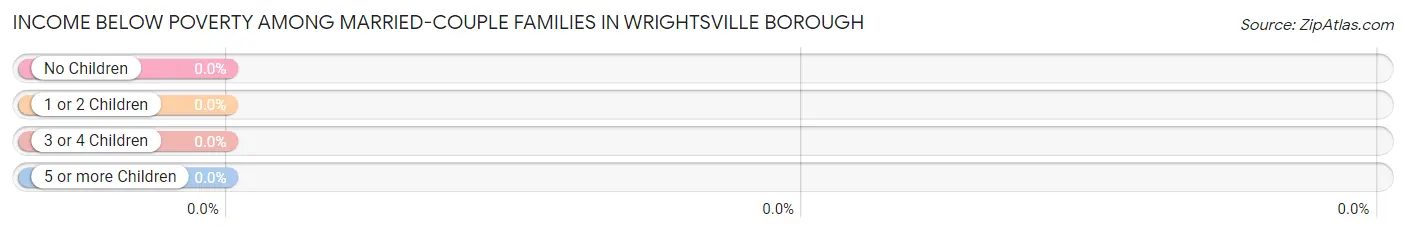
Income Below Poverty Among Married-Couple Families in Wrightsville borough
| Children | Above Poverty | Below Poverty |
| No Children | 243 (100.0%) | 0 (0.0%) |
| 1 or 2 Children | 109 (100.0%) | 0 (0.0%) |
| 3 or 4 Children | 59 (100.0%) | 0 (0.0%) |
| 5 or more Children | 0 (0.0%) | 0 (0.0%) |
| Total | 411 (100.0%) | 0 (0.0%) |
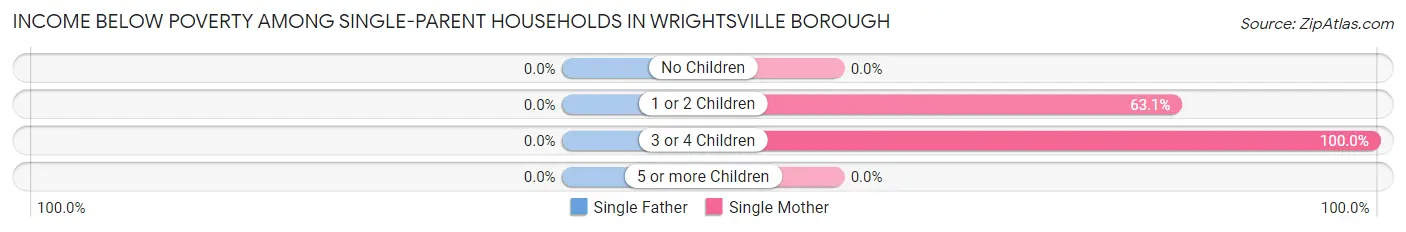
Income Below Poverty Among Single-Parent Households in Wrightsville borough
| Children | Single Father | Single Mother |
| No Children | 0 (0.0%) | 0 (0.0%) |
| 1 or 2 Children | 0 (0.0%) | 41 (63.1%) |
| 3 or 4 Children | 0 (0.0%) | 14 (100.0%) |
| 5 or more Children | 0 (0.0%) | 0 (0.0%) |
| Total | 0 (0.0%) | 55 (44.4%) |
Income Below Poverty Among Married-Couple vs Single-Parent Households in Wrightsville borough
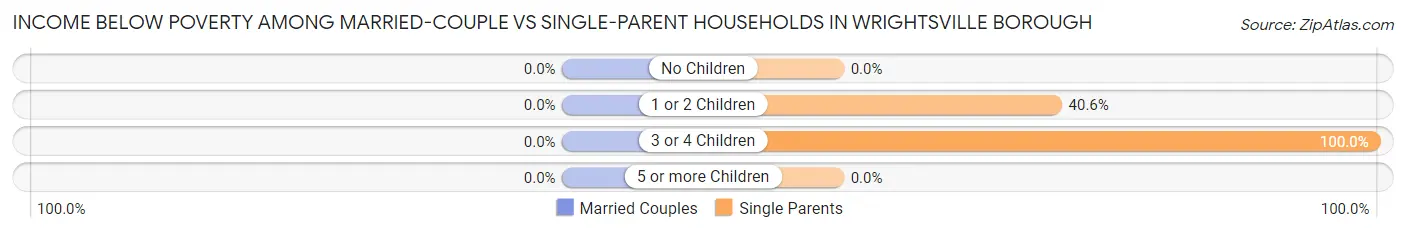
| Children | Married-Couple Families | Single-Parent Households |
| No Children | 0 (0.0%) | 0 (0.0%) |
| 1 or 2 Children | 0 (0.0%) | 41 (40.6%) |
| 3 or 4 Children | 0 (0.0%) | 14 (100.0%) |
| 5 or more Children | 0 (0.0%) | 0 (0.0%) |
| Total | 0 (0.0%) | 55 (27.6%) |
Race in Wrightsville borough
The most populous races in Wrightsville borough are White / Caucasian (2,034 | 92.3%), Hispanic or Latino (194 | 8.8%), and Two or more Races (126 | 5.7%).
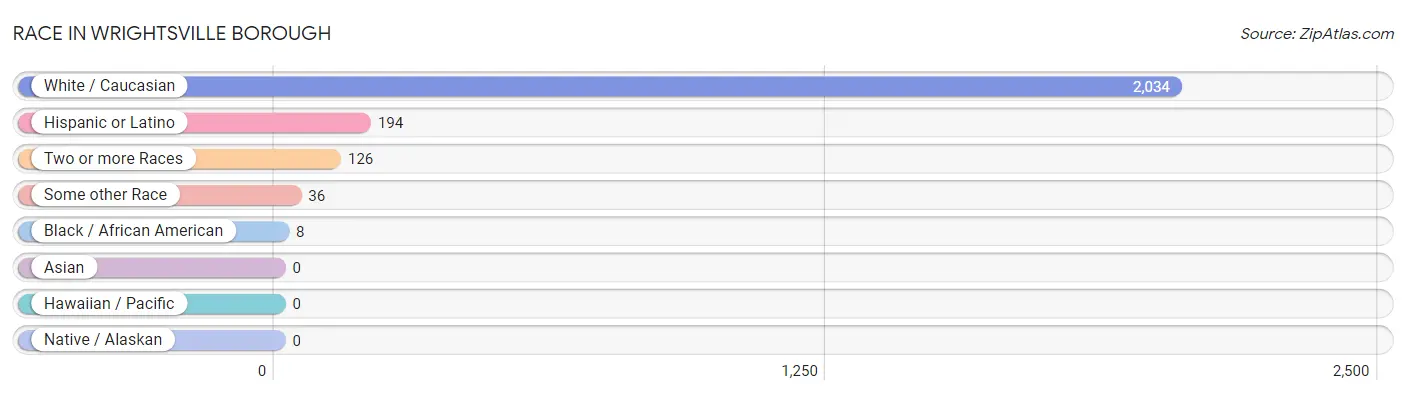
| Race | # Population | % Population |
| Asian | 0 | 0.0% |
| Black / African American | 8 | 0.4% |
| Hawaiian / Pacific | 0 | 0.0% |
| Hispanic or Latino | 194 | 8.8% |
| Native / Alaskan | 0 | 0.0% |
| White / Caucasian | 2,034 | 92.3% |
| Two or more Races | 126 | 5.7% |
| Some other Race | 36 | 1.6% |
| Total | 2,204 | 100.0% |
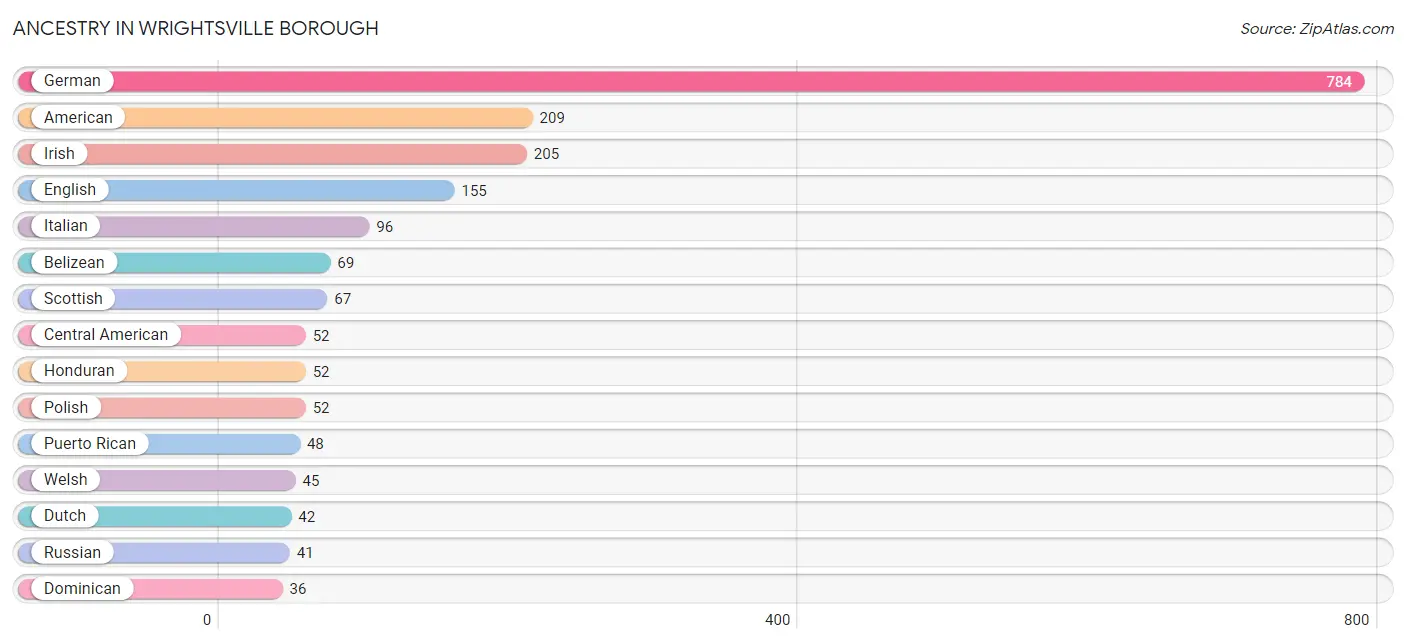
Ancestry in Wrightsville borough
The most populous ancestries reported in Wrightsville borough are German (784 | 35.6%), American (209 | 9.5%), Irish (205 | 9.3%), English (155 | 7.0%), and Italian (96 | 4.4%), together accounting for 65.7% of all Wrightsville borough residents.
| Ancestry | # Population | % Population |
| American | 209 | 9.5% |
| Belizean | 69 | 3.1% |
| Bhutanese | 35 | 1.6% |
| British | 3 | 0.1% |
| Burmese | 15 | 0.7% |
| Central American | 52 | 2.4% |
| Cherokee | 12 | 0.5% |
| Chippewa | 10 | 0.4% |
| Colombian | 12 | 0.5% |
| Cuban | 29 | 1.3% |
| Czech | 2 | 0.1% |
| Dominican | 36 | 1.6% |
| Dutch | 42 | 1.9% |
| Eastern European | 6 | 0.3% |
| English | 155 | 7.0% |
| European | 14 | 0.6% |
| French | 16 | 0.7% |
| German | 784 | 35.6% |
| Honduran | 52 | 2.4% |
| Hungarian | 9 | 0.4% |
| Irish | 205 | 9.3% |
| Italian | 96 | 4.4% |
| Mexican | 14 | 0.6% |
| Pennsylvania German | 3 | 0.1% |
| Polish | 52 | 2.4% |
| Portuguese | 5 | 0.2% |
| Puerto Rican | 48 | 2.2% |
| Russian | 41 | 1.9% |
| Scotch-Irish | 30 | 1.4% |
| Scottish | 67 | 3.0% |
| Slovak | 12 | 0.5% |
| South American | 12 | 0.5% |
| Spaniard | 3 | 0.1% |
| Welsh | 45 | 2.0% | View All 34 Rows |
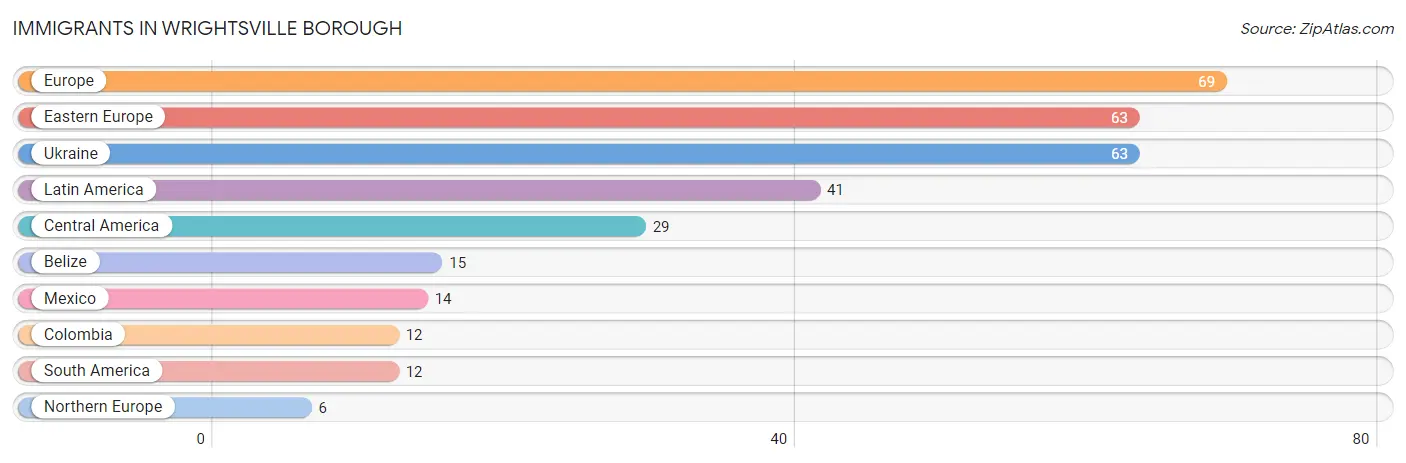
Immigrants in Wrightsville borough
The most numerous immigrant groups reported in Wrightsville borough came from Europe (69 | 3.1%), Eastern Europe (63 | 2.9%), Ukraine (63 | 2.9%), Latin America (41 | 1.9%), and Central America (29 | 1.3%), together accounting for 12.0% of all Wrightsville borough residents.
| Immigration Origin | # Population | % Population |
| Belize | 15 | 0.7% |
| Central America | 29 | 1.3% |
| Colombia | 12 | 0.5% |
| Eastern Europe | 63 | 2.9% |
| Europe | 69 | 3.1% |
| Latin America | 41 | 1.9% |
| Mexico | 14 | 0.6% |
| Northern Europe | 6 | 0.3% |
| South America | 12 | 0.5% |
| Ukraine | 63 | 2.9% | View All 10 Rows |
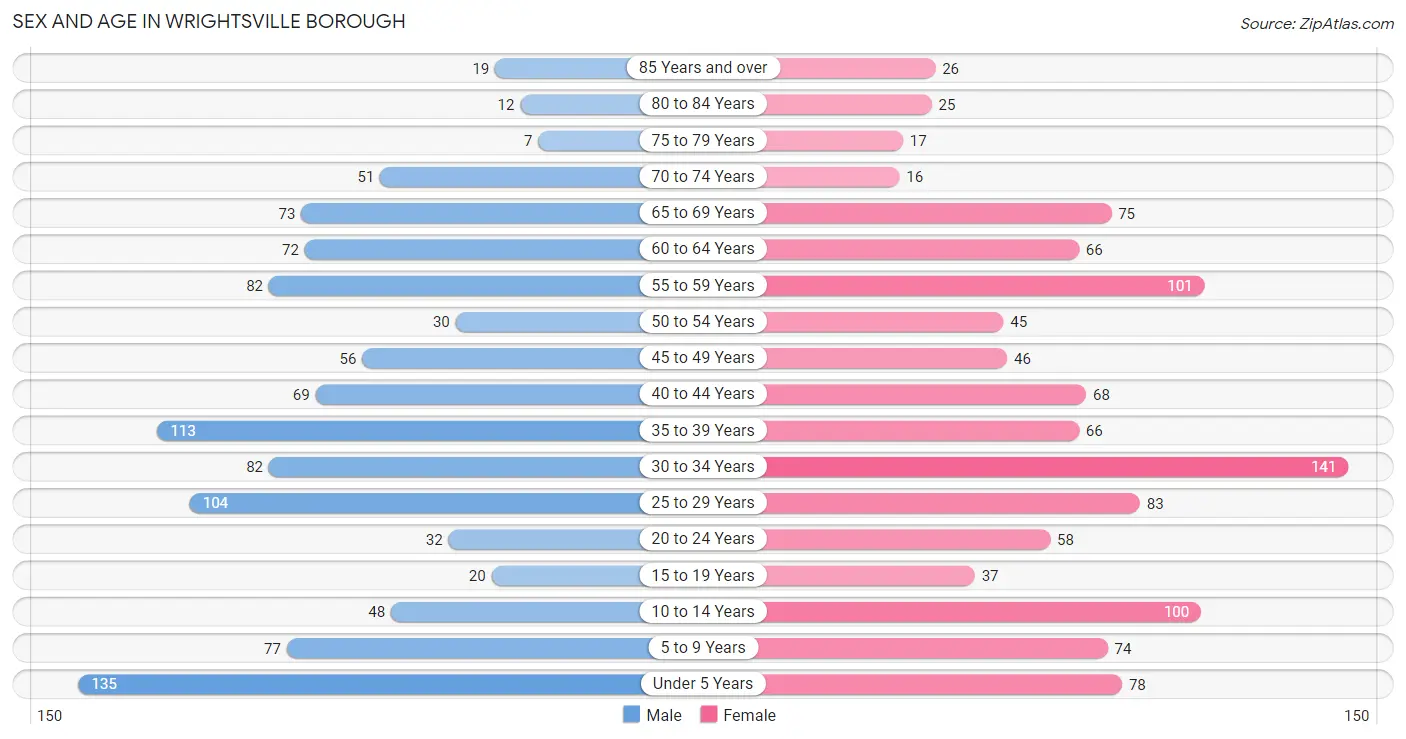
Sex and Age in Wrightsville borough
Sex and Age in Wrightsville borough
The most populous age groups in Wrightsville borough are Under 5 Years (135 | 12.5%) for men and 30 to 34 Years (141 | 12.6%) for women.
| Age Bracket | Male | Female |
| Under 5 Years | 135 (12.5%) | 78 (7.0%) |
| 5 to 9 Years | 77 (7.1%) | 74 (6.6%) |
| 10 to 14 Years | 48 (4.4%) | 100 (8.9%) |
| 15 to 19 Years | 20 (1.8%) | 37 (3.3%) |
| 20 to 24 Years | 32 (3.0%) | 58 (5.2%) |
| 25 to 29 Years | 104 (9.6%) | 83 (7.4%) |
| 30 to 34 Years | 82 (7.6%) | 141 (12.6%) |
| 35 to 39 Years | 113 (10.4%) | 66 (5.9%) |
| 40 to 44 Years | 69 (6.4%) | 68 (6.1%) |
| 45 to 49 Years | 56 (5.2%) | 46 (4.1%) |
| 50 to 54 Years | 30 (2.8%) | 45 (4.0%) |
| 55 to 59 Years | 82 (7.6%) | 101 (9.0%) |
| 60 to 64 Years | 72 (6.7%) | 66 (5.9%) |
| 65 to 69 Years | 73 (6.8%) | 75 (6.7%) |
| 70 to 74 Years | 51 (4.7%) | 16 (1.4%) |
| 75 to 79 Years | 7 (0.6%) | 17 (1.5%) |
| 80 to 84 Years | 12 (1.1%) | 25 (2.2%) |
| 85 Years and over | 19 (1.8%) | 26 (2.3%) |
| Total | 1,082 (100.0%) | 1,122 (100.0%) |
Families and Households in Wrightsville borough
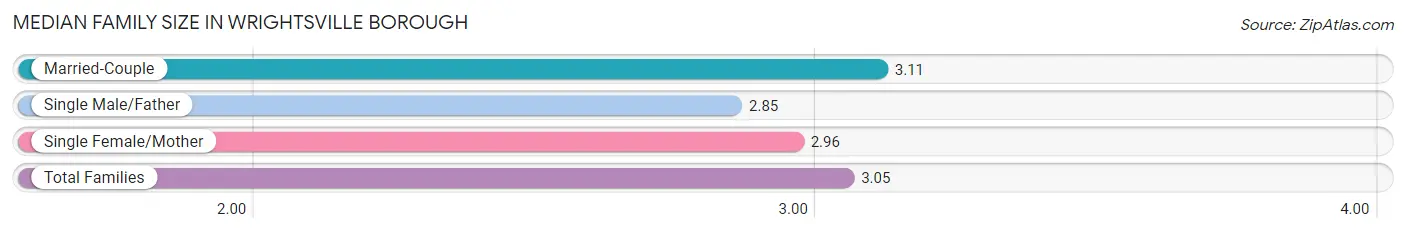
Median Family Size in Wrightsville borough
The median family size in Wrightsville borough is 3.05 persons per family, with married-couple families (411 | 67.4%) accounting for the largest median family size of 3.11 persons per family. On the other hand, single male/father families (75 | 12.3%) represent the smallest median family size with 2.85 persons per family.
| Family Type | # Families | Family Size |
| Married-Couple | 411 (67.4%) | 3.11 |
| Single Male/Father | 75 (12.3%) | 2.85 |
| Single Female/Mother | 124 (20.3%) | 2.96 |
| Total Families | 610 (100.0%) | 3.05 |
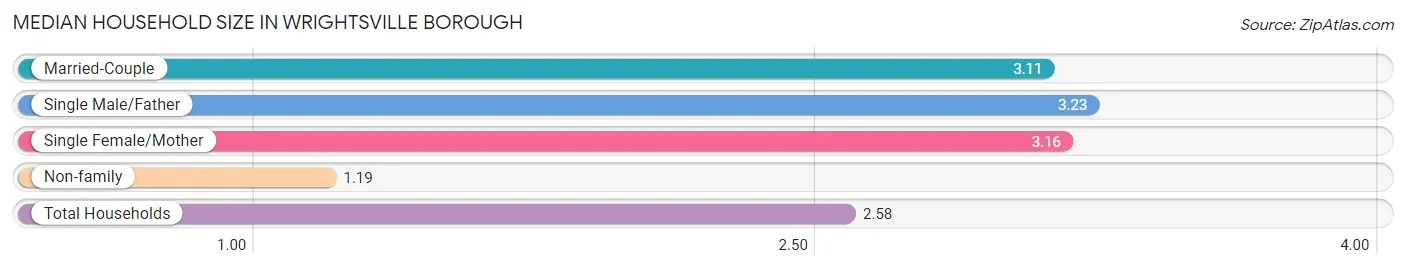
Median Household Size in Wrightsville borough
The median household size in Wrightsville borough is 2.58 persons per household, with single male/father households (75 | 8.8%) accounting for the largest median household size of 3.23 persons per household. non-family households (245 | 28.6%) represent the smallest median household size with 1.19 persons per household.
| Household Type | # Households | Household Size |
| Married-Couple | 411 (48.1%) | 3.11 |
| Single Male/Father | 75 (8.8%) | 3.23 |
| Single Female/Mother | 124 (14.5%) | 3.16 |
| Non-family | 245 (28.6%) | 1.19 |
| Total Households | 855 (100.0%) | 2.58 |
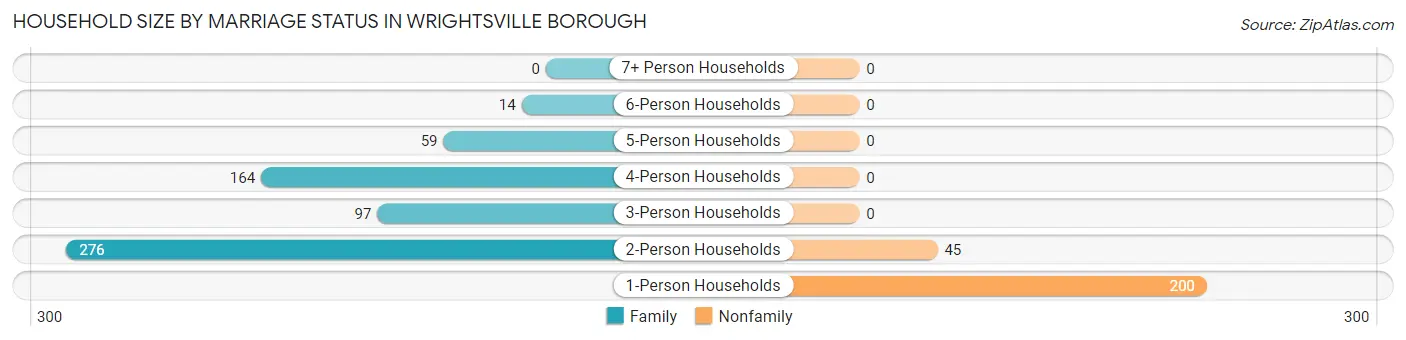
Household Size by Marriage Status in Wrightsville borough
Out of a total of 855 households in Wrightsville borough, 610 (71.4%) are family households, while 245 (28.6%) are nonfamily households. The most numerous type of family households are 2-person households, comprising 276, and the most common type of nonfamily households are 1-person households, comprising 200.
| Household Size | Family Households | Nonfamily Households |
| 1-Person Households | - | 200 (23.4%) |
| 2-Person Households | 276 (32.3%) | 45 (5.3%) |
| 3-Person Households | 97 (11.4%) | 0 (0.0%) |
| 4-Person Households | 164 (19.2%) | 0 (0.0%) |
| 5-Person Households | 59 (6.9%) | 0 (0.0%) |
| 6-Person Households | 14 (1.6%) | 0 (0.0%) |
| 7+ Person Households | 0 (0.0%) | 0 (0.0%) |
| Total | 610 (71.4%) | 245 (28.6%) |
Female Fertility in Wrightsville borough
Fertility by Age in Wrightsville borough
Average fertility rate in Wrightsville borough is 76.0 births per 1,000 women. Women in the age bracket of 15 to 19 years have the highest fertility rate with 162.0 births per 1,000 women. Women in the age bracket of 20 to 34 years acount for 65.8% of all women with births.
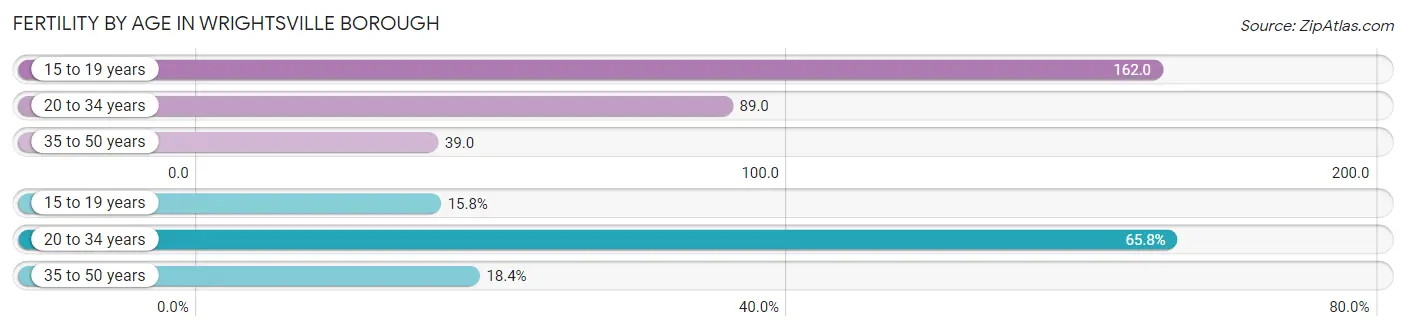
| Age Bracket | Women with Births | Births / 1,000 Women |
| 15 to 19 years | 6 (15.8%) | 162.0 |
| 20 to 34 years | 25 (65.8%) | 89.0 |
| 35 to 50 years | 7 (18.4%) | 39.0 |
| Total | 38 (100.0%) | 76.0 |
Fertility by Age by Marriage Status in Wrightsville borough
84.2% of women with births (38) in Wrightsville borough are married. The highest percentage of unmarried women with births falls into 15 to 19 years age bracket with 100.0% of them unmarried at the time of birth, while the lowest percentage of unmarried women with births belong to 20 to 34 years age bracket with 0.0% of them unmarried.
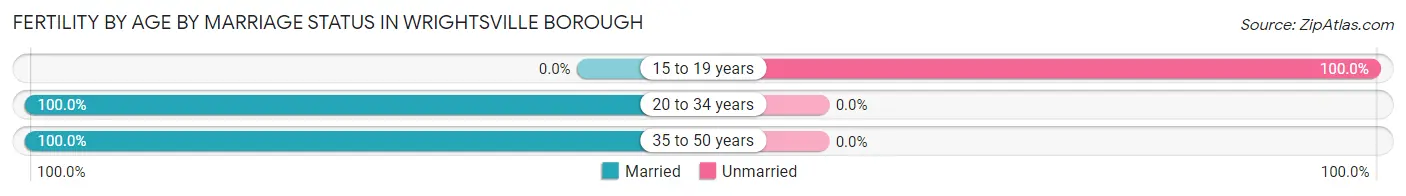
| Age Bracket | Married | Unmarried |
| 15 to 19 years | 0 (0.0%) | 6 (100.0%) |
| 20 to 34 years | 25 (100.0%) | 0 (0.0%) |
| 35 to 50 years | 7 (100.0%) | 0 (0.0%) |
| Total | 32 (84.2%) | 6 (15.8%) |
Fertility by Education in Wrightsville borough
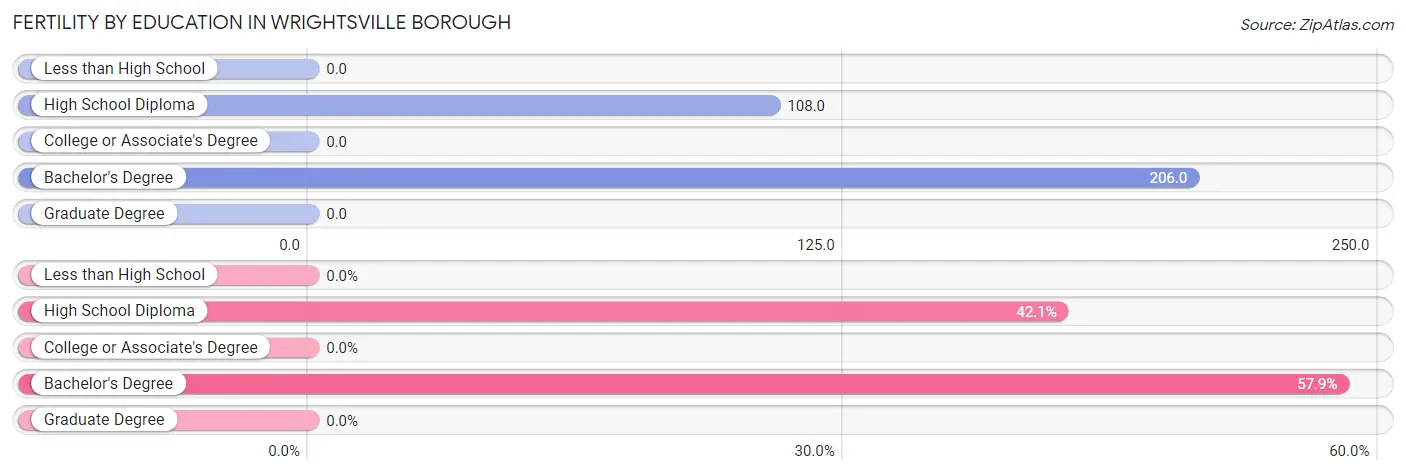
| Educational Attainment | Women with Births | Births / 1,000 Women |
| Less than High School | 0 (0.0%) | 0.0 |
| High School Diploma | 16 (42.1%) | 108.0 |
| College or Associate's Degree | 0 (0.0%) | 0.0 |
| Bachelor's Degree | 22 (57.9%) | 206.0 |
| Graduate Degree | 0 (0.0%) | 0.0 |
| Total | 38 (100.0%) | 76.0 |
Fertility by Education by Marriage Status in Wrightsville borough
15.8% of women with births in Wrightsville borough are unmarried. Women with the educational attainment of bachelor's degree are most likely to be married with 100.0% of them married at childbirth, while women with the educational attainment of high school diploma are least likely to be married with 37.5% of them unmarried at childbirth.
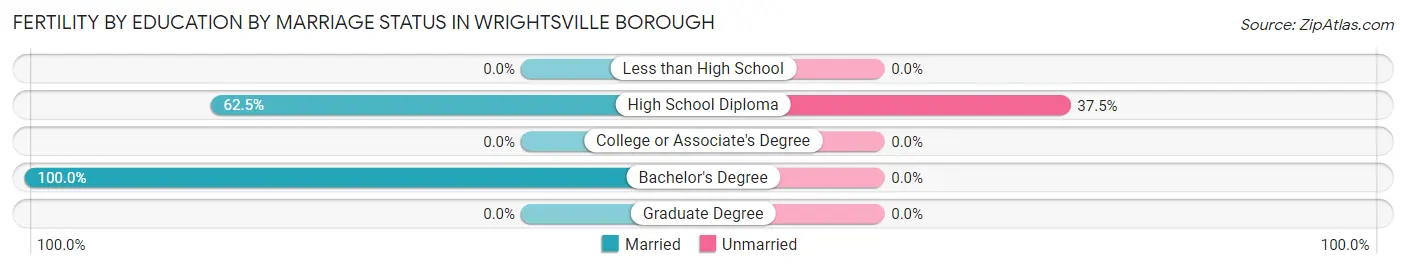
| Educational Attainment | Married | Unmarried |
| Less than High School | 0 (0.0%) | 0 (0.0%) |
| High School Diploma | 10 (62.5%) | 6 (37.5%) |
| College or Associate's Degree | 0 (0.0%) | 0 (0.0%) |
| Bachelor's Degree | 22 (100.0%) | 0 (0.0%) |
| Graduate Degree | 0 (0.0%) | 0 (0.0%) |
| Total | 32 (84.2%) | 6 (15.8%) |
Employment Characteristics in Wrightsville borough
Employment by Class of Employer in Wrightsville borough
Among the 1,124 employed individuals in Wrightsville borough, private company employees (875 | 77.8%), local government employees (115 | 10.2%), and not-for-profit organizations (99 | 8.8%) make up the most common classes of employment.
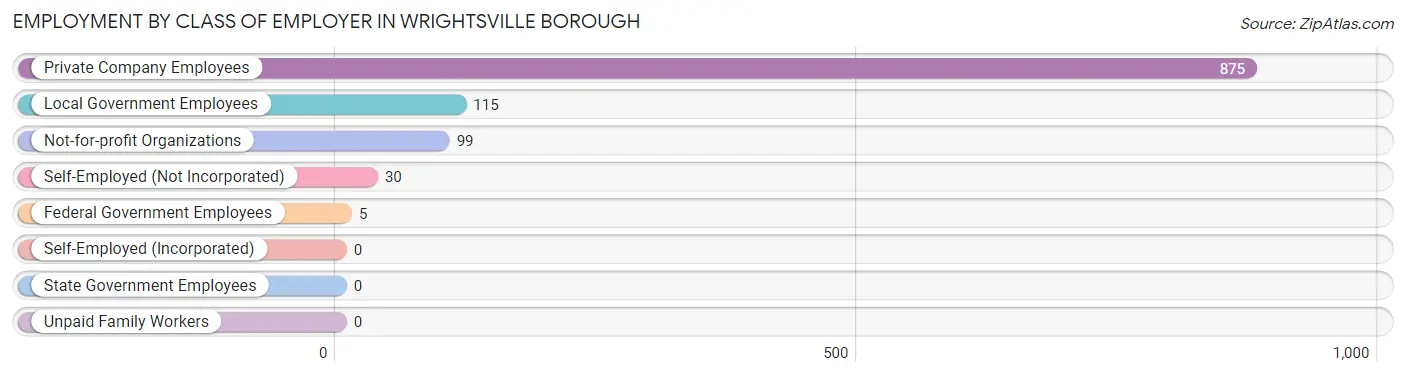
| Employer Class | # Employees | % Employees |
| Private Company Employees | 875 | 77.8% |
| Self-Employed (Incorporated) | 0 | 0.0% |
| Self-Employed (Not Incorporated) | 30 | 2.7% |
| Not-for-profit Organizations | 99 | 8.8% |
| Local Government Employees | 115 | 10.2% |
| State Government Employees | 0 | 0.0% |
| Federal Government Employees | 5 | 0.4% |
| Unpaid Family Workers | 0 | 0.0% |
| Total | 1,124 | 100.0% |
Employment Status by Age in Wrightsville borough
According to the labor force statistics for Wrightsville borough, out of the total population over 16 years of age (1,647), 71.8% or 1,183 individuals are in the labor force, with 3.0% or 35 of them unemployed. The age group with the highest labor force participation rate is 16 to 19 years, with 100.0% or 12 individuals in the labor force. Within the labor force, the 16 to 19 years age range has the highest percentage of unemployed individuals, with 50.0% or 6 of them being unemployed.
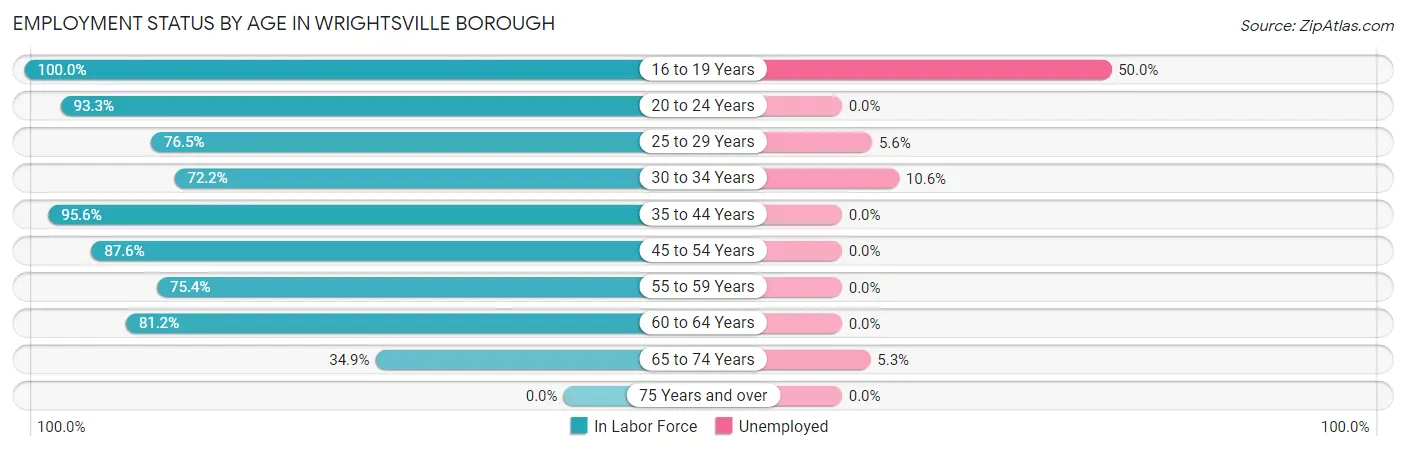
| Age Bracket | In Labor Force | Unemployed |
| 16 to 19 Years | 12 (100.0%) | 6 (50.0%) |
| 20 to 24 Years | 84 (93.3%) | 0 (0.0%) |
| 25 to 29 Years | 143 (76.5%) | 8 (5.6%) |
| 30 to 34 Years | 161 (72.2%) | 17 (10.6%) |
| 35 to 44 Years | 302 (95.6%) | 0 (0.0%) |
| 45 to 54 Years | 155 (87.6%) | 0 (0.0%) |
| 55 to 59 Years | 138 (75.4%) | 0 (0.0%) |
| 60 to 64 Years | 112 (81.2%) | 0 (0.0%) |
| 65 to 74 Years | 75 (34.9%) | 4 (5.3%) |
| 75 Years and over | 0 (0.0%) | 0 (0.0%) |
| Total | 1,183 (71.8%) | 35 (3.0%) |
Employment Status by Educational Attainment in Wrightsville borough
According to labor force statistics for Wrightsville borough, 82.6% of individuals (1,011) out of the total population between 25 and 64 years of age (1,224) are in the labor force, with 2.5% or 25 of them being unemployed. The group with the highest labor force participation rate are those with the educational attainment of bachelor's degree or higher, with 87.4% or 173 individuals in the labor force. Within the labor force, individuals with high school diploma education have the highest percentage of unemployment, with 3.8% or 19 of them being unemployed.
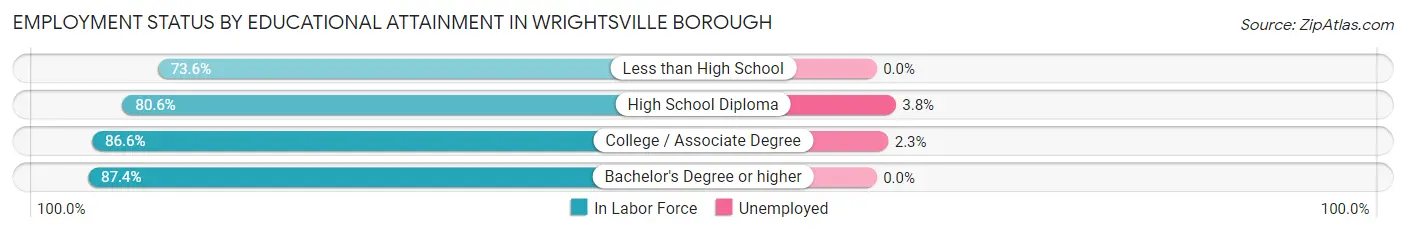
| Educational Attainment | In Labor Force | Unemployed |
| Less than High School | 78 (73.6%) | 0 (0.0%) |
| High School Diploma | 494 (80.6%) | 23 (3.8%) |
| College / Associate Degree | 266 (86.6%) | 7 (2.3%) |
| Bachelor's Degree or higher | 173 (87.4%) | 0 (0.0%) |
| Total | 1,011 (82.6%) | 31 (2.5%) |
Employment Occupations by Sex in Wrightsville borough
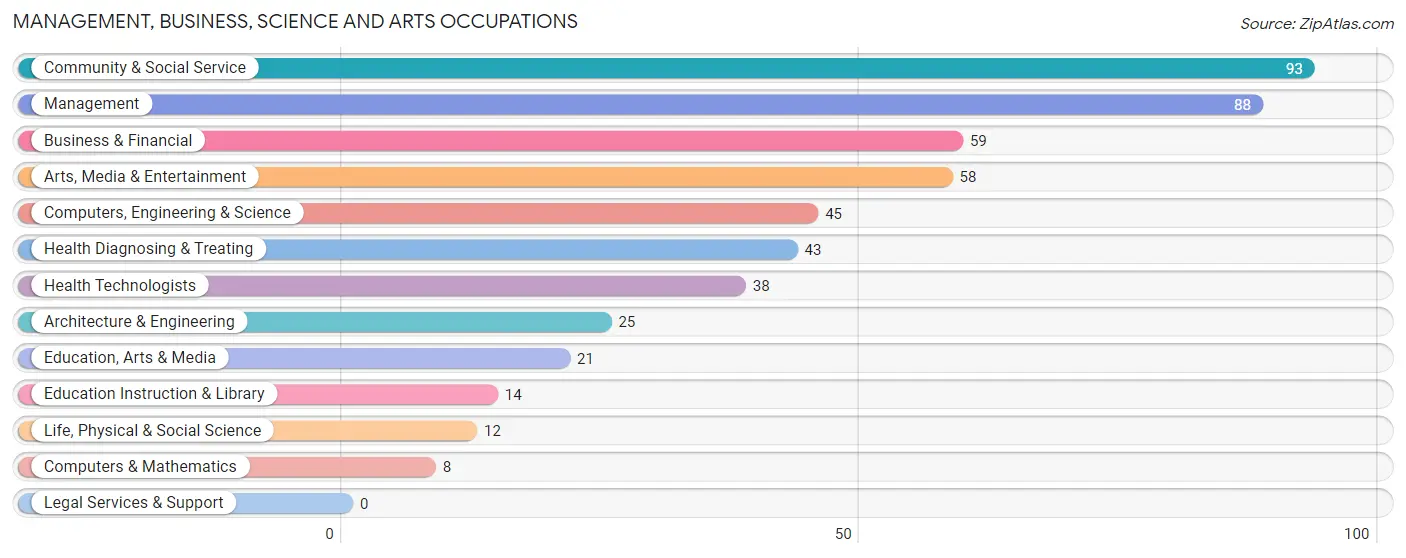
Management, Business, Science and Arts Occupations
The most common Management, Business, Science and Arts occupations in Wrightsville borough are Community & Social Service (93 | 8.1%), Management (88 | 7.7%), Business & Financial (59 | 5.1%), Arts, Media & Entertainment (58 | 5.1%), and Computers, Engineering & Science (45 | 3.9%).
Management, Business, Science and Arts Occupations by Sex
Within the Management, Business, Science and Arts occupations in Wrightsville borough, the most male-oriented occupations are Computers & Mathematics (100.0%), Architecture & Engineering (100.0%), and Computers, Engineering & Science (93.3%), while the most female-oriented occupations are Health Diagnosing & Treating (100.0%), Health Technologists (100.0%), and Business & Financial (72.9%).
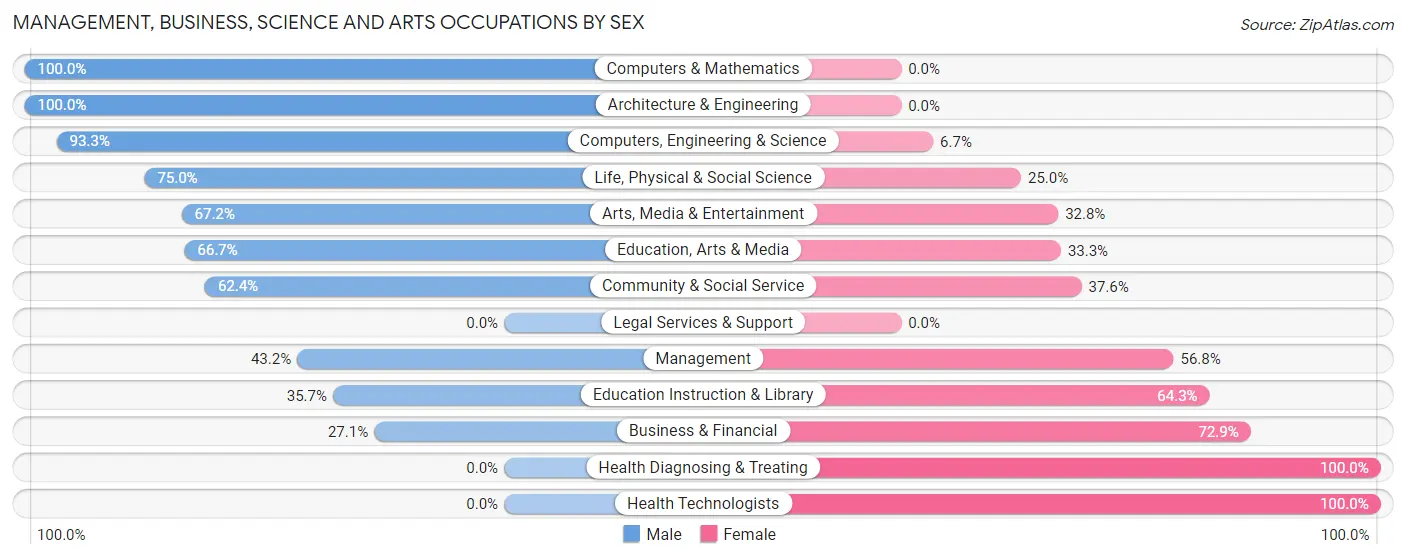
| Occupation | Male | Female |
| Management | 38 (43.2%) | 50 (56.8%) |
| Business & Financial | 16 (27.1%) | 43 (72.9%) |
| Computers, Engineering & Science | 42 (93.3%) | 3 (6.7%) |
| Computers & Mathematics | 8 (100.0%) | 0 (0.0%) |
| Architecture & Engineering | 25 (100.0%) | 0 (0.0%) |
| Life, Physical & Social Science | 9 (75.0%) | 3 (25.0%) |
| Community & Social Service | 58 (62.4%) | 35 (37.6%) |
| Education, Arts & Media | 14 (66.7%) | 7 (33.3%) |
| Legal Services & Support | 0 (0.0%) | 0 (0.0%) |
| Education Instruction & Library | 5 (35.7%) | 9 (64.3%) |
| Arts, Media & Entertainment | 39 (67.2%) | 19 (32.8%) |
| Health Diagnosing & Treating | 0 (0.0%) | 43 (100.0%) |
| Health Technologists | 0 (0.0%) | 38 (100.0%) |
| Total (Category) | 154 (46.9%) | 174 (53.0%) |
| Total (Overall) | 606 (52.8%) | 541 (47.2%) |
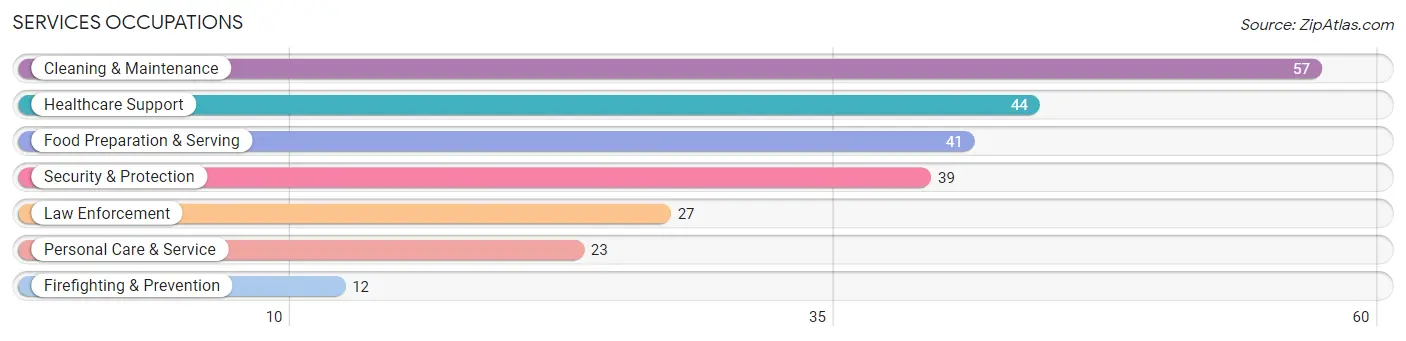
Services Occupations
The most common Services occupations in Wrightsville borough are Cleaning & Maintenance (57 | 5.0%), Healthcare Support (44 | 3.8%), Food Preparation & Serving (41 | 3.6%), Security & Protection (39 | 3.4%), and Law Enforcement (27 | 2.4%).
Services Occupations by Sex
Within the Services occupations in Wrightsville borough, the most male-oriented occupations are Security & Protection (100.0%), Firefighting & Prevention (100.0%), and Law Enforcement (100.0%), while the most female-oriented occupations are Food Preparation & Serving (100.0%), Personal Care & Service (100.0%), and Healthcare Support (81.8%).
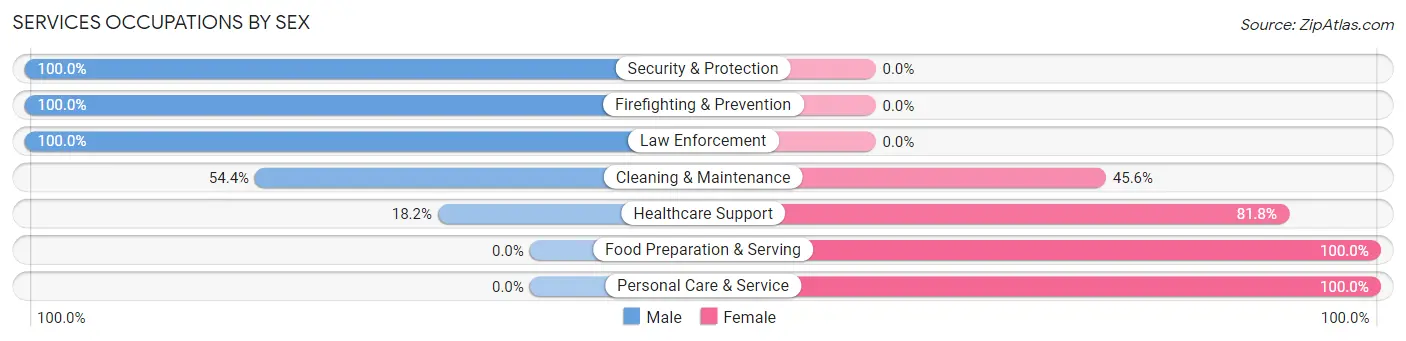
| Occupation | Male | Female |
| Healthcare Support | 8 (18.2%) | 36 (81.8%) |
| Security & Protection | 39 (100.0%) | 0 (0.0%) |
| Firefighting & Prevention | 12 (100.0%) | 0 (0.0%) |
| Law Enforcement | 27 (100.0%) | 0 (0.0%) |
| Food Preparation & Serving | 0 (0.0%) | 41 (100.0%) |
| Cleaning & Maintenance | 31 (54.4%) | 26 (45.6%) |
| Personal Care & Service | 0 (0.0%) | 23 (100.0%) |
| Total (Category) | 78 (38.2%) | 126 (61.8%) |
| Total (Overall) | 606 (52.8%) | 541 (47.2%) |
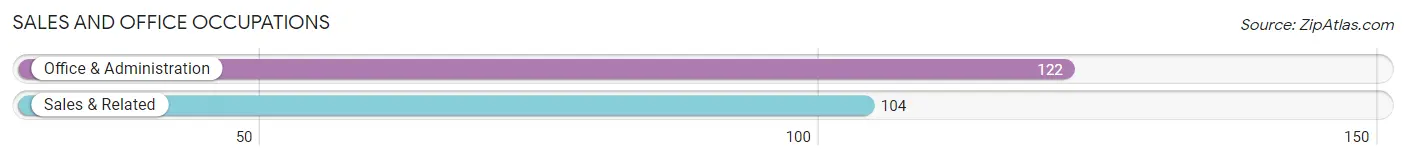
Sales and Office Occupations
The most common Sales and Office occupations in Wrightsville borough are Office & Administration (122 | 10.6%), and Sales & Related (104 | 9.1%).
Sales and Office Occupations by Sex
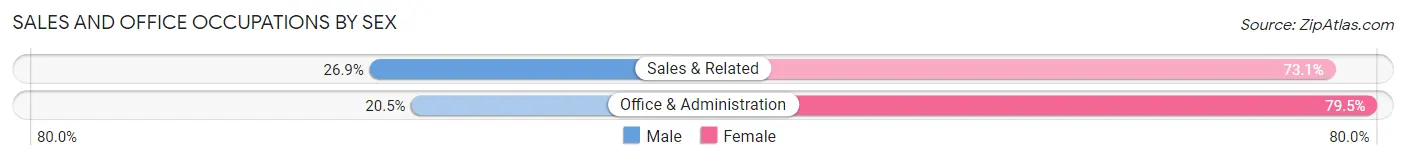
| Occupation | Male | Female |
| Sales & Related | 28 (26.9%) | 76 (73.1%) |
| Office & Administration | 25 (20.5%) | 97 (79.5%) |
| Total (Category) | 53 (23.4%) | 173 (76.5%) |
| Total (Overall) | 606 (52.8%) | 541 (47.2%) |
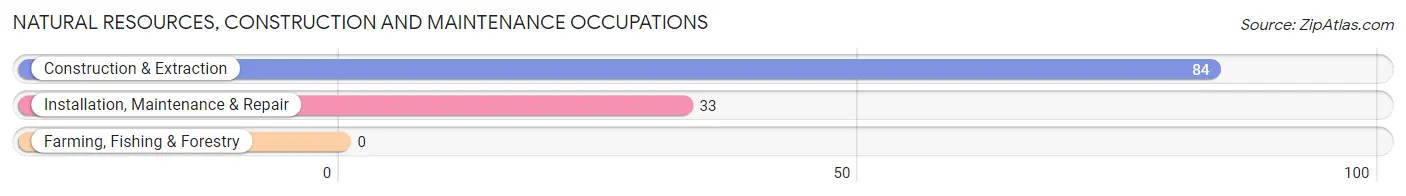
Natural Resources, Construction and Maintenance Occupations
The most common Natural Resources, Construction and Maintenance occupations in Wrightsville borough are Construction & Extraction (84 | 7.3%), and Installation, Maintenance & Repair (33 | 2.9%).
Natural Resources, Construction and Maintenance Occupations by Sex
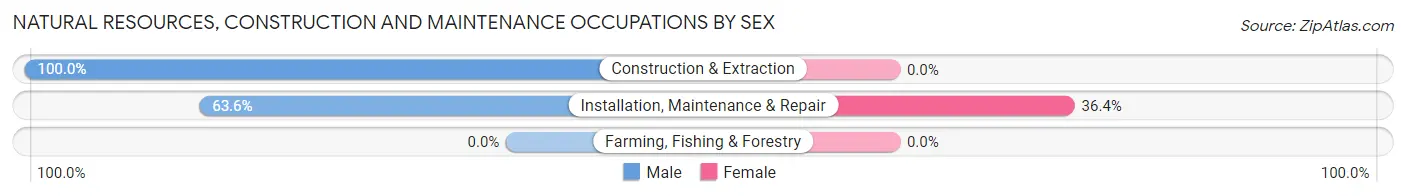
| Occupation | Male | Female |
| Farming, Fishing & Forestry | 0 (0.0%) | 0 (0.0%) |
| Construction & Extraction | 84 (100.0%) | 0 (0.0%) |
| Installation, Maintenance & Repair | 21 (63.6%) | 12 (36.4%) |
| Total (Category) | 105 (89.7%) | 12 (10.3%) |
| Total (Overall) | 606 (52.8%) | 541 (47.2%) |
Production, Transportation and Moving Occupations
The most common Production, Transportation and Moving occupations in Wrightsville borough are Production (209 | 18.2%), Material Moving (46 | 4.0%), and Transportation (17 | 1.5%).
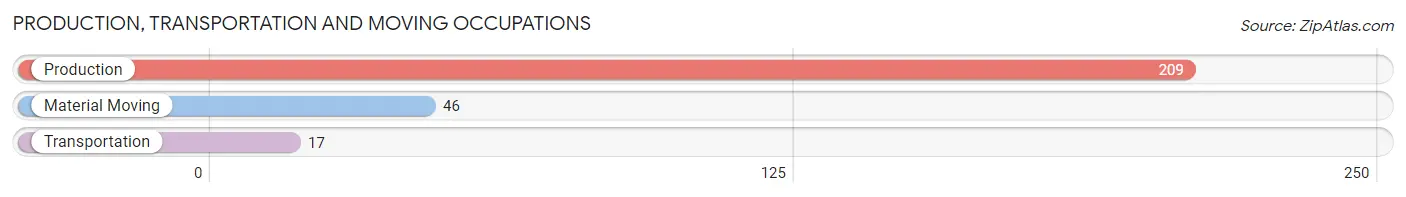
Production, Transportation and Moving Occupations by Sex
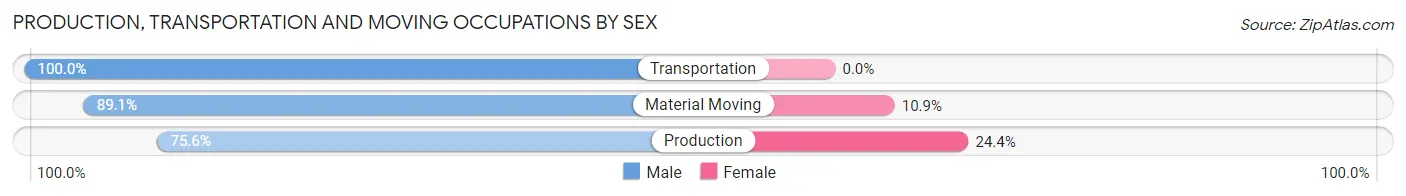
| Occupation | Male | Female |
| Production | 158 (75.6%) | 51 (24.4%) |
| Transportation | 17 (100.0%) | 0 (0.0%) |
| Material Moving | 41 (89.1%) | 5 (10.9%) |
| Total (Category) | 216 (79.4%) | 56 (20.6%) |
| Total (Overall) | 606 (52.8%) | 541 (47.2%) |
Employment Industries by Sex in Wrightsville borough
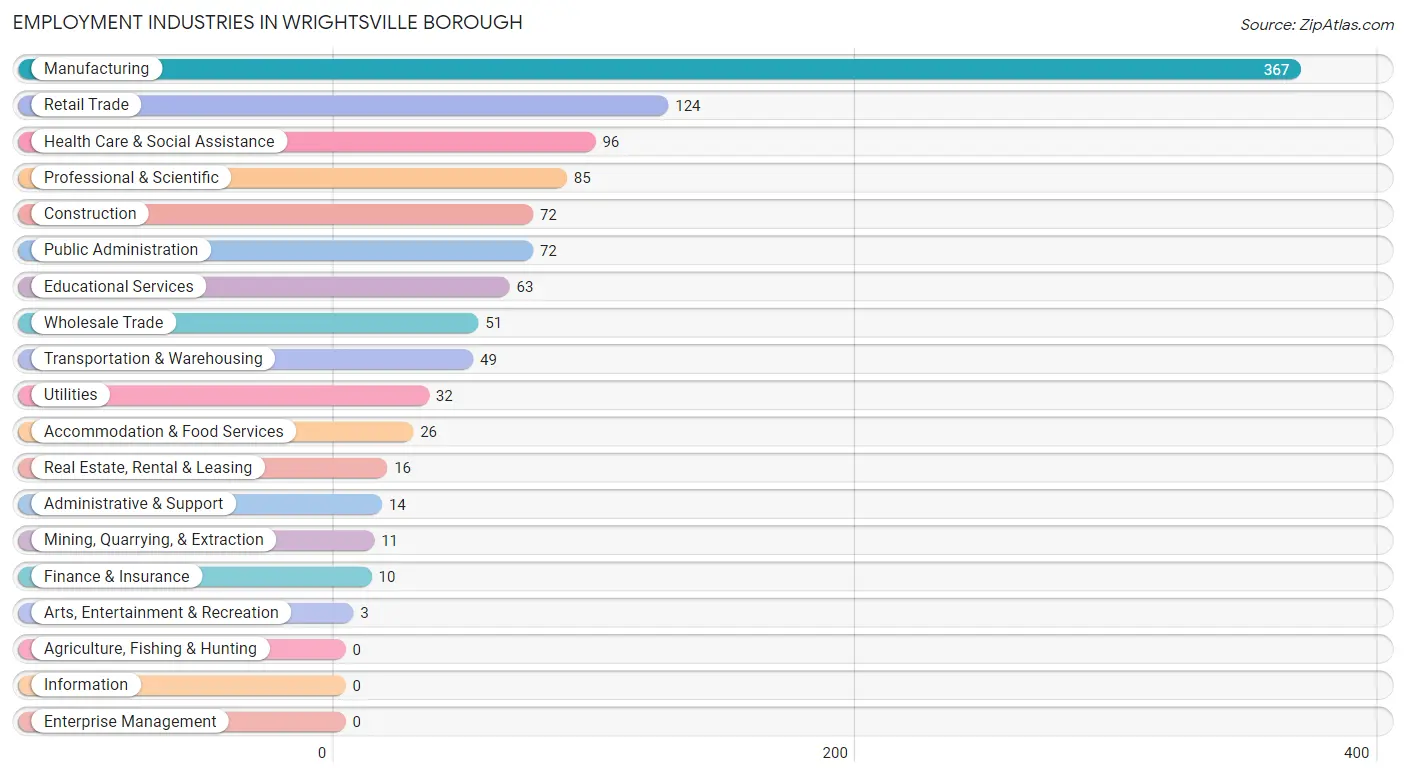
Employment Industries in Wrightsville borough
The major employment industries in Wrightsville borough include Manufacturing (367 | 32.0%), Retail Trade (124 | 10.8%), Health Care & Social Assistance (96 | 8.4%), Professional & Scientific (85 | 7.4%), and Construction (72 | 6.3%).
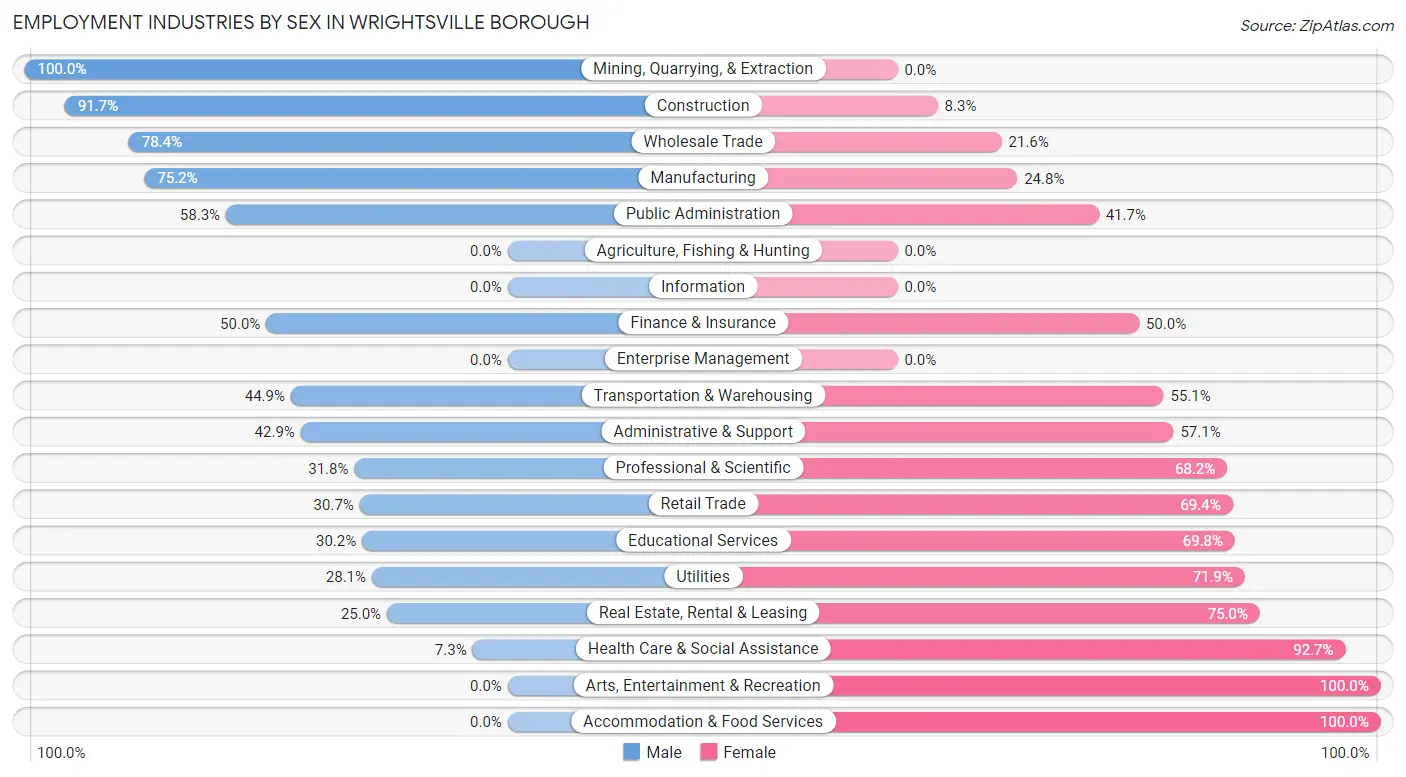
Employment Industries by Sex in Wrightsville borough
The Wrightsville borough industries that see more men than women are Mining, Quarrying, & Extraction (100.0%), Construction (91.7%), and Wholesale Trade (78.4%), whereas the industries that tend to have a higher number of women are Arts, Entertainment & Recreation (100.0%), Accommodation & Food Services (100.0%), and Health Care & Social Assistance (92.7%).
| Industry | Male | Female |
| Agriculture, Fishing & Hunting | 0 (0.0%) | 0 (0.0%) |
| Mining, Quarrying, & Extraction | 11 (100.0%) | 0 (0.0%) |
| Construction | 66 (91.7%) | 6 (8.3%) |
| Manufacturing | 276 (75.2%) | 91 (24.8%) |
| Wholesale Trade | 40 (78.4%) | 11 (21.6%) |
| Retail Trade | 38 (30.6%) | 86 (69.4%) |
| Transportation & Warehousing | 22 (44.9%) | 27 (55.1%) |
| Utilities | 9 (28.1%) | 23 (71.9%) |
| Information | 0 (0.0%) | 0 (0.0%) |
| Finance & Insurance | 5 (50.0%) | 5 (50.0%) |
| Real Estate, Rental & Leasing | 4 (25.0%) | 12 (75.0%) |
| Professional & Scientific | 27 (31.8%) | 58 (68.2%) |
| Enterprise Management | 0 (0.0%) | 0 (0.0%) |
| Administrative & Support | 6 (42.9%) | 8 (57.1%) |
| Educational Services | 19 (30.2%) | 44 (69.8%) |
| Health Care & Social Assistance | 7 (7.3%) | 89 (92.7%) |
| Arts, Entertainment & Recreation | 0 (0.0%) | 3 (100.0%) |
| Accommodation & Food Services | 0 (0.0%) | 26 (100.0%) |
| Public Administration | 42 (58.3%) | 30 (41.7%) |
| Total | 606 (52.8%) | 541 (47.2%) |
Education in Wrightsville borough
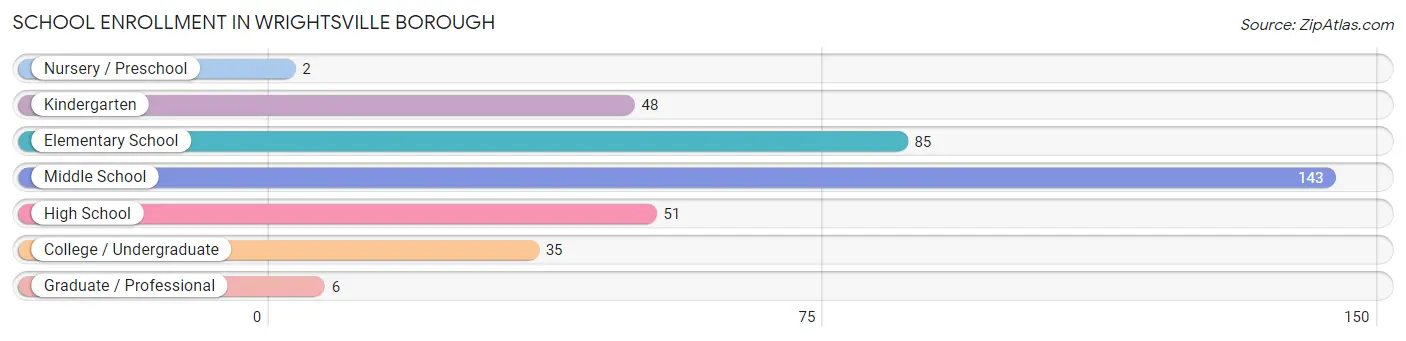
School Enrollment in Wrightsville borough
The most common levels of schooling among the 370 students in Wrightsville borough are middle school (143 | 38.7%), elementary school (85 | 23.0%), and high school (51 | 13.8%).
| School Level | # Students | % Students |
| Nursery / Preschool | 2 | 0.5% |
| Kindergarten | 48 | 13.0% |
| Elementary School | 85 | 23.0% |
| Middle School | 143 | 38.7% |
| High School | 51 | 13.8% |
| College / Undergraduate | 35 | 9.5% |
| Graduate / Professional | 6 | 1.6% |
| Total | 370 | 100.0% |
School Enrollment by Age by Funding Source in Wrightsville borough
Out of a total of 370 students who are enrolled in schools in Wrightsville borough, 17 (4.6%) attend a private institution, while the remaining 353 (95.4%) are enrolled in public schools. The age group of 35 years and over has the highest likelihood of being enrolled in private schools, with 4 (100.0% in the age bracket) enrolled. Conversely, the age group of 3 to 4 year olds has the lowest likelihood of being enrolled in a private school, with 2 (100.0% in the age bracket) attending a public institution.
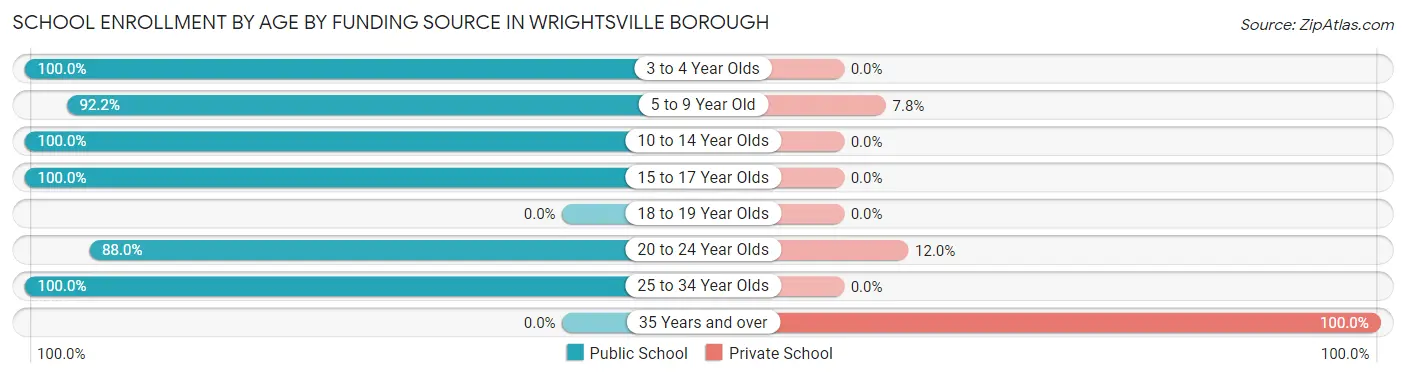
| Age Bracket | Public School | Private School |
| 3 to 4 Year Olds | 2 (100.0%) | 0 (0.0%) |
| 5 to 9 Year Old | 118 (92.2%) | 10 (7.8%) |
| 10 to 14 Year Olds | 148 (100.0%) | 0 (0.0%) |
| 15 to 17 Year Olds | 51 (100.0%) | 0 (0.0%) |
| 18 to 19 Year Olds | 0 (0.0%) | 0 (0.0%) |
| 20 to 24 Year Olds | 22 (88.0%) | 3 (12.0%) |
| 25 to 34 Year Olds | 12 (100.0%) | 0 (0.0%) |
| 35 Years and over | 0 (0.0%) | 4 (100.0%) |
| Total | 353 (95.4%) | 17 (4.6%) |
Educational Attainment by Field of Study in Wrightsville borough
Arts & humanities (48 | 19.1%), business (42 | 16.7%), liberal arts & history (24 | 9.5%), education (22 | 8.7%), and science & technology (18 | 7.1%) are the most common fields of study among 252 individuals in Wrightsville borough who have obtained a bachelor's degree or higher.
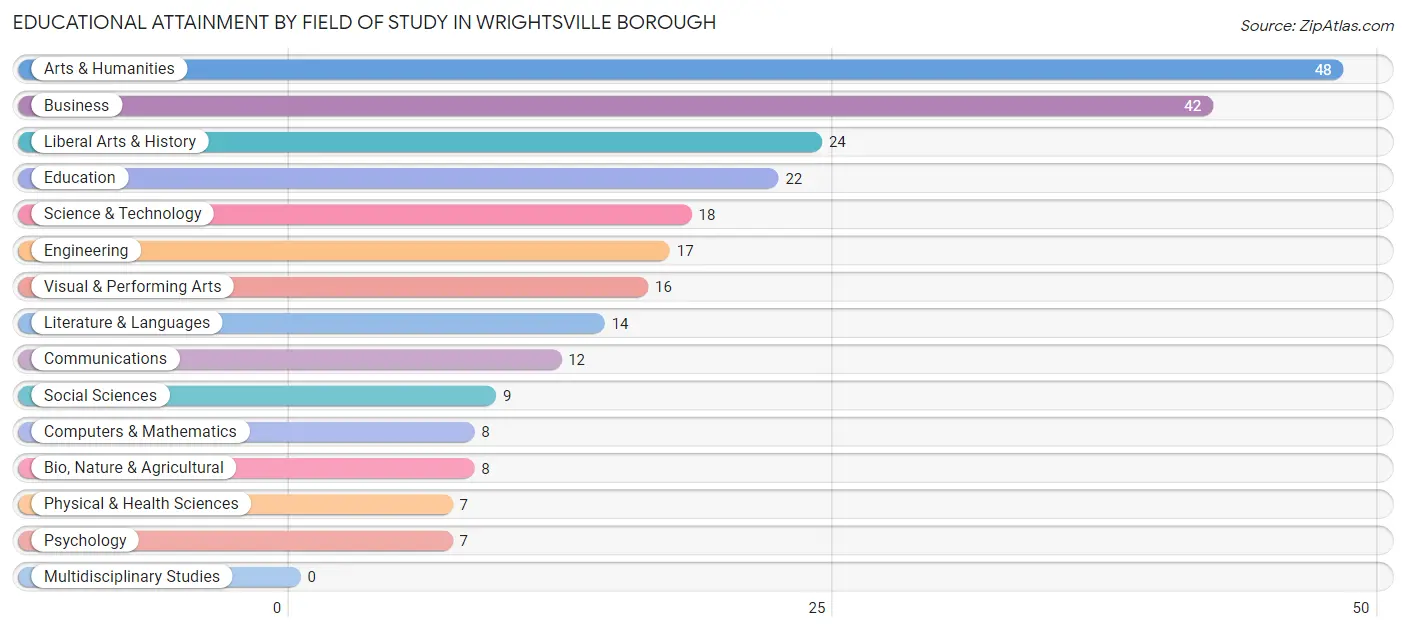
| Field of Study | # Graduates | % Graduates |
| Computers & Mathematics | 8 | 3.2% |
| Bio, Nature & Agricultural | 8 | 3.2% |
| Physical & Health Sciences | 7 | 2.8% |
| Psychology | 7 | 2.8% |
| Social Sciences | 9 | 3.6% |
| Engineering | 17 | 6.8% |
| Multidisciplinary Studies | 0 | 0.0% |
| Science & Technology | 18 | 7.1% |
| Business | 42 | 16.7% |
| Education | 22 | 8.7% |
| Literature & Languages | 14 | 5.6% |
| Liberal Arts & History | 24 | 9.5% |
| Visual & Performing Arts | 16 | 6.4% |
| Communications | 12 | 4.8% |
| Arts & Humanities | 48 | 19.1% |
| Total | 252 | 100.0% |
Transportation & Commute in Wrightsville borough
Vehicle Availability by Sex in Wrightsville borough
The most prevalent vehicle ownership categories in Wrightsville borough are males with 2 vehicles (325, accounting for 54.8%) and females with 2 vehicles (341, making up 61.2%).
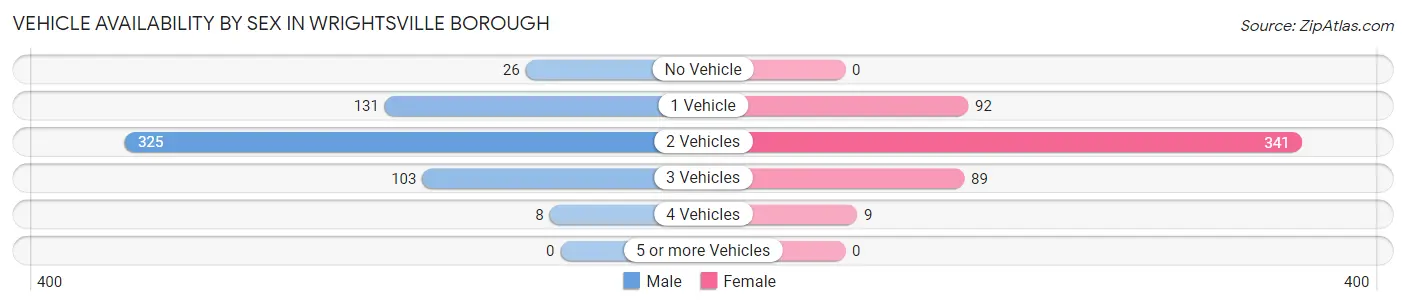
| Vehicles Available | Male | Female |
| No Vehicle | 26 (4.4%) | 0 (0.0%) |
| 1 Vehicle | 131 (22.1%) | 92 (17.3%) |
| 2 Vehicles | 325 (54.8%) | 341 (64.2%) |
| 3 Vehicles | 103 (17.4%) | 89 (16.8%) |
| 4 Vehicles | 8 (1.3%) | 9 (1.7%) |
| 5 or more Vehicles | 0 (0.0%) | 0 (0.0%) |
| Total | 593 (100.0%) | 531 (100.0%) |
Commute Time in Wrightsville borough
The most frequently occuring commute durations in Wrightsville borough are 20 to 24 minutes (223 commuters, 20.7%), 15 to 19 minutes (181 commuters, 16.8%), and 10 to 14 minutes (135 commuters, 12.6%).
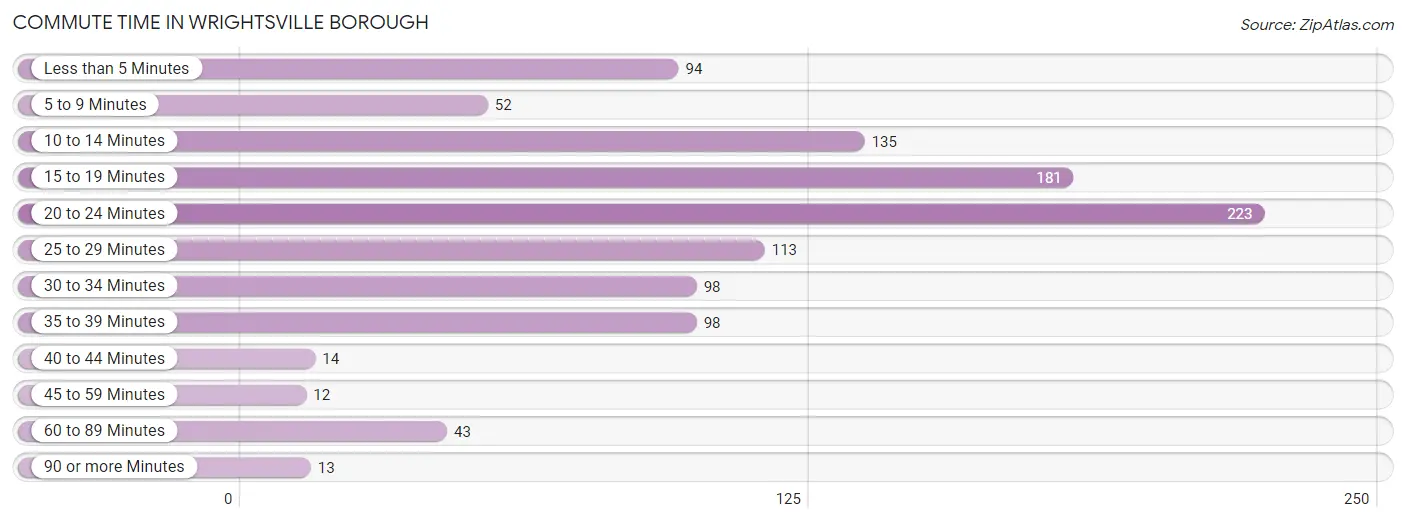
| Commute Time | # Commuters | % Commuters |
| Less than 5 Minutes | 94 | 8.7% |
| 5 to 9 Minutes | 52 | 4.8% |
| 10 to 14 Minutes | 135 | 12.6% |
| 15 to 19 Minutes | 181 | 16.8% |
| 20 to 24 Minutes | 223 | 20.7% |
| 25 to 29 Minutes | 113 | 10.5% |
| 30 to 34 Minutes | 98 | 9.1% |
| 35 to 39 Minutes | 98 | 9.1% |
| 40 to 44 Minutes | 14 | 1.3% |
| 45 to 59 Minutes | 12 | 1.1% |
| 60 to 89 Minutes | 43 | 4.0% |
| 90 or more Minutes | 13 | 1.2% |
Commute Time by Sex in Wrightsville borough
The most common commute times in Wrightsville borough are 20 to 24 minutes (156 commuters, 27.9%) for males and 15 to 19 minutes (83 commuters, 16.1%) for females.
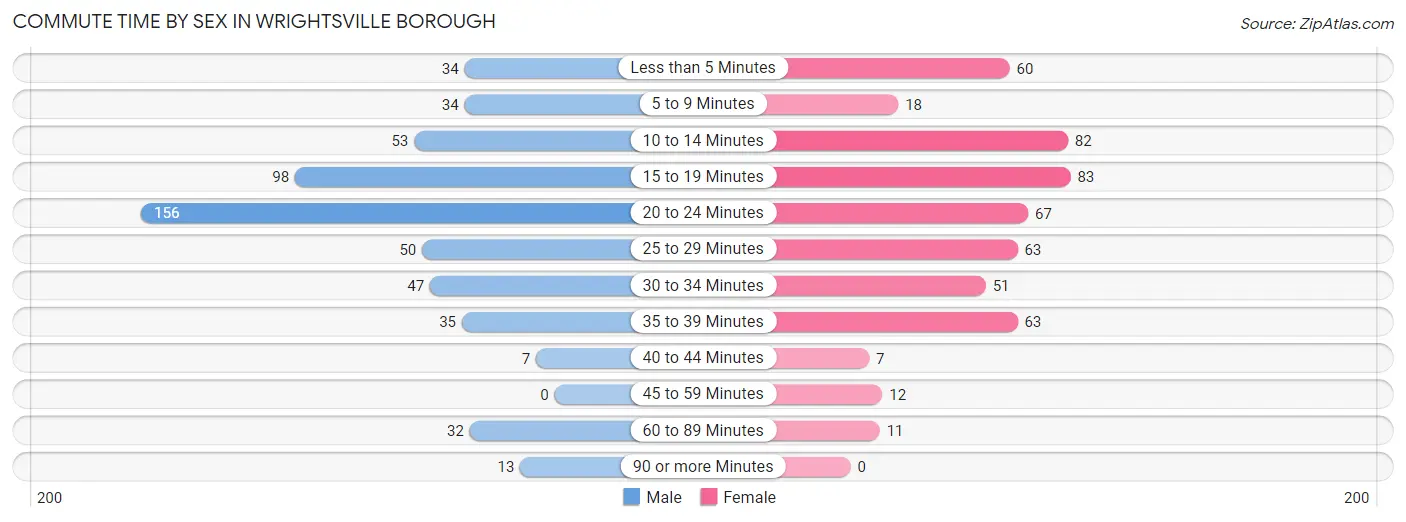
| Commute Time | Male | Female |
| Less than 5 Minutes | 34 (6.1%) | 60 (11.6%) |
| 5 to 9 Minutes | 34 (6.1%) | 18 (3.5%) |
| 10 to 14 Minutes | 53 (9.5%) | 82 (15.9%) |
| 15 to 19 Minutes | 98 (17.5%) | 83 (16.1%) |
| 20 to 24 Minutes | 156 (27.9%) | 67 (13.0%) |
| 25 to 29 Minutes | 50 (8.9%) | 63 (12.2%) |
| 30 to 34 Minutes | 47 (8.4%) | 51 (9.9%) |
| 35 to 39 Minutes | 35 (6.3%) | 63 (12.2%) |
| 40 to 44 Minutes | 7 (1.3%) | 7 (1.3%) |
| 45 to 59 Minutes | 0 (0.0%) | 12 (2.3%) |
| 60 to 89 Minutes | 32 (5.7%) | 11 (2.1%) |
| 90 or more Minutes | 13 (2.3%) | 0 (0.0%) |
Time of Departure to Work by Sex in Wrightsville borough
The most frequent times of departure to work in Wrightsville borough are 5:00 AM to 5:29 AM (87, 15.6%) for males and 7:00 AM to 7:29 AM (118, 22.8%) for females.
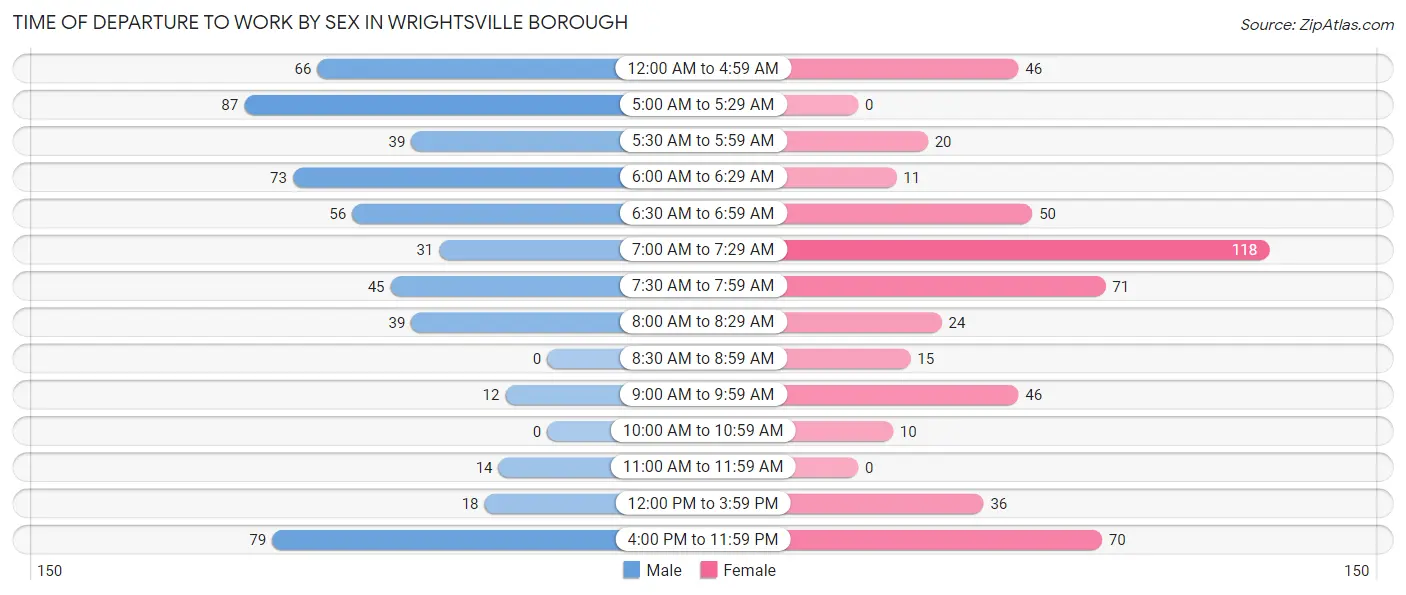
| Time of Departure | Male | Female |
| 12:00 AM to 4:59 AM | 66 (11.8%) | 46 (8.9%) |
| 5:00 AM to 5:29 AM | 87 (15.6%) | 0 (0.0%) |
| 5:30 AM to 5:59 AM | 39 (7.0%) | 20 (3.9%) |
| 6:00 AM to 6:29 AM | 73 (13.1%) | 11 (2.1%) |
| 6:30 AM to 6:59 AM | 56 (10.0%) | 50 (9.7%) |
| 7:00 AM to 7:29 AM | 31 (5.6%) | 118 (22.8%) |
| 7:30 AM to 7:59 AM | 45 (8.1%) | 71 (13.7%) |
| 8:00 AM to 8:29 AM | 39 (7.0%) | 24 (4.6%) |
| 8:30 AM to 8:59 AM | 0 (0.0%) | 15 (2.9%) |
| 9:00 AM to 9:59 AM | 12 (2.1%) | 46 (8.9%) |
| 10:00 AM to 10:59 AM | 0 (0.0%) | 10 (1.9%) |
| 11:00 AM to 11:59 AM | 14 (2.5%) | 0 (0.0%) |
| 12:00 PM to 3:59 PM | 18 (3.2%) | 36 (7.0%) |
| 4:00 PM to 11:59 PM | 79 (14.1%) | 70 (13.5%) |
| Total | 559 (100.0%) | 517 (100.0%) |
Housing Occupancy in Wrightsville borough
Occupancy by Ownership in Wrightsville borough
Of the total 855 dwellings in Wrightsville borough, owner-occupied units account for 604 (70.6%), while renter-occupied units make up 251 (29.4%).
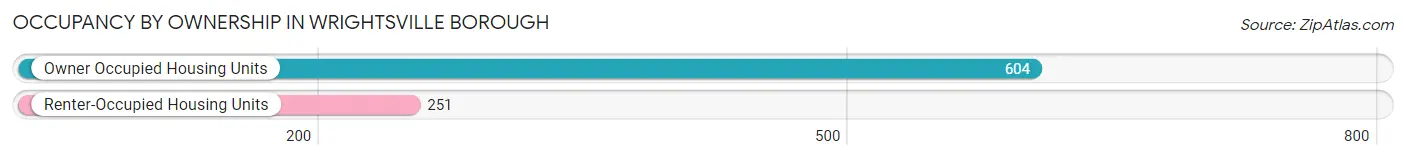
| Occupancy | # Housing Units | % Housing Units |
| Owner Occupied Housing Units | 604 | 70.6% |
| Renter-Occupied Housing Units | 251 | 29.4% |
| Total Occupied Housing Units | 855 | 100.0% |
Occupancy by Household Size in Wrightsville borough
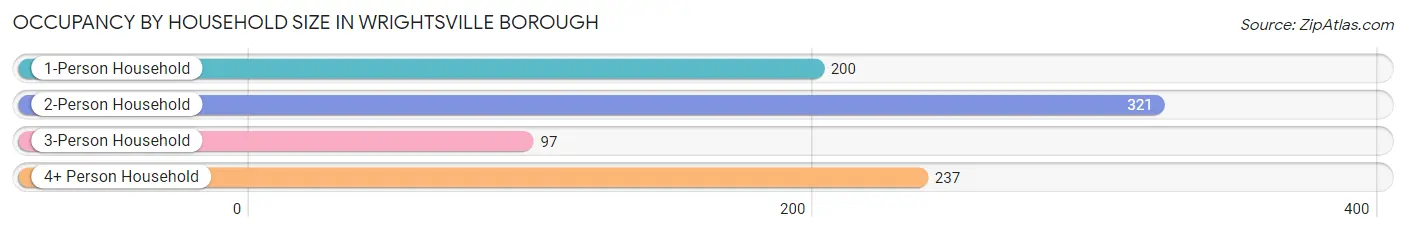
| Household Size | # Housing Units | % Housing Units |
| 1-Person Household | 200 | 23.4% |
| 2-Person Household | 321 | 37.5% |
| 3-Person Household | 97 | 11.4% |
| 4+ Person Household | 237 | 27.7% |
| Total Housing Units | 855 | 100.0% |
Occupancy by Ownership by Household Size in Wrightsville borough
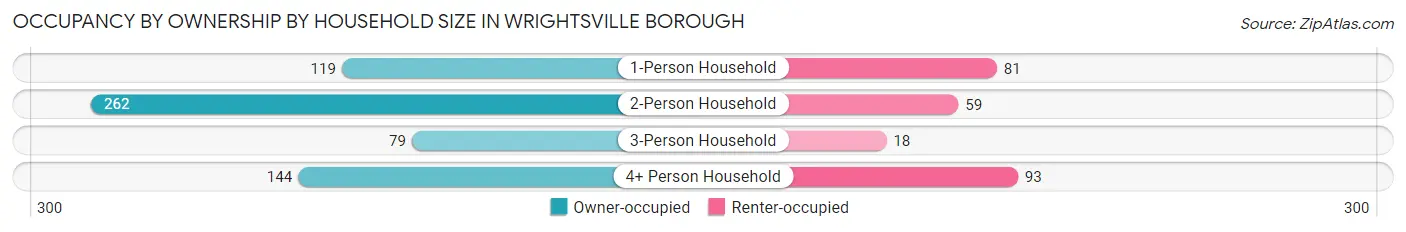
| Household Size | Owner-occupied | Renter-occupied |
| 1-Person Household | 119 (59.5%) | 81 (40.5%) |
| 2-Person Household | 262 (81.6%) | 59 (18.4%) |
| 3-Person Household | 79 (81.4%) | 18 (18.6%) |
| 4+ Person Household | 144 (60.8%) | 93 (39.2%) |
| Total Housing Units | 604 (70.6%) | 251 (29.4%) |
Occupancy by Educational Attainment in Wrightsville borough
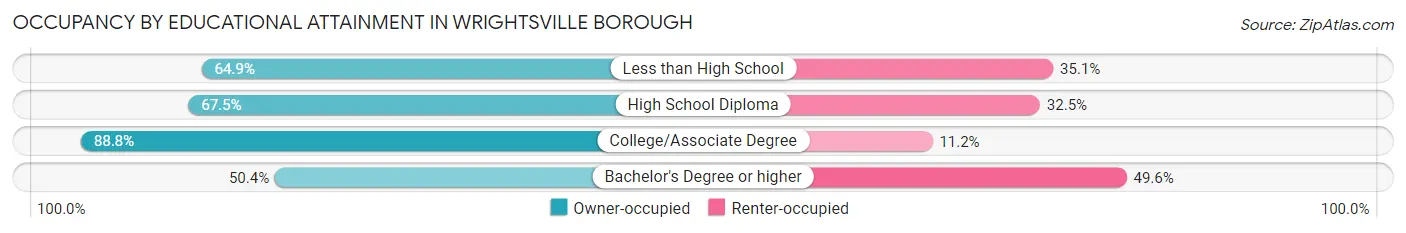
| Household Size | Owner-occupied | Renter-occupied |
| Less than High School | 37 (64.9%) | 20 (35.1%) |
| High School Diploma | 283 (67.5%) | 136 (32.5%) |
| College/Associate Degree | 215 (88.8%) | 27 (11.2%) |
| Bachelor's Degree or higher | 69 (50.4%) | 68 (49.6%) |
Occupancy by Age of Householder in Wrightsville borough
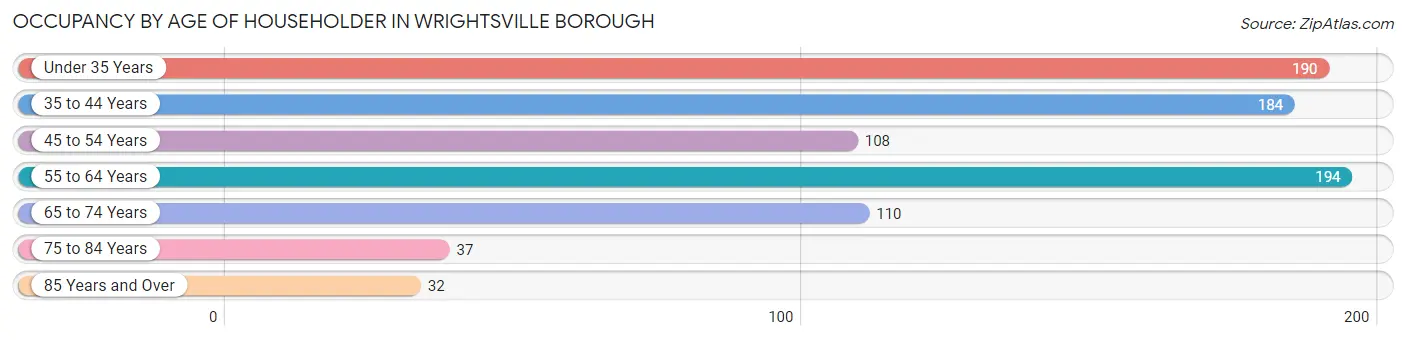
| Age Bracket | # Households | % Households |
| Under 35 Years | 190 | 22.2% |
| 35 to 44 Years | 184 | 21.5% |
| 45 to 54 Years | 108 | 12.6% |
| 55 to 64 Years | 194 | 22.7% |
| 65 to 74 Years | 110 | 12.9% |
| 75 to 84 Years | 37 | 4.3% |
| 85 Years and Over | 32 | 3.7% |
| Total | 855 | 100.0% |
Housing Finances in Wrightsville borough
Median Income by Occupancy in Wrightsville borough
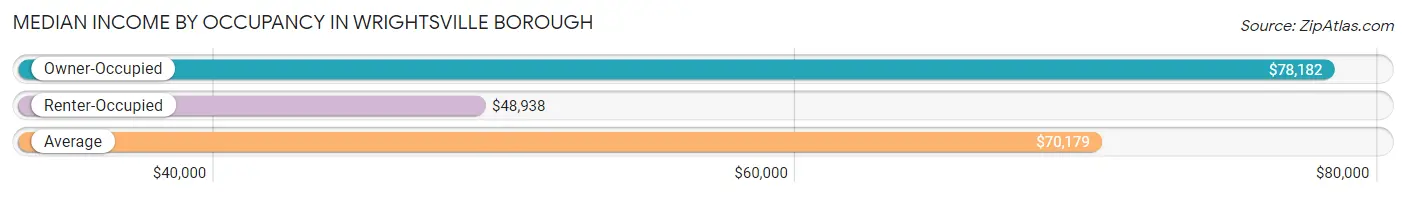
| Occupancy Type | # Households | Median Income |
| Owner-Occupied | 604 (70.6%) | $78,182 |
| Renter-Occupied | 251 (29.4%) | $48,938 |
| Average | 855 (100.0%) | $70,179 |
Occupancy by Householder Income Bracket in Wrightsville borough
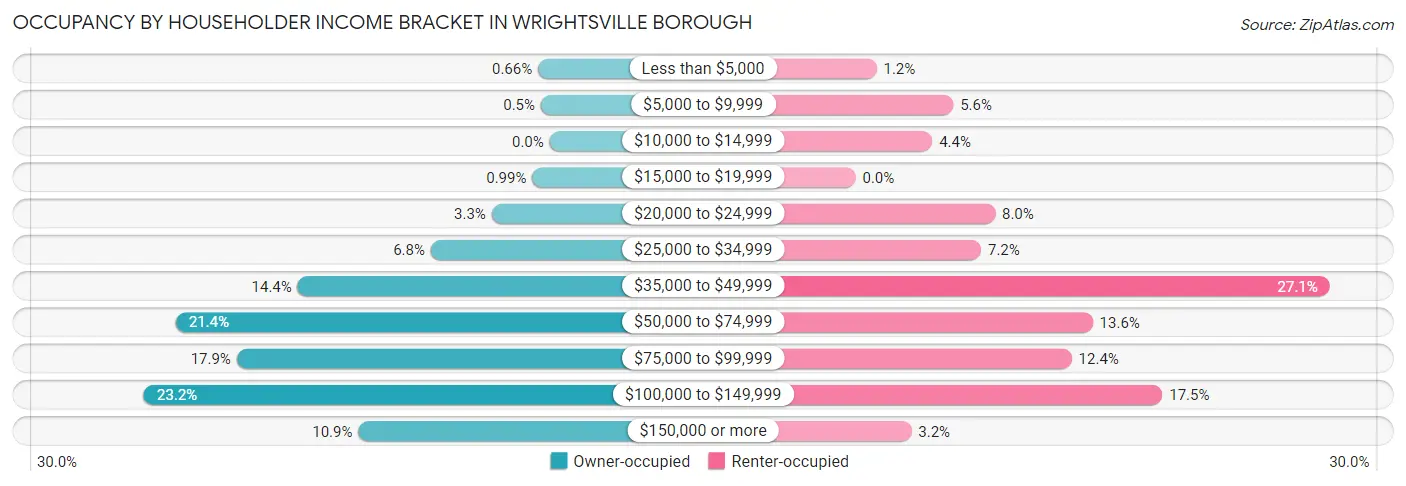
| Income Bracket | Owner-occupied | Renter-occupied |
| Less than $5,000 | 4 (0.7%) | 3 (1.2%) |
| $5,000 to $9,999 | 3 (0.5%) | 14 (5.6%) |
| $10,000 to $14,999 | 0 (0.0%) | 11 (4.4%) |
| $15,000 to $19,999 | 6 (1.0%) | 0 (0.0%) |
| $20,000 to $24,999 | 20 (3.3%) | 20 (8.0%) |
| $25,000 to $34,999 | 41 (6.8%) | 18 (7.2%) |
| $35,000 to $49,999 | 87 (14.4%) | 68 (27.1%) |
| $50,000 to $74,999 | 129 (21.4%) | 34 (13.6%) |
| $75,000 to $99,999 | 108 (17.9%) | 31 (12.3%) |
| $100,000 to $149,999 | 140 (23.2%) | 44 (17.5%) |
| $150,000 or more | 66 (10.9%) | 8 (3.2%) |
| Total | 604 (100.0%) | 251 (100.0%) |
Monthly Housing Cost Tiers in Wrightsville borough
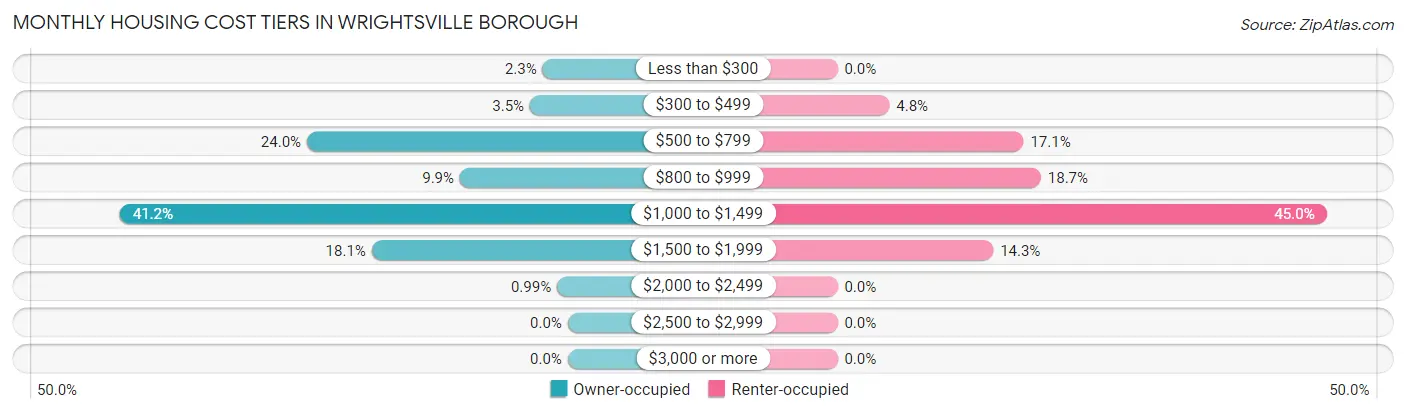
| Monthly Cost | Owner-occupied | Renter-occupied |
| Less than $300 | 14 (2.3%) | 0 (0.0%) |
| $300 to $499 | 21 (3.5%) | 12 (4.8%) |
| $500 to $799 | 145 (24.0%) | 43 (17.1%) |
| $800 to $999 | 60 (9.9%) | 47 (18.7%) |
| $1,000 to $1,499 | 249 (41.2%) | 113 (45.0%) |
| $1,500 to $1,999 | 109 (18.0%) | 36 (14.3%) |
| $2,000 to $2,499 | 6 (1.0%) | 0 (0.0%) |
| $2,500 to $2,999 | 0 (0.0%) | 0 (0.0%) |
| $3,000 or more | 0 (0.0%) | 0 (0.0%) |
| Total | 604 (100.0%) | 251 (100.0%) |
Physical Housing Characteristics in Wrightsville borough
Housing Structures in Wrightsville borough
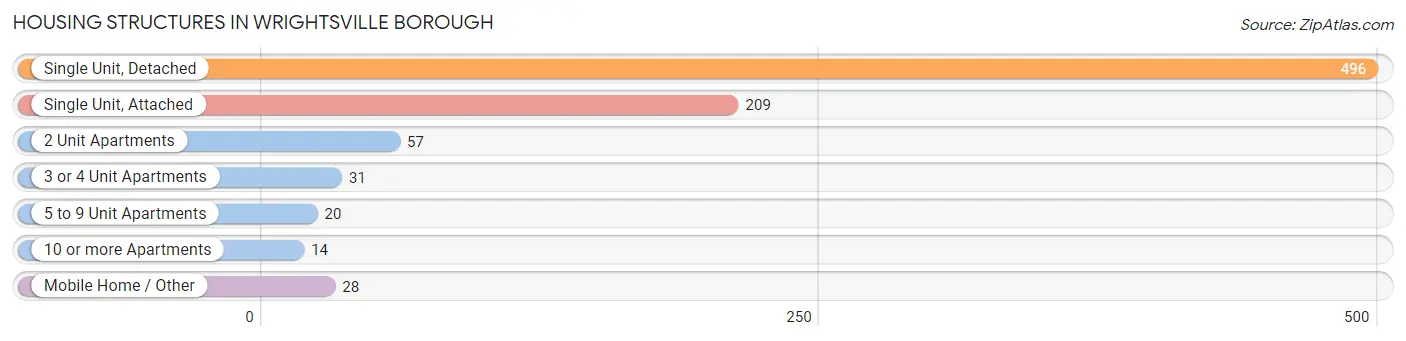
| Structure Type | # Housing Units | % Housing Units |
| Single Unit, Detached | 496 | 58.0% |
| Single Unit, Attached | 209 | 24.4% |
| 2 Unit Apartments | 57 | 6.7% |
| 3 or 4 Unit Apartments | 31 | 3.6% |
| 5 to 9 Unit Apartments | 20 | 2.3% |
| 10 or more Apartments | 14 | 1.6% |
| Mobile Home / Other | 28 | 3.3% |
| Total | 855 | 100.0% |
Housing Structures by Occupancy in Wrightsville borough
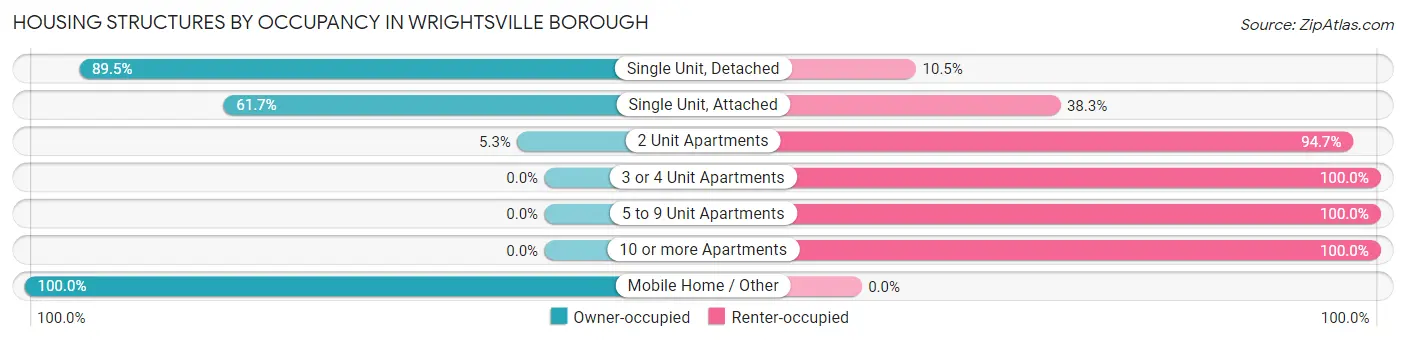
| Structure Type | Owner-occupied | Renter-occupied |
| Single Unit, Detached | 444 (89.5%) | 52 (10.5%) |
| Single Unit, Attached | 129 (61.7%) | 80 (38.3%) |
| 2 Unit Apartments | 3 (5.3%) | 54 (94.7%) |
| 3 or 4 Unit Apartments | 0 (0.0%) | 31 (100.0%) |
| 5 to 9 Unit Apartments | 0 (0.0%) | 20 (100.0%) |
| 10 or more Apartments | 0 (0.0%) | 14 (100.0%) |
| Mobile Home / Other | 28 (100.0%) | 0 (0.0%) |
| Total | 604 (70.6%) | 251 (29.4%) |
Housing Structures by Number of Rooms in Wrightsville borough
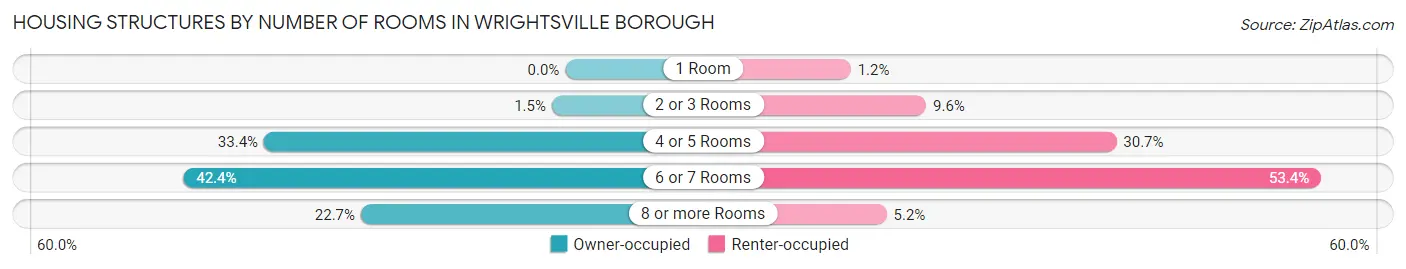
| Number of Rooms | Owner-occupied | Renter-occupied |
| 1 Room | 0 (0.0%) | 3 (1.2%) |
| 2 or 3 Rooms | 9 (1.5%) | 24 (9.6%) |
| 4 or 5 Rooms | 202 (33.4%) | 77 (30.7%) |
| 6 or 7 Rooms | 256 (42.4%) | 134 (53.4%) |
| 8 or more Rooms | 137 (22.7%) | 13 (5.2%) |
| Total | 604 (100.0%) | 251 (100.0%) |
Housing Structure by Heating Type in Wrightsville borough
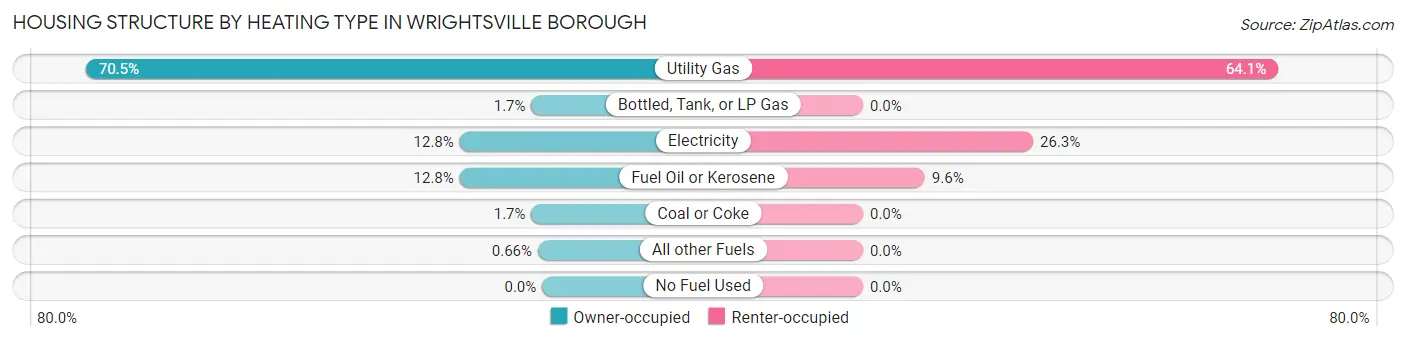
| Heating Type | Owner-occupied | Renter-occupied |
| Utility Gas | 426 (70.5%) | 161 (64.1%) |
| Bottled, Tank, or LP Gas | 10 (1.7%) | 0 (0.0%) |
| Electricity | 77 (12.8%) | 66 (26.3%) |
| Fuel Oil or Kerosene | 77 (12.8%) | 24 (9.6%) |
| Coal or Coke | 10 (1.7%) | 0 (0.0%) |
| All other Fuels | 4 (0.7%) | 0 (0.0%) |
| No Fuel Used | 0 (0.0%) | 0 (0.0%) |
| Total | 604 (100.0%) | 251 (100.0%) |
Household Vehicle Usage in Wrightsville borough
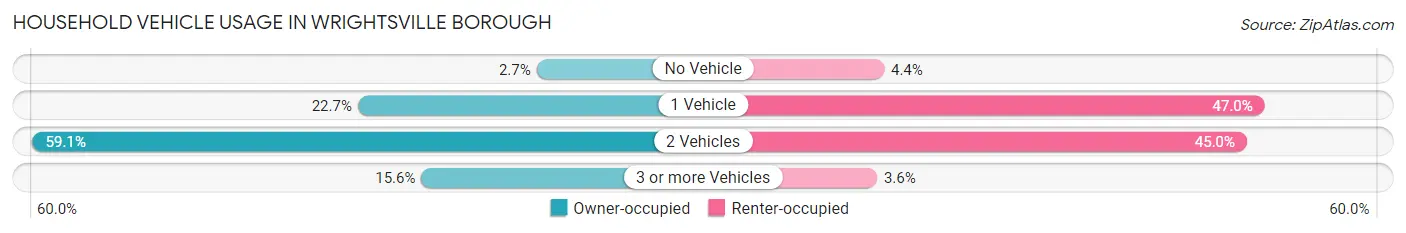
| Vehicles per Household | Owner-occupied | Renter-occupied |
| No Vehicle | 16 (2.6%) | 11 (4.4%) |
| 1 Vehicle | 137 (22.7%) | 118 (47.0%) |
| 2 Vehicles | 357 (59.1%) | 113 (45.0%) |
| 3 or more Vehicles | 94 (15.6%) | 9 (3.6%) |
| Total | 604 (100.0%) | 251 (100.0%) |
Real Estate & Mortgages in Wrightsville borough
Real Estate and Mortgage Overview in Wrightsville borough
| Characteristic | Without Mortgage | With Mortgage |
| Housing Units | 217 | 387 |
| Median Property Value | $157,800 | $160,300 |
| Median Household Income | $59,563 | $38 |
| Monthly Housing Costs | $658 | $0 |
| Real Estate Taxes | $3,230 | $24 |
Property Value by Mortgage Status in Wrightsville borough
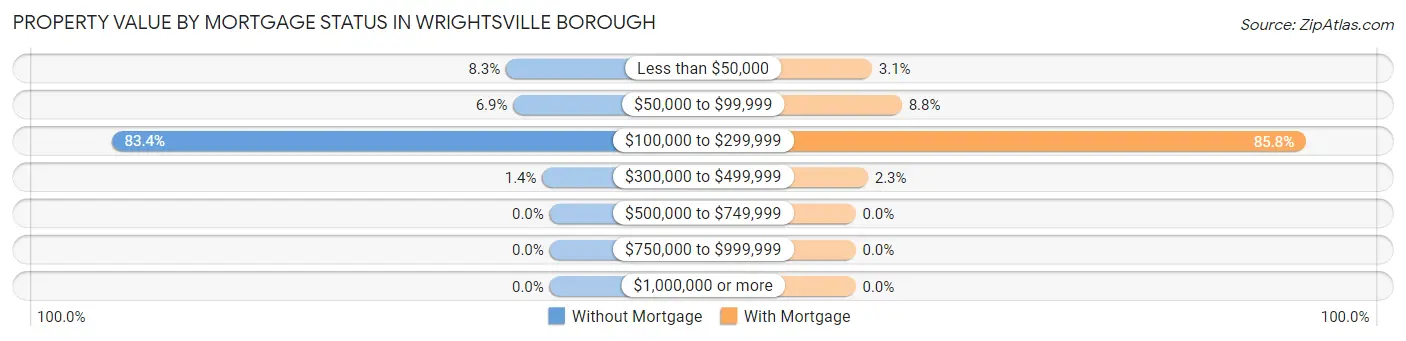
| Property Value | Without Mortgage | With Mortgage |
| Less than $50,000 | 18 (8.3%) | 12 (3.1%) |
| $50,000 to $99,999 | 15 (6.9%) | 34 (8.8%) |
| $100,000 to $299,999 | 181 (83.4%) | 332 (85.8%) |
| $300,000 to $499,999 | 3 (1.4%) | 9 (2.3%) |
| $500,000 to $749,999 | 0 (0.0%) | 0 (0.0%) |
| $750,000 to $999,999 | 0 (0.0%) | 0 (0.0%) |
| $1,000,000 or more | 0 (0.0%) | 0 (0.0%) |
| Total | 217 (100.0%) | 387 (100.0%) |
Household Income by Mortgage Status in Wrightsville borough
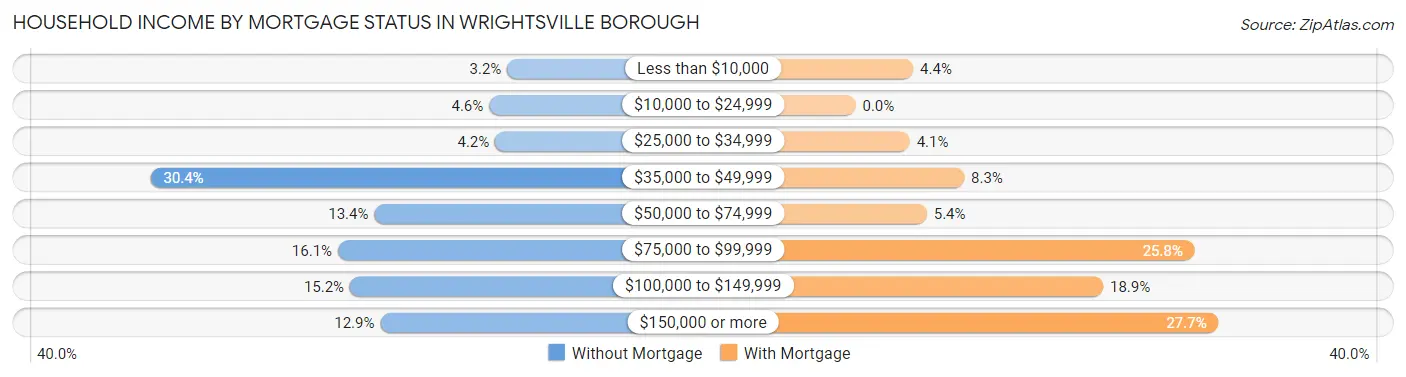
| Household Income | Without Mortgage | With Mortgage |
| Less than $10,000 | 7 (3.2%) | 17 (4.4%) |
| $10,000 to $24,999 | 10 (4.6%) | 0 (0.0%) |
| $25,000 to $34,999 | 9 (4.2%) | 16 (4.1%) |
| $35,000 to $49,999 | 66 (30.4%) | 32 (8.3%) |
| $50,000 to $74,999 | 29 (13.4%) | 21 (5.4%) |
| $75,000 to $99,999 | 35 (16.1%) | 100 (25.8%) |
| $100,000 to $149,999 | 33 (15.2%) | 73 (18.9%) |
| $150,000 or more | 28 (12.9%) | 107 (27.7%) |
| Total | 217 (100.0%) | 387 (100.0%) |
Property Value to Household Income Ratio in Wrightsville borough
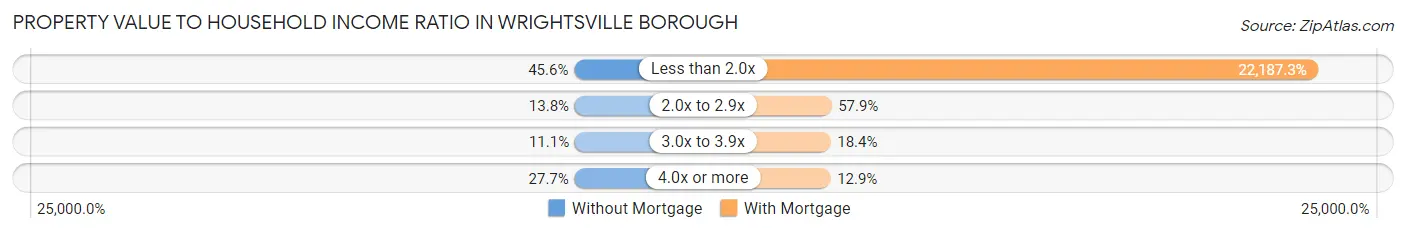
| Value-to-Income Ratio | Without Mortgage | With Mortgage |
| Less than 2.0x | 99 (45.6%) | 85,865 (22,187.3%) |
| 2.0x to 2.9x | 30 (13.8%) | 224 (57.9%) |
| 3.0x to 3.9x | 24 (11.1%) | 71 (18.3%) |
| 4.0x or more | 60 (27.7%) | 50 (12.9%) |
| Total | 217 (100.0%) | 387 (100.0%) |
Real Estate Taxes by Mortgage Status in Wrightsville borough
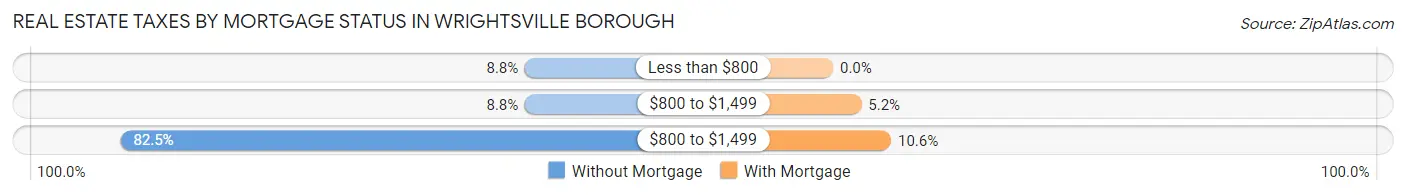
| Property Taxes | Without Mortgage | With Mortgage |
| Less than $800 | 19 (8.8%) | 0 (0.0%) |
| $800 to $1,499 | 19 (8.8%) | 20 (5.2%) |
| $800 to $1,499 | 179 (82.5%) | 41 (10.6%) |
| Total | 217 (100.0%) | 387 (100.0%) |
Health & Disability in Wrightsville borough
Health Insurance Coverage by Age in Wrightsville borough
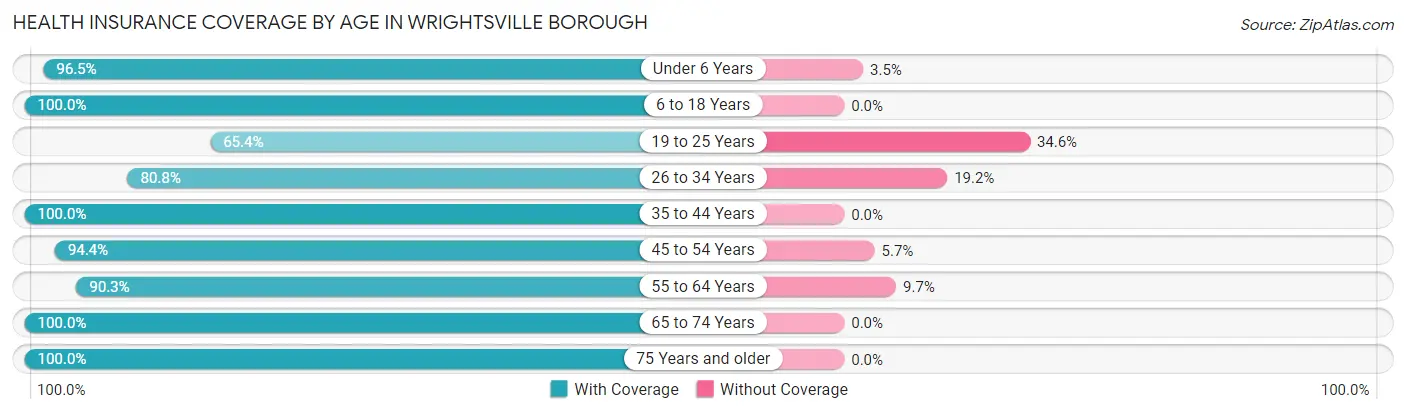
| Age Bracket | With Coverage | Without Coverage |
| Under 6 Years | 220 (96.5%) | 8 (3.5%) |
| 6 to 18 Years | 341 (100.0%) | 0 (0.0%) |
| 19 to 25 Years | 68 (65.4%) | 36 (34.6%) |
| 26 to 34 Years | 320 (80.8%) | 76 (19.2%) |
| 35 to 44 Years | 316 (100.0%) | 0 (0.0%) |
| 45 to 54 Years | 167 (94.4%) | 10 (5.7%) |
| 55 to 64 Years | 290 (90.3%) | 31 (9.7%) |
| 65 to 74 Years | 215 (100.0%) | 0 (0.0%) |
| 75 Years and older | 106 (100.0%) | 0 (0.0%) |
| Total | 2,043 (92.7%) | 161 (7.3%) |
Health Insurance Coverage by Citizenship Status in Wrightsville borough
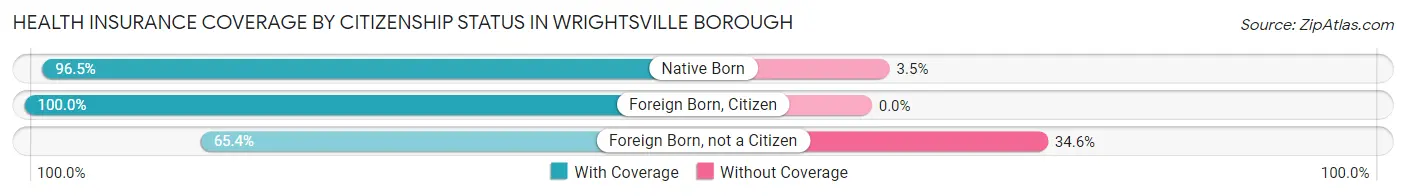
| Citizenship Status | With Coverage | Without Coverage |
| Native Born | 220 (96.5%) | 8 (3.5%) |
| Foreign Born, Citizen | 341 (100.0%) | 0 (0.0%) |
| Foreign Born, not a Citizen | 68 (65.4%) | 36 (34.6%) |
Health Insurance Coverage by Household Income in Wrightsville borough
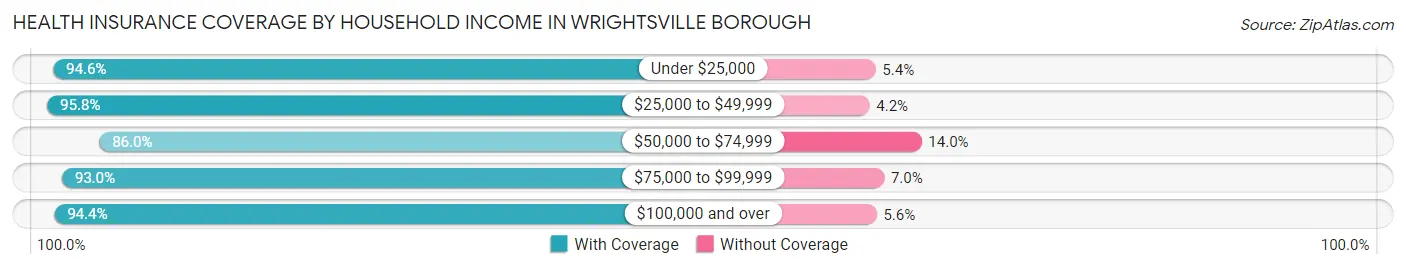
| Household Income | With Coverage | Without Coverage |
| Under $25,000 | 159 (94.6%) | 9 (5.4%) |
| $25,000 to $49,999 | 431 (95.8%) | 19 (4.2%) |
| $50,000 to $74,999 | 400 (86.0%) | 65 (14.0%) |
| $75,000 to $99,999 | 374 (93.0%) | 28 (7.0%) |
| $100,000 and over | 679 (94.4%) | 40 (5.6%) |
Public vs Private Health Insurance Coverage by Age in Wrightsville borough
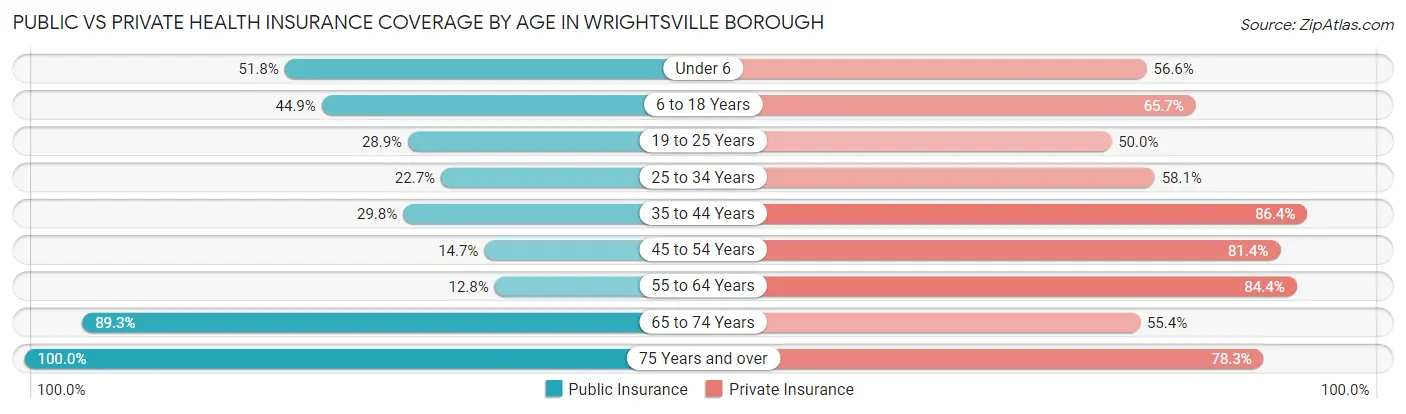
| Age Bracket | Public Insurance | Private Insurance |
| Under 6 | 118 (51.7%) | 129 (56.6%) |
| 6 to 18 Years | 153 (44.9%) | 224 (65.7%) |
| 19 to 25 Years | 30 (28.8%) | 52 (50.0%) |
| 25 to 34 Years | 90 (22.7%) | 230 (58.1%) |
| 35 to 44 Years | 94 (29.7%) | 273 (86.4%) |
| 45 to 54 Years | 26 (14.7%) | 144 (81.4%) |
| 55 to 64 Years | 41 (12.8%) | 271 (84.4%) |
| 65 to 74 Years | 192 (89.3%) | 119 (55.3%) |
| 75 Years and over | 106 (100.0%) | 83 (78.3%) |
| Total | 850 (38.6%) | 1,525 (69.2%) |
Disability Status by Sex by Age in Wrightsville borough
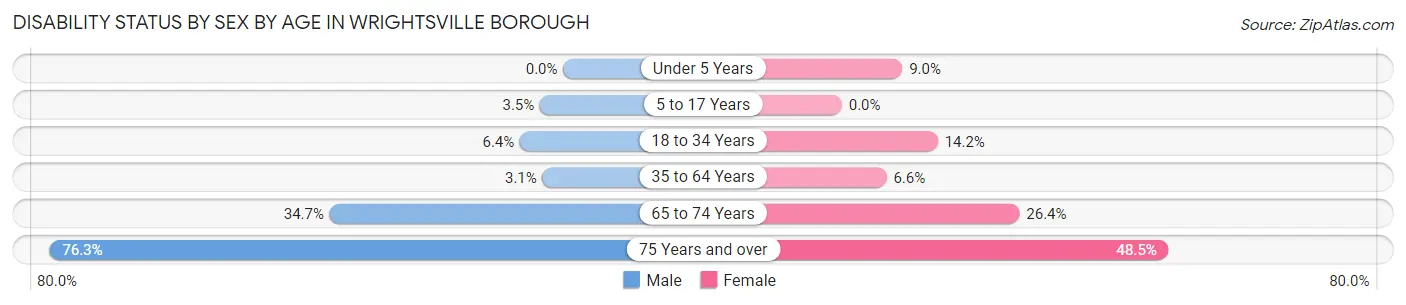
| Age Bracket | Male | Female |
| Under 5 Years | 0 (0.0%) | 7 (9.0%) |
| 5 to 17 Years | 5 (3.5%) | 0 (0.0%) |
| 18 to 34 Years | 14 (6.4%) | 41 (14.2%) |
| 35 to 64 Years | 13 (3.1%) | 26 (6.6%) |
| 65 to 74 Years | 43 (34.7%) | 24 (26.4%) |
| 75 Years and over | 29 (76.3%) | 33 (48.5%) |
Disability Class by Sex by Age in Wrightsville borough
Disability Class: Hearing Difficulty
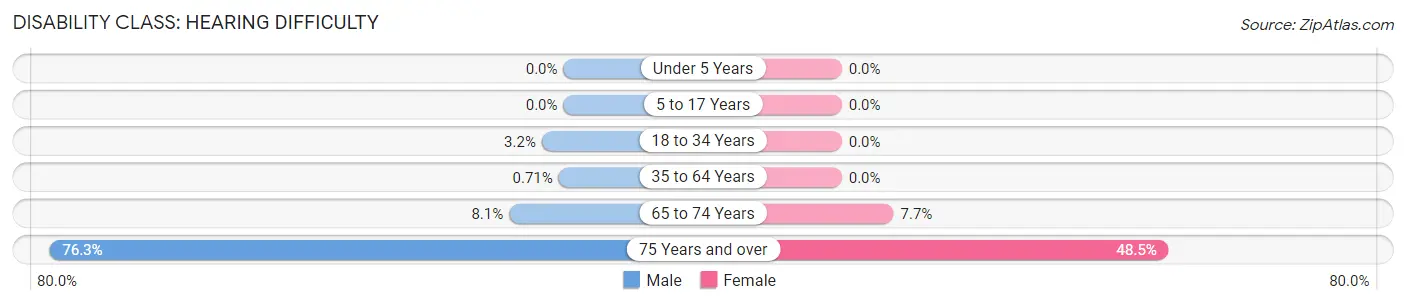
| Age Bracket | Male | Female |
| Under 5 Years | 0 (0.0%) | 0 (0.0%) |
| 5 to 17 Years | 0 (0.0%) | 0 (0.0%) |
| 18 to 34 Years | 7 (3.2%) | 0 (0.0%) |
| 35 to 64 Years | 3 (0.7%) | 0 (0.0%) |
| 65 to 74 Years | 10 (8.1%) | 7 (7.7%) |
| 75 Years and over | 29 (76.3%) | 33 (48.5%) |
Disability Class: Vision Difficulty
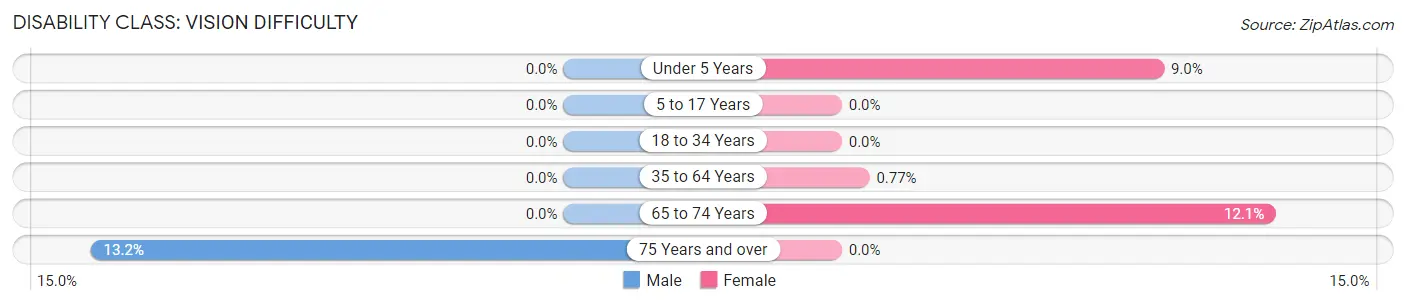
| Age Bracket | Male | Female |
| Under 5 Years | 0 (0.0%) | 7 (9.0%) |
| 5 to 17 Years | 0 (0.0%) | 0 (0.0%) |
| 18 to 34 Years | 0 (0.0%) | 0 (0.0%) |
| 35 to 64 Years | 0 (0.0%) | 3 (0.8%) |
| 65 to 74 Years | 0 (0.0%) | 11 (12.1%) |
| 75 Years and over | 5 (13.2%) | 0 (0.0%) |
Disability Class: Cognitive Difficulty
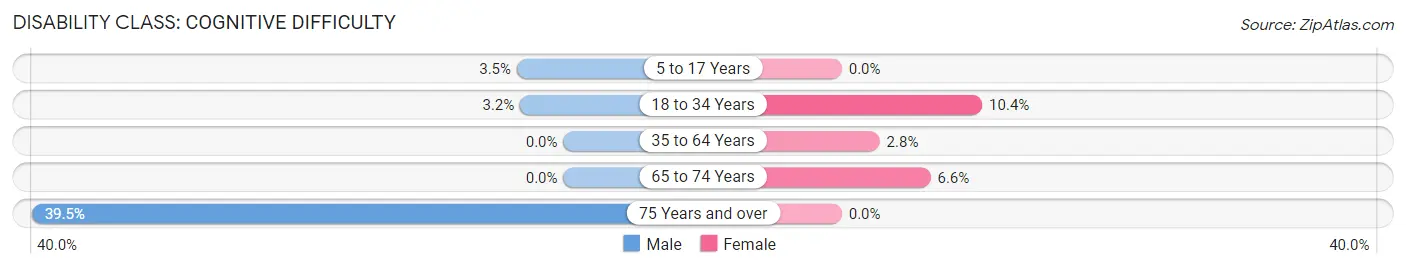
| Age Bracket | Male | Female |
| 5 to 17 Years | 5 (3.5%) | 0 (0.0%) |
| 18 to 34 Years | 7 (3.2%) | 30 (10.4%) |
| 35 to 64 Years | 0 (0.0%) | 11 (2.8%) |
| 65 to 74 Years | 0 (0.0%) | 6 (6.6%) |
| 75 Years and over | 15 (39.5%) | 0 (0.0%) |
Disability Class: Ambulatory Difficulty
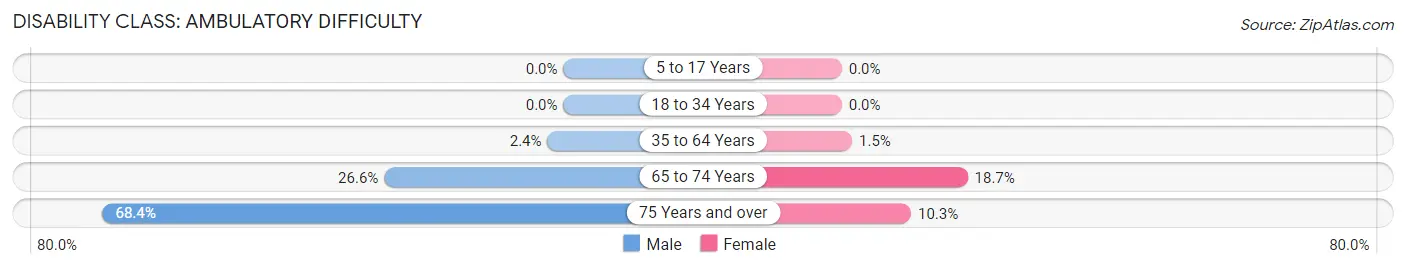
| Age Bracket | Male | Female |
| 5 to 17 Years | 0 (0.0%) | 0 (0.0%) |
| 18 to 34 Years | 0 (0.0%) | 0 (0.0%) |
| 35 to 64 Years | 10 (2.4%) | 6 (1.5%) |
| 65 to 74 Years | 33 (26.6%) | 17 (18.7%) |
| 75 Years and over | 26 (68.4%) | 7 (10.3%) |
Disability Class: Self-Care Difficulty
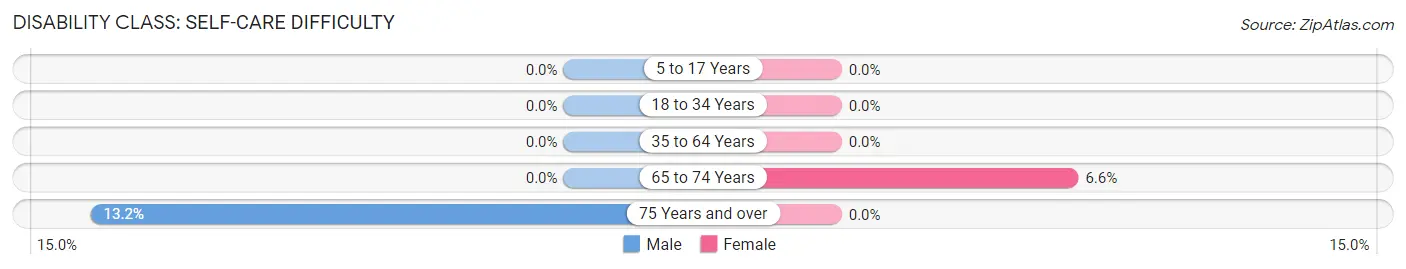
| Age Bracket | Male | Female |
| 5 to 17 Years | 0 (0.0%) | 0 (0.0%) |
| 18 to 34 Years | 0 (0.0%) | 0 (0.0%) |
| 35 to 64 Years | 0 (0.0%) | 0 (0.0%) |
| 65 to 74 Years | 0 (0.0%) | 6 (6.6%) |
| 75 Years and over | 5 (13.2%) | 0 (0.0%) |
Technology Access in Wrightsville borough
Computing Device Access in Wrightsville borough
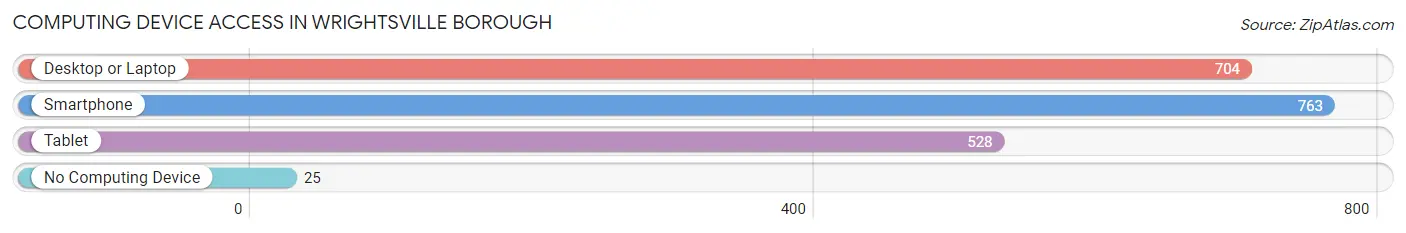
| Device Type | # Households | % Households |
| Desktop or Laptop | 704 | 82.3% |
| Smartphone | 763 | 89.2% |
| Tablet | 528 | 61.8% |
| No Computing Device | 25 | 2.9% |
| Total | 855 | 100.0% |
Internet Access in Wrightsville borough
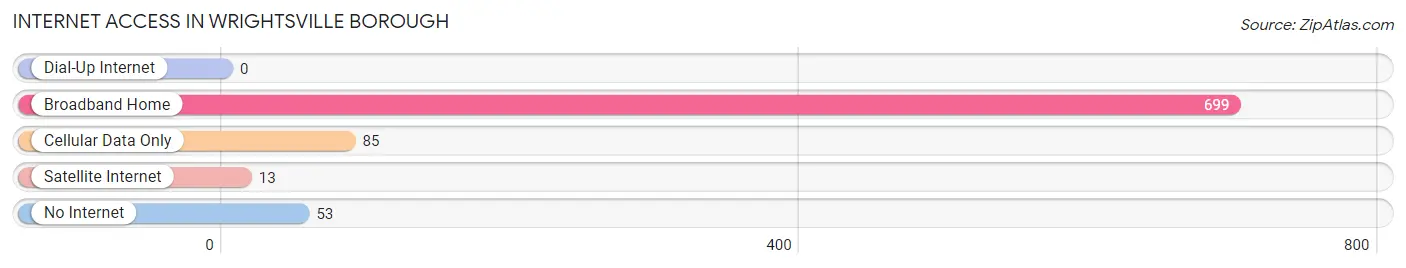
| Internet Type | # Households | % Households |
| Dial-Up Internet | 0 | 0.0% |
| Broadband Home | 699 | 81.8% |
| Cellular Data Only | 85 | 9.9% |
| Satellite Internet | 13 | 1.5% |
| No Internet | 53 | 6.2% |
| Total | 855 | 100.0% |
Wrightsville borough Summary
Wrightsville Borough is a small borough located in York County, Pennsylvania. It is situated along the Susquehanna River, just south of the city of York. The borough was incorporated in 1851 and has a population of approximately 2,000 people.
History
Wrightsville Borough was first settled in 1730 by a group of German immigrants. The town was originally known as “Wright’s Ferry”, named after the ferry service that operated across the Susquehanna River. The ferry service was operated by the Wright family, who were the first settlers in the area. The town was officially incorporated in 1851 and was named after the Wright family.
In the late 19th century, the town was a major hub for the Pennsylvania Railroad. The railroad provided transportation for goods and passengers to and from the town. The railroad also provided employment for many of the town’s residents.
In the early 20th century, the town was a major center for the production of silk. The silk industry provided employment for many of the town’s residents. The town also had a thriving shipbuilding industry, which provided employment for many of the town’s residents.
Geography
Wrightsville Borough is located in York County, Pennsylvania. It is situated along the Susquehanna River, just south of the city of York. The borough is located in the Susquehanna Valley, which is a major agricultural region. The borough is located in a rural area, with rolling hills and farmland.
The borough is located in a humid continental climate zone, with hot summers and cold winters. The average annual temperature is around 50 degrees Fahrenheit. The average annual precipitation is around 40 inches.
Economy
The economy of Wrightsville Borough is largely based on agriculture and manufacturing. The town is home to several farms, which produce a variety of crops, including corn, soybeans, and wheat. The town also has several manufacturing plants, which produce a variety of products, including furniture, clothing, and electronics.
The town also has a thriving tourism industry. The town is home to several historic sites, including the Wright’s Ferry Mansion and the Susquehanna River Museum. The town also has several parks and recreational areas, including the Susquehanna River Trail and the Wrightsville Beach.
Demographics
As of the 2010 census, the population of Wrightsville Borough was 2,000 people. The racial makeup of the town was 97.5% White, 0.5% African American, 0.5% Native American, 0.5% Asian, and 1.0% from other races. The median household income was $41,250, and the median family income was $50,000.
The town has a large number of elderly residents, with nearly 20% of the population over the age of 65. The town also has a large number of children, with nearly 30% of the population under the age of 18. The town has a low unemployment rate, with only 4.5% of the population unemployed.
Conclusion
Wrightsville Borough is a small borough located in York County, Pennsylvania. It is situated along the Susquehanna River, just south of the city of York. The borough was incorporated in 1851 and has a population of approximately 2,000 people. The economy of the town is largely based on agriculture and manufacturing, and the town also has a thriving tourism industry. The town has a diverse population, with a large number of elderly and children. The town has a low unemployment rate, and the median household income is around $41,250.
Common Questions
What is Per Capita Income in Wrightsville borough?
Per Capita income in Wrightsville borough is $31,783.
What is the Median Family Income in Wrightsville borough?
Median Family Income in Wrightsville borough is $86,000.
What is the Median Household income in Wrightsville borough?
Median Household Income in Wrightsville borough is $70,179.
What is Income or Wage Gap in Wrightsville borough?
Income or Wage Gap in Wrightsville borough is 21.3%.
Women in Wrightsville borough earn 78.7 cents for every dollar earned by a man.
What is Family Income Deficit in Wrightsville borough?
Family Income Deficit in Wrightsville borough is $12,504.
Families that are below poverty line in Wrightsville borough earn $12,504 less on average than the poverty threshold level.
What is Inequality or Gini Index in Wrightsville borough?
Inequality or Gini Index in Wrightsville borough is 0.33.
What is the Total Population of Wrightsville borough?
Total Population of Wrightsville borough is 2,204.
What is the Total Male Population of Wrightsville borough?
Total Male Population of Wrightsville borough is 1,082.
What is the Total Female Population of Wrightsville borough?
Total Female Population of Wrightsville borough is 1,122.
What is the Ratio of Males per 100 Females in Wrightsville borough?
There are 96.43 Males per 100 Females in Wrightsville borough.
What is the Ratio of Females per 100 Males in Wrightsville borough?
There are 103.70 Females per 100 Males in Wrightsville borough.
What is the Median Population Age in Wrightsville borough?
Median Population Age in Wrightsville borough is 36.3 Years.
What is the Average Family Size in Wrightsville borough
Average Family Size in Wrightsville borough is 3.0 People.
What is the Average Household Size in Wrightsville borough
Average Household Size in Wrightsville borough is 2.6 People.
How Large is the Labor Force in Wrightsville borough?
There are 1,183 People in the Labor Forcein in Wrightsville borough.
What is the Percentage of People in the Labor Force in Wrightsville borough?
71.8% of People are in the Labor Force in Wrightsville borough.
What is the Unemployment Rate in Wrightsville borough?
Unemployment Rate in Wrightsville borough is 3.0%.