Rose Valley borough, PA Map & Demographics
Rose Valley borough Overview
$103,224
PER CAPITA INCOME
$250,001
AVG FAMILY INCOME
$250,001
AVG HOUSEHOLD INCOME
38.8%
WAGE / INCOME GAP [ % ]
61.2¢/ $1
WAGE / INCOME GAP [ $ ]
0.45
INEQUALITY / GINI INDEX
1,187
TOTAL POPULATION
587
MALE POPULATION
600
FEMALE POPULATION
97.83
MALES / 100 FEMALES
102.21
FEMALES / 100 MALES
41.5
MEDIAN AGE
3.3
AVG FAMILY SIZE
3.1
AVG HOUSEHOLD SIZE
528
LABOR FORCE [ PEOPLE ]
62.6%
PERCENT IN LABOR FORCE
1.1%
UNEMPLOYMENT RATE
Income in Rose Valley borough
Income Overview in Rose Valley borough
Per Capita Income in Rose Valley borough is $103,224, while median incomes of families and households are $250,001 and $250,001 respectively.
| Characteristic | Number | Measure |
| Per Capita Income | 1,187 | $103,224 |
| Median Family Income | 334 | $250,001 |
| Mean Family Income | 334 | $350,291 |
| Median Household Income | 385 | $250,001 |
| Mean Household Income | 385 | $320,162 |
| Income Deficit | 334 | $0 |
| Wage / Income Gap (%) | 1,187 | 38.80% |
| Wage / Income Gap ($) | 1,187 | 61.20¢ per $1 |
| Gini / Inequality Index | 1,187 | 0.45 |
Earnings by Sex in Rose Valley borough
Average Earnings in Rose Valley borough are $87,443, $120,000 for men and $73,438 for women, a difference of 38.8%.
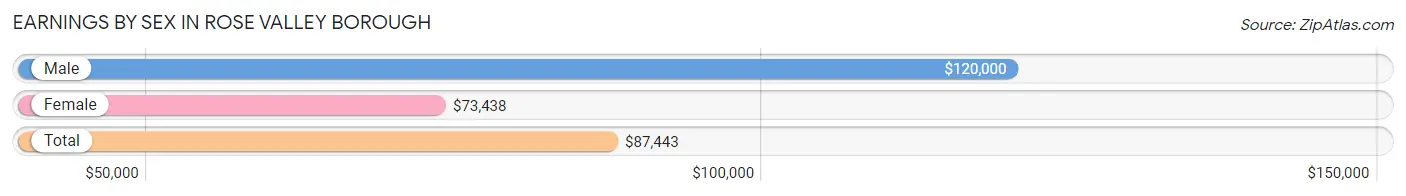
| Sex | Number | Average Earnings |
| Male | 322 (57.0%) | $120,000 |
| Female | 243 (43.0%) | $73,438 |
| Total | 565 (100.0%) | $87,443 |
Earnings by Sex by Income Bracket in Rose Valley borough
The most common earnings brackets in Rose Valley borough are $100,000+ for men (175 | 54.3%) and $100,000+ for women (95 | 39.1%).
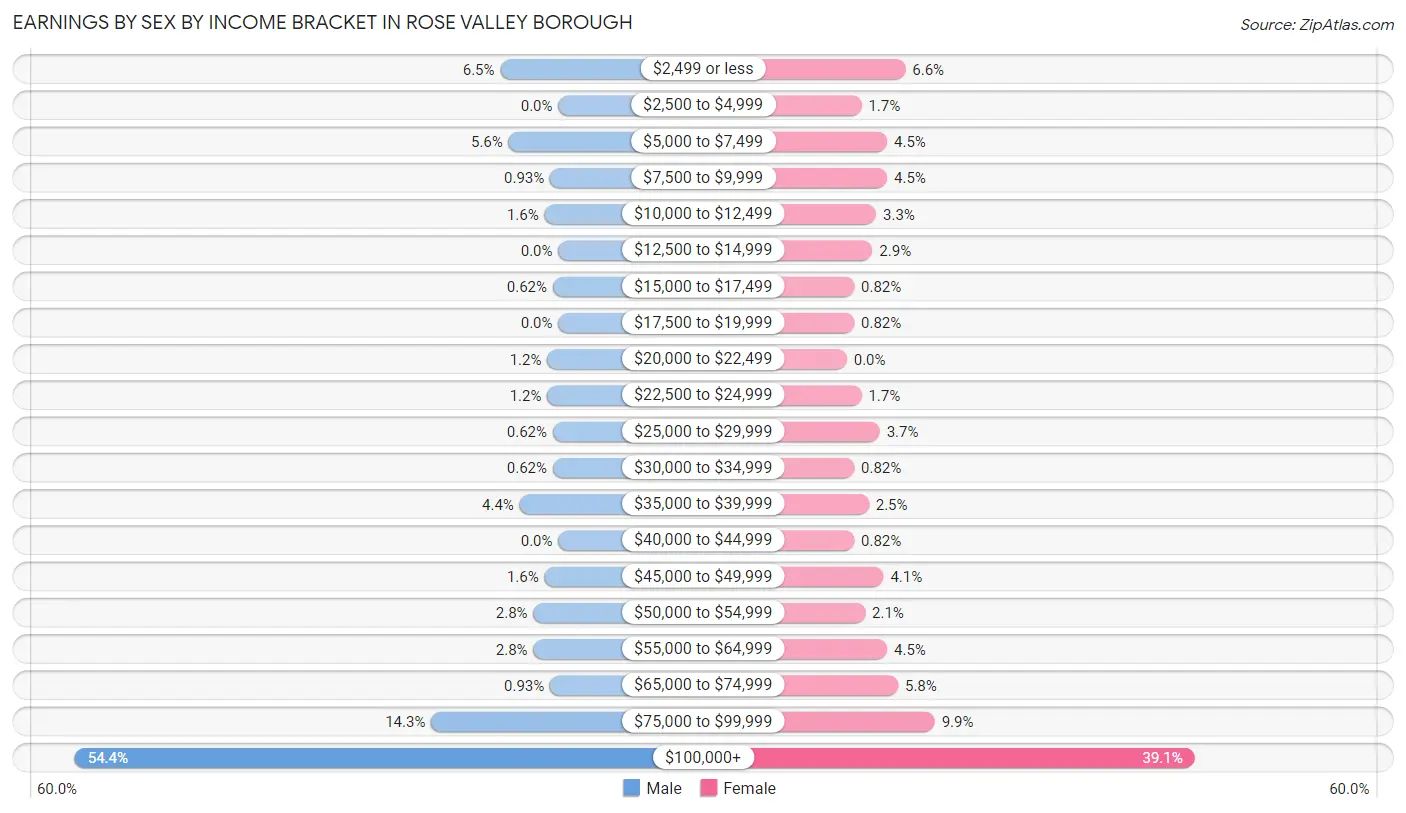
| Income | Male | Female |
| $2,499 or less | 21 (6.5%) | 16 (6.6%) |
| $2,500 to $4,999 | 0 (0.0%) | 4 (1.7%) |
| $5,000 to $7,499 | 18 (5.6%) | 11 (4.5%) |
| $7,500 to $9,999 | 3 (0.9%) | 11 (4.5%) |
| $10,000 to $12,499 | 5 (1.5%) | 8 (3.3%) |
| $12,500 to $14,999 | 0 (0.0%) | 7 (2.9%) |
| $15,000 to $17,499 | 2 (0.6%) | 2 (0.8%) |
| $17,500 to $19,999 | 0 (0.0%) | 2 (0.8%) |
| $20,000 to $22,499 | 4 (1.2%) | 0 (0.0%) |
| $22,500 to $24,999 | 4 (1.2%) | 4 (1.7%) |
| $25,000 to $29,999 | 2 (0.6%) | 9 (3.7%) |
| $30,000 to $34,999 | 2 (0.6%) | 2 (0.8%) |
| $35,000 to $39,999 | 14 (4.3%) | 6 (2.5%) |
| $40,000 to $44,999 | 0 (0.0%) | 2 (0.8%) |
| $45,000 to $49,999 | 5 (1.5%) | 10 (4.1%) |
| $50,000 to $54,999 | 9 (2.8%) | 5 (2.1%) |
| $55,000 to $64,999 | 9 (2.8%) | 11 (4.5%) |
| $65,000 to $74,999 | 3 (0.9%) | 14 (5.8%) |
| $75,000 to $99,999 | 46 (14.3%) | 24 (9.9%) |
| $100,000+ | 175 (54.3%) | 95 (39.1%) |
| Total | 322 (100.0%) | 243 (100.0%) |
Earnings by Sex by Educational Attainment in Rose Valley borough
Average earnings in Rose Valley borough are $160,938 for men and $75,417 for women, a difference of 53.1%. Men with an educational attainment of graduate degree enjoy the highest average annual earnings of $225,833, while those with bachelor's degree education earn the least with $113,750. Women with an educational attainment of graduate degree earn the most with the average annual earnings of $100,000, while those with bachelor's degree education have the smallest earnings of $85,625.
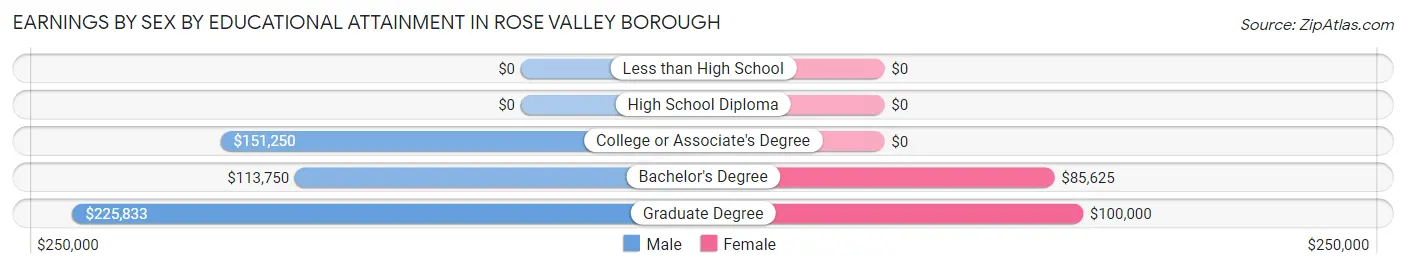
| Educational Attainment | Male Income | Female Income |
| Less than High School | - | - |
| High School Diploma | - | - |
| College or Associate's Degree | $151,250 | $0 |
| Bachelor's Degree | $113,750 | $85,625 |
| Graduate Degree | $225,833 | $100,000 |
| Total | $160,938 | $75,417 |
Family Income in Rose Valley borough
Family Income Brackets in Rose Valley borough
According to the Rose Valley borough family income data, there are 205 families falling into the $200,000+ income range, which is the most common income bracket and makes up 61.4% of all families.
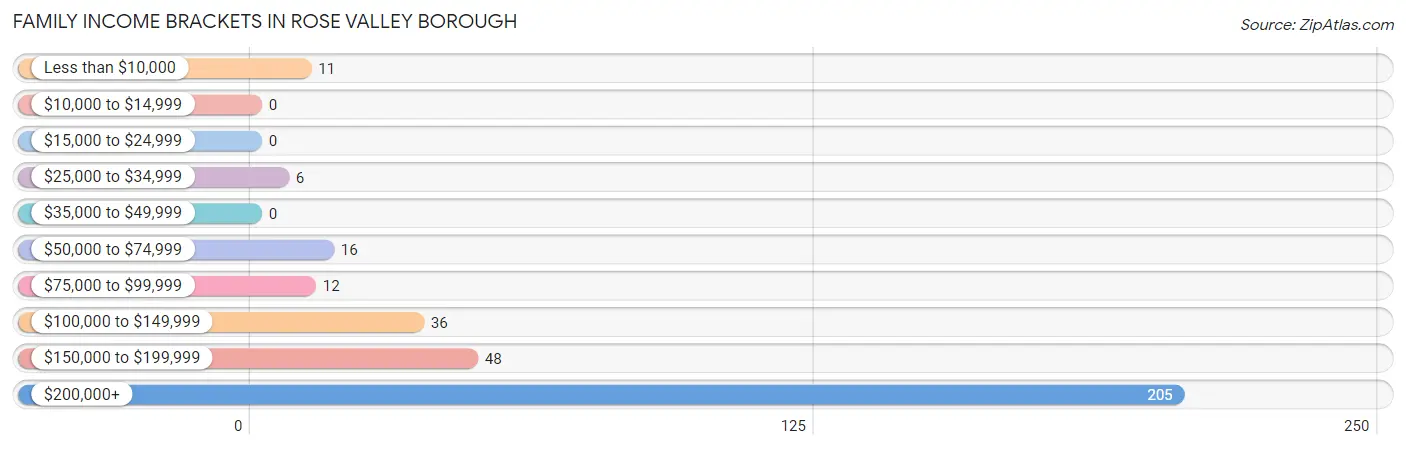
| Income Bracket | # Families | % Families |
| Less than $10,000 | 11 | 3.3% |
| $10,000 to $14,999 | 0 | 0.0% |
| $15,000 to $24,999 | 0 | 0.0% |
| $25,000 to $34,999 | 6 | 1.8% |
| $35,000 to $49,999 | 0 | 0.0% |
| $50,000 to $74,999 | 16 | 4.8% |
| $75,000 to $99,999 | 12 | 3.6% |
| $100,000 to $149,999 | 36 | 10.8% |
| $150,000 to $199,999 | 48 | 14.4% |
| $200,000+ | 205 | 61.4% |
Family Income by Famaliy Size in Rose Valley borough
3-person families (65 | 19.5%) account for the highest median family income in Rose Valley borough with $250,001 per family, while 2-person families (126 | 37.7%) have the highest median income of $91,562 per family member.
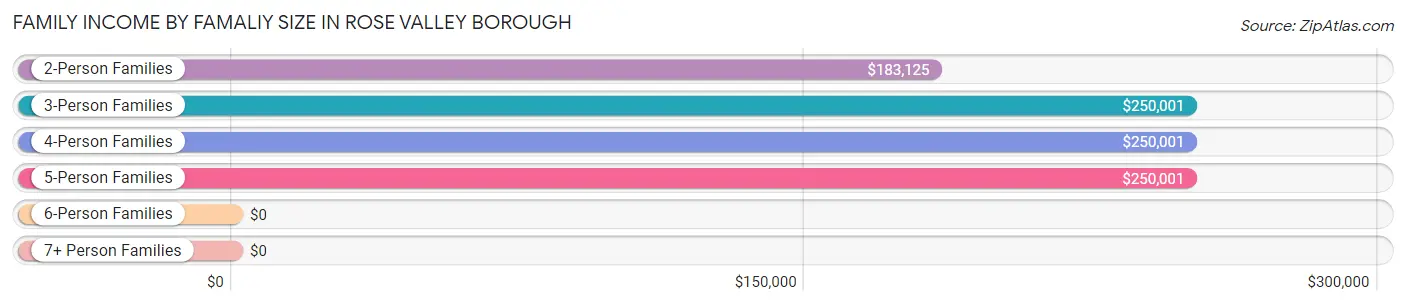
| Income Bracket | # Families | Median Income |
| 2-Person Families | 126 (37.7%) | $183,125 |
| 3-Person Families | 65 (19.5%) | $250,001 |
| 4-Person Families | 122 (36.5%) | $250,001 |
| 5-Person Families | 17 (5.1%) | $250,001 |
| 6-Person Families | 2 (0.6%) | $0 |
| 7+ Person Families | 2 (0.6%) | $0 |
| Total | 334 (100.0%) | $250,001 |
Family Income by Number of Earners in Rose Valley borough
The median family income in Rose Valley borough is $250,001, with families comprising 2 earners (166) having the highest median family income of $250,001, while families with no earners (55) have the lowest median family income of $104,792, accounting for 49.7% and 16.5% of families, respectively.
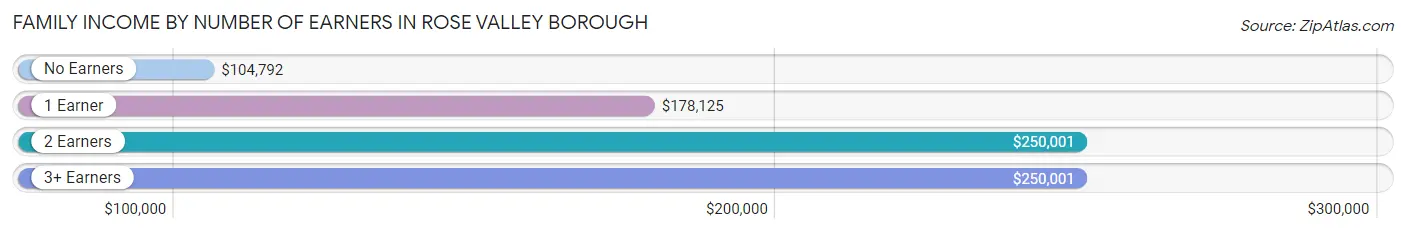
| Number of Earners | # Families | Median Income |
| No Earners | 55 (16.5%) | $104,792 |
| 1 Earner | 81 (24.2%) | $178,125 |
| 2 Earners | 166 (49.7%) | $250,001 |
| 3+ Earners | 32 (9.6%) | $250,001 |
| Total | 334 (100.0%) | $250,001 |
Household Income in Rose Valley borough
Household Income Brackets in Rose Valley borough
With 216 households falling in the category, the $200,000+ income range is the most frequent in Rose Valley borough, accounting for 56.1% of all households.
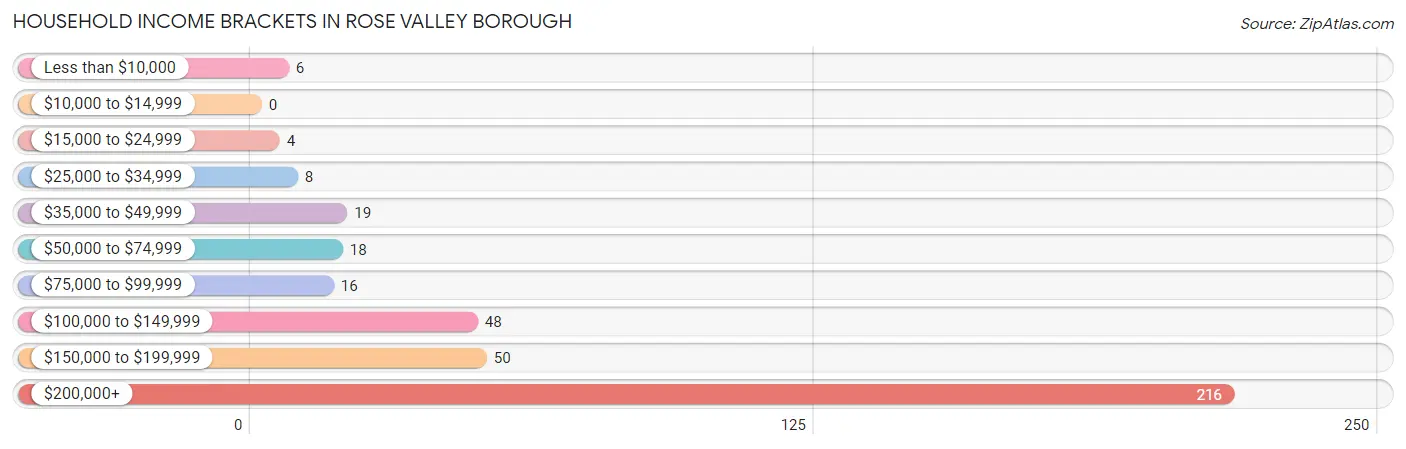
| Income Bracket | # Households | % Households |
| Less than $10,000 | 6 | 1.6% |
| $10,000 to $14,999 | 0 | 0.0% |
| $15,000 to $24,999 | 4 | 1.0% |
| $25,000 to $34,999 | 8 | 2.1% |
| $35,000 to $49,999 | 19 | 4.9% |
| $50,000 to $74,999 | 18 | 4.7% |
| $75,000 to $99,999 | 16 | 4.2% |
| $100,000 to $149,999 | 48 | 12.5% |
| $150,000 to $199,999 | 50 | 13.0% |
| $200,000+ | 216 | 56.1% |
Household Income by Householder Age in Rose Valley borough
The median household income in Rose Valley borough is $250,001, with the highest median household income of $250,001 found in the 25 to 44 years age bracket for the primary householder. A total of 93 households (24.2%) fall into this category.
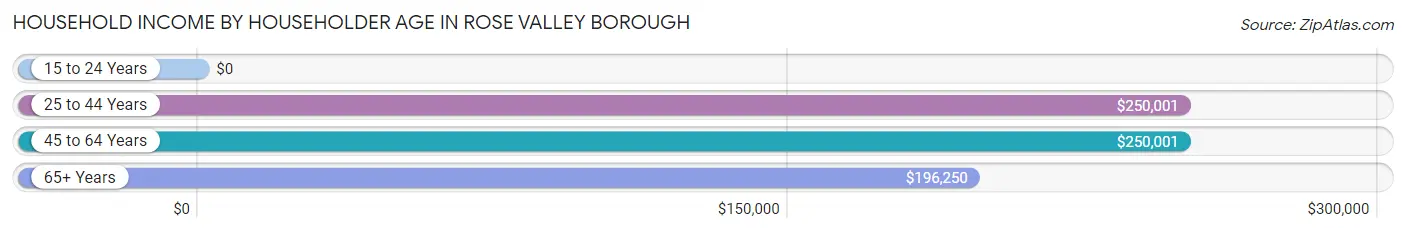
| Income Bracket | # Households | Median Income |
| 15 to 24 Years | 0 (0.0%) | $0 |
| 25 to 44 Years | 93 (24.2%) | $250,001 |
| 45 to 64 Years | 156 (40.5%) | $250,001 |
| 65+ Years | 136 (35.3%) | $196,250 |
| Total | 385 (100.0%) | $250,001 |
Poverty in Rose Valley borough
Income Below Poverty by Sex and Age in Rose Valley borough
With 3.9% poverty level for males and 4.3% for females among the residents of Rose Valley borough, 12 to 14 year old males and 18 to 24 year old females are the most vulnerable to poverty, with 9 males (45.0%) and 3 females (25.0%) in their respective age groups living below the poverty level.
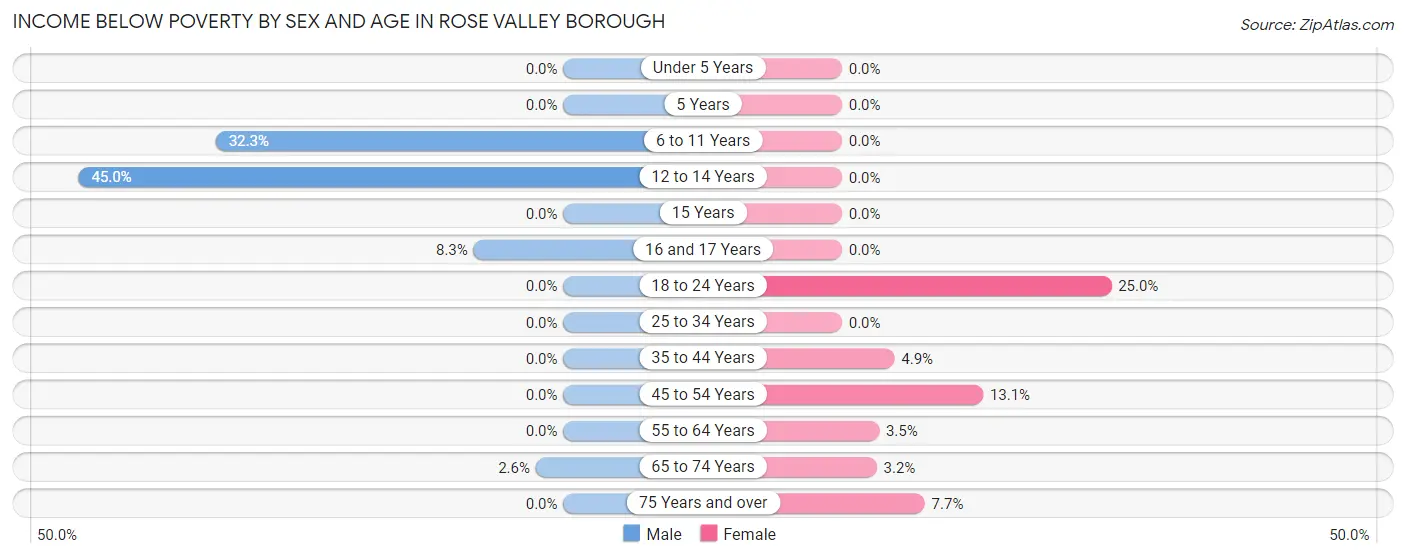
| Age Bracket | Male | Female |
| Under 5 Years | 0 (0.0%) | 0 (0.0%) |
| 5 Years | 0 (0.0%) | 0 (0.0%) |
| 6 to 11 Years | 10 (32.3%) | 0 (0.0%) |
| 12 to 14 Years | 9 (45.0%) | 0 (0.0%) |
| 15 Years | 0 (0.0%) | 0 (0.0%) |
| 16 and 17 Years | 2 (8.3%) | 0 (0.0%) |
| 18 to 24 Years | 0 (0.0%) | 3 (25.0%) |
| 25 to 34 Years | 0 (0.0%) | 0 (0.0%) |
| 35 to 44 Years | 0 (0.0%) | 4 (4.9%) |
| 45 to 54 Years | 0 (0.0%) | 11 (13.1%) |
| 55 to 64 Years | 0 (0.0%) | 3 (3.5%) |
| 65 to 74 Years | 2 (2.6%) | 2 (3.2%) |
| 75 Years and over | 0 (0.0%) | 3 (7.7%) |
| Total | 23 (3.9%) | 26 (4.3%) |
Income Above Poverty by Sex and Age in Rose Valley borough
According to the poverty statistics in Rose Valley borough, males aged under 5 years and females aged under 5 years are the age groups that are most secure financially, with 100.0% of males and 100.0% of females in these age groups living above the poverty line.
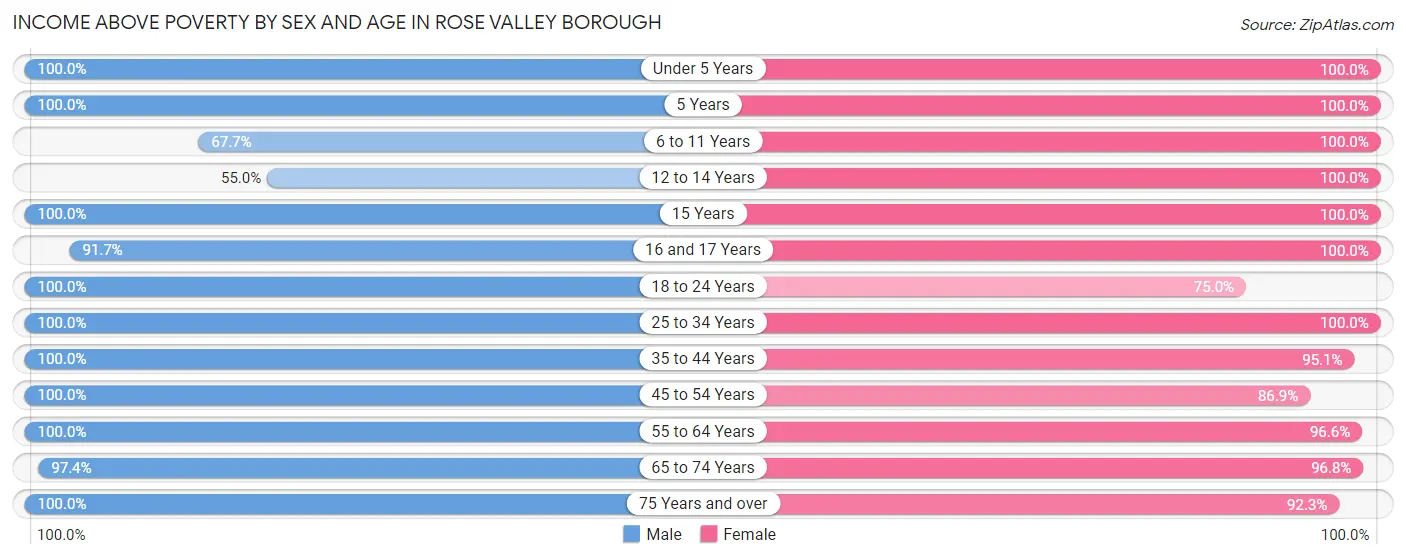
| Age Bracket | Male | Female |
| Under 5 Years | 71 (100.0%) | 21 (100.0%) |
| 5 Years | 19 (100.0%) | 43 (100.0%) |
| 6 to 11 Years | 21 (67.7%) | 99 (100.0%) |
| 12 to 14 Years | 11 (55.0%) | 19 (100.0%) |
| 15 Years | 11 (100.0%) | 9 (100.0%) |
| 16 and 17 Years | 22 (91.7%) | 10 (100.0%) |
| 18 to 24 Years | 32 (100.0%) | 9 (75.0%) |
| 25 to 34 Years | 18 (100.0%) | 33 (100.0%) |
| 35 to 44 Years | 107 (100.0%) | 78 (95.1%) |
| 45 to 54 Years | 63 (100.0%) | 73 (86.9%) |
| 55 to 64 Years | 54 (100.0%) | 84 (96.6%) |
| 65 to 74 Years | 76 (97.4%) | 60 (96.8%) |
| 75 Years and over | 59 (100.0%) | 36 (92.3%) |
| Total | 564 (96.1%) | 574 (95.7%) |
Income Below Poverty Among Married-Couple Families in Rose Valley borough
The poverty statistics for married-couple families in Rose Valley borough show that 0.7% or 2 of the total 299 families live below the poverty line. Families with no children have the highest poverty rate of 1.3%, comprising of 2 families. On the other hand, families with 1 or 2 children have the lowest poverty rate of 0.0%, which includes 0 families.
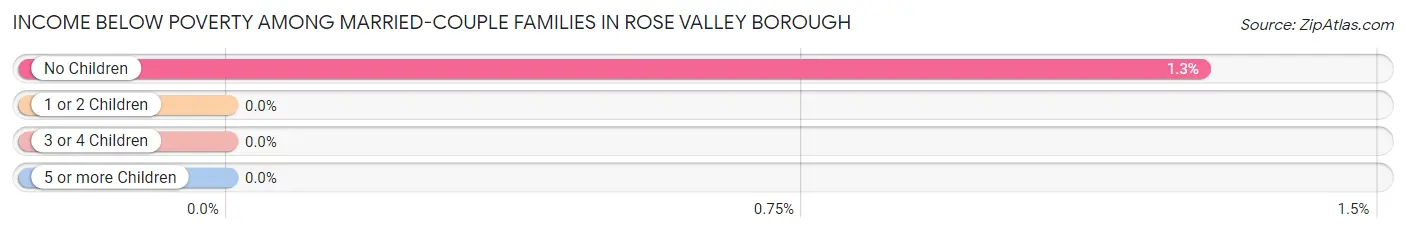
| Children | Above Poverty | Below Poverty |
| No Children | 156 (98.7%) | 2 (1.3%) |
| 1 or 2 Children | 129 (100.0%) | 0 (0.0%) |
| 3 or 4 Children | 10 (100.0%) | 0 (0.0%) |
| 5 or more Children | 2 (100.0%) | 0 (0.0%) |
| Total | 297 (99.3%) | 2 (0.7%) |
Income Below Poverty Among Single-Parent Households in Rose Valley borough
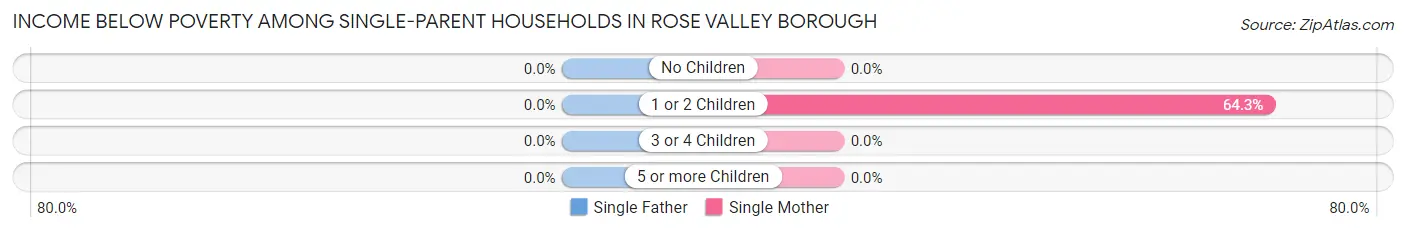
| Children | Single Father | Single Mother |
| No Children | 0 (0.0%) | 0 (0.0%) |
| 1 or 2 Children | 0 (0.0%) | 9 (64.3%) |
| 3 or 4 Children | 0 (0.0%) | 0 (0.0%) |
| 5 or more Children | 0 (0.0%) | 0 (0.0%) |
| Total | 0 (0.0%) | 9 (34.6%) |
Income Below Poverty Among Married-Couple vs Single-Parent Households in Rose Valley borough
The poverty data for Rose Valley borough shows that 2 of the married-couple family households (0.7%) and 9 of the single-parent households (25.7%) are living below the poverty level. Within the married-couple family households, those with no children have the highest poverty rate, with 2 households (1.3%) falling below the poverty line. Among the single-parent households, those with 1 or 2 children have the highest poverty rate, with 9 household (42.9%) living below poverty.
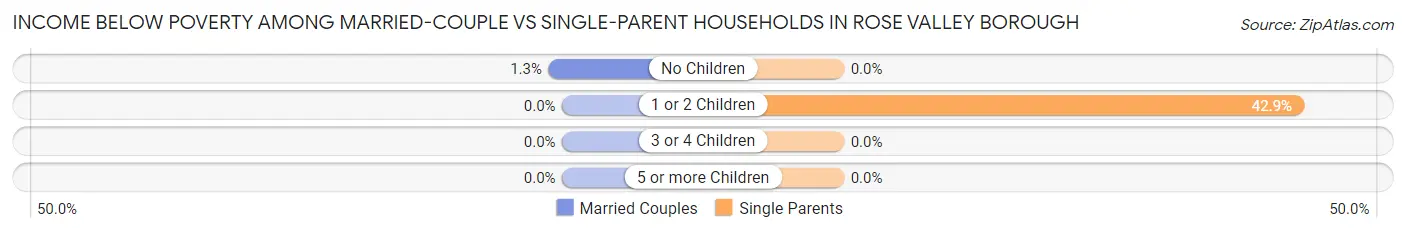
| Children | Married-Couple Families | Single-Parent Households |
| No Children | 2 (1.3%) | 0 (0.0%) |
| 1 or 2 Children | 0 (0.0%) | 9 (42.9%) |
| 3 or 4 Children | 0 (0.0%) | 0 (0.0%) |
| 5 or more Children | 0 (0.0%) | 0 (0.0%) |
| Total | 2 (0.7%) | 9 (25.7%) |
Race in Rose Valley borough
The most populous races in Rose Valley borough are White / Caucasian (953 | 80.3%), Black / African American (90 | 7.6%), and Two or more Races (88 | 7.4%).
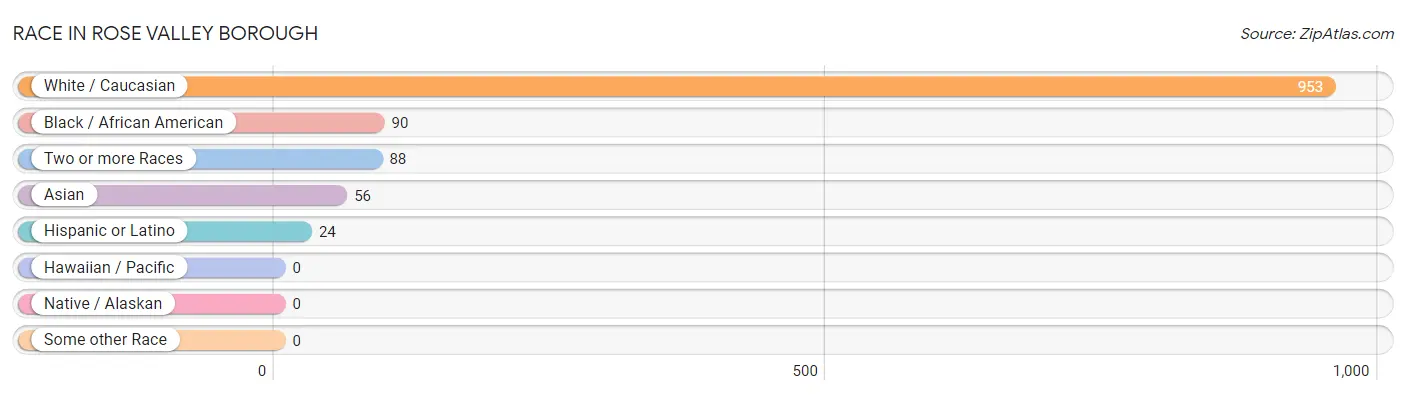
| Race | # Population | % Population |
| Asian | 56 | 4.7% |
| Black / African American | 90 | 7.6% |
| Hawaiian / Pacific | 0 | 0.0% |
| Hispanic or Latino | 24 | 2.0% |
| Native / Alaskan | 0 | 0.0% |
| White / Caucasian | 953 | 80.3% |
| Two or more Races | 88 | 7.4% |
| Some other Race | 0 | 0.0% |
| Total | 1,187 | 100.0% |
Ancestry in Rose Valley borough
The most populous ancestries reported in Rose Valley borough are Irish (281 | 23.7%), German (236 | 19.9%), English (191 | 16.1%), Italian (149 | 12.6%), and Polish (78 | 6.6%), together accounting for 78.8% of all Rose Valley borough residents.
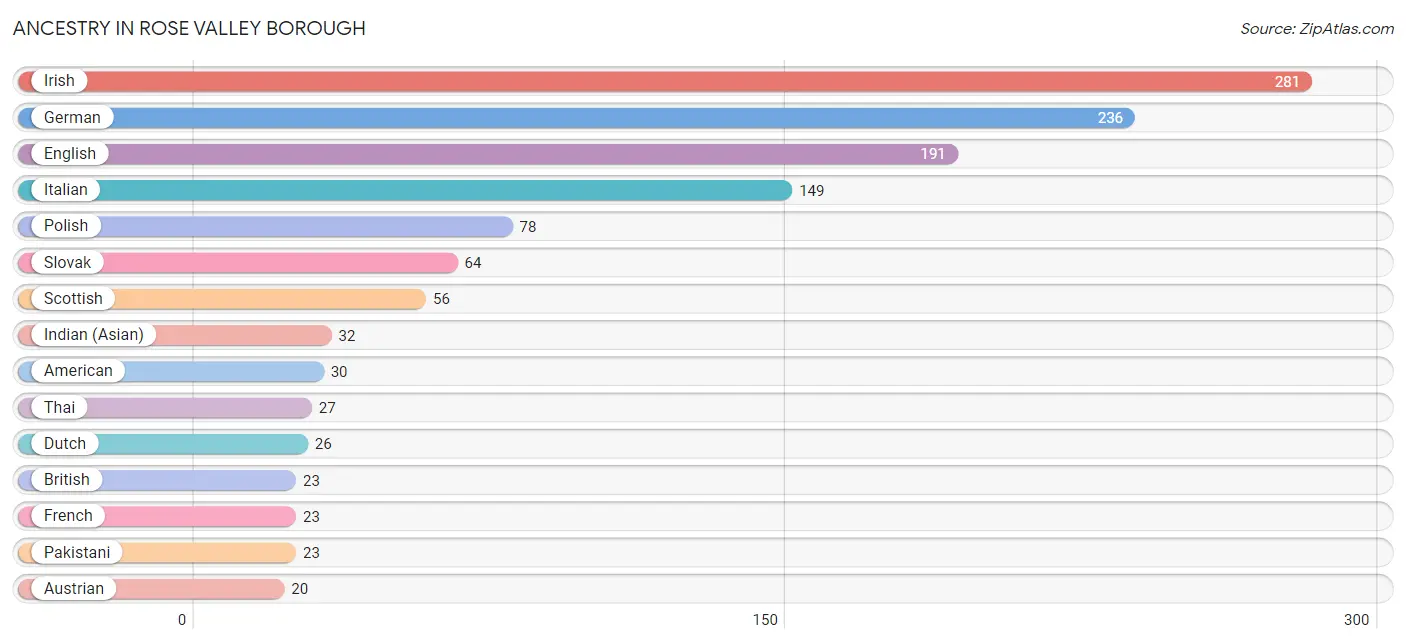
| Ancestry | # Population | % Population |
| American | 30 | 2.5% |
| Australian | 2 | 0.2% |
| Austrian | 20 | 1.7% |
| Bhutanese | 3 | 0.3% |
| British | 23 | 1.9% |
| Burmese | 7 | 0.6% |
| Colombian | 11 | 0.9% |
| Croatian | 2 | 0.2% |
| Danish | 11 | 0.9% |
| Dutch | 26 | 2.2% |
| Eastern European | 6 | 0.5% |
| Ecuadorian | 2 | 0.2% |
| English | 191 | 16.1% |
| European | 19 | 1.6% |
| French | 23 | 1.9% |
| French Canadian | 6 | 0.5% |
| German | 236 | 19.9% |
| Greek | 2 | 0.2% |
| Hungarian | 7 | 0.6% |
| Indian (Asian) | 32 | 2.7% |
| Irish | 281 | 23.7% |
| Israeli | 2 | 0.2% |
| Italian | 149 | 12.6% |
| Latvian | 5 | 0.4% |
| Mexican | 2 | 0.2% |
| Northern European | 2 | 0.2% |
| Norwegian | 5 | 0.4% |
| Pakistani | 23 | 1.9% |
| Polish | 78 | 6.6% |
| Portuguese | 5 | 0.4% |
| Puerto Rican | 2 | 0.2% |
| Russian | 18 | 1.5% |
| Scandinavian | 3 | 0.3% |
| Scotch-Irish | 5 | 0.4% |
| Scottish | 56 | 4.7% |
| Serbian | 1 | 0.1% |
| Slovak | 64 | 5.4% |
| Slovene | 4 | 0.3% |
| South American | 13 | 1.1% |
| Spaniard | 7 | 0.6% |
| Subsaharan African | 4 | 0.3% |
| Swedish | 14 | 1.2% |
| Thai | 27 | 2.3% |
| Ukrainian | 19 | 1.6% |
| Welsh | 19 | 1.6% | View All 45 Rows |
Immigrants in Rose Valley borough
The most numerous immigrant groups reported in Rose Valley borough came from Europe (30 | 2.5%), Asia (28 | 2.4%), Northern Europe (21 | 1.8%), Eastern Asia (12 | 1.0%), and China (11 | 0.9%), together accounting for 8.6% of all Rose Valley borough residents.
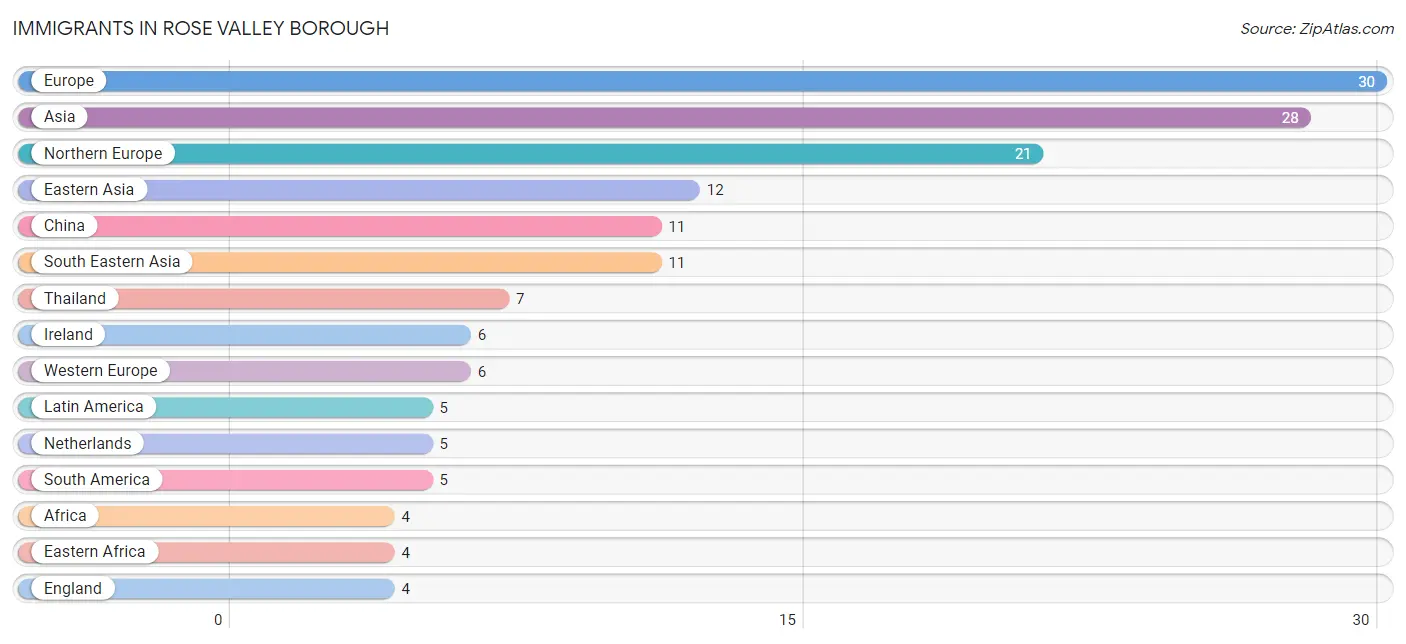
| Immigration Origin | # Population | % Population |
| Africa | 4 | 0.3% |
| Asia | 28 | 2.4% |
| Australia | 2 | 0.2% |
| Canada | 2 | 0.2% |
| China | 11 | 0.9% |
| Colombia | 3 | 0.3% |
| Eastern Africa | 4 | 0.3% |
| Eastern Asia | 12 | 1.0% |
| Ecuador | 2 | 0.2% |
| England | 4 | 0.3% |
| Europe | 30 | 2.5% |
| Germany | 1 | 0.1% |
| India | 3 | 0.3% |
| Indonesia | 1 | 0.1% |
| Ireland | 6 | 0.5% |
| Israel | 2 | 0.2% |
| Italy | 3 | 0.3% |
| Japan | 1 | 0.1% |
| Latin America | 5 | 0.4% |
| Netherlands | 5 | 0.4% |
| Northern Europe | 21 | 1.8% |
| Oceania | 2 | 0.2% |
| South America | 5 | 0.4% |
| South Central Asia | 3 | 0.3% |
| South Eastern Asia | 11 | 0.9% |
| Southern Europe | 3 | 0.3% |
| Sweden | 3 | 0.3% |
| Thailand | 7 | 0.6% |
| Western Asia | 2 | 0.2% |
| Western Europe | 6 | 0.5% | View All 30 Rows |
Sex and Age in Rose Valley borough
Sex and Age in Rose Valley borough
The most populous age groups in Rose Valley borough are Under 5 Years (71 | 12.1%) for men and 5 to 9 Years (84 | 14.0%) for women.
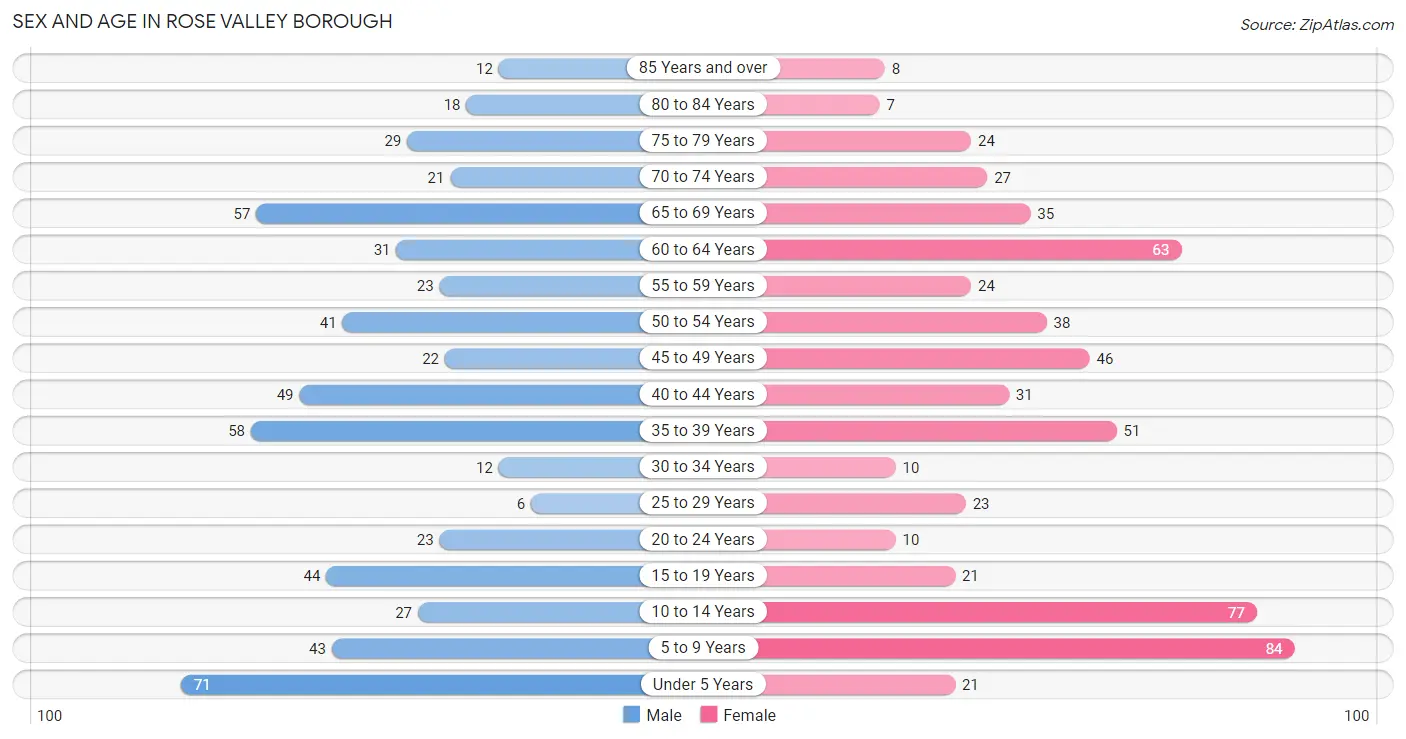
| Age Bracket | Male | Female |
| Under 5 Years | 71 (12.1%) | 21 (3.5%) |
| 5 to 9 Years | 43 (7.3%) | 84 (14.0%) |
| 10 to 14 Years | 27 (4.6%) | 77 (12.8%) |
| 15 to 19 Years | 44 (7.5%) | 21 (3.5%) |
| 20 to 24 Years | 23 (3.9%) | 10 (1.7%) |
| 25 to 29 Years | 6 (1.0%) | 23 (3.8%) |
| 30 to 34 Years | 12 (2.0%) | 10 (1.7%) |
| 35 to 39 Years | 58 (9.9%) | 51 (8.5%) |
| 40 to 44 Years | 49 (8.4%) | 31 (5.2%) |
| 45 to 49 Years | 22 (3.7%) | 46 (7.7%) |
| 50 to 54 Years | 41 (7.0%) | 38 (6.3%) |
| 55 to 59 Years | 23 (3.9%) | 24 (4.0%) |
| 60 to 64 Years | 31 (5.3%) | 63 (10.5%) |
| 65 to 69 Years | 57 (9.7%) | 35 (5.8%) |
| 70 to 74 Years | 21 (3.6%) | 27 (4.5%) |
| 75 to 79 Years | 29 (4.9%) | 24 (4.0%) |
| 80 to 84 Years | 18 (3.1%) | 7 (1.2%) |
| 85 Years and over | 12 (2.0%) | 8 (1.3%) |
| Total | 587 (100.0%) | 600 (100.0%) |
Families and Households in Rose Valley borough
Median Family Size in Rose Valley borough
The median family size in Rose Valley borough is 3.30 persons per family, with single female/mother families (26 | 7.8%) accounting for the largest median family size of 3.38 persons per family. On the other hand, single male/father families (9 | 2.7%) represent the smallest median family size with 3.00 persons per family.
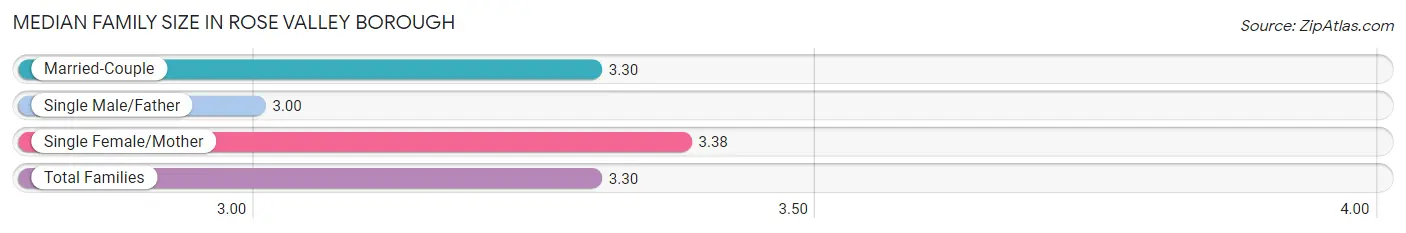
| Family Type | # Families | Family Size |
| Married-Couple | 299 (89.5%) | 3.30 |
| Single Male/Father | 9 (2.7%) | 3.00 |
| Single Female/Mother | 26 (7.8%) | 3.38 |
| Total Families | 334 (100.0%) | 3.30 |
Median Household Size in Rose Valley borough
The median household size in Rose Valley borough is 3.06 persons per household, with single female/mother households (26 | 6.8%) accounting for the largest median household size of 3.77 persons per household. non-family households (51 | 13.3%) represent the smallest median household size with 1.16 persons per household.
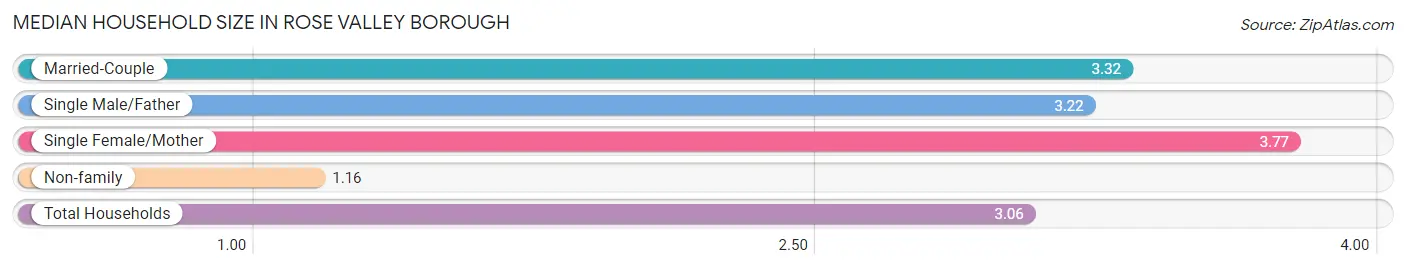
| Household Type | # Households | Household Size |
| Married-Couple | 299 (77.7%) | 3.32 |
| Single Male/Father | 9 (2.3%) | 3.22 |
| Single Female/Mother | 26 (6.8%) | 3.77 |
| Non-family | 51 (13.3%) | 1.16 |
| Total Households | 385 (100.0%) | 3.06 |
Household Size by Marriage Status in Rose Valley borough
Out of a total of 385 households in Rose Valley borough, 334 (86.8%) are family households, while 51 (13.3%) are nonfamily households. The most numerous type of family households are 4-person households, comprising 133, and the most common type of nonfamily households are 1-person households, comprising 45.
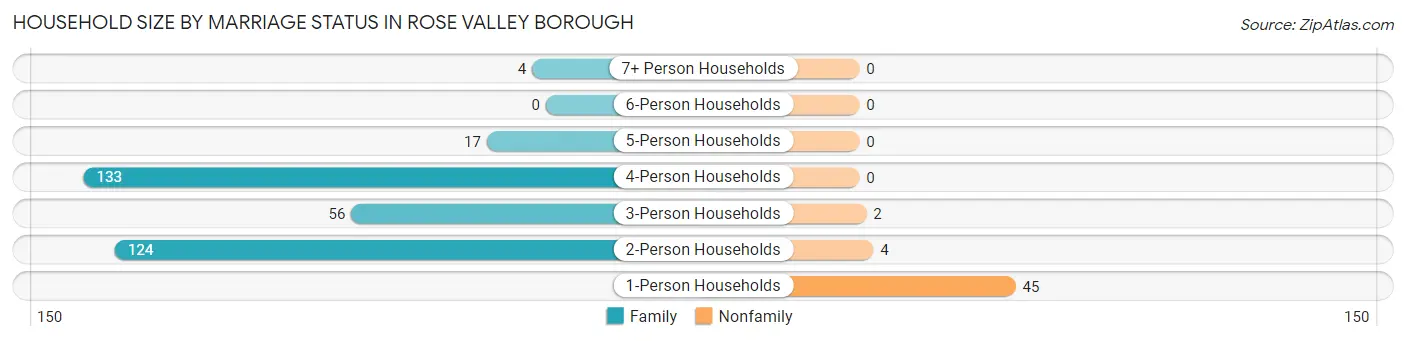
| Household Size | Family Households | Nonfamily Households |
| 1-Person Households | - | 45 (11.7%) |
| 2-Person Households | 124 (32.2%) | 4 (1.0%) |
| 3-Person Households | 56 (14.5%) | 2 (0.5%) |
| 4-Person Households | 133 (34.5%) | 0 (0.0%) |
| 5-Person Households | 17 (4.4%) | 0 (0.0%) |
| 6-Person Households | 0 (0.0%) | 0 (0.0%) |
| 7+ Person Households | 4 (1.0%) | 0 (0.0%) |
| Total | 334 (86.8%) | 51 (13.3%) |
Female Fertility in Rose Valley borough
Fertility by Age in Rose Valley borough
Average fertility rate in Rose Valley borough is 86.0 births per 1,000 women. Women in the age bracket of 35 to 50 years have the highest fertility rate with 103.0 births per 1,000 women. Women in the age bracket of 35 to 50 years acount for 83.3% of all women with births.
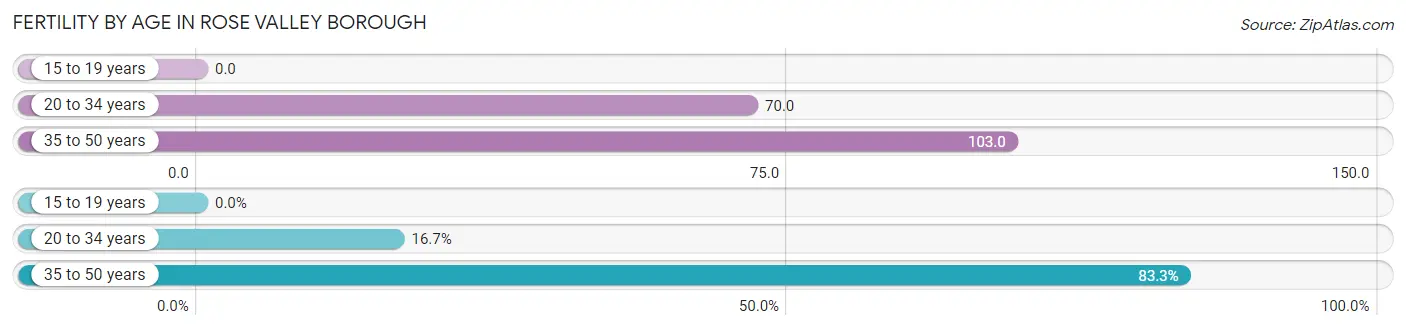
| Age Bracket | Women with Births | Births / 1,000 Women |
| 15 to 19 years | 0 (0.0%) | 0.0 |
| 20 to 34 years | 3 (16.7%) | 70.0 |
| 35 to 50 years | 15 (83.3%) | 103.0 |
| Total | 18 (100.0%) | 86.0 |
Fertility by Age by Marriage Status in Rose Valley borough
83.3% of women with births (18) in Rose Valley borough are married. The highest percentage of unmarried women with births falls into 20 to 34 years age bracket with 100.0% of them unmarried at the time of birth, while the lowest percentage of unmarried women with births belong to 35 to 50 years age bracket with 0.0% of them unmarried.
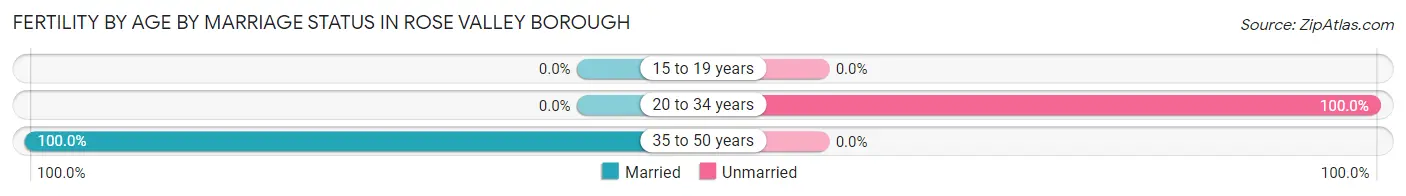
| Age Bracket | Married | Unmarried |
| 15 to 19 years | 0 (0.0%) | 0 (0.0%) |
| 20 to 34 years | 0 (0.0%) | 3 (100.0%) |
| 35 to 50 years | 15 (100.0%) | 0 (0.0%) |
| Total | 15 (83.3%) | 3 (16.7%) |
Fertility by Education in Rose Valley borough
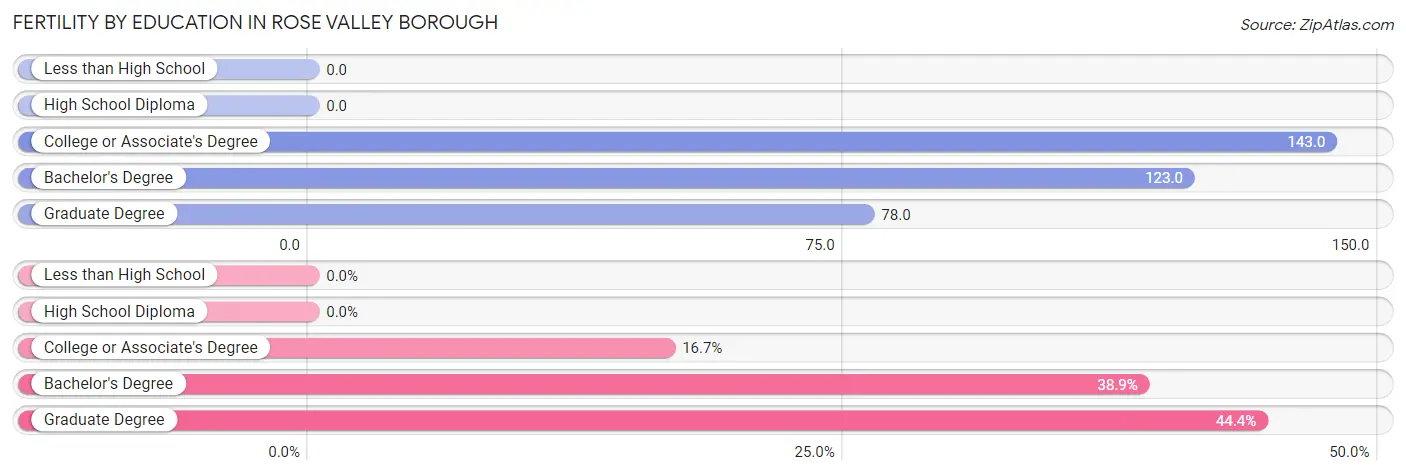
| Educational Attainment | Women with Births | Births / 1,000 Women |
| Less than High School | 0 (0.0%) | 0.0 |
| High School Diploma | 0 (0.0%) | 0.0 |
| College or Associate's Degree | 3 (16.7%) | 143.0 |
| Bachelor's Degree | 7 (38.9%) | 123.0 |
| Graduate Degree | 8 (44.4%) | 78.0 |
| Total | 18 (100.0%) | 86.0 |
Fertility by Education by Marriage Status in Rose Valley borough
16.7% of women with births in Rose Valley borough are unmarried. Women with the educational attainment of bachelor's degree are most likely to be married with 100.0% of them married at childbirth, while women with the educational attainment of college or associate's degree are least likely to be married with 100.0% of them unmarried at childbirth.
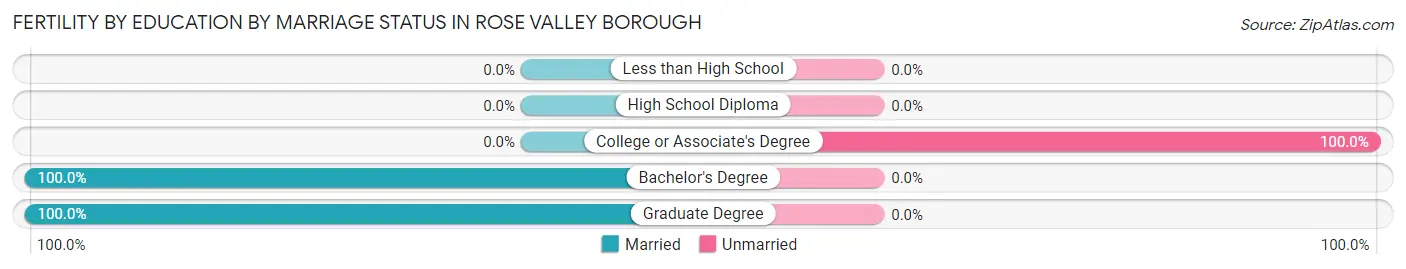
| Educational Attainment | Married | Unmarried |
| Less than High School | 0 (0.0%) | 0 (0.0%) |
| High School Diploma | 0 (0.0%) | 0 (0.0%) |
| College or Associate's Degree | 0 (0.0%) | 3 (100.0%) |
| Bachelor's Degree | 7 (100.0%) | 0 (0.0%) |
| Graduate Degree | 8 (100.0%) | 0 (0.0%) |
| Total | 15 (83.3%) | 3 (16.7%) |
Employment Characteristics in Rose Valley borough
Employment by Class of Employer in Rose Valley borough
Among the 506 employed individuals in Rose Valley borough, private company employees (310 | 61.3%), not-for-profit organizations (121 | 23.9%), and self-employed (not incorporated) (44 | 8.7%) make up the most common classes of employment.
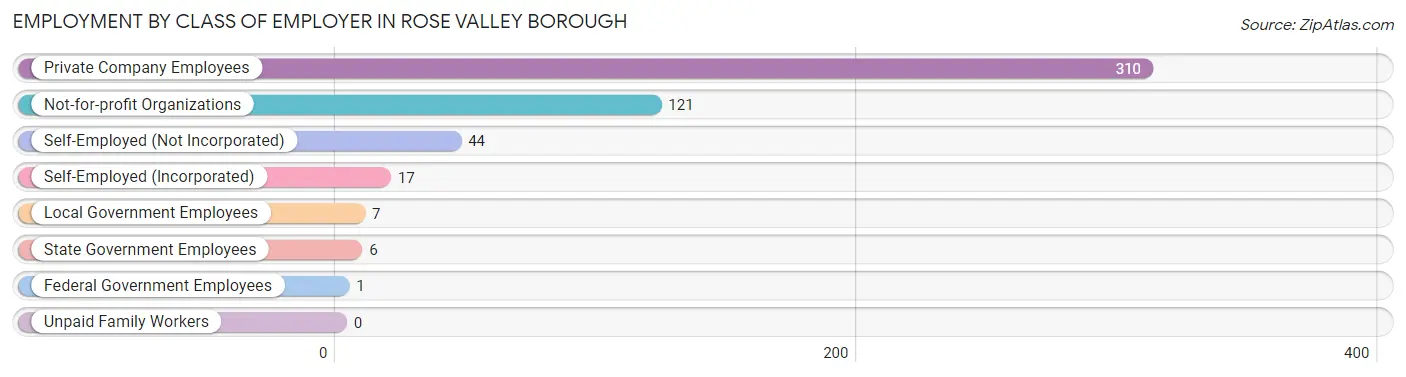
| Employer Class | # Employees | % Employees |
| Private Company Employees | 310 | 61.3% |
| Self-Employed (Incorporated) | 17 | 3.4% |
| Self-Employed (Not Incorporated) | 44 | 8.7% |
| Not-for-profit Organizations | 121 | 23.9% |
| Local Government Employees | 7 | 1.4% |
| State Government Employees | 6 | 1.2% |
| Federal Government Employees | 1 | 0.2% |
| Unpaid Family Workers | 0 | 0.0% |
| Total | 506 | 100.0% |
Employment Status by Age in Rose Valley borough
According to the labor force statistics for Rose Valley borough, out of the total population over 16 years of age (844), 62.6% or 528 individuals are in the labor force, with 1.1% or 6 of them unemployed. The age group with the highest labor force participation rate is 45 to 54 years, with 89.8% or 132 individuals in the labor force. Within the labor force, the 20 to 24 years age range has the highest percentage of unemployed individuals, with 12.0% or 3 of them being unemployed.
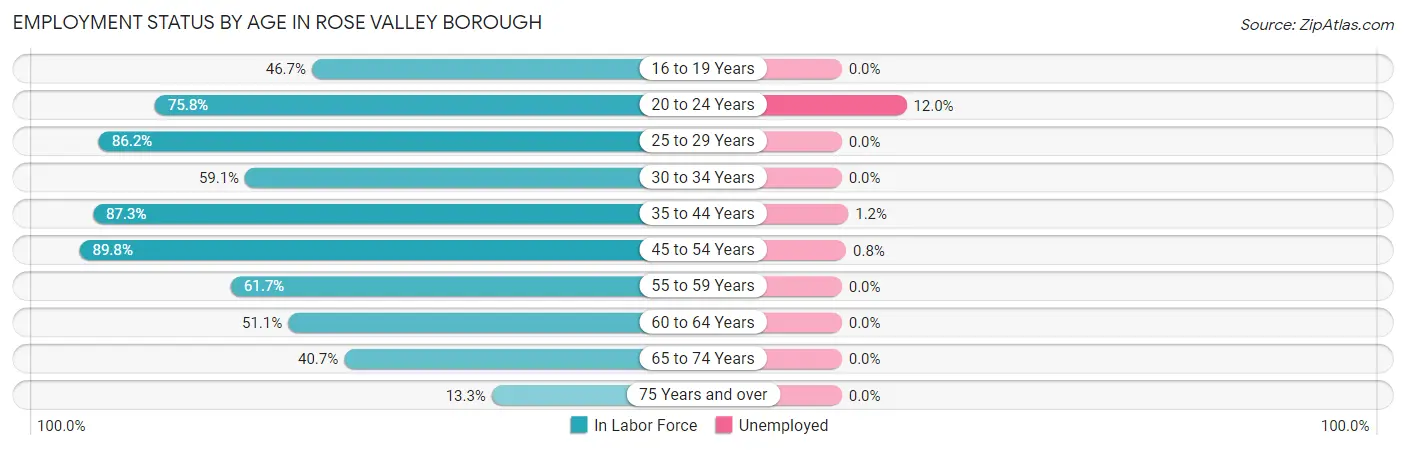
| Age Bracket | In Labor Force | Unemployed |
| 16 to 19 Years | 21 (46.7%) | 0 (0.0%) |
| 20 to 24 Years | 25 (75.8%) | 3 (12.0%) |
| 25 to 29 Years | 25 (86.2%) | 0 (0.0%) |
| 30 to 34 Years | 13 (59.1%) | 0 (0.0%) |
| 35 to 44 Years | 165 (87.3%) | 2 (1.2%) |
| 45 to 54 Years | 132 (89.8%) | 1 (0.8%) |
| 55 to 59 Years | 29 (61.7%) | 0 (0.0%) |
| 60 to 64 Years | 48 (51.1%) | 0 (0.0%) |
| 65 to 74 Years | 57 (40.7%) | 0 (0.0%) |
| 75 Years and over | 13 (13.3%) | 0 (0.0%) |
| Total | 528 (62.6%) | 6 (1.1%) |
Employment Status by Educational Attainment in Rose Valley borough
According to labor force statistics for Rose Valley borough, 78.0% of individuals (412) out of the total population between 25 and 64 years of age (528) are in the labor force, with 0.7% or 3 of them being unemployed. The group with the highest labor force participation rate are those with the educational attainment of bachelor's degree or higher, with 83.5% or 354 individuals in the labor force. Within the labor force, individuals with high school diploma education have the highest percentage of unemployment, with 22.2% or 2 of them being unemployed.
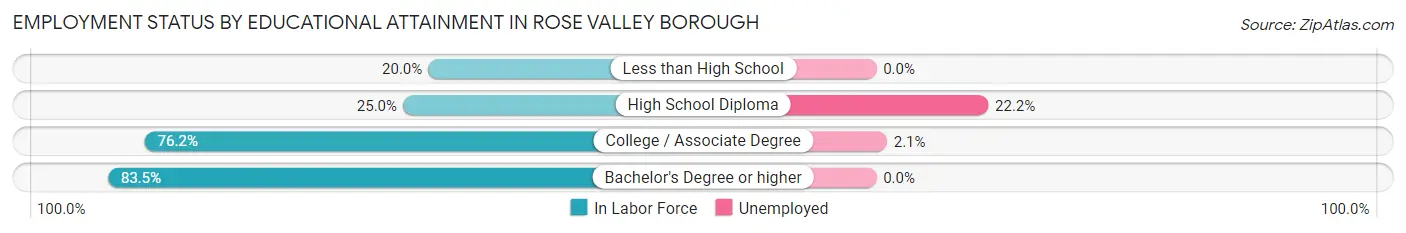
| Educational Attainment | In Labor Force | Unemployed |
| Less than High School | 1 (20.0%) | 0 (0.0%) |
| High School Diploma | 9 (25.0%) | 8 (22.2%) |
| College / Associate Degree | 48 (76.2%) | 1 (2.1%) |
| Bachelor's Degree or higher | 354 (83.5%) | 0 (0.0%) |
| Total | 412 (78.0%) | 4 (0.7%) |
Employment Occupations by Sex in Rose Valley borough
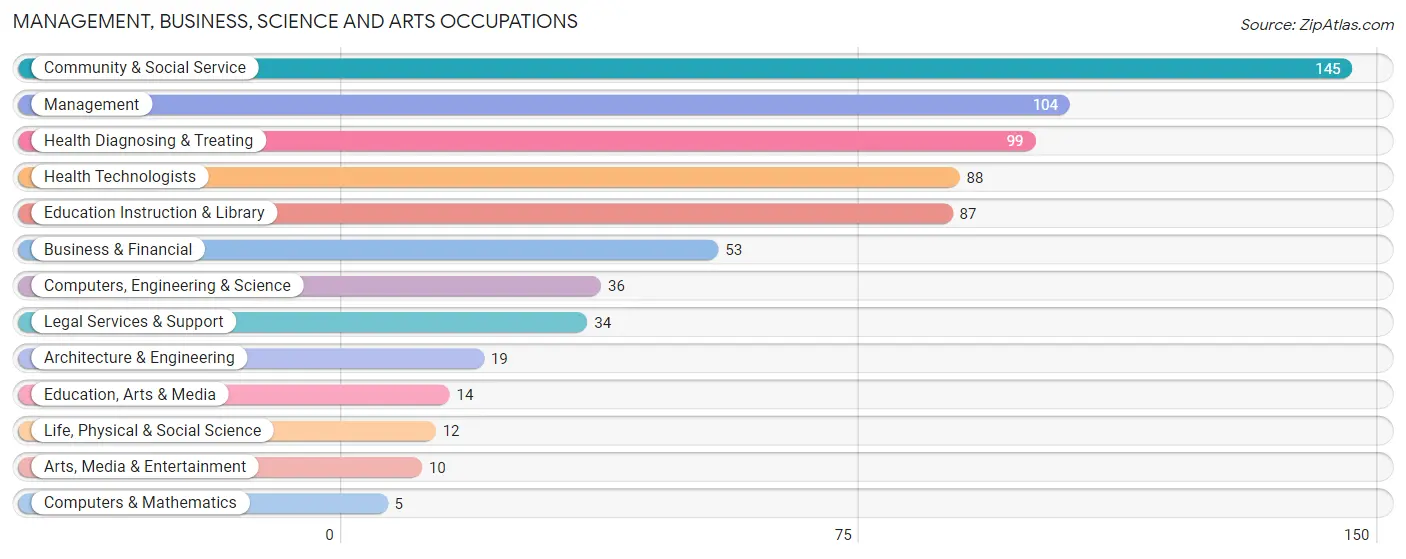
Management, Business, Science and Arts Occupations
The most common Management, Business, Science and Arts occupations in Rose Valley borough are Community & Social Service (145 | 27.8%), Management (104 | 19.9%), Health Diagnosing & Treating (99 | 19.0%), Health Technologists (88 | 16.9%), and Education Instruction & Library (87 | 16.7%).
Management, Business, Science and Arts Occupations by Sex
Within the Management, Business, Science and Arts occupations in Rose Valley borough, the most male-oriented occupations are Computers & Mathematics (100.0%), Architecture & Engineering (100.0%), and Computers, Engineering & Science (80.6%), while the most female-oriented occupations are Education, Arts & Media (71.4%), Education Instruction & Library (63.2%), and Community & Social Service (58.6%).
| Occupation | Male | Female |
| Management | 68 (65.4%) | 36 (34.6%) |
| Business & Financial | 26 (49.1%) | 27 (50.9%) |
| Computers, Engineering & Science | 29 (80.6%) | 7 (19.4%) |
| Computers & Mathematics | 5 (100.0%) | 0 (0.0%) |
| Architecture & Engineering | 19 (100.0%) | 0 (0.0%) |
| Life, Physical & Social Science | 5 (41.7%) | 7 (58.3%) |
| Community & Social Service | 60 (41.4%) | 85 (58.6%) |
| Education, Arts & Media | 4 (28.6%) | 10 (71.4%) |
| Legal Services & Support | 17 (50.0%) | 17 (50.0%) |
| Education Instruction & Library | 32 (36.8%) | 55 (63.2%) |
| Arts, Media & Entertainment | 7 (70.0%) | 3 (30.0%) |
| Health Diagnosing & Treating | 55 (55.6%) | 44 (44.4%) |
| Health Technologists | 55 (62.5%) | 33 (37.5%) |
| Total (Category) | 238 (54.5%) | 199 (45.5%) |
| Total (Overall) | 306 (58.6%) | 216 (41.4%) |
Services Occupations
The most common Services occupations in Rose Valley borough are Food Preparation & Serving (13 | 2.5%), Personal Care & Service (9 | 1.7%), and Cleaning & Maintenance (3 | 0.6%).
Services Occupations by Sex
Within the Services occupations in Rose Valley borough, the most male-oriented occupations are Cleaning & Maintenance (100.0%), Food Preparation & Serving (69.2%), and Personal Care & Service (55.6%), while the most female-oriented occupations are Personal Care & Service (44.4%), and Food Preparation & Serving (30.8%).
| Occupation | Male | Female |
| Healthcare Support | 0 (0.0%) | 0 (0.0%) |
| Security & Protection | 0 (0.0%) | 0 (0.0%) |
| Firefighting & Prevention | 0 (0.0%) | 0 (0.0%) |
| Law Enforcement | 0 (0.0%) | 0 (0.0%) |
| Food Preparation & Serving | 9 (69.2%) | 4 (30.8%) |
| Cleaning & Maintenance | 3 (100.0%) | 0 (0.0%) |
| Personal Care & Service | 5 (55.6%) | 4 (44.4%) |
| Total (Category) | 17 (68.0%) | 8 (32.0%) |
| Total (Overall) | 306 (58.6%) | 216 (41.4%) |
Sales and Office Occupations
The most common Sales and Office occupations in Rose Valley borough are Sales & Related (25 | 4.8%), and Office & Administration (22 | 4.2%).
Sales and Office Occupations by Sex
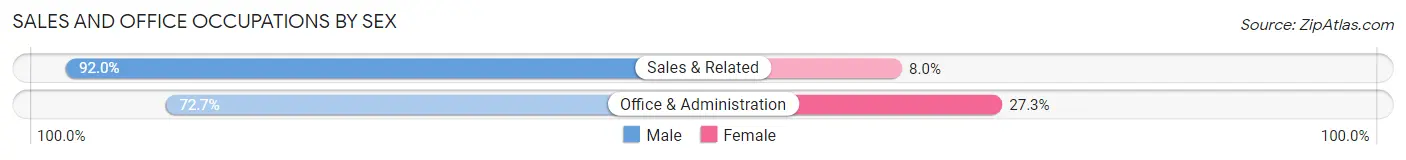
| Occupation | Male | Female |
| Sales & Related | 23 (92.0%) | 2 (8.0%) |
| Office & Administration | 16 (72.7%) | 6 (27.3%) |
| Total (Category) | 39 (83.0%) | 8 (17.0%) |
| Total (Overall) | 306 (58.6%) | 216 (41.4%) |
Natural Resources, Construction and Maintenance Occupations
The most common Natural Resources, Construction and Maintenance occupations in Rose Valley borough are , and Construction & Extraction (6 | 1.1%).
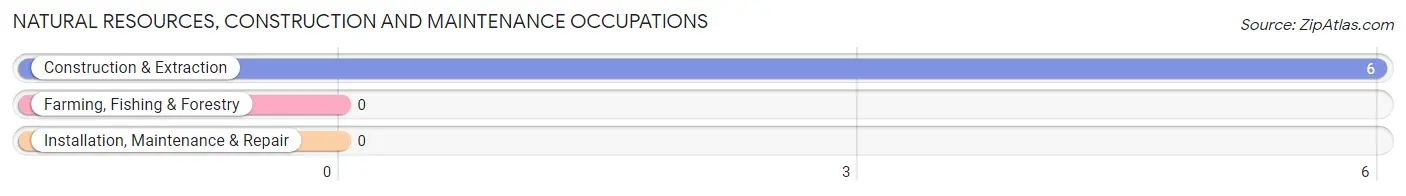
Natural Resources, Construction and Maintenance Occupations by Sex
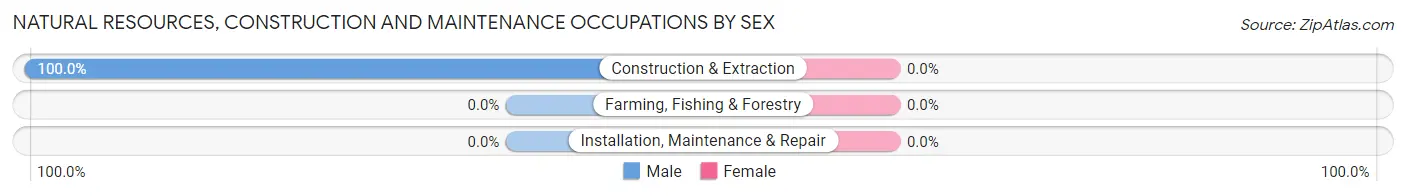
| Occupation | Male | Female |
| Farming, Fishing & Forestry | 0 (0.0%) | 0 (0.0%) |
| Construction & Extraction | 6 (100.0%) | 0 (0.0%) |
| Installation, Maintenance & Repair | 0 (0.0%) | 0 (0.0%) |
| Total (Category) | 6 (100.0%) | 0 (0.0%) |
| Total (Overall) | 306 (58.6%) | 216 (41.4%) |
Production, Transportation and Moving Occupations
The most common Production, Transportation and Moving occupations in Rose Valley borough are Material Moving (4 | 0.8%), and Production (3 | 0.6%).
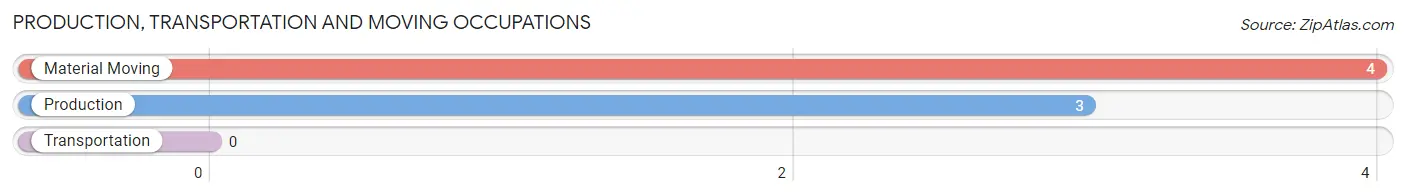
Production, Transportation and Moving Occupations by Sex
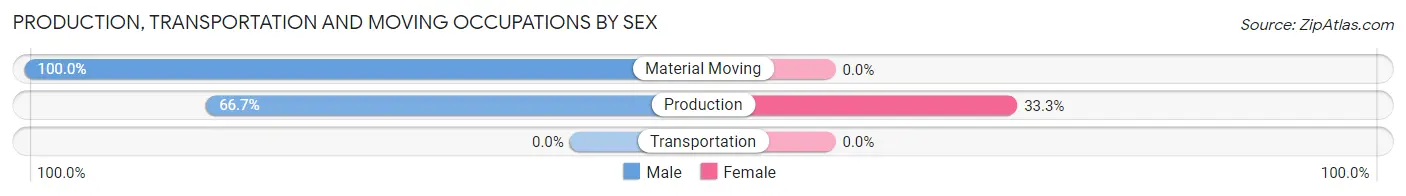
| Occupation | Male | Female |
| Production | 2 (66.7%) | 1 (33.3%) |
| Transportation | 0 (0.0%) | 0 (0.0%) |
| Material Moving | 4 (100.0%) | 0 (0.0%) |
| Total (Category) | 6 (85.7%) | 1 (14.3%) |
| Total (Overall) | 306 (58.6%) | 216 (41.4%) |
Employment Industries by Sex in Rose Valley borough
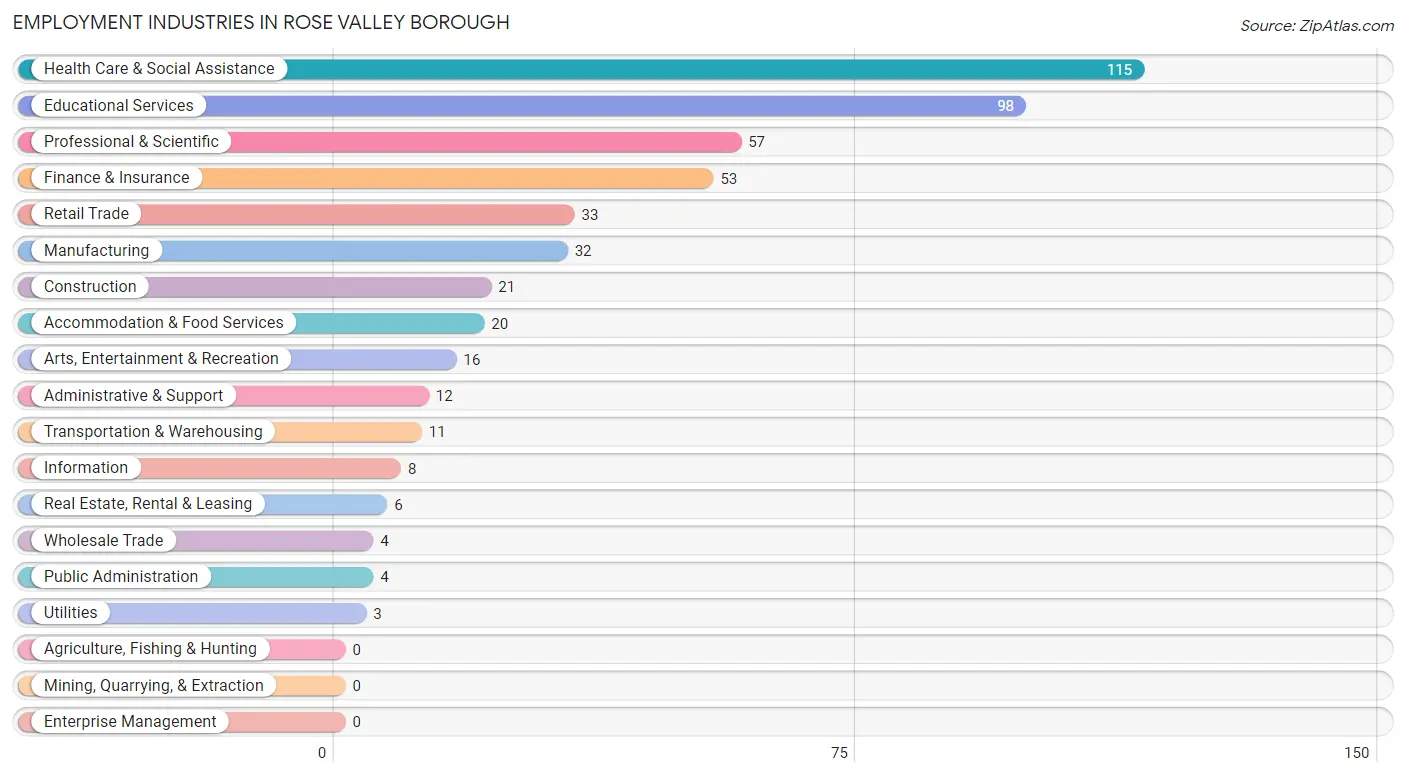
Employment Industries in Rose Valley borough
The major employment industries in Rose Valley borough include Health Care & Social Assistance (115 | 22.0%), Educational Services (98 | 18.8%), Professional & Scientific (57 | 10.9%), Finance & Insurance (53 | 10.2%), and Retail Trade (33 | 6.3%).
Employment Industries by Sex in Rose Valley borough
The Rose Valley borough industries that see more men than women are Wholesale Trade (100.0%), Transportation & Warehousing (100.0%), and Real Estate, Rental & Leasing (100.0%), whereas the industries that tend to have a higher number of women are Administrative & Support (83.3%), Public Administration (75.0%), and Finance & Insurance (60.4%).
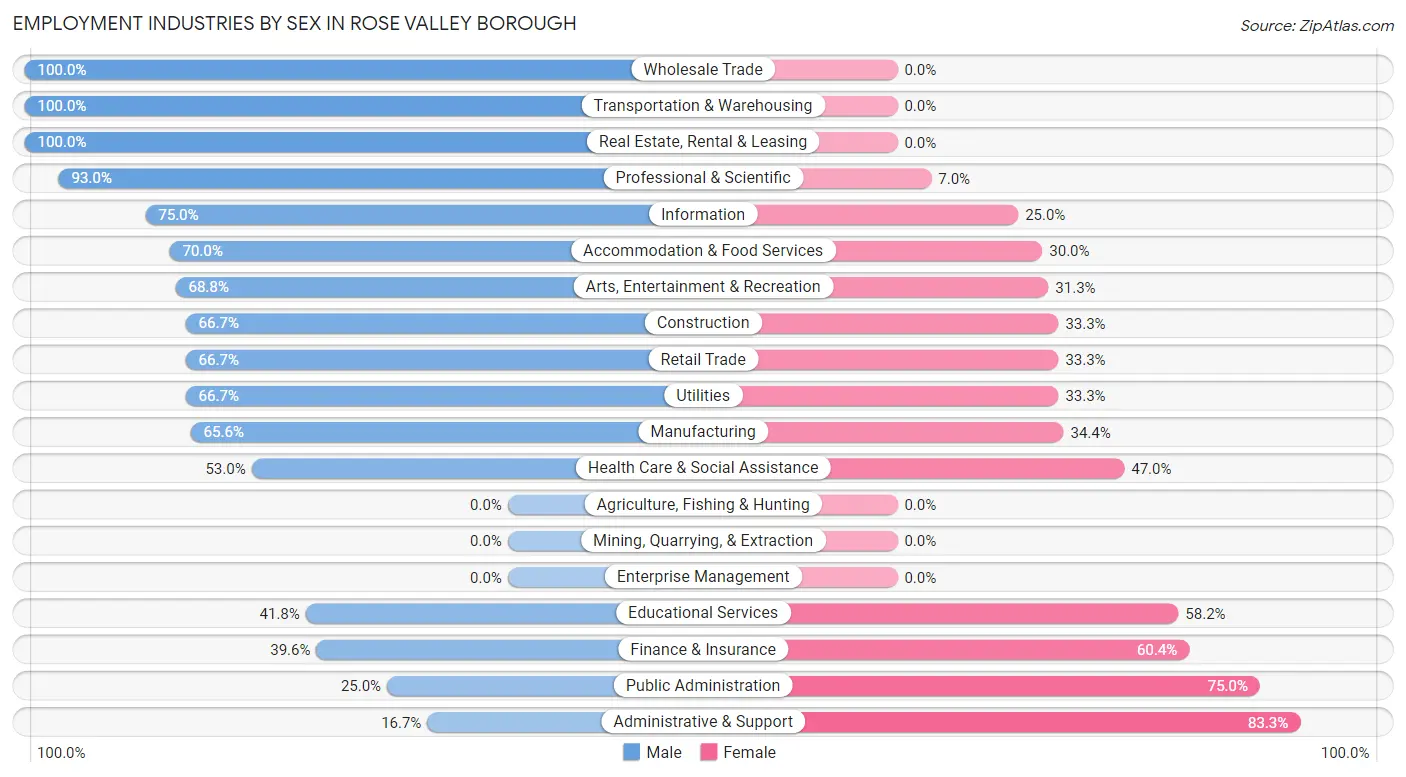
| Industry | Male | Female |
| Agriculture, Fishing & Hunting | 0 (0.0%) | 0 (0.0%) |
| Mining, Quarrying, & Extraction | 0 (0.0%) | 0 (0.0%) |
| Construction | 14 (66.7%) | 7 (33.3%) |
| Manufacturing | 21 (65.6%) | 11 (34.4%) |
| Wholesale Trade | 4 (100.0%) | 0 (0.0%) |
| Retail Trade | 22 (66.7%) | 11 (33.3%) |
| Transportation & Warehousing | 11 (100.0%) | 0 (0.0%) |
| Utilities | 2 (66.7%) | 1 (33.3%) |
| Information | 6 (75.0%) | 2 (25.0%) |
| Finance & Insurance | 21 (39.6%) | 32 (60.4%) |
| Real Estate, Rental & Leasing | 6 (100.0%) | 0 (0.0%) |
| Professional & Scientific | 53 (93.0%) | 4 (7.0%) |
| Enterprise Management | 0 (0.0%) | 0 (0.0%) |
| Administrative & Support | 2 (16.7%) | 10 (83.3%) |
| Educational Services | 41 (41.8%) | 57 (58.2%) |
| Health Care & Social Assistance | 61 (53.0%) | 54 (47.0%) |
| Arts, Entertainment & Recreation | 11 (68.8%) | 5 (31.2%) |
| Accommodation & Food Services | 14 (70.0%) | 6 (30.0%) |
| Public Administration | 1 (25.0%) | 3 (75.0%) |
| Total | 306 (58.6%) | 216 (41.4%) |
Education in Rose Valley borough
School Enrollment in Rose Valley borough
The most common levels of schooling among the 342 students in Rose Valley borough are elementary school (112 | 32.8%), high school (69 | 20.2%), and nursery / preschool (65 | 19.0%).
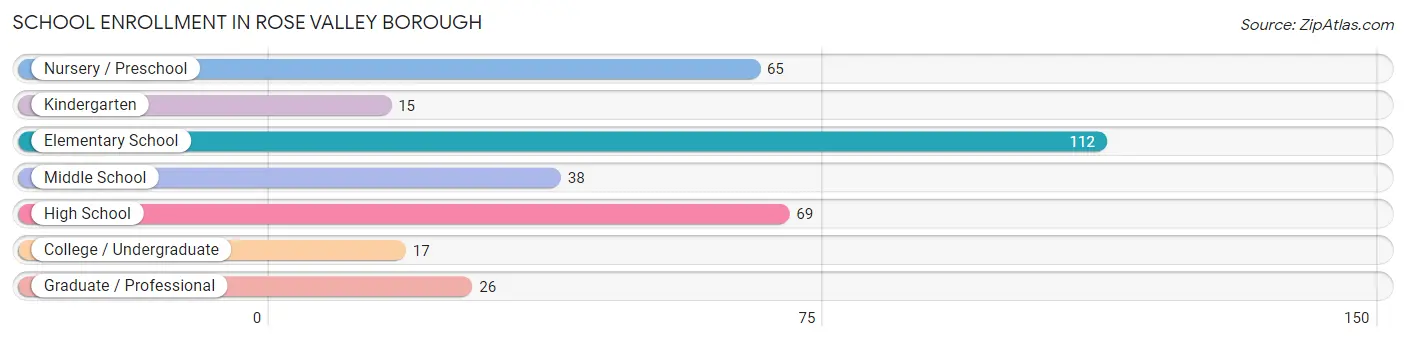
| School Level | # Students | % Students |
| Nursery / Preschool | 65 | 19.0% |
| Kindergarten | 15 | 4.4% |
| Elementary School | 112 | 32.8% |
| Middle School | 38 | 11.1% |
| High School | 69 | 20.2% |
| College / Undergraduate | 17 | 5.0% |
| Graduate / Professional | 26 | 7.6% |
| Total | 342 | 100.0% |
School Enrollment by Age by Funding Source in Rose Valley borough
Out of a total of 342 students who are enrolled in schools in Rose Valley borough, 104 (30.4%) attend a private institution, while the remaining 238 (69.6%) are enrolled in public schools. The age group of 35 years and over has the highest likelihood of being enrolled in private schools, with 19 (100.0% in the age bracket) enrolled. Conversely, the age group of 15 to 17 year olds has the lowest likelihood of being enrolled in a private school, with 48 (100.0% in the age bracket) attending a public institution.
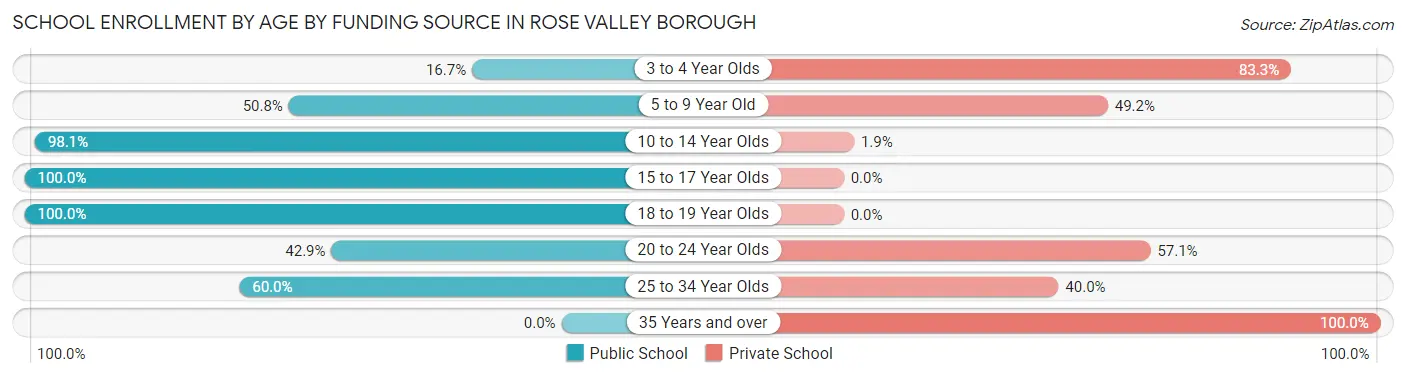
| Age Bracket | Public School | Private School |
| 3 to 4 Year Olds | 2 (16.7%) | 10 (83.3%) |
| 5 to 9 Year Old | 63 (50.8%) | 61 (49.2%) |
| 10 to 14 Year Olds | 102 (98.1%) | 2 (1.9%) |
| 15 to 17 Year Olds | 48 (100.0%) | 0 (0.0%) |
| 18 to 19 Year Olds | 11 (100.0%) | 0 (0.0%) |
| 20 to 24 Year Olds | 6 (42.9%) | 8 (57.1%) |
| 25 to 34 Year Olds | 6 (60.0%) | 4 (40.0%) |
| 35 Years and over | 0 (0.0%) | 19 (100.0%) |
| Total | 238 (69.6%) | 104 (30.4%) |
Educational Attainment by Field of Study in Rose Valley borough
Business (111 | 15.6%), bio, nature & agricultural (87 | 12.2%), literature & languages (86 | 12.1%), social sciences (85 | 11.9%), and science & technology (60 | 8.4%) are the most common fields of study among 711 individuals in Rose Valley borough who have obtained a bachelor's degree or higher.
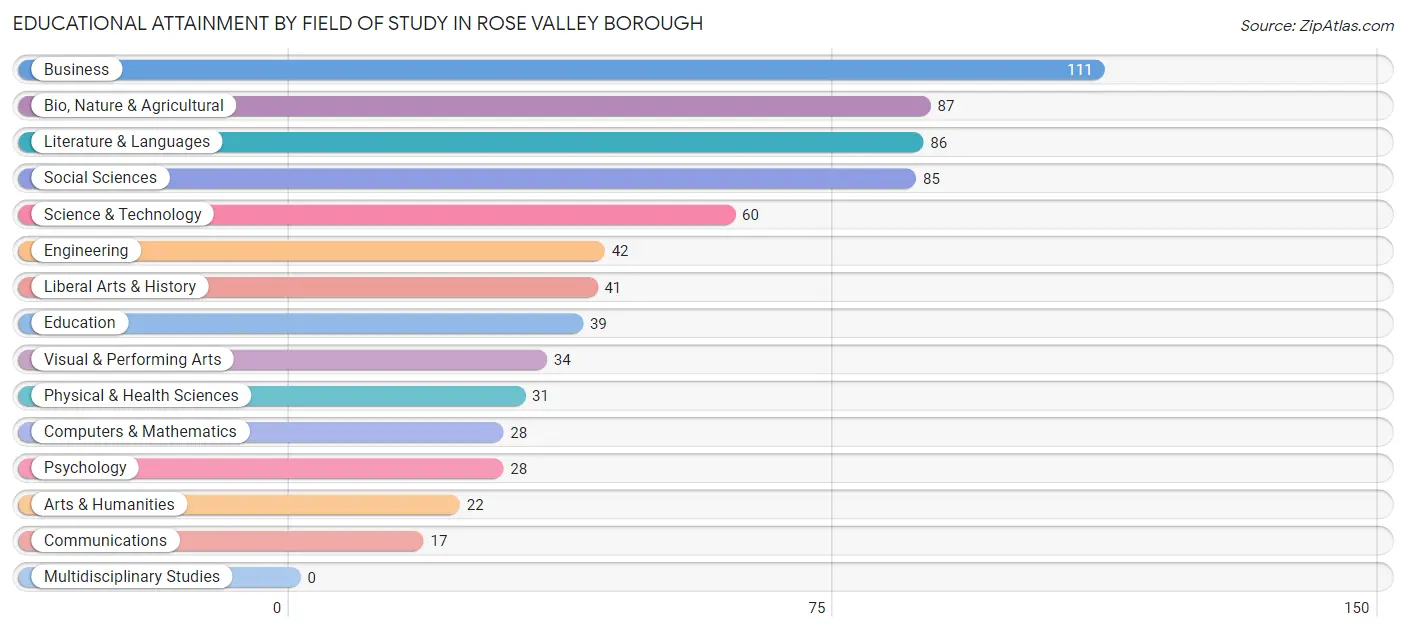
| Field of Study | # Graduates | % Graduates |
| Computers & Mathematics | 28 | 3.9% |
| Bio, Nature & Agricultural | 87 | 12.2% |
| Physical & Health Sciences | 31 | 4.4% |
| Psychology | 28 | 3.9% |
| Social Sciences | 85 | 11.9% |
| Engineering | 42 | 5.9% |
| Multidisciplinary Studies | 0 | 0.0% |
| Science & Technology | 60 | 8.4% |
| Business | 111 | 15.6% |
| Education | 39 | 5.5% |
| Literature & Languages | 86 | 12.1% |
| Liberal Arts & History | 41 | 5.8% |
| Visual & Performing Arts | 34 | 4.8% |
| Communications | 17 | 2.4% |
| Arts & Humanities | 22 | 3.1% |
| Total | 711 | 100.0% |
Transportation & Commute in Rose Valley borough
Vehicle Availability by Sex in Rose Valley borough
The most prevalent vehicle ownership categories in Rose Valley borough are males with 2 vehicles (159, accounting for 52.5%) and females with 2 vehicles (97, making up 79.1%).
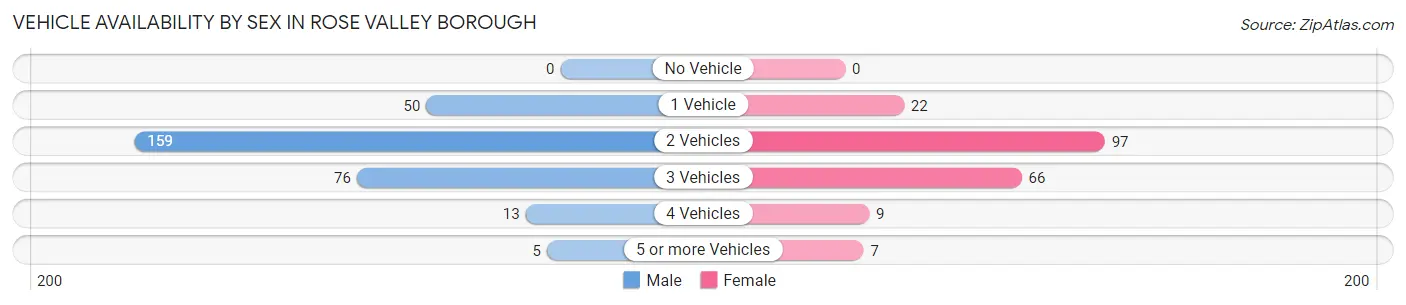
| Vehicles Available | Male | Female |
| No Vehicle | 0 (0.0%) | 0 (0.0%) |
| 1 Vehicle | 50 (16.5%) | 22 (11.0%) |
| 2 Vehicles | 159 (52.5%) | 97 (48.3%) |
| 3 Vehicles | 76 (25.1%) | 66 (32.8%) |
| 4 Vehicles | 13 (4.3%) | 9 (4.5%) |
| 5 or more Vehicles | 5 (1.7%) | 7 (3.5%) |
| Total | 303 (100.0%) | 201 (100.0%) |
Commute Time in Rose Valley borough
The most frequently occuring commute durations in Rose Valley borough are 30 to 34 minutes (64 commuters, 16.7%), 45 to 59 minutes (57 commuters, 14.8%), and 20 to 24 minutes (44 commuters, 11.5%).
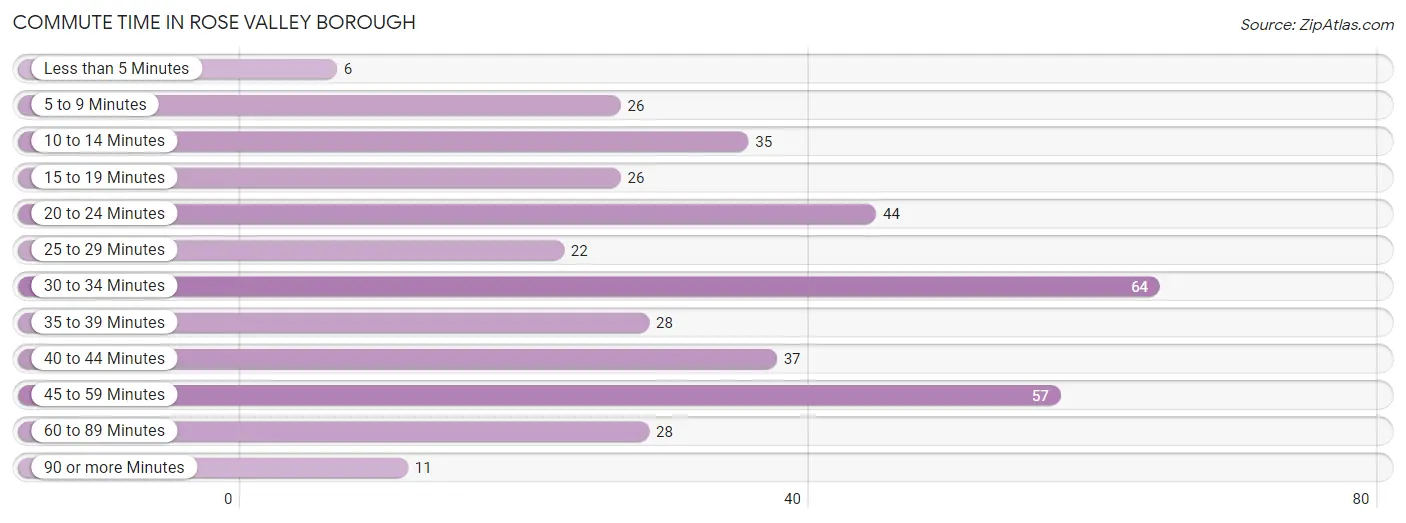
| Commute Time | # Commuters | % Commuters |
| Less than 5 Minutes | 6 | 1.6% |
| 5 to 9 Minutes | 26 | 6.8% |
| 10 to 14 Minutes | 35 | 9.1% |
| 15 to 19 Minutes | 26 | 6.8% |
| 20 to 24 Minutes | 44 | 11.5% |
| 25 to 29 Minutes | 22 | 5.7% |
| 30 to 34 Minutes | 64 | 16.7% |
| 35 to 39 Minutes | 28 | 7.3% |
| 40 to 44 Minutes | 37 | 9.6% |
| 45 to 59 Minutes | 57 | 14.8% |
| 60 to 89 Minutes | 28 | 7.3% |
| 90 or more Minutes | 11 | 2.9% |
Commute Time by Sex in Rose Valley borough
The most common commute times in Rose Valley borough are 30 to 34 minutes (45 commuters, 19.4%) for males and 45 to 59 minutes (33 commuters, 21.7%) for females.
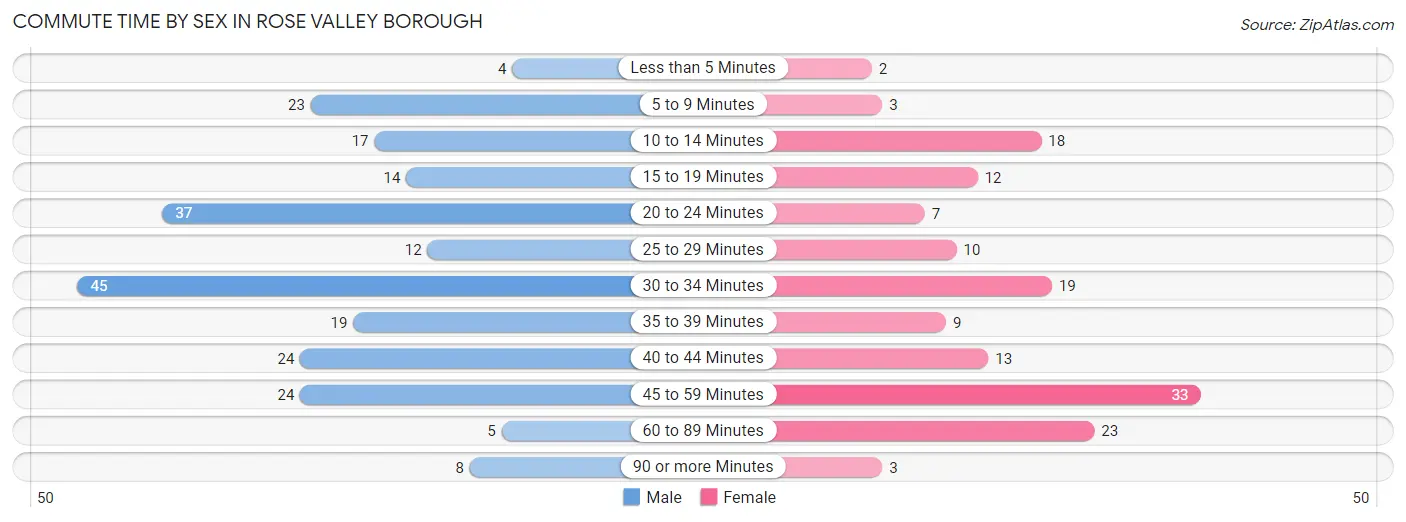
| Commute Time | Male | Female |
| Less than 5 Minutes | 4 (1.7%) | 2 (1.3%) |
| 5 to 9 Minutes | 23 (9.9%) | 3 (2.0%) |
| 10 to 14 Minutes | 17 (7.3%) | 18 (11.8%) |
| 15 to 19 Minutes | 14 (6.0%) | 12 (7.9%) |
| 20 to 24 Minutes | 37 (16.0%) | 7 (4.6%) |
| 25 to 29 Minutes | 12 (5.2%) | 10 (6.6%) |
| 30 to 34 Minutes | 45 (19.4%) | 19 (12.5%) |
| 35 to 39 Minutes | 19 (8.2%) | 9 (5.9%) |
| 40 to 44 Minutes | 24 (10.3%) | 13 (8.6%) |
| 45 to 59 Minutes | 24 (10.3%) | 33 (21.7%) |
| 60 to 89 Minutes | 5 (2.2%) | 23 (15.1%) |
| 90 or more Minutes | 8 (3.5%) | 3 (2.0%) |
Time of Departure to Work by Sex in Rose Valley borough
The most frequent times of departure to work in Rose Valley borough are 7:30 AM to 7:59 AM (36, 15.5%) for males and 7:30 AM to 7:59 AM (46, 30.3%) for females.
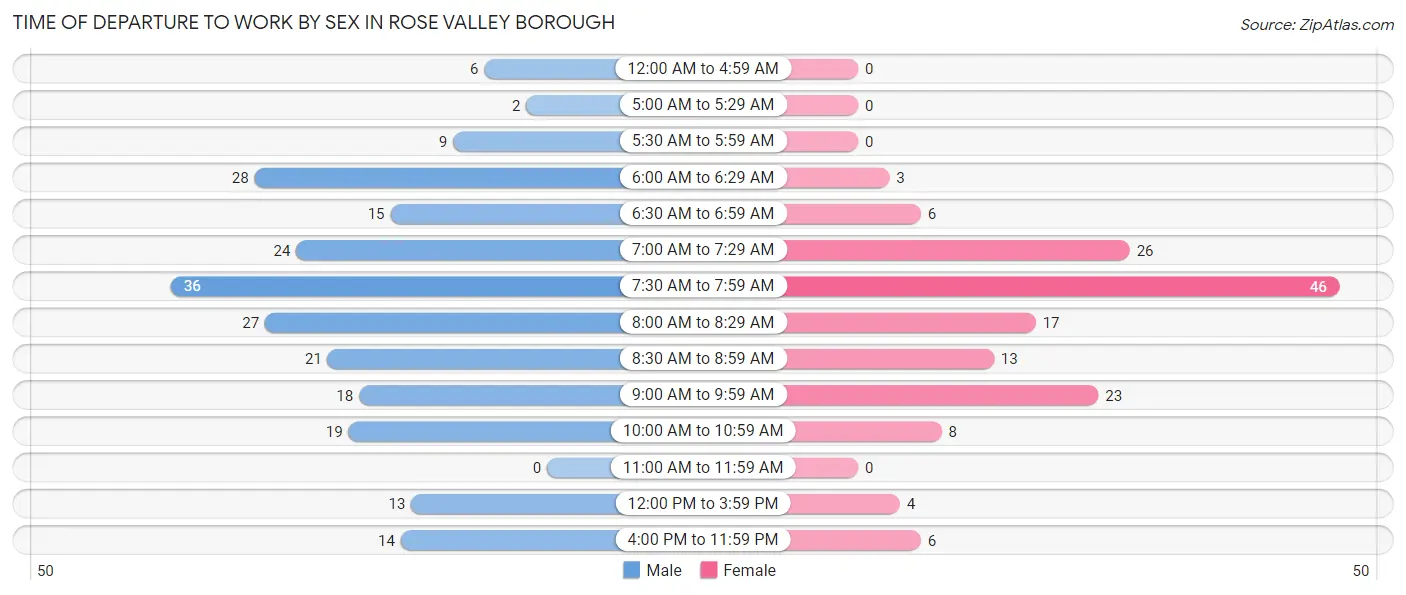
| Time of Departure | Male | Female |
| 12:00 AM to 4:59 AM | 6 (2.6%) | 0 (0.0%) |
| 5:00 AM to 5:29 AM | 2 (0.9%) | 0 (0.0%) |
| 5:30 AM to 5:59 AM | 9 (3.9%) | 0 (0.0%) |
| 6:00 AM to 6:29 AM | 28 (12.1%) | 3 (2.0%) |
| 6:30 AM to 6:59 AM | 15 (6.5%) | 6 (4.0%) |
| 7:00 AM to 7:29 AM | 24 (10.3%) | 26 (17.1%) |
| 7:30 AM to 7:59 AM | 36 (15.5%) | 46 (30.3%) |
| 8:00 AM to 8:29 AM | 27 (11.6%) | 17 (11.2%) |
| 8:30 AM to 8:59 AM | 21 (9.0%) | 13 (8.6%) |
| 9:00 AM to 9:59 AM | 18 (7.8%) | 23 (15.1%) |
| 10:00 AM to 10:59 AM | 19 (8.2%) | 8 (5.3%) |
| 11:00 AM to 11:59 AM | 0 (0.0%) | 0 (0.0%) |
| 12:00 PM to 3:59 PM | 13 (5.6%) | 4 (2.6%) |
| 4:00 PM to 11:59 PM | 14 (6.0%) | 6 (4.0%) |
| Total | 232 (100.0%) | 152 (100.0%) |
Housing Occupancy in Rose Valley borough
Occupancy by Ownership in Rose Valley borough
Of the total 385 dwellings in Rose Valley borough, owner-occupied units account for 374 (97.1%), while renter-occupied units make up 11 (2.9%).
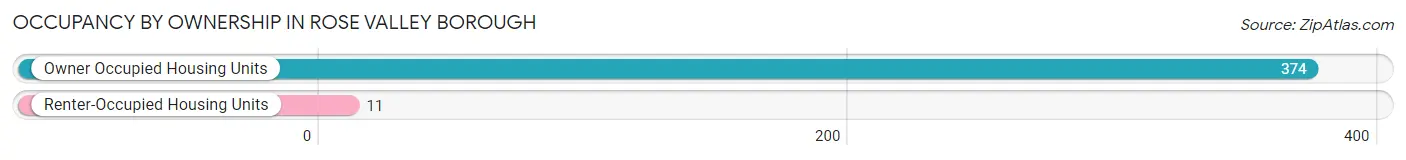
| Occupancy | # Housing Units | % Housing Units |
| Owner Occupied Housing Units | 374 | 97.1% |
| Renter-Occupied Housing Units | 11 | 2.9% |
| Total Occupied Housing Units | 385 | 100.0% |
Occupancy by Household Size in Rose Valley borough
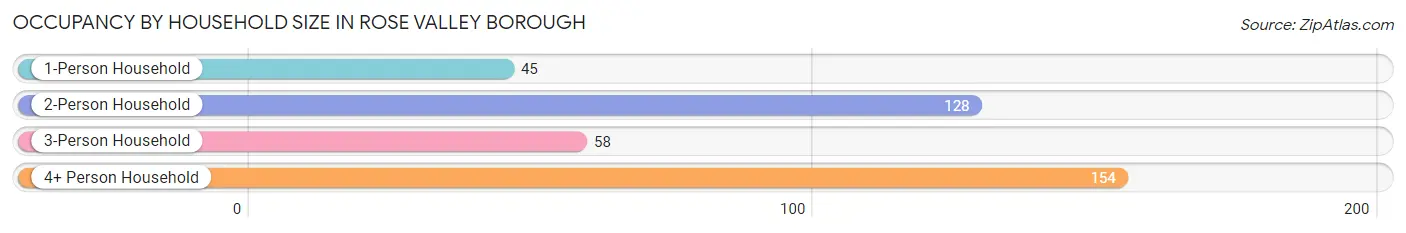
| Household Size | # Housing Units | % Housing Units |
| 1-Person Household | 45 | 11.7% |
| 2-Person Household | 128 | 33.3% |
| 3-Person Household | 58 | 15.1% |
| 4+ Person Household | 154 | 40.0% |
| Total Housing Units | 385 | 100.0% |
Occupancy by Ownership by Household Size in Rose Valley borough
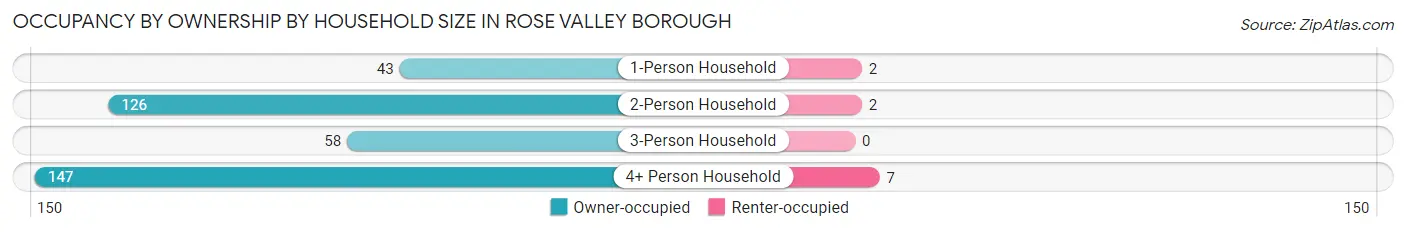
| Household Size | Owner-occupied | Renter-occupied |
| 1-Person Household | 43 (95.6%) | 2 (4.4%) |
| 2-Person Household | 126 (98.4%) | 2 (1.6%) |
| 3-Person Household | 58 (100.0%) | 0 (0.0%) |
| 4+ Person Household | 147 (95.5%) | 7 (4.5%) |
| Total Housing Units | 374 (97.1%) | 11 (2.9%) |
Occupancy by Educational Attainment in Rose Valley borough
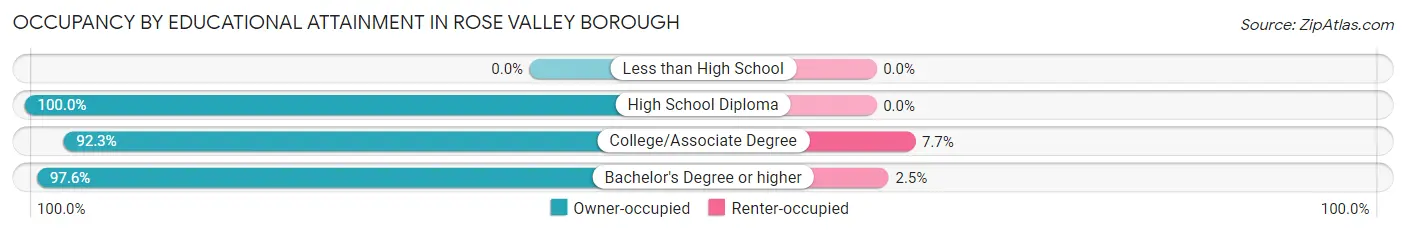
| Household Size | Owner-occupied | Renter-occupied |
| Less than High School | 0 (0.0%) | 0 (0.0%) |
| High School Diploma | 20 (100.0%) | 0 (0.0%) |
| College/Associate Degree | 36 (92.3%) | 3 (7.7%) |
| Bachelor's Degree or higher | 318 (97.6%) | 8 (2.5%) |
Occupancy by Age of Householder in Rose Valley borough
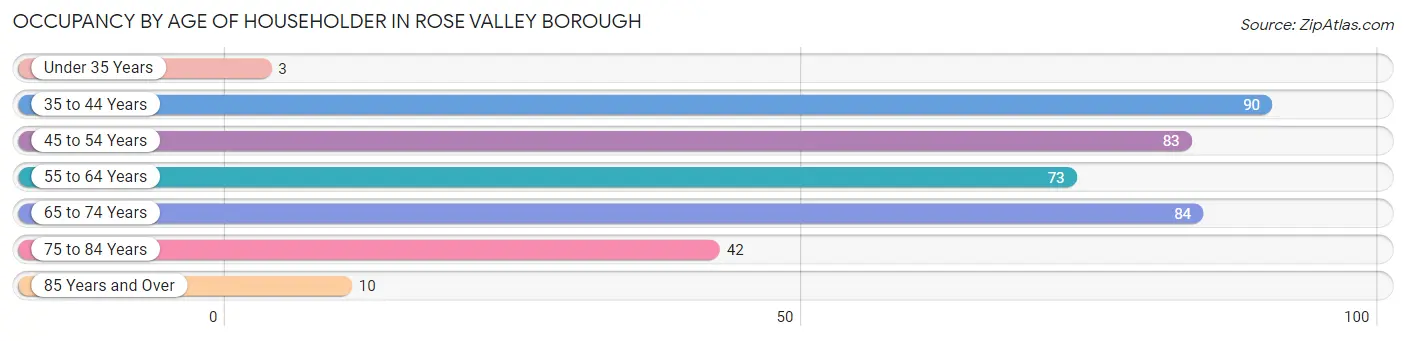
| Age Bracket | # Households | % Households |
| Under 35 Years | 3 | 0.8% |
| 35 to 44 Years | 90 | 23.4% |
| 45 to 54 Years | 83 | 21.6% |
| 55 to 64 Years | 73 | 19.0% |
| 65 to 74 Years | 84 | 21.8% |
| 75 to 84 Years | 42 | 10.9% |
| 85 Years and Over | 10 | 2.6% |
| Total | 385 | 100.0% |
Housing Finances in Rose Valley borough
Median Income by Occupancy in Rose Valley borough
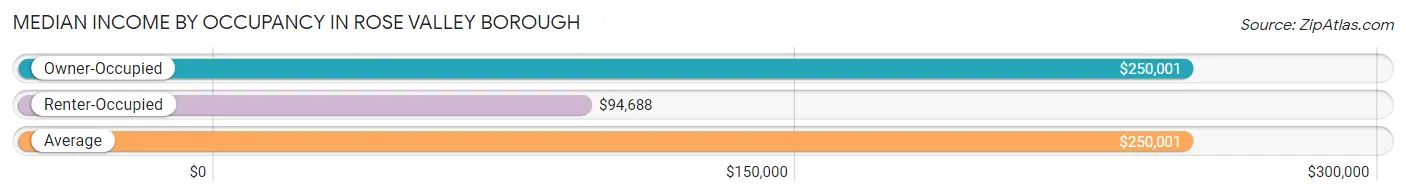
| Occupancy Type | # Households | Median Income |
| Owner-Occupied | 374 (97.1%) | $250,001 |
| Renter-Occupied | 11 (2.9%) | $94,688 |
| Average | 385 (100.0%) | $250,001 |
Occupancy by Householder Income Bracket in Rose Valley borough
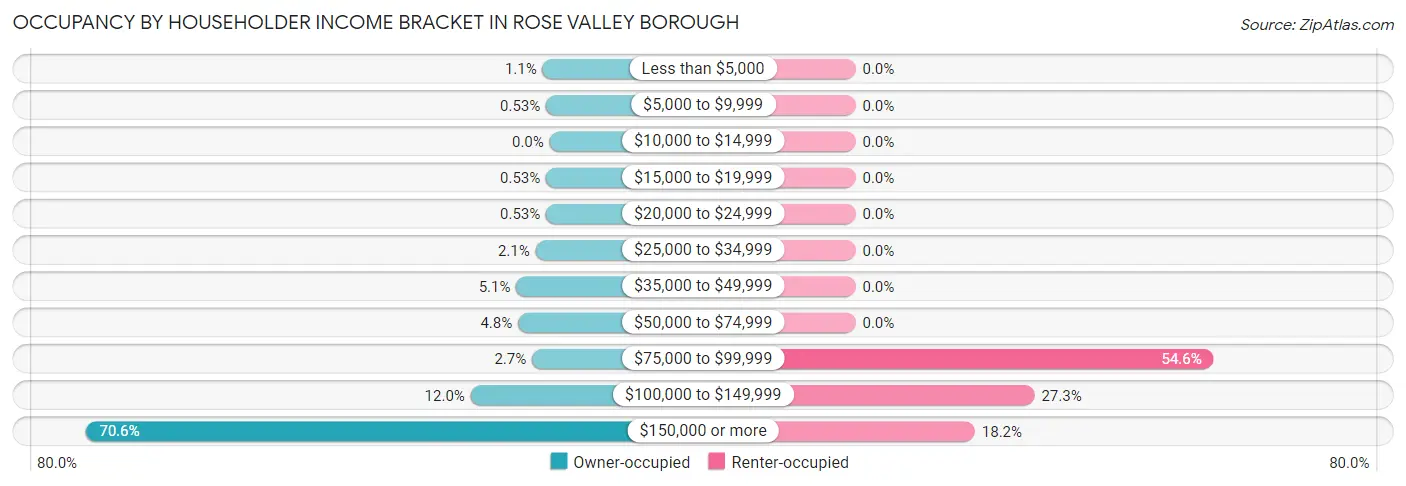
| Income Bracket | Owner-occupied | Renter-occupied |
| Less than $5,000 | 4 (1.1%) | 0 (0.0%) |
| $5,000 to $9,999 | 2 (0.5%) | 0 (0.0%) |
| $10,000 to $14,999 | 0 (0.0%) | 0 (0.0%) |
| $15,000 to $19,999 | 2 (0.5%) | 0 (0.0%) |
| $20,000 to $24,999 | 2 (0.5%) | 0 (0.0%) |
| $25,000 to $34,999 | 8 (2.1%) | 0 (0.0%) |
| $35,000 to $49,999 | 19 (5.1%) | 0 (0.0%) |
| $50,000 to $74,999 | 18 (4.8%) | 0 (0.0%) |
| $75,000 to $99,999 | 10 (2.7%) | 6 (54.5%) |
| $100,000 to $149,999 | 45 (12.0%) | 3 (27.3%) |
| $150,000 or more | 264 (70.6%) | 2 (18.2%) |
| Total | 374 (100.0%) | 11 (100.0%) |
Monthly Housing Cost Tiers in Rose Valley borough
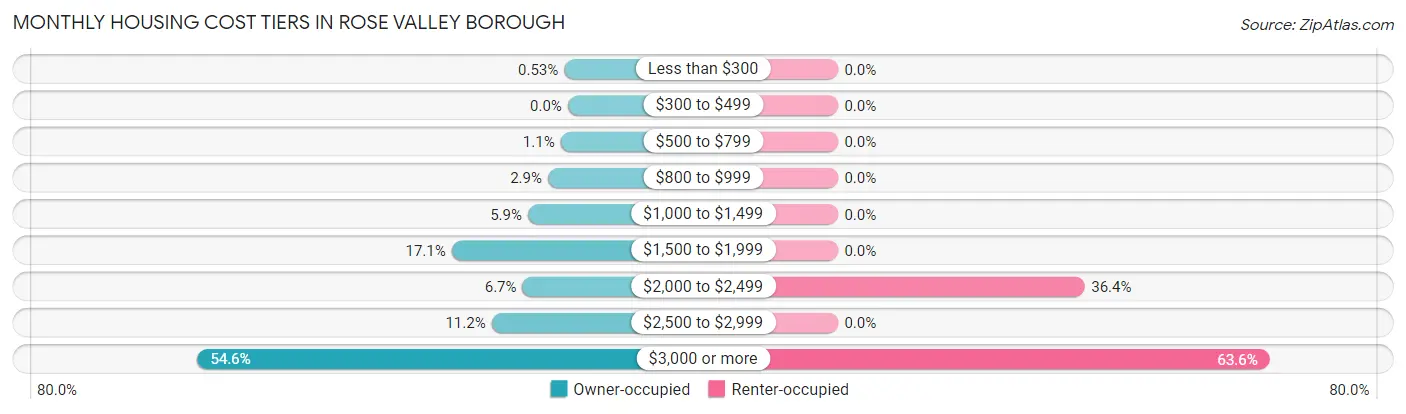
| Monthly Cost | Owner-occupied | Renter-occupied |
| Less than $300 | 2 (0.5%) | 0 (0.0%) |
| $300 to $499 | 0 (0.0%) | 0 (0.0%) |
| $500 to $799 | 4 (1.1%) | 0 (0.0%) |
| $800 to $999 | 11 (2.9%) | 0 (0.0%) |
| $1,000 to $1,499 | 22 (5.9%) | 0 (0.0%) |
| $1,500 to $1,999 | 64 (17.1%) | 0 (0.0%) |
| $2,000 to $2,499 | 25 (6.7%) | 4 (36.4%) |
| $2,500 to $2,999 | 42 (11.2%) | 0 (0.0%) |
| $3,000 or more | 204 (54.5%) | 7 (63.6%) |
| Total | 374 (100.0%) | 11 (100.0%) |
Physical Housing Characteristics in Rose Valley borough
Housing Structures in Rose Valley borough
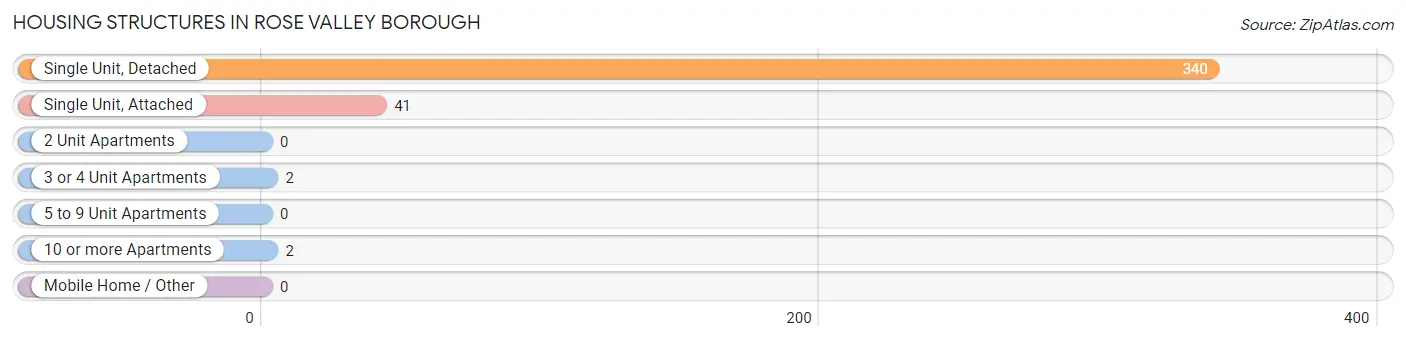
| Structure Type | # Housing Units | % Housing Units |
| Single Unit, Detached | 340 | 88.3% |
| Single Unit, Attached | 41 | 10.6% |
| 2 Unit Apartments | 0 | 0.0% |
| 3 or 4 Unit Apartments | 2 | 0.5% |
| 5 to 9 Unit Apartments | 0 | 0.0% |
| 10 or more Apartments | 2 | 0.5% |
| Mobile Home / Other | 0 | 0.0% |
| Total | 385 | 100.0% |
Housing Structures by Occupancy in Rose Valley borough
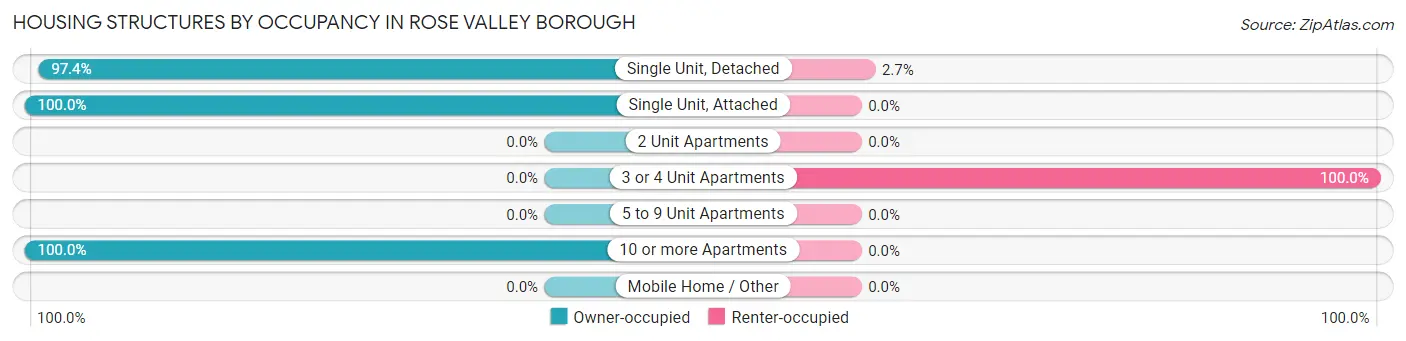
| Structure Type | Owner-occupied | Renter-occupied |
| Single Unit, Detached | 331 (97.4%) | 9 (2.6%) |
| Single Unit, Attached | 41 (100.0%) | 0 (0.0%) |
| 2 Unit Apartments | 0 (0.0%) | 0 (0.0%) |
| 3 or 4 Unit Apartments | 0 (0.0%) | 2 (100.0%) |
| 5 to 9 Unit Apartments | 0 (0.0%) | 0 (0.0%) |
| 10 or more Apartments | 2 (100.0%) | 0 (0.0%) |
| Mobile Home / Other | 0 (0.0%) | 0 (0.0%) |
| Total | 374 (97.1%) | 11 (2.9%) |
Housing Structures by Number of Rooms in Rose Valley borough
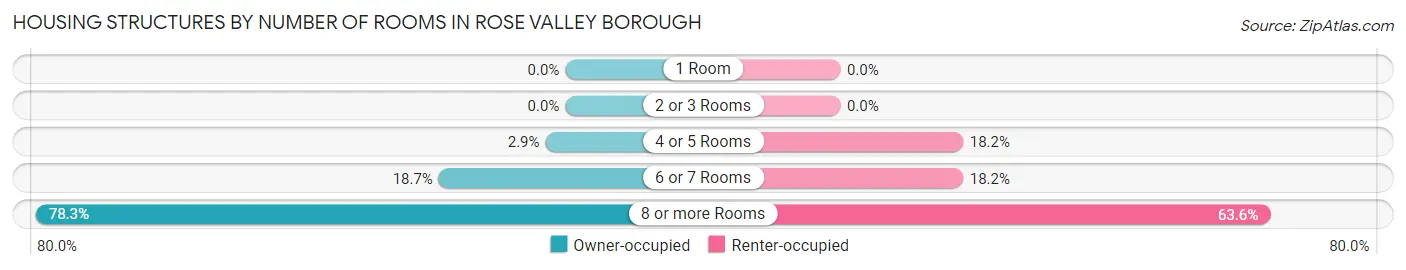
| Number of Rooms | Owner-occupied | Renter-occupied |
| 1 Room | 0 (0.0%) | 0 (0.0%) |
| 2 or 3 Rooms | 0 (0.0%) | 0 (0.0%) |
| 4 or 5 Rooms | 11 (2.9%) | 2 (18.2%) |
| 6 or 7 Rooms | 70 (18.7%) | 2 (18.2%) |
| 8 or more Rooms | 293 (78.3%) | 7 (63.6%) |
| Total | 374 (100.0%) | 11 (100.0%) |
Housing Structure by Heating Type in Rose Valley borough
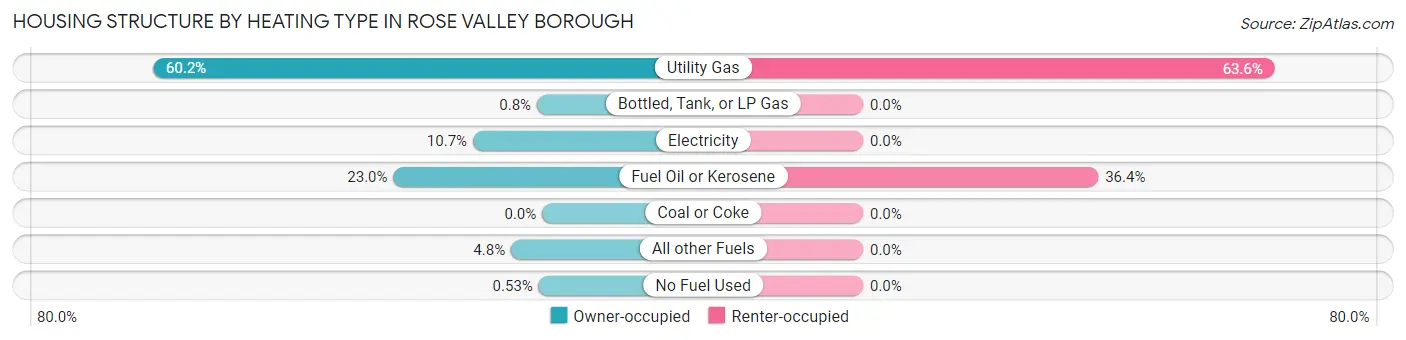
| Heating Type | Owner-occupied | Renter-occupied |
| Utility Gas | 225 (60.2%) | 7 (63.6%) |
| Bottled, Tank, or LP Gas | 3 (0.8%) | 0 (0.0%) |
| Electricity | 40 (10.7%) | 0 (0.0%) |
| Fuel Oil or Kerosene | 86 (23.0%) | 4 (36.4%) |
| Coal or Coke | 0 (0.0%) | 0 (0.0%) |
| All other Fuels | 18 (4.8%) | 0 (0.0%) |
| No Fuel Used | 2 (0.5%) | 0 (0.0%) |
| Total | 374 (100.0%) | 11 (100.0%) |
Household Vehicle Usage in Rose Valley borough
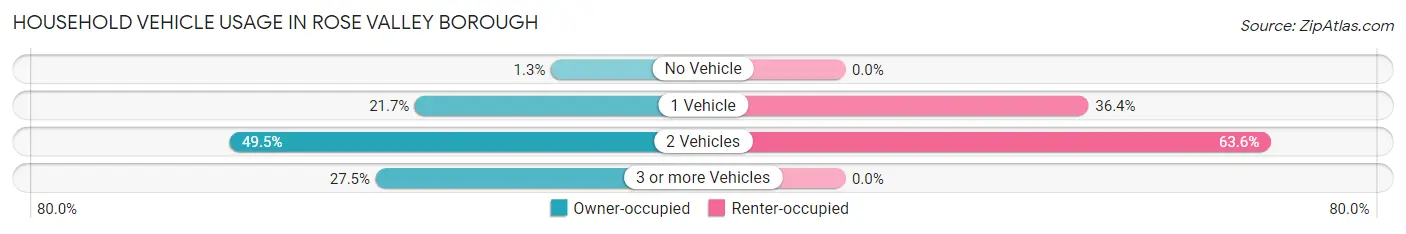
| Vehicles per Household | Owner-occupied | Renter-occupied |
| No Vehicle | 5 (1.3%) | 0 (0.0%) |
| 1 Vehicle | 81 (21.7%) | 4 (36.4%) |
| 2 Vehicles | 185 (49.5%) | 7 (63.6%) |
| 3 or more Vehicles | 103 (27.5%) | 0 (0.0%) |
| Total | 374 (100.0%) | 11 (100.0%) |
Real Estate & Mortgages in Rose Valley borough
Real Estate and Mortgage Overview in Rose Valley borough
| Characteristic | Without Mortgage | With Mortgage |
| Housing Units | 151 | 223 |
| Median Property Value | $720,700 | $652,300 |
| Median Household Income | $161,875 | $185 |
| Monthly Housing Costs | $1,501 | $181 |
| Real Estate Taxes | $10,001 | $3 |
Property Value by Mortgage Status in Rose Valley borough
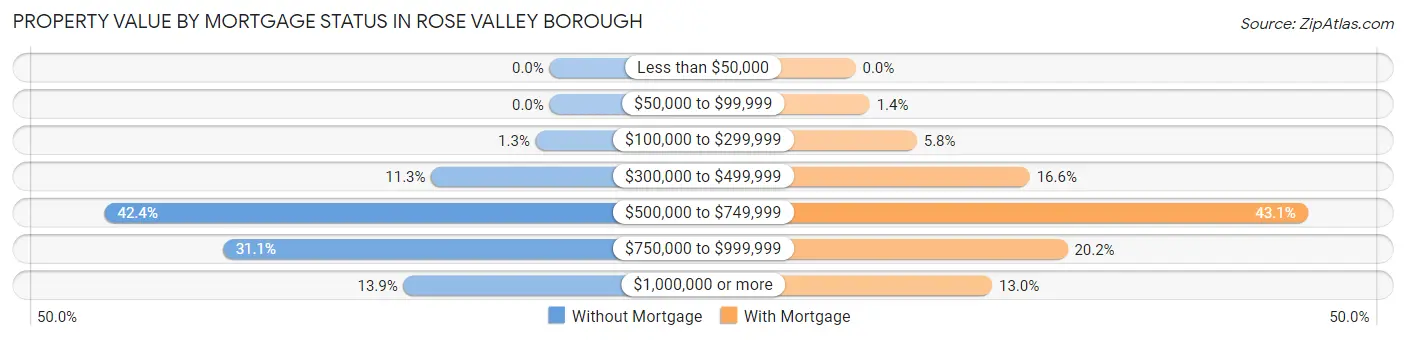
| Property Value | Without Mortgage | With Mortgage |
| Less than $50,000 | 0 (0.0%) | 0 (0.0%) |
| $50,000 to $99,999 | 0 (0.0%) | 3 (1.3%) |
| $100,000 to $299,999 | 2 (1.3%) | 13 (5.8%) |
| $300,000 to $499,999 | 17 (11.3%) | 37 (16.6%) |
| $500,000 to $749,999 | 64 (42.4%) | 96 (43.0%) |
| $750,000 to $999,999 | 47 (31.1%) | 45 (20.2%) |
| $1,000,000 or more | 21 (13.9%) | 29 (13.0%) |
| Total | 151 (100.0%) | 223 (100.0%) |
Household Income by Mortgage Status in Rose Valley borough
| Household Income | Without Mortgage | With Mortgage |
| Less than $10,000 | 3 (2.0%) | 2 (0.9%) |
| $10,000 to $24,999 | 2 (1.3%) | 3 (1.3%) |
| $25,000 to $34,999 | 0 (0.0%) | 2 (0.9%) |
| $35,000 to $49,999 | 11 (7.3%) | 8 (3.6%) |
| $50,000 to $74,999 | 11 (7.3%) | 8 (3.6%) |
| $75,000 to $99,999 | 10 (6.6%) | 7 (3.1%) |
| $100,000 to $149,999 | 35 (23.2%) | 0 (0.0%) |
| $150,000 or more | 79 (52.3%) | 10 (4.5%) |
| Total | 151 (100.0%) | 223 (100.0%) |
Property Value to Household Income Ratio in Rose Valley borough
| Value-to-Income Ratio | Without Mortgage | With Mortgage |
| Less than 2.0x | 31 (20.5%) | 250,001 (112,108.1%) |
| 2.0x to 2.9x | 28 (18.5%) | 90 (40.4%) |
| 3.0x to 3.9x | 23 (15.2%) | 60 (26.9%) |
| 4.0x or more | 68 (45.0%) | 39 (17.5%) |
| Total | 151 (100.0%) | 223 (100.0%) |
Real Estate Taxes by Mortgage Status in Rose Valley borough
| Property Taxes | Without Mortgage | With Mortgage |
| Less than $800 | 0 (0.0%) | 0 (0.0%) |
| $800 to $1,499 | 0 (0.0%) | 0 (0.0%) |
| $800 to $1,499 | 149 (98.7%) | 0 (0.0%) |
| Total | 151 (100.0%) | 223 (100.0%) |
Health & Disability in Rose Valley borough
Health Insurance Coverage by Age in Rose Valley borough
| Age Bracket | With Coverage | Without Coverage |
| Under 6 Years | 154 (100.0%) | 0 (0.0%) |
| 6 to 18 Years | 227 (97.0%) | 7 (3.0%) |
| 19 to 25 Years | 35 (89.7%) | 4 (10.3%) |
| 26 to 34 Years | 45 (100.0%) | 0 (0.0%) |
| 35 to 44 Years | 182 (96.3%) | 7 (3.7%) |
| 45 to 54 Years | 140 (95.2%) | 7 (4.8%) |
| 55 to 64 Years | 133 (94.3%) | 8 (5.7%) |
| 65 to 74 Years | 140 (100.0%) | 0 (0.0%) |
| 75 Years and older | 98 (100.0%) | 0 (0.0%) |
| Total | 1,154 (97.2%) | 33 (2.8%) |
Health Insurance Coverage by Citizenship Status in Rose Valley borough
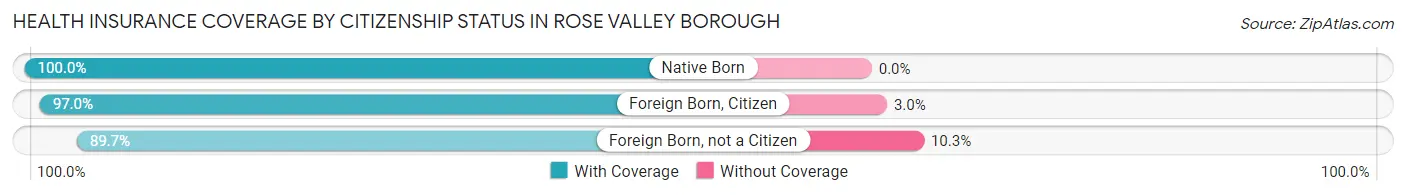
| Citizenship Status | With Coverage | Without Coverage |
| Native Born | 154 (100.0%) | 0 (0.0%) |
| Foreign Born, Citizen | 227 (97.0%) | 7 (3.0%) |
| Foreign Born, not a Citizen | 35 (89.7%) | 4 (10.3%) |
Health Insurance Coverage by Household Income in Rose Valley borough
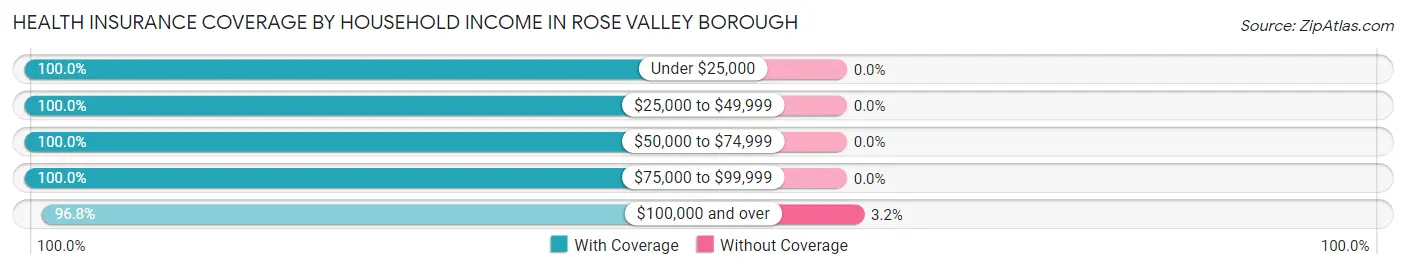
| Household Income | With Coverage | Without Coverage |
| Under $25,000 | 12 (100.0%) | 0 (0.0%) |
| $25,000 to $49,999 | 65 (100.0%) | 0 (0.0%) |
| $50,000 to $74,999 | 51 (100.0%) | 0 (0.0%) |
| $75,000 to $99,999 | 33 (100.0%) | 0 (0.0%) |
| $100,000 and over | 984 (96.8%) | 33 (3.2%) |
Public vs Private Health Insurance Coverage by Age in Rose Valley borough
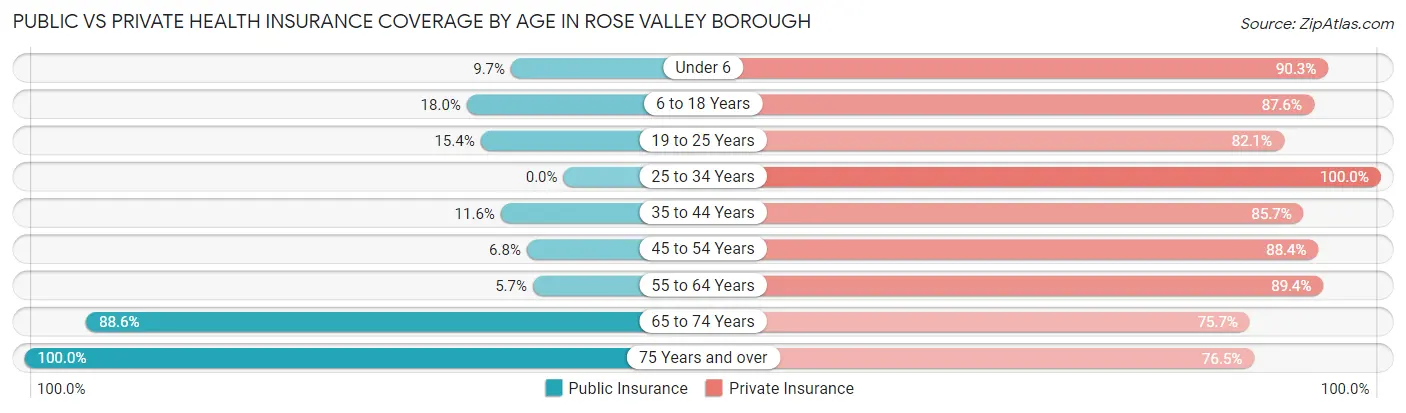
| Age Bracket | Public Insurance | Private Insurance |
| Under 6 | 15 (9.7%) | 139 (90.3%) |
| 6 to 18 Years | 42 (17.9%) | 205 (87.6%) |
| 19 to 25 Years | 6 (15.4%) | 32 (82.1%) |
| 25 to 34 Years | 0 (0.0%) | 45 (100.0%) |
| 35 to 44 Years | 22 (11.6%) | 162 (85.7%) |
| 45 to 54 Years | 10 (6.8%) | 130 (88.4%) |
| 55 to 64 Years | 8 (5.7%) | 126 (89.4%) |
| 65 to 74 Years | 124 (88.6%) | 106 (75.7%) |
| 75 Years and over | 98 (100.0%) | 75 (76.5%) |
| Total | 325 (27.4%) | 1,020 (85.9%) |
Disability Status by Sex by Age in Rose Valley borough
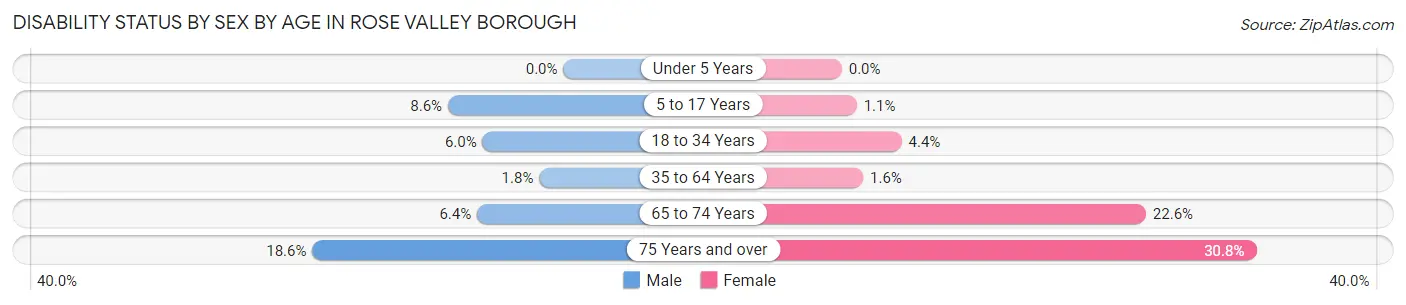
| Age Bracket | Male | Female |
| Under 5 Years | 0 (0.0%) | 0 (0.0%) |
| 5 to 17 Years | 9 (8.6%) | 2 (1.1%) |
| 18 to 34 Years | 3 (6.0%) | 2 (4.4%) |
| 35 to 64 Years | 4 (1.8%) | 4 (1.6%) |
| 65 to 74 Years | 5 (6.4%) | 14 (22.6%) |
| 75 Years and over | 11 (18.6%) | 12 (30.8%) |
Disability Class by Sex by Age in Rose Valley borough
Disability Class: Hearing Difficulty
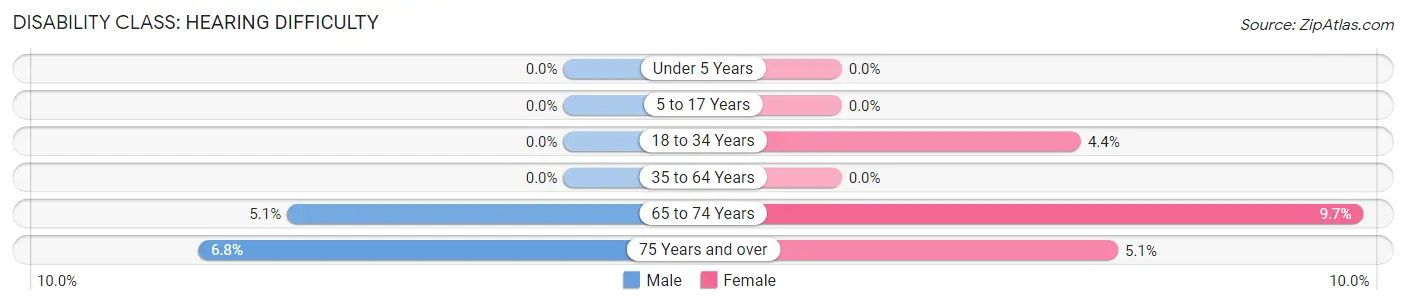
| Age Bracket | Male | Female |
| Under 5 Years | 0 (0.0%) | 0 (0.0%) |
| 5 to 17 Years | 0 (0.0%) | 0 (0.0%) |
| 18 to 34 Years | 0 (0.0%) | 2 (4.4%) |
| 35 to 64 Years | 0 (0.0%) | 0 (0.0%) |
| 65 to 74 Years | 4 (5.1%) | 6 (9.7%) |
| 75 Years and over | 4 (6.8%) | 2 (5.1%) |
Disability Class: Vision Difficulty
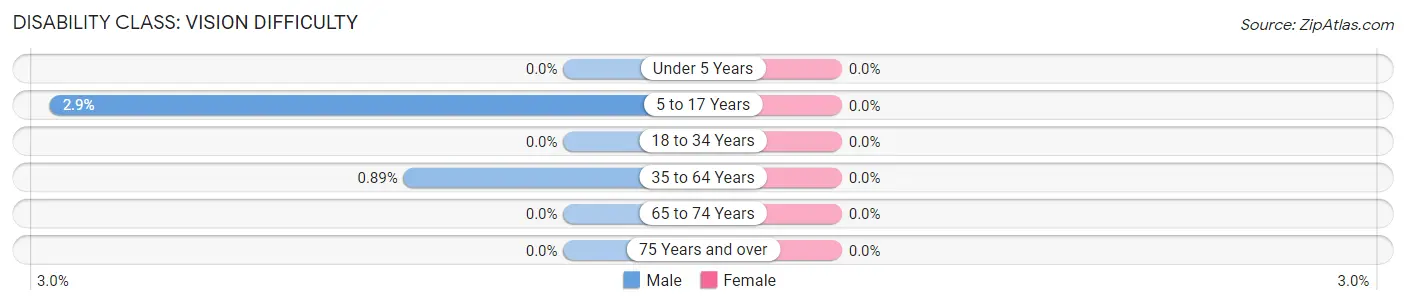
| Age Bracket | Male | Female |
| Under 5 Years | 0 (0.0%) | 0 (0.0%) |
| 5 to 17 Years | 3 (2.9%) | 0 (0.0%) |
| 18 to 34 Years | 0 (0.0%) | 0 (0.0%) |
| 35 to 64 Years | 2 (0.9%) | 0 (0.0%) |
| 65 to 74 Years | 0 (0.0%) | 0 (0.0%) |
| 75 Years and over | 0 (0.0%) | 0 (0.0%) |
Disability Class: Cognitive Difficulty
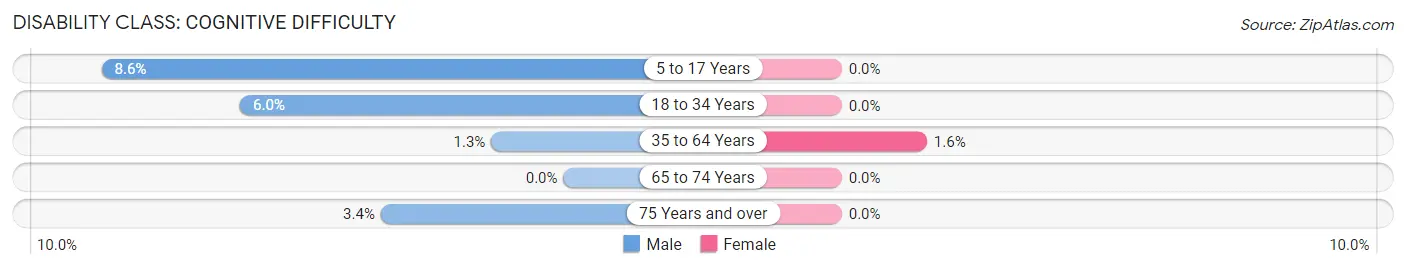
| Age Bracket | Male | Female |
| 5 to 17 Years | 9 (8.6%) | 0 (0.0%) |
| 18 to 34 Years | 3 (6.0%) | 0 (0.0%) |
| 35 to 64 Years | 3 (1.3%) | 4 (1.6%) |
| 65 to 74 Years | 0 (0.0%) | 0 (0.0%) |
| 75 Years and over | 2 (3.4%) | 0 (0.0%) |
Disability Class: Ambulatory Difficulty
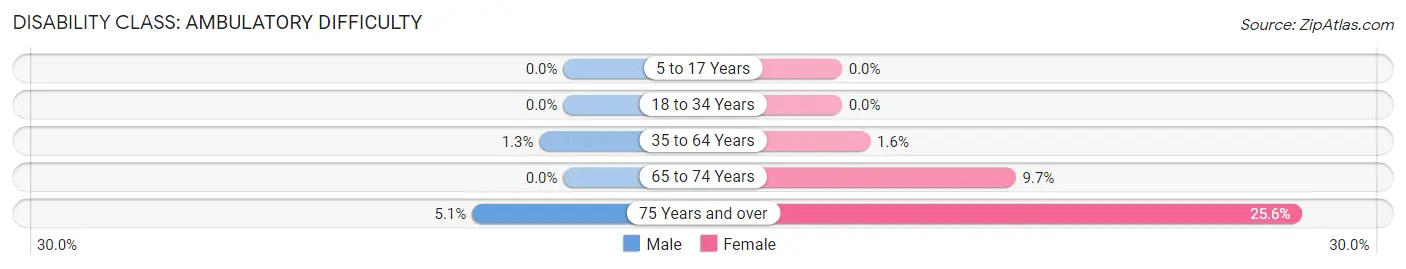
| Age Bracket | Male | Female |
| 5 to 17 Years | 0 (0.0%) | 0 (0.0%) |
| 18 to 34 Years | 0 (0.0%) | 0 (0.0%) |
| 35 to 64 Years | 3 (1.3%) | 4 (1.6%) |
| 65 to 74 Years | 0 (0.0%) | 6 (9.7%) |
| 75 Years and over | 3 (5.1%) | 10 (25.6%) |
Disability Class: Self-Care Difficulty
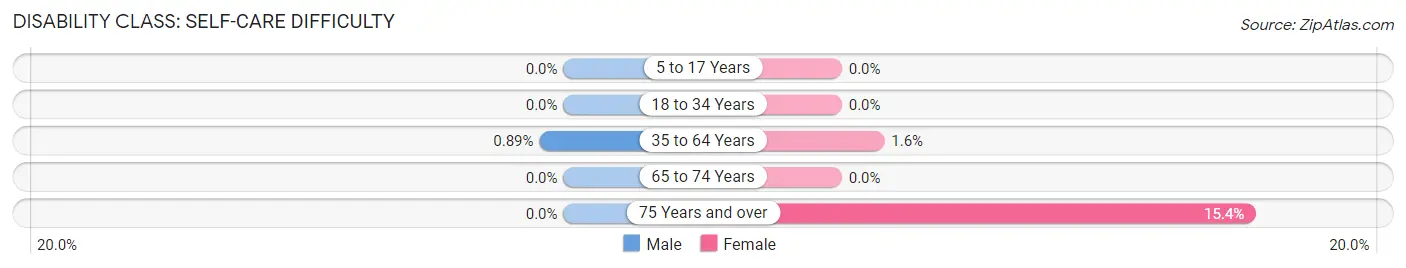
| Age Bracket | Male | Female |
| 5 to 17 Years | 0 (0.0%) | 0 (0.0%) |
| 18 to 34 Years | 0 (0.0%) | 0 (0.0%) |
| 35 to 64 Years | 2 (0.9%) | 4 (1.6%) |
| 65 to 74 Years | 0 (0.0%) | 0 (0.0%) |
| 75 Years and over | 0 (0.0%) | 6 (15.4%) |
Technology Access in Rose Valley borough
Computing Device Access in Rose Valley borough
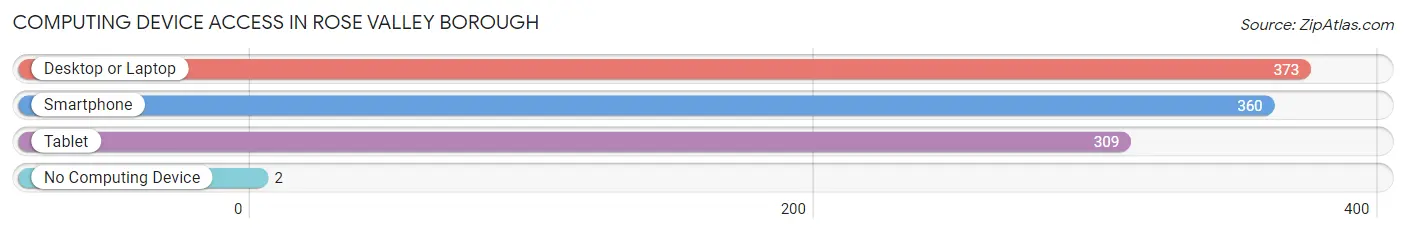
| Device Type | # Households | % Households |
| Desktop or Laptop | 373 | 96.9% |
| Smartphone | 360 | 93.5% |
| Tablet | 309 | 80.3% |
| No Computing Device | 2 | 0.5% |
| Total | 385 | 100.0% |
Internet Access in Rose Valley borough
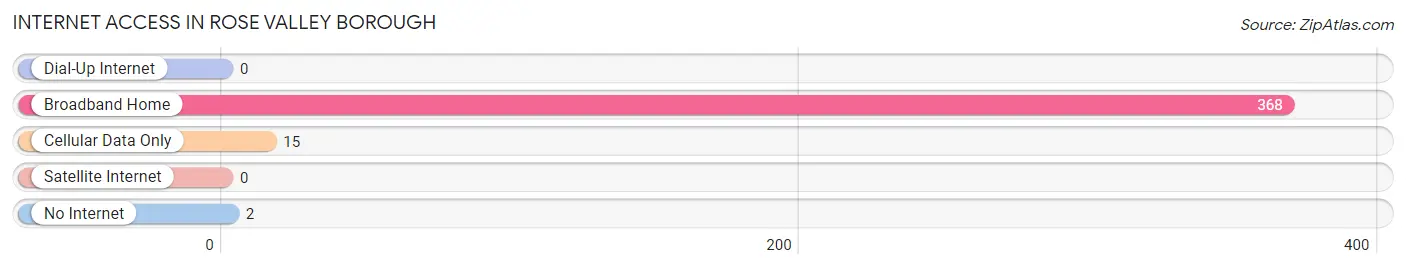
| Internet Type | # Households | % Households |
| Dial-Up Internet | 0 | 0.0% |
| Broadband Home | 368 | 95.6% |
| Cellular Data Only | 15 | 3.9% |
| Satellite Internet | 0 | 0.0% |
| No Internet | 2 | 0.5% |
| Total | 385 | 100.0% |
Rose Valley borough Summary
Valley Forge
Valley Forge is a borough in Chester County, Pennsylvania, United States. It is located approximately 25 miles northwest of Philadelphia and is part of the Greater Philadelphia Metropolitan Area. The population was 3,553 at the 2010 census.
History
The area that is now Valley Forge was originally inhabited by the Lenape Indians. The first European settlers arrived in the area in the late 17th century. The area was originally part of the Welsh Tract, a large tract of land granted to Welsh Quakers by William Penn in 1681. The area was known as Welsh Tract until the late 18th century, when it was renamed Valley Forge.
The area was the site of the Continental Army's winter encampment during the Revolutionary War. The encampment lasted from December 19, 1777 to June 19, 1778. During this time, the Continental Army was led by General George Washington. The encampment was a difficult time for the soldiers, as they were poorly supplied and suffered from the cold winter weather. Despite the hardships, the soldiers persevered and emerged from the encampment stronger and better prepared for the war.
The area was also the site of the Valley Forge Convention, a meeting of the Continental Congress in 1777. The convention was held to discuss the formation of a new government for the United States.
Geography
Valley Forge is located at 40°6'17" North, 75°30'25" West (40.104722, -75.506944). According to the United States Census Bureau, the borough has a total area of 2.2 square miles, all of it land.
Economy
Valley Forge is home to several large corporations, including the Valley Forge Casino Resort, the Valley Forge Convention Center, and the Valley Forge National Historical Park. The borough is also home to several small businesses, including restaurants, shops, and professional services.
Demographics
As of the 2010 census, there were 3,553 people, 1,521 households, and 890 families residing in the borough. The population density was 1,619.2 people per square mile. The racial makeup of the borough was 87.3% White, 5.3% African American, 0.2% Native American, 3.2% Asian, 0.1% Pacific Islander, 1.2% from other races, and 2.7% from two or more races. Hispanic or Latino of any race were 4.2% of the population.
The median income for a household in the borough was $60,938, and the median income for a family was $76,944. Males had a median income of $50,000 versus $41,250 for females. The per capita income for the borough was $30,945. About 3.2% of families and 4.7% of the population were below the poverty line, including 5.3% of those under age 18 and 4.2% of those age 65 or over.
Conclusion
Valley Forge is a borough in Chester County, Pennsylvania, located approximately 25 miles northwest of Philadelphia. The area was originally inhabited by the Lenape Indians and was later the site of the Continental Army's winter encampment during the Revolutionary War. The borough is home to several large corporations, including the Valley Forge Casino Resort, the Valley Forge Convention Center, and the Valley Forge National Historical Park. As of the 2010 census, the population of Valley Forge was 3,553. The median income for a household in the borough was $60,938, and the median income for a family was $76,944. Valley Forge is an important part of Pennsylvania's history and continues to be an important part of the Greater Philadelphia Metropolitan Area.
Common Questions
What is Per Capita Income in Rose Valley borough?
Per Capita income in Rose Valley borough is $103,224.
What is the Median Family Income in Rose Valley borough?
Median Family Income in Rose Valley borough is $250,001.
What is the Median Household income in Rose Valley borough?
Median Household Income in Rose Valley borough is $250,001.
What is Income or Wage Gap in Rose Valley borough?
Income or Wage Gap in Rose Valley borough is 38.8%.
Women in Rose Valley borough earn 61.2 cents for every dollar earned by a man.
What is Inequality or Gini Index in Rose Valley borough?
Inequality or Gini Index in Rose Valley borough is 0.45.
What is the Total Population of Rose Valley borough?
Total Population of Rose Valley borough is 1,187.
What is the Total Male Population of Rose Valley borough?
Total Male Population of Rose Valley borough is 587.
What is the Total Female Population of Rose Valley borough?
Total Female Population of Rose Valley borough is 600.
What is the Ratio of Males per 100 Females in Rose Valley borough?
There are 97.83 Males per 100 Females in Rose Valley borough.
What is the Ratio of Females per 100 Males in Rose Valley borough?
There are 102.21 Females per 100 Males in Rose Valley borough.
What is the Median Population Age in Rose Valley borough?
Median Population Age in Rose Valley borough is 41.5 Years.
What is the Average Family Size in Rose Valley borough
Average Family Size in Rose Valley borough is 3.3 People.
What is the Average Household Size in Rose Valley borough
Average Household Size in Rose Valley borough is 3.1 People.
How Large is the Labor Force in Rose Valley borough?
There are 528 People in the Labor Forcein in Rose Valley borough.
What is the Percentage of People in the Labor Force in Rose Valley borough?
62.6% of People are in the Labor Force in Rose Valley borough.
What is the Unemployment Rate in Rose Valley borough?
Unemployment Rate in Rose Valley borough is 1.1%.