Avonmore borough, PA Map & Demographics
Avonmore borough Overview
$28,796
PER CAPITA INCOME
$82,993
AVG FAMILY INCOME
$53,750
AVG HOUSEHOLD INCOME
11.0%
WAGE / INCOME GAP [ % ]
89.0¢/ $1
WAGE / INCOME GAP [ $ ]
0.39
INEQUALITY / GINI INDEX
1,079
TOTAL POPULATION
587
MALE POPULATION
492
FEMALE POPULATION
119.31
MALES / 100 FEMALES
83.82
FEMALES / 100 MALES
50.6
MEDIAN AGE
2.9
AVG FAMILY SIZE
2.3
AVG HOUSEHOLD SIZE
622
LABOR FORCE [ PEOPLE ]
61.2%
PERCENT IN LABOR FORCE
4.2%
UNEMPLOYMENT RATE
Income in Avonmore borough
Income Overview in Avonmore borough
Per Capita Income in Avonmore borough is $28,796, while median incomes of families and households are $82,993 and $53,750 respectively.
| Characteristic | Number | Measure |
| Per Capita Income | 1,079 | $28,796 |
| Median Family Income | 265 | $82,993 |
| Mean Family Income | 265 | $77,649 |
| Median Household Income | 477 | $53,750 |
| Mean Household Income | 477 | $61,784 |
| Income Deficit | 265 | $0 |
| Wage / Income Gap (%) | 1,079 | 10.95% |
| Wage / Income Gap ($) | 1,079 | 89.05¢ per $1 |
| Gini / Inequality Index | 1,079 | 0.39 |
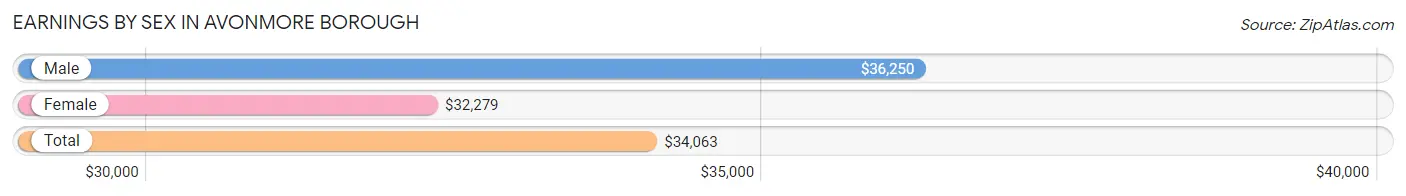
Earnings by Sex in Avonmore borough
Average Earnings in Avonmore borough are $34,063, $36,250 for men and $32,279 for women, a difference of 11.0%.
| Sex | Number | Average Earnings |
| Male | 340 (54.7%) | $36,250 |
| Female | 282 (45.3%) | $32,279 |
| Total | 622 (100.0%) | $34,063 |
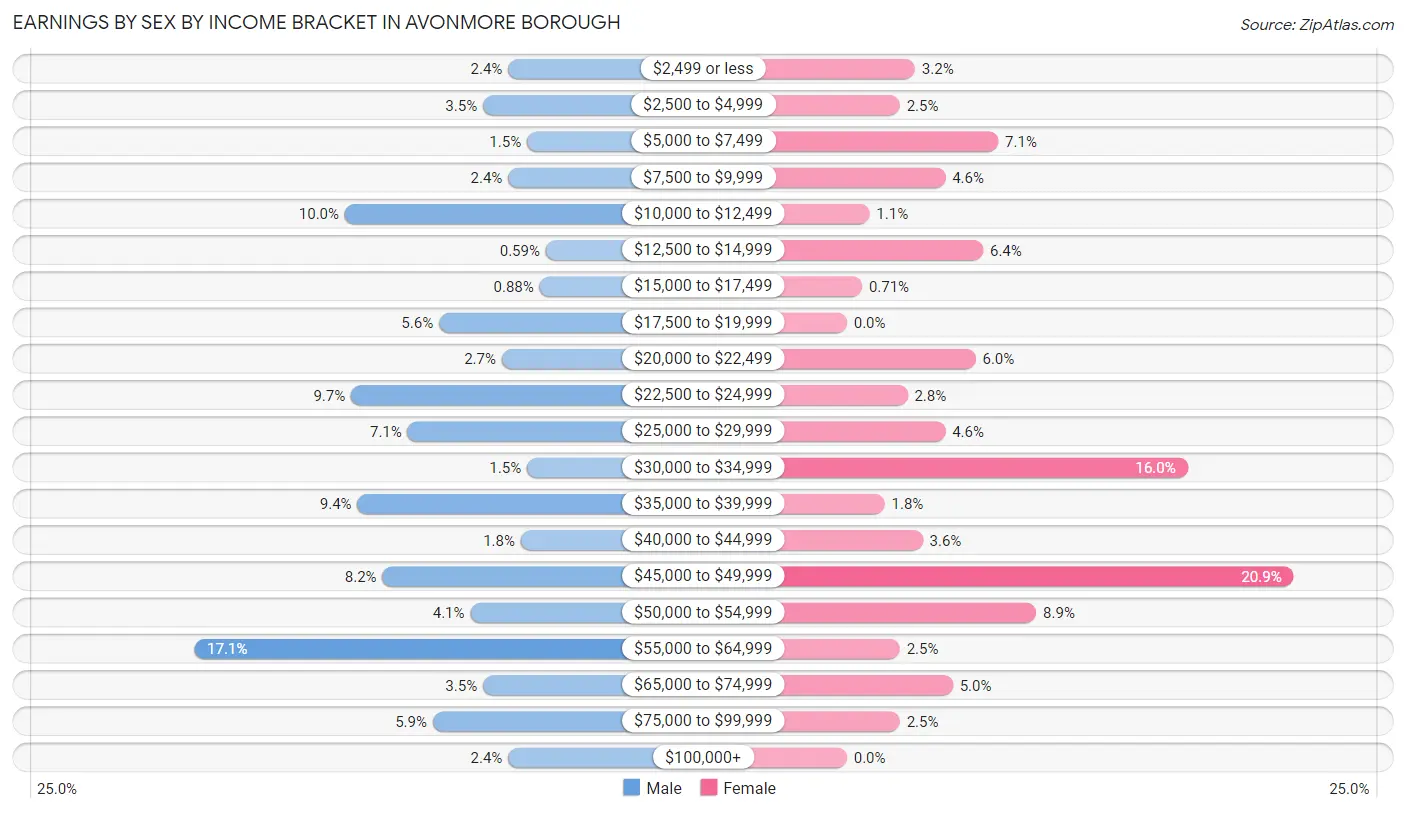
Earnings by Sex by Income Bracket in Avonmore borough
The most common earnings brackets in Avonmore borough are $55,000 to $64,999 for men (58 | 17.1%) and $45,000 to $49,999 for women (59 | 20.9%).
| Income | Male | Female |
| $2,499 or less | 8 (2.4%) | 9 (3.2%) |
| $2,500 to $4,999 | 12 (3.5%) | 7 (2.5%) |
| $5,000 to $7,499 | 5 (1.5%) | 20 (7.1%) |
| $7,500 to $9,999 | 8 (2.4%) | 13 (4.6%) |
| $10,000 to $12,499 | 34 (10.0%) | 3 (1.1%) |
| $12,500 to $14,999 | 2 (0.6%) | 18 (6.4%) |
| $15,000 to $17,499 | 3 (0.9%) | 2 (0.7%) |
| $17,500 to $19,999 | 19 (5.6%) | 0 (0.0%) |
| $20,000 to $22,499 | 9 (2.6%) | 17 (6.0%) |
| $22,500 to $24,999 | 33 (9.7%) | 8 (2.8%) |
| $25,000 to $29,999 | 24 (7.1%) | 13 (4.6%) |
| $30,000 to $34,999 | 5 (1.5%) | 45 (16.0%) |
| $35,000 to $39,999 | 32 (9.4%) | 5 (1.8%) |
| $40,000 to $44,999 | 6 (1.8%) | 10 (3.5%) |
| $45,000 to $49,999 | 28 (8.2%) | 59 (20.9%) |
| $50,000 to $54,999 | 14 (4.1%) | 25 (8.9%) |
| $55,000 to $64,999 | 58 (17.1%) | 7 (2.5%) |
| $65,000 to $74,999 | 12 (3.5%) | 14 (5.0%) |
| $75,000 to $99,999 | 20 (5.9%) | 7 (2.5%) |
| $100,000+ | 8 (2.4%) | 0 (0.0%) |
| Total | 340 (100.0%) | 282 (100.0%) |
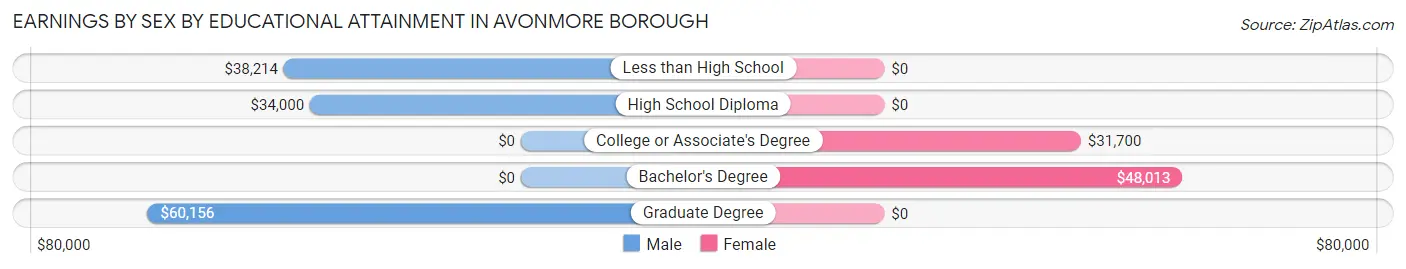
Earnings by Sex by Educational Attainment in Avonmore borough
Average earnings in Avonmore borough are $38,203 for men and $38,250 for women, a difference of 0.1%. Men with an educational attainment of graduate degree enjoy the highest average annual earnings of $60,156, while those with high school diploma education earn the least with $34,000. Women with an educational attainment of bachelor's degree earn the most with the average annual earnings of $48,013, while those with college or associate's degree education have the smallest earnings of $31,700.
| Educational Attainment | Male Income | Female Income |
| Less than High School | $38,214 | $0 |
| High School Diploma | $34,000 | $0 |
| College or Associate's Degree | - | - |
| Bachelor's Degree | - | - |
| Graduate Degree | $60,156 | $0 |
| Total | $38,203 | $38,250 |
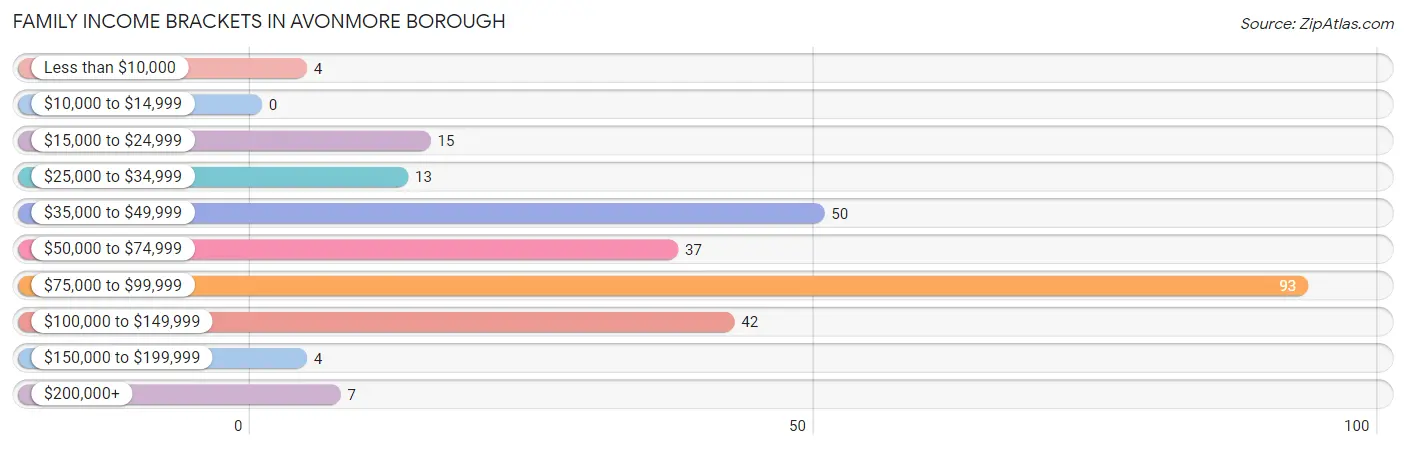
Family Income in Avonmore borough
Family Income Brackets in Avonmore borough
According to the Avonmore borough family income data, there are 93 families falling into the $75,000 to $99,999 income range, which is the most common income bracket and makes up 35.1% of all families.
| Income Bracket | # Families | % Families |
| Less than $10,000 | 4 | 1.5% |
| $10,000 to $14,999 | 0 | 0.0% |
| $15,000 to $24,999 | 15 | 5.7% |
| $25,000 to $34,999 | 13 | 4.9% |
| $35,000 to $49,999 | 50 | 18.9% |
| $50,000 to $74,999 | 37 | 14.0% |
| $75,000 to $99,999 | 93 | 35.1% |
| $100,000 to $149,999 | 42 | 15.8% |
| $150,000 to $199,999 | 4 | 1.5% |
| $200,000+ | 7 | 2.6% |
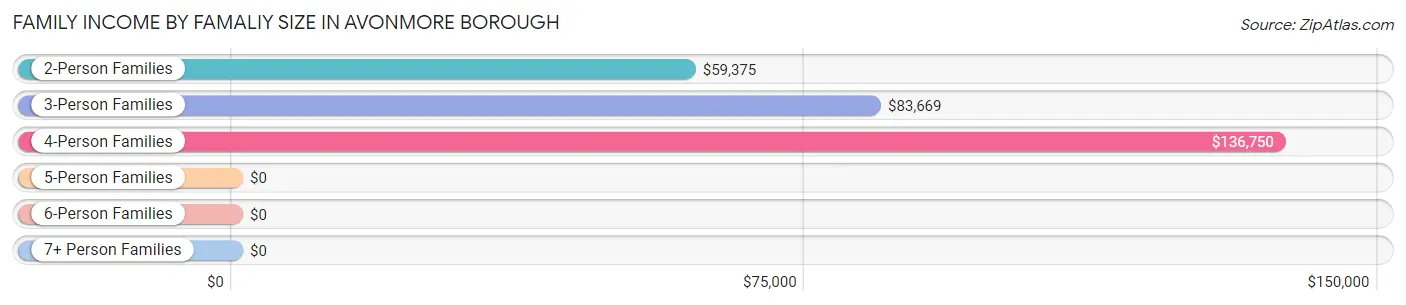
Family Income by Famaliy Size in Avonmore borough
4-person families (31 | 11.7%) account for the highest median family income in Avonmore borough with $136,750 per family, while 4-person families (31 | 11.7%) have the highest median income of $34,188 per family member.
| Income Bracket | # Families | Median Income |
| 2-Person Families | 152 (57.4%) | $59,375 |
| 3-Person Families | 75 (28.3%) | $83,669 |
| 4-Person Families | 31 (11.7%) | $136,750 |
| 5-Person Families | 0 (0.0%) | $0 |
| 6-Person Families | 7 (2.6%) | $0 |
| 7+ Person Families | 0 (0.0%) | $0 |
| Total | 265 (100.0%) | $82,993 |
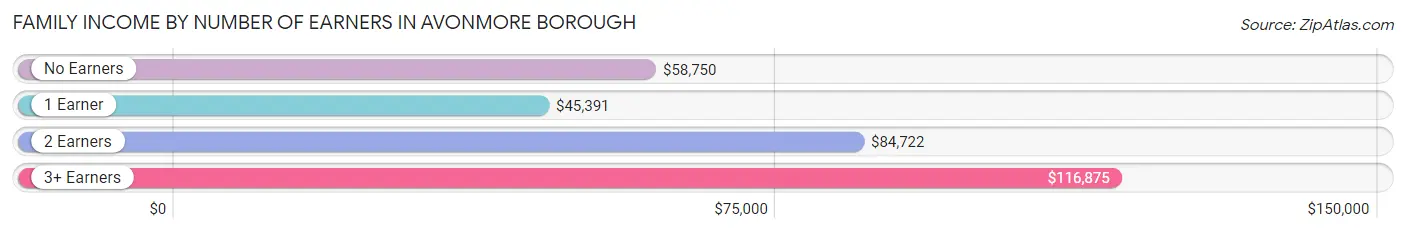
Family Income by Number of Earners in Avonmore borough
The median family income in Avonmore borough is $82,993, with families comprising 3+ earners (40) having the highest median family income of $116,875, while families with 1 earner (57) have the lowest median family income of $45,391, accounting for 15.1% and 21.5% of families, respectively.
| Number of Earners | # Families | Median Income |
| No Earners | 46 (17.4%) | $58,750 |
| 1 Earner | 57 (21.5%) | $45,391 |
| 2 Earners | 122 (46.0%) | $84,722 |
| 3+ Earners | 40 (15.1%) | $116,875 |
| Total | 265 (100.0%) | $82,993 |
Household Income in Avonmore borough
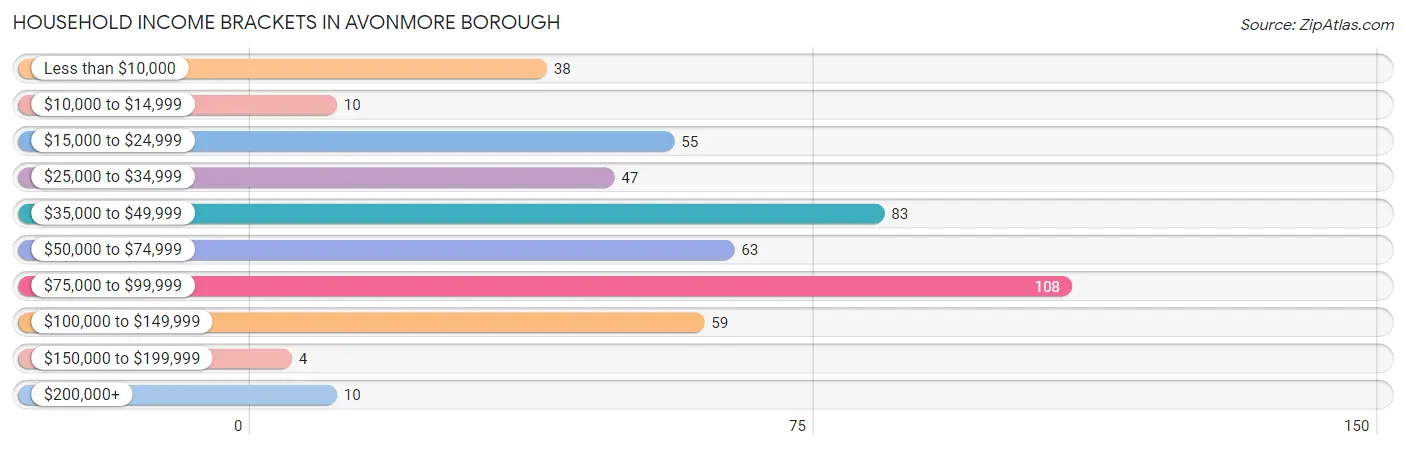
Household Income Brackets in Avonmore borough
With 108 households falling in the category, the $75,000 to $99,999 income range is the most frequent in Avonmore borough, accounting for 22.6% of all households. In contrast, only 4 households (0.8%) fall into the $150,000 to $199,999 income bracket, making it the least populous group.
| Income Bracket | # Households | % Households |
| Less than $10,000 | 38 | 8.0% |
| $10,000 to $14,999 | 10 | 2.1% |
| $15,000 to $24,999 | 55 | 11.5% |
| $25,000 to $34,999 | 47 | 9.9% |
| $35,000 to $49,999 | 83 | 17.4% |
| $50,000 to $74,999 | 63 | 13.2% |
| $75,000 to $99,999 | 108 | 22.6% |
| $100,000 to $149,999 | 59 | 12.4% |
| $150,000 to $199,999 | 4 | 0.8% |
| $200,000+ | 10 | 2.1% |
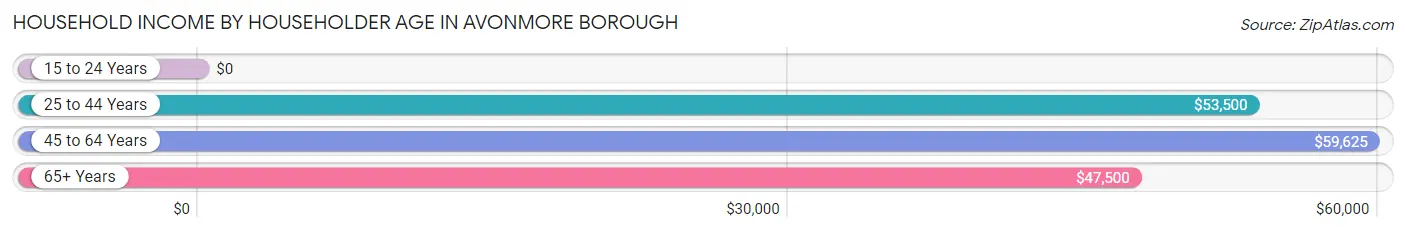
Household Income by Householder Age in Avonmore borough
The median household income in Avonmore borough is $53,750, with the highest median household income of $59,625 found in the 45 to 64 years age bracket for the primary householder. A total of 185 households (38.8%) fall into this category. Meanwhile, the 15 to 24 years age bracket for the primary householder has the lowest median household income of $0, with 28 households (5.9%) in this group.
| Income Bracket | # Households | Median Income |
| 15 to 24 Years | 28 (5.9%) | $0 |
| 25 to 44 Years | 100 (21.0%) | $53,500 |
| 45 to 64 Years | 185 (38.8%) | $59,625 |
| 65+ Years | 164 (34.4%) | $47,500 |
| Total | 477 (100.0%) | $53,750 |
Poverty in Avonmore borough
Income Below Poverty by Sex and Age in Avonmore borough
With 7.6% poverty level for males and 16.1% for females among the residents of Avonmore borough, 16 and 17 year old males and 35 to 44 year old females are the most vulnerable to poverty, with 5 males (71.4%) and 16 females (50.0%) in their respective age groups living below the poverty level.
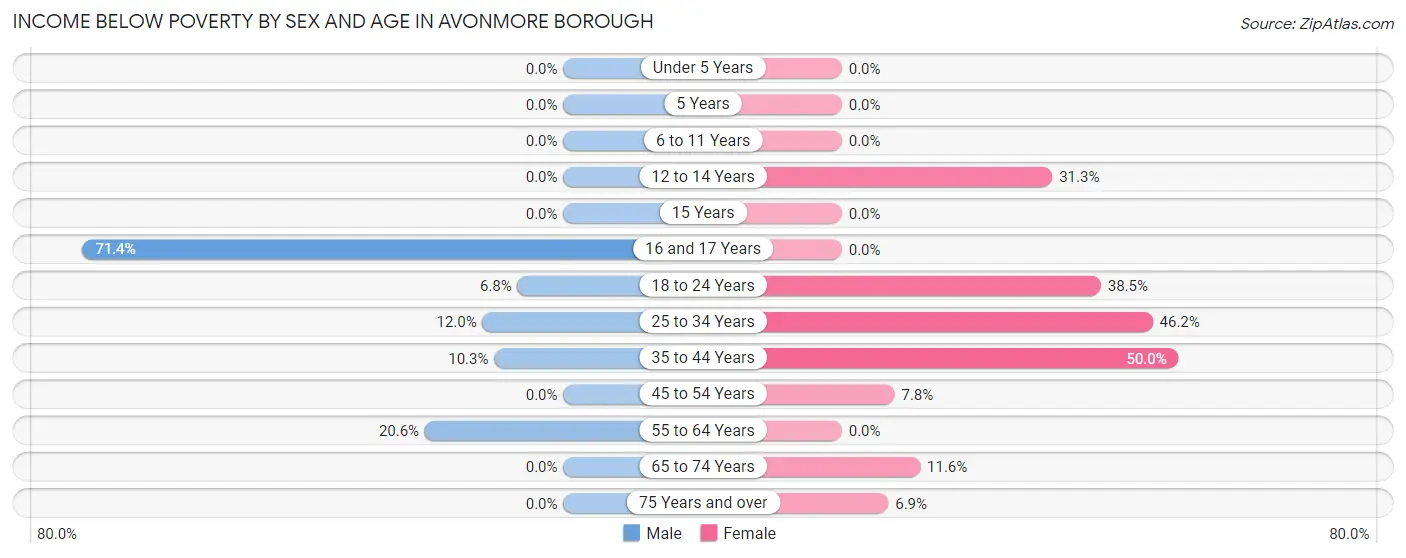
| Age Bracket | Male | Female |
| Under 5 Years | 0 (0.0%) | 0 (0.0%) |
| 5 Years | 0 (0.0%) | 0 (0.0%) |
| 6 to 11 Years | 0 (0.0%) | 0 (0.0%) |
| 12 to 14 Years | 0 (0.0%) | 5 (31.2%) |
| 15 Years | 0 (0.0%) | 0 (0.0%) |
| 16 and 17 Years | 5 (71.4%) | 0 (0.0%) |
| 18 to 24 Years | 11 (6.8%) | 10 (38.5%) |
| 25 to 34 Years | 9 (12.0%) | 30 (46.2%) |
| 35 to 44 Years | 4 (10.3%) | 16 (50.0%) |
| 45 to 54 Years | 0 (0.0%) | 9 (7.8%) |
| 55 to 64 Years | 15 (20.5%) | 0 (0.0%) |
| 65 to 74 Years | 0 (0.0%) | 5 (11.6%) |
| 75 Years and over | 0 (0.0%) | 4 (6.9%) |
| Total | 44 (7.6%) | 79 (16.1%) |
Income Above Poverty by Sex and Age in Avonmore borough
According to the poverty statistics in Avonmore borough, males aged 5 years and females aged under 5 years are the age groups that are most secure financially, with 100.0% of males and 100.0% of females in these age groups living above the poverty line.

| Age Bracket | Male | Female |
| Under 5 Years | 0 (0.0%) | 8 (100.0%) |
| 5 Years | 2 (100.0%) | 0 (0.0%) |
| 6 to 11 Years | 14 (100.0%) | 3 (100.0%) |
| 12 to 14 Years | 0 (0.0%) | 11 (68.8%) |
| 15 Years | 6 (100.0%) | 4 (100.0%) |
| 16 and 17 Years | 2 (28.6%) | 21 (100.0%) |
| 18 to 24 Years | 151 (93.2%) | 16 (61.5%) |
| 25 to 34 Years | 66 (88.0%) | 35 (53.8%) |
| 35 to 44 Years | 35 (89.7%) | 16 (50.0%) |
| 45 to 54 Years | 85 (100.0%) | 106 (92.2%) |
| 55 to 64 Years | 58 (79.4%) | 101 (100.0%) |
| 65 to 74 Years | 42 (100.0%) | 38 (88.4%) |
| 75 Years and over | 73 (100.0%) | 54 (93.1%) |
| Total | 534 (92.4%) | 413 (83.9%) |
Income Below Poverty Among Married-Couple Families in Avonmore borough
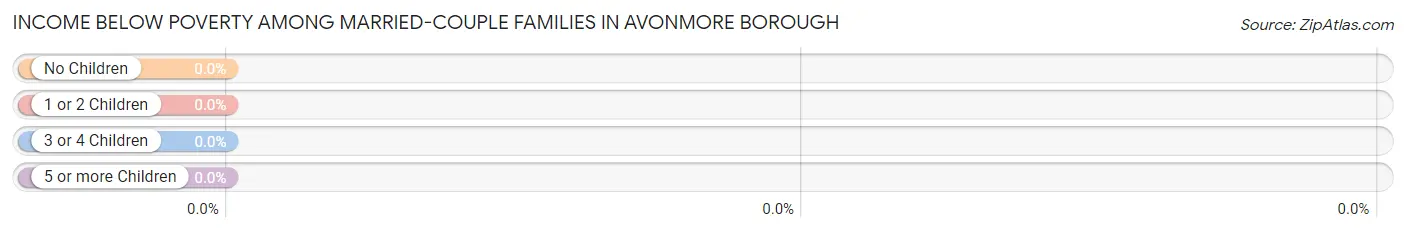
| Children | Above Poverty | Below Poverty |
| No Children | 184 (100.0%) | 0 (0.0%) |
| 1 or 2 Children | 12 (100.0%) | 0 (0.0%) |
| 3 or 4 Children | 0 (0.0%) | 0 (0.0%) |
| 5 or more Children | 0 (0.0%) | 0 (0.0%) |
| Total | 196 (100.0%) | 0 (0.0%) |
Income Below Poverty Among Single-Parent Households in Avonmore borough
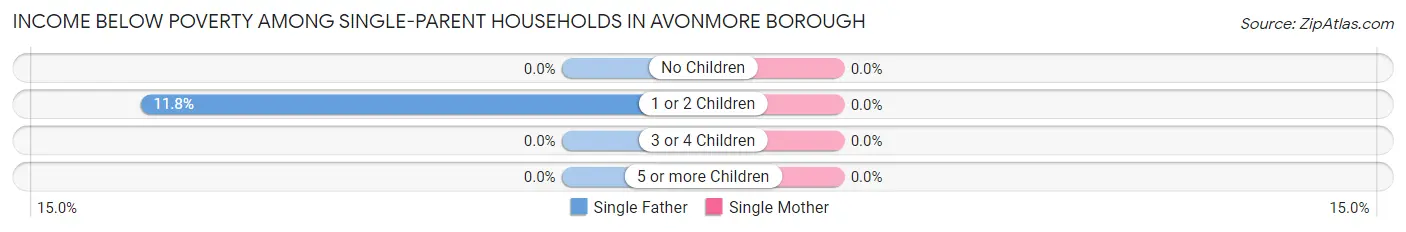
| Children | Single Father | Single Mother |
| No Children | 0 (0.0%) | 0 (0.0%) |
| 1 or 2 Children | 4 (11.8%) | 0 (0.0%) |
| 3 or 4 Children | 0 (0.0%) | 0 (0.0%) |
| 5 or more Children | 0 (0.0%) | 0 (0.0%) |
| Total | 4 (11.1%) | 0 (0.0%) |
Income Below Poverty Among Married-Couple vs Single-Parent Households in Avonmore borough
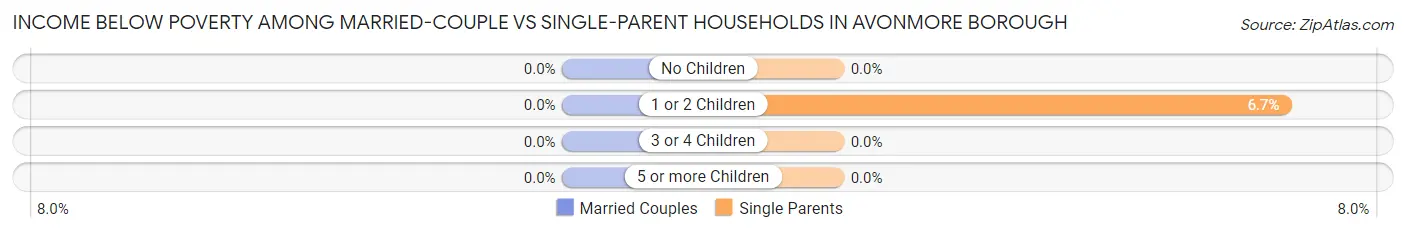
| Children | Married-Couple Families | Single-Parent Households |
| No Children | 0 (0.0%) | 0 (0.0%) |
| 1 or 2 Children | 0 (0.0%) | 4 (6.7%) |
| 3 or 4 Children | 0 (0.0%) | 0 (0.0%) |
| 5 or more Children | 0 (0.0%) | 0 (0.0%) |
| Total | 0 (0.0%) | 4 (5.8%) |
Race in Avonmore borough
The most populous races in Avonmore borough are White / Caucasian (1,021 | 94.6%), Black / African American (35 | 3.2%), and Two or more Races (21 | 1.9%).
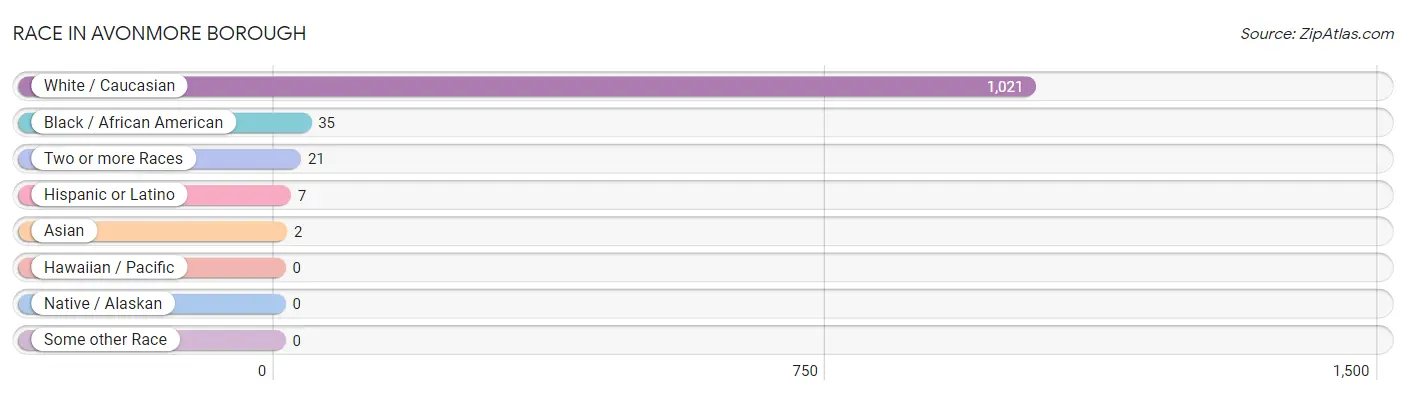
| Race | # Population | % Population |
| Asian | 2 | 0.2% |
| Black / African American | 35 | 3.2% |
| Hawaiian / Pacific | 0 | 0.0% |
| Hispanic or Latino | 7 | 0.6% |
| Native / Alaskan | 0 | 0.0% |
| White / Caucasian | 1,021 | 94.6% |
| Two or more Races | 21 | 1.9% |
| Some other Race | 0 | 0.0% |
| Total | 1,079 | 100.0% |
Ancestry in Avonmore borough
The most populous ancestries reported in Avonmore borough are German (414 | 38.4%), Polish (212 | 19.7%), Italian (204 | 18.9%), Irish (133 | 12.3%), and English (79 | 7.3%), together accounting for 96.6% of all Avonmore borough residents.
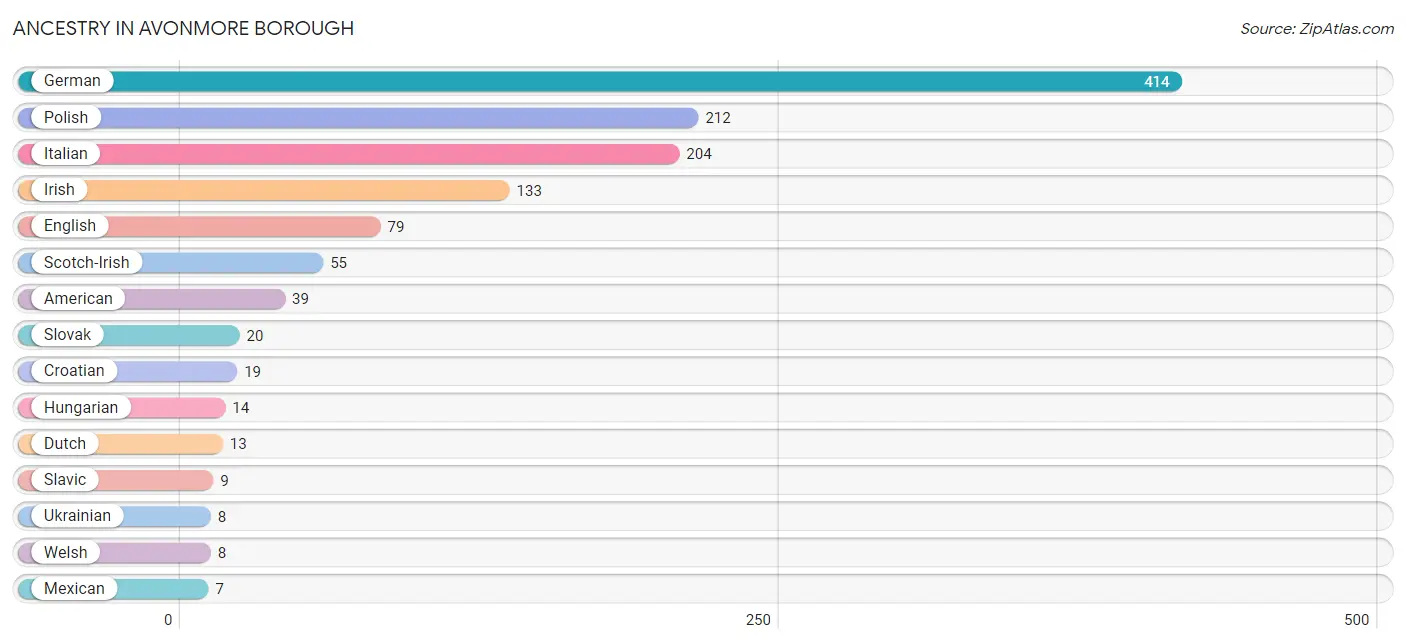
| Ancestry | # Population | % Population |
| American | 39 | 3.6% |
| Croatian | 19 | 1.8% |
| Czechoslovakian | 2 | 0.2% |
| Dutch | 13 | 1.2% |
| English | 79 | 7.3% |
| German | 414 | 38.4% |
| Hungarian | 14 | 1.3% |
| Indian (Asian) | 2 | 0.2% |
| Irish | 133 | 12.3% |
| Italian | 204 | 18.9% |
| Mexican | 7 | 0.6% |
| Norwegian | 5 | 0.5% |
| Pennsylvania German | 6 | 0.6% |
| Polish | 212 | 19.7% |
| Scotch-Irish | 55 | 5.1% |
| Scottish | 7 | 0.6% |
| Slavic | 9 | 0.8% |
| Slovak | 20 | 1.8% |
| Swedish | 5 | 0.5% |
| Ukrainian | 8 | 0.7% |
| Welsh | 8 | 0.7% | View All 21 Rows |
Immigrants in Avonmore borough
The most numerous immigrant groups reported in Avonmore borough came from Europe (3 | 0.3%), Germany (3 | 0.3%), Western Europe (3 | 0.3%), Asia (2 | 0.2%), and China (2 | 0.2%), together accounting for 1.2% of all Avonmore borough residents.
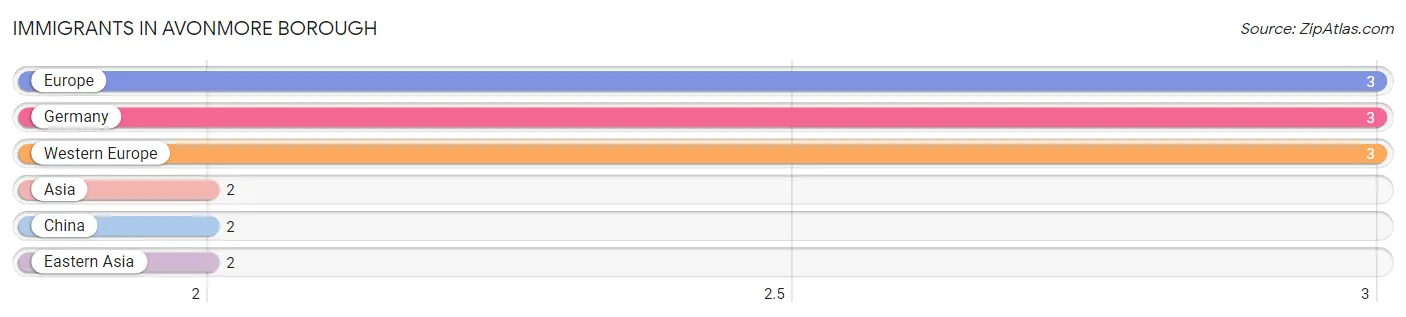
| Immigration Origin | # Population | % Population |
| Asia | 2 | 0.2% |
| China | 2 | 0.2% |
| Eastern Asia | 2 | 0.2% |
| Europe | 3 | 0.3% |
| Germany | 3 | 0.3% |
| Western Europe | 3 | 0.3% | View All 6 Rows |
Sex and Age in Avonmore borough
Sex and Age in Avonmore borough
The most populous age groups in Avonmore borough are 20 to 24 Years (133 | 22.7%) for men and 50 to 54 Years (94 | 19.1%) for women.
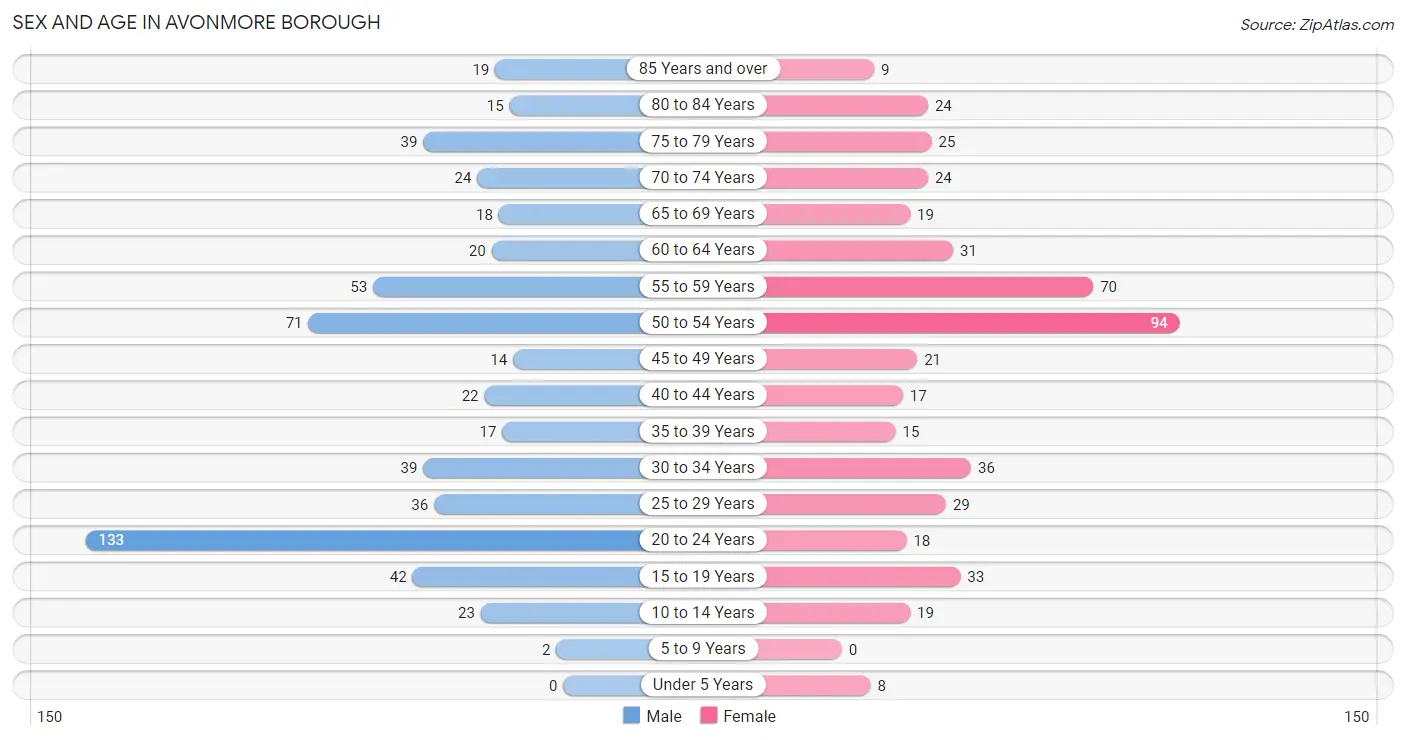
| Age Bracket | Male | Female |
| Under 5 Years | 0 (0.0%) | 8 (1.6%) |
| 5 to 9 Years | 2 (0.3%) | 0 (0.0%) |
| 10 to 14 Years | 23 (3.9%) | 19 (3.9%) |
| 15 to 19 Years | 42 (7.2%) | 33 (6.7%) |
| 20 to 24 Years | 133 (22.7%) | 18 (3.7%) |
| 25 to 29 Years | 36 (6.1%) | 29 (5.9%) |
| 30 to 34 Years | 39 (6.6%) | 36 (7.3%) |
| 35 to 39 Years | 17 (2.9%) | 15 (3.0%) |
| 40 to 44 Years | 22 (3.7%) | 17 (3.5%) |
| 45 to 49 Years | 14 (2.4%) | 21 (4.3%) |
| 50 to 54 Years | 71 (12.1%) | 94 (19.1%) |
| 55 to 59 Years | 53 (9.0%) | 70 (14.2%) |
| 60 to 64 Years | 20 (3.4%) | 31 (6.3%) |
| 65 to 69 Years | 18 (3.1%) | 19 (3.9%) |
| 70 to 74 Years | 24 (4.1%) | 24 (4.9%) |
| 75 to 79 Years | 39 (6.6%) | 25 (5.1%) |
| 80 to 84 Years | 15 (2.6%) | 24 (4.9%) |
| 85 Years and over | 19 (3.2%) | 9 (1.8%) |
| Total | 587 (100.0%) | 492 (100.0%) |
Families and Households in Avonmore borough
Median Family Size in Avonmore borough
The median family size in Avonmore borough is 2.88 persons per family, with single female/mother families (33 | 12.4%) accounting for the largest median family size of 3.82 persons per family. On the other hand, single male/father families (36 | 13.6%) represent the smallest median family size with 2.50 persons per family.
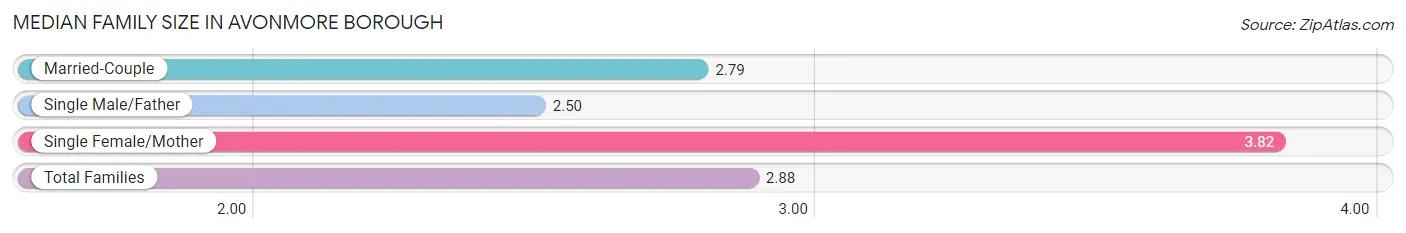
| Family Type | # Families | Family Size |
| Married-Couple | 196 (74.0%) | 2.79 |
| Single Male/Father | 36 (13.6%) | 2.50 |
| Single Female/Mother | 33 (12.4%) | 3.82 |
| Total Families | 265 (100.0%) | 2.88 |
Median Household Size in Avonmore borough
The median household size in Avonmore borough is 2.26 persons per household, with single female/mother households (33 | 6.9%) accounting for the largest median household size of 3.82 persons per household. non-family households (212 | 44.4%) represent the smallest median household size with 1.30 persons per household.
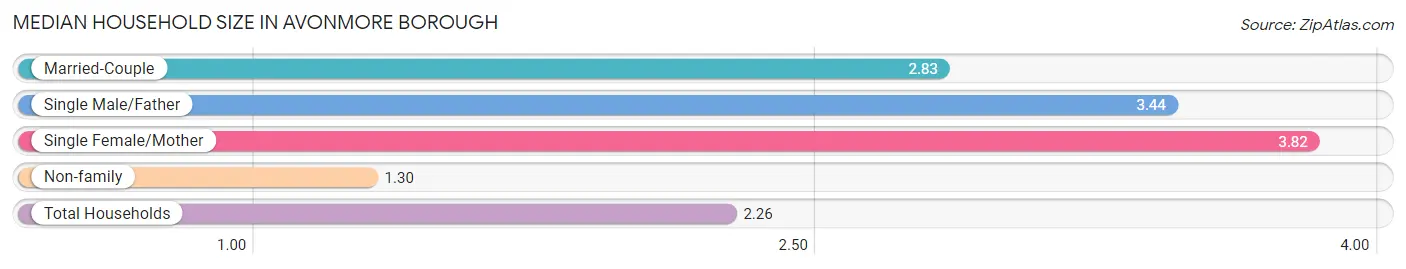
| Household Type | # Households | Household Size |
| Married-Couple | 196 (41.1%) | 2.83 |
| Single Male/Father | 36 (7.5%) | 3.44 |
| Single Female/Mother | 33 (6.9%) | 3.82 |
| Non-family | 212 (44.4%) | 1.30 |
| Total Households | 477 (100.0%) | 2.26 |
Household Size by Marriage Status in Avonmore borough
Out of a total of 477 households in Avonmore borough, 265 (55.6%) are family households, while 212 (44.4%) are nonfamily households. The most numerous type of family households are 2-person households, comprising 139, and the most common type of nonfamily households are 1-person households, comprising 153.
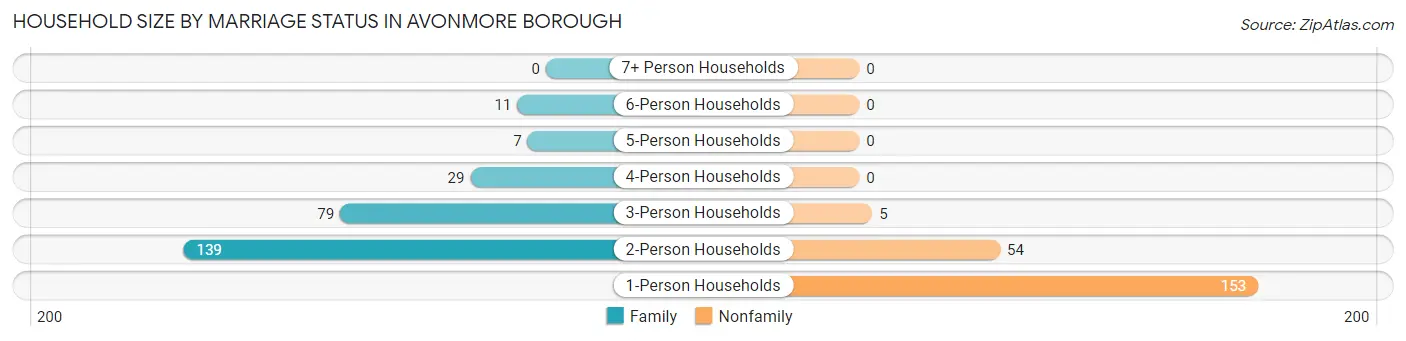
| Household Size | Family Households | Nonfamily Households |
| 1-Person Households | - | 153 (32.1%) |
| 2-Person Households | 139 (29.1%) | 54 (11.3%) |
| 3-Person Households | 79 (16.6%) | 5 (1.1%) |
| 4-Person Households | 29 (6.1%) | 0 (0.0%) |
| 5-Person Households | 7 (1.5%) | 0 (0.0%) |
| 6-Person Households | 11 (2.3%) | 0 (0.0%) |
| 7+ Person Households | 0 (0.0%) | 0 (0.0%) |
| Total | 265 (55.6%) | 212 (44.4%) |
Female Fertility in Avonmore borough
Fertility by Age in Avonmore borough
Average fertility rate in Avonmore borough is 43.0 births per 1,000 women. Women in the age bracket of 20 to 34 years have the highest fertility rate with 96.0 births per 1,000 women. Women in the age bracket of 20 to 34 years acount for 100.0% of all women with births.
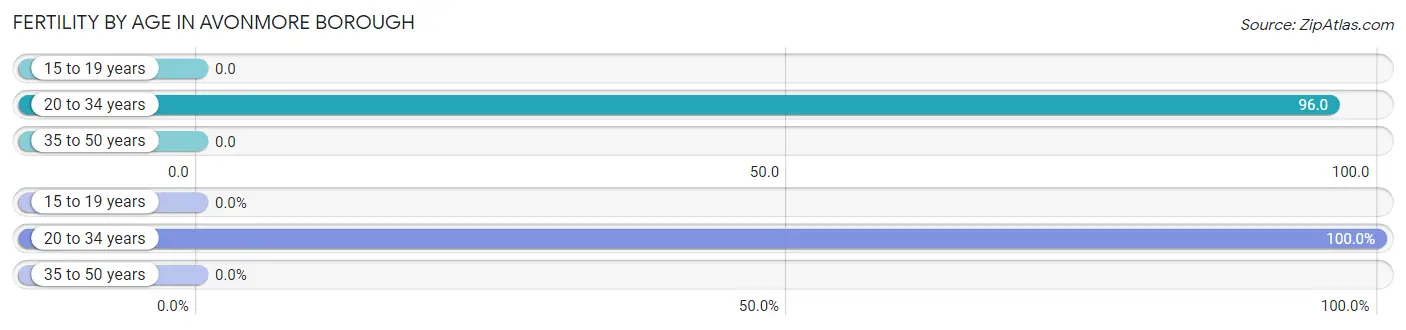
| Age Bracket | Women with Births | Births / 1,000 Women |
| 15 to 19 years | 0 (0.0%) | 0.0 |
| 20 to 34 years | 8 (100.0%) | 96.0 |
| 35 to 50 years | 0 (0.0%) | 0.0 |
| Total | 8 (100.0%) | 43.0 |
Fertility by Age by Marriage Status in Avonmore borough
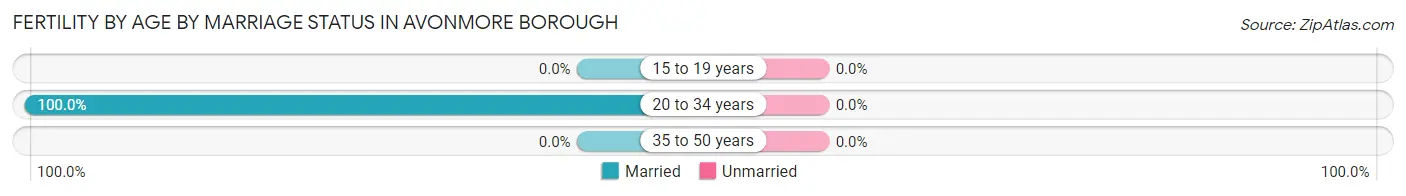
| Age Bracket | Married | Unmarried |
| 15 to 19 years | 0 (0.0%) | 0 (0.0%) |
| 20 to 34 years | 8 (100.0%) | 0 (0.0%) |
| 35 to 50 years | 0 (0.0%) | 0 (0.0%) |
| Total | 8 (100.0%) | 0 (0.0%) |
Fertility by Education in Avonmore borough
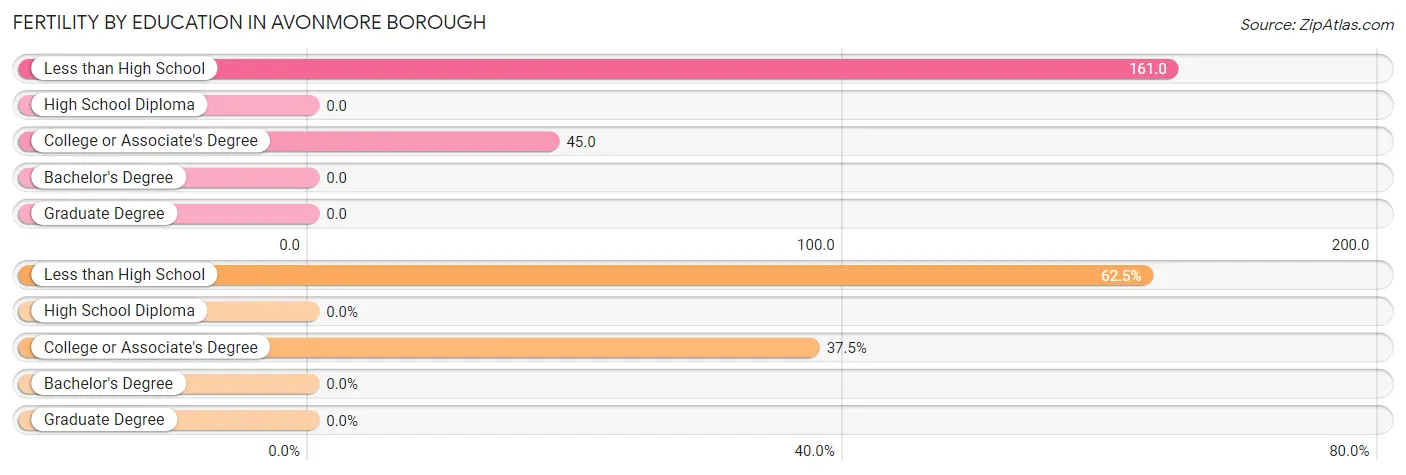
| Educational Attainment | Women with Births | Births / 1,000 Women |
| Less than High School | 5 (62.5%) | 161.0 |
| High School Diploma | 0 (0.0%) | 0.0 |
| College or Associate's Degree | 3 (37.5%) | 45.0 |
| Bachelor's Degree | 0 (0.0%) | 0.0 |
| Graduate Degree | 0 (0.0%) | 0.0 |
| Total | 8 (100.0%) | 43.0 |
Fertility by Education by Marriage Status in Avonmore borough
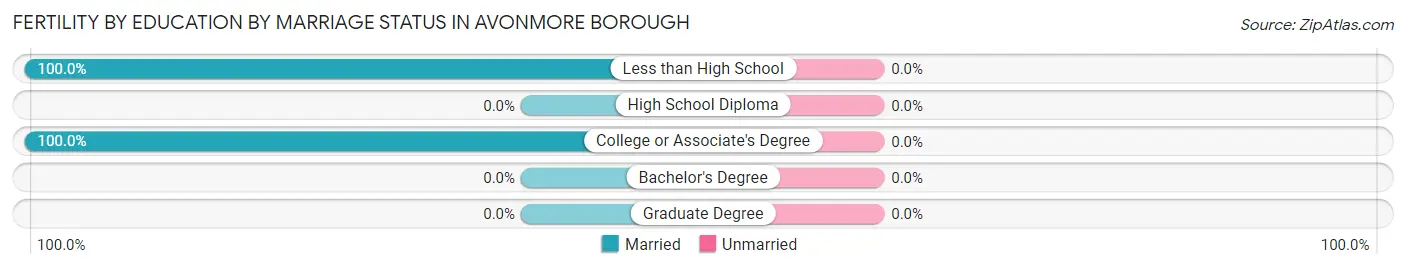
| Educational Attainment | Married | Unmarried |
| Less than High School | 5 (100.0%) | 0 (0.0%) |
| High School Diploma | 0 (0.0%) | 0 (0.0%) |
| College or Associate's Degree | 3 (100.0%) | 0 (0.0%) |
| Bachelor's Degree | 0 (0.0%) | 0 (0.0%) |
| Graduate Degree | 0 (0.0%) | 0 (0.0%) |
| Total | 8 (100.0%) | 0 (0.0%) |
Employment Characteristics in Avonmore borough
Employment by Class of Employer in Avonmore borough
Among the 555 employed individuals in Avonmore borough, private company employees (418 | 75.3%), not-for-profit organizations (53 | 9.6%), and local government employees (50 | 9.0%) make up the most common classes of employment.
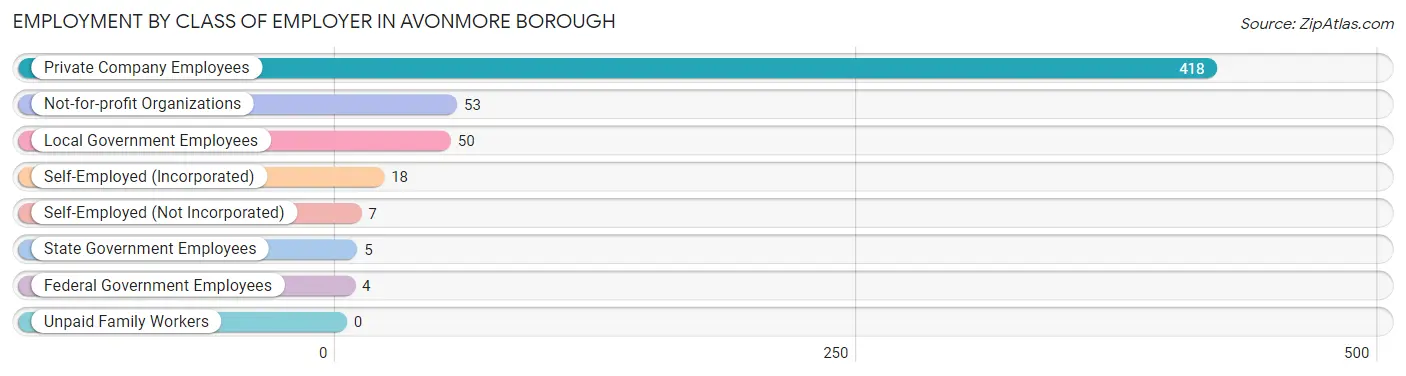
| Employer Class | # Employees | % Employees |
| Private Company Employees | 418 | 75.3% |
| Self-Employed (Incorporated) | 18 | 3.2% |
| Self-Employed (Not Incorporated) | 7 | 1.3% |
| Not-for-profit Organizations | 53 | 9.6% |
| Local Government Employees | 50 | 9.0% |
| State Government Employees | 5 | 0.9% |
| Federal Government Employees | 4 | 0.7% |
| Unpaid Family Workers | 0 | 0.0% |
| Total | 555 | 100.0% |
Employment Status by Age in Avonmore borough
According to the labor force statistics for Avonmore borough, out of the total population over 16 years of age (1,017), 61.2% or 622 individuals are in the labor force, with 4.2% or 26 of them unemployed. The age group with the highest labor force participation rate is 30 to 34 years, with 92.0% or 69 individuals in the labor force. Within the labor force, the 55 to 59 years age range has the highest percentage of unemployed individuals, with 10.2% or 10 of them being unemployed.
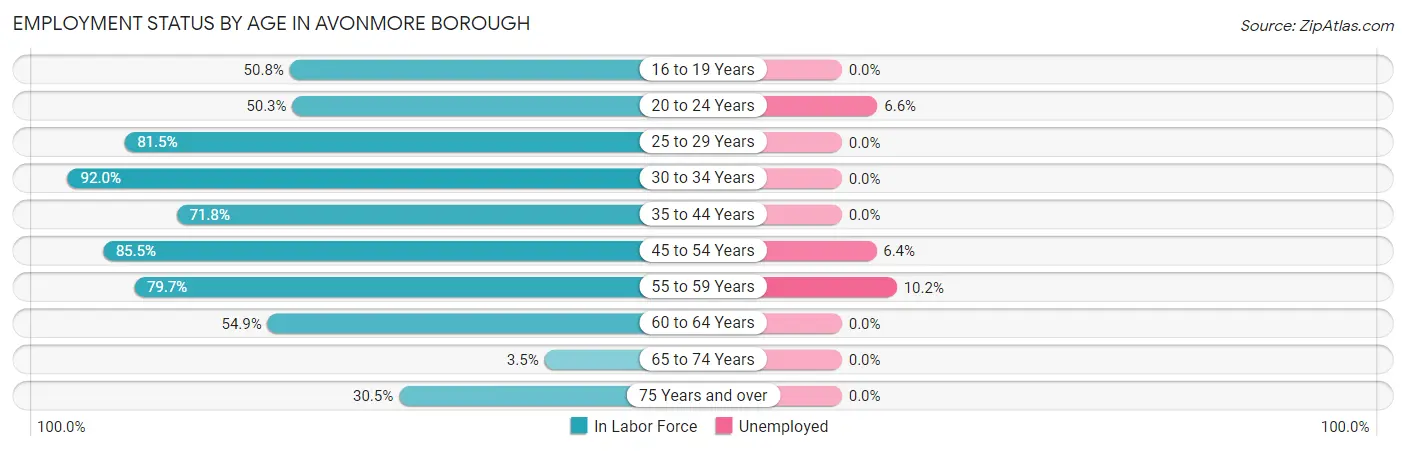
| Age Bracket | In Labor Force | Unemployed |
| 16 to 19 Years | 33 (50.8%) | 0 (0.0%) |
| 20 to 24 Years | 76 (50.3%) | 5 (6.6%) |
| 25 to 29 Years | 53 (81.5%) | 0 (0.0%) |
| 30 to 34 Years | 69 (92.0%) | 0 (0.0%) |
| 35 to 44 Years | 51 (71.8%) | 0 (0.0%) |
| 45 to 54 Years | 171 (85.5%) | 11 (6.4%) |
| 55 to 59 Years | 98 (79.7%) | 10 (10.2%) |
| 60 to 64 Years | 28 (54.9%) | 0 (0.0%) |
| 65 to 74 Years | 3 (3.5%) | 0 (0.0%) |
| 75 Years and over | 40 (30.5%) | 0 (0.0%) |
| Total | 622 (61.2%) | 26 (4.2%) |
Employment Status by Educational Attainment in Avonmore borough
According to labor force statistics for Avonmore borough, 80.3% of individuals (470) out of the total population between 25 and 64 years of age (585) are in the labor force, with 4.5% or 21 of them being unemployed. The group with the highest labor force participation rate are those with the educational attainment of bachelor's degree or higher, with 100.0% or 139 individuals in the labor force. Within the labor force, individuals with less than high school education have the highest percentage of unemployment, with 23.4% or 11 of them being unemployed.
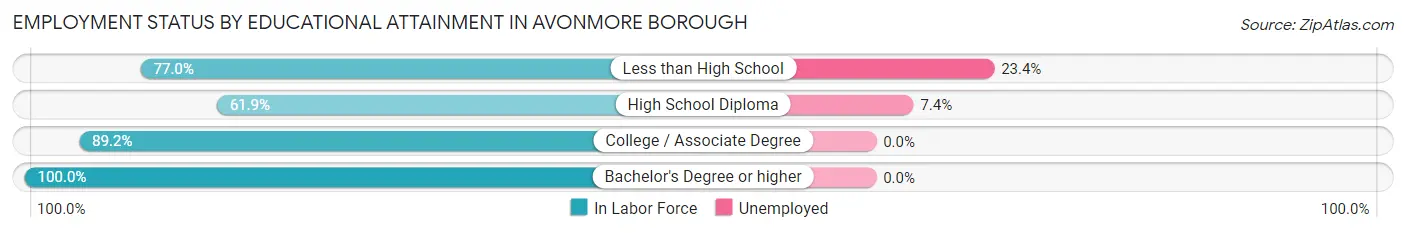
| Educational Attainment | In Labor Force | Unemployed |
| Less than High School | 47 (77.0%) | 14 (23.4%) |
| High School Diploma | 135 (61.9%) | 16 (7.4%) |
| College / Associate Degree | 149 (89.2%) | 0 (0.0%) |
| Bachelor's Degree or higher | 139 (100.0%) | 0 (0.0%) |
| Total | 470 (80.3%) | 26 (4.5%) |
Employment Occupations by Sex in Avonmore borough
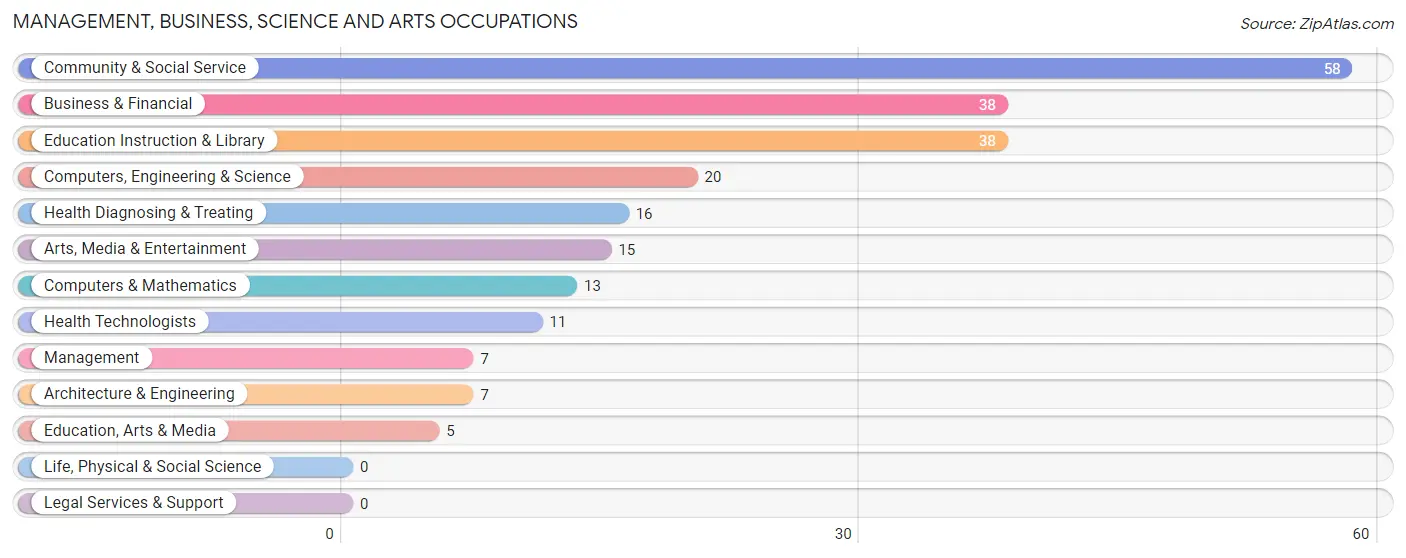
Management, Business, Science and Arts Occupations
The most common Management, Business, Science and Arts occupations in Avonmore borough are Community & Social Service (58 | 9.7%), Business & Financial (38 | 6.4%), Education Instruction & Library (38 | 6.4%), Computers, Engineering & Science (20 | 3.4%), and Health Diagnosing & Treating (16 | 2.7%).
Management, Business, Science and Arts Occupations by Sex
Within the Management, Business, Science and Arts occupations in Avonmore borough, the most male-oriented occupations are Management (100.0%), Architecture & Engineering (100.0%), and Health Technologists (63.6%), while the most female-oriented occupations are Education, Arts & Media (100.0%), Arts, Media & Entertainment (100.0%), and Community & Social Service (81.0%).
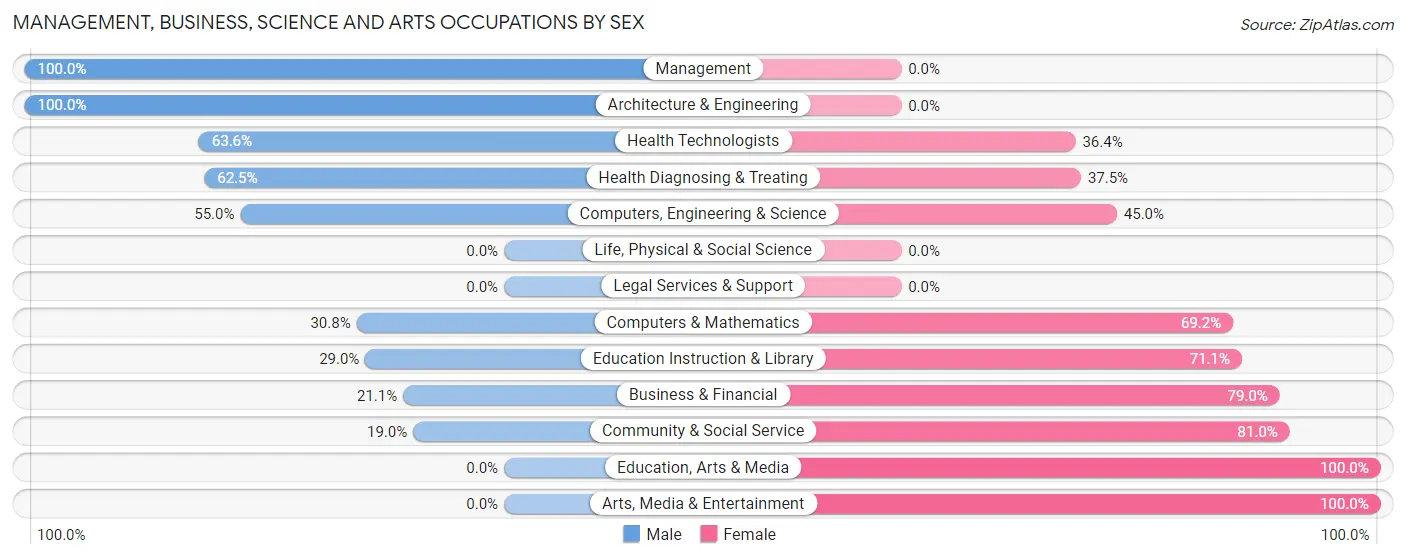
| Occupation | Male | Female |
| Management | 7 (100.0%) | 0 (0.0%) |
| Business & Financial | 8 (21.0%) | 30 (78.9%) |
| Computers, Engineering & Science | 11 (55.0%) | 9 (45.0%) |
| Computers & Mathematics | 4 (30.8%) | 9 (69.2%) |
| Architecture & Engineering | 7 (100.0%) | 0 (0.0%) |
| Life, Physical & Social Science | 0 (0.0%) | 0 (0.0%) |
| Community & Social Service | 11 (19.0%) | 47 (81.0%) |
| Education, Arts & Media | 0 (0.0%) | 5 (100.0%) |
| Legal Services & Support | 0 (0.0%) | 0 (0.0%) |
| Education Instruction & Library | 11 (28.9%) | 27 (71.1%) |
| Arts, Media & Entertainment | 0 (0.0%) | 15 (100.0%) |
| Health Diagnosing & Treating | 10 (62.5%) | 6 (37.5%) |
| Health Technologists | 7 (63.6%) | 4 (36.4%) |
| Total (Category) | 47 (33.8%) | 92 (66.2%) |
| Total (Overall) | 332 (55.7%) | 264 (44.3%) |
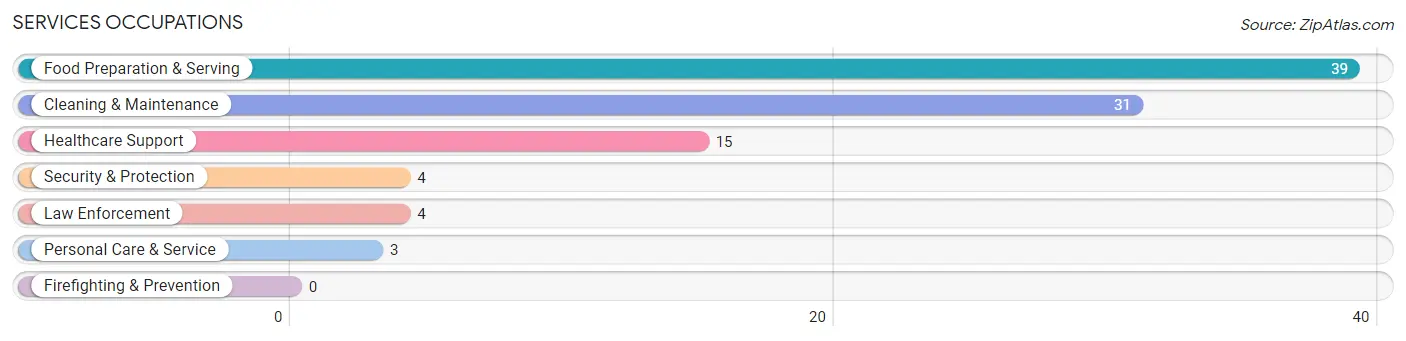
Services Occupations
The most common Services occupations in Avonmore borough are Food Preparation & Serving (39 | 6.5%), Cleaning & Maintenance (31 | 5.2%), Healthcare Support (15 | 2.5%), Security & Protection (4 | 0.7%), and Law Enforcement (4 | 0.7%).
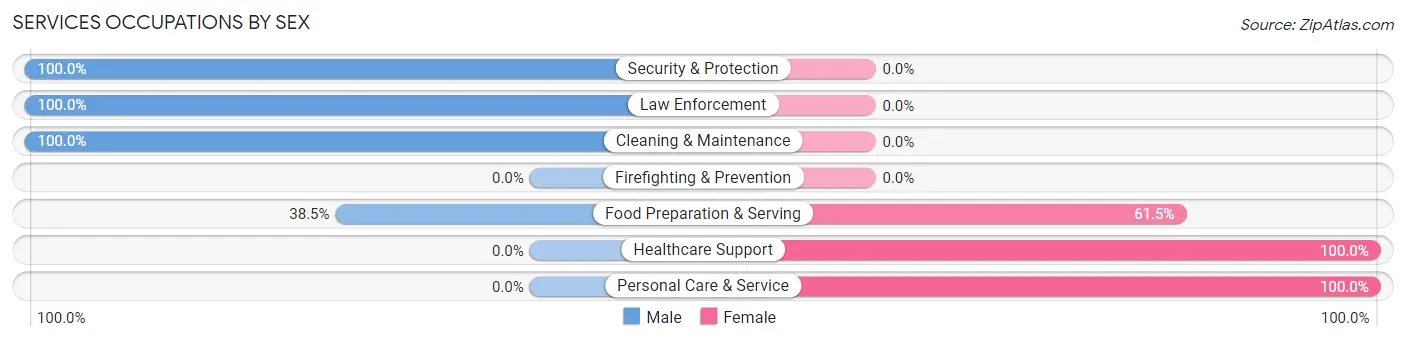
Services Occupations by Sex
Within the Services occupations in Avonmore borough, the most male-oriented occupations are Security & Protection (100.0%), Law Enforcement (100.0%), and Cleaning & Maintenance (100.0%), while the most female-oriented occupations are Healthcare Support (100.0%), Personal Care & Service (100.0%), and Food Preparation & Serving (61.5%).
| Occupation | Male | Female |
| Healthcare Support | 0 (0.0%) | 15 (100.0%) |
| Security & Protection | 4 (100.0%) | 0 (0.0%) |
| Firefighting & Prevention | 0 (0.0%) | 0 (0.0%) |
| Law Enforcement | 4 (100.0%) | 0 (0.0%) |
| Food Preparation & Serving | 15 (38.5%) | 24 (61.5%) |
| Cleaning & Maintenance | 31 (100.0%) | 0 (0.0%) |
| Personal Care & Service | 0 (0.0%) | 3 (100.0%) |
| Total (Category) | 50 (54.3%) | 42 (45.7%) |
| Total (Overall) | 332 (55.7%) | 264 (44.3%) |
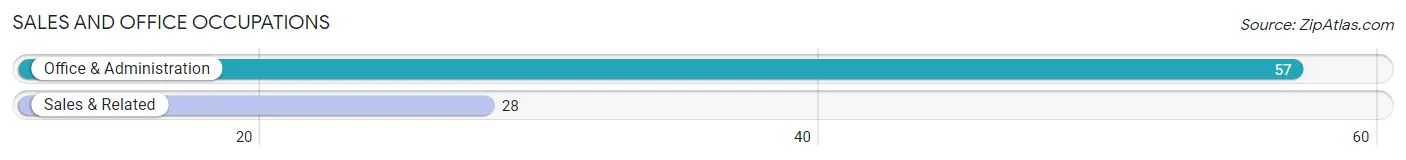
Sales and Office Occupations
The most common Sales and Office occupations in Avonmore borough are Office & Administration (57 | 9.6%), and Sales & Related (28 | 4.7%).
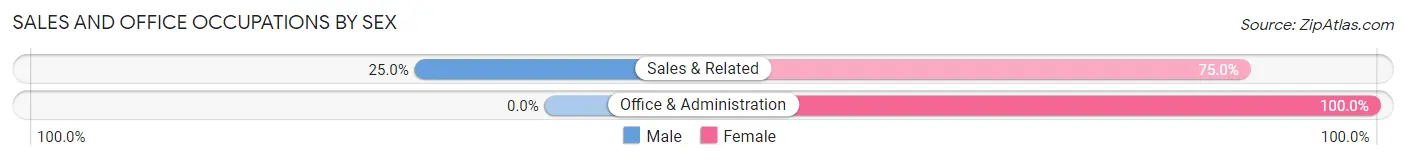
Sales and Office Occupations by Sex
| Occupation | Male | Female |
| Sales & Related | 7 (25.0%) | 21 (75.0%) |
| Office & Administration | 0 (0.0%) | 57 (100.0%) |
| Total (Category) | 7 (8.2%) | 78 (91.8%) |
| Total (Overall) | 332 (55.7%) | 264 (44.3%) |
Natural Resources, Construction and Maintenance Occupations
The most common Natural Resources, Construction and Maintenance occupations in Avonmore borough are Construction & Extraction (29 | 4.9%), and Installation, Maintenance & Repair (17 | 2.9%).
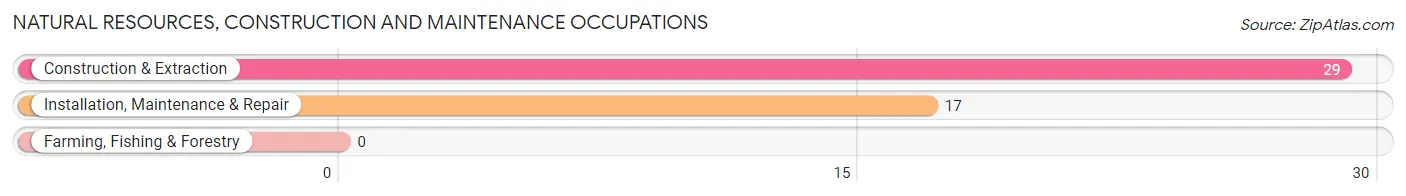
Natural Resources, Construction and Maintenance Occupations by Sex
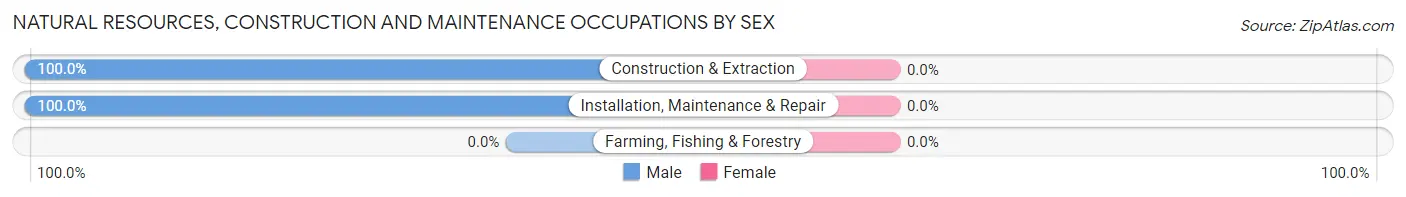
| Occupation | Male | Female |
| Farming, Fishing & Forestry | 0 (0.0%) | 0 (0.0%) |
| Construction & Extraction | 29 (100.0%) | 0 (0.0%) |
| Installation, Maintenance & Repair | 17 (100.0%) | 0 (0.0%) |
| Total (Category) | 46 (100.0%) | 0 (0.0%) |
| Total (Overall) | 332 (55.7%) | 264 (44.3%) |
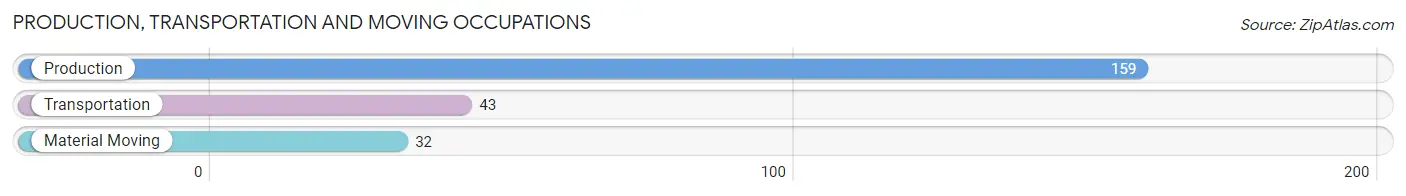
Production, Transportation and Moving Occupations
The most common Production, Transportation and Moving occupations in Avonmore borough are Production (159 | 26.7%), Transportation (43 | 7.2%), and Material Moving (32 | 5.4%).
Production, Transportation and Moving Occupations by Sex
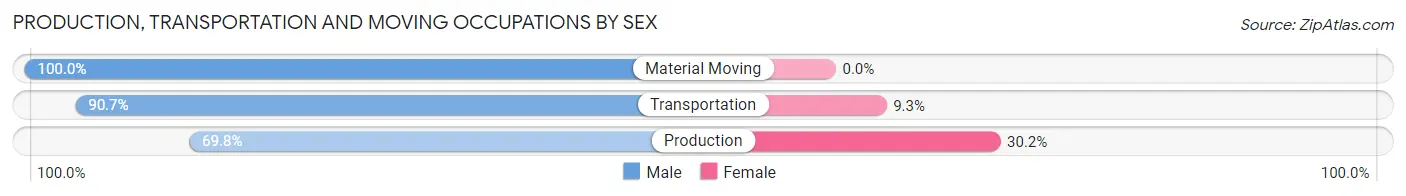
| Occupation | Male | Female |
| Production | 111 (69.8%) | 48 (30.2%) |
| Transportation | 39 (90.7%) | 4 (9.3%) |
| Material Moving | 32 (100.0%) | 0 (0.0%) |
| Total (Category) | 182 (77.8%) | 52 (22.2%) |
| Total (Overall) | 332 (55.7%) | 264 (44.3%) |
Employment Industries by Sex in Avonmore borough
Employment Industries in Avonmore borough
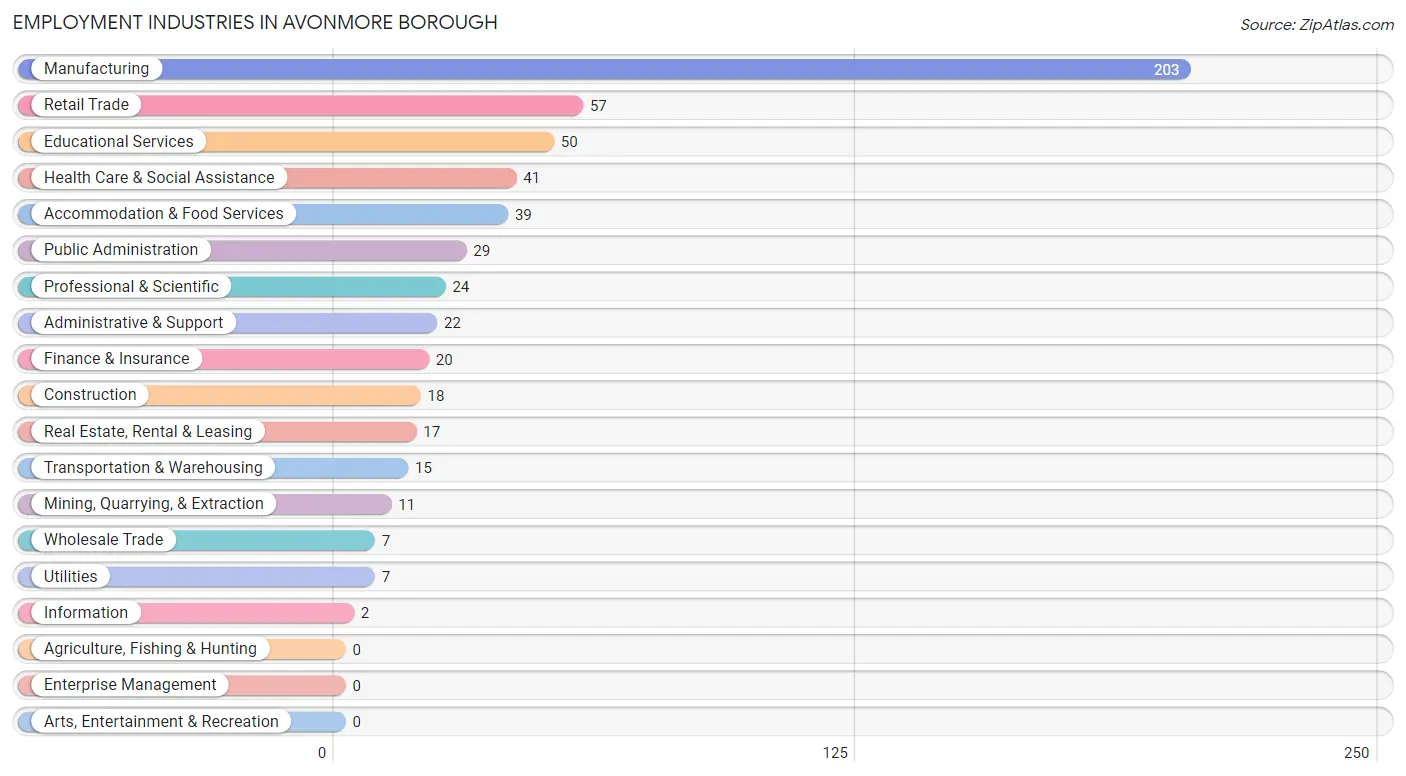
The major employment industries in Avonmore borough include Manufacturing (203 | 34.1%), Retail Trade (57 | 9.6%), Educational Services (50 | 8.4%), Health Care & Social Assistance (41 | 6.9%), and Accommodation & Food Services (39 | 6.5%).
Employment Industries by Sex in Avonmore borough
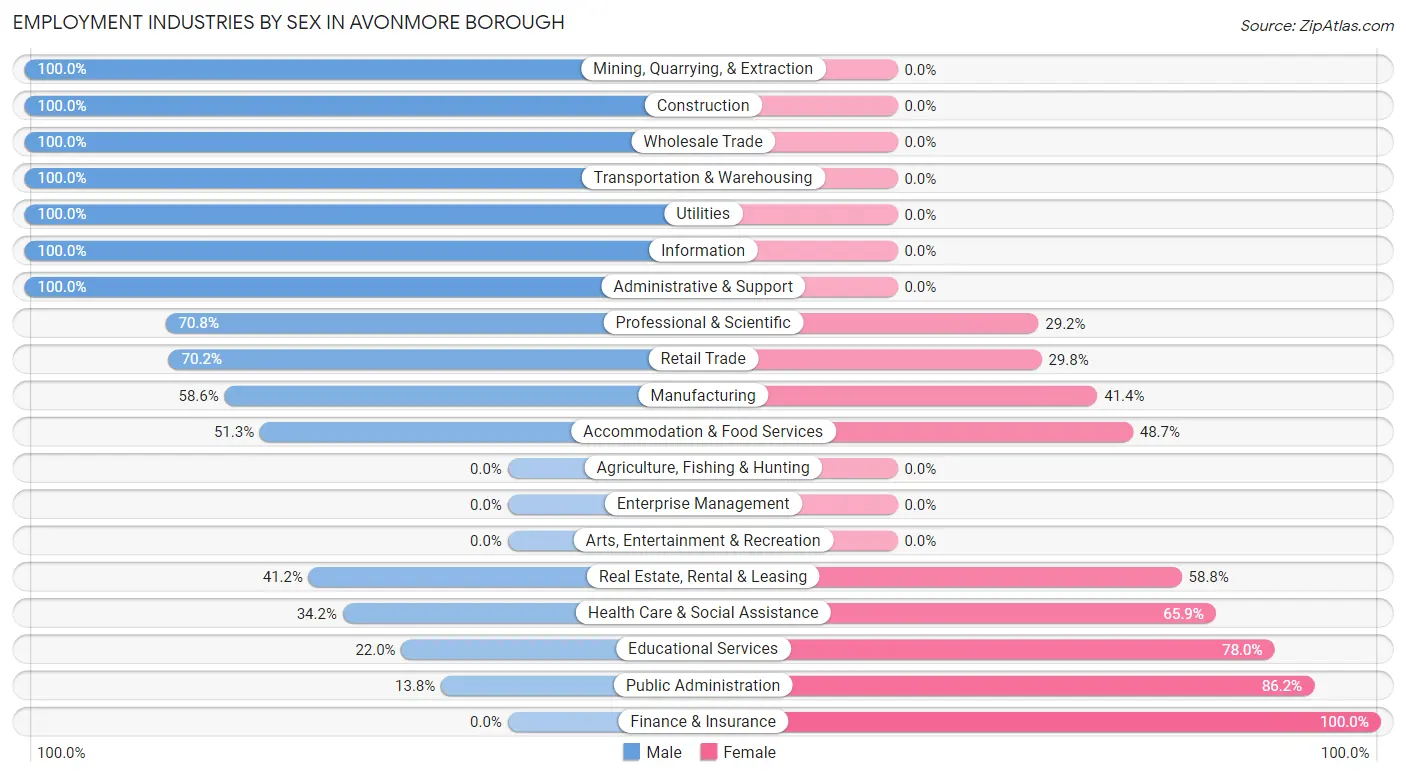
The Avonmore borough industries that see more men than women are Mining, Quarrying, & Extraction (100.0%), Construction (100.0%), and Wholesale Trade (100.0%), whereas the industries that tend to have a higher number of women are Finance & Insurance (100.0%), Public Administration (86.2%), and Educational Services (78.0%).
| Industry | Male | Female |
| Agriculture, Fishing & Hunting | 0 (0.0%) | 0 (0.0%) |
| Mining, Quarrying, & Extraction | 11 (100.0%) | 0 (0.0%) |
| Construction | 18 (100.0%) | 0 (0.0%) |
| Manufacturing | 119 (58.6%) | 84 (41.4%) |
| Wholesale Trade | 7 (100.0%) | 0 (0.0%) |
| Retail Trade | 40 (70.2%) | 17 (29.8%) |
| Transportation & Warehousing | 15 (100.0%) | 0 (0.0%) |
| Utilities | 7 (100.0%) | 0 (0.0%) |
| Information | 2 (100.0%) | 0 (0.0%) |
| Finance & Insurance | 0 (0.0%) | 20 (100.0%) |
| Real Estate, Rental & Leasing | 7 (41.2%) | 10 (58.8%) |
| Professional & Scientific | 17 (70.8%) | 7 (29.2%) |
| Enterprise Management | 0 (0.0%) | 0 (0.0%) |
| Administrative & Support | 22 (100.0%) | 0 (0.0%) |
| Educational Services | 11 (22.0%) | 39 (78.0%) |
| Health Care & Social Assistance | 14 (34.2%) | 27 (65.8%) |
| Arts, Entertainment & Recreation | 0 (0.0%) | 0 (0.0%) |
| Accommodation & Food Services | 20 (51.3%) | 19 (48.7%) |
| Public Administration | 4 (13.8%) | 25 (86.2%) |
| Total | 332 (55.7%) | 264 (44.3%) |
Education in Avonmore borough
School Enrollment in Avonmore borough
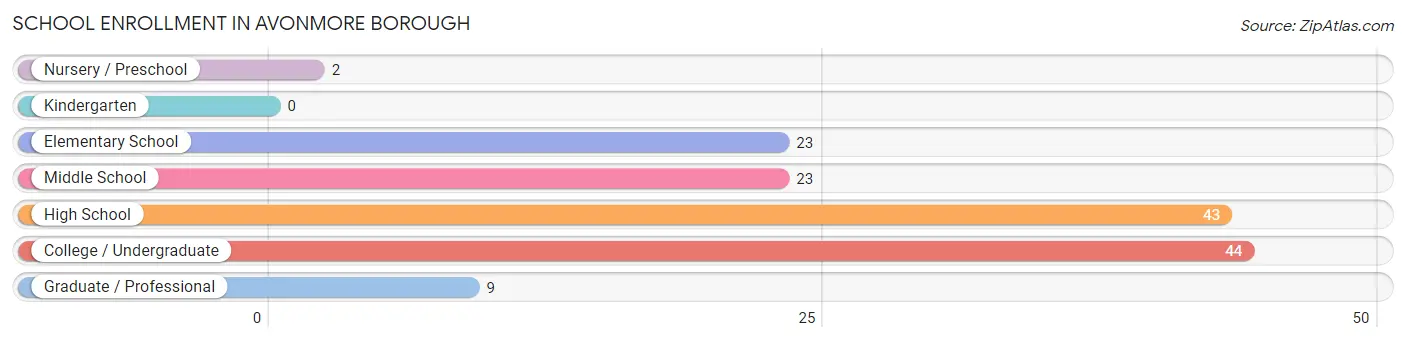
The most common levels of schooling among the 144 students in Avonmore borough are college / undergraduate (44 | 30.6%), high school (43 | 29.9%), and elementary school (23 | 16.0%).
| School Level | # Students | % Students |
| Nursery / Preschool | 2 | 1.4% |
| Kindergarten | 0 | 0.0% |
| Elementary School | 23 | 16.0% |
| Middle School | 23 | 16.0% |
| High School | 43 | 29.9% |
| College / Undergraduate | 44 | 30.6% |
| Graduate / Professional | 9 | 6.2% |
| Total | 144 | 100.0% |
School Enrollment by Age by Funding Source in Avonmore borough
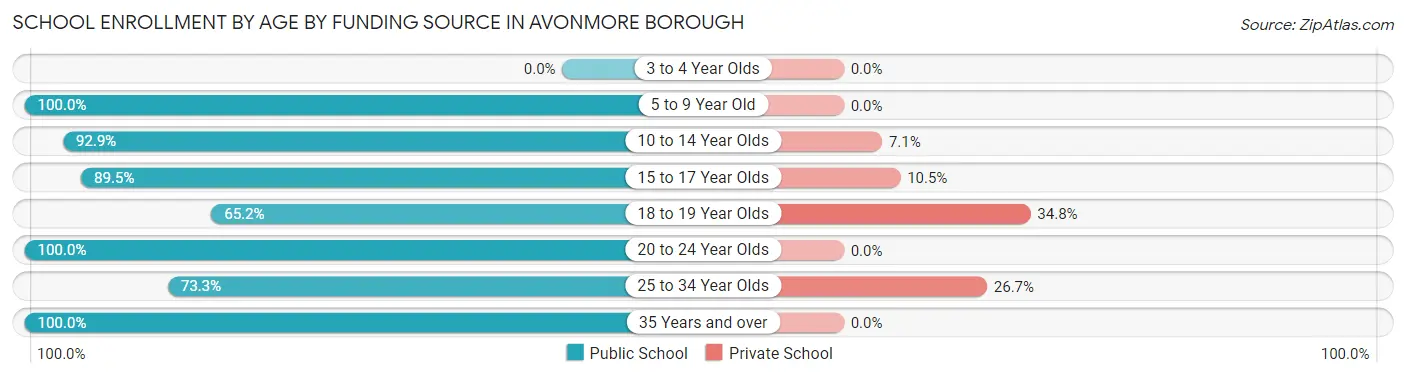
Out of a total of 144 students who are enrolled in schools in Avonmore borough, 19 (13.2%) attend a private institution, while the remaining 125 (86.8%) are enrolled in public schools. The age group of 18 to 19 year olds has the highest likelihood of being enrolled in private schools, with 8 (34.8% in the age bracket) enrolled. Conversely, the age group of 5 to 9 year old has the lowest likelihood of being enrolled in a private school, with 2 (100.0% in the age bracket) attending a public institution.
| Age Bracket | Public School | Private School |
| 3 to 4 Year Olds | 0 (0.0%) | 0 (0.0%) |
| 5 to 9 Year Old | 2 (100.0%) | 0 (0.0%) |
| 10 to 14 Year Olds | 39 (92.9%) | 3 (7.1%) |
| 15 to 17 Year Olds | 34 (89.5%) | 4 (10.5%) |
| 18 to 19 Year Olds | 15 (65.2%) | 8 (34.8%) |
| 20 to 24 Year Olds | 19 (100.0%) | 0 (0.0%) |
| 25 to 34 Year Olds | 11 (73.3%) | 4 (26.7%) |
| 35 Years and over | 5 (100.0%) | 0 (0.0%) |
| Total | 125 (86.8%) | 19 (13.2%) |
Educational Attainment by Field of Study in Avonmore borough
Business (74 | 47.7%), computers & mathematics (12 | 7.7%), arts & humanities (12 | 7.7%), bio, nature & agricultural (11 | 7.1%), and liberal arts & history (10 | 6.5%) are the most common fields of study among 155 individuals in Avonmore borough who have obtained a bachelor's degree or higher.
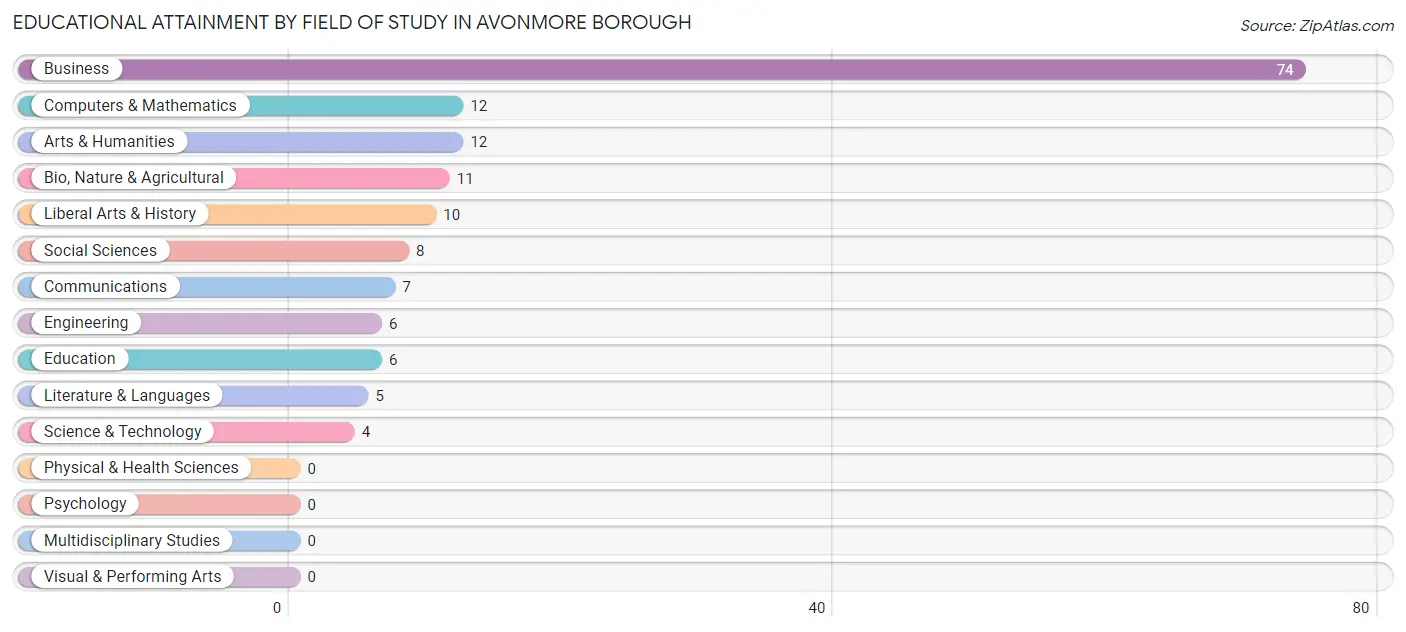
| Field of Study | # Graduates | % Graduates |
| Computers & Mathematics | 12 | 7.7% |
| Bio, Nature & Agricultural | 11 | 7.1% |
| Physical & Health Sciences | 0 | 0.0% |
| Psychology | 0 | 0.0% |
| Social Sciences | 8 | 5.2% |
| Engineering | 6 | 3.9% |
| Multidisciplinary Studies | 0 | 0.0% |
| Science & Technology | 4 | 2.6% |
| Business | 74 | 47.7% |
| Education | 6 | 3.9% |
| Literature & Languages | 5 | 3.2% |
| Liberal Arts & History | 10 | 6.5% |
| Visual & Performing Arts | 0 | 0.0% |
| Communications | 7 | 4.5% |
| Arts & Humanities | 12 | 7.7% |
| Total | 155 | 100.0% |
Transportation & Commute in Avonmore borough
Vehicle Availability by Sex in Avonmore borough
The most prevalent vehicle ownership categories in Avonmore borough are males with 2 vehicles (143, accounting for 48.6%) and females with 2 vehicles (113, making up 54.8%).
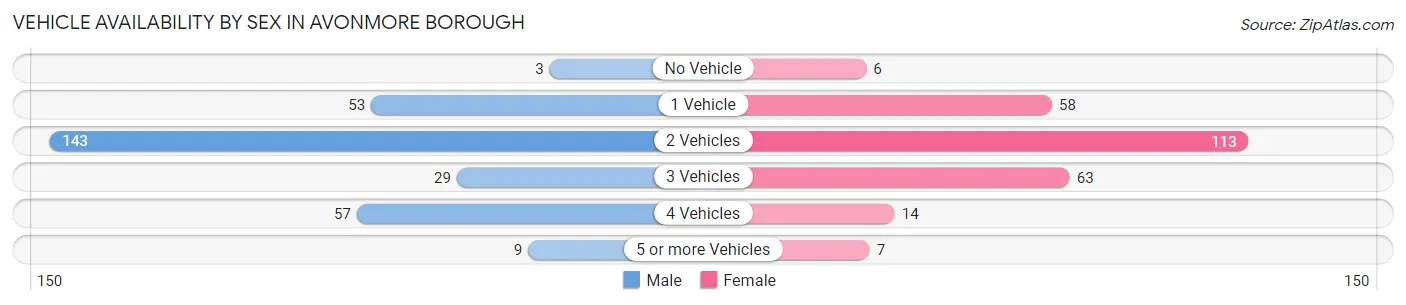
| Vehicles Available | Male | Female |
| No Vehicle | 3 (1.0%) | 6 (2.3%) |
| 1 Vehicle | 53 (18.0%) | 58 (22.2%) |
| 2 Vehicles | 143 (48.6%) | 113 (43.3%) |
| 3 Vehicles | 29 (9.9%) | 63 (24.1%) |
| 4 Vehicles | 57 (19.4%) | 14 (5.4%) |
| 5 or more Vehicles | 9 (3.1%) | 7 (2.7%) |
| Total | 294 (100.0%) | 261 (100.0%) |
Commute Time in Avonmore borough
The most frequently occuring commute durations in Avonmore borough are 20 to 24 minutes (110 commuters, 20.6%), 30 to 34 minutes (81 commuters, 15.2%), and 60 to 89 minutes (75 commuters, 14.1%).
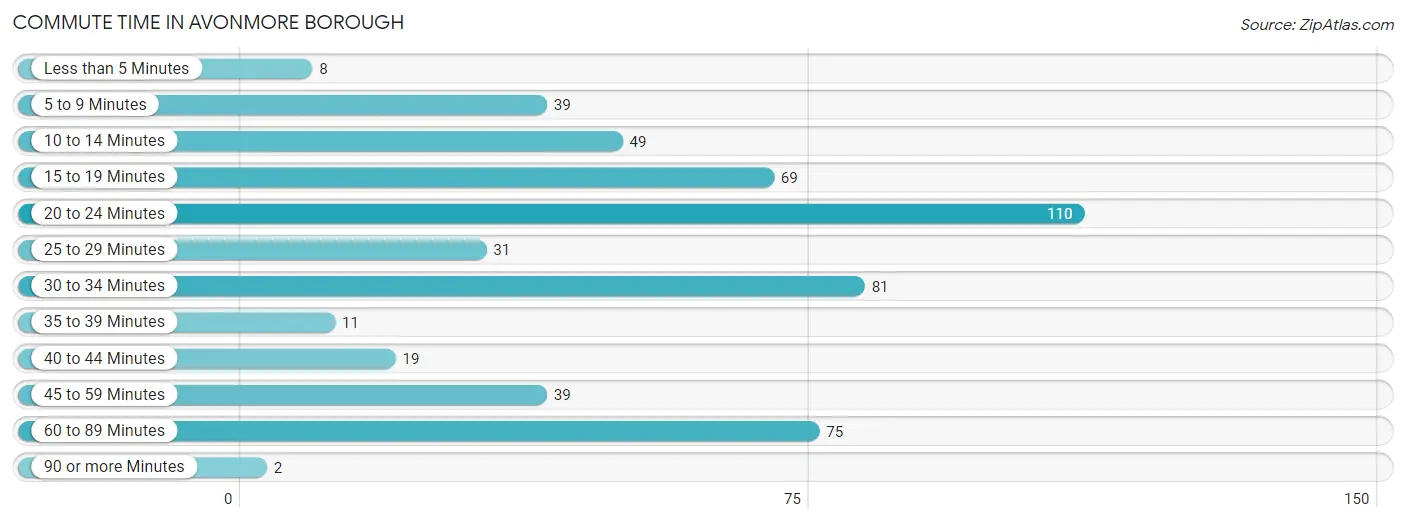
| Commute Time | # Commuters | % Commuters |
| Less than 5 Minutes | 8 | 1.5% |
| 5 to 9 Minutes | 39 | 7.3% |
| 10 to 14 Minutes | 49 | 9.2% |
| 15 to 19 Minutes | 69 | 13.0% |
| 20 to 24 Minutes | 110 | 20.6% |
| 25 to 29 Minutes | 31 | 5.8% |
| 30 to 34 Minutes | 81 | 15.2% |
| 35 to 39 Minutes | 11 | 2.1% |
| 40 to 44 Minutes | 19 | 3.6% |
| 45 to 59 Minutes | 39 | 7.3% |
| 60 to 89 Minutes | 75 | 14.1% |
| 90 or more Minutes | 2 | 0.4% |
Commute Time by Sex in Avonmore borough
The most common commute times in Avonmore borough are 15 to 19 minutes (66 commuters, 22.5%) for males and 20 to 24 minutes (83 commuters, 34.7%) for females.
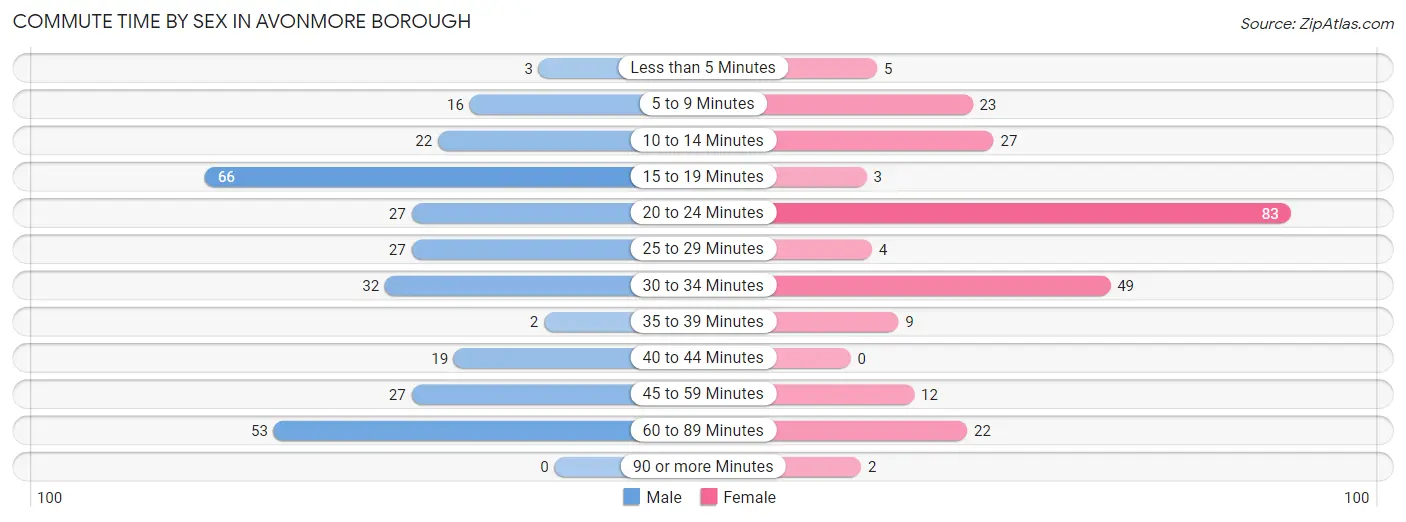
| Commute Time | Male | Female |
| Less than 5 Minutes | 3 (1.0%) | 5 (2.1%) |
| 5 to 9 Minutes | 16 (5.4%) | 23 (9.6%) |
| 10 to 14 Minutes | 22 (7.5%) | 27 (11.3%) |
| 15 to 19 Minutes | 66 (22.5%) | 3 (1.3%) |
| 20 to 24 Minutes | 27 (9.2%) | 83 (34.7%) |
| 25 to 29 Minutes | 27 (9.2%) | 4 (1.7%) |
| 30 to 34 Minutes | 32 (10.9%) | 49 (20.5%) |
| 35 to 39 Minutes | 2 (0.7%) | 9 (3.8%) |
| 40 to 44 Minutes | 19 (6.5%) | 0 (0.0%) |
| 45 to 59 Minutes | 27 (9.2%) | 12 (5.0%) |
| 60 to 89 Minutes | 53 (18.0%) | 22 (9.2%) |
| 90 or more Minutes | 0 (0.0%) | 2 (0.8%) |
Time of Departure to Work by Sex in Avonmore borough
The most frequent times of departure to work in Avonmore borough are 6:30 AM to 6:59 AM (66, 22.5%) for males and 7:30 AM to 7:59 AM (95, 39.8%) for females.
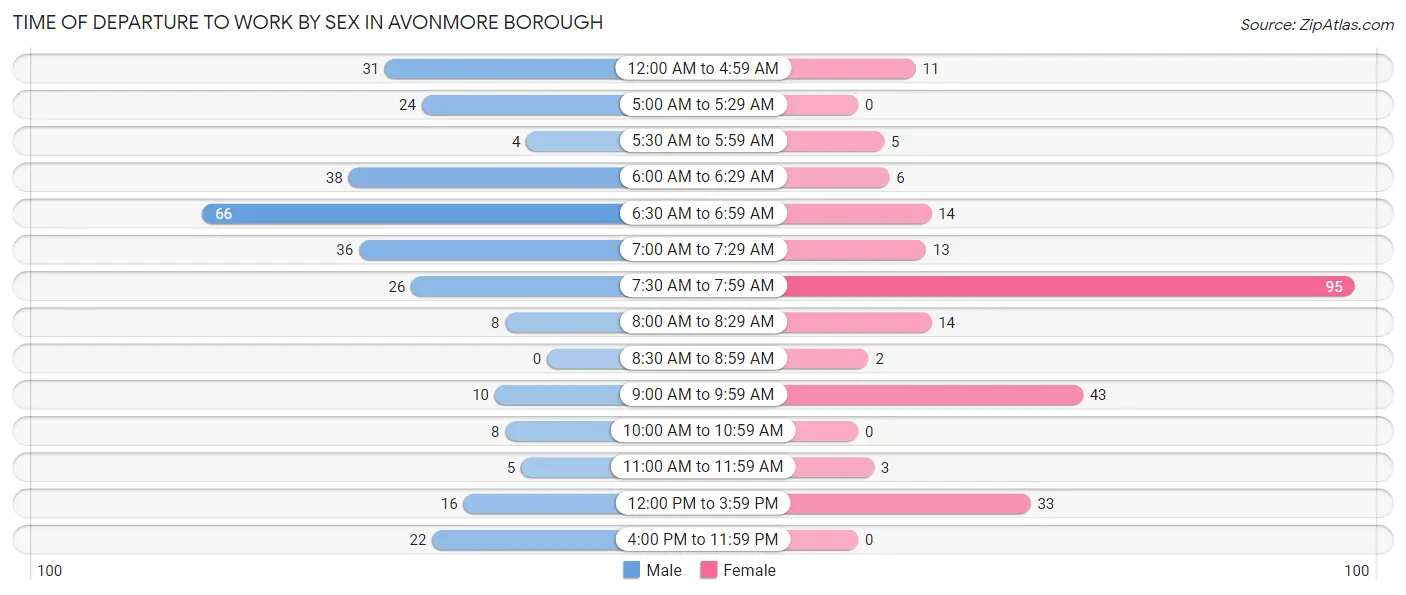
| Time of Departure | Male | Female |
| 12:00 AM to 4:59 AM | 31 (10.5%) | 11 (4.6%) |
| 5:00 AM to 5:29 AM | 24 (8.2%) | 0 (0.0%) |
| 5:30 AM to 5:59 AM | 4 (1.4%) | 5 (2.1%) |
| 6:00 AM to 6:29 AM | 38 (12.9%) | 6 (2.5%) |
| 6:30 AM to 6:59 AM | 66 (22.5%) | 14 (5.9%) |
| 7:00 AM to 7:29 AM | 36 (12.2%) | 13 (5.4%) |
| 7:30 AM to 7:59 AM | 26 (8.8%) | 95 (39.8%) |
| 8:00 AM to 8:29 AM | 8 (2.7%) | 14 (5.9%) |
| 8:30 AM to 8:59 AM | 0 (0.0%) | 2 (0.8%) |
| 9:00 AM to 9:59 AM | 10 (3.4%) | 43 (18.0%) |
| 10:00 AM to 10:59 AM | 8 (2.7%) | 0 (0.0%) |
| 11:00 AM to 11:59 AM | 5 (1.7%) | 3 (1.3%) |
| 12:00 PM to 3:59 PM | 16 (5.4%) | 33 (13.8%) |
| 4:00 PM to 11:59 PM | 22 (7.5%) | 0 (0.0%) |
| Total | 294 (100.0%) | 239 (100.0%) |
Housing Occupancy in Avonmore borough
Occupancy by Ownership in Avonmore borough
Of the total 477 dwellings in Avonmore borough, owner-occupied units account for 310 (65.0%), while renter-occupied units make up 167 (35.0%).
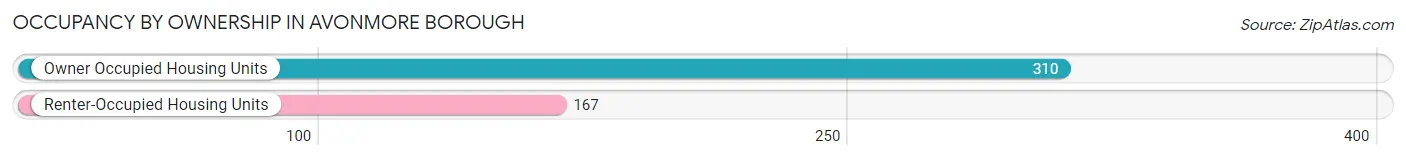
| Occupancy | # Housing Units | % Housing Units |
| Owner Occupied Housing Units | 310 | 65.0% |
| Renter-Occupied Housing Units | 167 | 35.0% |
| Total Occupied Housing Units | 477 | 100.0% |
Occupancy by Household Size in Avonmore borough
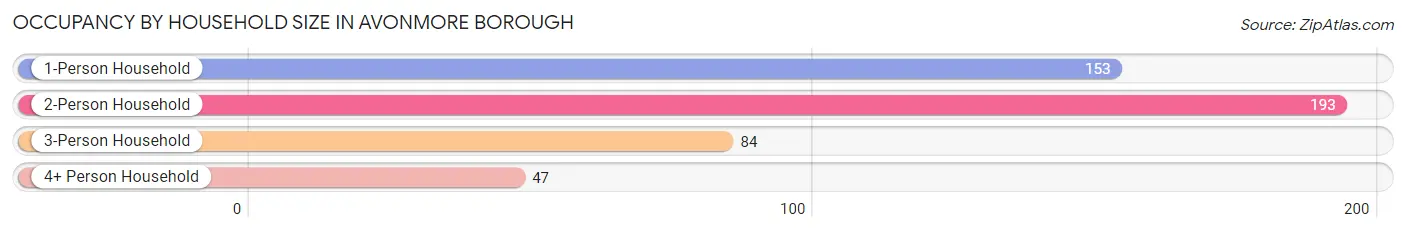
| Household Size | # Housing Units | % Housing Units |
| 1-Person Household | 153 | 32.1% |
| 2-Person Household | 193 | 40.5% |
| 3-Person Household | 84 | 17.6% |
| 4+ Person Household | 47 | 9.9% |
| Total Housing Units | 477 | 100.0% |
Occupancy by Ownership by Household Size in Avonmore borough
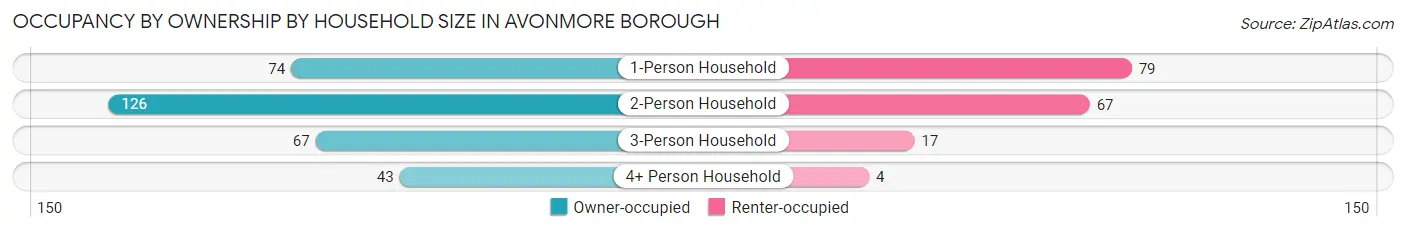
| Household Size | Owner-occupied | Renter-occupied |
| 1-Person Household | 74 (48.4%) | 79 (51.6%) |
| 2-Person Household | 126 (65.3%) | 67 (34.7%) |
| 3-Person Household | 67 (79.8%) | 17 (20.2%) |
| 4+ Person Household | 43 (91.5%) | 4 (8.5%) |
| Total Housing Units | 310 (65.0%) | 167 (35.0%) |
Occupancy by Educational Attainment in Avonmore borough
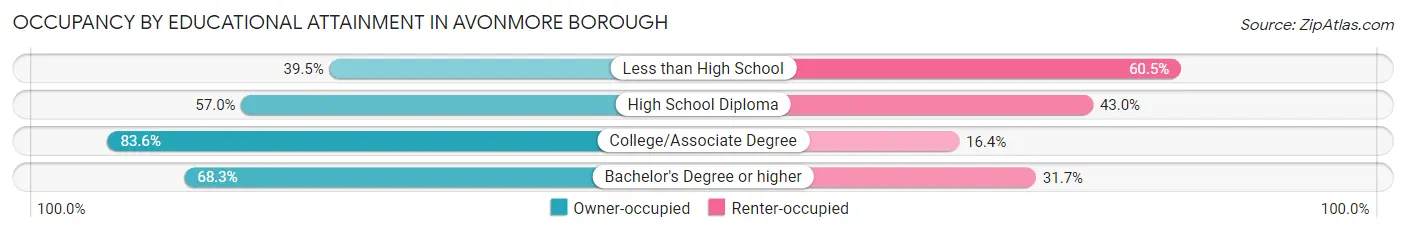
| Household Size | Owner-occupied | Renter-occupied |
| Less than High School | 17 (39.5%) | 26 (60.5%) |
| High School Diploma | 130 (57.0%) | 98 (43.0%) |
| College/Associate Degree | 122 (83.6%) | 24 (16.4%) |
| Bachelor's Degree or higher | 41 (68.3%) | 19 (31.7%) |
Occupancy by Age of Householder in Avonmore borough
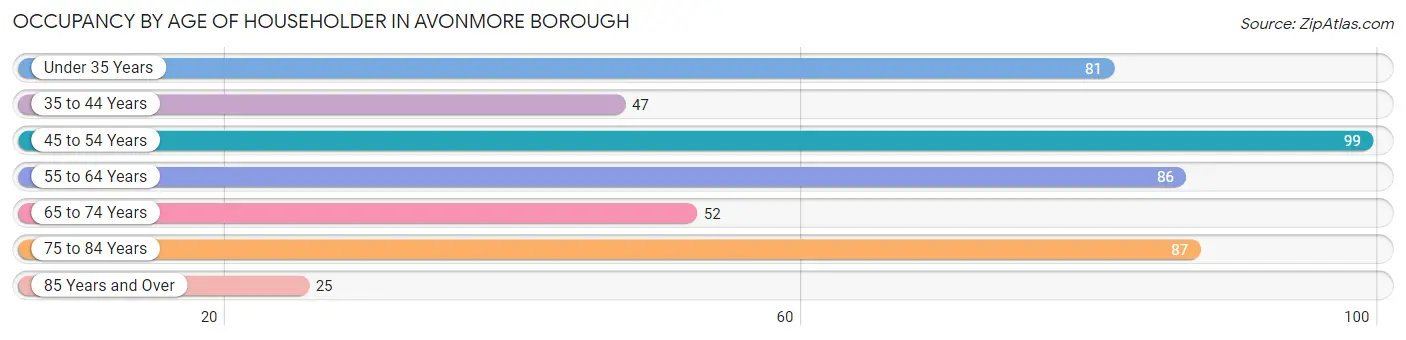
| Age Bracket | # Households | % Households |
| Under 35 Years | 81 | 17.0% |
| 35 to 44 Years | 47 | 9.9% |
| 45 to 54 Years | 99 | 20.7% |
| 55 to 64 Years | 86 | 18.0% |
| 65 to 74 Years | 52 | 10.9% |
| 75 to 84 Years | 87 | 18.2% |
| 85 Years and Over | 25 | 5.2% |
| Total | 477 | 100.0% |
Housing Finances in Avonmore borough
Median Income by Occupancy in Avonmore borough
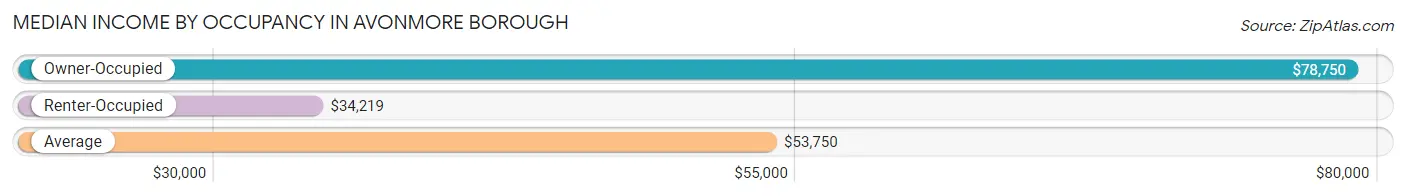
| Occupancy Type | # Households | Median Income |
| Owner-Occupied | 310 (65.0%) | $78,750 |
| Renter-Occupied | 167 (35.0%) | $34,219 |
| Average | 477 (100.0%) | $53,750 |
Occupancy by Householder Income Bracket in Avonmore borough
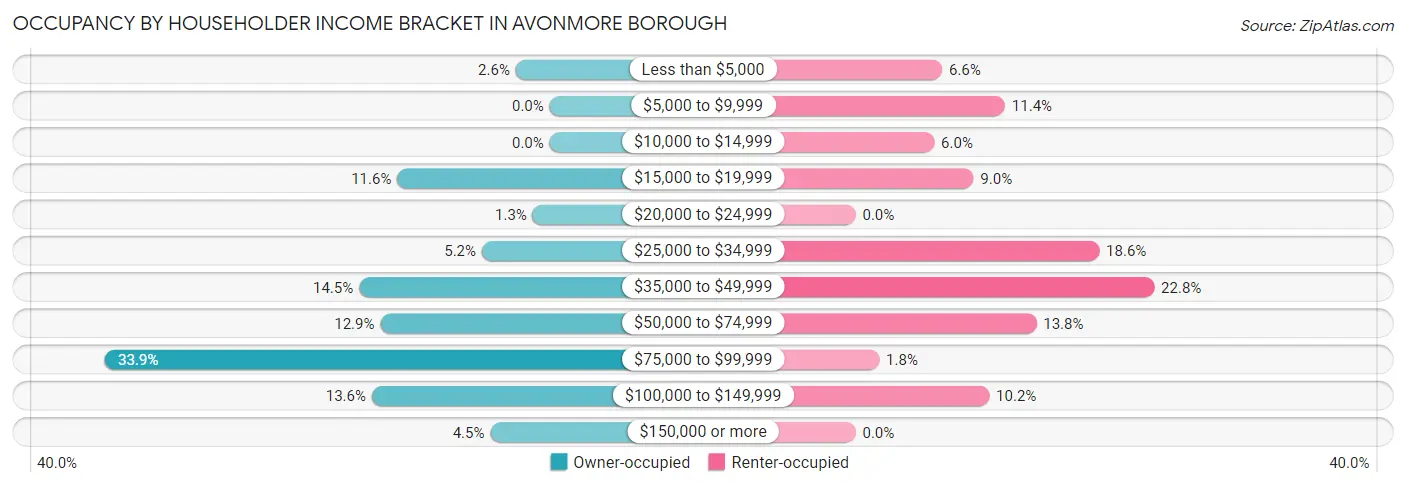
| Income Bracket | Owner-occupied | Renter-occupied |
| Less than $5,000 | 8 (2.6%) | 11 (6.6%) |
| $5,000 to $9,999 | 0 (0.0%) | 19 (11.4%) |
| $10,000 to $14,999 | 0 (0.0%) | 10 (6.0%) |
| $15,000 to $19,999 | 36 (11.6%) | 15 (9.0%) |
| $20,000 to $24,999 | 4 (1.3%) | 0 (0.0%) |
| $25,000 to $34,999 | 16 (5.2%) | 31 (18.6%) |
| $35,000 to $49,999 | 45 (14.5%) | 38 (22.8%) |
| $50,000 to $74,999 | 40 (12.9%) | 23 (13.8%) |
| $75,000 to $99,999 | 105 (33.9%) | 3 (1.8%) |
| $100,000 to $149,999 | 42 (13.6%) | 17 (10.2%) |
| $150,000 or more | 14 (4.5%) | 0 (0.0%) |
| Total | 310 (100.0%) | 167 (100.0%) |
Monthly Housing Cost Tiers in Avonmore borough
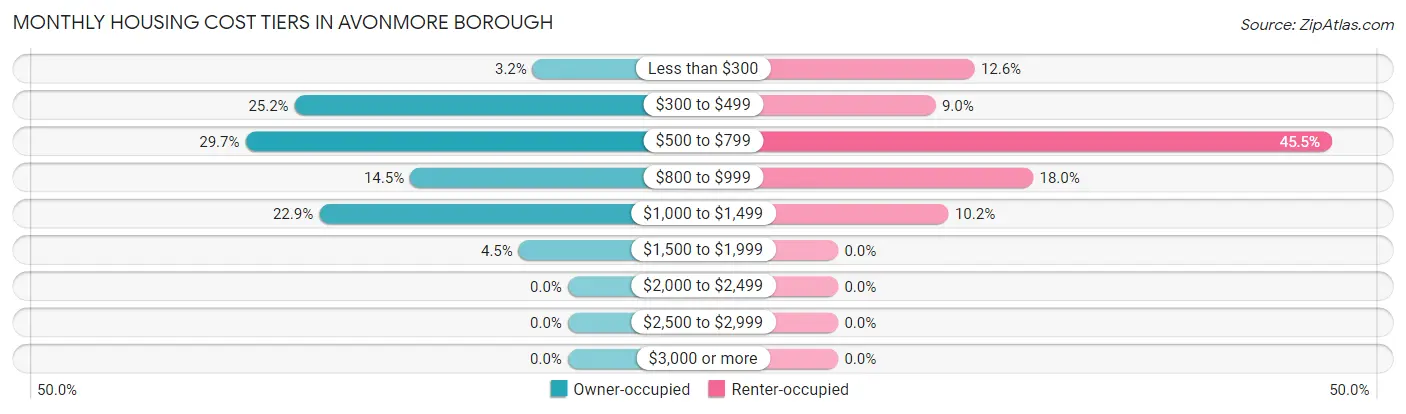
| Monthly Cost | Owner-occupied | Renter-occupied |
| Less than $300 | 10 (3.2%) | 21 (12.6%) |
| $300 to $499 | 78 (25.2%) | 15 (9.0%) |
| $500 to $799 | 92 (29.7%) | 76 (45.5%) |
| $800 to $999 | 45 (14.5%) | 30 (18.0%) |
| $1,000 to $1,499 | 71 (22.9%) | 17 (10.2%) |
| $1,500 to $1,999 | 14 (4.5%) | 0 (0.0%) |
| $2,000 to $2,499 | 0 (0.0%) | 0 (0.0%) |
| $2,500 to $2,999 | 0 (0.0%) | 0 (0.0%) |
| $3,000 or more | 0 (0.0%) | 0 (0.0%) |
| Total | 310 (100.0%) | 167 (100.0%) |
Physical Housing Characteristics in Avonmore borough
Housing Structures in Avonmore borough
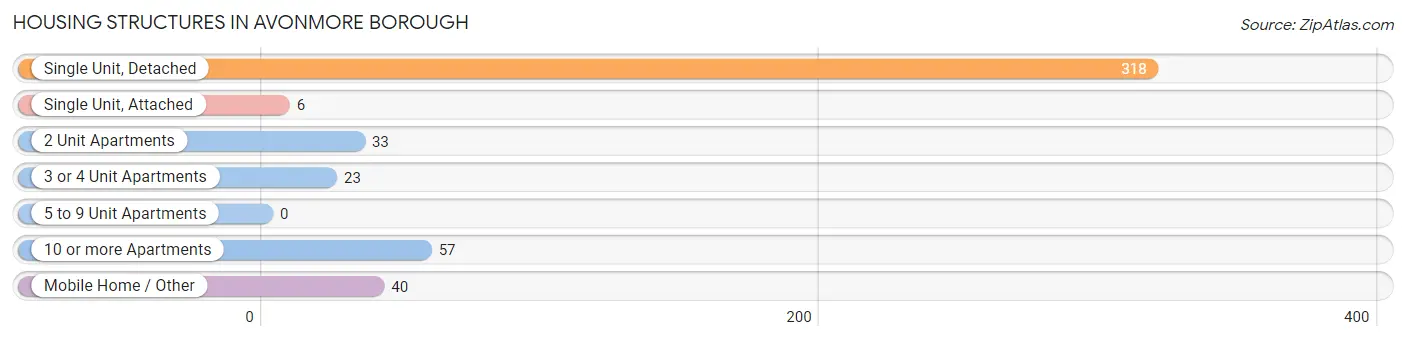
| Structure Type | # Housing Units | % Housing Units |
| Single Unit, Detached | 318 | 66.7% |
| Single Unit, Attached | 6 | 1.3% |
| 2 Unit Apartments | 33 | 6.9% |
| 3 or 4 Unit Apartments | 23 | 4.8% |
| 5 to 9 Unit Apartments | 0 | 0.0% |
| 10 or more Apartments | 57 | 11.9% |
| Mobile Home / Other | 40 | 8.4% |
| Total | 477 | 100.0% |
Housing Structures by Occupancy in Avonmore borough
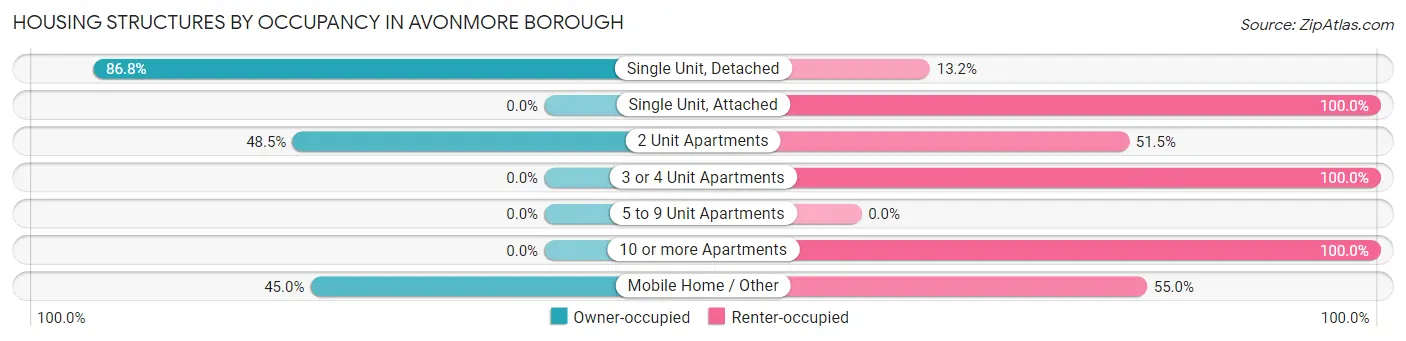
| Structure Type | Owner-occupied | Renter-occupied |
| Single Unit, Detached | 276 (86.8%) | 42 (13.2%) |
| Single Unit, Attached | 0 (0.0%) | 6 (100.0%) |
| 2 Unit Apartments | 16 (48.5%) | 17 (51.5%) |
| 3 or 4 Unit Apartments | 0 (0.0%) | 23 (100.0%) |
| 5 to 9 Unit Apartments | 0 (0.0%) | 0 (0.0%) |
| 10 or more Apartments | 0 (0.0%) | 57 (100.0%) |
| Mobile Home / Other | 18 (45.0%) | 22 (55.0%) |
| Total | 310 (65.0%) | 167 (35.0%) |
Housing Structures by Number of Rooms in Avonmore borough
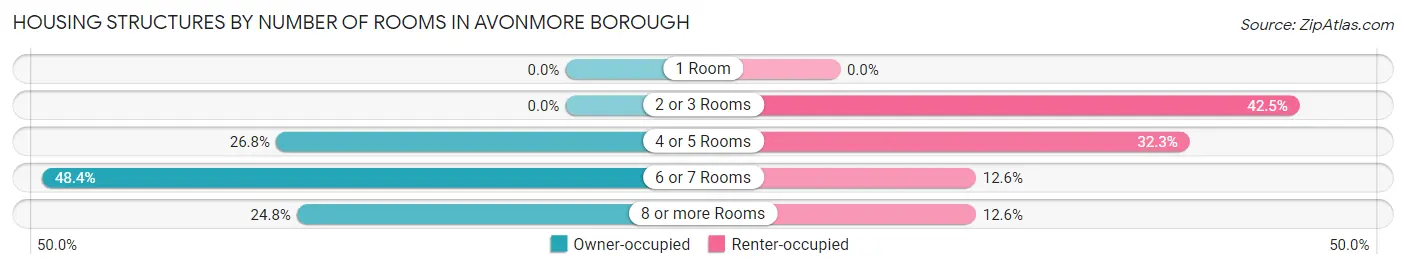
| Number of Rooms | Owner-occupied | Renter-occupied |
| 1 Room | 0 (0.0%) | 0 (0.0%) |
| 2 or 3 Rooms | 0 (0.0%) | 71 (42.5%) |
| 4 or 5 Rooms | 83 (26.8%) | 54 (32.3%) |
| 6 or 7 Rooms | 150 (48.4%) | 21 (12.6%) |
| 8 or more Rooms | 77 (24.8%) | 21 (12.6%) |
| Total | 310 (100.0%) | 167 (100.0%) |
Housing Structure by Heating Type in Avonmore borough
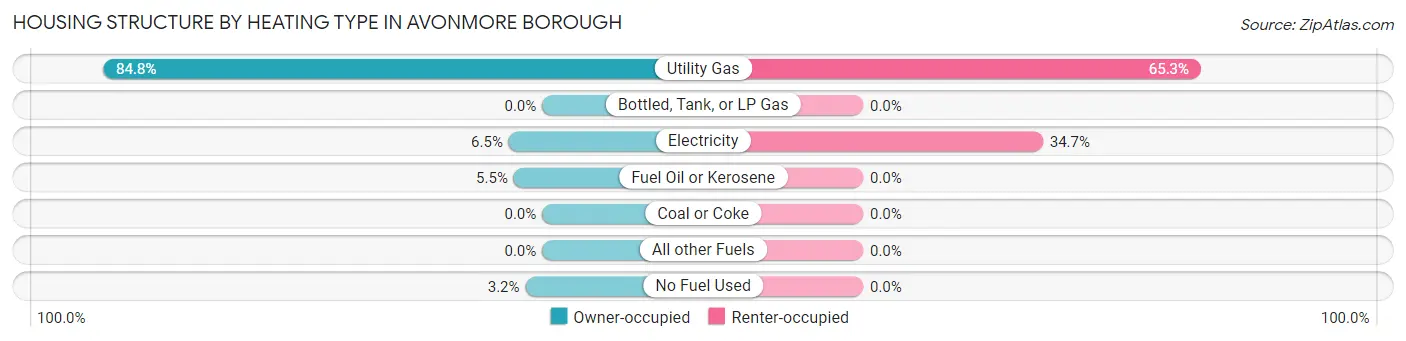
| Heating Type | Owner-occupied | Renter-occupied |
| Utility Gas | 263 (84.8%) | 109 (65.3%) |
| Bottled, Tank, or LP Gas | 0 (0.0%) | 0 (0.0%) |
| Electricity | 20 (6.5%) | 58 (34.7%) |
| Fuel Oil or Kerosene | 17 (5.5%) | 0 (0.0%) |
| Coal or Coke | 0 (0.0%) | 0 (0.0%) |
| All other Fuels | 0 (0.0%) | 0 (0.0%) |
| No Fuel Used | 10 (3.2%) | 0 (0.0%) |
| Total | 310 (100.0%) | 167 (100.0%) |
Household Vehicle Usage in Avonmore borough
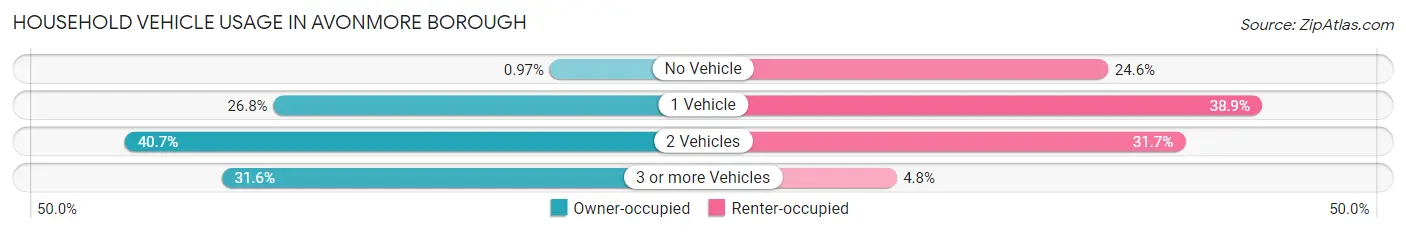
| Vehicles per Household | Owner-occupied | Renter-occupied |
| No Vehicle | 3 (1.0%) | 41 (24.5%) |
| 1 Vehicle | 83 (26.8%) | 65 (38.9%) |
| 2 Vehicles | 126 (40.6%) | 53 (31.7%) |
| 3 or more Vehicles | 98 (31.6%) | 8 (4.8%) |
| Total | 310 (100.0%) | 167 (100.0%) |
Real Estate & Mortgages in Avonmore borough
Real Estate and Mortgage Overview in Avonmore borough
| Characteristic | Without Mortgage | With Mortgage |
| Housing Units | 150 | 160 |
| Median Property Value | $105,000 | $78,200 |
| Median Household Income | $57,308 | $9 |
| Monthly Housing Costs | $450 | $0 |
| Real Estate Taxes | $2,213 | $0 |
Property Value by Mortgage Status in Avonmore borough
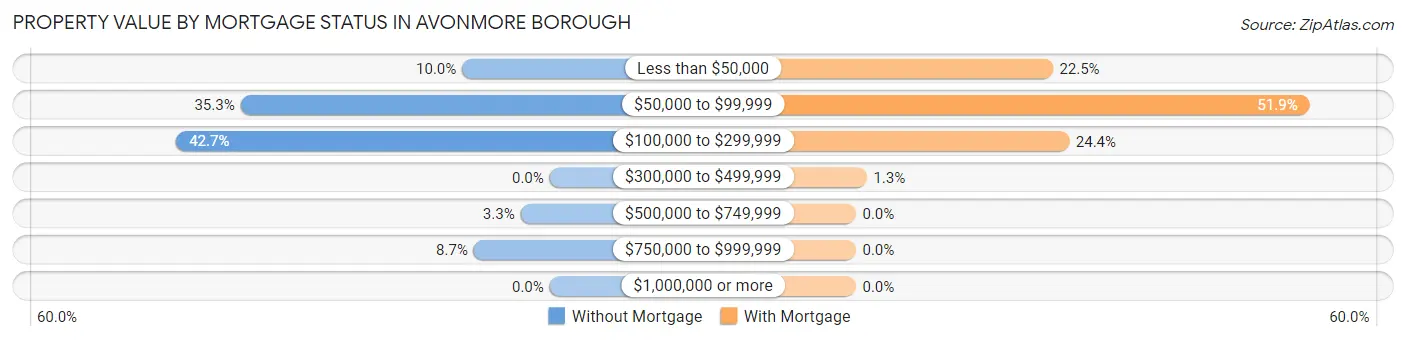
| Property Value | Without Mortgage | With Mortgage |
| Less than $50,000 | 15 (10.0%) | 36 (22.5%) |
| $50,000 to $99,999 | 53 (35.3%) | 83 (51.9%) |
| $100,000 to $299,999 | 64 (42.7%) | 39 (24.4%) |
| $300,000 to $499,999 | 0 (0.0%) | 2 (1.3%) |
| $500,000 to $749,999 | 5 (3.3%) | 0 (0.0%) |
| $750,000 to $999,999 | 13 (8.7%) | 0 (0.0%) |
| $1,000,000 or more | 0 (0.0%) | 0 (0.0%) |
| Total | 150 (100.0%) | 160 (100.0%) |
Household Income by Mortgage Status in Avonmore borough
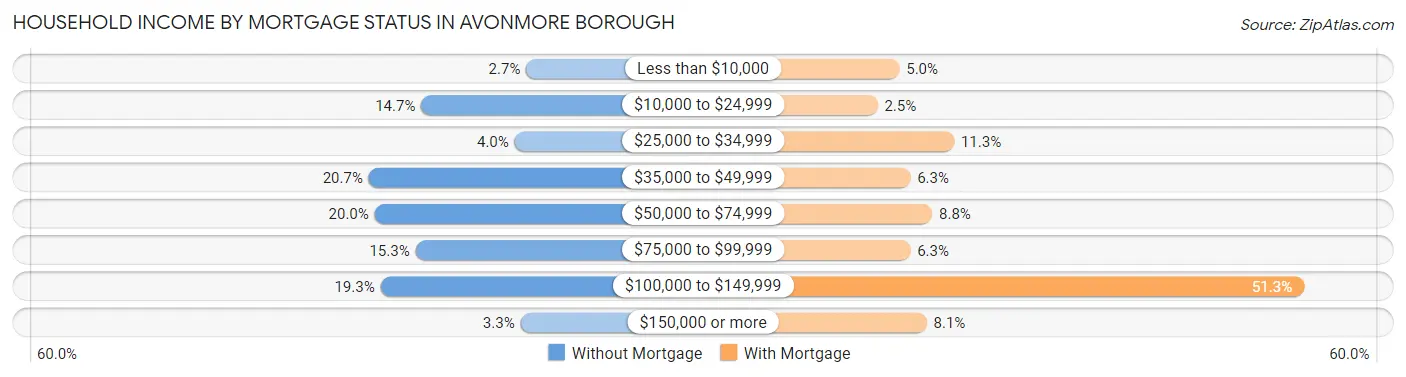
| Household Income | Without Mortgage | With Mortgage |
| Less than $10,000 | 4 (2.7%) | 8 (5.0%) |
| $10,000 to $24,999 | 22 (14.7%) | 4 (2.5%) |
| $25,000 to $34,999 | 6 (4.0%) | 18 (11.3%) |
| $35,000 to $49,999 | 31 (20.7%) | 10 (6.2%) |
| $50,000 to $74,999 | 30 (20.0%) | 14 (8.7%) |
| $75,000 to $99,999 | 23 (15.3%) | 10 (6.2%) |
| $100,000 to $149,999 | 29 (19.3%) | 82 (51.2%) |
| $150,000 or more | 5 (3.3%) | 13 (8.1%) |
| Total | 150 (100.0%) | 160 (100.0%) |
Property Value to Household Income Ratio in Avonmore borough
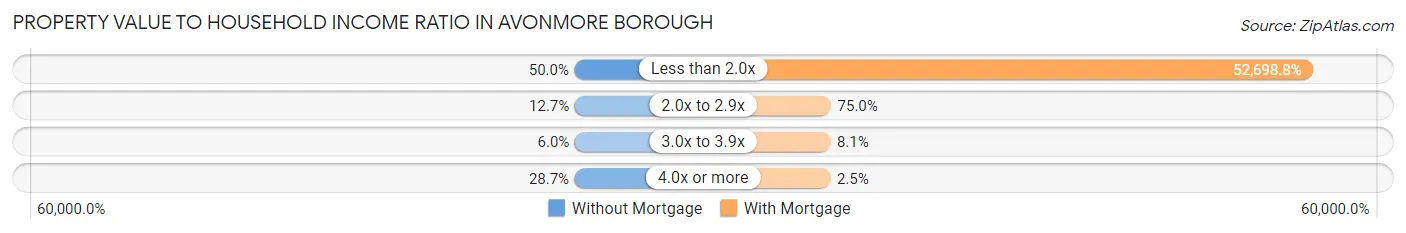
| Value-to-Income Ratio | Without Mortgage | With Mortgage |
| Less than 2.0x | 75 (50.0%) | 84,318 (52,698.7%) |
| 2.0x to 2.9x | 19 (12.7%) | 120 (75.0%) |
| 3.0x to 3.9x | 9 (6.0%) | 13 (8.1%) |
| 4.0x or more | 43 (28.7%) | 4 (2.5%) |
| Total | 150 (100.0%) | 160 (100.0%) |
Real Estate Taxes by Mortgage Status in Avonmore borough
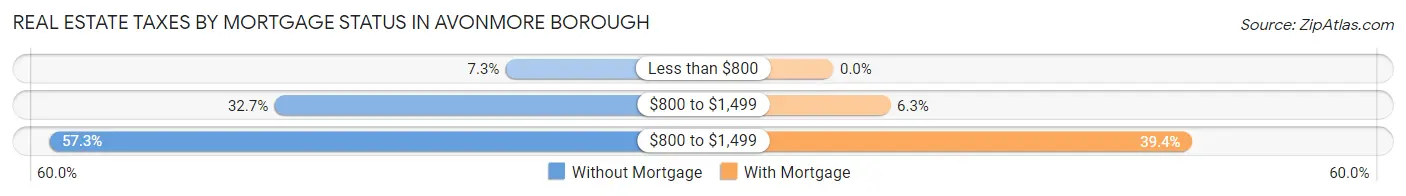
| Property Taxes | Without Mortgage | With Mortgage |
| Less than $800 | 11 (7.3%) | 0 (0.0%) |
| $800 to $1,499 | 49 (32.7%) | 10 (6.2%) |
| $800 to $1,499 | 86 (57.3%) | 63 (39.4%) |
| Total | 150 (100.0%) | 160 (100.0%) |
Health & Disability in Avonmore borough
Health Insurance Coverage by Age in Avonmore borough
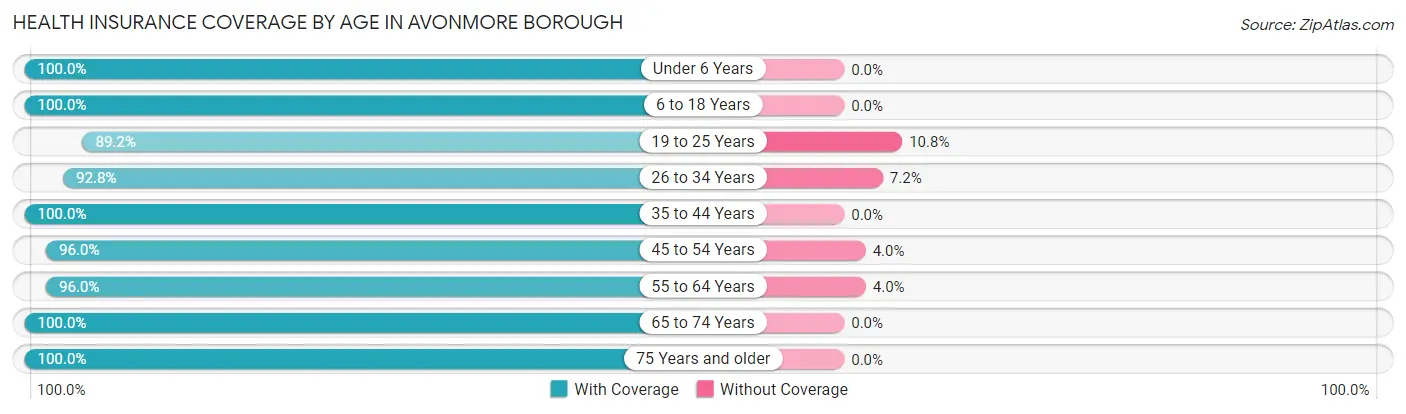
| Age Bracket | With Coverage | Without Coverage |
| Under 6 Years | 10 (100.0%) | 0 (0.0%) |
| 6 to 18 Years | 98 (100.0%) | 0 (0.0%) |
| 19 to 25 Years | 165 (89.2%) | 20 (10.8%) |
| 26 to 34 Years | 116 (92.8%) | 9 (7.2%) |
| 35 to 44 Years | 71 (100.0%) | 0 (0.0%) |
| 45 to 54 Years | 192 (96.0%) | 8 (4.0%) |
| 55 to 64 Years | 167 (96.0%) | 7 (4.0%) |
| 65 to 74 Years | 85 (100.0%) | 0 (0.0%) |
| 75 Years and older | 131 (100.0%) | 0 (0.0%) |
| Total | 1,035 (95.9%) | 44 (4.1%) |
Health Insurance Coverage by Citizenship Status in Avonmore borough
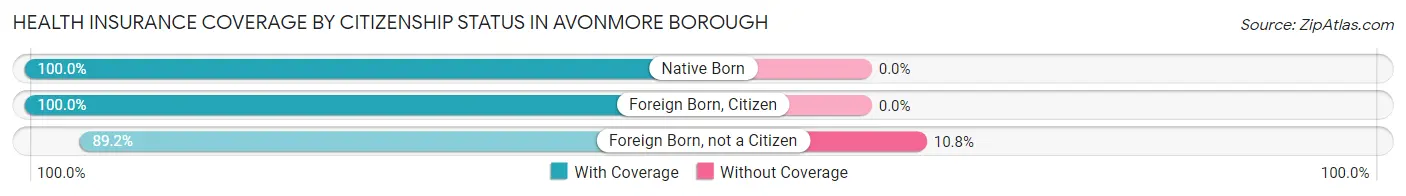
| Citizenship Status | With Coverage | Without Coverage |
| Native Born | 10 (100.0%) | 0 (0.0%) |
| Foreign Born, Citizen | 98 (100.0%) | 0 (0.0%) |
| Foreign Born, not a Citizen | 165 (89.2%) | 20 (10.8%) |
Health Insurance Coverage by Household Income in Avonmore borough
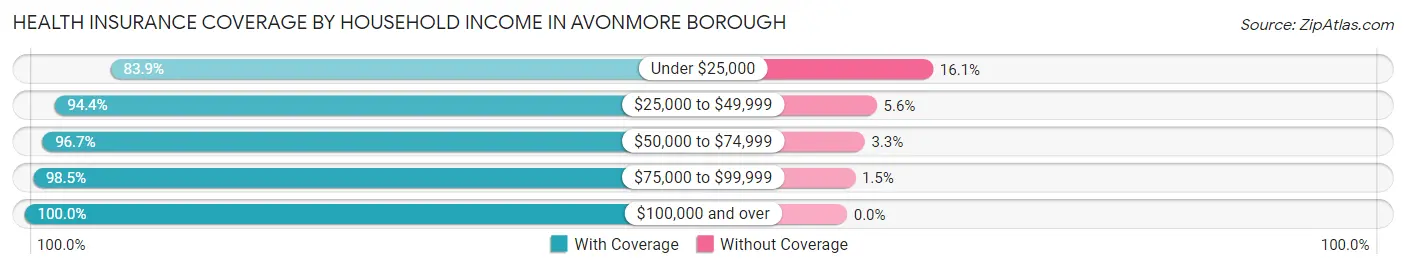
| Household Income | With Coverage | Without Coverage |
| Under $25,000 | 104 (83.9%) | 20 (16.1%) |
| $25,000 to $49,999 | 237 (94.4%) | 14 (5.6%) |
| $50,000 to $74,999 | 146 (96.7%) | 5 (3.3%) |
| $75,000 to $99,999 | 322 (98.5%) | 5 (1.5%) |
| $100,000 and over | 226 (100.0%) | 0 (0.0%) |
Public vs Private Health Insurance Coverage by Age in Avonmore borough
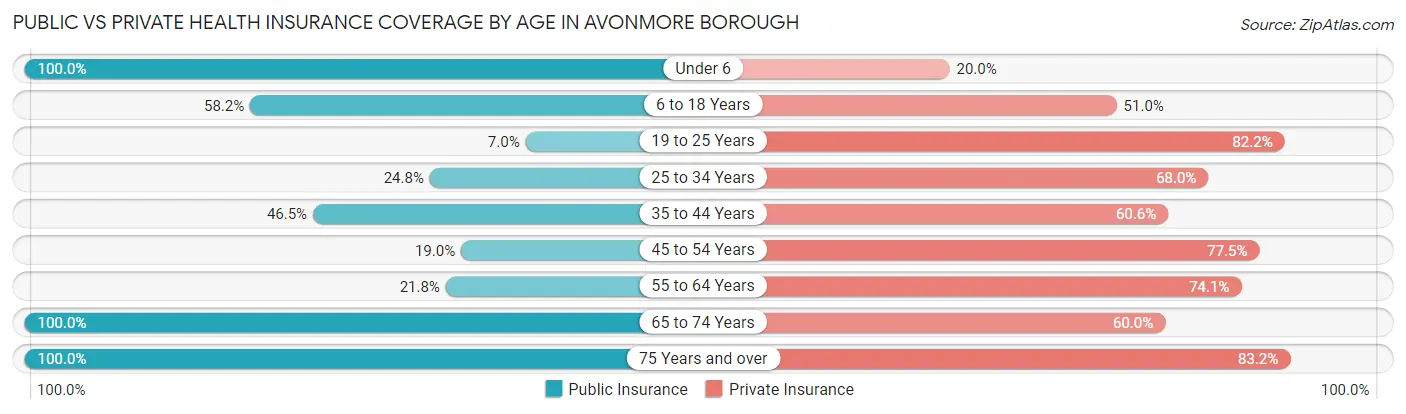
| Age Bracket | Public Insurance | Private Insurance |
| Under 6 | 10 (100.0%) | 2 (20.0%) |
| 6 to 18 Years | 57 (58.2%) | 50 (51.0%) |
| 19 to 25 Years | 13 (7.0%) | 152 (82.2%) |
| 25 to 34 Years | 31 (24.8%) | 85 (68.0%) |
| 35 to 44 Years | 33 (46.5%) | 43 (60.6%) |
| 45 to 54 Years | 38 (19.0%) | 155 (77.5%) |
| 55 to 64 Years | 38 (21.8%) | 129 (74.1%) |
| 65 to 74 Years | 85 (100.0%) | 51 (60.0%) |
| 75 Years and over | 131 (100.0%) | 109 (83.2%) |
| Total | 436 (40.4%) | 776 (71.9%) |
Disability Status by Sex by Age in Avonmore borough
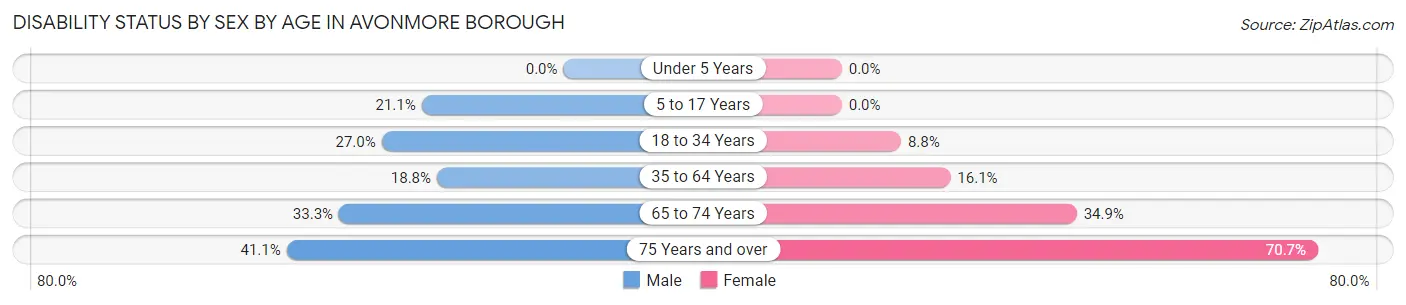
| Age Bracket | Male | Female |
| Under 5 Years | 0 (0.0%) | 0 (0.0%) |
| 5 to 17 Years | 8 (21.0%) | 0 (0.0%) |
| 18 to 34 Years | 64 (27.0%) | 8 (8.8%) |
| 35 to 64 Years | 37 (18.8%) | 40 (16.1%) |
| 65 to 74 Years | 14 (33.3%) | 15 (34.9%) |
| 75 Years and over | 30 (41.1%) | 41 (70.7%) |
Disability Class by Sex by Age in Avonmore borough
Disability Class: Hearing Difficulty
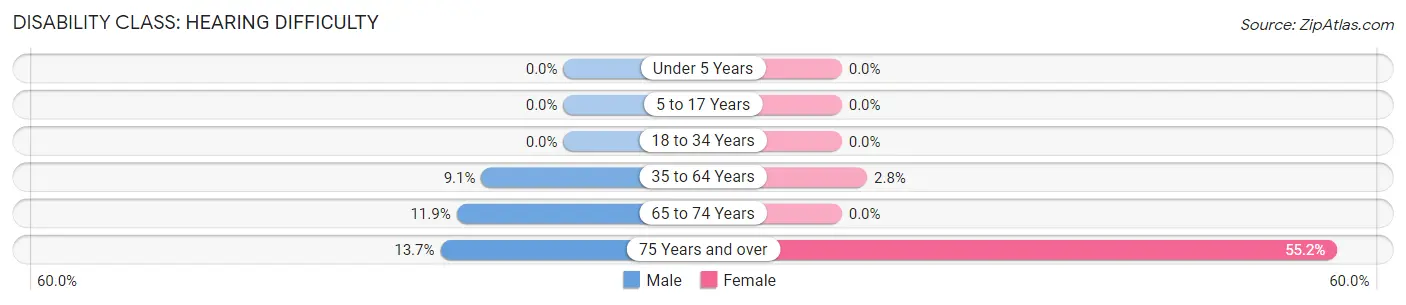
| Age Bracket | Male | Female |
| Under 5 Years | 0 (0.0%) | 0 (0.0%) |
| 5 to 17 Years | 0 (0.0%) | 0 (0.0%) |
| 18 to 34 Years | 0 (0.0%) | 0 (0.0%) |
| 35 to 64 Years | 18 (9.1%) | 7 (2.8%) |
| 65 to 74 Years | 5 (11.9%) | 0 (0.0%) |
| 75 Years and over | 10 (13.7%) | 32 (55.2%) |
Disability Class: Vision Difficulty
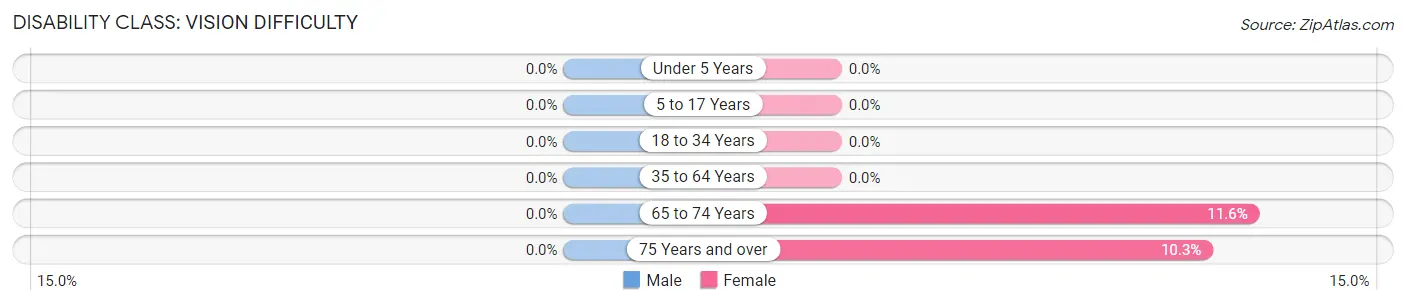
| Age Bracket | Male | Female |
| Under 5 Years | 0 (0.0%) | 0 (0.0%) |
| 5 to 17 Years | 0 (0.0%) | 0 (0.0%) |
| 18 to 34 Years | 0 (0.0%) | 0 (0.0%) |
| 35 to 64 Years | 0 (0.0%) | 0 (0.0%) |
| 65 to 74 Years | 0 (0.0%) | 5 (11.6%) |
| 75 Years and over | 0 (0.0%) | 6 (10.3%) |
Disability Class: Cognitive Difficulty
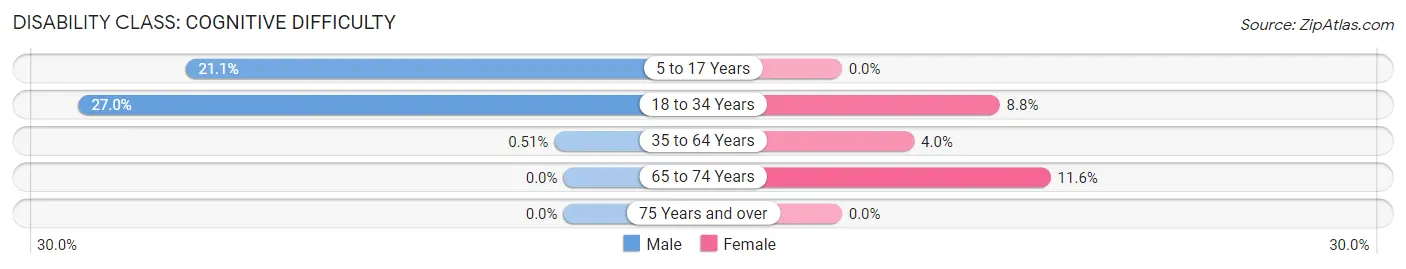
| Age Bracket | Male | Female |
| 5 to 17 Years | 8 (21.0%) | 0 (0.0%) |
| 18 to 34 Years | 64 (27.0%) | 8 (8.8%) |
| 35 to 64 Years | 1 (0.5%) | 10 (4.0%) |
| 65 to 74 Years | 0 (0.0%) | 5 (11.6%) |
| 75 Years and over | 0 (0.0%) | 0 (0.0%) |
Disability Class: Ambulatory Difficulty
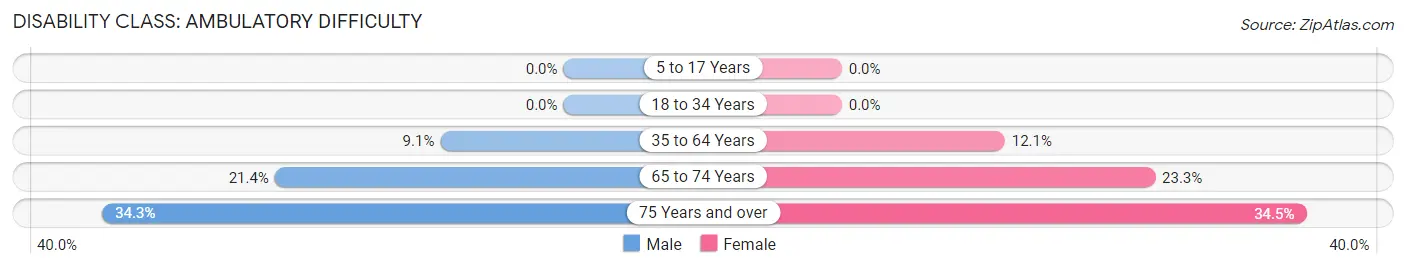
| Age Bracket | Male | Female |
| 5 to 17 Years | 0 (0.0%) | 0 (0.0%) |
| 18 to 34 Years | 0 (0.0%) | 0 (0.0%) |
| 35 to 64 Years | 18 (9.1%) | 30 (12.1%) |
| 65 to 74 Years | 9 (21.4%) | 10 (23.3%) |
| 75 Years and over | 25 (34.3%) | 20 (34.5%) |
Disability Class: Self-Care Difficulty
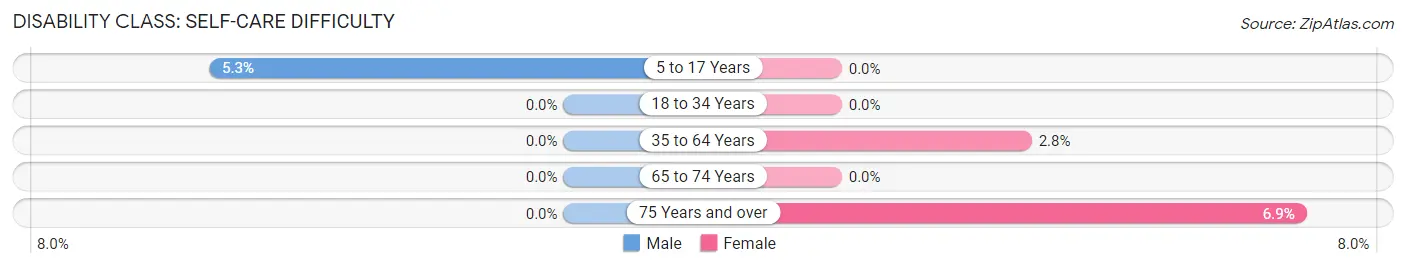
| Age Bracket | Male | Female |
| 5 to 17 Years | 2 (5.3%) | 0 (0.0%) |
| 18 to 34 Years | 0 (0.0%) | 0 (0.0%) |
| 35 to 64 Years | 0 (0.0%) | 7 (2.8%) |
| 65 to 74 Years | 0 (0.0%) | 0 (0.0%) |
| 75 Years and over | 0 (0.0%) | 4 (6.9%) |
Technology Access in Avonmore borough
Computing Device Access in Avonmore borough
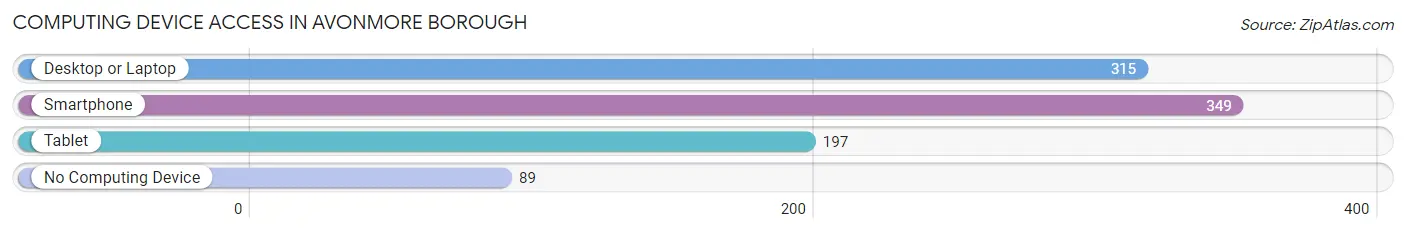
| Device Type | # Households | % Households |
| Desktop or Laptop | 315 | 66.0% |
| Smartphone | 349 | 73.2% |
| Tablet | 197 | 41.3% |
| No Computing Device | 89 | 18.7% |
| Total | 477 | 100.0% |
Internet Access in Avonmore borough
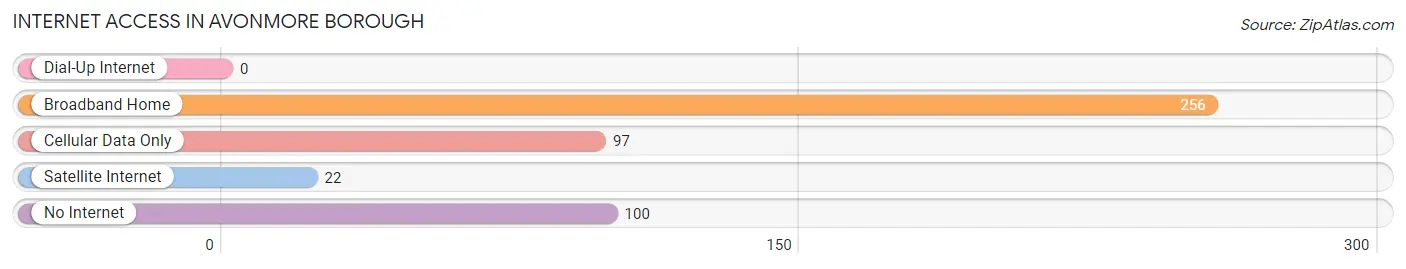
| Internet Type | # Households | % Households |
| Dial-Up Internet | 0 | 0.0% |
| Broadband Home | 256 | 53.7% |
| Cellular Data Only | 97 | 20.3% |
| Satellite Internet | 22 | 4.6% |
| No Internet | 100 | 21.0% |
| Total | 477 | 100.0% |
Avonmore borough Summary
Avonmore Borough is a small borough located in Westmoreland County, Pennsylvania. It is situated in the foothills of the Allegheny Mountains, approximately 30 miles east of Pittsburgh. The borough is home to a population of approximately 1,000 people, and is known for its rural charm and small-town atmosphere.
History
Avonmore Borough was founded in 1891 by a group of settlers from the nearby town of Avonmore. The settlers were looking for a place to call home and found the area to be ideal for their needs. The borough was officially incorporated in 1895 and has remained a small, rural community ever since.
The borough was named after the nearby Avonmore River, which was named after the Avonmore family who had settled in the area in the late 1700s. The Avonmore family was of Irish descent and had a long history in the area.
The borough was originally a farming community, with many of the residents working in the local agricultural industry. In the early 1900s, the borough began to experience a period of growth and development. The population increased and new businesses began to open up in the area.
In the 1950s, the borough experienced a period of decline as many of the local businesses closed and the population began to decline. However, in the late 1970s, the borough began to experience a period of revitalization. New businesses began to open up and the population began to increase once again.
Geography
Avonmore Borough is located in Westmoreland County, Pennsylvania. It is situated in the foothills of the Allegheny Mountains, approximately 30 miles east of Pittsburgh. The borough is bordered by the towns of Avonmore, Loyalhanna, and Saltsburg.
The borough is located in a rural area and is known for its rolling hills and scenic views. The borough is home to several parks and recreational areas, including the Avonmore Community Park, which features a playground, picnic area, and walking trails.
Economy
Avonmore Borough is a small, rural community with a population of approximately 1,000 people. The borough is home to several small businesses, including a grocery store, a hardware store, and a few restaurants. The borough also has a few small manufacturing companies.
The borough is home to several farms, which produce a variety of crops, including corn, soybeans, and hay. The borough also has a few small wineries, which produce a variety of wines.
Demographics
As of the 2010 census, the population of Avonmore Borough was 1,000 people. The racial makeup of the borough was 97.2% White, 0.7% African American, 0.2% Native American, 0.2% Asian, 0.2% from other races, and 1.7% from two or more races. Hispanic or Latino of any race were 0.7% of the population.
The median household income in Avonmore Borough was $37,500, and the median family income was $45,000. The per capita income for the borough was $18,000. About 8.3% of families and 10.2% of the population were below the poverty line, including 14.3% of those under age 18 and 6.7% of those age 65 or over.
Common Questions
What is Per Capita Income in Avonmore borough?
Per Capita income in Avonmore borough is $28,796.
What is the Median Family Income in Avonmore borough?
Median Family Income in Avonmore borough is $82,993.
What is the Median Household income in Avonmore borough?
Median Household Income in Avonmore borough is $53,750.
What is Income or Wage Gap in Avonmore borough?
Income or Wage Gap in Avonmore borough is 11.0%.
Women in Avonmore borough earn 89.0 cents for every dollar earned by a man.
What is Inequality or Gini Index in Avonmore borough?
Inequality or Gini Index in Avonmore borough is 0.39.
What is the Total Population of Avonmore borough?
Total Population of Avonmore borough is 1,079.
What is the Total Male Population of Avonmore borough?
Total Male Population of Avonmore borough is 587.
What is the Total Female Population of Avonmore borough?
Total Female Population of Avonmore borough is 492.
What is the Ratio of Males per 100 Females in Avonmore borough?
There are 119.31 Males per 100 Females in Avonmore borough.
What is the Ratio of Females per 100 Males in Avonmore borough?
There are 83.82 Females per 100 Males in Avonmore borough.
What is the Median Population Age in Avonmore borough?
Median Population Age in Avonmore borough is 50.6 Years.
What is the Average Family Size in Avonmore borough
Average Family Size in Avonmore borough is 2.9 People.
What is the Average Household Size in Avonmore borough
Average Household Size in Avonmore borough is 2.3 People.
How Large is the Labor Force in Avonmore borough?
There are 622 People in the Labor Forcein in Avonmore borough.
What is the Percentage of People in the Labor Force in Avonmore borough?
61.2% of People are in the Labor Force in Avonmore borough.
What is the Unemployment Rate in Avonmore borough?
Unemployment Rate in Avonmore borough is 4.2%.