Meadowood, PA Map & Demographics
Meadowood Map
Meadowood Overview
$36,370
PER CAPITA INCOME
$100,844
AVG FAMILY INCOME
$87,627
AVG HOUSEHOLD INCOME
54.9%
WAGE / INCOME GAP [ % ]
45.1¢/ $1
WAGE / INCOME GAP [ $ ]
0.34
INEQUALITY / GINI INDEX
2,936
TOTAL POPULATION
1,606
MALE POPULATION
1,330
FEMALE POPULATION
120.75
MALES / 100 FEMALES
82.81
FEMALES / 100 MALES
52.3
MEDIAN AGE
2.8
AVG FAMILY SIZE
2.2
AVG HOUSEHOLD SIZE
1,486
LABOR FORCE [ PEOPLE ]
57.5%
PERCENT IN LABOR FORCE
5.9%
UNEMPLOYMENT RATE
Income in Meadowood
Income Overview in Meadowood
Per Capita Income in Meadowood is $36,370, while median incomes of families and households are $100,844 and $87,627 respectively.
| Characteristic | Number | Measure |
| Per Capita Income | 2,936 | $36,370 |
| Median Family Income | 709 | $100,844 |
| Mean Family Income | 709 | $102,174 |
| Median Household Income | 1,207 | $87,627 |
| Mean Household Income | 1,207 | $84,635 |
| Income Deficit | 709 | $0 |
| Wage / Income Gap (%) | 2,936 | 54.88% |
| Wage / Income Gap ($) | 2,936 | 45.12¢ per $1 |
| Gini / Inequality Index | 2,936 | 0.34 |
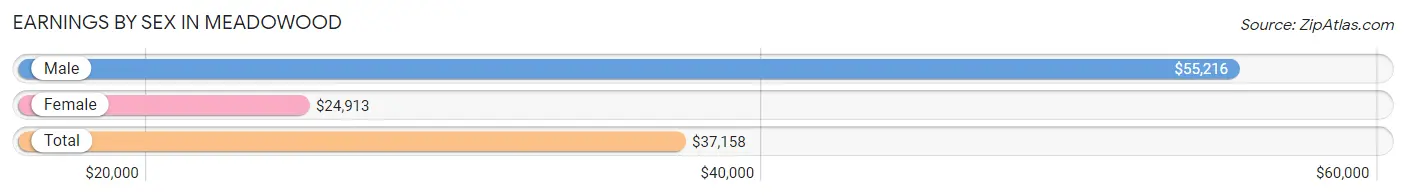
Earnings by Sex in Meadowood
Average Earnings in Meadowood are $37,158, $55,216 for men and $24,913 for women, a difference of 54.9%.
| Sex | Number | Average Earnings |
| Male | 885 (55.9%) | $55,216 |
| Female | 697 (44.1%) | $24,913 |
| Total | 1,582 (100.0%) | $37,158 |
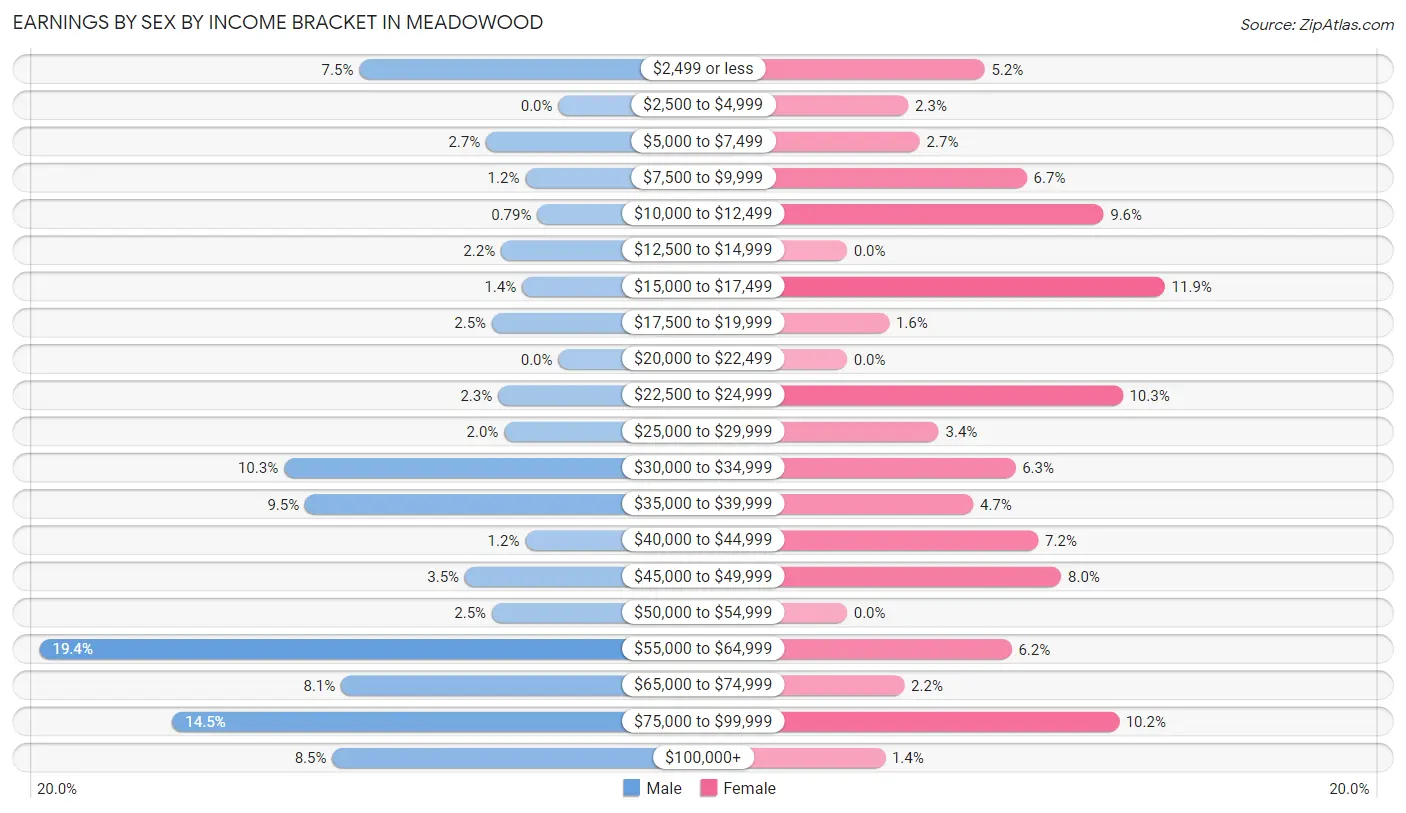
Earnings by Sex by Income Bracket in Meadowood
The most common earnings brackets in Meadowood are $55,000 to $64,999 for men (172 | 19.4%) and $15,000 to $17,499 for women (83 | 11.9%).
| Income | Male | Female |
| $2,499 or less | 66 (7.5%) | 36 (5.2%) |
| $2,500 to $4,999 | 0 (0.0%) | 16 (2.3%) |
| $5,000 to $7,499 | 24 (2.7%) | 19 (2.7%) |
| $7,500 to $9,999 | 11 (1.2%) | 47 (6.7%) |
| $10,000 to $12,499 | 7 (0.8%) | 67 (9.6%) |
| $12,500 to $14,999 | 19 (2.1%) | 0 (0.0%) |
| $15,000 to $17,499 | 12 (1.4%) | 83 (11.9%) |
| $17,500 to $19,999 | 22 (2.5%) | 11 (1.6%) |
| $20,000 to $22,499 | 0 (0.0%) | 0 (0.0%) |
| $22,500 to $24,999 | 20 (2.3%) | 72 (10.3%) |
| $25,000 to $29,999 | 18 (2.0%) | 24 (3.4%) |
| $30,000 to $34,999 | 91 (10.3%) | 44 (6.3%) |
| $35,000 to $39,999 | 84 (9.5%) | 33 (4.7%) |
| $40,000 to $44,999 | 11 (1.2%) | 50 (7.2%) |
| $45,000 to $49,999 | 31 (3.5%) | 56 (8.0%) |
| $50,000 to $54,999 | 22 (2.5%) | 0 (0.0%) |
| $55,000 to $64,999 | 172 (19.4%) | 43 (6.2%) |
| $65,000 to $74,999 | 72 (8.1%) | 15 (2.1%) |
| $75,000 to $99,999 | 128 (14.5%) | 71 (10.2%) |
| $100,000+ | 75 (8.5%) | 10 (1.4%) |
| Total | 885 (100.0%) | 697 (100.0%) |
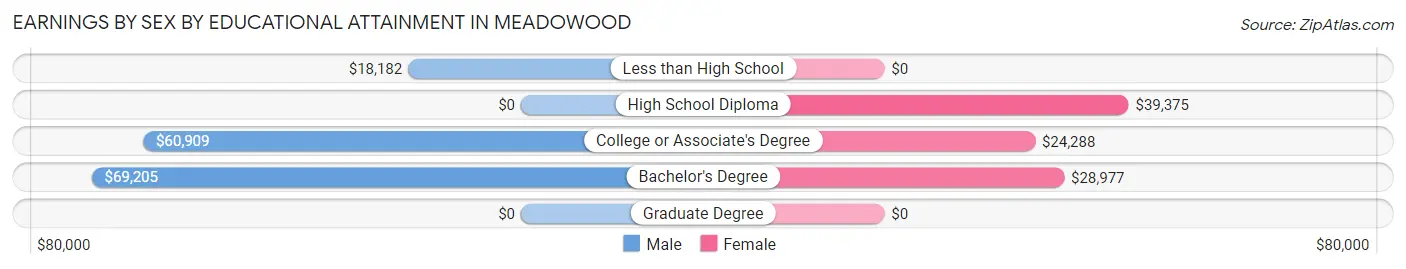
Earnings by Sex by Educational Attainment in Meadowood
Average earnings in Meadowood are $57,560 for men and $28,068 for women, a difference of 51.2%. Men with an educational attainment of bachelor's degree enjoy the highest average annual earnings of $69,205, while those with less than high school education earn the least with $18,182. Women with an educational attainment of high school diploma earn the most with the average annual earnings of $39,375, while those with college or associate's degree education have the smallest earnings of $24,288.
| Educational Attainment | Male Income | Female Income |
| Less than High School | $18,182 | $0 |
| High School Diploma | - | - |
| College or Associate's Degree | $60,909 | $24,288 |
| Bachelor's Degree | $69,205 | $28,977 |
| Graduate Degree | - | - |
| Total | $57,560 | $28,068 |
Family Income in Meadowood
Family Income Brackets in Meadowood
According to the Meadowood family income data, there are 305 families falling into the $100,000 to $149,999 income range, which is the most common income bracket and makes up 43.0% of all families.
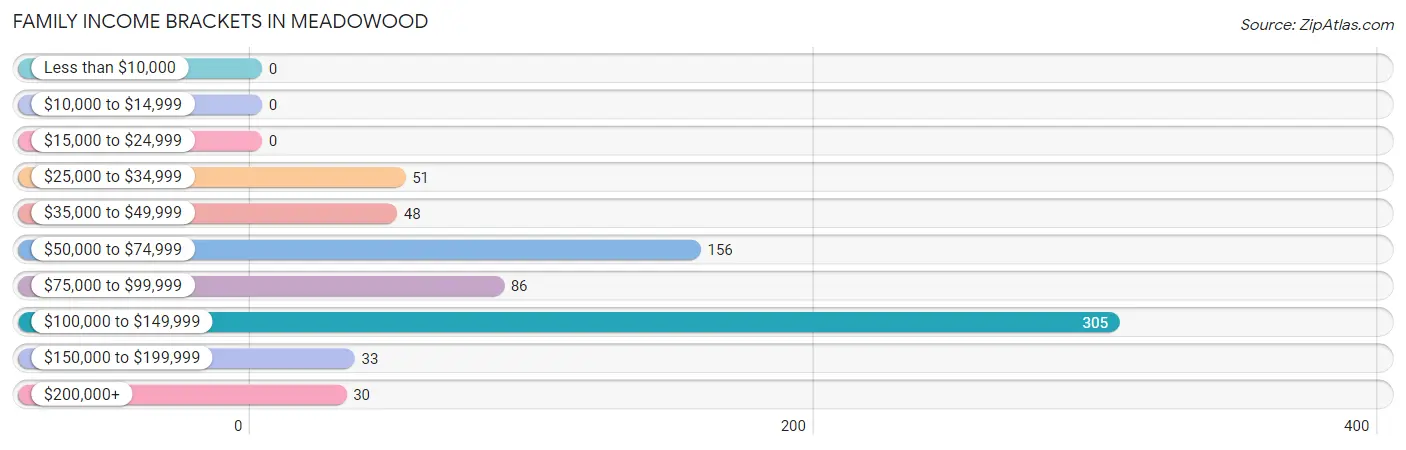
| Income Bracket | # Families | % Families |
| Less than $10,000 | 0 | 0.0% |
| $10,000 to $14,999 | 0 | 0.0% |
| $15,000 to $24,999 | 0 | 0.0% |
| $25,000 to $34,999 | 51 | 7.2% |
| $35,000 to $49,999 | 48 | 6.8% |
| $50,000 to $74,999 | 156 | 22.0% |
| $75,000 to $99,999 | 86 | 12.1% |
| $100,000 to $149,999 | 305 | 43.0% |
| $150,000 to $199,999 | 33 | 4.7% |
| $200,000+ | 30 | 4.2% |
Family Income by Famaliy Size in Meadowood
4-person families (126 | 17.8%) account for the highest median family income in Meadowood with $114,286 per family, while 2-person families (352 | 49.6%) have the highest median income of $54,500 per family member.
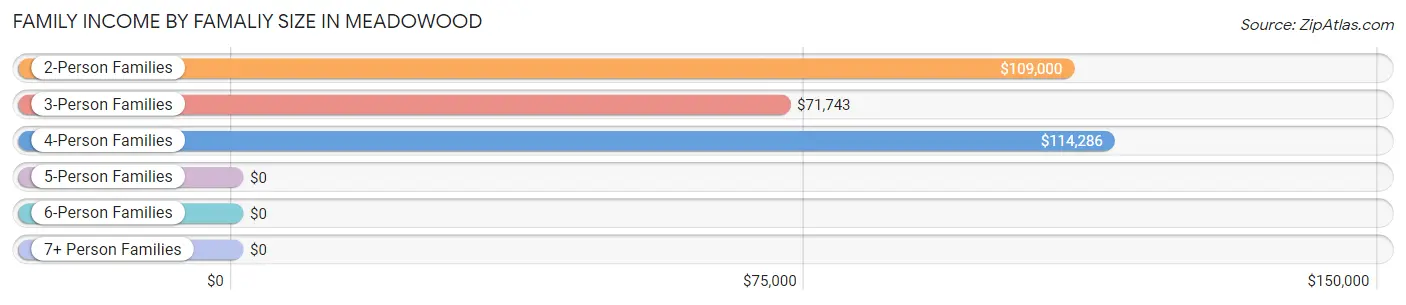
| Income Bracket | # Families | Median Income |
| 2-Person Families | 352 (49.6%) | $109,000 |
| 3-Person Families | 193 (27.2%) | $71,743 |
| 4-Person Families | 126 (17.8%) | $114,286 |
| 5-Person Families | 24 (3.4%) | $0 |
| 6-Person Families | 9 (1.3%) | $0 |
| 7+ Person Families | 5 (0.7%) | $0 |
| Total | 709 (100.0%) | $100,844 |
Family Income by Number of Earners in Meadowood
The median family income in Meadowood is $100,844, with families comprising 3+ earners (85) having the highest median family income of $139,375, while families with no earners (151) have the lowest median family income of $61,823, accounting for 12.0% and 21.3% of families, respectively.
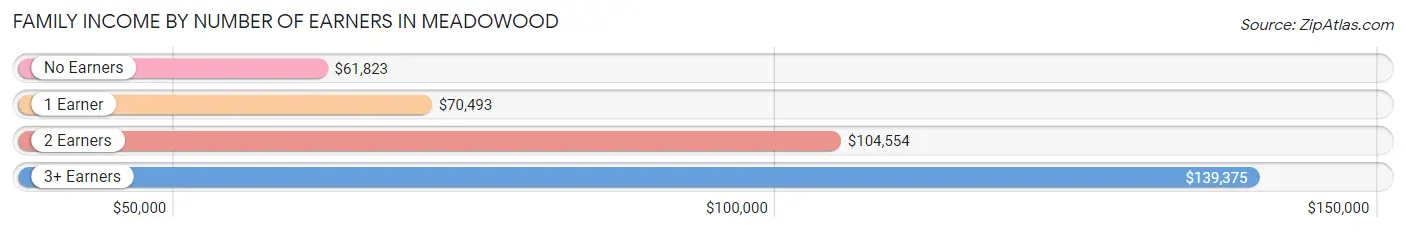
| Number of Earners | # Families | Median Income |
| No Earners | 151 (21.3%) | $61,823 |
| 1 Earner | 141 (19.9%) | $70,493 |
| 2 Earners | 332 (46.8%) | $104,554 |
| 3+ Earners | 85 (12.0%) | $139,375 |
| Total | 709 (100.0%) | $100,844 |
Household Income in Meadowood
Household Income Brackets in Meadowood
With 316 households falling in the category, the $100,000 to $149,999 income range is the most frequent in Meadowood, accounting for 26.2% of all households. In contrast, only 10 households (0.8%) fall into the $10,000 to $14,999 income bracket, making it the least populous group.
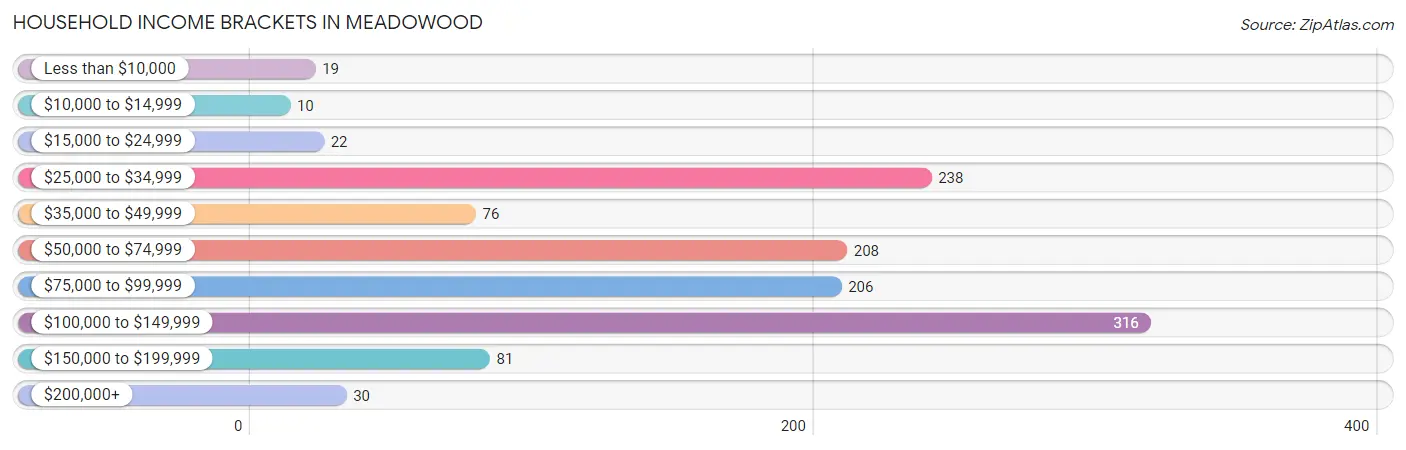
| Income Bracket | # Households | % Households |
| Less than $10,000 | 19 | 1.6% |
| $10,000 to $14,999 | 10 | 0.8% |
| $15,000 to $24,999 | 22 | 1.8% |
| $25,000 to $34,999 | 238 | 19.7% |
| $35,000 to $49,999 | 76 | 6.3% |
| $50,000 to $74,999 | 208 | 17.2% |
| $75,000 to $99,999 | 206 | 17.1% |
| $100,000 to $149,999 | 316 | 26.2% |
| $150,000 to $199,999 | 81 | 6.7% |
| $200,000+ | 30 | 2.5% |
Household Income by Householder Age in Meadowood
The median household income in Meadowood is $87,627, with the highest median household income of $112,000 found in the 45 to 64 years age bracket for the primary householder. A total of 256 households (21.2%) fall into this category.
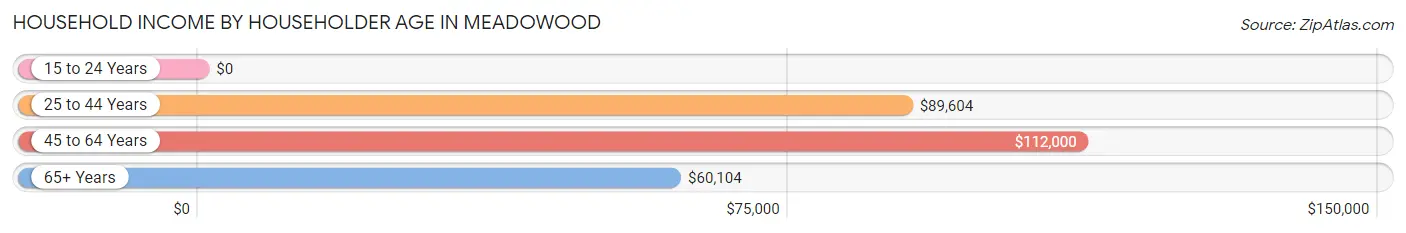
| Income Bracket | # Households | Median Income |
| 15 to 24 Years | 0 (0.0%) | $0 |
| 25 to 44 Years | 415 (34.4%) | $89,604 |
| 45 to 64 Years | 256 (21.2%) | $112,000 |
| 65+ Years | 536 (44.4%) | $60,104 |
| Total | 1,207 (100.0%) | $87,627 |
Poverty in Meadowood
Income Below Poverty by Sex and Age in Meadowood
With 1.8% poverty level for males and 2.8% for females among the residents of Meadowood, 45 to 54 year old males and 25 to 34 year old females are the most vulnerable to poverty, with 15 males (8.4%) and 14 females (11.0%) in their respective age groups living below the poverty level.
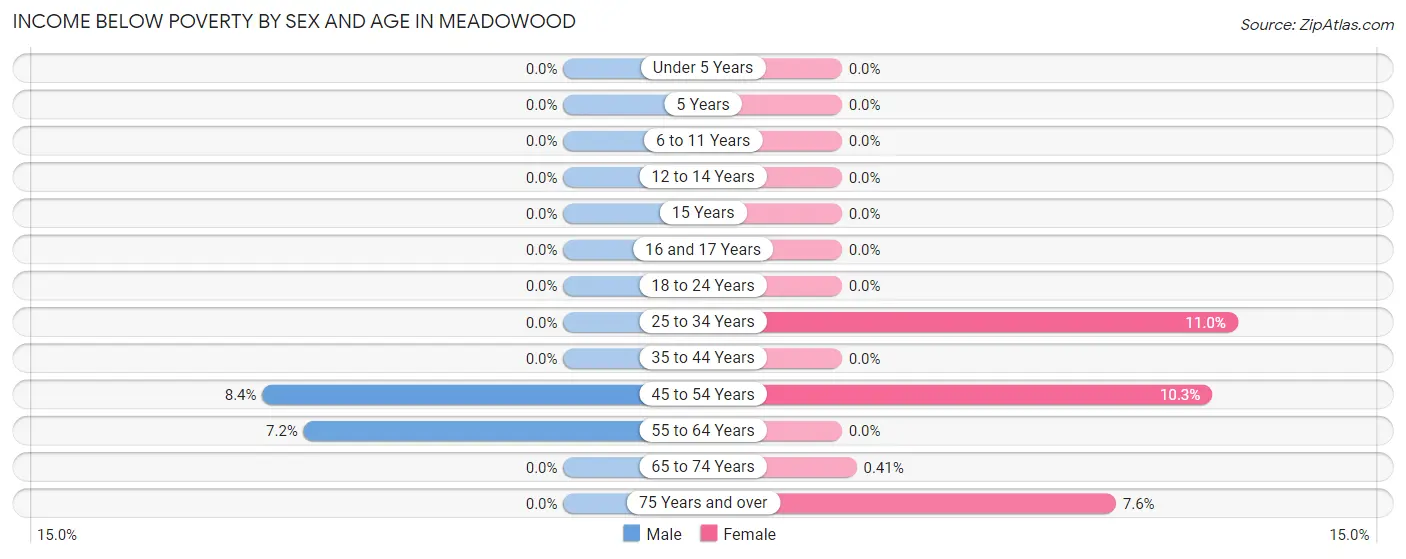
| Age Bracket | Male | Female |
| Under 5 Years | 0 (0.0%) | 0 (0.0%) |
| 5 Years | 0 (0.0%) | 0 (0.0%) |
| 6 to 11 Years | 0 (0.0%) | 0 (0.0%) |
| 12 to 14 Years | 0 (0.0%) | 0 (0.0%) |
| 15 Years | 0 (0.0%) | 0 (0.0%) |
| 16 and 17 Years | 0 (0.0%) | 0 (0.0%) |
| 18 to 24 Years | 0 (0.0%) | 0 (0.0%) |
| 25 to 34 Years | 0 (0.0%) | 14 (11.0%) |
| 35 to 44 Years | 0 (0.0%) | 0 (0.0%) |
| 45 to 54 Years | 15 (8.4%) | 10 (10.3%) |
| 55 to 64 Years | 12 (7.2%) | 0 (0.0%) |
| 65 to 74 Years | 0 (0.0%) | 1 (0.4%) |
| 75 Years and over | 0 (0.0%) | 9 (7.6%) |
| Total | 27 (1.8%) | 34 (2.8%) |
Income Above Poverty by Sex and Age in Meadowood
According to the poverty statistics in Meadowood, males aged under 5 years and females aged under 5 years are the age groups that are most secure financially, with 100.0% of males and 100.0% of females in these age groups living above the poverty line.
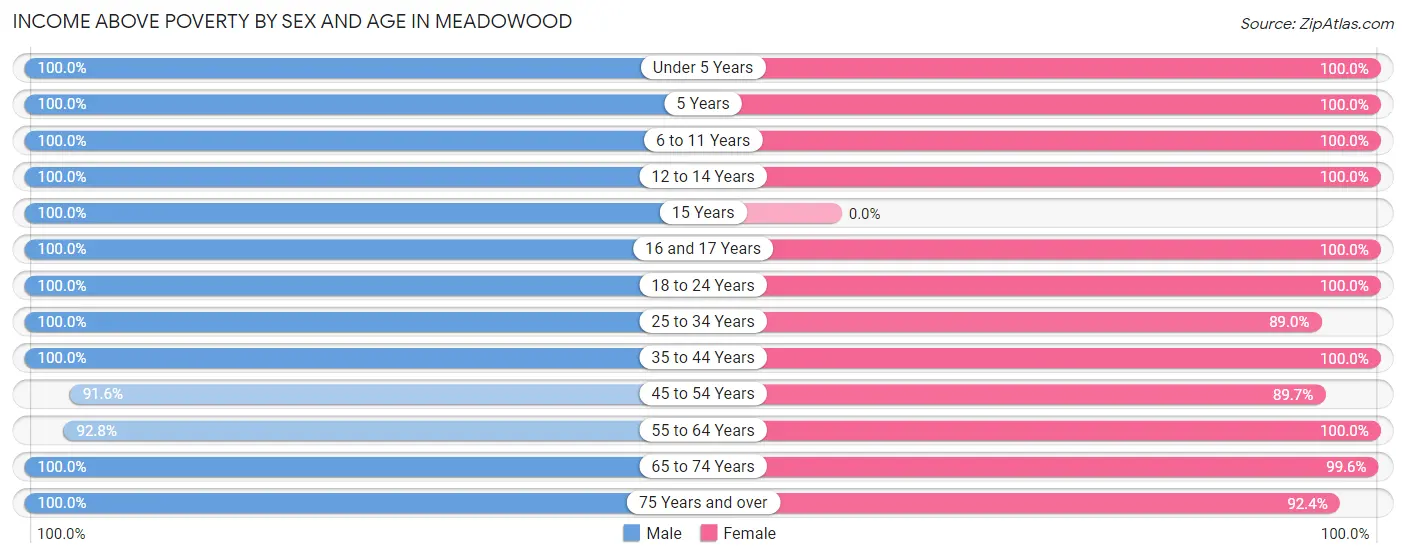
| Age Bracket | Male | Female |
| Under 5 Years | 41 (100.0%) | 60 (100.0%) |
| 5 Years | 22 (100.0%) | 2 (100.0%) |
| 6 to 11 Years | 66 (100.0%) | 73 (100.0%) |
| 12 to 14 Years | 27 (100.0%) | 48 (100.0%) |
| 15 Years | 12 (100.0%) | 0 (0.0%) |
| 16 and 17 Years | 68 (100.0%) | 26 (100.0%) |
| 18 to 24 Years | 74 (100.0%) | 30 (100.0%) |
| 25 to 34 Years | 283 (100.0%) | 113 (89.0%) |
| 35 to 44 Years | 112 (100.0%) | 224 (100.0%) |
| 45 to 54 Years | 164 (91.6%) | 87 (89.7%) |
| 55 to 64 Years | 154 (92.8%) | 153 (100.0%) |
| 65 to 74 Years | 247 (100.0%) | 240 (99.6%) |
| 75 Years and over | 190 (100.0%) | 109 (92.4%) |
| Total | 1,460 (98.2%) | 1,165 (97.2%) |
Income Below Poverty Among Married-Couple Families in Meadowood
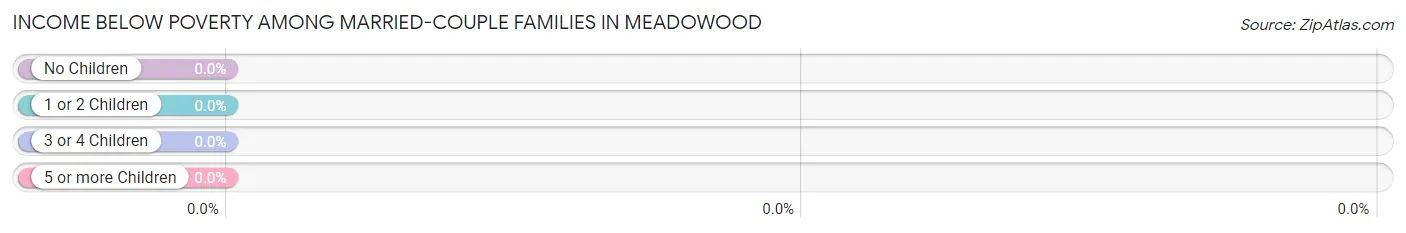
| Children | Above Poverty | Below Poverty |
| No Children | 372 (100.0%) | 0 (0.0%) |
| 1 or 2 Children | 161 (100.0%) | 0 (0.0%) |
| 3 or 4 Children | 5 (100.0%) | 0 (0.0%) |
| 5 or more Children | 5 (100.0%) | 0 (0.0%) |
| Total | 543 (100.0%) | 0 (0.0%) |
Income Below Poverty Among Single-Parent Households in Meadowood
| Children | Single Father | Single Mother |
| No Children | 0 (0.0%) | 0 (0.0%) |
| 1 or 2 Children | 0 (0.0%) | 0 (0.0%) |
| 3 or 4 Children | 0 (0.0%) | 0 (0.0%) |
| 5 or more Children | 0 (0.0%) | 0 (0.0%) |
| Total | 0 (0.0%) | 0 (0.0%) |
Income Below Poverty Among Married-Couple vs Single-Parent Households in Meadowood
| Children | Married-Couple Families | Single-Parent Households |
| No Children | 0 (0.0%) | 0 (0.0%) |
| 1 or 2 Children | 0 (0.0%) | 0 (0.0%) |
| 3 or 4 Children | 0 (0.0%) | 0 (0.0%) |
| 5 or more Children | 0 (0.0%) | 0 (0.0%) |
| Total | 0 (0.0%) | 0 (0.0%) |
Race in Meadowood
The most populous races in Meadowood are White / Caucasian (2,752 | 93.7%), Two or more Races (151 | 5.1%), and Hispanic or Latino (72 | 2.5%).
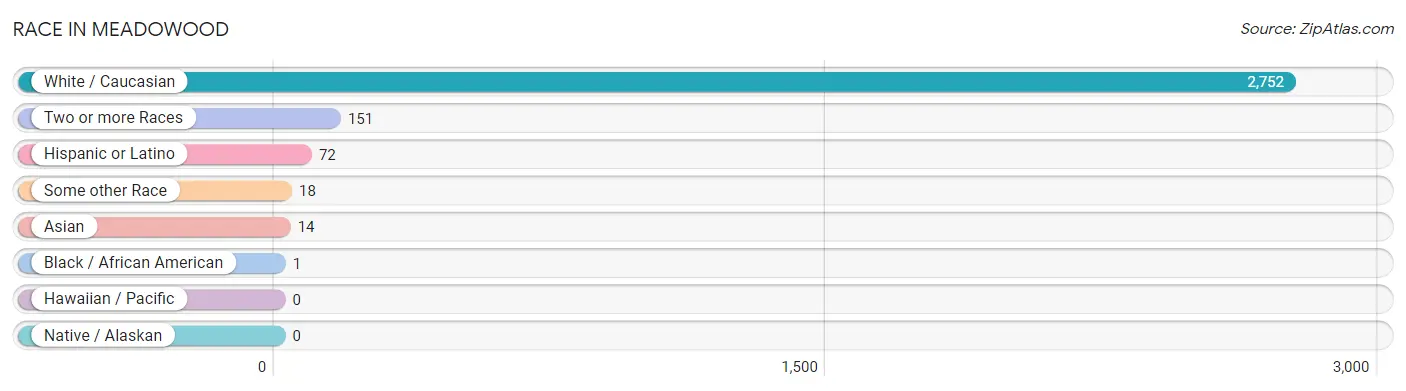
| Race | # Population | % Population |
| Asian | 14 | 0.5% |
| Black / African American | 1 | 0.0% |
| Hawaiian / Pacific | 0 | 0.0% |
| Hispanic or Latino | 72 | 2.5% |
| Native / Alaskan | 0 | 0.0% |
| White / Caucasian | 2,752 | 93.7% |
| Two or more Races | 151 | 5.1% |
| Some other Race | 18 | 0.6% |
| Total | 2,936 | 100.0% |
Ancestry in Meadowood
The most populous ancestries reported in Meadowood are German (874 | 29.8%), Italian (567 | 19.3%), Irish (447 | 15.2%), English (196 | 6.7%), and Polish (163 | 5.6%), together accounting for 76.5% of all Meadowood residents.
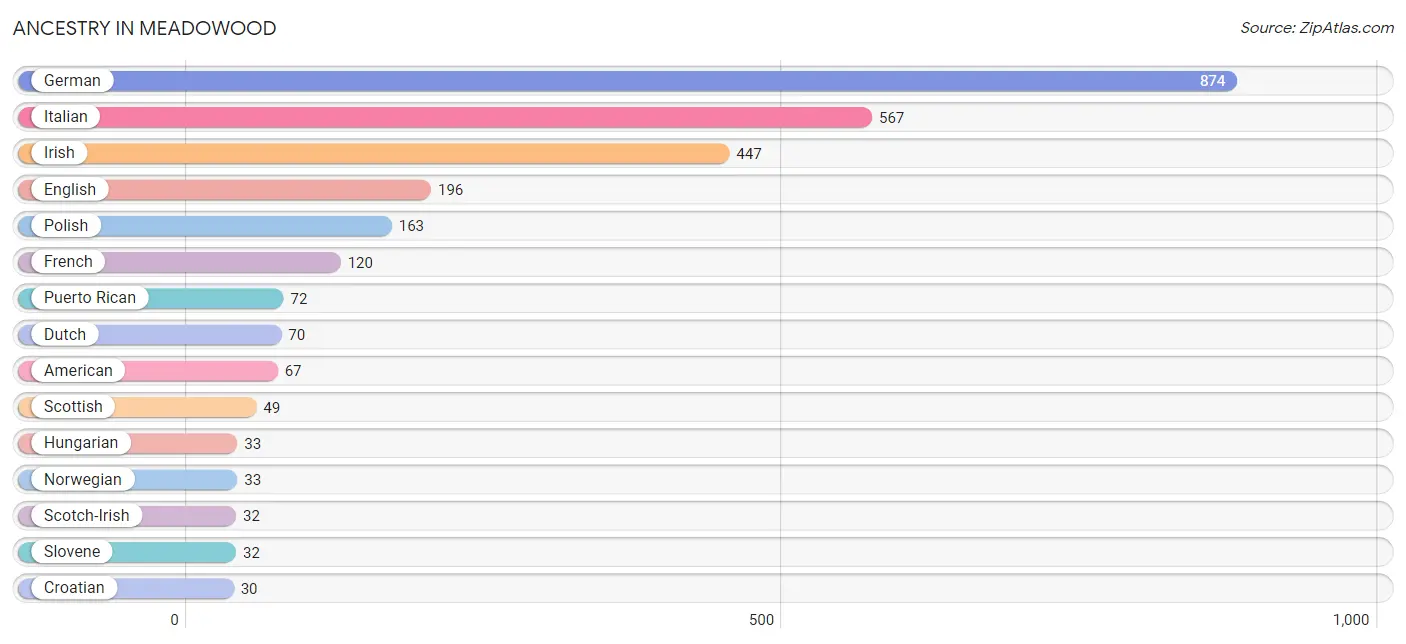
| Ancestry | # Population | % Population |
| American | 67 | 2.3% |
| Croatian | 30 | 1.0% |
| Czech | 27 | 0.9% |
| Danish | 10 | 0.3% |
| Dutch | 70 | 2.4% |
| Eastern European | 9 | 0.3% |
| English | 196 | 6.7% |
| Filipino | 14 | 0.5% |
| French | 120 | 4.1% |
| German | 874 | 29.8% |
| Greek | 20 | 0.7% |
| Hungarian | 33 | 1.1% |
| Irish | 447 | 15.2% |
| Iroquois | 7 | 0.2% |
| Italian | 567 | 19.3% |
| Norwegian | 33 | 1.1% |
| Pakistani | 8 | 0.3% |
| Pennsylvania German | 9 | 0.3% |
| Polish | 163 | 5.6% |
| Puerto Rican | 72 | 2.5% |
| Scotch-Irish | 32 | 1.1% |
| Scottish | 49 | 1.7% |
| Sioux | 1 | 0.0% |
| Slovak | 23 | 0.8% |
| Slovene | 32 | 1.1% |
| Ukrainian | 27 | 0.9% |
| Welsh | 19 | 0.6% | View All 27 Rows |
Immigrants in Meadowood
The most numerous immigrant groups reported in Meadowood came from , and Canada (28 | 0.9%), together accounting for 0.9% of all Meadowood residents.

| Immigration Origin | # Population | % Population |
| Canada | 28 | 0.9% | View All 1 Rows |
Sex and Age in Meadowood
Sex and Age in Meadowood
The most populous age groups in Meadowood are 65 to 69 Years (201 | 12.5%) for men and 65 to 69 Years (164 | 12.3%) for women.
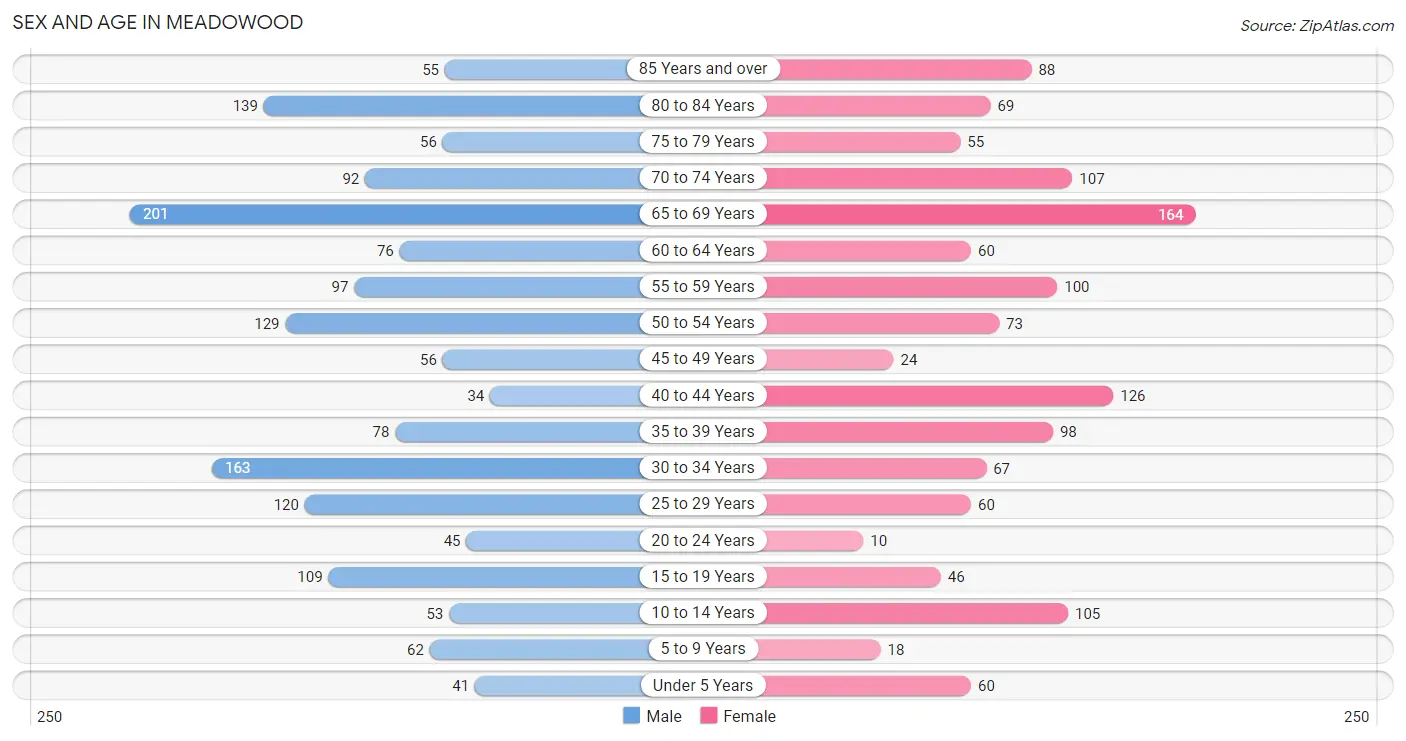
| Age Bracket | Male | Female |
| Under 5 Years | 41 (2.5%) | 60 (4.5%) |
| 5 to 9 Years | 62 (3.9%) | 18 (1.3%) |
| 10 to 14 Years | 53 (3.3%) | 105 (7.9%) |
| 15 to 19 Years | 109 (6.8%) | 46 (3.5%) |
| 20 to 24 Years | 45 (2.8%) | 10 (0.7%) |
| 25 to 29 Years | 120 (7.5%) | 60 (4.5%) |
| 30 to 34 Years | 163 (10.2%) | 67 (5.0%) |
| 35 to 39 Years | 78 (4.9%) | 98 (7.4%) |
| 40 to 44 Years | 34 (2.1%) | 126 (9.5%) |
| 45 to 49 Years | 56 (3.5%) | 24 (1.8%) |
| 50 to 54 Years | 129 (8.0%) | 73 (5.5%) |
| 55 to 59 Years | 97 (6.0%) | 100 (7.5%) |
| 60 to 64 Years | 76 (4.7%) | 60 (4.5%) |
| 65 to 69 Years | 201 (12.5%) | 164 (12.3%) |
| 70 to 74 Years | 92 (5.7%) | 107 (8.1%) |
| 75 to 79 Years | 56 (3.5%) | 55 (4.1%) |
| 80 to 84 Years | 139 (8.7%) | 69 (5.2%) |
| 85 Years and over | 55 (3.4%) | 88 (6.6%) |
| Total | 1,606 (100.0%) | 1,330 (100.0%) |
Families and Households in Meadowood
Median Family Size in Meadowood
The median family size in Meadowood is 2.83 persons per family, with single female/mother families (86 | 12.1%) accounting for the largest median family size of 3.13 persons per family. On the other hand, single male/father families (80 | 11.3%) represent the smallest median family size with 2.21 persons per family.
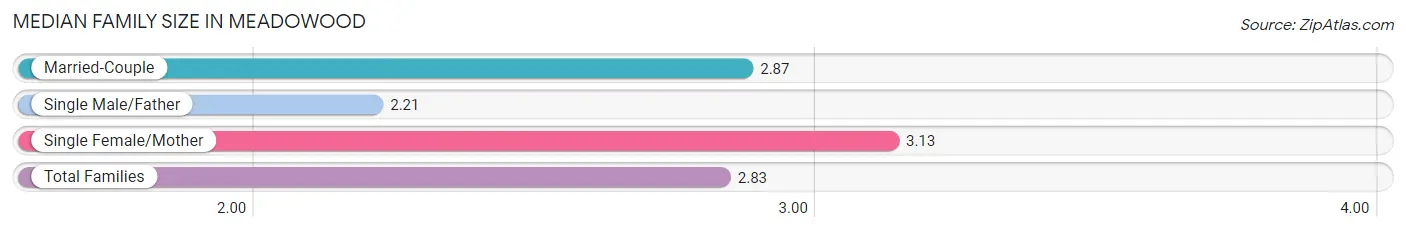
| Family Type | # Families | Family Size |
| Married-Couple | 543 (76.6%) | 2.87 |
| Single Male/Father | 80 (11.3%) | 2.21 |
| Single Female/Mother | 86 (12.1%) | 3.13 |
| Total Families | 709 (100.0%) | 2.83 |
Median Household Size in Meadowood
The median household size in Meadowood is 2.22 persons per household, with single female/mother households (86 | 7.1%) accounting for the largest median household size of 3.52 persons per household. non-family households (498 | 41.3%) represent the smallest median household size with 1.22 persons per household.
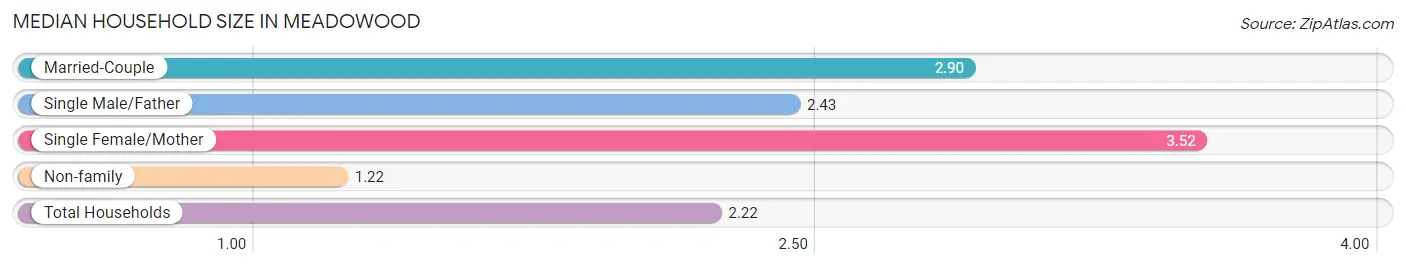
| Household Type | # Households | Household Size |
| Married-Couple | 543 (45.0%) | 2.90 |
| Single Male/Father | 80 (6.6%) | 2.43 |
| Single Female/Mother | 86 (7.1%) | 3.52 |
| Non-family | 498 (41.3%) | 1.22 |
| Total Households | 1,207 (100.0%) | 2.22 |
Household Size by Marriage Status in Meadowood
Out of a total of 1,207 households in Meadowood, 709 (58.7%) are family households, while 498 (41.3%) are nonfamily households. The most numerous type of family households are 2-person households, comprising 330, and the most common type of nonfamily households are 1-person households, comprising 393.
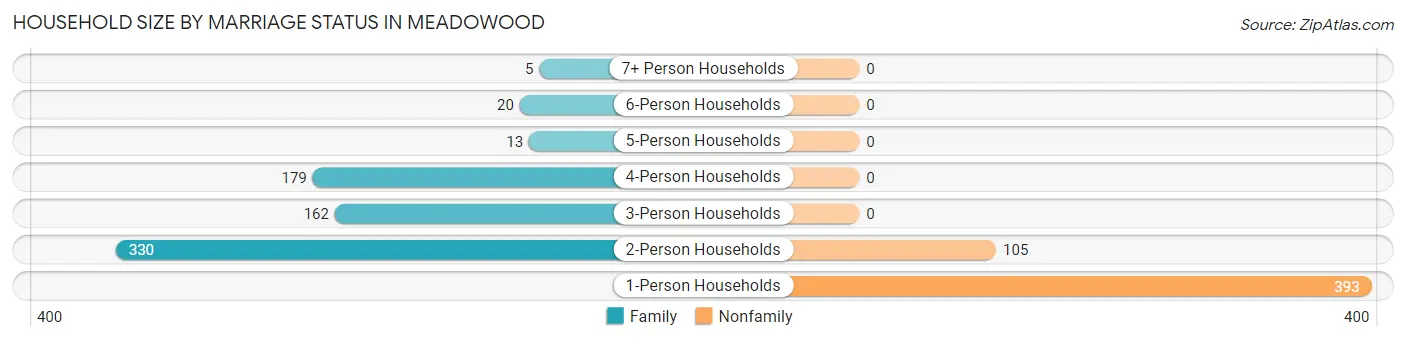
| Household Size | Family Households | Nonfamily Households |
| 1-Person Households | - | 393 (32.6%) |
| 2-Person Households | 330 (27.3%) | 105 (8.7%) |
| 3-Person Households | 162 (13.4%) | 0 (0.0%) |
| 4-Person Households | 179 (14.8%) | 0 (0.0%) |
| 5-Person Households | 13 (1.1%) | 0 (0.0%) |
| 6-Person Households | 20 (1.7%) | 0 (0.0%) |
| 7+ Person Households | 5 (0.4%) | 0 (0.0%) |
| Total | 709 (58.7%) | 498 (41.3%) |
Female Fertility in Meadowood
Fertility by Age in Meadowood
Average fertility rate in Meadowood is 27.0 births per 1,000 women. Women in the age bracket of 35 to 50 years have the highest fertility rate with 43.0 births per 1,000 women. Women in the age bracket of 35 to 50 years acount for 100.0% of all women with births.
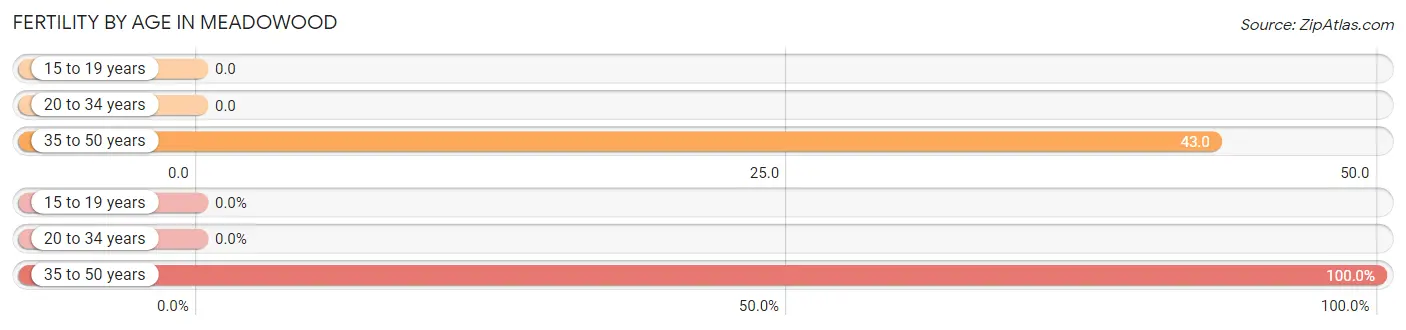
| Age Bracket | Women with Births | Births / 1,000 Women |
| 15 to 19 years | 0 (0.0%) | 0.0 |
| 20 to 34 years | 0 (0.0%) | 0.0 |
| 35 to 50 years | 13 (100.0%) | 43.0 |
| Total | 13 (100.0%) | 27.0 |
Fertility by Age by Marriage Status in Meadowood
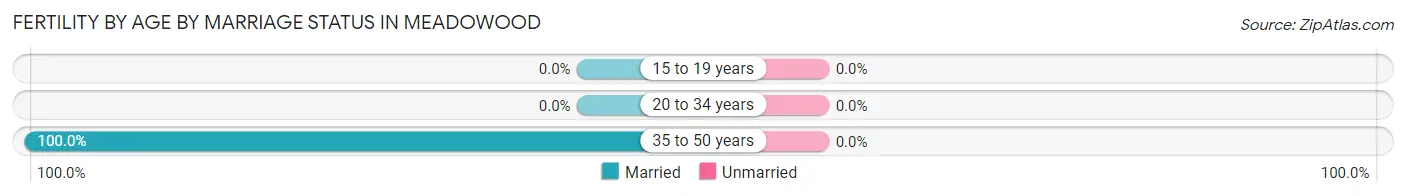
| Age Bracket | Married | Unmarried |
| 15 to 19 years | 0 (0.0%) | 0 (0.0%) |
| 20 to 34 years | 0 (0.0%) | 0 (0.0%) |
| 35 to 50 years | 13 (100.0%) | 0 (0.0%) |
| Total | 13 (100.0%) | 0 (0.0%) |
Fertility by Education in Meadowood
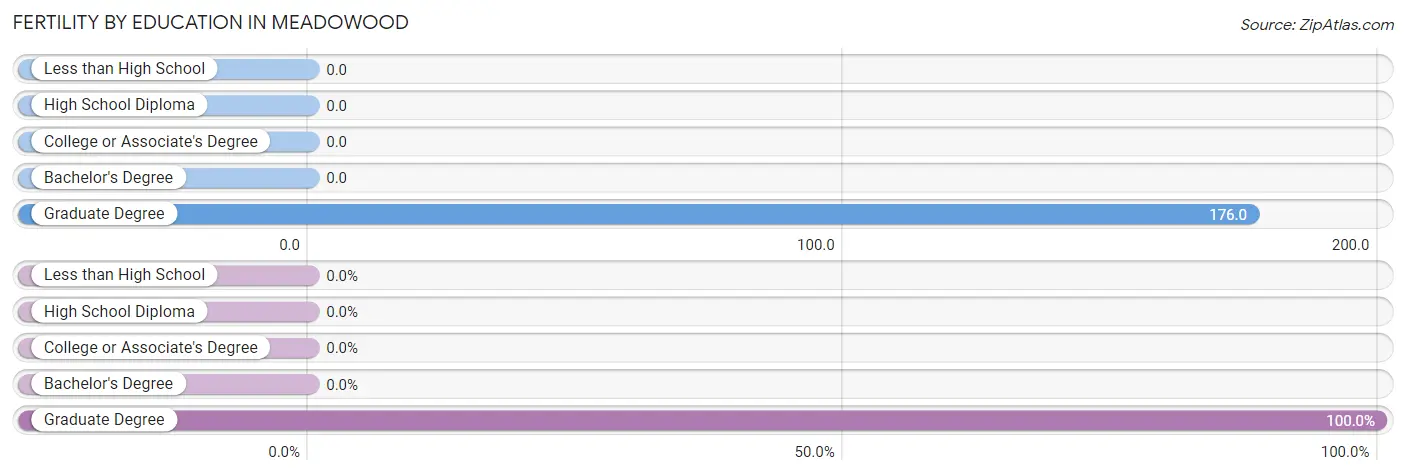
| Educational Attainment | Women with Births | Births / 1,000 Women |
| Less than High School | 0 (0.0%) | 0.0 |
| High School Diploma | 0 (0.0%) | 0.0 |
| College or Associate's Degree | 0 (0.0%) | 0.0 |
| Bachelor's Degree | 0 (0.0%) | 0.0 |
| Graduate Degree | 13 (100.0%) | 176.0 |
| Total | 13 (100.0%) | 27.0 |
Fertility by Education by Marriage Status in Meadowood
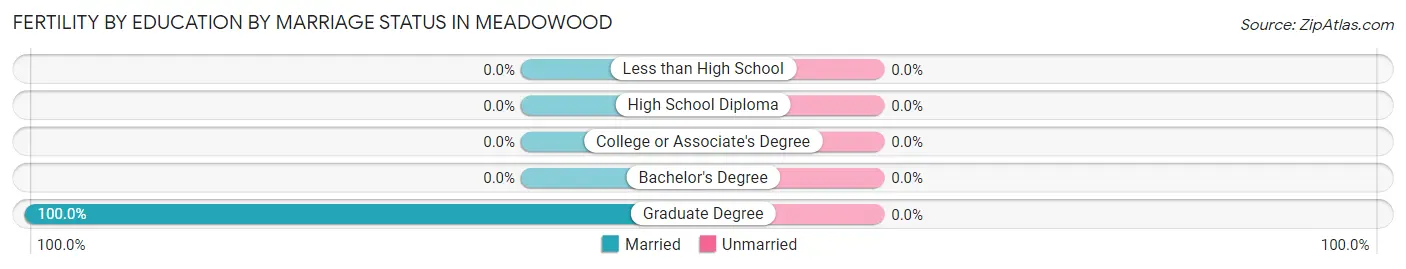
| Educational Attainment | Married | Unmarried |
| Less than High School | 0 (0.0%) | 0 (0.0%) |
| High School Diploma | 0 (0.0%) | 0 (0.0%) |
| College or Associate's Degree | 0 (0.0%) | 0 (0.0%) |
| Bachelor's Degree | 0 (0.0%) | 0 (0.0%) |
| Graduate Degree | 13 (100.0%) | 0 (0.0%) |
| Total | 13 (100.0%) | 0 (0.0%) |
Employment Characteristics in Meadowood
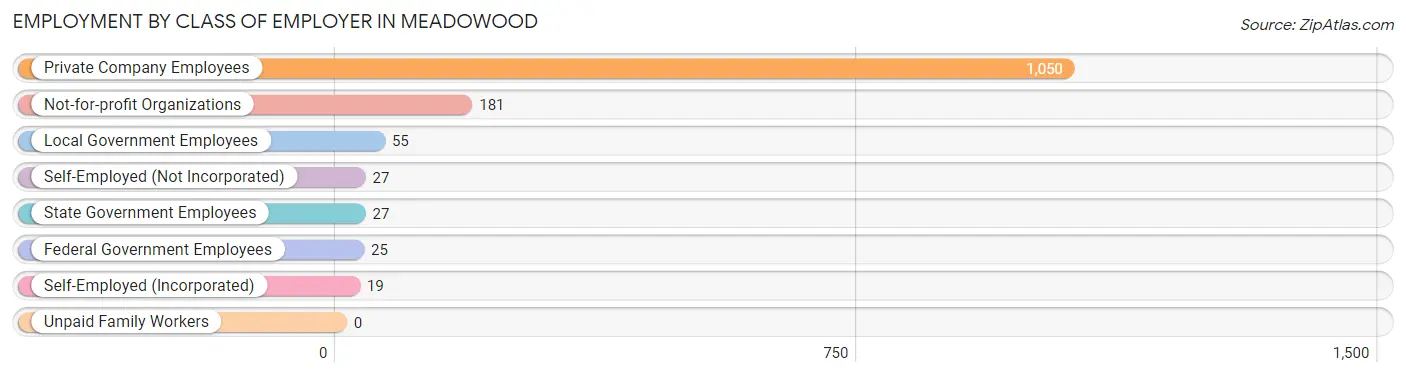
Employment by Class of Employer in Meadowood
Among the 1,384 employed individuals in Meadowood, private company employees (1,050 | 75.9%), not-for-profit organizations (181 | 13.1%), and local government employees (55 | 4.0%) make up the most common classes of employment.
| Employer Class | # Employees | % Employees |
| Private Company Employees | 1,050 | 75.9% |
| Self-Employed (Incorporated) | 19 | 1.4% |
| Self-Employed (Not Incorporated) | 27 | 1.9% |
| Not-for-profit Organizations | 181 | 13.1% |
| Local Government Employees | 55 | 4.0% |
| State Government Employees | 27 | 1.9% |
| Federal Government Employees | 25 | 1.8% |
| Unpaid Family Workers | 0 | 0.0% |
| Total | 1,384 | 100.0% |
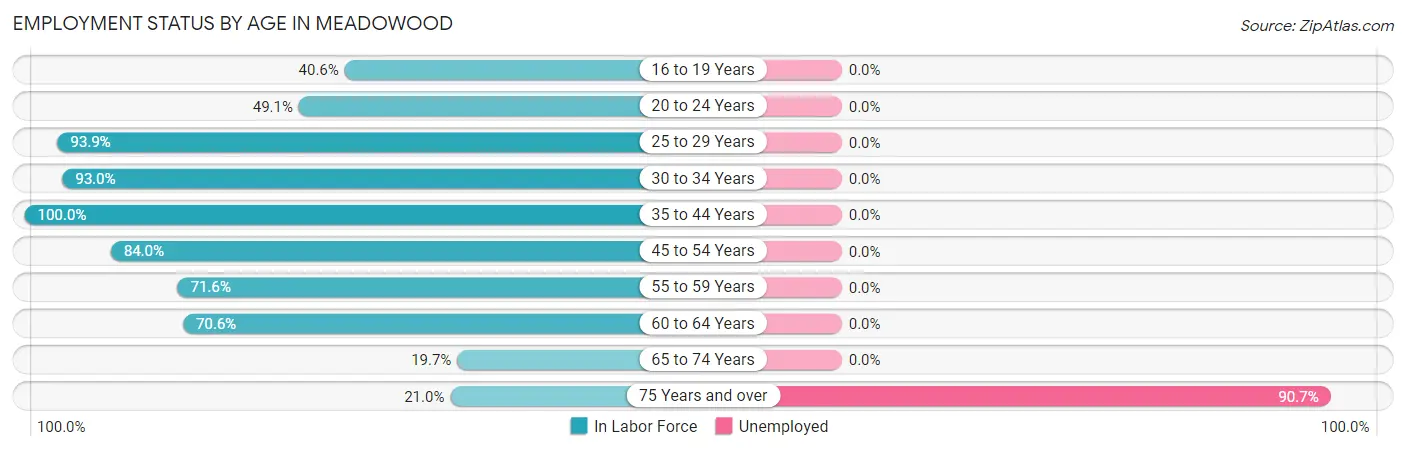
Employment Status by Age in Meadowood
According to the labor force statistics for Meadowood, out of the total population over 16 years of age (2,585), 57.5% or 1,486 individuals are in the labor force, with 5.9% or 88 of them unemployed. The age group with the highest labor force participation rate is 35 to 44 years, with 100.0% or 336 individuals in the labor force. Within the labor force, the 75 years and over age range has the highest percentage of unemployed individuals, with 90.7% or 88 of them being unemployed.
| Age Bracket | In Labor Force | Unemployed |
| 16 to 19 Years | 58 (40.6%) | 0 (0.0%) |
| 20 to 24 Years | 27 (49.1%) | 0 (0.0%) |
| 25 to 29 Years | 169 (93.9%) | 0 (0.0%) |
| 30 to 34 Years | 214 (93.0%) | 0 (0.0%) |
| 35 to 44 Years | 336 (100.0%) | 0 (0.0%) |
| 45 to 54 Years | 237 (84.0%) | 0 (0.0%) |
| 55 to 59 Years | 141 (71.6%) | 0 (0.0%) |
| 60 to 64 Years | 96 (70.6%) | 0 (0.0%) |
| 65 to 74 Years | 111 (19.7%) | 0 (0.0%) |
| 75 Years and over | 97 (21.0%) | 88 (90.7%) |
| Total | 1,486 (57.5%) | 88 (5.9%) |
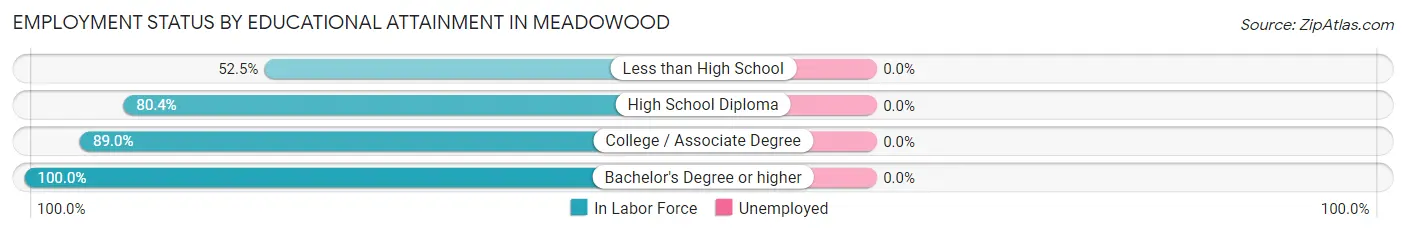
Employment Status by Educational Attainment in Meadowood
| Educational Attainment | In Labor Force | Unemployed |
| Less than High School | 32 (52.5%) | 0 (0.0%) |
| High School Diploma | 320 (80.4%) | 0 (0.0%) |
| College / Associate Degree | 496 (89.0%) | 0 (0.0%) |
| Bachelor's Degree or higher | 345 (100.0%) | 0 (0.0%) |
| Total | 1,194 (87.7%) | 0 (0.0%) |
Employment Occupations by Sex in Meadowood
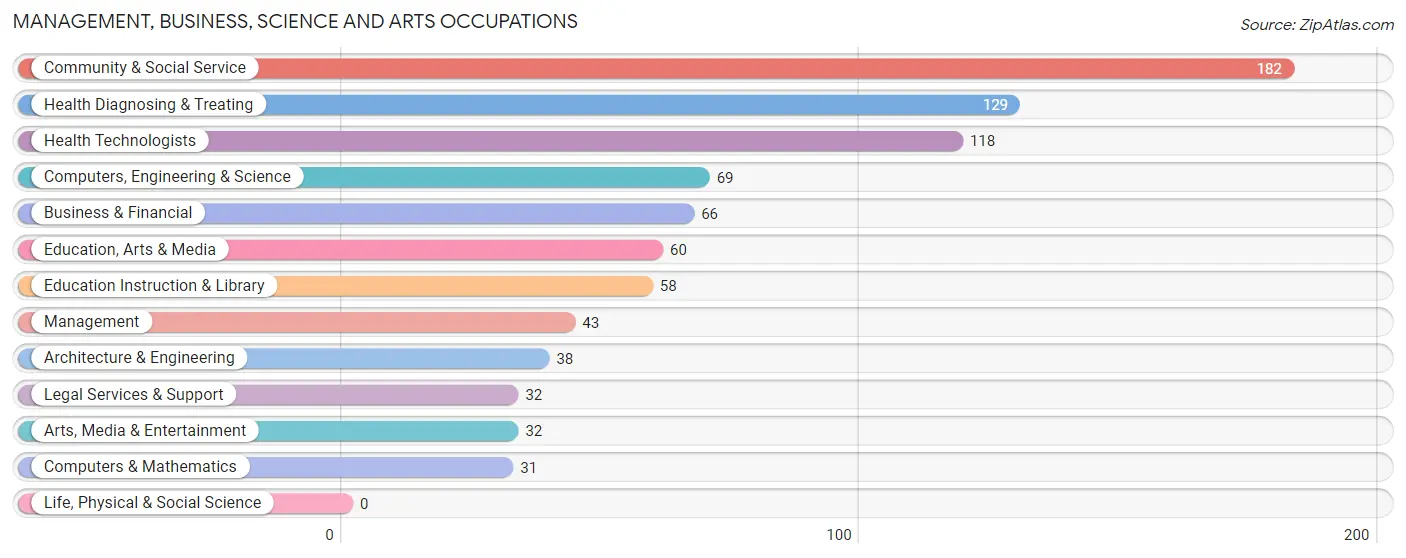
Management, Business, Science and Arts Occupations
The most common Management, Business, Science and Arts occupations in Meadowood are Community & Social Service (182 | 13.0%), Health Diagnosing & Treating (129 | 9.2%), Health Technologists (118 | 8.4%), Computers, Engineering & Science (69 | 4.9%), and Business & Financial (66 | 4.7%).
Management, Business, Science and Arts Occupations by Sex
Within the Management, Business, Science and Arts occupations in Meadowood, the most male-oriented occupations are Computers, Engineering & Science (100.0%), Computers & Mathematics (100.0%), and Architecture & Engineering (100.0%), while the most female-oriented occupations are Legal Services & Support (100.0%), Arts, Media & Entertainment (100.0%), and Health Technologists (100.0%).
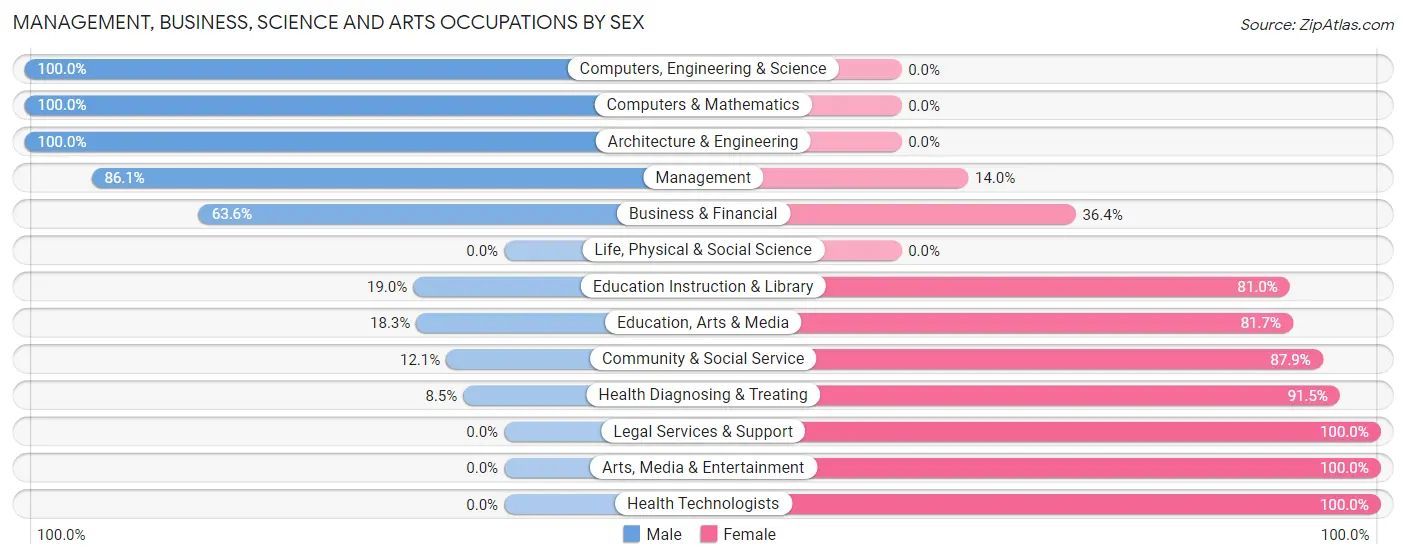
| Occupation | Male | Female |
| Management | 37 (86.1%) | 6 (14.0%) |
| Business & Financial | 42 (63.6%) | 24 (36.4%) |
| Computers, Engineering & Science | 69 (100.0%) | 0 (0.0%) |
| Computers & Mathematics | 31 (100.0%) | 0 (0.0%) |
| Architecture & Engineering | 38 (100.0%) | 0 (0.0%) |
| Life, Physical & Social Science | 0 (0.0%) | 0 (0.0%) |
| Community & Social Service | 22 (12.1%) | 160 (87.9%) |
| Education, Arts & Media | 11 (18.3%) | 49 (81.7%) |
| Legal Services & Support | 0 (0.0%) | 32 (100.0%) |
| Education Instruction & Library | 11 (19.0%) | 47 (81.0%) |
| Arts, Media & Entertainment | 0 (0.0%) | 32 (100.0%) |
| Health Diagnosing & Treating | 11 (8.5%) | 118 (91.5%) |
| Health Technologists | 0 (0.0%) | 118 (100.0%) |
| Total (Category) | 181 (37.0%) | 308 (63.0%) |
| Total (Overall) | 732 (52.4%) | 666 (47.6%) |
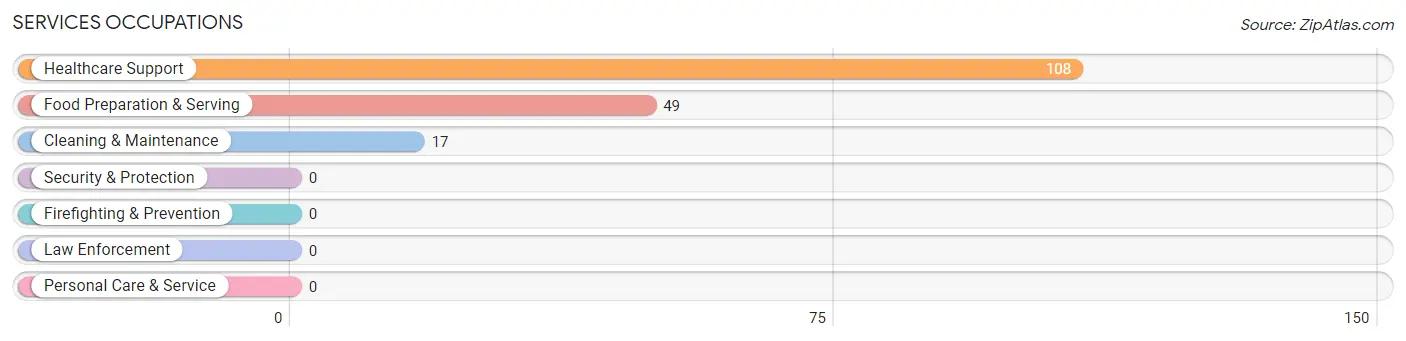
Services Occupations
The most common Services occupations in Meadowood are Healthcare Support (108 | 7.7%), Food Preparation & Serving (49 | 3.5%), and Cleaning & Maintenance (17 | 1.2%).
Services Occupations by Sex
Within the Services occupations in Meadowood, the most male-oriented occupations are Cleaning & Maintenance (88.2%), and Food Preparation & Serving (55.1%), while the most female-oriented occupations are Healthcare Support (100.0%), Food Preparation & Serving (44.9%), and Cleaning & Maintenance (11.8%).
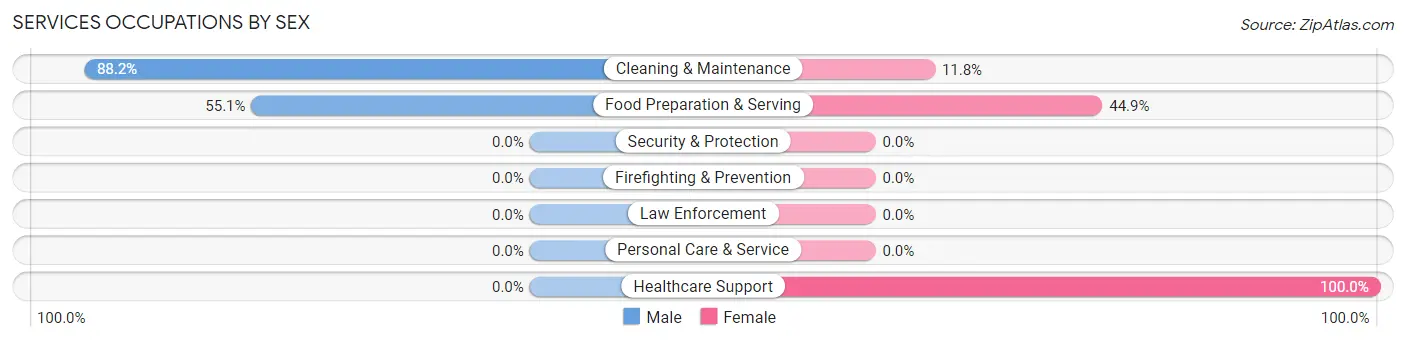
| Occupation | Male | Female |
| Healthcare Support | 0 (0.0%) | 108 (100.0%) |
| Security & Protection | 0 (0.0%) | 0 (0.0%) |
| Firefighting & Prevention | 0 (0.0%) | 0 (0.0%) |
| Law Enforcement | 0 (0.0%) | 0 (0.0%) |
| Food Preparation & Serving | 27 (55.1%) | 22 (44.9%) |
| Cleaning & Maintenance | 15 (88.2%) | 2 (11.8%) |
| Personal Care & Service | 0 (0.0%) | 0 (0.0%) |
| Total (Category) | 42 (24.1%) | 132 (75.9%) |
| Total (Overall) | 732 (52.4%) | 666 (47.6%) |
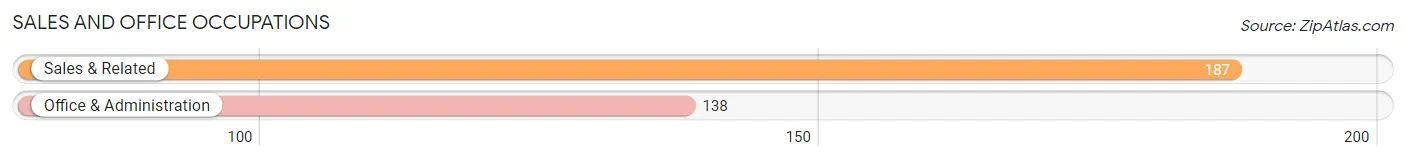
Sales and Office Occupations
The most common Sales and Office occupations in Meadowood are Sales & Related (187 | 13.4%), and Office & Administration (138 | 9.9%).
Sales and Office Occupations by Sex
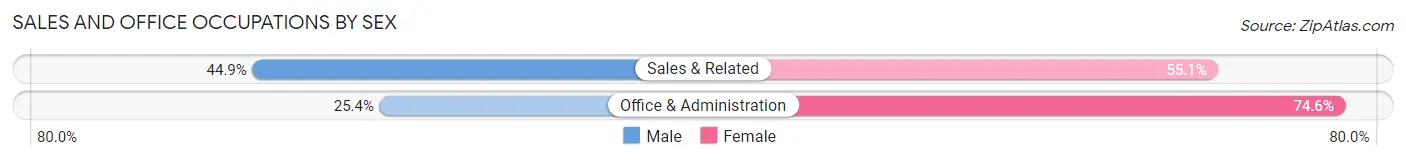
| Occupation | Male | Female |
| Sales & Related | 84 (44.9%) | 103 (55.1%) |
| Office & Administration | 35 (25.4%) | 103 (74.6%) |
| Total (Category) | 119 (36.6%) | 206 (63.4%) |
| Total (Overall) | 732 (52.4%) | 666 (47.6%) |
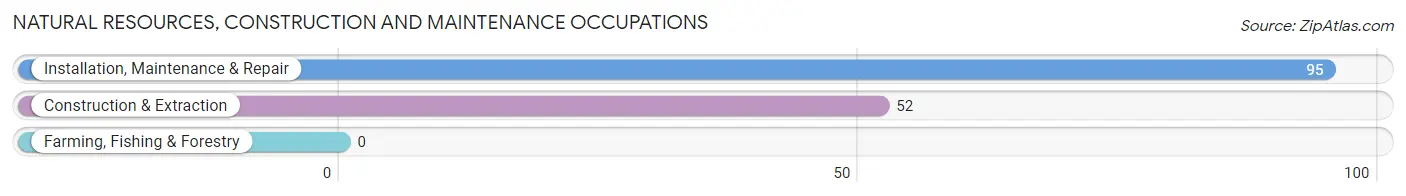
Natural Resources, Construction and Maintenance Occupations
The most common Natural Resources, Construction and Maintenance occupations in Meadowood are Installation, Maintenance & Repair (95 | 6.8%), and Construction & Extraction (52 | 3.7%).
Natural Resources, Construction and Maintenance Occupations by Sex
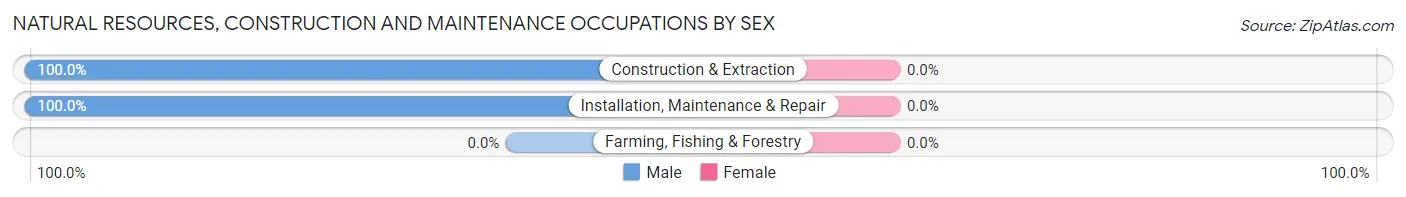
| Occupation | Male | Female |
| Farming, Fishing & Forestry | 0 (0.0%) | 0 (0.0%) |
| Construction & Extraction | 52 (100.0%) | 0 (0.0%) |
| Installation, Maintenance & Repair | 95 (100.0%) | 0 (0.0%) |
| Total (Category) | 147 (100.0%) | 0 (0.0%) |
| Total (Overall) | 732 (52.4%) | 666 (47.6%) |
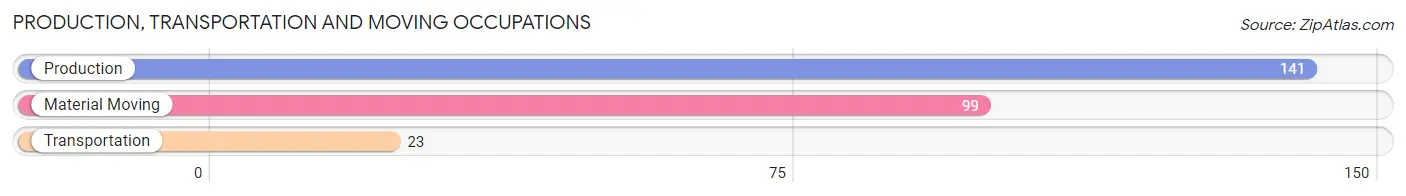
Production, Transportation and Moving Occupations
The most common Production, Transportation and Moving occupations in Meadowood are Production (141 | 10.1%), Material Moving (99 | 7.1%), and Transportation (23 | 1.7%).
Production, Transportation and Moving Occupations by Sex
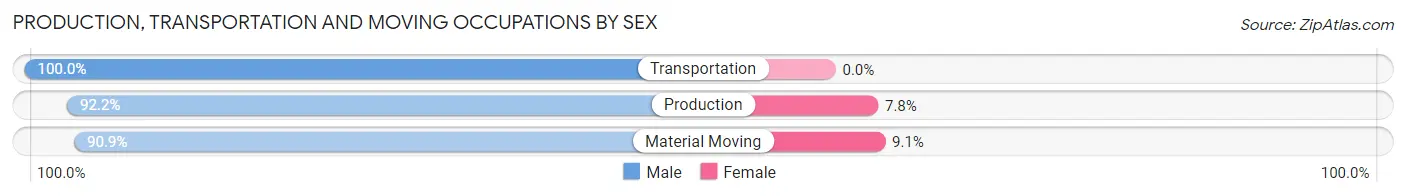
| Occupation | Male | Female |
| Production | 130 (92.2%) | 11 (7.8%) |
| Transportation | 23 (100.0%) | 0 (0.0%) |
| Material Moving | 90 (90.9%) | 9 (9.1%) |
| Total (Category) | 243 (92.4%) | 20 (7.6%) |
| Total (Overall) | 732 (52.4%) | 666 (47.6%) |
Employment Industries by Sex in Meadowood
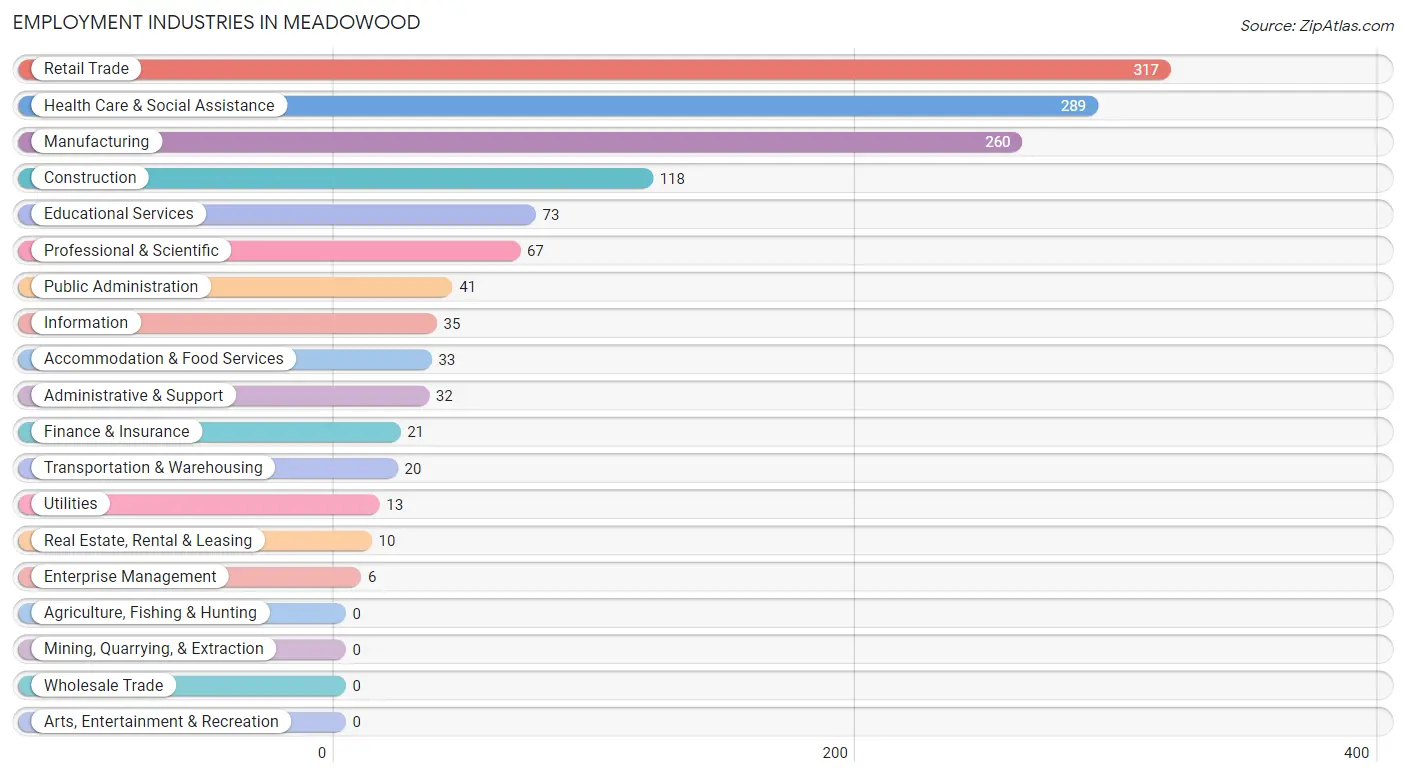
Employment Industries in Meadowood
The major employment industries in Meadowood include Retail Trade (317 | 22.7%), Health Care & Social Assistance (289 | 20.7%), Manufacturing (260 | 18.6%), Construction (118 | 8.4%), and Educational Services (73 | 5.2%).
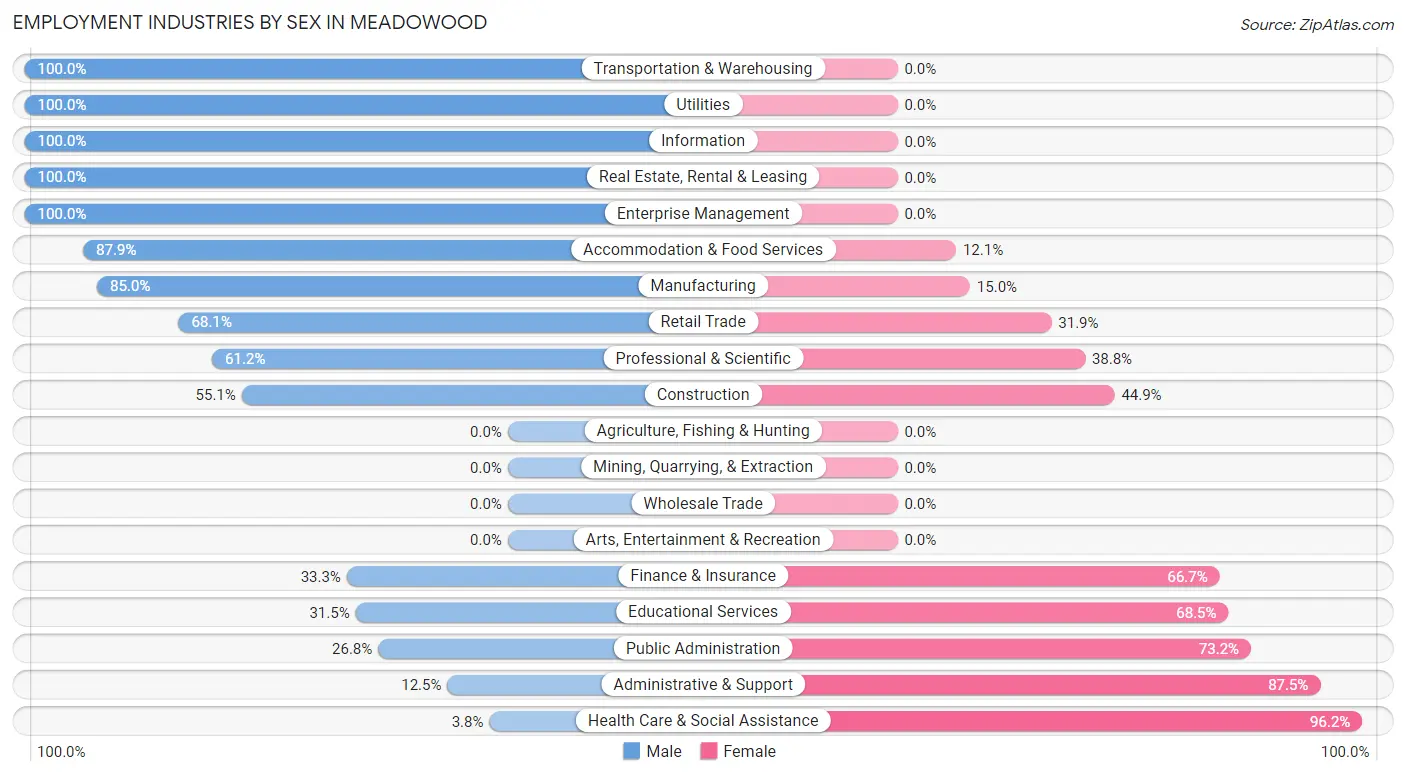
Employment Industries by Sex in Meadowood
The Meadowood industries that see more men than women are Transportation & Warehousing (100.0%), Utilities (100.0%), and Information (100.0%), whereas the industries that tend to have a higher number of women are Health Care & Social Assistance (96.2%), Administrative & Support (87.5%), and Public Administration (73.2%).
| Industry | Male | Female |
| Agriculture, Fishing & Hunting | 0 (0.0%) | 0 (0.0%) |
| Mining, Quarrying, & Extraction | 0 (0.0%) | 0 (0.0%) |
| Construction | 65 (55.1%) | 53 (44.9%) |
| Manufacturing | 221 (85.0%) | 39 (15.0%) |
| Wholesale Trade | 0 (0.0%) | 0 (0.0%) |
| Retail Trade | 216 (68.1%) | 101 (31.9%) |
| Transportation & Warehousing | 20 (100.0%) | 0 (0.0%) |
| Utilities | 13 (100.0%) | 0 (0.0%) |
| Information | 35 (100.0%) | 0 (0.0%) |
| Finance & Insurance | 7 (33.3%) | 14 (66.7%) |
| Real Estate, Rental & Leasing | 10 (100.0%) | 0 (0.0%) |
| Professional & Scientific | 41 (61.2%) | 26 (38.8%) |
| Enterprise Management | 6 (100.0%) | 0 (0.0%) |
| Administrative & Support | 4 (12.5%) | 28 (87.5%) |
| Educational Services | 23 (31.5%) | 50 (68.5%) |
| Health Care & Social Assistance | 11 (3.8%) | 278 (96.2%) |
| Arts, Entertainment & Recreation | 0 (0.0%) | 0 (0.0%) |
| Accommodation & Food Services | 29 (87.9%) | 4 (12.1%) |
| Public Administration | 11 (26.8%) | 30 (73.2%) |
| Total | 732 (52.4%) | 666 (47.6%) |
Education in Meadowood
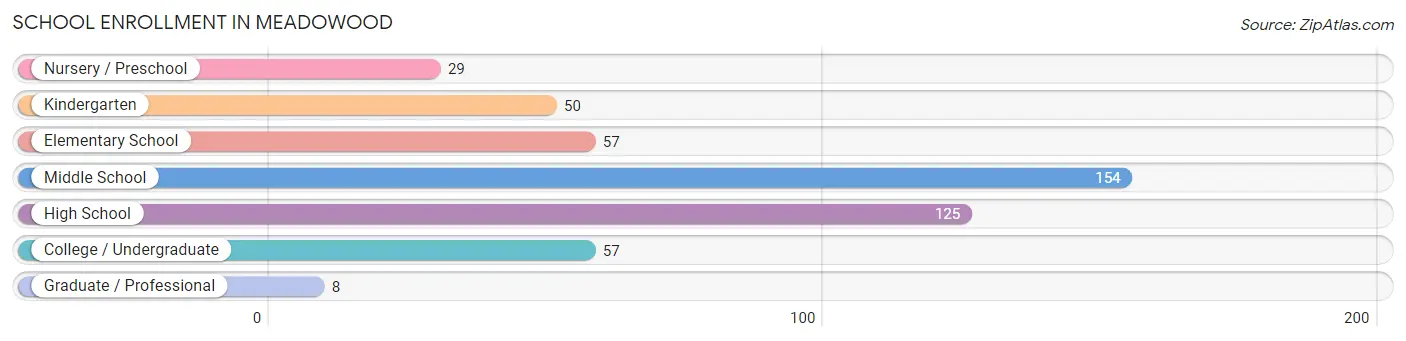
School Enrollment in Meadowood
The most common levels of schooling among the 480 students in Meadowood are middle school (154 | 32.1%), high school (125 | 26.0%), and elementary school (57 | 11.9%).
| School Level | # Students | % Students |
| Nursery / Preschool | 29 | 6.0% |
| Kindergarten | 50 | 10.4% |
| Elementary School | 57 | 11.9% |
| Middle School | 154 | 32.1% |
| High School | 125 | 26.0% |
| College / Undergraduate | 57 | 11.9% |
| Graduate / Professional | 8 | 1.7% |
| Total | 480 | 100.0% |
School Enrollment by Age by Funding Source in Meadowood
Out of a total of 480 students who are enrolled in schools in Meadowood, 86 (17.9%) attend a private institution, while the remaining 394 (82.1%) are enrolled in public schools. The age group of 3 to 4 year olds has the highest likelihood of being enrolled in private schools, with 23 (52.3% in the age bracket) enrolled. Conversely, the age group of 10 to 14 year olds has the lowest likelihood of being enrolled in a private school, with 158 (100.0% in the age bracket) attending a public institution.
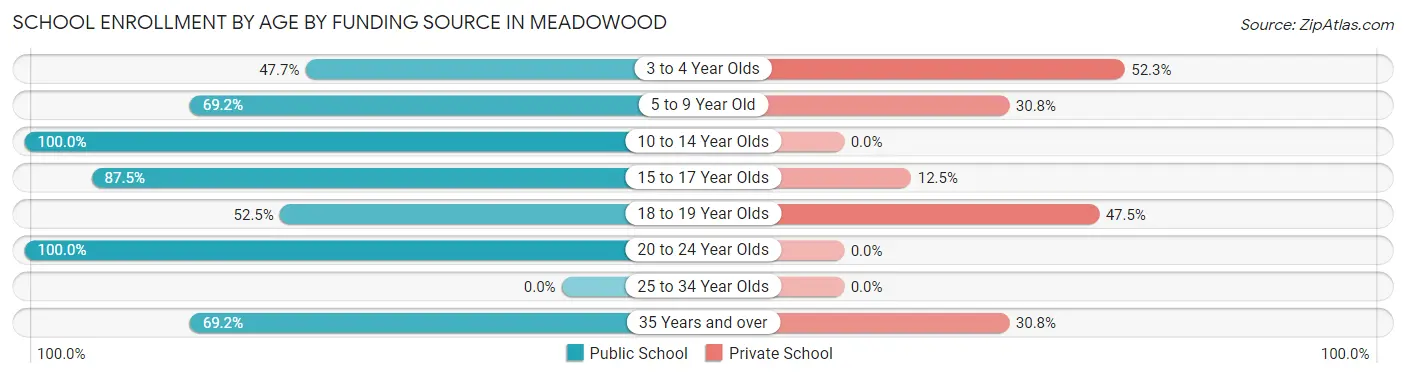
| Age Bracket | Public School | Private School |
| 3 to 4 Year Olds | 21 (47.7%) | 23 (52.3%) |
| 5 to 9 Year Old | 54 (69.2%) | 24 (30.8%) |
| 10 to 14 Year Olds | 158 (100.0%) | 0 (0.0%) |
| 15 to 17 Year Olds | 84 (87.5%) | 12 (12.5%) |
| 18 to 19 Year Olds | 21 (52.5%) | 19 (47.5%) |
| 20 to 24 Year Olds | 38 (100.0%) | 0 (0.0%) |
| 25 to 34 Year Olds | 0 (0.0%) | 0 (0.0%) |
| 35 Years and over | 18 (69.2%) | 8 (30.8%) |
| Total | 394 (82.1%) | 86 (17.9%) |
Educational Attainment by Field of Study in Meadowood
Science & technology (135 | 23.2%), education (115 | 19.8%), business (66 | 11.3%), visual & performing arts (66 | 11.3%), and psychology (47 | 8.1%) are the most common fields of study among 582 individuals in Meadowood who have obtained a bachelor's degree or higher.
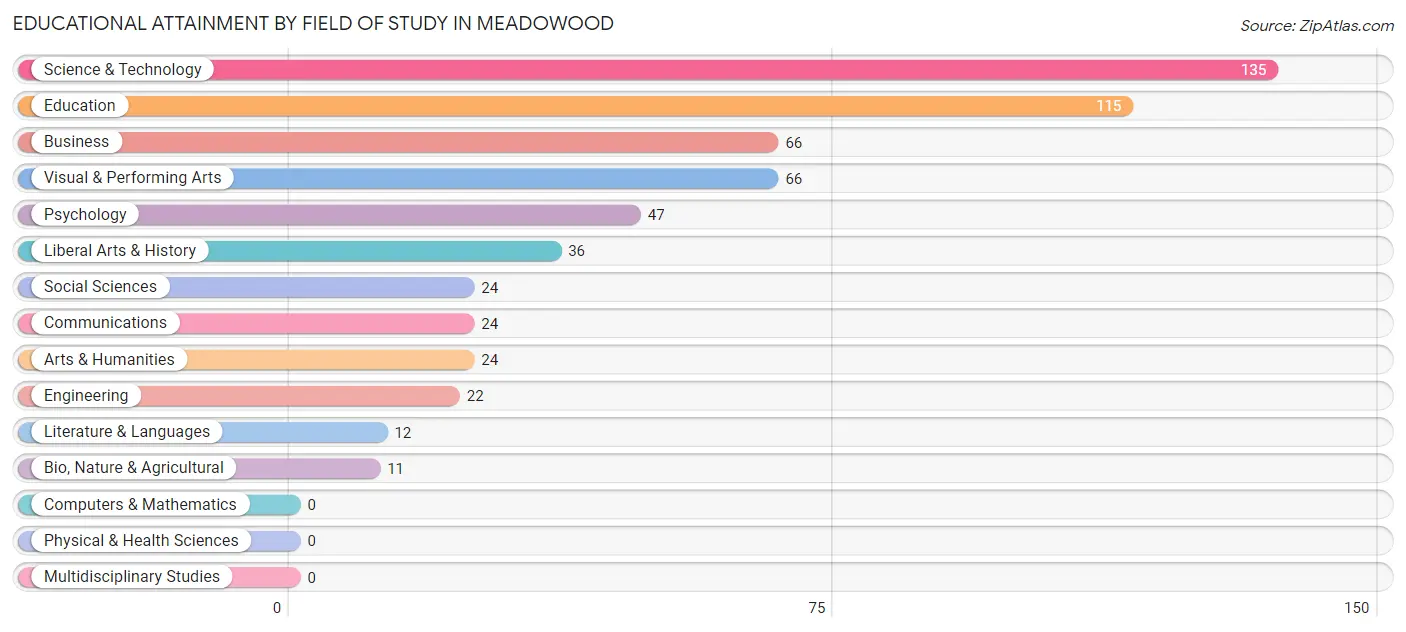
| Field of Study | # Graduates | % Graduates |
| Computers & Mathematics | 0 | 0.0% |
| Bio, Nature & Agricultural | 11 | 1.9% |
| Physical & Health Sciences | 0 | 0.0% |
| Psychology | 47 | 8.1% |
| Social Sciences | 24 | 4.1% |
| Engineering | 22 | 3.8% |
| Multidisciplinary Studies | 0 | 0.0% |
| Science & Technology | 135 | 23.2% |
| Business | 66 | 11.3% |
| Education | 115 | 19.8% |
| Literature & Languages | 12 | 2.1% |
| Liberal Arts & History | 36 | 6.2% |
| Visual & Performing Arts | 66 | 11.3% |
| Communications | 24 | 4.1% |
| Arts & Humanities | 24 | 4.1% |
| Total | 582 | 100.0% |
Transportation & Commute in Meadowood
Vehicle Availability by Sex in Meadowood
The most prevalent vehicle ownership categories in Meadowood are males with 2 vehicles (494, accounting for 69.1%) and females with 2 vehicles (451, making up 74.2%).
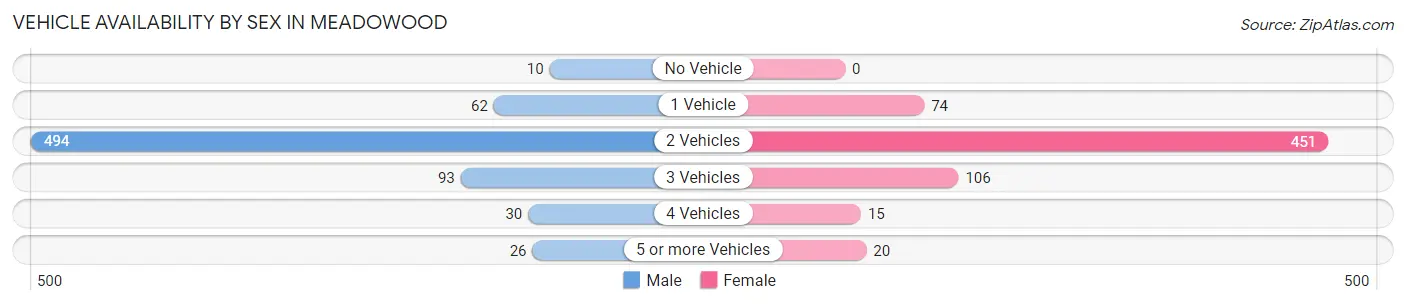
| Vehicles Available | Male | Female |
| No Vehicle | 10 (1.4%) | 0 (0.0%) |
| 1 Vehicle | 62 (8.7%) | 74 (11.1%) |
| 2 Vehicles | 494 (69.1%) | 451 (67.7%) |
| 3 Vehicles | 93 (13.0%) | 106 (15.9%) |
| 4 Vehicles | 30 (4.2%) | 15 (2.2%) |
| 5 or more Vehicles | 26 (3.6%) | 20 (3.0%) |
| Total | 715 (100.0%) | 666 (100.0%) |
Commute Time in Meadowood
The most frequently occuring commute durations in Meadowood are 10 to 14 minutes (280 commuters, 20.6%), 30 to 34 minutes (245 commuters, 18.1%), and 15 to 19 minutes (198 commuters, 14.6%).
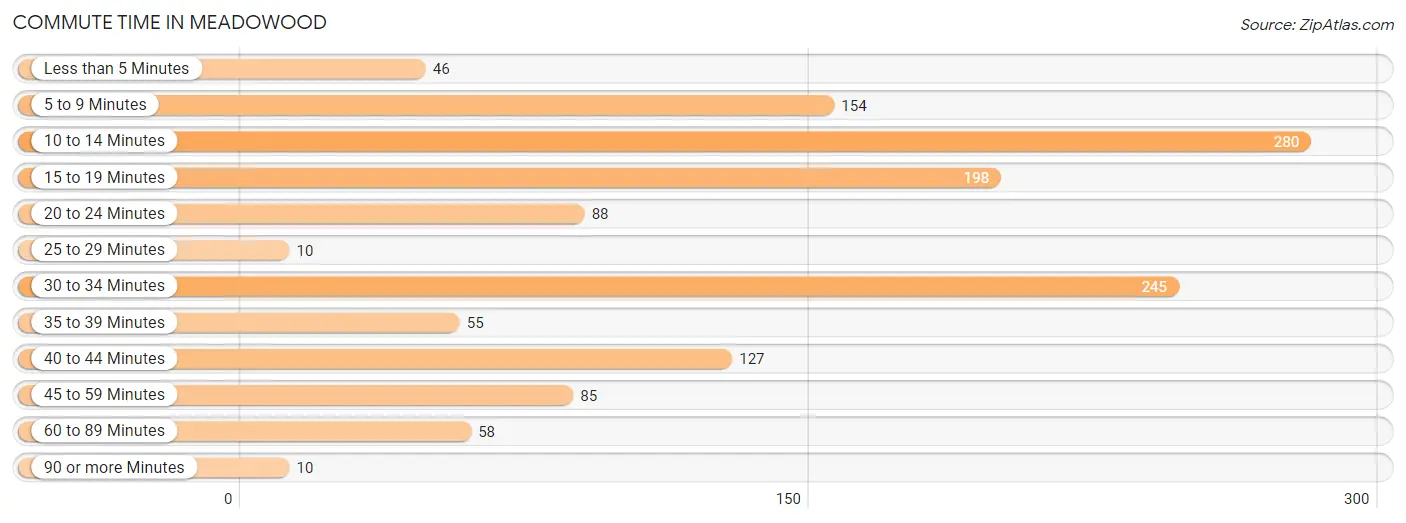
| Commute Time | # Commuters | % Commuters |
| Less than 5 Minutes | 46 | 3.4% |
| 5 to 9 Minutes | 154 | 11.4% |
| 10 to 14 Minutes | 280 | 20.6% |
| 15 to 19 Minutes | 198 | 14.6% |
| 20 to 24 Minutes | 88 | 6.5% |
| 25 to 29 Minutes | 10 | 0.7% |
| 30 to 34 Minutes | 245 | 18.1% |
| 35 to 39 Minutes | 55 | 4.1% |
| 40 to 44 Minutes | 127 | 9.4% |
| 45 to 59 Minutes | 85 | 6.3% |
| 60 to 89 Minutes | 58 | 4.3% |
| 90 or more Minutes | 10 | 0.7% |
Commute Time by Sex in Meadowood
The most common commute times in Meadowood are 10 to 14 minutes (158 commuters, 22.8%) for males and 30 to 34 minutes (147 commuters, 22.2%) for females.
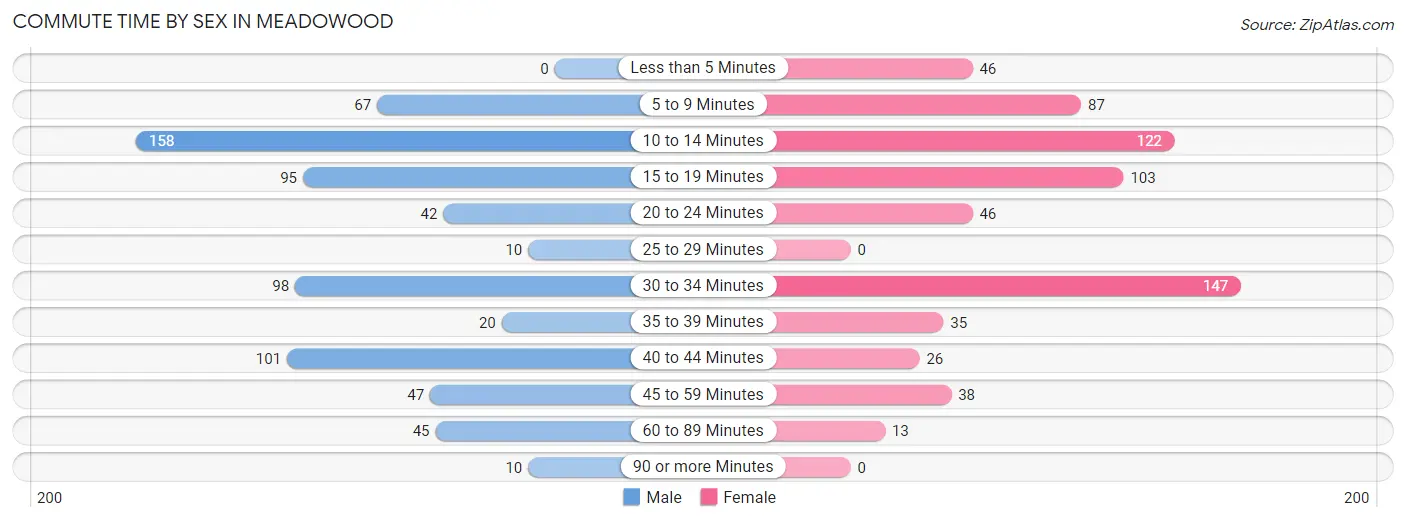
| Commute Time | Male | Female |
| Less than 5 Minutes | 0 (0.0%) | 46 (6.9%) |
| 5 to 9 Minutes | 67 (9.7%) | 87 (13.1%) |
| 10 to 14 Minutes | 158 (22.8%) | 122 (18.4%) |
| 15 to 19 Minutes | 95 (13.7%) | 103 (15.5%) |
| 20 to 24 Minutes | 42 (6.1%) | 46 (6.9%) |
| 25 to 29 Minutes | 10 (1.4%) | 0 (0.0%) |
| 30 to 34 Minutes | 98 (14.1%) | 147 (22.2%) |
| 35 to 39 Minutes | 20 (2.9%) | 35 (5.3%) |
| 40 to 44 Minutes | 101 (14.6%) | 26 (3.9%) |
| 45 to 59 Minutes | 47 (6.8%) | 38 (5.7%) |
| 60 to 89 Minutes | 45 (6.5%) | 13 (2.0%) |
| 90 or more Minutes | 10 (1.4%) | 0 (0.0%) |
Time of Departure to Work by Sex in Meadowood
The most frequent times of departure to work in Meadowood are 5:00 AM to 5:29 AM (187, 27.0%) for males and 7:00 AM to 7:29 AM (124, 18.7%) for females.
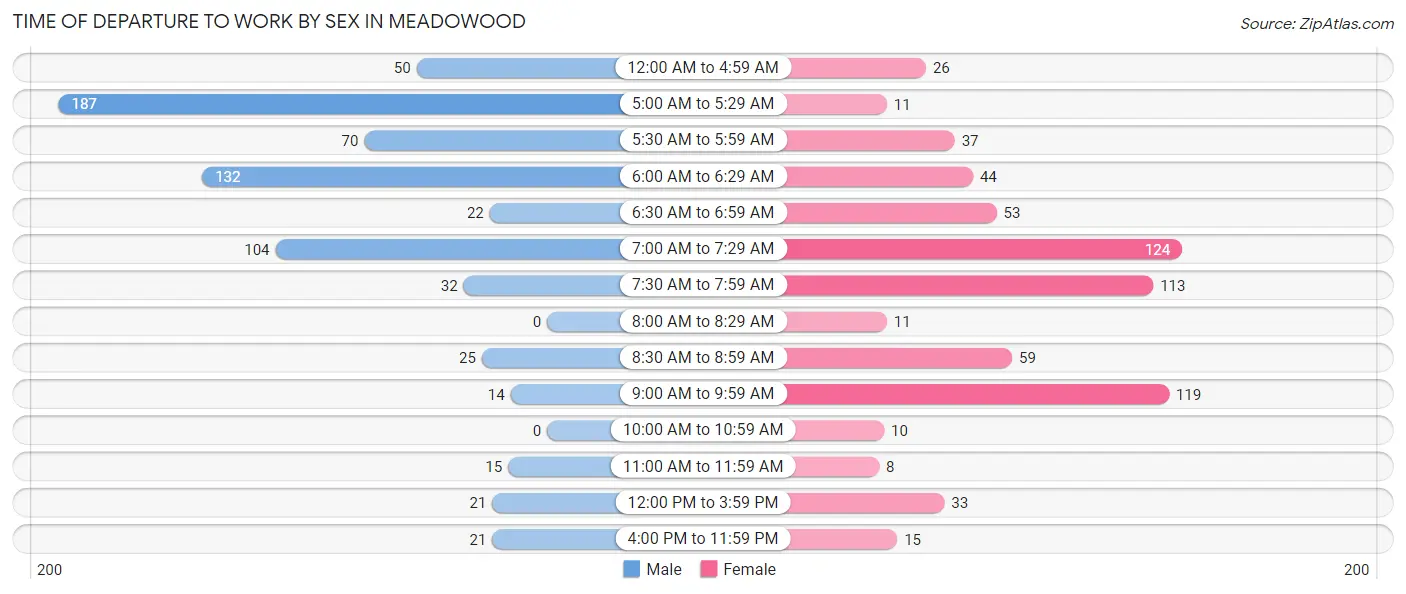
| Time of Departure | Male | Female |
| 12:00 AM to 4:59 AM | 50 (7.2%) | 26 (3.9%) |
| 5:00 AM to 5:29 AM | 187 (27.0%) | 11 (1.7%) |
| 5:30 AM to 5:59 AM | 70 (10.1%) | 37 (5.6%) |
| 6:00 AM to 6:29 AM | 132 (19.1%) | 44 (6.6%) |
| 6:30 AM to 6:59 AM | 22 (3.2%) | 53 (8.0%) |
| 7:00 AM to 7:29 AM | 104 (15.0%) | 124 (18.7%) |
| 7:30 AM to 7:59 AM | 32 (4.6%) | 113 (17.0%) |
| 8:00 AM to 8:29 AM | 0 (0.0%) | 11 (1.7%) |
| 8:30 AM to 8:59 AM | 25 (3.6%) | 59 (8.9%) |
| 9:00 AM to 9:59 AM | 14 (2.0%) | 119 (17.9%) |
| 10:00 AM to 10:59 AM | 0 (0.0%) | 10 (1.5%) |
| 11:00 AM to 11:59 AM | 15 (2.2%) | 8 (1.2%) |
| 12:00 PM to 3:59 PM | 21 (3.0%) | 33 (5.0%) |
| 4:00 PM to 11:59 PM | 21 (3.0%) | 15 (2.3%) |
| Total | 693 (100.0%) | 663 (100.0%) |
Housing Occupancy in Meadowood
Occupancy by Ownership in Meadowood
Of the total 1,207 dwellings in Meadowood, owner-occupied units account for 1,095 (90.7%), while renter-occupied units make up 112 (9.3%).
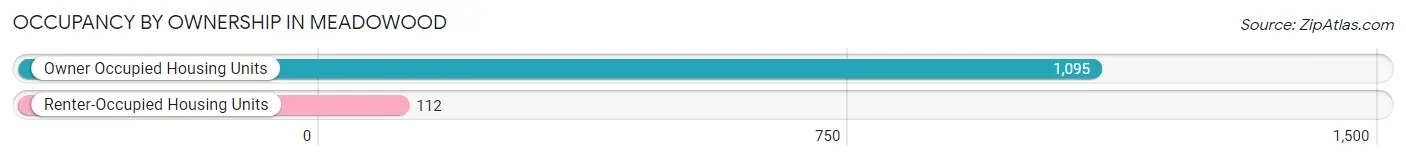
| Occupancy | # Housing Units | % Housing Units |
| Owner Occupied Housing Units | 1,095 | 90.7% |
| Renter-Occupied Housing Units | 112 | 9.3% |
| Total Occupied Housing Units | 1,207 | 100.0% |
Occupancy by Household Size in Meadowood
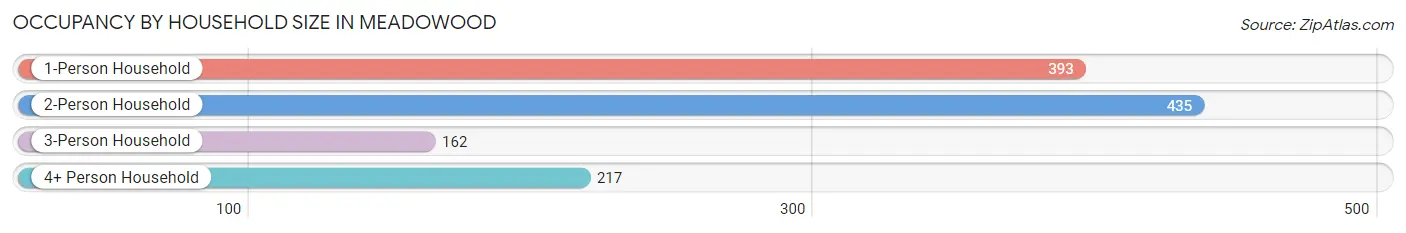
| Household Size | # Housing Units | % Housing Units |
| 1-Person Household | 393 | 32.6% |
| 2-Person Household | 435 | 36.0% |
| 3-Person Household | 162 | 13.4% |
| 4+ Person Household | 217 | 18.0% |
| Total Housing Units | 1,207 | 100.0% |
Occupancy by Ownership by Household Size in Meadowood
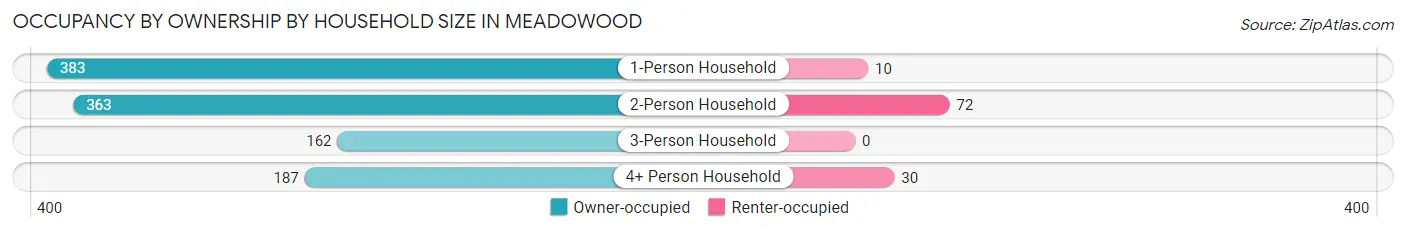
| Household Size | Owner-occupied | Renter-occupied |
| 1-Person Household | 383 (97.5%) | 10 (2.5%) |
| 2-Person Household | 363 (83.5%) | 72 (16.6%) |
| 3-Person Household | 162 (100.0%) | 0 (0.0%) |
| 4+ Person Household | 187 (86.2%) | 30 (13.8%) |
| Total Housing Units | 1,095 (90.7%) | 112 (9.3%) |
Occupancy by Educational Attainment in Meadowood
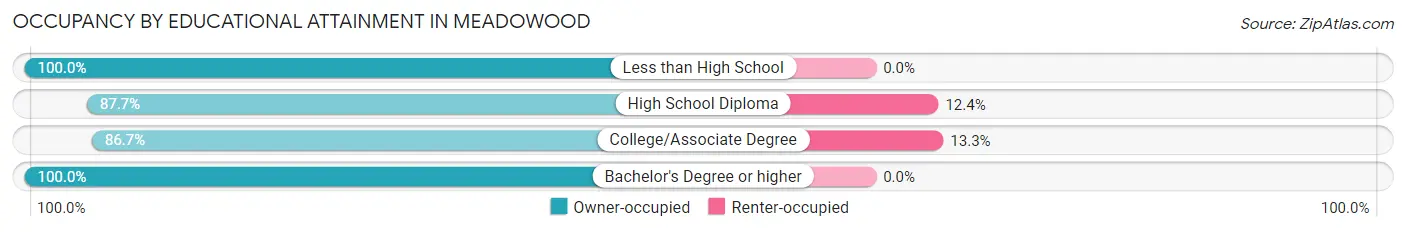
| Household Size | Owner-occupied | Renter-occupied |
| Less than High School | 10 (100.0%) | 0 (0.0%) |
| High School Diploma | 284 (87.6%) | 40 (12.3%) |
| College/Associate Degree | 468 (86.7%) | 72 (13.3%) |
| Bachelor's Degree or higher | 333 (100.0%) | 0 (0.0%) |
Occupancy by Age of Householder in Meadowood
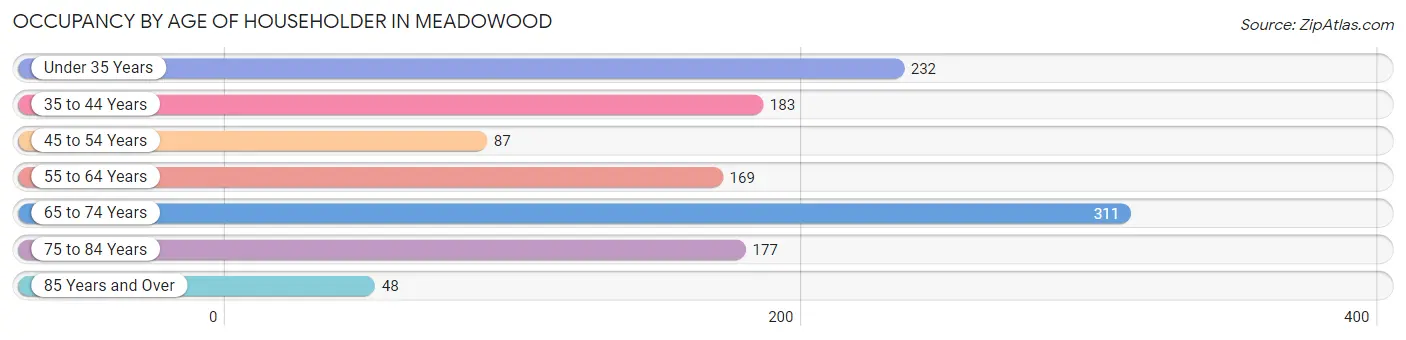
| Age Bracket | # Households | % Households |
| Under 35 Years | 232 | 19.2% |
| 35 to 44 Years | 183 | 15.2% |
| 45 to 54 Years | 87 | 7.2% |
| 55 to 64 Years | 169 | 14.0% |
| 65 to 74 Years | 311 | 25.8% |
| 75 to 84 Years | 177 | 14.7% |
| 85 Years and Over | 48 | 4.0% |
| Total | 1,207 | 100.0% |
Housing Finances in Meadowood
Median Income by Occupancy in Meadowood
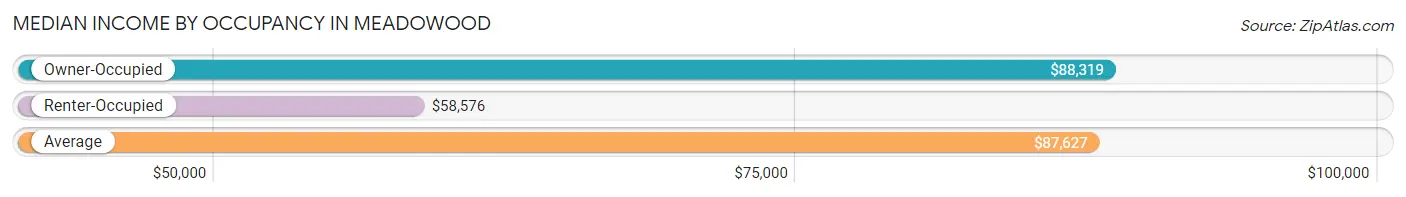
| Occupancy Type | # Households | Median Income |
| Owner-Occupied | 1,095 (90.7%) | $88,319 |
| Renter-Occupied | 112 (9.3%) | $58,576 |
| Average | 1,207 (100.0%) | $87,627 |
Occupancy by Householder Income Bracket in Meadowood
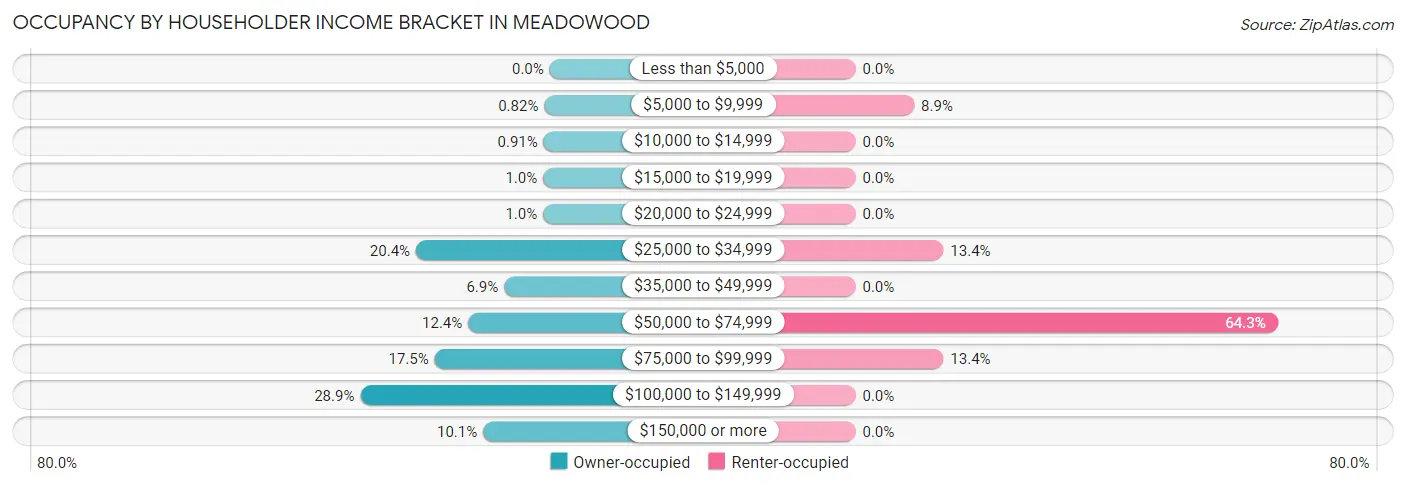
| Income Bracket | Owner-occupied | Renter-occupied |
| Less than $5,000 | 0 (0.0%) | 0 (0.0%) |
| $5,000 to $9,999 | 9 (0.8%) | 10 (8.9%) |
| $10,000 to $14,999 | 10 (0.9%) | 0 (0.0%) |
| $15,000 to $19,999 | 11 (1.0%) | 0 (0.0%) |
| $20,000 to $24,999 | 11 (1.0%) | 0 (0.0%) |
| $25,000 to $34,999 | 223 (20.4%) | 15 (13.4%) |
| $35,000 to $49,999 | 76 (6.9%) | 0 (0.0%) |
| $50,000 to $74,999 | 136 (12.4%) | 72 (64.3%) |
| $75,000 to $99,999 | 192 (17.5%) | 15 (13.4%) |
| $100,000 to $149,999 | 316 (28.9%) | 0 (0.0%) |
| $150,000 or more | 111 (10.1%) | 0 (0.0%) |
| Total | 1,095 (100.0%) | 112 (100.0%) |
Monthly Housing Cost Tiers in Meadowood
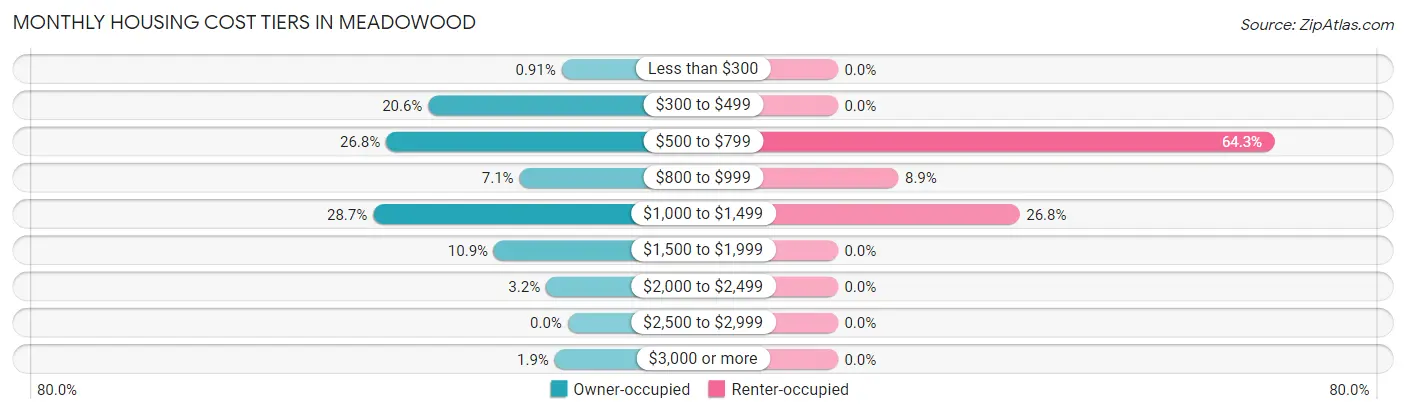
| Monthly Cost | Owner-occupied | Renter-occupied |
| Less than $300 | 10 (0.9%) | 0 (0.0%) |
| $300 to $499 | 225 (20.5%) | 0 (0.0%) |
| $500 to $799 | 293 (26.8%) | 72 (64.3%) |
| $800 to $999 | 78 (7.1%) | 10 (8.9%) |
| $1,000 to $1,499 | 314 (28.7%) | 30 (26.8%) |
| $1,500 to $1,999 | 119 (10.9%) | 0 (0.0%) |
| $2,000 to $2,499 | 35 (3.2%) | 0 (0.0%) |
| $2,500 to $2,999 | 0 (0.0%) | 0 (0.0%) |
| $3,000 or more | 21 (1.9%) | 0 (0.0%) |
| Total | 1,095 (100.0%) | 112 (100.0%) |
Physical Housing Characteristics in Meadowood
Housing Structures in Meadowood
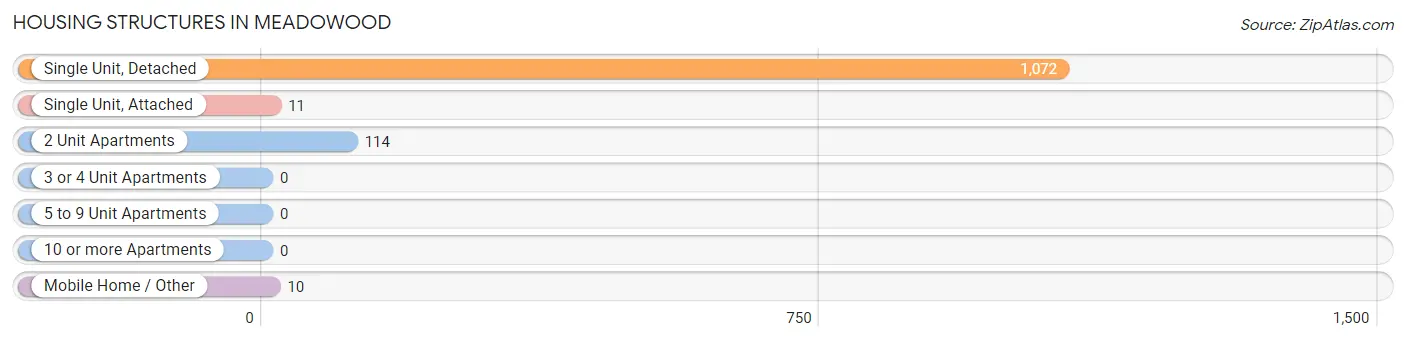
| Structure Type | # Housing Units | % Housing Units |
| Single Unit, Detached | 1,072 | 88.8% |
| Single Unit, Attached | 11 | 0.9% |
| 2 Unit Apartments | 114 | 9.4% |
| 3 or 4 Unit Apartments | 0 | 0.0% |
| 5 to 9 Unit Apartments | 0 | 0.0% |
| 10 or more Apartments | 0 | 0.0% |
| Mobile Home / Other | 10 | 0.8% |
| Total | 1,207 | 100.0% |
Housing Structures by Occupancy in Meadowood
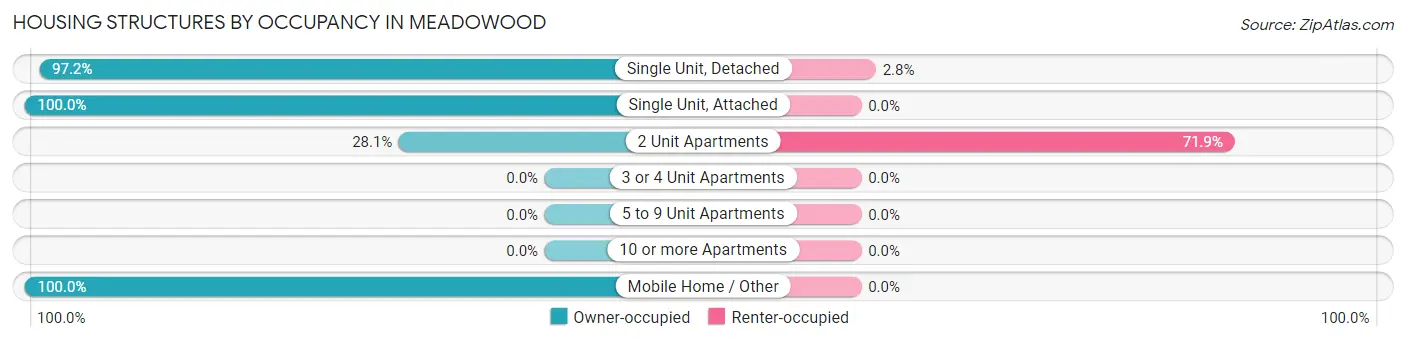
| Structure Type | Owner-occupied | Renter-occupied |
| Single Unit, Detached | 1,042 (97.2%) | 30 (2.8%) |
| Single Unit, Attached | 11 (100.0%) | 0 (0.0%) |
| 2 Unit Apartments | 32 (28.1%) | 82 (71.9%) |
| 3 or 4 Unit Apartments | 0 (0.0%) | 0 (0.0%) |
| 5 to 9 Unit Apartments | 0 (0.0%) | 0 (0.0%) |
| 10 or more Apartments | 0 (0.0%) | 0 (0.0%) |
| Mobile Home / Other | 10 (100.0%) | 0 (0.0%) |
| Total | 1,095 (90.7%) | 112 (9.3%) |
Housing Structures by Number of Rooms in Meadowood
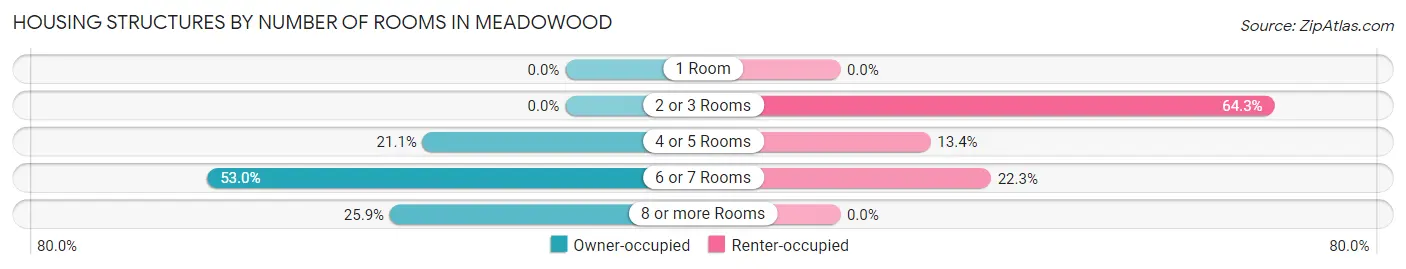
| Number of Rooms | Owner-occupied | Renter-occupied |
| 1 Room | 0 (0.0%) | 0 (0.0%) |
| 2 or 3 Rooms | 0 (0.0%) | 72 (64.3%) |
| 4 or 5 Rooms | 231 (21.1%) | 15 (13.4%) |
| 6 or 7 Rooms | 580 (53.0%) | 25 (22.3%) |
| 8 or more Rooms | 284 (25.9%) | 0 (0.0%) |
| Total | 1,095 (100.0%) | 112 (100.0%) |
Housing Structure by Heating Type in Meadowood
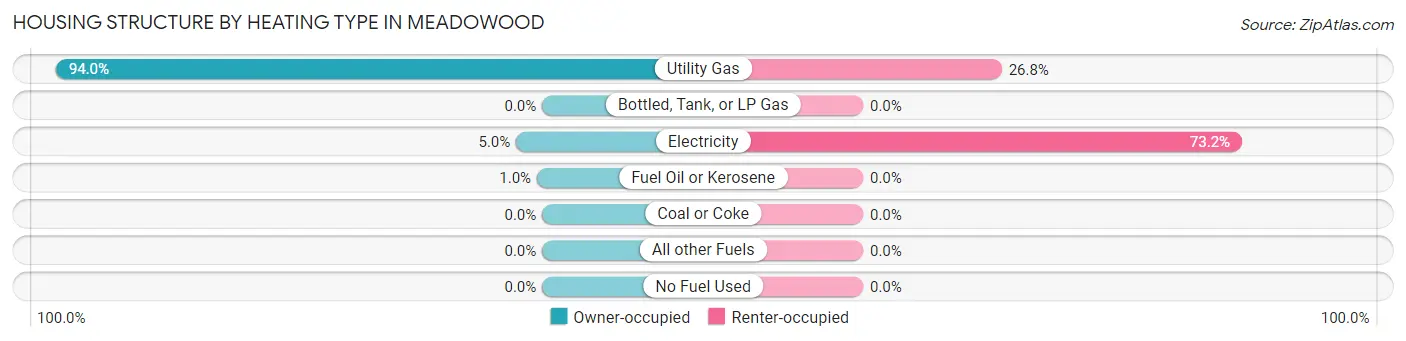
| Heating Type | Owner-occupied | Renter-occupied |
| Utility Gas | 1,029 (94.0%) | 30 (26.8%) |
| Bottled, Tank, or LP Gas | 0 (0.0%) | 0 (0.0%) |
| Electricity | 55 (5.0%) | 82 (73.2%) |
| Fuel Oil or Kerosene | 11 (1.0%) | 0 (0.0%) |
| Coal or Coke | 0 (0.0%) | 0 (0.0%) |
| All other Fuels | 0 (0.0%) | 0 (0.0%) |
| No Fuel Used | 0 (0.0%) | 0 (0.0%) |
| Total | 1,095 (100.0%) | 112 (100.0%) |
Household Vehicle Usage in Meadowood
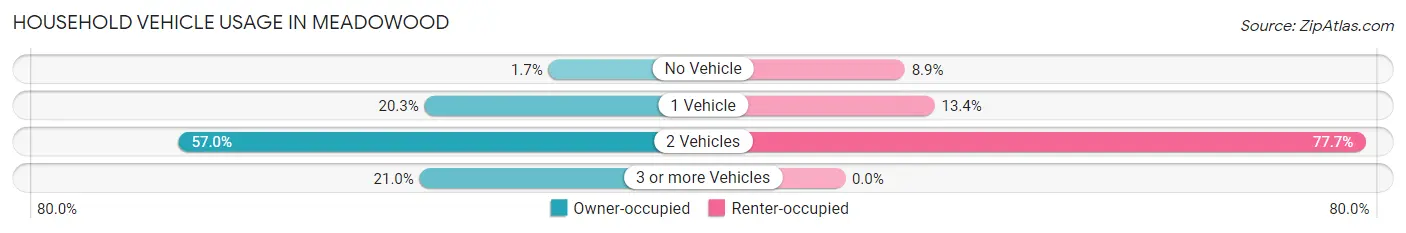
| Vehicles per Household | Owner-occupied | Renter-occupied |
| No Vehicle | 19 (1.7%) | 10 (8.9%) |
| 1 Vehicle | 222 (20.3%) | 15 (13.4%) |
| 2 Vehicles | 624 (57.0%) | 87 (77.7%) |
| 3 or more Vehicles | 230 (21.0%) | 0 (0.0%) |
| Total | 1,095 (100.0%) | 112 (100.0%) |
Real Estate & Mortgages in Meadowood
Real Estate and Mortgage Overview in Meadowood
| Characteristic | Without Mortgage | With Mortgage |
| Housing Units | 499 | 596 |
| Median Property Value | $186,000 | $180,800 |
| Median Household Income | $56,625 | $68 |
| Monthly Housing Costs | $518 | $21 |
| Real Estate Taxes | $2,523 | $0 |
Property Value by Mortgage Status in Meadowood
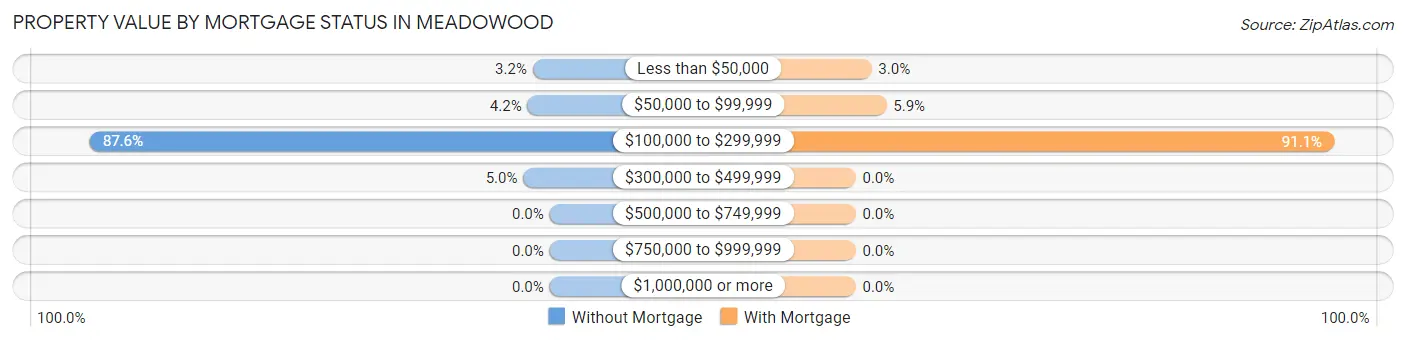
| Property Value | Without Mortgage | With Mortgage |
| Less than $50,000 | 16 (3.2%) | 18 (3.0%) |
| $50,000 to $99,999 | 21 (4.2%) | 35 (5.9%) |
| $100,000 to $299,999 | 437 (87.6%) | 543 (91.1%) |
| $300,000 to $499,999 | 25 (5.0%) | 0 (0.0%) |
| $500,000 to $749,999 | 0 (0.0%) | 0 (0.0%) |
| $750,000 to $999,999 | 0 (0.0%) | 0 (0.0%) |
| $1,000,000 or more | 0 (0.0%) | 0 (0.0%) |
| Total | 499 (100.0%) | 596 (100.0%) |
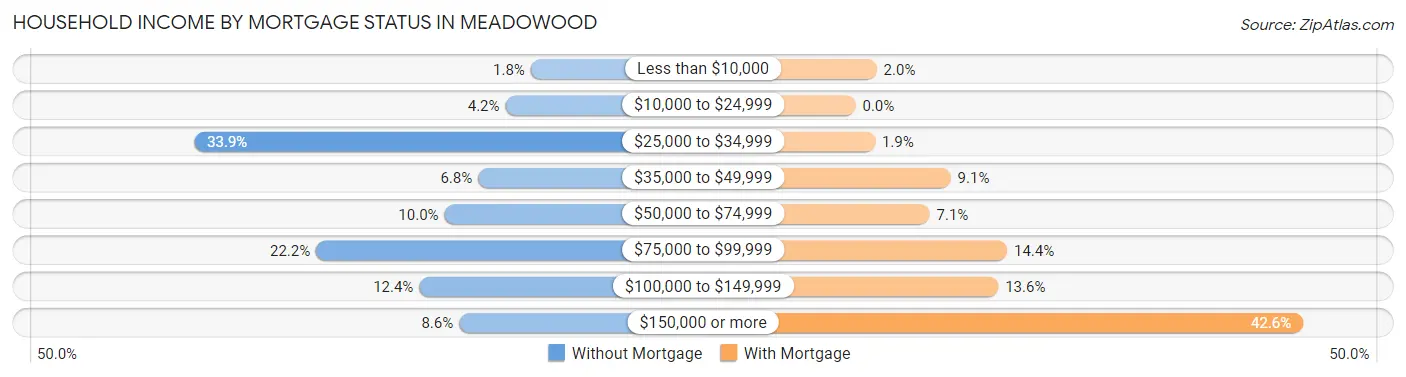
Household Income by Mortgage Status in Meadowood
| Household Income | Without Mortgage | With Mortgage |
| Less than $10,000 | 9 (1.8%) | 12 (2.0%) |
| $10,000 to $24,999 | 21 (4.2%) | 0 (0.0%) |
| $25,000 to $34,999 | 169 (33.9%) | 11 (1.8%) |
| $35,000 to $49,999 | 34 (6.8%) | 54 (9.1%) |
| $50,000 to $74,999 | 50 (10.0%) | 42 (7.0%) |
| $75,000 to $99,999 | 111 (22.2%) | 86 (14.4%) |
| $100,000 to $149,999 | 62 (12.4%) | 81 (13.6%) |
| $150,000 or more | 43 (8.6%) | 254 (42.6%) |
| Total | 499 (100.0%) | 596 (100.0%) |
Property Value to Household Income Ratio in Meadowood
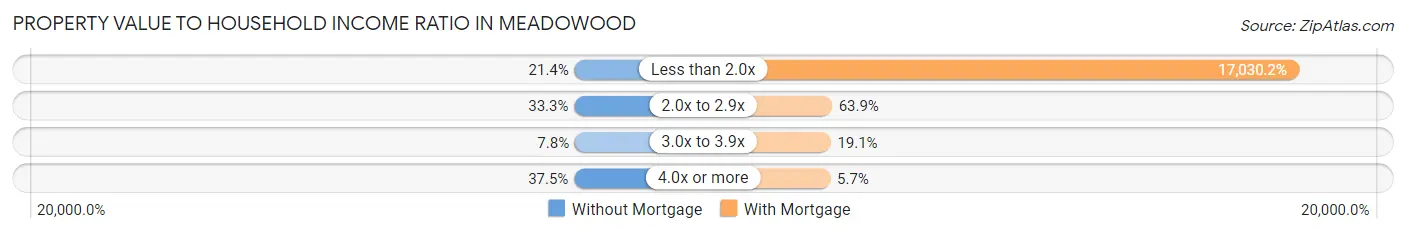
| Value-to-Income Ratio | Without Mortgage | With Mortgage |
| Less than 2.0x | 107 (21.4%) | 101,500 (17,030.2%) |
| 2.0x to 2.9x | 166 (33.3%) | 381 (63.9%) |
| 3.0x to 3.9x | 39 (7.8%) | 114 (19.1%) |
| 4.0x or more | 187 (37.5%) | 34 (5.7%) |
| Total | 499 (100.0%) | 596 (100.0%) |
Real Estate Taxes by Mortgage Status in Meadowood
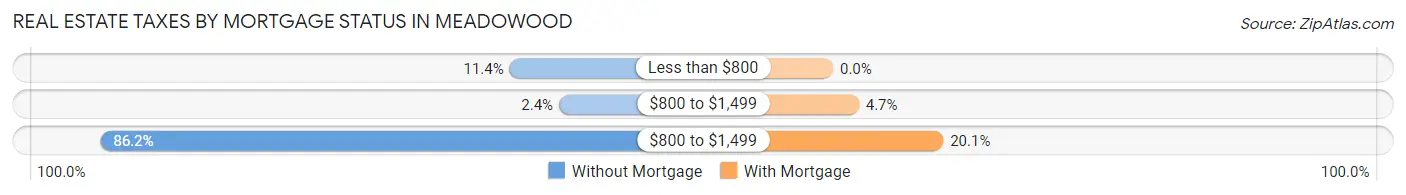
| Property Taxes | Without Mortgage | With Mortgage |
| Less than $800 | 57 (11.4%) | 0 (0.0%) |
| $800 to $1,499 | 12 (2.4%) | 28 (4.7%) |
| $800 to $1,499 | 430 (86.2%) | 120 (20.1%) |
| Total | 499 (100.0%) | 596 (100.0%) |
Health & Disability in Meadowood
Health Insurance Coverage by Age in Meadowood
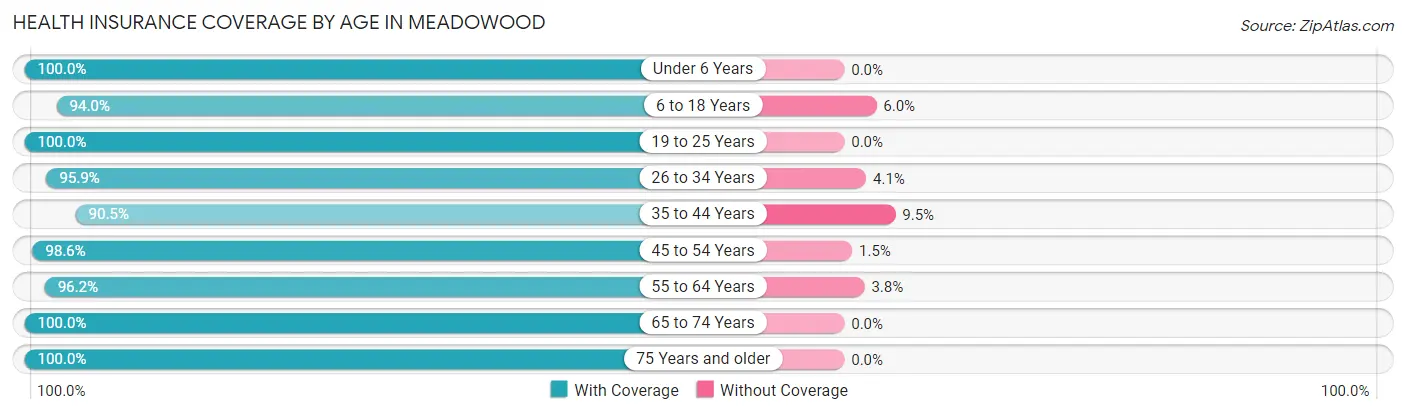
| Age Bracket | With Coverage | Without Coverage |
| Under 6 Years | 125 (100.0%) | 0 (0.0%) |
| 6 to 18 Years | 315 (94.0%) | 20 (6.0%) |
| 19 to 25 Years | 106 (100.0%) | 0 (0.0%) |
| 26 to 34 Years | 377 (95.9%) | 16 (4.1%) |
| 35 to 44 Years | 304 (90.5%) | 32 (9.5%) |
| 45 to 54 Years | 272 (98.6%) | 4 (1.5%) |
| 55 to 64 Years | 307 (96.2%) | 12 (3.8%) |
| 65 to 74 Years | 488 (100.0%) | 0 (0.0%) |
| 75 Years and older | 308 (100.0%) | 0 (0.0%) |
| Total | 2,602 (96.9%) | 84 (3.1%) |
Health Insurance Coverage by Citizenship Status in Meadowood
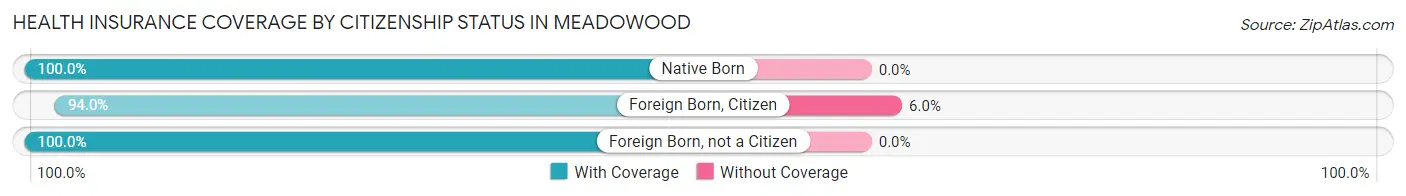
| Citizenship Status | With Coverage | Without Coverage |
| Native Born | 125 (100.0%) | 0 (0.0%) |
| Foreign Born, Citizen | 315 (94.0%) | 20 (6.0%) |
| Foreign Born, not a Citizen | 106 (100.0%) | 0 (0.0%) |
Health Insurance Coverage by Household Income in Meadowood
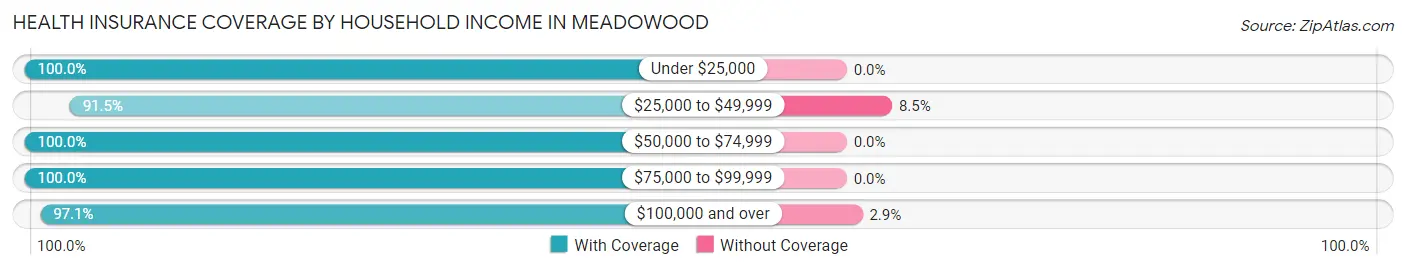
| Household Income | With Coverage | Without Coverage |
| Under $25,000 | 51 (100.0%) | 0 (0.0%) |
| $25,000 to $49,999 | 465 (91.5%) | 43 (8.5%) |
| $50,000 to $74,999 | 473 (100.0%) | 0 (0.0%) |
| $75,000 to $99,999 | 351 (100.0%) | 0 (0.0%) |
| $100,000 and over | 1,260 (97.1%) | 38 (2.9%) |
Public vs Private Health Insurance Coverage by Age in Meadowood
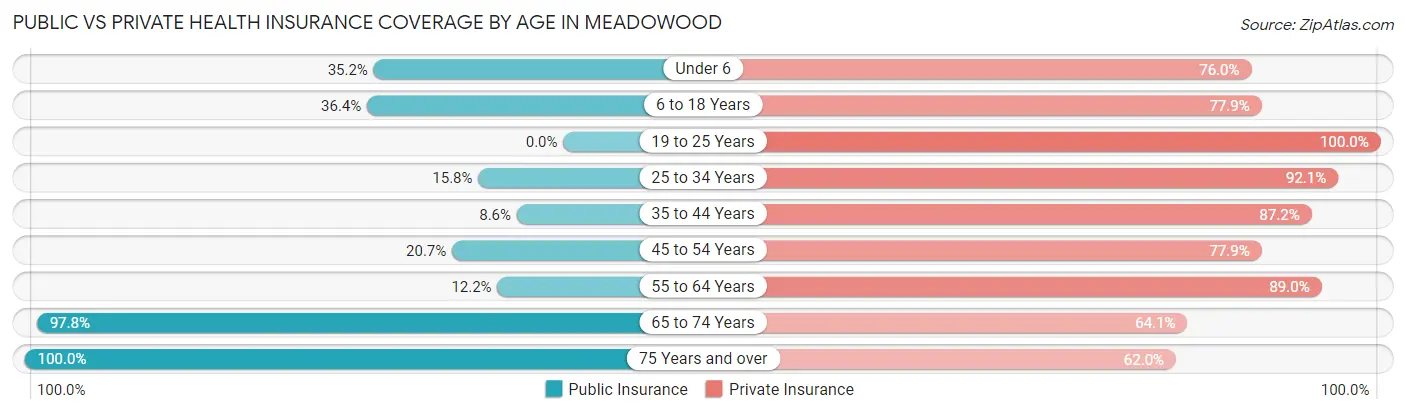
| Age Bracket | Public Insurance | Private Insurance |
| Under 6 | 44 (35.2%) | 95 (76.0%) |
| 6 to 18 Years | 122 (36.4%) | 261 (77.9%) |
| 19 to 25 Years | 0 (0.0%) | 106 (100.0%) |
| 25 to 34 Years | 62 (15.8%) | 362 (92.1%) |
| 35 to 44 Years | 29 (8.6%) | 293 (87.2%) |
| 45 to 54 Years | 57 (20.6%) | 215 (77.9%) |
| 55 to 64 Years | 39 (12.2%) | 284 (89.0%) |
| 65 to 74 Years | 477 (97.8%) | 313 (64.1%) |
| 75 Years and over | 308 (100.0%) | 191 (62.0%) |
| Total | 1,138 (42.4%) | 2,120 (78.9%) |
Disability Status by Sex by Age in Meadowood
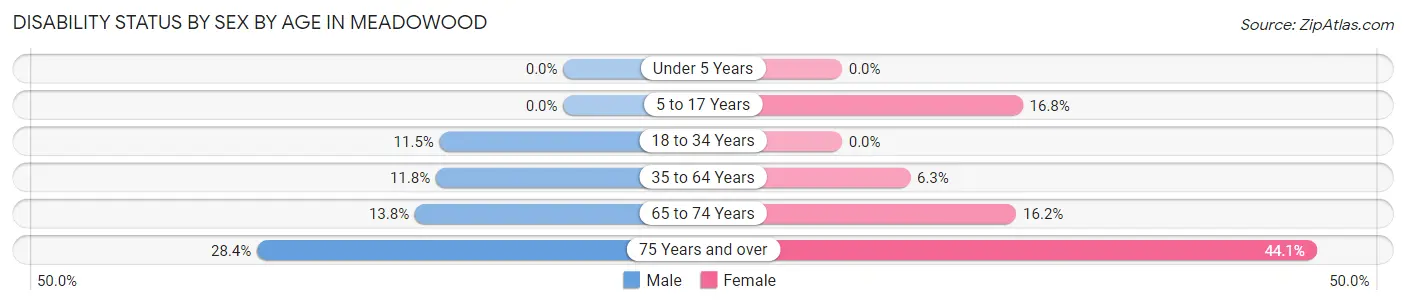
| Age Bracket | Male | Female |
| Under 5 Years | 0 (0.0%) | 0 (0.0%) |
| 5 to 17 Years | 0 (0.0%) | 25 (16.8%) |
| 18 to 34 Years | 41 (11.5%) | 0 (0.0%) |
| 35 to 64 Years | 54 (11.8%) | 30 (6.3%) |
| 65 to 74 Years | 34 (13.8%) | 39 (16.2%) |
| 75 Years and over | 54 (28.4%) | 52 (44.1%) |
Disability Class by Sex by Age in Meadowood
Disability Class: Hearing Difficulty
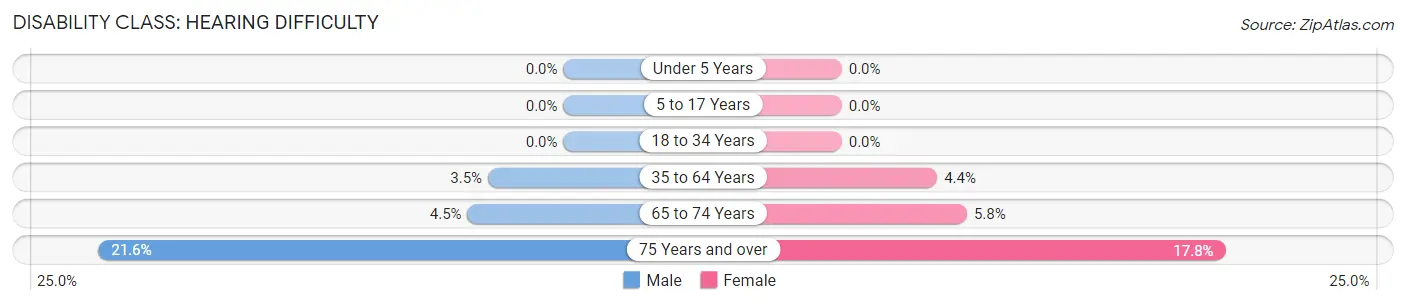
| Age Bracket | Male | Female |
| Under 5 Years | 0 (0.0%) | 0 (0.0%) |
| 5 to 17 Years | 0 (0.0%) | 0 (0.0%) |
| 18 to 34 Years | 0 (0.0%) | 0 (0.0%) |
| 35 to 64 Years | 16 (3.5%) | 21 (4.4%) |
| 65 to 74 Years | 11 (4.4%) | 14 (5.8%) |
| 75 Years and over | 41 (21.6%) | 21 (17.8%) |
Disability Class: Vision Difficulty
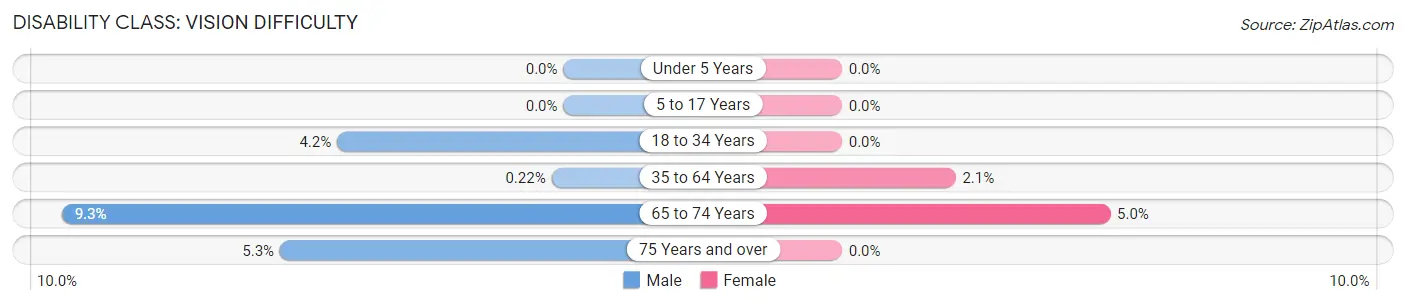
| Age Bracket | Male | Female |
| Under 5 Years | 0 (0.0%) | 0 (0.0%) |
| 5 to 17 Years | 0 (0.0%) | 0 (0.0%) |
| 18 to 34 Years | 15 (4.2%) | 0 (0.0%) |
| 35 to 64 Years | 1 (0.2%) | 10 (2.1%) |
| 65 to 74 Years | 23 (9.3%) | 12 (5.0%) |
| 75 Years and over | 10 (5.3%) | 0 (0.0%) |
Disability Class: Cognitive Difficulty
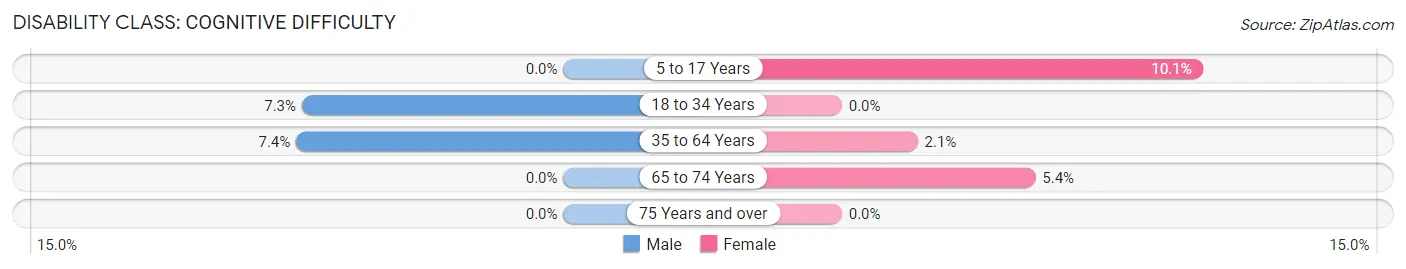
| Age Bracket | Male | Female |
| 5 to 17 Years | 0 (0.0%) | 15 (10.1%) |
| 18 to 34 Years | 26 (7.3%) | 0 (0.0%) |
| 35 to 64 Years | 34 (7.4%) | 10 (2.1%) |
| 65 to 74 Years | 0 (0.0%) | 13 (5.4%) |
| 75 Years and over | 0 (0.0%) | 0 (0.0%) |
Disability Class: Ambulatory Difficulty
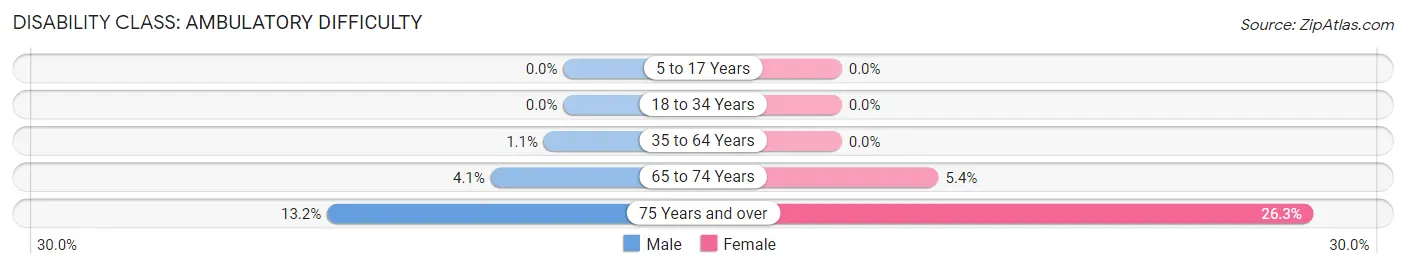
| Age Bracket | Male | Female |
| 5 to 17 Years | 0 (0.0%) | 0 (0.0%) |
| 18 to 34 Years | 0 (0.0%) | 0 (0.0%) |
| 35 to 64 Years | 5 (1.1%) | 0 (0.0%) |
| 65 to 74 Years | 10 (4.1%) | 13 (5.4%) |
| 75 Years and over | 25 (13.2%) | 31 (26.3%) |
Disability Class: Self-Care Difficulty
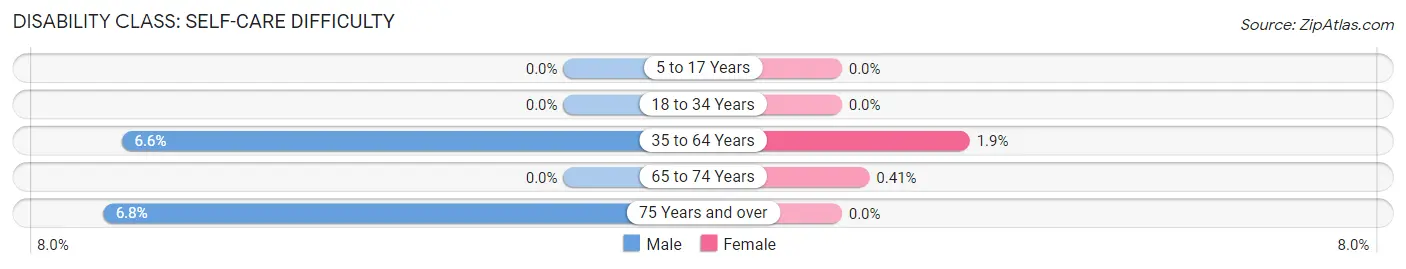
| Age Bracket | Male | Female |
| 5 to 17 Years | 0 (0.0%) | 0 (0.0%) |
| 18 to 34 Years | 0 (0.0%) | 0 (0.0%) |
| 35 to 64 Years | 30 (6.6%) | 9 (1.9%) |
| 65 to 74 Years | 0 (0.0%) | 1 (0.4%) |
| 75 Years and over | 13 (6.8%) | 0 (0.0%) |
Technology Access in Meadowood
Computing Device Access in Meadowood
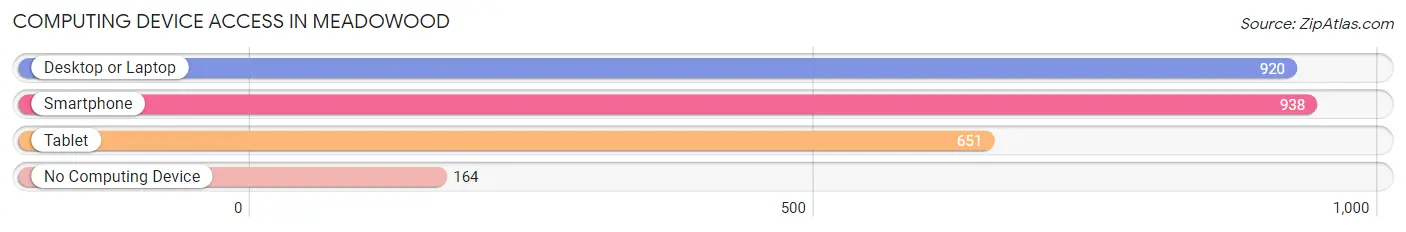
| Device Type | # Households | % Households |
| Desktop or Laptop | 920 | 76.2% |
| Smartphone | 938 | 77.7% |
| Tablet | 651 | 53.9% |
| No Computing Device | 164 | 13.6% |
| Total | 1,207 | 100.0% |
Internet Access in Meadowood
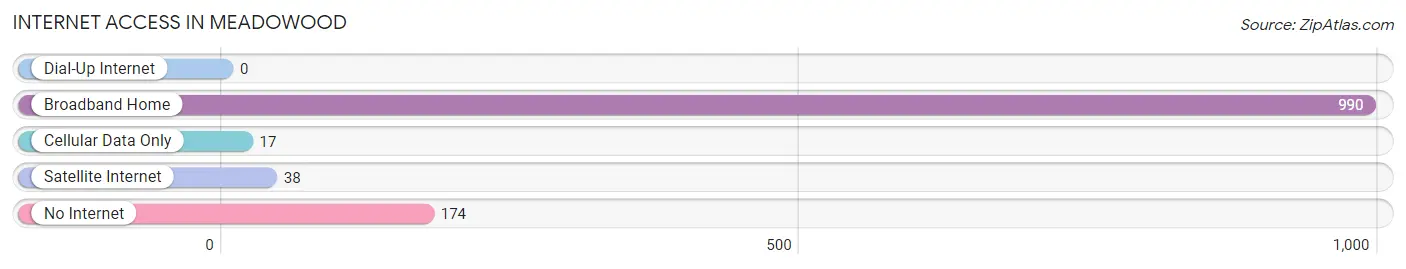
| Internet Type | # Households | % Households |
| Dial-Up Internet | 0 | 0.0% |
| Broadband Home | 990 | 82.0% |
| Cellular Data Only | 17 | 1.4% |
| Satellite Internet | 38 | 3.2% |
| No Internet | 174 | 14.4% |
| Total | 1,207 | 100.0% |
Meadowood Summary
Meadowood is a small borough located in Allegheny County, Pennsylvania. It is situated in the western part of the county, approximately 15 miles northwest of the city of Pittsburgh. The borough is bordered by the boroughs of Rosslyn Farms and Ingram, as well as the townships of Robinson and Kennedy. As of the 2010 census, the population of Meadowood was 1,845.
History
Meadowood was first settled in the late 1700s by a group of German immigrants. The area was originally known as “Meadow Wood”, and was part of the larger Robinson Township. In 1872, the area was incorporated as a borough, and the name was changed to Meadowood.
The borough was primarily an agricultural community until the early 1900s, when the area began to experience rapid growth due to the development of the steel industry in Pittsburgh. This growth was further accelerated by the construction of the Pennsylvania Railroad in the late 1800s, which provided easy access to the city.
Geography
Meadowood is located at 40°27'N 79°59'W (40.45, -79.98). According to the United States Census Bureau, the borough has a total area of 0.7 square miles (1.8 km2), all of which is land.
The borough is situated in the western part of Allegheny County, approximately 15 miles northwest of the city of Pittsburgh. It is bordered by the boroughs of Rosslyn Farms and Ingram, as well as the townships of Robinson and Kennedy.
Economy
Meadowood’s economy is largely based on the service industry. The borough is home to a variety of small businesses, including restaurants, retail stores, and professional services. The borough also has a number of industrial and manufacturing businesses, including a steel mill and a paper mill.
Demographics
As of the 2010 census, there were 1,845 people, 745 households, and 486 families residing in the borough. The population density was 2,637.3 people per square mile (1,017.2/km2). There were 809 housing units at an average density of 1,148.3 per square mile (443.2/km2). The racial makeup of the borough was 94.2% White, 2.7% African American, 0.2% Native American, 0.7% Asian, 0.1% Pacific Islander, 0.7% from other races, and 1.4% from two or more races. Hispanic or Latino of any race were 1.7% of the population.
There were 745 households, out of which 28.2% had children under the age of 18 living with them, 44.2% were married couples living together, 13.7% had a female householder with no husband present, and 36.2% were non-families. 30.2% of all households were made up of individuals, and 11.2% had someone living alone who was 65 years of age or older. The average household size was 2.47 and the average family size was 3.09.
In the borough, the population was spread out, with 24.2% under the age of 18, 8.2% from 18 to 24, 30.2% from 25 to 44, 22.7% from 45 to 64, and 14.7% who were 65 years of age or older. The median age was 37 years. For every 100 females, there were 94.2 males. For every 100 females age 18 and over, there were 91.2 males.
The median income for a household in the borough was $37,917, and the median income for a family was $45,000. Males had a median income of $35,000 versus $25,000 for females. The per capita income for the borough was $18,945. About 6.2% of families and 8.2% of the population were below the poverty line, including 10.2% of those under age 18 and 8.2% of those age 65 or over.
Common Questions
What is Per Capita Income in Meadowood?
Per Capita income in Meadowood is $36,370.
What is the Median Family Income in Meadowood?
Median Family Income in Meadowood is $100,844.
What is the Median Household income in Meadowood?
Median Household Income in Meadowood is $87,627.
What is Income or Wage Gap in Meadowood?
Income or Wage Gap in Meadowood is 54.9%.
Women in Meadowood earn 45.1 cents for every dollar earned by a man.
What is Inequality or Gini Index in Meadowood?
Inequality or Gini Index in Meadowood is 0.34.
What is the Total Population of Meadowood?
Total Population of Meadowood is 2,936.
What is the Total Male Population of Meadowood?
Total Male Population of Meadowood is 1,606.
What is the Total Female Population of Meadowood?
Total Female Population of Meadowood is 1,330.
What is the Ratio of Males per 100 Females in Meadowood?
There are 120.75 Males per 100 Females in Meadowood.
What is the Ratio of Females per 100 Males in Meadowood?
There are 82.81 Females per 100 Males in Meadowood.
What is the Median Population Age in Meadowood?
Median Population Age in Meadowood is 52.3 Years.
What is the Average Family Size in Meadowood
Average Family Size in Meadowood is 2.8 People.
What is the Average Household Size in Meadowood
Average Household Size in Meadowood is 2.2 People.
How Large is the Labor Force in Meadowood?
There are 1,486 People in the Labor Forcein in Meadowood.
What is the Percentage of People in the Labor Force in Meadowood?
57.5% of People are in the Labor Force in Meadowood.
What is the Unemployment Rate in Meadowood?
Unemployment Rate in Meadowood is 5.9%.