Mount Holly Springs borough, PA Map & Demographics
Mount Holly Springs borough Overview
$34,331
PER CAPITA INCOME
$76,364
AVG FAMILY INCOME
$65,972
AVG HOUSEHOLD INCOME
33.2%
WAGE / INCOME GAP [ % ]
66.8¢/ $1
WAGE / INCOME GAP [ $ ]
0.48
INEQUALITY / GINI INDEX
2,325
TOTAL POPULATION
1,246
MALE POPULATION
1,079
FEMALE POPULATION
115.48
MALES / 100 FEMALES
86.60
FEMALES / 100 MALES
41.3
MEDIAN AGE
3.2
AVG FAMILY SIZE
2.6
AVG HOUSEHOLD SIZE
1,189
LABOR FORCE [ PEOPLE ]
59.4%
PERCENT IN LABOR FORCE
6.2%
UNEMPLOYMENT RATE
Income in Mount Holly Springs borough
Income Overview in Mount Holly Springs borough
Per Capita Income in Mount Holly Springs borough is $34,331, while median incomes of families and households are $76,364 and $65,972 respectively.
| Characteristic | Number | Measure |
| Per Capita Income | 2,325 | $34,331 |
| Median Family Income | 538 | $76,364 |
| Mean Family Income | 538 | $91,188 |
| Median Household Income | 898 | $65,972 |
| Mean Household Income | 898 | $85,784 |
| Income Deficit | 538 | $0 |
| Wage / Income Gap (%) | 2,325 | 33.20% |
| Wage / Income Gap ($) | 2,325 | 66.80¢ per $1 |
| Gini / Inequality Index | 2,325 | 0.48 |
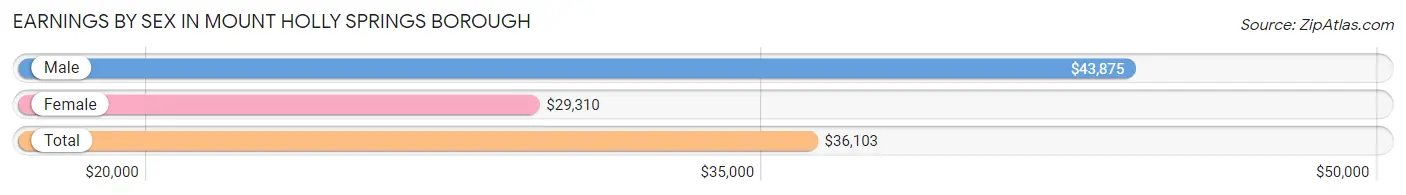
Earnings by Sex in Mount Holly Springs borough
Average Earnings in Mount Holly Springs borough are $36,103, $43,875 for men and $29,310 for women, a difference of 33.2%.
| Sex | Number | Average Earnings |
| Male | 718 (54.4%) | $43,875 |
| Female | 602 (45.6%) | $29,310 |
| Total | 1,320 (100.0%) | $36,103 |
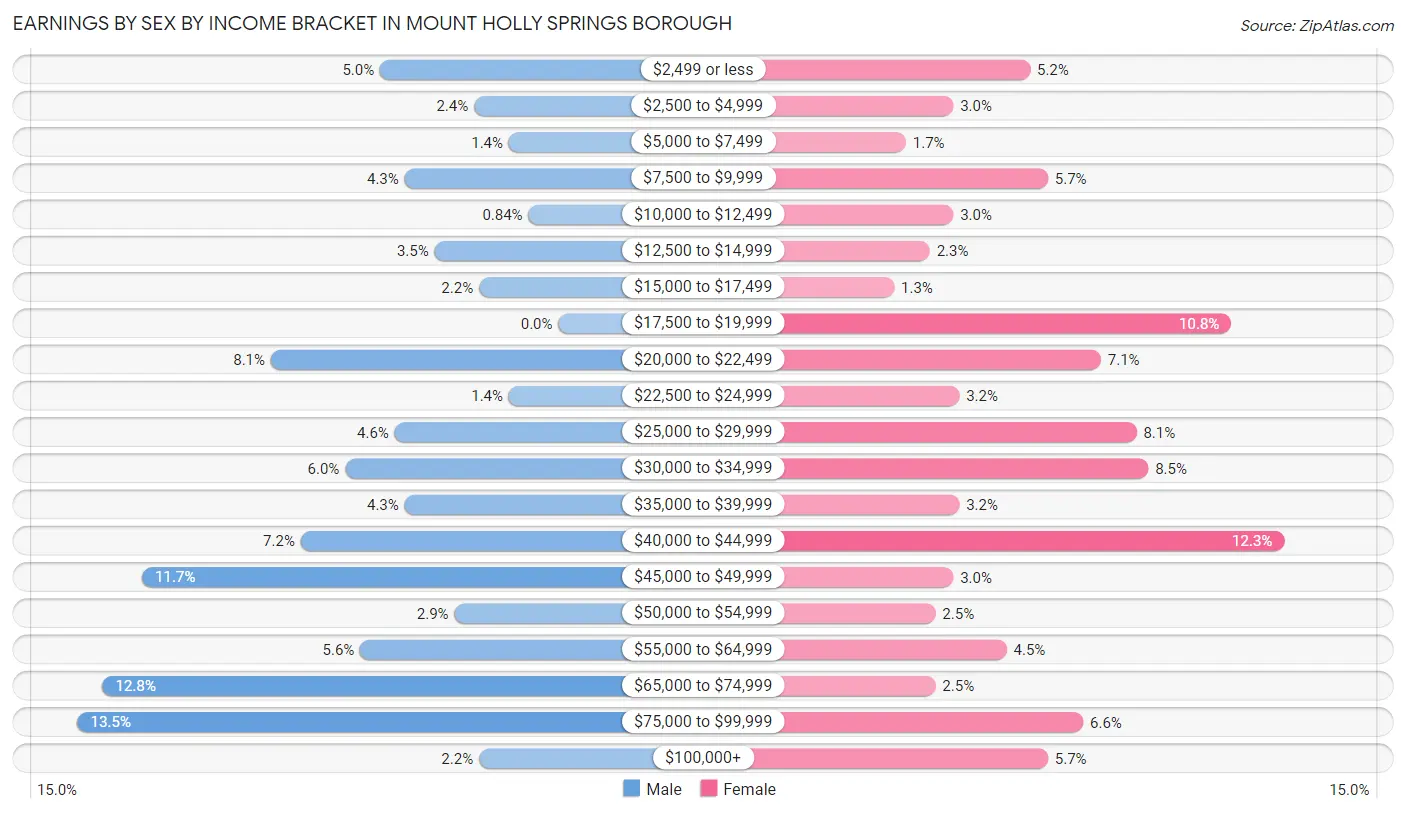
Earnings by Sex by Income Bracket in Mount Holly Springs borough
The most common earnings brackets in Mount Holly Springs borough are $75,000 to $99,999 for men (97 | 13.5%) and $40,000 to $44,999 for women (74 | 12.3%).
| Income | Male | Female |
| $2,499 or less | 36 (5.0%) | 31 (5.1%) |
| $2,500 to $4,999 | 17 (2.4%) | 18 (3.0%) |
| $5,000 to $7,499 | 10 (1.4%) | 10 (1.7%) |
| $7,500 to $9,999 | 31 (4.3%) | 34 (5.7%) |
| $10,000 to $12,499 | 6 (0.8%) | 18 (3.0%) |
| $12,500 to $14,999 | 25 (3.5%) | 14 (2.3%) |
| $15,000 to $17,499 | 16 (2.2%) | 8 (1.3%) |
| $17,500 to $19,999 | 0 (0.0%) | 65 (10.8%) |
| $20,000 to $22,499 | 58 (8.1%) | 43 (7.1%) |
| $22,500 to $24,999 | 10 (1.4%) | 19 (3.2%) |
| $25,000 to $29,999 | 33 (4.6%) | 49 (8.1%) |
| $30,000 to $34,999 | 43 (6.0%) | 51 (8.5%) |
| $35,000 to $39,999 | 31 (4.3%) | 19 (3.2%) |
| $40,000 to $44,999 | 52 (7.2%) | 74 (12.3%) |
| $45,000 to $49,999 | 84 (11.7%) | 18 (3.0%) |
| $50,000 to $54,999 | 21 (2.9%) | 15 (2.5%) |
| $55,000 to $64,999 | 40 (5.6%) | 27 (4.5%) |
| $65,000 to $74,999 | 92 (12.8%) | 15 (2.5%) |
| $75,000 to $99,999 | 97 (13.5%) | 40 (6.6%) |
| $100,000+ | 16 (2.2%) | 34 (5.7%) |
| Total | 718 (100.0%) | 602 (100.0%) |
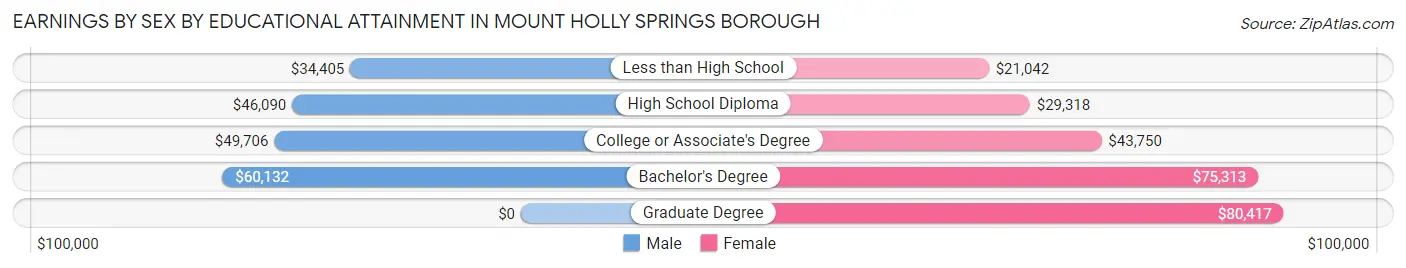
Earnings by Sex by Educational Attainment in Mount Holly Springs borough
Average earnings in Mount Holly Springs borough are $47,750 for men and $33,060 for women, a difference of 30.8%. Men with an educational attainment of bachelor's degree enjoy the highest average annual earnings of $60,132, while those with less than high school education earn the least with $34,405. Women with an educational attainment of graduate degree earn the most with the average annual earnings of $80,417, while those with less than high school education have the smallest earnings of $21,042.
| Educational Attainment | Male Income | Female Income |
| Less than High School | $34,405 | $21,042 |
| High School Diploma | $46,090 | $29,318 |
| College or Associate's Degree | $49,706 | $43,750 |
| Bachelor's Degree | $60,132 | $75,313 |
| Graduate Degree | - | - |
| Total | $47,750 | $33,060 |
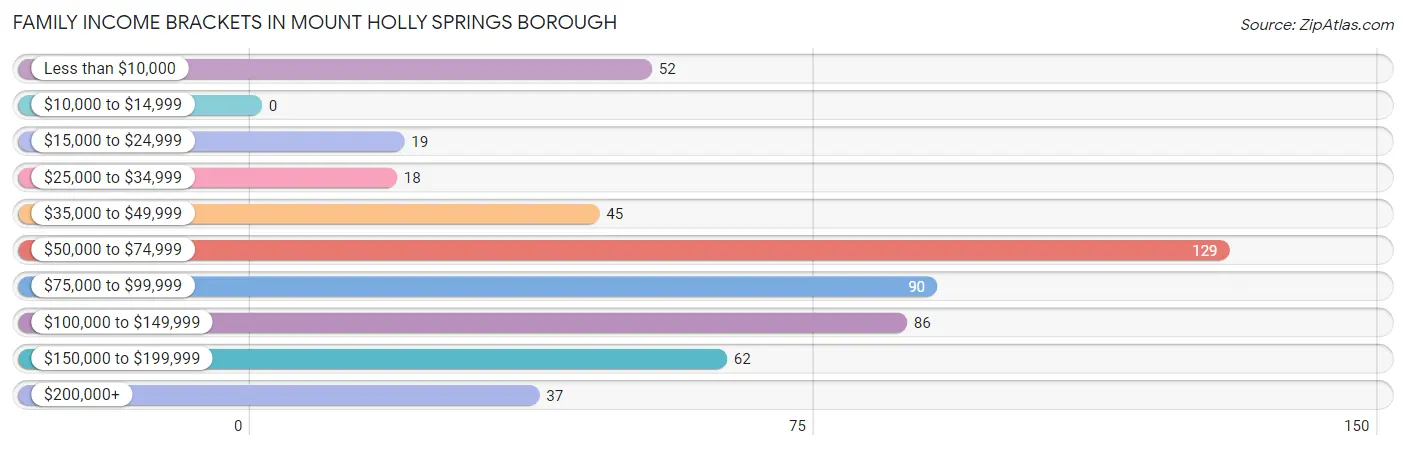
Family Income in Mount Holly Springs borough
Family Income Brackets in Mount Holly Springs borough
According to the Mount Holly Springs borough family income data, there are 129 families falling into the $50,000 to $74,999 income range, which is the most common income bracket and makes up 24.0% of all families.
| Income Bracket | # Families | % Families |
| Less than $10,000 | 52 | 9.7% |
| $10,000 to $14,999 | 0 | 0.0% |
| $15,000 to $24,999 | 19 | 3.5% |
| $25,000 to $34,999 | 18 | 3.3% |
| $35,000 to $49,999 | 45 | 8.4% |
| $50,000 to $74,999 | 129 | 24.0% |
| $75,000 to $99,999 | 90 | 16.7% |
| $100,000 to $149,999 | 86 | 16.0% |
| $150,000 to $199,999 | 62 | 11.5% |
| $200,000+ | 37 | 6.9% |
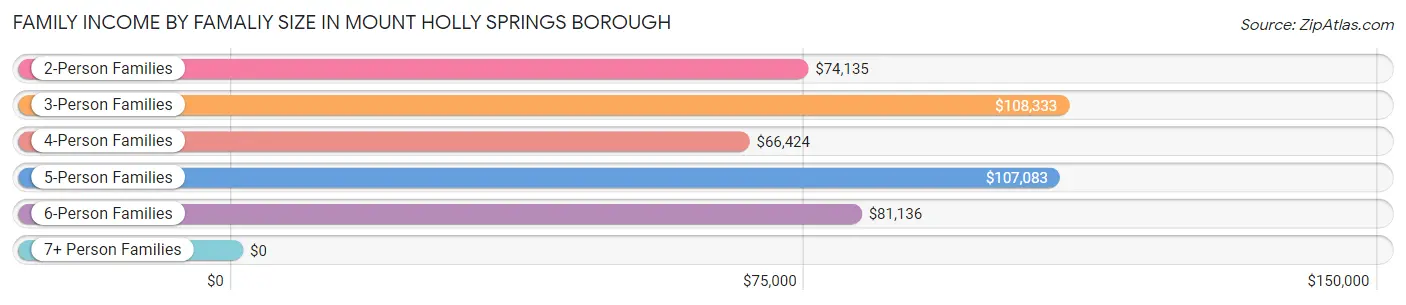
Family Income by Famaliy Size in Mount Holly Springs borough
3-person families (132 | 24.5%) account for the highest median family income in Mount Holly Springs borough with $108,333 per family, while 2-person families (265 | 49.3%) have the highest median income of $37,068 per family member.
| Income Bracket | # Families | Median Income |
| 2-Person Families | 265 (49.3%) | $74,135 |
| 3-Person Families | 132 (24.5%) | $108,333 |
| 4-Person Families | 101 (18.8%) | $66,424 |
| 5-Person Families | 24 (4.5%) | $107,083 |
| 6-Person Families | 16 (3.0%) | $81,136 |
| 7+ Person Families | 0 (0.0%) | $0 |
| Total | 538 (100.0%) | $76,364 |
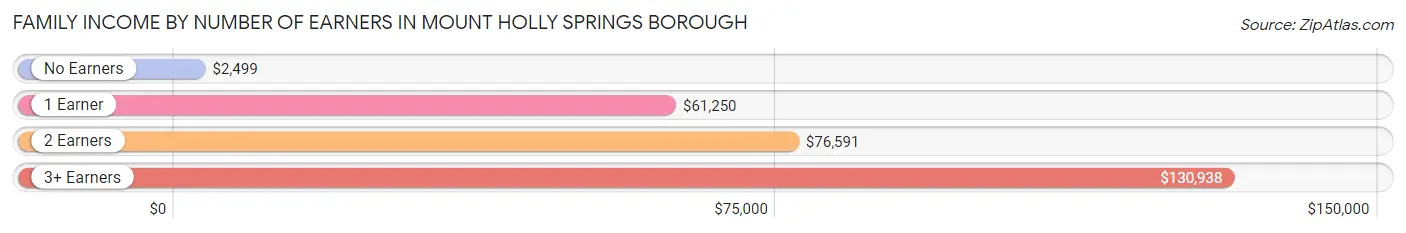
Family Income by Number of Earners in Mount Holly Springs borough
The median family income in Mount Holly Springs borough is $76,364, with families comprising 3+ earners (81) having the highest median family income of $130,938, while families with no earners (75) have the lowest median family income of $2,499, accounting for 15.1% and 13.9% of families, respectively.
| Number of Earners | # Families | Median Income |
| No Earners | 75 (13.9%) | $2,499 |
| 1 Earner | 156 (29.0%) | $61,250 |
| 2 Earners | 226 (42.0%) | $76,591 |
| 3+ Earners | 81 (15.1%) | $130,938 |
| Total | 538 (100.0%) | $76,364 |
Household Income in Mount Holly Springs borough
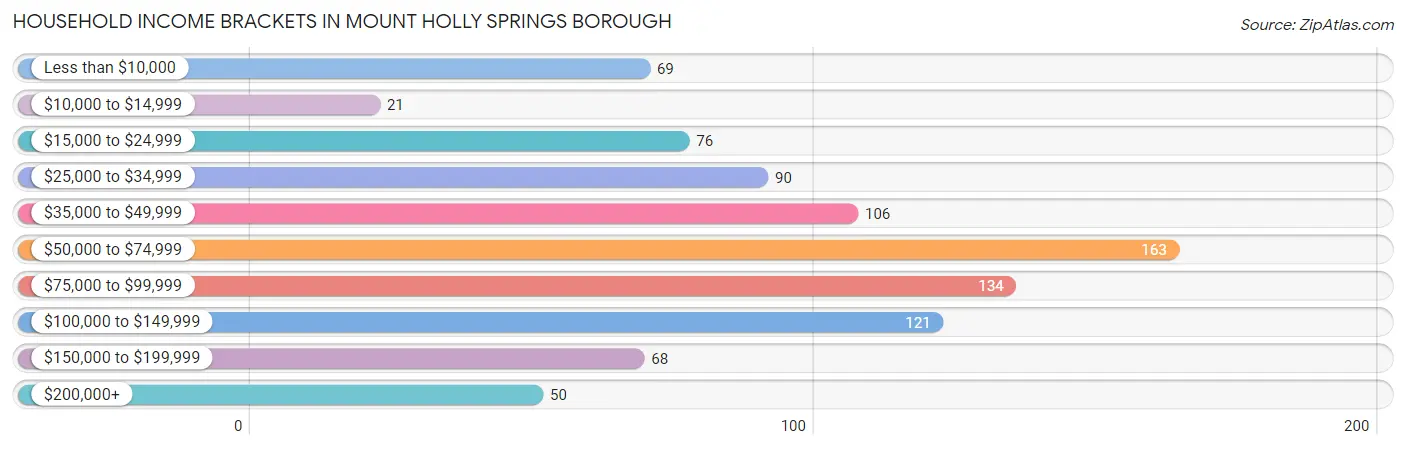
Household Income Brackets in Mount Holly Springs borough
With 163 households falling in the category, the $50,000 to $74,999 income range is the most frequent in Mount Holly Springs borough, accounting for 18.1% of all households. In contrast, only 21 households (2.3%) fall into the $10,000 to $14,999 income bracket, making it the least populous group.
| Income Bracket | # Households | % Households |
| Less than $10,000 | 69 | 7.7% |
| $10,000 to $14,999 | 21 | 2.3% |
| $15,000 to $24,999 | 76 | 8.5% |
| $25,000 to $34,999 | 90 | 10.0% |
| $35,000 to $49,999 | 106 | 11.8% |
| $50,000 to $74,999 | 163 | 18.2% |
| $75,000 to $99,999 | 134 | 14.9% |
| $100,000 to $149,999 | 121 | 13.5% |
| $150,000 to $199,999 | 68 | 7.6% |
| $200,000+ | 50 | 5.6% |
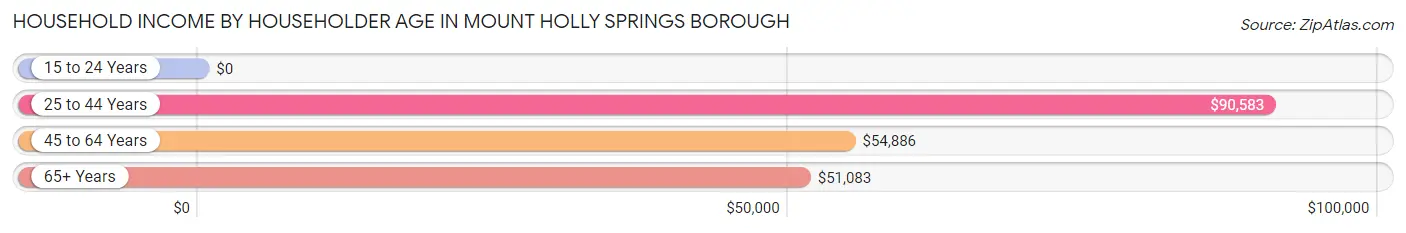
Household Income by Householder Age in Mount Holly Springs borough
The median household income in Mount Holly Springs borough is $65,972, with the highest median household income of $90,583 found in the 25 to 44 years age bracket for the primary householder. A total of 189 households (21.0%) fall into this category. Meanwhile, the 15 to 24 years age bracket for the primary householder has the lowest median household income of $0, with 64 households (7.1%) in this group.
| Income Bracket | # Households | Median Income |
| 15 to 24 Years | 64 (7.1%) | $0 |
| 25 to 44 Years | 189 (21.0%) | $90,583 |
| 45 to 64 Years | 453 (50.4%) | $54,886 |
| 65+ Years | 192 (21.4%) | $51,083 |
| Total | 898 (100.0%) | $65,972 |
Poverty in Mount Holly Springs borough
Income Below Poverty by Sex and Age in Mount Holly Springs borough
With 7.8% poverty level for males and 15.5% for females among the residents of Mount Holly Springs borough, 15 year old males and 45 to 54 year old females are the most vulnerable to poverty, with 60 males (75.0%) and 85 females (34.8%) in their respective age groups living below the poverty level.
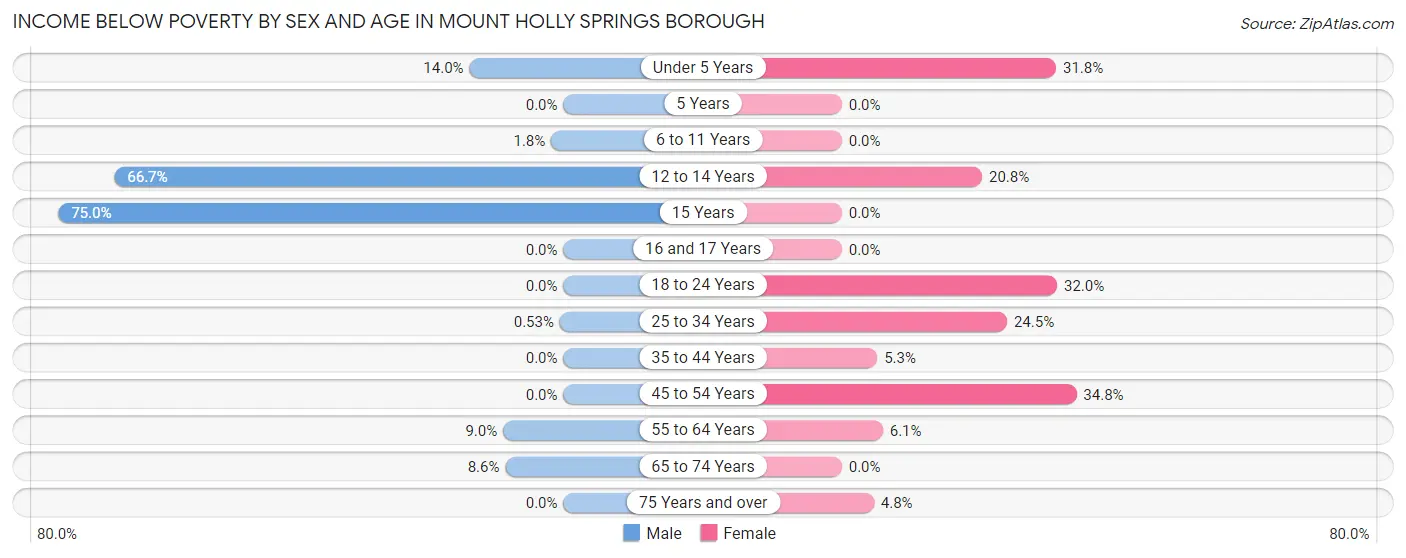
| Age Bracket | Male | Female |
| Under 5 Years | 6 (14.0%) | 7 (31.8%) |
| 5 Years | 0 (0.0%) | 0 (0.0%) |
| 6 to 11 Years | 1 (1.8%) | 0 (0.0%) |
| 12 to 14 Years | 6 (66.7%) | 5 (20.8%) |
| 15 Years | 60 (75.0%) | 0 (0.0%) |
| 16 and 17 Years | 0 (0.0%) | 0 (0.0%) |
| 18 to 24 Years | 0 (0.0%) | 31 (32.0%) |
| 25 to 34 Years | 2 (0.5%) | 13 (24.5%) |
| 35 to 44 Years | 0 (0.0%) | 5 (5.3%) |
| 45 to 54 Years | 0 (0.0%) | 85 (34.8%) |
| 55 to 64 Years | 17 (8.9%) | 14 (6.1%) |
| 65 to 74 Years | 5 (8.6%) | 0 (0.0%) |
| 75 Years and over | 0 (0.0%) | 5 (4.8%) |
| Total | 97 (7.8%) | 165 (15.5%) |
Income Above Poverty by Sex and Age in Mount Holly Springs borough
According to the poverty statistics in Mount Holly Springs borough, males aged 5 years and females aged 5 years are the age groups that are most secure financially, with 100.0% of males and 100.0% of females in these age groups living above the poverty line.
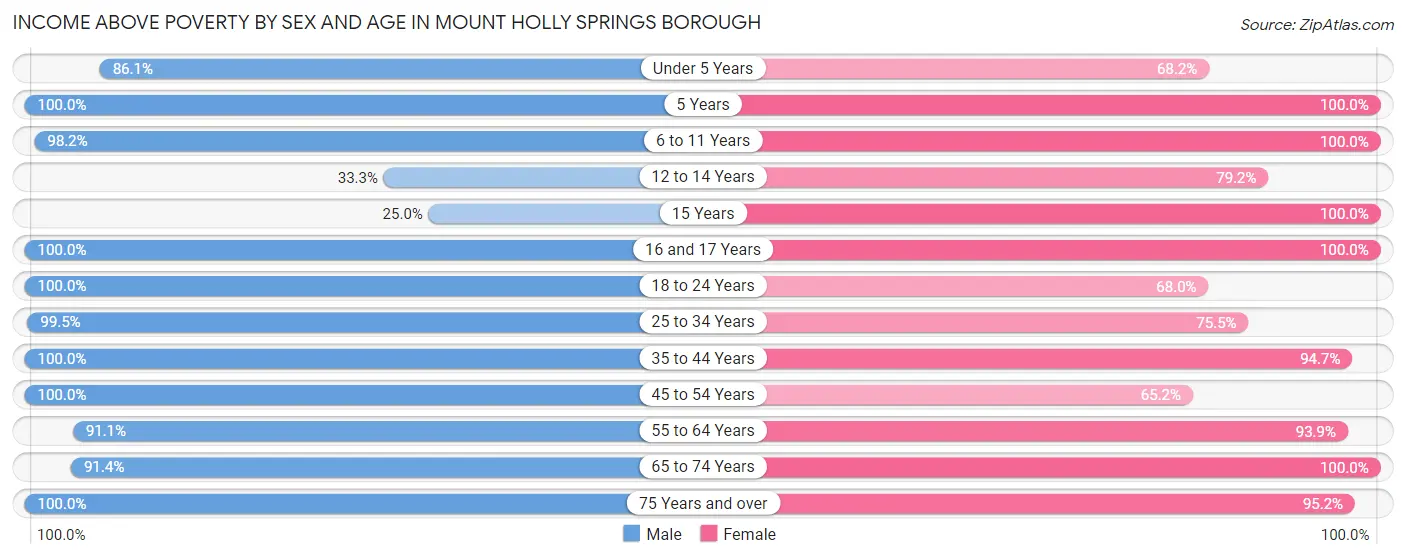
| Age Bracket | Male | Female |
| Under 5 Years | 37 (86.1%) | 15 (68.2%) |
| 5 Years | 1 (100.0%) | 10 (100.0%) |
| 6 to 11 Years | 54 (98.2%) | 58 (100.0%) |
| 12 to 14 Years | 3 (33.3%) | 19 (79.2%) |
| 15 Years | 20 (25.0%) | 4 (100.0%) |
| 16 and 17 Years | 30 (100.0%) | 22 (100.0%) |
| 18 to 24 Years | 123 (100.0%) | 66 (68.0%) |
| 25 to 34 Years | 372 (99.5%) | 40 (75.5%) |
| 35 to 44 Years | 112 (100.0%) | 90 (94.7%) |
| 45 to 54 Years | 91 (100.0%) | 159 (65.2%) |
| 55 to 64 Years | 173 (91.0%) | 216 (93.9%) |
| 65 to 74 Years | 53 (91.4%) | 98 (100.0%) |
| 75 Years and over | 80 (100.0%) | 100 (95.2%) |
| Total | 1,149 (92.2%) | 897 (84.5%) |
Income Below Poverty Among Married-Couple Families in Mount Holly Springs borough
The poverty statistics for married-couple families in Mount Holly Springs borough show that 0.7% or 2 of the total 302 families live below the poverty line. Families with 3 or 4 children have the highest poverty rate of 8.3%, comprising of 2 families. On the other hand, families with no children have the lowest poverty rate of 0.0%, which includes 0 families.

| Children | Above Poverty | Below Poverty |
| No Children | 235 (100.0%) | 0 (0.0%) |
| 1 or 2 Children | 43 (100.0%) | 0 (0.0%) |
| 3 or 4 Children | 22 (91.7%) | 2 (8.3%) |
| 5 or more Children | 0 (0.0%) | 0 (0.0%) |
| Total | 300 (99.3%) | 2 (0.7%) |
Income Below Poverty Among Single-Parent Households in Mount Holly Springs borough
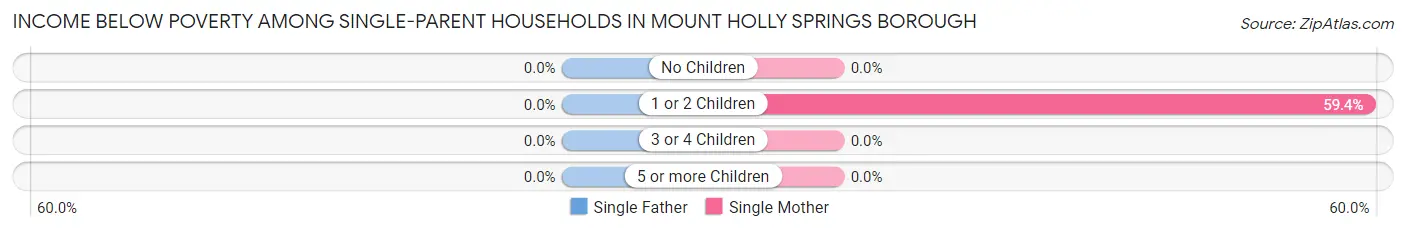
| Children | Single Father | Single Mother |
| No Children | 0 (0.0%) | 0 (0.0%) |
| 1 or 2 Children | 0 (0.0%) | 60 (59.4%) |
| 3 or 4 Children | 0 (0.0%) | 0 (0.0%) |
| 5 or more Children | 0 (0.0%) | 0 (0.0%) |
| Total | 0 (0.0%) | 60 (38.7%) |
Income Below Poverty Among Married-Couple vs Single-Parent Households in Mount Holly Springs borough
The poverty data for Mount Holly Springs borough shows that 2 of the married-couple family households (0.7%) and 60 of the single-parent households (25.4%) are living below the poverty level. Within the married-couple family households, those with 3 or 4 children have the highest poverty rate, with 2 households (8.3%) falling below the poverty line. Among the single-parent households, those with 1 or 2 children have the highest poverty rate, with 60 household (49.2%) living below poverty.
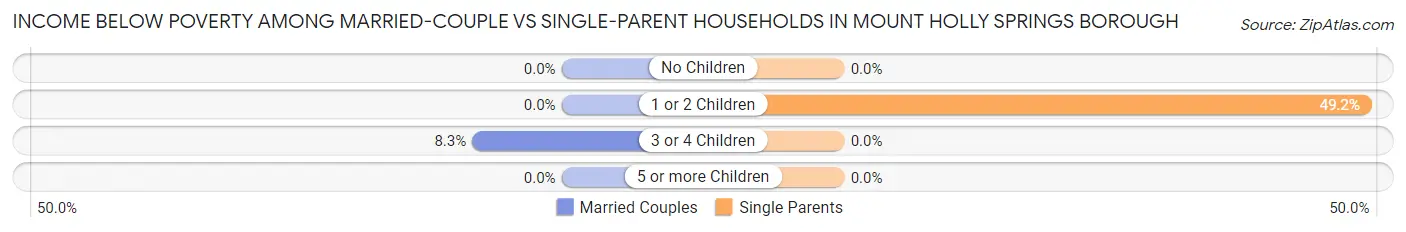
| Children | Married-Couple Families | Single-Parent Households |
| No Children | 0 (0.0%) | 0 (0.0%) |
| 1 or 2 Children | 0 (0.0%) | 60 (49.2%) |
| 3 or 4 Children | 2 (8.3%) | 0 (0.0%) |
| 5 or more Children | 0 (0.0%) | 0 (0.0%) |
| Total | 2 (0.7%) | 60 (25.4%) |
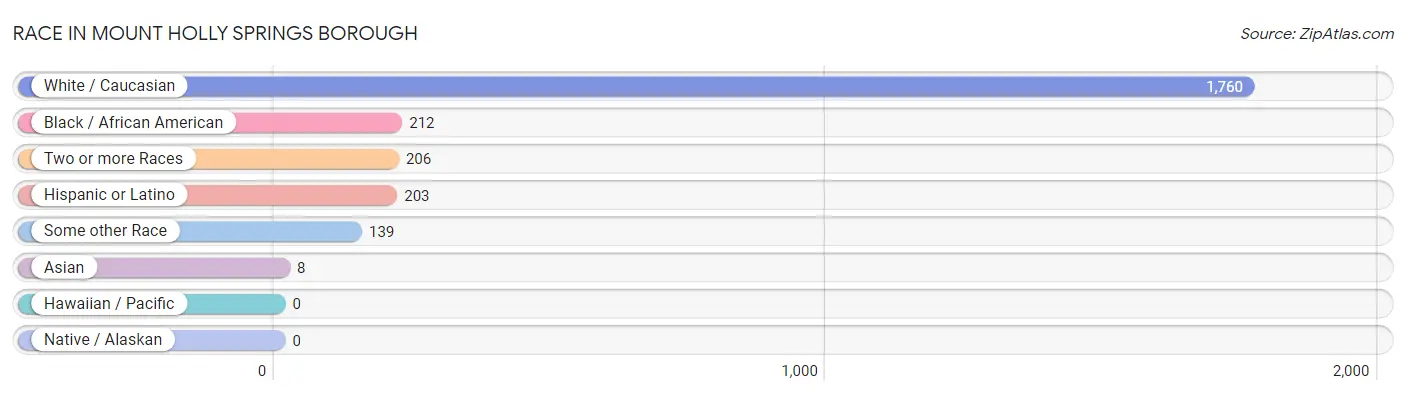
Race in Mount Holly Springs borough
The most populous races in Mount Holly Springs borough are White / Caucasian (1,760 | 75.7%), Black / African American (212 | 9.1%), and Two or more Races (206 | 8.9%).
| Race | # Population | % Population |
| Asian | 8 | 0.3% |
| Black / African American | 212 | 9.1% |
| Hawaiian / Pacific | 0 | 0.0% |
| Hispanic or Latino | 203 | 8.7% |
| Native / Alaskan | 0 | 0.0% |
| White / Caucasian | 1,760 | 75.7% |
| Two or more Races | 206 | 8.9% |
| Some other Race | 139 | 6.0% |
| Total | 2,325 | 100.0% |
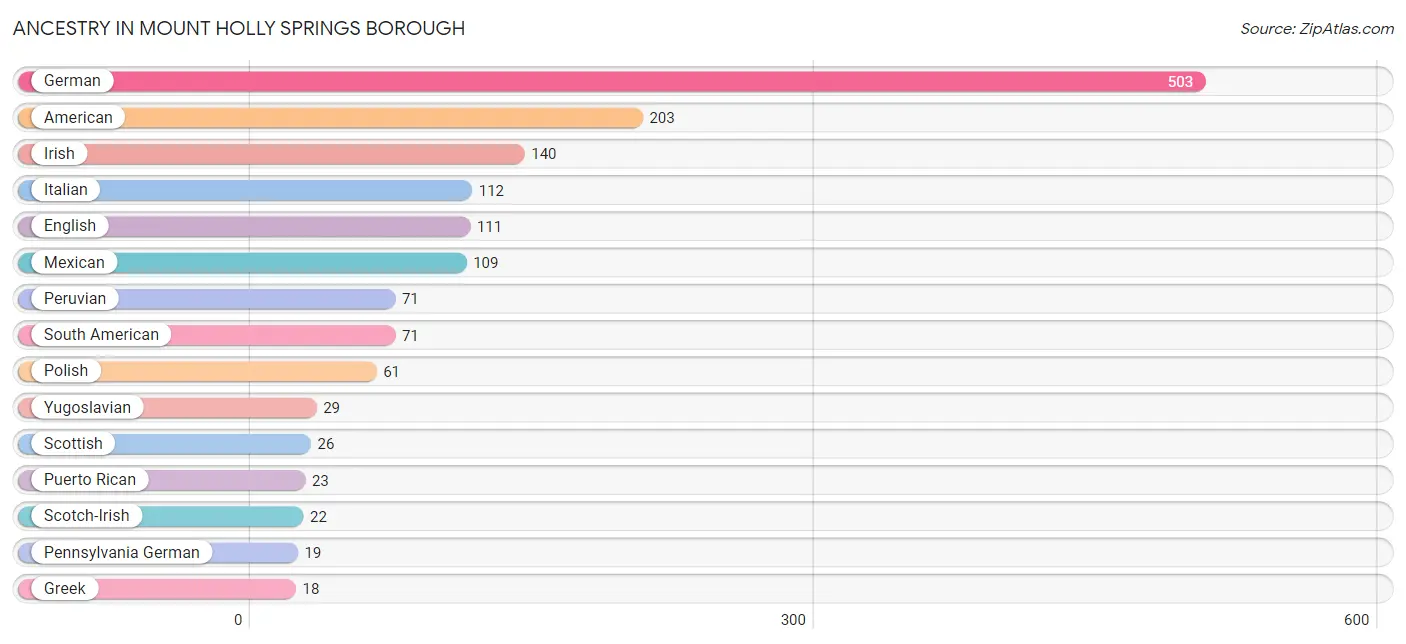
Ancestry in Mount Holly Springs borough
The most populous ancestries reported in Mount Holly Springs borough are German (503 | 21.6%), American (203 | 8.7%), Irish (140 | 6.0%), Italian (112 | 4.8%), and English (111 | 4.8%), together accounting for 46.0% of all Mount Holly Springs borough residents.
| Ancestry | # Population | % Population |
| American | 203 | 8.7% |
| Austrian | 9 | 0.4% |
| Bhutanese | 6 | 0.3% |
| British | 8 | 0.3% |
| Burmese | 9 | 0.4% |
| Danish | 4 | 0.2% |
| Dutch | 16 | 0.7% |
| Eastern European | 2 | 0.1% |
| English | 111 | 4.8% |
| French | 9 | 0.4% |
| French Canadian | 7 | 0.3% |
| German | 503 | 21.6% |
| Greek | 18 | 0.8% |
| Irish | 140 | 6.0% |
| Italian | 112 | 4.8% |
| Jamaican | 14 | 0.6% |
| Korean | 6 | 0.3% |
| Mexican | 109 | 4.7% |
| Pennsylvania German | 19 | 0.8% |
| Peruvian | 71 | 3.0% |
| Polish | 61 | 2.6% |
| Puerto Rican | 23 | 1.0% |
| Romanian | 10 | 0.4% |
| Russian | 5 | 0.2% |
| Scotch-Irish | 22 | 0.9% |
| Scottish | 26 | 1.1% |
| South American | 71 | 3.0% |
| Thai | 2 | 0.1% |
| Welsh | 8 | 0.3% |
| Yugoslavian | 29 | 1.3% | View All 30 Rows |
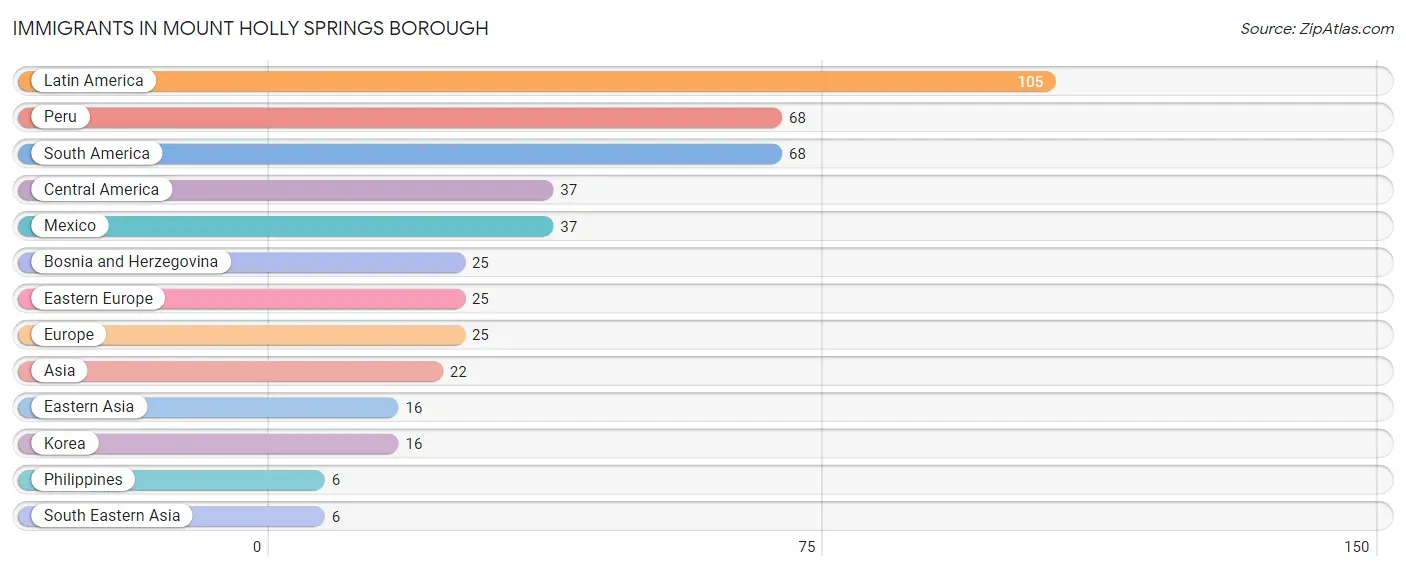
Immigrants in Mount Holly Springs borough
The most numerous immigrant groups reported in Mount Holly Springs borough came from Latin America (105 | 4.5%), Peru (68 | 2.9%), South America (68 | 2.9%), Central America (37 | 1.6%), and Mexico (37 | 1.6%), together accounting for 13.5% of all Mount Holly Springs borough residents.
| Immigration Origin | # Population | % Population |
| Asia | 22 | 0.9% |
| Bosnia and Herzegovina | 25 | 1.1% |
| Central America | 37 | 1.6% |
| Eastern Asia | 16 | 0.7% |
| Eastern Europe | 25 | 1.1% |
| Europe | 25 | 1.1% |
| Korea | 16 | 0.7% |
| Latin America | 105 | 4.5% |
| Mexico | 37 | 1.6% |
| Peru | 68 | 2.9% |
| Philippines | 6 | 0.3% |
| South America | 68 | 2.9% |
| South Eastern Asia | 6 | 0.3% | View All 13 Rows |
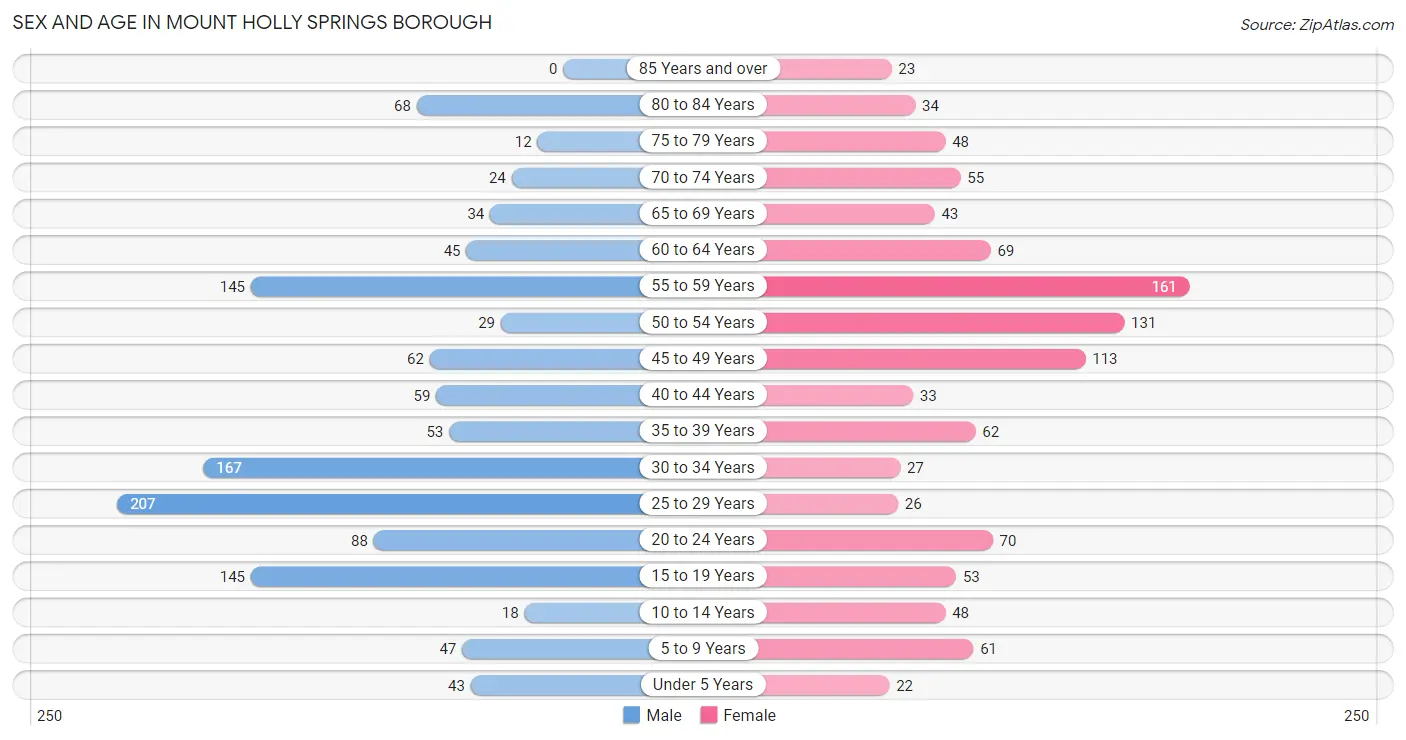
Sex and Age in Mount Holly Springs borough
Sex and Age in Mount Holly Springs borough
The most populous age groups in Mount Holly Springs borough are 25 to 29 Years (207 | 16.6%) for men and 55 to 59 Years (161 | 14.9%) for women.
| Age Bracket | Male | Female |
| Under 5 Years | 43 (3.5%) | 22 (2.0%) |
| 5 to 9 Years | 47 (3.8%) | 61 (5.7%) |
| 10 to 14 Years | 18 (1.4%) | 48 (4.4%) |
| 15 to 19 Years | 145 (11.6%) | 53 (4.9%) |
| 20 to 24 Years | 88 (7.1%) | 70 (6.5%) |
| 25 to 29 Years | 207 (16.6%) | 26 (2.4%) |
| 30 to 34 Years | 167 (13.4%) | 27 (2.5%) |
| 35 to 39 Years | 53 (4.3%) | 62 (5.8%) |
| 40 to 44 Years | 59 (4.7%) | 33 (3.1%) |
| 45 to 49 Years | 62 (5.0%) | 113 (10.5%) |
| 50 to 54 Years | 29 (2.3%) | 131 (12.1%) |
| 55 to 59 Years | 145 (11.6%) | 161 (14.9%) |
| 60 to 64 Years | 45 (3.6%) | 69 (6.4%) |
| 65 to 69 Years | 34 (2.7%) | 43 (4.0%) |
| 70 to 74 Years | 24 (1.9%) | 55 (5.1%) |
| 75 to 79 Years | 12 (1.0%) | 48 (4.4%) |
| 80 to 84 Years | 68 (5.5%) | 34 (3.2%) |
| 85 Years and over | 0 (0.0%) | 23 (2.1%) |
| Total | 1,246 (100.0%) | 1,079 (100.0%) |
Families and Households in Mount Holly Springs borough
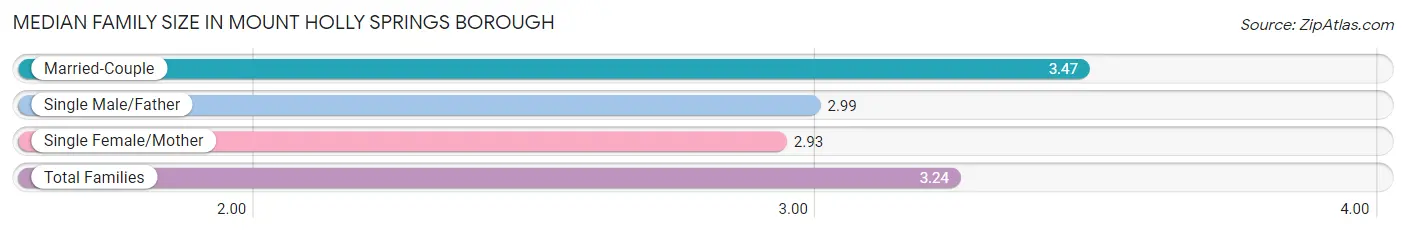
Median Family Size in Mount Holly Springs borough
The median family size in Mount Holly Springs borough is 3.24 persons per family, with married-couple families (302 | 56.1%) accounting for the largest median family size of 3.47 persons per family. On the other hand, single female/mother families (155 | 28.8%) represent the smallest median family size with 2.93 persons per family.
| Family Type | # Families | Family Size |
| Married-Couple | 302 (56.1%) | 3.47 |
| Single Male/Father | 81 (15.1%) | 2.99 |
| Single Female/Mother | 155 (28.8%) | 2.93 |
| Total Families | 538 (100.0%) | 3.24 |
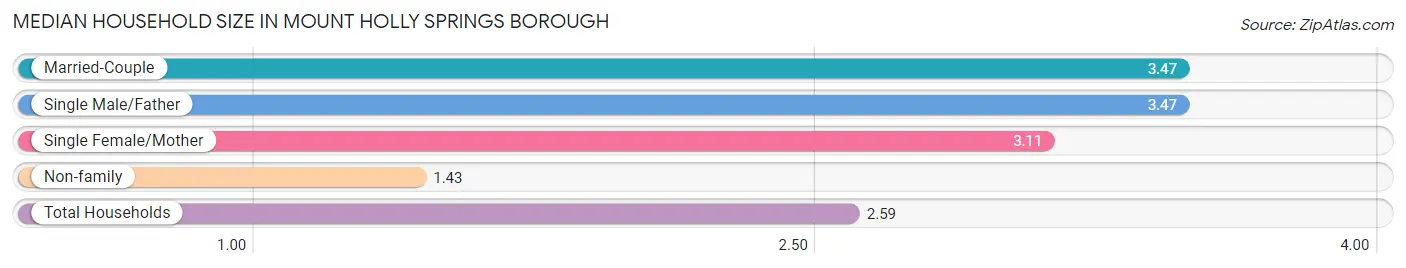
Median Household Size in Mount Holly Springs borough
The median household size in Mount Holly Springs borough is 2.59 persons per household, with married-couple households (302 | 33.6%) accounting for the largest median household size of 3.47 persons per household. non-family households (360 | 40.1%) represent the smallest median household size with 1.43 persons per household.
| Household Type | # Households | Household Size |
| Married-Couple | 302 (33.6%) | 3.47 |
| Single Male/Father | 81 (9.0%) | 3.47 |
| Single Female/Mother | 155 (17.3%) | 3.11 |
| Non-family | 360 (40.1%) | 1.43 |
| Total Households | 898 (100.0%) | 2.59 |
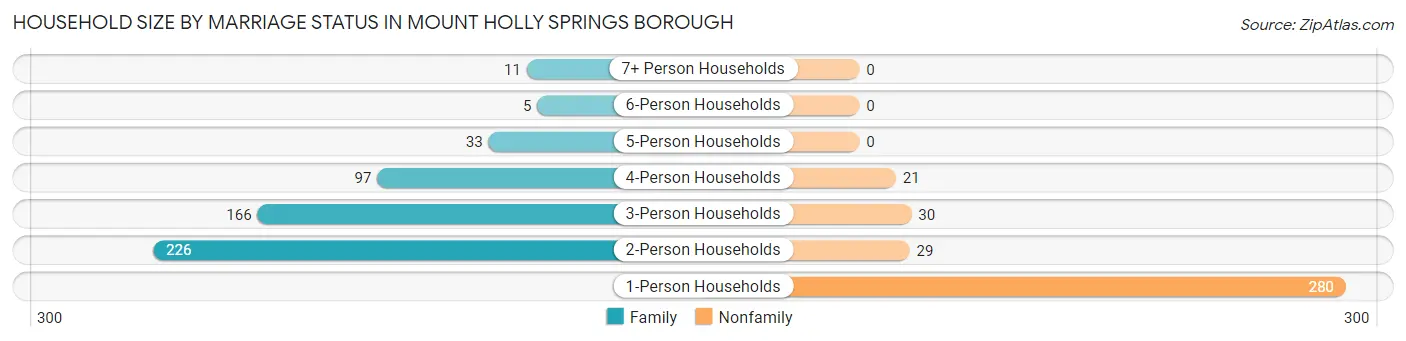
Household Size by Marriage Status in Mount Holly Springs borough
Out of a total of 898 households in Mount Holly Springs borough, 538 (59.9%) are family households, while 360 (40.1%) are nonfamily households. The most numerous type of family households are 2-person households, comprising 226, and the most common type of nonfamily households are 1-person households, comprising 280.
| Household Size | Family Households | Nonfamily Households |
| 1-Person Households | - | 280 (31.2%) |
| 2-Person Households | 226 (25.2%) | 29 (3.2%) |
| 3-Person Households | 166 (18.5%) | 30 (3.3%) |
| 4-Person Households | 97 (10.8%) | 21 (2.3%) |
| 5-Person Households | 33 (3.7%) | 0 (0.0%) |
| 6-Person Households | 5 (0.6%) | 0 (0.0%) |
| 7+ Person Households | 11 (1.2%) | 0 (0.0%) |
| Total | 538 (59.9%) | 360 (40.1%) |
Female Fertility in Mount Holly Springs borough
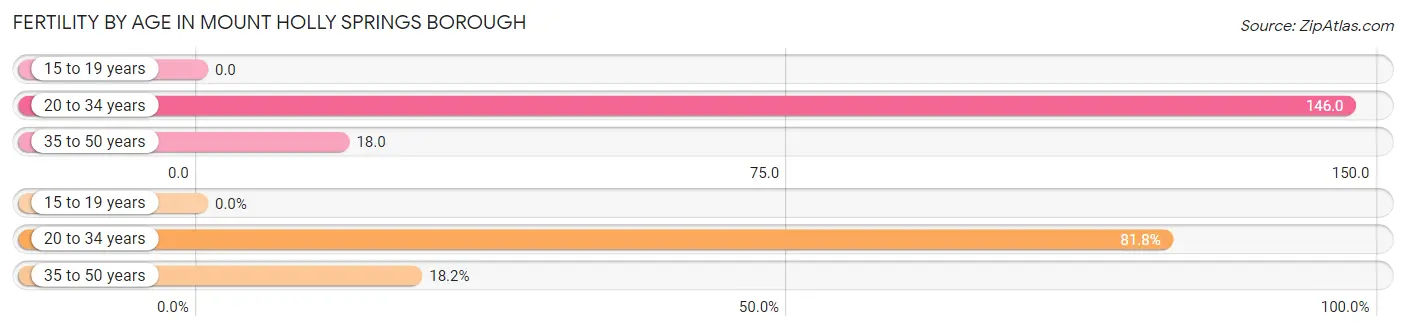
Fertility by Age in Mount Holly Springs borough
Average fertility rate in Mount Holly Springs borough is 55.0 births per 1,000 women. Women in the age bracket of 20 to 34 years have the highest fertility rate with 146.0 births per 1,000 women. Women in the age bracket of 20 to 34 years acount for 81.8% of all women with births.
| Age Bracket | Women with Births | Births / 1,000 Women |
| 15 to 19 years | 0 (0.0%) | 0.0 |
| 20 to 34 years | 18 (81.8%) | 146.0 |
| 35 to 50 years | 4 (18.2%) | 18.0 |
| Total | 22 (100.0%) | 55.0 |
Fertility by Age by Marriage Status in Mount Holly Springs borough
36.4% of women with births (22) in Mount Holly Springs borough are married. The highest percentage of unmarried women with births falls into 20 to 34 years age bracket with 77.8% of them unmarried at the time of birth, while the lowest percentage of unmarried women with births belong to 35 to 50 years age bracket with 0.0% of them unmarried.
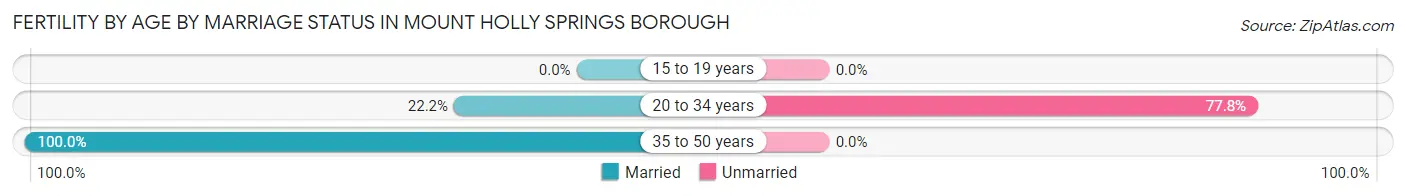
| Age Bracket | Married | Unmarried |
| 15 to 19 years | 0 (0.0%) | 0 (0.0%) |
| 20 to 34 years | 4 (22.2%) | 14 (77.8%) |
| 35 to 50 years | 4 (100.0%) | 0 (0.0%) |
| Total | 8 (36.4%) | 14 (63.6%) |
Fertility by Education in Mount Holly Springs borough
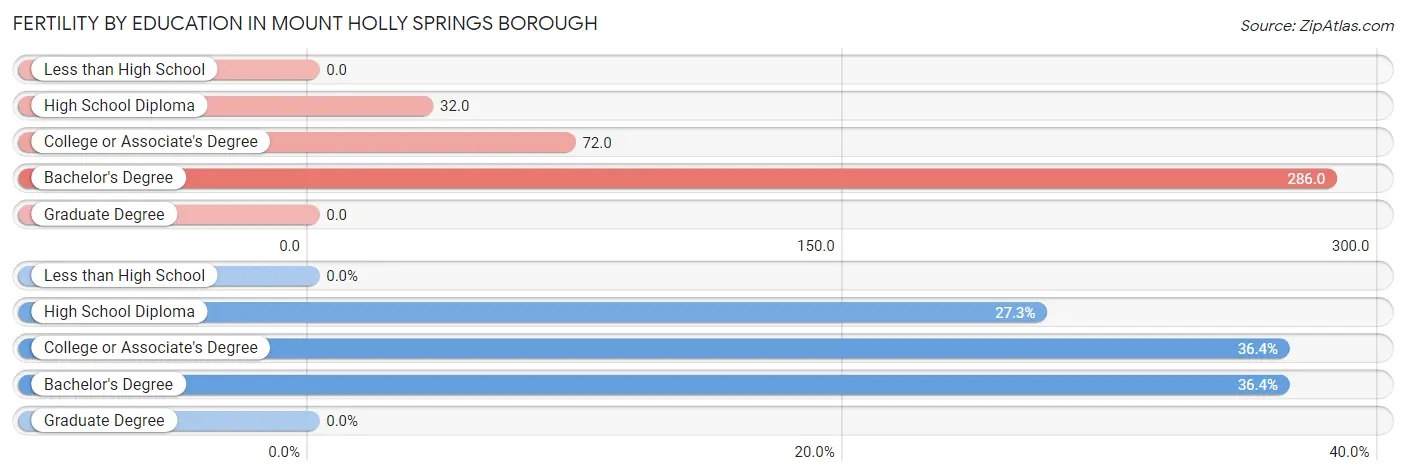
| Educational Attainment | Women with Births | Births / 1,000 Women |
| Less than High School | 0 (0.0%) | 0.0 |
| High School Diploma | 6 (27.3%) | 32.0 |
| College or Associate's Degree | 8 (36.4%) | 72.0 |
| Bachelor's Degree | 8 (36.4%) | 286.0 |
| Graduate Degree | 0 (0.0%) | 0.0 |
| Total | 22 (100.0%) | 55.0 |
Fertility by Education by Marriage Status in Mount Holly Springs borough
63.6% of women with births in Mount Holly Springs borough are unmarried. Women with the educational attainment of college or associate's degree are most likely to be married with 100.0% of them married at childbirth, while women with the educational attainment of high school diploma are least likely to be married with 100.0% of them unmarried at childbirth.
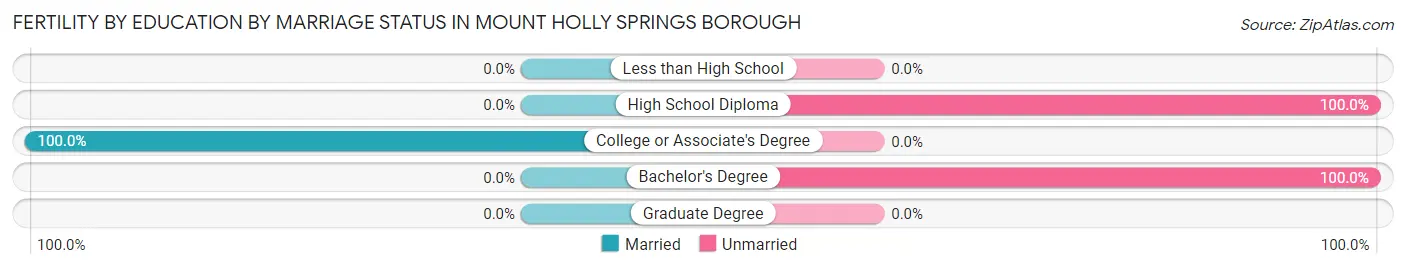
| Educational Attainment | Married | Unmarried |
| Less than High School | 0 (0.0%) | 0 (0.0%) |
| High School Diploma | 0 (0.0%) | 6 (100.0%) |
| College or Associate's Degree | 8 (100.0%) | 0 (0.0%) |
| Bachelor's Degree | 0 (0.0%) | 8 (100.0%) |
| Graduate Degree | 0 (0.0%) | 0 (0.0%) |
| Total | 8 (36.4%) | 14 (63.6%) |
Employment Characteristics in Mount Holly Springs borough
Employment by Class of Employer in Mount Holly Springs borough
Among the 1,082 employed individuals in Mount Holly Springs borough, private company employees (822 | 76.0%), not-for-profit organizations (118 | 10.9%), and local government employees (71 | 6.6%) make up the most common classes of employment.
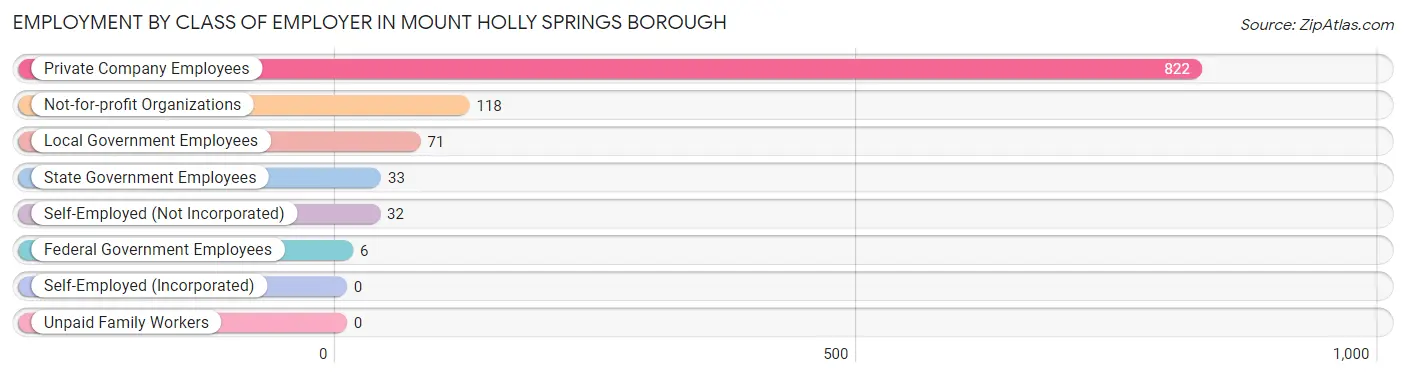
| Employer Class | # Employees | % Employees |
| Private Company Employees | 822 | 76.0% |
| Self-Employed (Incorporated) | 0 | 0.0% |
| Self-Employed (Not Incorporated) | 32 | 3.0% |
| Not-for-profit Organizations | 118 | 10.9% |
| Local Government Employees | 71 | 6.6% |
| State Government Employees | 33 | 3.0% |
| Federal Government Employees | 6 | 0.5% |
| Unpaid Family Workers | 0 | 0.0% |
| Total | 1,082 | 100.0% |
Employment Status by Age in Mount Holly Springs borough
According to the labor force statistics for Mount Holly Springs borough, out of the total population over 16 years of age (2,002), 59.4% or 1,189 individuals are in the labor force, with 6.2% or 74 of them unemployed. The age group with the highest labor force participation rate is 20 to 24 years, with 91.8% or 145 individuals in the labor force. Within the labor force, the 55 to 59 years age range has the highest percentage of unemployed individuals, with 15.8% or 39 of them being unemployed.
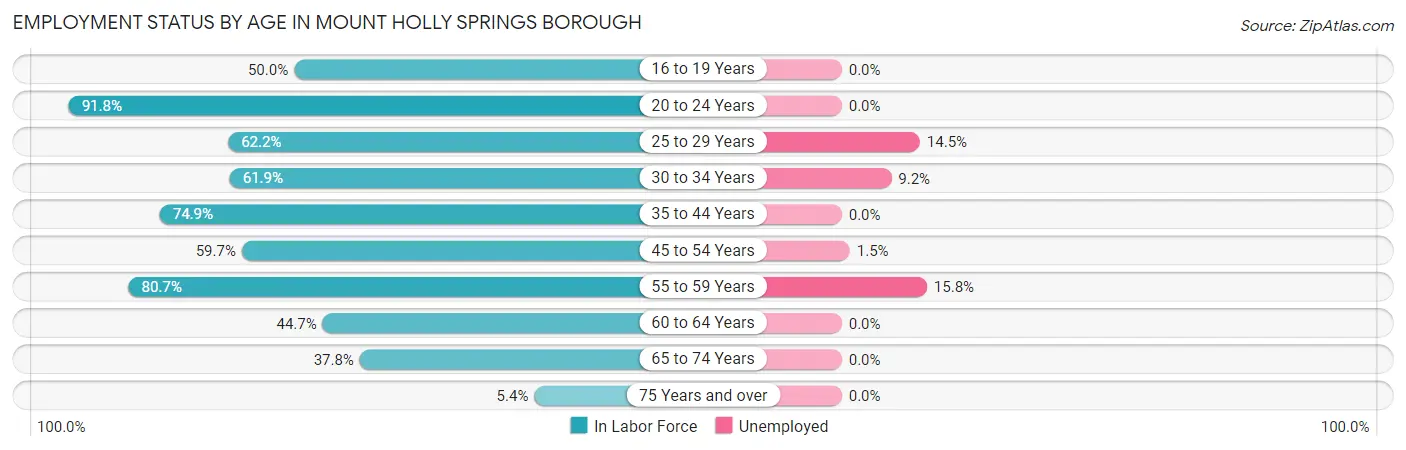
| Age Bracket | In Labor Force | Unemployed |
| 16 to 19 Years | 57 (50.0%) | 0 (0.0%) |
| 20 to 24 Years | 145 (91.8%) | 0 (0.0%) |
| 25 to 29 Years | 145 (62.2%) | 21 (14.5%) |
| 30 to 34 Years | 120 (61.9%) | 11 (9.2%) |
| 35 to 44 Years | 155 (74.9%) | 0 (0.0%) |
| 45 to 54 Years | 200 (59.7%) | 3 (1.5%) |
| 55 to 59 Years | 247 (80.7%) | 39 (15.8%) |
| 60 to 64 Years | 51 (44.7%) | 0 (0.0%) |
| 65 to 74 Years | 59 (37.8%) | 0 (0.0%) |
| 75 Years and over | 10 (5.4%) | 0 (0.0%) |
| Total | 1,189 (59.4%) | 74 (6.2%) |
Employment Status by Educational Attainment in Mount Holly Springs borough
According to labor force statistics for Mount Holly Springs borough, 66.1% of individuals (918) out of the total population between 25 and 64 years of age (1,389) are in the labor force, with 8.1% or 74 of them being unemployed. The group with the highest labor force participation rate are those with the educational attainment of bachelor's degree or higher, with 92.5% or 149 individuals in the labor force. Within the labor force, individuals with less than high school education have the highest percentage of unemployment, with 18.3% or 11 of them being unemployed.
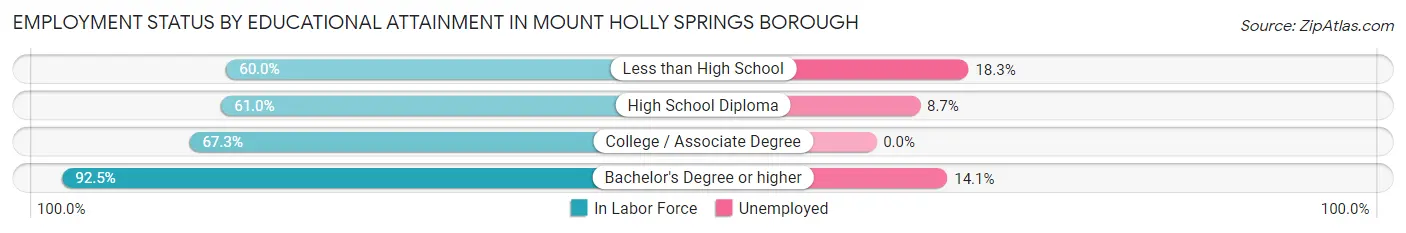
| Educational Attainment | In Labor Force | Unemployed |
| Less than High School | 60 (60.0%) | 18 (18.3%) |
| High School Diploma | 485 (61.0%) | 69 (8.7%) |
| College / Associate Degree | 224 (67.3%) | 0 (0.0%) |
| Bachelor's Degree or higher | 149 (92.5%) | 23 (14.1%) |
| Total | 918 (66.1%) | 113 (8.1%) |
Employment Occupations by Sex in Mount Holly Springs borough
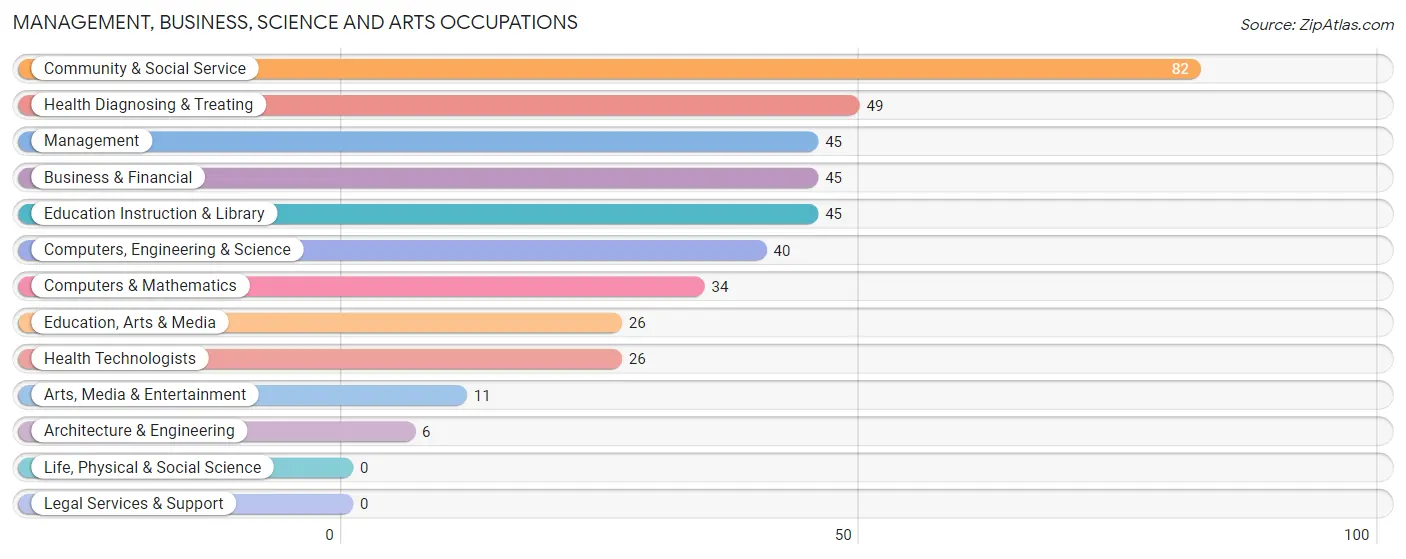
Management, Business, Science and Arts Occupations
The most common Management, Business, Science and Arts occupations in Mount Holly Springs borough are Community & Social Service (82 | 7.3%), Health Diagnosing & Treating (49 | 4.4%), Management (45 | 4.0%), Business & Financial (45 | 4.0%), and Education Instruction & Library (45 | 4.0%).
Management, Business, Science and Arts Occupations by Sex
Within the Management, Business, Science and Arts occupations in Mount Holly Springs borough, the most male-oriented occupations are Computers, Engineering & Science (100.0%), Computers & Mathematics (100.0%), and Architecture & Engineering (100.0%), while the most female-oriented occupations are Health Diagnosing & Treating (100.0%), Health Technologists (100.0%), and Management (62.2%).
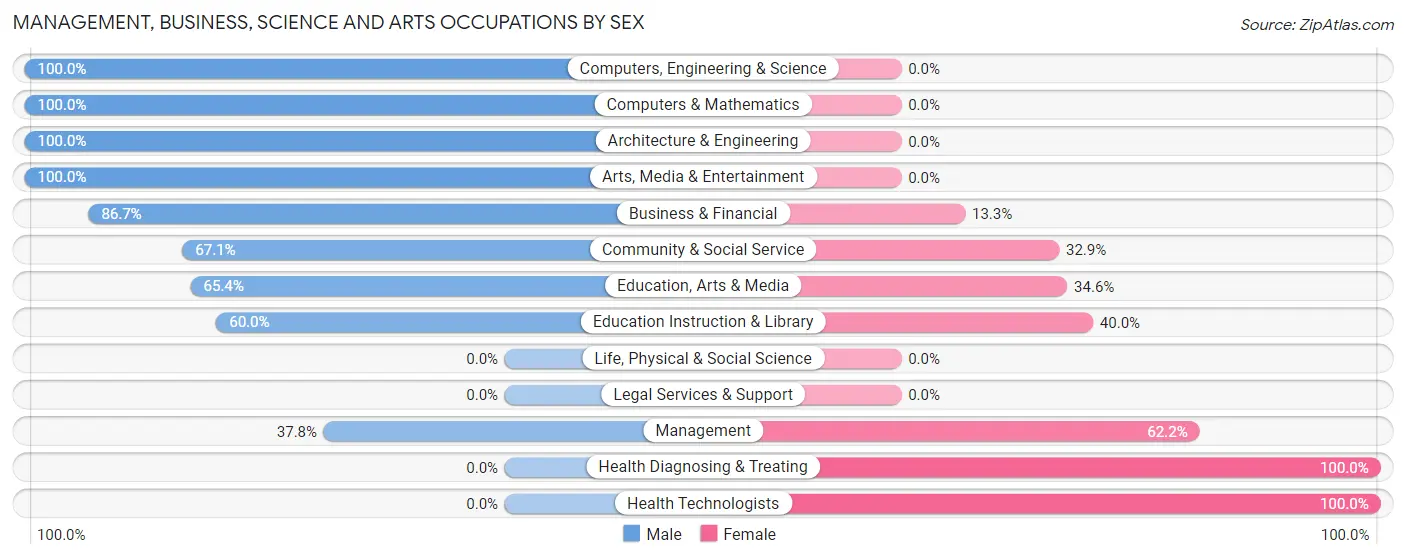
| Occupation | Male | Female |
| Management | 17 (37.8%) | 28 (62.2%) |
| Business & Financial | 39 (86.7%) | 6 (13.3%) |
| Computers, Engineering & Science | 40 (100.0%) | 0 (0.0%) |
| Computers & Mathematics | 34 (100.0%) | 0 (0.0%) |
| Architecture & Engineering | 6 (100.0%) | 0 (0.0%) |
| Life, Physical & Social Science | 0 (0.0%) | 0 (0.0%) |
| Community & Social Service | 55 (67.1%) | 27 (32.9%) |
| Education, Arts & Media | 17 (65.4%) | 9 (34.6%) |
| Legal Services & Support | 0 (0.0%) | 0 (0.0%) |
| Education Instruction & Library | 27 (60.0%) | 18 (40.0%) |
| Arts, Media & Entertainment | 11 (100.0%) | 0 (0.0%) |
| Health Diagnosing & Treating | 0 (0.0%) | 49 (100.0%) |
| Health Technologists | 0 (0.0%) | 26 (100.0%) |
| Total (Category) | 151 (57.9%) | 110 (42.1%) |
| Total (Overall) | 654 (58.7%) | 461 (41.3%) |
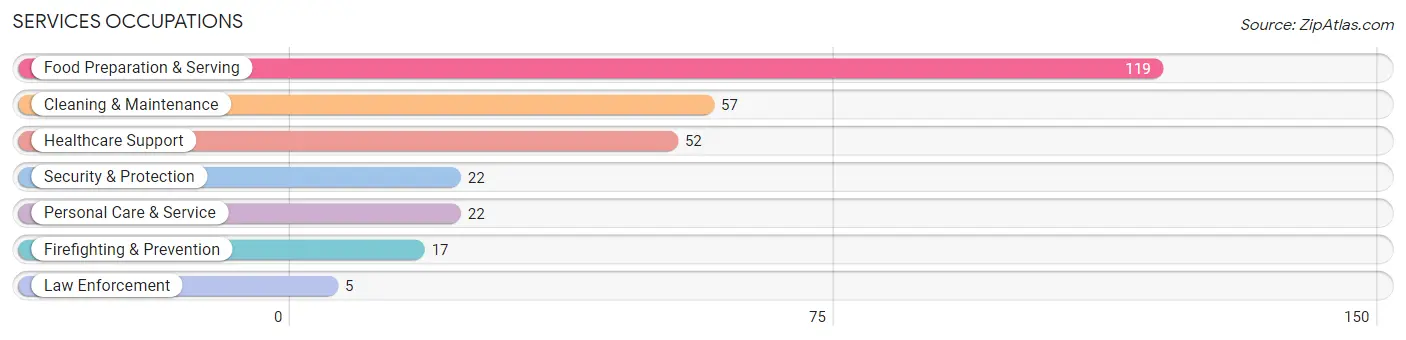
Services Occupations
The most common Services occupations in Mount Holly Springs borough are Food Preparation & Serving (119 | 10.7%), Cleaning & Maintenance (57 | 5.1%), Healthcare Support (52 | 4.7%), Security & Protection (22 | 2.0%), and Personal Care & Service (22 | 2.0%).
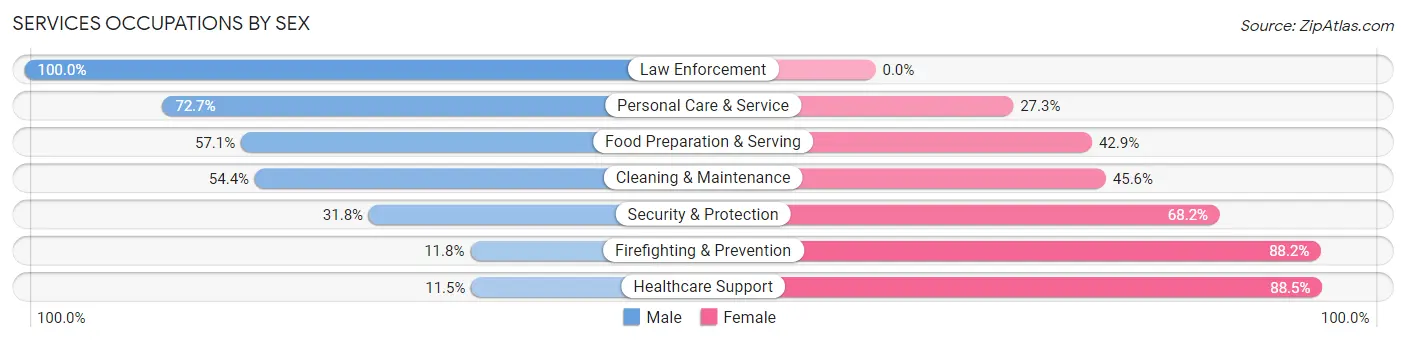
Services Occupations by Sex
Within the Services occupations in Mount Holly Springs borough, the most male-oriented occupations are Law Enforcement (100.0%), Personal Care & Service (72.7%), and Food Preparation & Serving (57.1%), while the most female-oriented occupations are Healthcare Support (88.5%), Firefighting & Prevention (88.2%), and Security & Protection (68.2%).
| Occupation | Male | Female |
| Healthcare Support | 6 (11.5%) | 46 (88.5%) |
| Security & Protection | 7 (31.8%) | 15 (68.2%) |
| Firefighting & Prevention | 2 (11.8%) | 15 (88.2%) |
| Law Enforcement | 5 (100.0%) | 0 (0.0%) |
| Food Preparation & Serving | 68 (57.1%) | 51 (42.9%) |
| Cleaning & Maintenance | 31 (54.4%) | 26 (45.6%) |
| Personal Care & Service | 16 (72.7%) | 6 (27.3%) |
| Total (Category) | 128 (47.1%) | 144 (52.9%) |
| Total (Overall) | 654 (58.7%) | 461 (41.3%) |
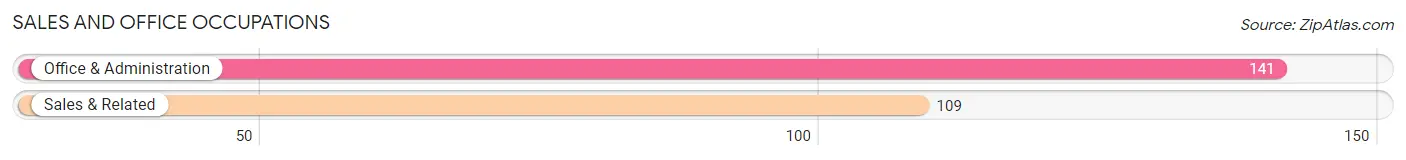
Sales and Office Occupations
The most common Sales and Office occupations in Mount Holly Springs borough are Office & Administration (141 | 12.7%), and Sales & Related (109 | 9.8%).
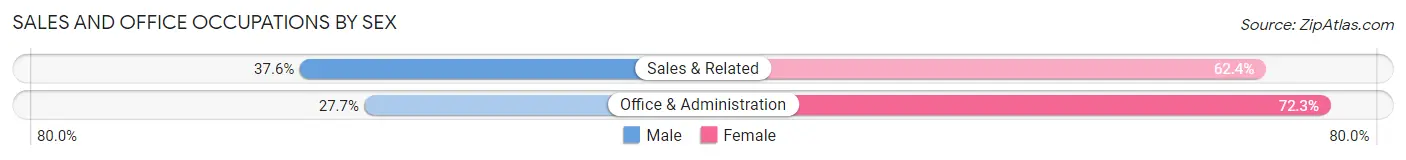
Sales and Office Occupations by Sex
| Occupation | Male | Female |
| Sales & Related | 41 (37.6%) | 68 (62.4%) |
| Office & Administration | 39 (27.7%) | 102 (72.3%) |
| Total (Category) | 80 (32.0%) | 170 (68.0%) |
| Total (Overall) | 654 (58.7%) | 461 (41.3%) |
Natural Resources, Construction and Maintenance Occupations
The most common Natural Resources, Construction and Maintenance occupations in Mount Holly Springs borough are Construction & Extraction (93 | 8.3%), and Installation, Maintenance & Repair (22 | 2.0%).
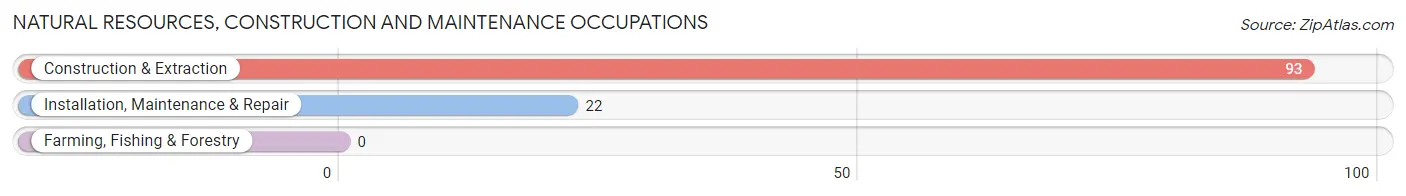
Natural Resources, Construction and Maintenance Occupations by Sex
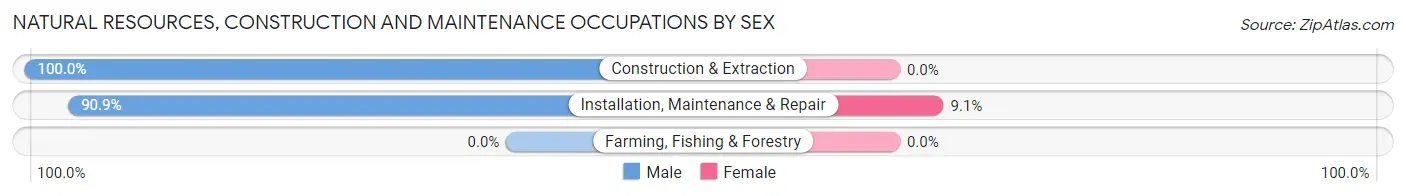
| Occupation | Male | Female |
| Farming, Fishing & Forestry | 0 (0.0%) | 0 (0.0%) |
| Construction & Extraction | 93 (100.0%) | 0 (0.0%) |
| Installation, Maintenance & Repair | 20 (90.9%) | 2 (9.1%) |
| Total (Category) | 113 (98.3%) | 2 (1.7%) |
| Total (Overall) | 654 (58.7%) | 461 (41.3%) |
Production, Transportation and Moving Occupations
The most common Production, Transportation and Moving occupations in Mount Holly Springs borough are Material Moving (157 | 14.1%), Production (47 | 4.2%), and Transportation (13 | 1.2%).
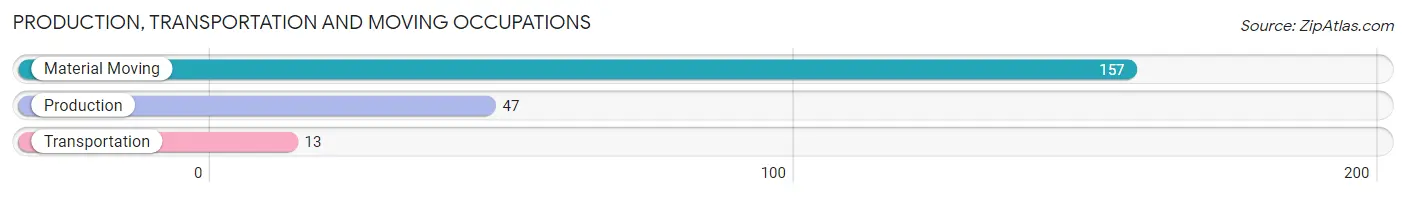
Production, Transportation and Moving Occupations by Sex
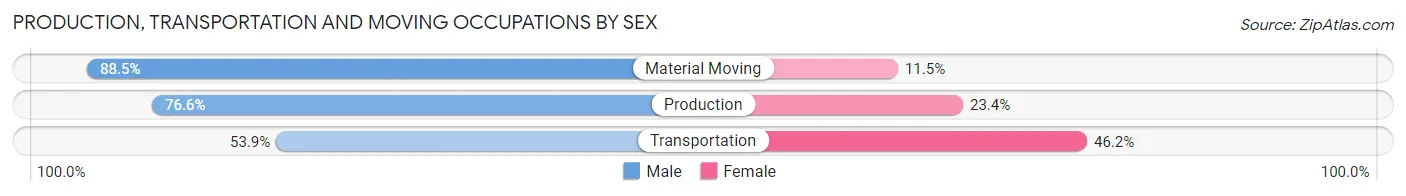
| Occupation | Male | Female |
| Production | 36 (76.6%) | 11 (23.4%) |
| Transportation | 7 (53.8%) | 6 (46.2%) |
| Material Moving | 139 (88.5%) | 18 (11.5%) |
| Total (Category) | 182 (83.9%) | 35 (16.1%) |
| Total (Overall) | 654 (58.7%) | 461 (41.3%) |
Employment Industries by Sex in Mount Holly Springs borough
Employment Industries in Mount Holly Springs borough
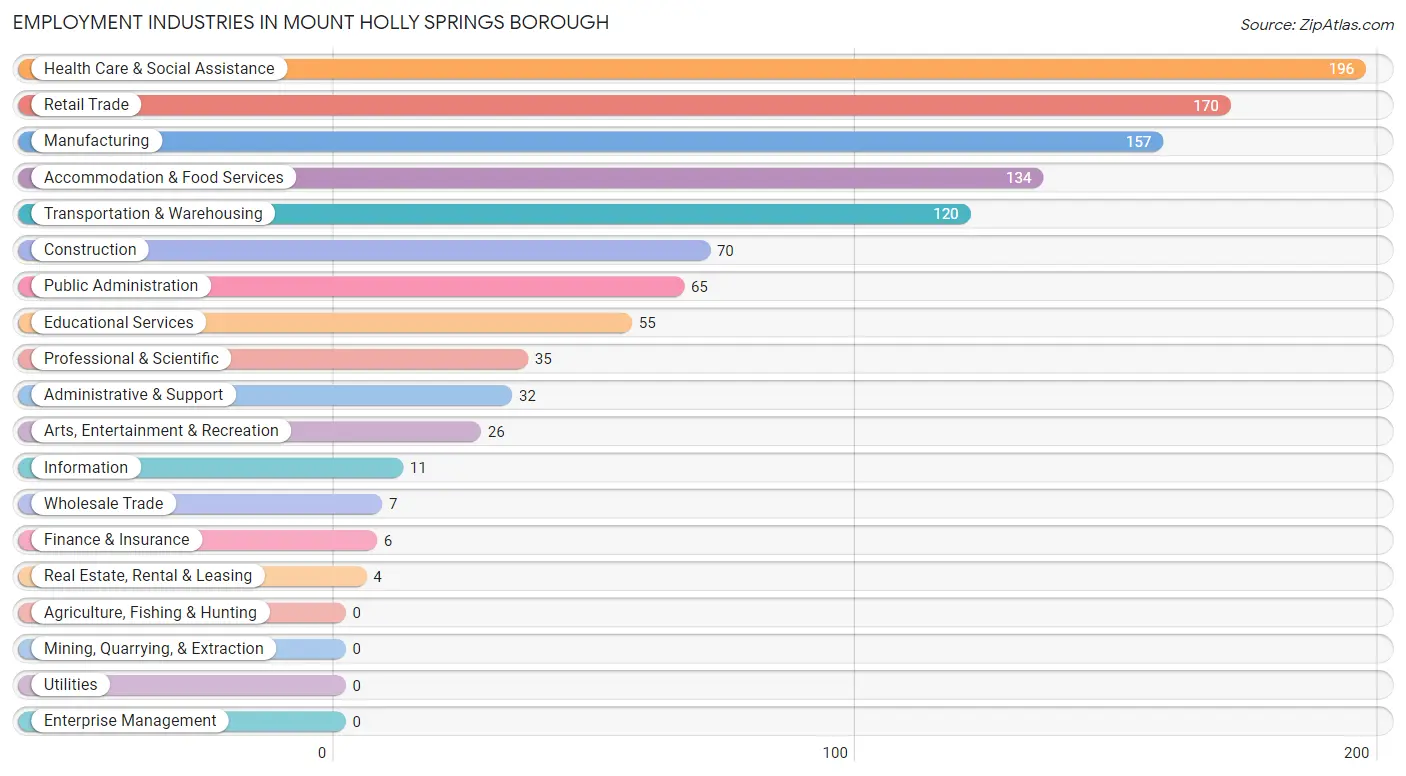
The major employment industries in Mount Holly Springs borough include Health Care & Social Assistance (196 | 17.6%), Retail Trade (170 | 15.2%), Manufacturing (157 | 14.1%), Accommodation & Food Services (134 | 12.0%), and Transportation & Warehousing (120 | 10.8%).
Employment Industries by Sex in Mount Holly Springs borough
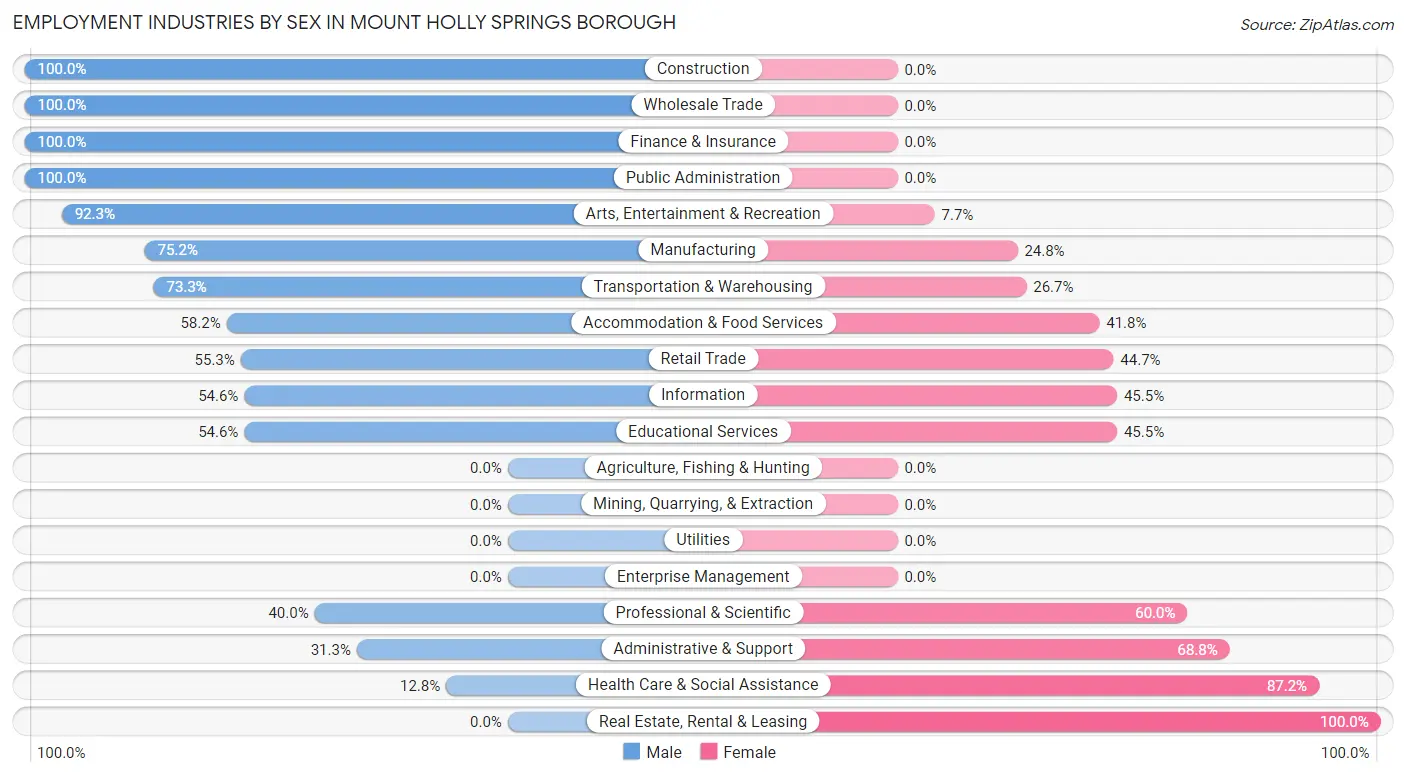
The Mount Holly Springs borough industries that see more men than women are Construction (100.0%), Wholesale Trade (100.0%), and Finance & Insurance (100.0%), whereas the industries that tend to have a higher number of women are Real Estate, Rental & Leasing (100.0%), Health Care & Social Assistance (87.2%), and Administrative & Support (68.8%).
| Industry | Male | Female |
| Agriculture, Fishing & Hunting | 0 (0.0%) | 0 (0.0%) |
| Mining, Quarrying, & Extraction | 0 (0.0%) | 0 (0.0%) |
| Construction | 70 (100.0%) | 0 (0.0%) |
| Manufacturing | 118 (75.2%) | 39 (24.8%) |
| Wholesale Trade | 7 (100.0%) | 0 (0.0%) |
| Retail Trade | 94 (55.3%) | 76 (44.7%) |
| Transportation & Warehousing | 88 (73.3%) | 32 (26.7%) |
| Utilities | 0 (0.0%) | 0 (0.0%) |
| Information | 6 (54.5%) | 5 (45.5%) |
| Finance & Insurance | 6 (100.0%) | 0 (0.0%) |
| Real Estate, Rental & Leasing | 0 (0.0%) | 4 (100.0%) |
| Professional & Scientific | 14 (40.0%) | 21 (60.0%) |
| Enterprise Management | 0 (0.0%) | 0 (0.0%) |
| Administrative & Support | 10 (31.2%) | 22 (68.8%) |
| Educational Services | 30 (54.5%) | 25 (45.5%) |
| Health Care & Social Assistance | 25 (12.8%) | 171 (87.2%) |
| Arts, Entertainment & Recreation | 24 (92.3%) | 2 (7.7%) |
| Accommodation & Food Services | 78 (58.2%) | 56 (41.8%) |
| Public Administration | 65 (100.0%) | 0 (0.0%) |
| Total | 654 (58.7%) | 461 (41.3%) |
Education in Mount Holly Springs borough
School Enrollment in Mount Holly Springs borough
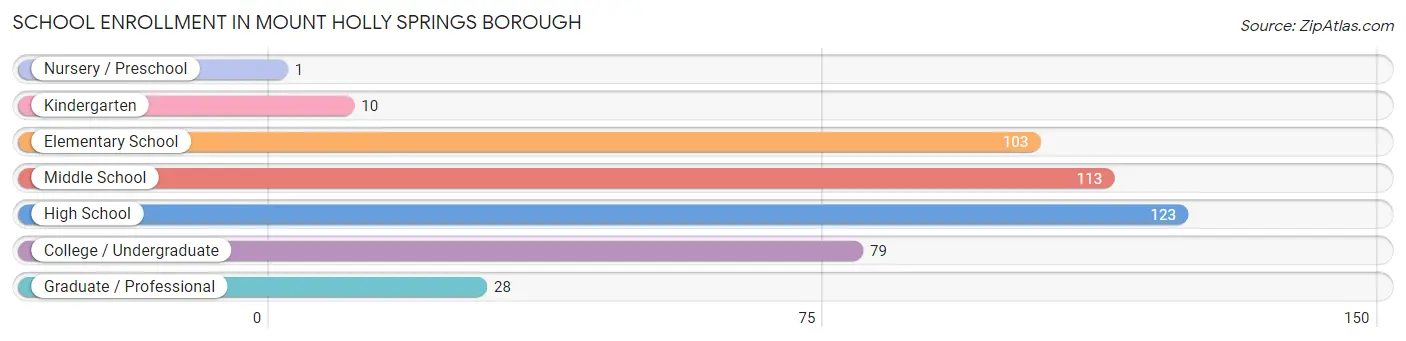
The most common levels of schooling among the 457 students in Mount Holly Springs borough are high school (123 | 26.9%), middle school (113 | 24.7%), and elementary school (103 | 22.5%).
| School Level | # Students | % Students |
| Nursery / Preschool | 1 | 0.2% |
| Kindergarten | 10 | 2.2% |
| Elementary School | 103 | 22.5% |
| Middle School | 113 | 24.7% |
| High School | 123 | 26.9% |
| College / Undergraduate | 79 | 17.3% |
| Graduate / Professional | 28 | 6.1% |
| Total | 457 | 100.0% |
School Enrollment by Age by Funding Source in Mount Holly Springs borough
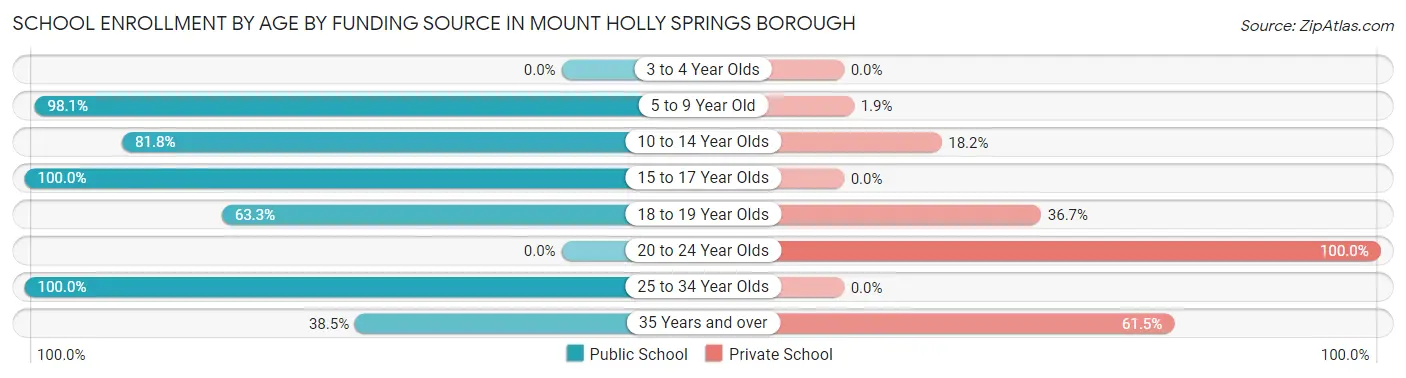
Out of a total of 457 students who are enrolled in schools in Mount Holly Springs borough, 54 (11.8%) attend a private institution, while the remaining 403 (88.2%) are enrolled in public schools. The age group of 20 to 24 year olds has the highest likelihood of being enrolled in private schools, with 14 (100.0% in the age bracket) enrolled. Conversely, the age group of 15 to 17 year olds has the lowest likelihood of being enrolled in a private school, with 128 (100.0% in the age bracket) attending a public institution.
| Age Bracket | Public School | Private School |
| 3 to 4 Year Olds | 0 (0.0%) | 0 (0.0%) |
| 5 to 9 Year Old | 105 (98.1%) | 2 (1.9%) |
| 10 to 14 Year Olds | 54 (81.8%) | 12 (18.2%) |
| 15 to 17 Year Olds | 128 (100.0%) | 0 (0.0%) |
| 18 to 19 Year Olds | 31 (63.3%) | 18 (36.7%) |
| 20 to 24 Year Olds | 0 (0.0%) | 14 (100.0%) |
| 25 to 34 Year Olds | 80 (100.0%) | 0 (0.0%) |
| 35 Years and over | 5 (38.5%) | 8 (61.5%) |
| Total | 403 (88.2%) | 54 (11.8%) |
Educational Attainment by Field of Study in Mount Holly Springs borough
Social sciences (49 | 26.6%), education (30 | 16.3%), business (27 | 14.7%), visual & performing arts (23 | 12.5%), and science & technology (19 | 10.3%) are the most common fields of study among 184 individuals in Mount Holly Springs borough who have obtained a bachelor's degree or higher.
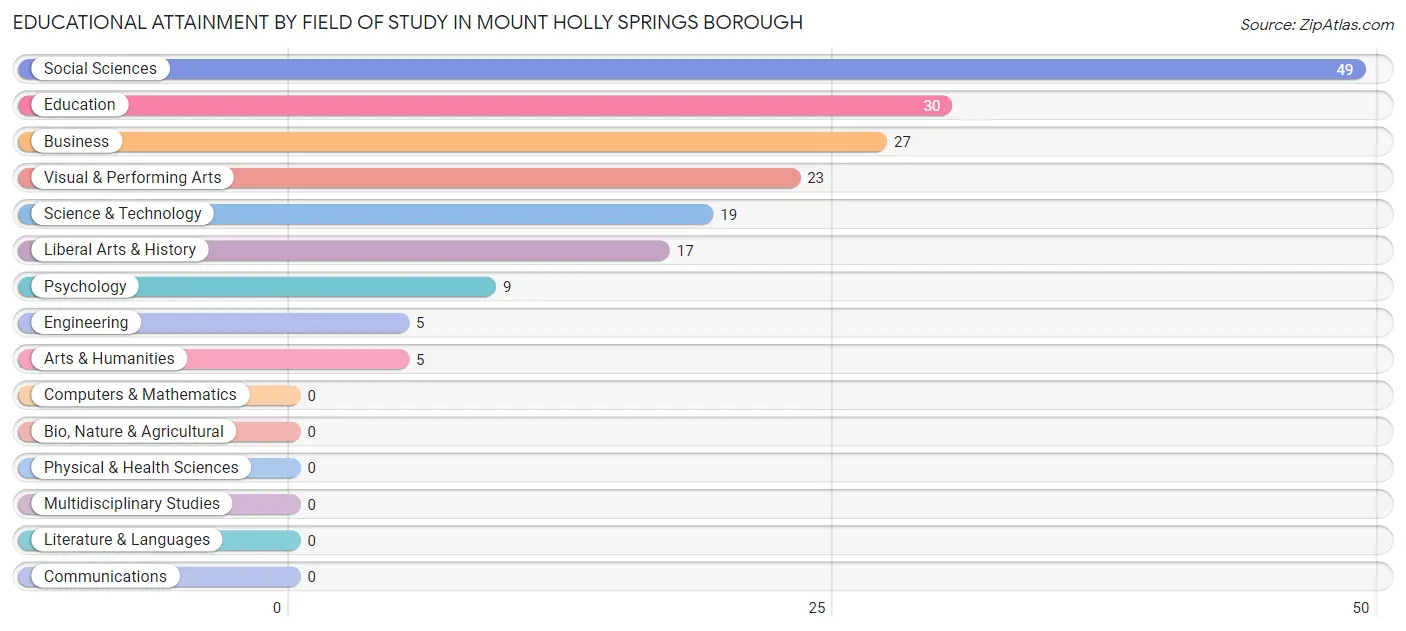
| Field of Study | # Graduates | % Graduates |
| Computers & Mathematics | 0 | 0.0% |
| Bio, Nature & Agricultural | 0 | 0.0% |
| Physical & Health Sciences | 0 | 0.0% |
| Psychology | 9 | 4.9% |
| Social Sciences | 49 | 26.6% |
| Engineering | 5 | 2.7% |
| Multidisciplinary Studies | 0 | 0.0% |
| Science & Technology | 19 | 10.3% |
| Business | 27 | 14.7% |
| Education | 30 | 16.3% |
| Literature & Languages | 0 | 0.0% |
| Liberal Arts & History | 17 | 9.2% |
| Visual & Performing Arts | 23 | 12.5% |
| Communications | 0 | 0.0% |
| Arts & Humanities | 5 | 2.7% |
| Total | 184 | 100.0% |
Transportation & Commute in Mount Holly Springs borough
Vehicle Availability by Sex in Mount Holly Springs borough
The most prevalent vehicle ownership categories in Mount Holly Springs borough are males with 2 vehicles (215, accounting for 34.0%) and females with 2 vehicles (193, making up 47.9%).
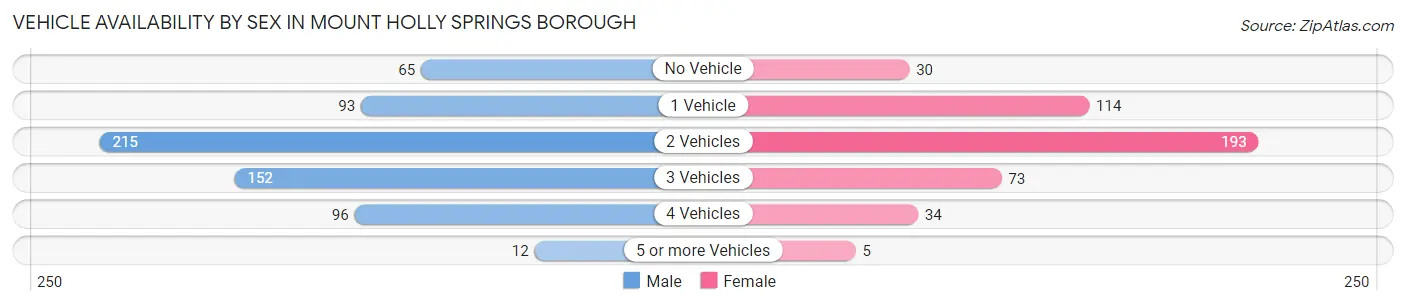
| Vehicles Available | Male | Female |
| No Vehicle | 65 (10.3%) | 30 (6.7%) |
| 1 Vehicle | 93 (14.7%) | 114 (25.4%) |
| 2 Vehicles | 215 (34.0%) | 193 (43.0%) |
| 3 Vehicles | 152 (24.0%) | 73 (16.3%) |
| 4 Vehicles | 96 (15.2%) | 34 (7.6%) |
| 5 or more Vehicles | 12 (1.9%) | 5 (1.1%) |
| Total | 633 (100.0%) | 449 (100.0%) |
Commute Time in Mount Holly Springs borough
The most frequently occuring commute durations in Mount Holly Springs borough are 20 to 24 minutes (161 commuters, 16.0%), 30 to 34 minutes (155 commuters, 15.4%), and 5 to 9 minutes (145 commuters, 14.4%).
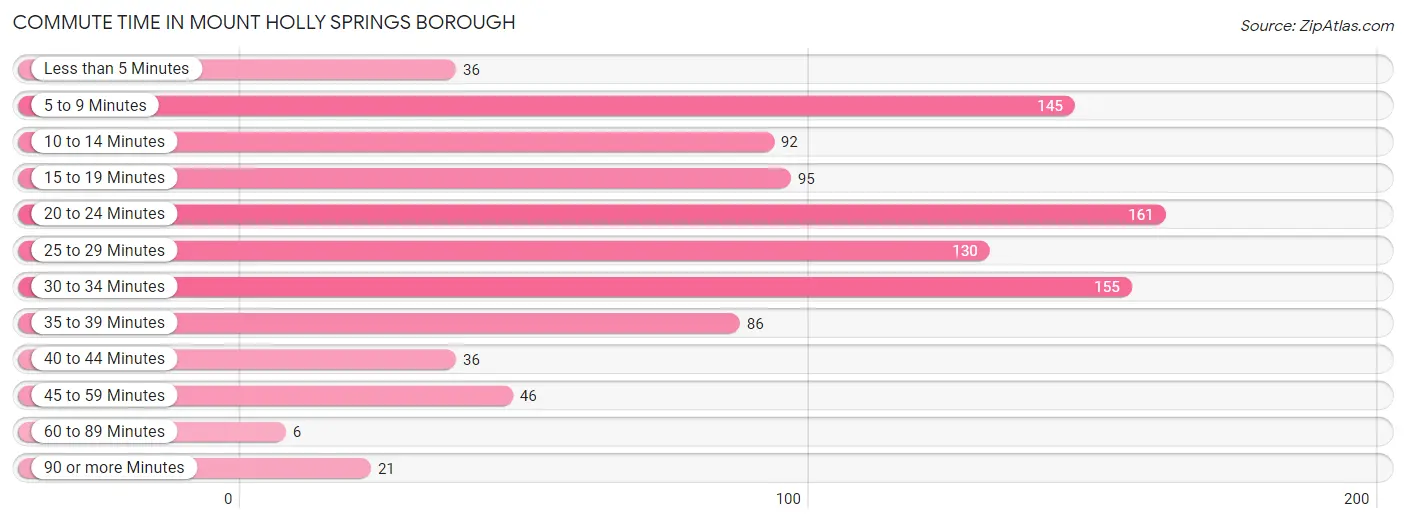
| Commute Time | # Commuters | % Commuters |
| Less than 5 Minutes | 36 | 3.6% |
| 5 to 9 Minutes | 145 | 14.4% |
| 10 to 14 Minutes | 92 | 9.1% |
| 15 to 19 Minutes | 95 | 9.4% |
| 20 to 24 Minutes | 161 | 16.0% |
| 25 to 29 Minutes | 130 | 12.9% |
| 30 to 34 Minutes | 155 | 15.4% |
| 35 to 39 Minutes | 86 | 8.5% |
| 40 to 44 Minutes | 36 | 3.6% |
| 45 to 59 Minutes | 46 | 4.6% |
| 60 to 89 Minutes | 6 | 0.6% |
| 90 or more Minutes | 21 | 2.1% |
Commute Time by Sex in Mount Holly Springs borough
The most common commute times in Mount Holly Springs borough are 30 to 34 minutes (122 commuters, 19.8%) for males and 20 to 24 minutes (75 commuters, 19.1%) for females.
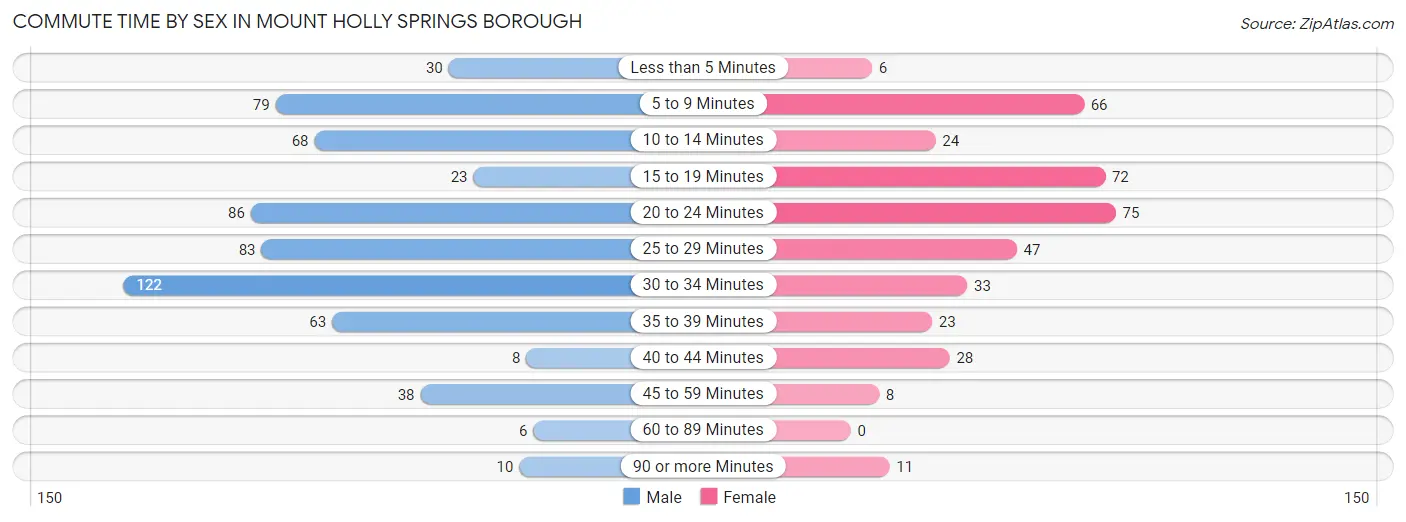
| Commute Time | Male | Female |
| Less than 5 Minutes | 30 (4.9%) | 6 (1.5%) |
| 5 to 9 Minutes | 79 (12.8%) | 66 (16.8%) |
| 10 to 14 Minutes | 68 (11.0%) | 24 (6.1%) |
| 15 to 19 Minutes | 23 (3.7%) | 72 (18.3%) |
| 20 to 24 Minutes | 86 (14.0%) | 75 (19.1%) |
| 25 to 29 Minutes | 83 (13.5%) | 47 (12.0%) |
| 30 to 34 Minutes | 122 (19.8%) | 33 (8.4%) |
| 35 to 39 Minutes | 63 (10.2%) | 23 (5.9%) |
| 40 to 44 Minutes | 8 (1.3%) | 28 (7.1%) |
| 45 to 59 Minutes | 38 (6.2%) | 8 (2.0%) |
| 60 to 89 Minutes | 6 (1.0%) | 0 (0.0%) |
| 90 or more Minutes | 10 (1.6%) | 11 (2.8%) |
Time of Departure to Work by Sex in Mount Holly Springs borough
The most frequent times of departure to work in Mount Holly Springs borough are 7:00 AM to 7:29 AM (111, 18.0%) for males and 7:00 AM to 7:29 AM (75, 19.1%) for females.
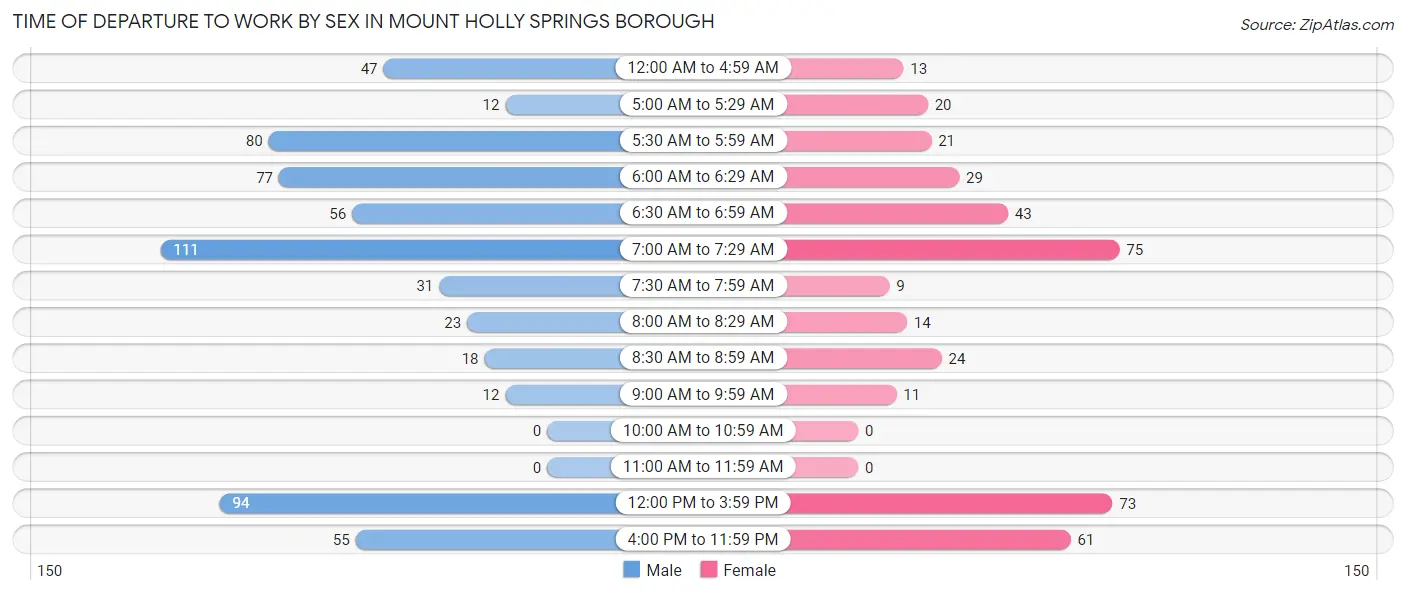
| Time of Departure | Male | Female |
| 12:00 AM to 4:59 AM | 47 (7.6%) | 13 (3.3%) |
| 5:00 AM to 5:29 AM | 12 (1.9%) | 20 (5.1%) |
| 5:30 AM to 5:59 AM | 80 (13.0%) | 21 (5.3%) |
| 6:00 AM to 6:29 AM | 77 (12.5%) | 29 (7.4%) |
| 6:30 AM to 6:59 AM | 56 (9.1%) | 43 (10.9%) |
| 7:00 AM to 7:29 AM | 111 (18.0%) | 75 (19.1%) |
| 7:30 AM to 7:59 AM | 31 (5.0%) | 9 (2.3%) |
| 8:00 AM to 8:29 AM | 23 (3.7%) | 14 (3.6%) |
| 8:30 AM to 8:59 AM | 18 (2.9%) | 24 (6.1%) |
| 9:00 AM to 9:59 AM | 12 (1.9%) | 11 (2.8%) |
| 10:00 AM to 10:59 AM | 0 (0.0%) | 0 (0.0%) |
| 11:00 AM to 11:59 AM | 0 (0.0%) | 0 (0.0%) |
| 12:00 PM to 3:59 PM | 94 (15.3%) | 73 (18.6%) |
| 4:00 PM to 11:59 PM | 55 (8.9%) | 61 (15.5%) |
| Total | 616 (100.0%) | 393 (100.0%) |
Housing Occupancy in Mount Holly Springs borough
Occupancy by Ownership in Mount Holly Springs borough
Of the total 898 dwellings in Mount Holly Springs borough, owner-occupied units account for 542 (60.4%), while renter-occupied units make up 356 (39.6%).
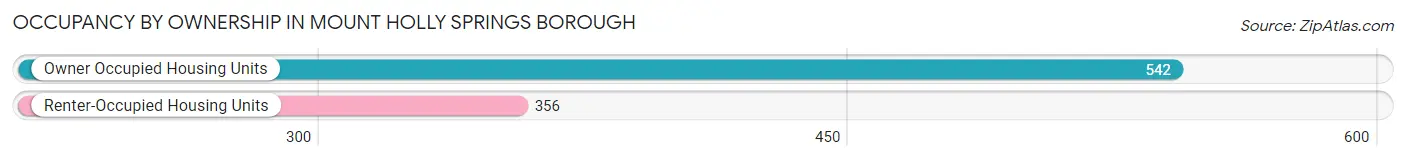
| Occupancy | # Housing Units | % Housing Units |
| Owner Occupied Housing Units | 542 | 60.4% |
| Renter-Occupied Housing Units | 356 | 39.6% |
| Total Occupied Housing Units | 898 | 100.0% |
Occupancy by Household Size in Mount Holly Springs borough
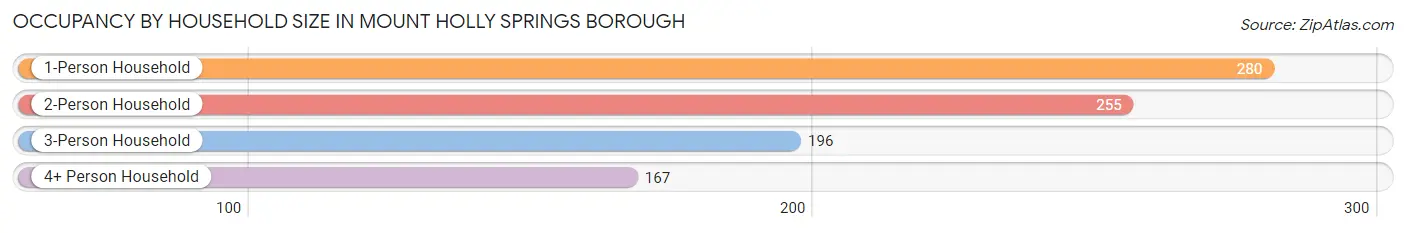
| Household Size | # Housing Units | % Housing Units |
| 1-Person Household | 280 | 31.2% |
| 2-Person Household | 255 | 28.4% |
| 3-Person Household | 196 | 21.8% |
| 4+ Person Household | 167 | 18.6% |
| Total Housing Units | 898 | 100.0% |
Occupancy by Ownership by Household Size in Mount Holly Springs borough
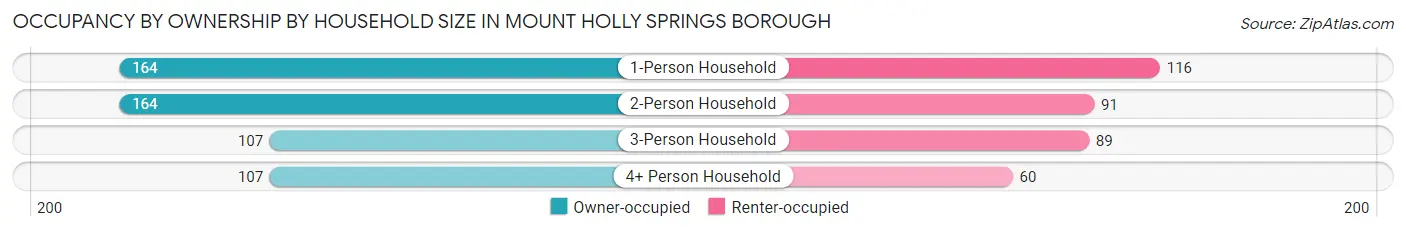
| Household Size | Owner-occupied | Renter-occupied |
| 1-Person Household | 164 (58.6%) | 116 (41.4%) |
| 2-Person Household | 164 (64.3%) | 91 (35.7%) |
| 3-Person Household | 107 (54.6%) | 89 (45.4%) |
| 4+ Person Household | 107 (64.1%) | 60 (35.9%) |
| Total Housing Units | 542 (60.4%) | 356 (39.6%) |
Occupancy by Educational Attainment in Mount Holly Springs borough
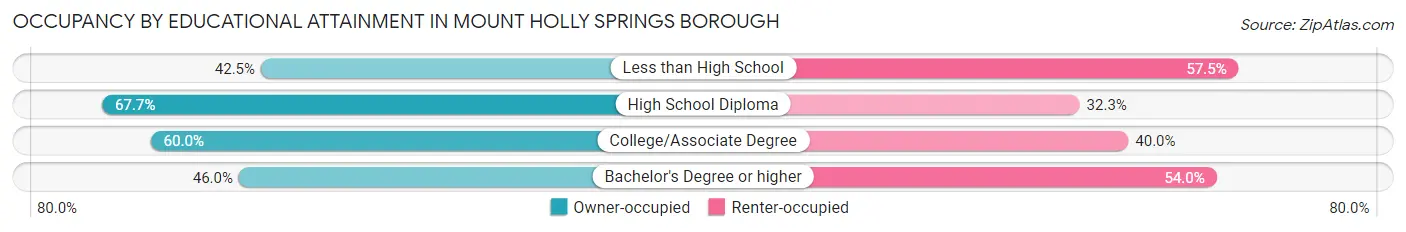
| Household Size | Owner-occupied | Renter-occupied |
| Less than High School | 37 (42.5%) | 50 (57.5%) |
| High School Diploma | 300 (67.7%) | 143 (32.3%) |
| College/Associate Degree | 153 (60.0%) | 102 (40.0%) |
| Bachelor's Degree or higher | 52 (46.0%) | 61 (54.0%) |
Occupancy by Age of Householder in Mount Holly Springs borough
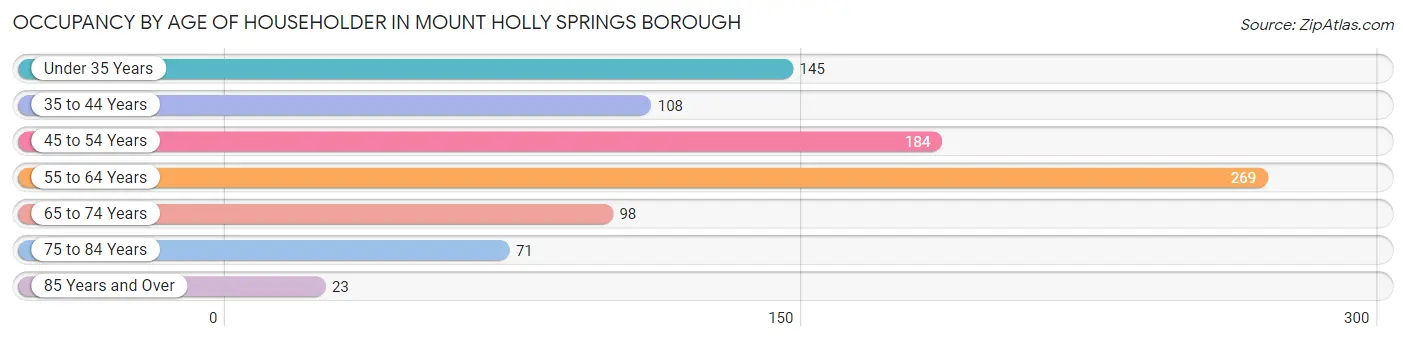
| Age Bracket | # Households | % Households |
| Under 35 Years | 145 | 16.2% |
| 35 to 44 Years | 108 | 12.0% |
| 45 to 54 Years | 184 | 20.5% |
| 55 to 64 Years | 269 | 30.0% |
| 65 to 74 Years | 98 | 10.9% |
| 75 to 84 Years | 71 | 7.9% |
| 85 Years and Over | 23 | 2.6% |
| Total | 898 | 100.0% |
Housing Finances in Mount Holly Springs borough
Median Income by Occupancy in Mount Holly Springs borough
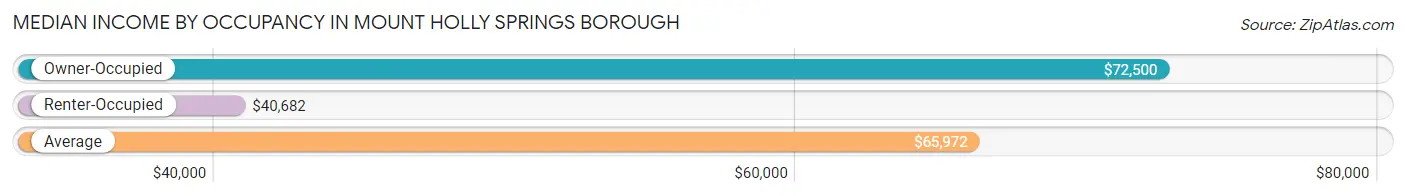
| Occupancy Type | # Households | Median Income |
| Owner-Occupied | 542 (60.4%) | $72,500 |
| Renter-Occupied | 356 (39.6%) | $40,682 |
| Average | 898 (100.0%) | $65,972 |
Occupancy by Householder Income Bracket in Mount Holly Springs borough
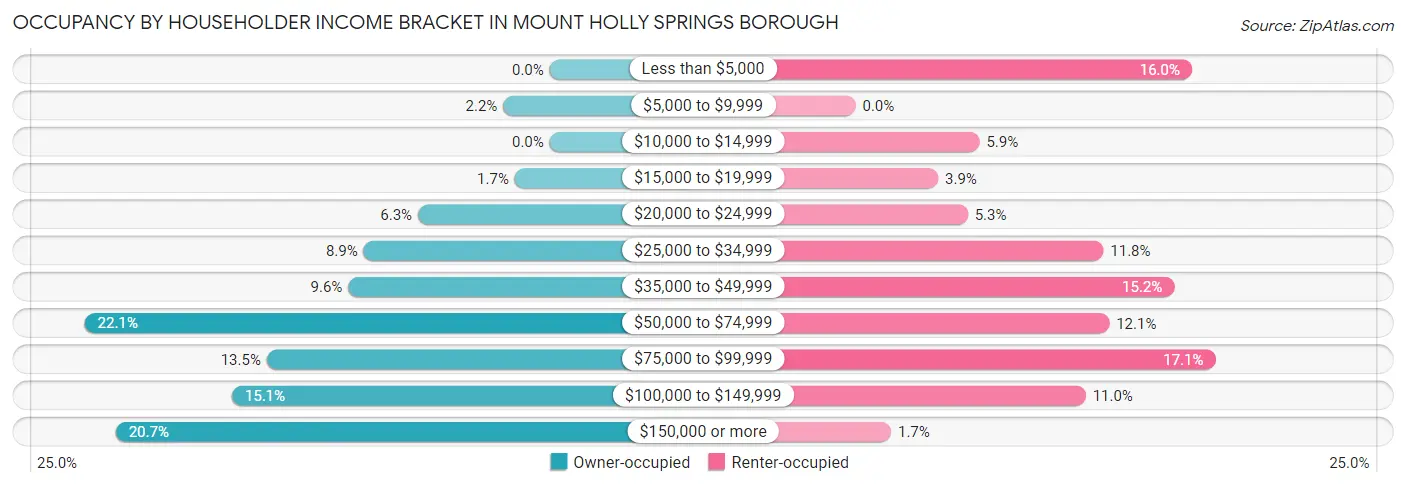
| Income Bracket | Owner-occupied | Renter-occupied |
| Less than $5,000 | 0 (0.0%) | 57 (16.0%) |
| $5,000 to $9,999 | 12 (2.2%) | 0 (0.0%) |
| $10,000 to $14,999 | 0 (0.0%) | 21 (5.9%) |
| $15,000 to $19,999 | 9 (1.7%) | 14 (3.9%) |
| $20,000 to $24,999 | 34 (6.3%) | 19 (5.3%) |
| $25,000 to $34,999 | 48 (8.9%) | 42 (11.8%) |
| $35,000 to $49,999 | 52 (9.6%) | 54 (15.2%) |
| $50,000 to $74,999 | 120 (22.1%) | 43 (12.1%) |
| $75,000 to $99,999 | 73 (13.5%) | 61 (17.1%) |
| $100,000 to $149,999 | 82 (15.1%) | 39 (11.0%) |
| $150,000 or more | 112 (20.7%) | 6 (1.7%) |
| Total | 542 (100.0%) | 356 (100.0%) |
Monthly Housing Cost Tiers in Mount Holly Springs borough
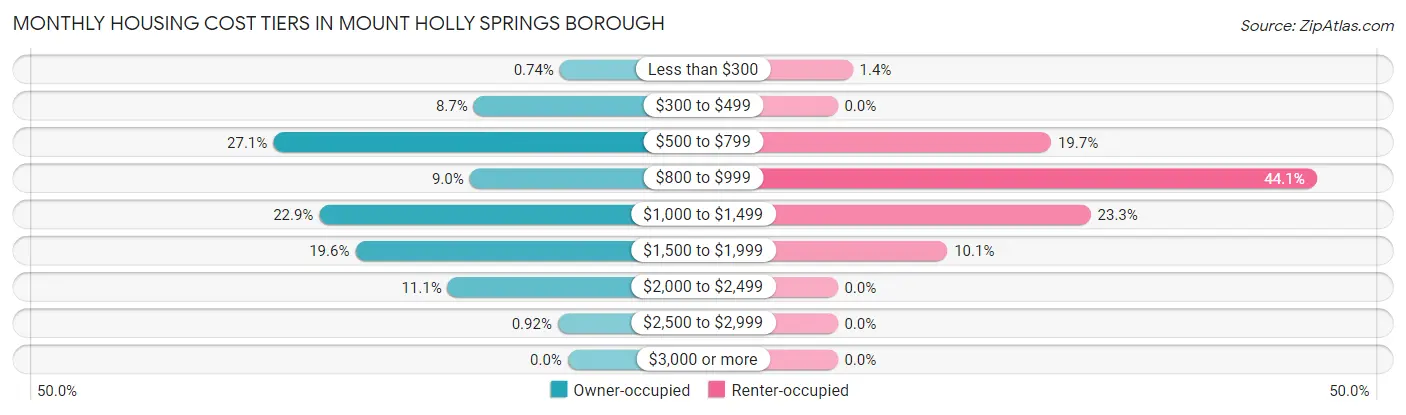
| Monthly Cost | Owner-occupied | Renter-occupied |
| Less than $300 | 4 (0.7%) | 5 (1.4%) |
| $300 to $499 | 47 (8.7%) | 0 (0.0%) |
| $500 to $799 | 147 (27.1%) | 70 (19.7%) |
| $800 to $999 | 49 (9.0%) | 157 (44.1%) |
| $1,000 to $1,499 | 124 (22.9%) | 83 (23.3%) |
| $1,500 to $1,999 | 106 (19.6%) | 36 (10.1%) |
| $2,000 to $2,499 | 60 (11.1%) | 0 (0.0%) |
| $2,500 to $2,999 | 5 (0.9%) | 0 (0.0%) |
| $3,000 or more | 0 (0.0%) | 0 (0.0%) |
| Total | 542 (100.0%) | 356 (100.0%) |
Physical Housing Characteristics in Mount Holly Springs borough
Housing Structures in Mount Holly Springs borough
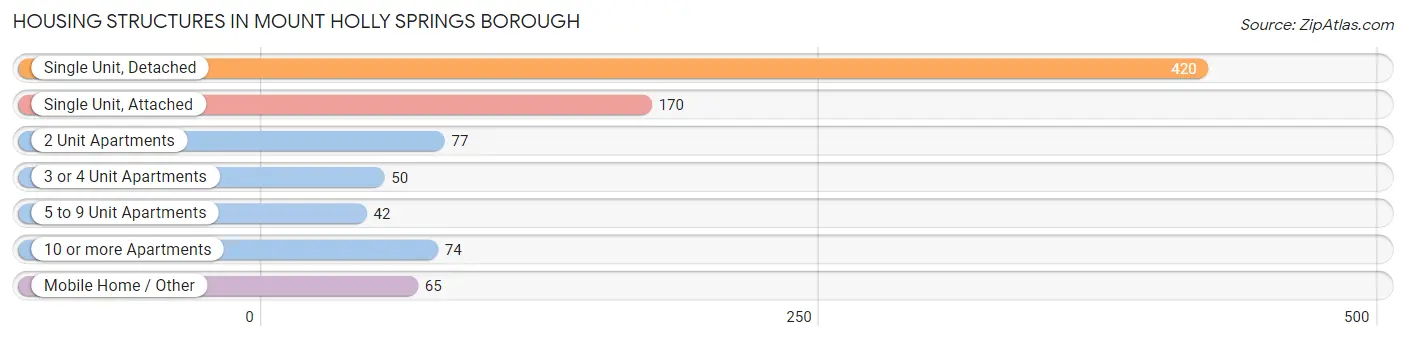
| Structure Type | # Housing Units | % Housing Units |
| Single Unit, Detached | 420 | 46.8% |
| Single Unit, Attached | 170 | 18.9% |
| 2 Unit Apartments | 77 | 8.6% |
| 3 or 4 Unit Apartments | 50 | 5.6% |
| 5 to 9 Unit Apartments | 42 | 4.7% |
| 10 or more Apartments | 74 | 8.2% |
| Mobile Home / Other | 65 | 7.2% |
| Total | 898 | 100.0% |
Housing Structures by Occupancy in Mount Holly Springs borough
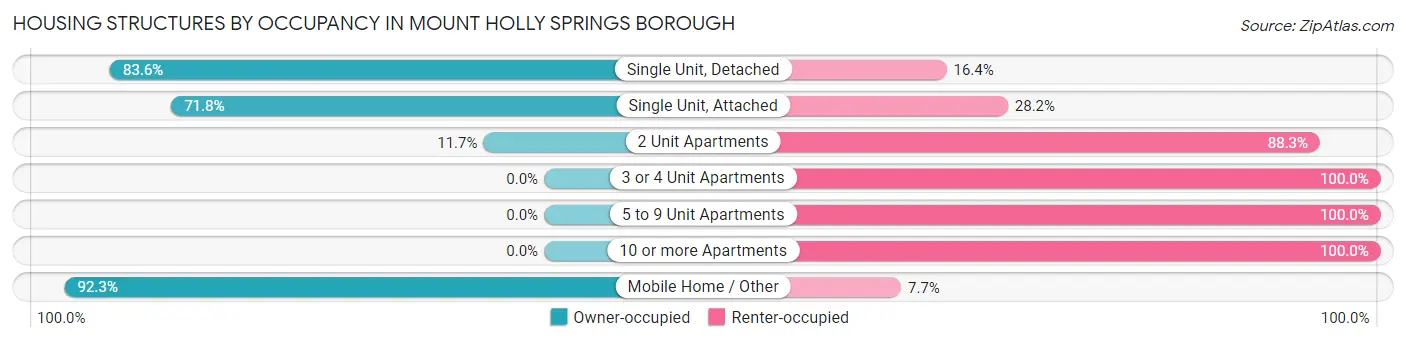
| Structure Type | Owner-occupied | Renter-occupied |
| Single Unit, Detached | 351 (83.6%) | 69 (16.4%) |
| Single Unit, Attached | 122 (71.8%) | 48 (28.2%) |
| 2 Unit Apartments | 9 (11.7%) | 68 (88.3%) |
| 3 or 4 Unit Apartments | 0 (0.0%) | 50 (100.0%) |
| 5 to 9 Unit Apartments | 0 (0.0%) | 42 (100.0%) |
| 10 or more Apartments | 0 (0.0%) | 74 (100.0%) |
| Mobile Home / Other | 60 (92.3%) | 5 (7.7%) |
| Total | 542 (60.4%) | 356 (39.6%) |
Housing Structures by Number of Rooms in Mount Holly Springs borough
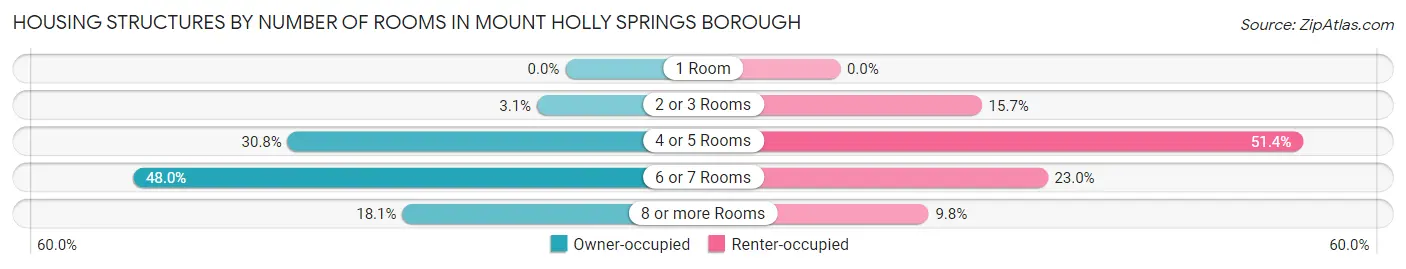
| Number of Rooms | Owner-occupied | Renter-occupied |
| 1 Room | 0 (0.0%) | 0 (0.0%) |
| 2 or 3 Rooms | 17 (3.1%) | 56 (15.7%) |
| 4 or 5 Rooms | 167 (30.8%) | 183 (51.4%) |
| 6 or 7 Rooms | 260 (48.0%) | 82 (23.0%) |
| 8 or more Rooms | 98 (18.1%) | 35 (9.8%) |
| Total | 542 (100.0%) | 356 (100.0%) |
Housing Structure by Heating Type in Mount Holly Springs borough
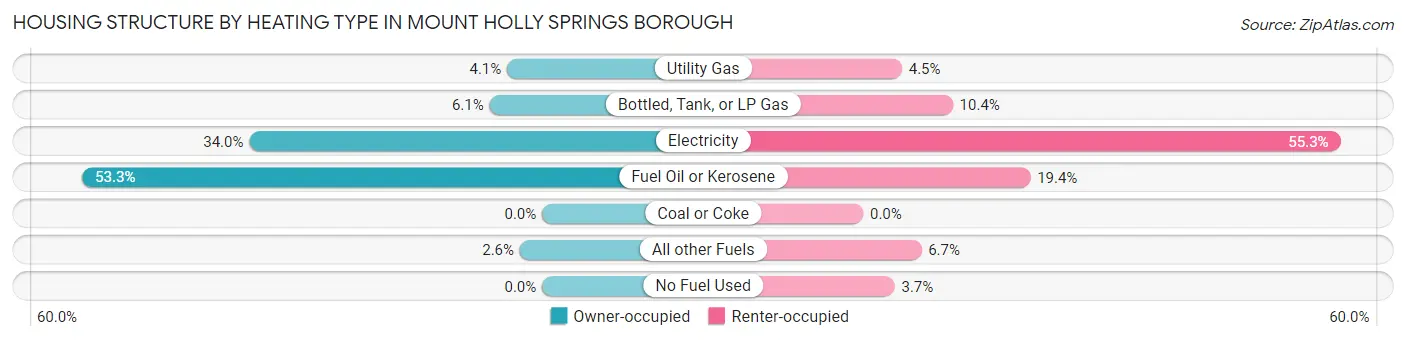
| Heating Type | Owner-occupied | Renter-occupied |
| Utility Gas | 22 (4.1%) | 16 (4.5%) |
| Bottled, Tank, or LP Gas | 33 (6.1%) | 37 (10.4%) |
| Electricity | 184 (34.0%) | 197 (55.3%) |
| Fuel Oil or Kerosene | 289 (53.3%) | 69 (19.4%) |
| Coal or Coke | 0 (0.0%) | 0 (0.0%) |
| All other Fuels | 14 (2.6%) | 24 (6.7%) |
| No Fuel Used | 0 (0.0%) | 13 (3.6%) |
| Total | 542 (100.0%) | 356 (100.0%) |
Household Vehicle Usage in Mount Holly Springs borough
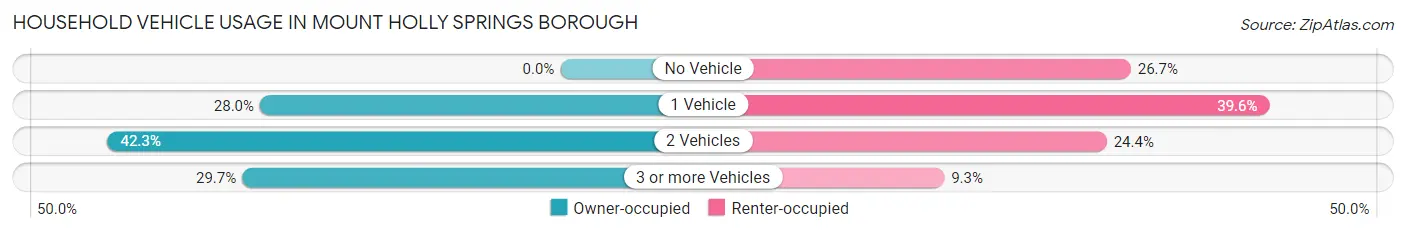
| Vehicles per Household | Owner-occupied | Renter-occupied |
| No Vehicle | 0 (0.0%) | 95 (26.7%) |
| 1 Vehicle | 152 (28.0%) | 141 (39.6%) |
| 2 Vehicles | 229 (42.2%) | 87 (24.4%) |
| 3 or more Vehicles | 161 (29.7%) | 33 (9.3%) |
| Total | 542 (100.0%) | 356 (100.0%) |
Real Estate & Mortgages in Mount Holly Springs borough
Real Estate and Mortgage Overview in Mount Holly Springs borough
| Characteristic | Without Mortgage | With Mortgage |
| Housing Units | 217 | 325 |
| Median Property Value | $163,000 | $151,700 |
| Median Household Income | $51,211 | $93 |
| Monthly Housing Costs | $601 | $0 |
| Real Estate Taxes | $2,655 | $0 |
Property Value by Mortgage Status in Mount Holly Springs borough
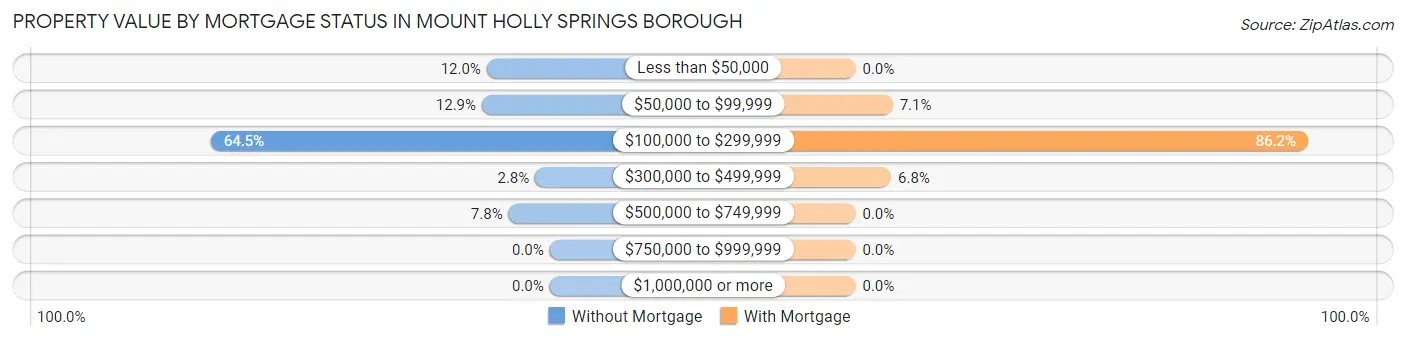
| Property Value | Without Mortgage | With Mortgage |
| Less than $50,000 | 26 (12.0%) | 0 (0.0%) |
| $50,000 to $99,999 | 28 (12.9%) | 23 (7.1%) |
| $100,000 to $299,999 | 140 (64.5%) | 280 (86.2%) |
| $300,000 to $499,999 | 6 (2.8%) | 22 (6.8%) |
| $500,000 to $749,999 | 17 (7.8%) | 0 (0.0%) |
| $750,000 to $999,999 | 0 (0.0%) | 0 (0.0%) |
| $1,000,000 or more | 0 (0.0%) | 0 (0.0%) |
| Total | 217 (100.0%) | 325 (100.0%) |
Household Income by Mortgage Status in Mount Holly Springs borough
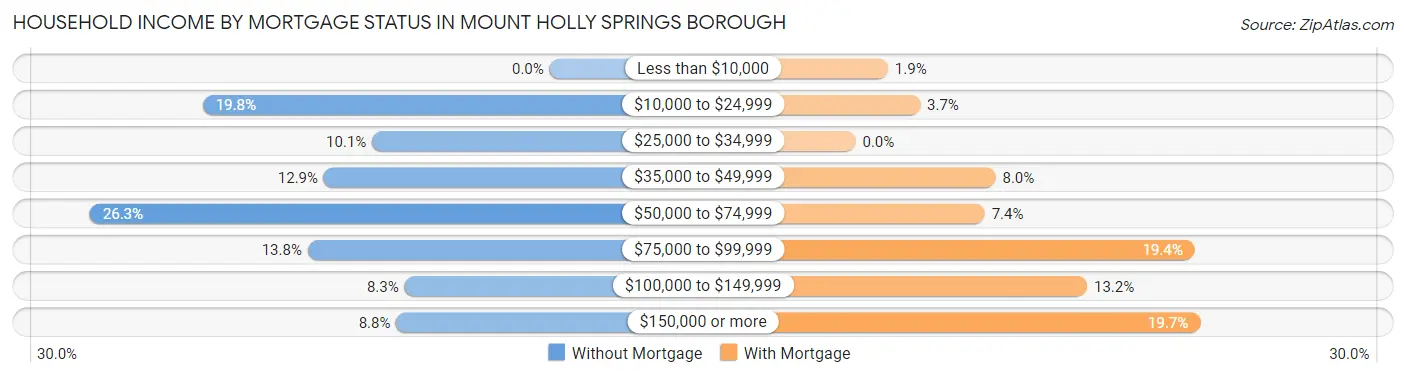
| Household Income | Without Mortgage | With Mortgage |
| Less than $10,000 | 0 (0.0%) | 6 (1.8%) |
| $10,000 to $24,999 | 43 (19.8%) | 12 (3.7%) |
| $25,000 to $34,999 | 22 (10.1%) | 0 (0.0%) |
| $35,000 to $49,999 | 28 (12.9%) | 26 (8.0%) |
| $50,000 to $74,999 | 57 (26.3%) | 24 (7.4%) |
| $75,000 to $99,999 | 30 (13.8%) | 63 (19.4%) |
| $100,000 to $149,999 | 18 (8.3%) | 43 (13.2%) |
| $150,000 or more | 19 (8.8%) | 64 (19.7%) |
| Total | 217 (100.0%) | 325 (100.0%) |
Property Value to Household Income Ratio in Mount Holly Springs borough
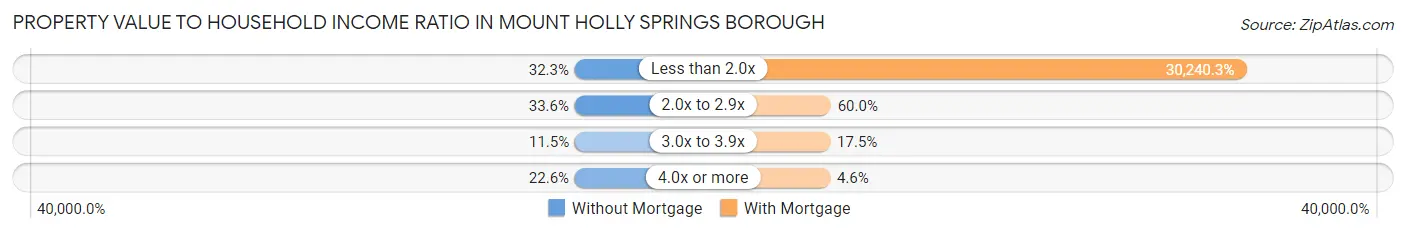
| Value-to-Income Ratio | Without Mortgage | With Mortgage |
| Less than 2.0x | 70 (32.3%) | 98,281 (30,240.3%) |
| 2.0x to 2.9x | 73 (33.6%) | 195 (60.0%) |
| 3.0x to 3.9x | 25 (11.5%) | 57 (17.5%) |
| 4.0x or more | 49 (22.6%) | 15 (4.6%) |
| Total | 217 (100.0%) | 325 (100.0%) |
Real Estate Taxes by Mortgage Status in Mount Holly Springs borough
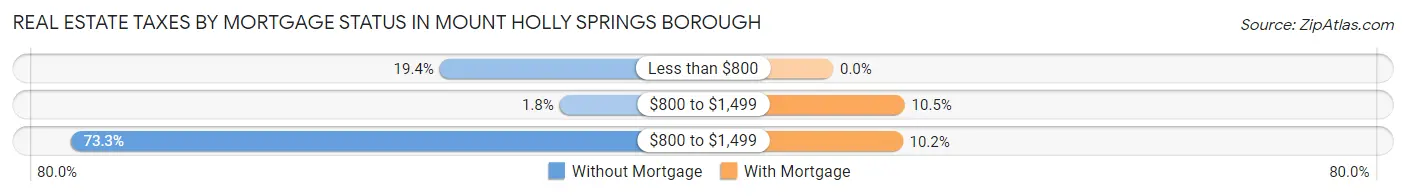
| Property Taxes | Without Mortgage | With Mortgage |
| Less than $800 | 42 (19.4%) | 0 (0.0%) |
| $800 to $1,499 | 4 (1.8%) | 34 (10.5%) |
| $800 to $1,499 | 159 (73.3%) | 33 (10.2%) |
| Total | 217 (100.0%) | 325 (100.0%) |
Health & Disability in Mount Holly Springs borough
Health Insurance Coverage by Age in Mount Holly Springs borough
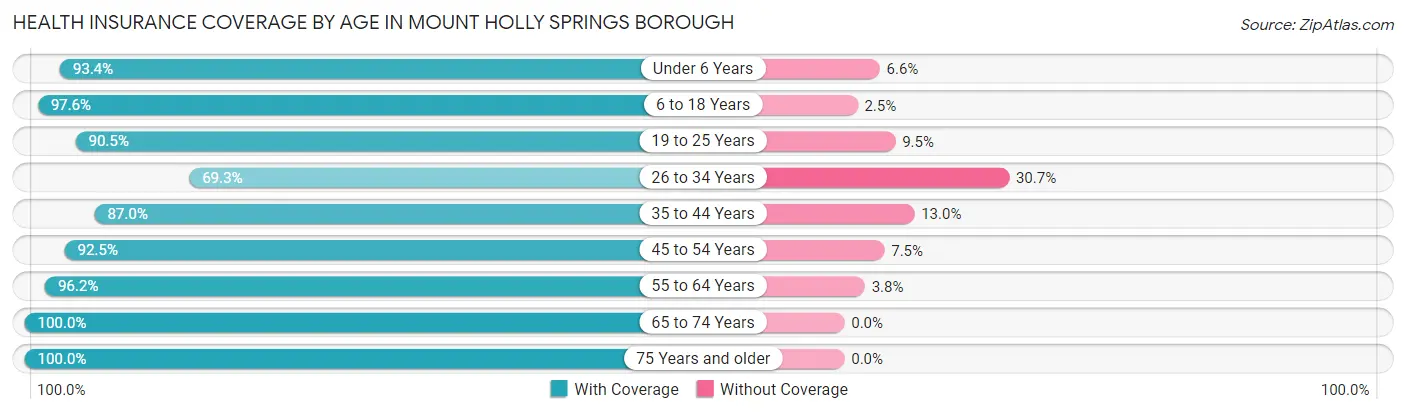
| Age Bracket | With Coverage | Without Coverage |
| Under 6 Years | 71 (93.4%) | 5 (6.6%) |
| 6 to 18 Years | 318 (97.6%) | 8 (2.5%) |
| 19 to 25 Years | 181 (90.5%) | 19 (9.5%) |
| 26 to 34 Years | 291 (69.3%) | 129 (30.7%) |
| 35 to 44 Years | 180 (87.0%) | 27 (13.0%) |
| 45 to 54 Years | 310 (92.5%) | 25 (7.5%) |
| 55 to 64 Years | 404 (96.2%) | 16 (3.8%) |
| 65 to 74 Years | 156 (100.0%) | 0 (0.0%) |
| 75 Years and older | 185 (100.0%) | 0 (0.0%) |
| Total | 2,096 (90.1%) | 229 (9.9%) |
Health Insurance Coverage by Citizenship Status in Mount Holly Springs borough
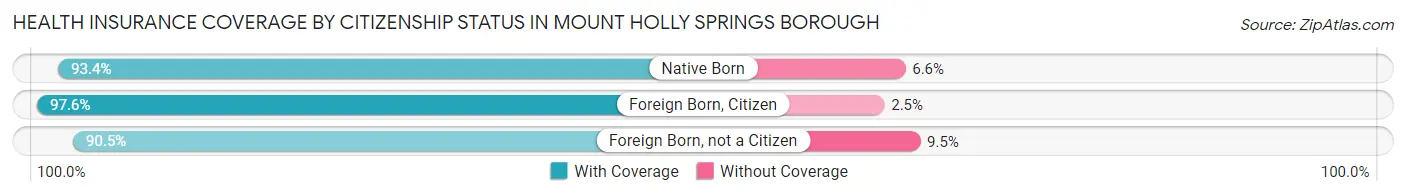
| Citizenship Status | With Coverage | Without Coverage |
| Native Born | 71 (93.4%) | 5 (6.6%) |
| Foreign Born, Citizen | 318 (97.6%) | 8 (2.5%) |
| Foreign Born, not a Citizen | 181 (90.5%) | 19 (9.5%) |
Health Insurance Coverage by Household Income in Mount Holly Springs borough
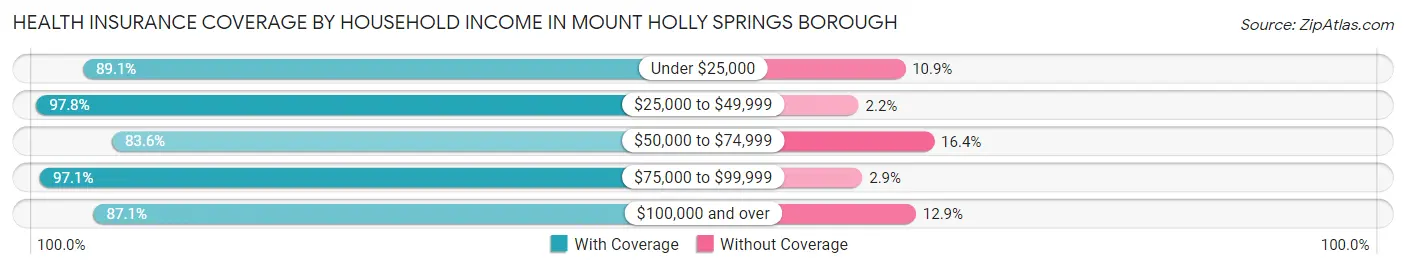
| Household Income | With Coverage | Without Coverage |
| Under $25,000 | 236 (89.1%) | 29 (10.9%) |
| $25,000 to $49,999 | 399 (97.8%) | 9 (2.2%) |
| $50,000 to $74,999 | 373 (83.6%) | 73 (16.4%) |
| $75,000 to $99,999 | 368 (97.1%) | 11 (2.9%) |
| $100,000 and over | 720 (87.1%) | 107 (12.9%) |
Public vs Private Health Insurance Coverage by Age in Mount Holly Springs borough
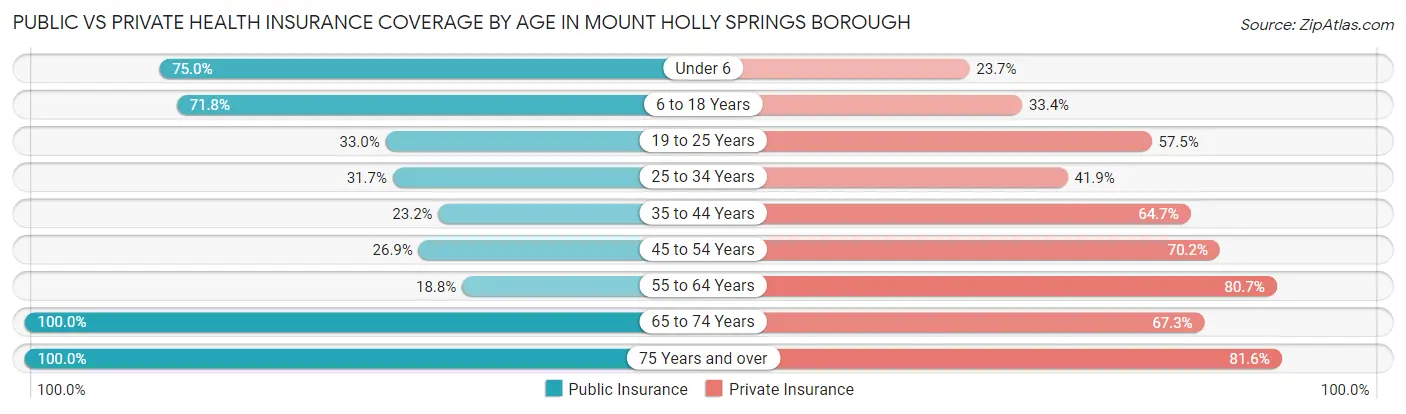
| Age Bracket | Public Insurance | Private Insurance |
| Under 6 | 57 (75.0%) | 18 (23.7%) |
| 6 to 18 Years | 234 (71.8%) | 109 (33.4%) |
| 19 to 25 Years | 66 (33.0%) | 115 (57.5%) |
| 25 to 34 Years | 133 (31.7%) | 176 (41.9%) |
| 35 to 44 Years | 48 (23.2%) | 134 (64.7%) |
| 45 to 54 Years | 90 (26.9%) | 235 (70.2%) |
| 55 to 64 Years | 79 (18.8%) | 339 (80.7%) |
| 65 to 74 Years | 156 (100.0%) | 105 (67.3%) |
| 75 Years and over | 185 (100.0%) | 151 (81.6%) |
| Total | 1,048 (45.1%) | 1,382 (59.4%) |
Disability Status by Sex by Age in Mount Holly Springs borough
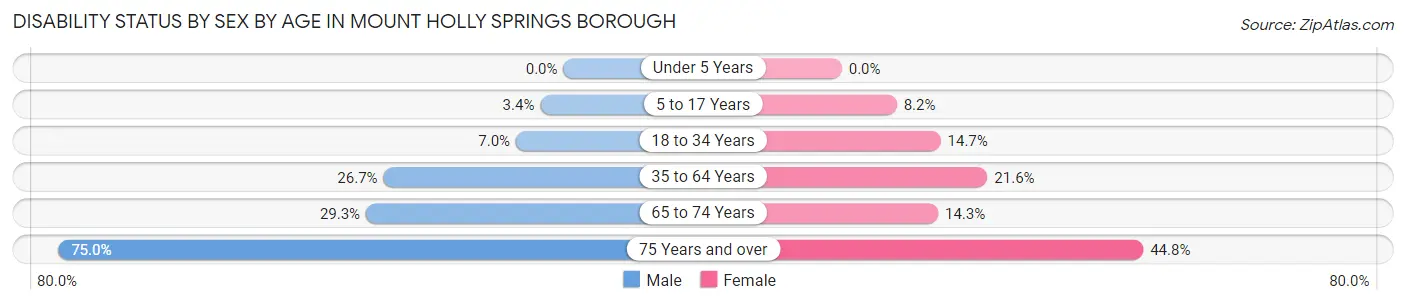
| Age Bracket | Male | Female |
| Under 5 Years | 0 (0.0%) | 0 (0.0%) |
| 5 to 17 Years | 6 (3.4%) | 11 (8.2%) |
| 18 to 34 Years | 35 (7.0%) | 22 (14.7%) |
| 35 to 64 Years | 105 (26.7%) | 123 (21.6%) |
| 65 to 74 Years | 17 (29.3%) | 14 (14.3%) |
| 75 Years and over | 60 (75.0%) | 47 (44.8%) |
Disability Class by Sex by Age in Mount Holly Springs borough
Disability Class: Hearing Difficulty
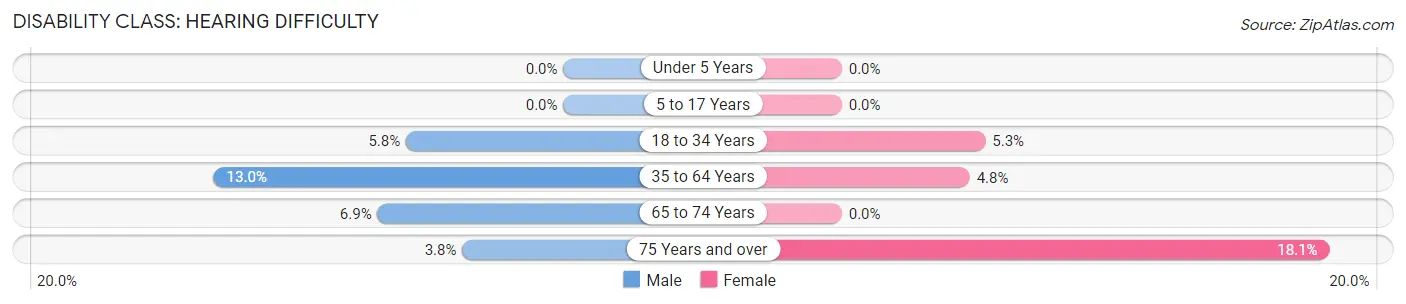
| Age Bracket | Male | Female |
| Under 5 Years | 0 (0.0%) | 0 (0.0%) |
| 5 to 17 Years | 0 (0.0%) | 0 (0.0%) |
| 18 to 34 Years | 29 (5.8%) | 8 (5.3%) |
| 35 to 64 Years | 51 (13.0%) | 27 (4.8%) |
| 65 to 74 Years | 4 (6.9%) | 0 (0.0%) |
| 75 Years and over | 3 (3.7%) | 19 (18.1%) |
Disability Class: Vision Difficulty
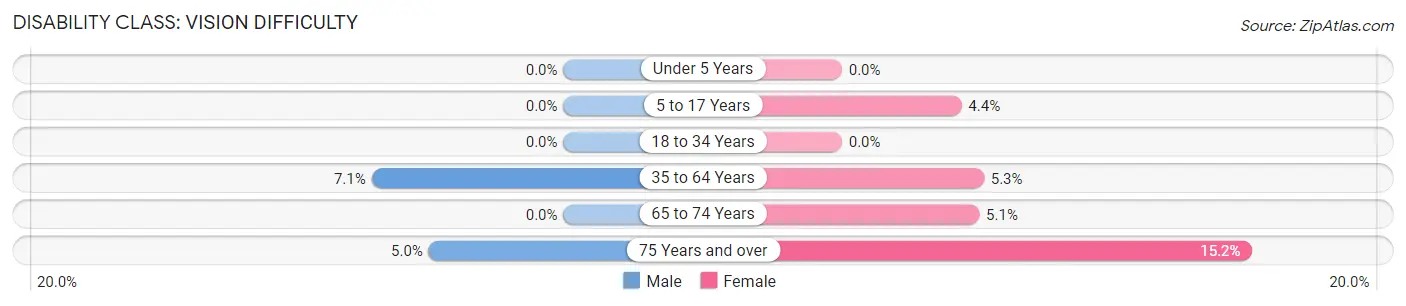
| Age Bracket | Male | Female |
| Under 5 Years | 0 (0.0%) | 0 (0.0%) |
| 5 to 17 Years | 0 (0.0%) | 6 (4.4%) |
| 18 to 34 Years | 0 (0.0%) | 0 (0.0%) |
| 35 to 64 Years | 28 (7.1%) | 30 (5.3%) |
| 65 to 74 Years | 0 (0.0%) | 5 (5.1%) |
| 75 Years and over | 4 (5.0%) | 16 (15.2%) |
Disability Class: Cognitive Difficulty
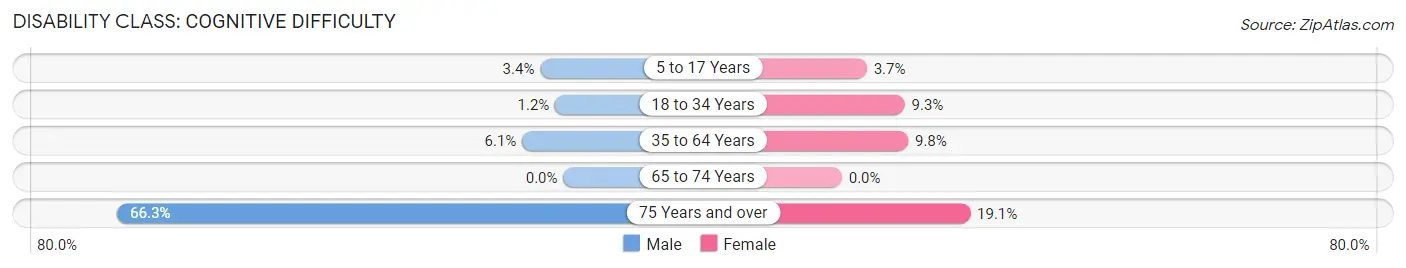
| Age Bracket | Male | Female |
| 5 to 17 Years | 6 (3.4%) | 5 (3.7%) |
| 18 to 34 Years | 6 (1.2%) | 14 (9.3%) |
| 35 to 64 Years | 24 (6.1%) | 56 (9.8%) |
| 65 to 74 Years | 0 (0.0%) | 0 (0.0%) |
| 75 Years and over | 53 (66.2%) | 20 (19.1%) |
Disability Class: Ambulatory Difficulty
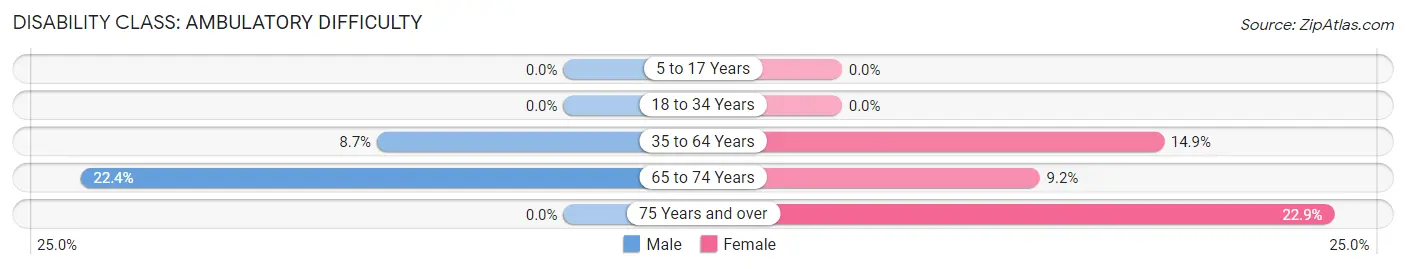
| Age Bracket | Male | Female |
| 5 to 17 Years | 0 (0.0%) | 0 (0.0%) |
| 18 to 34 Years | 0 (0.0%) | 0 (0.0%) |
| 35 to 64 Years | 34 (8.6%) | 85 (14.9%) |
| 65 to 74 Years | 13 (22.4%) | 9 (9.2%) |
| 75 Years and over | 0 (0.0%) | 24 (22.9%) |
Disability Class: Self-Care Difficulty
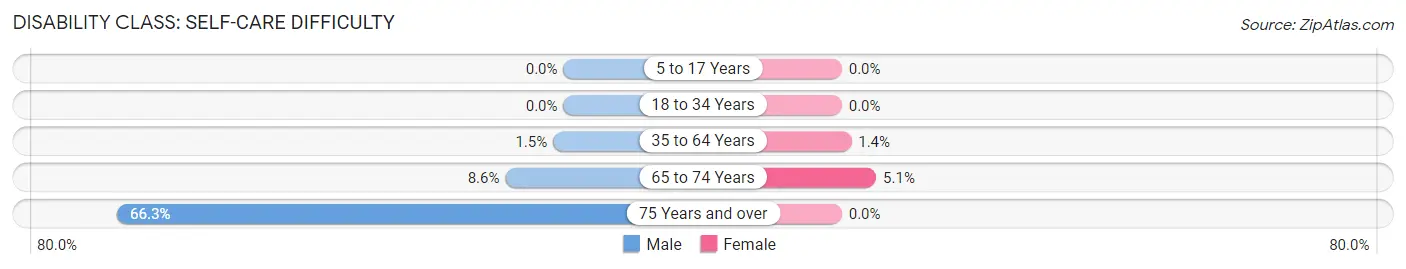
| Age Bracket | Male | Female |
| 5 to 17 Years | 0 (0.0%) | 0 (0.0%) |
| 18 to 34 Years | 0 (0.0%) | 0 (0.0%) |
| 35 to 64 Years | 6 (1.5%) | 8 (1.4%) |
| 65 to 74 Years | 5 (8.6%) | 5 (5.1%) |
| 75 Years and over | 53 (66.2%) | 0 (0.0%) |
Technology Access in Mount Holly Springs borough
Computing Device Access in Mount Holly Springs borough
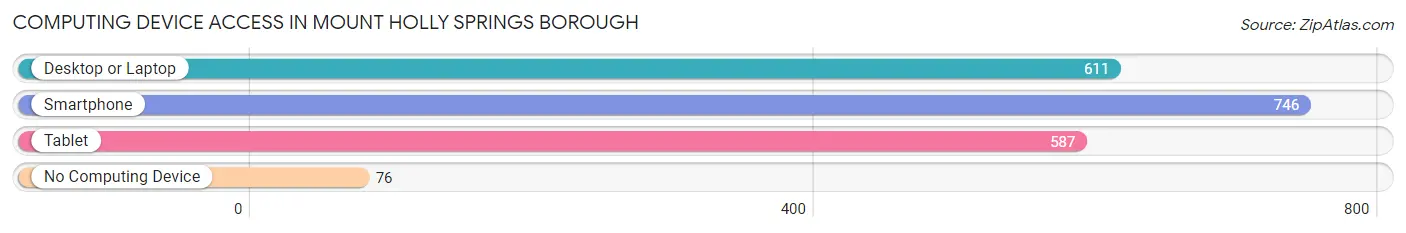
| Device Type | # Households | % Households |
| Desktop or Laptop | 611 | 68.0% |
| Smartphone | 746 | 83.1% |
| Tablet | 587 | 65.4% |
| No Computing Device | 76 | 8.5% |
| Total | 898 | 100.0% |
Internet Access in Mount Holly Springs borough
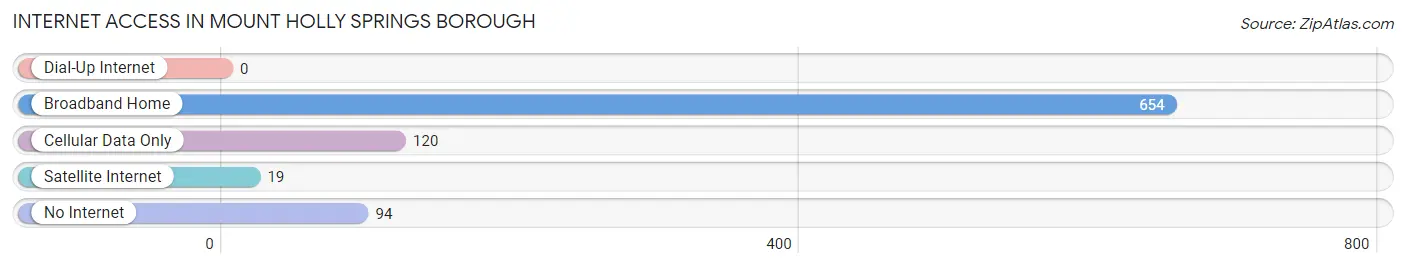
| Internet Type | # Households | % Households |
| Dial-Up Internet | 0 | 0.0% |
| Broadband Home | 654 | 72.8% |
| Cellular Data Only | 120 | 13.4% |
| Satellite Internet | 19 | 2.1% |
| No Internet | 94 | 10.5% |
| Total | 898 | 100.0% |
Mount Holly Springs borough Summary
Holly Springs Borough is a small borough located in Cumberland County, Pennsylvania. It is situated in the south-central part of the state, approximately 20 miles northwest of Harrisburg, the state capital. The borough is bordered by South Middleton Township to the north, Carlisle to the east, Shippensburg to the south, and Southampton Township to the west. The population of the borough was 1,845 at the 2010 census.
History
Holly Springs Borough was founded in 1845 and was originally known as “Holly Springs Crossroads.” The name was changed to “Holly Springs” in 1851. The borough was incorporated in 1854.
The area was first settled in the late 1700s by German and Scotch-Irish immigrants. The first settlers were attracted to the area due to its fertile soil and abundant natural resources. The area was also known for its iron ore deposits, which were mined and used to produce iron products.
The borough was an important stop on the Underground Railroad, a network of secret routes and safe houses used by African-American slaves to escape to freedom in the northern United States and Canada. The borough was also home to a number of prominent abolitionists, including William Still, who wrote the book The Underground Railroad.
Geography
Holly Springs Borough is located at 40°11'45" North, 77°14'45" West (40.195833, -77.245833). It has a total area of 0.6 square miles, all of which is land.
The borough is located in the Appalachian Mountains and is surrounded by rolling hills and valleys. The borough is situated in the Cumberland Valley, which is part of the Great Appalachian Valley. The borough is located in the Susquehanna River watershed.
Economy
The economy of Holly Springs Borough is largely based on agriculture and tourism. The borough is home to a number of farms, which produce a variety of crops, including corn, soybeans, hay, and wheat. The borough is also home to a number of tourist attractions, including the Holly Springs National Historic District, which is listed on the National Register of Historic Places.
The borough is also home to a number of small businesses, including restaurants, retail stores, and professional services. The borough is home to a number of manufacturing companies, including a plastics manufacturer and a metal fabrication company.
Demographics
As of the 2010 census, the population of Holly Springs Borough was 1,845. The racial makeup of the borough was 95.3% White, 1.2% African American, 0.2% Native American, 0.7% Asian, 0.1% Pacific Islander, 0.7% from other races, and 1.9% from two or more races. Hispanic or Latino of any race were 2.2% of the population.
The median household income in the borough was $45,938, and the median family income was $51,250. The per capita income for the borough was $20,945. About 8.3% of families and 10.2% of the population were below the poverty line, including 14.2% of those under age 18 and 5.2% of those age 65 or over.
Common Questions
What is Per Capita Income in Mount Holly Springs borough?
Per Capita income in Mount Holly Springs borough is $34,331.
What is the Median Family Income in Mount Holly Springs borough?
Median Family Income in Mount Holly Springs borough is $76,364.
What is the Median Household income in Mount Holly Springs borough?
Median Household Income in Mount Holly Springs borough is $65,972.
What is Income or Wage Gap in Mount Holly Springs borough?
Income or Wage Gap in Mount Holly Springs borough is 33.2%.
Women in Mount Holly Springs borough earn 66.8 cents for every dollar earned by a man.
What is Inequality or Gini Index in Mount Holly Springs borough?
Inequality or Gini Index in Mount Holly Springs borough is 0.48.
What is the Total Population of Mount Holly Springs borough?
Total Population of Mount Holly Springs borough is 2,325.
What is the Total Male Population of Mount Holly Springs borough?
Total Male Population of Mount Holly Springs borough is 1,246.
What is the Total Female Population of Mount Holly Springs borough?
Total Female Population of Mount Holly Springs borough is 1,079.
What is the Ratio of Males per 100 Females in Mount Holly Springs borough?
There are 115.48 Males per 100 Females in Mount Holly Springs borough.
What is the Ratio of Females per 100 Males in Mount Holly Springs borough?
There are 86.60 Females per 100 Males in Mount Holly Springs borough.
What is the Median Population Age in Mount Holly Springs borough?
Median Population Age in Mount Holly Springs borough is 41.3 Years.
What is the Average Family Size in Mount Holly Springs borough
Average Family Size in Mount Holly Springs borough is 3.2 People.
What is the Average Household Size in Mount Holly Springs borough
Average Household Size in Mount Holly Springs borough is 2.6 People.
How Large is the Labor Force in Mount Holly Springs borough?
There are 1,189 People in the Labor Forcein in Mount Holly Springs borough.
What is the Percentage of People in the Labor Force in Mount Holly Springs borough?
59.4% of People are in the Labor Force in Mount Holly Springs borough.
What is the Unemployment Rate in Mount Holly Springs borough?
Unemployment Rate in Mount Holly Springs borough is 6.2%.