Boothwyn, PA Map & Demographics
Boothwyn Map
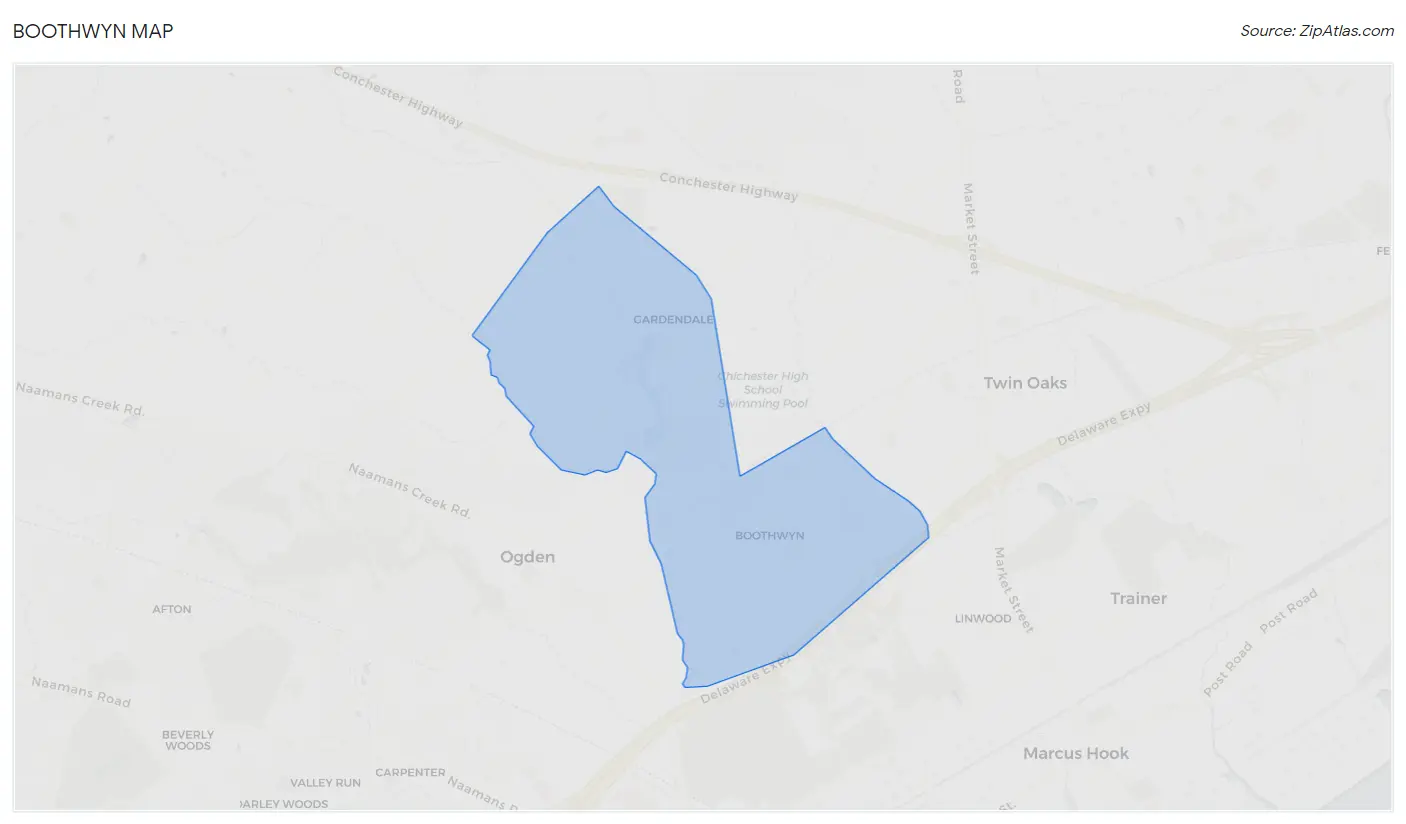
Boothwyn Overview
$39,929
PER CAPITA INCOME
$115,795
AVG FAMILY INCOME
$90,125
AVG HOUSEHOLD INCOME
47.8%
WAGE / INCOME GAP [ % ]
52.2¢/ $1
WAGE / INCOME GAP [ $ ]
0.38
INEQUALITY / GINI INDEX
5,506
TOTAL POPULATION
2,885
MALE POPULATION
2,621
FEMALE POPULATION
110.07
MALES / 100 FEMALES
90.85
FEMALES / 100 MALES
37.6
MEDIAN AGE
3.4
AVG FAMILY SIZE
2.7
AVG HOUSEHOLD SIZE
3,403
LABOR FORCE [ PEOPLE ]
73.7%
PERCENT IN LABOR FORCE
3.8%
UNEMPLOYMENT RATE
Income in Boothwyn
Income Overview in Boothwyn
Per Capita Income in Boothwyn is $39,929, while median incomes of families and households are $115,795 and $90,125 respectively.
| Characteristic | Number | Measure |
| Per Capita Income | 5,506 | $39,929 |
| Median Family Income | 1,307 | $115,795 |
| Mean Family Income | 1,307 | $123,401 |
| Median Household Income | 2,044 | $90,125 |
| Mean Household Income | 2,044 | $105,591 |
| Income Deficit | 1,307 | $0 |
| Wage / Income Gap (%) | 5,506 | 47.84% |
| Wage / Income Gap ($) | 5,506 | 52.16¢ per $1 |
| Gini / Inequality Index | 5,506 | 0.38 |
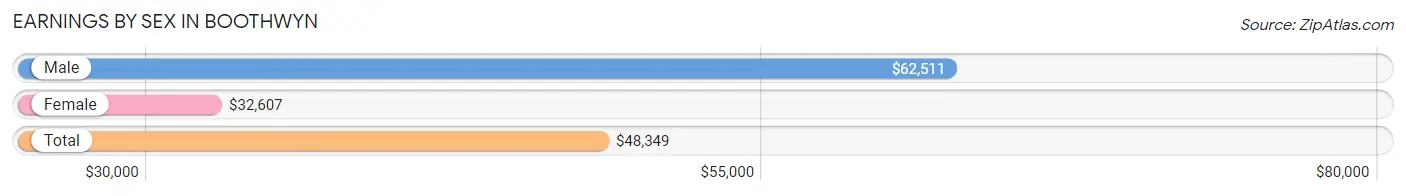
Earnings by Sex in Boothwyn
Average Earnings in Boothwyn are $48,349, $62,511 for men and $32,607 for women, a difference of 47.8%.
| Sex | Number | Average Earnings |
| Male | 1,833 (53.8%) | $62,511 |
| Female | 1,574 (46.2%) | $32,607 |
| Total | 3,407 (100.0%) | $48,349 |
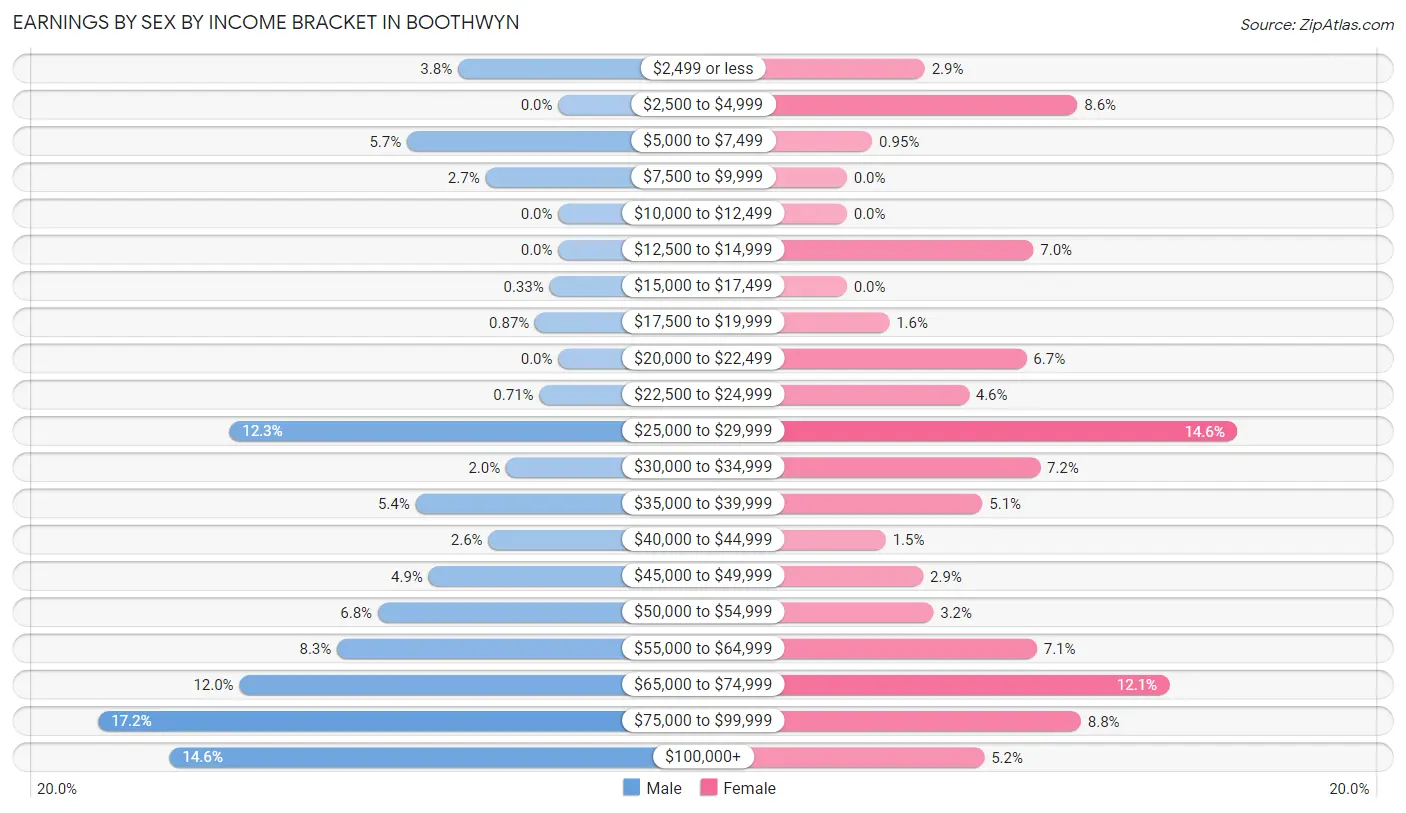
Earnings by Sex by Income Bracket in Boothwyn
The most common earnings brackets in Boothwyn are $75,000 to $99,999 for men (316 | 17.2%) and $25,000 to $29,999 for women (230 | 14.6%).
| Income | Male | Female |
| $2,499 or less | 69 (3.8%) | 46 (2.9%) |
| $2,500 to $4,999 | 0 (0.0%) | 136 (8.6%) |
| $5,000 to $7,499 | 104 (5.7%) | 15 (0.9%) |
| $7,500 to $9,999 | 50 (2.7%) | 0 (0.0%) |
| $10,000 to $12,499 | 0 (0.0%) | 0 (0.0%) |
| $12,500 to $14,999 | 0 (0.0%) | 110 (7.0%) |
| $15,000 to $17,499 | 6 (0.3%) | 0 (0.0%) |
| $17,500 to $19,999 | 16 (0.9%) | 25 (1.6%) |
| $20,000 to $22,499 | 0 (0.0%) | 106 (6.7%) |
| $22,500 to $24,999 | 13 (0.7%) | 72 (4.6%) |
| $25,000 to $29,999 | 226 (12.3%) | 230 (14.6%) |
| $30,000 to $34,999 | 36 (2.0%) | 114 (7.2%) |
| $35,000 to $39,999 | 98 (5.3%) | 80 (5.1%) |
| $40,000 to $44,999 | 48 (2.6%) | 23 (1.5%) |
| $45,000 to $49,999 | 89 (4.9%) | 45 (2.9%) |
| $50,000 to $54,999 | 124 (6.8%) | 51 (3.2%) |
| $55,000 to $64,999 | 152 (8.3%) | 112 (7.1%) |
| $65,000 to $74,999 | 219 (11.9%) | 190 (12.1%) |
| $75,000 to $99,999 | 316 (17.2%) | 138 (8.8%) |
| $100,000+ | 267 (14.6%) | 81 (5.1%) |
| Total | 1,833 (100.0%) | 1,574 (100.0%) |
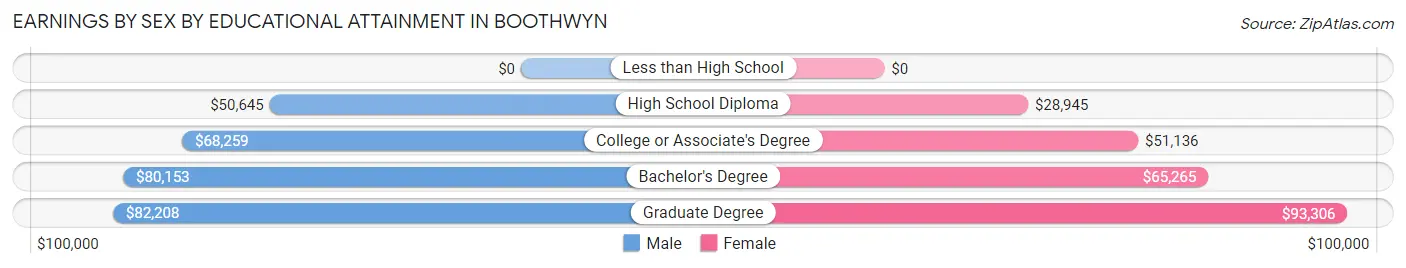
Earnings by Sex by Educational Attainment in Boothwyn
Average earnings in Boothwyn are $67,624 for men and $45,729 for women, a difference of 32.4%. Men with an educational attainment of graduate degree enjoy the highest average annual earnings of $82,208, while those with high school diploma education earn the least with $50,645. Women with an educational attainment of graduate degree earn the most with the average annual earnings of $93,306, while those with high school diploma education have the smallest earnings of $28,945.
| Educational Attainment | Male Income | Female Income |
| Less than High School | - | - |
| High School Diploma | $50,645 | $28,945 |
| College or Associate's Degree | $68,259 | $51,136 |
| Bachelor's Degree | $80,153 | $65,265 |
| Graduate Degree | $82,208 | $93,306 |
| Total | $67,624 | $45,729 |
Family Income in Boothwyn
Family Income Brackets in Boothwyn
According to the Boothwyn family income data, there are 370 families falling into the $100,000 to $149,999 income range, which is the most common income bracket and makes up 28.3% of all families.
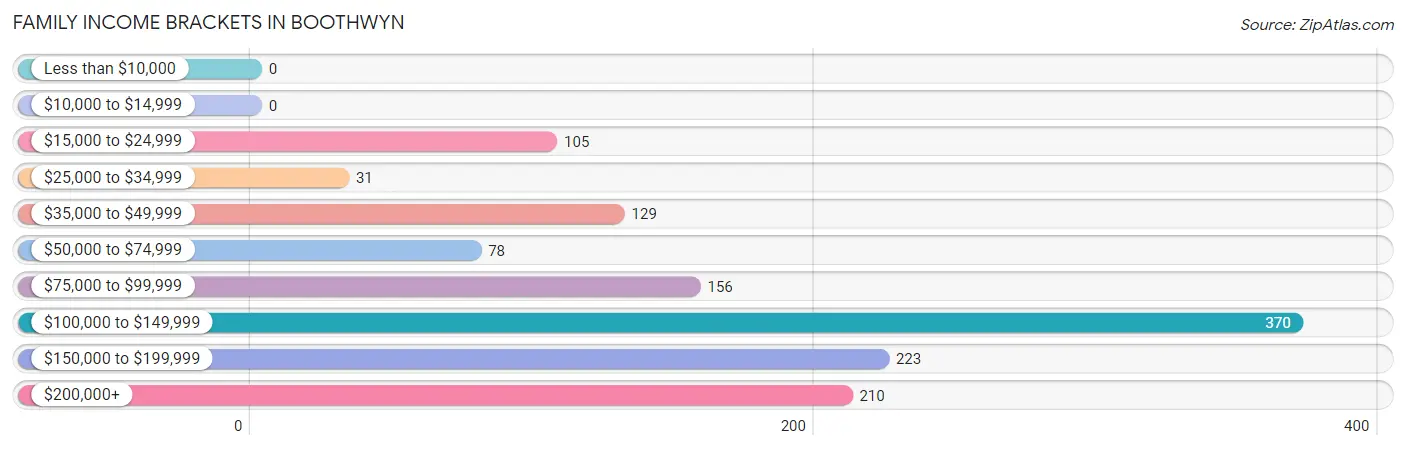
| Income Bracket | # Families | % Families |
| Less than $10,000 | 0 | 0.0% |
| $10,000 to $14,999 | 0 | 0.0% |
| $15,000 to $24,999 | 105 | 8.0% |
| $25,000 to $34,999 | 31 | 2.4% |
| $35,000 to $49,999 | 129 | 9.9% |
| $50,000 to $74,999 | 78 | 6.0% |
| $75,000 to $99,999 | 156 | 11.9% |
| $100,000 to $149,999 | 370 | 28.3% |
| $150,000 to $199,999 | 223 | 17.1% |
| $200,000+ | 210 | 16.1% |
Family Income by Famaliy Size in Boothwyn
5-person families (145 | 11.1%) account for the highest median family income in Boothwyn with $180,982 per family, while 2-person families (434 | 33.2%) have the highest median income of $44,444 per family member.
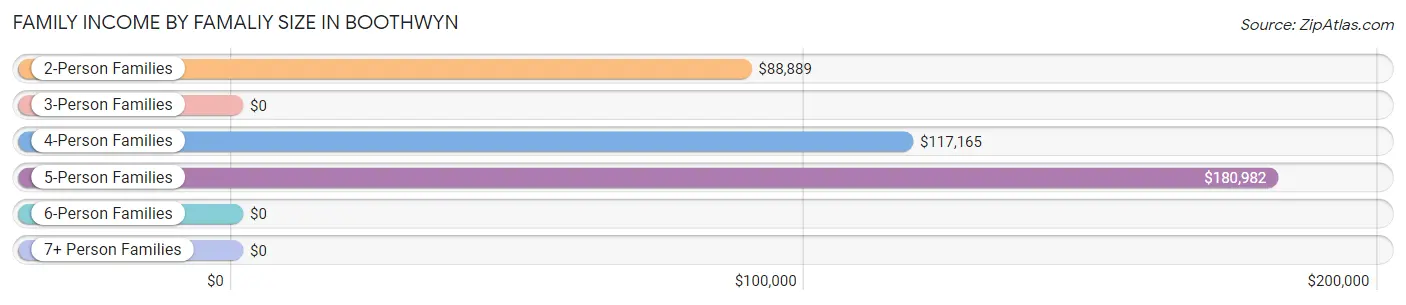
| Income Bracket | # Families | Median Income |
| 2-Person Families | 434 (33.2%) | $88,889 |
| 3-Person Families | 300 (23.0%) | $0 |
| 4-Person Families | 354 (27.1%) | $117,165 |
| 5-Person Families | 145 (11.1%) | $180,982 |
| 6-Person Families | 8 (0.6%) | $0 |
| 7+ Person Families | 66 (5.1%) | $0 |
| Total | 1,307 (100.0%) | $115,795 |
Family Income by Number of Earners in Boothwyn
The median family income in Boothwyn is $115,795, with families comprising 3+ earners (401) having the highest median family income of $180,982, while families with 1 earner (357) have the lowest median family income of $69,574, accounting for 30.7% and 27.3% of families, respectively.
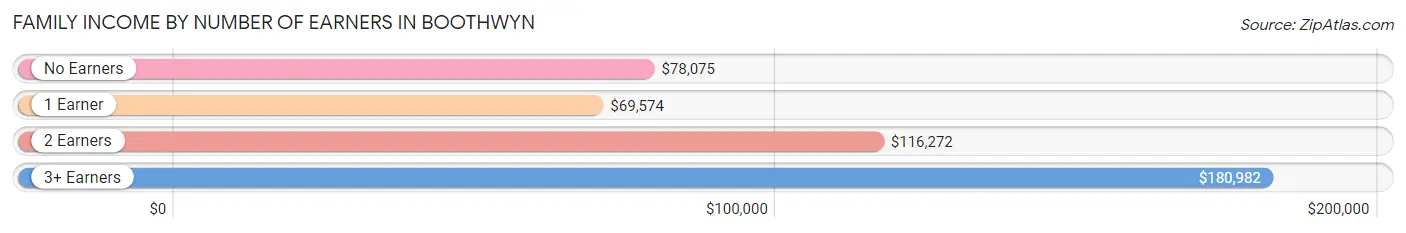
| Number of Earners | # Families | Median Income |
| No Earners | 145 (11.1%) | $78,075 |
| 1 Earner | 357 (27.3%) | $69,574 |
| 2 Earners | 404 (30.9%) | $116,272 |
| 3+ Earners | 401 (30.7%) | $180,982 |
| Total | 1,307 (100.0%) | $115,795 |
Household Income in Boothwyn
Household Income Brackets in Boothwyn
With 439 households falling in the category, the $50,000 to $74,999 income range is the most frequent in Boothwyn, accounting for 21.5% of all households. In contrast, only 33 households (1.6%) fall into the $10,000 to $14,999 income bracket, making it the least populous group.
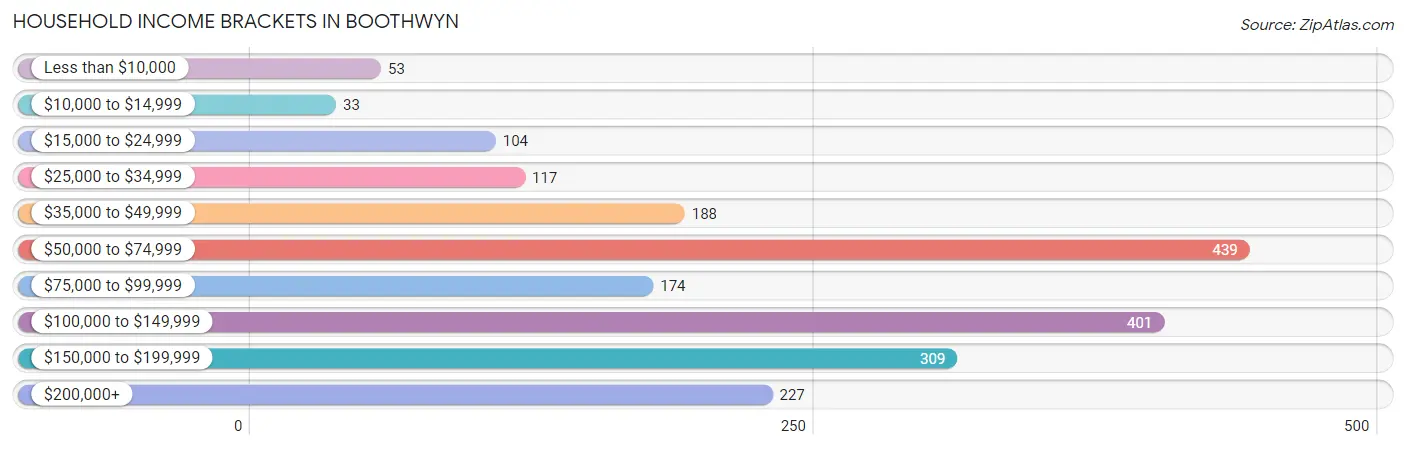
| Income Bracket | # Households | % Households |
| Less than $10,000 | 53 | 2.6% |
| $10,000 to $14,999 | 33 | 1.6% |
| $15,000 to $24,999 | 104 | 5.1% |
| $25,000 to $34,999 | 117 | 5.7% |
| $35,000 to $49,999 | 188 | 9.2% |
| $50,000 to $74,999 | 439 | 21.5% |
| $75,000 to $99,999 | 174 | 8.5% |
| $100,000 to $149,999 | 401 | 19.6% |
| $150,000 to $199,999 | 309 | 15.1% |
| $200,000+ | 227 | 11.1% |
Household Income by Householder Age in Boothwyn
The median household income in Boothwyn is $90,125, with the highest median household income of $116,203 found in the 45 to 64 years age bracket for the primary householder. A total of 895 households (43.8%) fall into this category. Meanwhile, the 15 to 24 years age bracket for the primary householder has the lowest median household income of $53,014, with 170 households (8.3%) in this group.
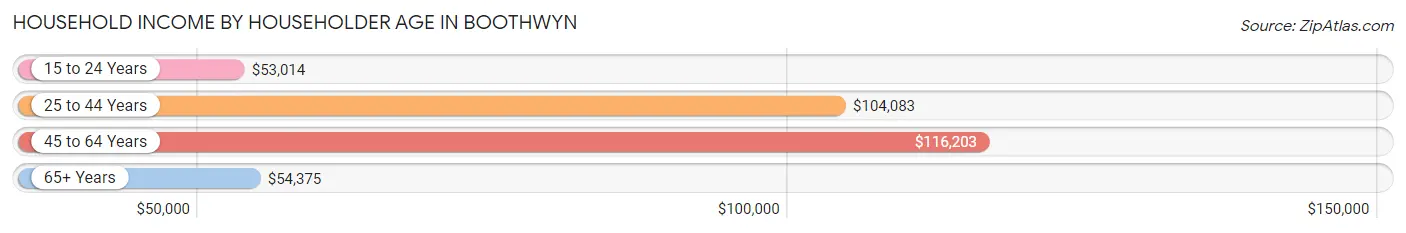
| Income Bracket | # Households | Median Income |
| 15 to 24 Years | 170 (8.3%) | $53,014 |
| 25 to 44 Years | 529 (25.9%) | $104,083 |
| 45 to 64 Years | 895 (43.8%) | $116,203 |
| 65+ Years | 450 (22.0%) | $54,375 |
| Total | 2,044 (100.0%) | $90,125 |
Poverty in Boothwyn
Income Below Poverty by Sex and Age in Boothwyn
With 3.0% poverty level for males and 11.2% for females among the residents of Boothwyn, 5 year old males and 6 to 11 year old females are the most vulnerable to poverty, with 36 males (72.0%) and 66 females (42.6%) in their respective age groups living below the poverty level.
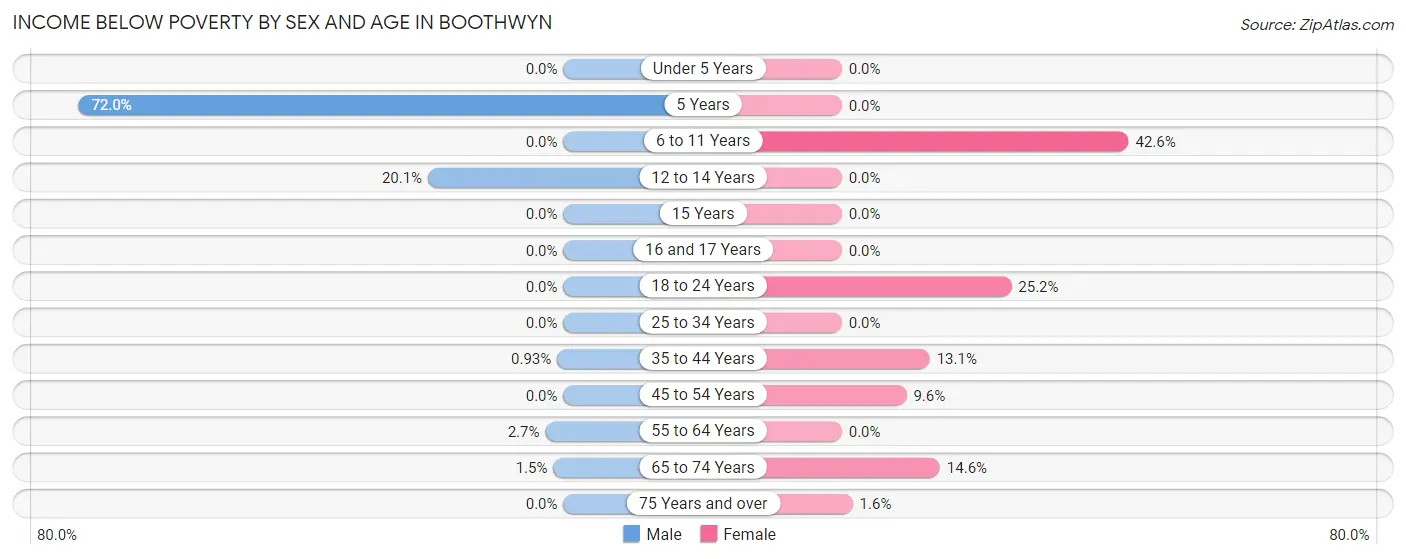
| Age Bracket | Male | Female |
| Under 5 Years | 0 (0.0%) | 0 (0.0%) |
| 5 Years | 36 (72.0%) | 0 (0.0%) |
| 6 to 11 Years | 0 (0.0%) | 66 (42.6%) |
| 12 to 14 Years | 35 (20.1%) | 0 (0.0%) |
| 15 Years | 0 (0.0%) | 0 (0.0%) |
| 16 and 17 Years | 0 (0.0%) | 0 (0.0%) |
| 18 to 24 Years | 0 (0.0%) | 107 (25.2%) |
| 25 to 34 Years | 0 (0.0%) | 0 (0.0%) |
| 35 to 44 Years | 2 (0.9%) | 32 (13.1%) |
| 45 to 54 Years | 0 (0.0%) | 43 (9.6%) |
| 55 to 64 Years | 10 (2.7%) | 0 (0.0%) |
| 65 to 74 Years | 4 (1.5%) | 44 (14.6%) |
| 75 Years and over | 0 (0.0%) | 2 (1.6%) |
| Total | 87 (3.0%) | 294 (11.2%) |
Income Above Poverty by Sex and Age in Boothwyn
According to the poverty statistics in Boothwyn, males aged under 5 years and females aged under 5 years are the age groups that are most secure financially, with 100.0% of males and 100.0% of females in these age groups living above the poverty line.
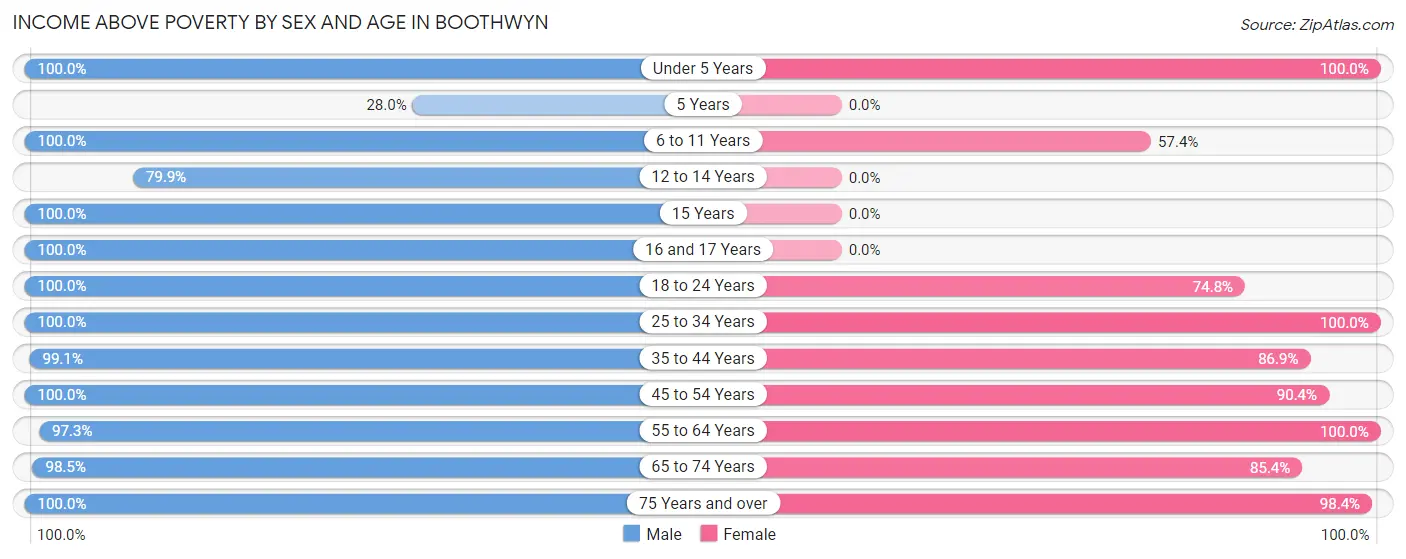
| Age Bracket | Male | Female |
| Under 5 Years | 91 (100.0%) | 54 (100.0%) |
| 5 Years | 14 (28.0%) | 0 (0.0%) |
| 6 to 11 Years | 296 (100.0%) | 89 (57.4%) |
| 12 to 14 Years | 139 (79.9%) | 0 (0.0%) |
| 15 Years | 69 (100.0%) | 0 (0.0%) |
| 16 and 17 Years | 8 (100.0%) | 0 (0.0%) |
| 18 to 24 Years | 232 (100.0%) | 318 (74.8%) |
| 25 to 34 Years | 596 (100.0%) | 442 (100.0%) |
| 35 to 44 Years | 212 (99.1%) | 213 (86.9%) |
| 45 to 54 Years | 483 (100.0%) | 405 (90.4%) |
| 55 to 64 Years | 363 (97.3%) | 426 (100.0%) |
| 65 to 74 Years | 264 (98.5%) | 258 (85.4%) |
| 75 Years and over | 31 (100.0%) | 122 (98.4%) |
| Total | 2,798 (97.0%) | 2,327 (88.8%) |
Income Below Poverty Among Married-Couple Families in Boothwyn
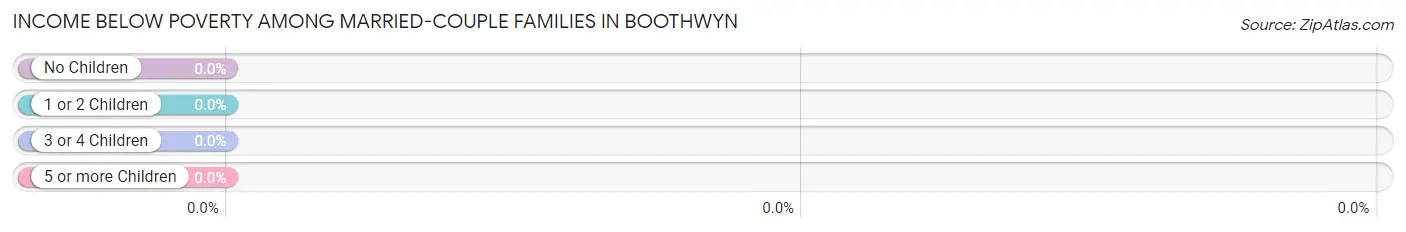
| Children | Above Poverty | Below Poverty |
| No Children | 500 (100.0%) | 0 (0.0%) |
| 1 or 2 Children | 614 (100.0%) | 0 (0.0%) |
| 3 or 4 Children | 0 (0.0%) | 0 (0.0%) |
| 5 or more Children | 0 (0.0%) | 0 (0.0%) |
| Total | 1,114 (100.0%) | 0 (0.0%) |
Income Below Poverty Among Single-Parent Households in Boothwyn
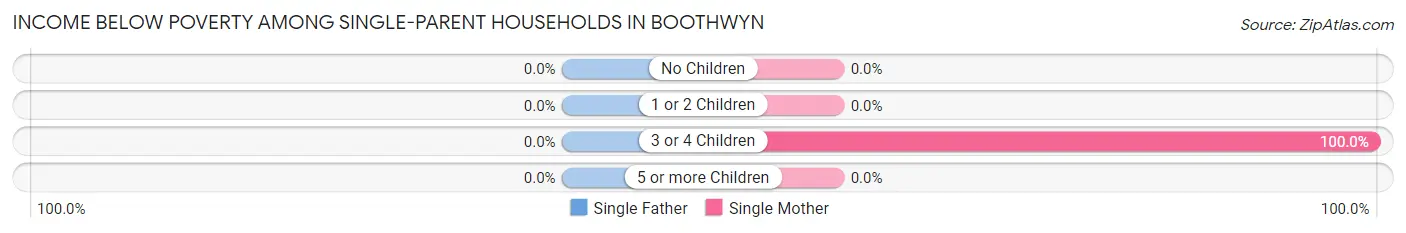
| Children | Single Father | Single Mother |
| No Children | 0 (0.0%) | 0 (0.0%) |
| 1 or 2 Children | 0 (0.0%) | 0 (0.0%) |
| 3 or 4 Children | 0 (0.0%) | 32 (100.0%) |
| 5 or more Children | 0 (0.0%) | 0 (0.0%) |
| Total | 0 (0.0%) | 32 (18.0%) |
Income Below Poverty Among Married-Couple vs Single-Parent Households in Boothwyn
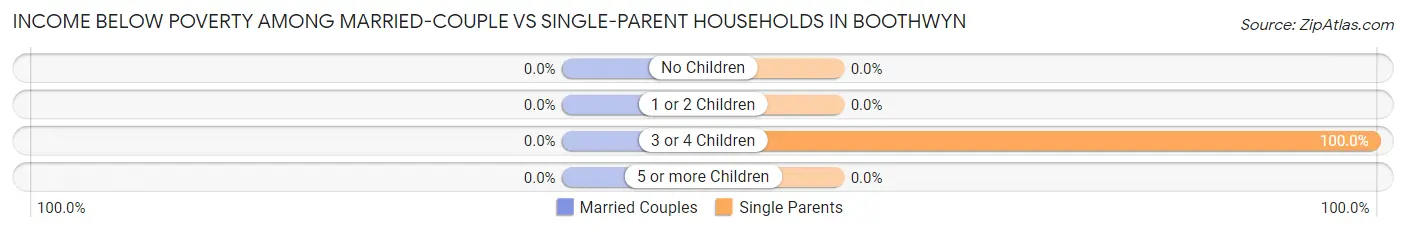
| Children | Married-Couple Families | Single-Parent Households |
| No Children | 0 (0.0%) | 0 (0.0%) |
| 1 or 2 Children | 0 (0.0%) | 0 (0.0%) |
| 3 or 4 Children | 0 (0.0%) | 32 (100.0%) |
| 5 or more Children | 0 (0.0%) | 0 (0.0%) |
| Total | 0 (0.0%) | 32 (16.6%) |
Race in Boothwyn
The most populous races in Boothwyn are White / Caucasian (4,554 | 82.7%), Asian (530 | 9.6%), and Hispanic or Latino (354 | 6.4%).
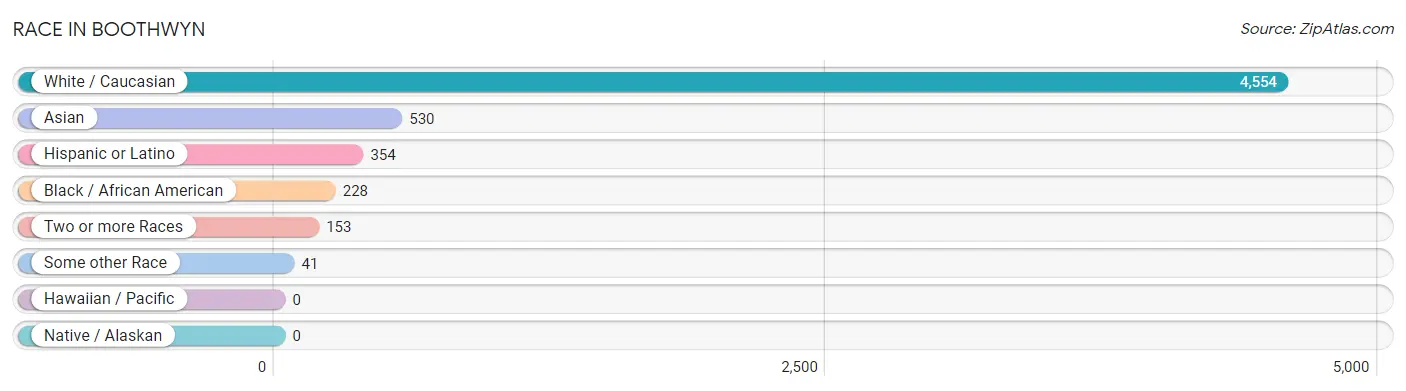
| Race | # Population | % Population |
| Asian | 530 | 9.6% |
| Black / African American | 228 | 4.1% |
| Hawaiian / Pacific | 0 | 0.0% |
| Hispanic or Latino | 354 | 6.4% |
| Native / Alaskan | 0 | 0.0% |
| White / Caucasian | 4,554 | 82.7% |
| Two or more Races | 153 | 2.8% |
| Some other Race | 41 | 0.7% |
| Total | 5,506 | 100.0% |
Ancestry in Boothwyn
The most populous ancestries reported in Boothwyn are Irish (1,651 | 30.0%), Italian (985 | 17.9%), German (700 | 12.7%), English (447 | 8.1%), and Japanese (413 | 7.5%), together accounting for 76.2% of all Boothwyn residents.
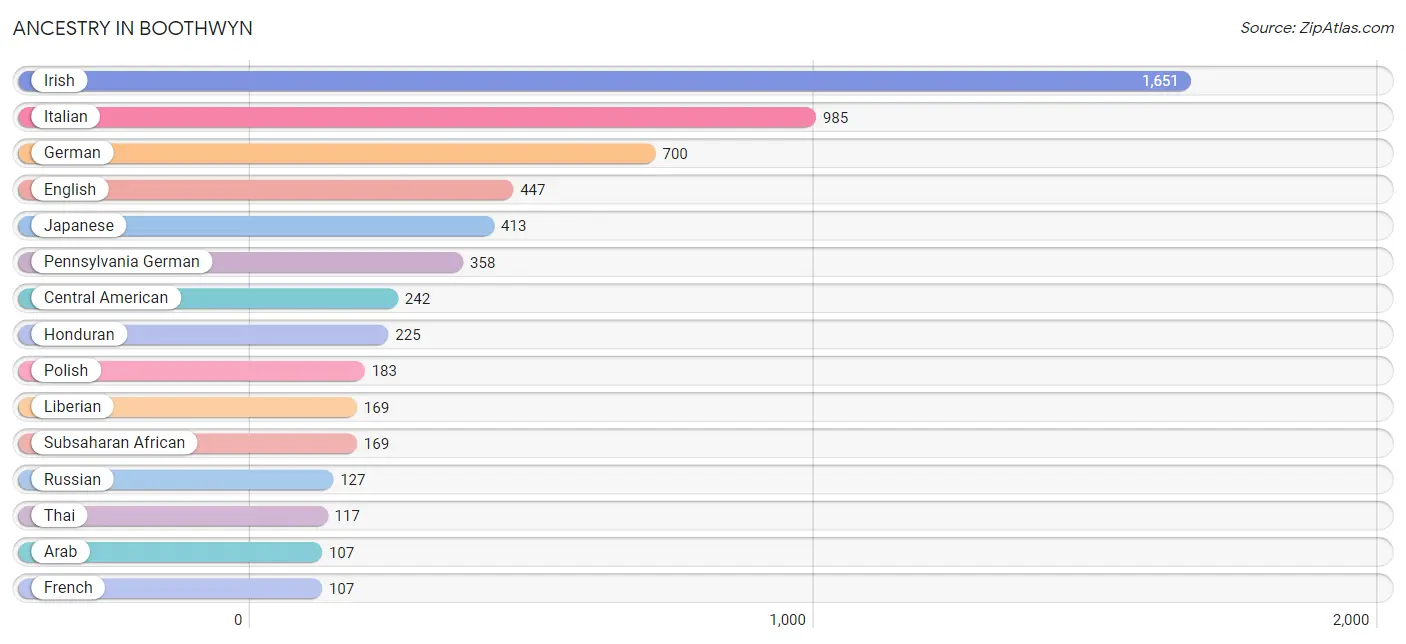
| Ancestry | # Population | % Population |
| American | 74 | 1.3% |
| Arab | 107 | 1.9% |
| Argentinean | 32 | 0.6% |
| Austrian | 10 | 0.2% |
| Blackfeet | 4 | 0.1% |
| Central American | 242 | 4.4% |
| Dutch | 16 | 0.3% |
| English | 447 | 8.1% |
| European | 59 | 1.1% |
| French | 107 | 1.9% |
| German | 700 | 12.7% |
| Honduran | 225 | 4.1% |
| Irish | 1,651 | 30.0% |
| Italian | 985 | 17.9% |
| Japanese | 413 | 7.5% |
| Lebanese | 107 | 1.9% |
| Liberian | 169 | 3.1% |
| Lithuanian | 15 | 0.3% |
| Norwegian | 10 | 0.2% |
| Panamanian | 17 | 0.3% |
| Pennsylvania German | 358 | 6.5% |
| Polish | 183 | 3.3% |
| Puerto Rican | 80 | 1.5% |
| Russian | 127 | 2.3% |
| Scotch-Irish | 10 | 0.2% |
| Scottish | 35 | 0.6% |
| Slovak | 14 | 0.3% |
| South American | 32 | 0.6% |
| Subsaharan African | 169 | 3.1% |
| Swiss | 18 | 0.3% |
| Thai | 117 | 2.1% |
| Ukrainian | 67 | 1.2% | View All 32 Rows |
Immigrants in Boothwyn
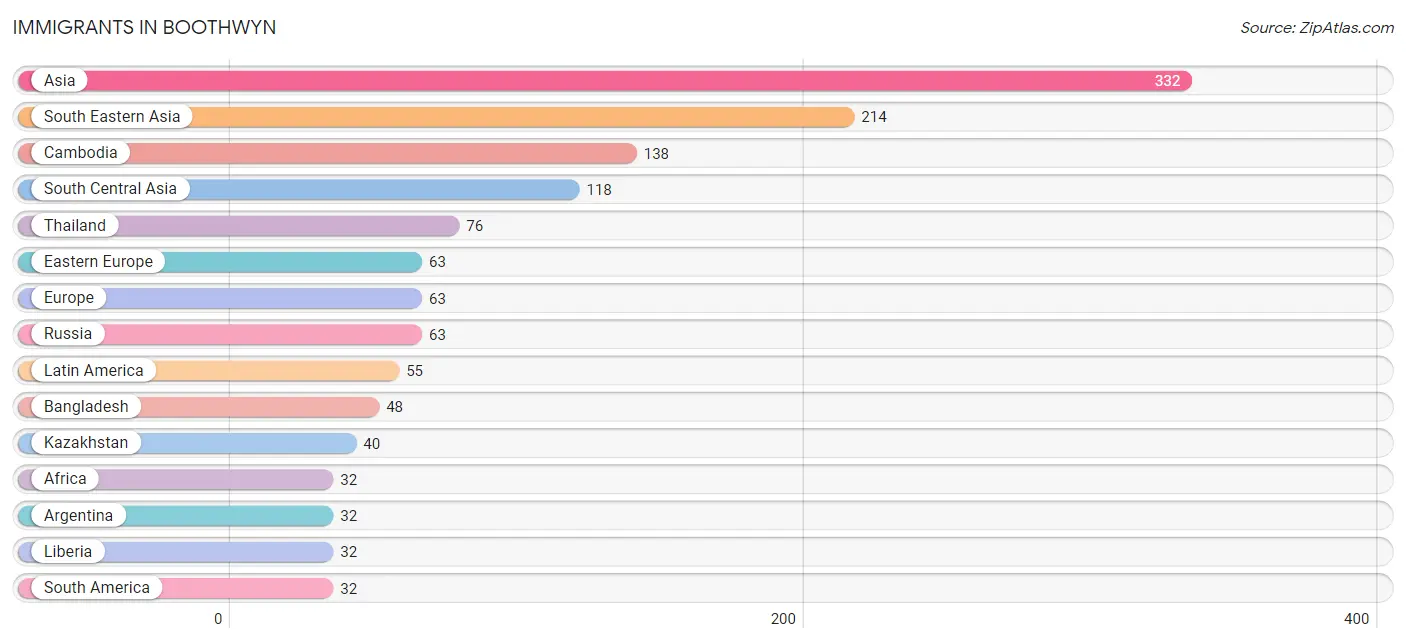
The most numerous immigrant groups reported in Boothwyn came from Asia (332 | 6.0%), South Eastern Asia (214 | 3.9%), Cambodia (138 | 2.5%), South Central Asia (118 | 2.1%), and Thailand (76 | 1.4%), together accounting for 16.0% of all Boothwyn residents.
| Immigration Origin | # Population | % Population |
| Africa | 32 | 0.6% |
| Argentina | 32 | 0.6% |
| Asia | 332 | 6.0% |
| Bangladesh | 48 | 0.9% |
| Cambodia | 138 | 2.5% |
| Central America | 23 | 0.4% |
| Eastern Europe | 63 | 1.1% |
| Europe | 63 | 1.1% |
| Honduras | 6 | 0.1% |
| India | 30 | 0.5% |
| Kazakhstan | 40 | 0.7% |
| Latin America | 55 | 1.0% |
| Liberia | 32 | 0.6% |
| Panama | 17 | 0.3% |
| Russia | 63 | 1.1% |
| South America | 32 | 0.6% |
| South Central Asia | 118 | 2.1% |
| South Eastern Asia | 214 | 3.9% |
| Thailand | 76 | 1.4% |
| Western Africa | 32 | 0.6% | View All 20 Rows |
Sex and Age in Boothwyn
Sex and Age in Boothwyn
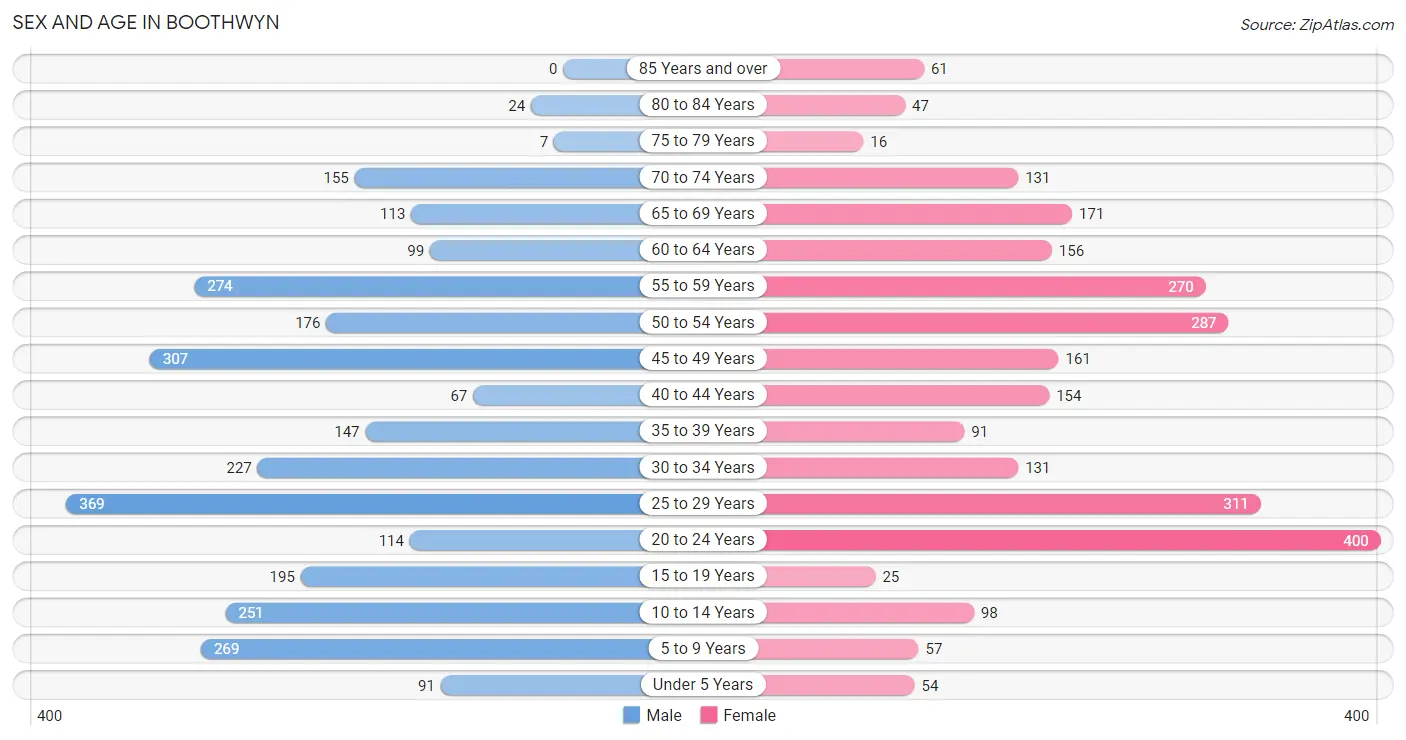
The most populous age groups in Boothwyn are 25 to 29 Years (369 | 12.8%) for men and 20 to 24 Years (400 | 15.3%) for women.
| Age Bracket | Male | Female |
| Under 5 Years | 91 (3.2%) | 54 (2.1%) |
| 5 to 9 Years | 269 (9.3%) | 57 (2.2%) |
| 10 to 14 Years | 251 (8.7%) | 98 (3.7%) |
| 15 to 19 Years | 195 (6.8%) | 25 (0.9%) |
| 20 to 24 Years | 114 (4.0%) | 400 (15.3%) |
| 25 to 29 Years | 369 (12.8%) | 311 (11.9%) |
| 30 to 34 Years | 227 (7.9%) | 131 (5.0%) |
| 35 to 39 Years | 147 (5.1%) | 91 (3.5%) |
| 40 to 44 Years | 67 (2.3%) | 154 (5.9%) |
| 45 to 49 Years | 307 (10.6%) | 161 (6.1%) |
| 50 to 54 Years | 176 (6.1%) | 287 (11.0%) |
| 55 to 59 Years | 274 (9.5%) | 270 (10.3%) |
| 60 to 64 Years | 99 (3.4%) | 156 (5.9%) |
| 65 to 69 Years | 113 (3.9%) | 171 (6.5%) |
| 70 to 74 Years | 155 (5.4%) | 131 (5.0%) |
| 75 to 79 Years | 7 (0.2%) | 16 (0.6%) |
| 80 to 84 Years | 24 (0.8%) | 47 (1.8%) |
| 85 Years and over | 0 (0.0%) | 61 (2.3%) |
| Total | 2,885 (100.0%) | 2,621 (100.0%) |
Families and Households in Boothwyn
Median Family Size in Boothwyn
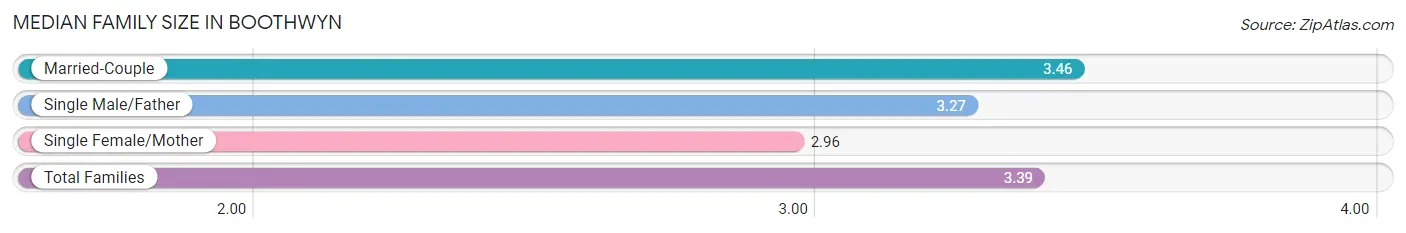
The median family size in Boothwyn is 3.39 persons per family, with married-couple families (1,114 | 85.2%) accounting for the largest median family size of 3.46 persons per family. On the other hand, single female/mother families (178 | 13.6%) represent the smallest median family size with 2.96 persons per family.
| Family Type | # Families | Family Size |
| Married-Couple | 1,114 (85.2%) | 3.46 |
| Single Male/Father | 15 (1.1%) | 3.27 |
| Single Female/Mother | 178 (13.6%) | 2.96 |
| Total Families | 1,307 (100.0%) | 3.39 |
Median Household Size in Boothwyn
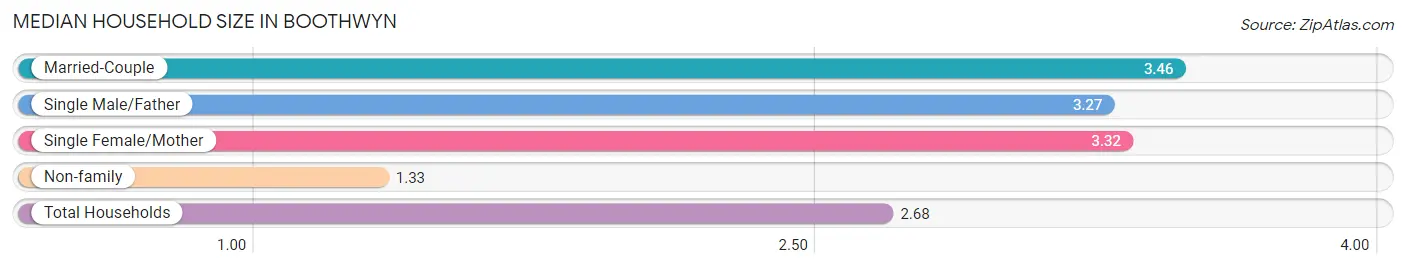
The median household size in Boothwyn is 2.68 persons per household, with married-couple households (1,114 | 54.5%) accounting for the largest median household size of 3.46 persons per household. non-family households (737 | 36.1%) represent the smallest median household size with 1.33 persons per household.
| Household Type | # Households | Household Size |
| Married-Couple | 1,114 (54.5%) | 3.46 |
| Single Male/Father | 15 (0.7%) | 3.27 |
| Single Female/Mother | 178 (8.7%) | 3.32 |
| Non-family | 737 (36.1%) | 1.33 |
| Total Households | 2,044 (100.0%) | 2.68 |
Household Size by Marriage Status in Boothwyn
Out of a total of 2,044 households in Boothwyn, 1,307 (63.9%) are family households, while 737 (36.1%) are nonfamily households. The most numerous type of family households are 2-person households, comprising 379, and the most common type of nonfamily households are 1-person households, comprising 506.
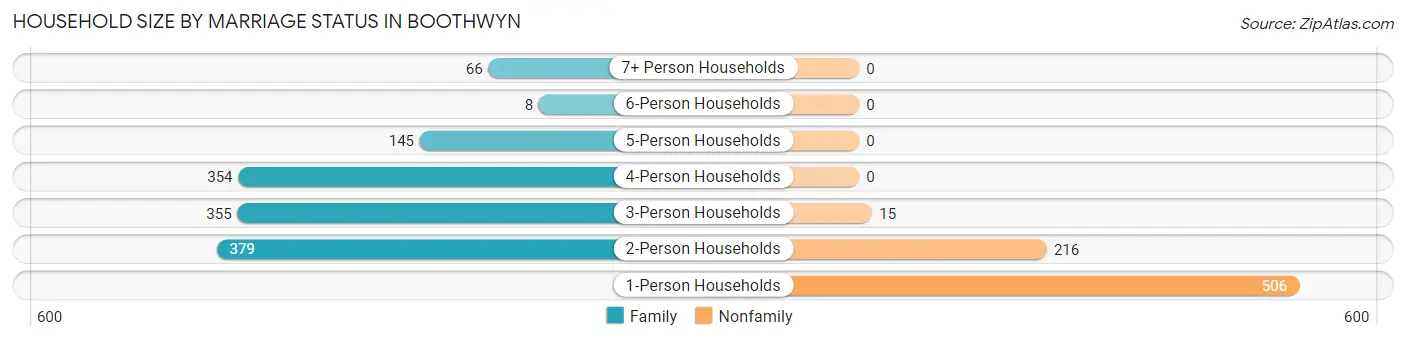
| Household Size | Family Households | Nonfamily Households |
| 1-Person Households | - | 506 (24.8%) |
| 2-Person Households | 379 (18.5%) | 216 (10.6%) |
| 3-Person Households | 355 (17.4%) | 15 (0.7%) |
| 4-Person Households | 354 (17.3%) | 0 (0.0%) |
| 5-Person Households | 145 (7.1%) | 0 (0.0%) |
| 6-Person Households | 8 (0.4%) | 0 (0.0%) |
| 7+ Person Households | 66 (3.2%) | 0 (0.0%) |
| Total | 1,307 (63.9%) | 737 (36.1%) |
Female Fertility in Boothwyn
Fertility by Age in Boothwyn
Average fertility rate in Boothwyn is 20.0 births per 1,000 women. Women in the age bracket of 20 to 34 years have the highest fertility rate with 33.0 births per 1,000 women. Women in the age bracket of 20 to 34 years acount for 100.0% of all women with births.
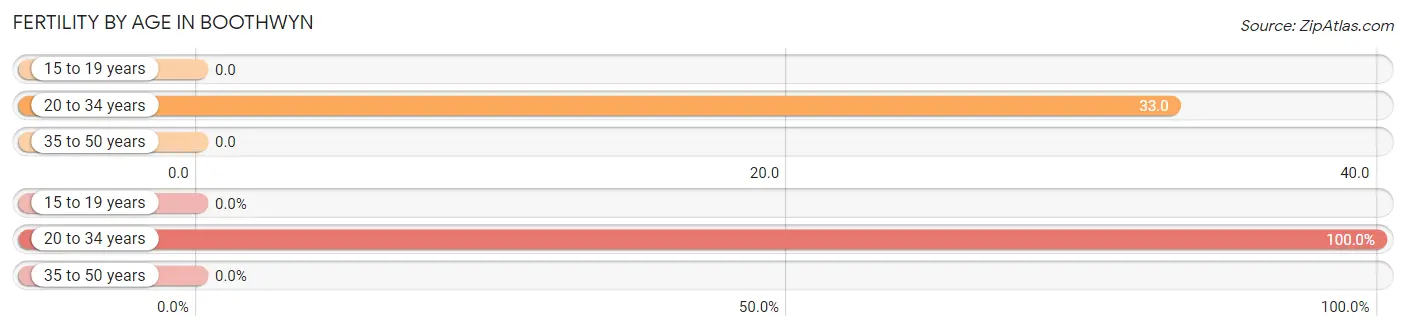
| Age Bracket | Women with Births | Births / 1,000 Women |
| 15 to 19 years | 0 (0.0%) | 0.0 |
| 20 to 34 years | 28 (100.0%) | 33.0 |
| 35 to 50 years | 0 (0.0%) | 0.0 |
| Total | 28 (100.0%) | 20.0 |
Fertility by Age by Marriage Status in Boothwyn
42.9% of women with births (28) in Boothwyn are married. The highest percentage of unmarried women with births falls into 20 to 34 years age bracket with 57.1% of them unmarried at the time of birth, while the lowest percentage of unmarried women with births belong to 20 to 34 years age bracket with 57.1% of them unmarried.
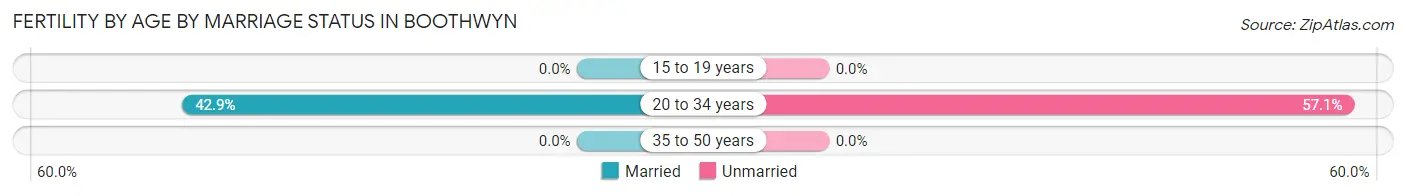
| Age Bracket | Married | Unmarried |
| 15 to 19 years | 0 (0.0%) | 0 (0.0%) |
| 20 to 34 years | 12 (42.9%) | 16 (57.1%) |
| 35 to 50 years | 0 (0.0%) | 0 (0.0%) |
| Total | 12 (42.9%) | 16 (57.1%) |
Fertility by Education in Boothwyn
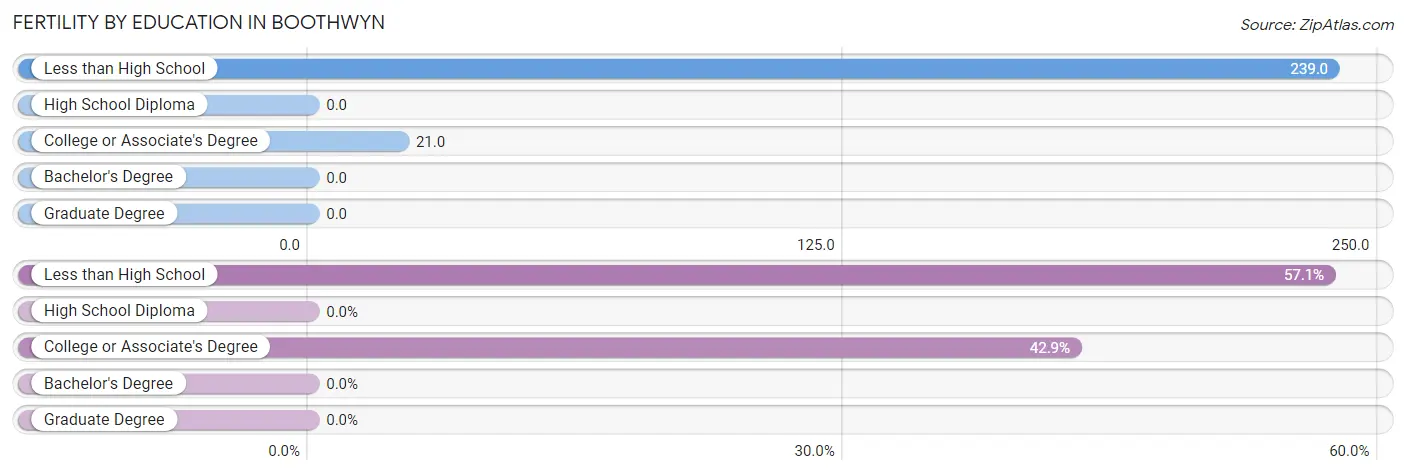
| Educational Attainment | Women with Births | Births / 1,000 Women |
| Less than High School | 16 (57.1%) | 239.0 |
| High School Diploma | 0 (0.0%) | 0.0 |
| College or Associate's Degree | 12 (42.9%) | 21.0 |
| Bachelor's Degree | 0 (0.0%) | 0.0 |
| Graduate Degree | 0 (0.0%) | 0.0 |
| Total | 28 (100.0%) | 20.0 |
Fertility by Education by Marriage Status in Boothwyn
57.1% of women with births in Boothwyn are unmarried. Women with the educational attainment of college or associate's degree are most likely to be married with 100.0% of them married at childbirth, while women with the educational attainment of less than high school are least likely to be married with 100.0% of them unmarried at childbirth.
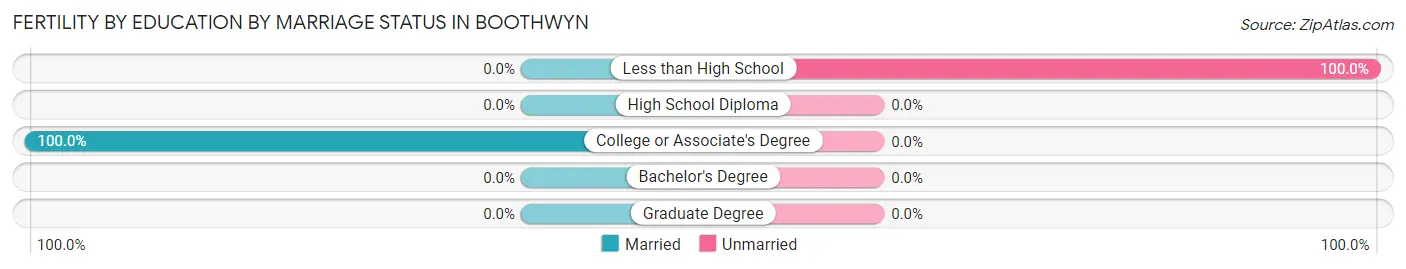
| Educational Attainment | Married | Unmarried |
| Less than High School | 0 (0.0%) | 16 (100.0%) |
| High School Diploma | 0 (0.0%) | 0 (0.0%) |
| College or Associate's Degree | 12 (100.0%) | 0 (0.0%) |
| Bachelor's Degree | 0 (0.0%) | 0 (0.0%) |
| Graduate Degree | 0 (0.0%) | 0 (0.0%) |
| Total | 12 (42.9%) | 16 (57.1%) |
Employment Characteristics in Boothwyn
Employment by Class of Employer in Boothwyn
Among the 3,221 employed individuals in Boothwyn, private company employees (2,625 | 81.5%), local government employees (308 | 9.6%), and not-for-profit organizations (147 | 4.6%) make up the most common classes of employment.
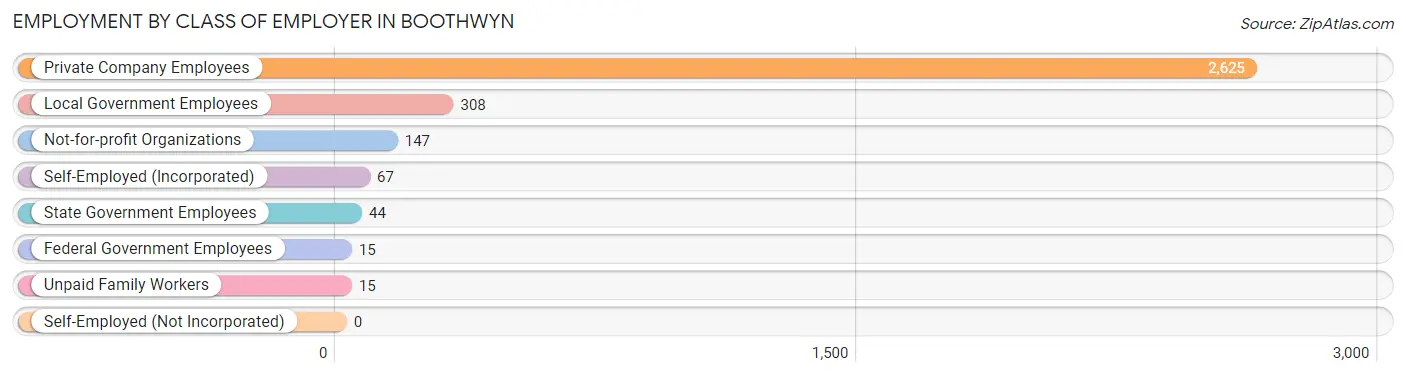
| Employer Class | # Employees | % Employees |
| Private Company Employees | 2,625 | 81.5% |
| Self-Employed (Incorporated) | 67 | 2.1% |
| Self-Employed (Not Incorporated) | 0 | 0.0% |
| Not-for-profit Organizations | 147 | 4.6% |
| Local Government Employees | 308 | 9.6% |
| State Government Employees | 44 | 1.4% |
| Federal Government Employees | 15 | 0.5% |
| Unpaid Family Workers | 15 | 0.5% |
| Total | 3,221 | 100.0% |
Employment Status by Age in Boothwyn
According to the labor force statistics for Boothwyn, out of the total population over 16 years of age (4,617), 73.7% or 3,403 individuals are in the labor force, with 3.8% or 129 of them unemployed. The age group with the highest labor force participation rate is 25 to 29 years, with 97.6% or 664 individuals in the labor force. Within the labor force, the 55 to 59 years age range has the highest percentage of unemployed individuals, with 13.1% or 51 of them being unemployed.
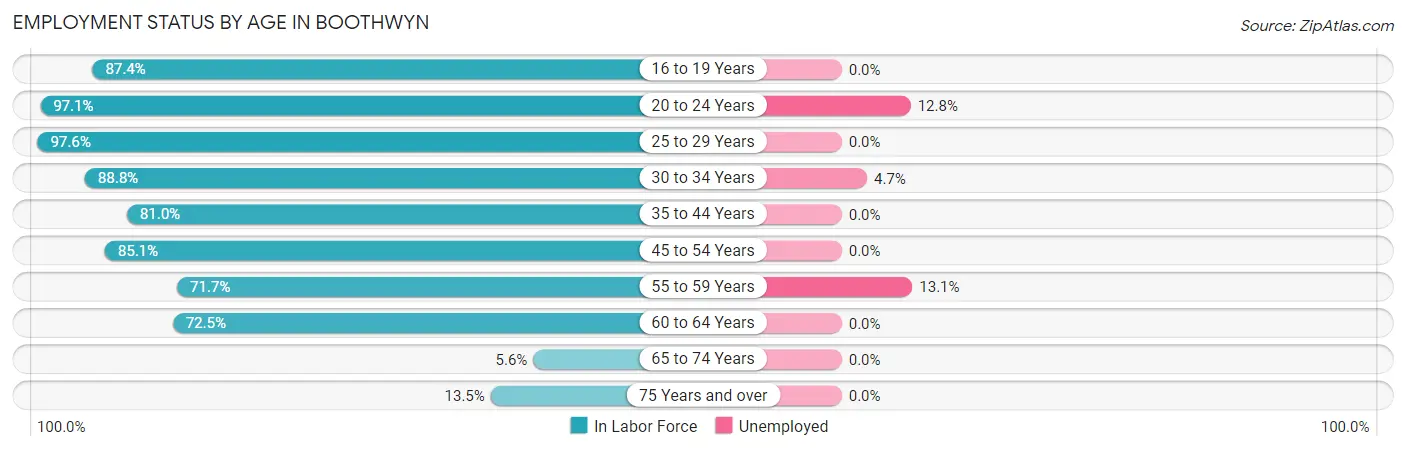
| Age Bracket | In Labor Force | Unemployed |
| 16 to 19 Years | 132 (87.4%) | 0 (0.0%) |
| 20 to 24 Years | 499 (97.1%) | 64 (12.8%) |
| 25 to 29 Years | 664 (97.6%) | 0 (0.0%) |
| 30 to 34 Years | 318 (88.8%) | 15 (4.7%) |
| 35 to 44 Years | 372 (81.0%) | 0 (0.0%) |
| 45 to 54 Years | 792 (85.1%) | 0 (0.0%) |
| 55 to 59 Years | 390 (71.7%) | 51 (13.1%) |
| 60 to 64 Years | 185 (72.5%) | 0 (0.0%) |
| 65 to 74 Years | 32 (5.6%) | 0 (0.0%) |
| 75 Years and over | 21 (13.5%) | 0 (0.0%) |
| Total | 3,403 (73.7%) | 129 (3.8%) |
Employment Status by Educational Attainment in Boothwyn
According to labor force statistics for Boothwyn, 84.3% of individuals (2,720) out of the total population between 25 and 64 years of age (3,227) are in the labor force, with 2.4% or 65 of them being unemployed. The group with the highest labor force participation rate are those with the educational attainment of college / associate degree, with 89.8% or 971 individuals in the labor force. Within the labor force, individuals with bachelor's degree or higher education have the highest percentage of unemployment, with 7.6% or 56 of them being unemployed.
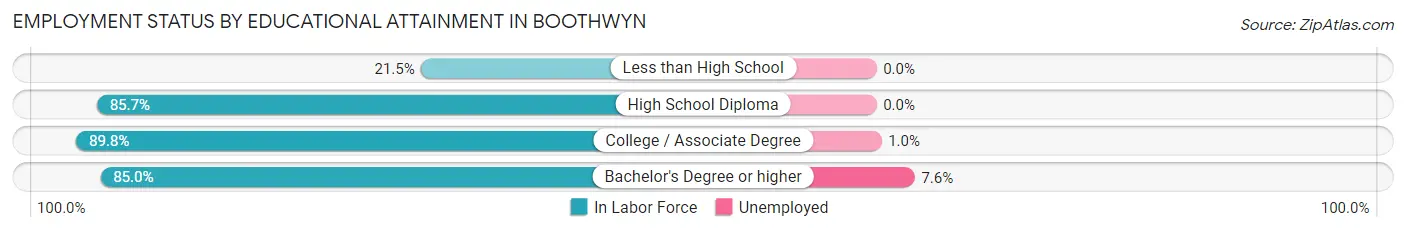
| Educational Attainment | In Labor Force | Unemployed |
| Less than High School | 28 (21.5%) | 0 (0.0%) |
| High School Diploma | 989 (85.7%) | 0 (0.0%) |
| College / Associate Degree | 971 (89.8%) | 11 (1.0%) |
| Bachelor's Degree or higher | 733 (85.0%) | 66 (7.6%) |
| Total | 2,720 (84.3%) | 77 (2.4%) |
Employment Occupations by Sex in Boothwyn
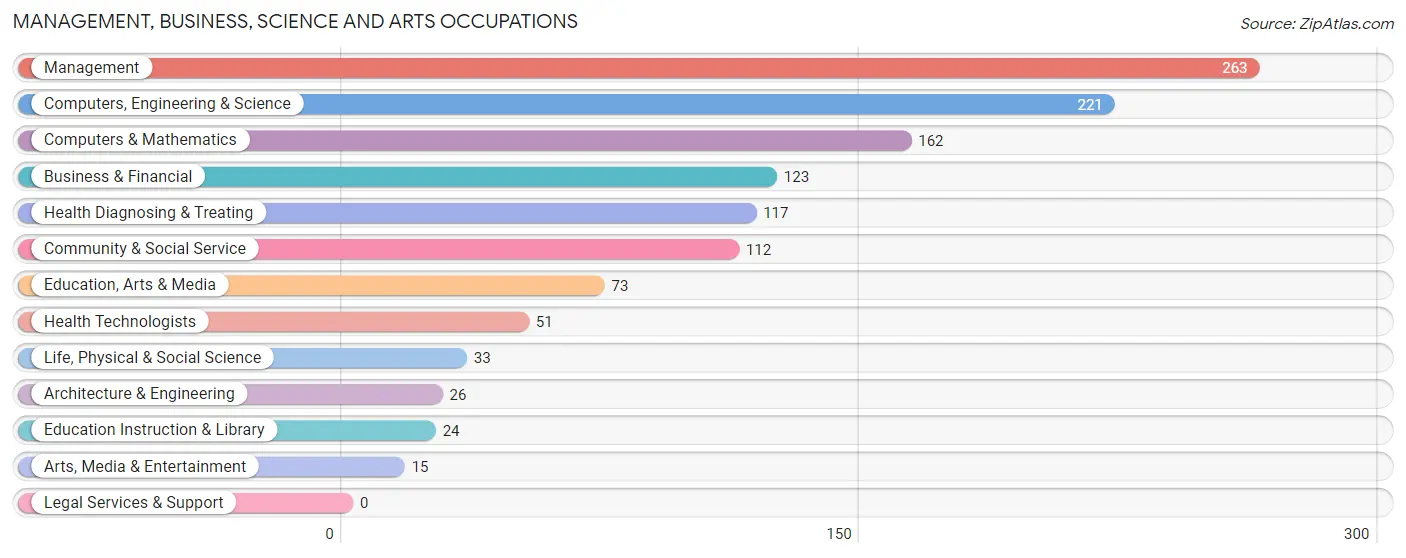
Management, Business, Science and Arts Occupations
The most common Management, Business, Science and Arts occupations in Boothwyn are Management (263 | 8.0%), Computers, Engineering & Science (221 | 6.8%), Computers & Mathematics (162 | 5.0%), Business & Financial (123 | 3.8%), and Health Diagnosing & Treating (117 | 3.6%).
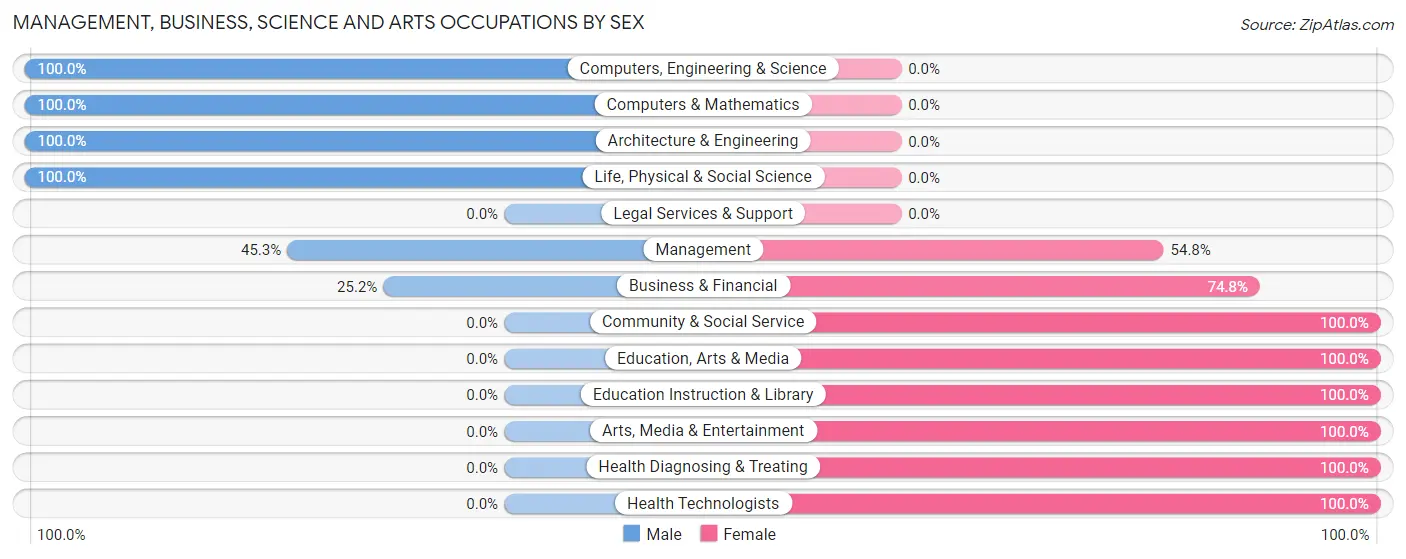
Management, Business, Science and Arts Occupations by Sex
Within the Management, Business, Science and Arts occupations in Boothwyn, the most male-oriented occupations are Computers, Engineering & Science (100.0%), Computers & Mathematics (100.0%), and Architecture & Engineering (100.0%), while the most female-oriented occupations are Community & Social Service (100.0%), Education, Arts & Media (100.0%), and Education Instruction & Library (100.0%).
| Occupation | Male | Female |
| Management | 119 (45.3%) | 144 (54.7%) |
| Business & Financial | 31 (25.2%) | 92 (74.8%) |
| Computers, Engineering & Science | 221 (100.0%) | 0 (0.0%) |
| Computers & Mathematics | 162 (100.0%) | 0 (0.0%) |
| Architecture & Engineering | 26 (100.0%) | 0 (0.0%) |
| Life, Physical & Social Science | 33 (100.0%) | 0 (0.0%) |
| Community & Social Service | 0 (0.0%) | 112 (100.0%) |
| Education, Arts & Media | 0 (0.0%) | 73 (100.0%) |
| Legal Services & Support | 0 (0.0%) | 0 (0.0%) |
| Education Instruction & Library | 0 (0.0%) | 24 (100.0%) |
| Arts, Media & Entertainment | 0 (0.0%) | 15 (100.0%) |
| Health Diagnosing & Treating | 0 (0.0%) | 117 (100.0%) |
| Health Technologists | 0 (0.0%) | 51 (100.0%) |
| Total (Category) | 371 (44.4%) | 465 (55.6%) |
| Total (Overall) | 1,781 (54.4%) | 1,494 (45.6%) |
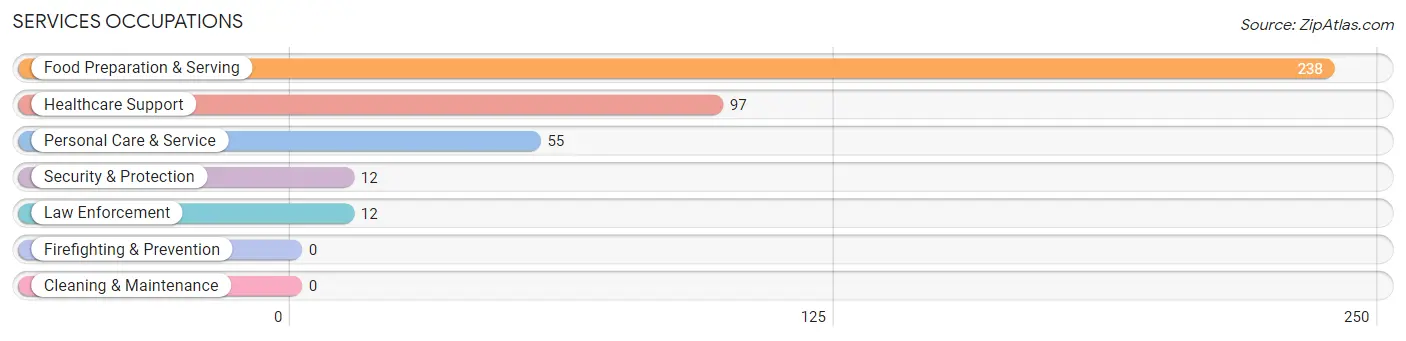
Services Occupations
The most common Services occupations in Boothwyn are Food Preparation & Serving (238 | 7.3%), Healthcare Support (97 | 3.0%), Personal Care & Service (55 | 1.7%), Security & Protection (12 | 0.4%), and Law Enforcement (12 | 0.4%).
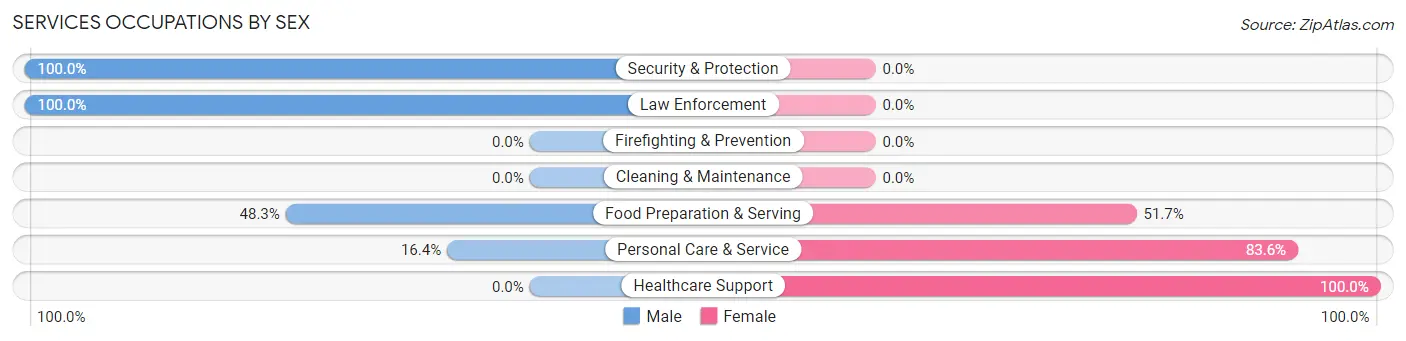
Services Occupations by Sex
Within the Services occupations in Boothwyn, the most male-oriented occupations are Security & Protection (100.0%), Law Enforcement (100.0%), and Food Preparation & Serving (48.3%), while the most female-oriented occupations are Healthcare Support (100.0%), Personal Care & Service (83.6%), and Food Preparation & Serving (51.7%).
| Occupation | Male | Female |
| Healthcare Support | 0 (0.0%) | 97 (100.0%) |
| Security & Protection | 12 (100.0%) | 0 (0.0%) |
| Firefighting & Prevention | 0 (0.0%) | 0 (0.0%) |
| Law Enforcement | 12 (100.0%) | 0 (0.0%) |
| Food Preparation & Serving | 115 (48.3%) | 123 (51.7%) |
| Cleaning & Maintenance | 0 (0.0%) | 0 (0.0%) |
| Personal Care & Service | 9 (16.4%) | 46 (83.6%) |
| Total (Category) | 136 (33.8%) | 266 (66.2%) |
| Total (Overall) | 1,781 (54.4%) | 1,494 (45.6%) |
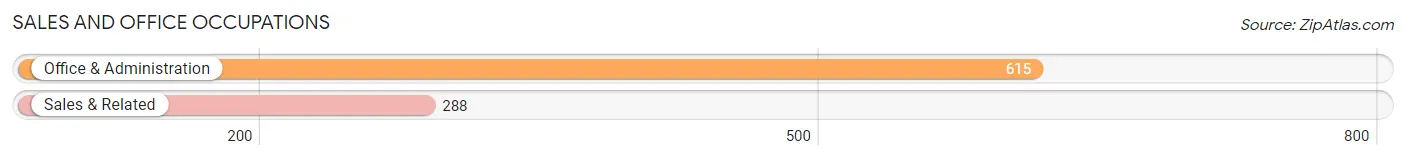
Sales and Office Occupations
The most common Sales and Office occupations in Boothwyn are Office & Administration (615 | 18.8%), and Sales & Related (288 | 8.8%).
Sales and Office Occupations by Sex
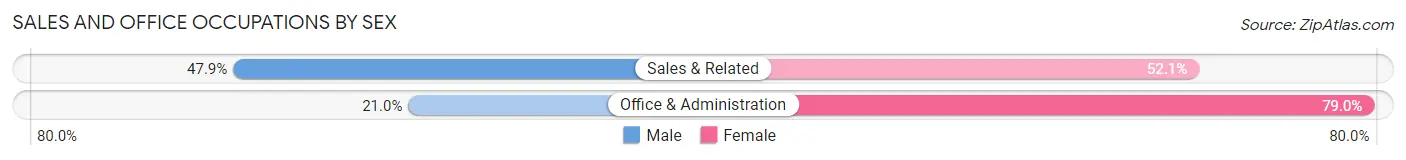
| Occupation | Male | Female |
| Sales & Related | 138 (47.9%) | 150 (52.1%) |
| Office & Administration | 129 (21.0%) | 486 (79.0%) |
| Total (Category) | 267 (29.6%) | 636 (70.4%) |
| Total (Overall) | 1,781 (54.4%) | 1,494 (45.6%) |
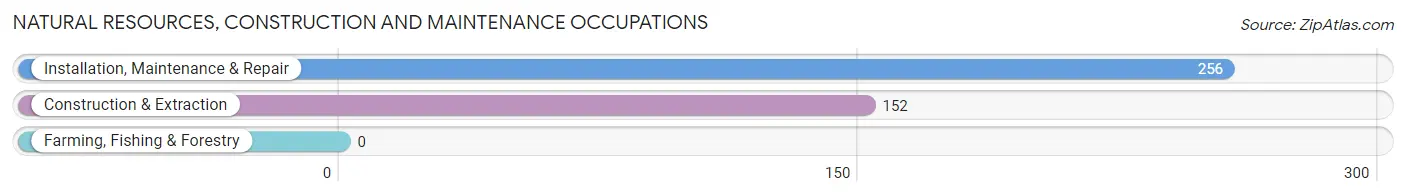
Natural Resources, Construction and Maintenance Occupations
The most common Natural Resources, Construction and Maintenance occupations in Boothwyn are Installation, Maintenance & Repair (256 | 7.8%), and Construction & Extraction (152 | 4.6%).
Natural Resources, Construction and Maintenance Occupations by Sex
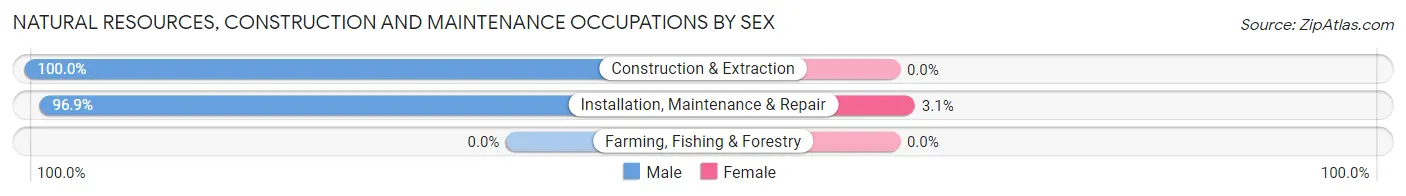
| Occupation | Male | Female |
| Farming, Fishing & Forestry | 0 (0.0%) | 0 (0.0%) |
| Construction & Extraction | 152 (100.0%) | 0 (0.0%) |
| Installation, Maintenance & Repair | 248 (96.9%) | 8 (3.1%) |
| Total (Category) | 400 (98.0%) | 8 (2.0%) |
| Total (Overall) | 1,781 (54.4%) | 1,494 (45.6%) |
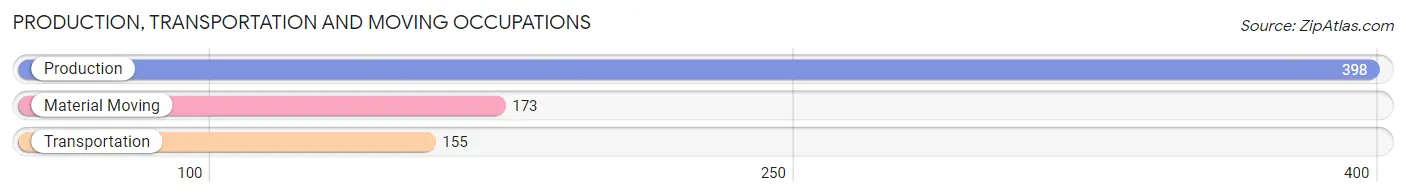
Production, Transportation and Moving Occupations
The most common Production, Transportation and Moving occupations in Boothwyn are Production (398 | 12.1%), Material Moving (173 | 5.3%), and Transportation (155 | 4.7%).
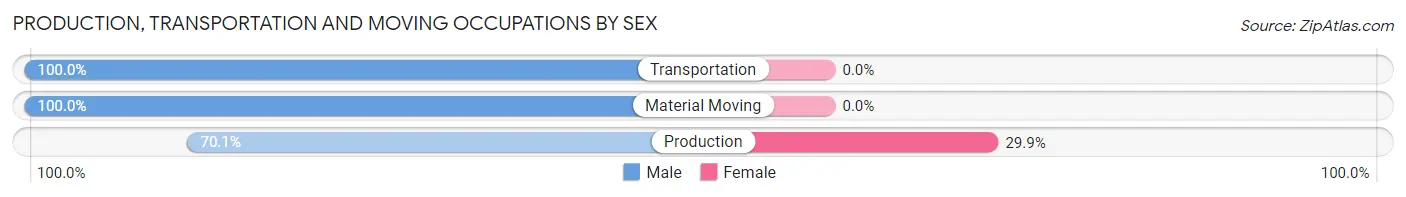
Production, Transportation and Moving Occupations by Sex
| Occupation | Male | Female |
| Production | 279 (70.1%) | 119 (29.9%) |
| Transportation | 155 (100.0%) | 0 (0.0%) |
| Material Moving | 173 (100.0%) | 0 (0.0%) |
| Total (Category) | 607 (83.6%) | 119 (16.4%) |
| Total (Overall) | 1,781 (54.4%) | 1,494 (45.6%) |
Employment Industries by Sex in Boothwyn
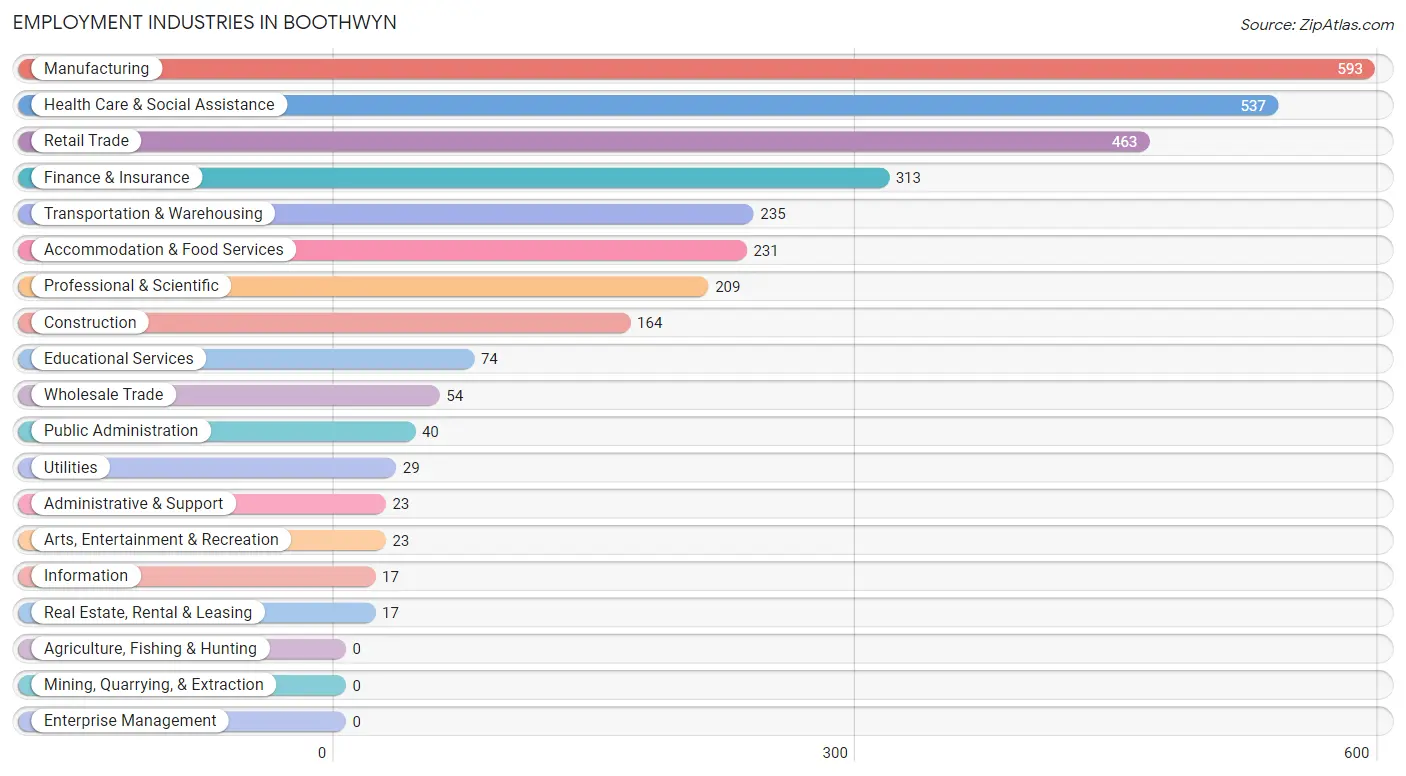
Employment Industries in Boothwyn
The major employment industries in Boothwyn include Manufacturing (593 | 18.1%), Health Care & Social Assistance (537 | 16.4%), Retail Trade (463 | 14.1%), Finance & Insurance (313 | 9.6%), and Transportation & Warehousing (235 | 7.2%).
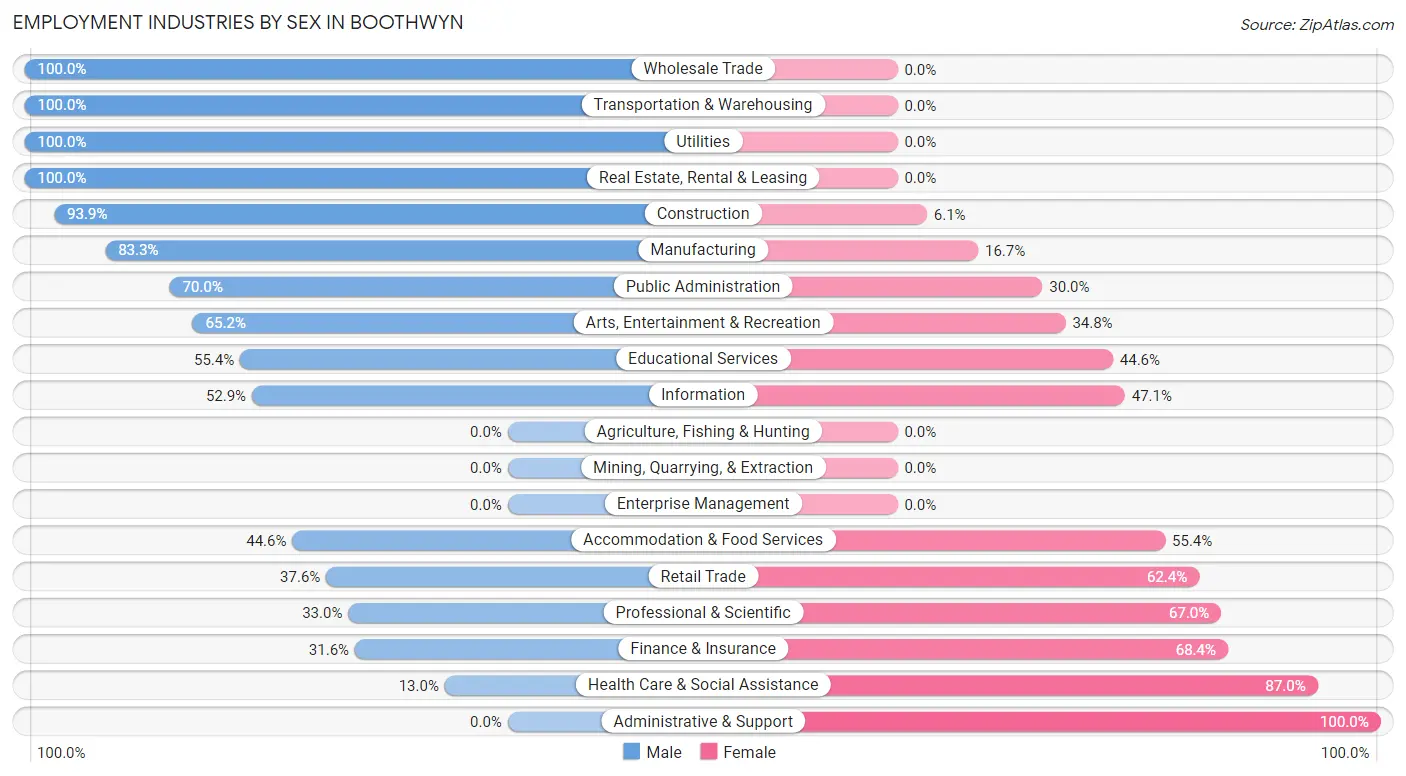
Employment Industries by Sex in Boothwyn
The Boothwyn industries that see more men than women are Wholesale Trade (100.0%), Transportation & Warehousing (100.0%), and Utilities (100.0%), whereas the industries that tend to have a higher number of women are Administrative & Support (100.0%), Health Care & Social Assistance (87.0%), and Finance & Insurance (68.4%).
| Industry | Male | Female |
| Agriculture, Fishing & Hunting | 0 (0.0%) | 0 (0.0%) |
| Mining, Quarrying, & Extraction | 0 (0.0%) | 0 (0.0%) |
| Construction | 154 (93.9%) | 10 (6.1%) |
| Manufacturing | 494 (83.3%) | 99 (16.7%) |
| Wholesale Trade | 54 (100.0%) | 0 (0.0%) |
| Retail Trade | 174 (37.6%) | 289 (62.4%) |
| Transportation & Warehousing | 235 (100.0%) | 0 (0.0%) |
| Utilities | 29 (100.0%) | 0 (0.0%) |
| Information | 9 (52.9%) | 8 (47.1%) |
| Finance & Insurance | 99 (31.6%) | 214 (68.4%) |
| Real Estate, Rental & Leasing | 17 (100.0%) | 0 (0.0%) |
| Professional & Scientific | 69 (33.0%) | 140 (67.0%) |
| Enterprise Management | 0 (0.0%) | 0 (0.0%) |
| Administrative & Support | 0 (0.0%) | 23 (100.0%) |
| Educational Services | 41 (55.4%) | 33 (44.6%) |
| Health Care & Social Assistance | 70 (13.0%) | 467 (87.0%) |
| Arts, Entertainment & Recreation | 15 (65.2%) | 8 (34.8%) |
| Accommodation & Food Services | 103 (44.6%) | 128 (55.4%) |
| Public Administration | 28 (70.0%) | 12 (30.0%) |
| Total | 1,781 (54.4%) | 1,494 (45.6%) |
Education in Boothwyn
School Enrollment in Boothwyn
The most common levels of schooling among the 1,299 students in Boothwyn are college / undergraduate (305 | 23.5%), middle school (304 | 23.4%), and elementary school (226 | 17.4%).
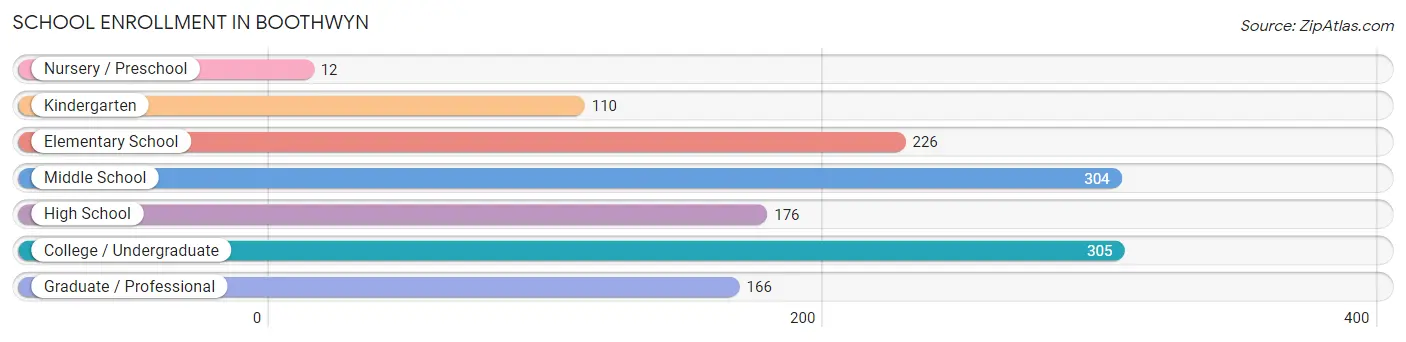
| School Level | # Students | % Students |
| Nursery / Preschool | 12 | 0.9% |
| Kindergarten | 110 | 8.5% |
| Elementary School | 226 | 17.4% |
| Middle School | 304 | 23.4% |
| High School | 176 | 13.6% |
| College / Undergraduate | 305 | 23.5% |
| Graduate / Professional | 166 | 12.8% |
| Total | 1,299 | 100.0% |
School Enrollment by Age by Funding Source in Boothwyn
Out of a total of 1,299 students who are enrolled in schools in Boothwyn, 187 (14.4%) attend a private institution, while the remaining 1,112 (85.6%) are enrolled in public schools. The age group of 3 to 4 year olds has the highest likelihood of being enrolled in private schools, with 12 (100.0% in the age bracket) enrolled. Conversely, the age group of 10 to 14 year olds has the lowest likelihood of being enrolled in a private school, with 349 (100.0% in the age bracket) attending a public institution.
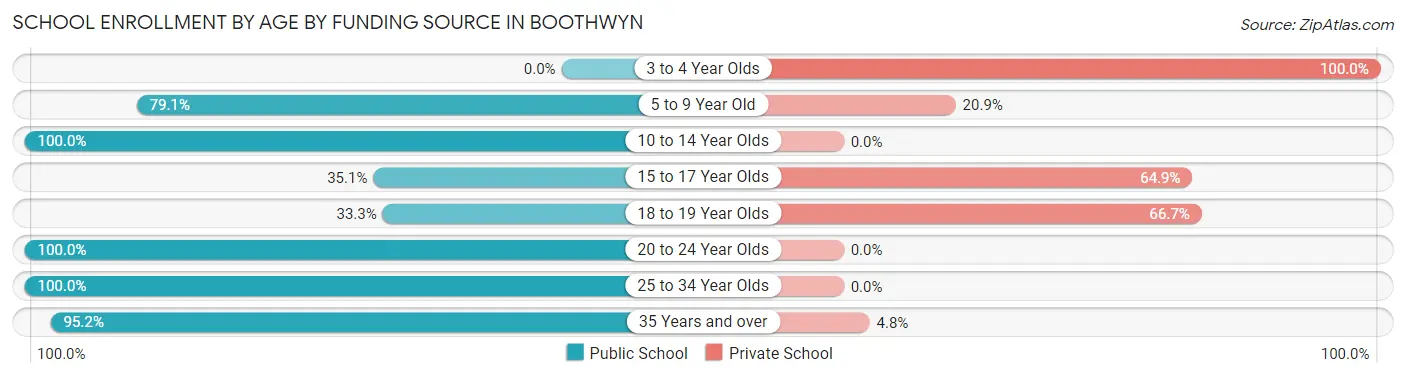
| Age Bracket | Public School | Private School |
| 3 to 4 Year Olds | 0 (0.0%) | 12 (100.0%) |
| 5 to 9 Year Old | 258 (79.1%) | 68 (20.9%) |
| 10 to 14 Year Olds | 349 (100.0%) | 0 (0.0%) |
| 15 to 17 Year Olds | 27 (35.1%) | 50 (64.9%) |
| 18 to 19 Year Olds | 25 (33.3%) | 50 (66.7%) |
| 20 to 24 Year Olds | 256 (100.0%) | 0 (0.0%) |
| 25 to 34 Year Olds | 59 (100.0%) | 0 (0.0%) |
| 35 Years and over | 138 (95.2%) | 7 (4.8%) |
| Total | 1,112 (85.6%) | 187 (14.4%) |
Educational Attainment by Field of Study in Boothwyn
Business (230 | 23.5%), science & technology (218 | 22.3%), arts & humanities (215 | 22.0%), education (86 | 8.8%), and bio, nature & agricultural (74 | 7.6%) are the most common fields of study among 977 individuals in Boothwyn who have obtained a bachelor's degree or higher.
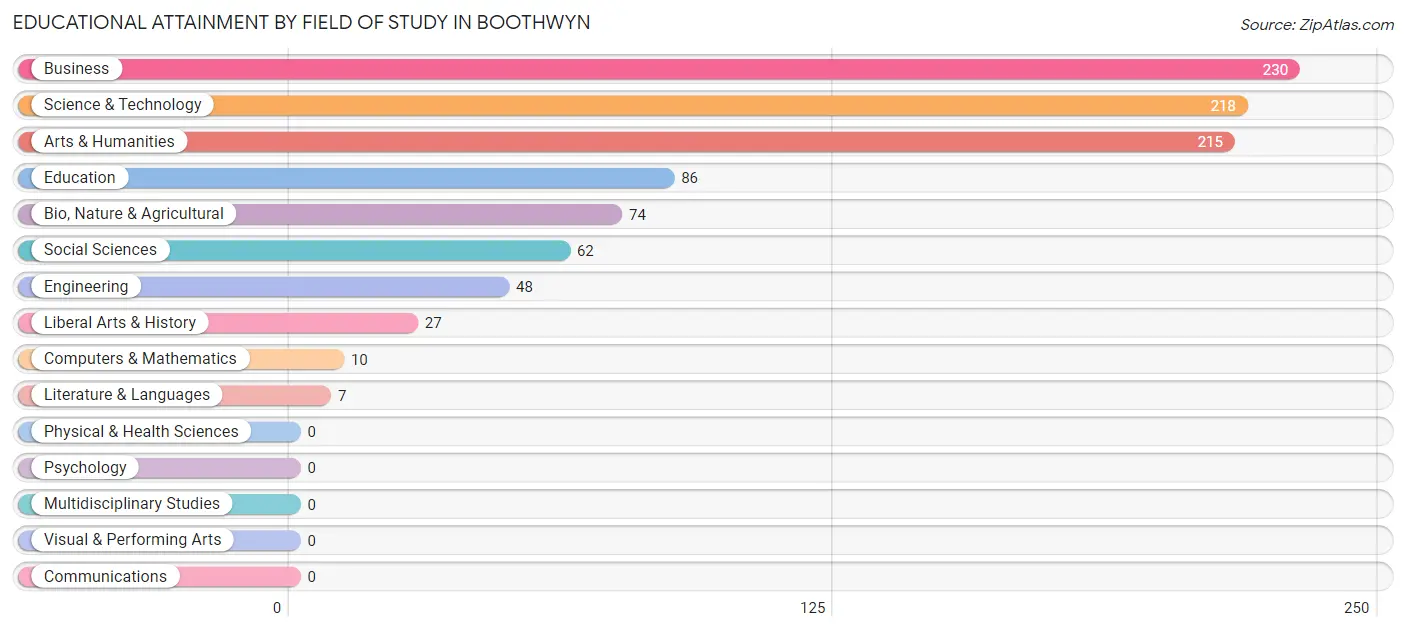
| Field of Study | # Graduates | % Graduates |
| Computers & Mathematics | 10 | 1.0% |
| Bio, Nature & Agricultural | 74 | 7.6% |
| Physical & Health Sciences | 0 | 0.0% |
| Psychology | 0 | 0.0% |
| Social Sciences | 62 | 6.4% |
| Engineering | 48 | 4.9% |
| Multidisciplinary Studies | 0 | 0.0% |
| Science & Technology | 218 | 22.3% |
| Business | 230 | 23.5% |
| Education | 86 | 8.8% |
| Literature & Languages | 7 | 0.7% |
| Liberal Arts & History | 27 | 2.8% |
| Visual & Performing Arts | 0 | 0.0% |
| Communications | 0 | 0.0% |
| Arts & Humanities | 215 | 22.0% |
| Total | 977 | 100.0% |
Transportation & Commute in Boothwyn
Vehicle Availability by Sex in Boothwyn
The most prevalent vehicle ownership categories in Boothwyn are males with 2 vehicles (832, accounting for 48.2%) and females with 2 vehicles (648, making up 55.9%).
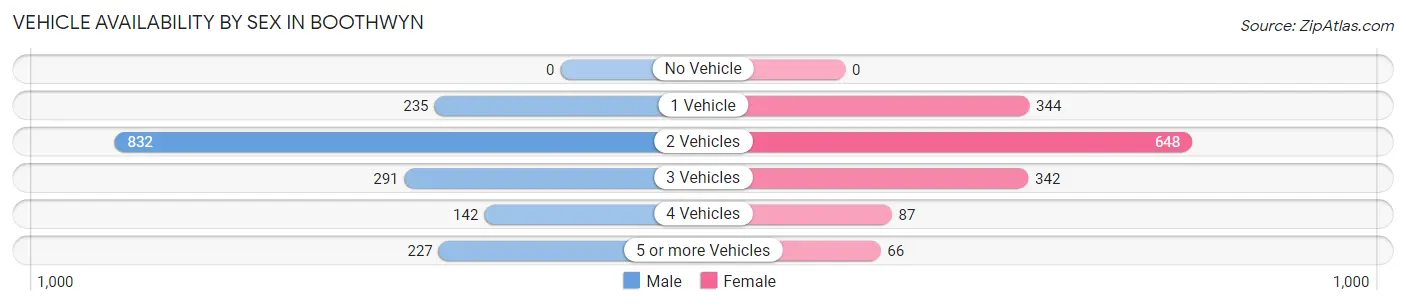
| Vehicles Available | Male | Female |
| No Vehicle | 0 (0.0%) | 0 (0.0%) |
| 1 Vehicle | 235 (13.6%) | 344 (23.1%) |
| 2 Vehicles | 832 (48.2%) | 648 (43.6%) |
| 3 Vehicles | 291 (16.9%) | 342 (23.0%) |
| 4 Vehicles | 142 (8.2%) | 87 (5.9%) |
| 5 or more Vehicles | 227 (13.1%) | 66 (4.4%) |
| Total | 1,727 (100.0%) | 1,487 (100.0%) |
Commute Time in Boothwyn
The most frequently occuring commute durations in Boothwyn are 15 to 19 minutes (682 commuters, 22.4%), 30 to 34 minutes (483 commuters, 15.9%), and 20 to 24 minutes (439 commuters, 14.4%).
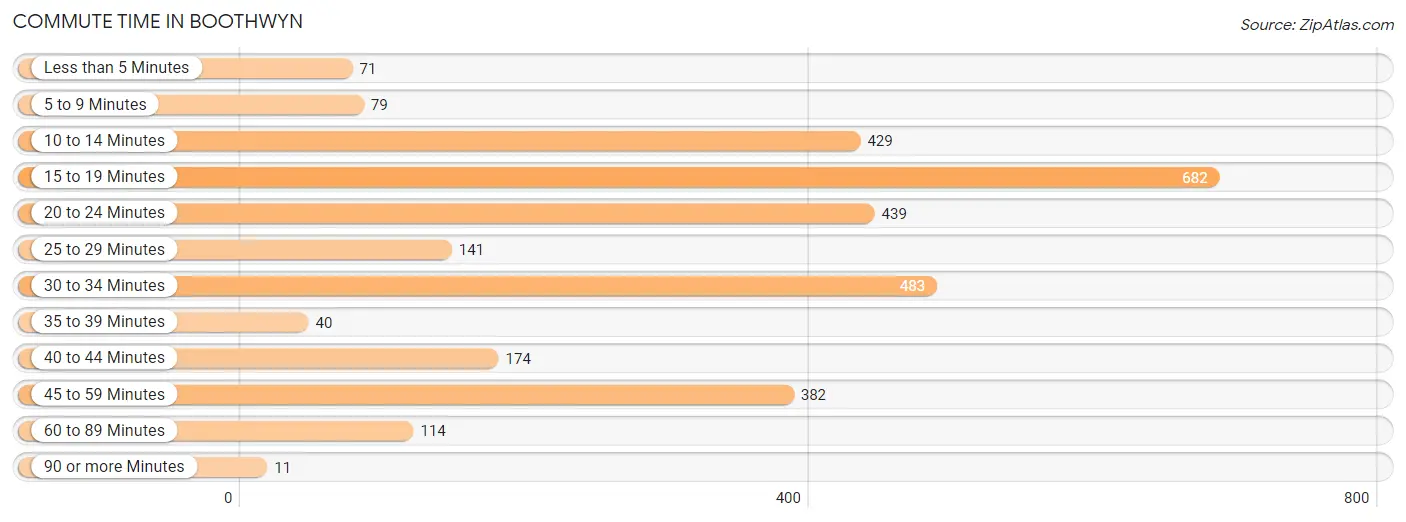
| Commute Time | # Commuters | % Commuters |
| Less than 5 Minutes | 71 | 2.3% |
| 5 to 9 Minutes | 79 | 2.6% |
| 10 to 14 Minutes | 429 | 14.1% |
| 15 to 19 Minutes | 682 | 22.4% |
| 20 to 24 Minutes | 439 | 14.4% |
| 25 to 29 Minutes | 141 | 4.6% |
| 30 to 34 Minutes | 483 | 15.9% |
| 35 to 39 Minutes | 40 | 1.3% |
| 40 to 44 Minutes | 174 | 5.7% |
| 45 to 59 Minutes | 382 | 12.6% |
| 60 to 89 Minutes | 114 | 3.7% |
| 90 or more Minutes | 11 | 0.4% |
Commute Time by Sex in Boothwyn
The most common commute times in Boothwyn are 10 to 14 minutes (335 commuters, 19.6%) for males and 15 to 19 minutes (382 commuters, 28.6%) for females.
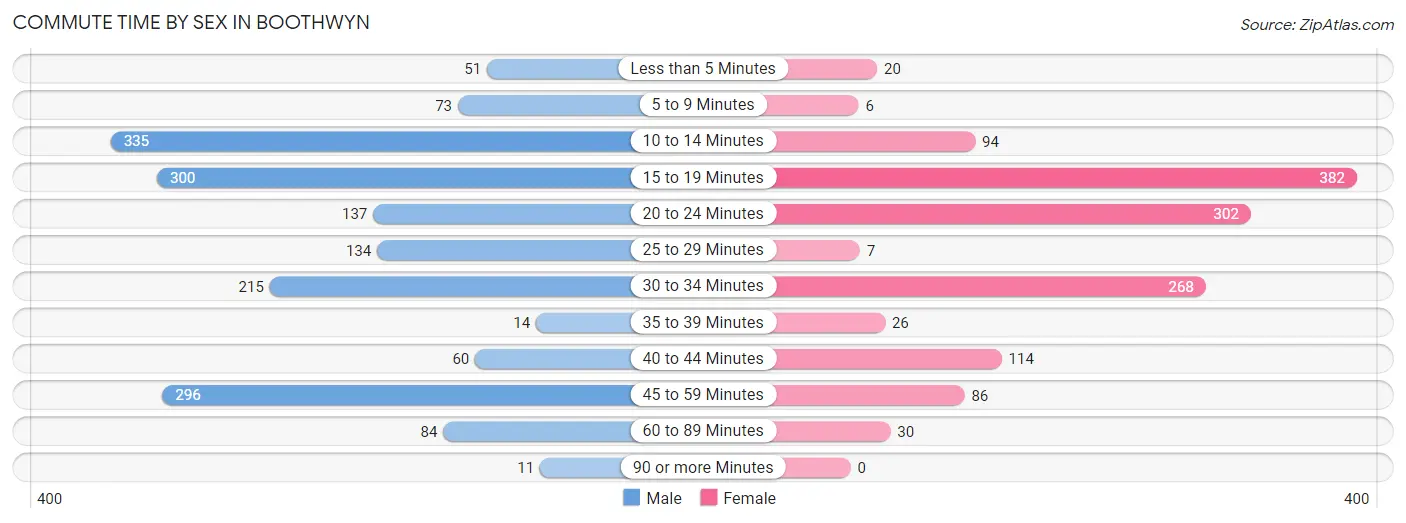
| Commute Time | Male | Female |
| Less than 5 Minutes | 51 (3.0%) | 20 (1.5%) |
| 5 to 9 Minutes | 73 (4.3%) | 6 (0.4%) |
| 10 to 14 Minutes | 335 (19.6%) | 94 (7.0%) |
| 15 to 19 Minutes | 300 (17.5%) | 382 (28.6%) |
| 20 to 24 Minutes | 137 (8.0%) | 302 (22.6%) |
| 25 to 29 Minutes | 134 (7.8%) | 7 (0.5%) |
| 30 to 34 Minutes | 215 (12.6%) | 268 (20.1%) |
| 35 to 39 Minutes | 14 (0.8%) | 26 (1.9%) |
| 40 to 44 Minutes | 60 (3.5%) | 114 (8.5%) |
| 45 to 59 Minutes | 296 (17.3%) | 86 (6.4%) |
| 60 to 89 Minutes | 84 (4.9%) | 30 (2.2%) |
| 90 or more Minutes | 11 (0.6%) | 0 (0.0%) |
Time of Departure to Work by Sex in Boothwyn
The most frequent times of departure to work in Boothwyn are 6:30 AM to 6:59 AM (385, 22.5%) for males and 7:00 AM to 7:29 AM (285, 21.3%) for females.
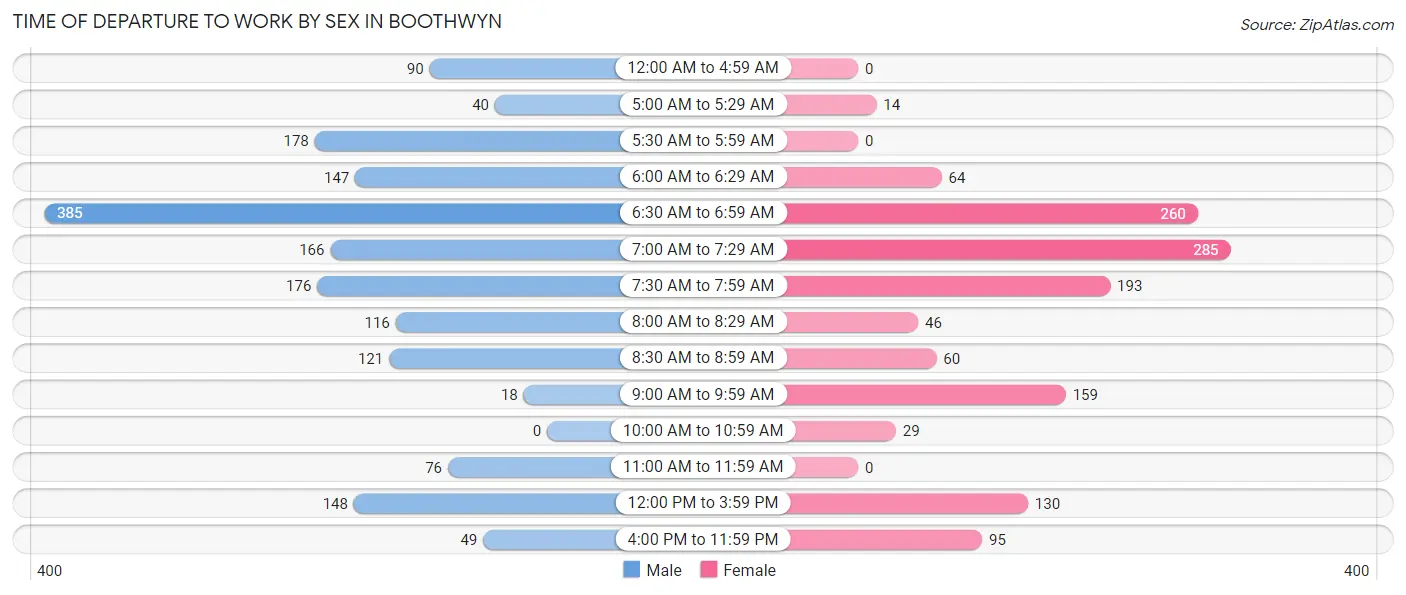
| Time of Departure | Male | Female |
| 12:00 AM to 4:59 AM | 90 (5.3%) | 0 (0.0%) |
| 5:00 AM to 5:29 AM | 40 (2.3%) | 14 (1.1%) |
| 5:30 AM to 5:59 AM | 178 (10.4%) | 0 (0.0%) |
| 6:00 AM to 6:29 AM | 147 (8.6%) | 64 (4.8%) |
| 6:30 AM to 6:59 AM | 385 (22.5%) | 260 (19.5%) |
| 7:00 AM to 7:29 AM | 166 (9.7%) | 285 (21.3%) |
| 7:30 AM to 7:59 AM | 176 (10.3%) | 193 (14.5%) |
| 8:00 AM to 8:29 AM | 116 (6.8%) | 46 (3.5%) |
| 8:30 AM to 8:59 AM | 121 (7.1%) | 60 (4.5%) |
| 9:00 AM to 9:59 AM | 18 (1.1%) | 159 (11.9%) |
| 10:00 AM to 10:59 AM | 0 (0.0%) | 29 (2.2%) |
| 11:00 AM to 11:59 AM | 76 (4.4%) | 0 (0.0%) |
| 12:00 PM to 3:59 PM | 148 (8.6%) | 130 (9.7%) |
| 4:00 PM to 11:59 PM | 49 (2.9%) | 95 (7.1%) |
| Total | 1,710 (100.0%) | 1,335 (100.0%) |
Housing Occupancy in Boothwyn
Occupancy by Ownership in Boothwyn
Of the total 2,044 dwellings in Boothwyn, owner-occupied units account for 1,433 (70.1%), while renter-occupied units make up 611 (29.9%).
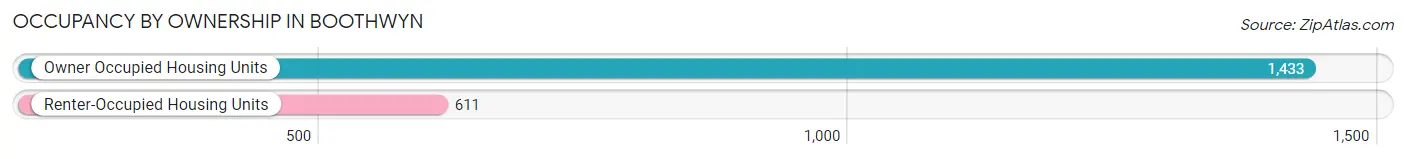
| Occupancy | # Housing Units | % Housing Units |
| Owner Occupied Housing Units | 1,433 | 70.1% |
| Renter-Occupied Housing Units | 611 | 29.9% |
| Total Occupied Housing Units | 2,044 | 100.0% |
Occupancy by Household Size in Boothwyn
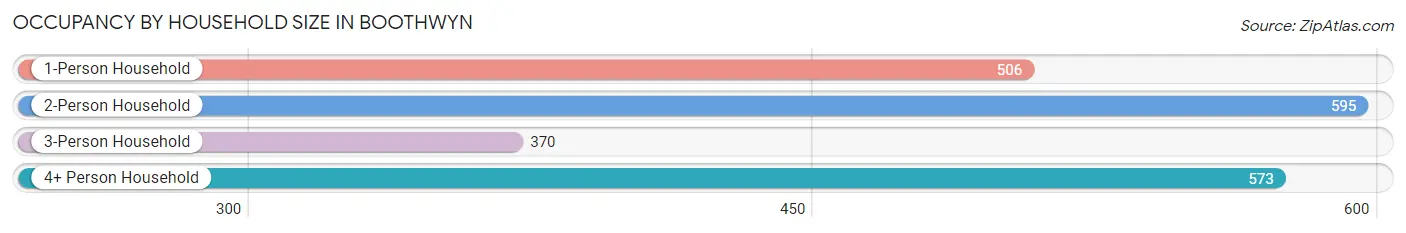
| Household Size | # Housing Units | % Housing Units |
| 1-Person Household | 506 | 24.8% |
| 2-Person Household | 595 | 29.1% |
| 3-Person Household | 370 | 18.1% |
| 4+ Person Household | 573 | 28.0% |
| Total Housing Units | 2,044 | 100.0% |
Occupancy by Ownership by Household Size in Boothwyn
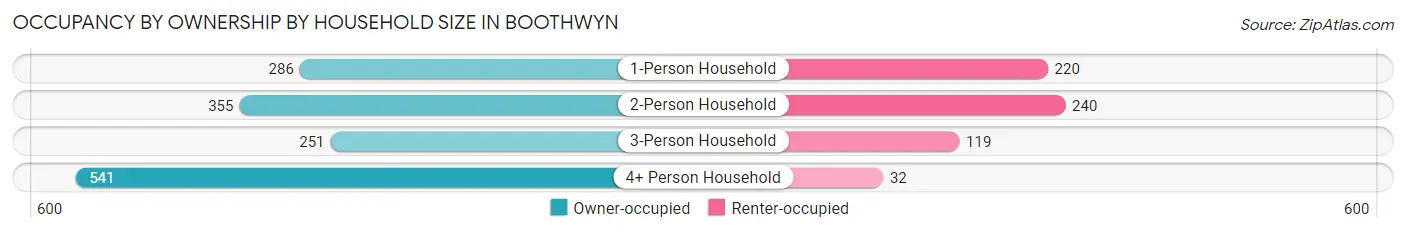
| Household Size | Owner-occupied | Renter-occupied |
| 1-Person Household | 286 (56.5%) | 220 (43.5%) |
| 2-Person Household | 355 (59.7%) | 240 (40.3%) |
| 3-Person Household | 251 (67.8%) | 119 (32.2%) |
| 4+ Person Household | 541 (94.4%) | 32 (5.6%) |
| Total Housing Units | 1,433 (70.1%) | 611 (29.9%) |
Occupancy by Educational Attainment in Boothwyn
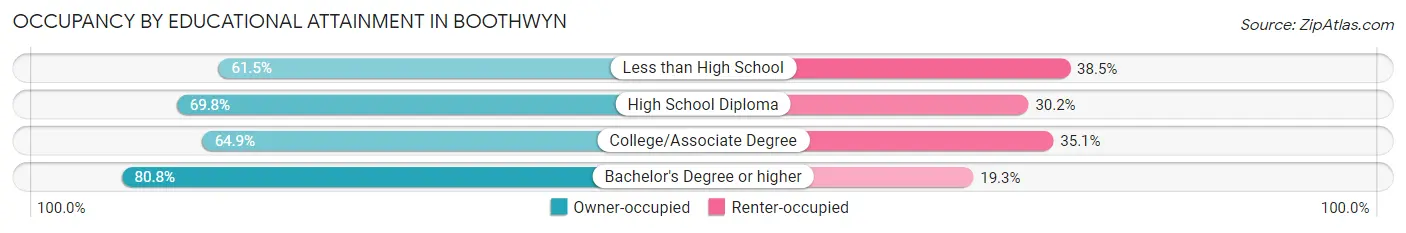
| Household Size | Owner-occupied | Renter-occupied |
| Less than High School | 16 (61.5%) | 10 (38.5%) |
| High School Diploma | 511 (69.8%) | 221 (30.2%) |
| College/Associate Degree | 541 (64.9%) | 293 (35.1%) |
| Bachelor's Degree or higher | 365 (80.7%) | 87 (19.3%) |
Occupancy by Age of Householder in Boothwyn
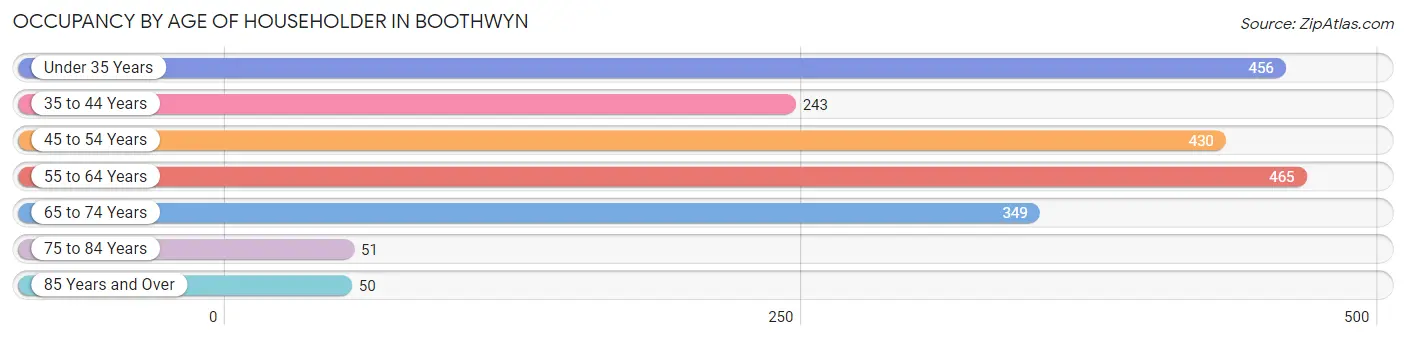
| Age Bracket | # Households | % Households |
| Under 35 Years | 456 | 22.3% |
| 35 to 44 Years | 243 | 11.9% |
| 45 to 54 Years | 430 | 21.0% |
| 55 to 64 Years | 465 | 22.8% |
| 65 to 74 Years | 349 | 17.1% |
| 75 to 84 Years | 51 | 2.5% |
| 85 Years and Over | 50 | 2.5% |
| Total | 2,044 | 100.0% |
Housing Finances in Boothwyn
Median Income by Occupancy in Boothwyn
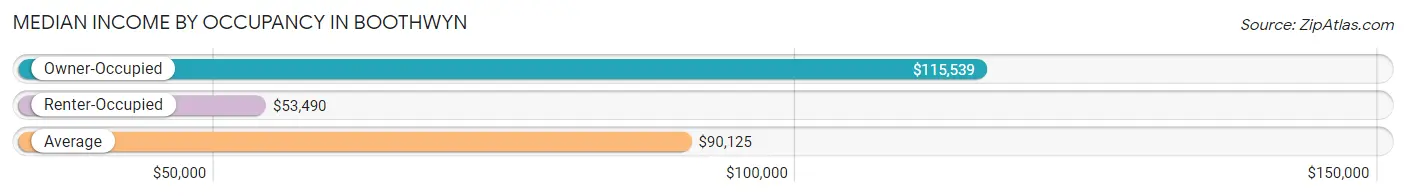
| Occupancy Type | # Households | Median Income |
| Owner-Occupied | 1,433 (70.1%) | $115,539 |
| Renter-Occupied | 611 (29.9%) | $53,490 |
| Average | 2,044 (100.0%) | $90,125 |
Occupancy by Householder Income Bracket in Boothwyn
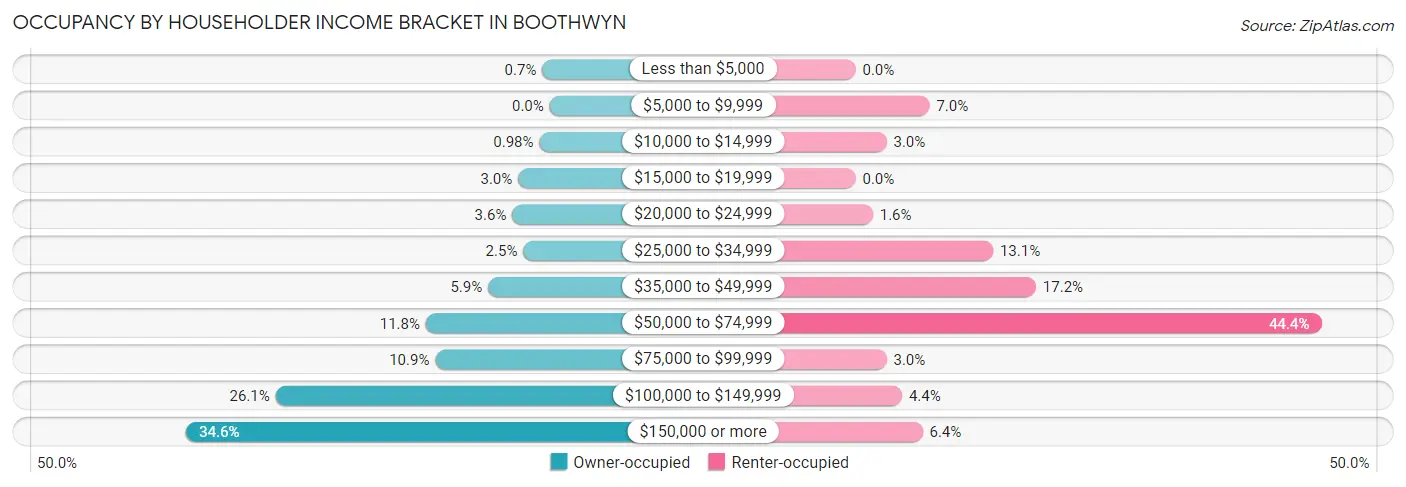
| Income Bracket | Owner-occupied | Renter-occupied |
| Less than $5,000 | 10 (0.7%) | 0 (0.0%) |
| $5,000 to $9,999 | 0 (0.0%) | 43 (7.0%) |
| $10,000 to $14,999 | 14 (1.0%) | 18 (2.9%) |
| $15,000 to $19,999 | 43 (3.0%) | 0 (0.0%) |
| $20,000 to $24,999 | 51 (3.6%) | 10 (1.6%) |
| $25,000 to $34,999 | 36 (2.5%) | 80 (13.1%) |
| $35,000 to $49,999 | 84 (5.9%) | 105 (17.2%) |
| $50,000 to $74,999 | 169 (11.8%) | 271 (44.4%) |
| $75,000 to $99,999 | 156 (10.9%) | 18 (2.9%) |
| $100,000 to $149,999 | 374 (26.1%) | 27 (4.4%) |
| $150,000 or more | 496 (34.6%) | 39 (6.4%) |
| Total | 1,433 (100.0%) | 611 (100.0%) |
Monthly Housing Cost Tiers in Boothwyn
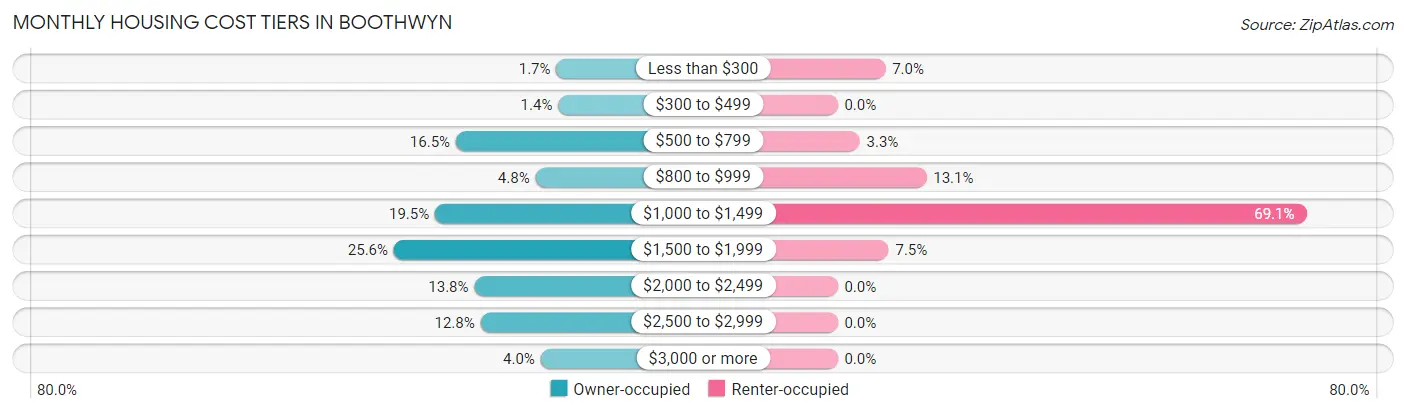
| Monthly Cost | Owner-occupied | Renter-occupied |
| Less than $300 | 24 (1.7%) | 43 (7.0%) |
| $300 to $499 | 20 (1.4%) | 0 (0.0%) |
| $500 to $799 | 236 (16.5%) | 20 (3.3%) |
| $800 to $999 | 68 (4.8%) | 80 (13.1%) |
| $1,000 to $1,499 | 280 (19.5%) | 422 (69.1%) |
| $1,500 to $1,999 | 367 (25.6%) | 46 (7.5%) |
| $2,000 to $2,499 | 197 (13.8%) | 0 (0.0%) |
| $2,500 to $2,999 | 184 (12.8%) | 0 (0.0%) |
| $3,000 or more | 57 (4.0%) | 0 (0.0%) |
| Total | 1,433 (100.0%) | 611 (100.0%) |
Physical Housing Characteristics in Boothwyn
Housing Structures in Boothwyn
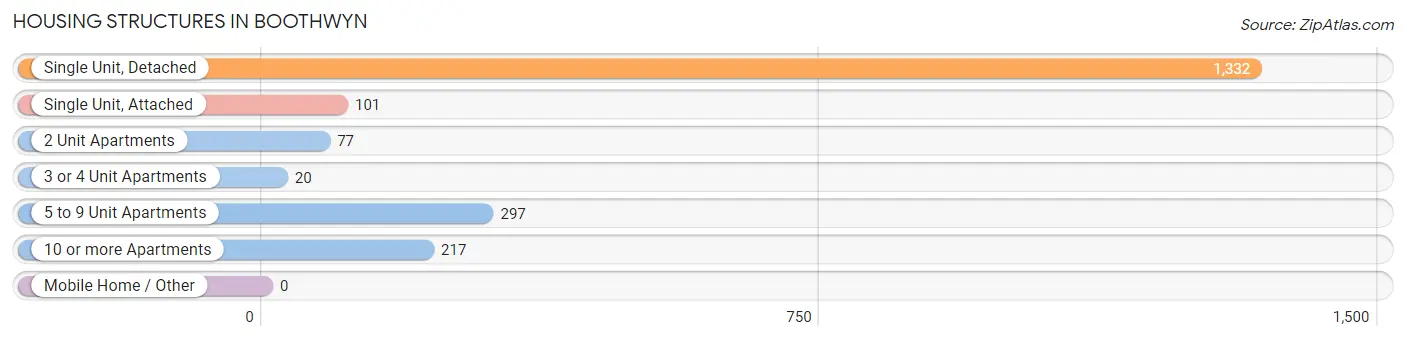
| Structure Type | # Housing Units | % Housing Units |
| Single Unit, Detached | 1,332 | 65.2% |
| Single Unit, Attached | 101 | 4.9% |
| 2 Unit Apartments | 77 | 3.8% |
| 3 or 4 Unit Apartments | 20 | 1.0% |
| 5 to 9 Unit Apartments | 297 | 14.5% |
| 10 or more Apartments | 217 | 10.6% |
| Mobile Home / Other | 0 | 0.0% |
| Total | 2,044 | 100.0% |
Housing Structures by Occupancy in Boothwyn
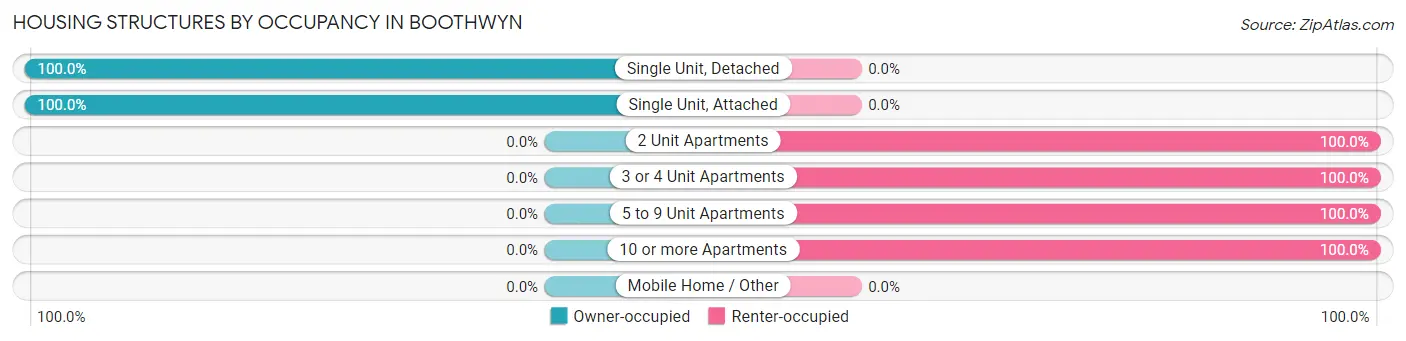
| Structure Type | Owner-occupied | Renter-occupied |
| Single Unit, Detached | 1,332 (100.0%) | 0 (0.0%) |
| Single Unit, Attached | 101 (100.0%) | 0 (0.0%) |
| 2 Unit Apartments | 0 (0.0%) | 77 (100.0%) |
| 3 or 4 Unit Apartments | 0 (0.0%) | 20 (100.0%) |
| 5 to 9 Unit Apartments | 0 (0.0%) | 297 (100.0%) |
| 10 or more Apartments | 0 (0.0%) | 217 (100.0%) |
| Mobile Home / Other | 0 (0.0%) | 0 (0.0%) |
| Total | 1,433 (70.1%) | 611 (29.9%) |
Housing Structures by Number of Rooms in Boothwyn
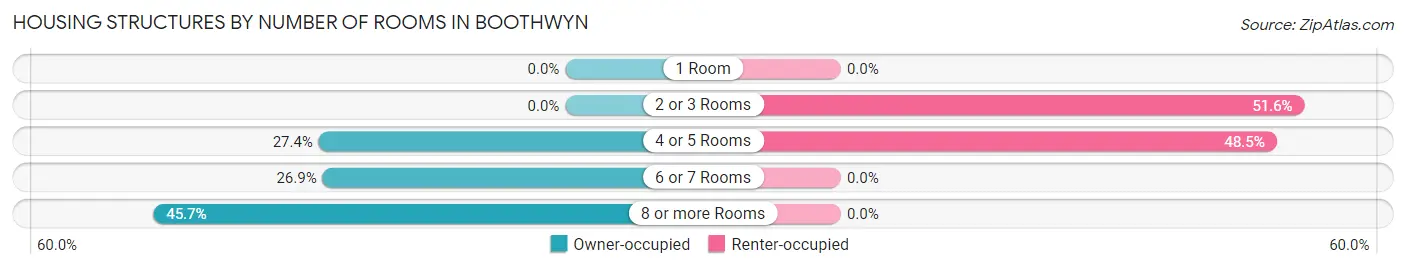
| Number of Rooms | Owner-occupied | Renter-occupied |
| 1 Room | 0 (0.0%) | 0 (0.0%) |
| 2 or 3 Rooms | 0 (0.0%) | 315 (51.5%) |
| 4 or 5 Rooms | 392 (27.4%) | 296 (48.4%) |
| 6 or 7 Rooms | 386 (26.9%) | 0 (0.0%) |
| 8 or more Rooms | 655 (45.7%) | 0 (0.0%) |
| Total | 1,433 (100.0%) | 611 (100.0%) |
Housing Structure by Heating Type in Boothwyn
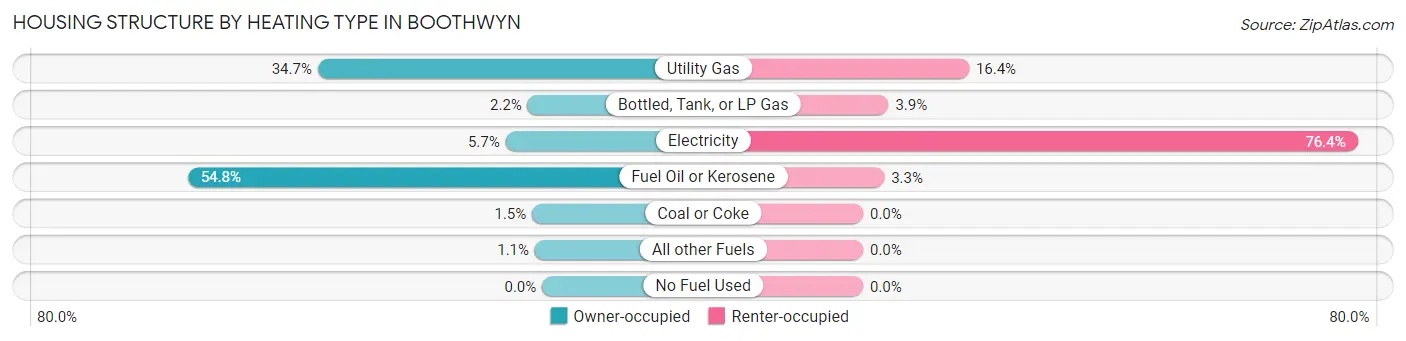
| Heating Type | Owner-occupied | Renter-occupied |
| Utility Gas | 497 (34.7%) | 100 (16.4%) |
| Bottled, Tank, or LP Gas | 32 (2.2%) | 24 (3.9%) |
| Electricity | 81 (5.7%) | 467 (76.4%) |
| Fuel Oil or Kerosene | 785 (54.8%) | 20 (3.3%) |
| Coal or Coke | 22 (1.5%) | 0 (0.0%) |
| All other Fuels | 16 (1.1%) | 0 (0.0%) |
| No Fuel Used | 0 (0.0%) | 0 (0.0%) |
| Total | 1,433 (100.0%) | 611 (100.0%) |
Household Vehicle Usage in Boothwyn
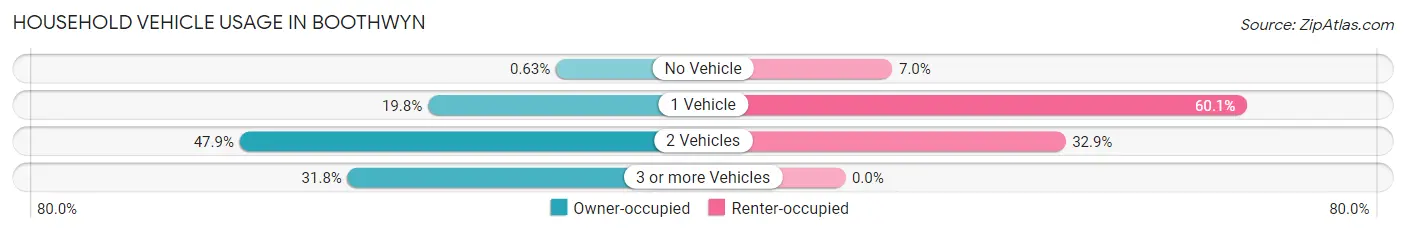
| Vehicles per Household | Owner-occupied | Renter-occupied |
| No Vehicle | 9 (0.6%) | 43 (7.0%) |
| 1 Vehicle | 283 (19.8%) | 367 (60.1%) |
| 2 Vehicles | 686 (47.9%) | 201 (32.9%) |
| 3 or more Vehicles | 455 (31.8%) | 0 (0.0%) |
| Total | 1,433 (100.0%) | 611 (100.0%) |
Real Estate & Mortgages in Boothwyn
Real Estate and Mortgage Overview in Boothwyn
| Characteristic | Without Mortgage | With Mortgage |
| Housing Units | 427 | 1,006 |
| Median Property Value | $216,000 | $259,800 |
| Median Household Income | $78,075 | $415 |
| Monthly Housing Costs | $709 | $57 |
| Real Estate Taxes | $4,352 | $11 |
Property Value by Mortgage Status in Boothwyn
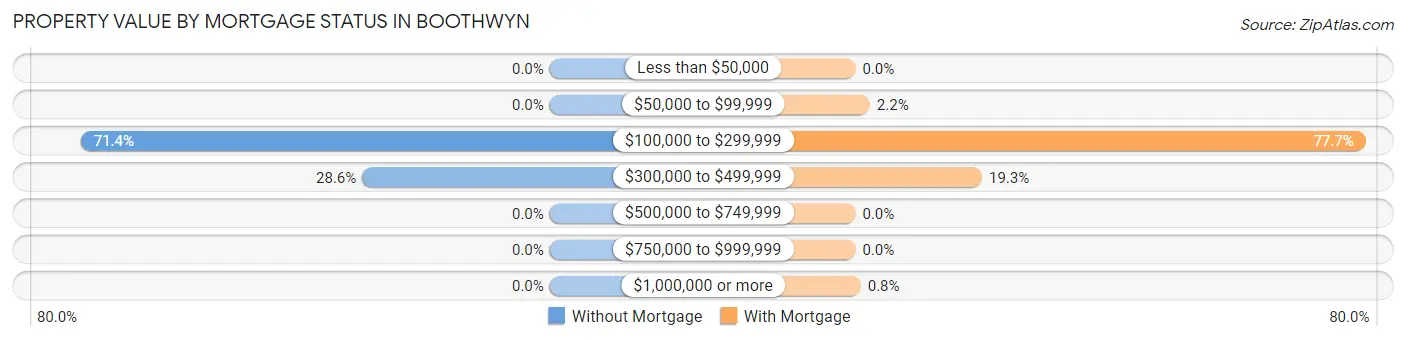
| Property Value | Without Mortgage | With Mortgage |
| Less than $50,000 | 0 (0.0%) | 0 (0.0%) |
| $50,000 to $99,999 | 0 (0.0%) | 22 (2.2%) |
| $100,000 to $299,999 | 305 (71.4%) | 782 (77.7%) |
| $300,000 to $499,999 | 122 (28.6%) | 194 (19.3%) |
| $500,000 to $749,999 | 0 (0.0%) | 0 (0.0%) |
| $750,000 to $999,999 | 0 (0.0%) | 0 (0.0%) |
| $1,000,000 or more | 0 (0.0%) | 8 (0.8%) |
| Total | 427 (100.0%) | 1,006 (100.0%) |
Household Income by Mortgage Status in Boothwyn
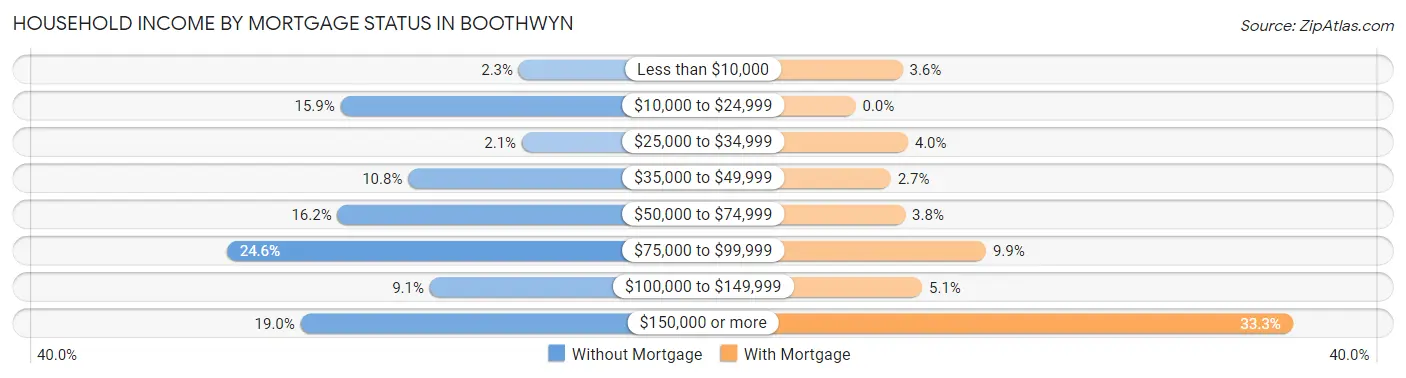
| Household Income | Without Mortgage | With Mortgage |
| Less than $10,000 | 10 (2.3%) | 36 (3.6%) |
| $10,000 to $24,999 | 68 (15.9%) | 0 (0.0%) |
| $25,000 to $34,999 | 9 (2.1%) | 40 (4.0%) |
| $35,000 to $49,999 | 46 (10.8%) | 27 (2.7%) |
| $50,000 to $74,999 | 69 (16.2%) | 38 (3.8%) |
| $75,000 to $99,999 | 105 (24.6%) | 100 (9.9%) |
| $100,000 to $149,999 | 39 (9.1%) | 51 (5.1%) |
| $150,000 or more | 81 (19.0%) | 335 (33.3%) |
| Total | 427 (100.0%) | 1,006 (100.0%) |
Property Value to Household Income Ratio in Boothwyn
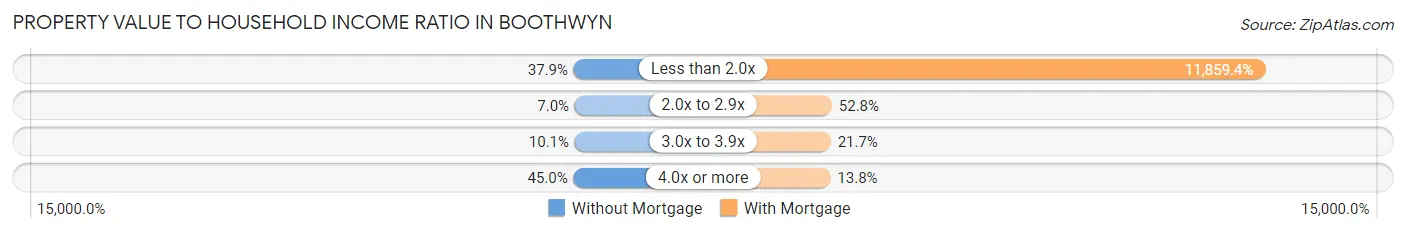
| Value-to-Income Ratio | Without Mortgage | With Mortgage |
| Less than 2.0x | 162 (37.9%) | 119,306 (11,859.4%) |
| 2.0x to 2.9x | 30 (7.0%) | 531 (52.8%) |
| 3.0x to 3.9x | 43 (10.1%) | 218 (21.7%) |
| 4.0x or more | 192 (45.0%) | 139 (13.8%) |
| Total | 427 (100.0%) | 1,006 (100.0%) |
Real Estate Taxes by Mortgage Status in Boothwyn
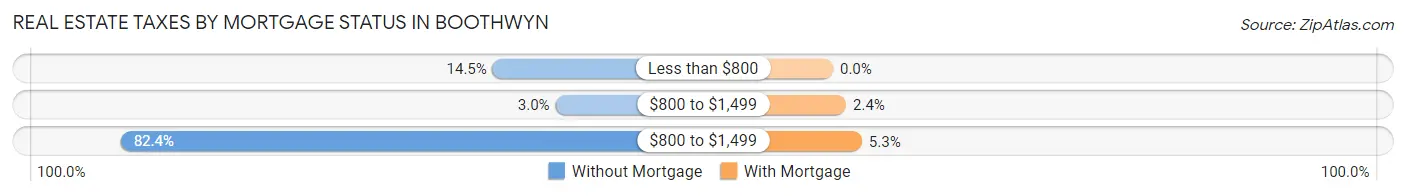
| Property Taxes | Without Mortgage | With Mortgage |
| Less than $800 | 62 (14.5%) | 0 (0.0%) |
| $800 to $1,499 | 13 (3.0%) | 24 (2.4%) |
| $800 to $1,499 | 352 (82.4%) | 53 (5.3%) |
| Total | 427 (100.0%) | 1,006 (100.0%) |
Health & Disability in Boothwyn
Health Insurance Coverage by Age in Boothwyn
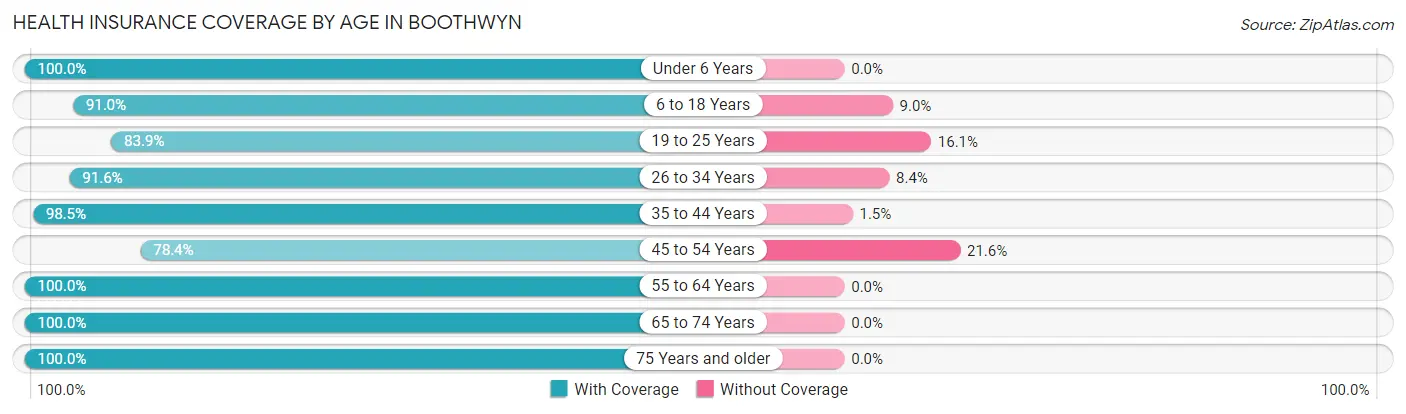
| Age Bracket | With Coverage | Without Coverage |
| Under 6 Years | 195 (100.0%) | 0 (0.0%) |
| 6 to 18 Years | 707 (91.0%) | 70 (9.0%) |
| 19 to 25 Years | 556 (83.9%) | 107 (16.1%) |
| 26 to 34 Years | 877 (91.6%) | 80 (8.4%) |
| 35 to 44 Years | 452 (98.5%) | 7 (1.5%) |
| 45 to 54 Years | 730 (78.4%) | 201 (21.6%) |
| 55 to 64 Years | 799 (100.0%) | 0 (0.0%) |
| 65 to 74 Years | 570 (100.0%) | 0 (0.0%) |
| 75 Years and older | 155 (100.0%) | 0 (0.0%) |
| Total | 5,041 (91.5%) | 465 (8.5%) |
Health Insurance Coverage by Citizenship Status in Boothwyn
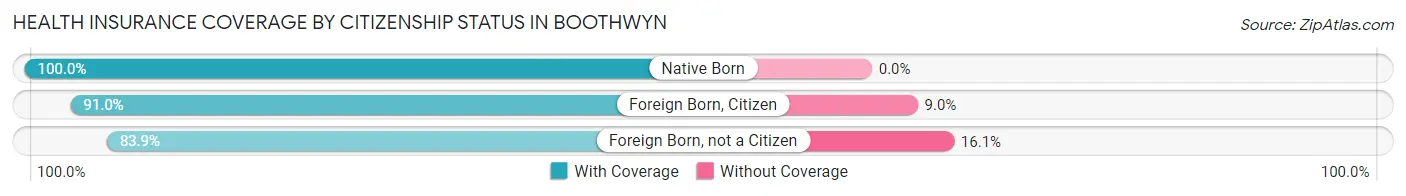
| Citizenship Status | With Coverage | Without Coverage |
| Native Born | 195 (100.0%) | 0 (0.0%) |
| Foreign Born, Citizen | 707 (91.0%) | 70 (9.0%) |
| Foreign Born, not a Citizen | 556 (83.9%) | 107 (16.1%) |
Health Insurance Coverage by Household Income in Boothwyn
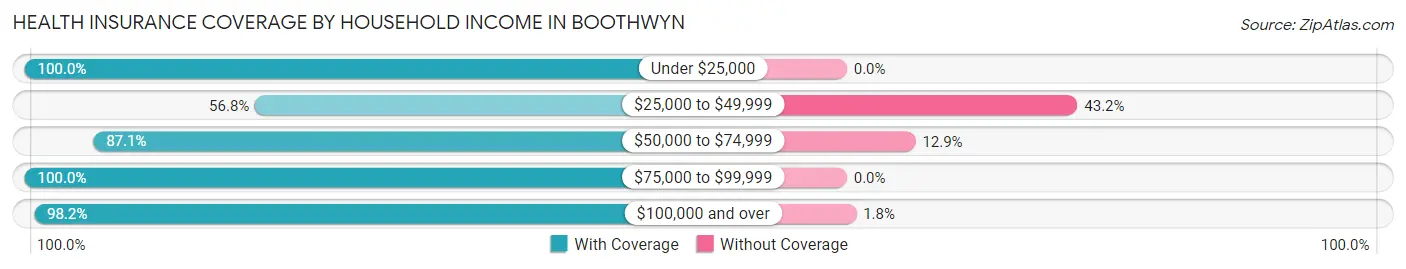
| Household Income | With Coverage | Without Coverage |
| Under $25,000 | 275 (100.0%) | 0 (0.0%) |
| $25,000 to $49,999 | 384 (56.8%) | 292 (43.2%) |
| $50,000 to $74,999 | 725 (87.1%) | 107 (12.9%) |
| $75,000 to $99,999 | 361 (100.0%) | 0 (0.0%) |
| $100,000 and over | 3,272 (98.2%) | 59 (1.8%) |
Public vs Private Health Insurance Coverage by Age in Boothwyn
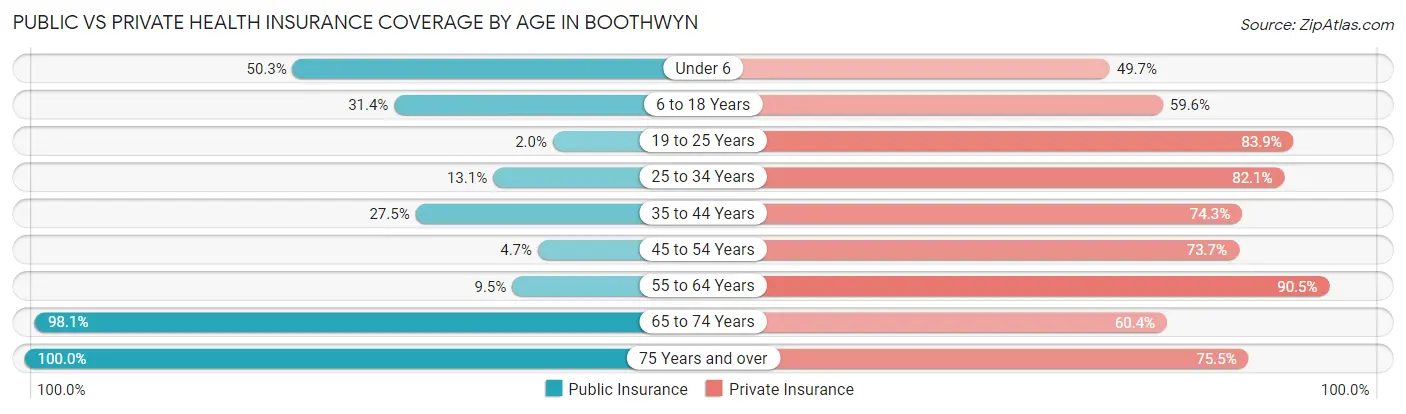
| Age Bracket | Public Insurance | Private Insurance |
| Under 6 | 98 (50.3%) | 97 (49.7%) |
| 6 to 18 Years | 244 (31.4%) | 463 (59.6%) |
| 19 to 25 Years | 13 (2.0%) | 556 (83.9%) |
| 25 to 34 Years | 125 (13.1%) | 786 (82.1%) |
| 35 to 44 Years | 126 (27.5%) | 341 (74.3%) |
| 45 to 54 Years | 44 (4.7%) | 686 (73.7%) |
| 55 to 64 Years | 76 (9.5%) | 723 (90.5%) |
| 65 to 74 Years | 559 (98.1%) | 344 (60.4%) |
| 75 Years and over | 155 (100.0%) | 117 (75.5%) |
| Total | 1,440 (26.2%) | 4,113 (74.7%) |
Disability Status by Sex by Age in Boothwyn
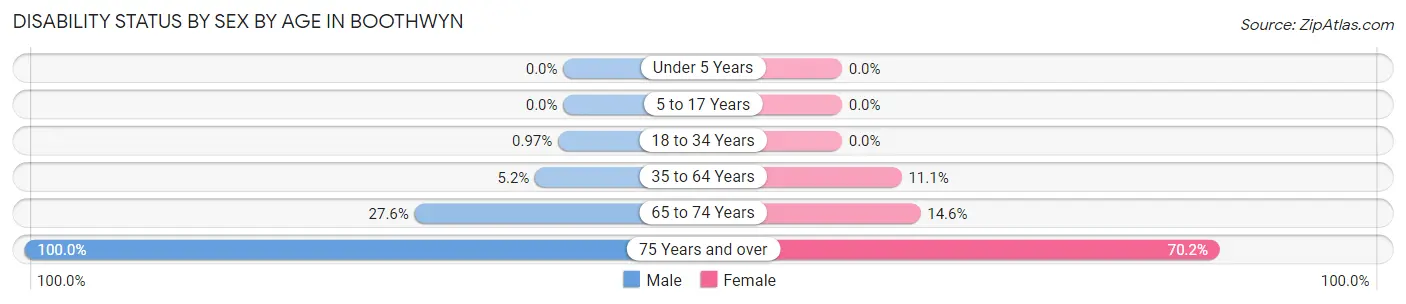
| Age Bracket | Male | Female |
| Under 5 Years | 0 (0.0%) | 0 (0.0%) |
| 5 to 17 Years | 0 (0.0%) | 0 (0.0%) |
| 18 to 34 Years | 8 (1.0%) | 0 (0.0%) |
| 35 to 64 Years | 56 (5.2%) | 124 (11.1%) |
| 65 to 74 Years | 74 (27.6%) | 44 (14.6%) |
| 75 Years and over | 31 (100.0%) | 87 (70.2%) |
Disability Class by Sex by Age in Boothwyn
Disability Class: Hearing Difficulty
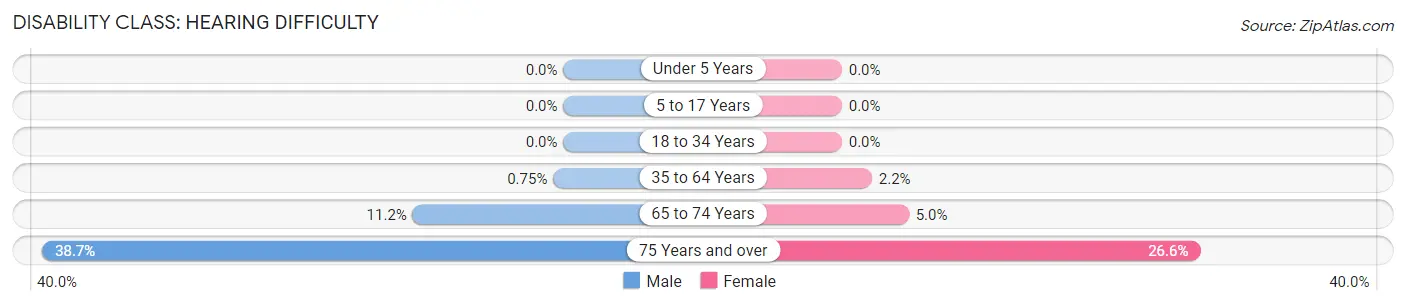
| Age Bracket | Male | Female |
| Under 5 Years | 0 (0.0%) | 0 (0.0%) |
| 5 to 17 Years | 0 (0.0%) | 0 (0.0%) |
| 18 to 34 Years | 0 (0.0%) | 0 (0.0%) |
| 35 to 64 Years | 8 (0.7%) | 25 (2.2%) |
| 65 to 74 Years | 30 (11.2%) | 15 (5.0%) |
| 75 Years and over | 12 (38.7%) | 33 (26.6%) |
Disability Class: Vision Difficulty
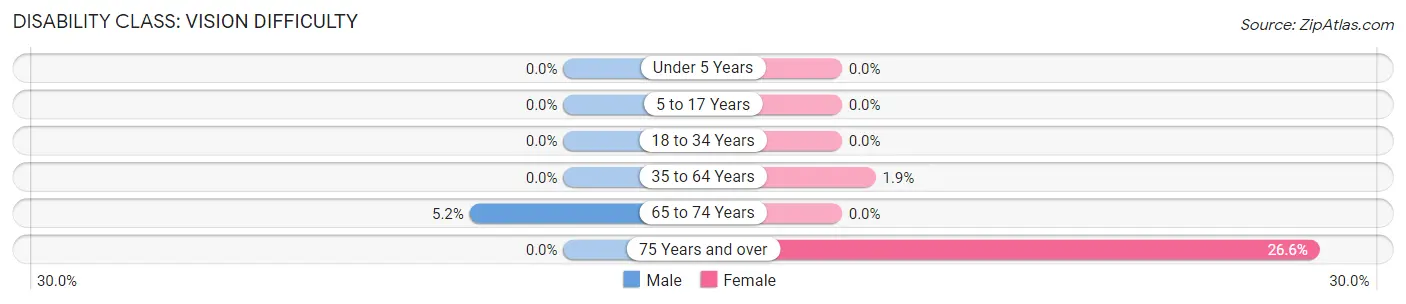
| Age Bracket | Male | Female |
| Under 5 Years | 0 (0.0%) | 0 (0.0%) |
| 5 to 17 Years | 0 (0.0%) | 0 (0.0%) |
| 18 to 34 Years | 0 (0.0%) | 0 (0.0%) |
| 35 to 64 Years | 0 (0.0%) | 21 (1.9%) |
| 65 to 74 Years | 14 (5.2%) | 0 (0.0%) |
| 75 Years and over | 0 (0.0%) | 33 (26.6%) |
Disability Class: Cognitive Difficulty
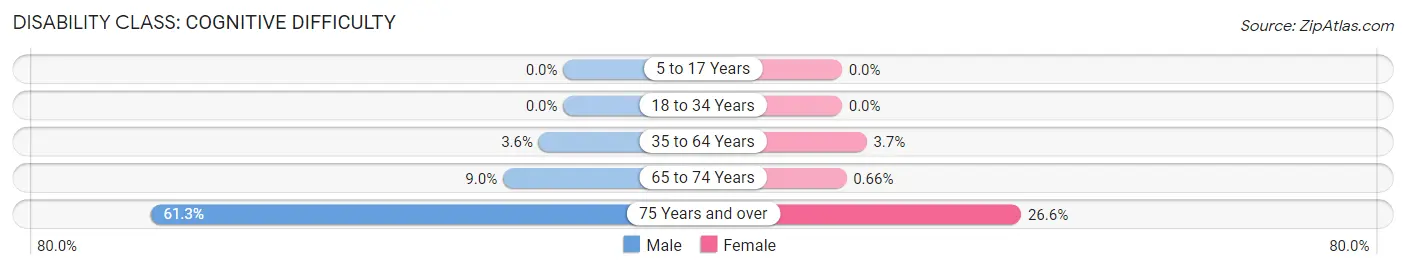
| Age Bracket | Male | Female |
| 5 to 17 Years | 0 (0.0%) | 0 (0.0%) |
| 18 to 34 Years | 0 (0.0%) | 0 (0.0%) |
| 35 to 64 Years | 39 (3.6%) | 41 (3.7%) |
| 65 to 74 Years | 24 (9.0%) | 2 (0.7%) |
| 75 Years and over | 19 (61.3%) | 33 (26.6%) |
Disability Class: Ambulatory Difficulty
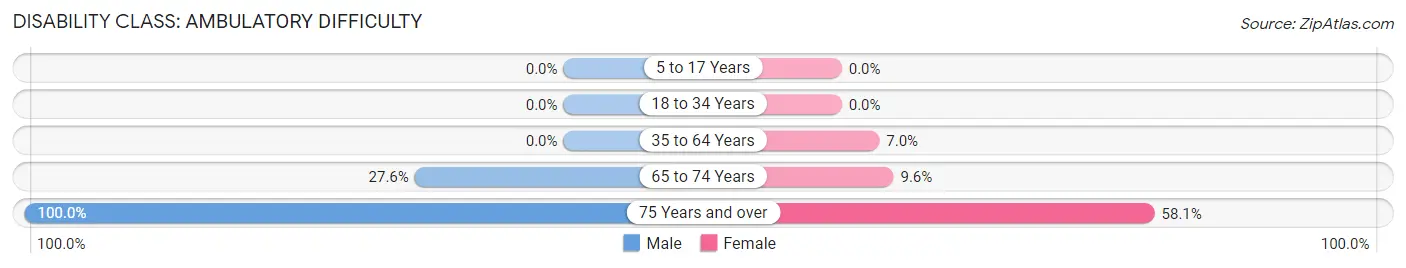
| Age Bracket | Male | Female |
| 5 to 17 Years | 0 (0.0%) | 0 (0.0%) |
| 18 to 34 Years | 0 (0.0%) | 0 (0.0%) |
| 35 to 64 Years | 0 (0.0%) | 78 (7.0%) |
| 65 to 74 Years | 74 (27.6%) | 29 (9.6%) |
| 75 Years and over | 31 (100.0%) | 72 (58.1%) |
Disability Class: Self-Care Difficulty
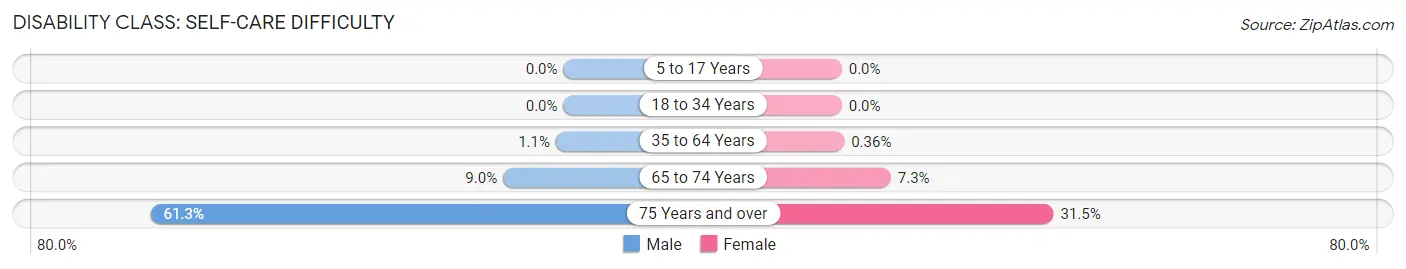
| Age Bracket | Male | Female |
| 5 to 17 Years | 0 (0.0%) | 0 (0.0%) |
| 18 to 34 Years | 0 (0.0%) | 0 (0.0%) |
| 35 to 64 Years | 12 (1.1%) | 4 (0.4%) |
| 65 to 74 Years | 24 (9.0%) | 22 (7.3%) |
| 75 Years and over | 19 (61.3%) | 39 (31.5%) |
Technology Access in Boothwyn
Computing Device Access in Boothwyn
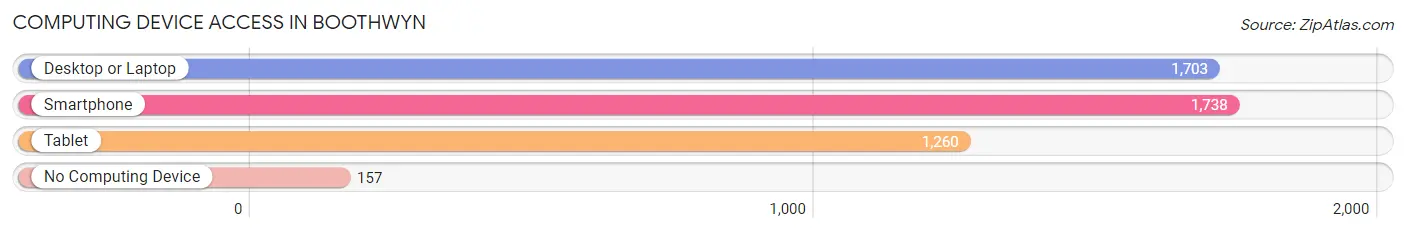
| Device Type | # Households | % Households |
| Desktop or Laptop | 1,703 | 83.3% |
| Smartphone | 1,738 | 85.0% |
| Tablet | 1,260 | 61.6% |
| No Computing Device | 157 | 7.7% |
| Total | 2,044 | 100.0% |
Internet Access in Boothwyn
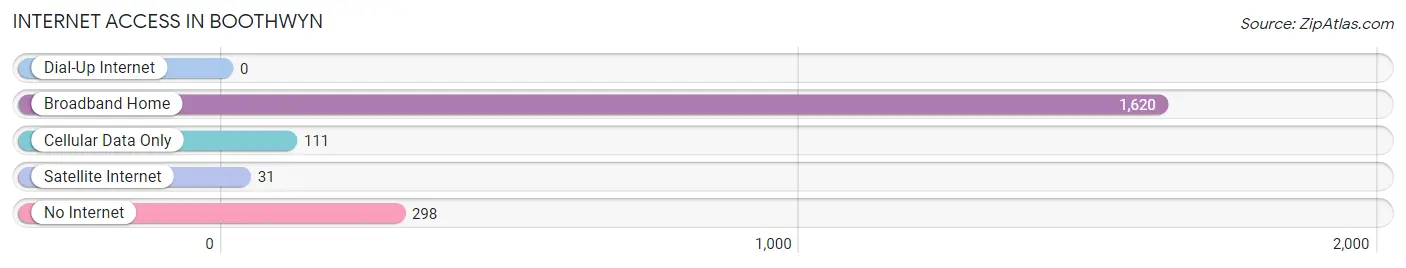
| Internet Type | # Households | % Households |
| Dial-Up Internet | 0 | 0.0% |
| Broadband Home | 1,620 | 79.3% |
| Cellular Data Only | 111 | 5.4% |
| Satellite Internet | 31 | 1.5% |
| No Internet | 298 | 14.6% |
| Total | 2,044 | 100.0% |
Boothwyn Summary
Boothwyn is a small unincorporated community located in Delaware County, Pennsylvania. It is situated in the southeastern corner of the county, just north of the Delaware state line. The population of Boothwyn was estimated to be 4,845 in the year 2000.
History
Boothwyn was first settled in the late 1700s by a group of Quakers from Chester County, Pennsylvania. The area was originally known as “Booth’s Corner” after the family who owned the land. The name was later changed to Boothwyn in 1876.
The area was primarily agricultural until the early 1900s when the Pennsylvania Railroad built a line through the area. This allowed for the development of industry and commerce in the area. The population of Boothwyn began to grow rapidly as people moved to the area for work.
Geography
Boothwyn is located in southeastern Delaware County, Pennsylvania. It is situated just north of the Delaware state line and is bordered by the townships of Upper Chichester, Nether Providence, and Ridley. The community is located on the banks of the Delaware River and is approximately 15 miles south of Philadelphia.
The terrain of Boothwyn is mostly flat with some rolling hills. The area is mostly wooded with some open fields. The climate is temperate with hot summers and cold winters.
Economy
Boothwyn’s economy is primarily based on manufacturing and retail. The area is home to several large manufacturing companies, including a steel mill, a paper mill, and a plastics factory. There are also several small businesses in the area, including restaurants, shops, and service providers.
The retail sector of Boothwyn’s economy is centered around the Boothwyn Shopping Center, which is located on the corner of Chichester Avenue and Boothwyn Road. The shopping center is home to several large chain stores, as well as smaller local businesses.
Demographics
As of the 2000 census, the population of Boothwyn was 4,845. The racial makeup of the town was 94.3% White, 2.3% African American, 0.7% Asian, 0.3% Native American, and 2.4% from other races. The median household income was $45,945, and the median family income was $54,945.
Boothwyn is a predominantly white community, with a small minority population. The town is home to a large number of families, with the majority of households consisting of married couples with children. The town is also home to a large number of senior citizens.
Common Questions
What is Per Capita Income in Boothwyn?
Per Capita income in Boothwyn is $39,929.
What is the Median Family Income in Boothwyn?
Median Family Income in Boothwyn is $115,795.
What is the Median Household income in Boothwyn?
Median Household Income in Boothwyn is $90,125.
What is Income or Wage Gap in Boothwyn?
Income or Wage Gap in Boothwyn is 47.8%.
Women in Boothwyn earn 52.2 cents for every dollar earned by a man.
What is Inequality or Gini Index in Boothwyn?
Inequality or Gini Index in Boothwyn is 0.38.
What is the Total Population of Boothwyn?
Total Population of Boothwyn is 5,506.
What is the Total Male Population of Boothwyn?
Total Male Population of Boothwyn is 2,885.
What is the Total Female Population of Boothwyn?
Total Female Population of Boothwyn is 2,621.
What is the Ratio of Males per 100 Females in Boothwyn?
There are 110.07 Males per 100 Females in Boothwyn.
What is the Ratio of Females per 100 Males in Boothwyn?
There are 90.85 Females per 100 Males in Boothwyn.
What is the Median Population Age in Boothwyn?
Median Population Age in Boothwyn is 37.6 Years.
What is the Average Family Size in Boothwyn
Average Family Size in Boothwyn is 3.4 People.
What is the Average Household Size in Boothwyn
Average Household Size in Boothwyn is 2.7 People.
How Large is the Labor Force in Boothwyn?
There are 3,403 People in the Labor Forcein in Boothwyn.
What is the Percentage of People in the Labor Force in Boothwyn?
73.7% of People are in the Labor Force in Boothwyn.
What is the Unemployment Rate in Boothwyn?
Unemployment Rate in Boothwyn is 3.8%.