Lebanon South, PA Map & Demographics
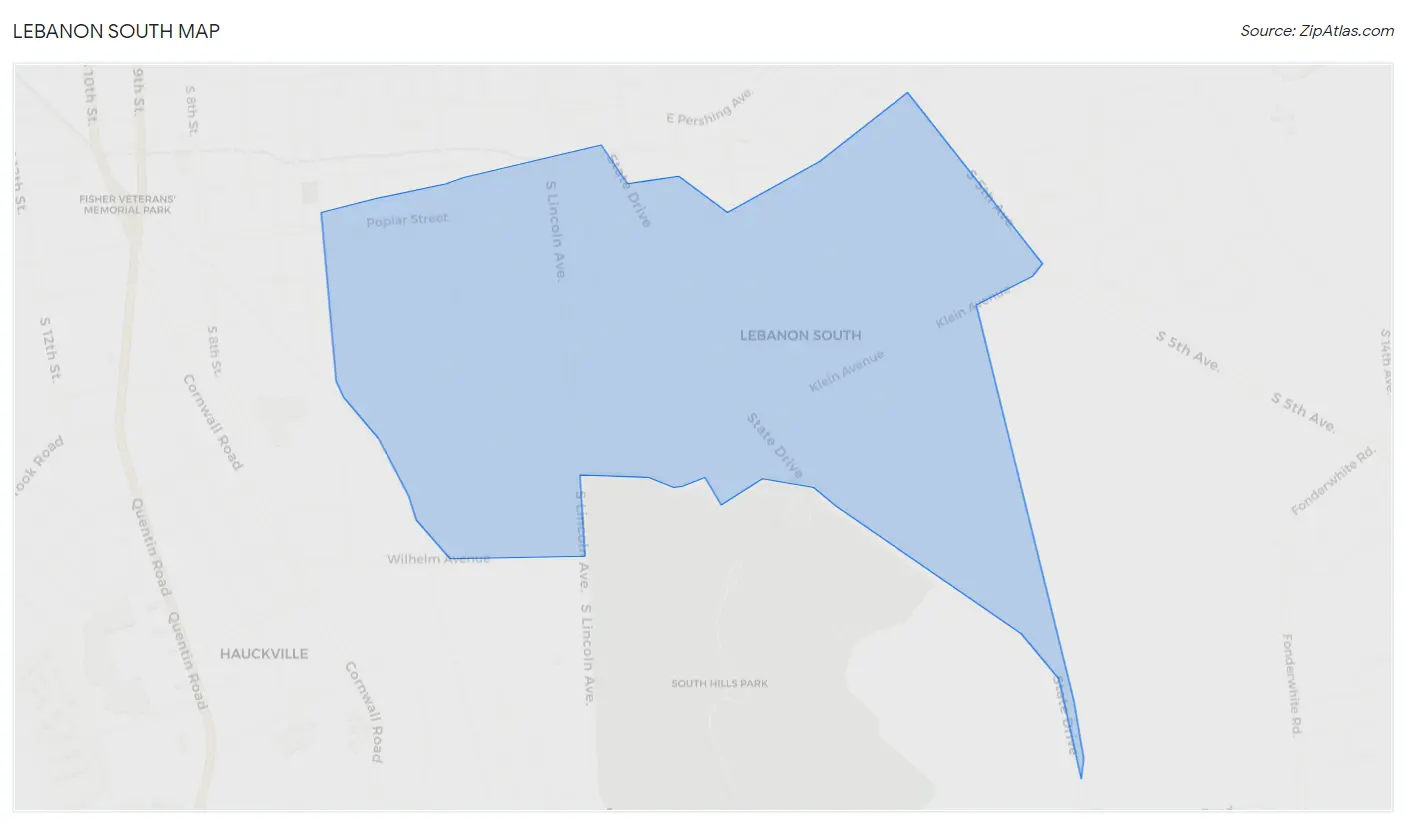
Lebanon South Map
Lebanon South Overview
$41,728
PER CAPITA INCOME
$97,237
AVG FAMILY INCOME
$72,045
AVG HOUSEHOLD INCOME
28.7%
WAGE / INCOME GAP [ % ]
71.3¢/ $1
WAGE / INCOME GAP [ $ ]
0.36
INEQUALITY / GINI INDEX
2,083
TOTAL POPULATION
943
MALE POPULATION
1,140
FEMALE POPULATION
82.72
MALES / 100 FEMALES
120.89
FEMALES / 100 MALES
55.2
MEDIAN AGE
2.5
AVG FAMILY SIZE
2.1
AVG HOUSEHOLD SIZE
1,063
LABOR FORCE [ PEOPLE ]
58.8%
PERCENT IN LABOR FORCE
4.0%
UNEMPLOYMENT RATE
Income in Lebanon South
Income Overview in Lebanon South
Per Capita Income in Lebanon South is $41,728, while median incomes of families and households are $97,237 and $72,045 respectively.
| Characteristic | Number | Measure |
| Per Capita Income | 2,083 | $41,728 |
| Median Family Income | 648 | $97,237 |
| Mean Family Income | 648 | $100,667 |
| Median Household Income | 978 | $72,045 |
| Mean Household Income | 978 | $85,792 |
| Income Deficit | 648 | $0 |
| Wage / Income Gap (%) | 2,083 | 28.66% |
| Wage / Income Gap ($) | 2,083 | 71.34¢ per $1 |
| Gini / Inequality Index | 2,083 | 0.36 |
Earnings by Sex in Lebanon South
Average Earnings in Lebanon South are $42,639, $51,000 for men and $36,382 for women, a difference of 28.7%.
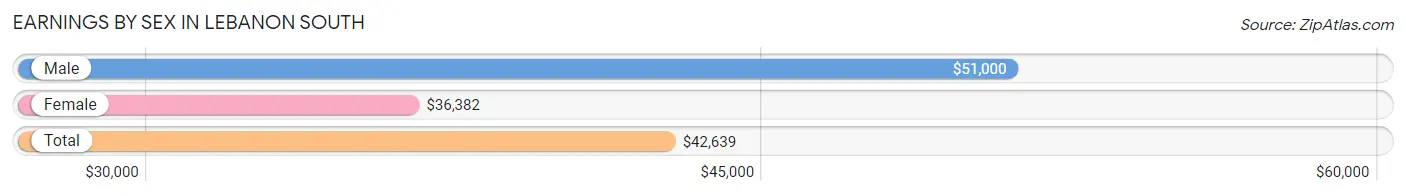
| Sex | Number | Average Earnings |
| Male | 562 (48.9%) | $51,000 |
| Female | 587 (51.1%) | $36,382 |
| Total | 1,149 (100.0%) | $42,639 |
Earnings by Sex by Income Bracket in Lebanon South
The most common earnings brackets in Lebanon South are $50,000 to $54,999 for men (87 | 15.5%) and $30,000 to $34,999 for women (74 | 12.6%).
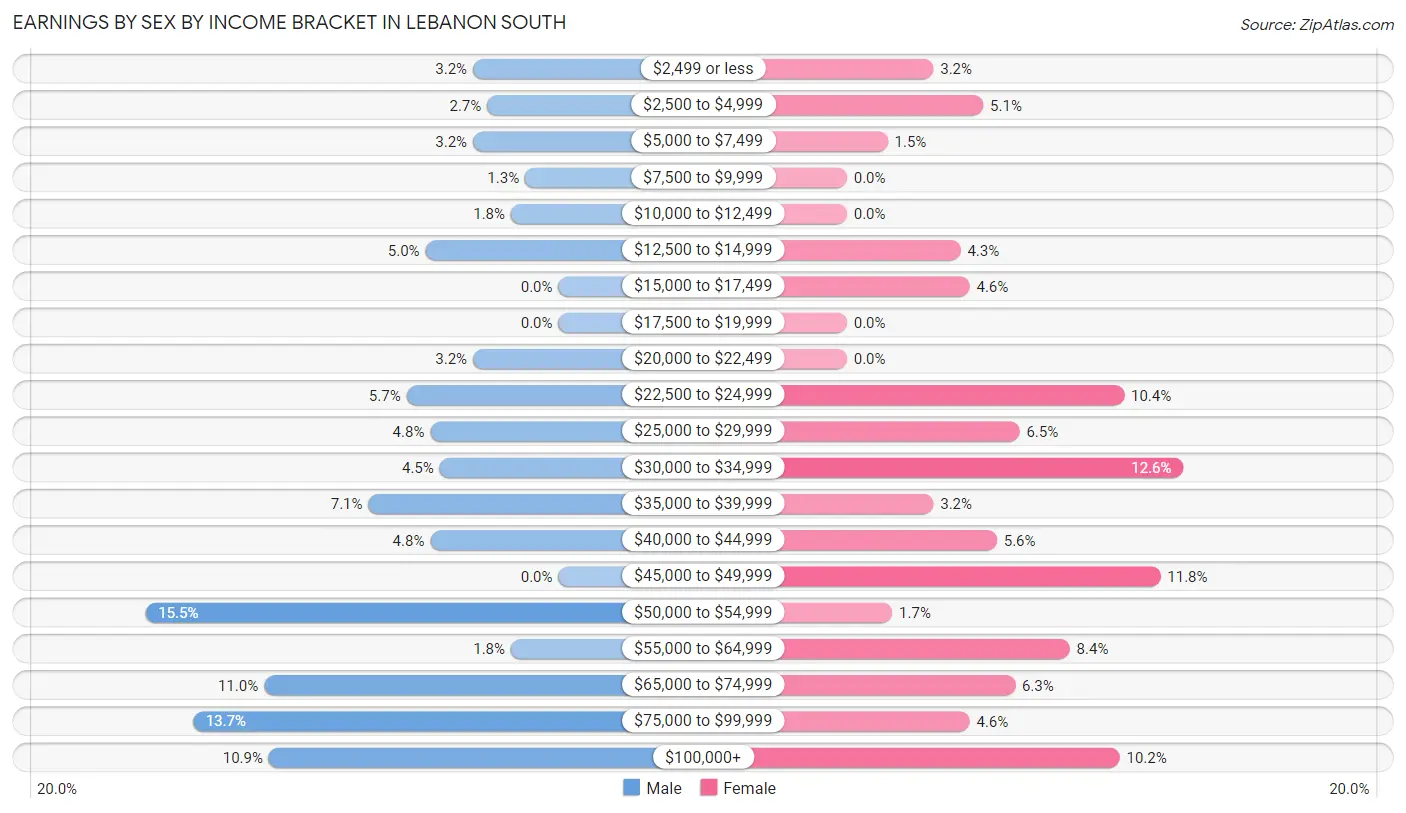
| Income | Male | Female |
| $2,499 or less | 18 (3.2%) | 19 (3.2%) |
| $2,500 to $4,999 | 15 (2.7%) | 30 (5.1%) |
| $5,000 to $7,499 | 18 (3.2%) | 9 (1.5%) |
| $7,500 to $9,999 | 7 (1.3%) | 0 (0.0%) |
| $10,000 to $12,499 | 10 (1.8%) | 0 (0.0%) |
| $12,500 to $14,999 | 28 (5.0%) | 25 (4.3%) |
| $15,000 to $17,499 | 0 (0.0%) | 27 (4.6%) |
| $17,500 to $19,999 | 0 (0.0%) | 0 (0.0%) |
| $20,000 to $22,499 | 18 (3.2%) | 0 (0.0%) |
| $22,500 to $24,999 | 32 (5.7%) | 61 (10.4%) |
| $25,000 to $29,999 | 27 (4.8%) | 38 (6.5%) |
| $30,000 to $34,999 | 25 (4.4%) | 74 (12.6%) |
| $35,000 to $39,999 | 40 (7.1%) | 19 (3.2%) |
| $40,000 to $44,999 | 27 (4.8%) | 33 (5.6%) |
| $45,000 to $49,999 | 0 (0.0%) | 69 (11.7%) |
| $50,000 to $54,999 | 87 (15.5%) | 10 (1.7%) |
| $55,000 to $64,999 | 10 (1.8%) | 49 (8.4%) |
| $65,000 to $74,999 | 62 (11.0%) | 37 (6.3%) |
| $75,000 to $99,999 | 77 (13.7%) | 27 (4.6%) |
| $100,000+ | 61 (10.8%) | 60 (10.2%) |
| Total | 562 (100.0%) | 587 (100.0%) |
Earnings by Sex by Educational Attainment in Lebanon South
Average earnings in Lebanon South are $52,713 for men and $40,347 for women, a difference of 23.5%. Men with an educational attainment of college or associate's degree enjoy the highest average annual earnings of $72,100, while those with bachelor's degree education earn the least with $50,104. Women with an educational attainment of bachelor's degree earn the most with the average annual earnings of $74,167, while those with college or associate's degree education have the smallest earnings of $34,625.
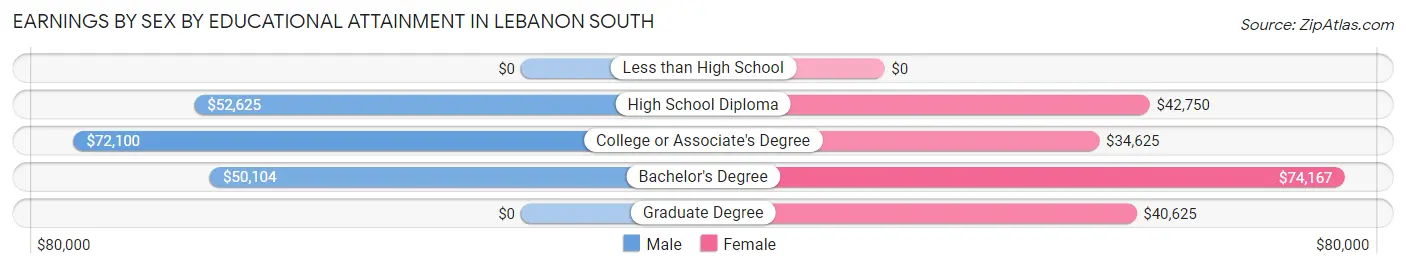
| Educational Attainment | Male Income | Female Income |
| Less than High School | - | - |
| High School Diploma | $52,625 | $42,750 |
| College or Associate's Degree | $72,100 | $34,625 |
| Bachelor's Degree | $50,104 | $74,167 |
| Graduate Degree | - | - |
| Total | $52,713 | $40,347 |
Family Income in Lebanon South
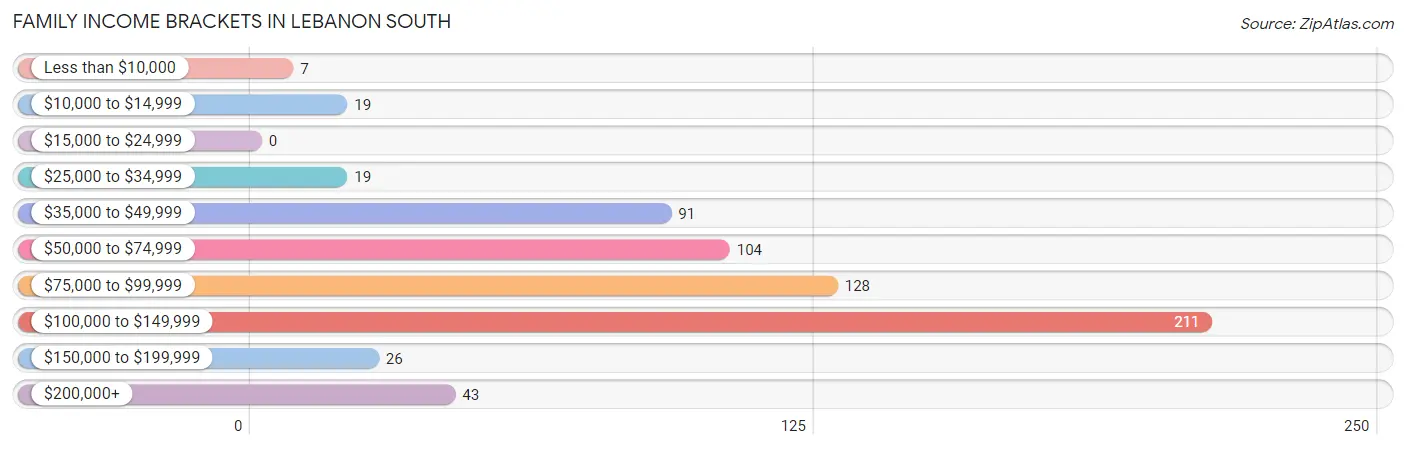
Family Income Brackets in Lebanon South
According to the Lebanon South family income data, there are 211 families falling into the $100,000 to $149,999 income range, which is the most common income bracket and makes up 32.6% of all families.
| Income Bracket | # Families | % Families |
| Less than $10,000 | 7 | 1.1% |
| $10,000 to $14,999 | 19 | 2.9% |
| $15,000 to $24,999 | 0 | 0.0% |
| $25,000 to $34,999 | 19 | 2.9% |
| $35,000 to $49,999 | 91 | 14.0% |
| $50,000 to $74,999 | 104 | 16.0% |
| $75,000 to $99,999 | 128 | 19.8% |
| $100,000 to $149,999 | 211 | 32.6% |
| $150,000 to $199,999 | 26 | 4.0% |
| $200,000+ | 43 | 6.6% |
Family Income by Famaliy Size in Lebanon South
4-person families (52 | 8.0%) account for the highest median family income in Lebanon South with $152,083 per family, while 2-person families (505 | 77.9%) have the highest median income of $48,635 per family member.
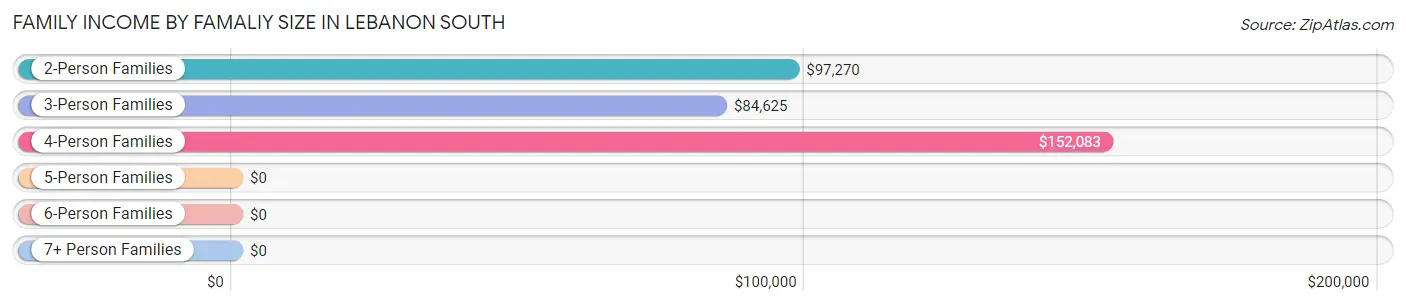
| Income Bracket | # Families | Median Income |
| 2-Person Families | 505 (77.9%) | $97,270 |
| 3-Person Families | 65 (10.0%) | $84,625 |
| 4-Person Families | 52 (8.0%) | $152,083 |
| 5-Person Families | 19 (2.9%) | $0 |
| 6-Person Families | 7 (1.1%) | $0 |
| 7+ Person Families | 0 (0.0%) | $0 |
| Total | 648 (100.0%) | $97,237 |
Family Income by Number of Earners in Lebanon South
The median family income in Lebanon South is $97,237, with families comprising 3+ earners (38) having the highest median family income of $108,214, while families with no earners (143) have the lowest median family income of $48,750, accounting for 5.9% and 22.1% of families, respectively.
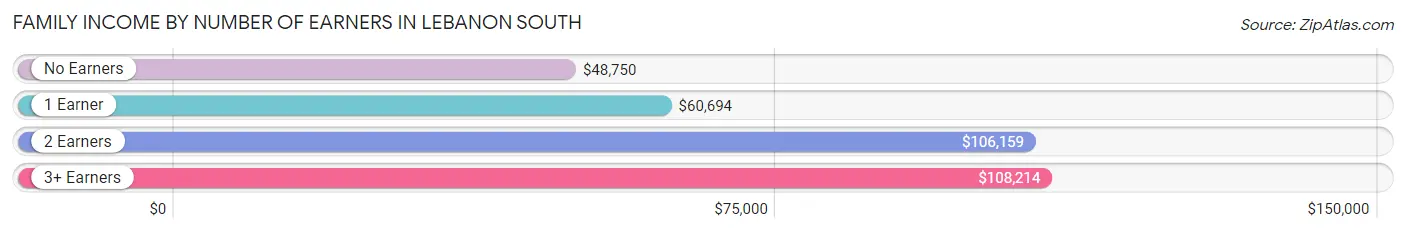
| Number of Earners | # Families | Median Income |
| No Earners | 143 (22.1%) | $48,750 |
| 1 Earner | 165 (25.5%) | $60,694 |
| 2 Earners | 302 (46.6%) | $106,159 |
| 3+ Earners | 38 (5.9%) | $108,214 |
| Total | 648 (100.0%) | $97,237 |
Household Income in Lebanon South
Household Income Brackets in Lebanon South
With 246 households falling in the category, the $100,000 to $149,999 income range is the most frequent in Lebanon South, accounting for 25.2% of all households. In contrast, only 19 households (1.9%) fall into the less than $10,000 income bracket, making it the least populous group.
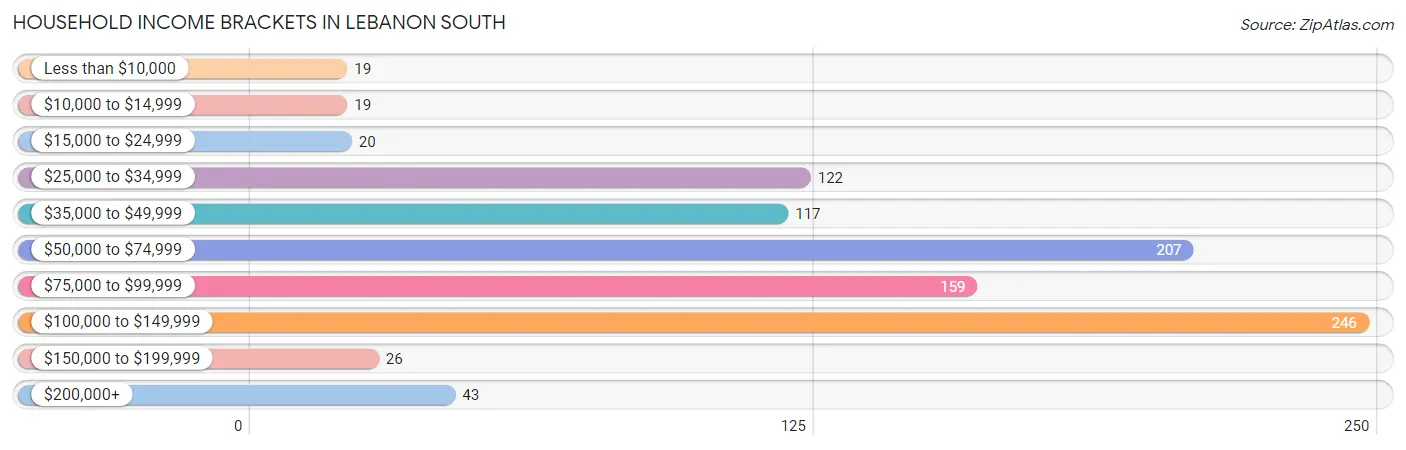
| Income Bracket | # Households | % Households |
| Less than $10,000 | 19 | 1.9% |
| $10,000 to $14,999 | 19 | 1.9% |
| $15,000 to $24,999 | 20 | 2.0% |
| $25,000 to $34,999 | 122 | 12.5% |
| $35,000 to $49,999 | 117 | 12.0% |
| $50,000 to $74,999 | 207 | 21.2% |
| $75,000 to $99,999 | 159 | 16.3% |
| $100,000 to $149,999 | 246 | 25.2% |
| $150,000 to $199,999 | 26 | 2.7% |
| $200,000+ | 43 | 4.4% |
Household Income by Householder Age in Lebanon South
The median household income in Lebanon South is $72,045, with the highest median household income of $98,719 found in the 45 to 64 years age bracket for the primary householder. A total of 371 households (37.9%) fall into this category. Meanwhile, the 15 to 24 years age bracket for the primary householder has the lowest median household income of $0, with 22 households (2.2%) in this group.
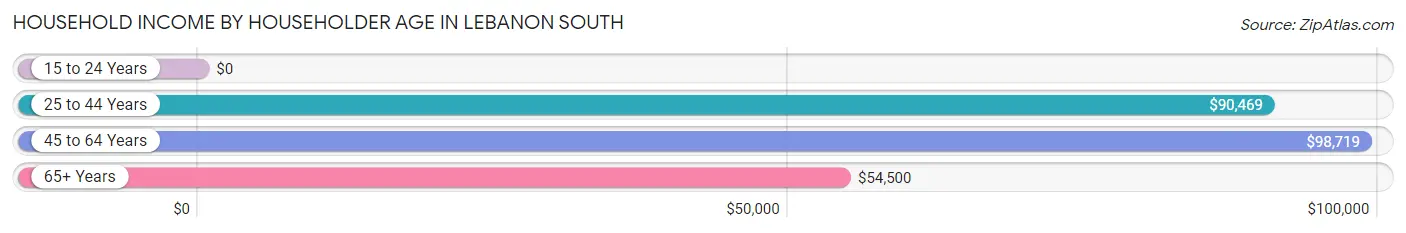
| Income Bracket | # Households | Median Income |
| 15 to 24 Years | 22 (2.2%) | $0 |
| 25 to 44 Years | 171 (17.5%) | $90,469 |
| 45 to 64 Years | 371 (37.9%) | $98,719 |
| 65+ Years | 414 (42.3%) | $54,500 |
| Total | 978 (100.0%) | $72,045 |
Poverty in Lebanon South
Income Below Poverty by Sex and Age in Lebanon South
With 11.7% poverty level for males and 11.0% for females among the residents of Lebanon South, 6 to 11 year old males and 6 to 11 year old females are the most vulnerable to poverty, with 35 males (63.6%) and 52 females (57.8%) in their respective age groups living below the poverty level.
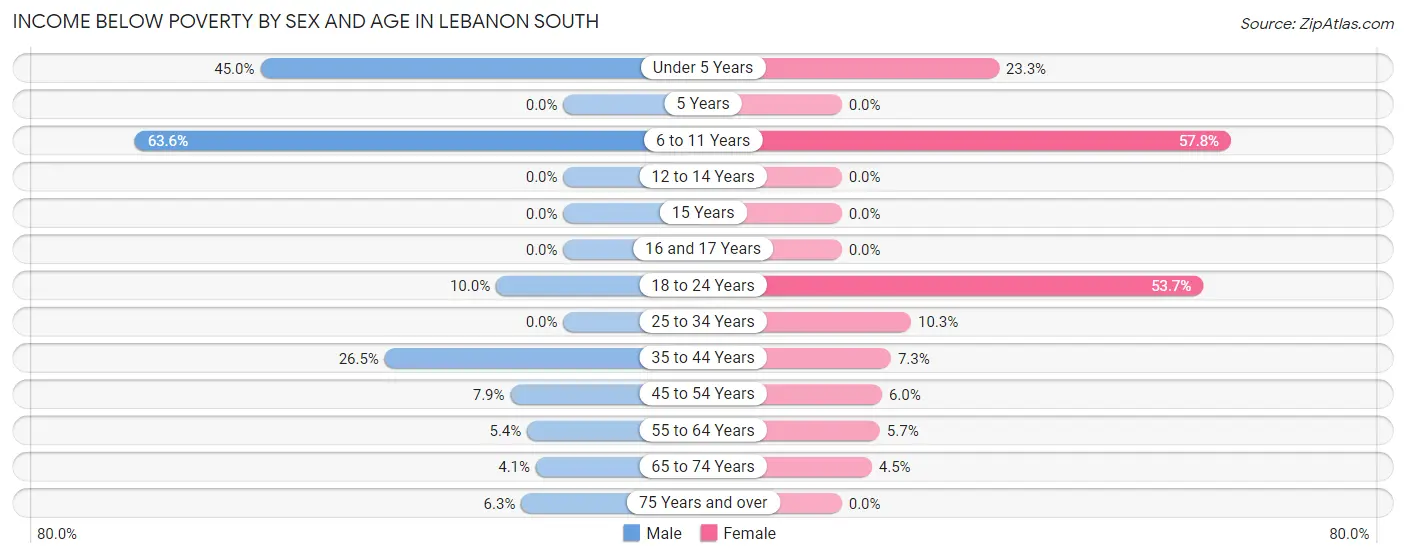
| Age Bracket | Male | Female |
| Under 5 Years | 9 (45.0%) | 7 (23.3%) |
| 5 Years | 0 (0.0%) | 0 (0.0%) |
| 6 to 11 Years | 35 (63.6%) | 52 (57.8%) |
| 12 to 14 Years | 0 (0.0%) | 0 (0.0%) |
| 15 Years | 0 (0.0%) | 0 (0.0%) |
| 16 and 17 Years | 0 (0.0%) | 0 (0.0%) |
| 18 to 24 Years | 8 (10.0%) | 22 (53.7%) |
| 25 to 34 Years | 0 (0.0%) | 7 (10.3%) |
| 35 to 44 Years | 26 (26.5%) | 10 (7.3%) |
| 45 to 54 Years | 7 (7.9%) | 9 (6.0%) |
| 55 to 64 Years | 10 (5.4%) | 9 (5.7%) |
| 65 to 74 Years | 6 (4.1%) | 9 (4.5%) |
| 75 Years and over | 9 (6.2%) | 0 (0.0%) |
| Total | 110 (11.7%) | 125 (11.0%) |
Income Above Poverty by Sex and Age in Lebanon South
According to the poverty statistics in Lebanon South, males aged 12 to 14 years and females aged 5 years are the age groups that are most secure financially, with 100.0% of males and 100.0% of females in these age groups living above the poverty line.
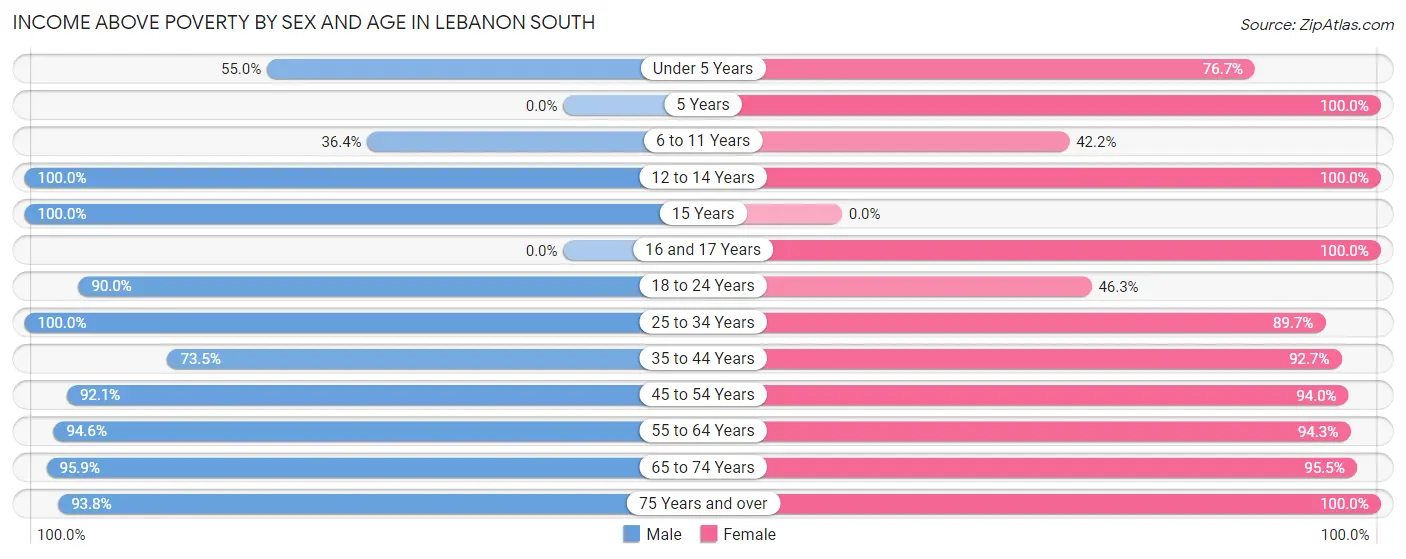
| Age Bracket | Male | Female |
| Under 5 Years | 11 (55.0%) | 23 (76.7%) |
| 5 Years | 0 (0.0%) | 18 (100.0%) |
| 6 to 11 Years | 20 (36.4%) | 38 (42.2%) |
| 12 to 14 Years | 20 (100.0%) | 24 (100.0%) |
| 15 Years | 18 (100.0%) | 0 (0.0%) |
| 16 and 17 Years | 0 (0.0%) | 15 (100.0%) |
| 18 to 24 Years | 72 (90.0%) | 19 (46.3%) |
| 25 to 34 Years | 86 (100.0%) | 61 (89.7%) |
| 35 to 44 Years | 72 (73.5%) | 127 (92.7%) |
| 45 to 54 Years | 82 (92.1%) | 142 (94.0%) |
| 55 to 64 Years | 176 (94.6%) | 150 (94.3%) |
| 65 to 74 Years | 141 (95.9%) | 193 (95.5%) |
| 75 Years and over | 135 (93.8%) | 205 (100.0%) |
| Total | 833 (88.3%) | 1,015 (89.0%) |
Income Below Poverty Among Married-Couple Families in Lebanon South
The poverty statistics for married-couple families in Lebanon South show that 4.0% or 20 of the total 504 families live below the poverty line. Families with 3 or 4 children have the highest poverty rate of 100.0%, comprising of 10 families. On the other hand, families with 1 or 2 children have the lowest poverty rate of 0.0%, which includes 0 families.
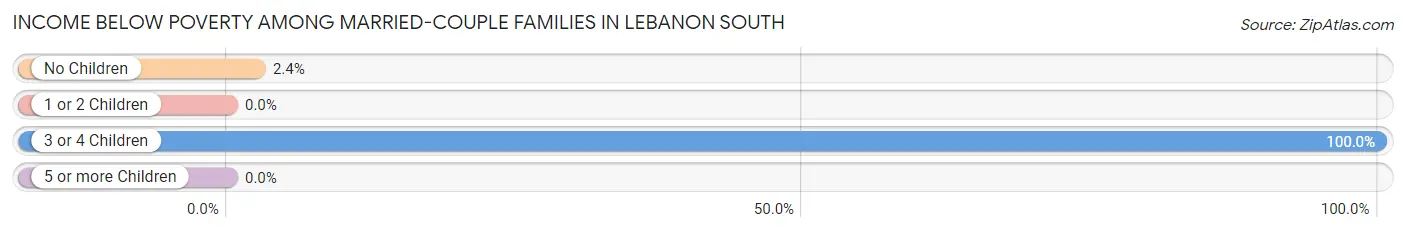
| Children | Above Poverty | Below Poverty |
| No Children | 401 (97.6%) | 10 (2.4%) |
| 1 or 2 Children | 83 (100.0%) | 0 (0.0%) |
| 3 or 4 Children | 0 (0.0%) | 10 (100.0%) |
| 5 or more Children | 0 (0.0%) | 0 (0.0%) |
| Total | 484 (96.0%) | 20 (4.0%) |
Income Below Poverty Among Single-Parent Households in Lebanon South
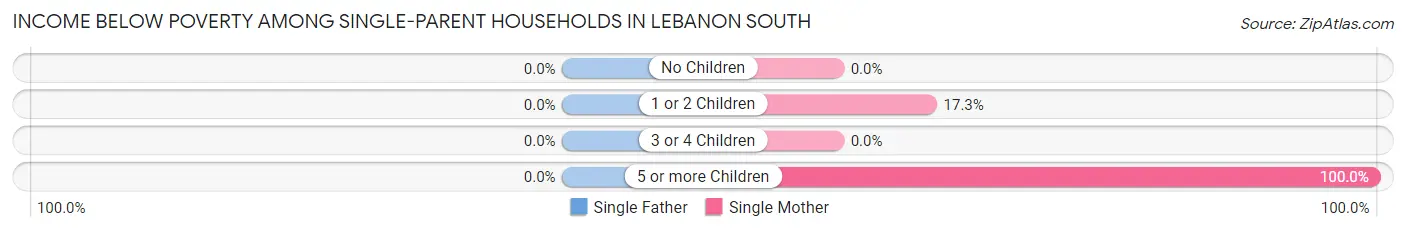
| Children | Single Father | Single Mother |
| No Children | 0 (0.0%) | 0 (0.0%) |
| 1 or 2 Children | 0 (0.0%) | 9 (17.3%) |
| 3 or 4 Children | 0 (0.0%) | 0 (0.0%) |
| 5 or more Children | 0 (0.0%) | 7 (100.0%) |
| Total | 0 (0.0%) | 16 (11.9%) |
Income Below Poverty Among Married-Couple vs Single-Parent Households in Lebanon South
The poverty data for Lebanon South shows that 20 of the married-couple family households (4.0%) and 16 of the single-parent households (11.1%) are living below the poverty level. Within the married-couple family households, those with 3 or 4 children have the highest poverty rate, with 10 households (100.0%) falling below the poverty line. Among the single-parent households, those with 5 or more children have the highest poverty rate, with 7 household (100.0%) living below poverty.
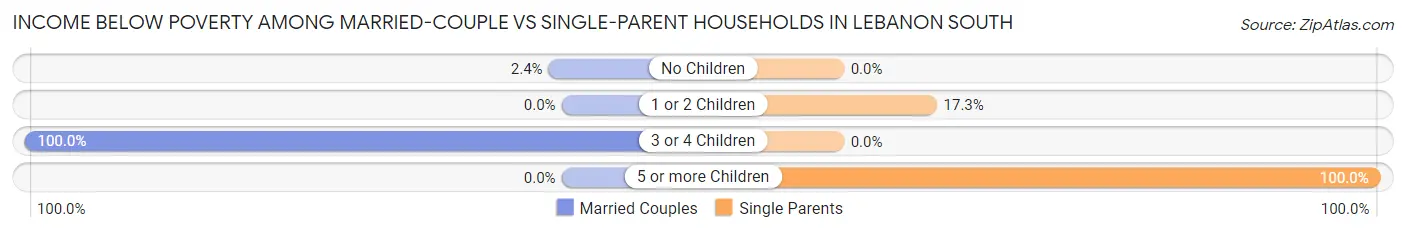
| Children | Married-Couple Families | Single-Parent Households |
| No Children | 10 (2.4%) | 0 (0.0%) |
| 1 or 2 Children | 0 (0.0%) | 9 (17.3%) |
| 3 or 4 Children | 10 (100.0%) | 0 (0.0%) |
| 5 or more Children | 0 (0.0%) | 7 (100.0%) |
| Total | 20 (4.0%) | 16 (11.1%) |
Race in Lebanon South
The most populous races in Lebanon South are White / Caucasian (1,962 | 94.2%), Hispanic or Latino (254 | 12.2%), and Two or more Races (100 | 4.8%).
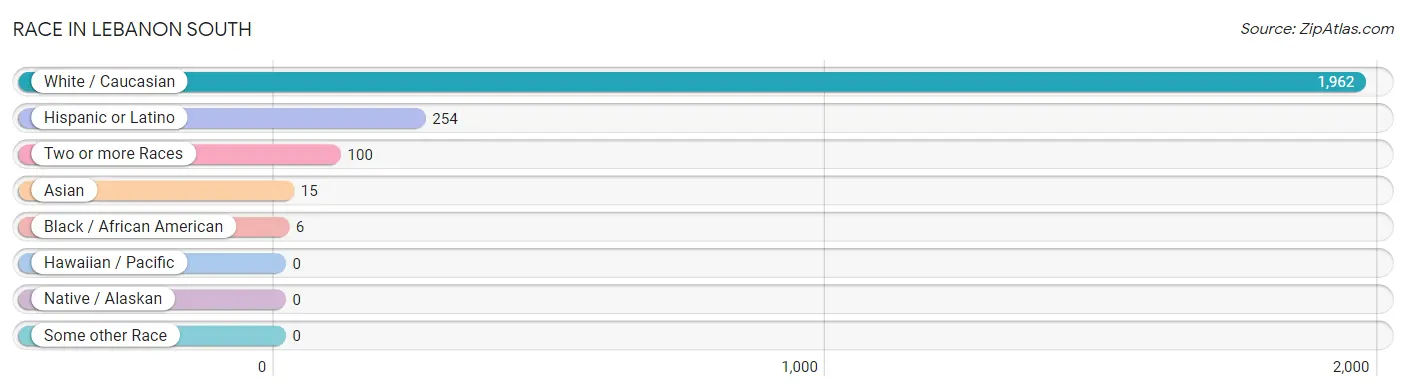
| Race | # Population | % Population |
| Asian | 15 | 0.7% |
| Black / African American | 6 | 0.3% |
| Hawaiian / Pacific | 0 | 0.0% |
| Hispanic or Latino | 254 | 12.2% |
| Native / Alaskan | 0 | 0.0% |
| White / Caucasian | 1,962 | 94.2% |
| Two or more Races | 100 | 4.8% |
| Some other Race | 0 | 0.0% |
| Total | 2,083 | 100.0% |
Ancestry in Lebanon South
The most populous ancestries reported in Lebanon South are German (857 | 41.1%), Irish (299 | 14.3%), Puerto Rican (236 | 11.3%), Italian (131 | 6.3%), and English (116 | 5.6%), together accounting for 78.7% of all Lebanon South residents.
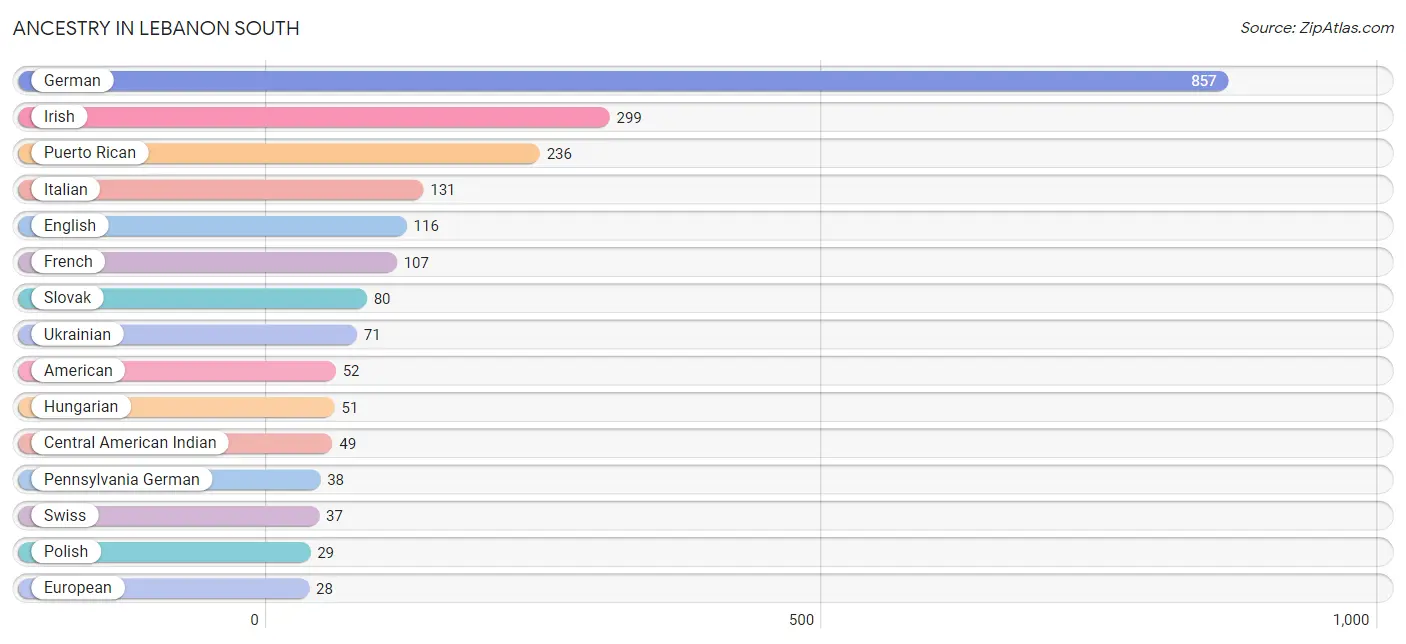
| Ancestry | # Population | % Population |
| American | 52 | 2.5% |
| Austrian | 9 | 0.4% |
| British | 13 | 0.6% |
| Central American Indian | 49 | 2.4% |
| Cherokee | 2 | 0.1% |
| Croatian | 17 | 0.8% |
| Danish | 9 | 0.4% |
| Dutch | 9 | 0.4% |
| Eastern European | 10 | 0.5% |
| English | 116 | 5.6% |
| European | 28 | 1.3% |
| French | 107 | 5.1% |
| German | 857 | 41.1% |
| Hungarian | 51 | 2.5% |
| Irish | 299 | 14.3% |
| Iroquois | 7 | 0.3% |
| Italian | 131 | 6.3% |
| Korean | 10 | 0.5% |
| Mexican | 18 | 0.9% |
| Norwegian | 17 | 0.8% |
| Pennsylvania German | 38 | 1.8% |
| Polish | 29 | 1.4% |
| Puerto Rican | 236 | 11.3% |
| Scotch-Irish | 10 | 0.5% |
| Scottish | 24 | 1.1% |
| Serbian | 9 | 0.4% |
| Slovak | 80 | 3.8% |
| Sri Lankan | 17 | 0.8% |
| Swedish | 18 | 0.9% |
| Swiss | 37 | 1.8% |
| Ukrainian | 71 | 3.4% | View All 31 Rows |
Immigrants in Lebanon South
The most numerous immigrant groups reported in Lebanon South came from Europe (35 | 1.7%), Eastern Europe (28 | 1.3%), Ukraine (20 | 1.0%), Asia (14 | 0.7%), and South Central Asia (10 | 0.5%), together accounting for 5.1% of all Lebanon South residents.
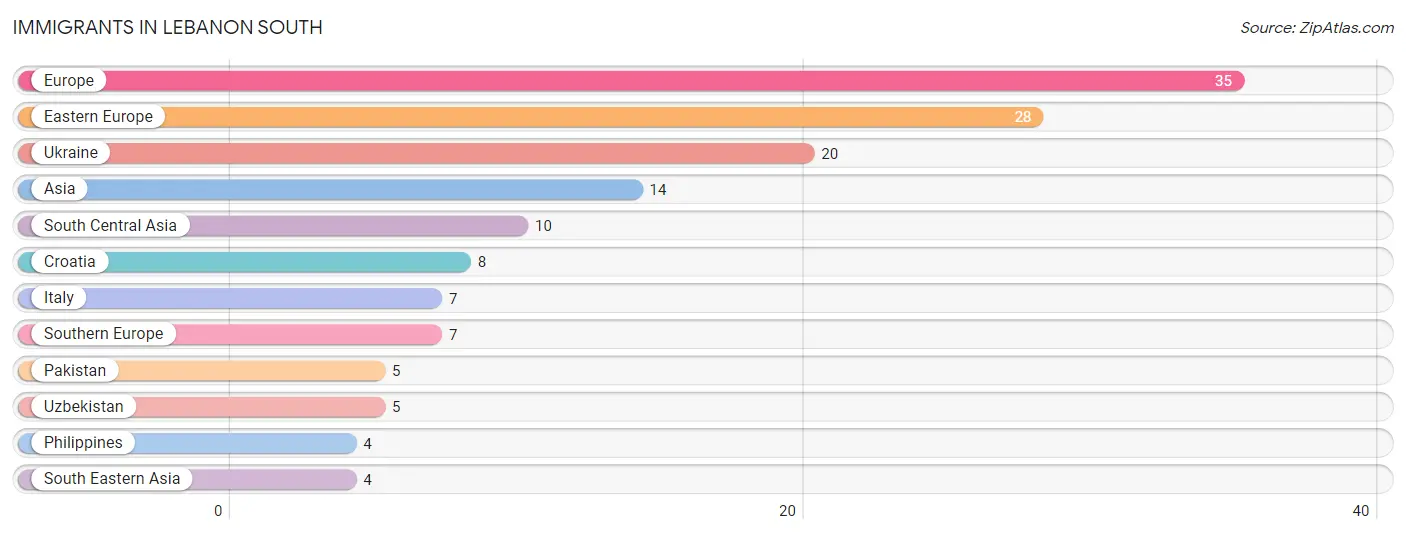
| Immigration Origin | # Population | % Population |
| Asia | 14 | 0.7% |
| Croatia | 8 | 0.4% |
| Eastern Europe | 28 | 1.3% |
| Europe | 35 | 1.7% |
| Italy | 7 | 0.3% |
| Pakistan | 5 | 0.2% |
| Philippines | 4 | 0.2% |
| South Central Asia | 10 | 0.5% |
| South Eastern Asia | 4 | 0.2% |
| Southern Europe | 7 | 0.3% |
| Ukraine | 20 | 1.0% |
| Uzbekistan | 5 | 0.2% | View All 12 Rows |
Sex and Age in Lebanon South
Sex and Age in Lebanon South
The most populous age groups in Lebanon South are 60 to 64 Years (125 | 13.3%) for men and 50 to 54 Years (138 | 12.1%) for women.
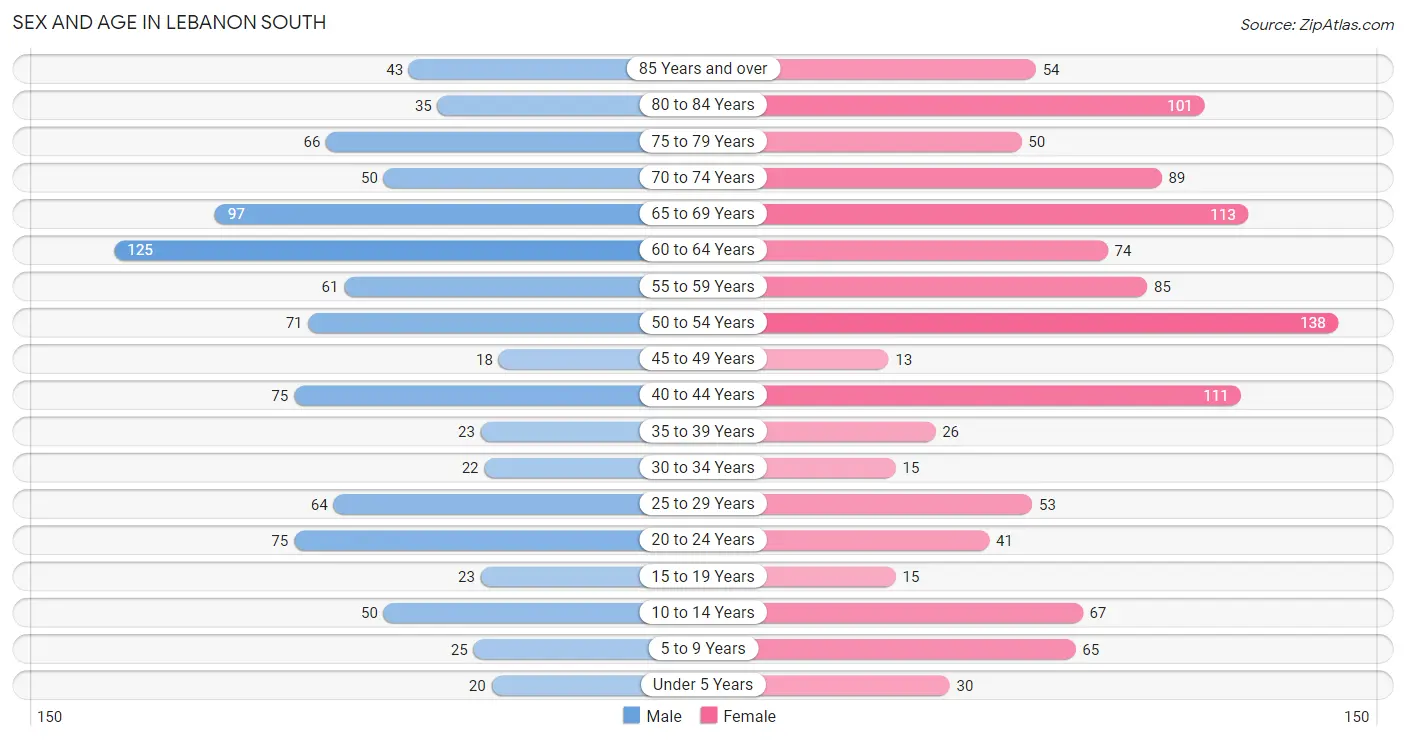
| Age Bracket | Male | Female |
| Under 5 Years | 20 (2.1%) | 30 (2.6%) |
| 5 to 9 Years | 25 (2.6%) | 65 (5.7%) |
| 10 to 14 Years | 50 (5.3%) | 67 (5.9%) |
| 15 to 19 Years | 23 (2.4%) | 15 (1.3%) |
| 20 to 24 Years | 75 (8.0%) | 41 (3.6%) |
| 25 to 29 Years | 64 (6.8%) | 53 (4.6%) |
| 30 to 34 Years | 22 (2.3%) | 15 (1.3%) |
| 35 to 39 Years | 23 (2.4%) | 26 (2.3%) |
| 40 to 44 Years | 75 (8.0%) | 111 (9.7%) |
| 45 to 49 Years | 18 (1.9%) | 13 (1.1%) |
| 50 to 54 Years | 71 (7.5%) | 138 (12.1%) |
| 55 to 59 Years | 61 (6.5%) | 85 (7.5%) |
| 60 to 64 Years | 125 (13.3%) | 74 (6.5%) |
| 65 to 69 Years | 97 (10.3%) | 113 (9.9%) |
| 70 to 74 Years | 50 (5.3%) | 89 (7.8%) |
| 75 to 79 Years | 66 (7.0%) | 50 (4.4%) |
| 80 to 84 Years | 35 (3.7%) | 101 (8.9%) |
| 85 Years and over | 43 (4.6%) | 54 (4.7%) |
| Total | 943 (100.0%) | 1,140 (100.0%) |
Families and Households in Lebanon South
Median Family Size in Lebanon South
The median family size in Lebanon South is 2.54 persons per family, with married-couple families (504 | 77.8%) accounting for the largest median family size of 2.54 persons per family. On the other hand, single male/father families (10 | 1.5%) represent the smallest median family size with 2.30 persons per family.
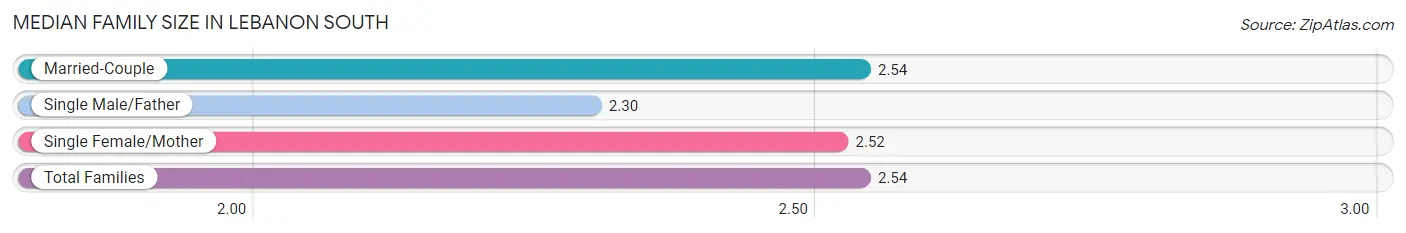
| Family Type | # Families | Family Size |
| Married-Couple | 504 (77.8%) | 2.54 |
| Single Male/Father | 10 (1.5%) | 2.30 |
| Single Female/Mother | 134 (20.7%) | 2.52 |
| Total Families | 648 (100.0%) | 2.54 |
Median Household Size in Lebanon South
The median household size in Lebanon South is 2.13 persons per household, with single female/mother households (134 | 13.7%) accounting for the largest median household size of 2.7 persons per household. non-family households (330 | 33.7%) represent the smallest median household size with 1.25 persons per household.

| Household Type | # Households | Household Size |
| Married-Couple | 504 (51.5%) | 2.55 |
| Single Male/Father | 10 (1.0%) | 2.30 |
| Single Female/Mother | 134 (13.7%) | 2.70 |
| Non-family | 330 (33.7%) | 1.25 |
| Total Households | 978 (100.0%) | 2.13 |
Household Size by Marriage Status in Lebanon South
Out of a total of 978 households in Lebanon South, 648 (66.3%) are family households, while 330 (33.7%) are nonfamily households. The most numerous type of family households are 2-person households, comprising 479, and the most common type of nonfamily households are 1-person households, comprising 268.
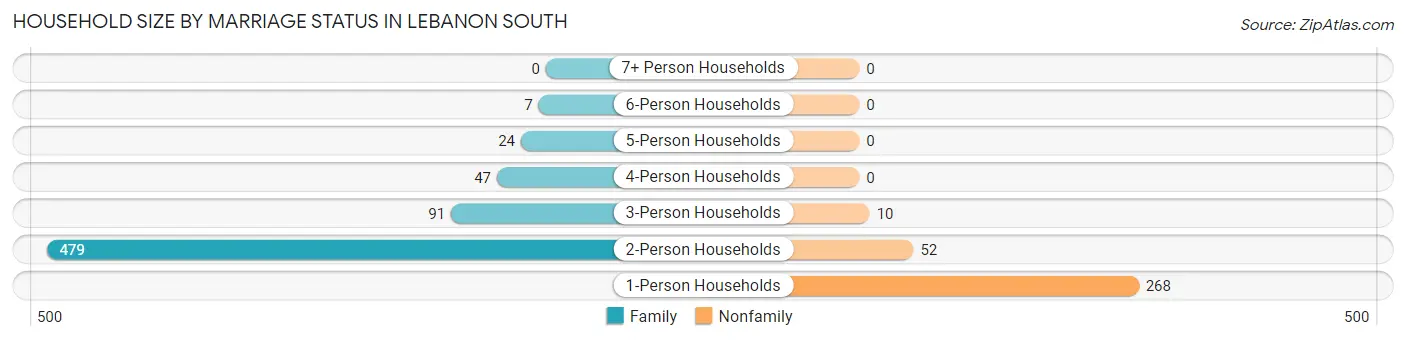
| Household Size | Family Households | Nonfamily Households |
| 1-Person Households | - | 268 (27.4%) |
| 2-Person Households | 479 (49.0%) | 52 (5.3%) |
| 3-Person Households | 91 (9.3%) | 10 (1.0%) |
| 4-Person Households | 47 (4.8%) | 0 (0.0%) |
| 5-Person Households | 24 (2.5%) | 0 (0.0%) |
| 6-Person Households | 7 (0.7%) | 0 (0.0%) |
| 7+ Person Households | 0 (0.0%) | 0 (0.0%) |
| Total | 648 (66.3%) | 330 (33.7%) |
Female Fertility in Lebanon South
Fertility by Age in Lebanon South
Average fertility rate in Lebanon South is 52.0 births per 1,000 women. Women in the age bracket of 20 to 34 years have the highest fertility rate with 64.0 births per 1,000 women. Women in the age bracket of 35 to 50 years acount for 56.2% of all women with births.
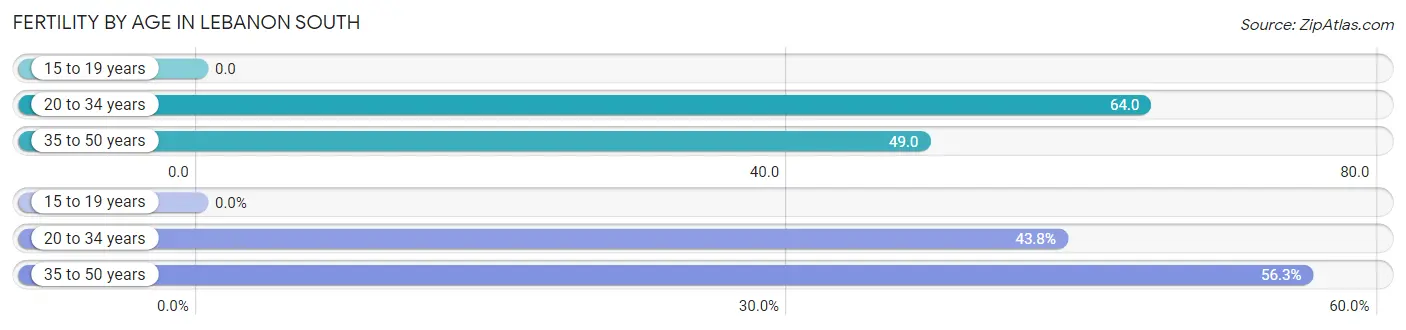
| Age Bracket | Women with Births | Births / 1,000 Women |
| 15 to 19 years | 0 (0.0%) | 0.0 |
| 20 to 34 years | 7 (43.8%) | 64.0 |
| 35 to 50 years | 9 (56.2%) | 49.0 |
| Total | 16 (100.0%) | 52.0 |
Fertility by Age by Marriage Status in Lebanon South
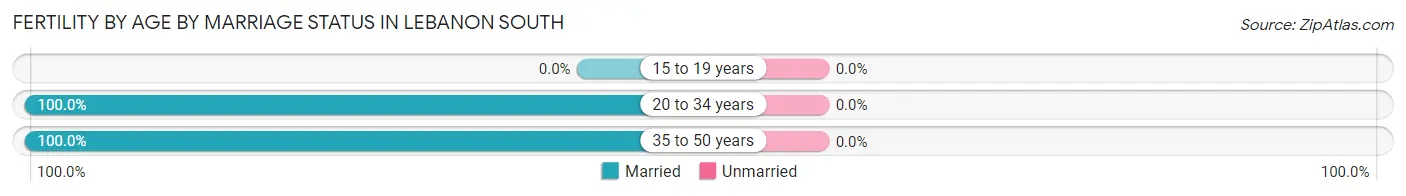
| Age Bracket | Married | Unmarried |
| 15 to 19 years | 0 (0.0%) | 0 (0.0%) |
| 20 to 34 years | 7 (100.0%) | 0 (0.0%) |
| 35 to 50 years | 9 (100.0%) | 0 (0.0%) |
| Total | 16 (100.0%) | 0 (0.0%) |
Fertility by Education in Lebanon South
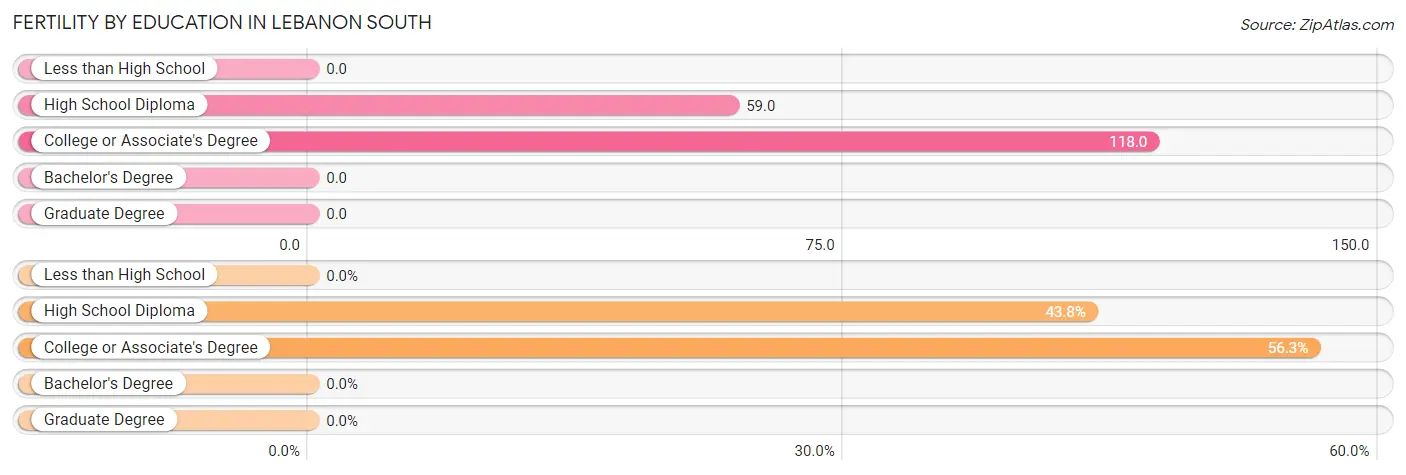
| Educational Attainment | Women with Births | Births / 1,000 Women |
| Less than High School | 0 (0.0%) | 0.0 |
| High School Diploma | 7 (43.8%) | 59.0 |
| College or Associate's Degree | 9 (56.2%) | 118.0 |
| Bachelor's Degree | 0 (0.0%) | 0.0 |
| Graduate Degree | 0 (0.0%) | 0.0 |
| Total | 16 (100.0%) | 52.0 |
Fertility by Education by Marriage Status in Lebanon South
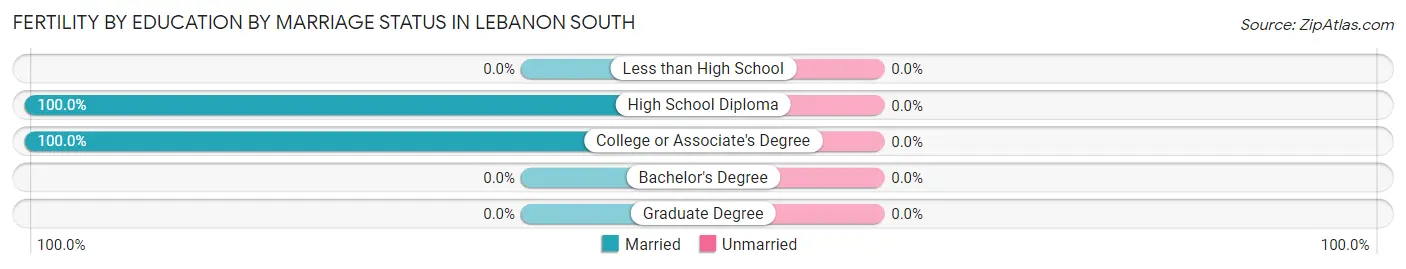
| Educational Attainment | Married | Unmarried |
| Less than High School | 0 (0.0%) | 0 (0.0%) |
| High School Diploma | 7 (100.0%) | 0 (0.0%) |
| College or Associate's Degree | 9 (100.0%) | 0 (0.0%) |
| Bachelor's Degree | 0 (0.0%) | 0 (0.0%) |
| Graduate Degree | 0 (0.0%) | 0 (0.0%) |
| Total | 16 (100.0%) | 0 (0.0%) |
Employment Characteristics in Lebanon South
Employment by Class of Employer in Lebanon South
Among the 998 employed individuals in Lebanon South, private company employees (659 | 66.0%), not-for-profit organizations (125 | 12.5%), and self-employed (not incorporated) (54 | 5.4%) make up the most common classes of employment.
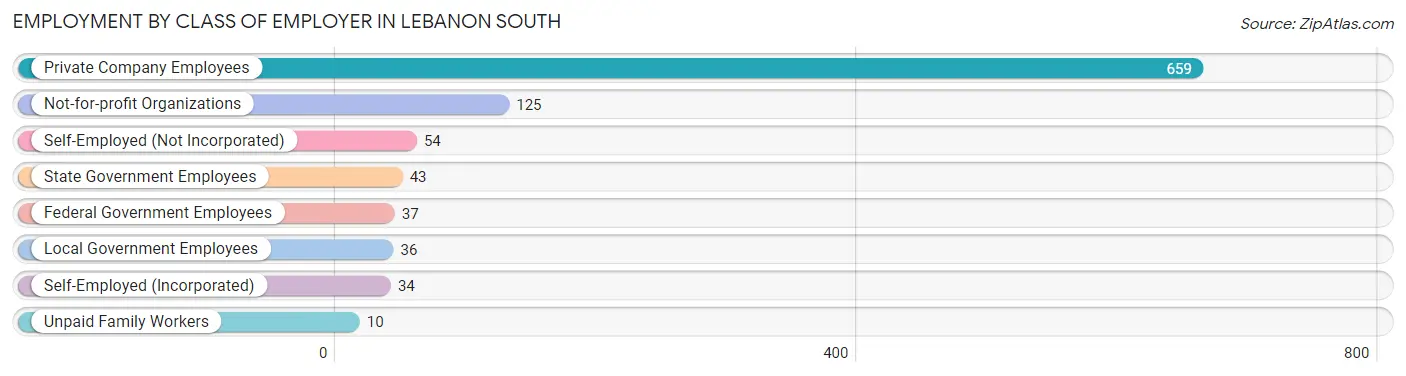
| Employer Class | # Employees | % Employees |
| Private Company Employees | 659 | 66.0% |
| Self-Employed (Incorporated) | 34 | 3.4% |
| Self-Employed (Not Incorporated) | 54 | 5.4% |
| Not-for-profit Organizations | 125 | 12.5% |
| Local Government Employees | 36 | 3.6% |
| State Government Employees | 43 | 4.3% |
| Federal Government Employees | 37 | 3.7% |
| Unpaid Family Workers | 10 | 1.0% |
| Total | 998 | 100.0% |
Employment Status by Age in Lebanon South
According to the labor force statistics for Lebanon South, out of the total population over 16 years of age (1,808), 58.8% or 1,063 individuals are in the labor force, with 4.0% or 43 of them unemployed. The age group with the highest labor force participation rate is 16 to 19 years, with 100.0% or 20 individuals in the labor force. Within the labor force, the 16 to 19 years age range has the highest percentage of unemployed individuals, with 25.0% or 5 of them being unemployed.
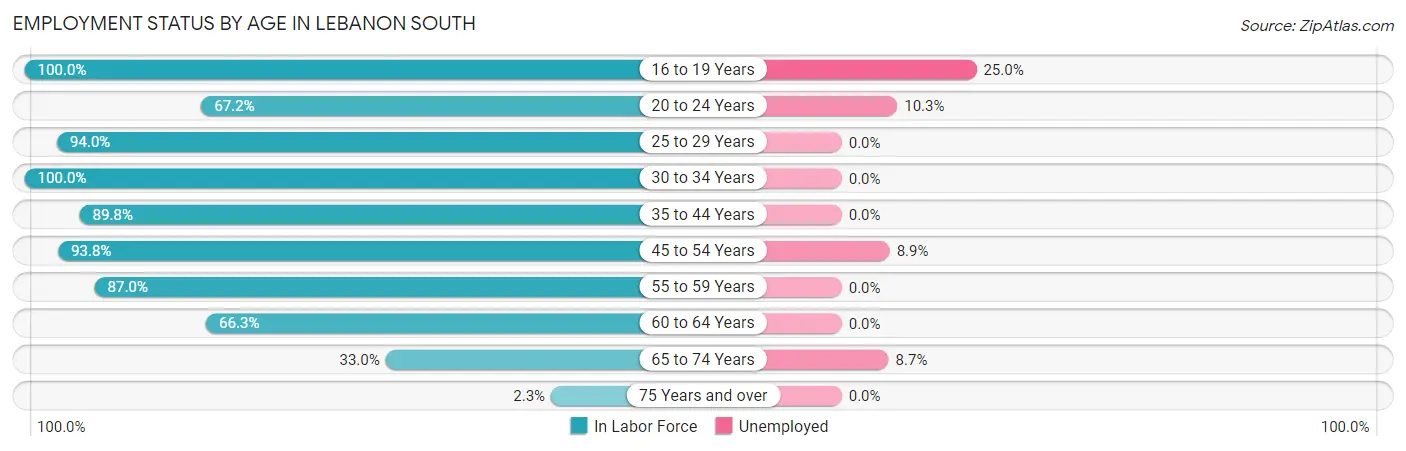
| Age Bracket | In Labor Force | Unemployed |
| 16 to 19 Years | 20 (100.0%) | 5 (25.0%) |
| 20 to 24 Years | 78 (67.2%) | 8 (10.3%) |
| 25 to 29 Years | 110 (94.0%) | 0 (0.0%) |
| 30 to 34 Years | 37 (100.0%) | 0 (0.0%) |
| 35 to 44 Years | 211 (89.8%) | 0 (0.0%) |
| 45 to 54 Years | 225 (93.8%) | 20 (8.9%) |
| 55 to 59 Years | 127 (87.0%) | 0 (0.0%) |
| 60 to 64 Years | 132 (66.3%) | 0 (0.0%) |
| 65 to 74 Years | 115 (33.0%) | 10 (8.7%) |
| 75 Years and over | 8 (2.3%) | 0 (0.0%) |
| Total | 1,063 (58.8%) | 43 (4.0%) |
Employment Status by Educational Attainment in Lebanon South
According to labor force statistics for Lebanon South, 86.4% of individuals (842) out of the total population between 25 and 64 years of age (974) are in the labor force, with 2.4% or 20 of them being unemployed. The group with the highest labor force participation rate are those with the educational attainment of bachelor's degree or higher, with 92.0% or 309 individuals in the labor force. Within the labor force, individuals with college / associate degree education have the highest percentage of unemployment, with 6.2% or 10 of them being unemployed.
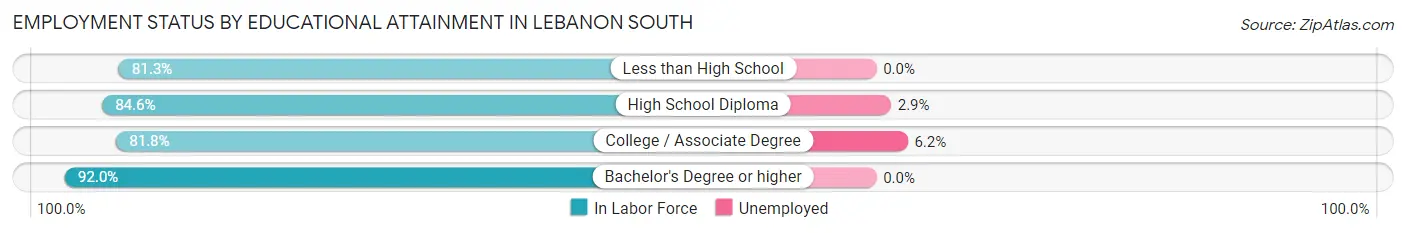
| Educational Attainment | In Labor Force | Unemployed |
| Less than High School | 26 (81.3%) | 0 (0.0%) |
| High School Diploma | 345 (84.6%) | 12 (2.9%) |
| College / Associate Degree | 162 (81.8%) | 12 (6.2%) |
| Bachelor's Degree or higher | 309 (92.0%) | 0 (0.0%) |
| Total | 842 (86.4%) | 23 (2.4%) |
Employment Occupations by Sex in Lebanon South
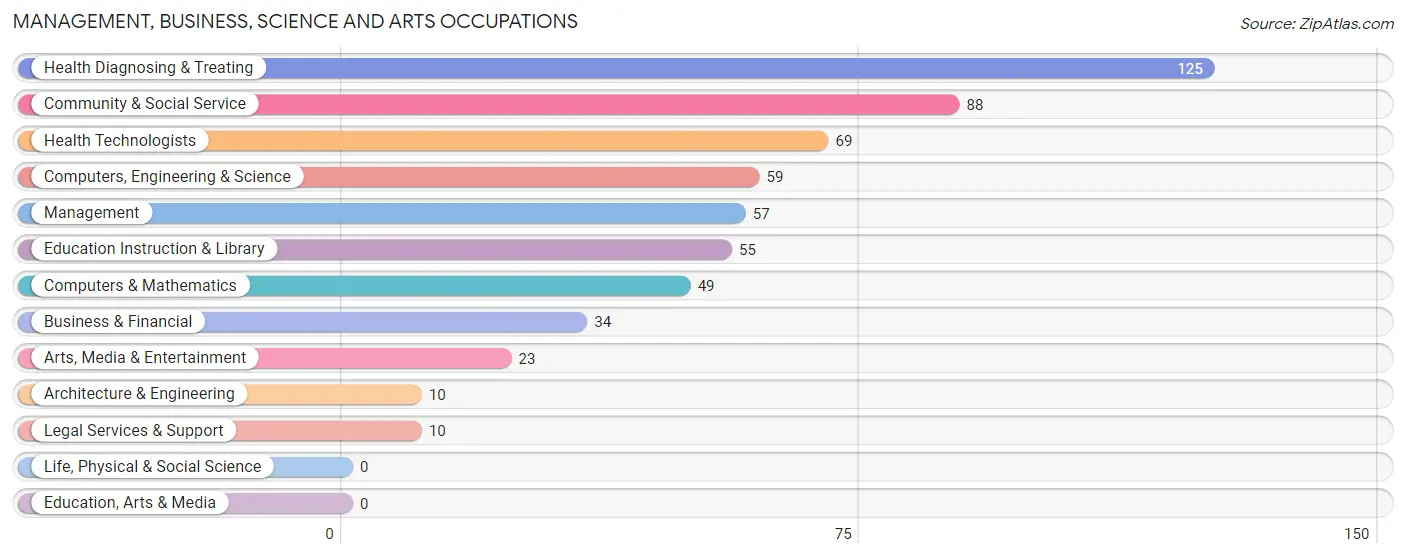
Management, Business, Science and Arts Occupations
The most common Management, Business, Science and Arts occupations in Lebanon South are Health Diagnosing & Treating (125 | 12.2%), Community & Social Service (88 | 8.6%), Health Technologists (69 | 6.8%), Computers, Engineering & Science (59 | 5.8%), and Management (57 | 5.6%).
Management, Business, Science and Arts Occupations by Sex
Within the Management, Business, Science and Arts occupations in Lebanon South, the most male-oriented occupations are Business & Financial (100.0%), Architecture & Engineering (100.0%), and Arts, Media & Entertainment (100.0%), while the most female-oriented occupations are Legal Services & Support (100.0%), Computers & Mathematics (83.7%), and Health Technologists (78.3%).
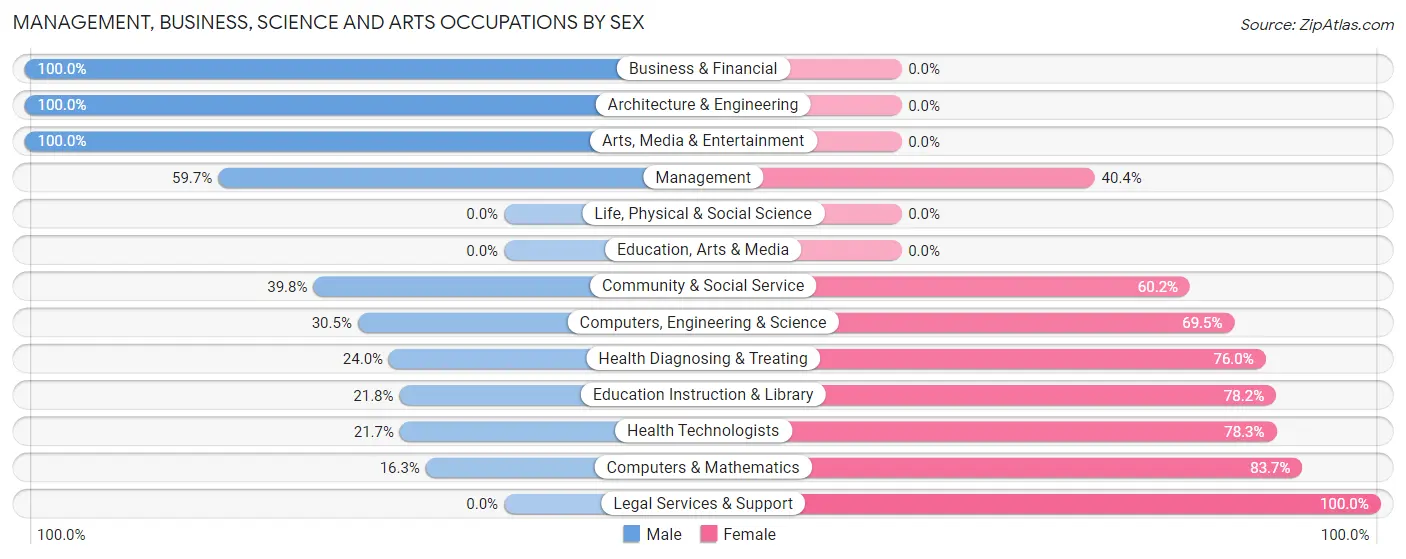
| Occupation | Male | Female |
| Management | 34 (59.7%) | 23 (40.4%) |
| Business & Financial | 34 (100.0%) | 0 (0.0%) |
| Computers, Engineering & Science | 18 (30.5%) | 41 (69.5%) |
| Computers & Mathematics | 8 (16.3%) | 41 (83.7%) |
| Architecture & Engineering | 10 (100.0%) | 0 (0.0%) |
| Life, Physical & Social Science | 0 (0.0%) | 0 (0.0%) |
| Community & Social Service | 35 (39.8%) | 53 (60.2%) |
| Education, Arts & Media | 0 (0.0%) | 0 (0.0%) |
| Legal Services & Support | 0 (0.0%) | 10 (100.0%) |
| Education Instruction & Library | 12 (21.8%) | 43 (78.2%) |
| Arts, Media & Entertainment | 23 (100.0%) | 0 (0.0%) |
| Health Diagnosing & Treating | 30 (24.0%) | 95 (76.0%) |
| Health Technologists | 15 (21.7%) | 54 (78.3%) |
| Total (Category) | 151 (41.6%) | 212 (58.4%) |
| Total (Overall) | 547 (53.6%) | 473 (46.4%) |
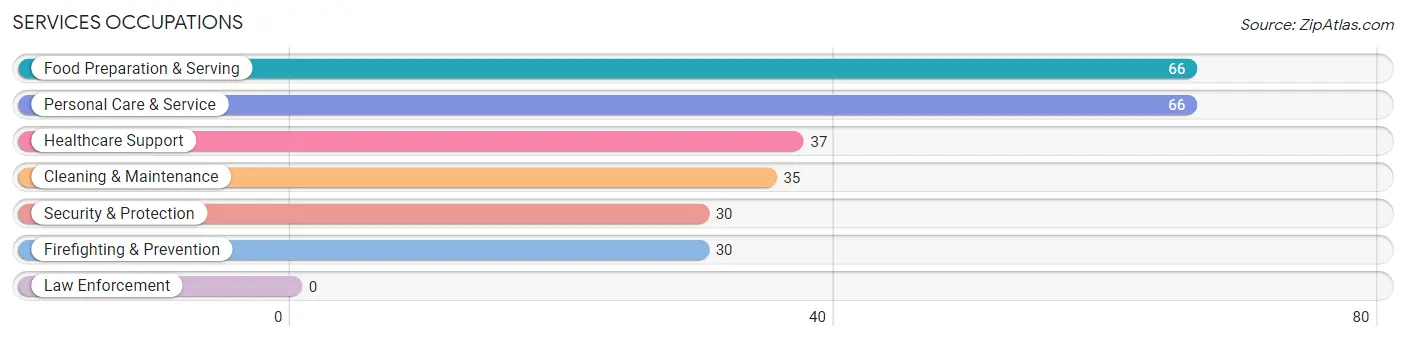
Services Occupations
The most common Services occupations in Lebanon South are Food Preparation & Serving (66 | 6.5%), Personal Care & Service (66 | 6.5%), Healthcare Support (37 | 3.6%), Cleaning & Maintenance (35 | 3.4%), and Security & Protection (30 | 2.9%).
Services Occupations by Sex
Within the Services occupations in Lebanon South, the most male-oriented occupations are Cleaning & Maintenance (100.0%), Healthcare Support (75.7%), and Security & Protection (70.0%), while the most female-oriented occupations are Food Preparation & Serving (100.0%), Personal Care & Service (59.1%), and Security & Protection (30.0%).
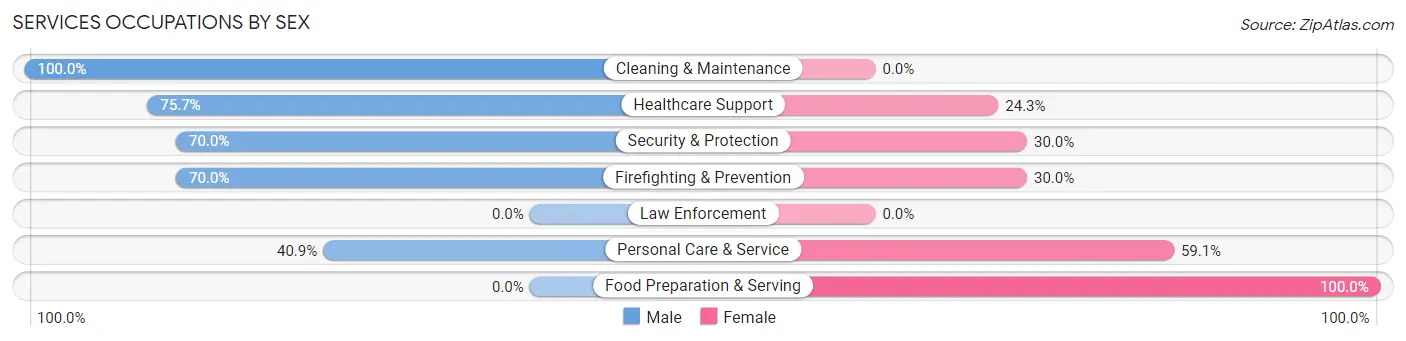
| Occupation | Male | Female |
| Healthcare Support | 28 (75.7%) | 9 (24.3%) |
| Security & Protection | 21 (70.0%) | 9 (30.0%) |
| Firefighting & Prevention | 21 (70.0%) | 9 (30.0%) |
| Law Enforcement | 0 (0.0%) | 0 (0.0%) |
| Food Preparation & Serving | 0 (0.0%) | 66 (100.0%) |
| Cleaning & Maintenance | 35 (100.0%) | 0 (0.0%) |
| Personal Care & Service | 27 (40.9%) | 39 (59.1%) |
| Total (Category) | 111 (47.4%) | 123 (52.6%) |
| Total (Overall) | 547 (53.6%) | 473 (46.4%) |
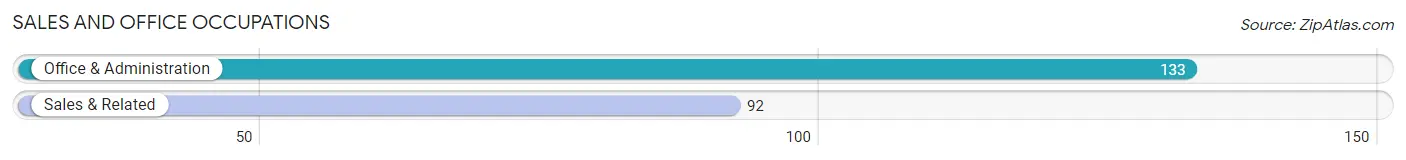
Sales and Office Occupations
The most common Sales and Office occupations in Lebanon South are Office & Administration (133 | 13.0%), and Sales & Related (92 | 9.0%).
Sales and Office Occupations by Sex
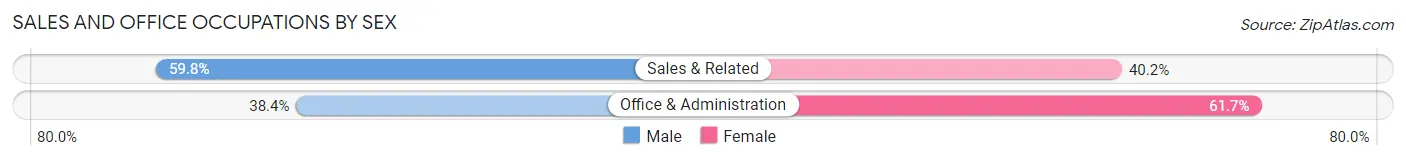
| Occupation | Male | Female |
| Sales & Related | 55 (59.8%) | 37 (40.2%) |
| Office & Administration | 51 (38.4%) | 82 (61.7%) |
| Total (Category) | 106 (47.1%) | 119 (52.9%) |
| Total (Overall) | 547 (53.6%) | 473 (46.4%) |
Natural Resources, Construction and Maintenance Occupations
The most common Natural Resources, Construction and Maintenance occupations in Lebanon South are Construction & Extraction (45 | 4.4%), and Installation, Maintenance & Repair (31 | 3.0%).

Natural Resources, Construction and Maintenance Occupations by Sex
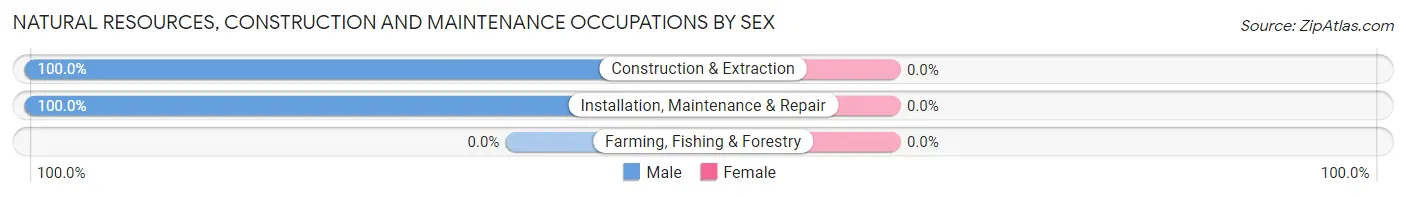
| Occupation | Male | Female |
| Farming, Fishing & Forestry | 0 (0.0%) | 0 (0.0%) |
| Construction & Extraction | 45 (100.0%) | 0 (0.0%) |
| Installation, Maintenance & Repair | 31 (100.0%) | 0 (0.0%) |
| Total (Category) | 76 (100.0%) | 0 (0.0%) |
| Total (Overall) | 547 (53.6%) | 473 (46.4%) |
Production, Transportation and Moving Occupations
The most common Production, Transportation and Moving occupations in Lebanon South are Transportation (64 | 6.3%), Production (38 | 3.7%), and Material Moving (20 | 2.0%).
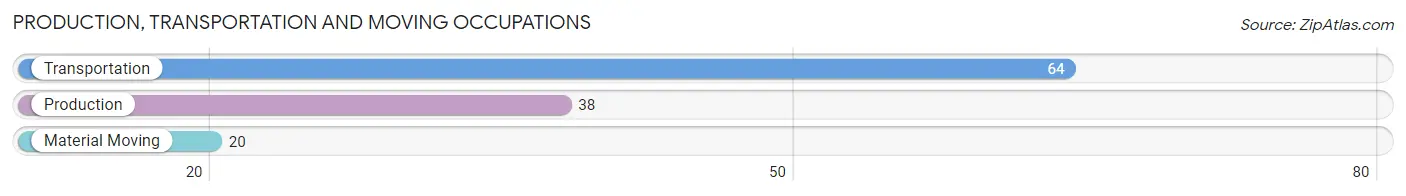
Production, Transportation and Moving Occupations by Sex
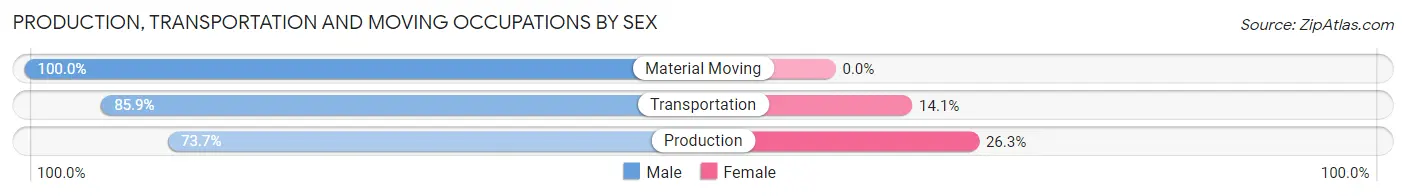
| Occupation | Male | Female |
| Production | 28 (73.7%) | 10 (26.3%) |
| Transportation | 55 (85.9%) | 9 (14.1%) |
| Material Moving | 20 (100.0%) | 0 (0.0%) |
| Total (Category) | 103 (84.4%) | 19 (15.6%) |
| Total (Overall) | 547 (53.6%) | 473 (46.4%) |
Employment Industries by Sex in Lebanon South
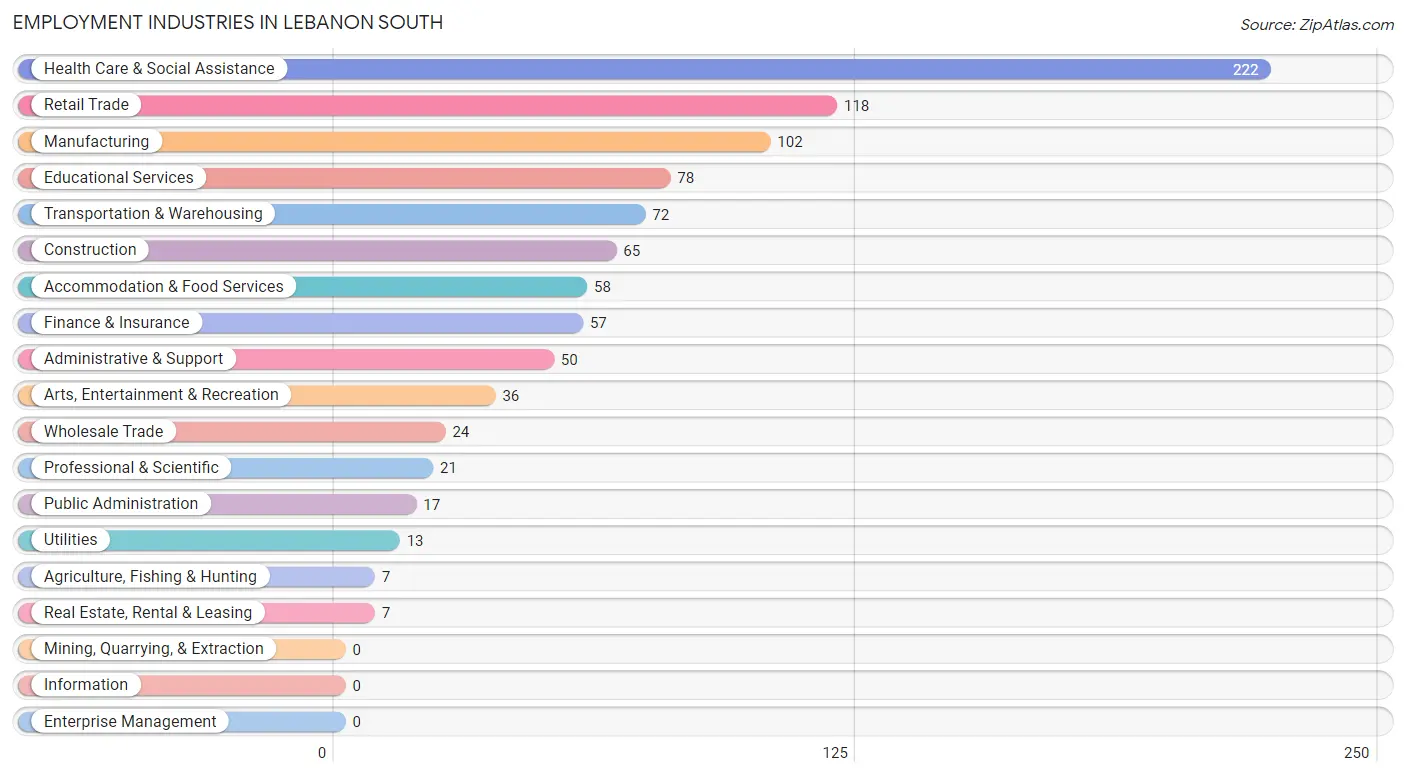
Employment Industries in Lebanon South
The major employment industries in Lebanon South include Health Care & Social Assistance (222 | 21.8%), Retail Trade (118 | 11.6%), Manufacturing (102 | 10.0%), Educational Services (78 | 7.6%), and Transportation & Warehousing (72 | 7.1%).
Employment Industries by Sex in Lebanon South
The Lebanon South industries that see more men than women are Agriculture, Fishing & Hunting (100.0%), Construction (100.0%), and Wholesale Trade (100.0%), whereas the industries that tend to have a higher number of women are Finance & Insurance (100.0%), Accommodation & Food Services (100.0%), and Public Administration (100.0%).
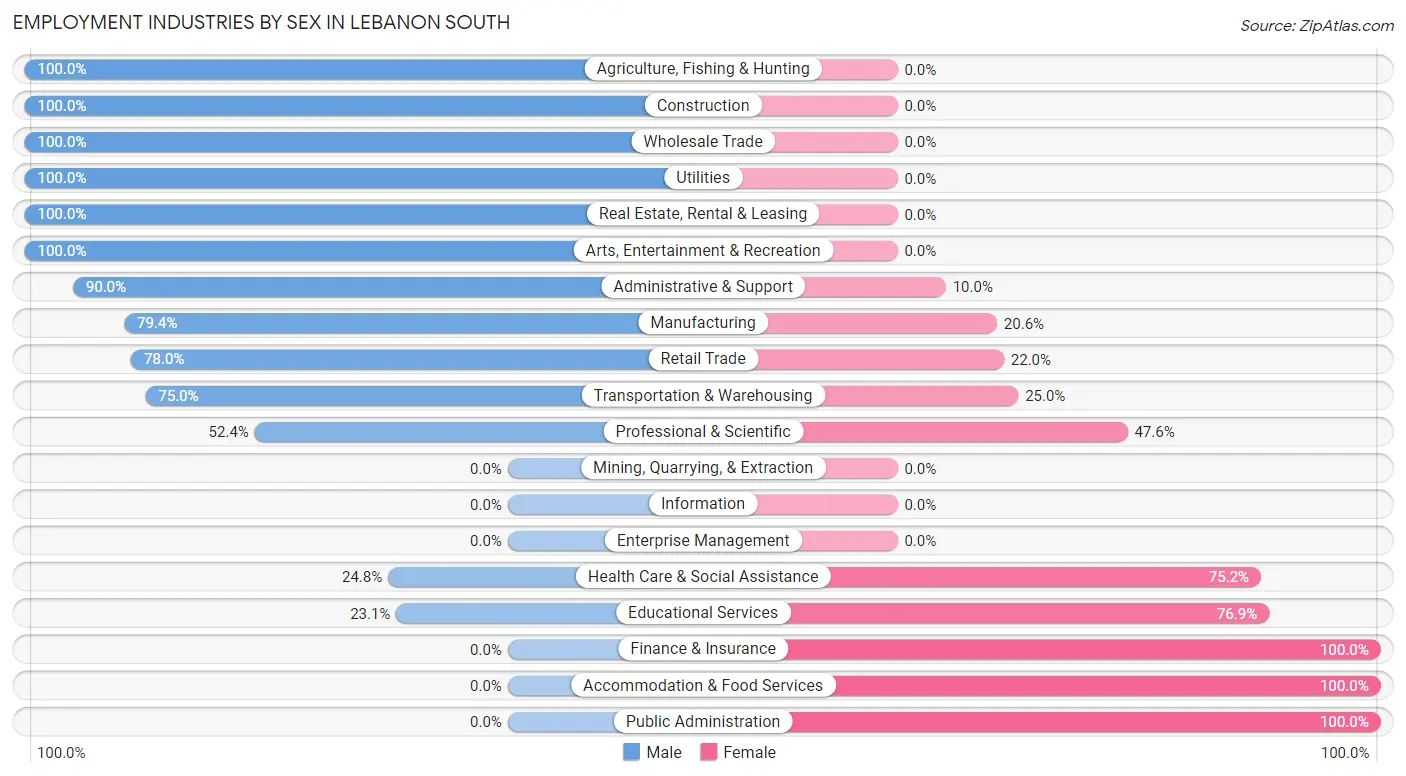
| Industry | Male | Female |
| Agriculture, Fishing & Hunting | 7 (100.0%) | 0 (0.0%) |
| Mining, Quarrying, & Extraction | 0 (0.0%) | 0 (0.0%) |
| Construction | 65 (100.0%) | 0 (0.0%) |
| Manufacturing | 81 (79.4%) | 21 (20.6%) |
| Wholesale Trade | 24 (100.0%) | 0 (0.0%) |
| Retail Trade | 92 (78.0%) | 26 (22.0%) |
| Transportation & Warehousing | 54 (75.0%) | 18 (25.0%) |
| Utilities | 13 (100.0%) | 0 (0.0%) |
| Information | 0 (0.0%) | 0 (0.0%) |
| Finance & Insurance | 0 (0.0%) | 57 (100.0%) |
| Real Estate, Rental & Leasing | 7 (100.0%) | 0 (0.0%) |
| Professional & Scientific | 11 (52.4%) | 10 (47.6%) |
| Enterprise Management | 0 (0.0%) | 0 (0.0%) |
| Administrative & Support | 45 (90.0%) | 5 (10.0%) |
| Educational Services | 18 (23.1%) | 60 (76.9%) |
| Health Care & Social Assistance | 55 (24.8%) | 167 (75.2%) |
| Arts, Entertainment & Recreation | 36 (100.0%) | 0 (0.0%) |
| Accommodation & Food Services | 0 (0.0%) | 58 (100.0%) |
| Public Administration | 0 (0.0%) | 17 (100.0%) |
| Total | 547 (53.6%) | 473 (46.4%) |
Education in Lebanon South
School Enrollment in Lebanon South
The most common levels of schooling among the 326 students in Lebanon South are elementary school (118 | 36.2%), middle school (89 | 27.3%), and graduate / professional (44 | 13.5%).
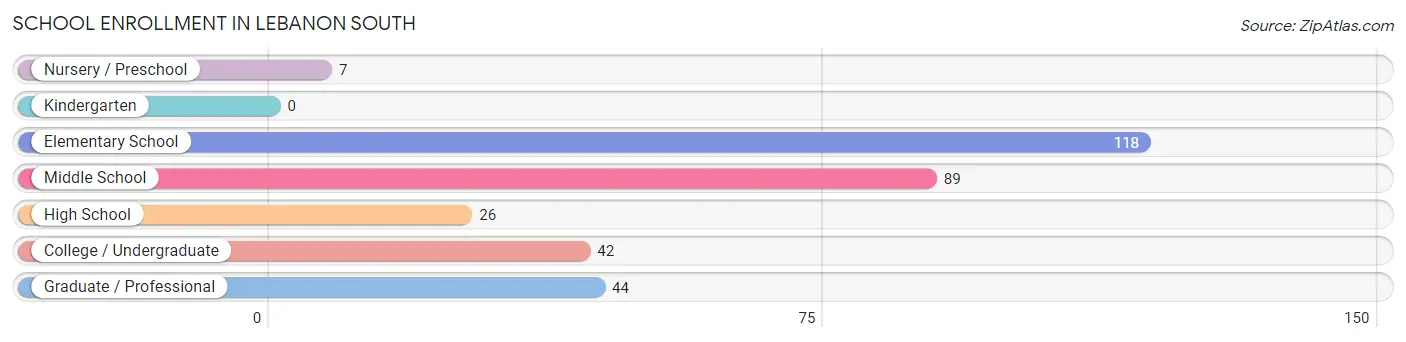
| School Level | # Students | % Students |
| Nursery / Preschool | 7 | 2.1% |
| Kindergarten | 0 | 0.0% |
| Elementary School | 118 | 36.2% |
| Middle School | 89 | 27.3% |
| High School | 26 | 8.0% |
| College / Undergraduate | 42 | 12.9% |
| Graduate / Professional | 44 | 13.5% |
| Total | 326 | 100.0% |
School Enrollment by Age by Funding Source in Lebanon South
Out of a total of 326 students who are enrolled in schools in Lebanon South, 61 (18.7%) attend a private institution, while the remaining 265 (81.3%) are enrolled in public schools. The age group of 3 to 4 year olds has the highest likelihood of being enrolled in private schools, with 7 (100.0% in the age bracket) enrolled. Conversely, the age group of 15 to 17 year olds has the lowest likelihood of being enrolled in a private school, with 33 (100.0% in the age bracket) attending a public institution.
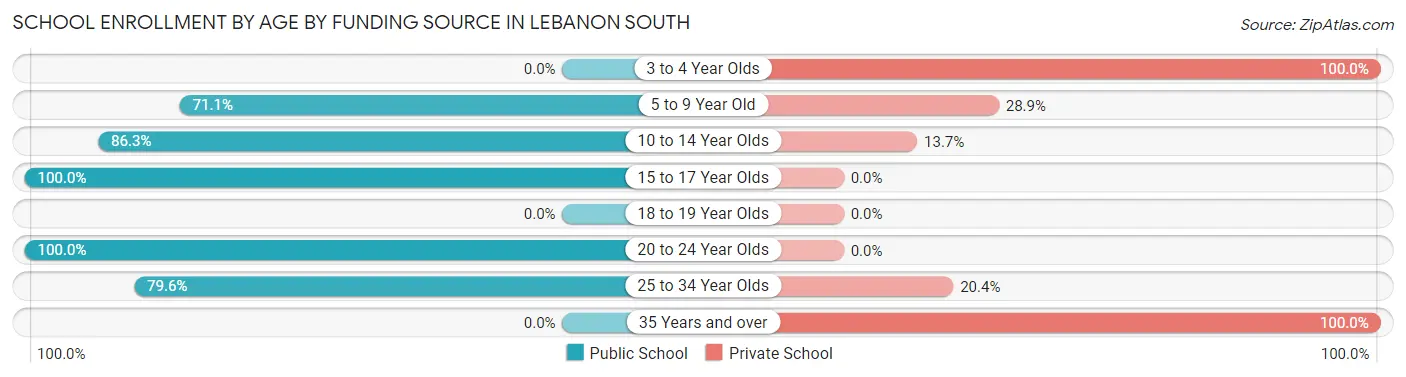
| Age Bracket | Public School | Private School |
| 3 to 4 Year Olds | 0 (0.0%) | 7 (100.0%) |
| 5 to 9 Year Old | 64 (71.1%) | 26 (28.9%) |
| 10 to 14 Year Olds | 101 (86.3%) | 16 (13.7%) |
| 15 to 17 Year Olds | 33 (100.0%) | 0 (0.0%) |
| 18 to 19 Year Olds | 0 (0.0%) | 0 (0.0%) |
| 20 to 24 Year Olds | 28 (100.0%) | 0 (0.0%) |
| 25 to 34 Year Olds | 39 (79.6%) | 10 (20.4%) |
| 35 Years and over | 0 (0.0%) | 2 (100.0%) |
| Total | 265 (81.3%) | 61 (18.7%) |
Educational Attainment by Field of Study in Lebanon South
Education (179 | 31.1%), business (83 | 14.4%), science & technology (67 | 11.7%), communications (54 | 9.4%), and arts & humanities (53 | 9.2%) are the most common fields of study among 575 individuals in Lebanon South who have obtained a bachelor's degree or higher.
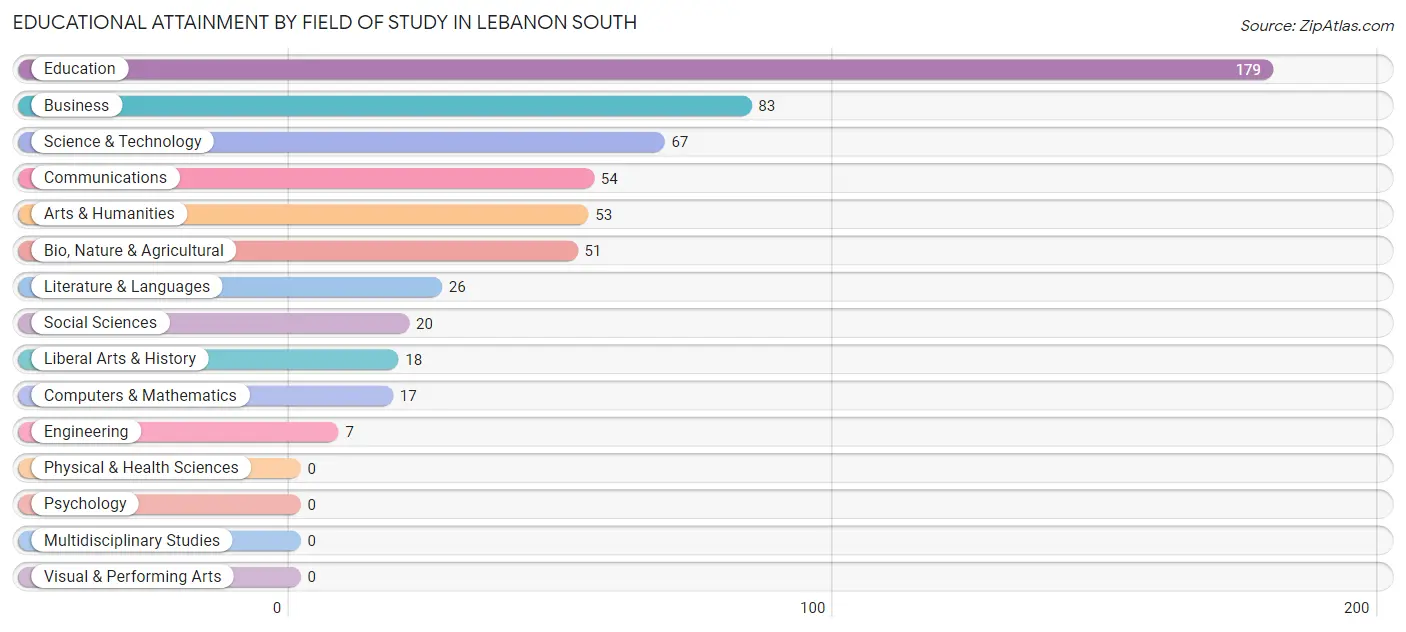
| Field of Study | # Graduates | % Graduates |
| Computers & Mathematics | 17 | 3.0% |
| Bio, Nature & Agricultural | 51 | 8.9% |
| Physical & Health Sciences | 0 | 0.0% |
| Psychology | 0 | 0.0% |
| Social Sciences | 20 | 3.5% |
| Engineering | 7 | 1.2% |
| Multidisciplinary Studies | 0 | 0.0% |
| Science & Technology | 67 | 11.7% |
| Business | 83 | 14.4% |
| Education | 179 | 31.1% |
| Literature & Languages | 26 | 4.5% |
| Liberal Arts & History | 18 | 3.1% |
| Visual & Performing Arts | 0 | 0.0% |
| Communications | 54 | 9.4% |
| Arts & Humanities | 53 | 9.2% |
| Total | 575 | 100.0% |
Transportation & Commute in Lebanon South
Vehicle Availability by Sex in Lebanon South
The most prevalent vehicle ownership categories in Lebanon South are males with 2 vehicles (332, accounting for 62.2%) and females with 2 vehicles (227, making up 71.6%).
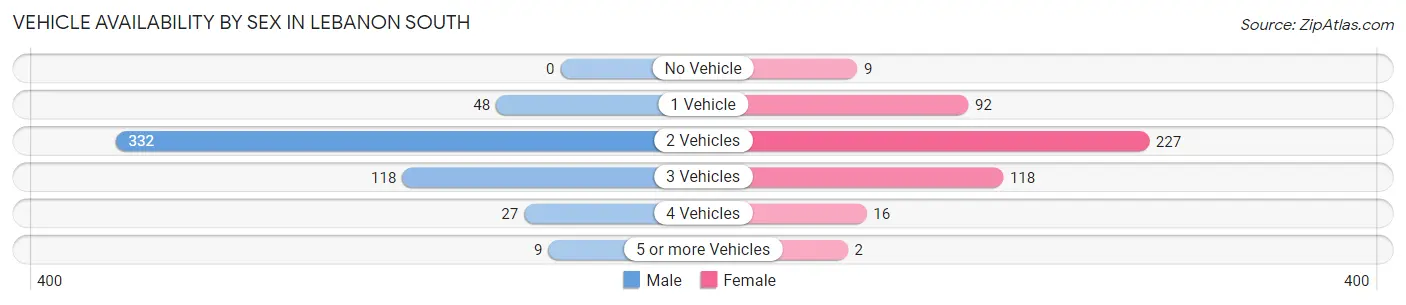
| Vehicles Available | Male | Female |
| No Vehicle | 0 (0.0%) | 9 (1.9%) |
| 1 Vehicle | 48 (9.0%) | 92 (19.8%) |
| 2 Vehicles | 332 (62.2%) | 227 (48.9%) |
| 3 Vehicles | 118 (22.1%) | 118 (25.4%) |
| 4 Vehicles | 27 (5.1%) | 16 (3.5%) |
| 5 or more Vehicles | 9 (1.7%) | 2 (0.4%) |
| Total | 534 (100.0%) | 464 (100.0%) |
Commute Time in Lebanon South
The most frequently occuring commute durations in Lebanon South are 5 to 9 minutes (217 commuters, 23.4%), 45 to 59 minutes (178 commuters, 19.2%), and 30 to 34 minutes (165 commuters, 17.8%).
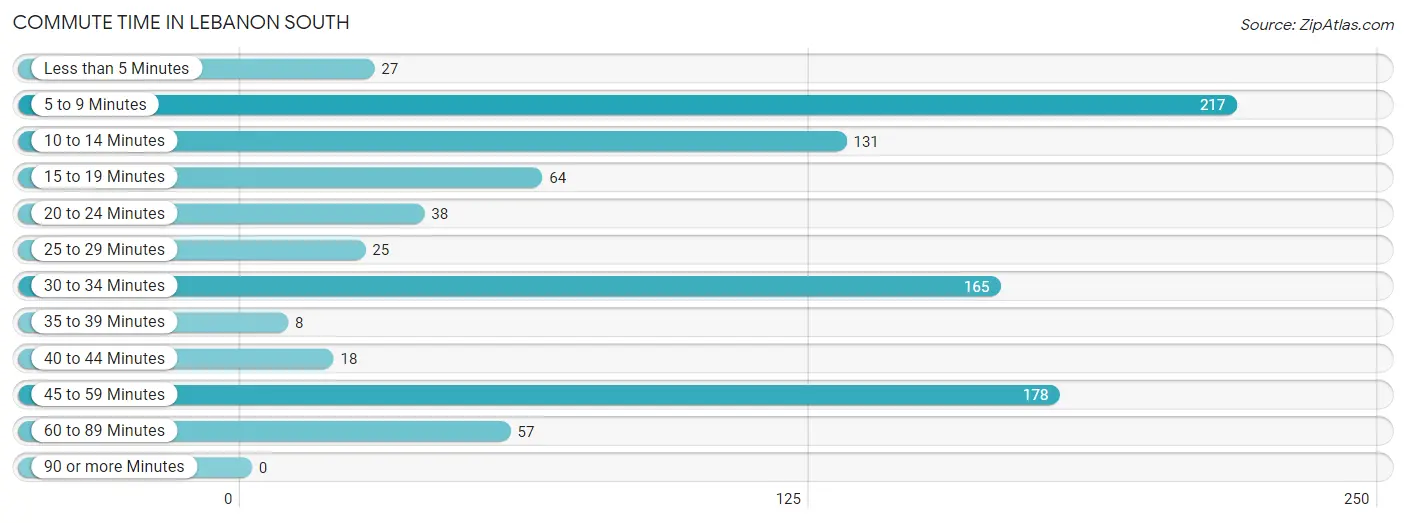
| Commute Time | # Commuters | % Commuters |
| Less than 5 Minutes | 27 | 2.9% |
| 5 to 9 Minutes | 217 | 23.4% |
| 10 to 14 Minutes | 131 | 14.1% |
| 15 to 19 Minutes | 64 | 6.9% |
| 20 to 24 Minutes | 38 | 4.1% |
| 25 to 29 Minutes | 25 | 2.7% |
| 30 to 34 Minutes | 165 | 17.8% |
| 35 to 39 Minutes | 8 | 0.9% |
| 40 to 44 Minutes | 18 | 1.9% |
| 45 to 59 Minutes | 178 | 19.2% |
| 60 to 89 Minutes | 57 | 6.1% |
| 90 or more Minutes | 0 | 0.0% |
Commute Time by Sex in Lebanon South
The most common commute times in Lebanon South are 45 to 59 minutes (124 commuters, 24.5%) for males and 5 to 9 minutes (136 commuters, 32.2%) for females.
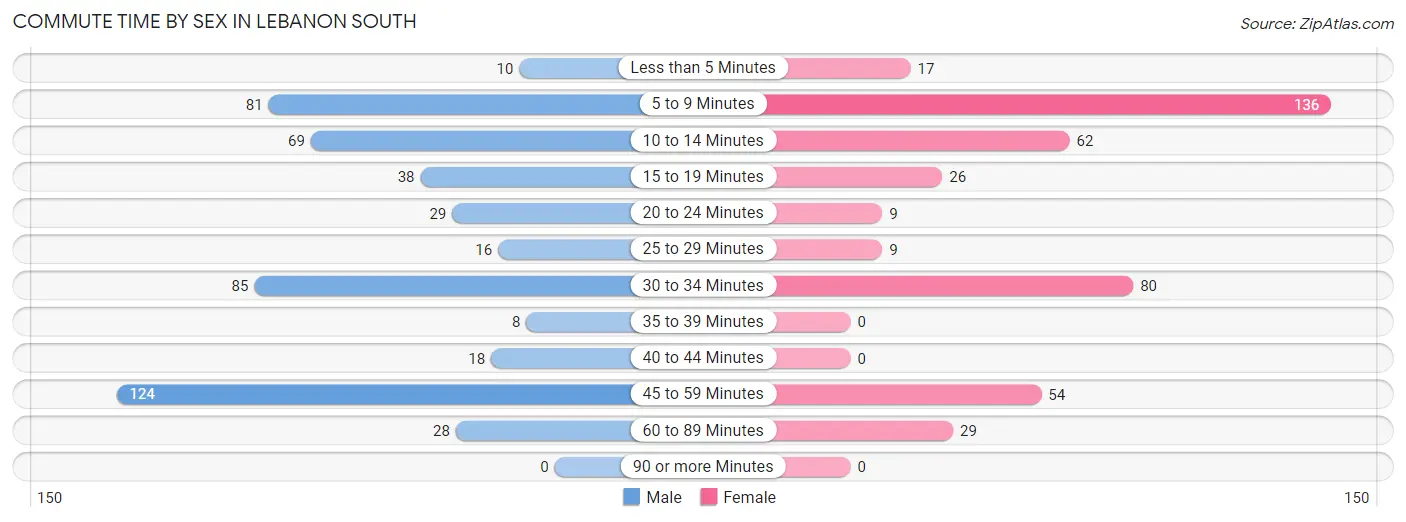
| Commute Time | Male | Female |
| Less than 5 Minutes | 10 (2.0%) | 17 (4.0%) |
| 5 to 9 Minutes | 81 (16.0%) | 136 (32.2%) |
| 10 to 14 Minutes | 69 (13.6%) | 62 (14.7%) |
| 15 to 19 Minutes | 38 (7.5%) | 26 (6.2%) |
| 20 to 24 Minutes | 29 (5.7%) | 9 (2.1%) |
| 25 to 29 Minutes | 16 (3.2%) | 9 (2.1%) |
| 30 to 34 Minutes | 85 (16.8%) | 80 (19.0%) |
| 35 to 39 Minutes | 8 (1.6%) | 0 (0.0%) |
| 40 to 44 Minutes | 18 (3.6%) | 0 (0.0%) |
| 45 to 59 Minutes | 124 (24.5%) | 54 (12.8%) |
| 60 to 89 Minutes | 28 (5.5%) | 29 (6.9%) |
| 90 or more Minutes | 0 (0.0%) | 0 (0.0%) |
Time of Departure to Work by Sex in Lebanon South
The most frequent times of departure to work in Lebanon South are 12:00 AM to 4:59 AM (98, 19.4%) for males and 7:30 AM to 7:59 AM (104, 24.6%) for females.
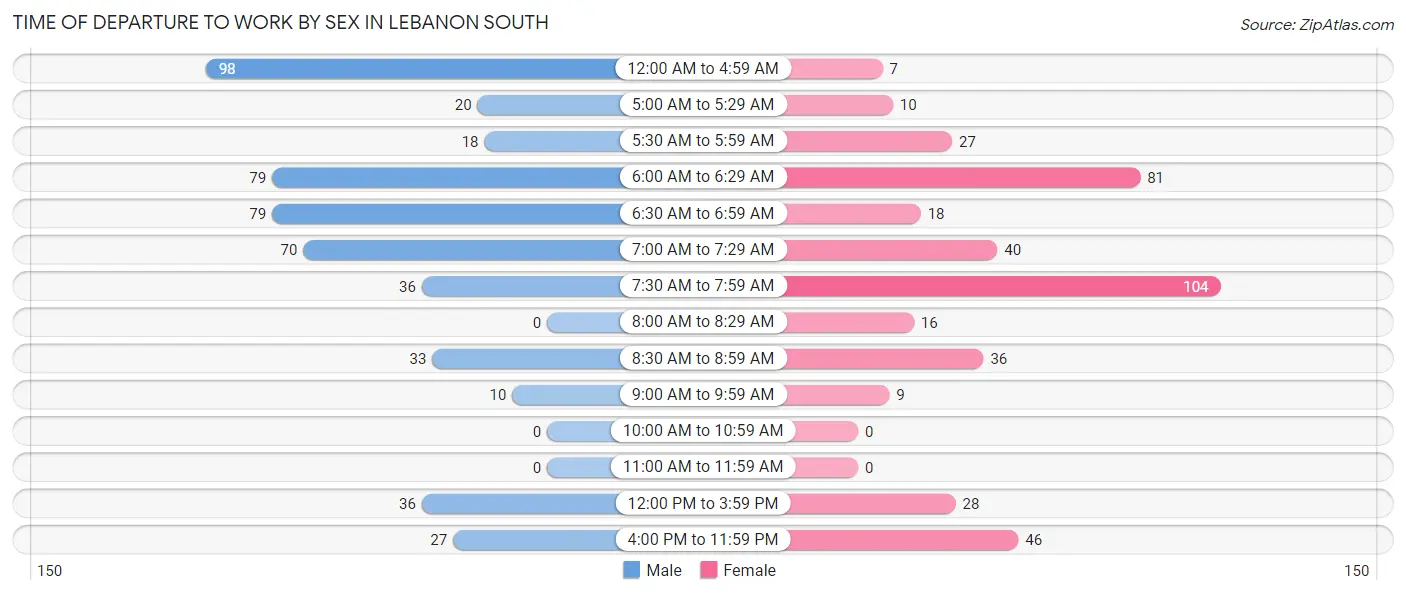
| Time of Departure | Male | Female |
| 12:00 AM to 4:59 AM | 98 (19.4%) | 7 (1.7%) |
| 5:00 AM to 5:29 AM | 20 (4.0%) | 10 (2.4%) |
| 5:30 AM to 5:59 AM | 18 (3.6%) | 27 (6.4%) |
| 6:00 AM to 6:29 AM | 79 (15.6%) | 81 (19.2%) |
| 6:30 AM to 6:59 AM | 79 (15.6%) | 18 (4.3%) |
| 7:00 AM to 7:29 AM | 70 (13.8%) | 40 (9.5%) |
| 7:30 AM to 7:59 AM | 36 (7.1%) | 104 (24.6%) |
| 8:00 AM to 8:29 AM | 0 (0.0%) | 16 (3.8%) |
| 8:30 AM to 8:59 AM | 33 (6.5%) | 36 (8.5%) |
| 9:00 AM to 9:59 AM | 10 (2.0%) | 9 (2.1%) |
| 10:00 AM to 10:59 AM | 0 (0.0%) | 0 (0.0%) |
| 11:00 AM to 11:59 AM | 0 (0.0%) | 0 (0.0%) |
| 12:00 PM to 3:59 PM | 36 (7.1%) | 28 (6.6%) |
| 4:00 PM to 11:59 PM | 27 (5.3%) | 46 (10.9%) |
| Total | 506 (100.0%) | 422 (100.0%) |
Housing Occupancy in Lebanon South
Occupancy by Ownership in Lebanon South
Of the total 978 dwellings in Lebanon South, owner-occupied units account for 848 (86.7%), while renter-occupied units make up 130 (13.3%).
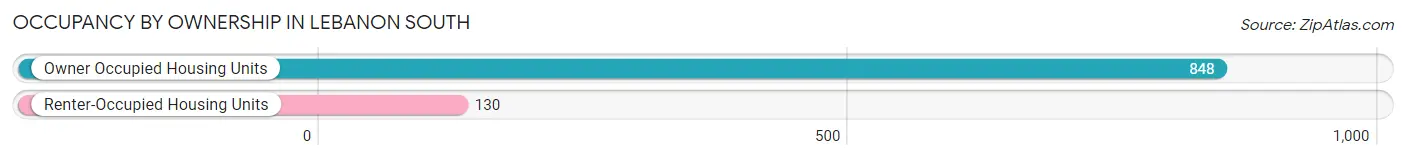
| Occupancy | # Housing Units | % Housing Units |
| Owner Occupied Housing Units | 848 | 86.7% |
| Renter-Occupied Housing Units | 130 | 13.3% |
| Total Occupied Housing Units | 978 | 100.0% |
Occupancy by Household Size in Lebanon South
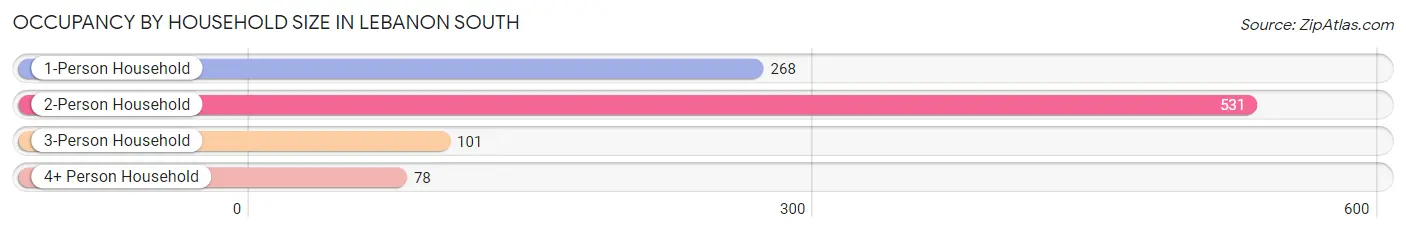
| Household Size | # Housing Units | % Housing Units |
| 1-Person Household | 268 | 27.4% |
| 2-Person Household | 531 | 54.3% |
| 3-Person Household | 101 | 10.3% |
| 4+ Person Household | 78 | 8.0% |
| Total Housing Units | 978 | 100.0% |
Occupancy by Ownership by Household Size in Lebanon South
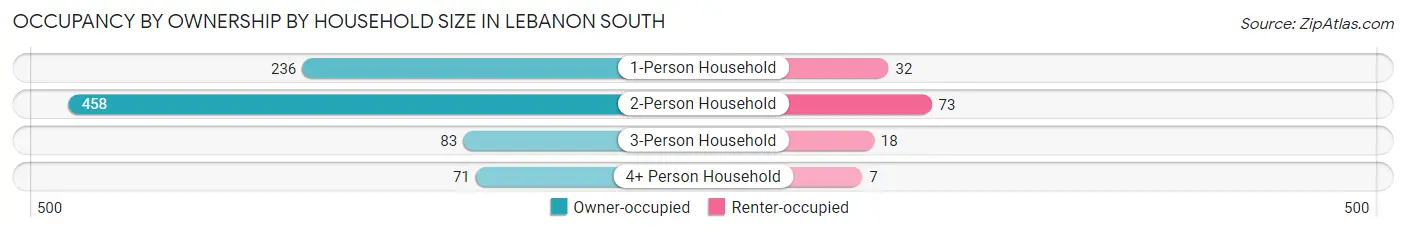
| Household Size | Owner-occupied | Renter-occupied |
| 1-Person Household | 236 (88.1%) | 32 (11.9%) |
| 2-Person Household | 458 (86.3%) | 73 (13.8%) |
| 3-Person Household | 83 (82.2%) | 18 (17.8%) |
| 4+ Person Household | 71 (91.0%) | 7 (9.0%) |
| Total Housing Units | 848 (86.7%) | 130 (13.3%) |
Occupancy by Educational Attainment in Lebanon South
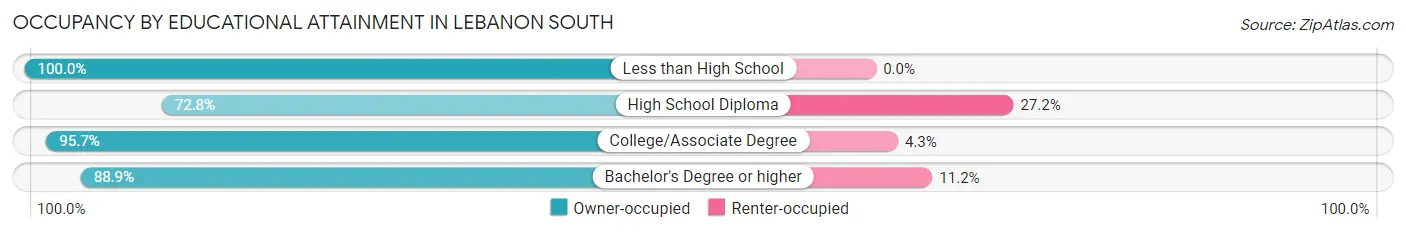
| Household Size | Owner-occupied | Renter-occupied |
| Less than High School | 126 (100.0%) | 0 (0.0%) |
| High School Diploma | 230 (72.8%) | 86 (27.2%) |
| College/Associate Degree | 221 (95.7%) | 10 (4.3%) |
| Bachelor's Degree or higher | 271 (88.8%) | 34 (11.2%) |
Occupancy by Age of Householder in Lebanon South
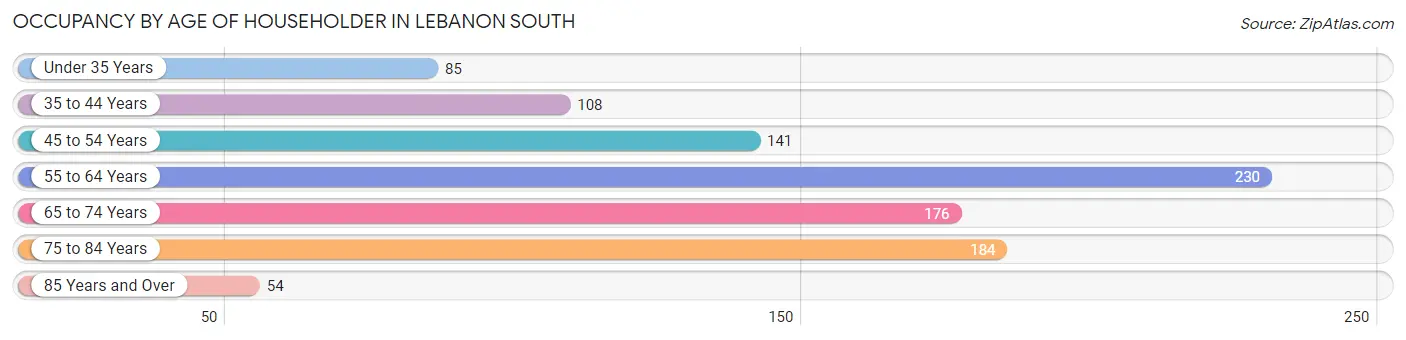
| Age Bracket | # Households | % Households |
| Under 35 Years | 85 | 8.7% |
| 35 to 44 Years | 108 | 11.0% |
| 45 to 54 Years | 141 | 14.4% |
| 55 to 64 Years | 230 | 23.5% |
| 65 to 74 Years | 176 | 18.0% |
| 75 to 84 Years | 184 | 18.8% |
| 85 Years and Over | 54 | 5.5% |
| Total | 978 | 100.0% |
Housing Finances in Lebanon South
Median Income by Occupancy in Lebanon South
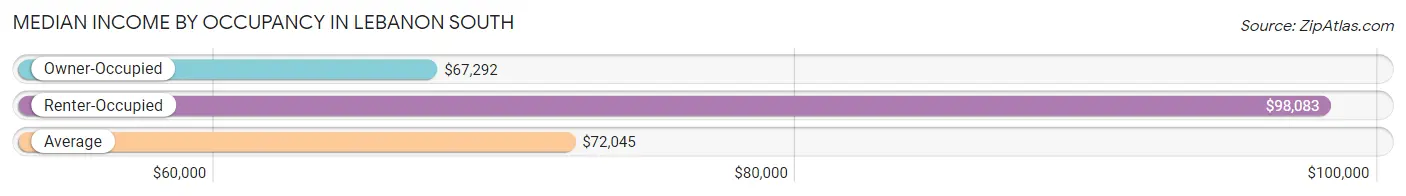
| Occupancy Type | # Households | Median Income |
| Owner-Occupied | 848 (86.7%) | $67,292 |
| Renter-Occupied | 130 (13.3%) | $98,083 |
| Average | 978 (100.0%) | $72,045 |
Occupancy by Householder Income Bracket in Lebanon South
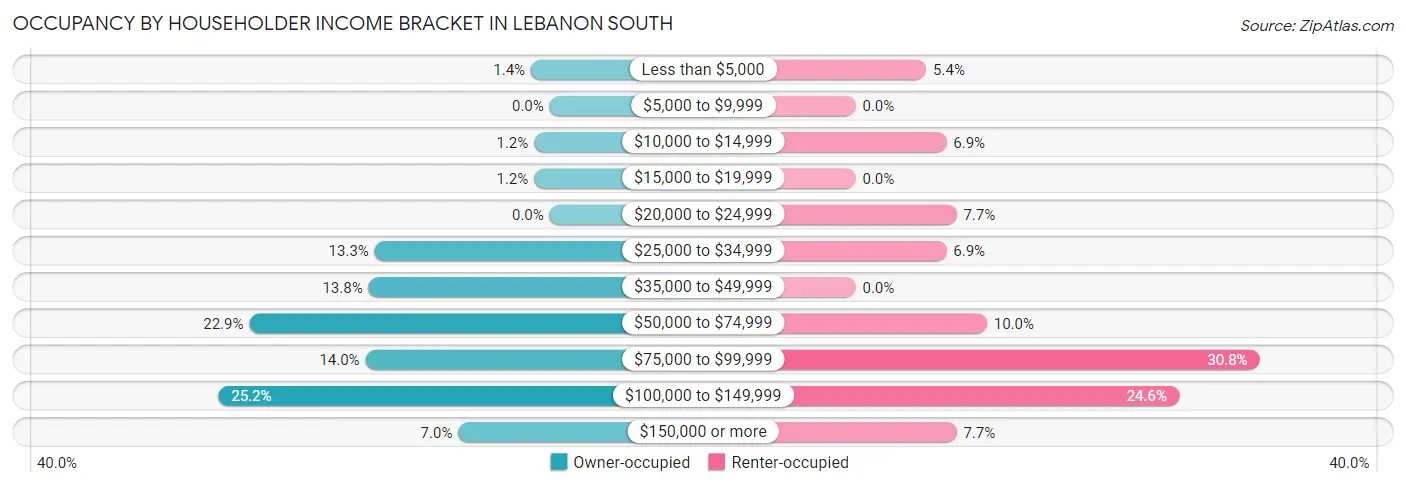
| Income Bracket | Owner-occupied | Renter-occupied |
| Less than $5,000 | 12 (1.4%) | 7 (5.4%) |
| $5,000 to $9,999 | 0 (0.0%) | 0 (0.0%) |
| $10,000 to $14,999 | 10 (1.2%) | 9 (6.9%) |
| $15,000 to $19,999 | 10 (1.2%) | 0 (0.0%) |
| $20,000 to $24,999 | 0 (0.0%) | 10 (7.7%) |
| $25,000 to $34,999 | 113 (13.3%) | 9 (6.9%) |
| $35,000 to $49,999 | 117 (13.8%) | 0 (0.0%) |
| $50,000 to $74,999 | 194 (22.9%) | 13 (10.0%) |
| $75,000 to $99,999 | 119 (14.0%) | 40 (30.8%) |
| $100,000 to $149,999 | 214 (25.2%) | 32 (24.6%) |
| $150,000 or more | 59 (7.0%) | 10 (7.7%) |
| Total | 848 (100.0%) | 130 (100.0%) |
Monthly Housing Cost Tiers in Lebanon South
| Monthly Cost | Owner-occupied | Renter-occupied |
| Less than $300 | 9 (1.1%) | 7 (5.4%) |
| $300 to $499 | 86 (10.1%) | 0 (0.0%) |
| $500 to $799 | 332 (39.2%) | 38 (29.2%) |
| $800 to $999 | 139 (16.4%) | 22 (16.9%) |
| $1,000 to $1,499 | 147 (17.3%) | 63 (48.5%) |
| $1,500 to $1,999 | 94 (11.1%) | 0 (0.0%) |
| $2,000 to $2,499 | 23 (2.7%) | 0 (0.0%) |
| $2,500 to $2,999 | 9 (1.1%) | 0 (0.0%) |
| $3,000 or more | 9 (1.1%) | 0 (0.0%) |
| Total | 848 (100.0%) | 130 (100.0%) |
Physical Housing Characteristics in Lebanon South
Housing Structures in Lebanon South
| Structure Type | # Housing Units | % Housing Units |
| Single Unit, Detached | 664 | 67.9% |
| Single Unit, Attached | 106 | 10.8% |
| 2 Unit Apartments | 24 | 2.5% |
| 3 or 4 Unit Apartments | 0 | 0.0% |
| 5 to 9 Unit Apartments | 10 | 1.0% |
| 10 or more Apartments | 31 | 3.2% |
| Mobile Home / Other | 143 | 14.6% |
| Total | 978 | 100.0% |
Housing Structures by Occupancy in Lebanon South
| Structure Type | Owner-occupied | Renter-occupied |
| Single Unit, Detached | 626 (94.3%) | 38 (5.7%) |
| Single Unit, Attached | 79 (74.5%) | 27 (25.5%) |
| 2 Unit Apartments | 0 (0.0%) | 24 (100.0%) |
| 3 or 4 Unit Apartments | 0 (0.0%) | 0 (0.0%) |
| 5 to 9 Unit Apartments | 0 (0.0%) | 10 (100.0%) |
| 10 or more Apartments | 0 (0.0%) | 31 (100.0%) |
| Mobile Home / Other | 143 (100.0%) | 0 (0.0%) |
| Total | 848 (86.7%) | 130 (13.3%) |
Housing Structures by Number of Rooms in Lebanon South
| Number of Rooms | Owner-occupied | Renter-occupied |
| 1 Room | 12 (1.4%) | 0 (0.0%) |
| 2 or 3 Rooms | 0 (0.0%) | 0 (0.0%) |
| 4 or 5 Rooms | 206 (24.3%) | 120 (92.3%) |
| 6 or 7 Rooms | 440 (51.9%) | 10 (7.7%) |
| 8 or more Rooms | 190 (22.4%) | 0 (0.0%) |
| Total | 848 (100.0%) | 130 (100.0%) |
Housing Structure by Heating Type in Lebanon South
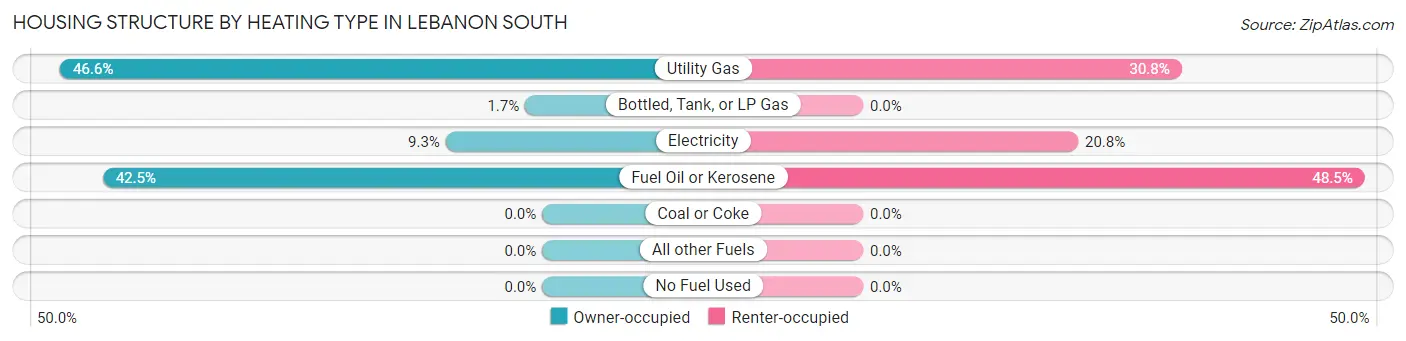
| Heating Type | Owner-occupied | Renter-occupied |
| Utility Gas | 395 (46.6%) | 40 (30.8%) |
| Bottled, Tank, or LP Gas | 14 (1.7%) | 0 (0.0%) |
| Electricity | 79 (9.3%) | 27 (20.8%) |
| Fuel Oil or Kerosene | 360 (42.4%) | 63 (48.5%) |
| Coal or Coke | 0 (0.0%) | 0 (0.0%) |
| All other Fuels | 0 (0.0%) | 0 (0.0%) |
| No Fuel Used | 0 (0.0%) | 0 (0.0%) |
| Total | 848 (100.0%) | 130 (100.0%) |
Household Vehicle Usage in Lebanon South
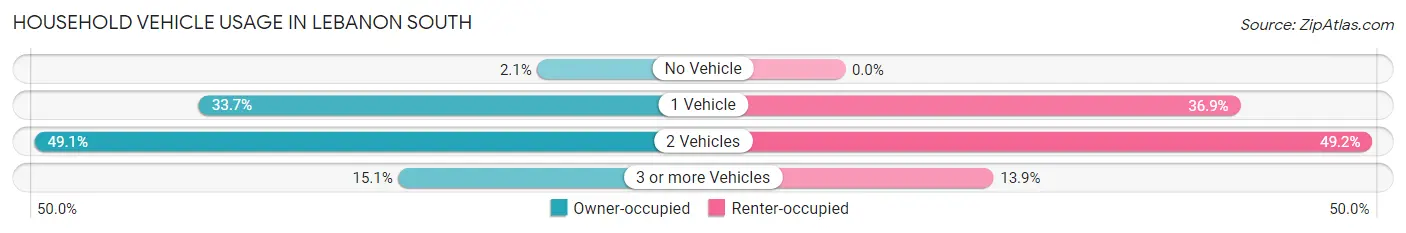
| Vehicles per Household | Owner-occupied | Renter-occupied |
| No Vehicle | 18 (2.1%) | 0 (0.0%) |
| 1 Vehicle | 286 (33.7%) | 48 (36.9%) |
| 2 Vehicles | 416 (49.1%) | 64 (49.2%) |
| 3 or more Vehicles | 128 (15.1%) | 18 (13.9%) |
| Total | 848 (100.0%) | 130 (100.0%) |
Real Estate & Mortgages in Lebanon South
Real Estate and Mortgage Overview in Lebanon South
| Characteristic | Without Mortgage | With Mortgage |
| Housing Units | 499 | 349 |
| Median Property Value | $172,800 | $190,100 |
| Median Household Income | $57,460 | $35 |
| Monthly Housing Costs | $650 | $9 |
| Real Estate Taxes | $2,807 | $0 |
Property Value by Mortgage Status in Lebanon South
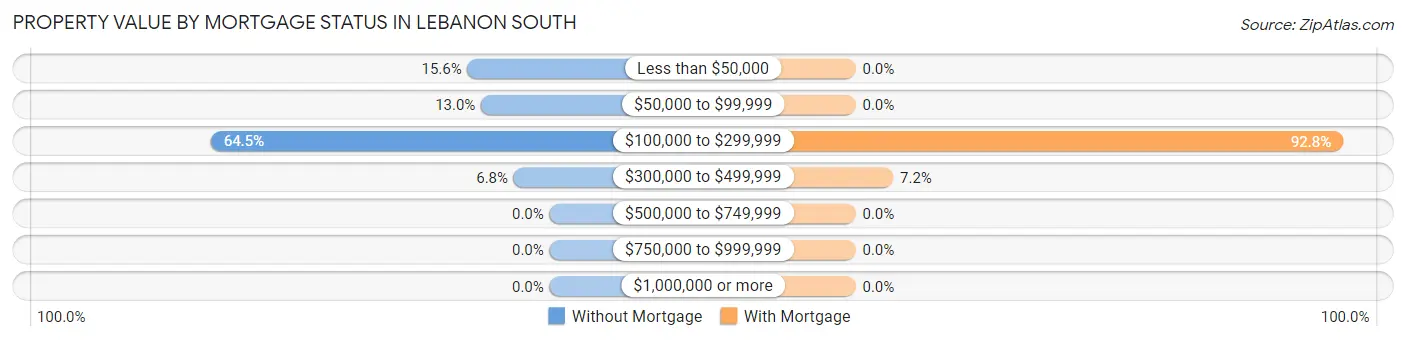
| Property Value | Without Mortgage | With Mortgage |
| Less than $50,000 | 78 (15.6%) | 0 (0.0%) |
| $50,000 to $99,999 | 65 (13.0%) | 0 (0.0%) |
| $100,000 to $299,999 | 322 (64.5%) | 324 (92.8%) |
| $300,000 to $499,999 | 34 (6.8%) | 25 (7.2%) |
| $500,000 to $749,999 | 0 (0.0%) | 0 (0.0%) |
| $750,000 to $999,999 | 0 (0.0%) | 0 (0.0%) |
| $1,000,000 or more | 0 (0.0%) | 0 (0.0%) |
| Total | 499 (100.0%) | 349 (100.0%) |
Household Income by Mortgage Status in Lebanon South
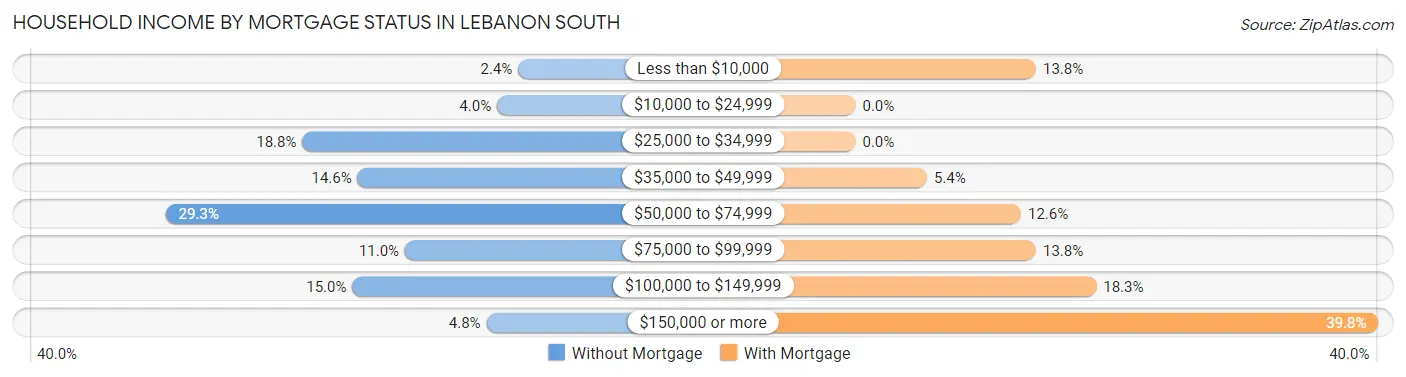
| Household Income | Without Mortgage | With Mortgage |
| Less than $10,000 | 12 (2.4%) | 48 (13.8%) |
| $10,000 to $24,999 | 20 (4.0%) | 0 (0.0%) |
| $25,000 to $34,999 | 94 (18.8%) | 0 (0.0%) |
| $35,000 to $49,999 | 73 (14.6%) | 19 (5.4%) |
| $50,000 to $74,999 | 146 (29.3%) | 44 (12.6%) |
| $75,000 to $99,999 | 55 (11.0%) | 48 (13.8%) |
| $100,000 to $149,999 | 75 (15.0%) | 64 (18.3%) |
| $150,000 or more | 24 (4.8%) | 139 (39.8%) |
| Total | 499 (100.0%) | 349 (100.0%) |
Property Value to Household Income Ratio in Lebanon South
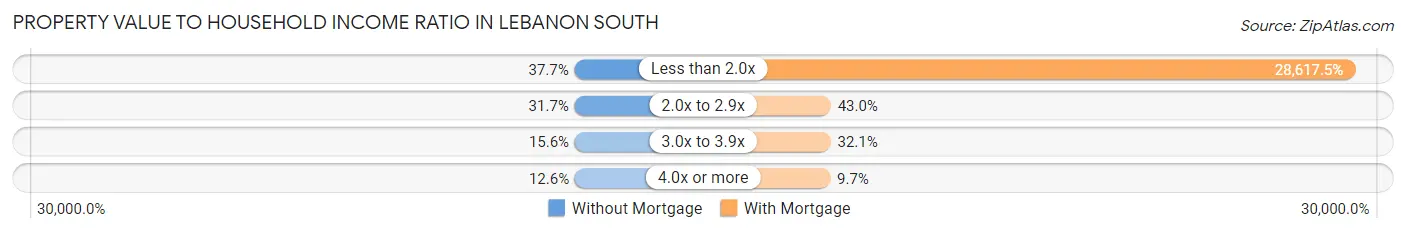
| Value-to-Income Ratio | Without Mortgage | With Mortgage |
| Less than 2.0x | 188 (37.7%) | 99,875 (28,617.5%) |
| 2.0x to 2.9x | 158 (31.7%) | 150 (43.0%) |
| 3.0x to 3.9x | 78 (15.6%) | 112 (32.1%) |
| 4.0x or more | 63 (12.6%) | 34 (9.7%) |
| Total | 499 (100.0%) | 349 (100.0%) |
Real Estate Taxes by Mortgage Status in Lebanon South
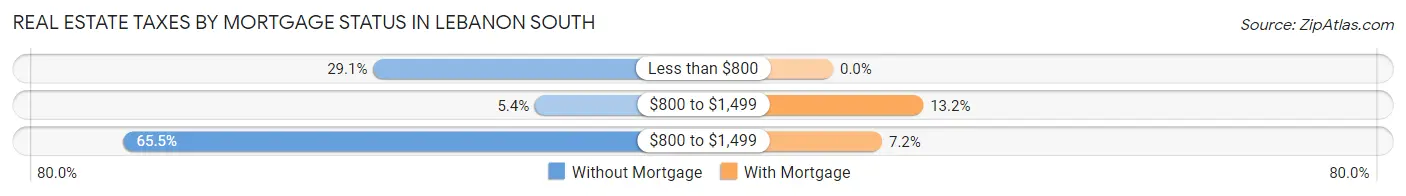
| Property Taxes | Without Mortgage | With Mortgage |
| Less than $800 | 145 (29.1%) | 0 (0.0%) |
| $800 to $1,499 | 27 (5.4%) | 46 (13.2%) |
| $800 to $1,499 | 327 (65.5%) | 25 (7.2%) |
| Total | 499 (100.0%) | 349 (100.0%) |
Health & Disability in Lebanon South
Health Insurance Coverage by Age in Lebanon South
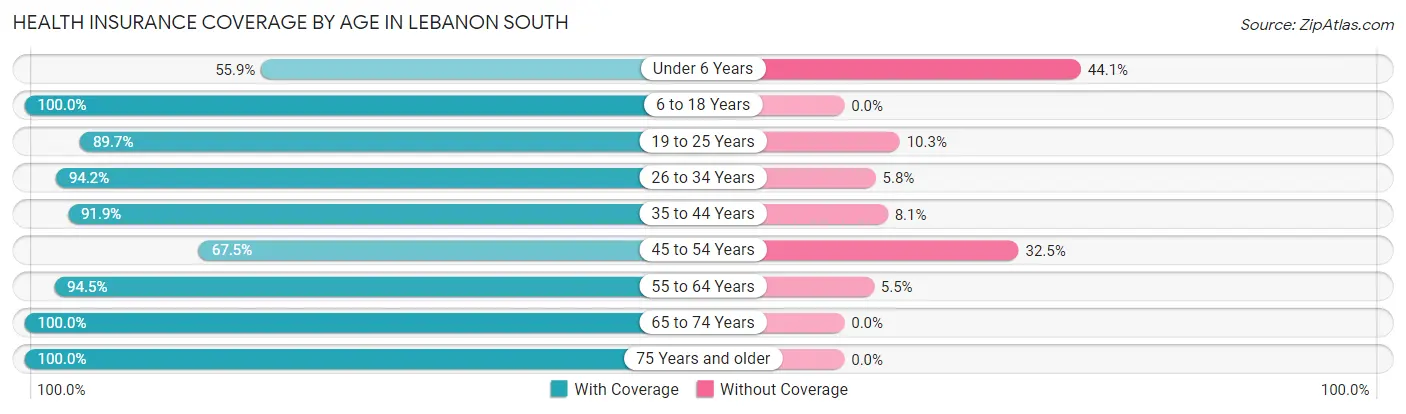
| Age Bracket | With Coverage | Without Coverage |
| Under 6 Years | 38 (55.9%) | 30 (44.1%) |
| 6 to 18 Years | 227 (100.0%) | 0 (0.0%) |
| 19 to 25 Years | 104 (89.7%) | 12 (10.3%) |
| 26 to 34 Years | 145 (94.2%) | 9 (5.8%) |
| 35 to 44 Years | 216 (91.9%) | 19 (8.1%) |
| 45 to 54 Years | 162 (67.5%) | 78 (32.5%) |
| 55 to 64 Years | 326 (94.5%) | 19 (5.5%) |
| 65 to 74 Years | 349 (100.0%) | 0 (0.0%) |
| 75 Years and older | 349 (100.0%) | 0 (0.0%) |
| Total | 1,916 (92.0%) | 167 (8.0%) |
Health Insurance Coverage by Citizenship Status in Lebanon South
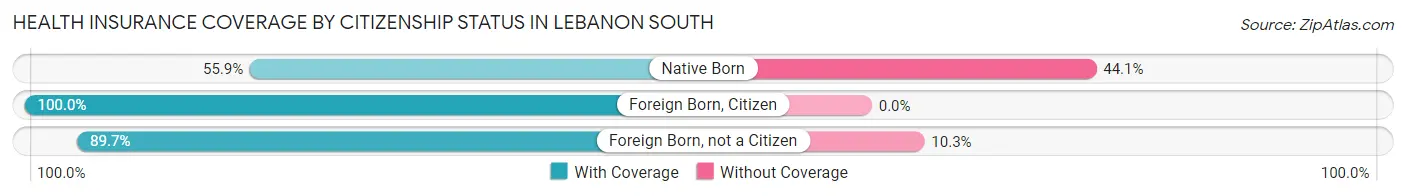
| Citizenship Status | With Coverage | Without Coverage |
| Native Born | 38 (55.9%) | 30 (44.1%) |
| Foreign Born, Citizen | 227 (100.0%) | 0 (0.0%) |
| Foreign Born, not a Citizen | 104 (89.7%) | 12 (10.3%) |
Health Insurance Coverage by Household Income in Lebanon South
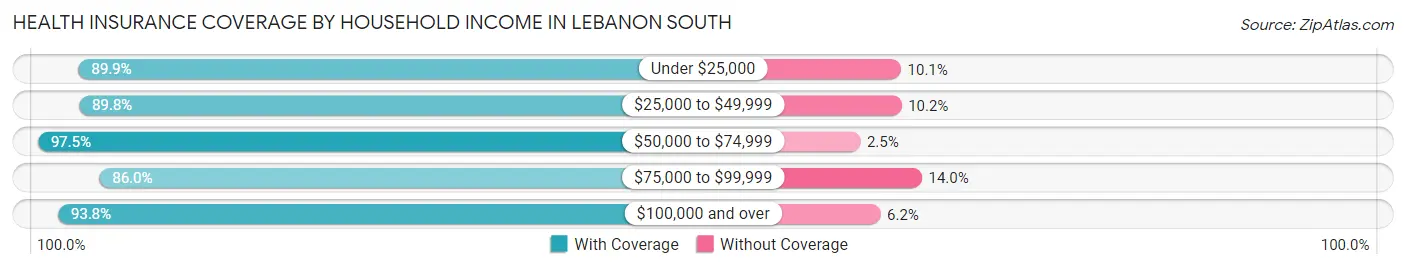
| Household Income | With Coverage | Without Coverage |
| Under $25,000 | 107 (89.9%) | 12 (10.1%) |
| $25,000 to $49,999 | 432 (89.8%) | 49 (10.2%) |
| $50,000 to $74,999 | 355 (97.5%) | 9 (2.5%) |
| $75,000 to $99,999 | 301 (86.0%) | 49 (14.0%) |
| $100,000 and over | 721 (93.8%) | 48 (6.2%) |
Public vs Private Health Insurance Coverage by Age in Lebanon South
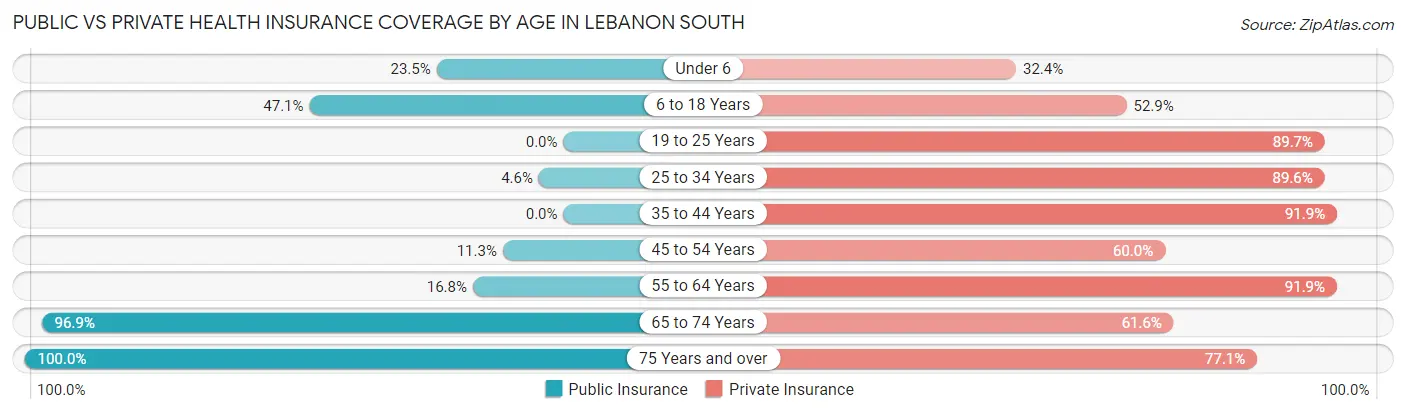
| Age Bracket | Public Insurance | Private Insurance |
| Under 6 | 16 (23.5%) | 22 (32.4%) |
| 6 to 18 Years | 107 (47.1%) | 120 (52.9%) |
| 19 to 25 Years | 0 (0.0%) | 104 (89.7%) |
| 25 to 34 Years | 7 (4.5%) | 138 (89.6%) |
| 35 to 44 Years | 0 (0.0%) | 216 (91.9%) |
| 45 to 54 Years | 27 (11.3%) | 144 (60.0%) |
| 55 to 64 Years | 58 (16.8%) | 317 (91.9%) |
| 65 to 74 Years | 338 (96.9%) | 215 (61.6%) |
| 75 Years and over | 349 (100.0%) | 269 (77.1%) |
| Total | 902 (43.3%) | 1,545 (74.2%) |
Disability Status by Sex by Age in Lebanon South
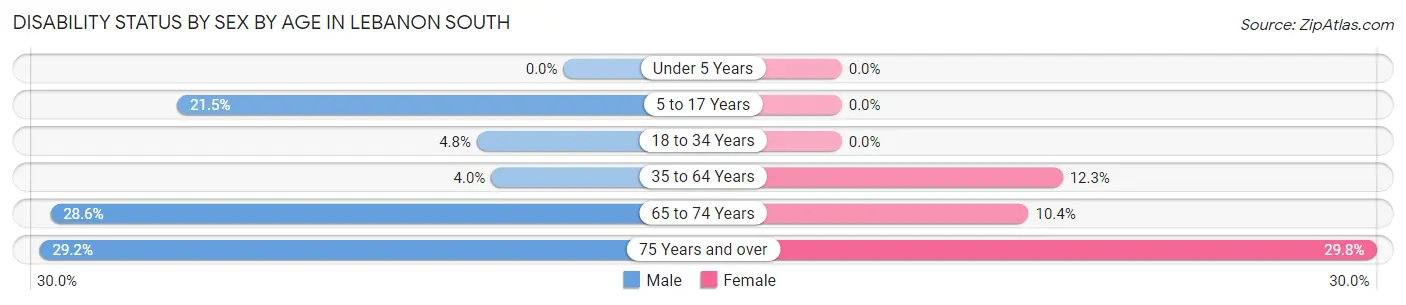
| Age Bracket | Male | Female |
| Under 5 Years | 0 (0.0%) | 0 (0.0%) |
| 5 to 17 Years | 20 (21.5%) | 0 (0.0%) |
| 18 to 34 Years | 8 (4.8%) | 0 (0.0%) |
| 35 to 64 Years | 15 (4.0%) | 55 (12.3%) |
| 65 to 74 Years | 42 (28.6%) | 21 (10.4%) |
| 75 Years and over | 42 (29.2%) | 61 (29.8%) |
Disability Class by Sex by Age in Lebanon South
Disability Class: Hearing Difficulty
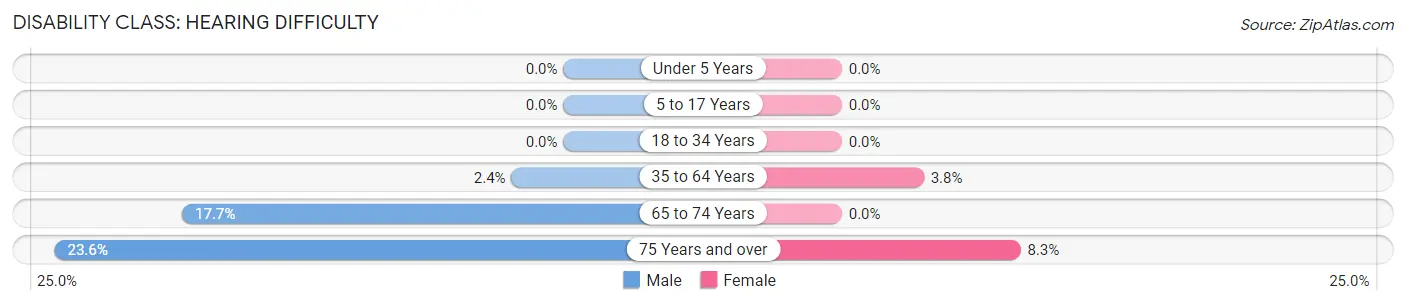
| Age Bracket | Male | Female |
| Under 5 Years | 0 (0.0%) | 0 (0.0%) |
| 5 to 17 Years | 0 (0.0%) | 0 (0.0%) |
| 18 to 34 Years | 0 (0.0%) | 0 (0.0%) |
| 35 to 64 Years | 9 (2.4%) | 17 (3.8%) |
| 65 to 74 Years | 26 (17.7%) | 0 (0.0%) |
| 75 Years and over | 34 (23.6%) | 17 (8.3%) |
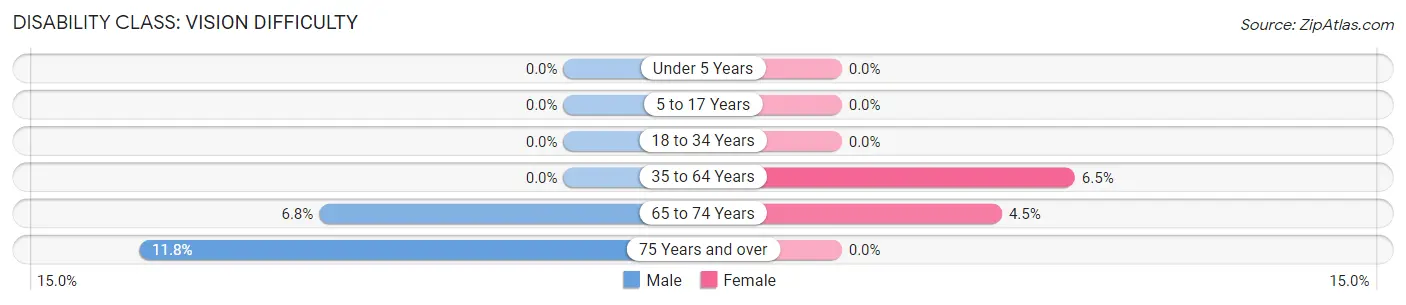
Disability Class: Vision Difficulty
| Age Bracket | Male | Female |
| Under 5 Years | 0 (0.0%) | 0 (0.0%) |
| 5 to 17 Years | 0 (0.0%) | 0 (0.0%) |
| 18 to 34 Years | 0 (0.0%) | 0 (0.0%) |
| 35 to 64 Years | 0 (0.0%) | 29 (6.5%) |
| 65 to 74 Years | 10 (6.8%) | 9 (4.5%) |
| 75 Years and over | 17 (11.8%) | 0 (0.0%) |
Disability Class: Cognitive Difficulty
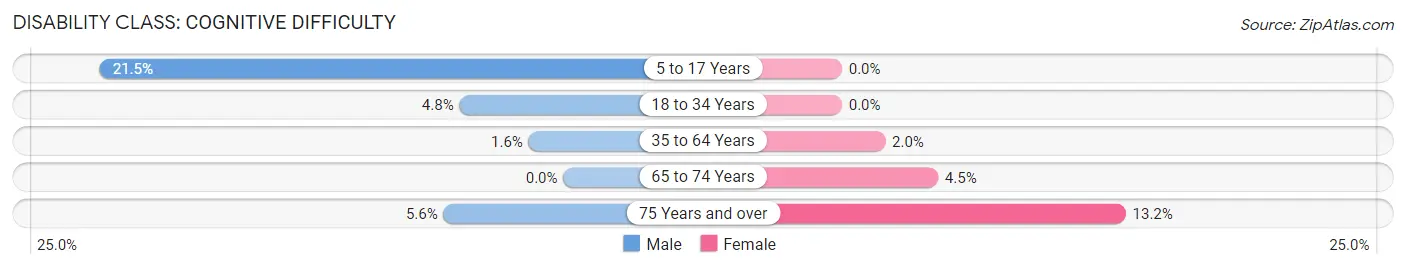
| Age Bracket | Male | Female |
| 5 to 17 Years | 20 (21.5%) | 0 (0.0%) |
| 18 to 34 Years | 8 (4.8%) | 0 (0.0%) |
| 35 to 64 Years | 6 (1.6%) | 9 (2.0%) |
| 65 to 74 Years | 0 (0.0%) | 9 (4.5%) |
| 75 Years and over | 8 (5.6%) | 27 (13.2%) |
Disability Class: Ambulatory Difficulty
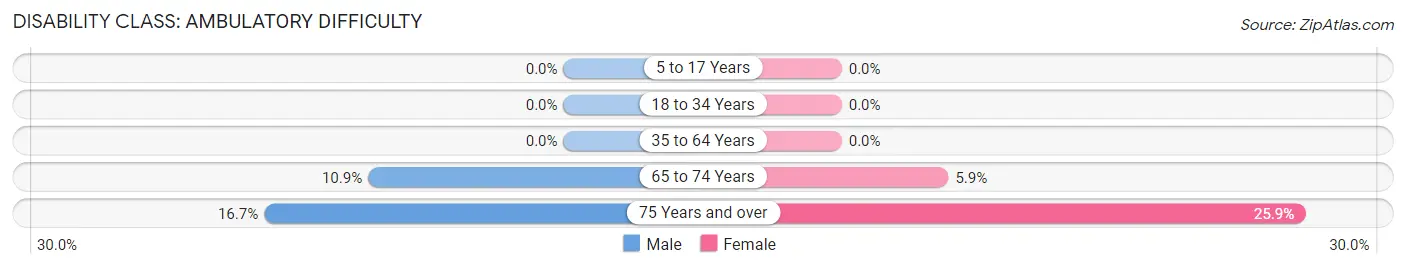
| Age Bracket | Male | Female |
| 5 to 17 Years | 0 (0.0%) | 0 (0.0%) |
| 18 to 34 Years | 0 (0.0%) | 0 (0.0%) |
| 35 to 64 Years | 0 (0.0%) | 0 (0.0%) |
| 65 to 74 Years | 16 (10.9%) | 12 (5.9%) |
| 75 Years and over | 24 (16.7%) | 53 (25.9%) |
Disability Class: Self-Care Difficulty
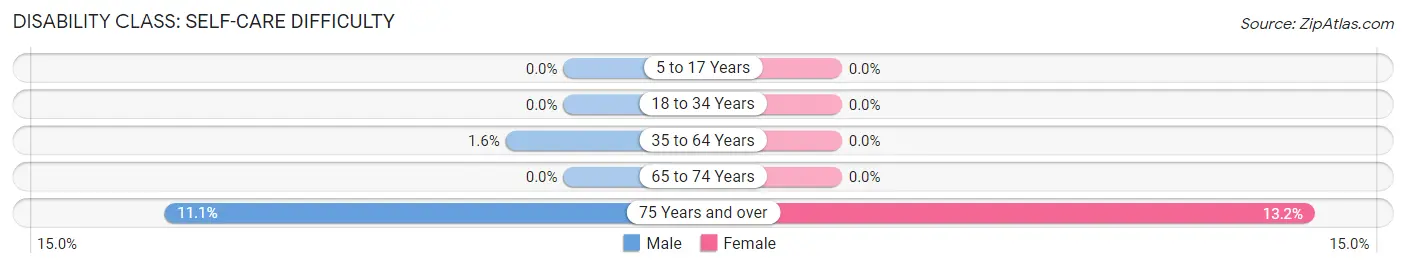
| Age Bracket | Male | Female |
| 5 to 17 Years | 0 (0.0%) | 0 (0.0%) |
| 18 to 34 Years | 0 (0.0%) | 0 (0.0%) |
| 35 to 64 Years | 6 (1.6%) | 0 (0.0%) |
| 65 to 74 Years | 0 (0.0%) | 0 (0.0%) |
| 75 Years and over | 16 (11.1%) | 27 (13.2%) |
Technology Access in Lebanon South
Computing Device Access in Lebanon South
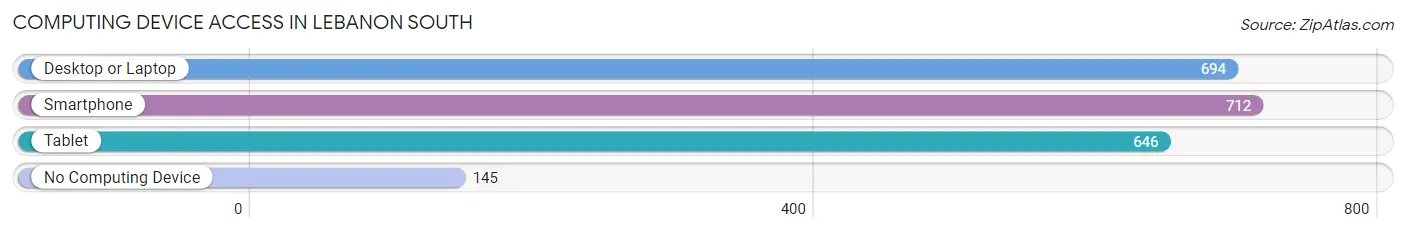
| Device Type | # Households | % Households |
| Desktop or Laptop | 694 | 71.0% |
| Smartphone | 712 | 72.8% |
| Tablet | 646 | 66.0% |
| No Computing Device | 145 | 14.8% |
| Total | 978 | 100.0% |
Internet Access in Lebanon South
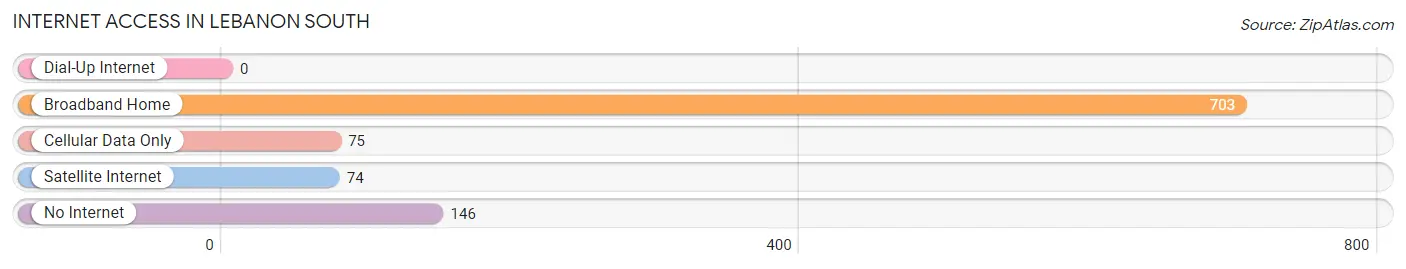
| Internet Type | # Households | % Households |
| Dial-Up Internet | 0 | 0.0% |
| Broadband Home | 703 | 71.9% |
| Cellular Data Only | 75 | 7.7% |
| Satellite Internet | 74 | 7.6% |
| No Internet | 146 | 14.9% |
| Total | 978 | 100.0% |
Lebanon South Summary
Lebanon South, Pennsylvania is a small borough located in Lebanon County, Pennsylvania. It is situated in the southeastern part of the state, approximately 20 miles east of Harrisburg, the state capital. The population of Lebanon South was 2,845 at the 2010 census.
Geography
Lebanon South is located at 40°20'17" North, 76°20'45" West (40.338, -76.346). It is situated in the southeastern part of Lebanon County, approximately 20 miles east of Harrisburg, the state capital. The borough is bordered by North Lebanon Township to the north, East Hanover Township to the east, South Annville Township to the south, and West Cornwall Township to the west.
The borough is situated in the Lebanon Valley, a region of rolling hills and valleys. The area is characterized by a humid continental climate, with hot, humid summers and cold, snowy winters. The average annual temperature is 52°F, and the average annual precipitation is 41 inches.
Economy
Lebanon South is a small, rural borough with a largely agricultural economy. The borough is home to several small businesses, including a grocery store, a hardware store, and a few restaurants. The borough is also home to several small manufacturing companies, including a plastics manufacturer and a metal fabrication company.
The borough is served by the Lebanon Valley Railroad, which provides freight service to the area. The railroad also serves as a tourist attraction, offering scenic rides through the countryside.
Demographics
As of the 2010 census, the population of Lebanon South was 2,845. The racial makeup of the borough was 97.3% White, 0.7% African American, 0.3% Native American, 0.3% Asian, 0.2% from other races, and 1.2% from two or more races. Hispanic or Latino of any race were 1.2% of the population.
The median income for a household in the borough was $45,938, and the median income for a family was $54,844. The per capita income for the borough was $20,945. About 6.2% of families and 8.2% of the population were below the poverty line, including 10.2% of those under age 18 and 8.2% of those age 65 or over.
Education
Lebanon South is served by the Lebanon School District. The district operates two elementary schools, one middle school, and one high school. The district also operates a vocational-technical school.
The borough is also home to Lebanon Valley College, a private liberal arts college. The college offers a variety of undergraduate and graduate degree programs.
Conclusion
Lebanon South, Pennsylvania is a small borough located in Lebanon County, Pennsylvania. It is situated in the southeastern part of the state, approximately 20 miles east of Harrisburg, the state capital. The population of Lebanon South was 2,845 at the 2010 census. The borough is characterized by a humid continental climate, with hot, humid summers and cold, snowy winters. The economy of Lebanon South is largely agricultural, with several small businesses and manufacturing companies. The borough is served by the Lebanon School District and is home to Lebanon Valley College.
Common Questions
What is Per Capita Income in Lebanon South?
Per Capita income in Lebanon South is $41,728.
What is the Median Family Income in Lebanon South?
Median Family Income in Lebanon South is $97,237.
What is the Median Household income in Lebanon South?
Median Household Income in Lebanon South is $72,045.
What is Income or Wage Gap in Lebanon South?
Income or Wage Gap in Lebanon South is 28.7%.
Women in Lebanon South earn 71.3 cents for every dollar earned by a man.
What is Inequality or Gini Index in Lebanon South?
Inequality or Gini Index in Lebanon South is 0.36.
What is the Total Population of Lebanon South?
Total Population of Lebanon South is 2,083.
What is the Total Male Population of Lebanon South?
Total Male Population of Lebanon South is 943.
What is the Total Female Population of Lebanon South?
Total Female Population of Lebanon South is 1,140.
What is the Ratio of Males per 100 Females in Lebanon South?
There are 82.72 Males per 100 Females in Lebanon South.
What is the Ratio of Females per 100 Males in Lebanon South?
There are 120.89 Females per 100 Males in Lebanon South.
What is the Median Population Age in Lebanon South?
Median Population Age in Lebanon South is 55.2 Years.
What is the Average Family Size in Lebanon South
Average Family Size in Lebanon South is 2.5 People.
What is the Average Household Size in Lebanon South
Average Household Size in Lebanon South is 2.1 People.
How Large is the Labor Force in Lebanon South?
There are 1,063 People in the Labor Forcein in Lebanon South.
What is the Percentage of People in the Labor Force in Lebanon South?
58.8% of People are in the Labor Force in Lebanon South.
What is the Unemployment Rate in Lebanon South?
Unemployment Rate in Lebanon South is 4.0%.