Monaca borough, PA Map & Demographics
Monaca borough Overview
$30,587
PER CAPITA INCOME
$74,450
AVG FAMILY INCOME
$62,125
AVG HOUSEHOLD INCOME
33.2%
WAGE / INCOME GAP [ % ]
66.8¢/ $1
WAGE / INCOME GAP [ $ ]
0.42
INEQUALITY / GINI INDEX
5,587
TOTAL POPULATION
2,728
MALE POPULATION
2,859
FEMALE POPULATION
95.42
MALES / 100 FEMALES
104.80
FEMALES / 100 MALES
39.3
MEDIAN AGE
3.1
AVG FAMILY SIZE
2.3
AVG HOUSEHOLD SIZE
2,959
LABOR FORCE [ PEOPLE ]
67.0%
PERCENT IN LABOR FORCE
7.2%
UNEMPLOYMENT RATE
Income in Monaca borough
Income Overview in Monaca borough
Per Capita Income in Monaca borough is $30,587, while median incomes of families and households are $74,450 and $62,125 respectively.
| Characteristic | Number | Measure |
| Per Capita Income | 5,587 | $30,587 |
| Median Family Income | 1,353 | $74,450 |
| Mean Family Income | 1,353 | $86,848 |
| Median Household Income | 2,418 | $62,125 |
| Mean Household Income | 2,418 | $69,736 |
| Income Deficit | 1,353 | $0 |
| Wage / Income Gap (%) | 5,587 | 33.17% |
| Wage / Income Gap ($) | 5,587 | 66.83¢ per $1 |
| Gini / Inequality Index | 5,587 | 0.42 |
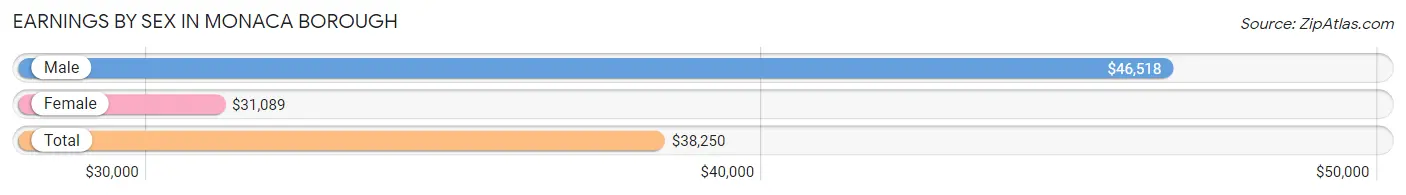
Earnings by Sex in Monaca borough
Average Earnings in Monaca borough are $38,250, $46,518 for men and $31,089 for women, a difference of 33.2%.
| Sex | Number | Average Earnings |
| Male | 1,570 (52.6%) | $46,518 |
| Female | 1,417 (47.4%) | $31,089 |
| Total | 2,987 (100.0%) | $38,250 |
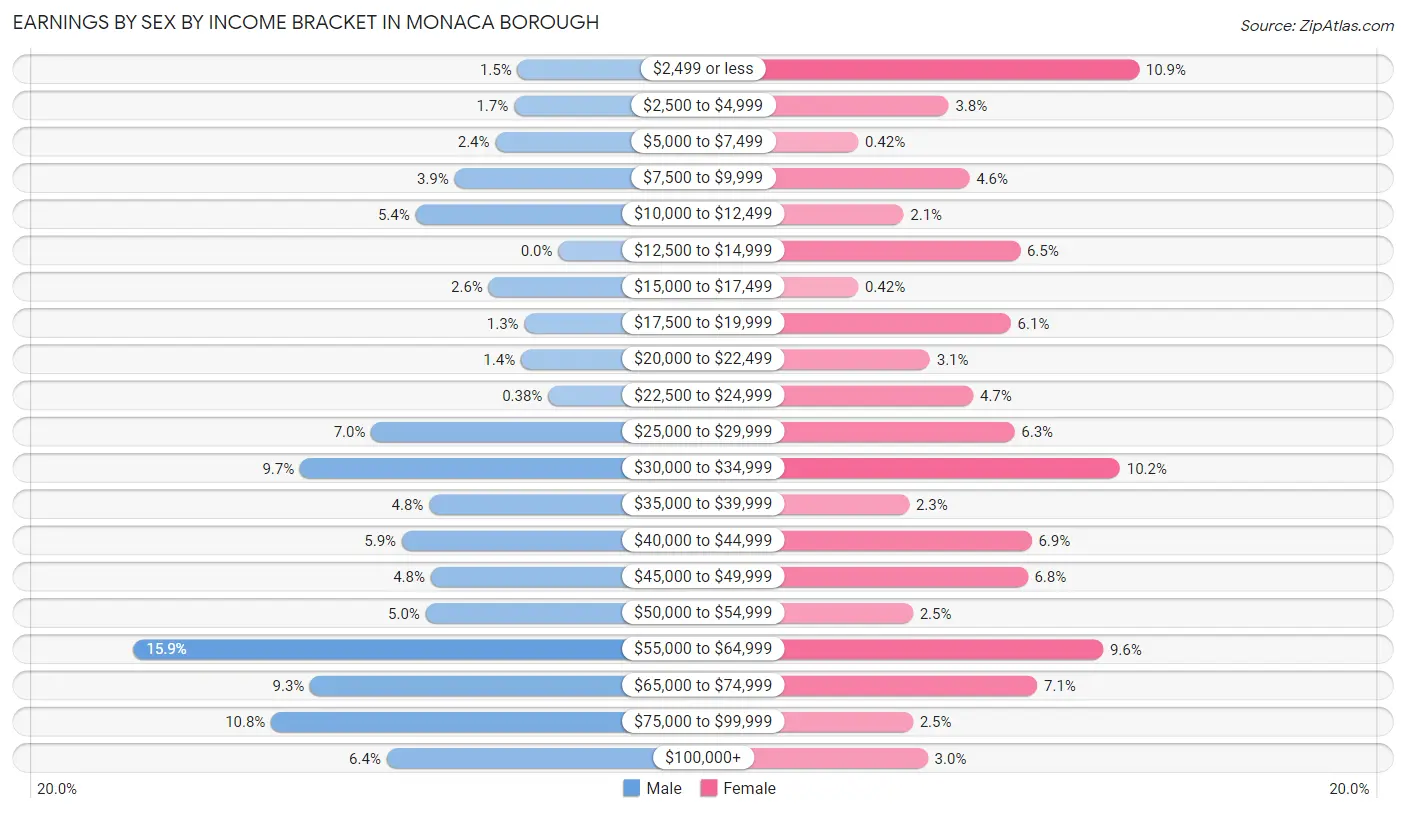
Earnings by Sex by Income Bracket in Monaca borough
The most common earnings brackets in Monaca borough are $55,000 to $64,999 for men (250 | 15.9%) and $2,499 or less for women (155 | 10.9%).
| Income | Male | Female |
| $2,499 or less | 24 (1.5%) | 155 (10.9%) |
| $2,500 to $4,999 | 26 (1.7%) | 54 (3.8%) |
| $5,000 to $7,499 | 37 (2.4%) | 6 (0.4%) |
| $7,500 to $9,999 | 61 (3.9%) | 65 (4.6%) |
| $10,000 to $12,499 | 84 (5.3%) | 30 (2.1%) |
| $12,500 to $14,999 | 0 (0.0%) | 92 (6.5%) |
| $15,000 to $17,499 | 41 (2.6%) | 6 (0.4%) |
| $17,500 to $19,999 | 20 (1.3%) | 87 (6.1%) |
| $20,000 to $22,499 | 22 (1.4%) | 44 (3.1%) |
| $22,500 to $24,999 | 6 (0.4%) | 67 (4.7%) |
| $25,000 to $29,999 | 110 (7.0%) | 89 (6.3%) |
| $30,000 to $34,999 | 152 (9.7%) | 145 (10.2%) |
| $35,000 to $39,999 | 76 (4.8%) | 33 (2.3%) |
| $40,000 to $44,999 | 92 (5.9%) | 98 (6.9%) |
| $45,000 to $49,999 | 75 (4.8%) | 96 (6.8%) |
| $50,000 to $54,999 | 78 (5.0%) | 35 (2.5%) |
| $55,000 to $64,999 | 250 (15.9%) | 136 (9.6%) |
| $65,000 to $74,999 | 146 (9.3%) | 101 (7.1%) |
| $75,000 to $99,999 | 169 (10.8%) | 35 (2.5%) |
| $100,000+ | 101 (6.4%) | 43 (3.0%) |
| Total | 1,570 (100.0%) | 1,417 (100.0%) |
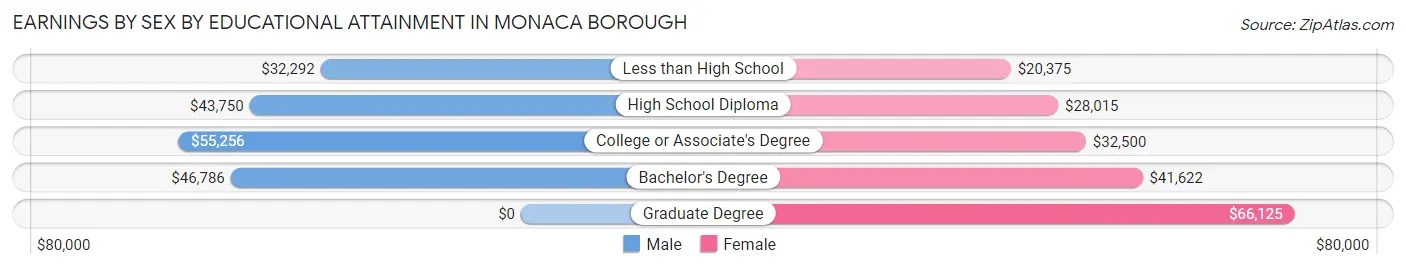
Earnings by Sex by Educational Attainment in Monaca borough
Average earnings in Monaca borough are $49,803 for men and $34,018 for women, a difference of 31.7%. Men with an educational attainment of college or associate's degree enjoy the highest average annual earnings of $55,256, while those with less than high school education earn the least with $32,292. Women with an educational attainment of graduate degree earn the most with the average annual earnings of $66,125, while those with less than high school education have the smallest earnings of $20,375.
| Educational Attainment | Male Income | Female Income |
| Less than High School | $32,292 | $20,375 |
| High School Diploma | $43,750 | $28,015 |
| College or Associate's Degree | $55,256 | $32,500 |
| Bachelor's Degree | $46,786 | $41,622 |
| Graduate Degree | - | - |
| Total | $49,803 | $34,018 |
Family Income in Monaca borough
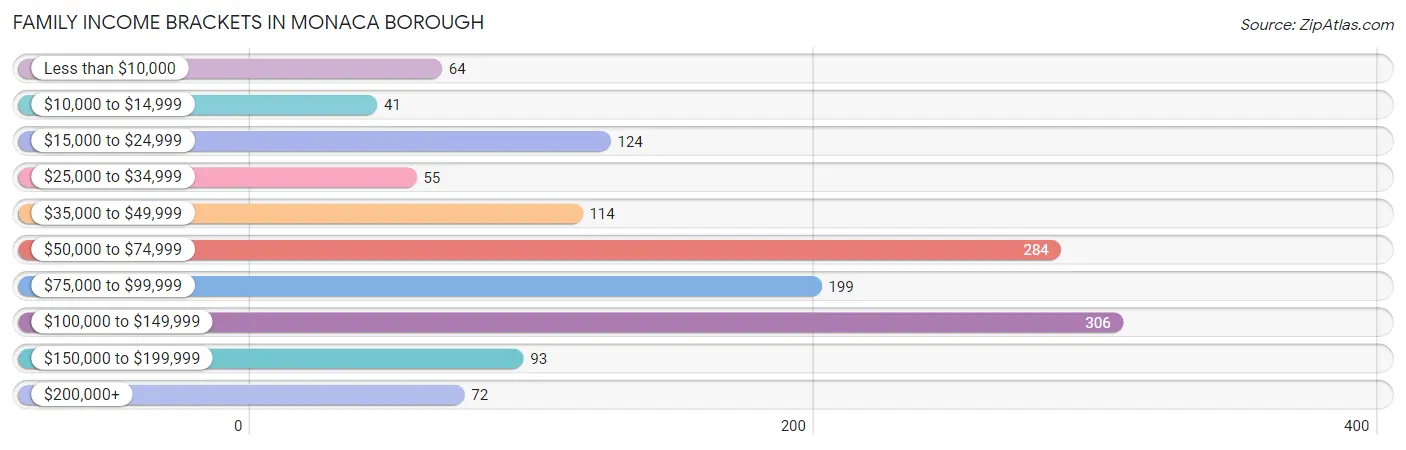
Family Income Brackets in Monaca borough
According to the Monaca borough family income data, there are 306 families falling into the $100,000 to $149,999 income range, which is the most common income bracket and makes up 22.6% of all families. Conversely, the $10,000 to $14,999 income bracket is the least frequent group with only 41 families (3.0%) belonging to this category.
| Income Bracket | # Families | % Families |
| Less than $10,000 | 64 | 4.7% |
| $10,000 to $14,999 | 41 | 3.0% |
| $15,000 to $24,999 | 124 | 9.2% |
| $25,000 to $34,999 | 55 | 4.1% |
| $35,000 to $49,999 | 114 | 8.4% |
| $50,000 to $74,999 | 284 | 21.0% |
| $75,000 to $99,999 | 199 | 14.7% |
| $100,000 to $149,999 | 306 | 22.6% |
| $150,000 to $199,999 | 93 | 6.9% |
| $200,000+ | 72 | 5.3% |
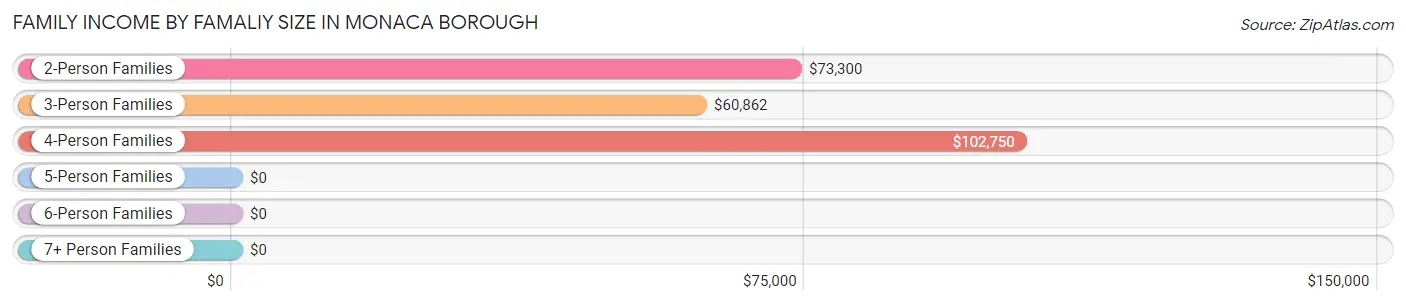
Family Income by Famaliy Size in Monaca borough
4-person families (262 | 19.4%) account for the highest median family income in Monaca borough with $102,750 per family, while 2-person families (548 | 40.5%) have the highest median income of $36,650 per family member.
| Income Bracket | # Families | Median Income |
| 2-Person Families | 548 (40.5%) | $73,300 |
| 3-Person Families | 344 (25.4%) | $60,862 |
| 4-Person Families | 262 (19.4%) | $102,750 |
| 5-Person Families | 131 (9.7%) | $0 |
| 6-Person Families | 68 (5.0%) | $0 |
| 7+ Person Families | 0 (0.0%) | $0 |
| Total | 1,353 (100.0%) | $74,450 |
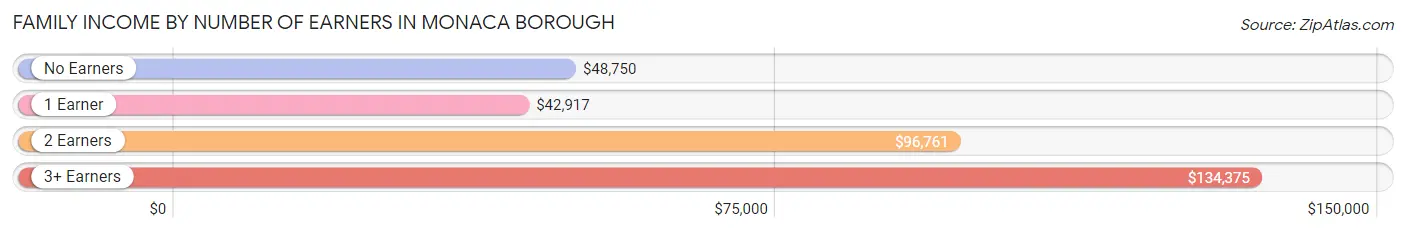
Family Income by Number of Earners in Monaca borough
The median family income in Monaca borough is $74,450, with families comprising 3+ earners (147) having the highest median family income of $134,375, while families with 1 earner (369) have the lowest median family income of $42,917, accounting for 10.9% and 27.3% of families, respectively.
| Number of Earners | # Families | Median Income |
| No Earners | 230 (17.0%) | $48,750 |
| 1 Earner | 369 (27.3%) | $42,917 |
| 2 Earners | 607 (44.9%) | $96,761 |
| 3+ Earners | 147 (10.9%) | $134,375 |
| Total | 1,353 (100.0%) | $74,450 |
Household Income in Monaca borough
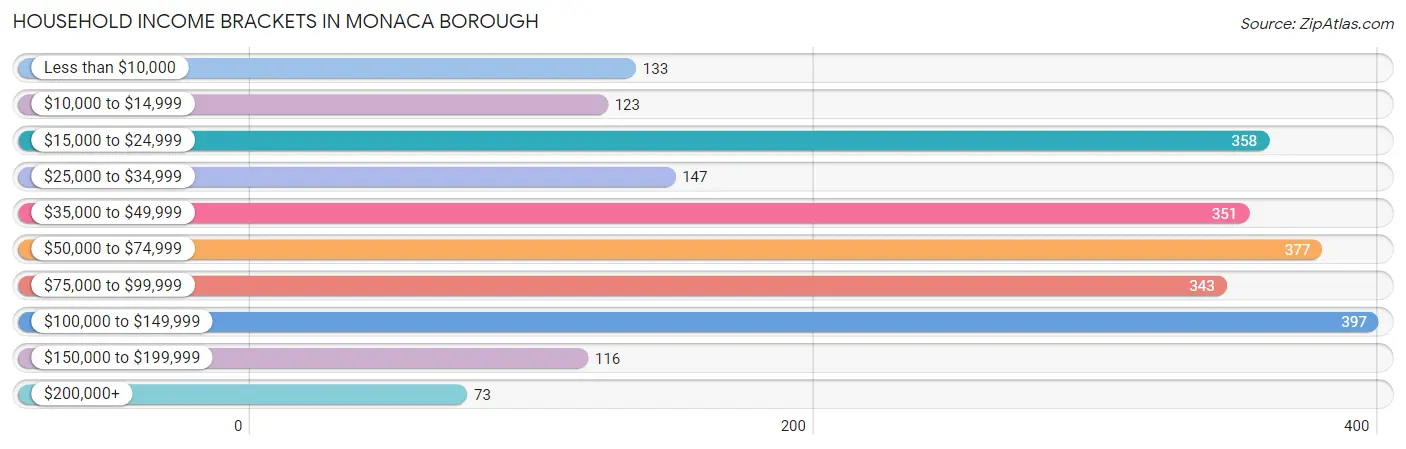
Household Income Brackets in Monaca borough
With 397 households falling in the category, the $100,000 to $149,999 income range is the most frequent in Monaca borough, accounting for 16.4% of all households. In contrast, only 73 households (3.0%) fall into the $200,000+ income bracket, making it the least populous group.
| Income Bracket | # Households | % Households |
| Less than $10,000 | 133 | 5.5% |
| $10,000 to $14,999 | 123 | 5.1% |
| $15,000 to $24,999 | 358 | 14.8% |
| $25,000 to $34,999 | 147 | 6.1% |
| $35,000 to $49,999 | 351 | 14.5% |
| $50,000 to $74,999 | 377 | 15.6% |
| $75,000 to $99,999 | 343 | 14.2% |
| $100,000 to $149,999 | 397 | 16.4% |
| $150,000 to $199,999 | 116 | 4.8% |
| $200,000+ | 73 | 3.0% |
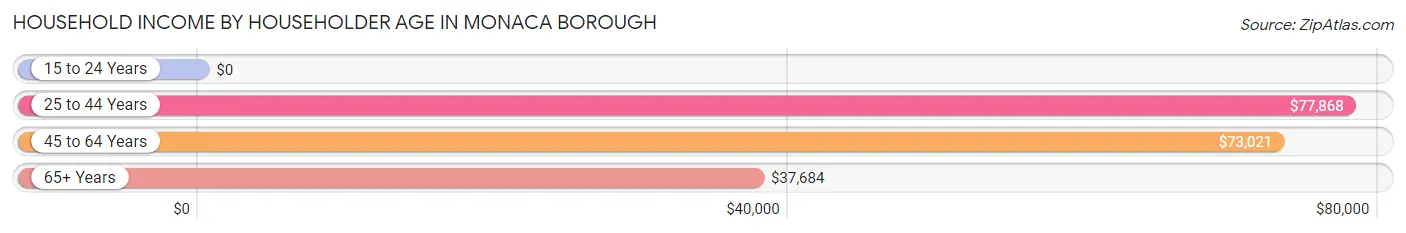
Household Income by Householder Age in Monaca borough
The median household income in Monaca borough is $62,125, with the highest median household income of $77,868 found in the 25 to 44 years age bracket for the primary householder. A total of 815 households (33.7%) fall into this category. Meanwhile, the 15 to 24 years age bracket for the primary householder has the lowest median household income of $0, with 75 households (3.1%) in this group.
| Income Bracket | # Households | Median Income |
| 15 to 24 Years | 75 (3.1%) | $0 |
| 25 to 44 Years | 815 (33.7%) | $77,868 |
| 45 to 64 Years | 803 (33.2%) | $73,021 |
| 65+ Years | 725 (30.0%) | $37,684 |
| Total | 2,418 (100.0%) | $62,125 |
Poverty in Monaca borough
Income Below Poverty by Sex and Age in Monaca borough
With 14.6% poverty level for males and 15.3% for females among the residents of Monaca borough, 5 year old males and under 5 year old females are the most vulnerable to poverty, with 7 males (100.0%) and 74 females (45.1%) in their respective age groups living below the poverty level.
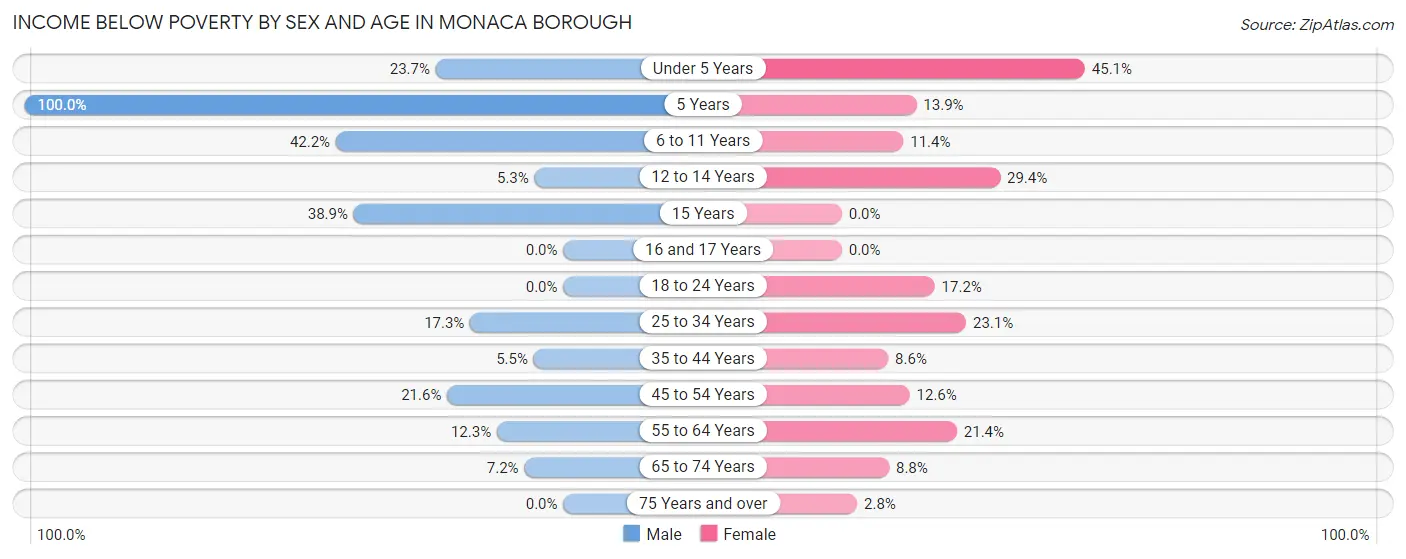
| Age Bracket | Male | Female |
| Under 5 Years | 27 (23.7%) | 74 (45.1%) |
| 5 Years | 7 (100.0%) | 9 (13.9%) |
| 6 to 11 Years | 84 (42.2%) | 30 (11.4%) |
| 12 to 14 Years | 8 (5.3%) | 37 (29.4%) |
| 15 Years | 21 (38.9%) | 0 (0.0%) |
| 16 and 17 Years | 0 (0.0%) | 0 (0.0%) |
| 18 to 24 Years | 0 (0.0%) | 40 (17.2%) |
| 25 to 34 Years | 79 (17.3%) | 83 (23.1%) |
| 35 to 44 Years | 21 (5.5%) | 31 (8.6%) |
| 45 to 54 Years | 89 (21.5%) | 36 (12.6%) |
| 55 to 64 Years | 43 (12.3%) | 63 (21.4%) |
| 65 to 74 Years | 19 (7.2%) | 25 (8.8%) |
| 75 Years and over | 0 (0.0%) | 10 (2.8%) |
| Total | 398 (14.6%) | 438 (15.3%) |
Income Above Poverty by Sex and Age in Monaca borough
According to the poverty statistics in Monaca borough, males aged 16 and 17 years and females aged 15 years are the age groups that are most secure financially, with 100.0% of males and 100.0% of females in these age groups living above the poverty line.
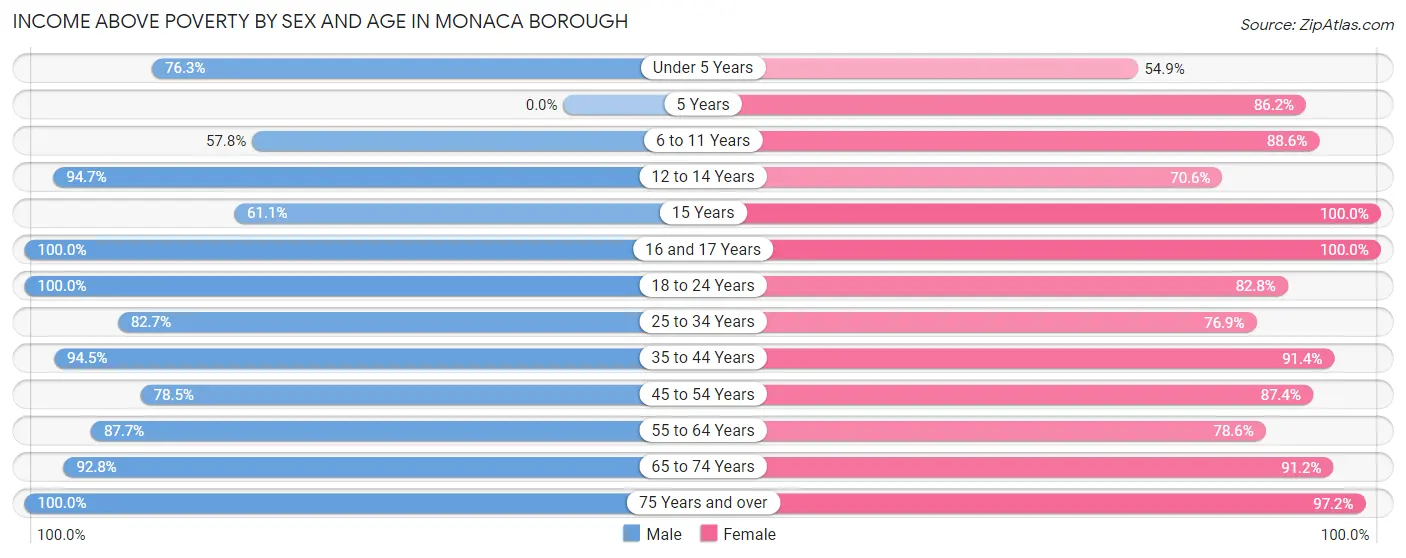
| Age Bracket | Male | Female |
| Under 5 Years | 87 (76.3%) | 90 (54.9%) |
| 5 Years | 0 (0.0%) | 56 (86.2%) |
| 6 to 11 Years | 115 (57.8%) | 233 (88.6%) |
| 12 to 14 Years | 142 (94.7%) | 89 (70.6%) |
| 15 Years | 33 (61.1%) | 19 (100.0%) |
| 16 and 17 Years | 49 (100.0%) | 52 (100.0%) |
| 18 to 24 Years | 123 (100.0%) | 192 (82.8%) |
| 25 to 34 Years | 378 (82.7%) | 277 (76.9%) |
| 35 to 44 Years | 362 (94.5%) | 329 (91.4%) |
| 45 to 54 Years | 324 (78.4%) | 250 (87.4%) |
| 55 to 64 Years | 306 (87.7%) | 232 (78.6%) |
| 65 to 74 Years | 244 (92.8%) | 260 (91.2%) |
| 75 Years and over | 157 (100.0%) | 342 (97.2%) |
| Total | 2,320 (85.4%) | 2,421 (84.7%) |
Income Below Poverty Among Married-Couple Families in Monaca borough
The poverty statistics for married-couple families in Monaca borough show that 10.6% or 101 of the total 955 families live below the poverty line. Families with 1 or 2 children have the highest poverty rate of 22.8%, comprising of 75 families. On the other hand, families with no children have the lowest poverty rate of 0.8%, which includes 4 families.
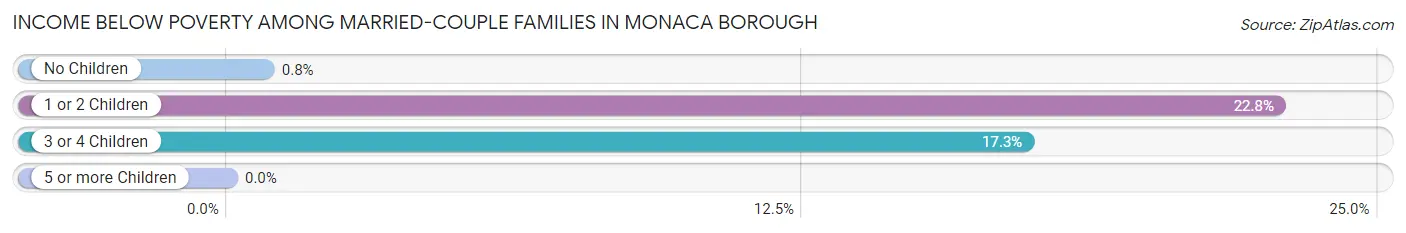
| Children | Above Poverty | Below Poverty |
| No Children | 495 (99.2%) | 4 (0.8%) |
| 1 or 2 Children | 254 (77.2%) | 75 (22.8%) |
| 3 or 4 Children | 105 (82.7%) | 22 (17.3%) |
| 5 or more Children | 0 (0.0%) | 0 (0.0%) |
| Total | 854 (89.4%) | 101 (10.6%) |
Income Below Poverty Among Single-Parent Households in Monaca borough
According to the poverty data in Monaca borough, 17.2% or 16 single-father households and 29.2% or 89 single-mother households are living below the poverty line. Among single-father households, those with 1 or 2 children have the highest poverty rate, with 16 households (30.2%) experiencing poverty. Likewise, among single-mother households, those with 1 or 2 children have the highest poverty rate, with 77 households (49.4%) falling below the poverty line.
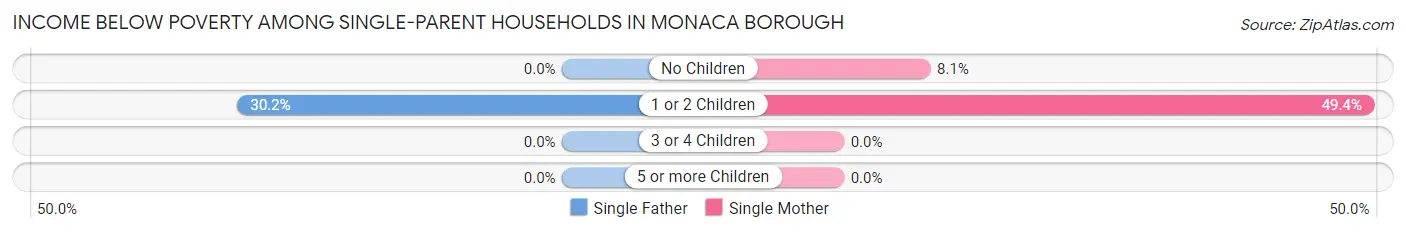
| Children | Single Father | Single Mother |
| No Children | 0 (0.0%) | 12 (8.1%) |
| 1 or 2 Children | 16 (30.2%) | 77 (49.4%) |
| 3 or 4 Children | 0 (0.0%) | 0 (0.0%) |
| 5 or more Children | 0 (0.0%) | 0 (0.0%) |
| Total | 16 (17.2%) | 89 (29.2%) |
Income Below Poverty Among Married-Couple vs Single-Parent Households in Monaca borough
The poverty data for Monaca borough shows that 101 of the married-couple family households (10.6%) and 105 of the single-parent households (26.4%) are living below the poverty level. Within the married-couple family households, those with 1 or 2 children have the highest poverty rate, with 75 households (22.8%) falling below the poverty line. Among the single-parent households, those with 1 or 2 children have the highest poverty rate, with 93 household (44.5%) living below poverty.
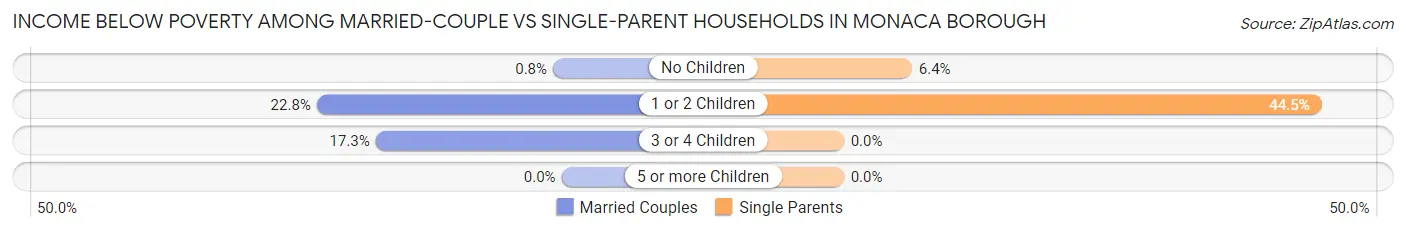
| Children | Married-Couple Families | Single-Parent Households |
| No Children | 4 (0.8%) | 12 (6.4%) |
| 1 or 2 Children | 75 (22.8%) | 93 (44.5%) |
| 3 or 4 Children | 22 (17.3%) | 0 (0.0%) |
| 5 or more Children | 0 (0.0%) | 0 (0.0%) |
| Total | 101 (10.6%) | 105 (26.4%) |
Race in Monaca borough
The most populous races in Monaca borough are White / Caucasian (4,930 | 88.2%), Two or more Races (322 | 5.8%), and Hispanic or Latino (179 | 3.2%).
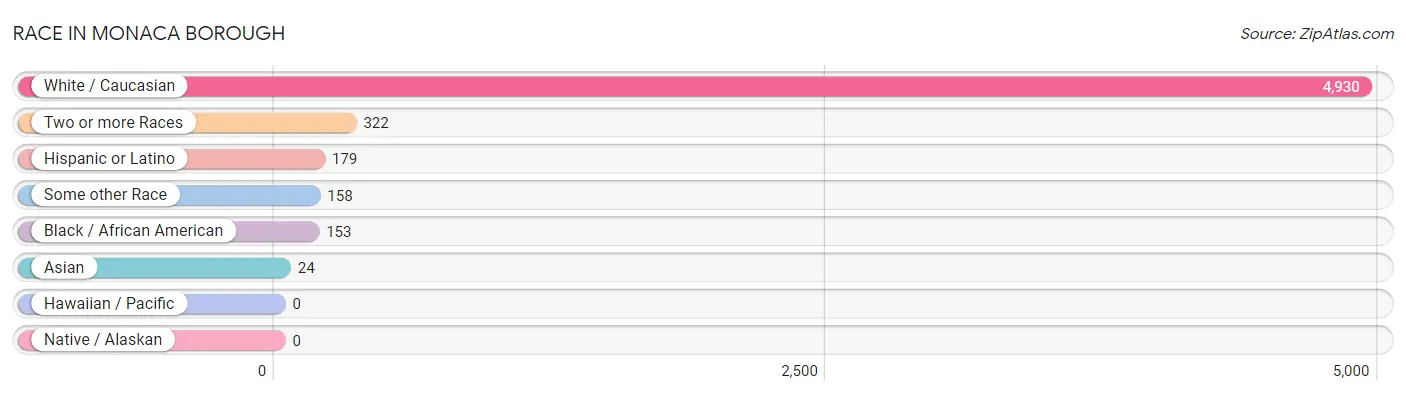
| Race | # Population | % Population |
| Asian | 24 | 0.4% |
| Black / African American | 153 | 2.7% |
| Hawaiian / Pacific | 0 | 0.0% |
| Hispanic or Latino | 179 | 3.2% |
| Native / Alaskan | 0 | 0.0% |
| White / Caucasian | 4,930 | 88.2% |
| Two or more Races | 322 | 5.8% |
| Some other Race | 158 | 2.8% |
| Total | 5,587 | 100.0% |
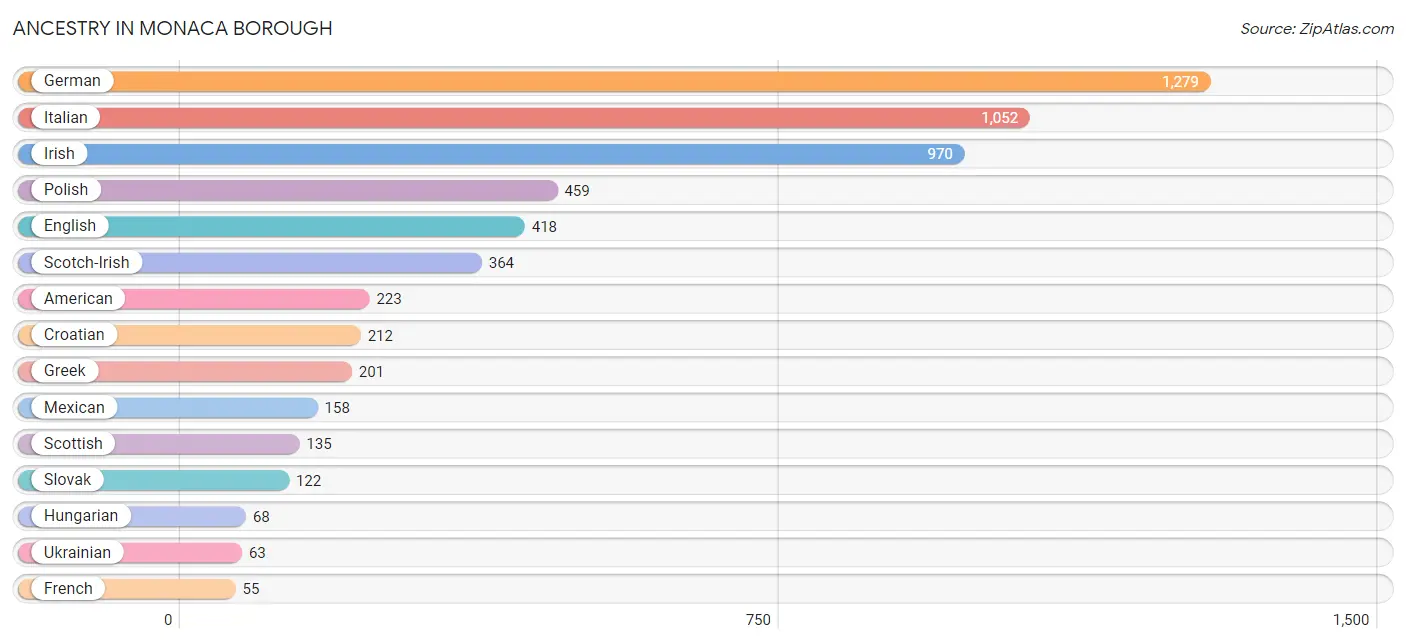
Ancestry in Monaca borough
The most populous ancestries reported in Monaca borough are German (1,279 | 22.9%), Italian (1,052 | 18.8%), Irish (970 | 17.4%), Polish (459 | 8.2%), and English (418 | 7.5%), together accounting for 74.8% of all Monaca borough residents.
| Ancestry | # Population | % Population |
| African | 6 | 0.1% |
| American | 223 | 4.0% |
| Austrian | 28 | 0.5% |
| Belgian | 38 | 0.7% |
| British | 12 | 0.2% |
| Cherokee | 17 | 0.3% |
| Croatian | 212 | 3.8% |
| Czech | 26 | 0.5% |
| Czechoslovakian | 13 | 0.2% |
| Danish | 1 | 0.0% |
| Dominican | 9 | 0.2% |
| Dutch | 21 | 0.4% |
| Eastern European | 10 | 0.2% |
| English | 418 | 7.5% |
| European | 19 | 0.3% |
| French | 55 | 1.0% |
| French Canadian | 18 | 0.3% |
| German | 1,279 | 22.9% |
| Greek | 201 | 3.6% |
| Hungarian | 68 | 1.2% |
| Indian (Asian) | 25 | 0.4% |
| Irish | 970 | 17.4% |
| Italian | 1,052 | 18.8% |
| Lithuanian | 50 | 0.9% |
| Mexican | 158 | 2.8% |
| Nigerian | 16 | 0.3% |
| Northern European | 12 | 0.2% |
| Norwegian | 6 | 0.1% |
| Pennsylvania German | 14 | 0.3% |
| Peruvian | 2 | 0.0% |
| Polish | 459 | 8.2% |
| Portuguese | 24 | 0.4% |
| Puerto Rican | 10 | 0.2% |
| Romanian | 12 | 0.2% |
| Russian | 6 | 0.1% |
| Scandinavian | 24 | 0.4% |
| Scotch-Irish | 364 | 6.5% |
| Scottish | 135 | 2.4% |
| Serbian | 26 | 0.5% |
| Sioux | 24 | 0.4% |
| Slovak | 122 | 2.2% |
| Slovene | 7 | 0.1% |
| South American | 2 | 0.0% |
| Subsaharan African | 22 | 0.4% |
| Swedish | 15 | 0.3% |
| Ukrainian | 63 | 1.1% |
| Welsh | 41 | 0.7% | View All 47 Rows |
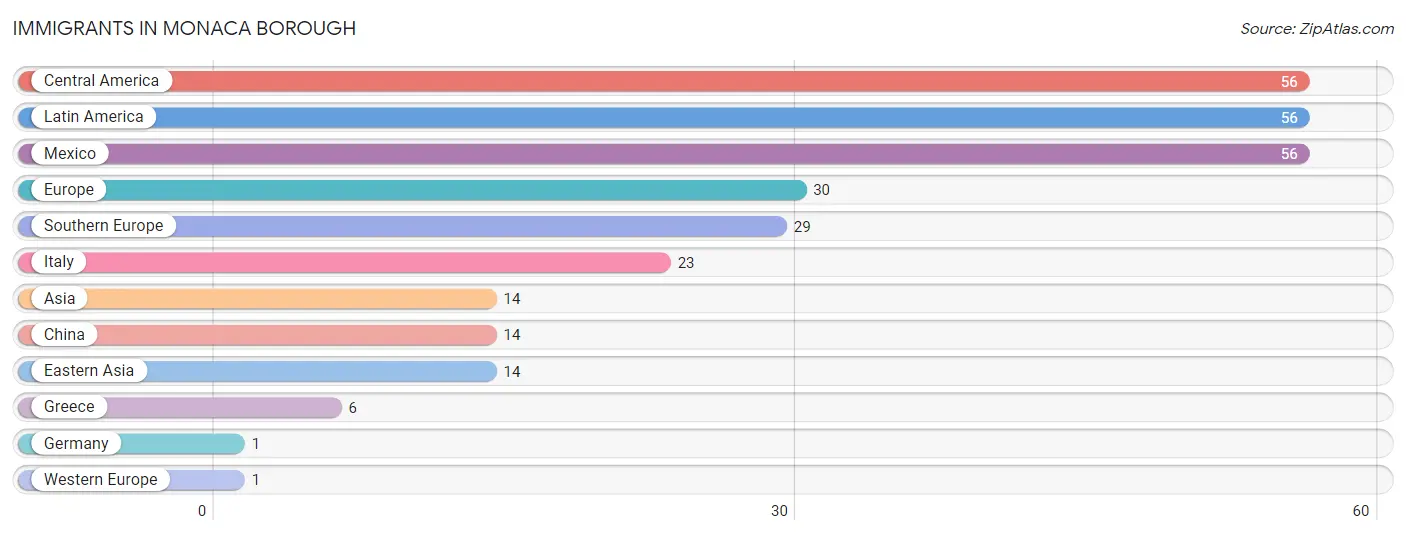
Immigrants in Monaca borough
The most numerous immigrant groups reported in Monaca borough came from Central America (56 | 1.0%), Latin America (56 | 1.0%), Mexico (56 | 1.0%), Europe (30 | 0.5%), and Southern Europe (29 | 0.5%), together accounting for 4.1% of all Monaca borough residents.
| Immigration Origin | # Population | % Population |
| Asia | 14 | 0.3% |
| Central America | 56 | 1.0% |
| China | 14 | 0.3% |
| Eastern Asia | 14 | 0.3% |
| Europe | 30 | 0.5% |
| Germany | 1 | 0.0% |
| Greece | 6 | 0.1% |
| Italy | 23 | 0.4% |
| Latin America | 56 | 1.0% |
| Mexico | 56 | 1.0% |
| Southern Europe | 29 | 0.5% |
| Western Europe | 1 | 0.0% | View All 12 Rows |
Sex and Age in Monaca borough
Sex and Age in Monaca borough
The most populous age groups in Monaca borough are 50 to 54 Years (253 | 9.3%) for men and 10 to 14 Years (284 | 9.9%) for women.
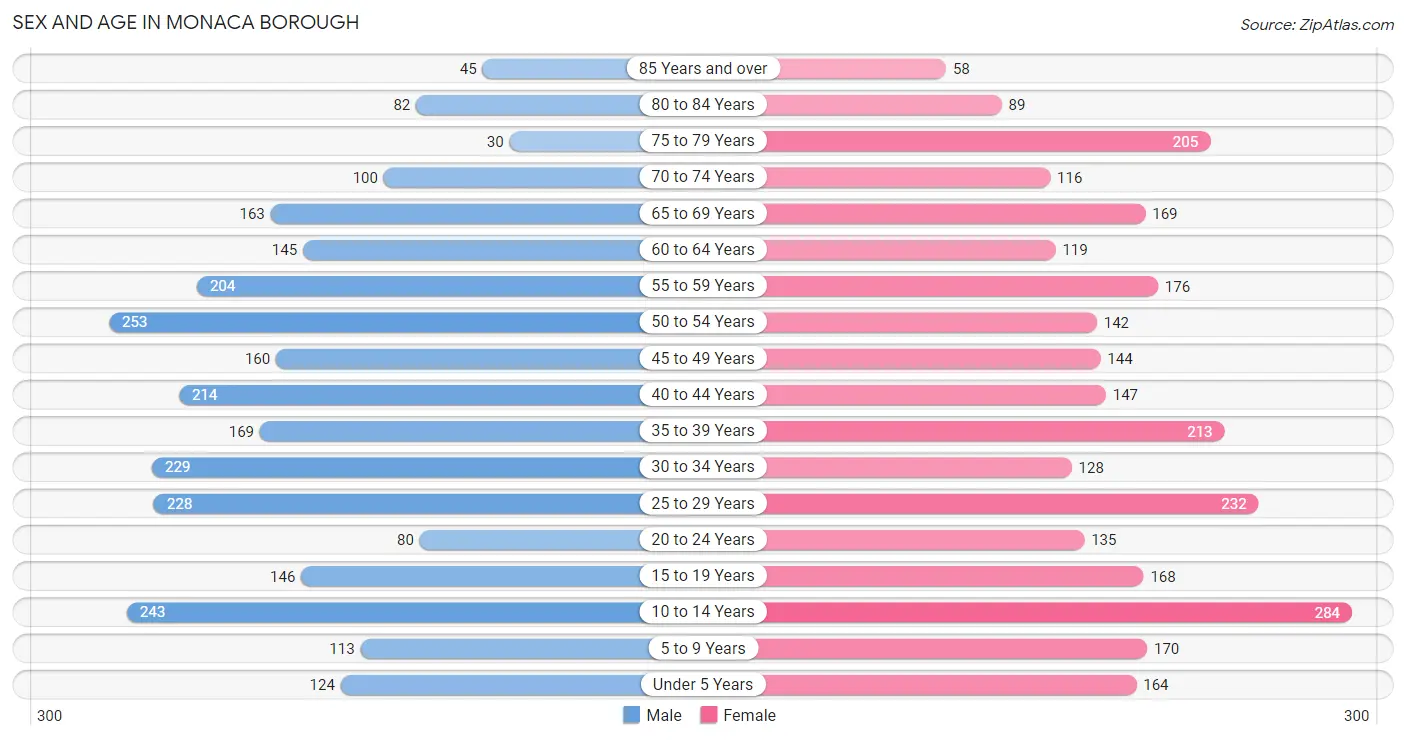
| Age Bracket | Male | Female |
| Under 5 Years | 124 (4.5%) | 164 (5.7%) |
| 5 to 9 Years | 113 (4.1%) | 170 (5.9%) |
| 10 to 14 Years | 243 (8.9%) | 284 (9.9%) |
| 15 to 19 Years | 146 (5.3%) | 168 (5.9%) |
| 20 to 24 Years | 80 (2.9%) | 135 (4.7%) |
| 25 to 29 Years | 228 (8.4%) | 232 (8.1%) |
| 30 to 34 Years | 229 (8.4%) | 128 (4.5%) |
| 35 to 39 Years | 169 (6.2%) | 213 (7.4%) |
| 40 to 44 Years | 214 (7.8%) | 147 (5.1%) |
| 45 to 49 Years | 160 (5.9%) | 144 (5.0%) |
| 50 to 54 Years | 253 (9.3%) | 142 (5.0%) |
| 55 to 59 Years | 204 (7.5%) | 176 (6.2%) |
| 60 to 64 Years | 145 (5.3%) | 119 (4.2%) |
| 65 to 69 Years | 163 (6.0%) | 169 (5.9%) |
| 70 to 74 Years | 100 (3.7%) | 116 (4.1%) |
| 75 to 79 Years | 30 (1.1%) | 205 (7.2%) |
| 80 to 84 Years | 82 (3.0%) | 89 (3.1%) |
| 85 Years and over | 45 (1.7%) | 58 (2.0%) |
| Total | 2,728 (100.0%) | 2,859 (100.0%) |
Families and Households in Monaca borough
Median Family Size in Monaca borough
The median family size in Monaca borough is 3.11 persons per family, with single male/father families (93 | 6.9%) accounting for the largest median family size of 3.47 persons per family. On the other hand, single female/mother families (305 | 22.5%) represent the smallest median family size with 2.58 persons per family.
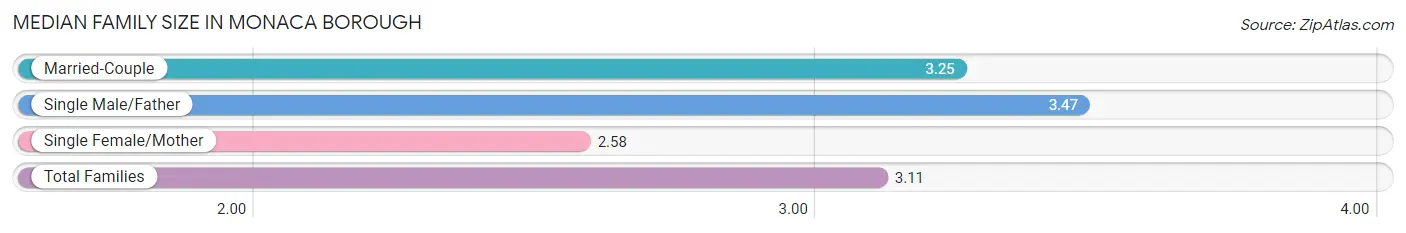
| Family Type | # Families | Family Size |
| Married-Couple | 955 (70.6%) | 3.25 |
| Single Male/Father | 93 (6.9%) | 3.47 |
| Single Female/Mother | 305 (22.5%) | 2.58 |
| Total Families | 1,353 (100.0%) | 3.11 |
Median Household Size in Monaca borough
The median household size in Monaca borough is 2.31 persons per household, with single male/father households (93 | 3.8%) accounting for the largest median household size of 3.73 persons per household. non-family households (1,065 | 44.0%) represent the smallest median household size with 1.18 persons per household.
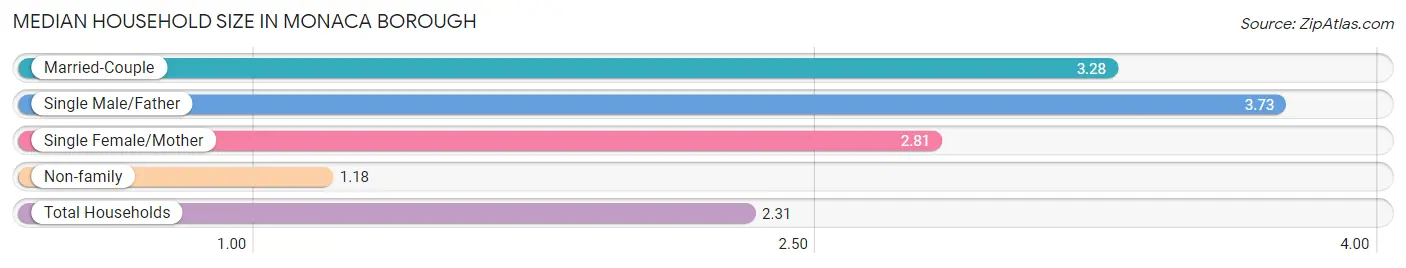
| Household Type | # Households | Household Size |
| Married-Couple | 955 (39.5%) | 3.28 |
| Single Male/Father | 93 (3.8%) | 3.73 |
| Single Female/Mother | 305 (12.6%) | 2.81 |
| Non-family | 1,065 (44.0%) | 1.18 |
| Total Households | 2,418 (100.0%) | 2.31 |
Household Size by Marriage Status in Monaca borough
Out of a total of 2,418 households in Monaca borough, 1,353 (56.0%) are family households, while 1,065 (44.0%) are nonfamily households. The most numerous type of family households are 2-person households, comprising 508, and the most common type of nonfamily households are 1-person households, comprising 891.
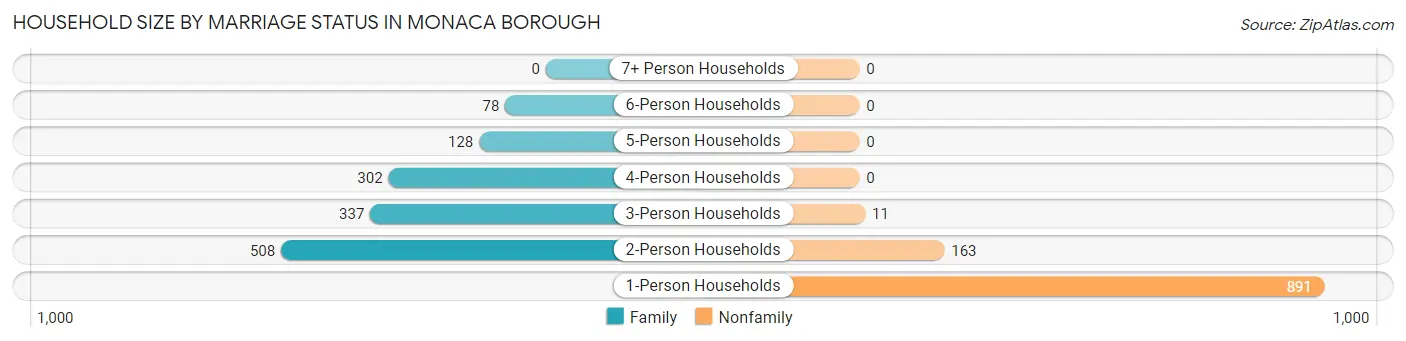
| Household Size | Family Households | Nonfamily Households |
| 1-Person Households | - | 891 (36.8%) |
| 2-Person Households | 508 (21.0%) | 163 (6.7%) |
| 3-Person Households | 337 (13.9%) | 11 (0.4%) |
| 4-Person Households | 302 (12.5%) | 0 (0.0%) |
| 5-Person Households | 128 (5.3%) | 0 (0.0%) |
| 6-Person Households | 78 (3.2%) | 0 (0.0%) |
| 7+ Person Households | 0 (0.0%) | 0 (0.0%) |
| Total | 1,353 (56.0%) | 1,065 (44.0%) |
Female Fertility in Monaca borough
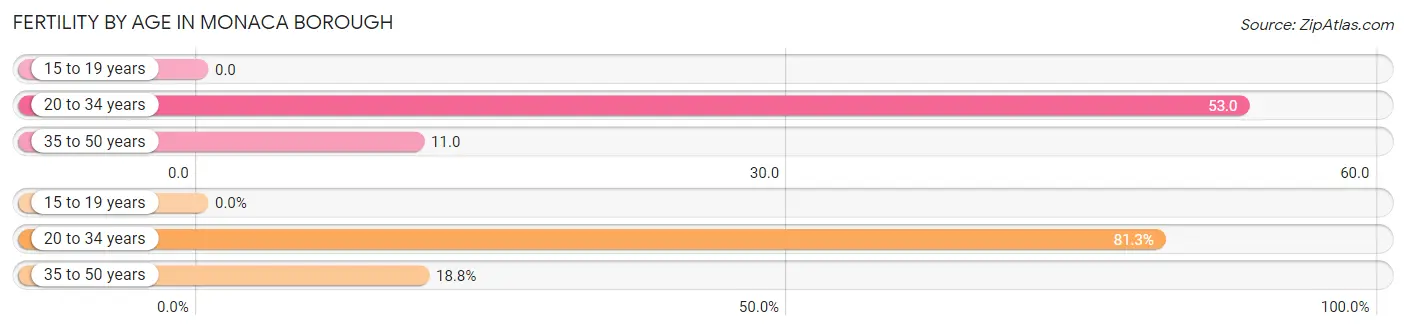
Fertility by Age in Monaca borough
Average fertility rate in Monaca borough is 27.0 births per 1,000 women. Women in the age bracket of 20 to 34 years have the highest fertility rate with 53.0 births per 1,000 women. Women in the age bracket of 20 to 34 years acount for 81.2% of all women with births.
| Age Bracket | Women with Births | Births / 1,000 Women |
| 15 to 19 years | 0 (0.0%) | 0.0 |
| 20 to 34 years | 26 (81.2%) | 53.0 |
| 35 to 50 years | 6 (18.8%) | 11.0 |
| Total | 32 (100.0%) | 27.0 |
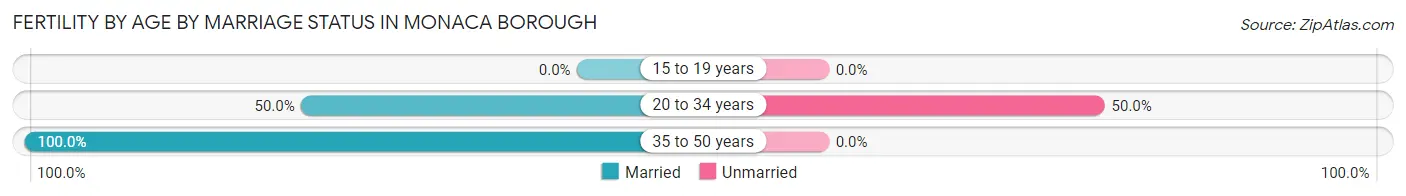
Fertility by Age by Marriage Status in Monaca borough
59.4% of women with births (32) in Monaca borough are married. The highest percentage of unmarried women with births falls into 20 to 34 years age bracket with 50.0% of them unmarried at the time of birth, while the lowest percentage of unmarried women with births belong to 35 to 50 years age bracket with 0.0% of them unmarried.
| Age Bracket | Married | Unmarried |
| 15 to 19 years | 0 (0.0%) | 0 (0.0%) |
| 20 to 34 years | 13 (50.0%) | 13 (50.0%) |
| 35 to 50 years | 6 (100.0%) | 0 (0.0%) |
| Total | 19 (59.4%) | 13 (40.6%) |
Fertility by Education in Monaca borough
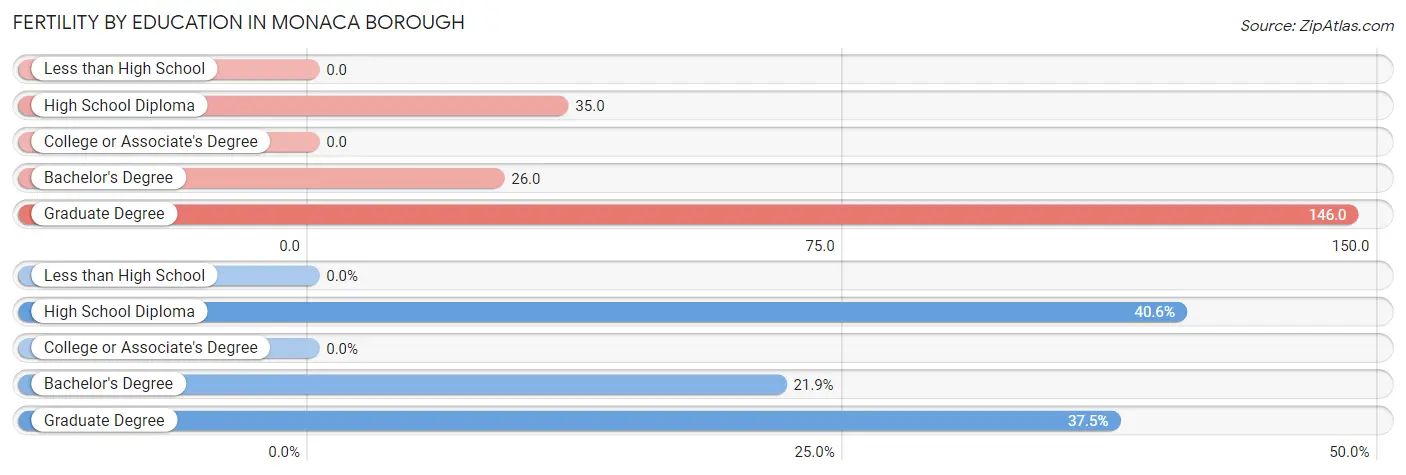
| Educational Attainment | Women with Births | Births / 1,000 Women |
| Less than High School | 0 (0.0%) | 0.0 |
| High School Diploma | 13 (40.6%) | 35.0 |
| College or Associate's Degree | 0 (0.0%) | 0.0 |
| Bachelor's Degree | 7 (21.9%) | 26.0 |
| Graduate Degree | 12 (37.5%) | 146.0 |
| Total | 32 (100.0%) | 27.0 |
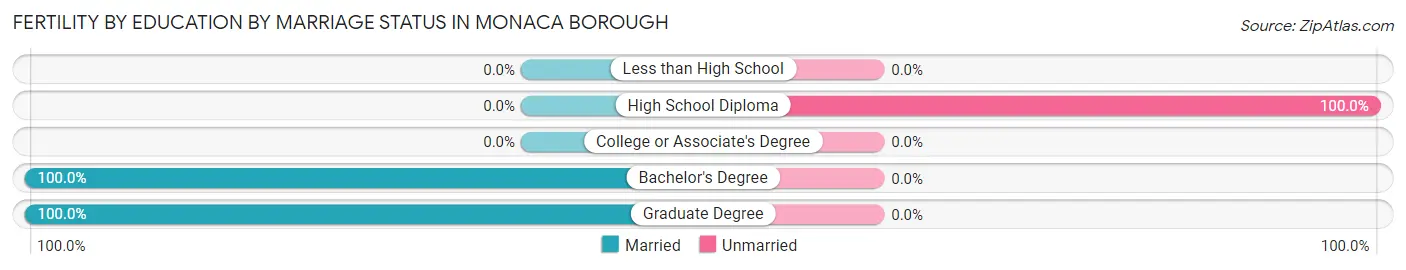
Fertility by Education by Marriage Status in Monaca borough
40.6% of women with births in Monaca borough are unmarried. Women with the educational attainment of bachelor's degree are most likely to be married with 100.0% of them married at childbirth, while women with the educational attainment of high school diploma are least likely to be married with 100.0% of them unmarried at childbirth.
| Educational Attainment | Married | Unmarried |
| Less than High School | 0 (0.0%) | 0 (0.0%) |
| High School Diploma | 0 (0.0%) | 13 (100.0%) |
| College or Associate's Degree | 0 (0.0%) | 0 (0.0%) |
| Bachelor's Degree | 7 (100.0%) | 0 (0.0%) |
| Graduate Degree | 12 (100.0%) | 0 (0.0%) |
| Total | 19 (59.4%) | 13 (40.6%) |
Employment Characteristics in Monaca borough
Employment by Class of Employer in Monaca borough
Among the 2,685 employed individuals in Monaca borough, private company employees (1,905 | 71.0%), not-for-profit organizations (336 | 12.5%), and local government employees (193 | 7.2%) make up the most common classes of employment.
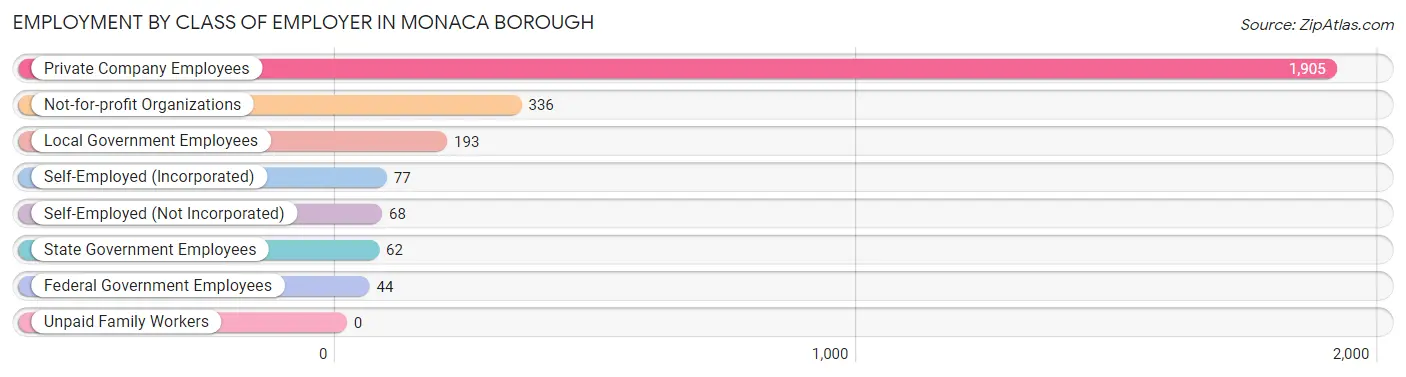
| Employer Class | # Employees | % Employees |
| Private Company Employees | 1,905 | 71.0% |
| Self-Employed (Incorporated) | 77 | 2.9% |
| Self-Employed (Not Incorporated) | 68 | 2.5% |
| Not-for-profit Organizations | 336 | 12.5% |
| Local Government Employees | 193 | 7.2% |
| State Government Employees | 62 | 2.3% |
| Federal Government Employees | 44 | 1.6% |
| Unpaid Family Workers | 0 | 0.0% |
| Total | 2,685 | 100.0% |
Employment Status by Age in Monaca borough
According to the labor force statistics for Monaca borough, out of the total population over 16 years of age (4,416), 67.0% or 2,959 individuals are in the labor force, with 7.2% or 213 of them unemployed. The age group with the highest labor force participation rate is 20 to 24 years, with 92.6% or 199 individuals in the labor force. Within the labor force, the 25 to 29 years age range has the highest percentage of unemployed individuals, with 12.0% or 47 of them being unemployed.
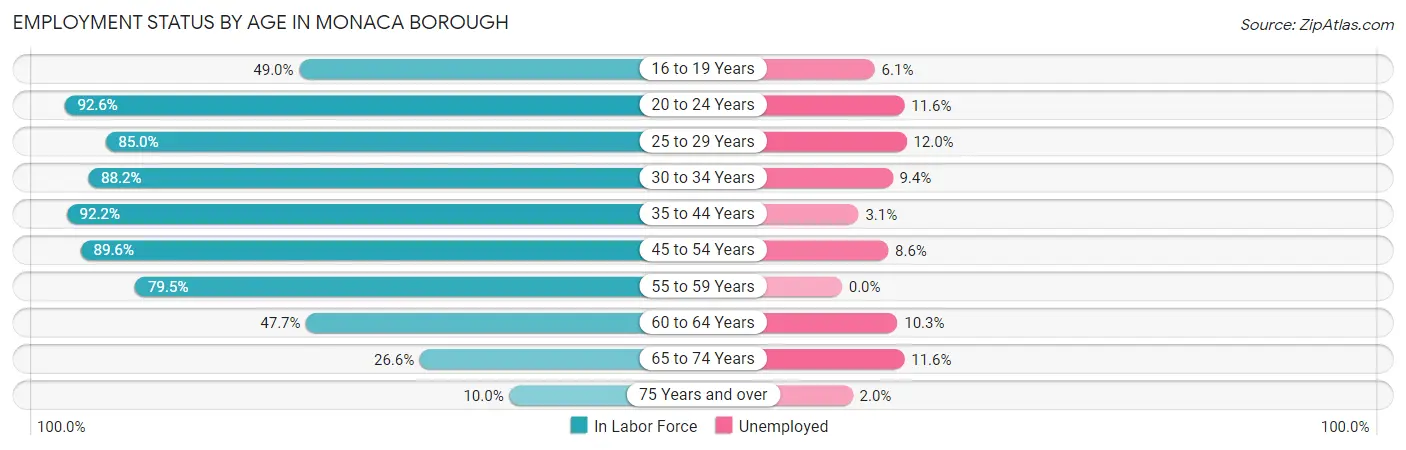
| Age Bracket | In Labor Force | Unemployed |
| 16 to 19 Years | 118 (49.0%) | 7 (6.1%) |
| 20 to 24 Years | 199 (92.6%) | 23 (11.6%) |
| 25 to 29 Years | 391 (85.0%) | 47 (12.0%) |
| 30 to 34 Years | 315 (88.2%) | 30 (9.4%) |
| 35 to 44 Years | 685 (92.2%) | 21 (3.1%) |
| 45 to 54 Years | 626 (89.6%) | 54 (8.6%) |
| 55 to 59 Years | 302 (79.5%) | 0 (0.0%) |
| 60 to 64 Years | 126 (47.7%) | 13 (10.3%) |
| 65 to 74 Years | 146 (26.6%) | 17 (11.6%) |
| 75 Years and over | 51 (10.0%) | 1 (2.0%) |
| Total | 2,959 (67.0%) | 213 (7.2%) |
Employment Status by Educational Attainment in Monaca borough
According to labor force statistics for Monaca borough, 84.2% of individuals (2,444) out of the total population between 25 and 64 years of age (2,903) are in the labor force, with 6.7% or 164 of them being unemployed. The group with the highest labor force participation rate are those with the educational attainment of bachelor's degree or higher, with 94.5% or 812 individuals in the labor force. Within the labor force, individuals with high school diploma education have the highest percentage of unemployment, with 14.0% or 89 of them being unemployed.
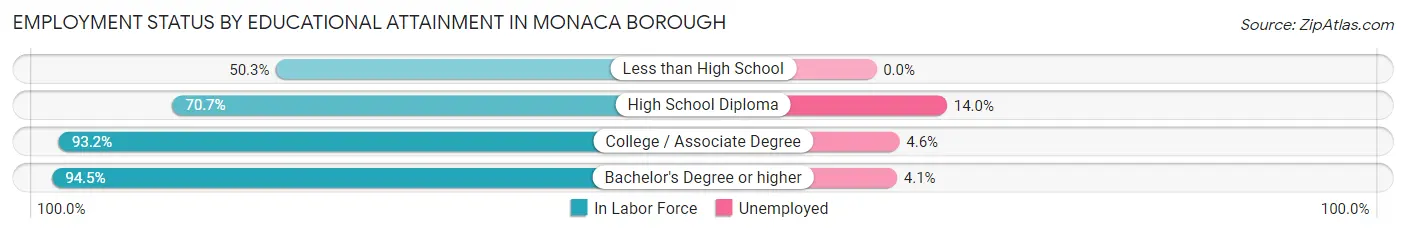
| Educational Attainment | In Labor Force | Unemployed |
| Less than High School | 82 (50.3%) | 0 (0.0%) |
| High School Diploma | 636 (70.7%) | 126 (14.0%) |
| College / Associate Degree | 915 (93.2%) | 45 (4.6%) |
| Bachelor's Degree or higher | 812 (94.5%) | 35 (4.1%) |
| Total | 2,444 (84.2%) | 195 (6.7%) |
Employment Occupations by Sex in Monaca borough
Management, Business, Science and Arts Occupations
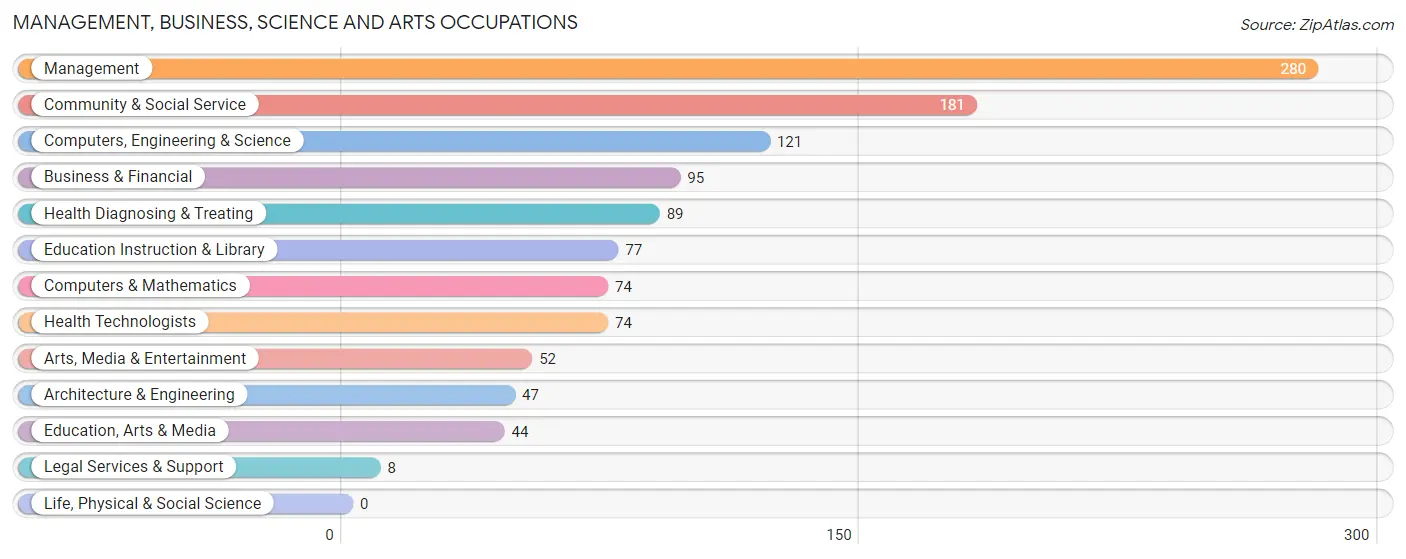
The most common Management, Business, Science and Arts occupations in Monaca borough are Management (280 | 10.3%), Community & Social Service (181 | 6.6%), Computers, Engineering & Science (121 | 4.4%), Business & Financial (95 | 3.5%), and Health Diagnosing & Treating (89 | 3.3%).
Management, Business, Science and Arts Occupations by Sex
Within the Management, Business, Science and Arts occupations in Monaca borough, the most male-oriented occupations are Architecture & Engineering (100.0%), Legal Services & Support (100.0%), and Computers, Engineering & Science (89.3%), while the most female-oriented occupations are Health Diagnosing & Treating (87.6%), Health Technologists (85.1%), and Education, Arts & Media (81.8%).
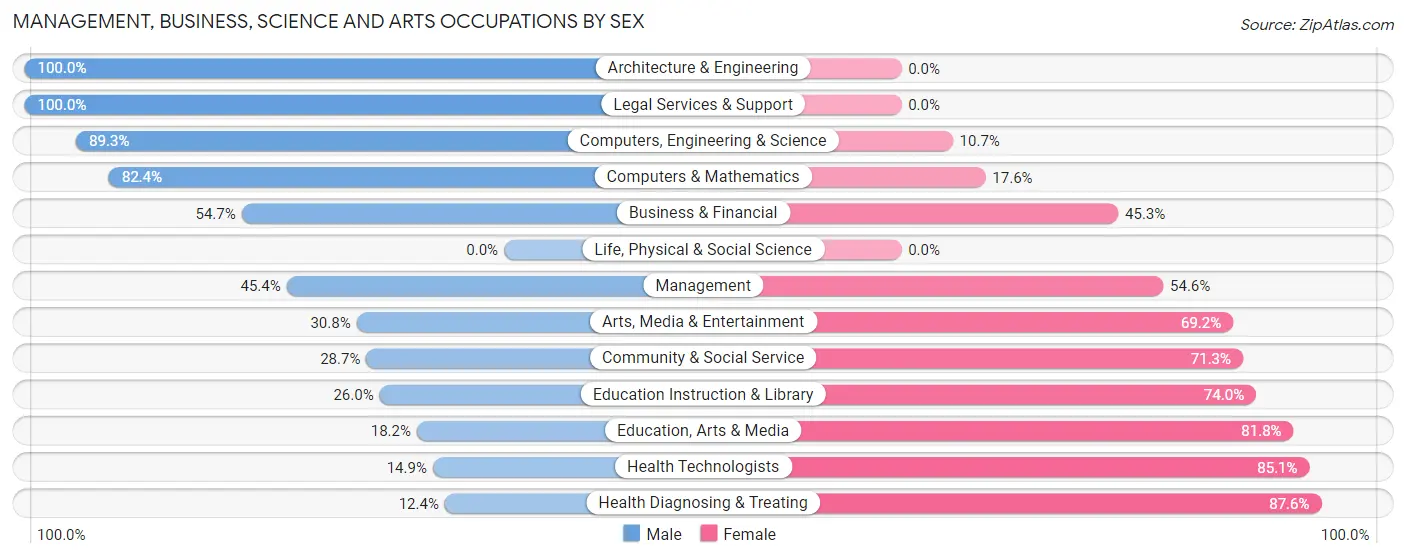
| Occupation | Male | Female |
| Management | 127 (45.4%) | 153 (54.6%) |
| Business & Financial | 52 (54.7%) | 43 (45.3%) |
| Computers, Engineering & Science | 108 (89.3%) | 13 (10.7%) |
| Computers & Mathematics | 61 (82.4%) | 13 (17.6%) |
| Architecture & Engineering | 47 (100.0%) | 0 (0.0%) |
| Life, Physical & Social Science | 0 (0.0%) | 0 (0.0%) |
| Community & Social Service | 52 (28.7%) | 129 (71.3%) |
| Education, Arts & Media | 8 (18.2%) | 36 (81.8%) |
| Legal Services & Support | 8 (100.0%) | 0 (0.0%) |
| Education Instruction & Library | 20 (26.0%) | 57 (74.0%) |
| Arts, Media & Entertainment | 16 (30.8%) | 36 (69.2%) |
| Health Diagnosing & Treating | 11 (12.4%) | 78 (87.6%) |
| Health Technologists | 11 (14.9%) | 63 (85.1%) |
| Total (Category) | 350 (45.7%) | 416 (54.3%) |
| Total (Overall) | 1,438 (52.7%) | 1,290 (47.3%) |
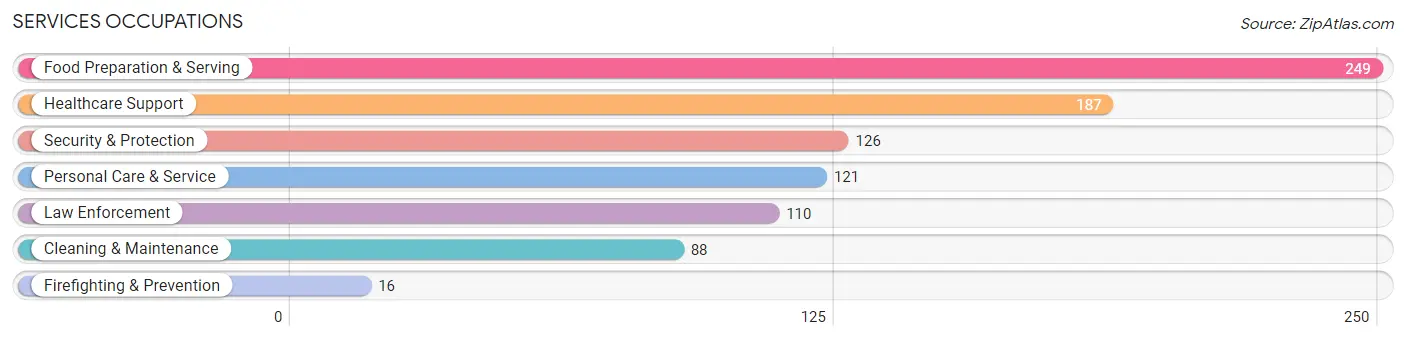
Services Occupations
The most common Services occupations in Monaca borough are Food Preparation & Serving (249 | 9.1%), Healthcare Support (187 | 6.9%), Security & Protection (126 | 4.6%), Personal Care & Service (121 | 4.4%), and Law Enforcement (110 | 4.0%).
Services Occupations by Sex
Within the Services occupations in Monaca borough, the most male-oriented occupations are Firefighting & Prevention (100.0%), Cleaning & Maintenance (100.0%), and Security & Protection (92.1%), while the most female-oriented occupations are Healthcare Support (95.2%), Personal Care & Service (68.6%), and Food Preparation & Serving (38.2%).
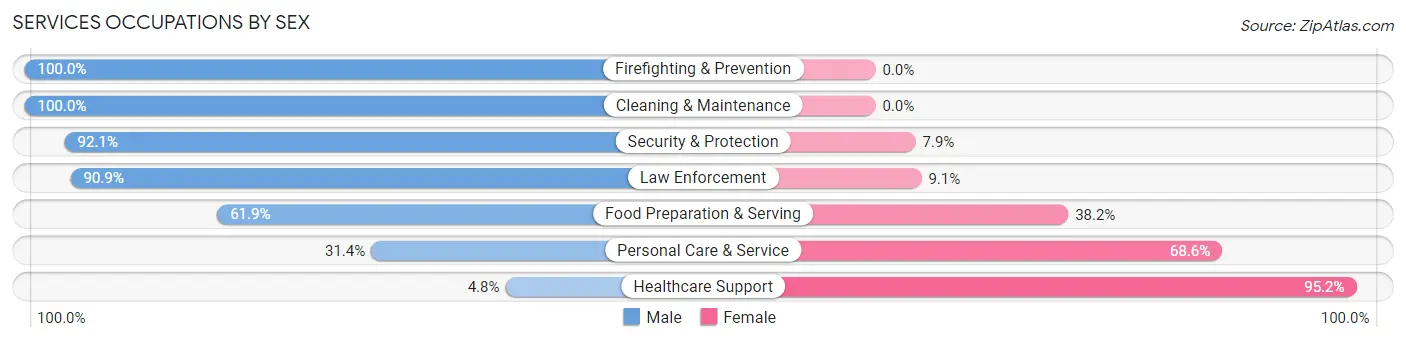
| Occupation | Male | Female |
| Healthcare Support | 9 (4.8%) | 178 (95.2%) |
| Security & Protection | 116 (92.1%) | 10 (7.9%) |
| Firefighting & Prevention | 16 (100.0%) | 0 (0.0%) |
| Law Enforcement | 100 (90.9%) | 10 (9.1%) |
| Food Preparation & Serving | 154 (61.9%) | 95 (38.2%) |
| Cleaning & Maintenance | 88 (100.0%) | 0 (0.0%) |
| Personal Care & Service | 38 (31.4%) | 83 (68.6%) |
| Total (Category) | 405 (52.5%) | 366 (47.5%) |
| Total (Overall) | 1,438 (52.7%) | 1,290 (47.3%) |
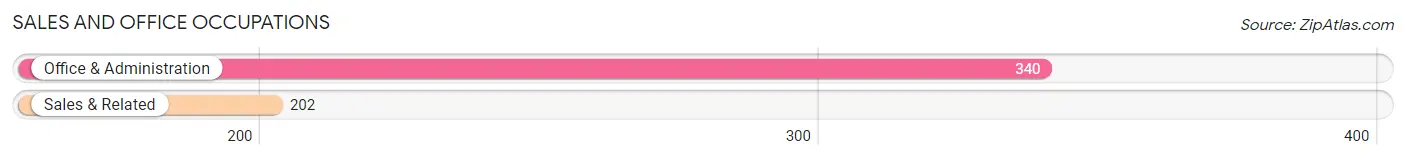
Sales and Office Occupations
The most common Sales and Office occupations in Monaca borough are Office & Administration (340 | 12.5%), and Sales & Related (202 | 7.4%).
Sales and Office Occupations by Sex
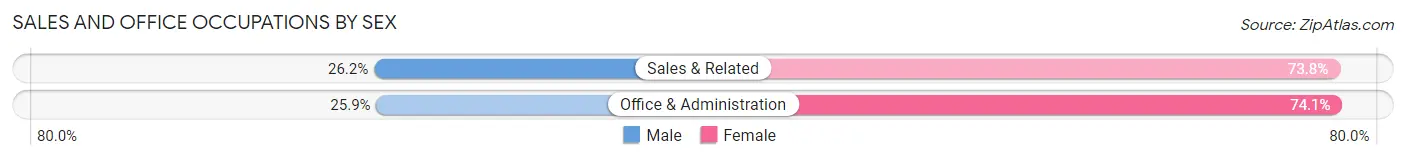
| Occupation | Male | Female |
| Sales & Related | 53 (26.2%) | 149 (73.8%) |
| Office & Administration | 88 (25.9%) | 252 (74.1%) |
| Total (Category) | 141 (26.0%) | 401 (74.0%) |
| Total (Overall) | 1,438 (52.7%) | 1,290 (47.3%) |
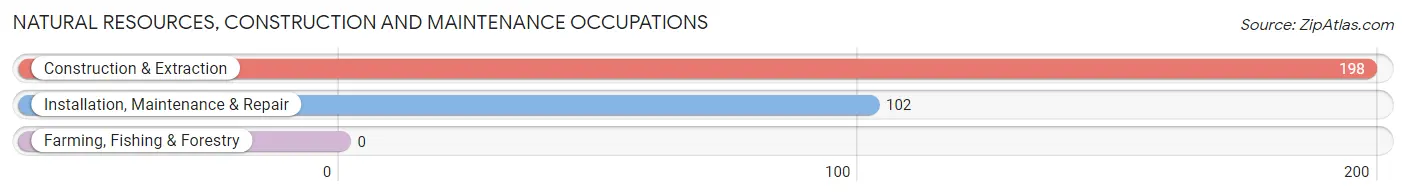
Natural Resources, Construction and Maintenance Occupations
The most common Natural Resources, Construction and Maintenance occupations in Monaca borough are Construction & Extraction (198 | 7.3%), and Installation, Maintenance & Repair (102 | 3.7%).
Natural Resources, Construction and Maintenance Occupations by Sex
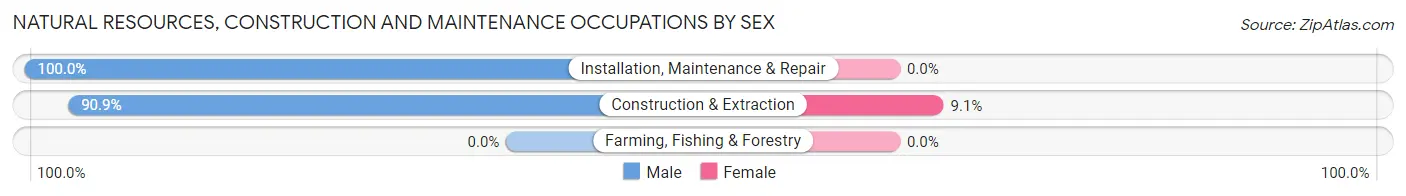
| Occupation | Male | Female |
| Farming, Fishing & Forestry | 0 (0.0%) | 0 (0.0%) |
| Construction & Extraction | 180 (90.9%) | 18 (9.1%) |
| Installation, Maintenance & Repair | 102 (100.0%) | 0 (0.0%) |
| Total (Category) | 282 (94.0%) | 18 (6.0%) |
| Total (Overall) | 1,438 (52.7%) | 1,290 (47.3%) |
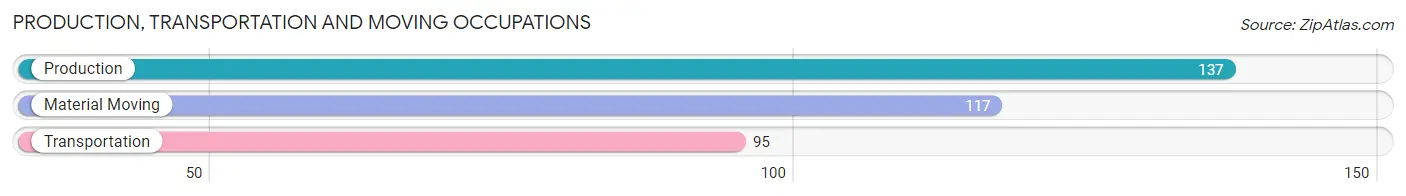
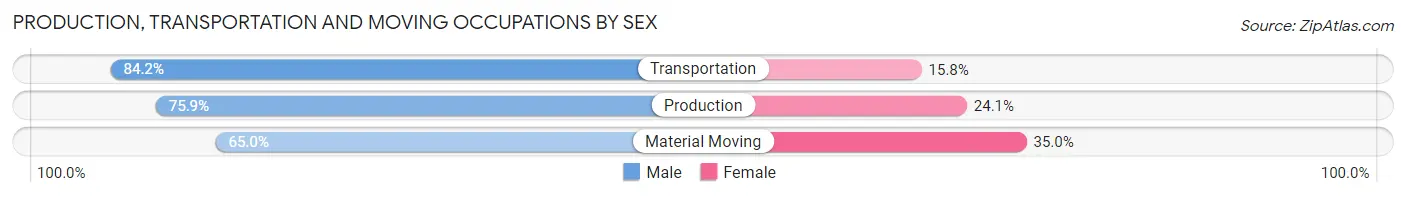
Production, Transportation and Moving Occupations
The most common Production, Transportation and Moving occupations in Monaca borough are Production (137 | 5.0%), Material Moving (117 | 4.3%), and Transportation (95 | 3.5%).
Production, Transportation and Moving Occupations by Sex
| Occupation | Male | Female |
| Production | 104 (75.9%) | 33 (24.1%) |
| Transportation | 80 (84.2%) | 15 (15.8%) |
| Material Moving | 76 (65.0%) | 41 (35.0%) |
| Total (Category) | 260 (74.5%) | 89 (25.5%) |
| Total (Overall) | 1,438 (52.7%) | 1,290 (47.3%) |
Employment Industries by Sex in Monaca borough
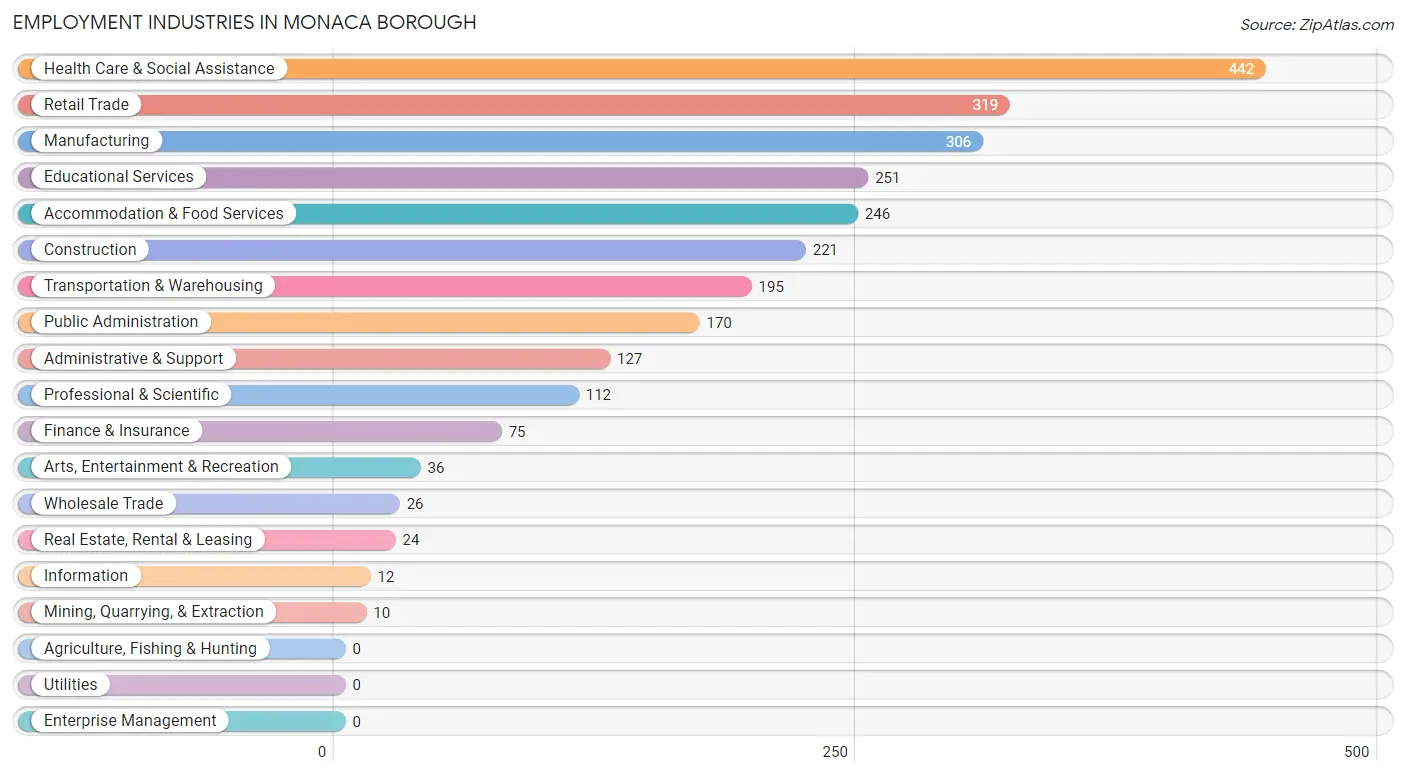
Employment Industries in Monaca borough
The major employment industries in Monaca borough include Health Care & Social Assistance (442 | 16.2%), Retail Trade (319 | 11.7%), Manufacturing (306 | 11.2%), Educational Services (251 | 9.2%), and Accommodation & Food Services (246 | 9.0%).
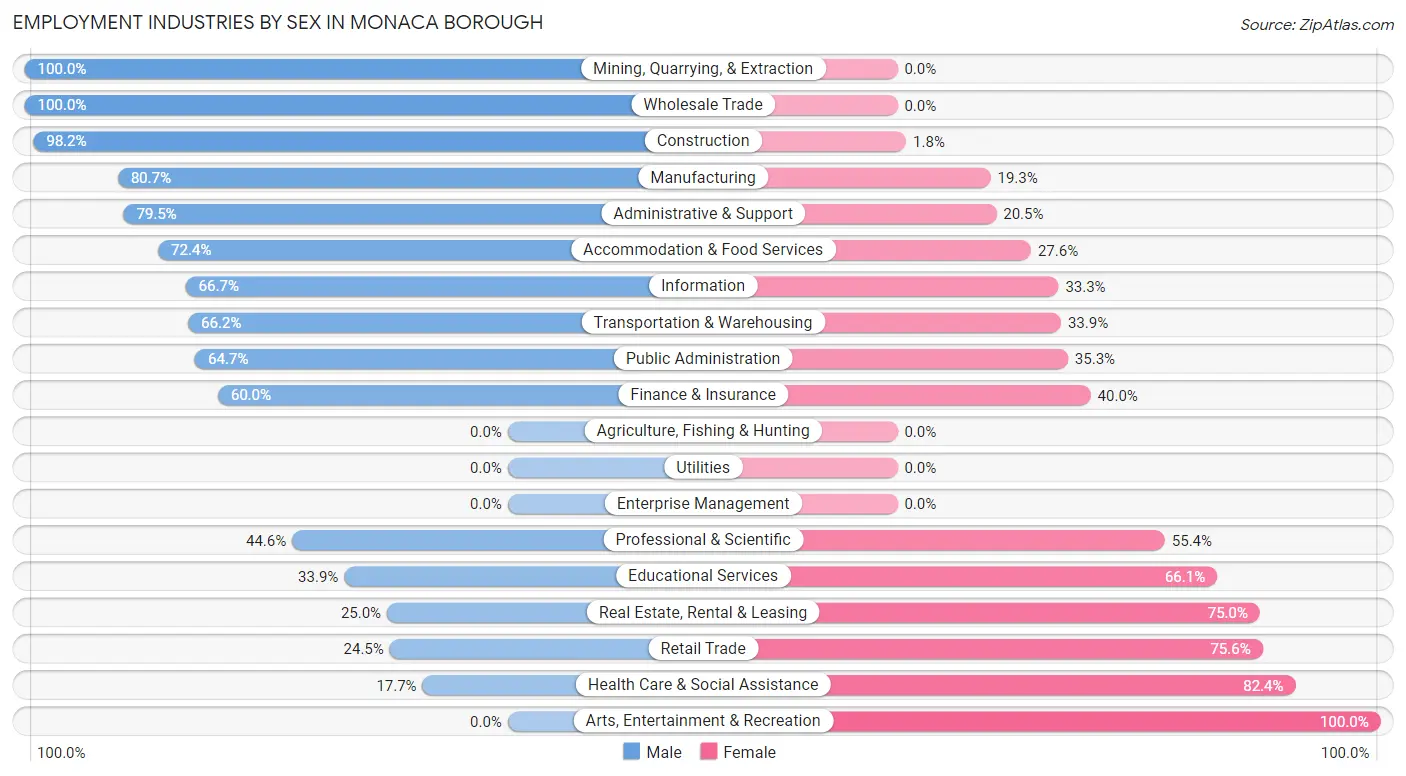
Employment Industries by Sex in Monaca borough
The Monaca borough industries that see more men than women are Mining, Quarrying, & Extraction (100.0%), Wholesale Trade (100.0%), and Construction (98.2%), whereas the industries that tend to have a higher number of women are Arts, Entertainment & Recreation (100.0%), Health Care & Social Assistance (82.4%), and Retail Trade (75.5%).
| Industry | Male | Female |
| Agriculture, Fishing & Hunting | 0 (0.0%) | 0 (0.0%) |
| Mining, Quarrying, & Extraction | 10 (100.0%) | 0 (0.0%) |
| Construction | 217 (98.2%) | 4 (1.8%) |
| Manufacturing | 247 (80.7%) | 59 (19.3%) |
| Wholesale Trade | 26 (100.0%) | 0 (0.0%) |
| Retail Trade | 78 (24.4%) | 241 (75.5%) |
| Transportation & Warehousing | 129 (66.1%) | 66 (33.9%) |
| Utilities | 0 (0.0%) | 0 (0.0%) |
| Information | 8 (66.7%) | 4 (33.3%) |
| Finance & Insurance | 45 (60.0%) | 30 (40.0%) |
| Real Estate, Rental & Leasing | 6 (25.0%) | 18 (75.0%) |
| Professional & Scientific | 50 (44.6%) | 62 (55.4%) |
| Enterprise Management | 0 (0.0%) | 0 (0.0%) |
| Administrative & Support | 101 (79.5%) | 26 (20.5%) |
| Educational Services | 85 (33.9%) | 166 (66.1%) |
| Health Care & Social Assistance | 78 (17.6%) | 364 (82.4%) |
| Arts, Entertainment & Recreation | 0 (0.0%) | 36 (100.0%) |
| Accommodation & Food Services | 178 (72.4%) | 68 (27.6%) |
| Public Administration | 110 (64.7%) | 60 (35.3%) |
| Total | 1,438 (52.7%) | 1,290 (47.3%) |
Education in Monaca borough
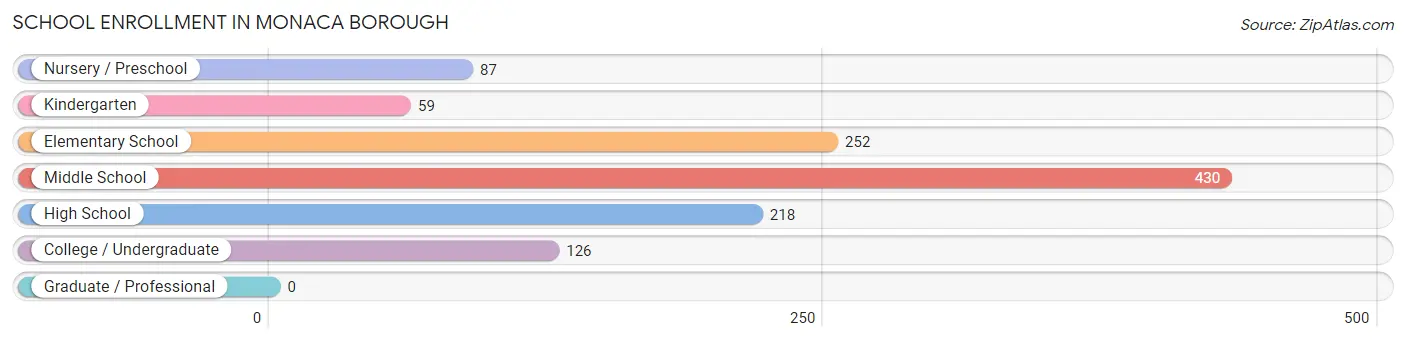
School Enrollment in Monaca borough
The most common levels of schooling among the 1,172 students in Monaca borough are middle school (430 | 36.7%), elementary school (252 | 21.5%), and high school (218 | 18.6%).
| School Level | # Students | % Students |
| Nursery / Preschool | 87 | 7.4% |
| Kindergarten | 59 | 5.0% |
| Elementary School | 252 | 21.5% |
| Middle School | 430 | 36.7% |
| High School | 218 | 18.6% |
| College / Undergraduate | 126 | 10.7% |
| Graduate / Professional | 0 | 0.0% |
| Total | 1,172 | 100.0% |
School Enrollment by Age by Funding Source in Monaca borough
Out of a total of 1,172 students who are enrolled in schools in Monaca borough, 132 (11.3%) attend a private institution, while the remaining 1,040 (88.7%) are enrolled in public schools. The age group of 25 to 34 year olds has the highest likelihood of being enrolled in private schools, with 18 (100.0% in the age bracket) enrolled. Conversely, the age group of 3 to 4 year olds has the lowest likelihood of being enrolled in a private school, with 53 (100.0% in the age bracket) attending a public institution.
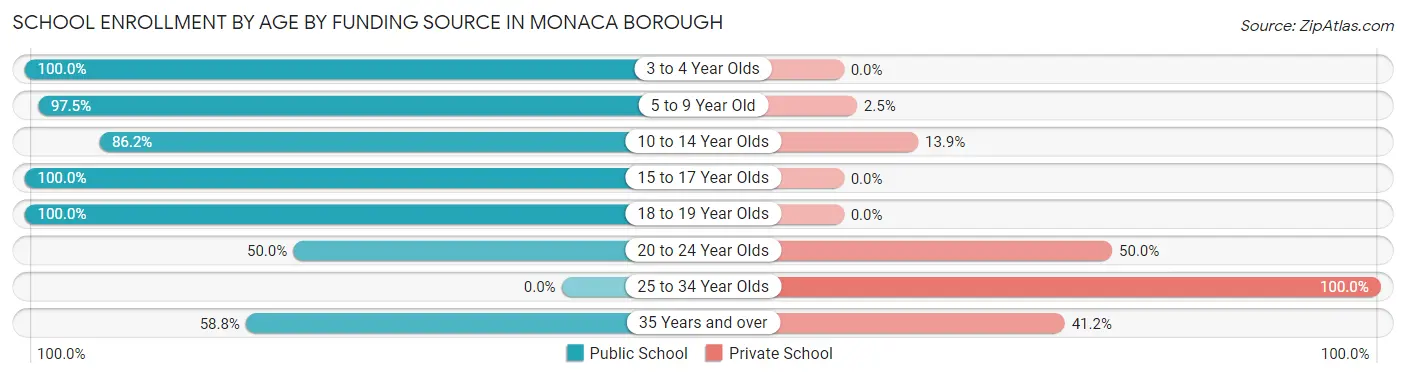
| Age Bracket | Public School | Private School |
| 3 to 4 Year Olds | 53 (100.0%) | 0 (0.0%) |
| 5 to 9 Year Old | 276 (97.5%) | 7 (2.5%) |
| 10 to 14 Year Olds | 454 (86.2%) | 73 (13.9%) |
| 15 to 17 Year Olds | 174 (100.0%) | 0 (0.0%) |
| 18 to 19 Year Olds | 46 (100.0%) | 0 (0.0%) |
| 20 to 24 Year Olds | 27 (50.0%) | 27 (50.0%) |
| 25 to 34 Year Olds | 0 (0.0%) | 18 (100.0%) |
| 35 Years and over | 10 (58.8%) | 7 (41.2%) |
| Total | 1,040 (88.7%) | 132 (11.3%) |
Educational Attainment by Field of Study in Monaca borough
Business (211 | 19.6%), arts & humanities (161 | 14.9%), science & technology (158 | 14.7%), education (109 | 10.1%), and social sciences (98 | 9.1%) are the most common fields of study among 1,078 individuals in Monaca borough who have obtained a bachelor's degree or higher.
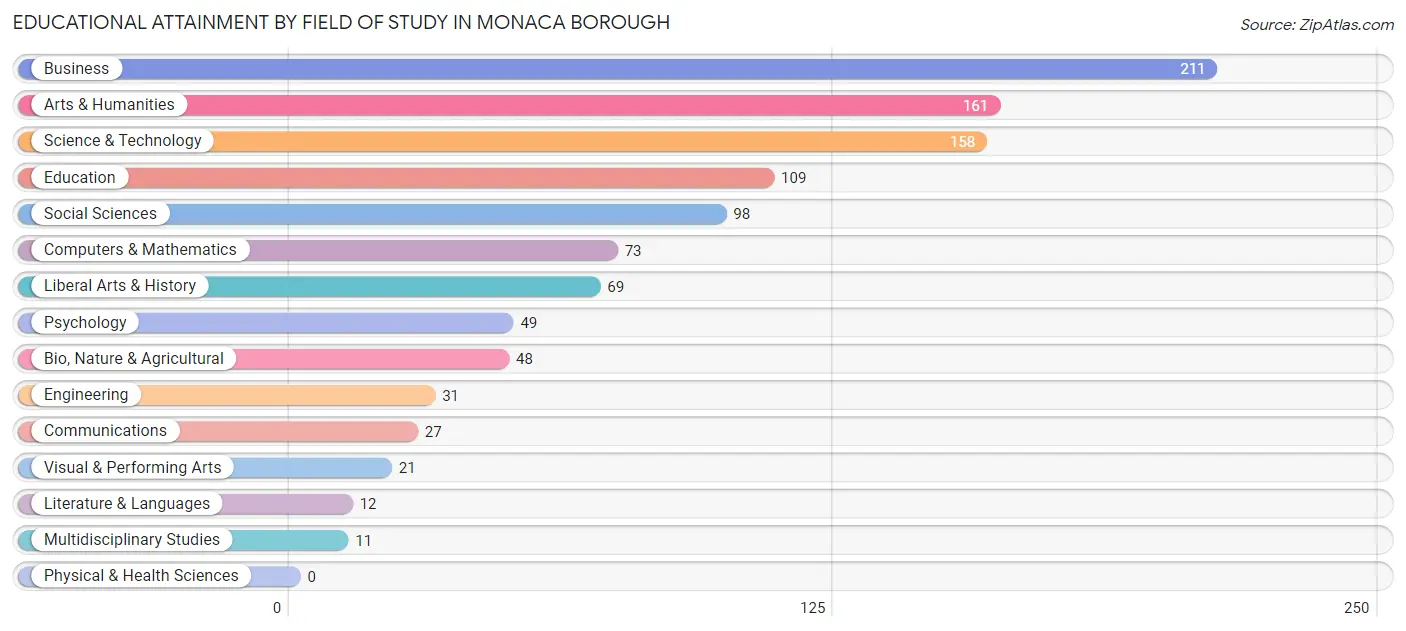
| Field of Study | # Graduates | % Graduates |
| Computers & Mathematics | 73 | 6.8% |
| Bio, Nature & Agricultural | 48 | 4.4% |
| Physical & Health Sciences | 0 | 0.0% |
| Psychology | 49 | 4.5% |
| Social Sciences | 98 | 9.1% |
| Engineering | 31 | 2.9% |
| Multidisciplinary Studies | 11 | 1.0% |
| Science & Technology | 158 | 14.7% |
| Business | 211 | 19.6% |
| Education | 109 | 10.1% |
| Literature & Languages | 12 | 1.1% |
| Liberal Arts & History | 69 | 6.4% |
| Visual & Performing Arts | 21 | 1.9% |
| Communications | 27 | 2.5% |
| Arts & Humanities | 161 | 14.9% |
| Total | 1,078 | 100.0% |
Transportation & Commute in Monaca borough
Vehicle Availability by Sex in Monaca borough
The most prevalent vehicle ownership categories in Monaca borough are males with 2 vehicles (589, accounting for 41.8%) and females with 2 vehicles (496, making up 46.2%).
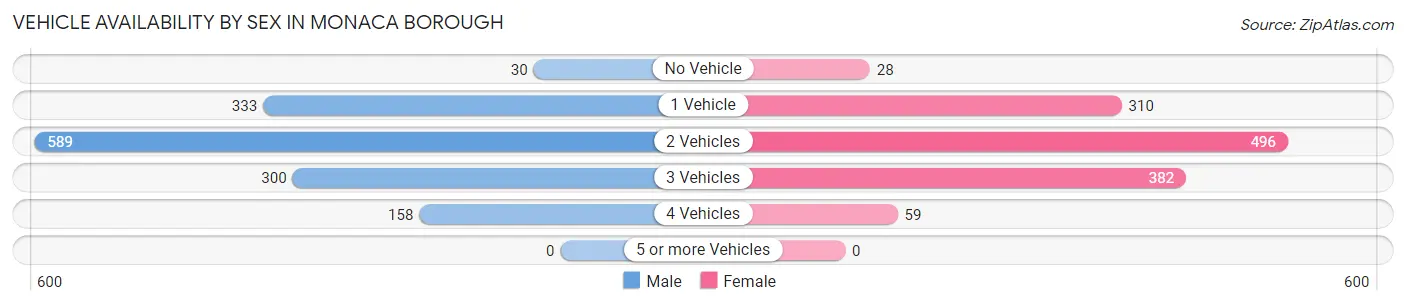
| Vehicles Available | Male | Female |
| No Vehicle | 30 (2.1%) | 28 (2.2%) |
| 1 Vehicle | 333 (23.6%) | 310 (24.3%) |
| 2 Vehicles | 589 (41.8%) | 496 (38.9%) |
| 3 Vehicles | 300 (21.3%) | 382 (30.0%) |
| 4 Vehicles | 158 (11.2%) | 59 (4.6%) |
| 5 or more Vehicles | 0 (0.0%) | 0 (0.0%) |
| Total | 1,410 (100.0%) | 1,275 (100.0%) |
Commute Time in Monaca borough
The most frequently occuring commute durations in Monaca borough are 20 to 24 minutes (428 commuters, 17.8%), 10 to 14 minutes (372 commuters, 15.5%), and 5 to 9 minutes (353 commuters, 14.7%).
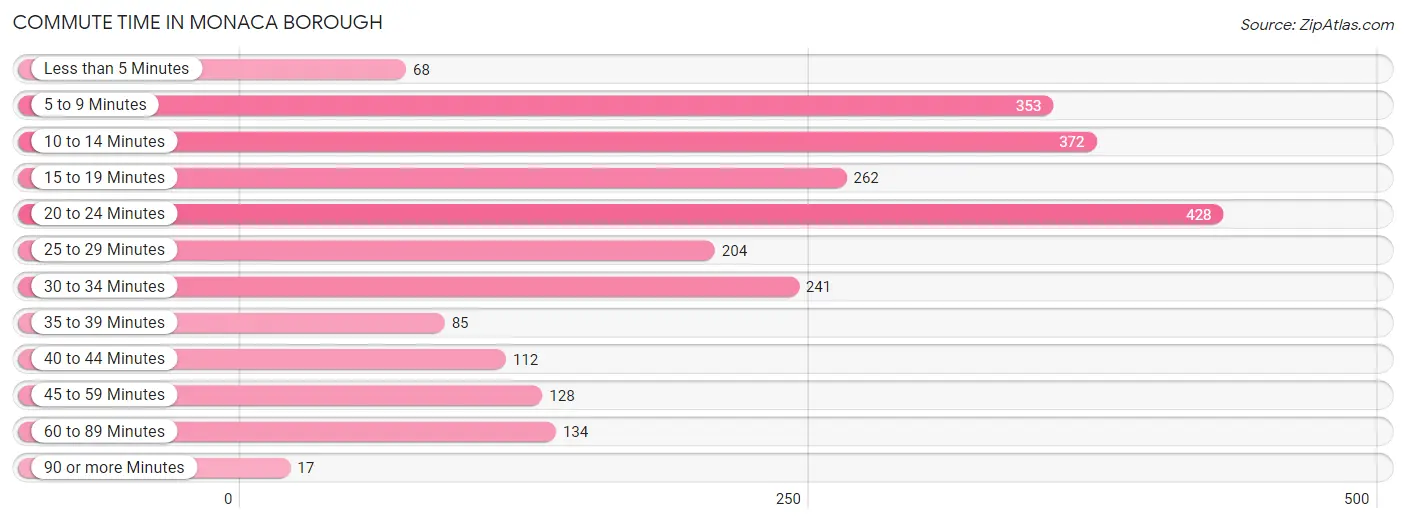
| Commute Time | # Commuters | % Commuters |
| Less than 5 Minutes | 68 | 2.8% |
| 5 to 9 Minutes | 353 | 14.7% |
| 10 to 14 Minutes | 372 | 15.5% |
| 15 to 19 Minutes | 262 | 10.9% |
| 20 to 24 Minutes | 428 | 17.8% |
| 25 to 29 Minutes | 204 | 8.5% |
| 30 to 34 Minutes | 241 | 10.0% |
| 35 to 39 Minutes | 85 | 3.5% |
| 40 to 44 Minutes | 112 | 4.7% |
| 45 to 59 Minutes | 128 | 5.3% |
| 60 to 89 Minutes | 134 | 5.6% |
| 90 or more Minutes | 17 | 0.7% |
Commute Time by Sex in Monaca borough
The most common commute times in Monaca borough are 20 to 24 minutes (243 commuters, 19.3%) for males and 20 to 24 minutes (185 commuters, 16.2%) for females.
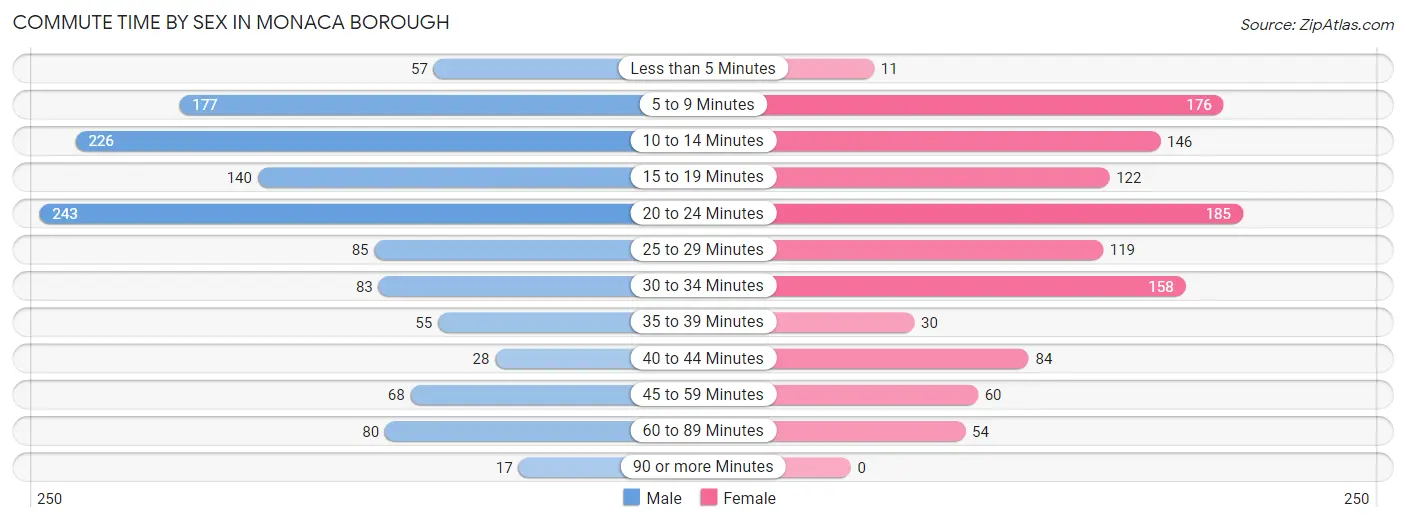
| Commute Time | Male | Female |
| Less than 5 Minutes | 57 (4.5%) | 11 (1.0%) |
| 5 to 9 Minutes | 177 (14.1%) | 176 (15.4%) |
| 10 to 14 Minutes | 226 (17.9%) | 146 (12.8%) |
| 15 to 19 Minutes | 140 (11.1%) | 122 (10.7%) |
| 20 to 24 Minutes | 243 (19.3%) | 185 (16.2%) |
| 25 to 29 Minutes | 85 (6.8%) | 119 (10.4%) |
| 30 to 34 Minutes | 83 (6.6%) | 158 (13.8%) |
| 35 to 39 Minutes | 55 (4.4%) | 30 (2.6%) |
| 40 to 44 Minutes | 28 (2.2%) | 84 (7.3%) |
| 45 to 59 Minutes | 68 (5.4%) | 60 (5.2%) |
| 60 to 89 Minutes | 80 (6.4%) | 54 (4.7%) |
| 90 or more Minutes | 17 (1.3%) | 0 (0.0%) |
Time of Departure to Work by Sex in Monaca borough
The most frequent times of departure to work in Monaca borough are 6:30 AM to 6:59 AM (230, 18.3%) for males and 6:30 AM to 6:59 AM (180, 15.7%) for females.
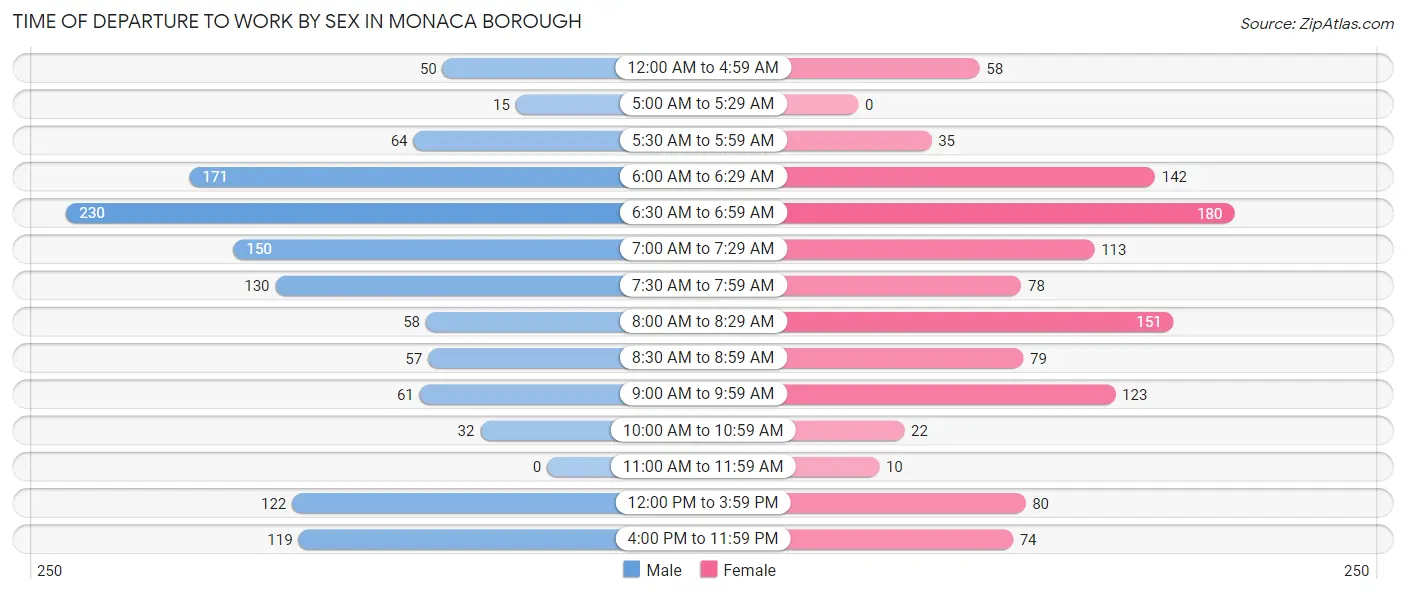
| Time of Departure | Male | Female |
| 12:00 AM to 4:59 AM | 50 (4.0%) | 58 (5.1%) |
| 5:00 AM to 5:29 AM | 15 (1.2%) | 0 (0.0%) |
| 5:30 AM to 5:59 AM | 64 (5.1%) | 35 (3.1%) |
| 6:00 AM to 6:29 AM | 171 (13.6%) | 142 (12.4%) |
| 6:30 AM to 6:59 AM | 230 (18.3%) | 180 (15.7%) |
| 7:00 AM to 7:29 AM | 150 (11.9%) | 113 (9.9%) |
| 7:30 AM to 7:59 AM | 130 (10.3%) | 78 (6.8%) |
| 8:00 AM to 8:29 AM | 58 (4.6%) | 151 (13.2%) |
| 8:30 AM to 8:59 AM | 57 (4.5%) | 79 (6.9%) |
| 9:00 AM to 9:59 AM | 61 (4.9%) | 123 (10.7%) |
| 10:00 AM to 10:59 AM | 32 (2.5%) | 22 (1.9%) |
| 11:00 AM to 11:59 AM | 0 (0.0%) | 10 (0.9%) |
| 12:00 PM to 3:59 PM | 122 (9.7%) | 80 (7.0%) |
| 4:00 PM to 11:59 PM | 119 (9.5%) | 74 (6.5%) |
| Total | 1,259 (100.0%) | 1,145 (100.0%) |
Housing Occupancy in Monaca borough
Occupancy by Ownership in Monaca borough
Of the total 2,418 dwellings in Monaca borough, owner-occupied units account for 1,473 (60.9%), while renter-occupied units make up 945 (39.1%).
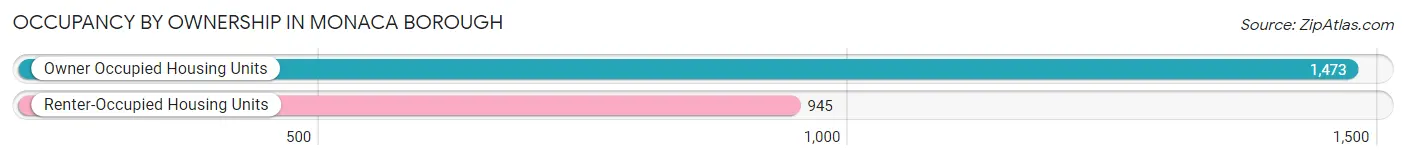
| Occupancy | # Housing Units | % Housing Units |
| Owner Occupied Housing Units | 1,473 | 60.9% |
| Renter-Occupied Housing Units | 945 | 39.1% |
| Total Occupied Housing Units | 2,418 | 100.0% |
Occupancy by Household Size in Monaca borough
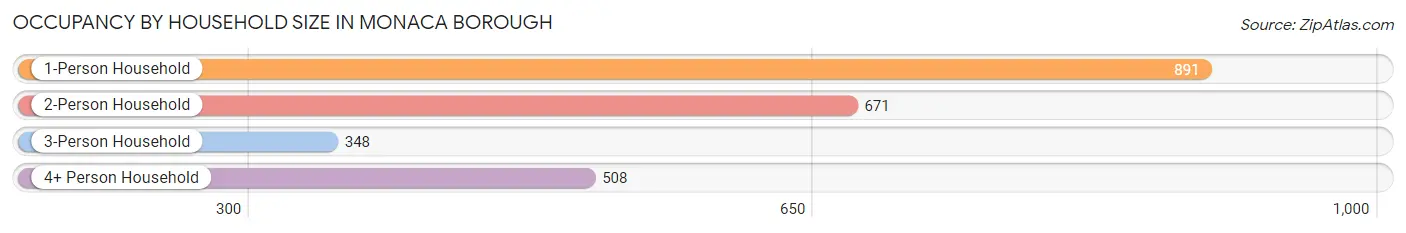
| Household Size | # Housing Units | % Housing Units |
| 1-Person Household | 891 | 36.8% |
| 2-Person Household | 671 | 27.8% |
| 3-Person Household | 348 | 14.4% |
| 4+ Person Household | 508 | 21.0% |
| Total Housing Units | 2,418 | 100.0% |
Occupancy by Ownership by Household Size in Monaca borough
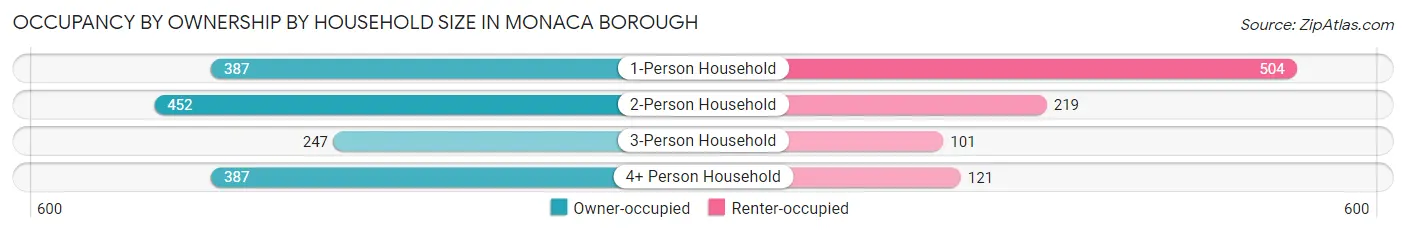
| Household Size | Owner-occupied | Renter-occupied |
| 1-Person Household | 387 (43.4%) | 504 (56.6%) |
| 2-Person Household | 452 (67.4%) | 219 (32.6%) |
| 3-Person Household | 247 (71.0%) | 101 (29.0%) |
| 4+ Person Household | 387 (76.2%) | 121 (23.8%) |
| Total Housing Units | 1,473 (60.9%) | 945 (39.1%) |
Occupancy by Educational Attainment in Monaca borough
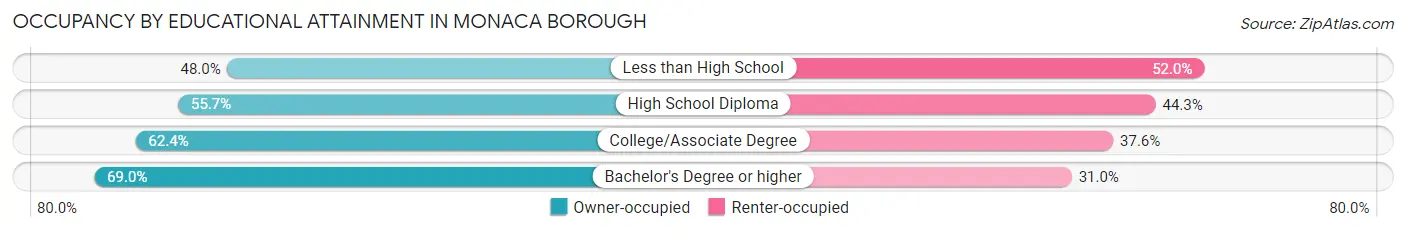
| Household Size | Owner-occupied | Renter-occupied |
| Less than High School | 59 (48.0%) | 64 (52.0%) |
| High School Diploma | 489 (55.7%) | 389 (44.3%) |
| College/Associate Degree | 500 (62.4%) | 301 (37.6%) |
| Bachelor's Degree or higher | 425 (69.0%) | 191 (31.0%) |
Occupancy by Age of Householder in Monaca borough
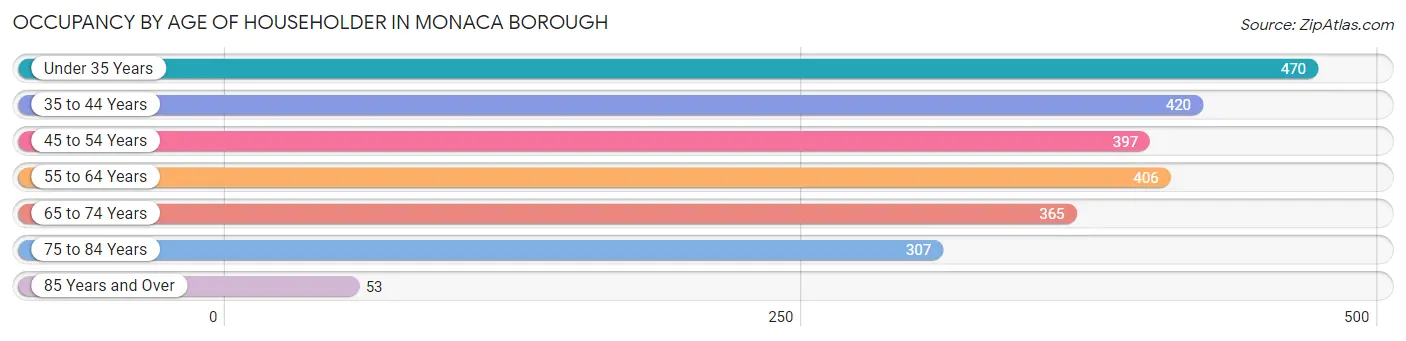
| Age Bracket | # Households | % Households |
| Under 35 Years | 470 | 19.4% |
| 35 to 44 Years | 420 | 17.4% |
| 45 to 54 Years | 397 | 16.4% |
| 55 to 64 Years | 406 | 16.8% |
| 65 to 74 Years | 365 | 15.1% |
| 75 to 84 Years | 307 | 12.7% |
| 85 Years and Over | 53 | 2.2% |
| Total | 2,418 | 100.0% |
Housing Finances in Monaca borough
Median Income by Occupancy in Monaca borough
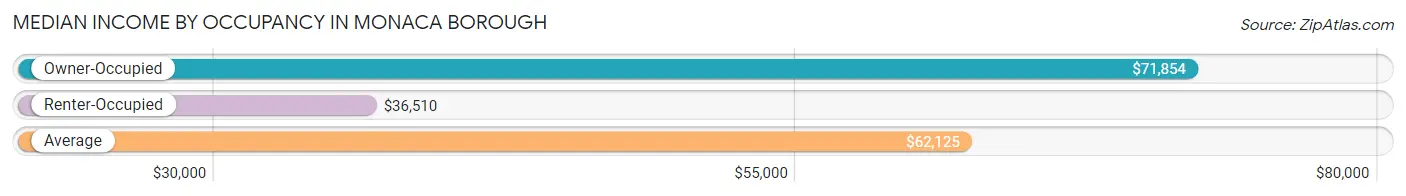
| Occupancy Type | # Households | Median Income |
| Owner-Occupied | 1,473 (60.9%) | $71,854 |
| Renter-Occupied | 945 (39.1%) | $36,510 |
| Average | 2,418 (100.0%) | $62,125 |
Occupancy by Householder Income Bracket in Monaca borough
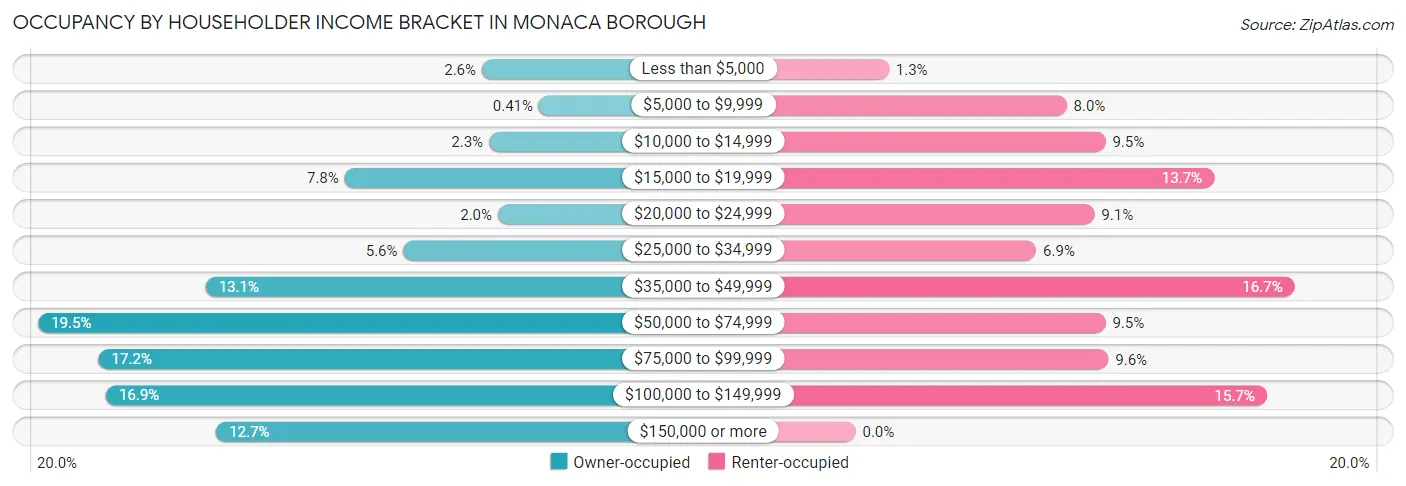
| Income Bracket | Owner-occupied | Renter-occupied |
| Less than $5,000 | 38 (2.6%) | 12 (1.3%) |
| $5,000 to $9,999 | 6 (0.4%) | 76 (8.0%) |
| $10,000 to $14,999 | 34 (2.3%) | 90 (9.5%) |
| $15,000 to $19,999 | 115 (7.8%) | 129 (13.7%) |
| $20,000 to $24,999 | 29 (2.0%) | 86 (9.1%) |
| $25,000 to $34,999 | 82 (5.6%) | 65 (6.9%) |
| $35,000 to $49,999 | 193 (13.1%) | 158 (16.7%) |
| $50,000 to $74,999 | 287 (19.5%) | 90 (9.5%) |
| $75,000 to $99,999 | 253 (17.2%) | 91 (9.6%) |
| $100,000 to $149,999 | 249 (16.9%) | 148 (15.7%) |
| $150,000 or more | 187 (12.7%) | 0 (0.0%) |
| Total | 1,473 (100.0%) | 945 (100.0%) |
Monthly Housing Cost Tiers in Monaca borough
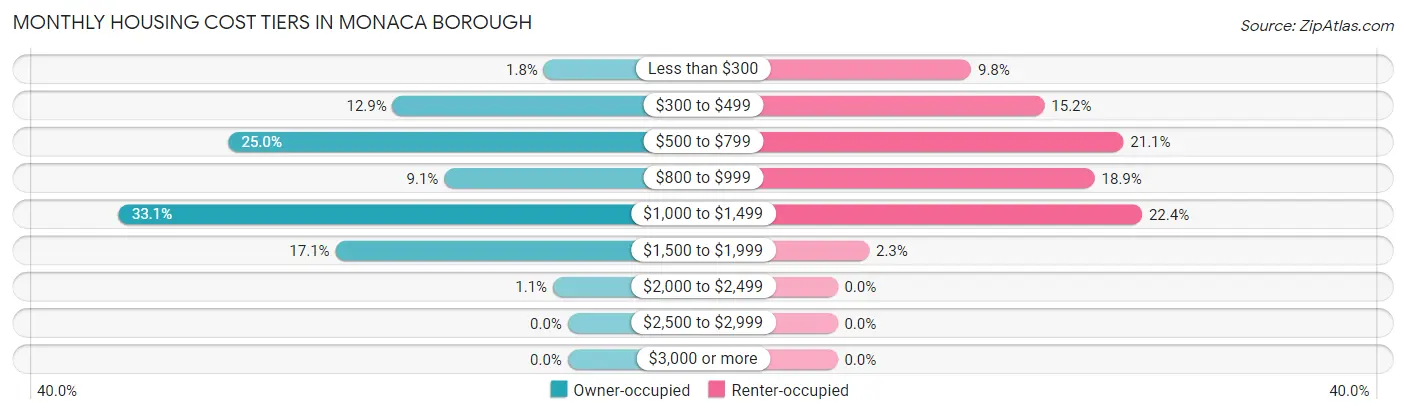
| Monthly Cost | Owner-occupied | Renter-occupied |
| Less than $300 | 26 (1.8%) | 93 (9.8%) |
| $300 to $499 | 190 (12.9%) | 144 (15.2%) |
| $500 to $799 | 368 (25.0%) | 199 (21.1%) |
| $800 to $999 | 134 (9.1%) | 179 (18.9%) |
| $1,000 to $1,499 | 487 (33.1%) | 212 (22.4%) |
| $1,500 to $1,999 | 252 (17.1%) | 22 (2.3%) |
| $2,000 to $2,499 | 16 (1.1%) | 0 (0.0%) |
| $2,500 to $2,999 | 0 (0.0%) | 0 (0.0%) |
| $3,000 or more | 0 (0.0%) | 0 (0.0%) |
| Total | 1,473 (100.0%) | 945 (100.0%) |
Physical Housing Characteristics in Monaca borough
Housing Structures in Monaca borough
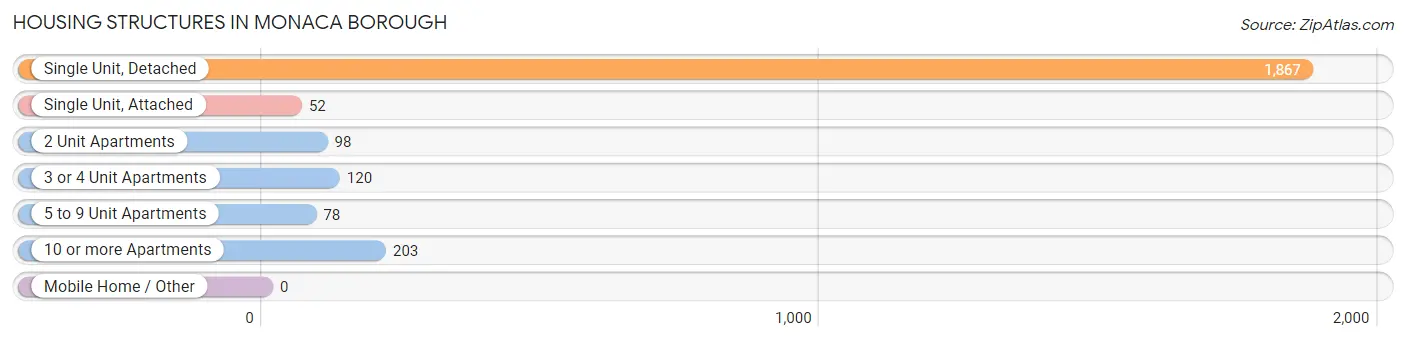
| Structure Type | # Housing Units | % Housing Units |
| Single Unit, Detached | 1,867 | 77.2% |
| Single Unit, Attached | 52 | 2.1% |
| 2 Unit Apartments | 98 | 4.1% |
| 3 or 4 Unit Apartments | 120 | 5.0% |
| 5 to 9 Unit Apartments | 78 | 3.2% |
| 10 or more Apartments | 203 | 8.4% |
| Mobile Home / Other | 0 | 0.0% |
| Total | 2,418 | 100.0% |
Housing Structures by Occupancy in Monaca borough
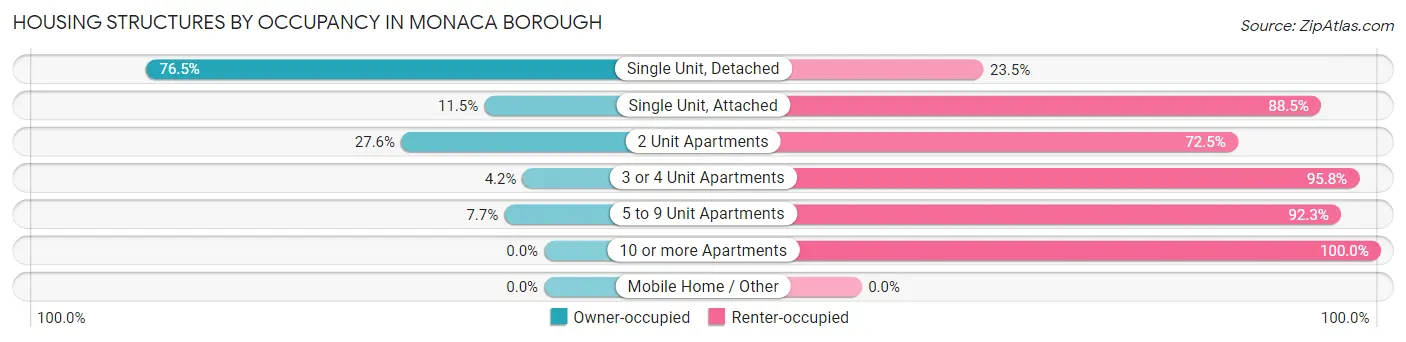
| Structure Type | Owner-occupied | Renter-occupied |
| Single Unit, Detached | 1,429 (76.5%) | 438 (23.5%) |
| Single Unit, Attached | 6 (11.5%) | 46 (88.5%) |
| 2 Unit Apartments | 27 (27.6%) | 71 (72.5%) |
| 3 or 4 Unit Apartments | 5 (4.2%) | 115 (95.8%) |
| 5 to 9 Unit Apartments | 6 (7.7%) | 72 (92.3%) |
| 10 or more Apartments | 0 (0.0%) | 203 (100.0%) |
| Mobile Home / Other | 0 (0.0%) | 0 (0.0%) |
| Total | 1,473 (60.9%) | 945 (39.1%) |
Housing Structures by Number of Rooms in Monaca borough
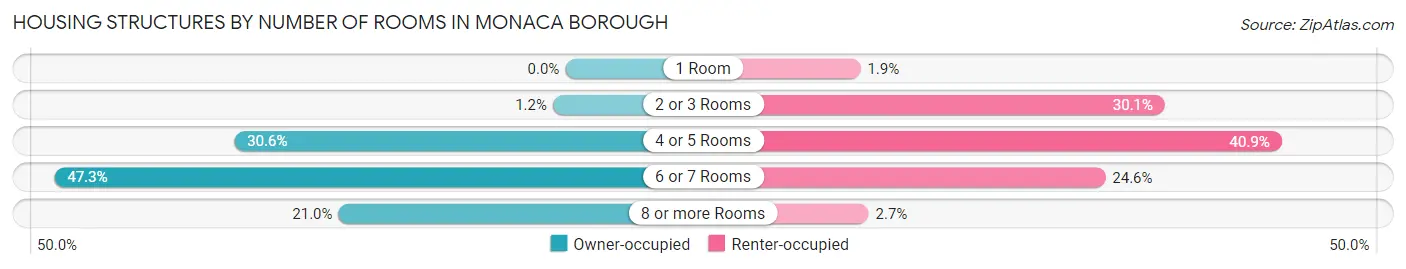
| Number of Rooms | Owner-occupied | Renter-occupied |
| 1 Room | 0 (0.0%) | 18 (1.9%) |
| 2 or 3 Rooms | 17 (1.1%) | 284 (30.0%) |
| 4 or 5 Rooms | 451 (30.6%) | 386 (40.8%) |
| 6 or 7 Rooms | 696 (47.2%) | 232 (24.5%) |
| 8 or more Rooms | 309 (21.0%) | 25 (2.6%) |
| Total | 1,473 (100.0%) | 945 (100.0%) |
Housing Structure by Heating Type in Monaca borough
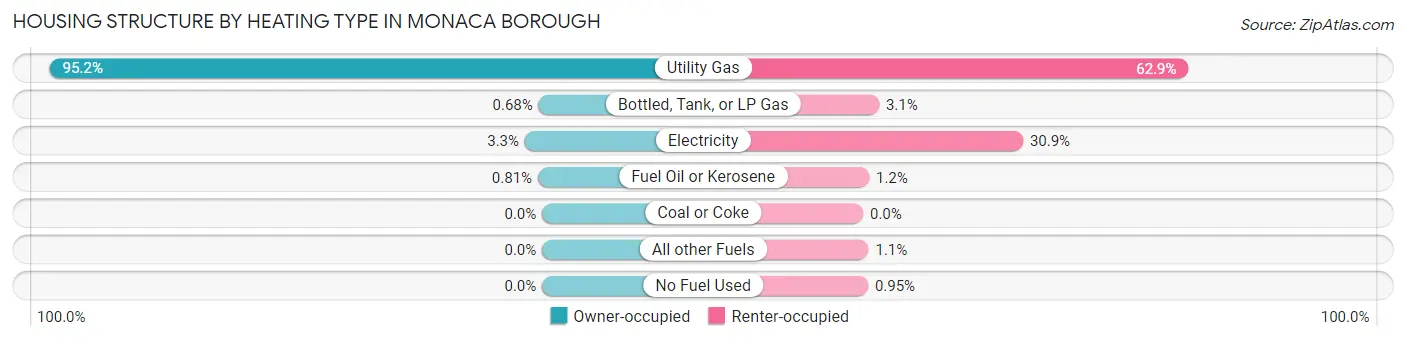
| Heating Type | Owner-occupied | Renter-occupied |
| Utility Gas | 1,402 (95.2%) | 594 (62.9%) |
| Bottled, Tank, or LP Gas | 10 (0.7%) | 29 (3.1%) |
| Electricity | 49 (3.3%) | 292 (30.9%) |
| Fuel Oil or Kerosene | 12 (0.8%) | 11 (1.2%) |
| Coal or Coke | 0 (0.0%) | 0 (0.0%) |
| All other Fuels | 0 (0.0%) | 10 (1.1%) |
| No Fuel Used | 0 (0.0%) | 9 (0.9%) |
| Total | 1,473 (100.0%) | 945 (100.0%) |
Household Vehicle Usage in Monaca borough
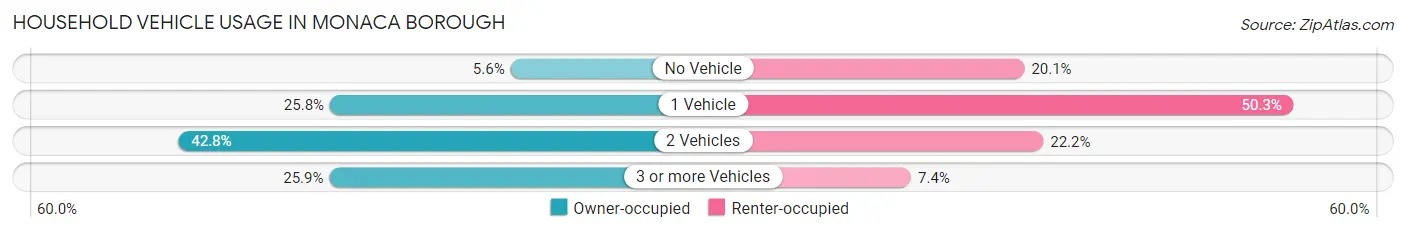
| Vehicles per Household | Owner-occupied | Renter-occupied |
| No Vehicle | 82 (5.6%) | 190 (20.1%) |
| 1 Vehicle | 380 (25.8%) | 475 (50.3%) |
| 2 Vehicles | 630 (42.8%) | 210 (22.2%) |
| 3 or more Vehicles | 381 (25.9%) | 70 (7.4%) |
| Total | 1,473 (100.0%) | 945 (100.0%) |
Real Estate & Mortgages in Monaca borough
Real Estate and Mortgage Overview in Monaca borough
| Characteristic | Without Mortgage | With Mortgage |
| Housing Units | 586 | 887 |
| Median Property Value | $145,500 | $150,800 |
| Median Household Income | $48,068 | $119 |
| Monthly Housing Costs | $545 | $0 |
| Real Estate Taxes | $2,041 | $69 |
Property Value by Mortgage Status in Monaca borough
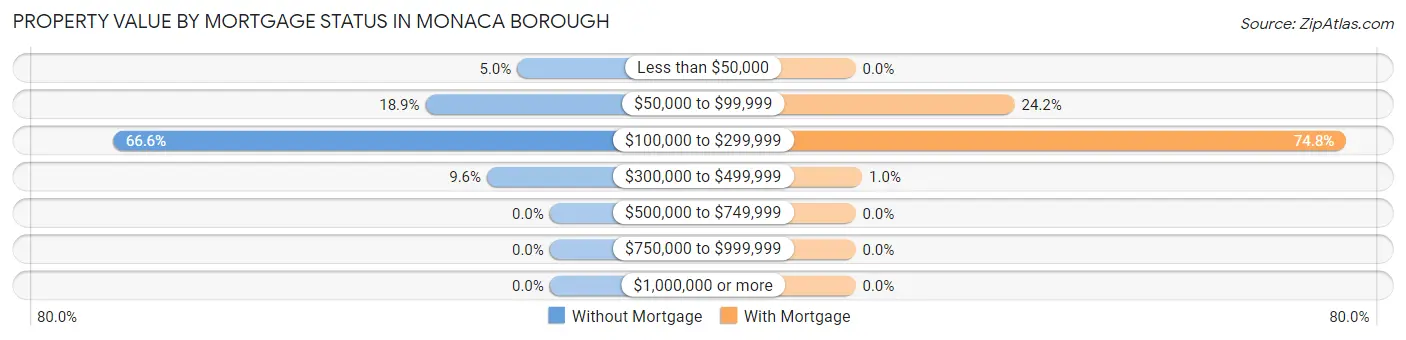
| Property Value | Without Mortgage | With Mortgage |
| Less than $50,000 | 29 (5.0%) | 0 (0.0%) |
| $50,000 to $99,999 | 111 (18.9%) | 215 (24.2%) |
| $100,000 to $299,999 | 390 (66.5%) | 663 (74.8%) |
| $300,000 to $499,999 | 56 (9.6%) | 9 (1.0%) |
| $500,000 to $749,999 | 0 (0.0%) | 0 (0.0%) |
| $750,000 to $999,999 | 0 (0.0%) | 0 (0.0%) |
| $1,000,000 or more | 0 (0.0%) | 0 (0.0%) |
| Total | 586 (100.0%) | 887 (100.0%) |
Household Income by Mortgage Status in Monaca borough
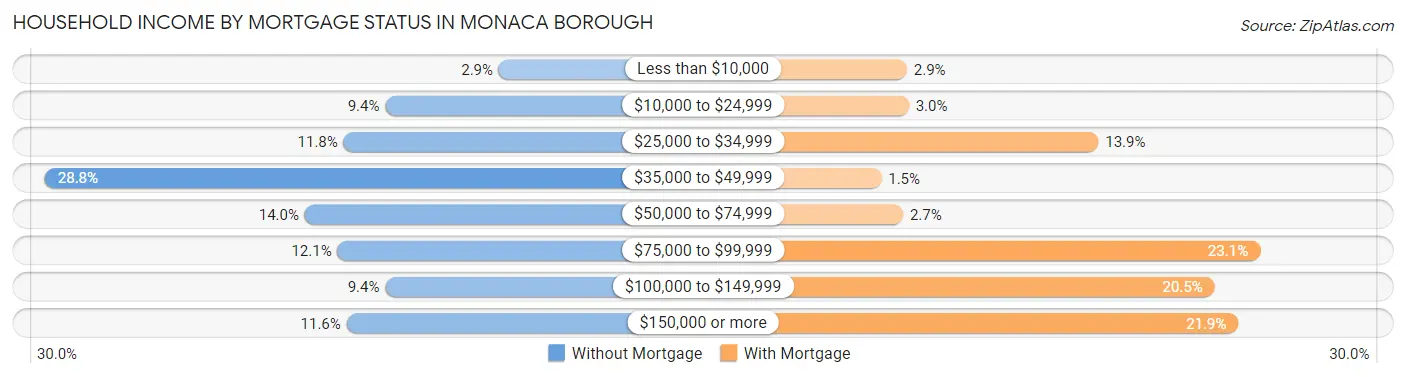
| Household Income | Without Mortgage | With Mortgage |
| Less than $10,000 | 17 (2.9%) | 26 (2.9%) |
| $10,000 to $24,999 | 55 (9.4%) | 27 (3.0%) |
| $25,000 to $34,999 | 69 (11.8%) | 123 (13.9%) |
| $35,000 to $49,999 | 169 (28.8%) | 13 (1.5%) |
| $50,000 to $74,999 | 82 (14.0%) | 24 (2.7%) |
| $75,000 to $99,999 | 71 (12.1%) | 205 (23.1%) |
| $100,000 to $149,999 | 55 (9.4%) | 182 (20.5%) |
| $150,000 or more | 68 (11.6%) | 194 (21.9%) |
| Total | 586 (100.0%) | 887 (100.0%) |
Property Value to Household Income Ratio in Monaca borough
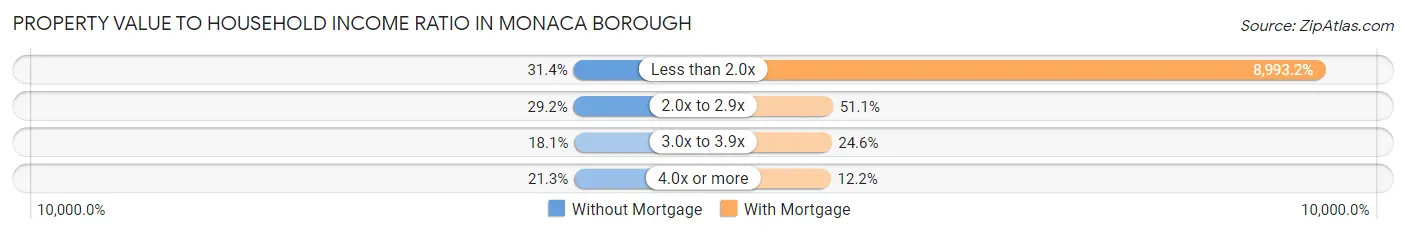
| Value-to-Income Ratio | Without Mortgage | With Mortgage |
| Less than 2.0x | 184 (31.4%) | 79,770 (8,993.2%) |
| 2.0x to 2.9x | 171 (29.2%) | 453 (51.1%) |
| 3.0x to 3.9x | 106 (18.1%) | 218 (24.6%) |
| 4.0x or more | 125 (21.3%) | 108 (12.2%) |
| Total | 586 (100.0%) | 887 (100.0%) |
Real Estate Taxes by Mortgage Status in Monaca borough
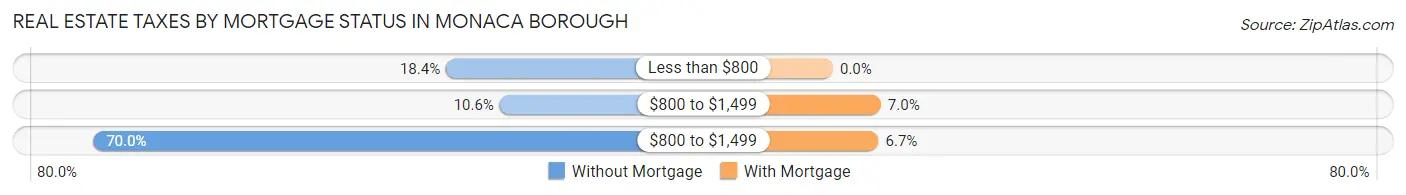
| Property Taxes | Without Mortgage | With Mortgage |
| Less than $800 | 108 (18.4%) | 0 (0.0%) |
| $800 to $1,499 | 62 (10.6%) | 62 (7.0%) |
| $800 to $1,499 | 410 (70.0%) | 59 (6.7%) |
| Total | 586 (100.0%) | 887 (100.0%) |
Health & Disability in Monaca borough
Health Insurance Coverage by Age in Monaca borough
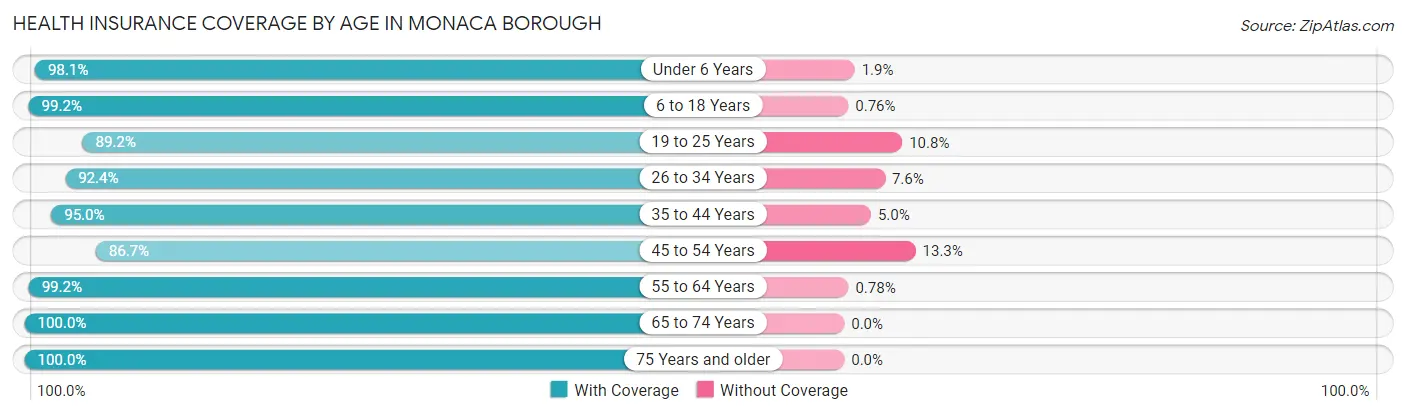
| Age Bracket | With Coverage | Without Coverage |
| Under 6 Years | 353 (98.1%) | 7 (1.9%) |
| 6 to 18 Years | 914 (99.2%) | 7 (0.8%) |
| 19 to 25 Years | 396 (89.2%) | 48 (10.8%) |
| 26 to 34 Years | 646 (92.4%) | 53 (7.6%) |
| 35 to 44 Years | 706 (95.0%) | 37 (5.0%) |
| 45 to 54 Years | 606 (86.7%) | 93 (13.3%) |
| 55 to 64 Years | 639 (99.2%) | 5 (0.8%) |
| 65 to 74 Years | 548 (100.0%) | 0 (0.0%) |
| 75 Years and older | 509 (100.0%) | 0 (0.0%) |
| Total | 5,317 (95.5%) | 250 (4.5%) |
Health Insurance Coverage by Citizenship Status in Monaca borough
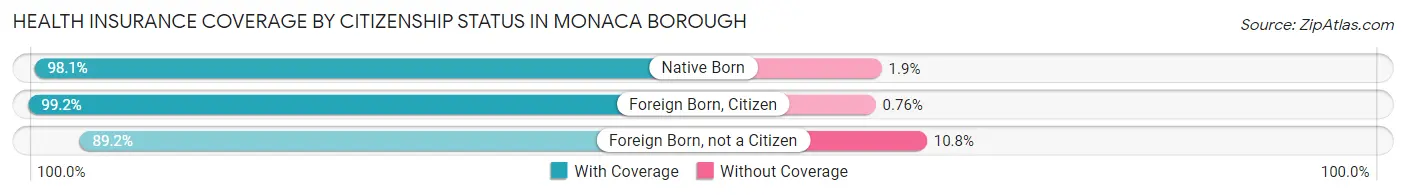
| Citizenship Status | With Coverage | Without Coverage |
| Native Born | 353 (98.1%) | 7 (1.9%) |
| Foreign Born, Citizen | 914 (99.2%) | 7 (0.8%) |
| Foreign Born, not a Citizen | 396 (89.2%) | 48 (10.8%) |
Health Insurance Coverage by Household Income in Monaca borough
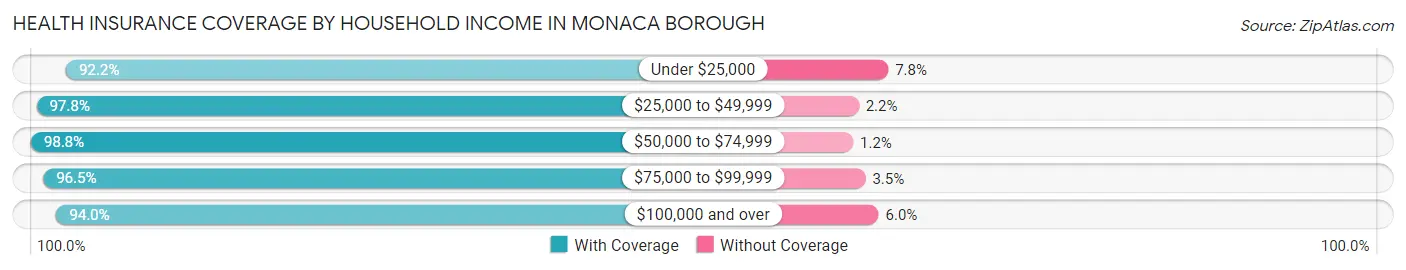
| Household Income | With Coverage | Without Coverage |
| Under $25,000 | 951 (92.2%) | 80 (7.8%) |
| $25,000 to $49,999 | 789 (97.8%) | 18 (2.2%) |
| $50,000 to $74,999 | 922 (98.8%) | 11 (1.2%) |
| $75,000 to $99,999 | 994 (96.5%) | 36 (3.5%) |
| $100,000 and over | 1,658 (94.0%) | 105 (6.0%) |
Public vs Private Health Insurance Coverage by Age in Monaca borough
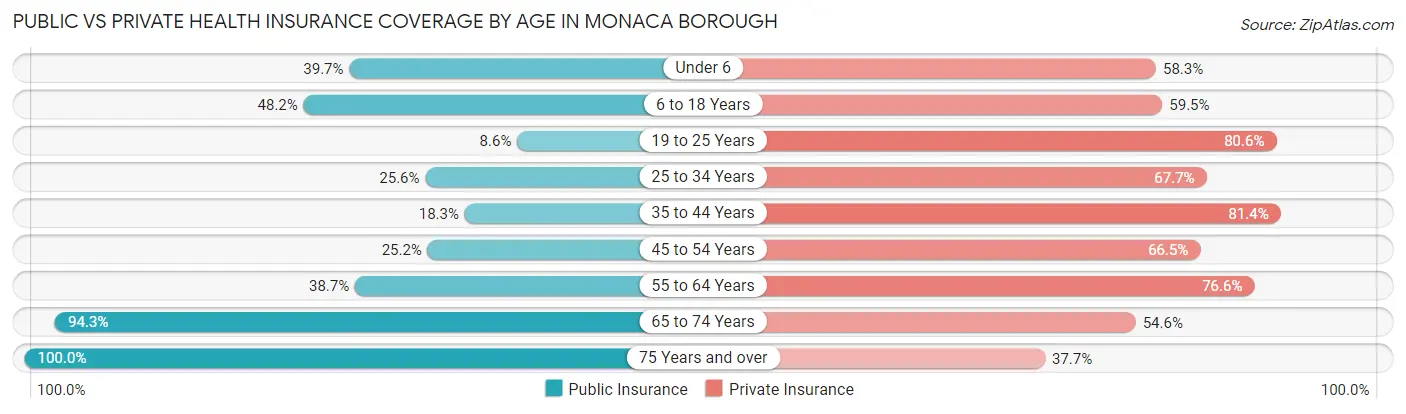
| Age Bracket | Public Insurance | Private Insurance |
| Under 6 | 143 (39.7%) | 210 (58.3%) |
| 6 to 18 Years | 444 (48.2%) | 548 (59.5%) |
| 19 to 25 Years | 38 (8.6%) | 358 (80.6%) |
| 25 to 34 Years | 179 (25.6%) | 473 (67.7%) |
| 35 to 44 Years | 136 (18.3%) | 605 (81.4%) |
| 45 to 54 Years | 176 (25.2%) | 465 (66.5%) |
| 55 to 64 Years | 249 (38.7%) | 493 (76.5%) |
| 65 to 74 Years | 517 (94.3%) | 299 (54.6%) |
| 75 Years and over | 509 (100.0%) | 192 (37.7%) |
| Total | 2,391 (42.9%) | 3,643 (65.4%) |
Disability Status by Sex by Age in Monaca borough
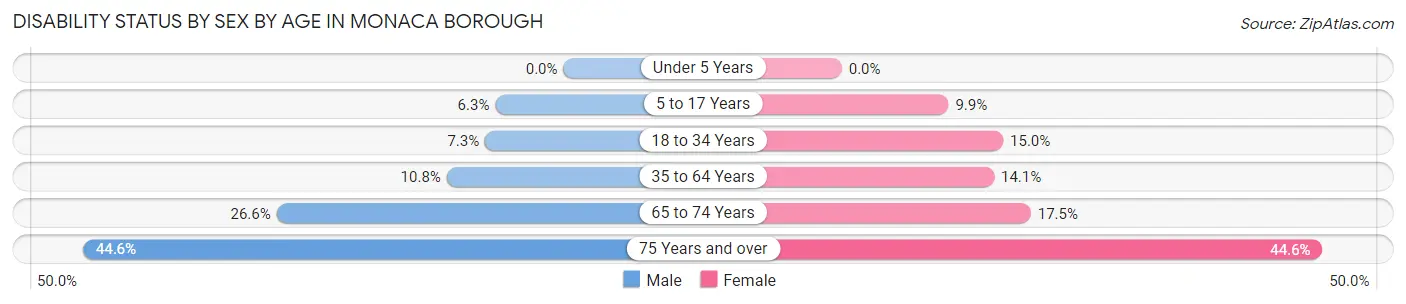
| Age Bracket | Male | Female |
| Under 5 Years | 0 (0.0%) | 0 (0.0%) |
| 5 to 17 Years | 29 (6.3%) | 52 (9.9%) |
| 18 to 34 Years | 41 (7.3%) | 88 (15.0%) |
| 35 to 64 Years | 124 (10.8%) | 133 (14.1%) |
| 65 to 74 Years | 70 (26.6%) | 50 (17.5%) |
| 75 Years and over | 70 (44.6%) | 157 (44.6%) |
Disability Class by Sex by Age in Monaca borough
Disability Class: Hearing Difficulty
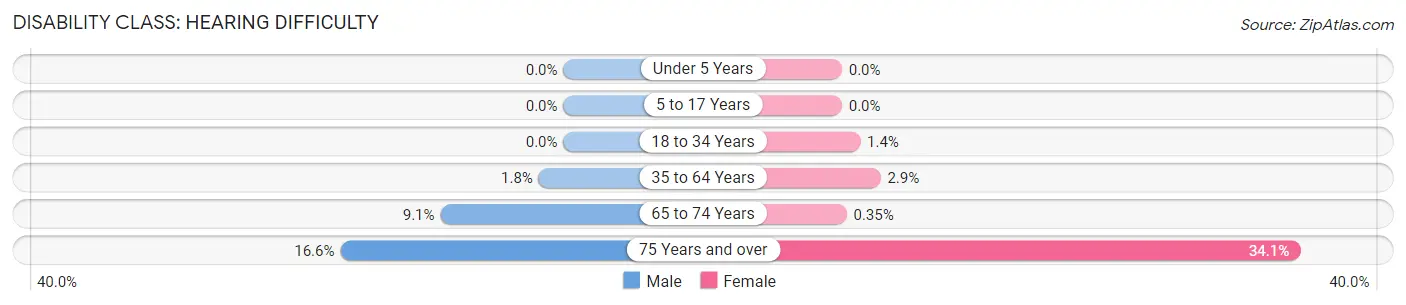
| Age Bracket | Male | Female |
| Under 5 Years | 0 (0.0%) | 0 (0.0%) |
| 5 to 17 Years | 0 (0.0%) | 0 (0.0%) |
| 18 to 34 Years | 0 (0.0%) | 8 (1.4%) |
| 35 to 64 Years | 21 (1.8%) | 27 (2.9%) |
| 65 to 74 Years | 24 (9.1%) | 1 (0.4%) |
| 75 Years and over | 26 (16.6%) | 120 (34.1%) |
Disability Class: Vision Difficulty
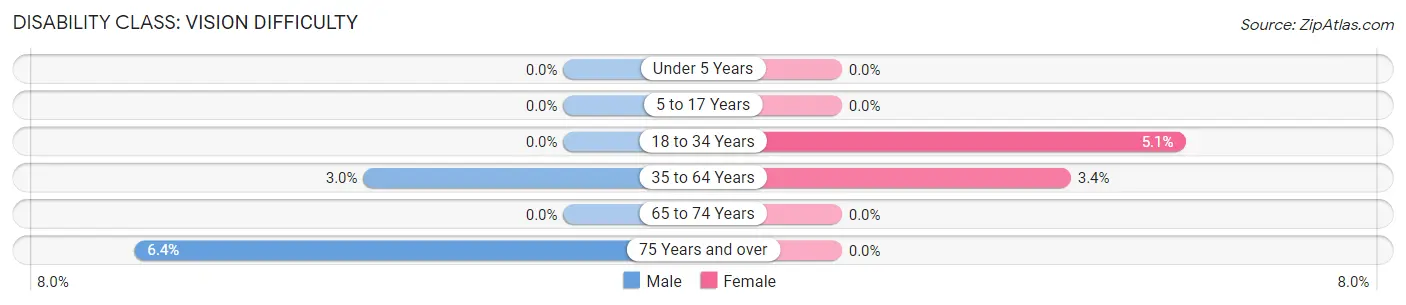
| Age Bracket | Male | Female |
| Under 5 Years | 0 (0.0%) | 0 (0.0%) |
| 5 to 17 Years | 0 (0.0%) | 0 (0.0%) |
| 18 to 34 Years | 0 (0.0%) | 30 (5.1%) |
| 35 to 64 Years | 34 (3.0%) | 32 (3.4%) |
| 65 to 74 Years | 0 (0.0%) | 0 (0.0%) |
| 75 Years and over | 10 (6.4%) | 0 (0.0%) |
Disability Class: Cognitive Difficulty
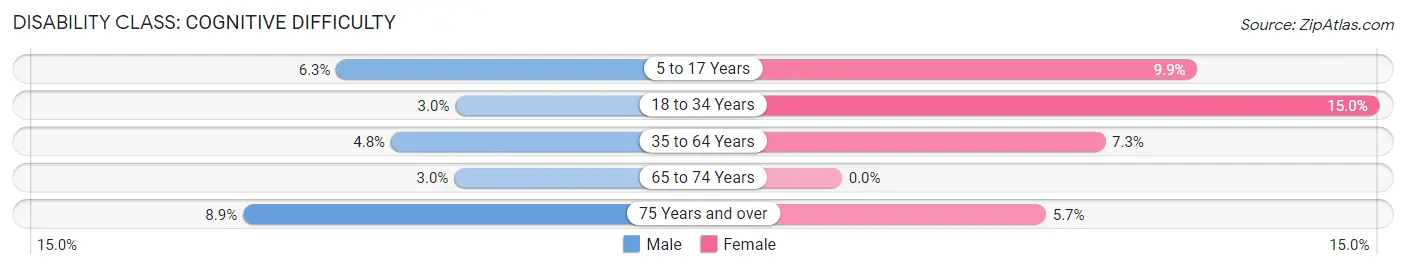
| Age Bracket | Male | Female |
| 5 to 17 Years | 29 (6.3%) | 52 (9.9%) |
| 18 to 34 Years | 17 (3.0%) | 88 (15.0%) |
| 35 to 64 Years | 55 (4.8%) | 69 (7.3%) |
| 65 to 74 Years | 8 (3.0%) | 0 (0.0%) |
| 75 Years and over | 14 (8.9%) | 20 (5.7%) |
Disability Class: Ambulatory Difficulty
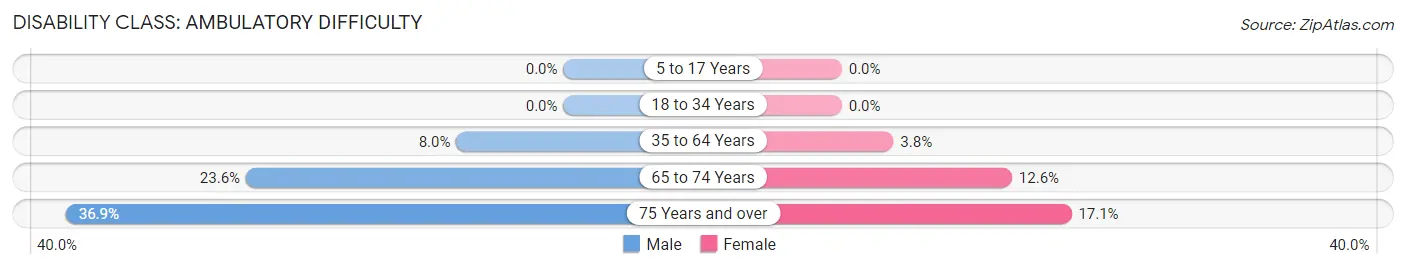
| Age Bracket | Male | Female |
| 5 to 17 Years | 0 (0.0%) | 0 (0.0%) |
| 18 to 34 Years | 0 (0.0%) | 0 (0.0%) |
| 35 to 64 Years | 91 (8.0%) | 36 (3.8%) |
| 65 to 74 Years | 62 (23.6%) | 36 (12.6%) |
| 75 Years and over | 58 (36.9%) | 60 (17.1%) |
Disability Class: Self-Care Difficulty
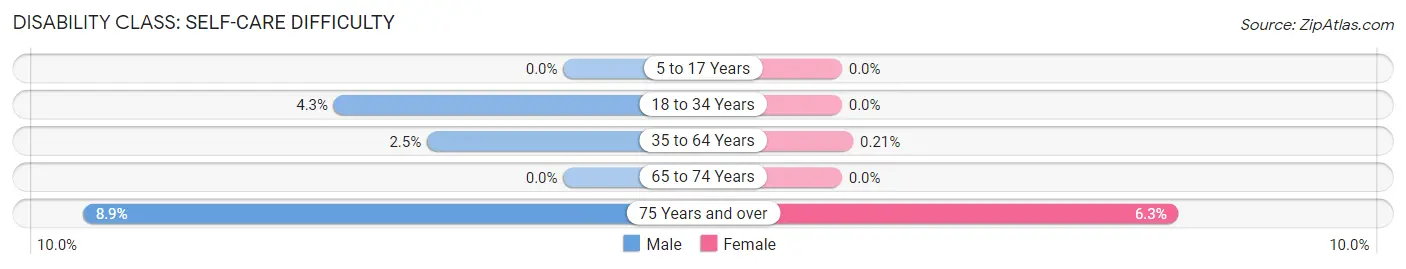
| Age Bracket | Male | Female |
| 5 to 17 Years | 0 (0.0%) | 0 (0.0%) |
| 18 to 34 Years | 24 (4.3%) | 0 (0.0%) |
| 35 to 64 Years | 29 (2.5%) | 2 (0.2%) |
| 65 to 74 Years | 0 (0.0%) | 0 (0.0%) |
| 75 Years and over | 14 (8.9%) | 22 (6.2%) |
Technology Access in Monaca borough
Computing Device Access in Monaca borough
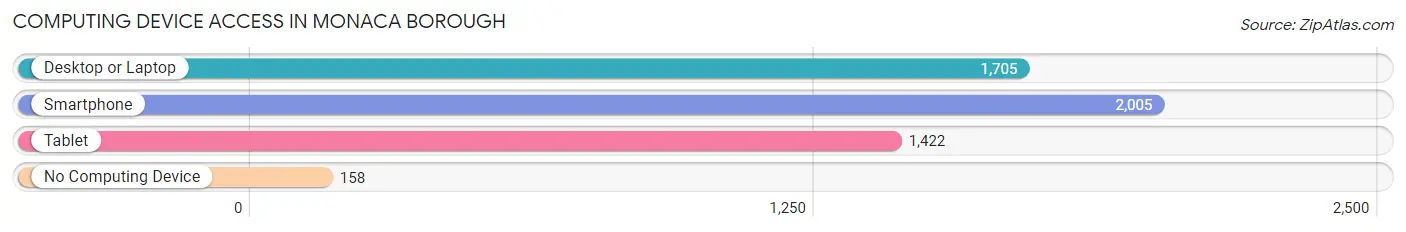
| Device Type | # Households | % Households |
| Desktop or Laptop | 1,705 | 70.5% |
| Smartphone | 2,005 | 82.9% |
| Tablet | 1,422 | 58.8% |
| No Computing Device | 158 | 6.5% |
| Total | 2,418 | 100.0% |
Internet Access in Monaca borough
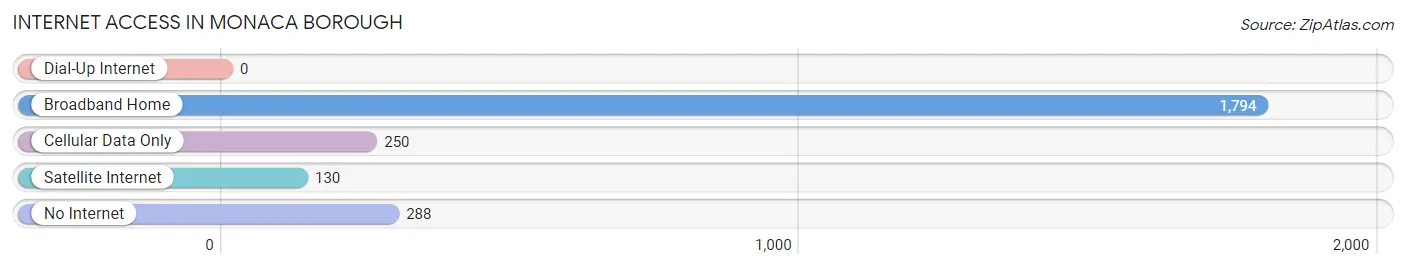
| Internet Type | # Households | % Households |
| Dial-Up Internet | 0 | 0.0% |
| Broadband Home | 1,794 | 74.2% |
| Cellular Data Only | 250 | 10.3% |
| Satellite Internet | 130 | 5.4% |
| No Internet | 288 | 11.9% |
| Total | 2,418 | 100.0% |
Monaca borough Summary
Monaca Borough is a borough located in Beaver County, Pennsylvania, United States. It is located along the Ohio River, approximately 25 miles northwest of Pittsburgh. The population was 6,586 at the 2010 census.
History
Monaca was first settled in 1790 by John and Mary Moore, who were among the first settlers in the area. The town was originally known as Moore's Ferry, and was later renamed Monaca in 1828 after the Monongahela River. The town was incorporated as a borough in 1868.
Monaca was an important stop on the Pennsylvania Canal, which ran along the Ohio River. The canal was used to transport goods and passengers between Pittsburgh and the Ohio River. The canal was eventually replaced by the Pennsylvania Railroad in the late 19th century.
Monaca was also home to several industries, including a glass factory, a steel mill, and a brickyard. The glass factory was the largest employer in the area, and was in operation until the early 20th century.
Geography
Monaca is located at 40°45'17" North, 80°22'45" West (40.754722, -80.379167). According to the United States Census Bureau, the borough has a total area of 1.2 square miles, all of it land.
Economy
Monaca's economy is largely based on manufacturing and retail. The borough is home to several manufacturing companies, including a steel mill, a glass factory, and a brickyard. The steel mill is the largest employer in the area, and is responsible for the majority of the borough's manufacturing jobs.
The retail sector is also important to the local economy. Monaca is home to several small businesses, including restaurants, bars, and shops. The borough also has a large shopping center, which is home to several national retailers.
Demographics
As of the 2010 census, there were 6,586 people, 2,717 households, and 1,717 families residing in the borough. The population density was 5,541.7 people per square mile (2,139.7/km2). There were 2,945 housing units at an average density of 2,457.5 per square mile (945.3/km2). The racial makeup of the borough was 94.2% White, 2.7% African American, 0.2% Native American, 0.7% Asian, 0.1% Pacific Islander, 0.7% from other races, and 1.4% from two or more races. Hispanic or Latino of any race were 1.7% of the population.
There were 2,717 households, out of which 28.2% had children under the age of 18 living with them, 43.2% were married couples living together, 14.7% had a female householder with no husband present, and 36.7% were non-families. 32.2% of all households were made up of individuals, and 14.2% had someone living alone who was 65 years of age or older. The average household size was 2.41 and the average family size was 3.03.
In the borough, the population was spread out, with 23.2% under the age of 18, 8.2% from 18 to 24, 28.3% from 25 to 44, 22.7% from 45 to 64, and 17.6% who were 65 years of age or older. The median age was 38 years. For every 100 females, there were 91.2 males. For every 100 females age 18 and over, there were 87.3 males.
The median income for a household in the borough was $35,938, and the median income for a family was $44,844. Males had a median income of $35,938 versus $25,938 for females. The per capita income for the borough was $18,845. About 8.2% of families and 10.2% of the population were below the poverty line, including 14.2% of those under age 18 and 8.2% of those age 65 or over.
Common Questions
What is Per Capita Income in Monaca borough?
Per Capita income in Monaca borough is $30,587.
What is the Median Family Income in Monaca borough?
Median Family Income in Monaca borough is $74,450.
What is the Median Household income in Monaca borough?
Median Household Income in Monaca borough is $62,125.
What is Income or Wage Gap in Monaca borough?
Income or Wage Gap in Monaca borough is 33.2%.
Women in Monaca borough earn 66.8 cents for every dollar earned by a man.
What is Inequality or Gini Index in Monaca borough?
Inequality or Gini Index in Monaca borough is 0.42.
What is the Total Population of Monaca borough?
Total Population of Monaca borough is 5,587.
What is the Total Male Population of Monaca borough?
Total Male Population of Monaca borough is 2,728.
What is the Total Female Population of Monaca borough?
Total Female Population of Monaca borough is 2,859.
What is the Ratio of Males per 100 Females in Monaca borough?
There are 95.42 Males per 100 Females in Monaca borough.
What is the Ratio of Females per 100 Males in Monaca borough?
There are 104.80 Females per 100 Males in Monaca borough.
What is the Median Population Age in Monaca borough?
Median Population Age in Monaca borough is 39.3 Years.
What is the Average Family Size in Monaca borough
Average Family Size in Monaca borough is 3.1 People.
What is the Average Household Size in Monaca borough
Average Household Size in Monaca borough is 2.3 People.
How Large is the Labor Force in Monaca borough?
There are 2,959 People in the Labor Forcein in Monaca borough.
What is the Percentage of People in the Labor Force in Monaca borough?
67.0% of People are in the Labor Force in Monaca borough.
What is the Unemployment Rate in Monaca borough?
Unemployment Rate in Monaca borough is 7.2%.