East McKeesport borough, PA Map & Demographics
East McKeesport borough Overview
$35,492
PER CAPITA INCOME
$94,605
AVG FAMILY INCOME
$60,988
AVG HOUSEHOLD INCOME
16.1%
WAGE / INCOME GAP [ % ]
83.9¢/ $1
WAGE / INCOME GAP [ $ ]
$2,885
FAMILY INCOME DEFICIT
0.39
INEQUALITY / GINI INDEX
2,074
TOTAL POPULATION
997
MALE POPULATION
1,077
FEMALE POPULATION
92.57
MALES / 100 FEMALES
108.02
FEMALES / 100 MALES
48.1
MEDIAN AGE
2.9
AVG FAMILY SIZE
2.0
AVG HOUSEHOLD SIZE
1,180
LABOR FORCE [ PEOPLE ]
63.5%
PERCENT IN LABOR FORCE
6.8%
UNEMPLOYMENT RATE
Income in East McKeesport borough
Income Overview in East McKeesport borough
Per Capita Income in East McKeesport borough is $35,492, while median incomes of families and households are $94,605 and $60,988 respectively.
| Characteristic | Number | Measure |
| Per Capita Income | 2,074 | $35,492 |
| Median Family Income | 512 | $94,605 |
| Mean Family Income | 512 | $98,323 |
| Median Household Income | 1,012 | $60,988 |
| Mean Household Income | 1,012 | $71,881 |
| Income Deficit | 512 | $2,885 |
| Wage / Income Gap (%) | 2,074 | 16.06% |
| Wage / Income Gap ($) | 2,074 | 83.94¢ per $1 |
| Gini / Inequality Index | 2,074 | 0.39 |
Earnings by Sex in East McKeesport borough
Average Earnings in East McKeesport borough are $34,745, $31,579 for men and $37,619 for women, a difference of 16.1%.
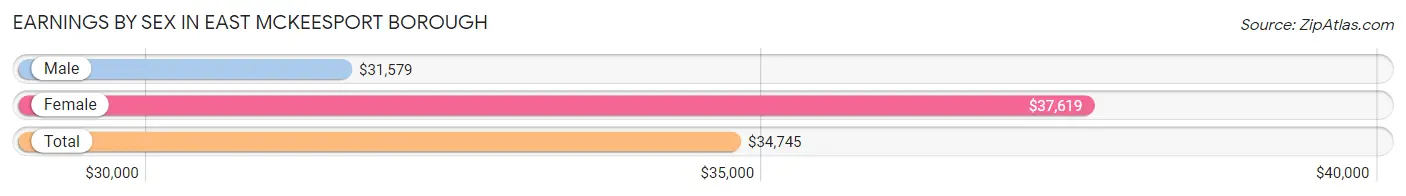
| Sex | Number | Average Earnings |
| Male | 578 (48.1%) | $31,579 |
| Female | 624 (51.9%) | $37,619 |
| Total | 1,202 (100.0%) | $34,745 |
Earnings by Sex by Income Bracket in East McKeesport borough
The most common earnings brackets in East McKeesport borough are $40,000 to $44,999 for men (68 | 11.8%) and $35,000 to $39,999 for women (81 | 13.0%).
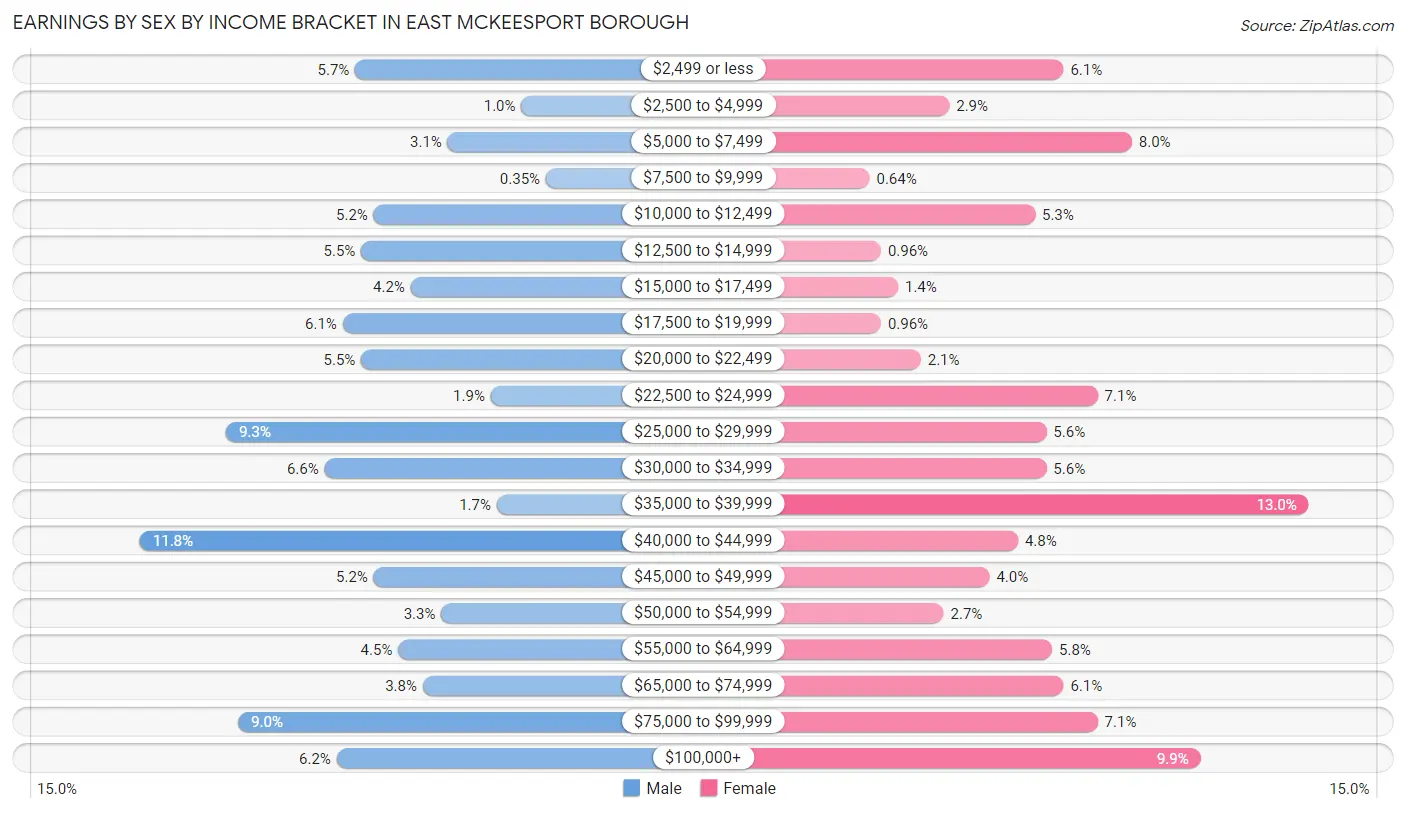
| Income | Male | Female |
| $2,499 or less | 33 (5.7%) | 38 (6.1%) |
| $2,500 to $4,999 | 6 (1.0%) | 18 (2.9%) |
| $5,000 to $7,499 | 18 (3.1%) | 50 (8.0%) |
| $7,500 to $9,999 | 2 (0.4%) | 4 (0.6%) |
| $10,000 to $12,499 | 30 (5.2%) | 33 (5.3%) |
| $12,500 to $14,999 | 32 (5.5%) | 6 (1.0%) |
| $15,000 to $17,499 | 24 (4.2%) | 9 (1.4%) |
| $17,500 to $19,999 | 35 (6.1%) | 6 (1.0%) |
| $20,000 to $22,499 | 32 (5.5%) | 13 (2.1%) |
| $22,500 to $24,999 | 11 (1.9%) | 44 (7.0%) |
| $25,000 to $29,999 | 54 (9.3%) | 35 (5.6%) |
| $30,000 to $34,999 | 38 (6.6%) | 35 (5.6%) |
| $35,000 to $39,999 | 10 (1.7%) | 81 (13.0%) |
| $40,000 to $44,999 | 68 (11.8%) | 30 (4.8%) |
| $45,000 to $49,999 | 30 (5.2%) | 25 (4.0%) |
| $50,000 to $54,999 | 19 (3.3%) | 17 (2.7%) |
| $55,000 to $64,999 | 26 (4.5%) | 36 (5.8%) |
| $65,000 to $74,999 | 22 (3.8%) | 38 (6.1%) |
| $75,000 to $99,999 | 52 (9.0%) | 44 (7.0%) |
| $100,000+ | 36 (6.2%) | 62 (9.9%) |
| Total | 578 (100.0%) | 624 (100.0%) |
Earnings by Sex by Educational Attainment in East McKeesport borough
Average earnings in East McKeesport borough are $32,632 for men and $39,063 for women, a difference of 16.5%. Men with an educational attainment of graduate degree enjoy the highest average annual earnings of $86,094, while those with college or associate's degree education earn the least with $19,286. Women with an educational attainment of graduate degree earn the most with the average annual earnings of $113,355, while those with high school diploma education have the smallest earnings of $29,074.
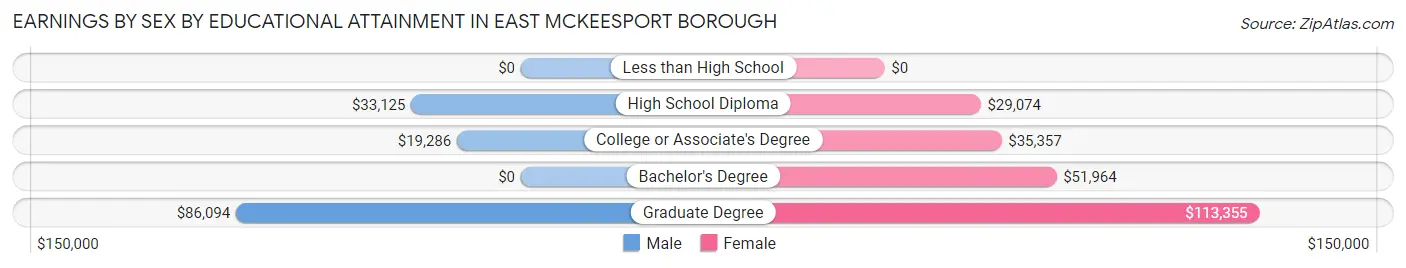
| Educational Attainment | Male Income | Female Income |
| Less than High School | - | - |
| High School Diploma | $33,125 | $29,074 |
| College or Associate's Degree | $19,286 | $35,357 |
| Bachelor's Degree | - | - |
| Graduate Degree | $86,094 | $113,355 |
| Total | $32,632 | $39,063 |
Family Income in East McKeesport borough
Family Income Brackets in East McKeesport borough
According to the East McKeesport borough family income data, there are 171 families falling into the $100,000 to $149,999 income range, which is the most common income bracket and makes up 33.4% of all families.
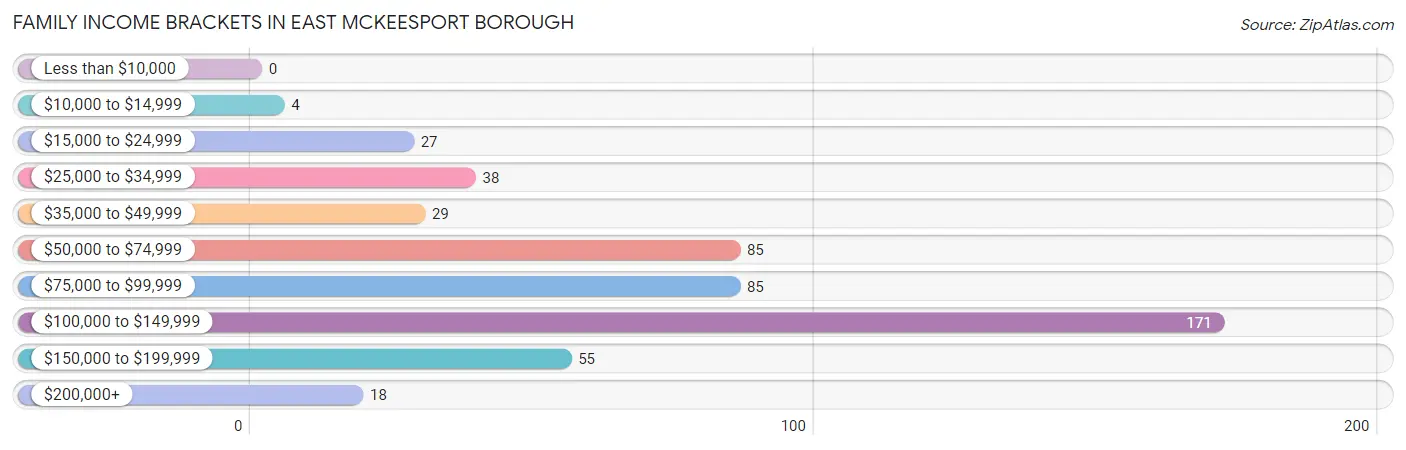
| Income Bracket | # Families | % Families |
| Less than $10,000 | 0 | 0.0% |
| $10,000 to $14,999 | 4 | 0.8% |
| $15,000 to $24,999 | 27 | 5.3% |
| $25,000 to $34,999 | 38 | 7.4% |
| $35,000 to $49,999 | 29 | 5.7% |
| $50,000 to $74,999 | 85 | 16.6% |
| $75,000 to $99,999 | 85 | 16.6% |
| $100,000 to $149,999 | 171 | 33.4% |
| $150,000 to $199,999 | 55 | 10.7% |
| $200,000+ | 18 | 3.5% |
Family Income by Famaliy Size in East McKeesport borough
3-person families (80 | 15.6%) account for the highest median family income in East McKeesport borough with $109,643 per family, while 2-person families (331 | 64.6%) have the highest median income of $42,176 per family member.
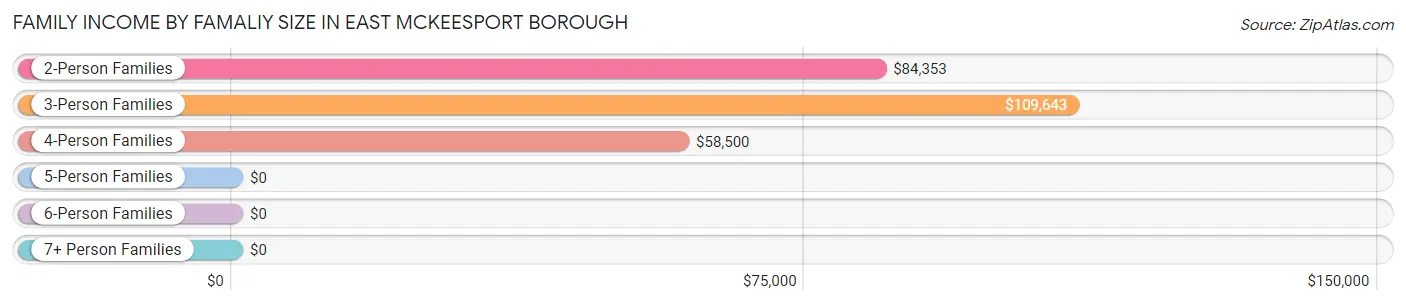
| Income Bracket | # Families | Median Income |
| 2-Person Families | 331 (64.6%) | $84,353 |
| 3-Person Families | 80 (15.6%) | $109,643 |
| 4-Person Families | 46 (9.0%) | $58,500 |
| 5-Person Families | 24 (4.7%) | $0 |
| 6-Person Families | 0 (0.0%) | $0 |
| 7+ Person Families | 31 (6.0%) | $0 |
| Total | 512 (100.0%) | $94,605 |
Family Income by Number of Earners in East McKeesport borough
The median family income in East McKeesport borough is $94,605, with families comprising 3+ earners (33) having the highest median family income of $130,179, while families with no earners (87) have the lowest median family income of $36,375, accounting for 6.5% and 17.0% of families, respectively.
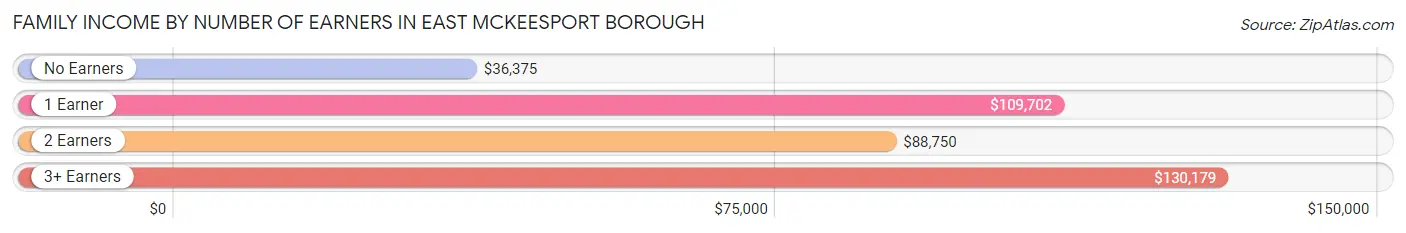
| Number of Earners | # Families | Median Income |
| No Earners | 87 (17.0%) | $36,375 |
| 1 Earner | 131 (25.6%) | $109,702 |
| 2 Earners | 261 (51.0%) | $88,750 |
| 3+ Earners | 33 (6.5%) | $130,179 |
| Total | 512 (100.0%) | $94,605 |
Household Income in East McKeesport borough
Household Income Brackets in East McKeesport borough
With 186 households falling in the category, the $100,000 to $149,999 income range is the most frequent in East McKeesport borough, accounting for 18.4% of all households. In contrast, only 22 households (2.2%) fall into the less than $10,000 income bracket, making it the least populous group.
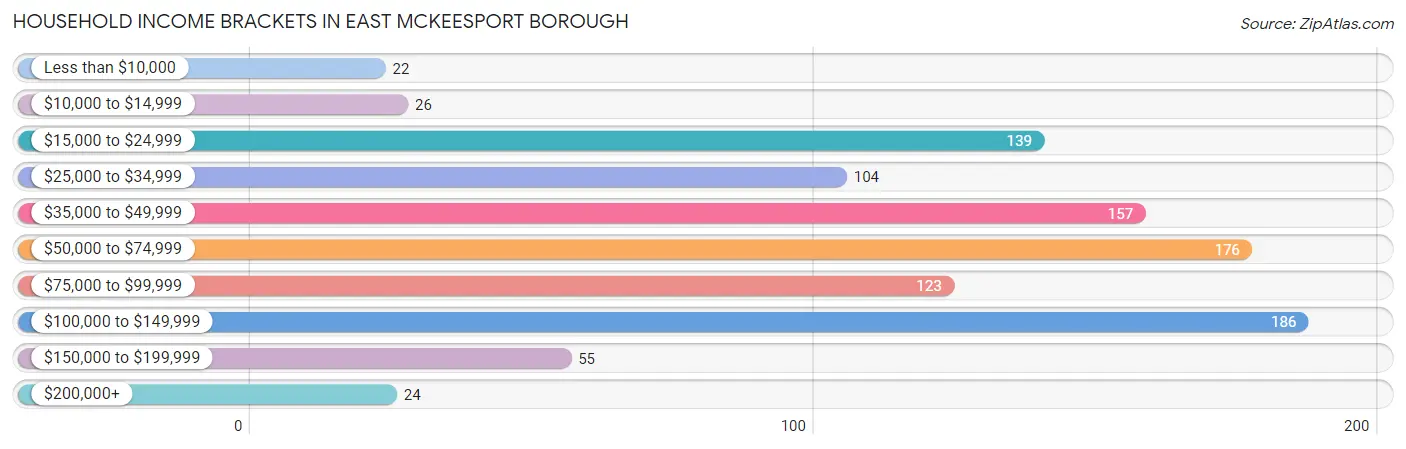
| Income Bracket | # Households | % Households |
| Less than $10,000 | 22 | 2.2% |
| $10,000 to $14,999 | 26 | 2.6% |
| $15,000 to $24,999 | 139 | 13.7% |
| $25,000 to $34,999 | 104 | 10.3% |
| $35,000 to $49,999 | 157 | 15.5% |
| $50,000 to $74,999 | 176 | 17.4% |
| $75,000 to $99,999 | 123 | 12.2% |
| $100,000 to $149,999 | 186 | 18.4% |
| $150,000 to $199,999 | 55 | 5.4% |
| $200,000+ | 24 | 2.4% |
Household Income by Householder Age in East McKeesport borough
The median household income in East McKeesport borough is $60,988, with the highest median household income of $74,250 found in the 45 to 64 years age bracket for the primary householder. A total of 447 households (44.2%) fall into this category.
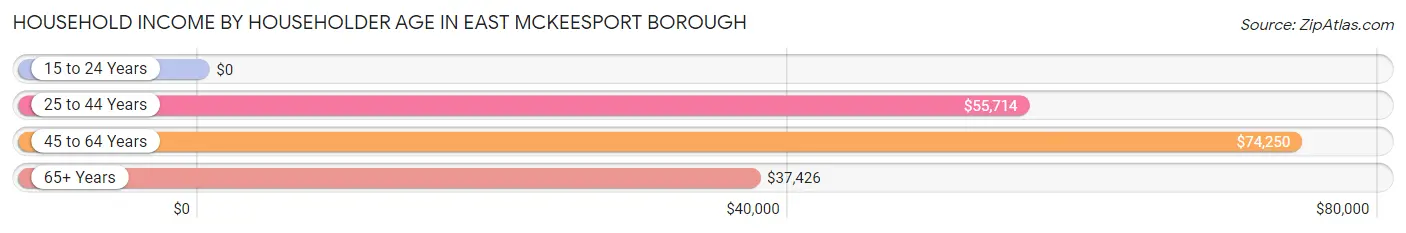
| Income Bracket | # Households | Median Income |
| 15 to 24 Years | 0 (0.0%) | $0 |
| 25 to 44 Years | 262 (25.9%) | $55,714 |
| 45 to 64 Years | 447 (44.2%) | $74,250 |
| 65+ Years | 303 (29.9%) | $37,426 |
| Total | 1,012 (100.0%) | $60,988 |
Poverty in East McKeesport borough
Income Below Poverty by Sex and Age in East McKeesport borough
With 6.5% poverty level for males and 4.0% for females among the residents of East McKeesport borough, 45 to 54 year old males and 55 to 64 year old females are the most vulnerable to poverty, with 20 males (16.3%) and 33 females (26.4%) in their respective age groups living below the poverty level.
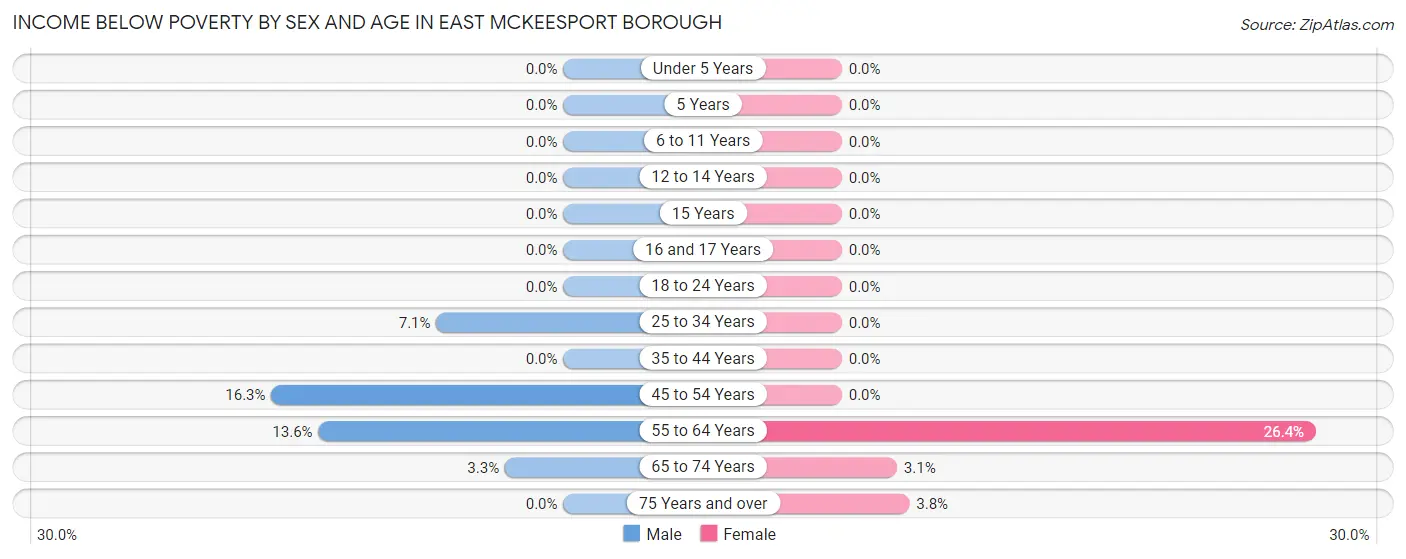
| Age Bracket | Male | Female |
| Under 5 Years | 0 (0.0%) | 0 (0.0%) |
| 5 Years | 0 (0.0%) | 0 (0.0%) |
| 6 to 11 Years | 0 (0.0%) | 0 (0.0%) |
| 12 to 14 Years | 0 (0.0%) | 0 (0.0%) |
| 15 Years | 0 (0.0%) | 0 (0.0%) |
| 16 and 17 Years | 0 (0.0%) | 0 (0.0%) |
| 18 to 24 Years | 0 (0.0%) | 0 (0.0%) |
| 25 to 34 Years | 13 (7.1%) | 0 (0.0%) |
| 35 to 44 Years | 0 (0.0%) | 0 (0.0%) |
| 45 to 54 Years | 20 (16.3%) | 0 (0.0%) |
| 55 to 64 Years | 27 (13.6%) | 33 (26.4%) |
| 65 to 74 Years | 5 (3.3%) | 5 (3.1%) |
| 75 Years and over | 0 (0.0%) | 5 (3.8%) |
| Total | 65 (6.5%) | 43 (4.0%) |
Income Above Poverty by Sex and Age in East McKeesport borough
According to the poverty statistics in East McKeesport borough, males aged under 5 years and females aged under 5 years are the age groups that are most secure financially, with 100.0% of males and 100.0% of females in these age groups living above the poverty line.
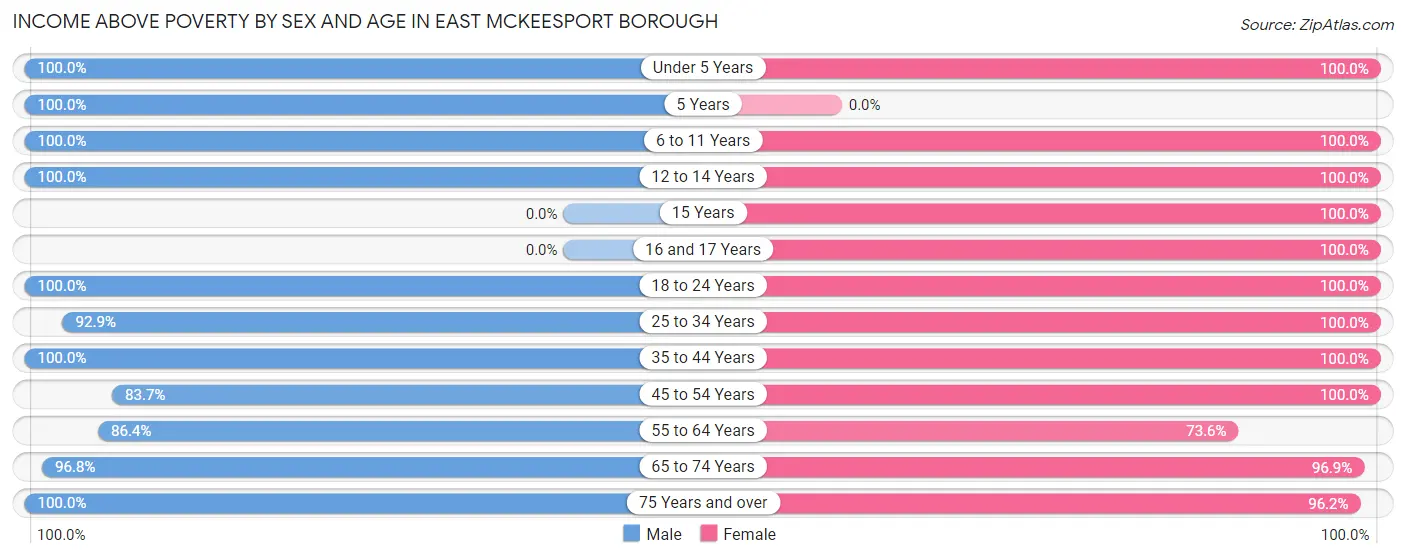
| Age Bracket | Male | Female |
| Under 5 Years | 10 (100.0%) | 8 (100.0%) |
| 5 Years | 13 (100.0%) | 0 (0.0%) |
| 6 to 11 Years | 54 (100.0%) | 57 (100.0%) |
| 12 to 14 Years | 45 (100.0%) | 5 (100.0%) |
| 15 Years | 0 (0.0%) | 24 (100.0%) |
| 16 and 17 Years | 0 (0.0%) | 48 (100.0%) |
| 18 to 24 Years | 82 (100.0%) | 38 (100.0%) |
| 25 to 34 Years | 171 (92.9%) | 156 (100.0%) |
| 35 to 44 Years | 71 (100.0%) | 127 (100.0%) |
| 45 to 54 Years | 103 (83.7%) | 193 (100.0%) |
| 55 to 64 Years | 171 (86.4%) | 92 (73.6%) |
| 65 to 74 Years | 149 (96.8%) | 158 (96.9%) |
| 75 Years and over | 63 (100.0%) | 128 (96.2%) |
| Total | 932 (93.5%) | 1,034 (96.0%) |
Income Below Poverty Among Married-Couple Families in East McKeesport borough
The poverty statistics for married-couple families in East McKeesport borough show that 7.3% or 27 of the total 369 families live below the poverty line. Families with no children have the highest poverty rate of 9.1%, comprising of 27 families. On the other hand, families with 1 or 2 children have the lowest poverty rate of 0.0%, which includes 0 families.
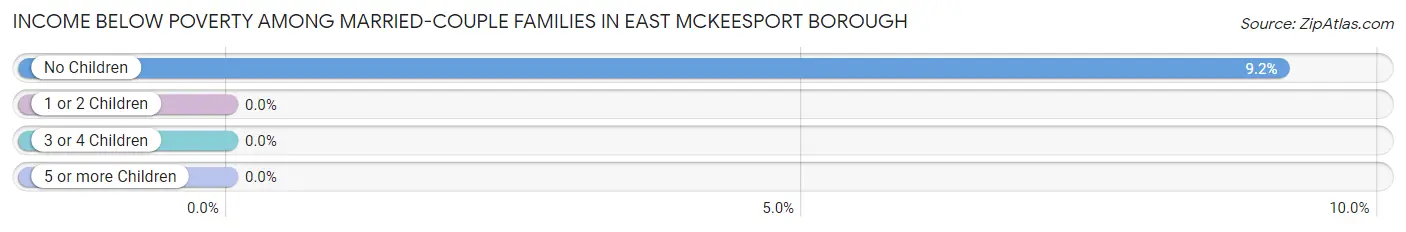
| Children | Above Poverty | Below Poverty |
| No Children | 268 (90.8%) | 27 (9.1%) |
| 1 or 2 Children | 63 (100.0%) | 0 (0.0%) |
| 3 or 4 Children | 11 (100.0%) | 0 (0.0%) |
| 5 or more Children | 0 (0.0%) | 0 (0.0%) |
| Total | 342 (92.7%) | 27 (7.3%) |
Income Below Poverty Among Single-Parent Households in East McKeesport borough
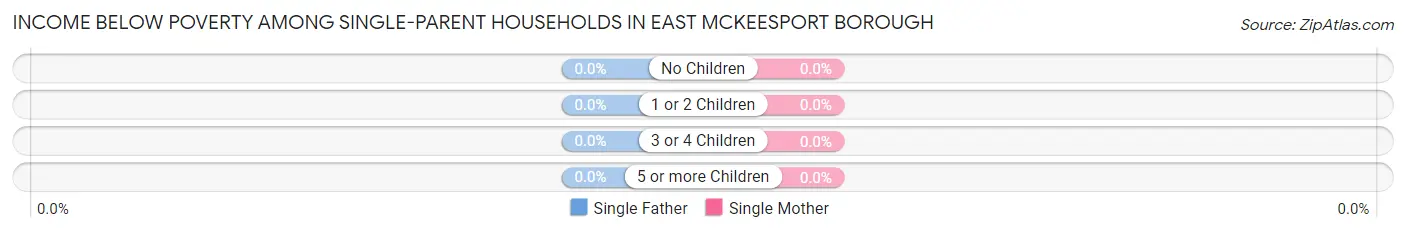
| Children | Single Father | Single Mother |
| No Children | 0 (0.0%) | 0 (0.0%) |
| 1 or 2 Children | 0 (0.0%) | 0 (0.0%) |
| 3 or 4 Children | 0 (0.0%) | 0 (0.0%) |
| 5 or more Children | 0 (0.0%) | 0 (0.0%) |
| Total | 0 (0.0%) | 0 (0.0%) |
Income Below Poverty Among Married-Couple vs Single-Parent Households in East McKeesport borough
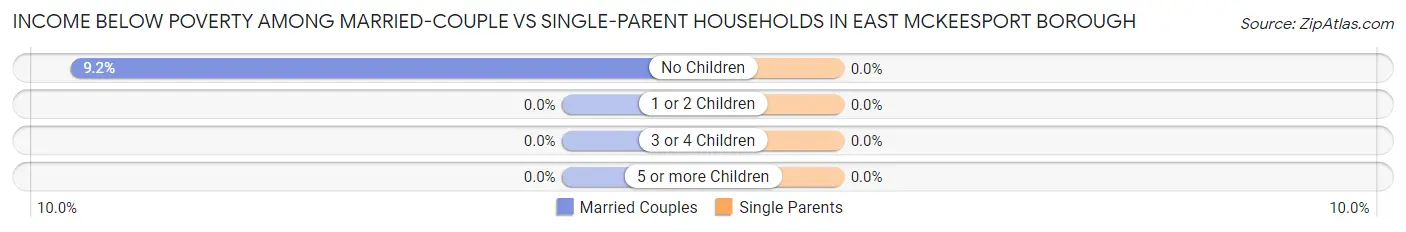
| Children | Married-Couple Families | Single-Parent Households |
| No Children | 27 (9.1%) | 0 (0.0%) |
| 1 or 2 Children | 0 (0.0%) | 0 (0.0%) |
| 3 or 4 Children | 0 (0.0%) | 0 (0.0%) |
| 5 or more Children | 0 (0.0%) | 0 (0.0%) |
| Total | 27 (7.3%) | 0 (0.0%) |
Race in East McKeesport borough
The most populous races in East McKeesport borough are White / Caucasian (1,757 | 84.7%), Black / African American (169 | 8.2%), and Two or more Races (139 | 6.7%).
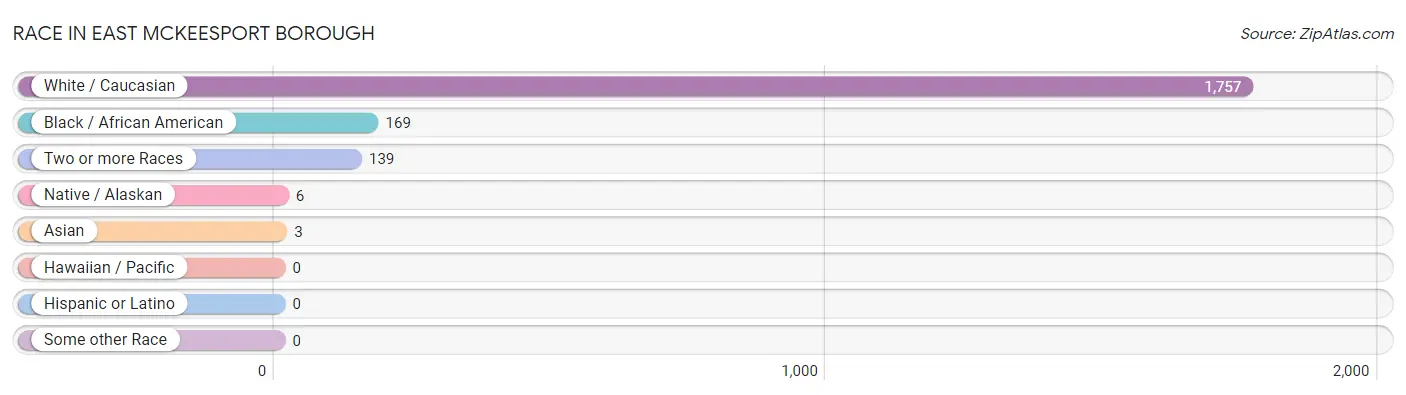
| Race | # Population | % Population |
| Asian | 3 | 0.1% |
| Black / African American | 169 | 8.2% |
| Hawaiian / Pacific | 0 | 0.0% |
| Hispanic or Latino | 0 | 0.0% |
| Native / Alaskan | 6 | 0.3% |
| White / Caucasian | 1,757 | 84.7% |
| Two or more Races | 139 | 6.7% |
| Some other Race | 0 | 0.0% |
| Total | 2,074 | 100.0% |
Ancestry in East McKeesport borough
The most populous ancestries reported in East McKeesport borough are Irish (466 | 22.5%), Italian (428 | 20.6%), German (375 | 18.1%), Polish (364 | 17.5%), and English (253 | 12.2%), together accounting for 90.9% of all East McKeesport borough residents.
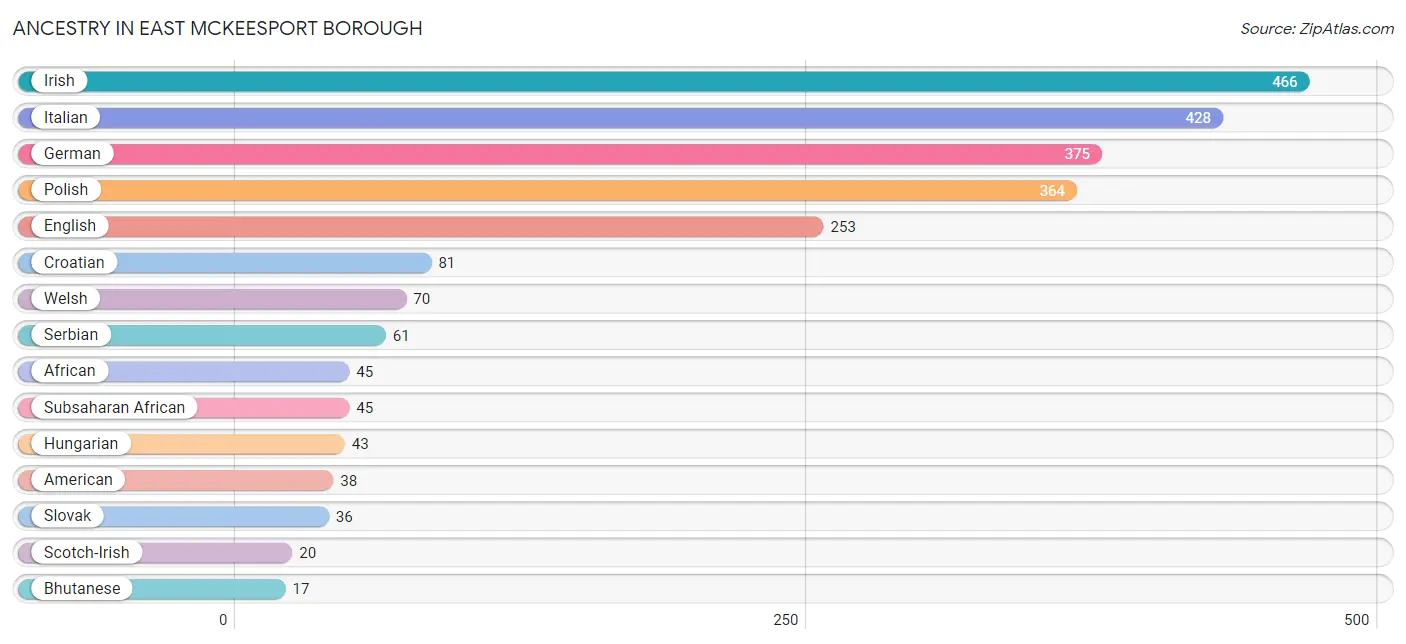
| Ancestry | # Population | % Population |
| African | 45 | 2.2% |
| American | 38 | 1.8% |
| Bhutanese | 17 | 0.8% |
| Cherokee | 6 | 0.3% |
| Croatian | 81 | 3.9% |
| Czech | 6 | 0.3% |
| Czechoslovakian | 2 | 0.1% |
| Dutch | 6 | 0.3% |
| Eastern European | 15 | 0.7% |
| English | 253 | 12.2% |
| German | 375 | 18.1% |
| Hungarian | 43 | 2.1% |
| Irish | 466 | 22.5% |
| Italian | 428 | 20.6% |
| Korean | 3 | 0.1% |
| Lithuanian | 4 | 0.2% |
| Macedonian | 4 | 0.2% |
| Pennsylvania German | 6 | 0.3% |
| Polish | 364 | 17.5% |
| Scotch-Irish | 20 | 1.0% |
| Scottish | 10 | 0.5% |
| Serbian | 61 | 2.9% |
| Slovak | 36 | 1.7% |
| Slovene | 3 | 0.1% |
| Subsaharan African | 45 | 2.2% |
| Swedish | 5 | 0.2% |
| Ukrainian | 15 | 0.7% |
| Welsh | 70 | 3.4% | View All 28 Rows |
Immigrants in East McKeesport borough
The most numerous immigrant groups reported in East McKeesport borough came from Europe (18 | 0.9%), Italy (13 | 0.6%), Southern Europe (13 | 0.6%), Eastern Europe (5 | 0.2%), and Hungary (5 | 0.2%), together accounting for 2.6% of all East McKeesport borough residents.
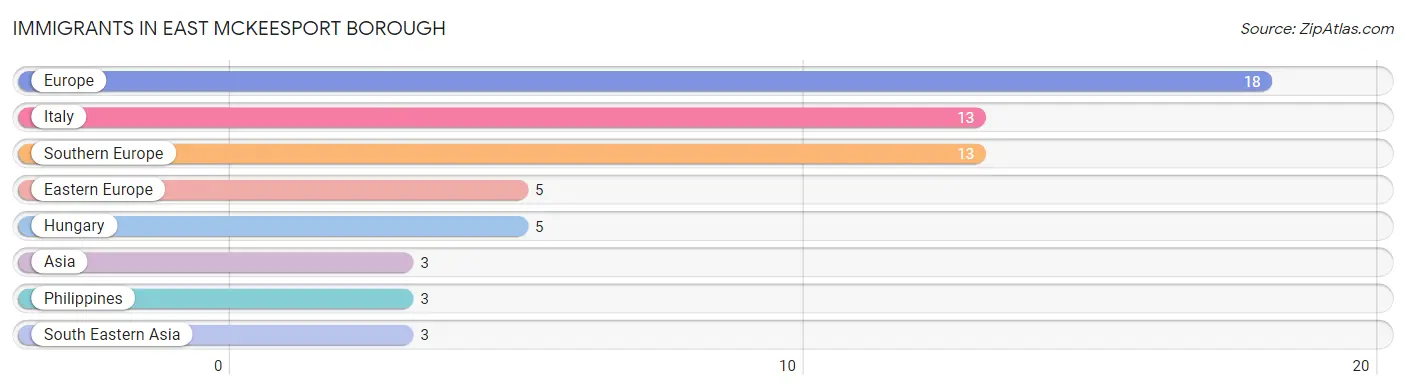
| Immigration Origin | # Population | % Population |
| Asia | 3 | 0.1% |
| Eastern Europe | 5 | 0.2% |
| Europe | 18 | 0.9% |
| Hungary | 5 | 0.2% |
| Italy | 13 | 0.6% |
| Philippines | 3 | 0.1% |
| South Eastern Asia | 3 | 0.1% |
| Southern Europe | 13 | 0.6% | View All 8 Rows |
Sex and Age in East McKeesport borough
Sex and Age in East McKeesport borough
The most populous age groups in East McKeesport borough are 60 to 64 Years (125 | 12.5%) for men and 65 to 69 Years (112 | 10.4%) for women.
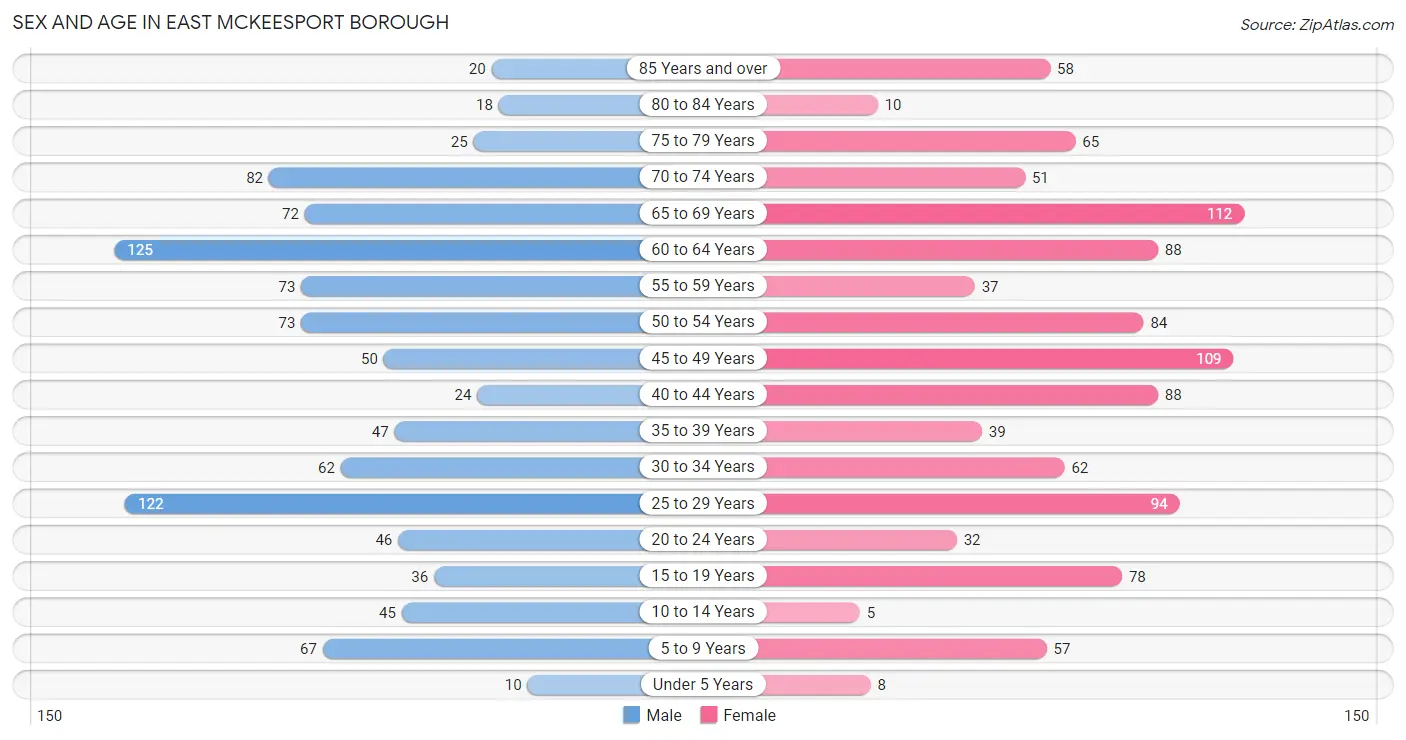
| Age Bracket | Male | Female |
| Under 5 Years | 10 (1.0%) | 8 (0.7%) |
| 5 to 9 Years | 67 (6.7%) | 57 (5.3%) |
| 10 to 14 Years | 45 (4.5%) | 5 (0.5%) |
| 15 to 19 Years | 36 (3.6%) | 78 (7.2%) |
| 20 to 24 Years | 46 (4.6%) | 32 (3.0%) |
| 25 to 29 Years | 122 (12.2%) | 94 (8.7%) |
| 30 to 34 Years | 62 (6.2%) | 62 (5.8%) |
| 35 to 39 Years | 47 (4.7%) | 39 (3.6%) |
| 40 to 44 Years | 24 (2.4%) | 88 (8.2%) |
| 45 to 49 Years | 50 (5.0%) | 109 (10.1%) |
| 50 to 54 Years | 73 (7.3%) | 84 (7.8%) |
| 55 to 59 Years | 73 (7.3%) | 37 (3.4%) |
| 60 to 64 Years | 125 (12.5%) | 88 (8.2%) |
| 65 to 69 Years | 72 (7.2%) | 112 (10.4%) |
| 70 to 74 Years | 82 (8.2%) | 51 (4.7%) |
| 75 to 79 Years | 25 (2.5%) | 65 (6.0%) |
| 80 to 84 Years | 18 (1.8%) | 10 (0.9%) |
| 85 Years and over | 20 (2.0%) | 58 (5.4%) |
| Total | 997 (100.0%) | 1,077 (100.0%) |
Families and Households in East McKeesport borough
Median Family Size in East McKeesport borough
The median family size in East McKeesport borough is 2.91 persons per family, with single female/mother families (120 | 23.4%) accounting for the largest median family size of 3.47 persons per family. On the other hand, single male/father families (23 | 4.5%) represent the smallest median family size with 2.00 persons per family.
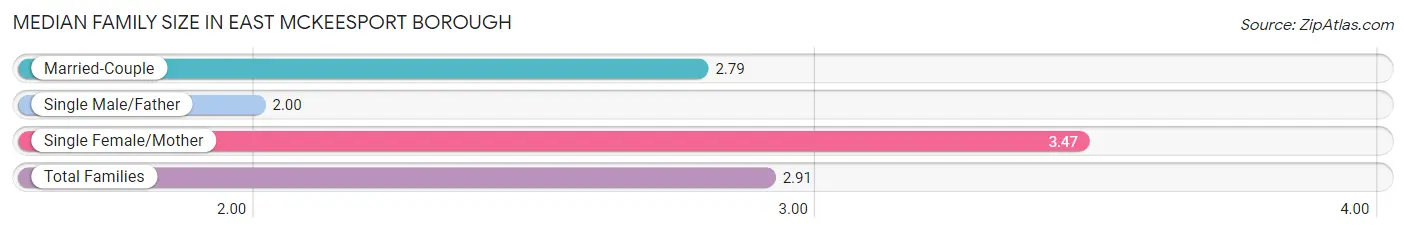
| Family Type | # Families | Family Size |
| Married-Couple | 369 (72.1%) | 2.79 |
| Single Male/Father | 23 (4.5%) | 2.00 |
| Single Female/Mother | 120 (23.4%) | 3.47 |
| Total Families | 512 (100.0%) | 2.91 |
Median Household Size in East McKeesport borough
The median household size in East McKeesport borough is 2.05 persons per household, with single female/mother households (120 | 11.9%) accounting for the largest median household size of 3.47 persons per household. non-family households (500 | 49.4%) represent the smallest median household size with 1.17 persons per household.
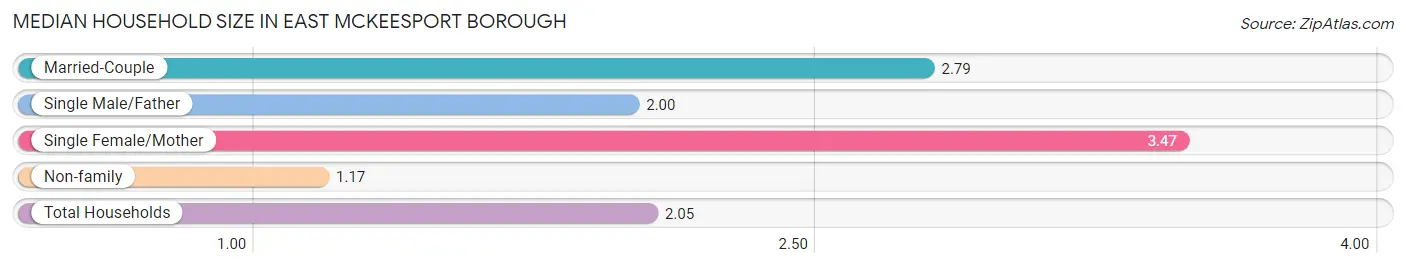
| Household Type | # Households | Household Size |
| Married-Couple | 369 (36.5%) | 2.79 |
| Single Male/Father | 23 (2.3%) | 2.00 |
| Single Female/Mother | 120 (11.9%) | 3.47 |
| Non-family | 500 (49.4%) | 1.17 |
| Total Households | 1,012 (100.0%) | 2.05 |
Household Size by Marriage Status in East McKeesport borough
Out of a total of 1,012 households in East McKeesport borough, 512 (50.6%) are family households, while 500 (49.4%) are nonfamily households. The most numerous type of family households are 2-person households, comprising 331, and the most common type of nonfamily households are 1-person households, comprising 414.
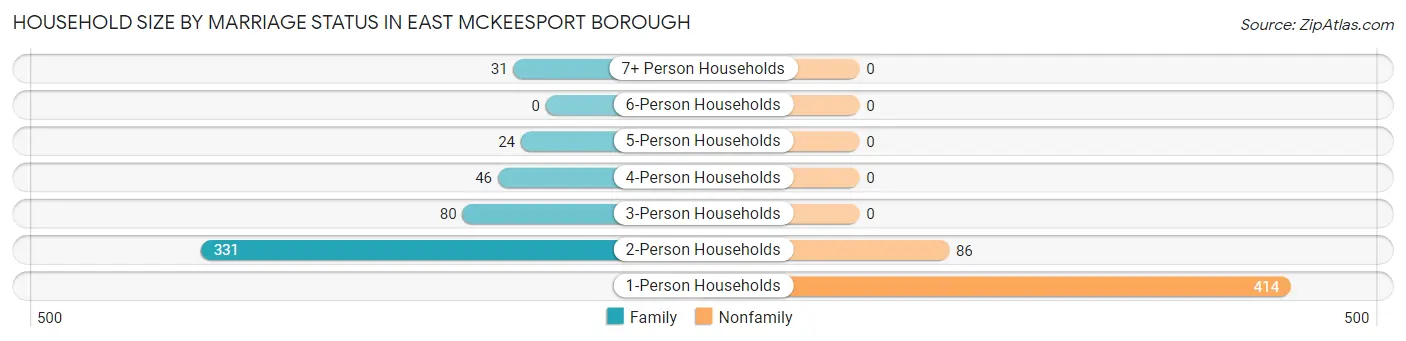
| Household Size | Family Households | Nonfamily Households |
| 1-Person Households | - | 414 (40.9%) |
| 2-Person Households | 331 (32.7%) | 86 (8.5%) |
| 3-Person Households | 80 (7.9%) | 0 (0.0%) |
| 4-Person Households | 46 (4.5%) | 0 (0.0%) |
| 5-Person Households | 24 (2.4%) | 0 (0.0%) |
| 6-Person Households | 0 (0.0%) | 0 (0.0%) |
| 7+ Person Households | 31 (3.1%) | 0 (0.0%) |
| Total | 512 (50.6%) | 500 (49.4%) |
Female Fertility in East McKeesport borough
Fertility by Age in East McKeesport borough
| Age Bracket | Women with Births | Births / 1,000 Women |
| 15 to 19 years | 0 (0.0%) | 0.0 |
| 20 to 34 years | 0 (0.0%) | 0.0 |
| 35 to 50 years | 0 (0.0%) | 0.0 |
| Total | 0 (0.0%) | 0.0 |
Fertility by Age by Marriage Status in East McKeesport borough
| Age Bracket | Married | Unmarried |
| 15 to 19 years | 0 (0.0%) | 0 (0.0%) |
| 20 to 34 years | 0 (0.0%) | 0 (0.0%) |
| 35 to 50 years | 0 (0.0%) | 0 (0.0%) |
| Total | 0 (0.0%) | 0 (0.0%) |
Fertility by Education in East McKeesport borough
| Educational Attainment | Women with Births | Births / 1,000 Women |
| Less than High School | 0 (0.0%) | 0.0 |
| High School Diploma | 0 (0.0%) | 0.0 |
| College or Associate's Degree | 0 (0.0%) | 0.0 |
| Bachelor's Degree | 0 (0.0%) | 0.0 |
| Graduate Degree | 0 (0.0%) | 0.0 |
| Total | 0 (0.0%) | 0.0 |
Fertility by Education by Marriage Status in East McKeesport borough
| Educational Attainment | Married | Unmarried |
| Less than High School | 0 (0.0%) | 0 (0.0%) |
| High School Diploma | 0 (0.0%) | 0 (0.0%) |
| College or Associate's Degree | 0 (0.0%) | 0 (0.0%) |
| Bachelor's Degree | 0 (0.0%) | 0 (0.0%) |
| Graduate Degree | 0 (0.0%) | 0 (0.0%) |
| Total | 0 (0.0%) | 0 (0.0%) |
Employment Characteristics in East McKeesport borough
Employment by Class of Employer in East McKeesport borough
Among the 1,096 employed individuals in East McKeesport borough, private company employees (761 | 69.4%), not-for-profit organizations (141 | 12.9%), and local government employees (70 | 6.4%) make up the most common classes of employment.
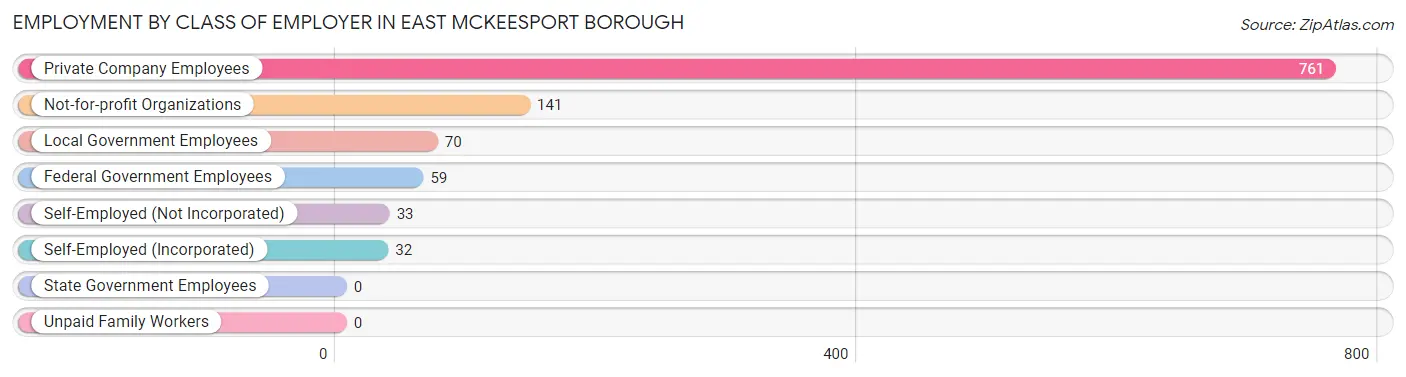
| Employer Class | # Employees | % Employees |
| Private Company Employees | 761 | 69.4% |
| Self-Employed (Incorporated) | 32 | 2.9% |
| Self-Employed (Not Incorporated) | 33 | 3.0% |
| Not-for-profit Organizations | 141 | 12.9% |
| Local Government Employees | 70 | 6.4% |
| State Government Employees | 0 | 0.0% |
| Federal Government Employees | 59 | 5.4% |
| Unpaid Family Workers | 0 | 0.0% |
| Total | 1,096 | 100.0% |
Employment Status by Age in East McKeesport borough
According to the labor force statistics for East McKeesport borough, out of the total population over 16 years of age (1,858), 63.5% or 1,180 individuals are in the labor force, with 6.8% or 80 of them unemployed. The age group with the highest labor force participation rate is 30 to 34 years, with 100.0% or 124 individuals in the labor force. Within the labor force, the 20 to 24 years age range has the highest percentage of unemployed individuals, with 35.1% or 26 of them being unemployed.
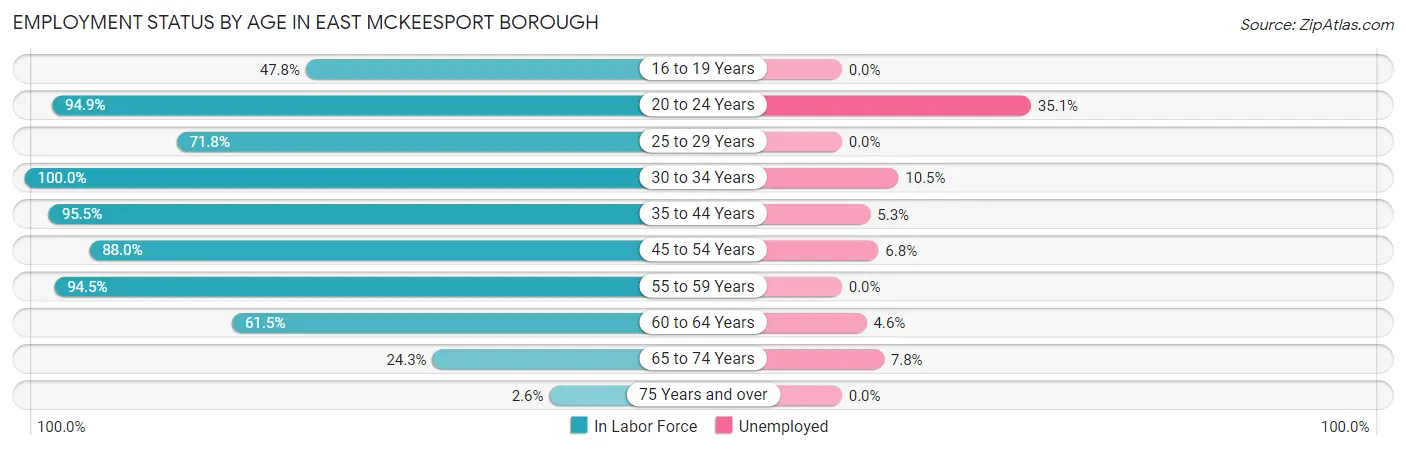
| Age Bracket | In Labor Force | Unemployed |
| 16 to 19 Years | 43 (47.8%) | 0 (0.0%) |
| 20 to 24 Years | 74 (94.9%) | 26 (35.1%) |
| 25 to 29 Years | 155 (71.8%) | 0 (0.0%) |
| 30 to 34 Years | 124 (100.0%) | 13 (10.5%) |
| 35 to 44 Years | 189 (95.5%) | 10 (5.3%) |
| 45 to 54 Years | 278 (88.0%) | 19 (6.8%) |
| 55 to 59 Years | 104 (94.5%) | 0 (0.0%) |
| 60 to 64 Years | 131 (61.5%) | 6 (4.6%) |
| 65 to 74 Years | 77 (24.3%) | 6 (7.8%) |
| 75 Years and over | 5 (2.6%) | 0 (0.0%) |
| Total | 1,180 (63.5%) | 80 (6.8%) |
Employment Status by Educational Attainment in East McKeesport borough
According to labor force statistics for East McKeesport borough, 83.3% of individuals (980) out of the total population between 25 and 64 years of age (1,177) are in the labor force, with 4.9% or 48 of them being unemployed. The group with the highest labor force participation rate are those with the educational attainment of bachelor's degree or higher, with 96.3% or 309 individuals in the labor force. Within the labor force, individuals with less than high school education have the highest percentage of unemployment, with 22.4% or 13 of them being unemployed.
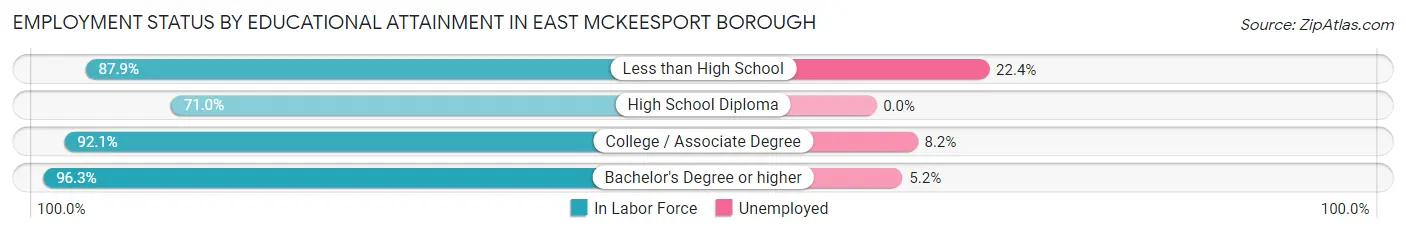
| Educational Attainment | In Labor Force | Unemployed |
| Less than High School | 58 (87.9%) | 15 (22.4%) |
| High School Diploma | 382 (71.0%) | 0 (0.0%) |
| College / Associate Degree | 232 (92.1%) | 21 (8.2%) |
| Bachelor's Degree or higher | 309 (96.3%) | 17 (5.2%) |
| Total | 980 (83.3%) | 58 (4.9%) |
Employment Occupations by Sex in East McKeesport borough
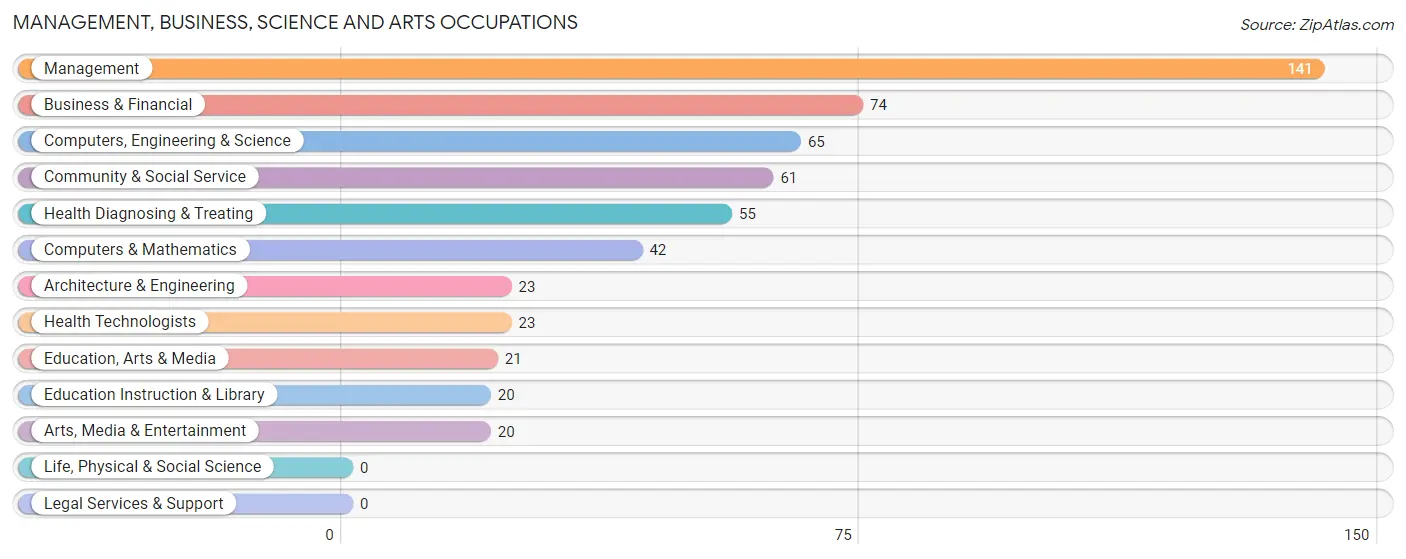
Management, Business, Science and Arts Occupations
The most common Management, Business, Science and Arts occupations in East McKeesport borough are Management (141 | 12.8%), Business & Financial (74 | 6.7%), Computers, Engineering & Science (65 | 5.9%), Community & Social Service (61 | 5.6%), and Health Diagnosing & Treating (55 | 5.0%).
Management, Business, Science and Arts Occupations by Sex
Within the Management, Business, Science and Arts occupations in East McKeesport borough, the most male-oriented occupations are Architecture & Engineering (100.0%), Arts, Media & Entertainment (75.0%), and Computers, Engineering & Science (72.3%), while the most female-oriented occupations are Health Diagnosing & Treating (100.0%), Health Technologists (100.0%), and Education Instruction & Library (80.0%).
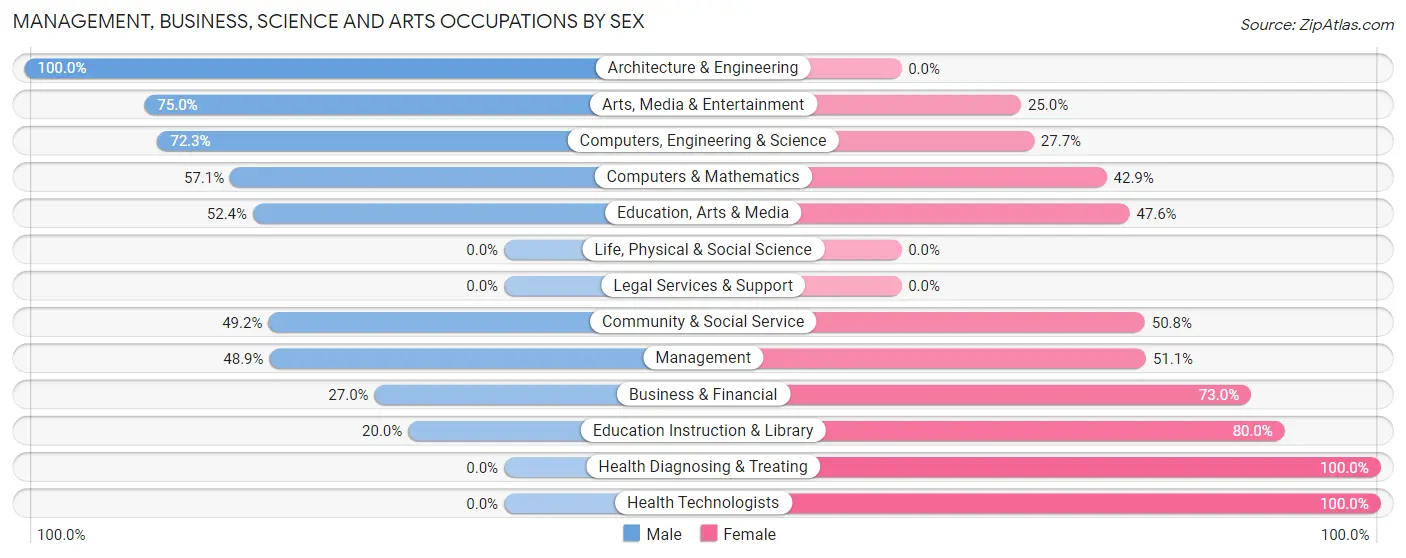
| Occupation | Male | Female |
| Management | 69 (48.9%) | 72 (51.1%) |
| Business & Financial | 20 (27.0%) | 54 (73.0%) |
| Computers, Engineering & Science | 47 (72.3%) | 18 (27.7%) |
| Computers & Mathematics | 24 (57.1%) | 18 (42.9%) |
| Architecture & Engineering | 23 (100.0%) | 0 (0.0%) |
| Life, Physical & Social Science | 0 (0.0%) | 0 (0.0%) |
| Community & Social Service | 30 (49.2%) | 31 (50.8%) |
| Education, Arts & Media | 11 (52.4%) | 10 (47.6%) |
| Legal Services & Support | 0 (0.0%) | 0 (0.0%) |
| Education Instruction & Library | 4 (20.0%) | 16 (80.0%) |
| Arts, Media & Entertainment | 15 (75.0%) | 5 (25.0%) |
| Health Diagnosing & Treating | 0 (0.0%) | 55 (100.0%) |
| Health Technologists | 0 (0.0%) | 23 (100.0%) |
| Total (Category) | 166 (41.9%) | 230 (58.1%) |
| Total (Overall) | 512 (46.6%) | 588 (53.4%) |
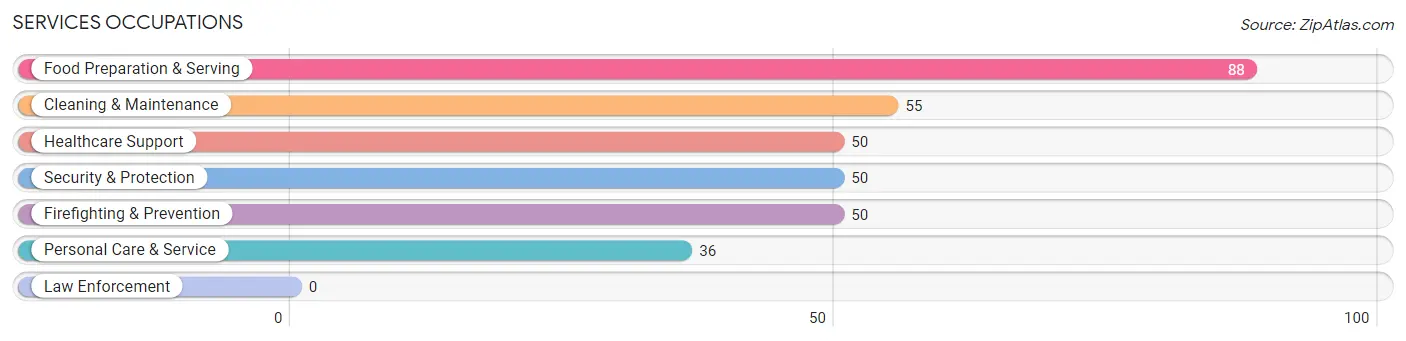
Services Occupations
The most common Services occupations in East McKeesport borough are Food Preparation & Serving (88 | 8.0%), Cleaning & Maintenance (55 | 5.0%), Healthcare Support (50 | 4.5%), Security & Protection (50 | 4.5%), and Firefighting & Prevention (50 | 4.5%).
Services Occupations by Sex
Within the Services occupations in East McKeesport borough, the most male-oriented occupations are Cleaning & Maintenance (56.4%), Food Preparation & Serving (43.2%), and Healthcare Support (12.0%), while the most female-oriented occupations are Security & Protection (100.0%), Firefighting & Prevention (100.0%), and Personal Care & Service (100.0%).
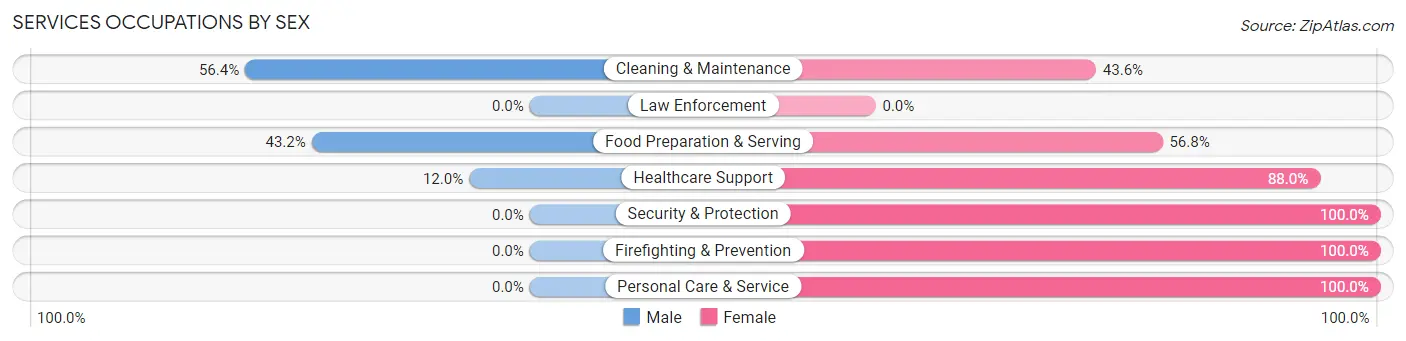
| Occupation | Male | Female |
| Healthcare Support | 6 (12.0%) | 44 (88.0%) |
| Security & Protection | 0 (0.0%) | 50 (100.0%) |
| Firefighting & Prevention | 0 (0.0%) | 50 (100.0%) |
| Law Enforcement | 0 (0.0%) | 0 (0.0%) |
| Food Preparation & Serving | 38 (43.2%) | 50 (56.8%) |
| Cleaning & Maintenance | 31 (56.4%) | 24 (43.6%) |
| Personal Care & Service | 0 (0.0%) | 36 (100.0%) |
| Total (Category) | 75 (26.9%) | 204 (73.1%) |
| Total (Overall) | 512 (46.6%) | 588 (53.4%) |
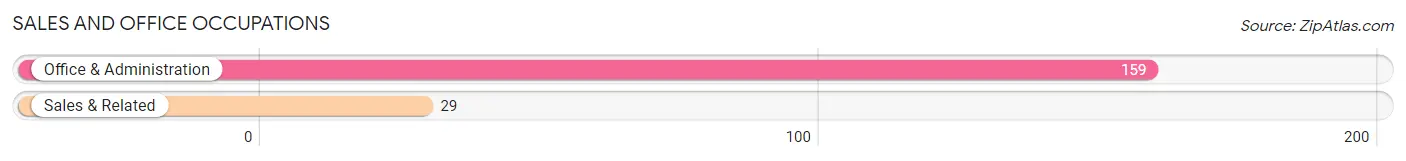
Sales and Office Occupations
The most common Sales and Office occupations in East McKeesport borough are Office & Administration (159 | 14.4%), and Sales & Related (29 | 2.6%).
Sales and Office Occupations by Sex
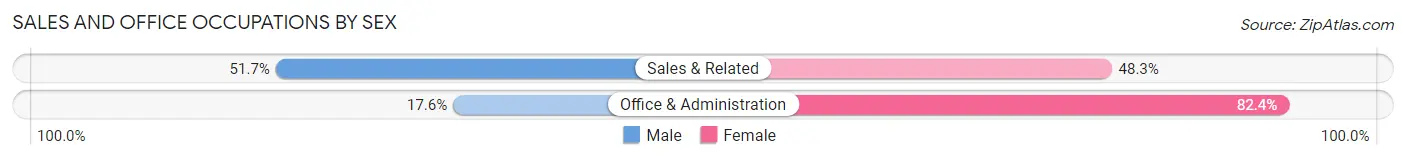
| Occupation | Male | Female |
| Sales & Related | 15 (51.7%) | 14 (48.3%) |
| Office & Administration | 28 (17.6%) | 131 (82.4%) |
| Total (Category) | 43 (22.9%) | 145 (77.1%) |
| Total (Overall) | 512 (46.6%) | 588 (53.4%) |
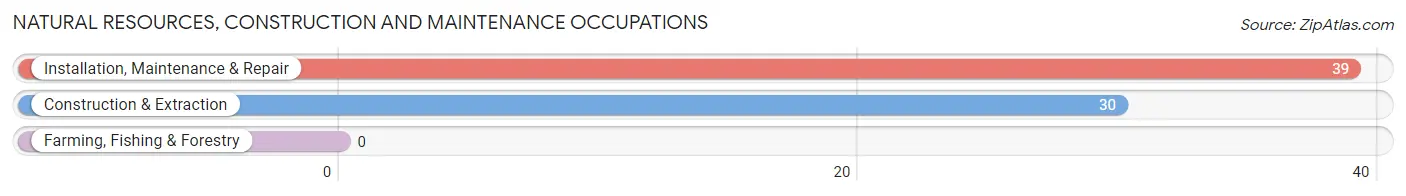
Natural Resources, Construction and Maintenance Occupations
The most common Natural Resources, Construction and Maintenance occupations in East McKeesport borough are Installation, Maintenance & Repair (39 | 3.5%), and Construction & Extraction (30 | 2.7%).
Natural Resources, Construction and Maintenance Occupations by Sex
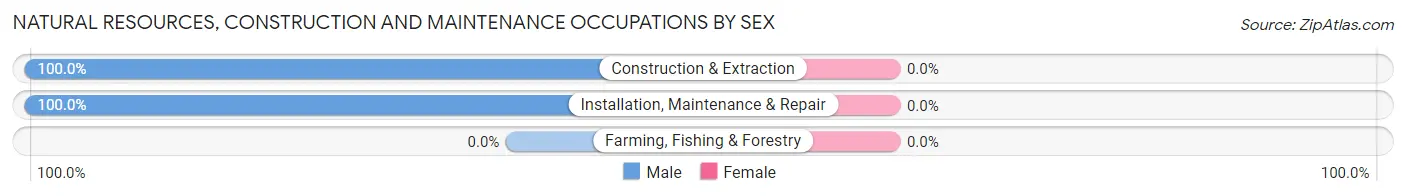
| Occupation | Male | Female |
| Farming, Fishing & Forestry | 0 (0.0%) | 0 (0.0%) |
| Construction & Extraction | 30 (100.0%) | 0 (0.0%) |
| Installation, Maintenance & Repair | 39 (100.0%) | 0 (0.0%) |
| Total (Category) | 69 (100.0%) | 0 (0.0%) |
| Total (Overall) | 512 (46.6%) | 588 (53.4%) |
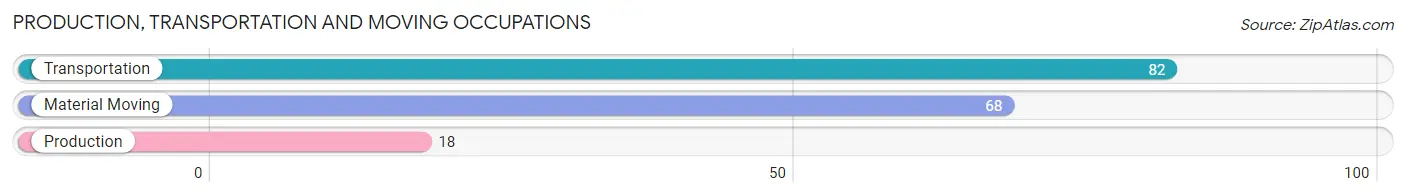
Production, Transportation and Moving Occupations
The most common Production, Transportation and Moving occupations in East McKeesport borough are Transportation (82 | 7.4%), Material Moving (68 | 6.2%), and Production (18 | 1.6%).
Production, Transportation and Moving Occupations by Sex
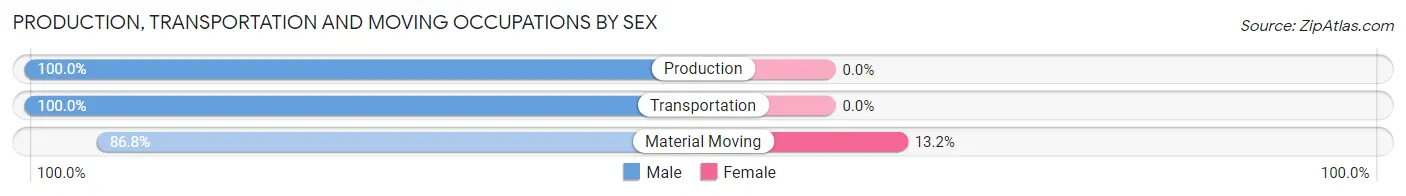
| Occupation | Male | Female |
| Production | 18 (100.0%) | 0 (0.0%) |
| Transportation | 82 (100.0%) | 0 (0.0%) |
| Material Moving | 59 (86.8%) | 9 (13.2%) |
| Total (Category) | 159 (94.6%) | 9 (5.4%) |
| Total (Overall) | 512 (46.6%) | 588 (53.4%) |
Employment Industries by Sex in East McKeesport borough
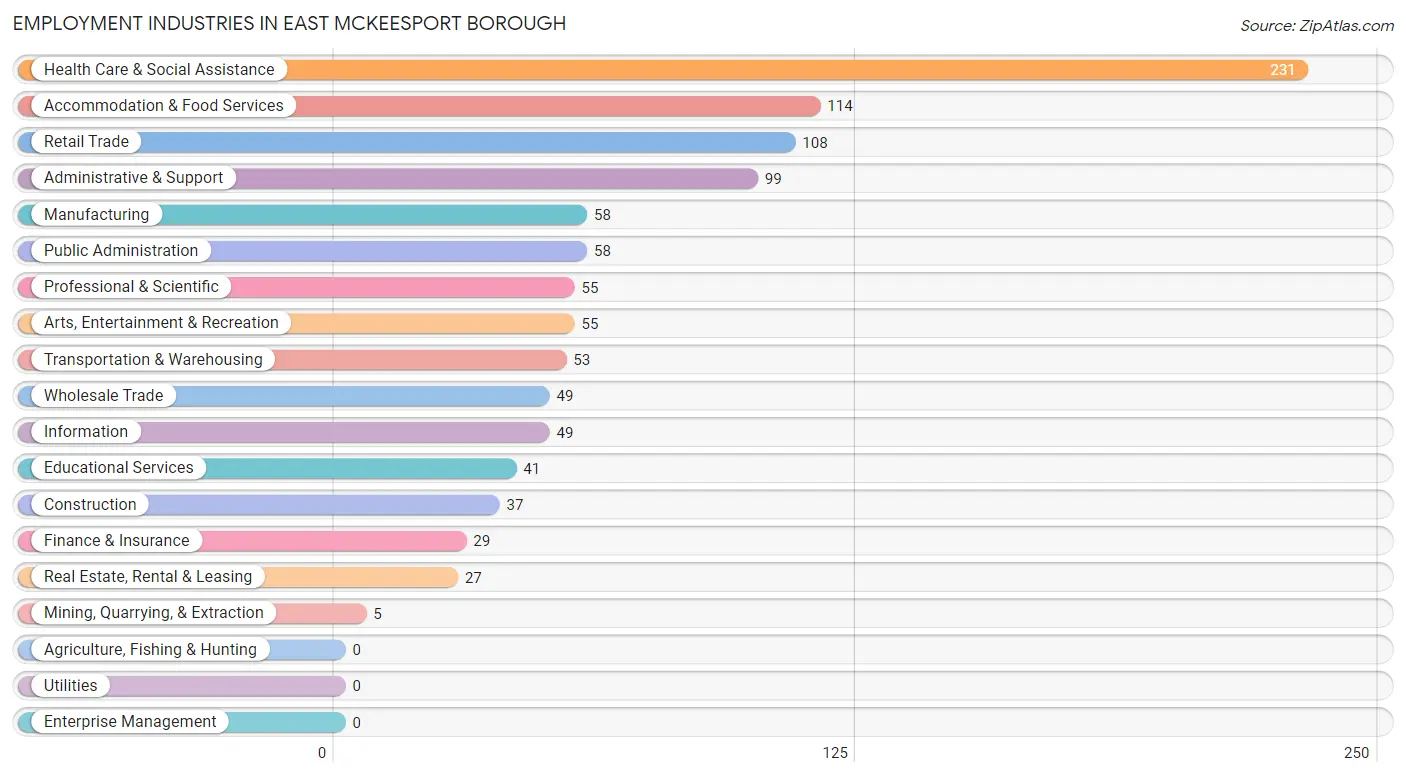
Employment Industries in East McKeesport borough
The major employment industries in East McKeesport borough include Health Care & Social Assistance (231 | 21.0%), Accommodation & Food Services (114 | 10.4%), Retail Trade (108 | 9.8%), Administrative & Support (99 | 9.0%), and Manufacturing (58 | 5.3%).
Employment Industries by Sex in East McKeesport borough
The East McKeesport borough industries that see more men than women are Construction (100.0%), Wholesale Trade (100.0%), and Transportation & Warehousing (100.0%), whereas the industries that tend to have a higher number of women are Mining, Quarrying, & Extraction (100.0%), Health Care & Social Assistance (90.5%), and Finance & Insurance (89.7%).
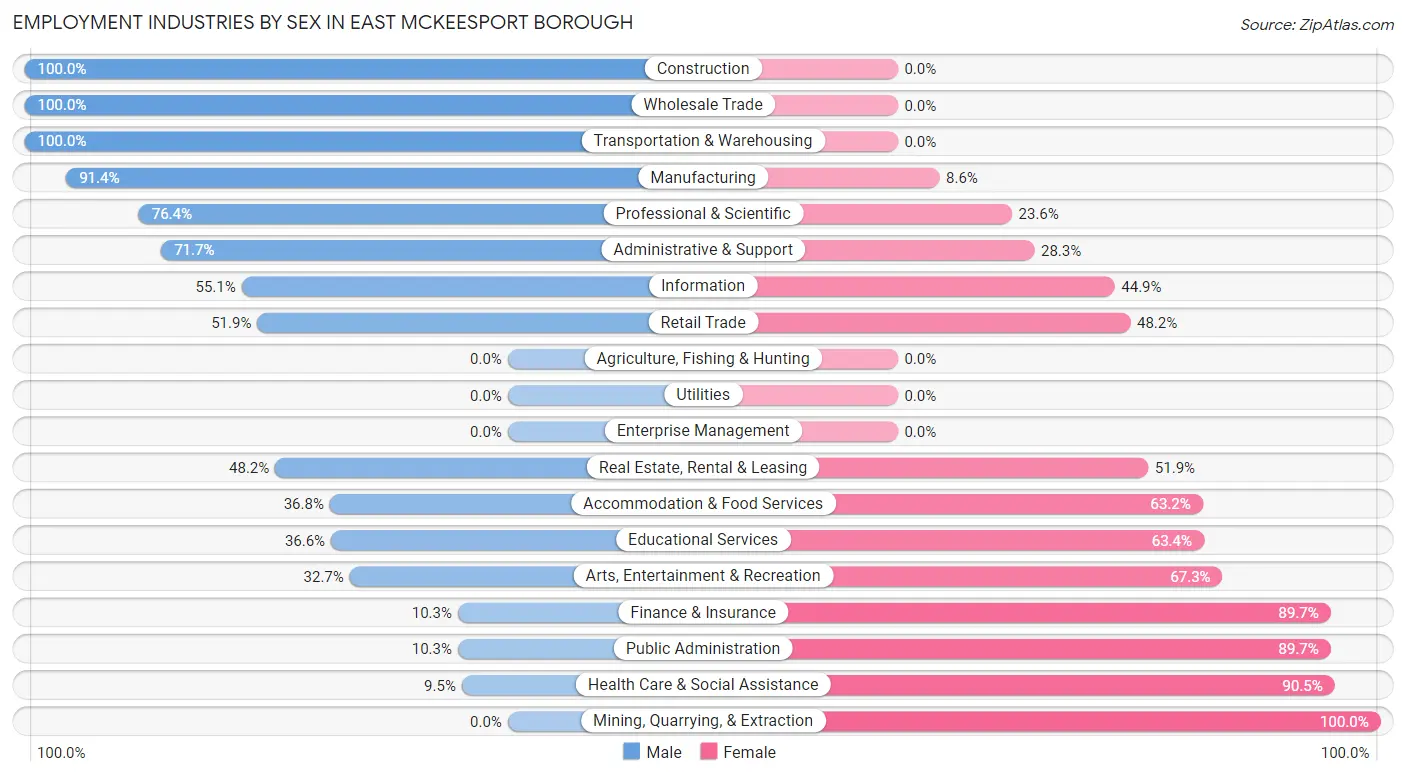
| Industry | Male | Female |
| Agriculture, Fishing & Hunting | 0 (0.0%) | 0 (0.0%) |
| Mining, Quarrying, & Extraction | 0 (0.0%) | 5 (100.0%) |
| Construction | 37 (100.0%) | 0 (0.0%) |
| Manufacturing | 53 (91.4%) | 5 (8.6%) |
| Wholesale Trade | 49 (100.0%) | 0 (0.0%) |
| Retail Trade | 56 (51.8%) | 52 (48.1%) |
| Transportation & Warehousing | 53 (100.0%) | 0 (0.0%) |
| Utilities | 0 (0.0%) | 0 (0.0%) |
| Information | 27 (55.1%) | 22 (44.9%) |
| Finance & Insurance | 3 (10.3%) | 26 (89.7%) |
| Real Estate, Rental & Leasing | 13 (48.1%) | 14 (51.8%) |
| Professional & Scientific | 42 (76.4%) | 13 (23.6%) |
| Enterprise Management | 0 (0.0%) | 0 (0.0%) |
| Administrative & Support | 71 (71.7%) | 28 (28.3%) |
| Educational Services | 15 (36.6%) | 26 (63.4%) |
| Health Care & Social Assistance | 22 (9.5%) | 209 (90.5%) |
| Arts, Entertainment & Recreation | 18 (32.7%) | 37 (67.3%) |
| Accommodation & Food Services | 42 (36.8%) | 72 (63.2%) |
| Public Administration | 6 (10.3%) | 52 (89.7%) |
| Total | 512 (46.6%) | 588 (53.4%) |
Education in East McKeesport borough
School Enrollment in East McKeesport borough
The most common levels of schooling among the 341 students in East McKeesport borough are high school (104 | 30.5%), elementary school (87 | 25.5%), and middle school (50 | 14.7%).
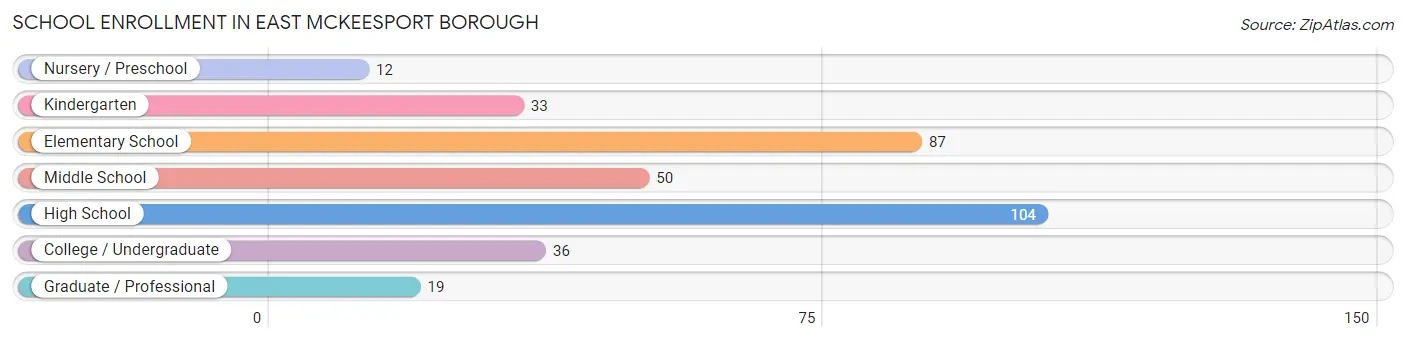
| School Level | # Students | % Students |
| Nursery / Preschool | 12 | 3.5% |
| Kindergarten | 33 | 9.7% |
| Elementary School | 87 | 25.5% |
| Middle School | 50 | 14.7% |
| High School | 104 | 30.5% |
| College / Undergraduate | 36 | 10.6% |
| Graduate / Professional | 19 | 5.6% |
| Total | 341 | 100.0% |
School Enrollment by Age by Funding Source in East McKeesport borough
Out of a total of 341 students who are enrolled in schools in East McKeesport borough, 16 (4.7%) attend a private institution, while the remaining 325 (95.3%) are enrolled in public schools. The age group of 3 to 4 year olds has the highest likelihood of being enrolled in private schools, with 8 (100.0% in the age bracket) enrolled. Conversely, the age group of 5 to 9 year old has the lowest likelihood of being enrolled in a private school, with 124 (100.0% in the age bracket) attending a public institution.
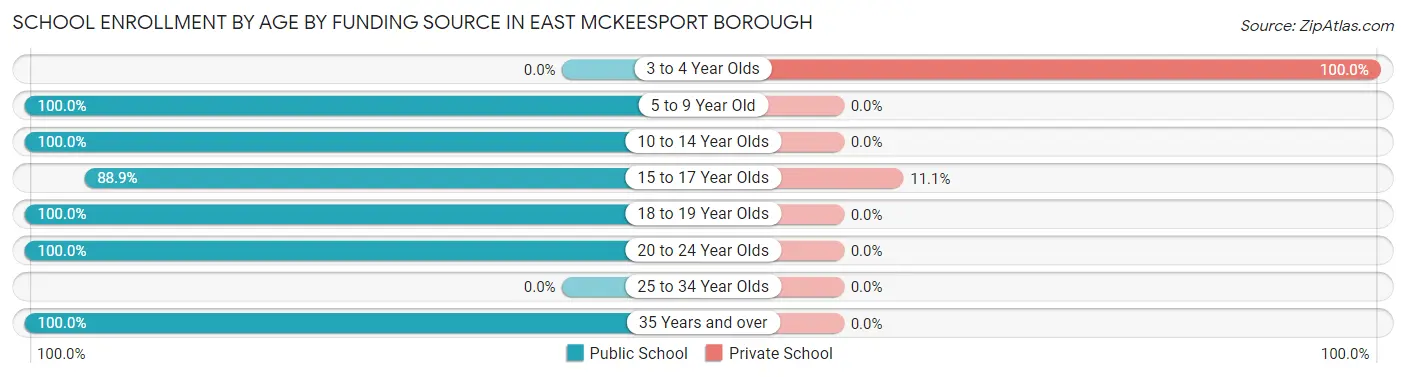
| Age Bracket | Public School | Private School |
| 3 to 4 Year Olds | 0 (0.0%) | 8 (100.0%) |
| 5 to 9 Year Old | 124 (100.0%) | 0 (0.0%) |
| 10 to 14 Year Olds | 50 (100.0%) | 0 (0.0%) |
| 15 to 17 Year Olds | 64 (88.9%) | 8 (11.1%) |
| 18 to 19 Year Olds | 42 (100.0%) | 0 (0.0%) |
| 20 to 24 Year Olds | 37 (100.0%) | 0 (0.0%) |
| 25 to 34 Year Olds | 0 (0.0%) | 0 (0.0%) |
| 35 Years and over | 8 (100.0%) | 0 (0.0%) |
| Total | 325 (95.3%) | 16 (4.7%) |
Educational Attainment by Field of Study in East McKeesport borough
Communications (91 | 24.8%), business (67 | 18.3%), science & technology (46 | 12.5%), arts & humanities (42 | 11.4%), and bio, nature & agricultural (37 | 10.1%) are the most common fields of study among 367 individuals in East McKeesport borough who have obtained a bachelor's degree or higher.
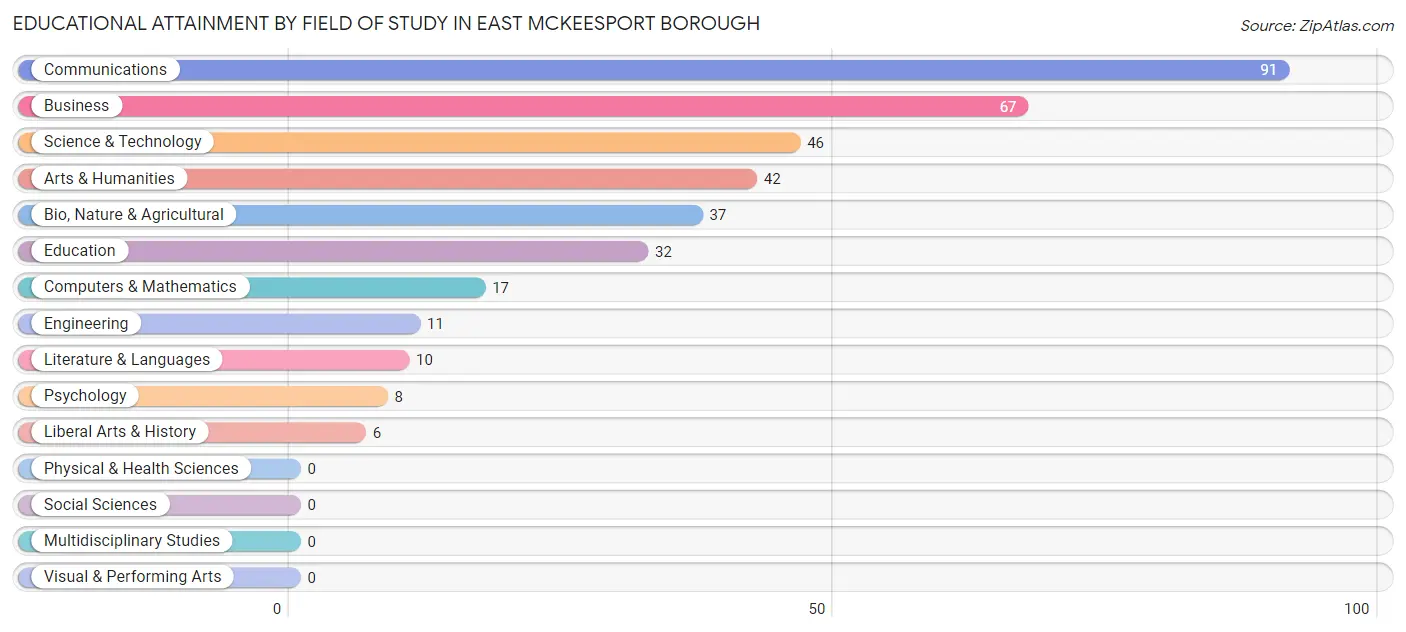
| Field of Study | # Graduates | % Graduates |
| Computers & Mathematics | 17 | 4.6% |
| Bio, Nature & Agricultural | 37 | 10.1% |
| Physical & Health Sciences | 0 | 0.0% |
| Psychology | 8 | 2.2% |
| Social Sciences | 0 | 0.0% |
| Engineering | 11 | 3.0% |
| Multidisciplinary Studies | 0 | 0.0% |
| Science & Technology | 46 | 12.5% |
| Business | 67 | 18.3% |
| Education | 32 | 8.7% |
| Literature & Languages | 10 | 2.7% |
| Liberal Arts & History | 6 | 1.6% |
| Visual & Performing Arts | 0 | 0.0% |
| Communications | 91 | 24.8% |
| Arts & Humanities | 42 | 11.4% |
| Total | 367 | 100.0% |
Transportation & Commute in East McKeesport borough
Vehicle Availability by Sex in East McKeesport borough
The most prevalent vehicle ownership categories in East McKeesport borough are males with 2 vehicles (191, accounting for 37.3%) and females with 2 vehicles (167, making up 32.7%).
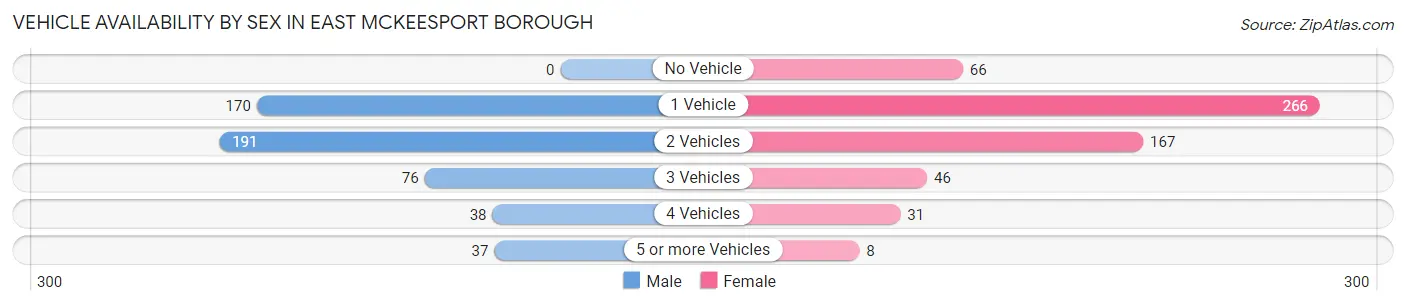
| Vehicles Available | Male | Female |
| No Vehicle | 0 (0.0%) | 66 (11.3%) |
| 1 Vehicle | 170 (33.2%) | 266 (45.6%) |
| 2 Vehicles | 191 (37.3%) | 167 (28.6%) |
| 3 Vehicles | 76 (14.8%) | 46 (7.9%) |
| 4 Vehicles | 38 (7.4%) | 31 (5.3%) |
| 5 or more Vehicles | 37 (7.2%) | 8 (1.4%) |
| Total | 512 (100.0%) | 584 (100.0%) |
Commute Time in East McKeesport borough
The most frequently occuring commute durations in East McKeesport borough are 15 to 19 minutes (169 commuters, 18.0%), 30 to 34 minutes (132 commuters, 14.1%), and 45 to 59 minutes (130 commuters, 13.8%).
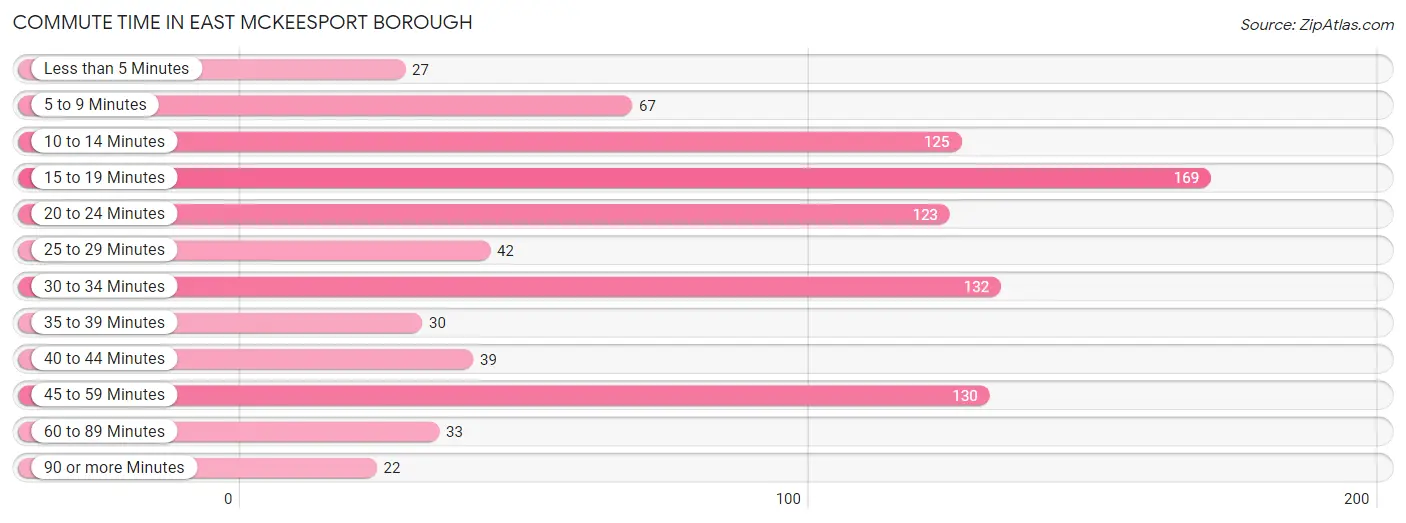
| Commute Time | # Commuters | % Commuters |
| Less than 5 Minutes | 27 | 2.9% |
| 5 to 9 Minutes | 67 | 7.1% |
| 10 to 14 Minutes | 125 | 13.3% |
| 15 to 19 Minutes | 169 | 18.0% |
| 20 to 24 Minutes | 123 | 13.1% |
| 25 to 29 Minutes | 42 | 4.5% |
| 30 to 34 Minutes | 132 | 14.1% |
| 35 to 39 Minutes | 30 | 3.2% |
| 40 to 44 Minutes | 39 | 4.2% |
| 45 to 59 Minutes | 130 | 13.8% |
| 60 to 89 Minutes | 33 | 3.5% |
| 90 or more Minutes | 22 | 2.3% |
Commute Time by Sex in East McKeesport borough
The most common commute times in East McKeesport borough are 15 to 19 minutes (90 commuters, 18.7%) for males and 15 to 19 minutes (79 commuters, 17.2%) for females.
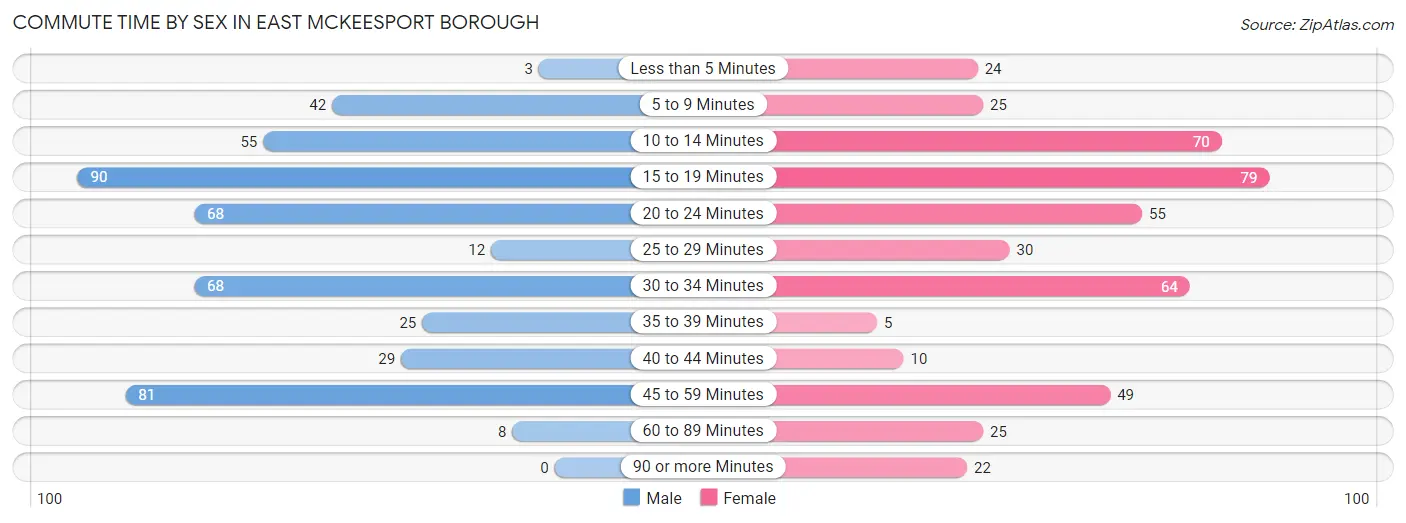
| Commute Time | Male | Female |
| Less than 5 Minutes | 3 (0.6%) | 24 (5.2%) |
| 5 to 9 Minutes | 42 (8.7%) | 25 (5.5%) |
| 10 to 14 Minutes | 55 (11.4%) | 70 (15.3%) |
| 15 to 19 Minutes | 90 (18.7%) | 79 (17.2%) |
| 20 to 24 Minutes | 68 (14.1%) | 55 (12.0%) |
| 25 to 29 Minutes | 12 (2.5%) | 30 (6.6%) |
| 30 to 34 Minutes | 68 (14.1%) | 64 (14.0%) |
| 35 to 39 Minutes | 25 (5.2%) | 5 (1.1%) |
| 40 to 44 Minutes | 29 (6.0%) | 10 (2.2%) |
| 45 to 59 Minutes | 81 (16.8%) | 49 (10.7%) |
| 60 to 89 Minutes | 8 (1.7%) | 25 (5.5%) |
| 90 or more Minutes | 0 (0.0%) | 22 (4.8%) |
Time of Departure to Work by Sex in East McKeesport borough
The most frequent times of departure to work in East McKeesport borough are 6:30 AM to 6:59 AM (92, 19.1%) for males and 4:00 PM to 11:59 PM (70, 15.3%) for females.
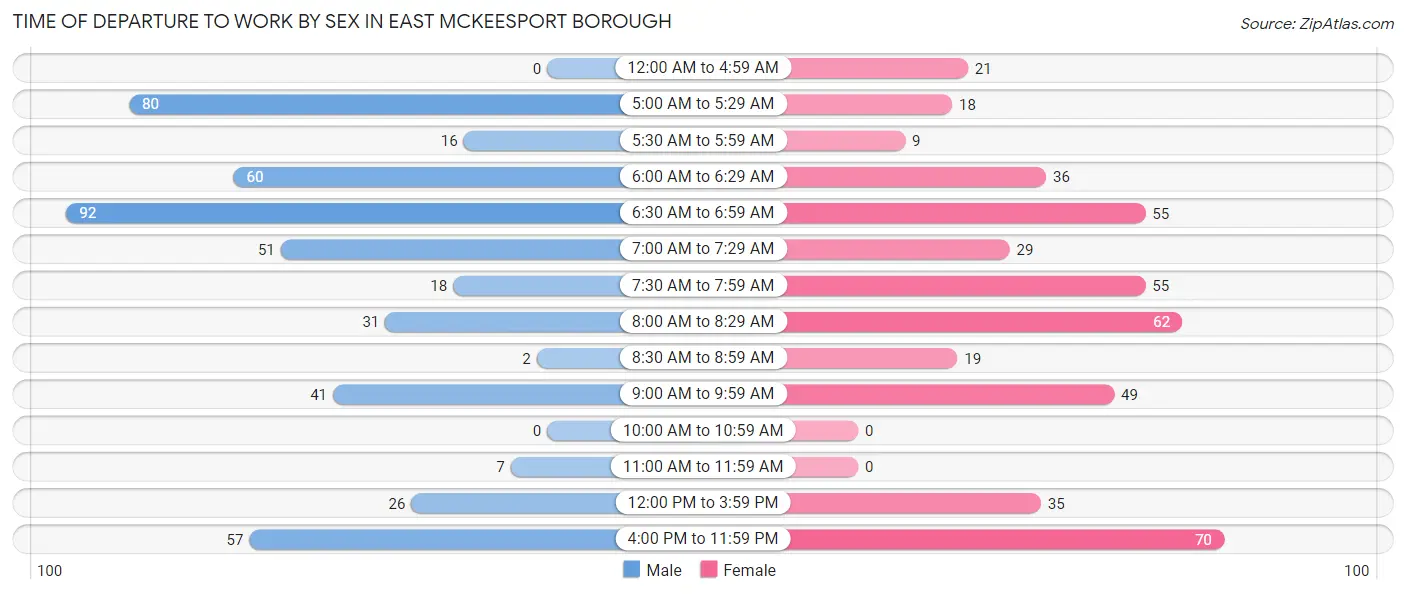
| Time of Departure | Male | Female |
| 12:00 AM to 4:59 AM | 0 (0.0%) | 21 (4.6%) |
| 5:00 AM to 5:29 AM | 80 (16.6%) | 18 (3.9%) |
| 5:30 AM to 5:59 AM | 16 (3.3%) | 9 (2.0%) |
| 6:00 AM to 6:29 AM | 60 (12.5%) | 36 (7.9%) |
| 6:30 AM to 6:59 AM | 92 (19.1%) | 55 (12.0%) |
| 7:00 AM to 7:29 AM | 51 (10.6%) | 29 (6.3%) |
| 7:30 AM to 7:59 AM | 18 (3.7%) | 55 (12.0%) |
| 8:00 AM to 8:29 AM | 31 (6.4%) | 62 (13.5%) |
| 8:30 AM to 8:59 AM | 2 (0.4%) | 19 (4.2%) |
| 9:00 AM to 9:59 AM | 41 (8.5%) | 49 (10.7%) |
| 10:00 AM to 10:59 AM | 0 (0.0%) | 0 (0.0%) |
| 11:00 AM to 11:59 AM | 7 (1.5%) | 0 (0.0%) |
| 12:00 PM to 3:59 PM | 26 (5.4%) | 35 (7.6%) |
| 4:00 PM to 11:59 PM | 57 (11.8%) | 70 (15.3%) |
| Total | 481 (100.0%) | 458 (100.0%) |
Housing Occupancy in East McKeesport borough
Occupancy by Ownership in East McKeesport borough
Of the total 1,012 dwellings in East McKeesport borough, owner-occupied units account for 679 (67.1%), while renter-occupied units make up 333 (32.9%).
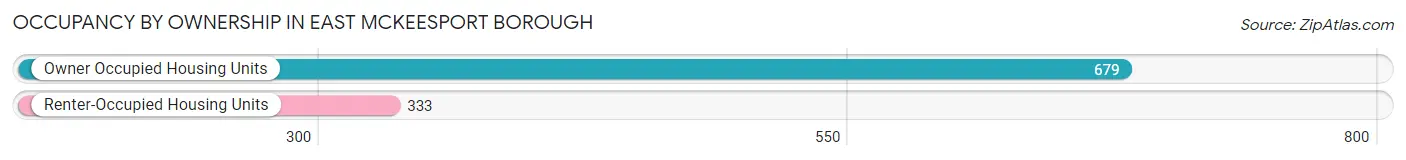
| Occupancy | # Housing Units | % Housing Units |
| Owner Occupied Housing Units | 679 | 67.1% |
| Renter-Occupied Housing Units | 333 | 32.9% |
| Total Occupied Housing Units | 1,012 | 100.0% |
Occupancy by Household Size in East McKeesport borough
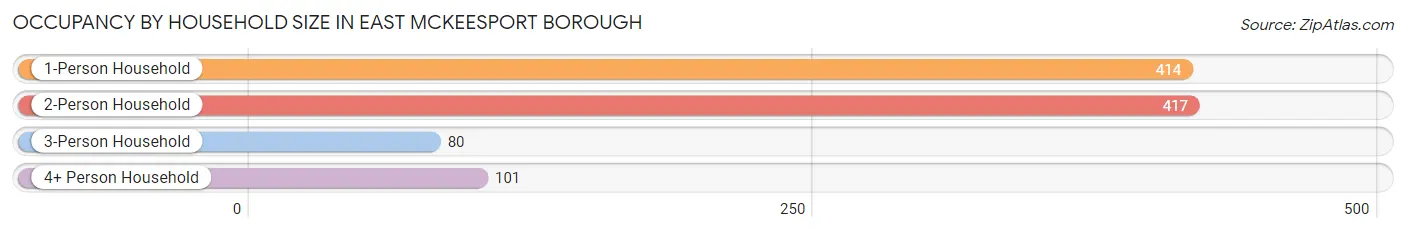
| Household Size | # Housing Units | % Housing Units |
| 1-Person Household | 414 | 40.9% |
| 2-Person Household | 417 | 41.2% |
| 3-Person Household | 80 | 7.9% |
| 4+ Person Household | 101 | 10.0% |
| Total Housing Units | 1,012 | 100.0% |
Occupancy by Ownership by Household Size in East McKeesport borough
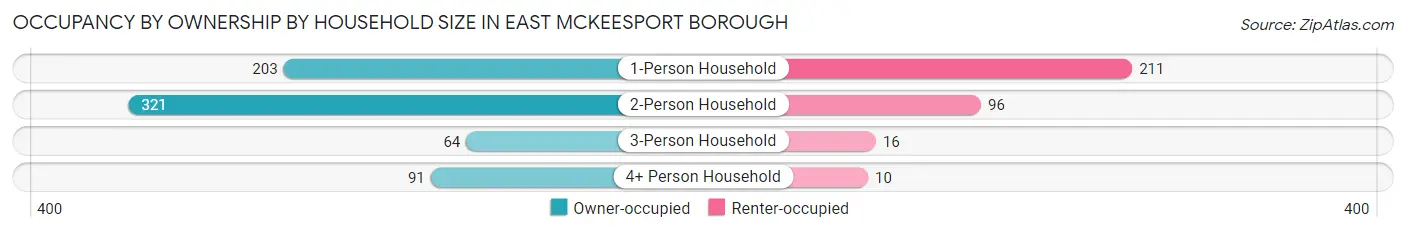
| Household Size | Owner-occupied | Renter-occupied |
| 1-Person Household | 203 (49.0%) | 211 (51.0%) |
| 2-Person Household | 321 (77.0%) | 96 (23.0%) |
| 3-Person Household | 64 (80.0%) | 16 (20.0%) |
| 4+ Person Household | 91 (90.1%) | 10 (9.9%) |
| Total Housing Units | 679 (67.1%) | 333 (32.9%) |
Occupancy by Educational Attainment in East McKeesport borough
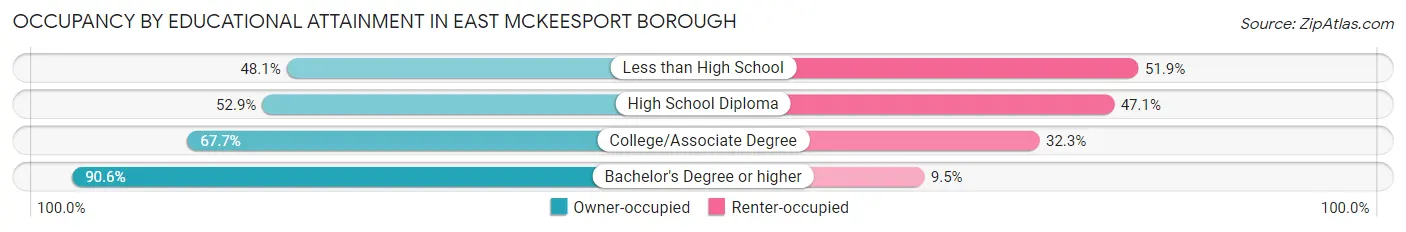
| Household Size | Owner-occupied | Renter-occupied |
| Less than High School | 25 (48.1%) | 27 (51.9%) |
| High School Diploma | 210 (52.9%) | 187 (47.1%) |
| College/Associate Degree | 195 (67.7%) | 93 (32.3%) |
| Bachelor's Degree or higher | 249 (90.5%) | 26 (9.5%) |
Occupancy by Age of Householder in East McKeesport borough
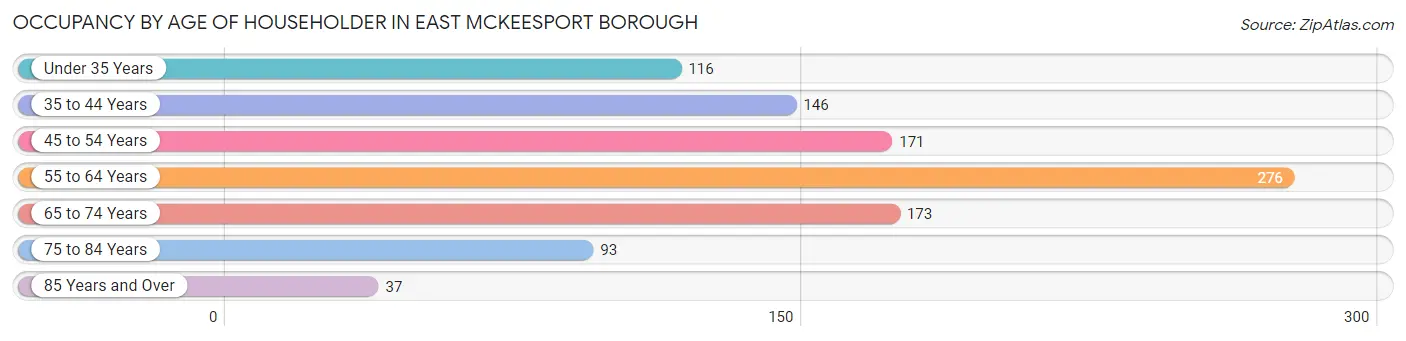
| Age Bracket | # Households | % Households |
| Under 35 Years | 116 | 11.5% |
| 35 to 44 Years | 146 | 14.4% |
| 45 to 54 Years | 171 | 16.9% |
| 55 to 64 Years | 276 | 27.3% |
| 65 to 74 Years | 173 | 17.1% |
| 75 to 84 Years | 93 | 9.2% |
| 85 Years and Over | 37 | 3.7% |
| Total | 1,012 | 100.0% |
Housing Finances in East McKeesport borough
Median Income by Occupancy in East McKeesport borough
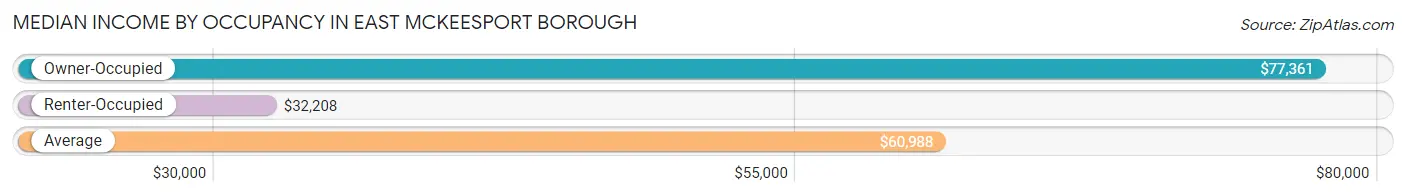
| Occupancy Type | # Households | Median Income |
| Owner-Occupied | 679 (67.1%) | $77,361 |
| Renter-Occupied | 333 (32.9%) | $32,208 |
| Average | 1,012 (100.0%) | $60,988 |
Occupancy by Householder Income Bracket in East McKeesport borough
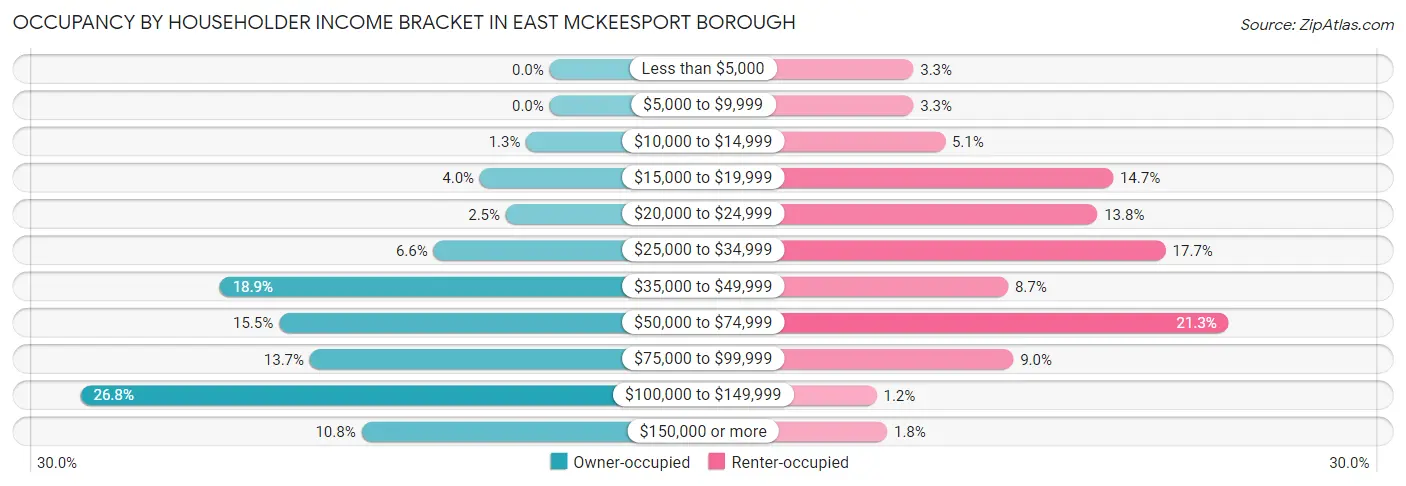
| Income Bracket | Owner-occupied | Renter-occupied |
| Less than $5,000 | 0 (0.0%) | 11 (3.3%) |
| $5,000 to $9,999 | 0 (0.0%) | 11 (3.3%) |
| $10,000 to $14,999 | 9 (1.3%) | 17 (5.1%) |
| $15,000 to $19,999 | 27 (4.0%) | 49 (14.7%) |
| $20,000 to $24,999 | 17 (2.5%) | 46 (13.8%) |
| $25,000 to $34,999 | 45 (6.6%) | 59 (17.7%) |
| $35,000 to $49,999 | 128 (18.9%) | 29 (8.7%) |
| $50,000 to $74,999 | 105 (15.5%) | 71 (21.3%) |
| $75,000 to $99,999 | 93 (13.7%) | 30 (9.0%) |
| $100,000 to $149,999 | 182 (26.8%) | 4 (1.2%) |
| $150,000 or more | 73 (10.7%) | 6 (1.8%) |
| Total | 679 (100.0%) | 333 (100.0%) |
Monthly Housing Cost Tiers in East McKeesport borough
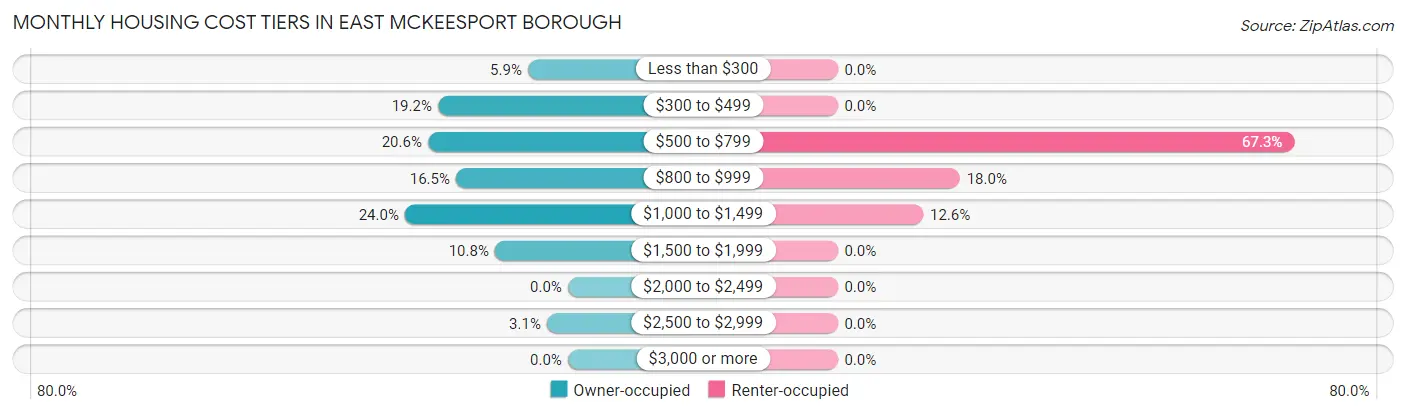
| Monthly Cost | Owner-occupied | Renter-occupied |
| Less than $300 | 40 (5.9%) | 0 (0.0%) |
| $300 to $499 | 130 (19.2%) | 0 (0.0%) |
| $500 to $799 | 140 (20.6%) | 224 (67.3%) |
| $800 to $999 | 112 (16.5%) | 60 (18.0%) |
| $1,000 to $1,499 | 163 (24.0%) | 42 (12.6%) |
| $1,500 to $1,999 | 73 (10.7%) | 0 (0.0%) |
| $2,000 to $2,499 | 0 (0.0%) | 0 (0.0%) |
| $2,500 to $2,999 | 21 (3.1%) | 0 (0.0%) |
| $3,000 or more | 0 (0.0%) | 0 (0.0%) |
| Total | 679 (100.0%) | 333 (100.0%) |
Physical Housing Characteristics in East McKeesport borough
Housing Structures in East McKeesport borough
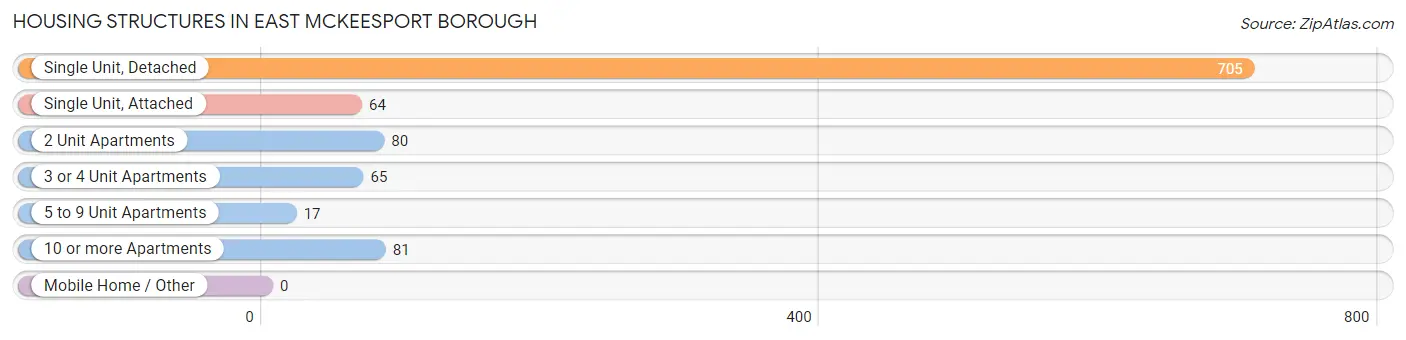
| Structure Type | # Housing Units | % Housing Units |
| Single Unit, Detached | 705 | 69.7% |
| Single Unit, Attached | 64 | 6.3% |
| 2 Unit Apartments | 80 | 7.9% |
| 3 or 4 Unit Apartments | 65 | 6.4% |
| 5 to 9 Unit Apartments | 17 | 1.7% |
| 10 or more Apartments | 81 | 8.0% |
| Mobile Home / Other | 0 | 0.0% |
| Total | 1,012 | 100.0% |
Housing Structures by Occupancy in East McKeesport borough
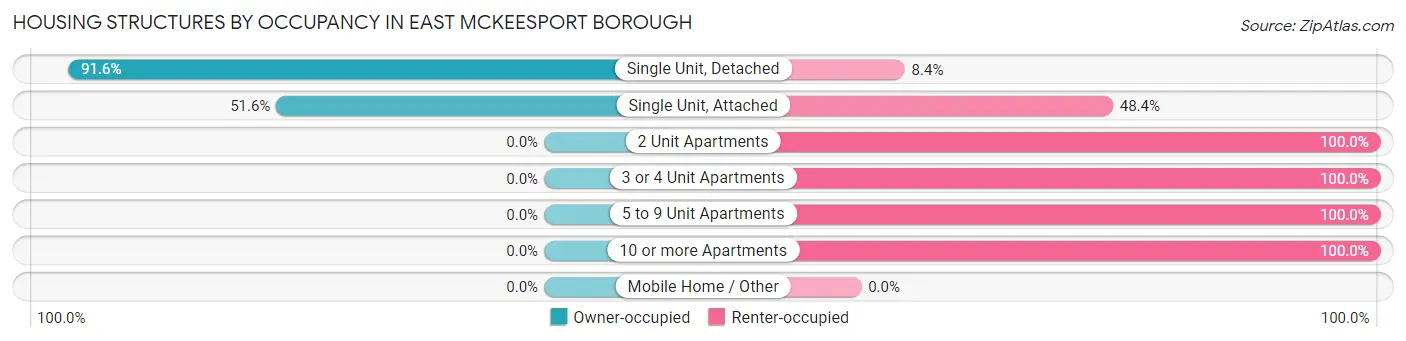
| Structure Type | Owner-occupied | Renter-occupied |
| Single Unit, Detached | 646 (91.6%) | 59 (8.4%) |
| Single Unit, Attached | 33 (51.6%) | 31 (48.4%) |
| 2 Unit Apartments | 0 (0.0%) | 80 (100.0%) |
| 3 or 4 Unit Apartments | 0 (0.0%) | 65 (100.0%) |
| 5 to 9 Unit Apartments | 0 (0.0%) | 17 (100.0%) |
| 10 or more Apartments | 0 (0.0%) | 81 (100.0%) |
| Mobile Home / Other | 0 (0.0%) | 0 (0.0%) |
| Total | 679 (67.1%) | 333 (32.9%) |
Housing Structures by Number of Rooms in East McKeesport borough
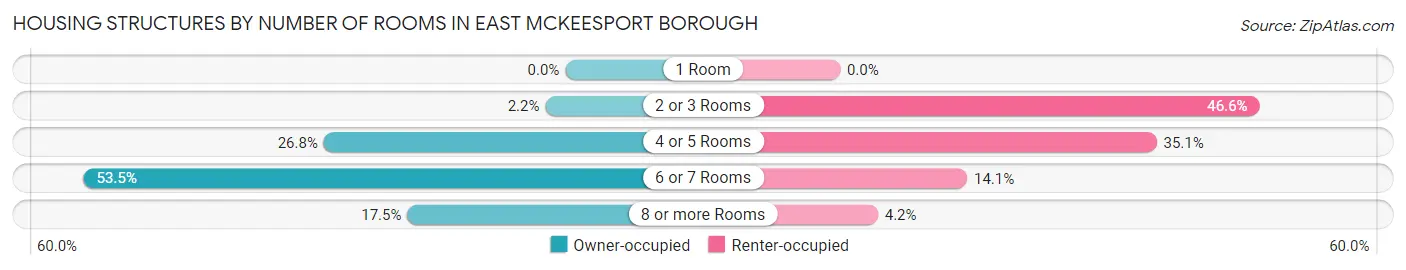
| Number of Rooms | Owner-occupied | Renter-occupied |
| 1 Room | 0 (0.0%) | 0 (0.0%) |
| 2 or 3 Rooms | 15 (2.2%) | 155 (46.6%) |
| 4 or 5 Rooms | 182 (26.8%) | 117 (35.1%) |
| 6 or 7 Rooms | 363 (53.5%) | 47 (14.1%) |
| 8 or more Rooms | 119 (17.5%) | 14 (4.2%) |
| Total | 679 (100.0%) | 333 (100.0%) |
Housing Structure by Heating Type in East McKeesport borough
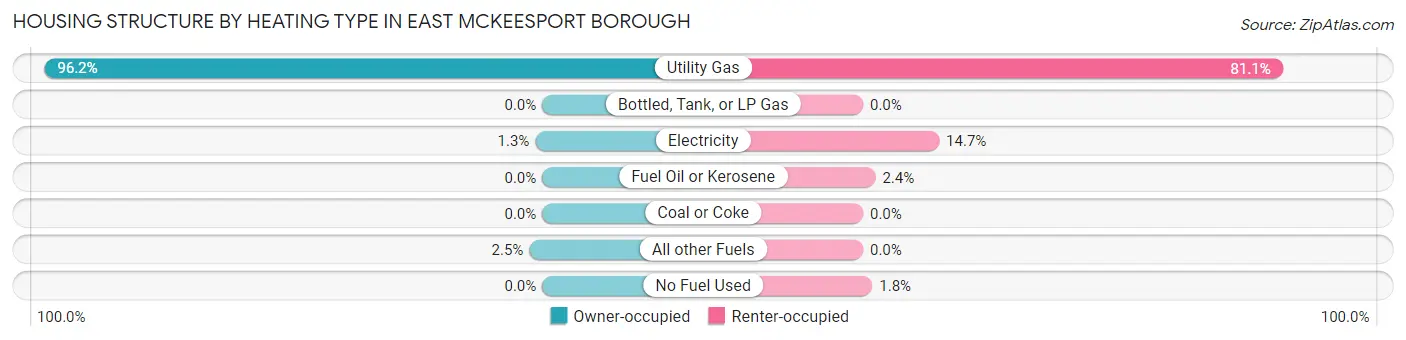
| Heating Type | Owner-occupied | Renter-occupied |
| Utility Gas | 653 (96.2%) | 270 (81.1%) |
| Bottled, Tank, or LP Gas | 0 (0.0%) | 0 (0.0%) |
| Electricity | 9 (1.3%) | 49 (14.7%) |
| Fuel Oil or Kerosene | 0 (0.0%) | 8 (2.4%) |
| Coal or Coke | 0 (0.0%) | 0 (0.0%) |
| All other Fuels | 17 (2.5%) | 0 (0.0%) |
| No Fuel Used | 0 (0.0%) | 6 (1.8%) |
| Total | 679 (100.0%) | 333 (100.0%) |
Household Vehicle Usage in East McKeesport borough
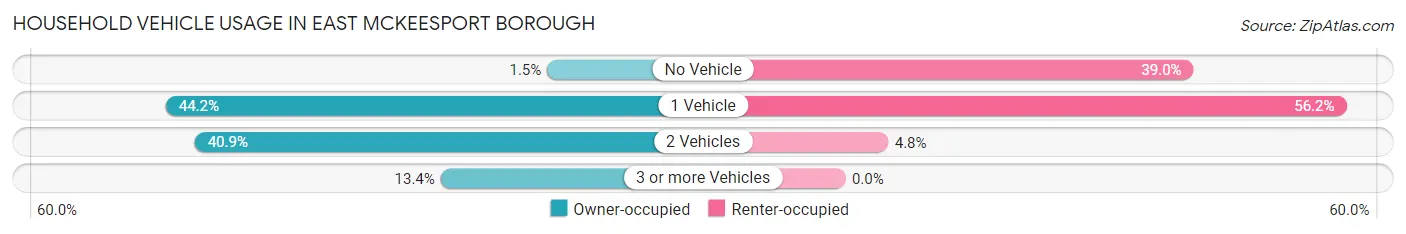
| Vehicles per Household | Owner-occupied | Renter-occupied |
| No Vehicle | 10 (1.5%) | 130 (39.0%) |
| 1 Vehicle | 300 (44.2%) | 187 (56.2%) |
| 2 Vehicles | 278 (40.9%) | 16 (4.8%) |
| 3 or more Vehicles | 91 (13.4%) | 0 (0.0%) |
| Total | 679 (100.0%) | 333 (100.0%) |
Real Estate & Mortgages in East McKeesport borough
Real Estate and Mortgage Overview in East McKeesport borough
| Characteristic | Without Mortgage | With Mortgage |
| Housing Units | 305 | 374 |
| Median Property Value | $66,900 | $89,500 |
| Median Household Income | $66,625 | $51 |
| Monthly Housing Costs | $479 | $0 |
| Real Estate Taxes | $1,871 | $3 |
Property Value by Mortgage Status in East McKeesport borough
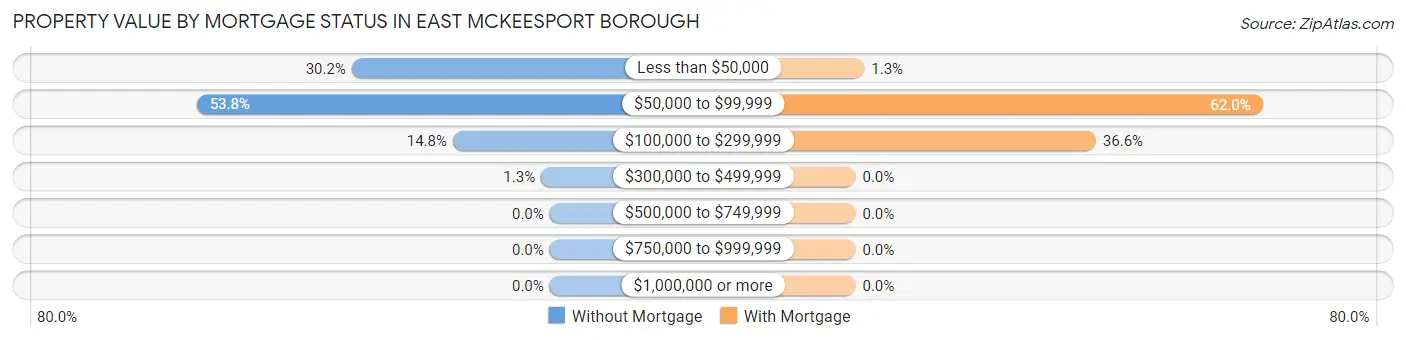
| Property Value | Without Mortgage | With Mortgage |
| Less than $50,000 | 92 (30.2%) | 5 (1.3%) |
| $50,000 to $99,999 | 164 (53.8%) | 232 (62.0%) |
| $100,000 to $299,999 | 45 (14.7%) | 137 (36.6%) |
| $300,000 to $499,999 | 4 (1.3%) | 0 (0.0%) |
| $500,000 to $749,999 | 0 (0.0%) | 0 (0.0%) |
| $750,000 to $999,999 | 0 (0.0%) | 0 (0.0%) |
| $1,000,000 or more | 0 (0.0%) | 0 (0.0%) |
| Total | 305 (100.0%) | 374 (100.0%) |
Household Income by Mortgage Status in East McKeesport borough
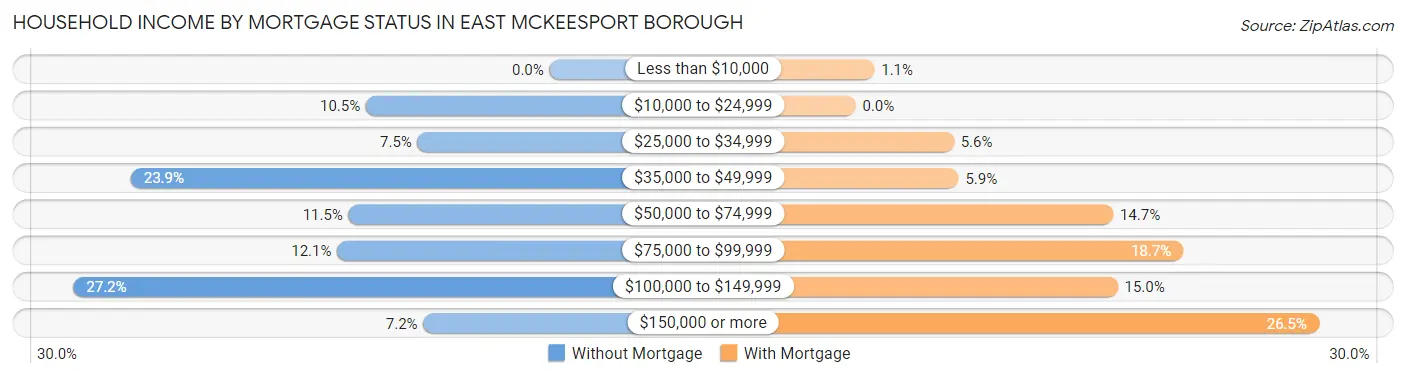
| Household Income | Without Mortgage | With Mortgage |
| Less than $10,000 | 0 (0.0%) | 4 (1.1%) |
| $10,000 to $24,999 | 32 (10.5%) | 0 (0.0%) |
| $25,000 to $34,999 | 23 (7.5%) | 21 (5.6%) |
| $35,000 to $49,999 | 73 (23.9%) | 22 (5.9%) |
| $50,000 to $74,999 | 35 (11.5%) | 55 (14.7%) |
| $75,000 to $99,999 | 37 (12.1%) | 70 (18.7%) |
| $100,000 to $149,999 | 83 (27.2%) | 56 (15.0%) |
| $150,000 or more | 22 (7.2%) | 99 (26.5%) |
| Total | 305 (100.0%) | 374 (100.0%) |
Property Value to Household Income Ratio in East McKeesport borough
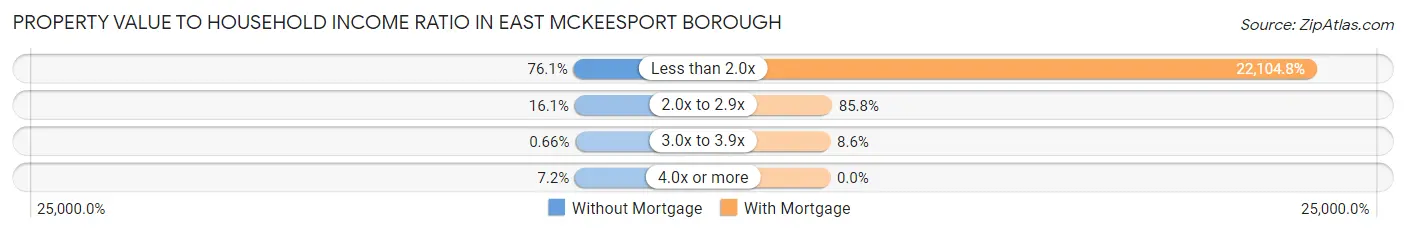
| Value-to-Income Ratio | Without Mortgage | With Mortgage |
| Less than 2.0x | 232 (76.1%) | 82,672 (22,104.8%) |
| 2.0x to 2.9x | 49 (16.1%) | 321 (85.8%) |
| 3.0x to 3.9x | 2 (0.7%) | 32 (8.6%) |
| 4.0x or more | 22 (7.2%) | 0 (0.0%) |
| Total | 305 (100.0%) | 374 (100.0%) |
Real Estate Taxes by Mortgage Status in East McKeesport borough
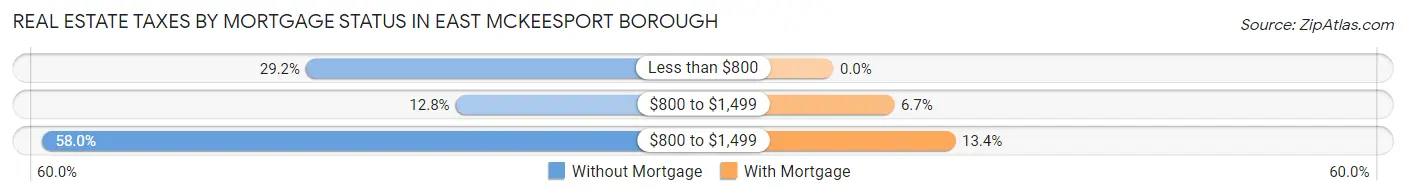
| Property Taxes | Without Mortgage | With Mortgage |
| Less than $800 | 89 (29.2%) | 0 (0.0%) |
| $800 to $1,499 | 39 (12.8%) | 25 (6.7%) |
| $800 to $1,499 | 177 (58.0%) | 50 (13.4%) |
| Total | 305 (100.0%) | 374 (100.0%) |
Health & Disability in East McKeesport borough
Health Insurance Coverage by Age in East McKeesport borough
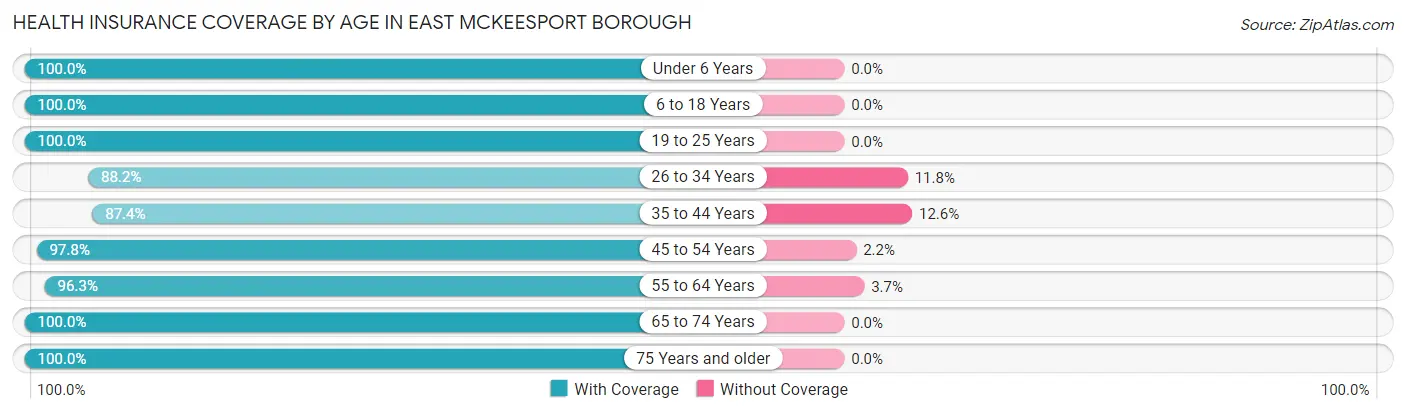
| Age Bracket | With Coverage | Without Coverage |
| Under 6 Years | 31 (100.0%) | 0 (0.0%) |
| 6 to 18 Years | 275 (100.0%) | 0 (0.0%) |
| 19 to 25 Years | 139 (100.0%) | 0 (0.0%) |
| 26 to 34 Years | 246 (88.2%) | 33 (11.8%) |
| 35 to 44 Years | 173 (87.4%) | 25 (12.6%) |
| 45 to 54 Years | 309 (97.8%) | 7 (2.2%) |
| 55 to 64 Years | 311 (96.3%) | 12 (3.7%) |
| 65 to 74 Years | 317 (100.0%) | 0 (0.0%) |
| 75 Years and older | 196 (100.0%) | 0 (0.0%) |
| Total | 1,997 (96.3%) | 77 (3.7%) |
Health Insurance Coverage by Citizenship Status in East McKeesport borough
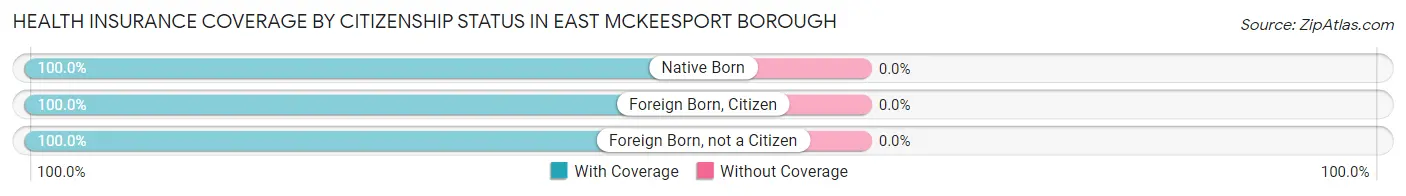
| Citizenship Status | With Coverage | Without Coverage |
| Native Born | 31 (100.0%) | 0 (0.0%) |
| Foreign Born, Citizen | 275 (100.0%) | 0 (0.0%) |
| Foreign Born, not a Citizen | 139 (100.0%) | 0 (0.0%) |
Health Insurance Coverage by Household Income in East McKeesport borough
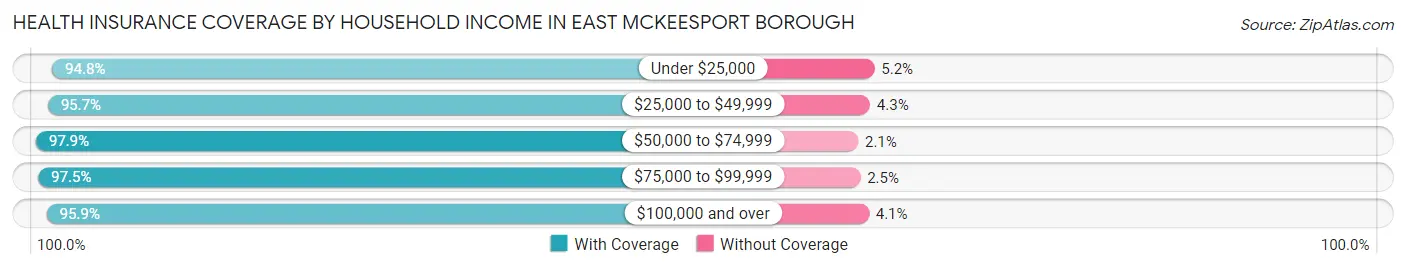
| Household Income | With Coverage | Without Coverage |
| Under $25,000 | 220 (94.8%) | 12 (5.2%) |
| $25,000 to $49,999 | 376 (95.7%) | 17 (4.3%) |
| $50,000 to $74,999 | 325 (97.9%) | 7 (2.1%) |
| $75,000 to $99,999 | 309 (97.5%) | 8 (2.5%) |
| $100,000 and over | 767 (95.9%) | 33 (4.1%) |
Public vs Private Health Insurance Coverage by Age in East McKeesport borough
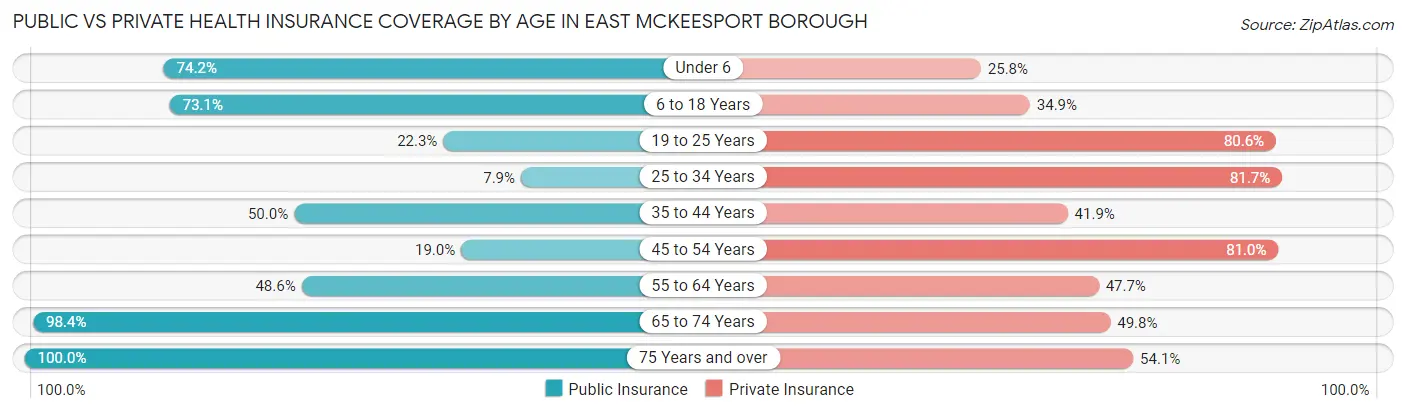
| Age Bracket | Public Insurance | Private Insurance |
| Under 6 | 23 (74.2%) | 8 (25.8%) |
| 6 to 18 Years | 201 (73.1%) | 96 (34.9%) |
| 19 to 25 Years | 31 (22.3%) | 112 (80.6%) |
| 25 to 34 Years | 22 (7.9%) | 228 (81.7%) |
| 35 to 44 Years | 99 (50.0%) | 83 (41.9%) |
| 45 to 54 Years | 60 (19.0%) | 256 (81.0%) |
| 55 to 64 Years | 157 (48.6%) | 154 (47.7%) |
| 65 to 74 Years | 312 (98.4%) | 158 (49.8%) |
| 75 Years and over | 196 (100.0%) | 106 (54.1%) |
| Total | 1,101 (53.1%) | 1,201 (57.9%) |
Disability Status by Sex by Age in East McKeesport borough
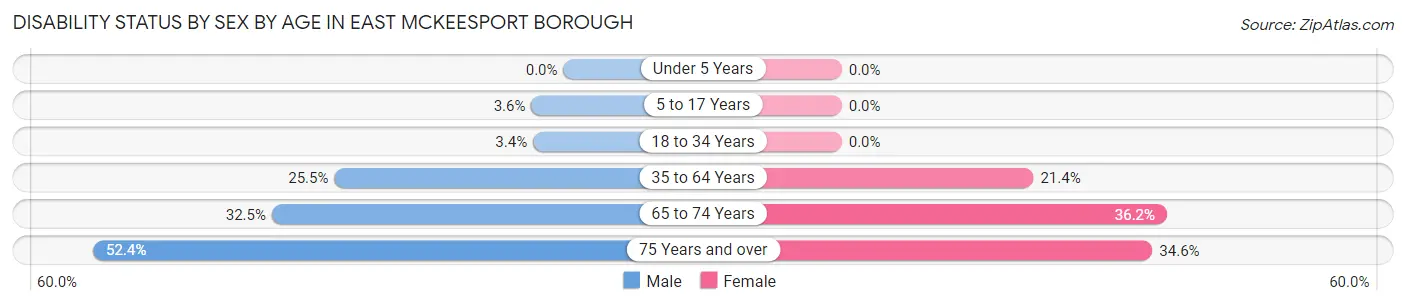
| Age Bracket | Male | Female |
| Under 5 Years | 0 (0.0%) | 0 (0.0%) |
| 5 to 17 Years | 4 (3.6%) | 0 (0.0%) |
| 18 to 34 Years | 9 (3.4%) | 0 (0.0%) |
| 35 to 64 Years | 100 (25.5%) | 95 (21.3%) |
| 65 to 74 Years | 50 (32.5%) | 59 (36.2%) |
| 75 Years and over | 33 (52.4%) | 46 (34.6%) |
Disability Class by Sex by Age in East McKeesport borough
Disability Class: Hearing Difficulty
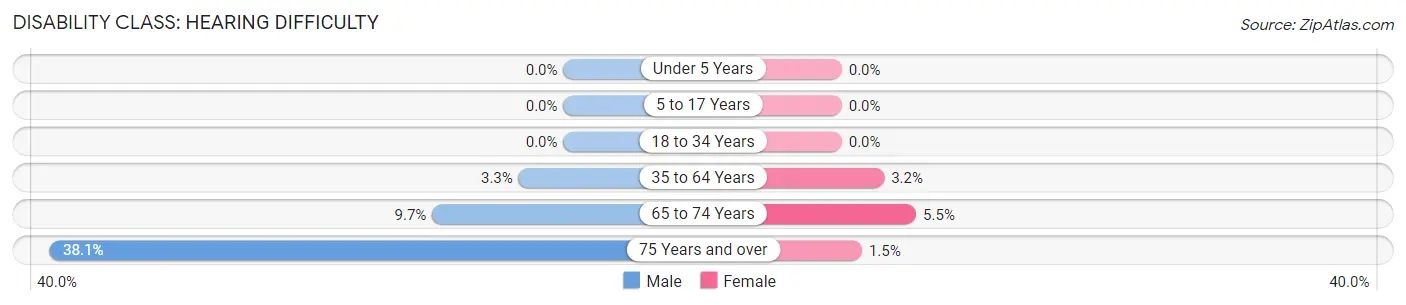
| Age Bracket | Male | Female |
| Under 5 Years | 0 (0.0%) | 0 (0.0%) |
| 5 to 17 Years | 0 (0.0%) | 0 (0.0%) |
| 18 to 34 Years | 0 (0.0%) | 0 (0.0%) |
| 35 to 64 Years | 13 (3.3%) | 14 (3.2%) |
| 65 to 74 Years | 15 (9.7%) | 9 (5.5%) |
| 75 Years and over | 24 (38.1%) | 2 (1.5%) |
Disability Class: Vision Difficulty
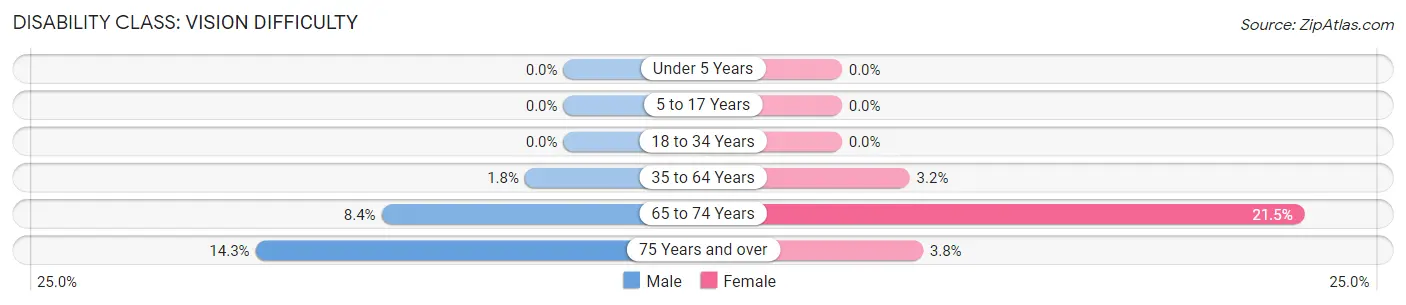
| Age Bracket | Male | Female |
| Under 5 Years | 0 (0.0%) | 0 (0.0%) |
| 5 to 17 Years | 0 (0.0%) | 0 (0.0%) |
| 18 to 34 Years | 0 (0.0%) | 0 (0.0%) |
| 35 to 64 Years | 7 (1.8%) | 14 (3.2%) |
| 65 to 74 Years | 13 (8.4%) | 35 (21.5%) |
| 75 Years and over | 9 (14.3%) | 5 (3.8%) |
Disability Class: Cognitive Difficulty
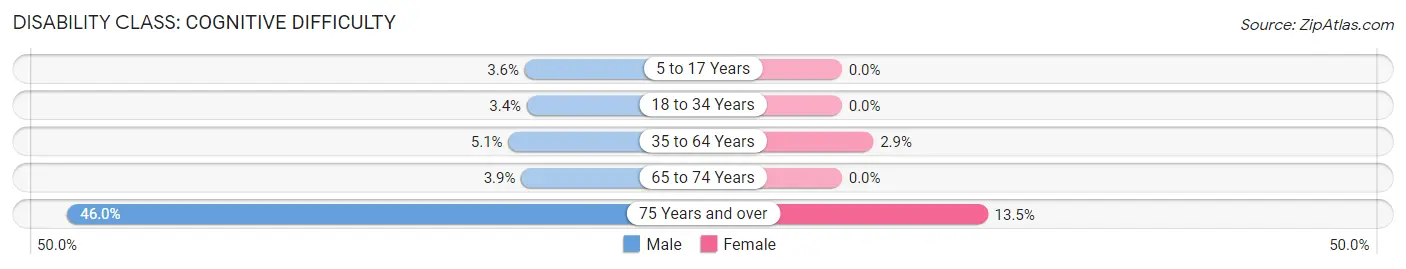
| Age Bracket | Male | Female |
| 5 to 17 Years | 4 (3.6%) | 0 (0.0%) |
| 18 to 34 Years | 9 (3.4%) | 0 (0.0%) |
| 35 to 64 Years | 20 (5.1%) | 13 (2.9%) |
| 65 to 74 Years | 6 (3.9%) | 0 (0.0%) |
| 75 Years and over | 29 (46.0%) | 18 (13.5%) |
Disability Class: Ambulatory Difficulty
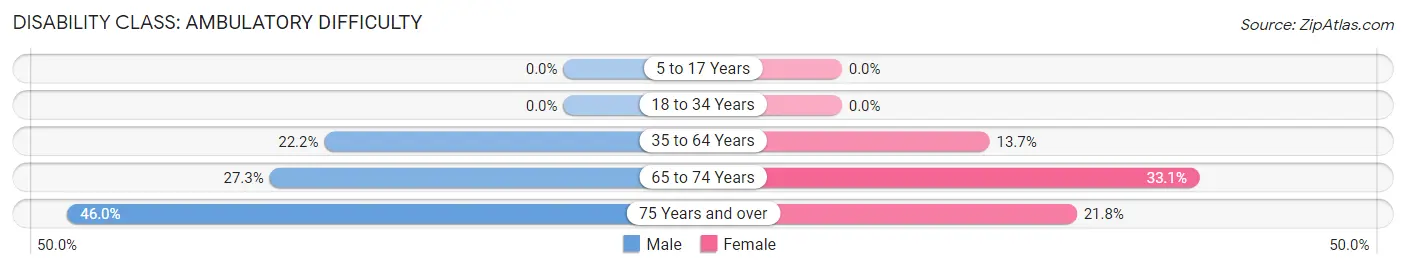
| Age Bracket | Male | Female |
| 5 to 17 Years | 0 (0.0%) | 0 (0.0%) |
| 18 to 34 Years | 0 (0.0%) | 0 (0.0%) |
| 35 to 64 Years | 87 (22.2%) | 61 (13.7%) |
| 65 to 74 Years | 42 (27.3%) | 54 (33.1%) |
| 75 Years and over | 29 (46.0%) | 29 (21.8%) |
Disability Class: Self-Care Difficulty
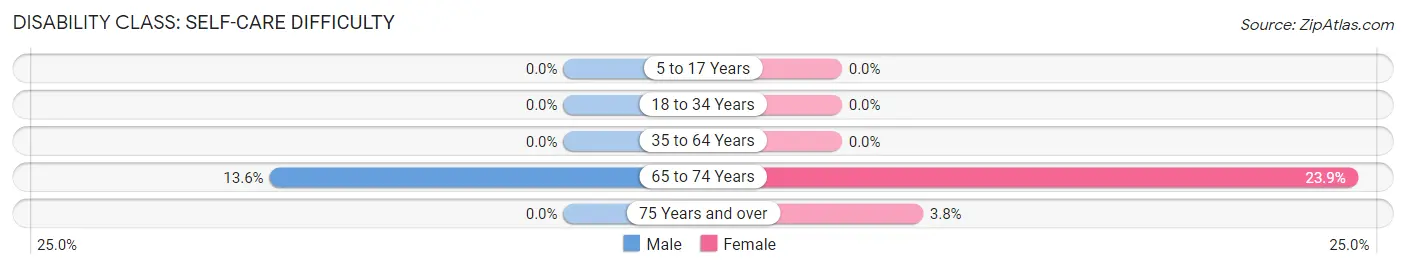
| Age Bracket | Male | Female |
| 5 to 17 Years | 0 (0.0%) | 0 (0.0%) |
| 18 to 34 Years | 0 (0.0%) | 0 (0.0%) |
| 35 to 64 Years | 0 (0.0%) | 0 (0.0%) |
| 65 to 74 Years | 21 (13.6%) | 39 (23.9%) |
| 75 Years and over | 0 (0.0%) | 5 (3.8%) |
Technology Access in East McKeesport borough
Computing Device Access in East McKeesport borough
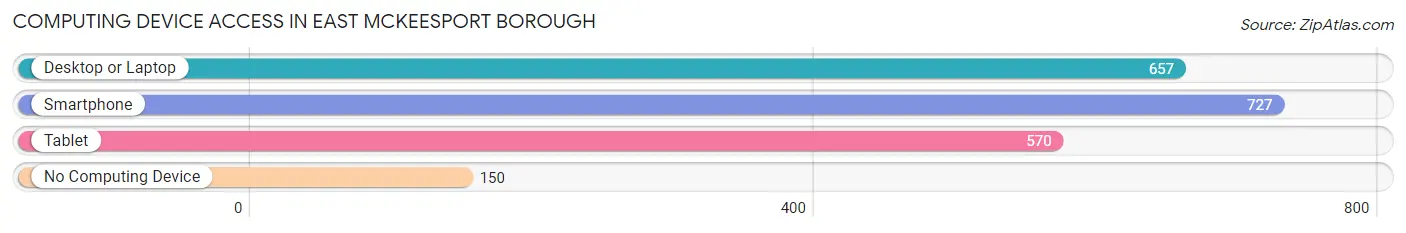
| Device Type | # Households | % Households |
| Desktop or Laptop | 657 | 64.9% |
| Smartphone | 727 | 71.8% |
| Tablet | 570 | 56.3% |
| No Computing Device | 150 | 14.8% |
| Total | 1,012 | 100.0% |
Internet Access in East McKeesport borough
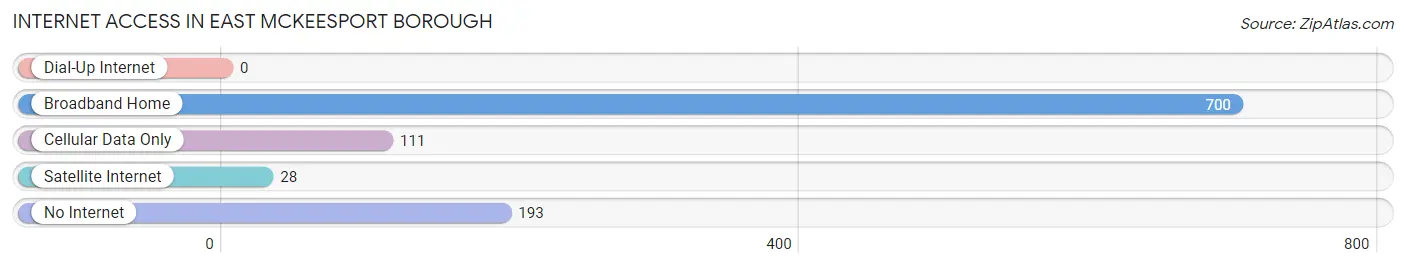
| Internet Type | # Households | % Households |
| Dial-Up Internet | 0 | 0.0% |
| Broadband Home | 700 | 69.2% |
| Cellular Data Only | 111 | 11.0% |
| Satellite Internet | 28 | 2.8% |
| No Internet | 193 | 19.1% |
| Total | 1,012 | 100.0% |
East McKeesport borough Summary
East Mckeesport Borough is a small borough located in Allegheny County, Pennsylvania. It is situated in the Monongahela Valley, approximately 10 miles southeast of Pittsburgh. The borough was incorporated in 1891 and has a population of approximately 3,000 people.
History
East Mckeesport was originally part of the larger borough of McKeesport, which was founded in 1795. The area was first settled by German immigrants in the early 1800s. The first industry in the area was a glass factory, which was established in 1845. The glass factory was followed by a steel mill, which was built in 1872. The steel mill was the first of its kind in the area and helped to spur the growth of the borough.
In 1891, the area was incorporated as the Borough of East Mckeesport. The borough was named after the nearby city of McKeesport, which was named after John McKee, a local landowner. The borough was initially a small, rural community, but it began to grow rapidly in the early 1900s. The population of the borough increased from 1,000 in 1900 to 3,000 in 1920.
Geography
East Mckeesport is located in the Monongahela Valley, approximately 10 miles southeast of Pittsburgh. The borough is situated on the banks of the Monongahela River and is bordered by the boroughs of White Oak, Versailles, and North Versailles. The borough has a total area of 1.2 square miles, all of which is land.
The borough is located in a hilly region and is surrounded by wooded areas. The highest point in the borough is located at the intersection of East Fifth Avenue and East Tenth Street, which is approximately 500 feet above sea level. The borough is located in a humid continental climate zone and has four distinct seasons.
Economy
The economy of East Mckeesport is largely based on manufacturing and retail. The borough is home to several factories, including a steel mill, a glass factory, and a paper mill. The steel mill is the largest employer in the borough and employs approximately 500 people. The glass factory and paper mill each employ approximately 200 people.
The borough also has a number of retail stores, including grocery stores, clothing stores, and restaurants. The largest retail store in the borough is a Walmart Supercenter, which opened in 2011. The Walmart Supercenter employs approximately 200 people.
Demographics
As of the 2010 census, the population of East Mckeesport was 3,072. The racial makeup of the borough was 94.3% White, 2.7% African American, 0.3% Native American, 0.7% Asian, and 1.9% from other races. Hispanic or Latino of any race were 2.2% of the population.
The median household income in the borough was $37,917, and the median family income was $45,938. The per capita income in the borough was $19,945. Approximately 11.3% of the population was below the poverty line.
East Mckeesport is a small borough with a rich history and a diverse economy. The borough is home to several factories and retail stores, and it has a population of approximately 3,000 people. The borough is located in a hilly region and is surrounded by wooded areas. The economy of the borough is largely based on manufacturing and retail, and the largest employer in the borough is a steel mill. The population of the borough is predominantly White, but it also has a significant African American and Hispanic population.
Common Questions
What is Per Capita Income in East McKeesport borough?
Per Capita income in East McKeesport borough is $35,492.
What is the Median Family Income in East McKeesport borough?
Median Family Income in East McKeesport borough is $94,605.
What is the Median Household income in East McKeesport borough?
Median Household Income in East McKeesport borough is $60,988.
What is Income or Wage Gap in East McKeesport borough?
Income or Wage Gap in East McKeesport borough is 16.1%.
Women in East McKeesport borough earn 83.9 cents for every dollar earned by a man.
What is Family Income Deficit in East McKeesport borough?
Family Income Deficit in East McKeesport borough is $2,885.
Families that are below poverty line in East McKeesport borough earn $2,885 less on average than the poverty threshold level.
What is Inequality or Gini Index in East McKeesport borough?
Inequality or Gini Index in East McKeesport borough is 0.39.
What is the Total Population of East McKeesport borough?
Total Population of East McKeesport borough is 2,074.
What is the Total Male Population of East McKeesport borough?
Total Male Population of East McKeesport borough is 997.
What is the Total Female Population of East McKeesport borough?
Total Female Population of East McKeesport borough is 1,077.
What is the Ratio of Males per 100 Females in East McKeesport borough?
There are 92.57 Males per 100 Females in East McKeesport borough.
What is the Ratio of Females per 100 Males in East McKeesport borough?
There are 108.02 Females per 100 Males in East McKeesport borough.
What is the Median Population Age in East McKeesport borough?
Median Population Age in East McKeesport borough is 48.1 Years.
What is the Average Family Size in East McKeesport borough
Average Family Size in East McKeesport borough is 2.9 People.
What is the Average Household Size in East McKeesport borough
Average Household Size in East McKeesport borough is 2.0 People.
How Large is the Labor Force in East McKeesport borough?
There are 1,180 People in the Labor Forcein in East McKeesport borough.
What is the Percentage of People in the Labor Force in East McKeesport borough?
63.5% of People are in the Labor Force in East McKeesport borough.
What is the Unemployment Rate in East McKeesport borough?
Unemployment Rate in East McKeesport borough is 6.8%.