Wescosville, PA Map & Demographics
Wescosville Map
Wescosville Overview
$61,480
PER CAPITA INCOME
$161,620
AVG FAMILY INCOME
$128,853
AVG HOUSEHOLD INCOME
58.8%
WAGE / INCOME GAP [ % ]
41.2¢/ $1
WAGE / INCOME GAP [ $ ]
0.41
INEQUALITY / GINI INDEX
6,799
TOTAL POPULATION
3,229
MALE POPULATION
3,570
FEMALE POPULATION
90.45
MALES / 100 FEMALES
110.56
FEMALES / 100 MALES
45.3
MEDIAN AGE
2.8
AVG FAMILY SIZE
2.5
AVG HOUSEHOLD SIZE
3,975
LABOR FORCE [ PEOPLE ]
71.6%
PERCENT IN LABOR FORCE
3.0%
UNEMPLOYMENT RATE
Wescosville Area Codes
Income in Wescosville
Income Overview in Wescosville
Per Capita Income in Wescosville is $61,480, while median incomes of families and households are $161,620 and $128,853 respectively.
| Characteristic | Number | Measure |
| Per Capita Income | 6,799 | $61,480 |
| Median Family Income | 2,077 | $161,620 |
| Mean Family Income | 2,077 | $174,186 |
| Median Household Income | 2,670 | $128,853 |
| Mean Household Income | 2,670 | $156,955 |
| Income Deficit | 2,077 | $0 |
| Wage / Income Gap (%) | 6,799 | 58.84% |
| Wage / Income Gap ($) | 6,799 | 41.16¢ per $1 |
| Gini / Inequality Index | 6,799 | 0.41 |
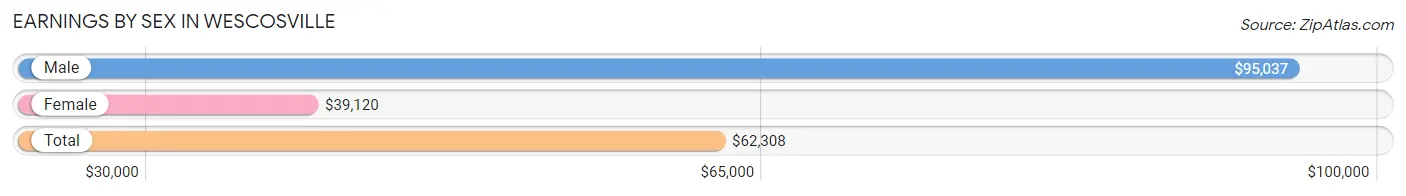
Earnings by Sex in Wescosville
Average Earnings in Wescosville are $62,308, $95,037 for men and $39,120 for women, a difference of 58.8%.
| Sex | Number | Average Earnings |
| Male | 2,019 (48.7%) | $95,037 |
| Female | 2,127 (51.3%) | $39,120 |
| Total | 4,146 (100.0%) | $62,308 |
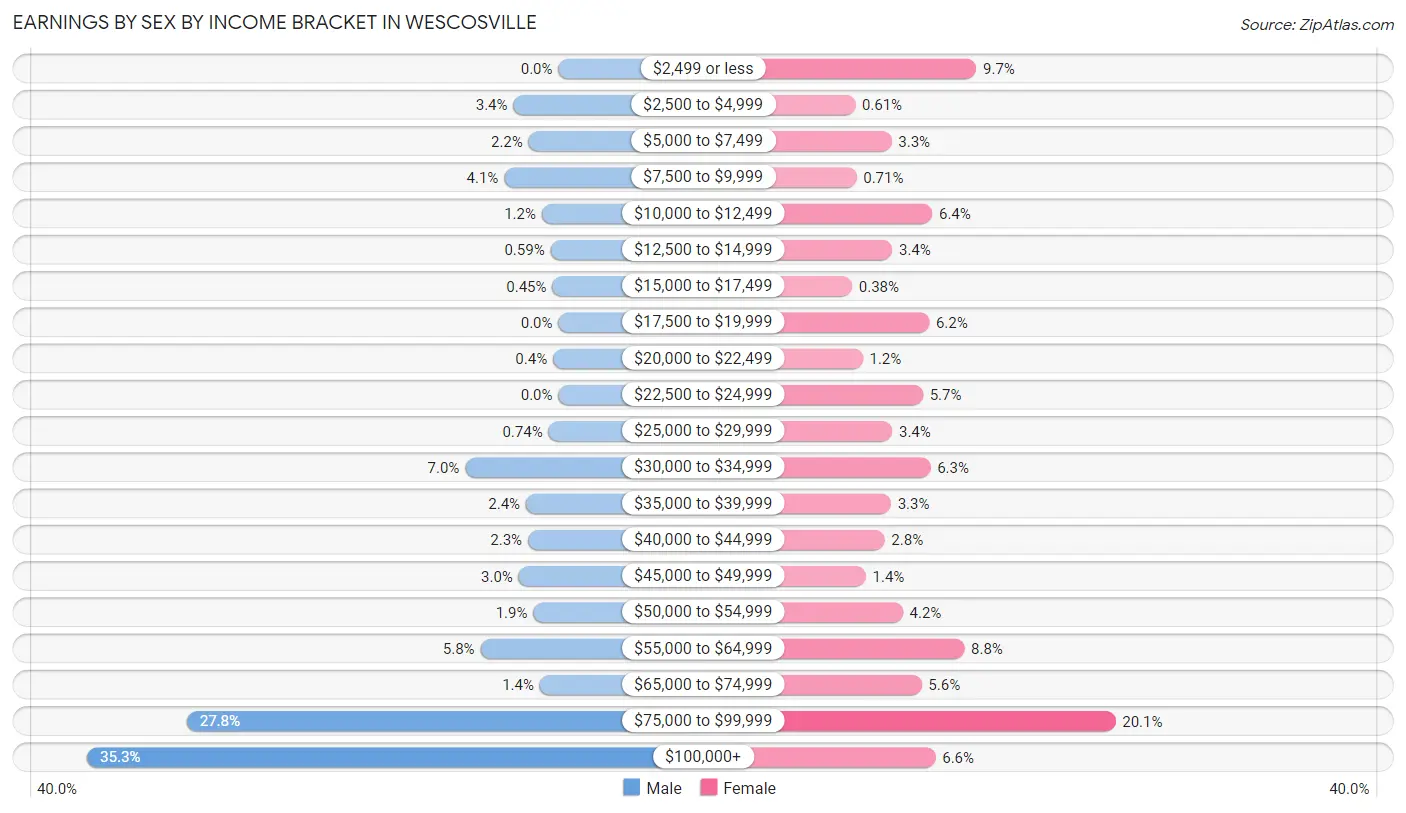
Earnings by Sex by Income Bracket in Wescosville
The most common earnings brackets in Wescosville are $100,000+ for men (713 | 35.3%) and $75,000 to $99,999 for women (428 | 20.1%).
| Income | Male | Female |
| $2,499 or less | 0 (0.0%) | 206 (9.7%) |
| $2,500 to $4,999 | 68 (3.4%) | 13 (0.6%) |
| $5,000 to $7,499 | 45 (2.2%) | 71 (3.3%) |
| $7,500 to $9,999 | 82 (4.1%) | 15 (0.7%) |
| $10,000 to $12,499 | 25 (1.2%) | 136 (6.4%) |
| $12,500 to $14,999 | 12 (0.6%) | 72 (3.4%) |
| $15,000 to $17,499 | 9 (0.4%) | 8 (0.4%) |
| $17,500 to $19,999 | 0 (0.0%) | 131 (6.2%) |
| $20,000 to $22,499 | 8 (0.4%) | 25 (1.2%) |
| $22,500 to $24,999 | 0 (0.0%) | 121 (5.7%) |
| $25,000 to $29,999 | 15 (0.7%) | 72 (3.4%) |
| $30,000 to $34,999 | 141 (7.0%) | 133 (6.2%) |
| $35,000 to $39,999 | 49 (2.4%) | 70 (3.3%) |
| $40,000 to $44,999 | 46 (2.3%) | 60 (2.8%) |
| $45,000 to $49,999 | 60 (3.0%) | 30 (1.4%) |
| $50,000 to $54,999 | 38 (1.9%) | 89 (4.2%) |
| $55,000 to $64,999 | 118 (5.8%) | 187 (8.8%) |
| $65,000 to $74,999 | 28 (1.4%) | 119 (5.6%) |
| $75,000 to $99,999 | 562 (27.8%) | 428 (20.1%) |
| $100,000+ | 713 (35.3%) | 141 (6.6%) |
| Total | 2,019 (100.0%) | 2,127 (100.0%) |
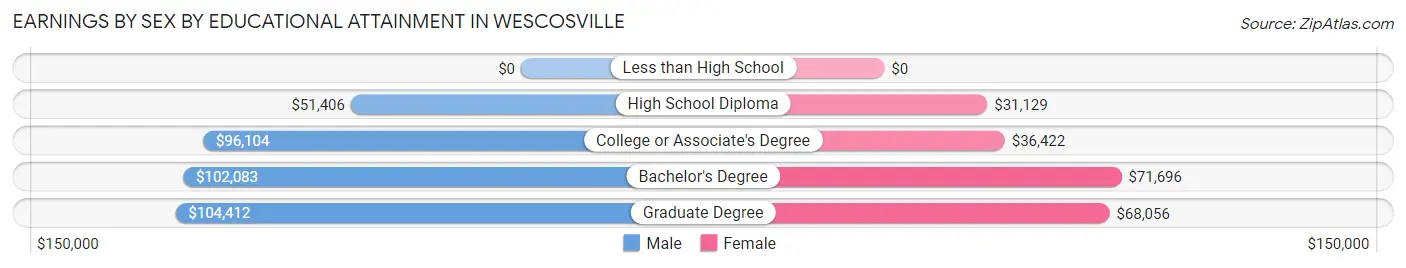
Earnings by Sex by Educational Attainment in Wescosville
Average earnings in Wescosville are $95,718 for men and $55,000 for women, a difference of 42.5%. Men with an educational attainment of graduate degree enjoy the highest average annual earnings of $104,412, while those with high school diploma education earn the least with $51,406. Women with an educational attainment of bachelor's degree earn the most with the average annual earnings of $71,696, while those with high school diploma education have the smallest earnings of $31,129.
| Educational Attainment | Male Income | Female Income |
| Less than High School | - | - |
| High School Diploma | $51,406 | $31,129 |
| College or Associate's Degree | $96,104 | $36,422 |
| Bachelor's Degree | $102,083 | $71,696 |
| Graduate Degree | $104,412 | $68,056 |
| Total | $95,718 | $55,000 |
Family Income in Wescosville
Family Income Brackets in Wescosville
According to the Wescosville family income data, there are 584 families falling into the $150,000 to $199,999 income range, which is the most common income bracket and makes up 28.1% of all families.
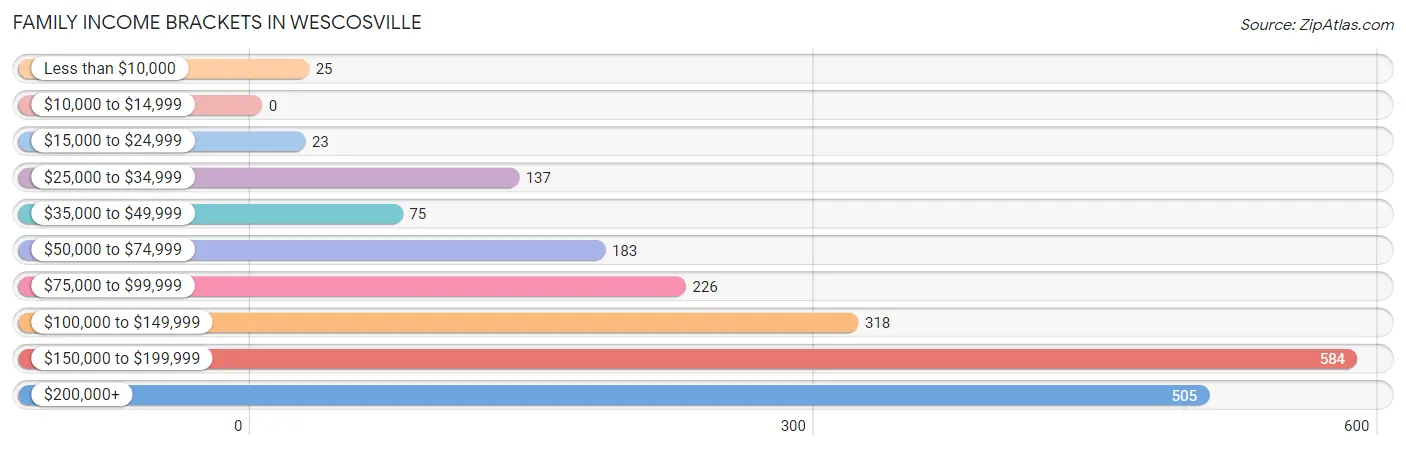
| Income Bracket | # Families | % Families |
| Less than $10,000 | 25 | 1.2% |
| $10,000 to $14,999 | 0 | 0.0% |
| $15,000 to $24,999 | 23 | 1.1% |
| $25,000 to $34,999 | 137 | 6.6% |
| $35,000 to $49,999 | 75 | 3.6% |
| $50,000 to $74,999 | 183 | 8.8% |
| $75,000 to $99,999 | 226 | 10.9% |
| $100,000 to $149,999 | 318 | 15.3% |
| $150,000 to $199,999 | 584 | 28.1% |
| $200,000+ | 505 | 24.3% |
Family Income by Famaliy Size in Wescosville
6-person families (52 | 2.5%) account for the highest median family income in Wescosville with $250,001 per family, while 2-person families (1,219 | 58.7%) have the highest median income of $85,982 per family member.
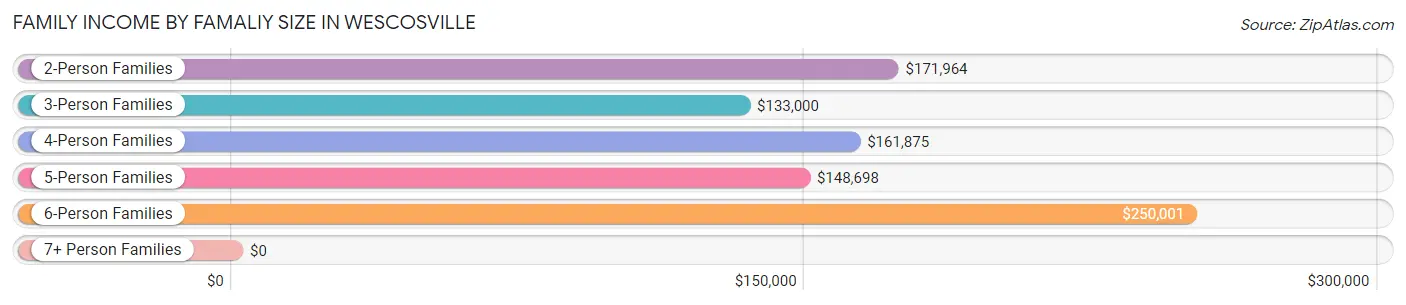
| Income Bracket | # Families | Median Income |
| 2-Person Families | 1,219 (58.7%) | $171,964 |
| 3-Person Families | 342 (16.5%) | $133,000 |
| 4-Person Families | 253 (12.2%) | $161,875 |
| 5-Person Families | 211 (10.2%) | $148,698 |
| 6-Person Families | 52 (2.5%) | $250,001 |
| 7+ Person Families | 0 (0.0%) | $0 |
| Total | 2,077 (100.0%) | $161,620 |
Family Income by Number of Earners in Wescosville
The median family income in Wescosville is $161,620, with families comprising 3+ earners (181) having the highest median family income of $201,691, while families with 1 earner (560) have the lowest median family income of $61,848, accounting for 8.7% and 27.0% of families, respectively.
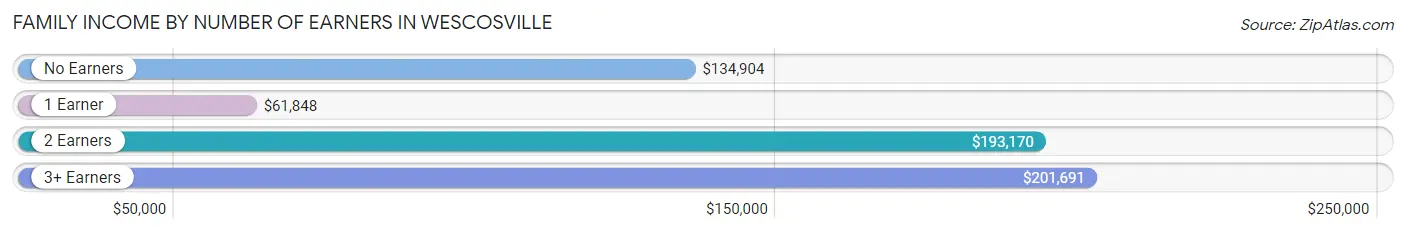
| Number of Earners | # Families | Median Income |
| No Earners | 213 (10.3%) | $134,904 |
| 1 Earner | 560 (27.0%) | $61,848 |
| 2 Earners | 1,123 (54.1%) | $193,170 |
| 3+ Earners | 181 (8.7%) | $201,691 |
| Total | 2,077 (100.0%) | $161,620 |
Household Income in Wescosville
Household Income Brackets in Wescosville
With 611 households falling in the category, the $150,000 to $199,999 income range is the most frequent in Wescosville, accounting for 22.9% of all households.
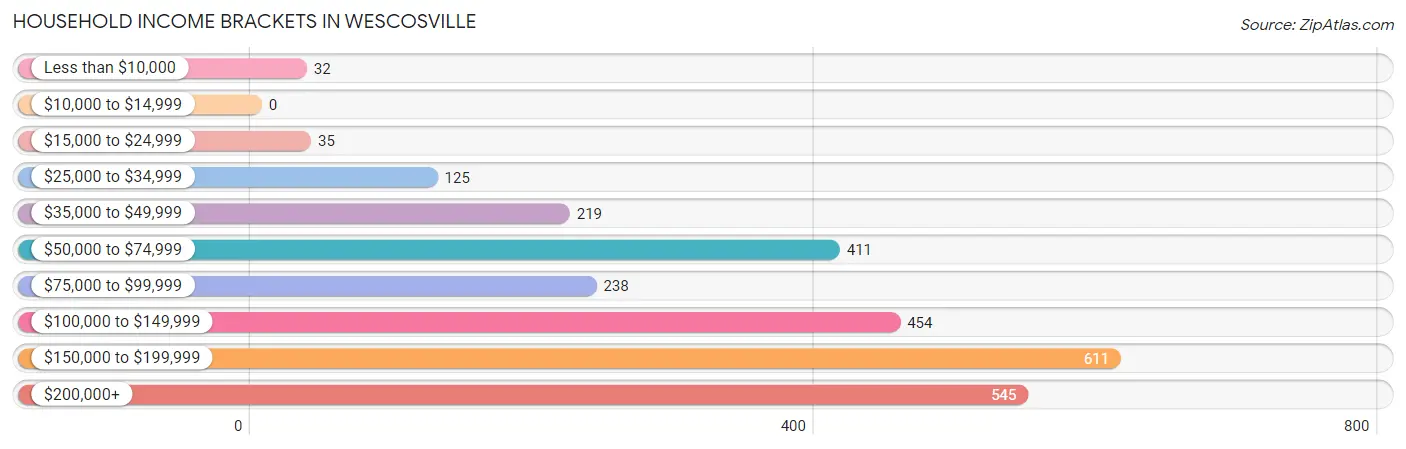
| Income Bracket | # Households | % Households |
| Less than $10,000 | 32 | 1.2% |
| $10,000 to $14,999 | 0 | 0.0% |
| $15,000 to $24,999 | 35 | 1.3% |
| $25,000 to $34,999 | 125 | 4.7% |
| $35,000 to $49,999 | 219 | 8.2% |
| $50,000 to $74,999 | 411 | 15.4% |
| $75,000 to $99,999 | 238 | 8.9% |
| $100,000 to $149,999 | 454 | 17.0% |
| $150,000 to $199,999 | 611 | 22.9% |
| $200,000+ | 545 | 20.4% |
Household Income by Householder Age in Wescosville
The median household income in Wescosville is $128,853, with the highest median household income of $192,550 found in the 45 to 64 years age bracket for the primary householder. A total of 1,334 households (50.0%) fall into this category. Meanwhile, the 15 to 24 years age bracket for the primary householder has the lowest median household income of $0, with 5 households (0.2%) in this group.
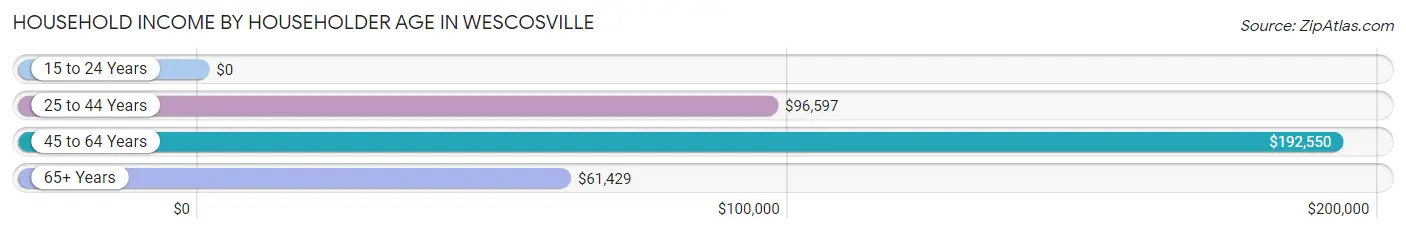
| Income Bracket | # Households | Median Income |
| 15 to 24 Years | 5 (0.2%) | $0 |
| 25 to 44 Years | 673 (25.2%) | $96,597 |
| 45 to 64 Years | 1,334 (50.0%) | $192,550 |
| 65+ Years | 658 (24.6%) | $61,429 |
| Total | 2,670 (100.0%) | $128,853 |
Poverty in Wescosville
Income Below Poverty by Sex and Age in Wescosville
With 1.7% poverty level for males and 3.0% for females among the residents of Wescosville, 12 to 14 year old males and 35 to 44 year old females are the most vulnerable to poverty, with 18 males (14.7%) and 33 females (9.0%) in their respective age groups living below the poverty level.
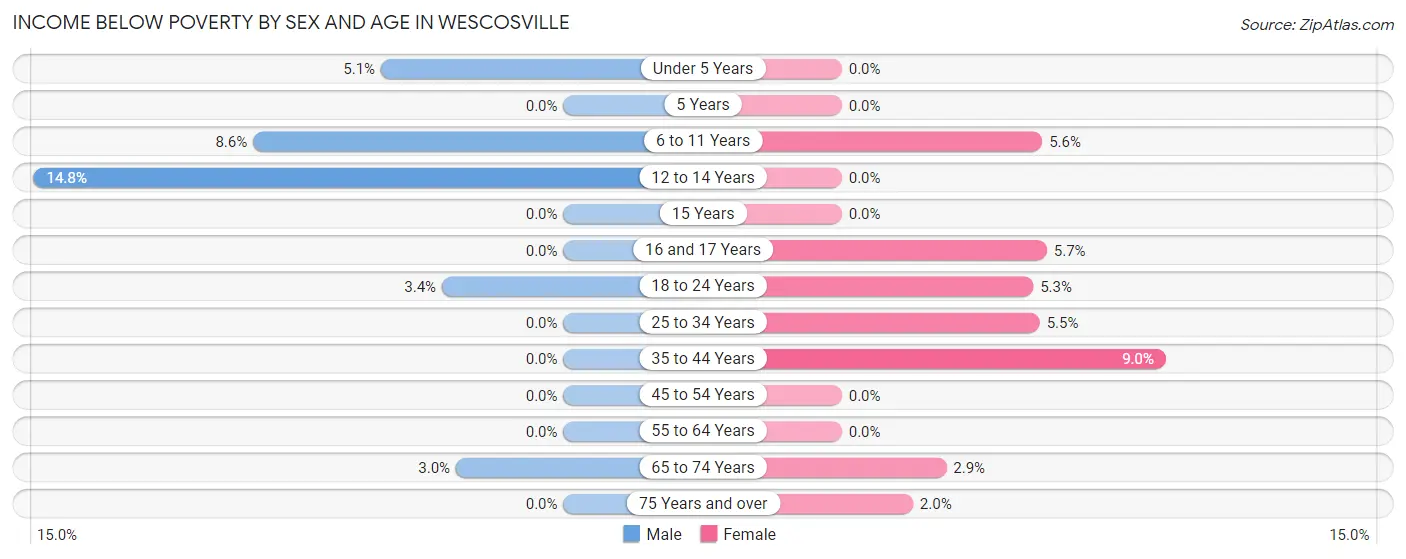
| Age Bracket | Male | Female |
| Under 5 Years | 10 (5.1%) | 0 (0.0%) |
| 5 Years | 0 (0.0%) | 0 (0.0%) |
| 6 to 11 Years | 14 (8.6%) | 11 (5.6%) |
| 12 to 14 Years | 18 (14.7%) | 0 (0.0%) |
| 15 Years | 0 (0.0%) | 0 (0.0%) |
| 16 and 17 Years | 0 (0.0%) | 12 (5.7%) |
| 18 to 24 Years | 5 (3.4%) | 16 (5.3%) |
| 25 to 34 Years | 0 (0.0%) | 20 (5.5%) |
| 35 to 44 Years | 0 (0.0%) | 33 (9.0%) |
| 45 to 54 Years | 0 (0.0%) | 0 (0.0%) |
| 55 to 64 Years | 0 (0.0%) | 0 (0.0%) |
| 65 to 74 Years | 8 (3.0%) | 8 (2.9%) |
| 75 Years and over | 0 (0.0%) | 7 (2.0%) |
| Total | 55 (1.7%) | 107 (3.0%) |
Income Above Poverty by Sex and Age in Wescosville
According to the poverty statistics in Wescosville, males aged 5 years and females aged under 5 years are the age groups that are most secure financially, with 100.0% of males and 100.0% of females in these age groups living above the poverty line.
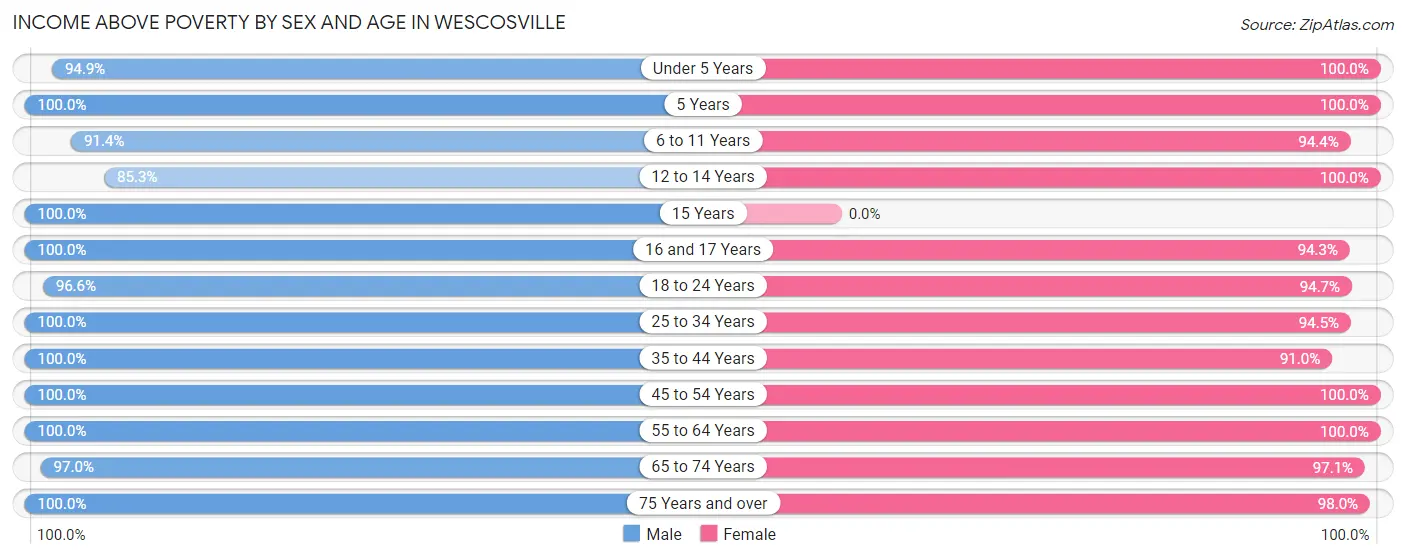
| Age Bracket | Male | Female |
| Under 5 Years | 187 (94.9%) | 155 (100.0%) |
| 5 Years | 63 (100.0%) | 115 (100.0%) |
| 6 to 11 Years | 148 (91.4%) | 186 (94.4%) |
| 12 to 14 Years | 104 (85.3%) | 113 (100.0%) |
| 15 Years | 65 (100.0%) | 0 (0.0%) |
| 16 and 17 Years | 110 (100.0%) | 198 (94.3%) |
| 18 to 24 Years | 143 (96.6%) | 284 (94.7%) |
| 25 to 34 Years | 272 (100.0%) | 343 (94.5%) |
| 35 to 44 Years | 347 (100.0%) | 333 (91.0%) |
| 45 to 54 Years | 483 (100.0%) | 452 (100.0%) |
| 55 to 64 Years | 697 (100.0%) | 655 (100.0%) |
| 65 to 74 Years | 260 (97.0%) | 267 (97.1%) |
| 75 Years and over | 225 (100.0%) | 346 (98.0%) |
| Total | 3,104 (98.3%) | 3,447 (97.0%) |
Income Below Poverty Among Married-Couple Families in Wescosville
The poverty statistics for married-couple families in Wescosville show that 0.5% or 8 of the total 1,522 families live below the poverty line. Families with 1 or 2 children have the highest poverty rate of 2.5%, comprising of 8 families. On the other hand, families with no children have the lowest poverty rate of 0.0%, which includes 0 families.
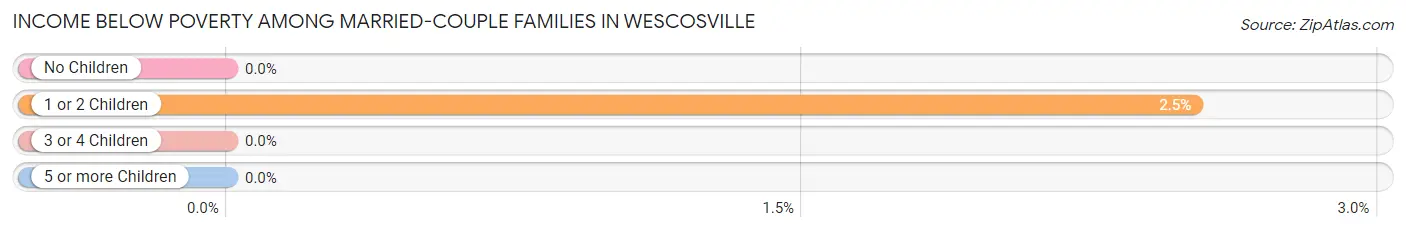
| Children | Above Poverty | Below Poverty |
| No Children | 1,065 (100.0%) | 0 (0.0%) |
| 1 or 2 Children | 309 (97.5%) | 8 (2.5%) |
| 3 or 4 Children | 140 (100.0%) | 0 (0.0%) |
| 5 or more Children | 0 (0.0%) | 0 (0.0%) |
| Total | 1,514 (99.5%) | 8 (0.5%) |
Income Below Poverty Among Single-Parent Households in Wescosville
According to the poverty data in Wescosville, 1.3% or 5 single-father households and 13.1% or 24 single-mother households are living below the poverty line. Among single-father households, those with 1 or 2 children have the highest poverty rate, with 5 households (1.7%) experiencing poverty. Likewise, among single-mother households, those with 3 or 4 children have the highest poverty rate, with 4 households (100.0%) falling below the poverty line.
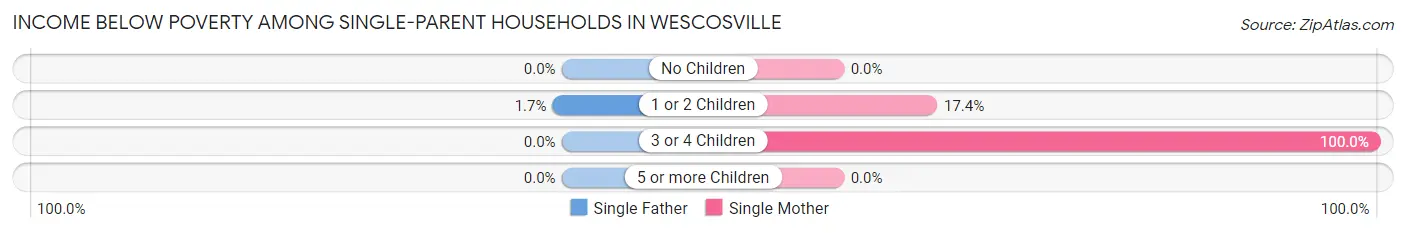
| Children | Single Father | Single Mother |
| No Children | 0 (0.0%) | 0 (0.0%) |
| 1 or 2 Children | 5 (1.7%) | 20 (17.4%) |
| 3 or 4 Children | 0 (0.0%) | 4 (100.0%) |
| 5 or more Children | 0 (0.0%) | 0 (0.0%) |
| Total | 5 (1.3%) | 24 (13.1%) |
Income Below Poverty Among Married-Couple vs Single-Parent Households in Wescosville
The poverty data for Wescosville shows that 8 of the married-couple family households (0.5%) and 29 of the single-parent households (5.2%) are living below the poverty level. Within the married-couple family households, those with 1 or 2 children have the highest poverty rate, with 8 households (2.5%) falling below the poverty line. Among the single-parent households, those with 3 or 4 children have the highest poverty rate, with 4 household (100.0%) living below poverty.
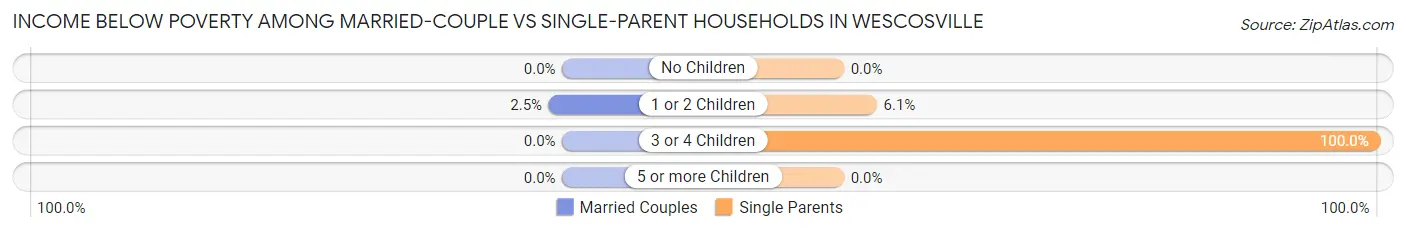
| Children | Married-Couple Families | Single-Parent Households |
| No Children | 0 (0.0%) | 0 (0.0%) |
| 1 or 2 Children | 8 (2.5%) | 25 (6.1%) |
| 3 or 4 Children | 0 (0.0%) | 4 (100.0%) |
| 5 or more Children | 0 (0.0%) | 0 (0.0%) |
| Total | 8 (0.5%) | 29 (5.2%) |
Race in Wescosville
The most populous races in Wescosville are White / Caucasian (5,830 | 85.8%), Hispanic or Latino (593 | 8.7%), and Black / African American (430 | 6.3%).
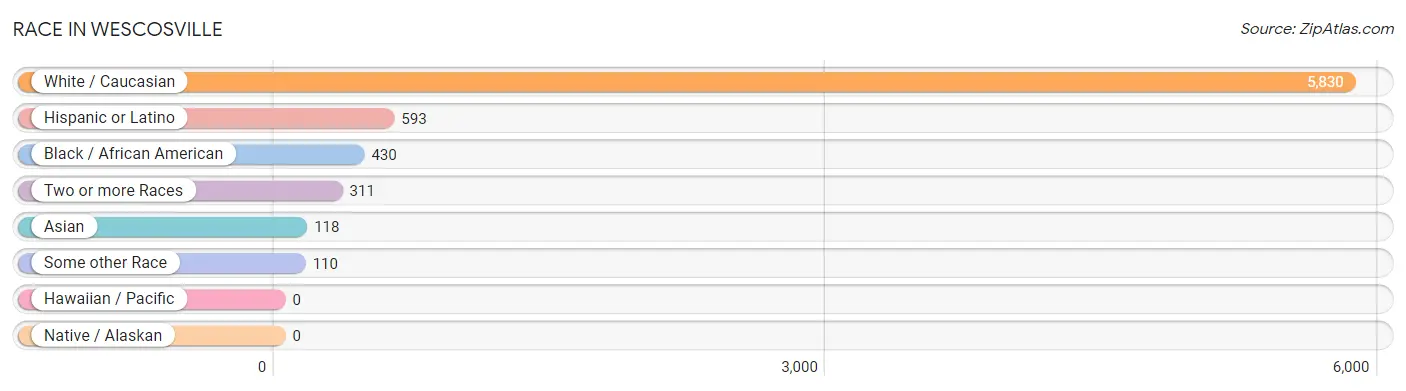
| Race | # Population | % Population |
| Asian | 118 | 1.7% |
| Black / African American | 430 | 6.3% |
| Hawaiian / Pacific | 0 | 0.0% |
| Hispanic or Latino | 593 | 8.7% |
| Native / Alaskan | 0 | 0.0% |
| White / Caucasian | 5,830 | 85.8% |
| Two or more Races | 311 | 4.6% |
| Some other Race | 110 | 1.6% |
| Total | 6,799 | 100.0% |
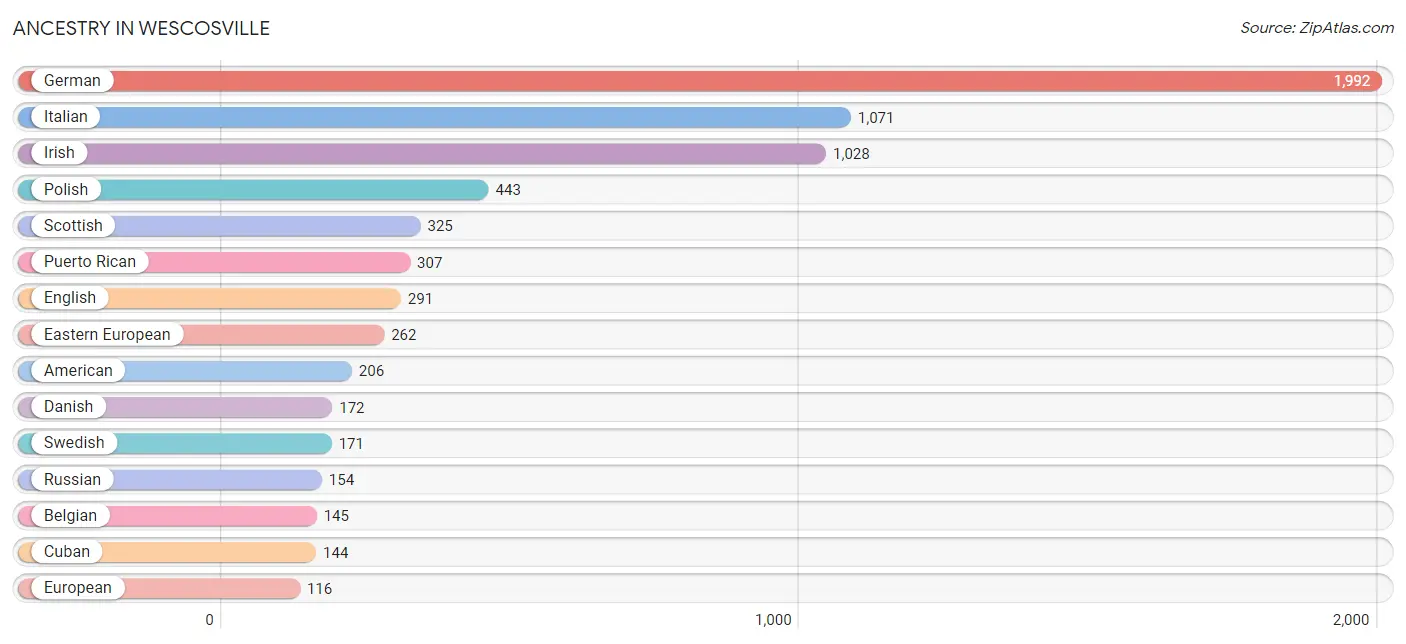
Ancestry in Wescosville
The most populous ancestries reported in Wescosville are German (1,992 | 29.3%), Italian (1,071 | 15.8%), Irish (1,028 | 15.1%), Polish (443 | 6.5%), and Scottish (325 | 4.8%), together accounting for 71.5% of all Wescosville residents.
| Ancestry | # Population | % Population |
| American | 206 | 3.0% |
| Arab | 10 | 0.2% |
| Argentinean | 20 | 0.3% |
| Austrian | 92 | 1.3% |
| Belgian | 145 | 2.1% |
| Bhutanese | 26 | 0.4% |
| Celtic | 9 | 0.1% |
| Chilean | 21 | 0.3% |
| Cuban | 144 | 2.1% |
| Czech | 44 | 0.6% |
| Danish | 172 | 2.5% |
| Dominican | 26 | 0.4% |
| Dutch | 30 | 0.4% |
| Eastern European | 262 | 3.8% |
| Ecuadorian | 22 | 0.3% |
| English | 291 | 4.3% |
| European | 116 | 1.7% |
| French | 44 | 0.6% |
| French Canadian | 59 | 0.9% |
| German | 1,992 | 29.3% |
| Haitian | 18 | 0.3% |
| Hungarian | 46 | 0.7% |
| Indian (Asian) | 57 | 0.8% |
| Irish | 1,028 | 15.1% |
| Italian | 1,071 | 15.8% |
| Jamaican | 19 | 0.3% |
| Lithuanian | 14 | 0.2% |
| Malaysian | 18 | 0.3% |
| Mexican | 42 | 0.6% |
| Pennsylvania German | 82 | 1.2% |
| Peruvian | 1 | 0.0% |
| Polish | 443 | 6.5% |
| Puerto Rican | 307 | 4.5% |
| Russian | 154 | 2.3% |
| Scotch-Irish | 49 | 0.7% |
| Scottish | 325 | 4.8% |
| Serbian | 56 | 0.8% |
| Slovak | 69 | 1.0% |
| Slovene | 9 | 0.1% |
| South American | 64 | 0.9% |
| Spaniard | 10 | 0.2% |
| Swedish | 171 | 2.5% |
| Syrian | 10 | 0.2% |
| Thai | 43 | 0.6% |
| Ukrainian | 110 | 1.6% |
| Welsh | 50 | 0.7% |
| West Indian | 16 | 0.2% | View All 47 Rows |
Immigrants in Wescosville
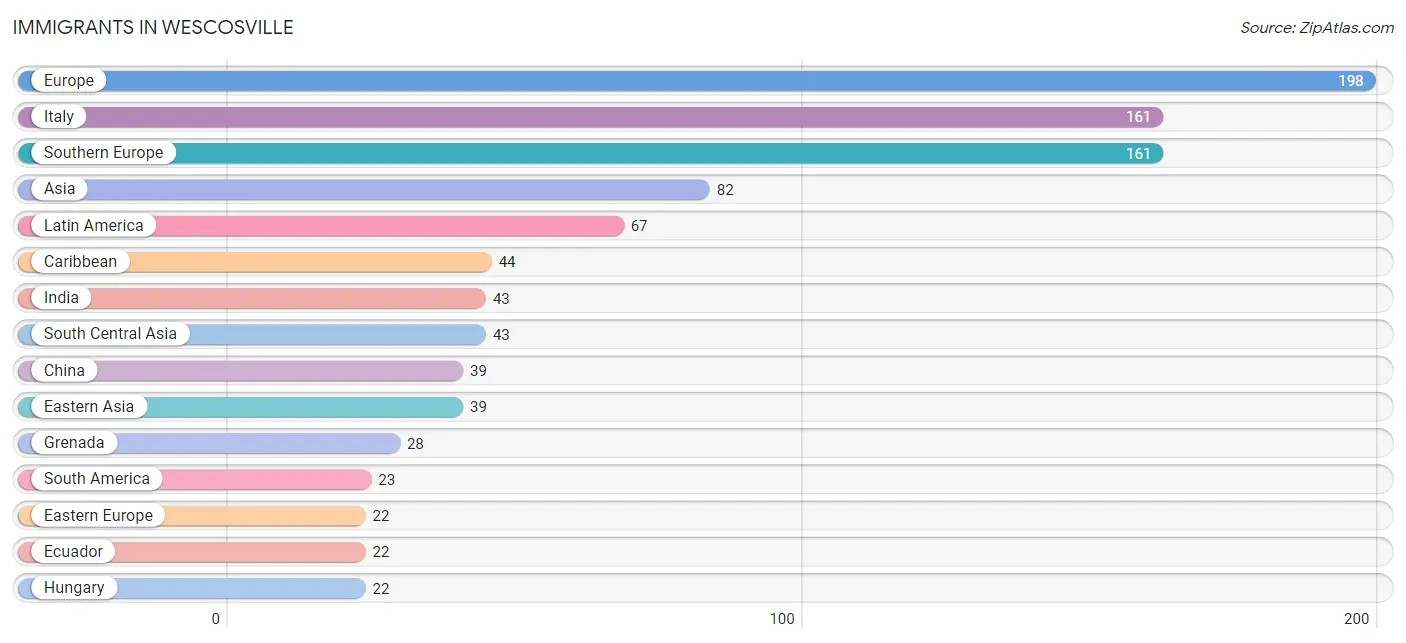
The most numerous immigrant groups reported in Wescosville came from Europe (198 | 2.9%), Italy (161 | 2.4%), Southern Europe (161 | 2.4%), Asia (82 | 1.2%), and Latin America (67 | 1.0%), together accounting for 9.9% of all Wescosville residents.
| Immigration Origin | # Population | % Population |
| Asia | 82 | 1.2% |
| Canada | 11 | 0.2% |
| Caribbean | 44 | 0.6% |
| China | 39 | 0.6% |
| Dominican Republic | 16 | 0.2% |
| Eastern Asia | 39 | 0.6% |
| Eastern Europe | 22 | 0.3% |
| Ecuador | 22 | 0.3% |
| Europe | 198 | 2.9% |
| Germany | 15 | 0.2% |
| Grenada | 28 | 0.4% |
| Hungary | 22 | 0.3% |
| India | 43 | 0.6% |
| Italy | 161 | 2.4% |
| Latin America | 67 | 1.0% |
| Peru | 1 | 0.0% |
| South America | 23 | 0.3% |
| South Central Asia | 43 | 0.6% |
| Southern Europe | 161 | 2.4% |
| Western Europe | 15 | 0.2% | View All 20 Rows |
Sex and Age in Wescosville
Sex and Age in Wescosville
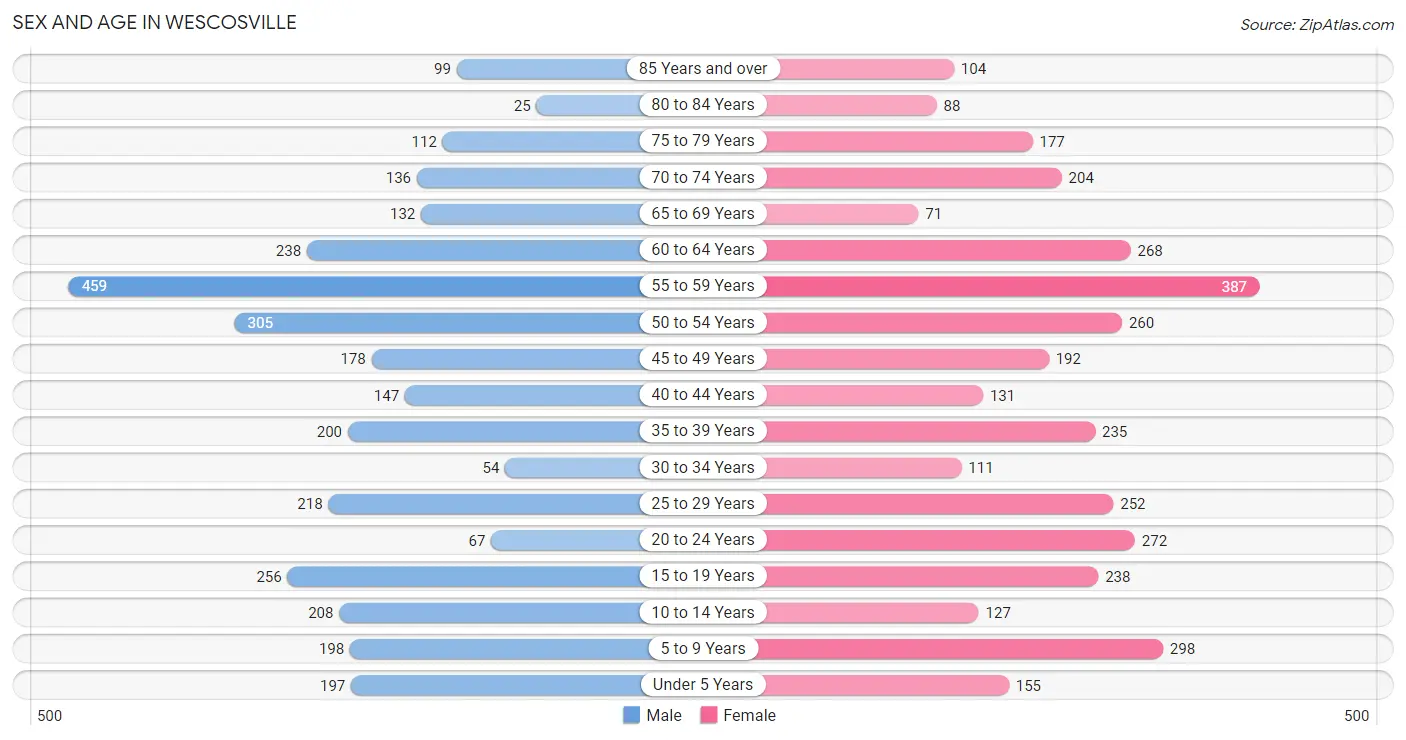
The most populous age groups in Wescosville are 55 to 59 Years (459 | 14.2%) for men and 55 to 59 Years (387 | 10.8%) for women.
| Age Bracket | Male | Female |
| Under 5 Years | 197 (6.1%) | 155 (4.3%) |
| 5 to 9 Years | 198 (6.1%) | 298 (8.4%) |
| 10 to 14 Years | 208 (6.4%) | 127 (3.6%) |
| 15 to 19 Years | 256 (7.9%) | 238 (6.7%) |
| 20 to 24 Years | 67 (2.1%) | 272 (7.6%) |
| 25 to 29 Years | 218 (6.8%) | 252 (7.1%) |
| 30 to 34 Years | 54 (1.7%) | 111 (3.1%) |
| 35 to 39 Years | 200 (6.2%) | 235 (6.6%) |
| 40 to 44 Years | 147 (4.5%) | 131 (3.7%) |
| 45 to 49 Years | 178 (5.5%) | 192 (5.4%) |
| 50 to 54 Years | 305 (9.5%) | 260 (7.3%) |
| 55 to 59 Years | 459 (14.2%) | 387 (10.8%) |
| 60 to 64 Years | 238 (7.4%) | 268 (7.5%) |
| 65 to 69 Years | 132 (4.1%) | 71 (2.0%) |
| 70 to 74 Years | 136 (4.2%) | 204 (5.7%) |
| 75 to 79 Years | 112 (3.5%) | 177 (5.0%) |
| 80 to 84 Years | 25 (0.8%) | 88 (2.5%) |
| 85 Years and over | 99 (3.1%) | 104 (2.9%) |
| Total | 3,229 (100.0%) | 3,570 (100.0%) |
Families and Households in Wescosville
Median Family Size in Wescosville
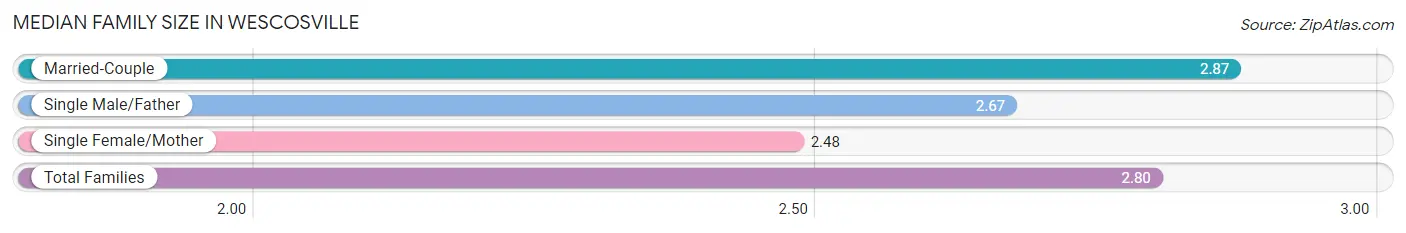
The median family size in Wescosville is 2.80 persons per family, with married-couple families (1,522 | 73.3%) accounting for the largest median family size of 2.87 persons per family. On the other hand, single female/mother families (183 | 8.8%) represent the smallest median family size with 2.48 persons per family.
| Family Type | # Families | Family Size |
| Married-Couple | 1,522 (73.3%) | 2.87 |
| Single Male/Father | 372 (17.9%) | 2.67 |
| Single Female/Mother | 183 (8.8%) | 2.48 |
| Total Families | 2,077 (100.0%) | 2.80 |
Median Household Size in Wescosville
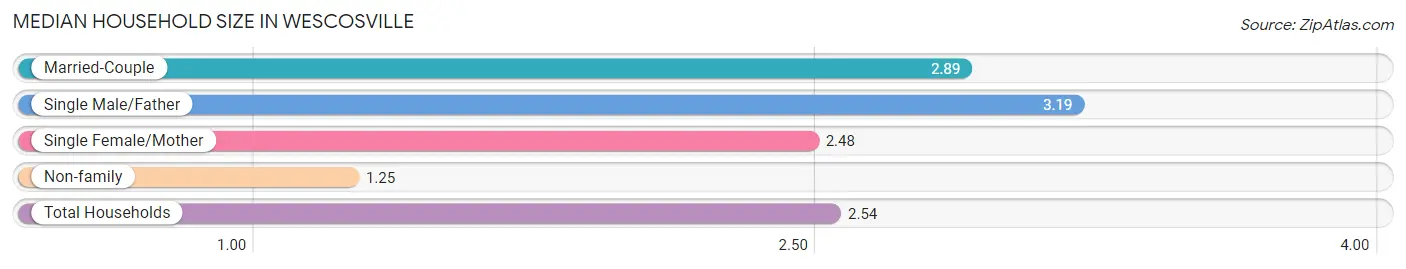
The median household size in Wescosville is 2.54 persons per household, with single male/father households (372 | 13.9%) accounting for the largest median household size of 3.19 persons per household. non-family households (593 | 22.2%) represent the smallest median household size with 1.25 persons per household.
| Household Type | # Households | Household Size |
| Married-Couple | 1,522 (57.0%) | 2.89 |
| Single Male/Father | 372 (13.9%) | 3.19 |
| Single Female/Mother | 183 (6.9%) | 2.48 |
| Non-family | 593 (22.2%) | 1.25 |
| Total Households | 2,670 (100.0%) | 2.54 |
Household Size by Marriage Status in Wescosville
Out of a total of 2,670 households in Wescosville, 2,077 (77.8%) are family households, while 593 (22.2%) are nonfamily households. The most numerous type of family households are 2-person households, comprising 1,078, and the most common type of nonfamily households are 1-person households, comprising 461.
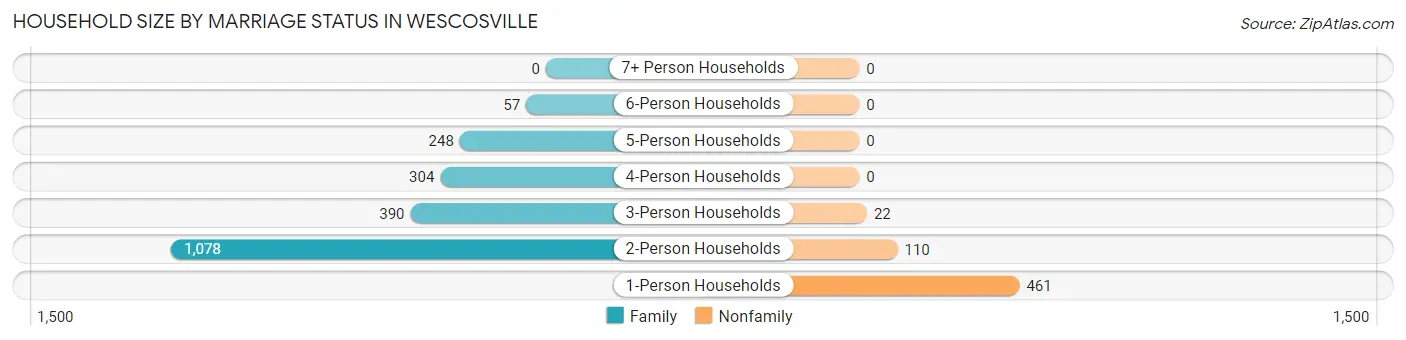
| Household Size | Family Households | Nonfamily Households |
| 1-Person Households | - | 461 (17.3%) |
| 2-Person Households | 1,078 (40.4%) | 110 (4.1%) |
| 3-Person Households | 390 (14.6%) | 22 (0.8%) |
| 4-Person Households | 304 (11.4%) | 0 (0.0%) |
| 5-Person Households | 248 (9.3%) | 0 (0.0%) |
| 6-Person Households | 57 (2.1%) | 0 (0.0%) |
| 7+ Person Households | 0 (0.0%) | 0 (0.0%) |
| Total | 2,077 (77.8%) | 593 (22.2%) |
Female Fertility in Wescosville
Fertility by Age in Wescosville
Average fertility rate in Wescosville is 32.0 births per 1,000 women. Women in the age bracket of 20 to 34 years have the highest fertility rate with 46.0 births per 1,000 women. Women in the age bracket of 20 to 34 years acount for 63.0% of all women with births.
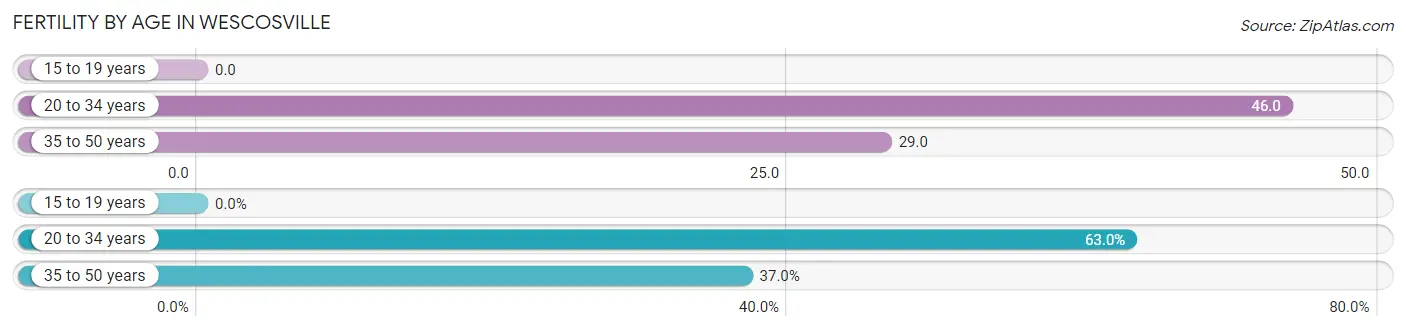
| Age Bracket | Women with Births | Births / 1,000 Women |
| 15 to 19 years | 0 (0.0%) | 0.0 |
| 20 to 34 years | 29 (63.0%) | 46.0 |
| 35 to 50 years | 17 (37.0%) | 29.0 |
| Total | 46 (100.0%) | 32.0 |
Fertility by Age by Marriage Status in Wescosville
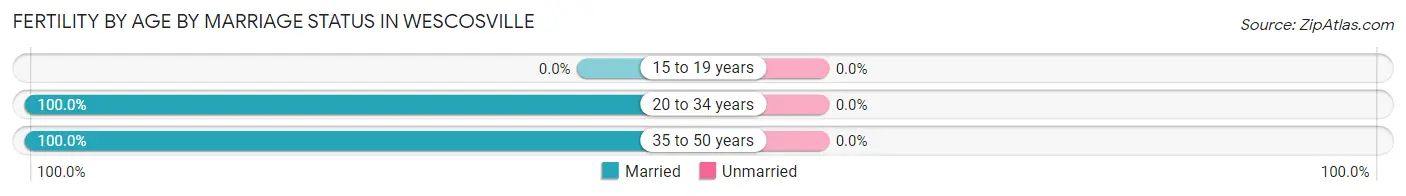
| Age Bracket | Married | Unmarried |
| 15 to 19 years | 0 (0.0%) | 0 (0.0%) |
| 20 to 34 years | 29 (100.0%) | 0 (0.0%) |
| 35 to 50 years | 17 (100.0%) | 0 (0.0%) |
| Total | 46 (100.0%) | 0 (0.0%) |
Fertility by Education in Wescosville
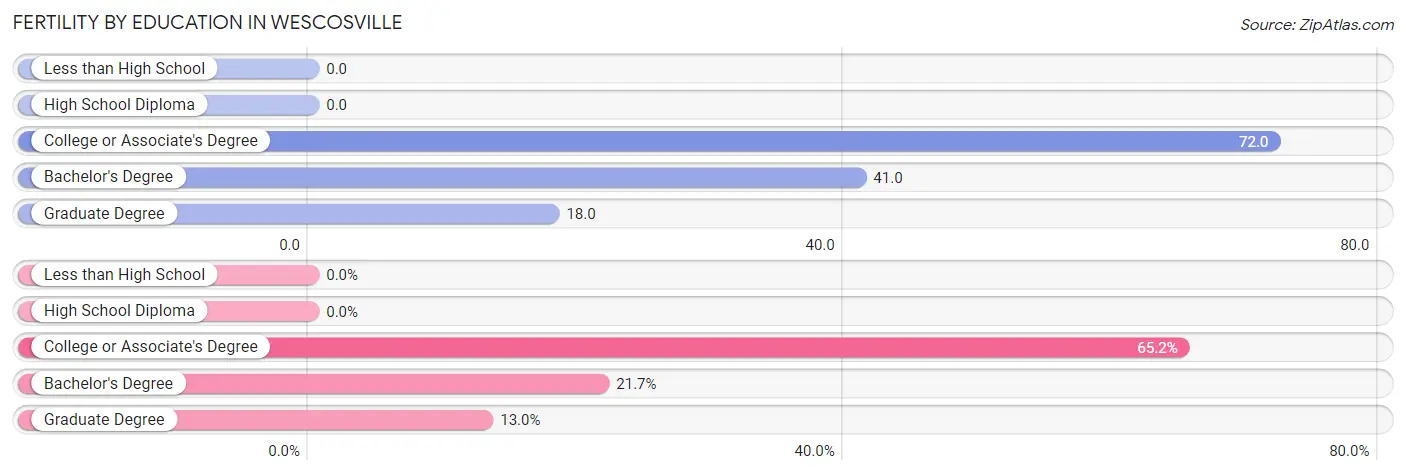
| Educational Attainment | Women with Births | Births / 1,000 Women |
| Less than High School | 0 (0.0%) | 0.0 |
| High School Diploma | 0 (0.0%) | 0.0 |
| College or Associate's Degree | 30 (65.2%) | 72.0 |
| Bachelor's Degree | 10 (21.7%) | 41.0 |
| Graduate Degree | 6 (13.0%) | 18.0 |
| Total | 46 (100.0%) | 32.0 |
Fertility by Education by Marriage Status in Wescosville
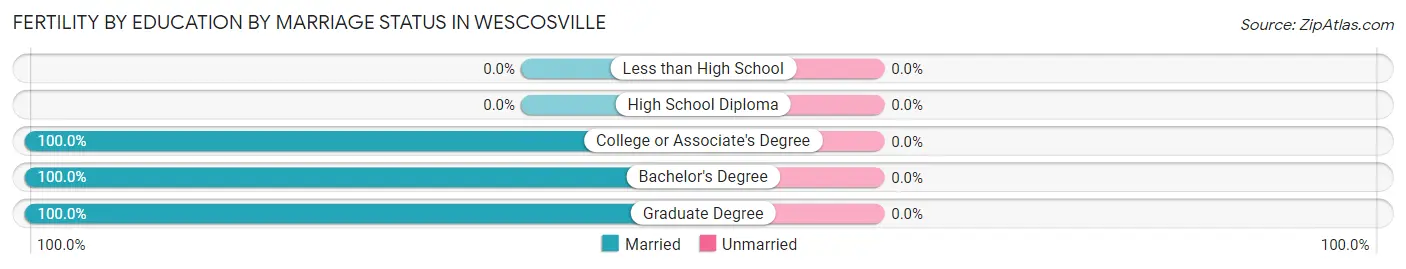
| Educational Attainment | Married | Unmarried |
| Less than High School | 0 (0.0%) | 0 (0.0%) |
| High School Diploma | 0 (0.0%) | 0 (0.0%) |
| College or Associate's Degree | 30 (100.0%) | 0 (0.0%) |
| Bachelor's Degree | 10 (100.0%) | 0 (0.0%) |
| Graduate Degree | 6 (100.0%) | 0 (0.0%) |
| Total | 46 (100.0%) | 0 (0.0%) |
Employment Characteristics in Wescosville
Employment by Class of Employer in Wescosville
Among the 3,827 employed individuals in Wescosville, private company employees (2,749 | 71.8%), not-for-profit organizations (459 | 12.0%), and local government employees (239 | 6.2%) make up the most common classes of employment.
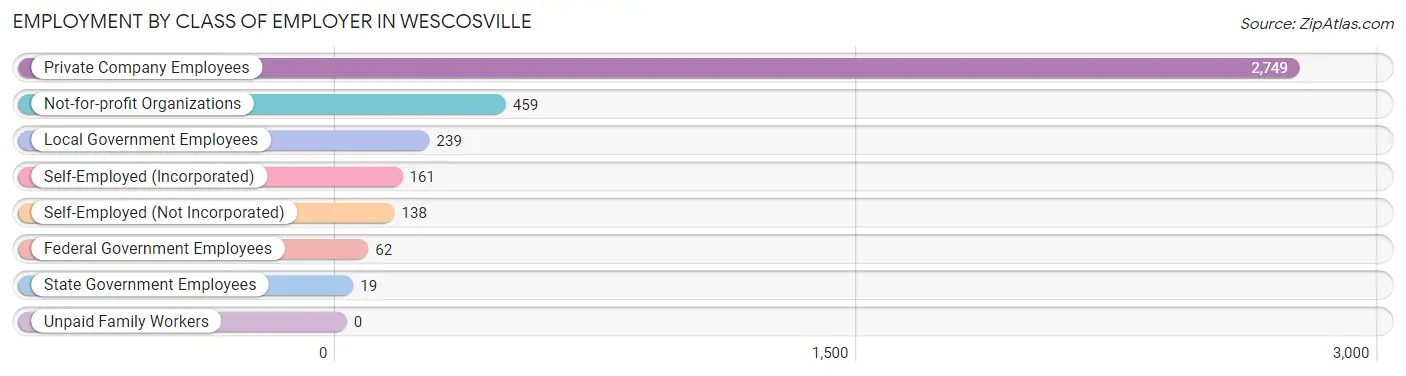
| Employer Class | # Employees | % Employees |
| Private Company Employees | 2,749 | 71.8% |
| Self-Employed (Incorporated) | 161 | 4.2% |
| Self-Employed (Not Incorporated) | 138 | 3.6% |
| Not-for-profit Organizations | 459 | 12.0% |
| Local Government Employees | 239 | 6.2% |
| State Government Employees | 19 | 0.5% |
| Federal Government Employees | 62 | 1.6% |
| Unpaid Family Workers | 0 | 0.0% |
| Total | 3,827 | 100.0% |
Employment Status by Age in Wescosville
According to the labor force statistics for Wescosville, out of the total population over 16 years of age (5,551), 71.6% or 3,975 individuals are in the labor force, with 3.0% or 119 of them unemployed. The age group with the highest labor force participation rate is 20 to 24 years, with 93.5% or 317 individuals in the labor force. Within the labor force, the 20 to 24 years age range has the highest percentage of unemployed individuals, with 26.2% or 83 of them being unemployed.
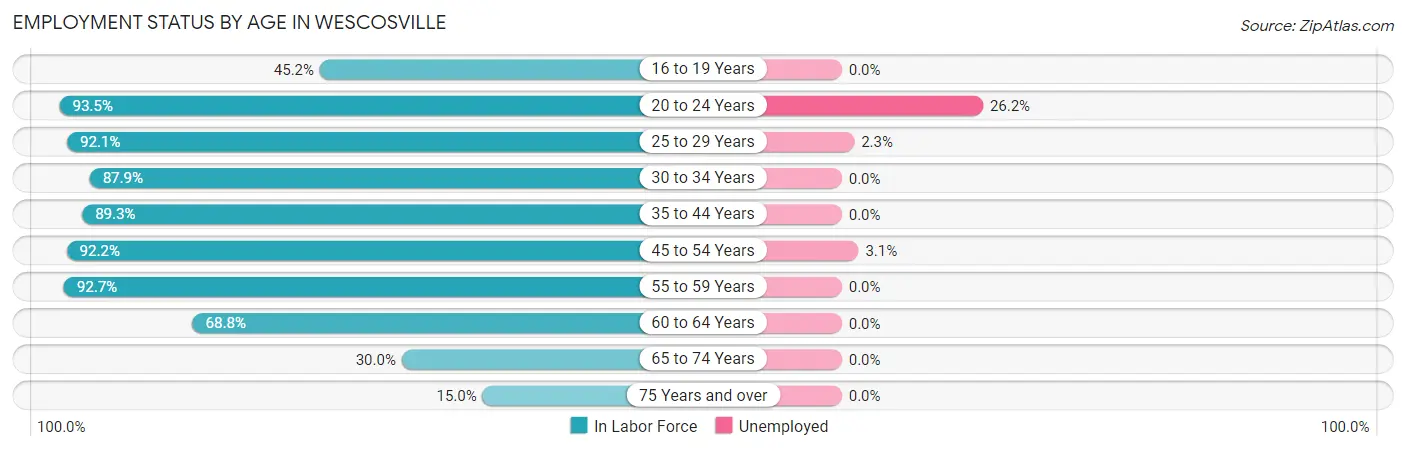
| Age Bracket | In Labor Force | Unemployed |
| 16 to 19 Years | 194 (45.2%) | 0 (0.0%) |
| 20 to 24 Years | 317 (93.5%) | 83 (26.2%) |
| 25 to 29 Years | 433 (92.1%) | 10 (2.3%) |
| 30 to 34 Years | 145 (87.9%) | 0 (0.0%) |
| 35 to 44 Years | 637 (89.3%) | 0 (0.0%) |
| 45 to 54 Years | 862 (92.2%) | 27 (3.1%) |
| 55 to 59 Years | 784 (92.7%) | 0 (0.0%) |
| 60 to 64 Years | 348 (68.8%) | 0 (0.0%) |
| 65 to 74 Years | 163 (30.0%) | 0 (0.0%) |
| 75 Years and over | 91 (15.0%) | 0 (0.0%) |
| Total | 3,975 (71.6%) | 119 (3.0%) |
Employment Status by Educational Attainment in Wescosville
According to labor force statistics for Wescosville, 88.3% of individuals (3,210) out of the total population between 25 and 64 years of age (3,635) are in the labor force, with 1.2% or 39 of them being unemployed. The group with the highest labor force participation rate are those with the educational attainment of high school diploma, with 93.6% or 656 individuals in the labor force. Within the labor force, individuals with less than high school education have the highest percentage of unemployment, with 40.9% or 27 of them being unemployed.
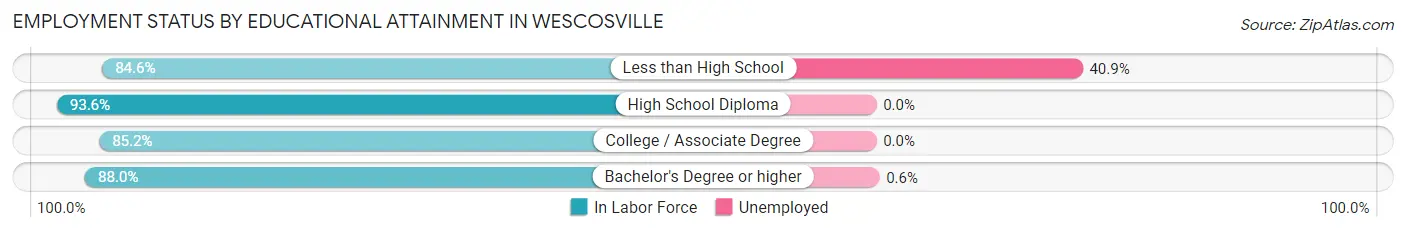
| Educational Attainment | In Labor Force | Unemployed |
| Less than High School | 66 (84.6%) | 32 (40.9%) |
| High School Diploma | 656 (93.6%) | 0 (0.0%) |
| College / Associate Degree | 816 (85.2%) | 0 (0.0%) |
| Bachelor's Degree or higher | 1,670 (88.0%) | 11 (0.6%) |
| Total | 3,210 (88.3%) | 44 (1.2%) |
Employment Occupations by Sex in Wescosville
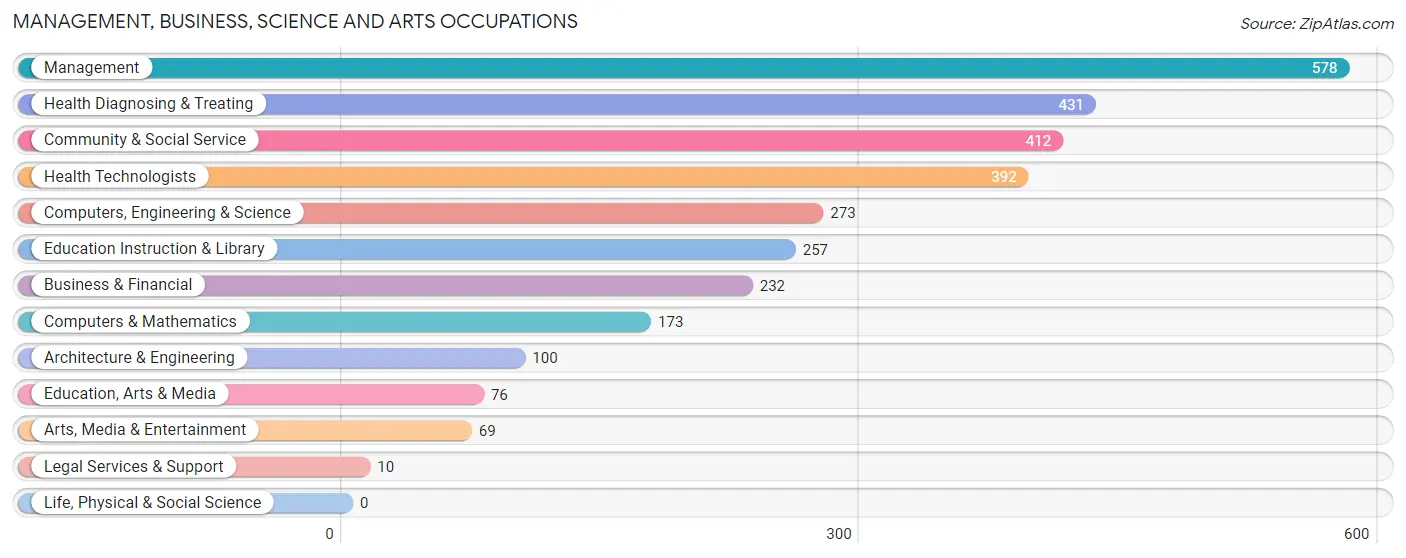
Management, Business, Science and Arts Occupations
The most common Management, Business, Science and Arts occupations in Wescosville are Management (578 | 15.0%), Health Diagnosing & Treating (431 | 11.2%), Community & Social Service (412 | 10.7%), Health Technologists (392 | 10.2%), and Computers, Engineering & Science (273 | 7.1%).
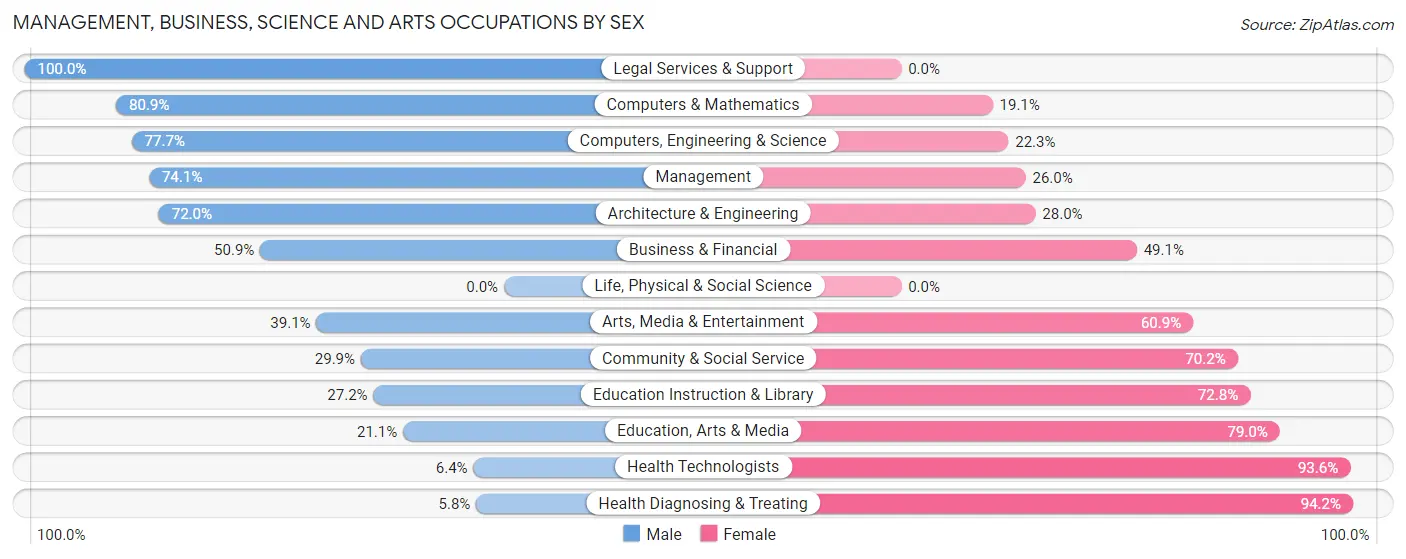
Management, Business, Science and Arts Occupations by Sex
Within the Management, Business, Science and Arts occupations in Wescosville, the most male-oriented occupations are Legal Services & Support (100.0%), Computers & Mathematics (80.9%), and Computers, Engineering & Science (77.7%), while the most female-oriented occupations are Health Diagnosing & Treating (94.2%), Health Technologists (93.6%), and Education, Arts & Media (78.9%).
| Occupation | Male | Female |
| Management | 428 (74.1%) | 150 (26.0%) |
| Business & Financial | 118 (50.9%) | 114 (49.1%) |
| Computers, Engineering & Science | 212 (77.7%) | 61 (22.3%) |
| Computers & Mathematics | 140 (80.9%) | 33 (19.1%) |
| Architecture & Engineering | 72 (72.0%) | 28 (28.0%) |
| Life, Physical & Social Science | 0 (0.0%) | 0 (0.0%) |
| Community & Social Service | 123 (29.8%) | 289 (70.2%) |
| Education, Arts & Media | 16 (21.0%) | 60 (78.9%) |
| Legal Services & Support | 10 (100.0%) | 0 (0.0%) |
| Education Instruction & Library | 70 (27.2%) | 187 (72.8%) |
| Arts, Media & Entertainment | 27 (39.1%) | 42 (60.9%) |
| Health Diagnosing & Treating | 25 (5.8%) | 406 (94.2%) |
| Health Technologists | 25 (6.4%) | 367 (93.6%) |
| Total (Category) | 906 (47.0%) | 1,020 (53.0%) |
| Total (Overall) | 1,986 (51.5%) | 1,868 (48.5%) |
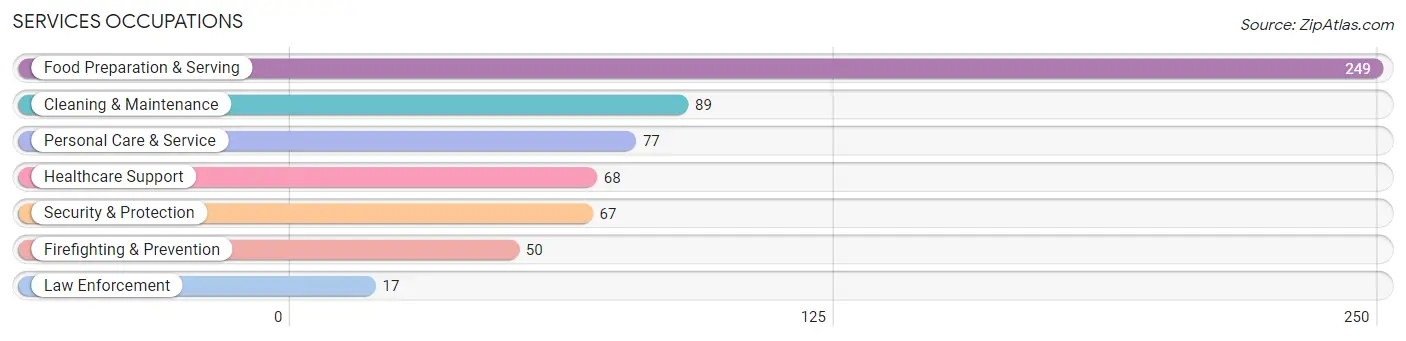
Services Occupations
The most common Services occupations in Wescosville are Food Preparation & Serving (249 | 6.5%), Cleaning & Maintenance (89 | 2.3%), Personal Care & Service (77 | 2.0%), Healthcare Support (68 | 1.8%), and Security & Protection (67 | 1.7%).
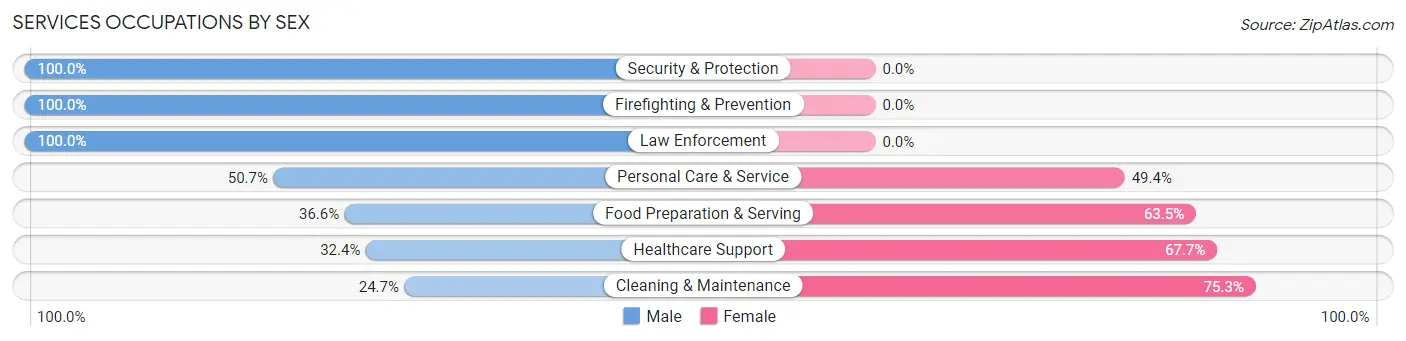
Services Occupations by Sex
Within the Services occupations in Wescosville, the most male-oriented occupations are Security & Protection (100.0%), Firefighting & Prevention (100.0%), and Law Enforcement (100.0%), while the most female-oriented occupations are Cleaning & Maintenance (75.3%), Healthcare Support (67.6%), and Food Preparation & Serving (63.4%).
| Occupation | Male | Female |
| Healthcare Support | 22 (32.4%) | 46 (67.6%) |
| Security & Protection | 67 (100.0%) | 0 (0.0%) |
| Firefighting & Prevention | 50 (100.0%) | 0 (0.0%) |
| Law Enforcement | 17 (100.0%) | 0 (0.0%) |
| Food Preparation & Serving | 91 (36.5%) | 158 (63.4%) |
| Cleaning & Maintenance | 22 (24.7%) | 67 (75.3%) |
| Personal Care & Service | 39 (50.6%) | 38 (49.3%) |
| Total (Category) | 241 (43.8%) | 309 (56.2%) |
| Total (Overall) | 1,986 (51.5%) | 1,868 (48.5%) |
Sales and Office Occupations
The most common Sales and Office occupations in Wescosville are Sales & Related (653 | 16.9%), and Office & Administration (364 | 9.4%).

Sales and Office Occupations by Sex

| Occupation | Male | Female |
| Sales & Related | 443 (67.8%) | 210 (32.2%) |
| Office & Administration | 105 (28.8%) | 259 (71.2%) |
| Total (Category) | 548 (53.9%) | 469 (46.1%) |
| Total (Overall) | 1,986 (51.5%) | 1,868 (48.5%) |
Natural Resources, Construction and Maintenance Occupations
The most common Natural Resources, Construction and Maintenance occupations in Wescosville are Construction & Extraction (161 | 4.2%), Installation, Maintenance & Repair (34 | 0.9%), and Farming, Fishing & Forestry (5 | 0.1%).

Natural Resources, Construction and Maintenance Occupations by Sex

| Occupation | Male | Female |
| Farming, Fishing & Forestry | 5 (100.0%) | 0 (0.0%) |
| Construction & Extraction | 153 (95.0%) | 8 (5.0%) |
| Installation, Maintenance & Repair | 34 (100.0%) | 0 (0.0%) |
| Total (Category) | 192 (96.0%) | 8 (4.0%) |
| Total (Overall) | 1,986 (51.5%) | 1,868 (48.5%) |
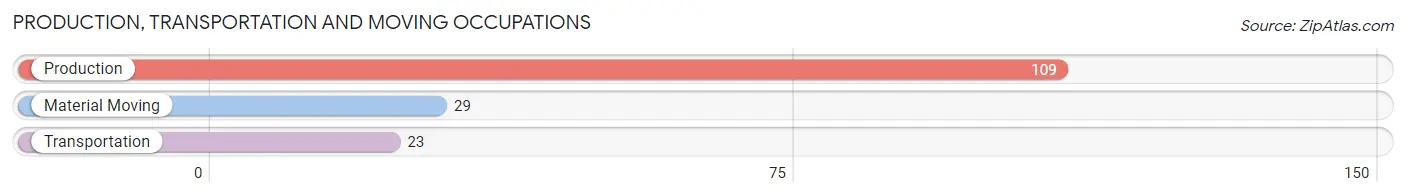
Production, Transportation and Moving Occupations
The most common Production, Transportation and Moving occupations in Wescosville are Production (109 | 2.8%), Material Moving (29 | 0.7%), and Transportation (23 | 0.6%).
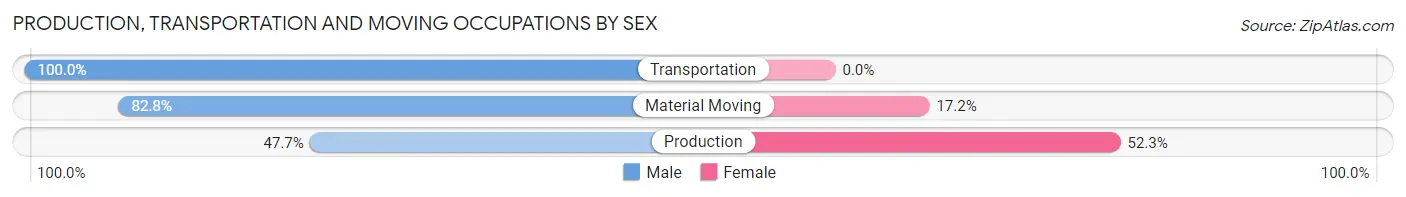
Production, Transportation and Moving Occupations by Sex
| Occupation | Male | Female |
| Production | 52 (47.7%) | 57 (52.3%) |
| Transportation | 23 (100.0%) | 0 (0.0%) |
| Material Moving | 24 (82.8%) | 5 (17.2%) |
| Total (Category) | 99 (61.5%) | 62 (38.5%) |
| Total (Overall) | 1,986 (51.5%) | 1,868 (48.5%) |
Employment Industries by Sex in Wescosville
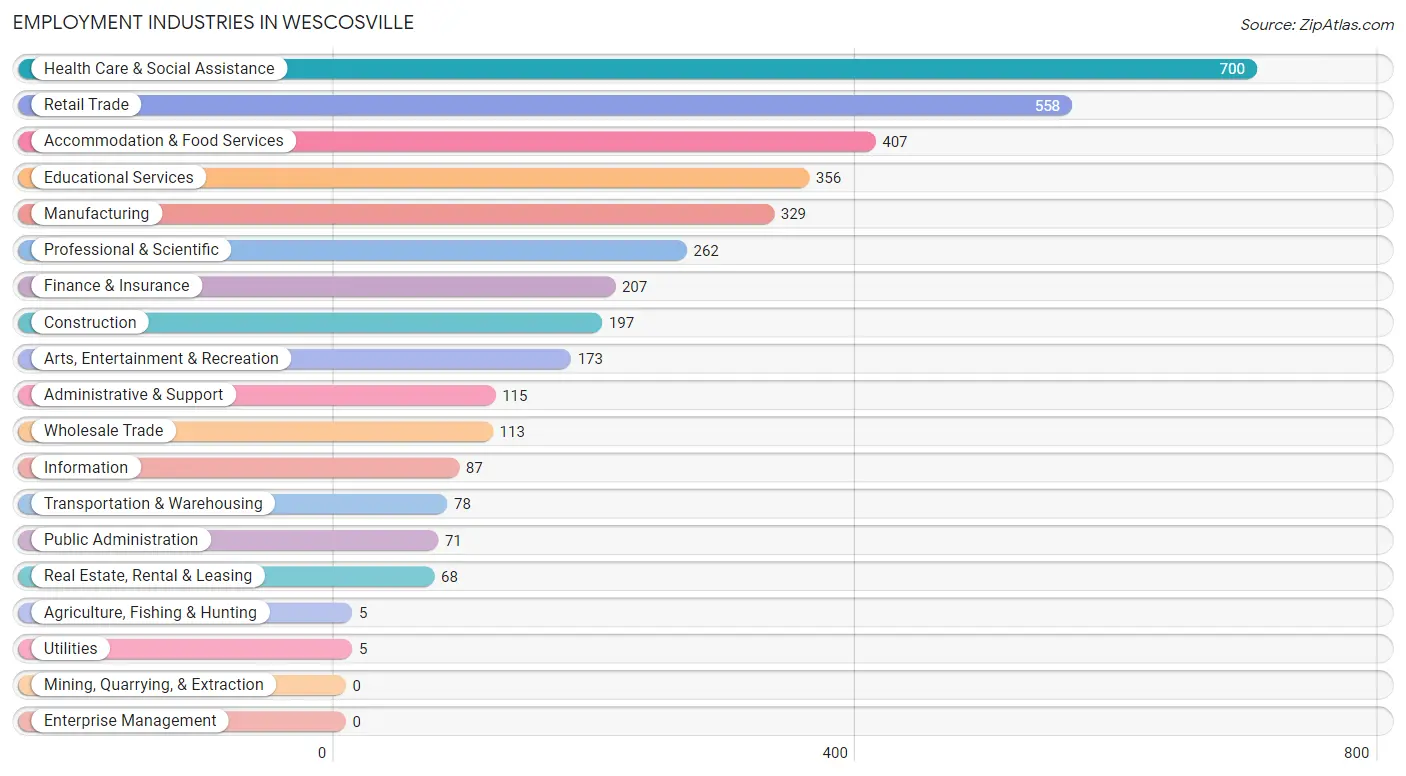
Employment Industries in Wescosville
The major employment industries in Wescosville include Health Care & Social Assistance (700 | 18.2%), Retail Trade (558 | 14.5%), Accommodation & Food Services (407 | 10.6%), Educational Services (356 | 9.2%), and Manufacturing (329 | 8.5%).
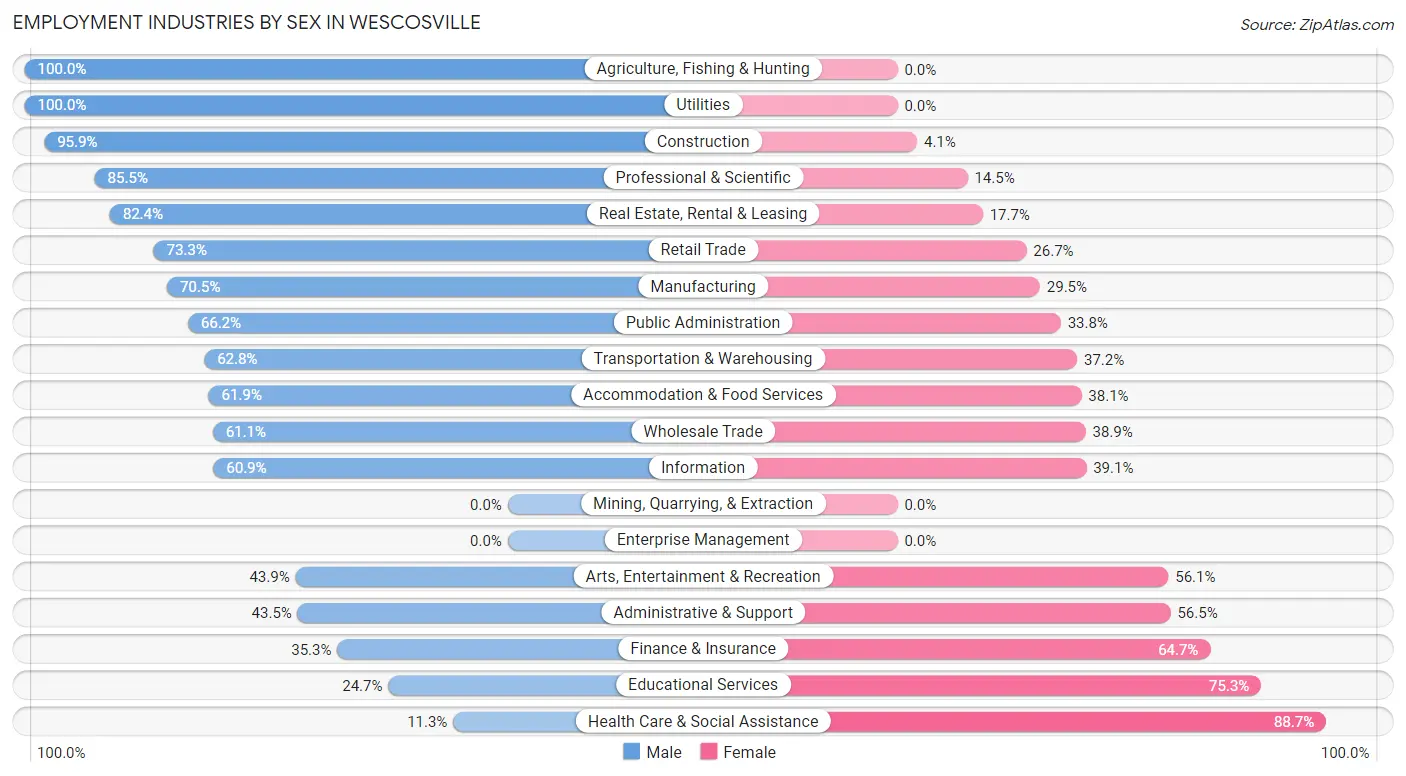
Employment Industries by Sex in Wescosville
The Wescosville industries that see more men than women are Agriculture, Fishing & Hunting (100.0%), Utilities (100.0%), and Construction (95.9%), whereas the industries that tend to have a higher number of women are Health Care & Social Assistance (88.7%), Educational Services (75.3%), and Finance & Insurance (64.7%).
| Industry | Male | Female |
| Agriculture, Fishing & Hunting | 5 (100.0%) | 0 (0.0%) |
| Mining, Quarrying, & Extraction | 0 (0.0%) | 0 (0.0%) |
| Construction | 189 (95.9%) | 8 (4.1%) |
| Manufacturing | 232 (70.5%) | 97 (29.5%) |
| Wholesale Trade | 69 (61.1%) | 44 (38.9%) |
| Retail Trade | 409 (73.3%) | 149 (26.7%) |
| Transportation & Warehousing | 49 (62.8%) | 29 (37.2%) |
| Utilities | 5 (100.0%) | 0 (0.0%) |
| Information | 53 (60.9%) | 34 (39.1%) |
| Finance & Insurance | 73 (35.3%) | 134 (64.7%) |
| Real Estate, Rental & Leasing | 56 (82.4%) | 12 (17.6%) |
| Professional & Scientific | 224 (85.5%) | 38 (14.5%) |
| Enterprise Management | 0 (0.0%) | 0 (0.0%) |
| Administrative & Support | 50 (43.5%) | 65 (56.5%) |
| Educational Services | 88 (24.7%) | 268 (75.3%) |
| Health Care & Social Assistance | 79 (11.3%) | 621 (88.7%) |
| Arts, Entertainment & Recreation | 76 (43.9%) | 97 (56.1%) |
| Accommodation & Food Services | 252 (61.9%) | 155 (38.1%) |
| Public Administration | 47 (66.2%) | 24 (33.8%) |
| Total | 1,986 (51.5%) | 1,868 (48.5%) |
Education in Wescosville
School Enrollment in Wescosville
The most common levels of schooling among the 1,585 students in Wescosville are high school (479 | 30.2%), middle school (324 | 20.4%), and elementary school (318 | 20.1%).
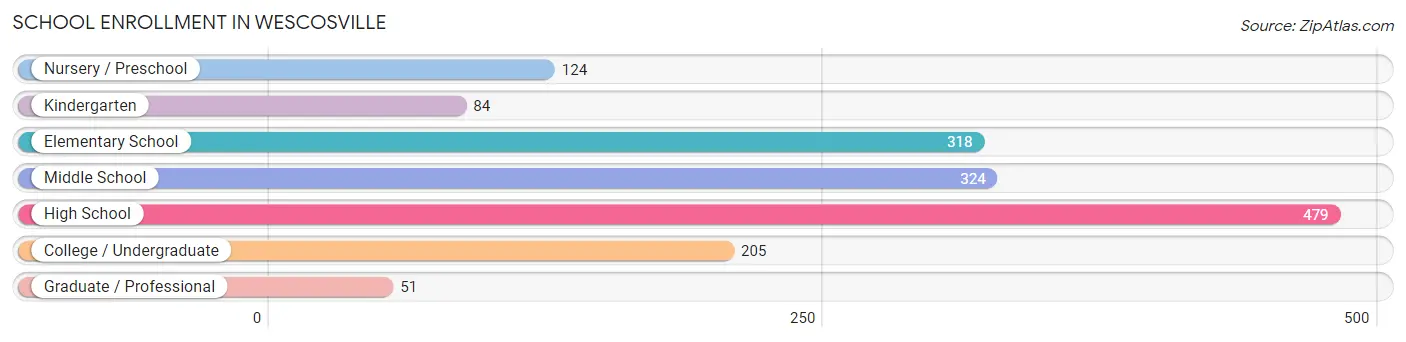
| School Level | # Students | % Students |
| Nursery / Preschool | 124 | 7.8% |
| Kindergarten | 84 | 5.3% |
| Elementary School | 318 | 20.1% |
| Middle School | 324 | 20.4% |
| High School | 479 | 30.2% |
| College / Undergraduate | 205 | 12.9% |
| Graduate / Professional | 51 | 3.2% |
| Total | 1,585 | 100.0% |
School Enrollment by Age by Funding Source in Wescosville
Out of a total of 1,585 students who are enrolled in schools in Wescosville, 301 (19.0%) attend a private institution, while the remaining 1,284 (81.0%) are enrolled in public schools. The age group of 3 to 4 year olds has the highest likelihood of being enrolled in private schools, with 40 (81.6% in the age bracket) enrolled. Conversely, the age group of 18 to 19 year olds has the lowest likelihood of being enrolled in a private school, with 104 (100.0% in the age bracket) attending a public institution.
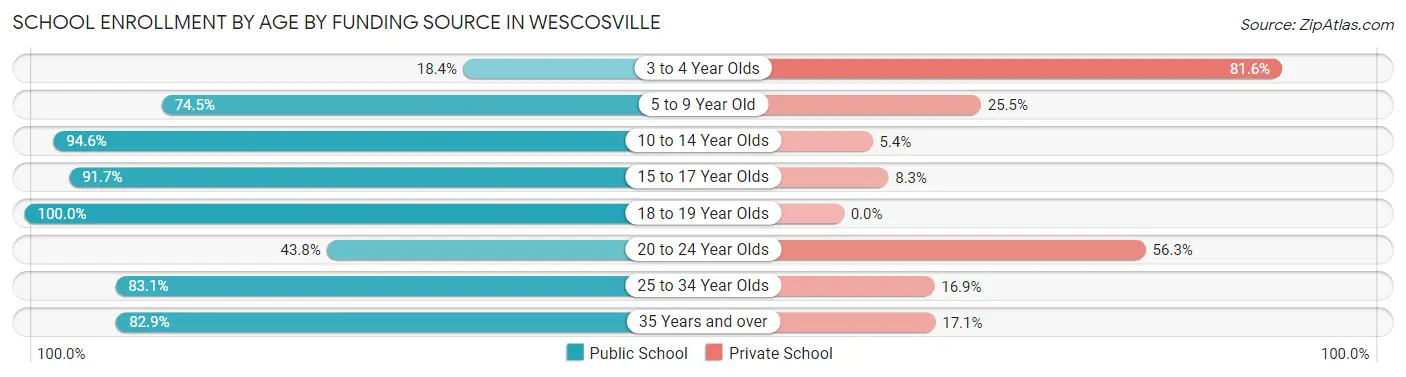
| Age Bracket | Public School | Private School |
| 3 to 4 Year Olds | 9 (18.4%) | 40 (81.6%) |
| 5 to 9 Year Old | 347 (74.5%) | 119 (25.5%) |
| 10 to 14 Year Olds | 317 (94.6%) | 18 (5.4%) |
| 15 to 17 Year Olds | 353 (91.7%) | 32 (8.3%) |
| 18 to 19 Year Olds | 104 (100.0%) | 0 (0.0%) |
| 20 to 24 Year Olds | 56 (43.8%) | 72 (56.2%) |
| 25 to 34 Year Olds | 64 (83.1%) | 13 (16.9%) |
| 35 Years and over | 34 (82.9%) | 7 (17.1%) |
| Total | 1,284 (81.0%) | 301 (19.0%) |
Educational Attainment by Field of Study in Wescosville
Business (557 | 22.1%), science & technology (513 | 20.3%), education (272 | 10.8%), engineering (234 | 9.3%), and social sciences (160 | 6.3%) are the most common fields of study among 2,524 individuals in Wescosville who have obtained a bachelor's degree or higher.
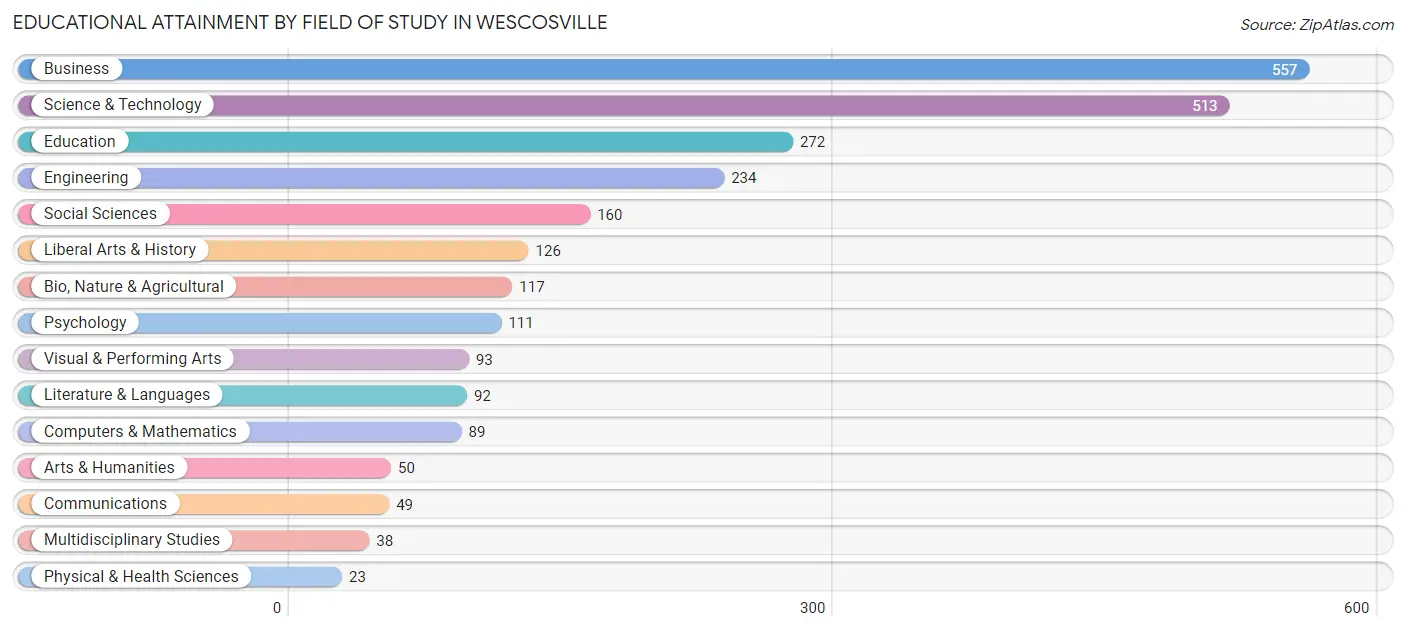
| Field of Study | # Graduates | % Graduates |
| Computers & Mathematics | 89 | 3.5% |
| Bio, Nature & Agricultural | 117 | 4.6% |
| Physical & Health Sciences | 23 | 0.9% |
| Psychology | 111 | 4.4% |
| Social Sciences | 160 | 6.3% |
| Engineering | 234 | 9.3% |
| Multidisciplinary Studies | 38 | 1.5% |
| Science & Technology | 513 | 20.3% |
| Business | 557 | 22.1% |
| Education | 272 | 10.8% |
| Literature & Languages | 92 | 3.6% |
| Liberal Arts & History | 126 | 5.0% |
| Visual & Performing Arts | 93 | 3.7% |
| Communications | 49 | 1.9% |
| Arts & Humanities | 50 | 2.0% |
| Total | 2,524 | 100.0% |
Transportation & Commute in Wescosville
Vehicle Availability by Sex in Wescosville
The most prevalent vehicle ownership categories in Wescosville are males with 2 vehicles (701, accounting for 35.6%) and females with 2 vehicles (668, making up 37.7%).
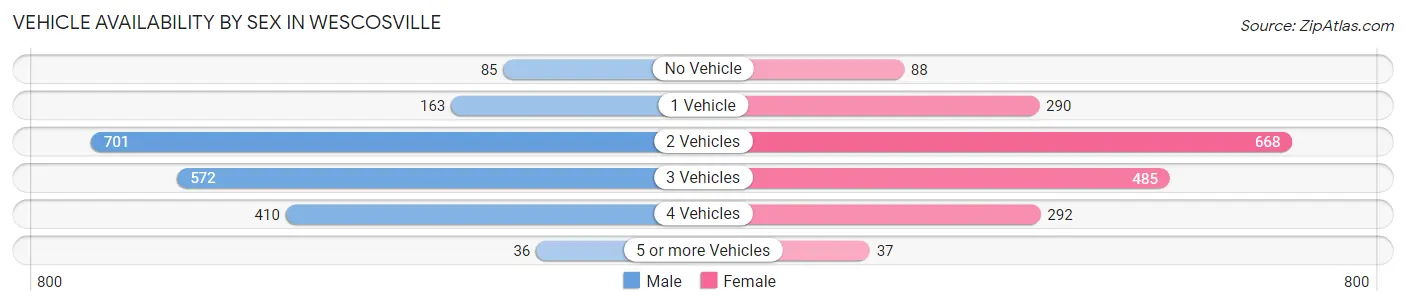
| Vehicles Available | Male | Female |
| No Vehicle | 85 (4.3%) | 88 (4.7%) |
| 1 Vehicle | 163 (8.3%) | 290 (15.6%) |
| 2 Vehicles | 701 (35.6%) | 668 (35.9%) |
| 3 Vehicles | 572 (29.1%) | 485 (26.1%) |
| 4 Vehicles | 410 (20.8%) | 292 (15.7%) |
| 5 or more Vehicles | 36 (1.8%) | 37 (2.0%) |
| Total | 1,967 (100.0%) | 1,860 (100.0%) |
Commute Time in Wescosville
The most frequently occuring commute durations in Wescosville are 15 to 19 minutes (616 commuters, 18.3%), 10 to 14 minutes (602 commuters, 17.8%), and 5 to 9 minutes (571 commuters, 16.9%).
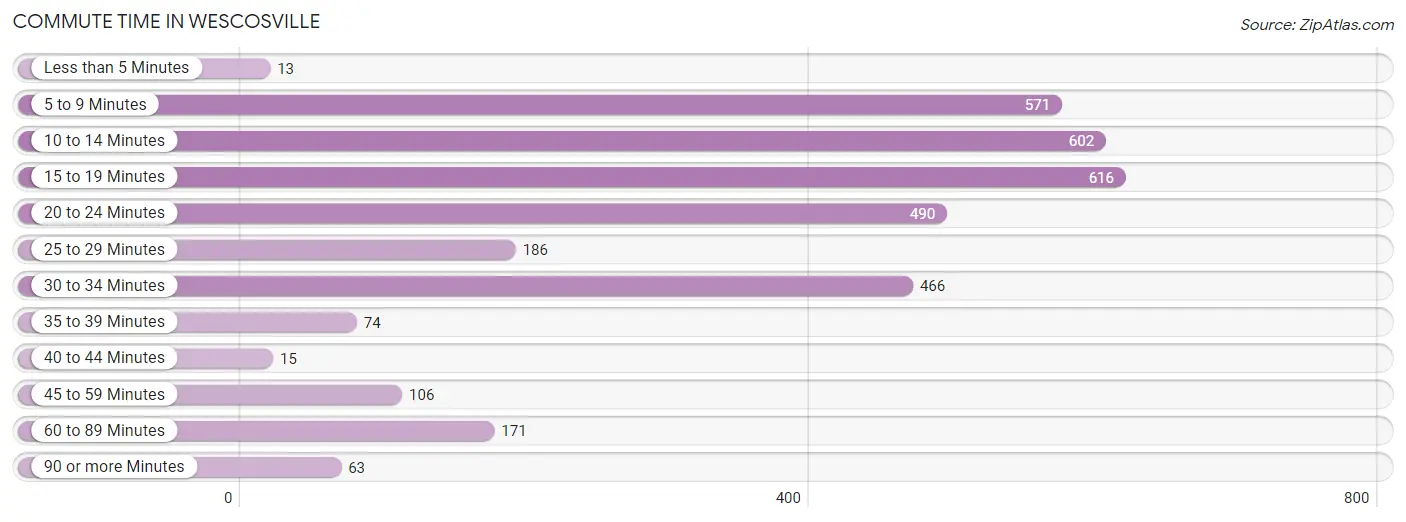
| Commute Time | # Commuters | % Commuters |
| Less than 5 Minutes | 13 | 0.4% |
| 5 to 9 Minutes | 571 | 16.9% |
| 10 to 14 Minutes | 602 | 17.8% |
| 15 to 19 Minutes | 616 | 18.3% |
| 20 to 24 Minutes | 490 | 14.5% |
| 25 to 29 Minutes | 186 | 5.5% |
| 30 to 34 Minutes | 466 | 13.8% |
| 35 to 39 Minutes | 74 | 2.2% |
| 40 to 44 Minutes | 15 | 0.4% |
| 45 to 59 Minutes | 106 | 3.1% |
| 60 to 89 Minutes | 171 | 5.1% |
| 90 or more Minutes | 63 | 1.9% |
Commute Time by Sex in Wescosville
The most common commute times in Wescosville are 30 to 34 minutes (410 commuters, 23.4%) for males and 10 to 14 minutes (388 commuters, 23.9%) for females.
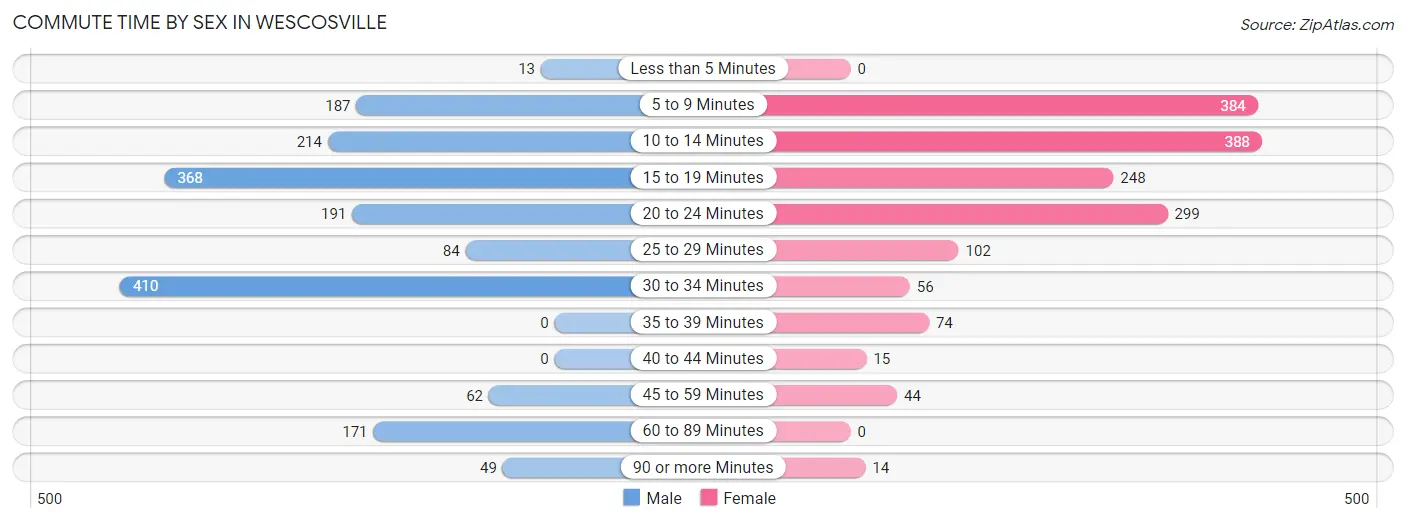
| Commute Time | Male | Female |
| Less than 5 Minutes | 13 (0.7%) | 0 (0.0%) |
| 5 to 9 Minutes | 187 (10.7%) | 384 (23.6%) |
| 10 to 14 Minutes | 214 (12.2%) | 388 (23.9%) |
| 15 to 19 Minutes | 368 (21.0%) | 248 (15.3%) |
| 20 to 24 Minutes | 191 (10.9%) | 299 (18.4%) |
| 25 to 29 Minutes | 84 (4.8%) | 102 (6.3%) |
| 30 to 34 Minutes | 410 (23.4%) | 56 (3.5%) |
| 35 to 39 Minutes | 0 (0.0%) | 74 (4.6%) |
| 40 to 44 Minutes | 0 (0.0%) | 15 (0.9%) |
| 45 to 59 Minutes | 62 (3.5%) | 44 (2.7%) |
| 60 to 89 Minutes | 171 (9.8%) | 0 (0.0%) |
| 90 or more Minutes | 49 (2.8%) | 14 (0.9%) |
Time of Departure to Work by Sex in Wescosville
The most frequent times of departure to work in Wescosville are 6:30 AM to 6:59 AM (371, 21.2%) for males and 6:30 AM to 6:59 AM (312, 19.2%) for females.
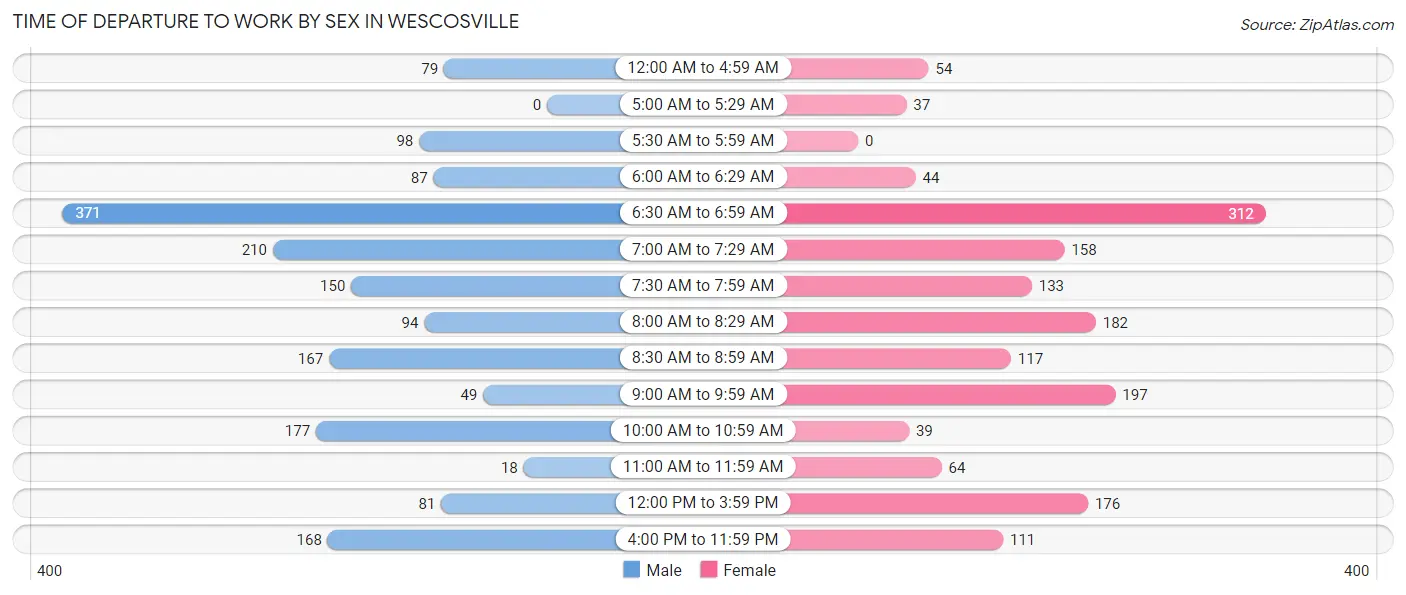
| Time of Departure | Male | Female |
| 12:00 AM to 4:59 AM | 79 (4.5%) | 54 (3.3%) |
| 5:00 AM to 5:29 AM | 0 (0.0%) | 37 (2.3%) |
| 5:30 AM to 5:59 AM | 98 (5.6%) | 0 (0.0%) |
| 6:00 AM to 6:29 AM | 87 (5.0%) | 44 (2.7%) |
| 6:30 AM to 6:59 AM | 371 (21.2%) | 312 (19.2%) |
| 7:00 AM to 7:29 AM | 210 (12.0%) | 158 (9.7%) |
| 7:30 AM to 7:59 AM | 150 (8.6%) | 133 (8.2%) |
| 8:00 AM to 8:29 AM | 94 (5.4%) | 182 (11.2%) |
| 8:30 AM to 8:59 AM | 167 (9.6%) | 117 (7.2%) |
| 9:00 AM to 9:59 AM | 49 (2.8%) | 197 (12.1%) |
| 10:00 AM to 10:59 AM | 177 (10.1%) | 39 (2.4%) |
| 11:00 AM to 11:59 AM | 18 (1.0%) | 64 (3.9%) |
| 12:00 PM to 3:59 PM | 81 (4.6%) | 176 (10.8%) |
| 4:00 PM to 11:59 PM | 168 (9.6%) | 111 (6.8%) |
| Total | 1,749 (100.0%) | 1,624 (100.0%) |
Housing Occupancy in Wescosville
Occupancy by Ownership in Wescosville
Of the total 2,670 dwellings in Wescosville, owner-occupied units account for 2,358 (88.3%), while renter-occupied units make up 312 (11.7%).
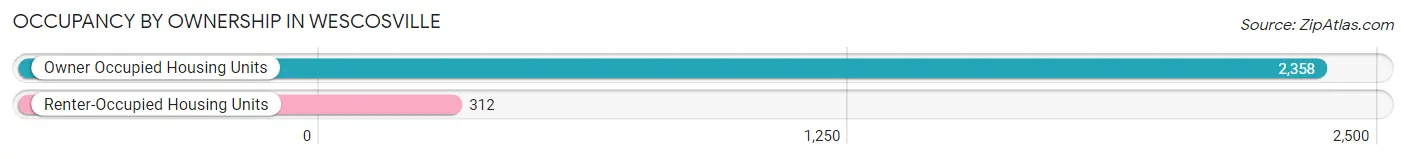
| Occupancy | # Housing Units | % Housing Units |
| Owner Occupied Housing Units | 2,358 | 88.3% |
| Renter-Occupied Housing Units | 312 | 11.7% |
| Total Occupied Housing Units | 2,670 | 100.0% |
Occupancy by Household Size in Wescosville
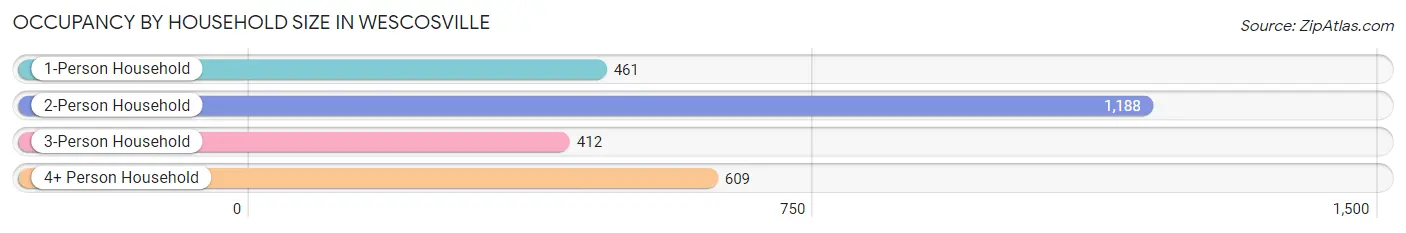
| Household Size | # Housing Units | % Housing Units |
| 1-Person Household | 461 | 17.3% |
| 2-Person Household | 1,188 | 44.5% |
| 3-Person Household | 412 | 15.4% |
| 4+ Person Household | 609 | 22.8% |
| Total Housing Units | 2,670 | 100.0% |
Occupancy by Ownership by Household Size in Wescosville
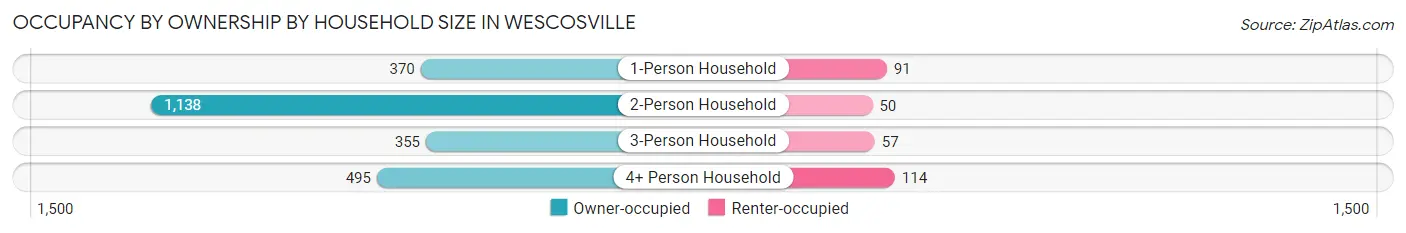
| Household Size | Owner-occupied | Renter-occupied |
| 1-Person Household | 370 (80.3%) | 91 (19.7%) |
| 2-Person Household | 1,138 (95.8%) | 50 (4.2%) |
| 3-Person Household | 355 (86.2%) | 57 (13.8%) |
| 4+ Person Household | 495 (81.3%) | 114 (18.7%) |
| Total Housing Units | 2,358 (88.3%) | 312 (11.7%) |
Occupancy by Educational Attainment in Wescosville
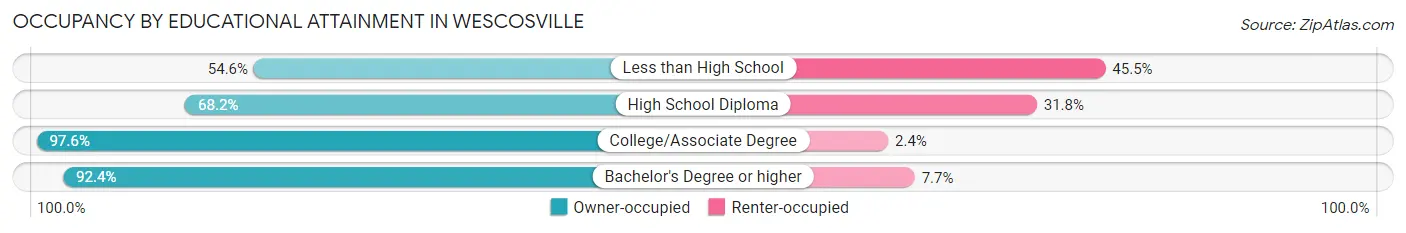
| Household Size | Owner-occupied | Renter-occupied |
| Less than High School | 24 (54.5%) | 20 (45.5%) |
| High School Diploma | 364 (68.2%) | 170 (31.8%) |
| College/Associate Degree | 702 (97.6%) | 17 (2.4%) |
| Bachelor's Degree or higher | 1,268 (92.3%) | 105 (7.6%) |
Occupancy by Age of Householder in Wescosville
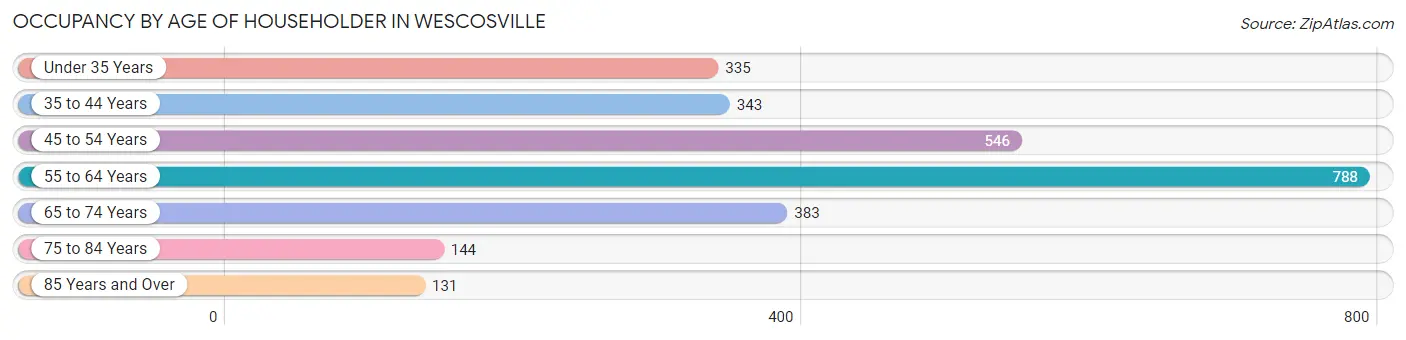
| Age Bracket | # Households | % Households |
| Under 35 Years | 335 | 12.6% |
| 35 to 44 Years | 343 | 12.9% |
| 45 to 54 Years | 546 | 20.4% |
| 55 to 64 Years | 788 | 29.5% |
| 65 to 74 Years | 383 | 14.3% |
| 75 to 84 Years | 144 | 5.4% |
| 85 Years and Over | 131 | 4.9% |
| Total | 2,670 | 100.0% |
Housing Finances in Wescosville
Median Income by Occupancy in Wescosville

| Occupancy Type | # Households | Median Income |
| Owner-Occupied | 2,358 (88.3%) | $146,354 |
| Renter-Occupied | 312 (11.7%) | $61,471 |
| Average | 2,670 (100.0%) | $128,853 |
Occupancy by Householder Income Bracket in Wescosville
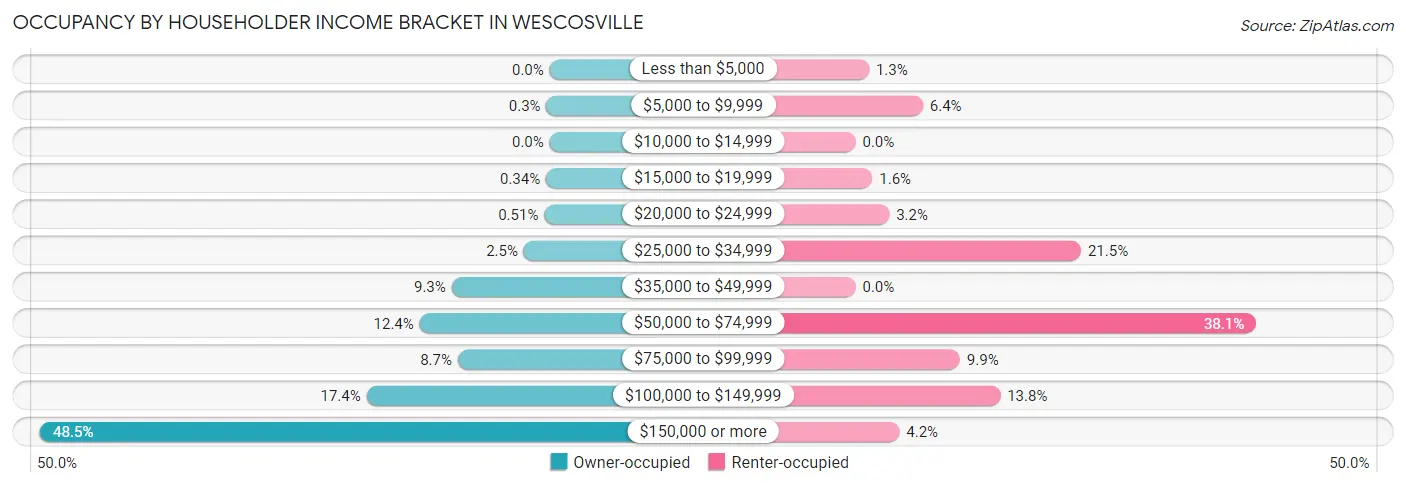
| Income Bracket | Owner-occupied | Renter-occupied |
| Less than $5,000 | 0 (0.0%) | 4 (1.3%) |
| $5,000 to $9,999 | 7 (0.3%) | 20 (6.4%) |
| $10,000 to $14,999 | 0 (0.0%) | 0 (0.0%) |
| $15,000 to $19,999 | 8 (0.3%) | 5 (1.6%) |
| $20,000 to $24,999 | 12 (0.5%) | 10 (3.2%) |
| $25,000 to $34,999 | 58 (2.5%) | 67 (21.5%) |
| $35,000 to $49,999 | 220 (9.3%) | 0 (0.0%) |
| $50,000 to $74,999 | 292 (12.4%) | 119 (38.1%) |
| $75,000 to $99,999 | 206 (8.7%) | 31 (9.9%) |
| $100,000 to $149,999 | 411 (17.4%) | 43 (13.8%) |
| $150,000 or more | 1,144 (48.5%) | 13 (4.2%) |
| Total | 2,358 (100.0%) | 312 (100.0%) |
Monthly Housing Cost Tiers in Wescosville
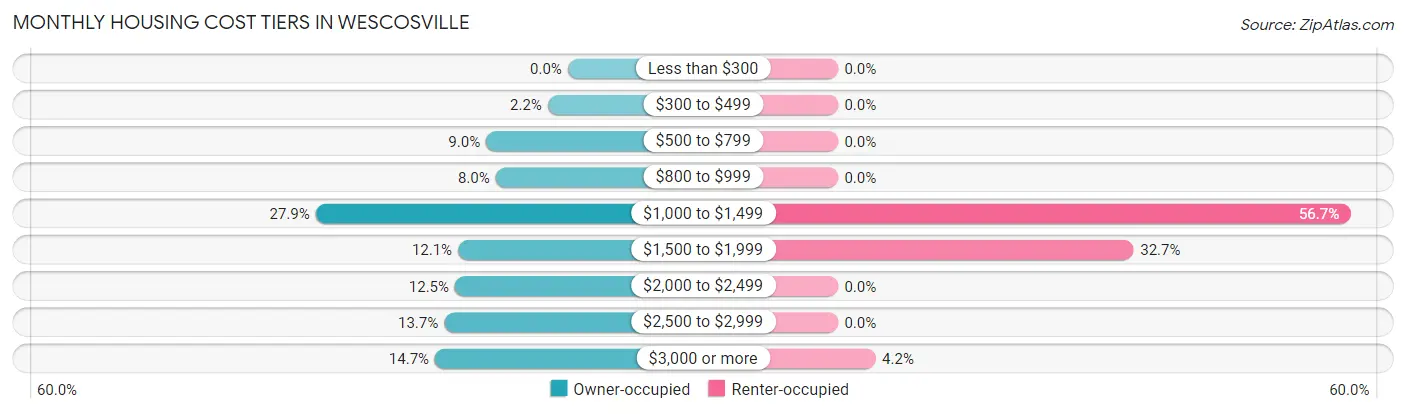
| Monthly Cost | Owner-occupied | Renter-occupied |
| Less than $300 | 0 (0.0%) | 0 (0.0%) |
| $300 to $499 | 52 (2.2%) | 0 (0.0%) |
| $500 to $799 | 213 (9.0%) | 0 (0.0%) |
| $800 to $999 | 188 (8.0%) | 0 (0.0%) |
| $1,000 to $1,499 | 657 (27.9%) | 177 (56.7%) |
| $1,500 to $1,999 | 286 (12.1%) | 102 (32.7%) |
| $2,000 to $2,499 | 294 (12.5%) | 0 (0.0%) |
| $2,500 to $2,999 | 322 (13.7%) | 0 (0.0%) |
| $3,000 or more | 346 (14.7%) | 13 (4.2%) |
| Total | 2,358 (100.0%) | 312 (100.0%) |
Physical Housing Characteristics in Wescosville
Housing Structures in Wescosville
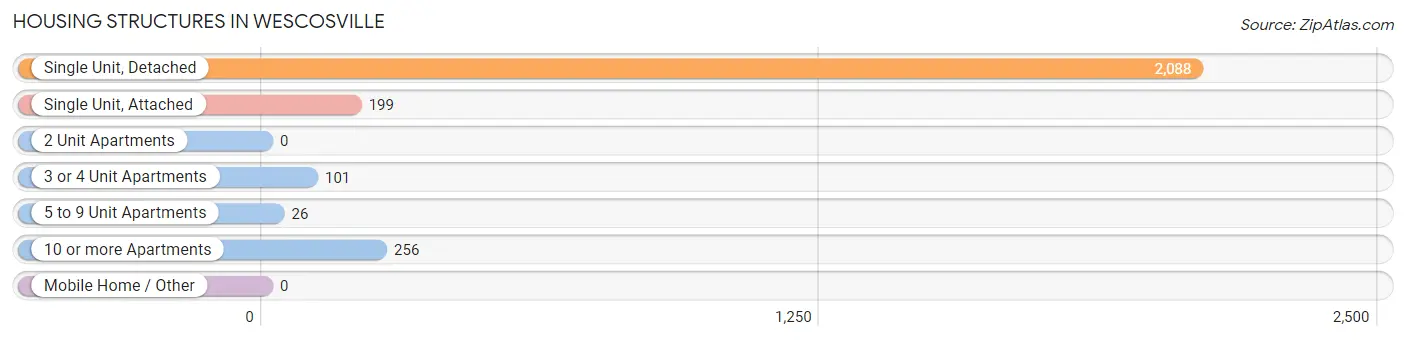
| Structure Type | # Housing Units | % Housing Units |
| Single Unit, Detached | 2,088 | 78.2% |
| Single Unit, Attached | 199 | 7.4% |
| 2 Unit Apartments | 0 | 0.0% |
| 3 or 4 Unit Apartments | 101 | 3.8% |
| 5 to 9 Unit Apartments | 26 | 1.0% |
| 10 or more Apartments | 256 | 9.6% |
| Mobile Home / Other | 0 | 0.0% |
| Total | 2,670 | 100.0% |
Housing Structures by Occupancy in Wescosville
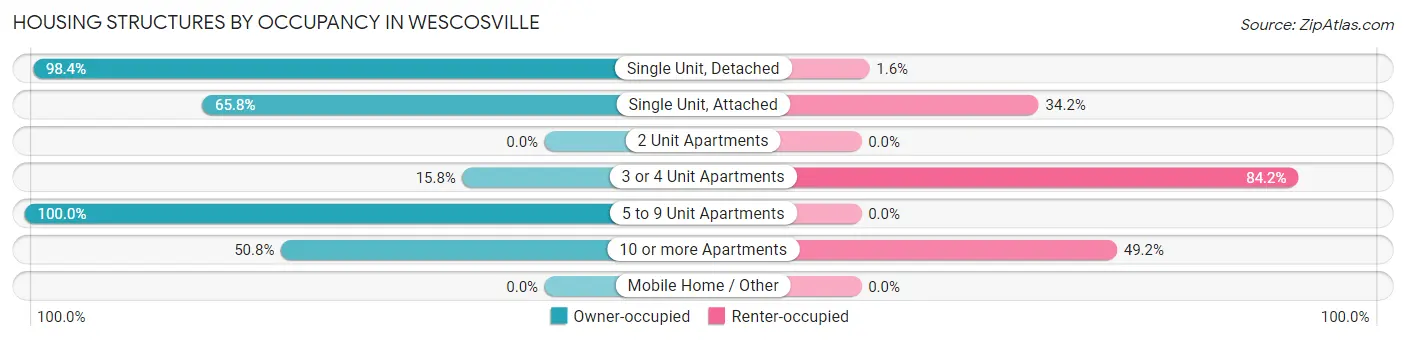
| Structure Type | Owner-occupied | Renter-occupied |
| Single Unit, Detached | 2,055 (98.4%) | 33 (1.6%) |
| Single Unit, Attached | 131 (65.8%) | 68 (34.2%) |
| 2 Unit Apartments | 0 (0.0%) | 0 (0.0%) |
| 3 or 4 Unit Apartments | 16 (15.8%) | 85 (84.2%) |
| 5 to 9 Unit Apartments | 26 (100.0%) | 0 (0.0%) |
| 10 or more Apartments | 130 (50.8%) | 126 (49.2%) |
| Mobile Home / Other | 0 (0.0%) | 0 (0.0%) |
| Total | 2,358 (88.3%) | 312 (11.7%) |
Housing Structures by Number of Rooms in Wescosville
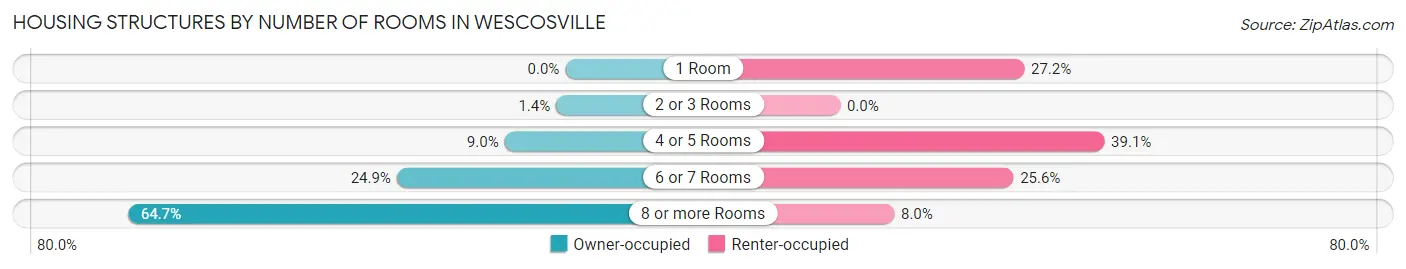
| Number of Rooms | Owner-occupied | Renter-occupied |
| 1 Room | 0 (0.0%) | 85 (27.2%) |
| 2 or 3 Rooms | 32 (1.4%) | 0 (0.0%) |
| 4 or 5 Rooms | 212 (9.0%) | 122 (39.1%) |
| 6 or 7 Rooms | 588 (24.9%) | 80 (25.6%) |
| 8 or more Rooms | 1,526 (64.7%) | 25 (8.0%) |
| Total | 2,358 (100.0%) | 312 (100.0%) |
Housing Structure by Heating Type in Wescosville
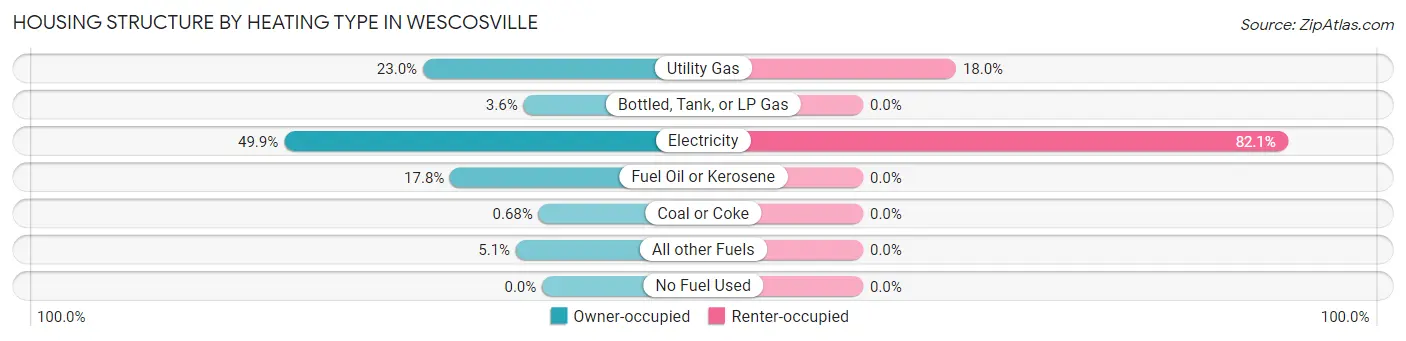
| Heating Type | Owner-occupied | Renter-occupied |
| Utility Gas | 543 (23.0%) | 56 (17.9%) |
| Bottled, Tank, or LP Gas | 85 (3.6%) | 0 (0.0%) |
| Electricity | 1,176 (49.9%) | 256 (82.1%) |
| Fuel Oil or Kerosene | 419 (17.8%) | 0 (0.0%) |
| Coal or Coke | 16 (0.7%) | 0 (0.0%) |
| All other Fuels | 119 (5.1%) | 0 (0.0%) |
| No Fuel Used | 0 (0.0%) | 0 (0.0%) |
| Total | 2,358 (100.0%) | 312 (100.0%) |
Household Vehicle Usage in Wescosville
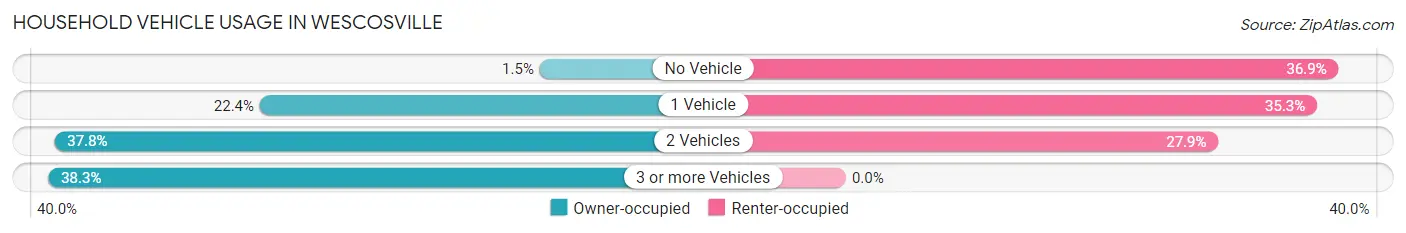
| Vehicles per Household | Owner-occupied | Renter-occupied |
| No Vehicle | 36 (1.5%) | 115 (36.9%) |
| 1 Vehicle | 529 (22.4%) | 110 (35.3%) |
| 2 Vehicles | 891 (37.8%) | 87 (27.9%) |
| 3 or more Vehicles | 902 (38.3%) | 0 (0.0%) |
| Total | 2,358 (100.0%) | 312 (100.0%) |
Real Estate & Mortgages in Wescosville
Real Estate and Mortgage Overview in Wescosville
| Characteristic | Without Mortgage | With Mortgage |
| Housing Units | 571 | 1,787 |
| Median Property Value | $302,500 | $415,000 |
| Median Household Income | $115,347 | $983 |
| Monthly Housing Costs | $819 | $346 |
| Real Estate Taxes | $5,253 | $0 |
Property Value by Mortgage Status in Wescosville
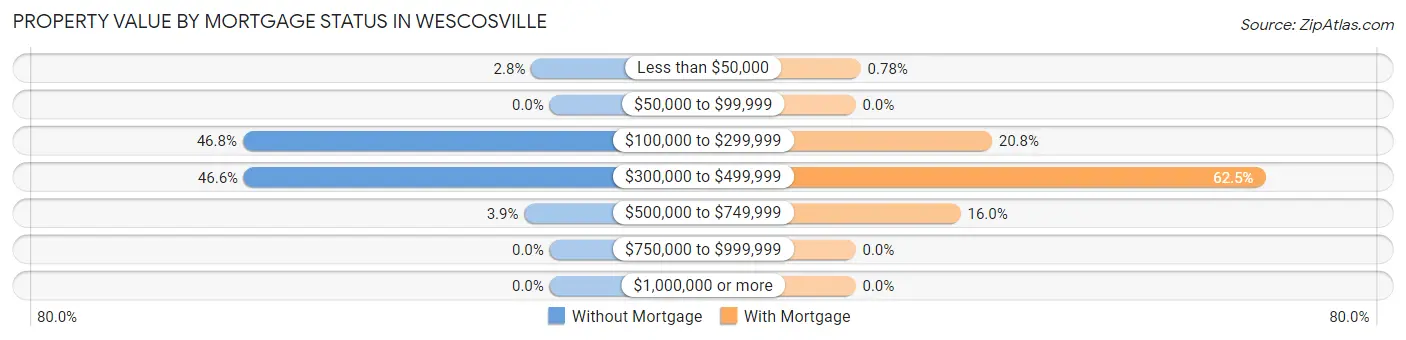
| Property Value | Without Mortgage | With Mortgage |
| Less than $50,000 | 16 (2.8%) | 14 (0.8%) |
| $50,000 to $99,999 | 0 (0.0%) | 0 (0.0%) |
| $100,000 to $299,999 | 267 (46.8%) | 371 (20.8%) |
| $300,000 to $499,999 | 266 (46.6%) | 1,116 (62.5%) |
| $500,000 to $749,999 | 22 (3.8%) | 286 (16.0%) |
| $750,000 to $999,999 | 0 (0.0%) | 0 (0.0%) |
| $1,000,000 or more | 0 (0.0%) | 0 (0.0%) |
| Total | 571 (100.0%) | 1,787 (100.0%) |
Household Income by Mortgage Status in Wescosville
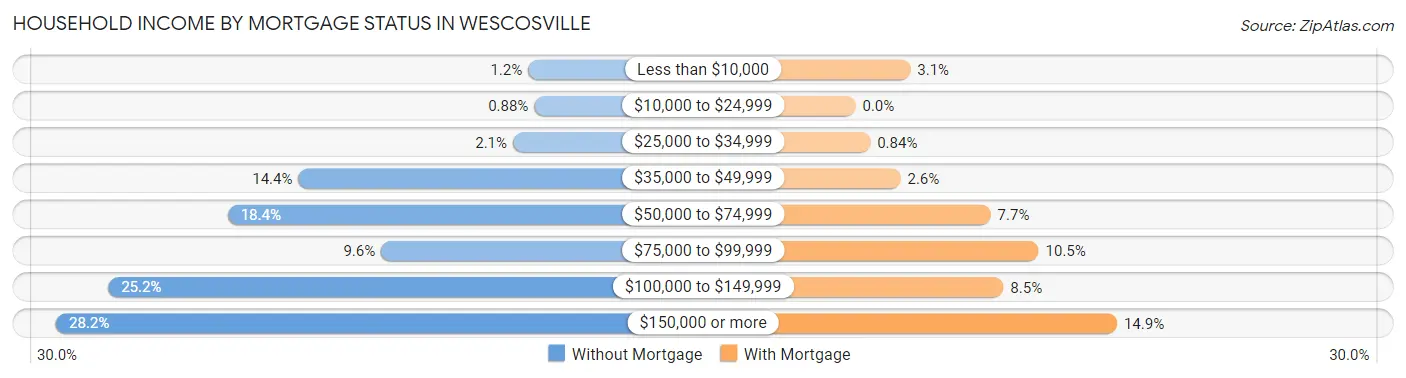
| Household Income | Without Mortgage | With Mortgage |
| Less than $10,000 | 7 (1.2%) | 56 (3.1%) |
| $10,000 to $24,999 | 5 (0.9%) | 0 (0.0%) |
| $25,000 to $34,999 | 12 (2.1%) | 15 (0.8%) |
| $35,000 to $49,999 | 82 (14.4%) | 46 (2.6%) |
| $50,000 to $74,999 | 105 (18.4%) | 138 (7.7%) |
| $75,000 to $99,999 | 55 (9.6%) | 187 (10.5%) |
| $100,000 to $149,999 | 144 (25.2%) | 151 (8.5%) |
| $150,000 or more | 161 (28.2%) | 267 (14.9%) |
| Total | 571 (100.0%) | 1,787 (100.0%) |
Property Value to Household Income Ratio in Wescosville
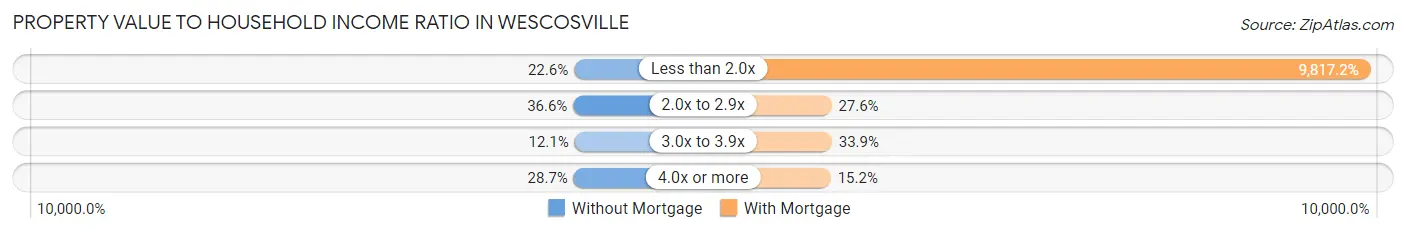
| Value-to-Income Ratio | Without Mortgage | With Mortgage |
| Less than 2.0x | 129 (22.6%) | 175,434 (9,817.2%) |
| 2.0x to 2.9x | 209 (36.6%) | 493 (27.6%) |
| 3.0x to 3.9x | 69 (12.1%) | 606 (33.9%) |
| 4.0x or more | 164 (28.7%) | 272 (15.2%) |
| Total | 571 (100.0%) | 1,787 (100.0%) |
Real Estate Taxes by Mortgage Status in Wescosville

| Property Taxes | Without Mortgage | With Mortgage |
| Less than $800 | 32 (5.6%) | 0 (0.0%) |
| $800 to $1,499 | 43 (7.5%) | 48 (2.7%) |
| $800 to $1,499 | 480 (84.1%) | 38 (2.1%) |
| Total | 571 (100.0%) | 1,787 (100.0%) |
Health & Disability in Wescosville
Health Insurance Coverage by Age in Wescosville
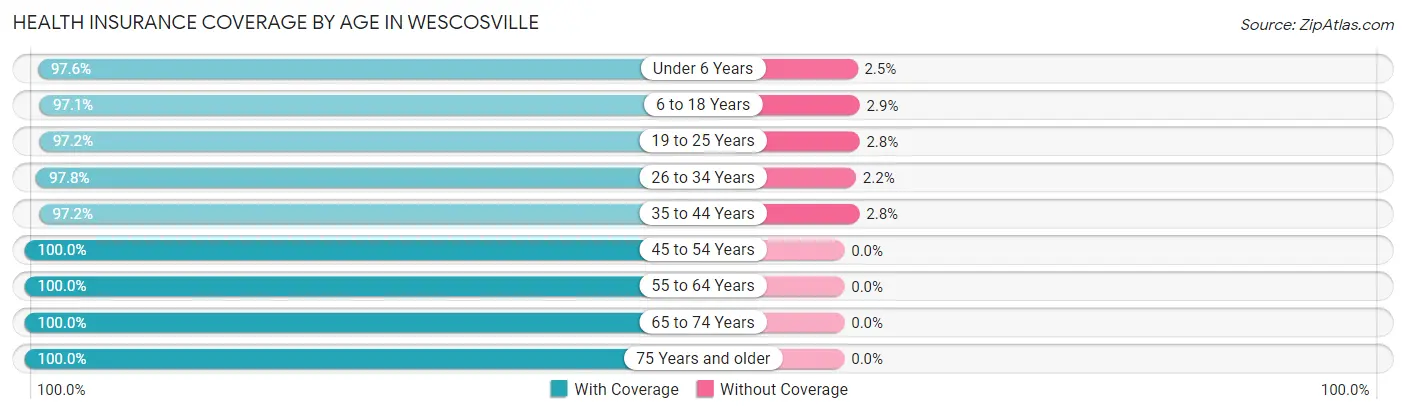
| Age Bracket | With Coverage | Without Coverage |
| Under 6 Years | 517 (97.6%) | 13 (2.5%) |
| 6 to 18 Years | 1,084 (97.1%) | 32 (2.9%) |
| 19 to 25 Years | 481 (97.2%) | 14 (2.8%) |
| 26 to 34 Years | 499 (97.8%) | 11 (2.2%) |
| 35 to 44 Years | 693 (97.2%) | 20 (2.8%) |
| 45 to 54 Years | 935 (100.0%) | 0 (0.0%) |
| 55 to 64 Years | 1,352 (100.0%) | 0 (0.0%) |
| 65 to 74 Years | 543 (100.0%) | 0 (0.0%) |
| 75 Years and older | 578 (100.0%) | 0 (0.0%) |
| Total | 6,682 (98.7%) | 90 (1.3%) |
Health Insurance Coverage by Citizenship Status in Wescosville
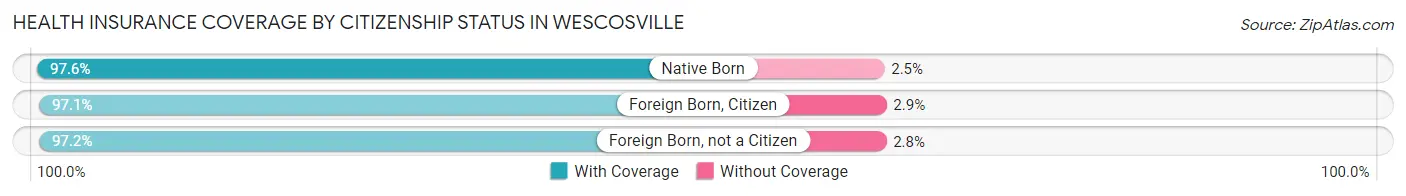
| Citizenship Status | With Coverage | Without Coverage |
| Native Born | 517 (97.6%) | 13 (2.5%) |
| Foreign Born, Citizen | 1,084 (97.1%) | 32 (2.9%) |
| Foreign Born, not a Citizen | 481 (97.2%) | 14 (2.8%) |
Health Insurance Coverage by Household Income in Wescosville
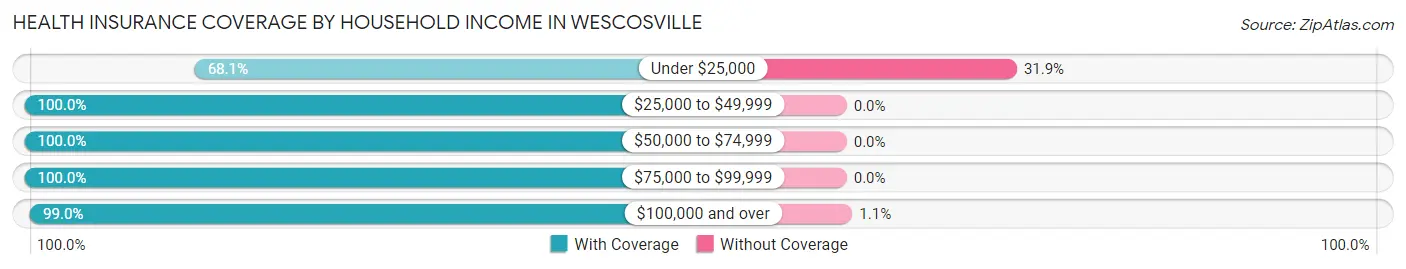
| Household Income | With Coverage | Without Coverage |
| Under $25,000 | 94 (68.1%) | 44 (31.9%) |
| $25,000 to $49,999 | 470 (100.0%) | 0 (0.0%) |
| $50,000 to $74,999 | 1,034 (100.0%) | 0 (0.0%) |
| $75,000 to $99,999 | 749 (100.0%) | 0 (0.0%) |
| $100,000 and over | 4,335 (99.0%) | 46 (1.1%) |
Public vs Private Health Insurance Coverage by Age in Wescosville
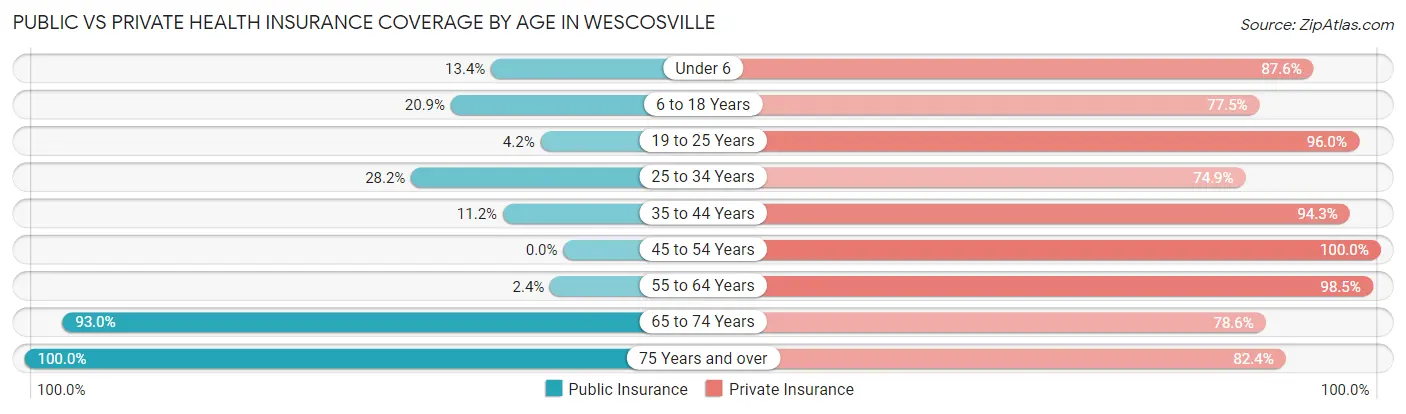
| Age Bracket | Public Insurance | Private Insurance |
| Under 6 | 71 (13.4%) | 464 (87.5%) |
| 6 to 18 Years | 233 (20.9%) | 865 (77.5%) |
| 19 to 25 Years | 21 (4.2%) | 475 (96.0%) |
| 25 to 34 Years | 144 (28.2%) | 382 (74.9%) |
| 35 to 44 Years | 80 (11.2%) | 672 (94.3%) |
| 45 to 54 Years | 0 (0.0%) | 935 (100.0%) |
| 55 to 64 Years | 33 (2.4%) | 1,332 (98.5%) |
| 65 to 74 Years | 505 (93.0%) | 427 (78.6%) |
| 75 Years and over | 578 (100.0%) | 476 (82.4%) |
| Total | 1,665 (24.6%) | 6,028 (89.0%) |
Disability Status by Sex by Age in Wescosville
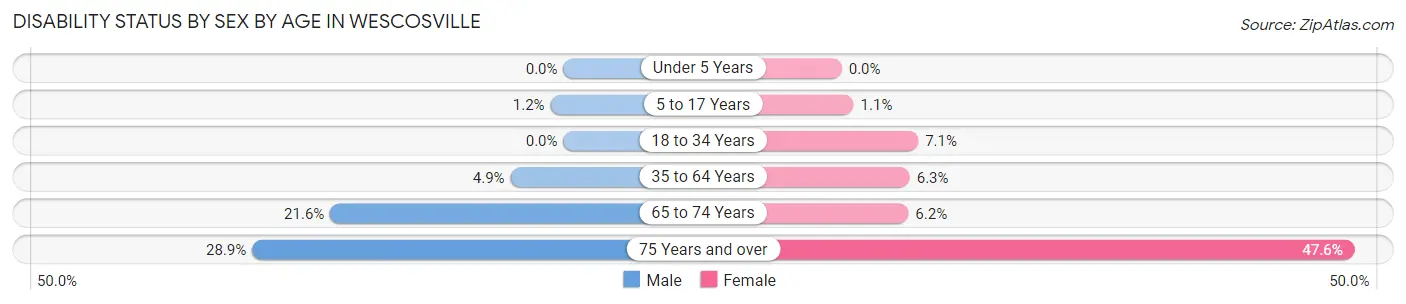
| Age Bracket | Male | Female |
| Under 5 Years | 0 (0.0%) | 0 (0.0%) |
| 5 to 17 Years | 7 (1.2%) | 7 (1.1%) |
| 18 to 34 Years | 0 (0.0%) | 47 (7.1%) |
| 35 to 64 Years | 75 (4.9%) | 93 (6.3%) |
| 65 to 74 Years | 58 (21.6%) | 17 (6.2%) |
| 75 Years and over | 65 (28.9%) | 168 (47.6%) |
Disability Class by Sex by Age in Wescosville
Disability Class: Hearing Difficulty
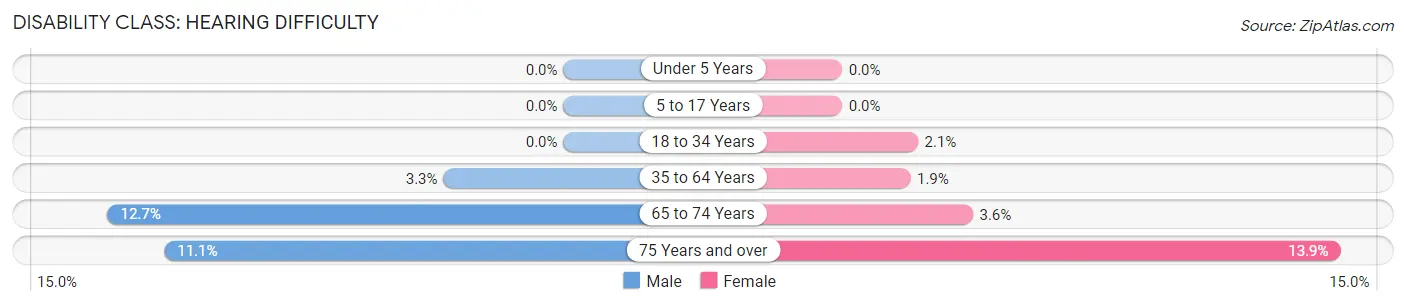
| Age Bracket | Male | Female |
| Under 5 Years | 0 (0.0%) | 0 (0.0%) |
| 5 to 17 Years | 0 (0.0%) | 0 (0.0%) |
| 18 to 34 Years | 0 (0.0%) | 14 (2.1%) |
| 35 to 64 Years | 51 (3.3%) | 28 (1.9%) |
| 65 to 74 Years | 34 (12.7%) | 10 (3.6%) |
| 75 Years and over | 25 (11.1%) | 49 (13.9%) |
Disability Class: Vision Difficulty
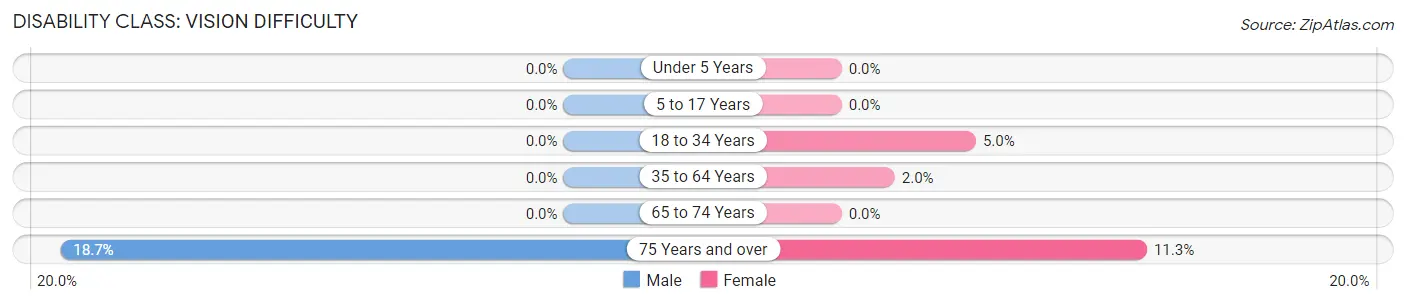
| Age Bracket | Male | Female |
| Under 5 Years | 0 (0.0%) | 0 (0.0%) |
| 5 to 17 Years | 0 (0.0%) | 0 (0.0%) |
| 18 to 34 Years | 0 (0.0%) | 33 (5.0%) |
| 35 to 64 Years | 0 (0.0%) | 29 (2.0%) |
| 65 to 74 Years | 0 (0.0%) | 0 (0.0%) |
| 75 Years and over | 42 (18.7%) | 40 (11.3%) |
Disability Class: Cognitive Difficulty

| Age Bracket | Male | Female |
| 5 to 17 Years | 7 (1.2%) | 7 (1.1%) |
| 18 to 34 Years | 0 (0.0%) | 14 (2.1%) |
| 35 to 64 Years | 40 (2.6%) | 37 (2.5%) |
| 65 to 74 Years | 10 (3.7%) | 0 (0.0%) |
| 75 Years and over | 8 (3.6%) | 39 (11.1%) |
Disability Class: Ambulatory Difficulty
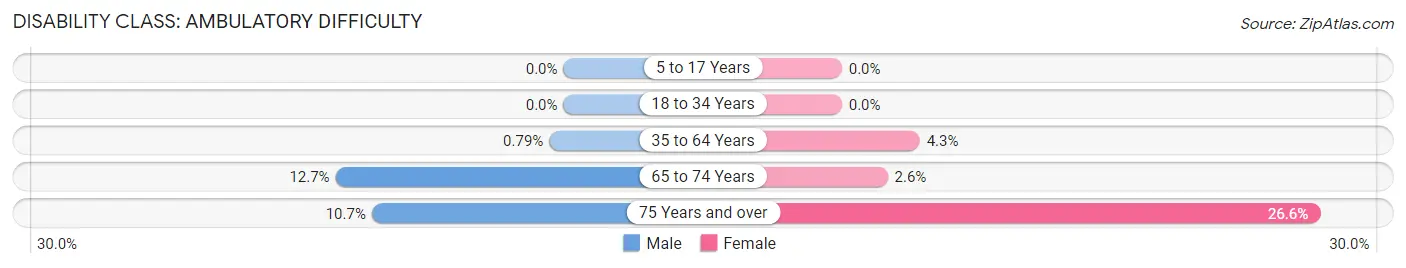
| Age Bracket | Male | Female |
| 5 to 17 Years | 0 (0.0%) | 0 (0.0%) |
| 18 to 34 Years | 0 (0.0%) | 0 (0.0%) |
| 35 to 64 Years | 12 (0.8%) | 64 (4.3%) |
| 65 to 74 Years | 34 (12.7%) | 7 (2.5%) |
| 75 Years and over | 24 (10.7%) | 94 (26.6%) |
Disability Class: Self-Care Difficulty
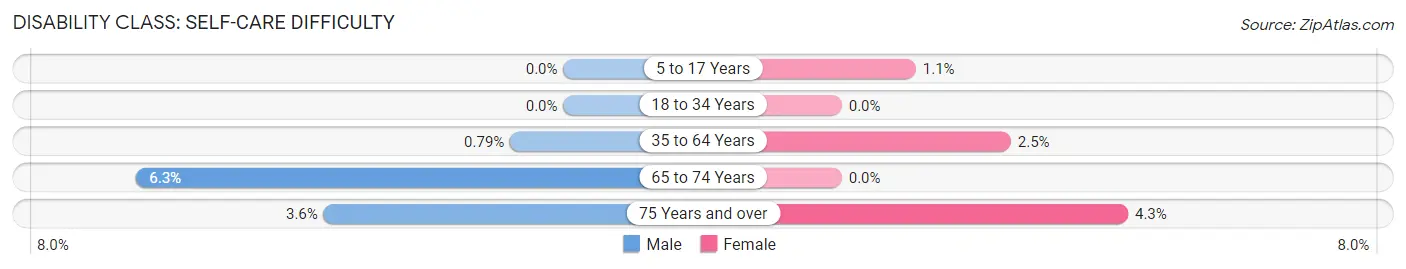
| Age Bracket | Male | Female |
| 5 to 17 Years | 0 (0.0%) | 7 (1.1%) |
| 18 to 34 Years | 0 (0.0%) | 0 (0.0%) |
| 35 to 64 Years | 12 (0.8%) | 37 (2.5%) |
| 65 to 74 Years | 17 (6.3%) | 0 (0.0%) |
| 75 Years and over | 8 (3.6%) | 15 (4.3%) |
Technology Access in Wescosville
Computing Device Access in Wescosville
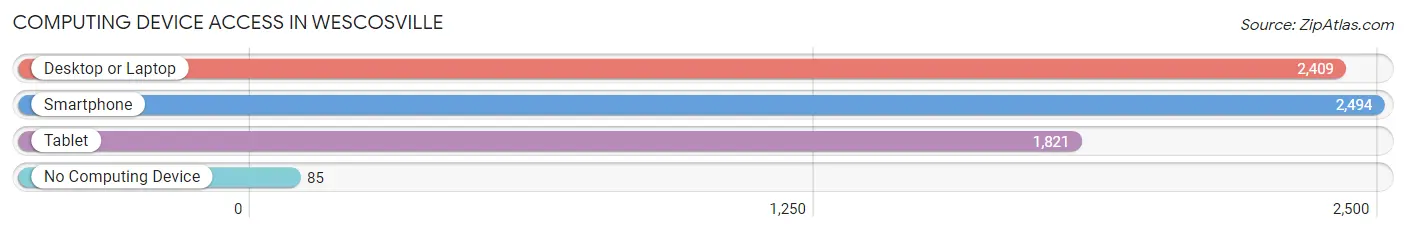
| Device Type | # Households | % Households |
| Desktop or Laptop | 2,409 | 90.2% |
| Smartphone | 2,494 | 93.4% |
| Tablet | 1,821 | 68.2% |
| No Computing Device | 85 | 3.2% |
| Total | 2,670 | 100.0% |
Internet Access in Wescosville
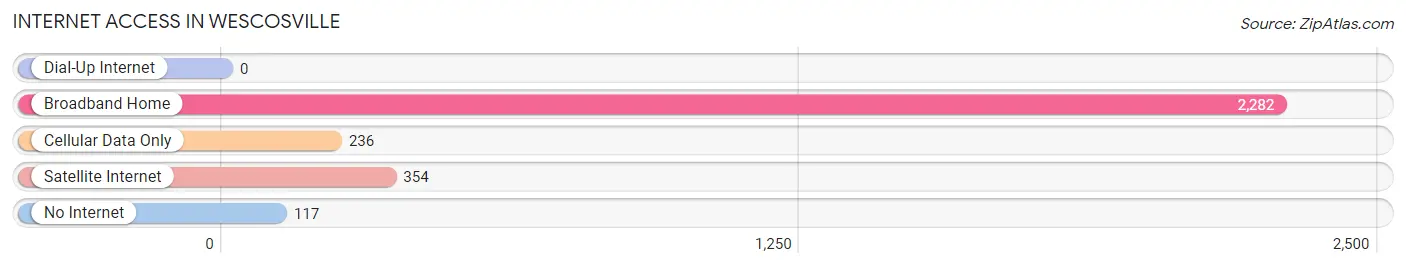
| Internet Type | # Households | % Households |
| Dial-Up Internet | 0 | 0.0% |
| Broadband Home | 2,282 | 85.5% |
| Cellular Data Only | 236 | 8.8% |
| Satellite Internet | 354 | 13.3% |
| No Internet | 117 | 4.4% |
| Total | 2,670 | 100.0% |
Wescosville Summary
Wescosville is a census-designated place (CDP) located in Lehigh County, Pennsylvania, United States. It is a suburb of Allentown, the third-largest city in the state. As of the 2010 census, the population of Wescosville was 4,845.
Geography
Wescosville is located at 40°37'17" North, 75°30'45" West (40.6214, -75.5125). It is situated in the Lehigh Valley region of Pennsylvania, approximately 8 miles (13 km) north of Allentown. The CDP has a total area of 2.2 square miles (5.7 km2), all of which is land.
History
The area now known as Wescosville was first settled in the late 1700s by German immigrants. The name Wescosville is derived from the name of the original settler, John Wescos. The area remained largely rural until the 1950s, when the population began to grow rapidly due to the influx of people from the nearby cities of Allentown and Bethlehem.
Economy
Wescosville is home to a variety of businesses, including retail stores, restaurants, and professional services. The largest employer in the area is the Lehigh Valley Health Network, which operates a hospital and several medical offices in the area. Other major employers include the Lehigh Valley Mall, the Lehigh Valley Industrial Park, and the Lehigh Valley Zoo.
Demographics
As of the 2010 census, there were 4,845 people, 1,945 households, and 1,323 families residing in the CDP. The population density was 2,179.2 people per square mile (841.3/km2). There were 2,068 housing units at an average density of 930.2 per square mile (358.7/km2). The racial makeup of the CDP was 94.2% White, 1.3% African American, 0.2% Native American, 1.7% Asian, 0.7% from other races, and 2.1% from two or more races. Hispanic or Latino of any race were 3.2% of the population.
There were 1,945 households, out of which 28.2% had children under the age of 18 living with them, 54.2% were married couples living together, 9.2% had a female householder with no husband present, and 32.2% were non-families. 26.7% of all households were made up of individuals, and 11.2% had someone living alone who was 65 years of age or older. The average household size was 2.48 and the average family size was 3.03.
In the CDP, the population was spread out, with 22.2% under the age of 18, 6.7% from 18 to 24, 28.2% from 25 to 44, 25.2% from 45 to 64, and 17.7% who were 65 years of age or older. The median age was 40 years. For every 100 females, there were 93.2 males. For every 100 females age 18 and over, there were 90.2 males.
The median income for a household in the CDP was $50,938, and the median income for a family was $60,938. Males had a median income of $41,938 versus $30,938 for females. The per capita income for the CDP was $24,938. About 3.2% of families and 4.2% of the population were below the poverty line, including 5.2% of those under age 18 and 4.2% of those age 65 or over.
Common Questions
What is Per Capita Income in Wescosville?
Per Capita income in Wescosville is $61,480.
What is the Median Family Income in Wescosville?
Median Family Income in Wescosville is $161,620.
What is the Median Household income in Wescosville?
Median Household Income in Wescosville is $128,853.
What is Income or Wage Gap in Wescosville?
Income or Wage Gap in Wescosville is 58.8%.
Women in Wescosville earn 41.2 cents for every dollar earned by a man.
What is Inequality or Gini Index in Wescosville?
Inequality or Gini Index in Wescosville is 0.41.
What is the Total Population of Wescosville?
Total Population of Wescosville is 6,799.
What is the Total Male Population of Wescosville?
Total Male Population of Wescosville is 3,229.
What is the Total Female Population of Wescosville?
Total Female Population of Wescosville is 3,570.
What is the Ratio of Males per 100 Females in Wescosville?
There are 90.45 Males per 100 Females in Wescosville.
What is the Ratio of Females per 100 Males in Wescosville?
There are 110.56 Females per 100 Males in Wescosville.
What is the Median Population Age in Wescosville?
Median Population Age in Wescosville is 45.3 Years.
What is the Average Family Size in Wescosville
Average Family Size in Wescosville is 2.8 People.
What is the Average Household Size in Wescosville
Average Household Size in Wescosville is 2.5 People.
How Large is the Labor Force in Wescosville?
There are 3,975 People in the Labor Forcein in Wescosville.
What is the Percentage of People in the Labor Force in Wescosville?
71.6% of People are in the Labor Force in Wescosville.
What is the Unemployment Rate in Wescosville?
Unemployment Rate in Wescosville is 3.0%.