Throop borough, PA Map & Demographics
Throop borough Overview
$30,234
PER CAPITA INCOME
$66,250
AVG FAMILY INCOME
$49,673
AVG HOUSEHOLD INCOME
12.0%
WAGE / INCOME GAP [ % ]
88.0¢/ $1
WAGE / INCOME GAP [ $ ]
0.45
INEQUALITY / GINI INDEX
4,062
TOTAL POPULATION
2,057
MALE POPULATION
2,005
FEMALE POPULATION
102.59
MALES / 100 FEMALES
97.47
FEMALES / 100 MALES
40.6
MEDIAN AGE
2.9
AVG FAMILY SIZE
2.2
AVG HOUSEHOLD SIZE
1,996
LABOR FORCE [ PEOPLE ]
59.8%
PERCENT IN LABOR FORCE
2.7%
UNEMPLOYMENT RATE
Income in Throop borough
Income Overview in Throop borough
Per Capita Income in Throop borough is $30,234, while median incomes of families and households are $66,250 and $49,673 respectively.
| Characteristic | Number | Measure |
| Per Capita Income | 4,062 | $30,234 |
| Median Family Income | 1,077 | $66,250 |
| Mean Family Income | 1,077 | $82,765 |
| Median Household Income | 1,829 | $49,673 |
| Mean Household Income | 1,829 | $66,130 |
| Income Deficit | 1,077 | $0 |
| Wage / Income Gap (%) | 4,062 | 11.97% |
| Wage / Income Gap ($) | 4,062 | 88.03¢ per $1 |
| Gini / Inequality Index | 4,062 | 0.45 |
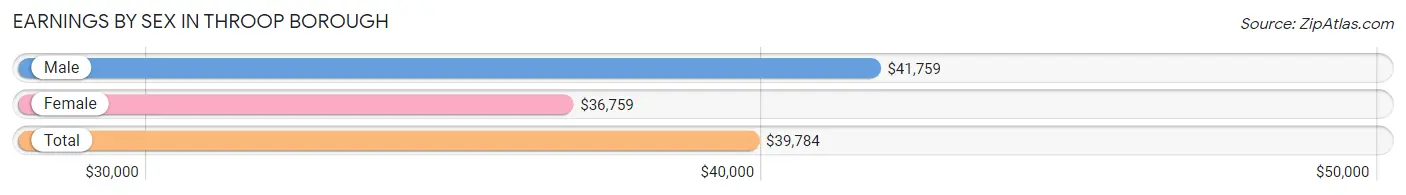
Earnings by Sex in Throop borough
Average Earnings in Throop borough are $39,784, $41,759 for men and $36,759 for women, a difference of 12.0%.
| Sex | Number | Average Earnings |
| Male | 996 (48.4%) | $41,759 |
| Female | 1,062 (51.6%) | $36,759 |
| Total | 2,058 (100.0%) | $39,784 |
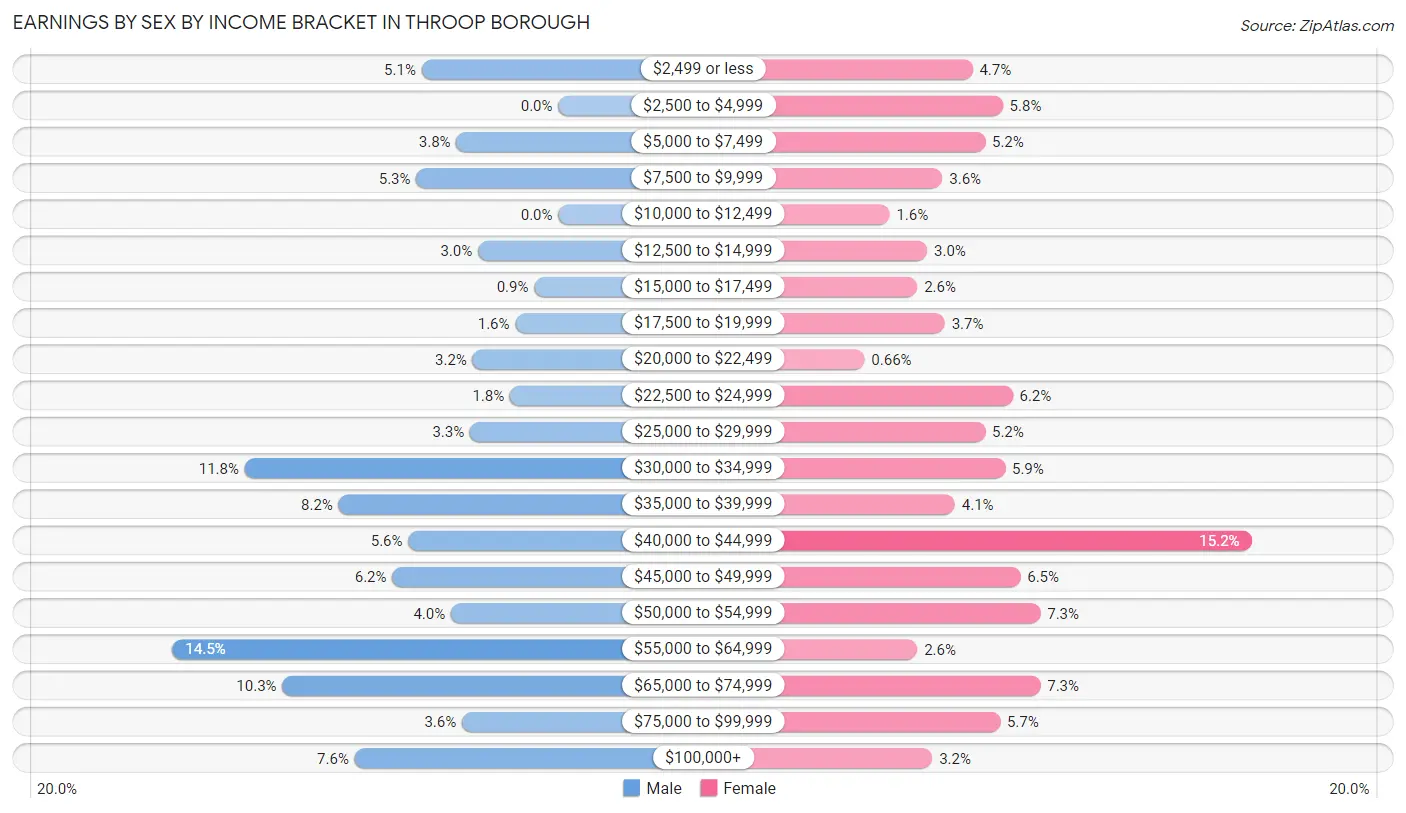
Earnings by Sex by Income Bracket in Throop borough
The most common earnings brackets in Throop borough are $55,000 to $64,999 for men (144 | 14.5%) and $40,000 to $44,999 for women (161 | 15.2%).
| Income | Male | Female |
| $2,499 or less | 51 (5.1%) | 50 (4.7%) |
| $2,500 to $4,999 | 0 (0.0%) | 62 (5.8%) |
| $5,000 to $7,499 | 38 (3.8%) | 55 (5.2%) |
| $7,500 to $9,999 | 53 (5.3%) | 38 (3.6%) |
| $10,000 to $12,499 | 0 (0.0%) | 17 (1.6%) |
| $12,500 to $14,999 | 30 (3.0%) | 32 (3.0%) |
| $15,000 to $17,499 | 9 (0.9%) | 28 (2.6%) |
| $17,500 to $19,999 | 16 (1.6%) | 39 (3.7%) |
| $20,000 to $22,499 | 32 (3.2%) | 7 (0.7%) |
| $22,500 to $24,999 | 18 (1.8%) | 66 (6.2%) |
| $25,000 to $29,999 | 33 (3.3%) | 55 (5.2%) |
| $30,000 to $34,999 | 117 (11.7%) | 63 (5.9%) |
| $35,000 to $39,999 | 82 (8.2%) | 43 (4.1%) |
| $40,000 to $44,999 | 56 (5.6%) | 161 (15.2%) |
| $45,000 to $49,999 | 62 (6.2%) | 69 (6.5%) |
| $50,000 to $54,999 | 40 (4.0%) | 77 (7.2%) |
| $55,000 to $64,999 | 144 (14.5%) | 28 (2.6%) |
| $65,000 to $74,999 | 103 (10.3%) | 77 (7.2%) |
| $75,000 to $99,999 | 36 (3.6%) | 61 (5.7%) |
| $100,000+ | 76 (7.6%) | 34 (3.2%) |
| Total | 996 (100.0%) | 1,062 (100.0%) |
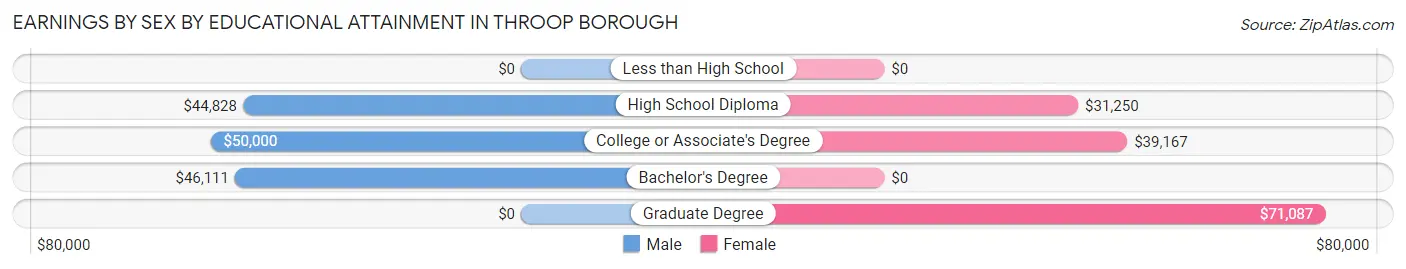
Earnings by Sex by Educational Attainment in Throop borough
Average earnings in Throop borough are $47,411 for men and $40,268 for women, a difference of 15.1%. Men with an educational attainment of college or associate's degree enjoy the highest average annual earnings of $50,000, while those with high school diploma education earn the least with $44,828. Women with an educational attainment of graduate degree earn the most with the average annual earnings of $71,087, while those with high school diploma education have the smallest earnings of $31,250.
| Educational Attainment | Male Income | Female Income |
| Less than High School | - | - |
| High School Diploma | $44,828 | $31,250 |
| College or Associate's Degree | $50,000 | $39,167 |
| Bachelor's Degree | $46,111 | $0 |
| Graduate Degree | - | - |
| Total | $47,411 | $40,268 |
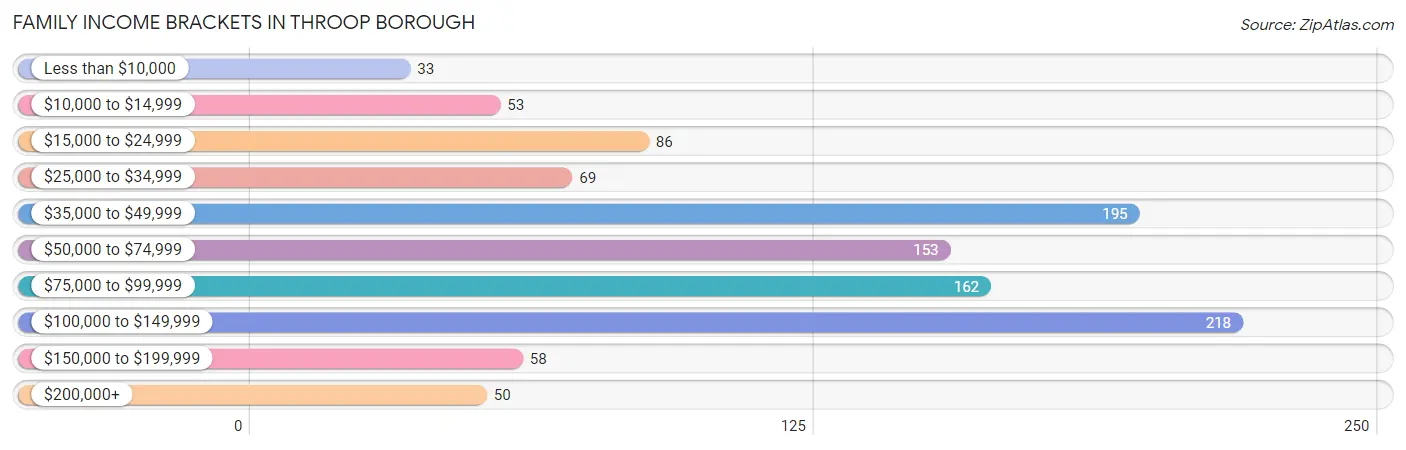
Family Income in Throop borough
Family Income Brackets in Throop borough
According to the Throop borough family income data, there are 218 families falling into the $100,000 to $149,999 income range, which is the most common income bracket and makes up 20.2% of all families. Conversely, the less than $10,000 income bracket is the least frequent group with only 33 families (3.1%) belonging to this category.
| Income Bracket | # Families | % Families |
| Less than $10,000 | 33 | 3.1% |
| $10,000 to $14,999 | 53 | 4.9% |
| $15,000 to $24,999 | 86 | 8.0% |
| $25,000 to $34,999 | 69 | 6.4% |
| $35,000 to $49,999 | 195 | 18.1% |
| $50,000 to $74,999 | 153 | 14.2% |
| $75,000 to $99,999 | 162 | 15.0% |
| $100,000 to $149,999 | 218 | 20.2% |
| $150,000 to $199,999 | 58 | 5.4% |
| $200,000+ | 50 | 4.6% |
Family Income by Famaliy Size in Throop borough
5-person families (28 | 2.6%) account for the highest median family income in Throop borough with $250,001 per family, while 5-person families (28 | 2.6%) have the highest median income of $50,000 per family member.
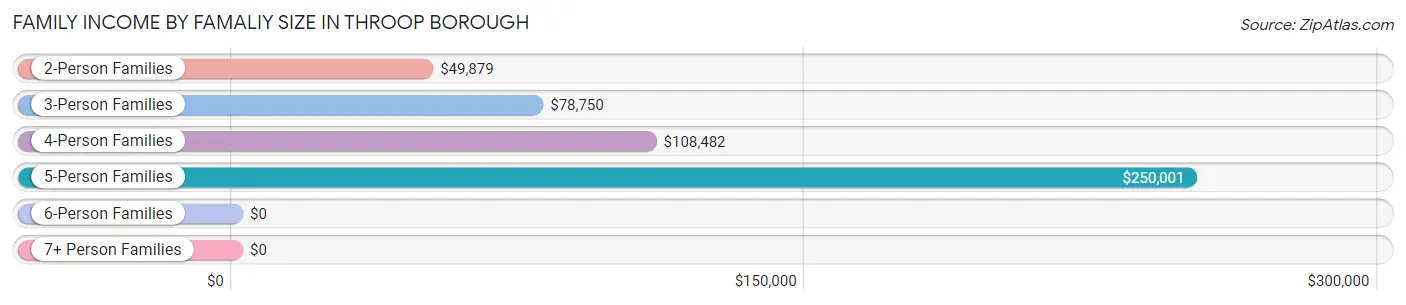
| Income Bracket | # Families | Median Income |
| 2-Person Families | 557 (51.7%) | $49,879 |
| 3-Person Families | 344 (31.9%) | $78,750 |
| 4-Person Families | 123 (11.4%) | $108,482 |
| 5-Person Families | 28 (2.6%) | $250,001 |
| 6-Person Families | 16 (1.5%) | $0 |
| 7+ Person Families | 9 (0.8%) | $0 |
| Total | 1,077 (100.0%) | $66,250 |
Family Income by Number of Earners in Throop borough
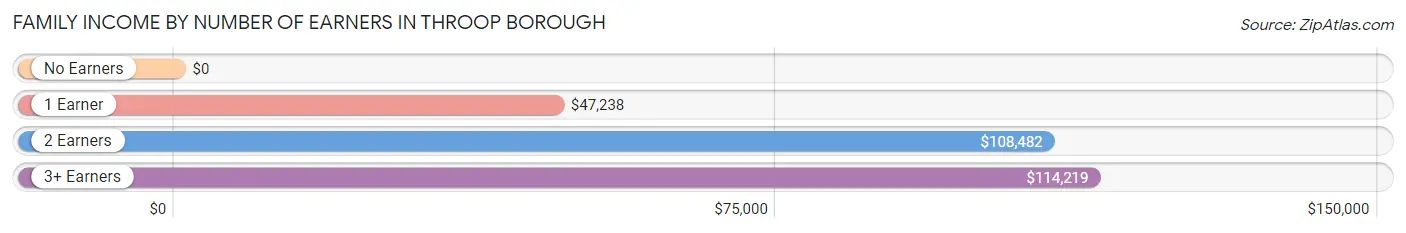
| Number of Earners | # Families | Median Income |
| No Earners | 194 (18.0%) | $0 |
| 1 Earner | 467 (43.4%) | $47,238 |
| 2 Earners | 259 (24.0%) | $108,482 |
| 3+ Earners | 157 (14.6%) | $114,219 |
| Total | 1,077 (100.0%) | $66,250 |
Household Income in Throop borough
Household Income Brackets in Throop borough
With 358 households falling in the category, the $50,000 to $74,999 income range is the most frequent in Throop borough, accounting for 19.6% of all households. In contrast, only 48 households (2.6%) fall into the $150,000 to $199,999 income bracket, making it the least populous group.
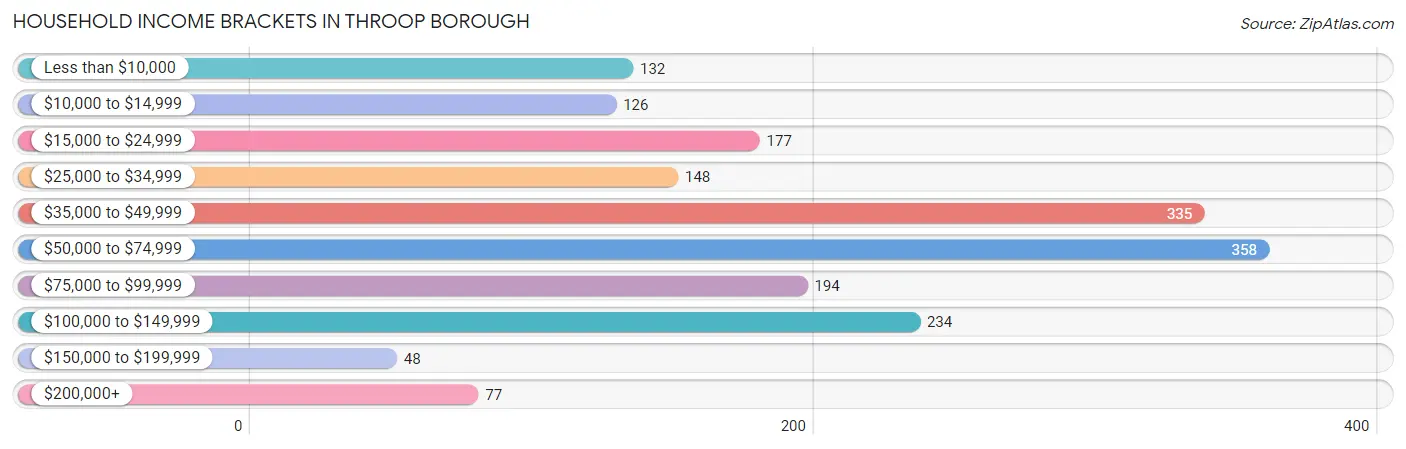
| Income Bracket | # Households | % Households |
| Less than $10,000 | 132 | 7.2% |
| $10,000 to $14,999 | 126 | 6.9% |
| $15,000 to $24,999 | 177 | 9.7% |
| $25,000 to $34,999 | 148 | 8.1% |
| $35,000 to $49,999 | 335 | 18.3% |
| $50,000 to $74,999 | 358 | 19.6% |
| $75,000 to $99,999 | 194 | 10.6% |
| $100,000 to $149,999 | 234 | 12.8% |
| $150,000 to $199,999 | 48 | 2.6% |
| $200,000+ | 77 | 4.2% |
Household Income by Householder Age in Throop borough
The median household income in Throop borough is $49,673, with the highest median household income of $59,531 found in the 25 to 44 years age bracket for the primary householder. A total of 540 households (29.5%) fall into this category. Meanwhile, the 15 to 24 years age bracket for the primary householder has the lowest median household income of $0, with 59 households (3.2%) in this group.
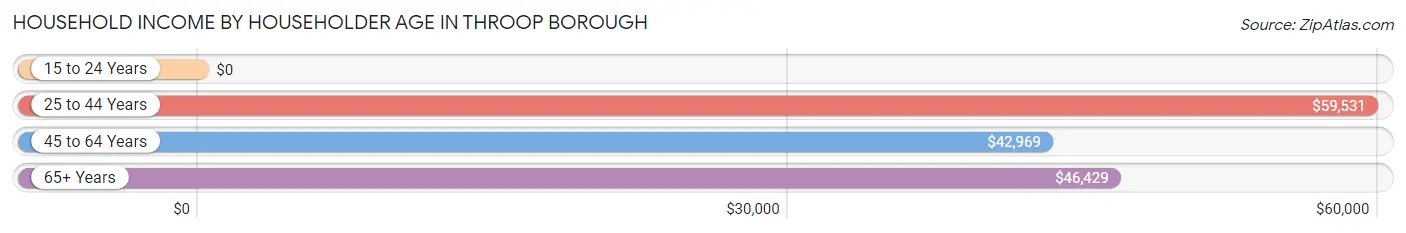
| Income Bracket | # Households | Median Income |
| 15 to 24 Years | 59 (3.2%) | $0 |
| 25 to 44 Years | 540 (29.5%) | $59,531 |
| 45 to 64 Years | 766 (41.9%) | $42,969 |
| 65+ Years | 464 (25.4%) | $46,429 |
| Total | 1,829 (100.0%) | $49,673 |
Poverty in Throop borough
Income Below Poverty by Sex and Age in Throop borough
With 14.1% poverty level for males and 12.1% for females among the residents of Throop borough, under 5 year old males and 6 to 11 year old females are the most vulnerable to poverty, with 11 males (39.3%) and 61 females (54.5%) in their respective age groups living below the poverty level.
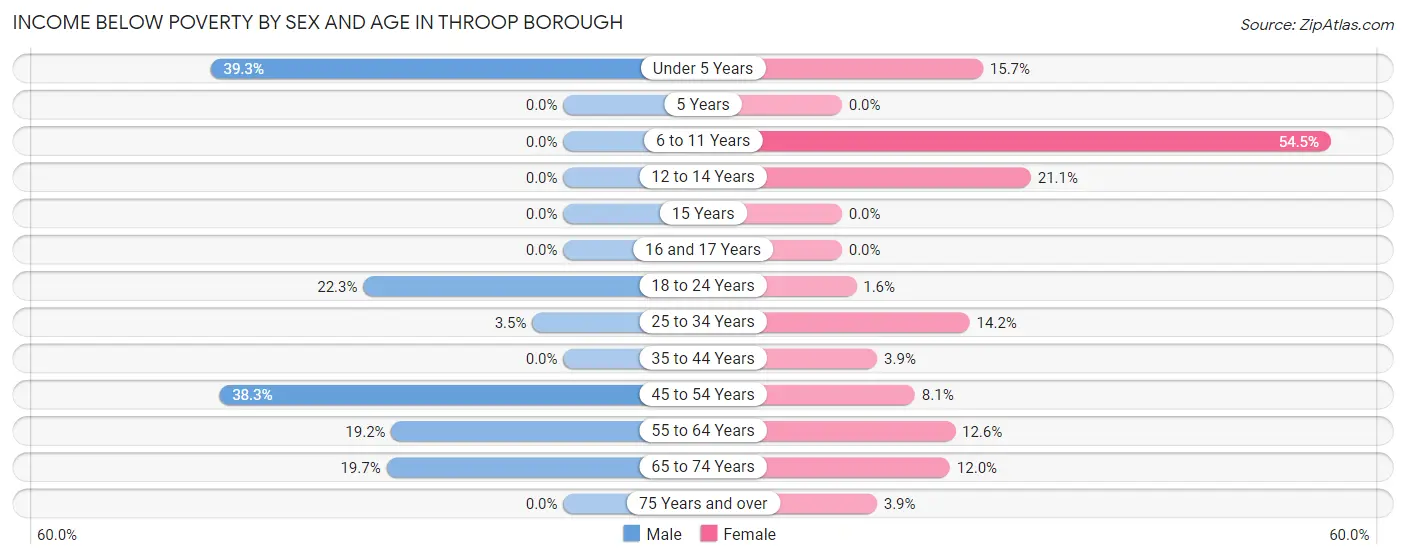
| Age Bracket | Male | Female |
| Under 5 Years | 11 (39.3%) | 11 (15.7%) |
| 5 Years | 0 (0.0%) | 0 (0.0%) |
| 6 to 11 Years | 0 (0.0%) | 61 (54.5%) |
| 12 to 14 Years | 0 (0.0%) | 28 (21.0%) |
| 15 Years | 0 (0.0%) | 0 (0.0%) |
| 16 and 17 Years | 0 (0.0%) | 0 (0.0%) |
| 18 to 24 Years | 43 (22.3%) | 2 (1.6%) |
| 25 to 34 Years | 10 (3.5%) | 41 (14.2%) |
| 35 to 44 Years | 0 (0.0%) | 11 (3.9%) |
| 45 to 54 Years | 151 (38.3%) | 25 (8.1%) |
| 55 to 64 Years | 36 (19.2%) | 30 (12.6%) |
| 65 to 74 Years | 40 (19.7%) | 26 (12.0%) |
| 75 Years and over | 0 (0.0%) | 8 (3.9%) |
| Total | 291 (14.1%) | 243 (12.1%) |
Income Above Poverty by Sex and Age in Throop borough
According to the poverty statistics in Throop borough, males aged 5 years and females aged 5 years are the age groups that are most secure financially, with 100.0% of males and 100.0% of females in these age groups living above the poverty line.
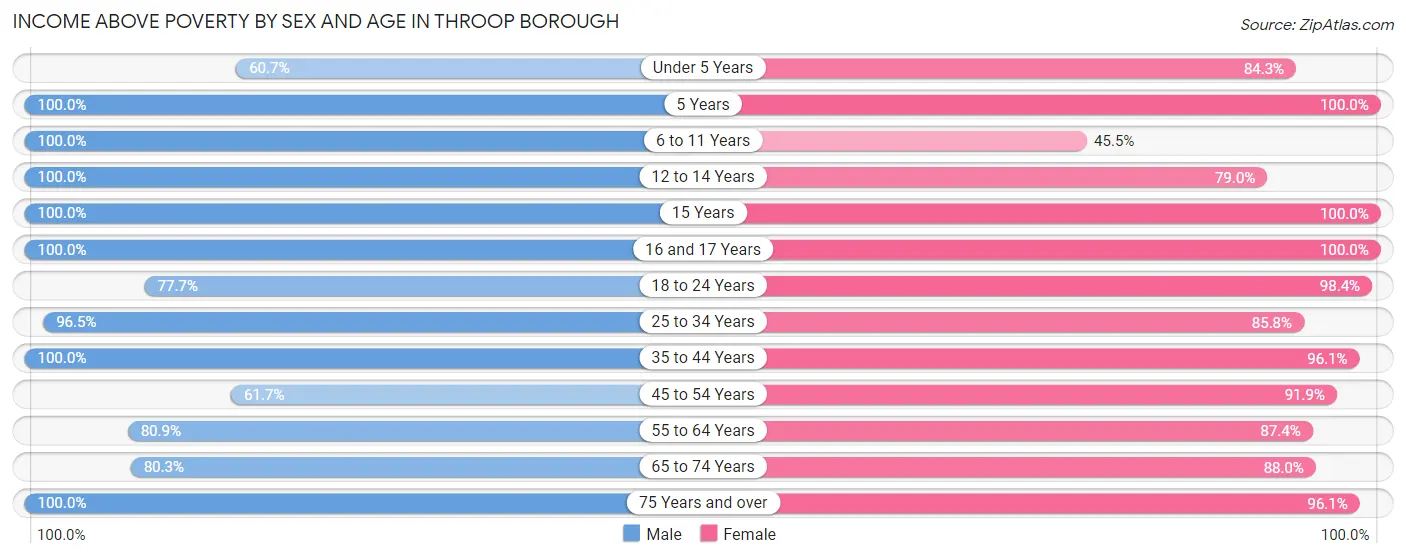
| Age Bracket | Male | Female |
| Under 5 Years | 17 (60.7%) | 59 (84.3%) |
| 5 Years | 32 (100.0%) | 12 (100.0%) |
| 6 to 11 Years | 182 (100.0%) | 51 (45.5%) |
| 12 to 14 Years | 114 (100.0%) | 105 (78.9%) |
| 15 Years | 24 (100.0%) | 17 (100.0%) |
| 16 and 17 Years | 46 (100.0%) | 4 (100.0%) |
| 18 to 24 Years | 150 (77.7%) | 122 (98.4%) |
| 25 to 34 Years | 279 (96.5%) | 247 (85.8%) |
| 35 to 44 Years | 208 (100.0%) | 268 (96.1%) |
| 45 to 54 Years | 243 (61.7%) | 282 (91.9%) |
| 55 to 64 Years | 152 (80.8%) | 208 (87.4%) |
| 65 to 74 Years | 163 (80.3%) | 190 (88.0%) |
| 75 Years and over | 156 (100.0%) | 197 (96.1%) |
| Total | 1,766 (85.9%) | 1,762 (87.9%) |
Income Below Poverty Among Married-Couple Families in Throop borough
The poverty statistics for married-couple families in Throop borough show that 1.4% or 8 of the total 570 families live below the poverty line. Families with no children have the highest poverty rate of 2.0%, comprising of 8 families. On the other hand, families with 1 or 2 children have the lowest poverty rate of 0.0%, which includes 0 families.
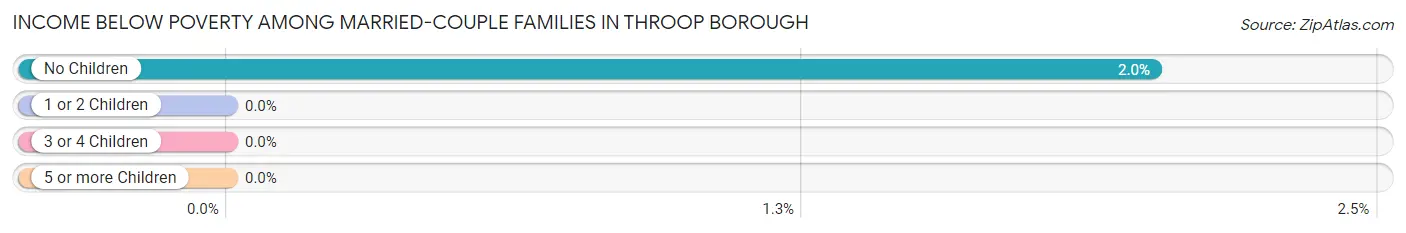
| Children | Above Poverty | Below Poverty |
| No Children | 390 (98.0%) | 8 (2.0%) |
| 1 or 2 Children | 155 (100.0%) | 0 (0.0%) |
| 3 or 4 Children | 17 (100.0%) | 0 (0.0%) |
| 5 or more Children | 0 (0.0%) | 0 (0.0%) |
| Total | 562 (98.6%) | 8 (1.4%) |
Income Below Poverty Among Single-Parent Households in Throop borough
According to the poverty data in Throop borough, 47.3% or 53 single-father households and 14.2% or 56 single-mother households are living below the poverty line. Among single-father households, those with no children have the highest poverty rate, with 53 households (58.9%) experiencing poverty. Likewise, among single-mother households, those with 1 or 2 children have the highest poverty rate, with 56 households (21.2%) falling below the poverty line.
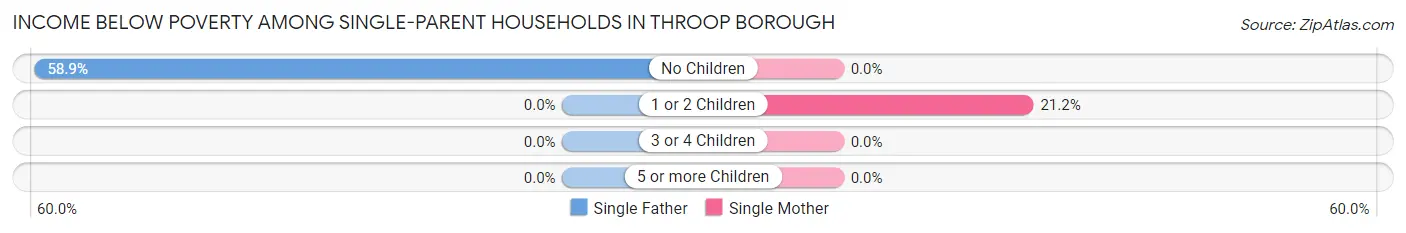
| Children | Single Father | Single Mother |
| No Children | 53 (58.9%) | 0 (0.0%) |
| 1 or 2 Children | 0 (0.0%) | 56 (21.2%) |
| 3 or 4 Children | 0 (0.0%) | 0 (0.0%) |
| 5 or more Children | 0 (0.0%) | 0 (0.0%) |
| Total | 53 (47.3%) | 56 (14.2%) |
Income Below Poverty Among Married-Couple vs Single-Parent Households in Throop borough
The poverty data for Throop borough shows that 8 of the married-couple family households (1.4%) and 109 of the single-parent households (21.5%) are living below the poverty level. Within the married-couple family households, those with no children have the highest poverty rate, with 8 households (2.0%) falling below the poverty line. Among the single-parent households, those with no children have the highest poverty rate, with 53 household (27.3%) living below poverty.
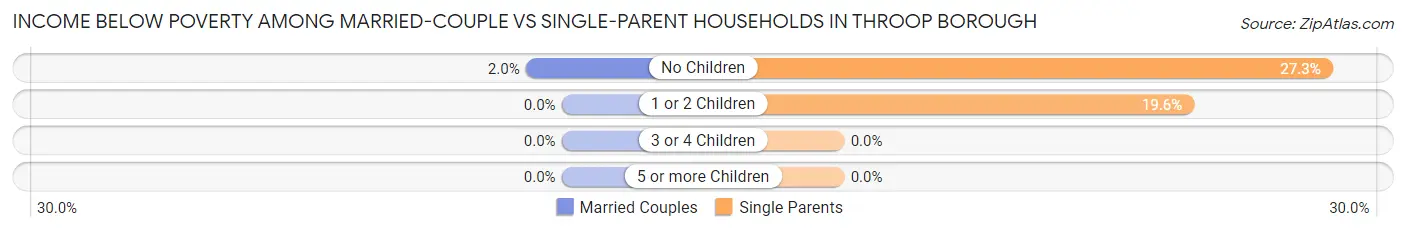
| Children | Married-Couple Families | Single-Parent Households |
| No Children | 8 (2.0%) | 53 (27.3%) |
| 1 or 2 Children | 0 (0.0%) | 56 (19.6%) |
| 3 or 4 Children | 0 (0.0%) | 0 (0.0%) |
| 5 or more Children | 0 (0.0%) | 0 (0.0%) |
| Total | 8 (1.4%) | 109 (21.5%) |
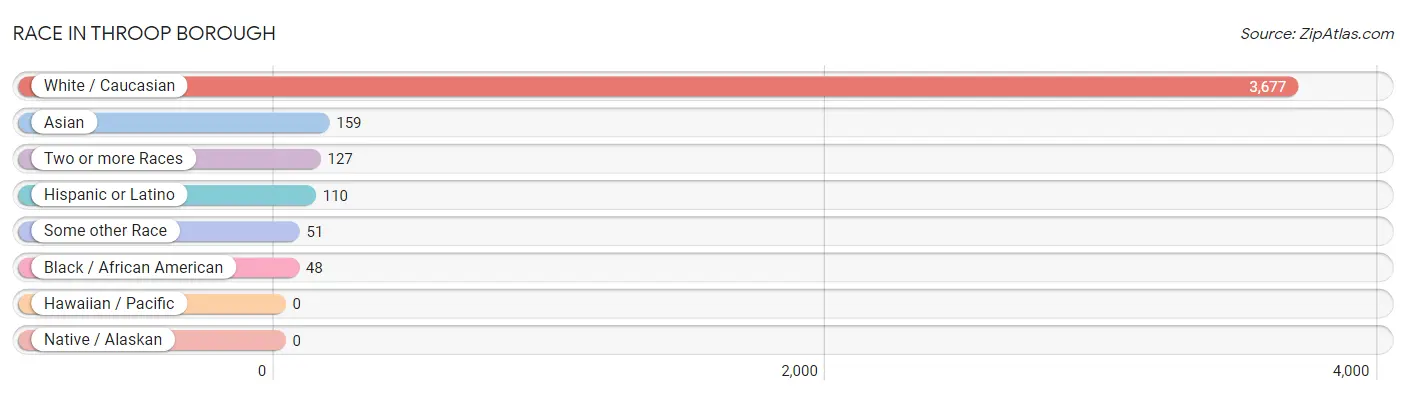
Race in Throop borough
The most populous races in Throop borough are White / Caucasian (3,677 | 90.5%), Asian (159 | 3.9%), and Two or more Races (127 | 3.1%).
| Race | # Population | % Population |
| Asian | 159 | 3.9% |
| Black / African American | 48 | 1.2% |
| Hawaiian / Pacific | 0 | 0.0% |
| Hispanic or Latino | 110 | 2.7% |
| Native / Alaskan | 0 | 0.0% |
| White / Caucasian | 3,677 | 90.5% |
| Two or more Races | 127 | 3.1% |
| Some other Race | 51 | 1.3% |
| Total | 4,062 | 100.0% |
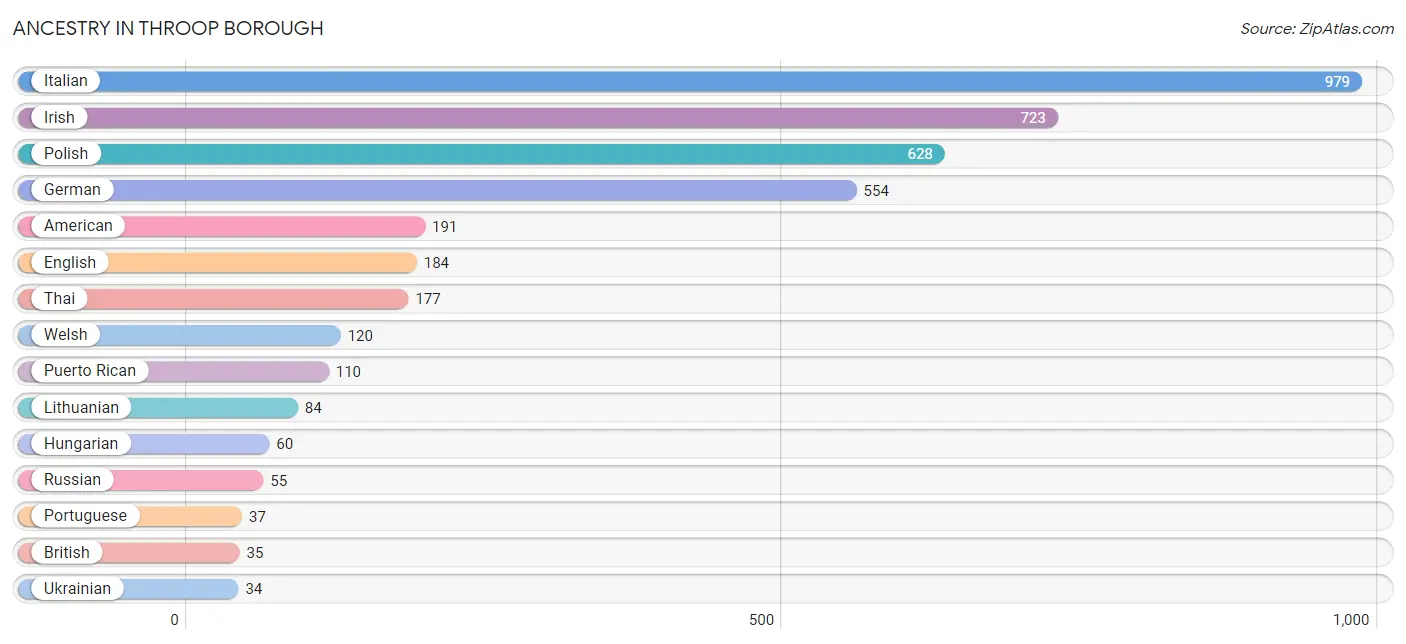
Ancestry in Throop borough
The most populous ancestries reported in Throop borough are Italian (979 | 24.1%), Irish (723 | 17.8%), Polish (628 | 15.5%), German (554 | 13.6%), and American (191 | 4.7%), together accounting for 75.7% of all Throop borough residents.
| Ancestry | # Population | % Population |
| African | 16 | 0.4% |
| American | 191 | 4.7% |
| Arab | 24 | 0.6% |
| British | 35 | 0.9% |
| Burmese | 7 | 0.2% |
| Cherokee | 6 | 0.2% |
| Czech | 8 | 0.2% |
| Dutch | 7 | 0.2% |
| Eastern European | 12 | 0.3% |
| English | 184 | 4.5% |
| European | 8 | 0.2% |
| French | 15 | 0.4% |
| German | 554 | 13.6% |
| Hungarian | 60 | 1.5% |
| Irish | 723 | 17.8% |
| Iroquois | 10 | 0.3% |
| Italian | 979 | 24.1% |
| Lebanese | 24 | 0.6% |
| Lithuanian | 84 | 2.1% |
| Northern European | 30 | 0.7% |
| Polish | 628 | 15.5% |
| Portuguese | 37 | 0.9% |
| Puerto Rican | 110 | 2.7% |
| Russian | 55 | 1.3% |
| Scotch-Irish | 10 | 0.3% |
| Scottish | 31 | 0.8% |
| Slavic | 9 | 0.2% |
| Slovak | 10 | 0.3% |
| Subsaharan African | 16 | 0.4% |
| Thai | 177 | 4.4% |
| Ukrainian | 34 | 0.8% |
| Welsh | 120 | 2.9% | View All 32 Rows |
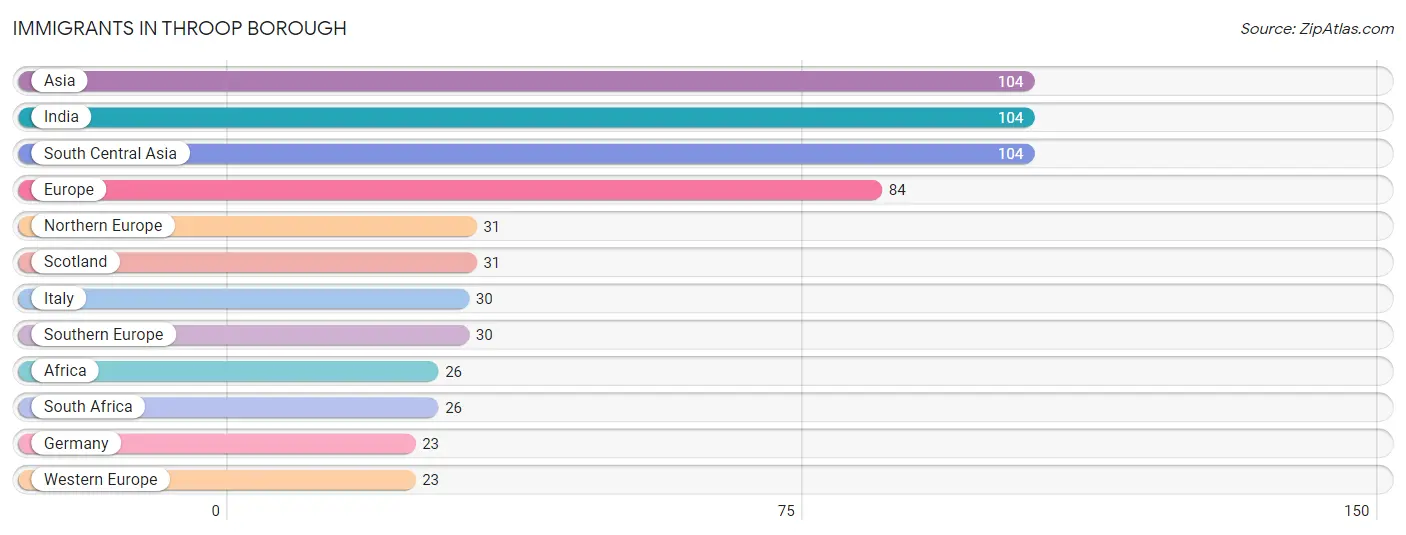
Immigrants in Throop borough
The most numerous immigrant groups reported in Throop borough came from Asia (104 | 2.6%), India (104 | 2.6%), South Central Asia (104 | 2.6%), Europe (84 | 2.1%), and Northern Europe (31 | 0.8%), together accounting for 10.5% of all Throop borough residents.
| Immigration Origin | # Population | % Population |
| Africa | 26 | 0.6% |
| Asia | 104 | 2.6% |
| Europe | 84 | 2.1% |
| Germany | 23 | 0.6% |
| India | 104 | 2.6% |
| Italy | 30 | 0.7% |
| Northern Europe | 31 | 0.8% |
| Scotland | 31 | 0.8% |
| South Africa | 26 | 0.6% |
| South Central Asia | 104 | 2.6% |
| Southern Europe | 30 | 0.7% |
| Western Europe | 23 | 0.6% | View All 12 Rows |
Sex and Age in Throop borough
Sex and Age in Throop borough
The most populous age groups in Throop borough are 10 to 14 Years (229 | 11.1%) for men and 50 to 54 Years (196 | 9.8%) for women.
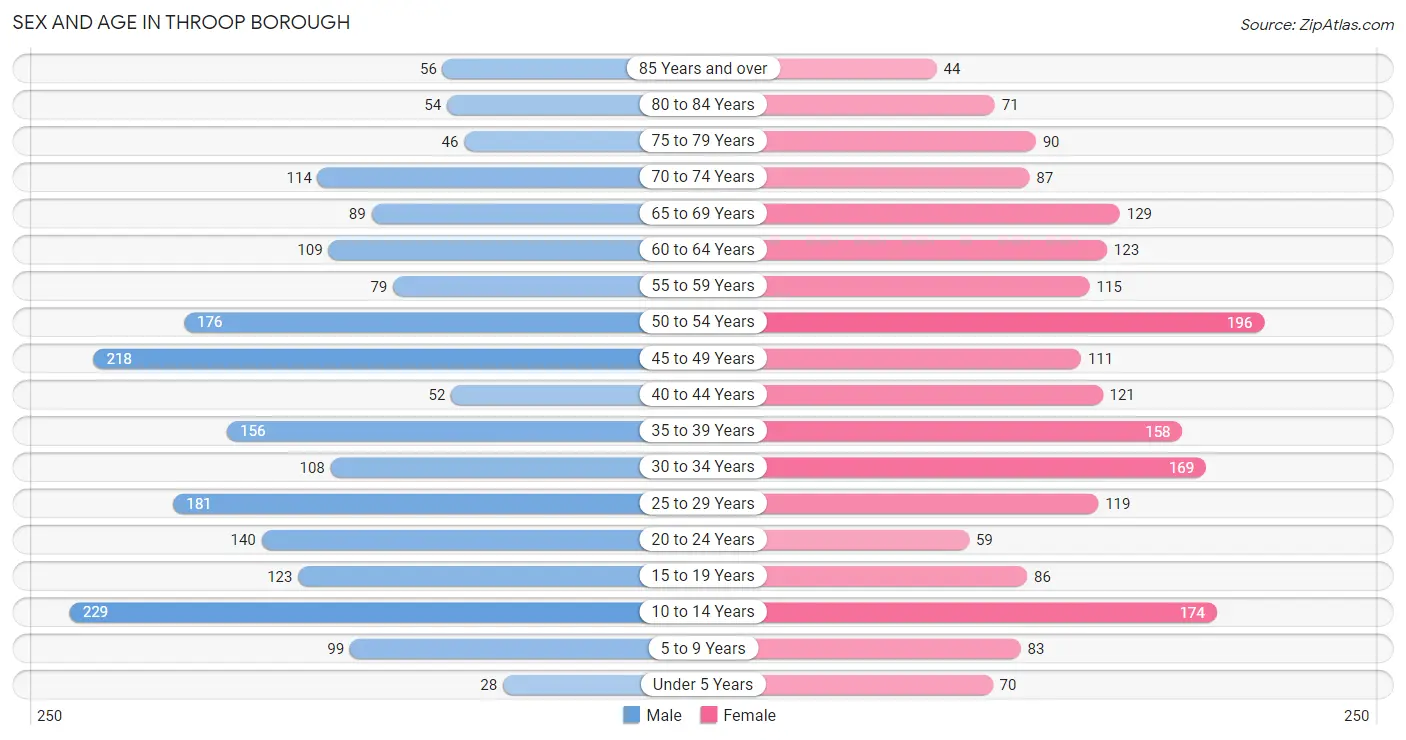
| Age Bracket | Male | Female |
| Under 5 Years | 28 (1.4%) | 70 (3.5%) |
| 5 to 9 Years | 99 (4.8%) | 83 (4.1%) |
| 10 to 14 Years | 229 (11.1%) | 174 (8.7%) |
| 15 to 19 Years | 123 (6.0%) | 86 (4.3%) |
| 20 to 24 Years | 140 (6.8%) | 59 (2.9%) |
| 25 to 29 Years | 181 (8.8%) | 119 (5.9%) |
| 30 to 34 Years | 108 (5.2%) | 169 (8.4%) |
| 35 to 39 Years | 156 (7.6%) | 158 (7.9%) |
| 40 to 44 Years | 52 (2.5%) | 121 (6.0%) |
| 45 to 49 Years | 218 (10.6%) | 111 (5.5%) |
| 50 to 54 Years | 176 (8.6%) | 196 (9.8%) |
| 55 to 59 Years | 79 (3.8%) | 115 (5.7%) |
| 60 to 64 Years | 109 (5.3%) | 123 (6.1%) |
| 65 to 69 Years | 89 (4.3%) | 129 (6.4%) |
| 70 to 74 Years | 114 (5.5%) | 87 (4.3%) |
| 75 to 79 Years | 46 (2.2%) | 90 (4.5%) |
| 80 to 84 Years | 54 (2.6%) | 71 (3.5%) |
| 85 Years and over | 56 (2.7%) | 44 (2.2%) |
| Total | 2,057 (100.0%) | 2,005 (100.0%) |
Families and Households in Throop borough
Median Family Size in Throop borough
The median family size in Throop borough is 2.85 persons per family, with married-couple families (570 | 52.9%) accounting for the largest median family size of 2.98 persons per family. On the other hand, single male/father families (112 | 10.4%) represent the smallest median family size with 1.86 persons per family.
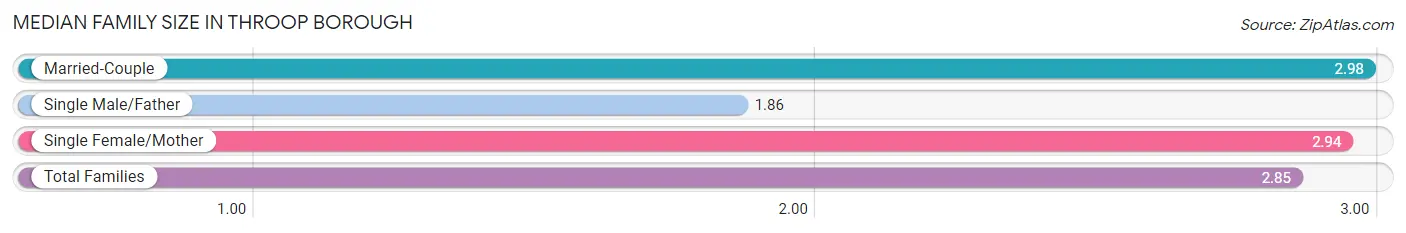
| Family Type | # Families | Family Size |
| Married-Couple | 570 (52.9%) | 2.98 |
| Single Male/Father | 112 (10.4%) | 1.86 |
| Single Female/Mother | 395 (36.7%) | 2.94 |
| Total Families | 1,077 (100.0%) | 2.85 |
Median Household Size in Throop borough
The median household size in Throop borough is 2.22 persons per household, with single female/mother households (395 | 21.6%) accounting for the largest median household size of 3.29 persons per household. non-family households (752 | 41.1%) represent the smallest median household size with 1.11 persons per household.
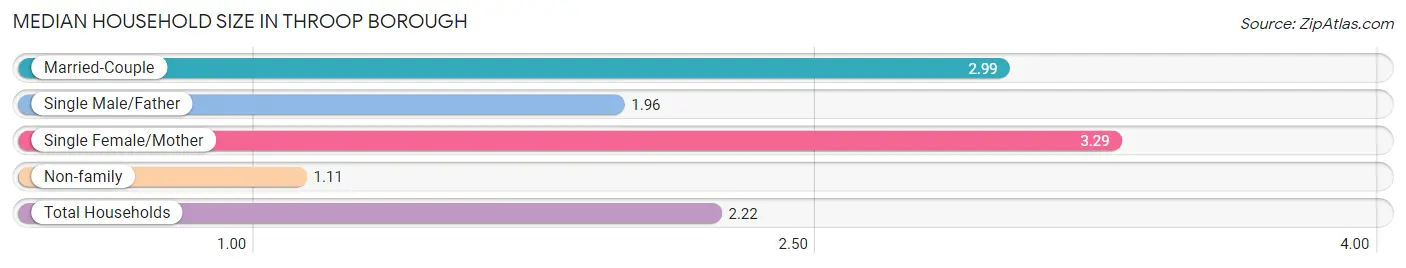
| Household Type | # Households | Household Size |
| Married-Couple | 570 (31.2%) | 2.99 |
| Single Male/Father | 112 (6.1%) | 1.96 |
| Single Female/Mother | 395 (21.6%) | 3.29 |
| Non-family | 752 (41.1%) | 1.11 |
| Total Households | 1,829 (100.0%) | 2.22 |
Household Size by Marriage Status in Throop borough
Out of a total of 1,829 households in Throop borough, 1,077 (58.9%) are family households, while 752 (41.1%) are nonfamily households. The most numerous type of family households are 2-person households, comprising 489, and the most common type of nonfamily households are 1-person households, comprising 671.
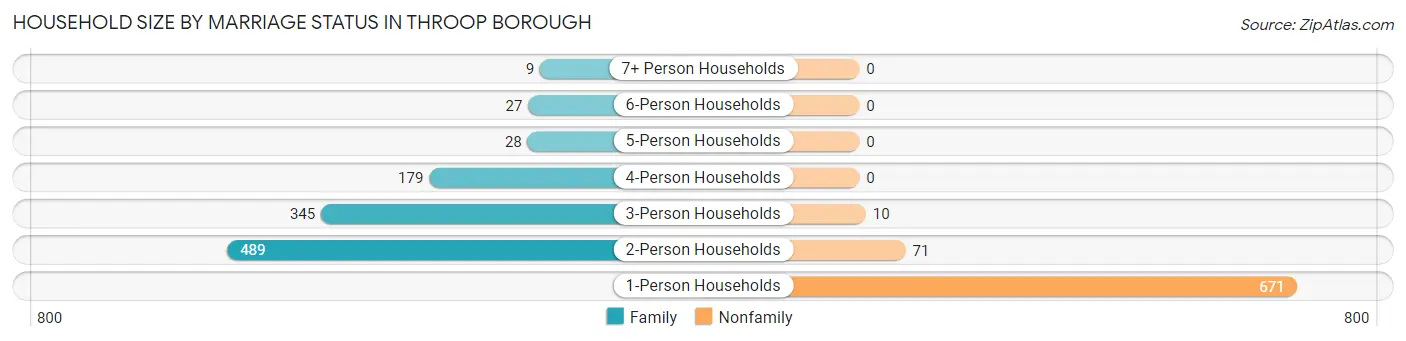
| Household Size | Family Households | Nonfamily Households |
| 1-Person Households | - | 671 (36.7%) |
| 2-Person Households | 489 (26.7%) | 71 (3.9%) |
| 3-Person Households | 345 (18.9%) | 10 (0.5%) |
| 4-Person Households | 179 (9.8%) | 0 (0.0%) |
| 5-Person Households | 28 (1.5%) | 0 (0.0%) |
| 6-Person Households | 27 (1.5%) | 0 (0.0%) |
| 7+ Person Households | 9 (0.5%) | 0 (0.0%) |
| Total | 1,077 (58.9%) | 752 (41.1%) |
Female Fertility in Throop borough
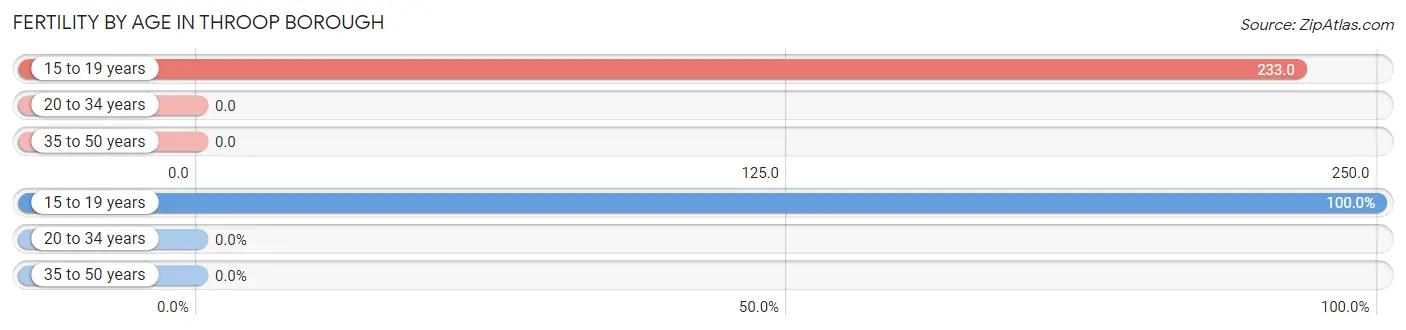
Fertility by Age in Throop borough
Average fertility rate in Throop borough is 23.0 births per 1,000 women. Women in the age bracket of 15 to 19 years have the highest fertility rate with 233.0 births per 1,000 women. Women in the age bracket of 15 to 19 years acount for 100.0% of all women with births.
| Age Bracket | Women with Births | Births / 1,000 Women |
| 15 to 19 years | 20 (100.0%) | 233.0 |
| 20 to 34 years | 0 (0.0%) | 0.0 |
| 35 to 50 years | 0 (0.0%) | 0.0 |
| Total | 20 (100.0%) | 23.0 |
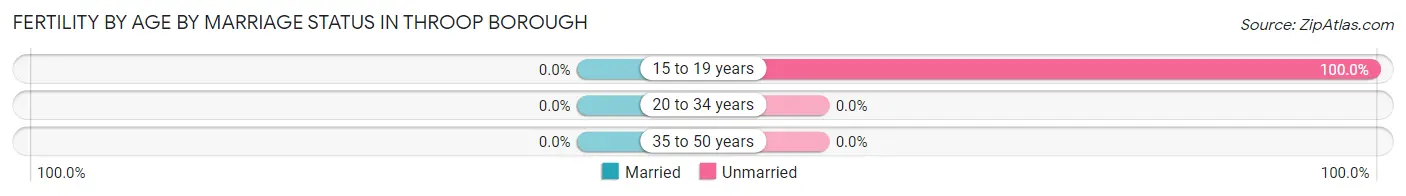
Fertility by Age by Marriage Status in Throop borough
| Age Bracket | Married | Unmarried |
| 15 to 19 years | 0 (0.0%) | 20 (100.0%) |
| 20 to 34 years | 0 (0.0%) | 0 (0.0%) |
| 35 to 50 years | 0 (0.0%) | 0 (0.0%) |
| Total | 0 (0.0%) | 20 (100.0%) |
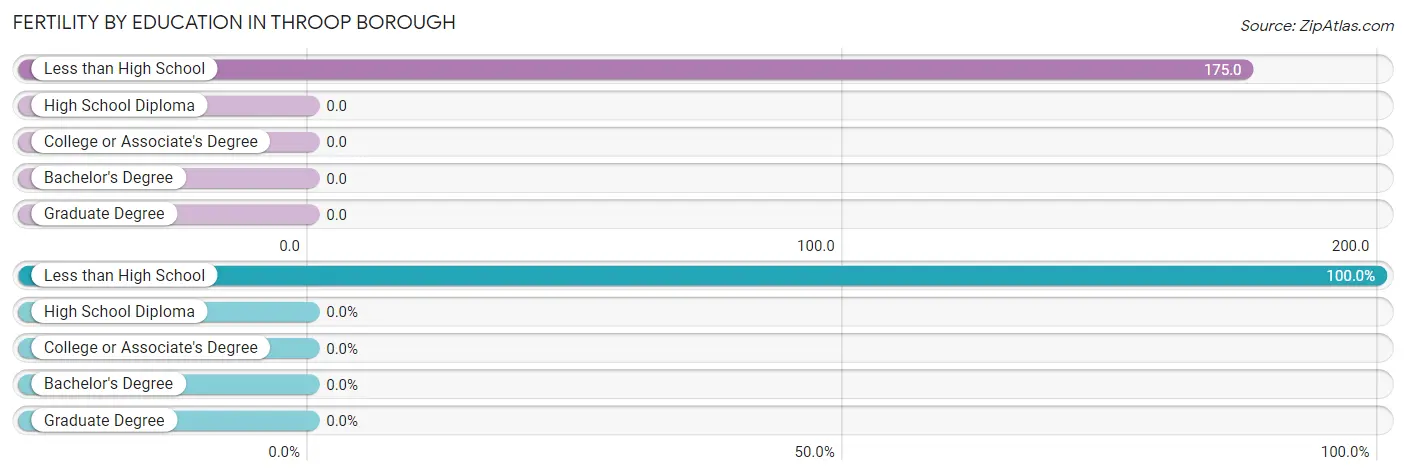
Fertility by Education in Throop borough
| Educational Attainment | Women with Births | Births / 1,000 Women |
| Less than High School | 20 (100.0%) | 175.0 |
| High School Diploma | 0 (0.0%) | 0.0 |
| College or Associate's Degree | 0 (0.0%) | 0.0 |
| Bachelor's Degree | 0 (0.0%) | 0.0 |
| Graduate Degree | 0 (0.0%) | 0.0 |
| Total | 20 (100.0%) | 23.0 |
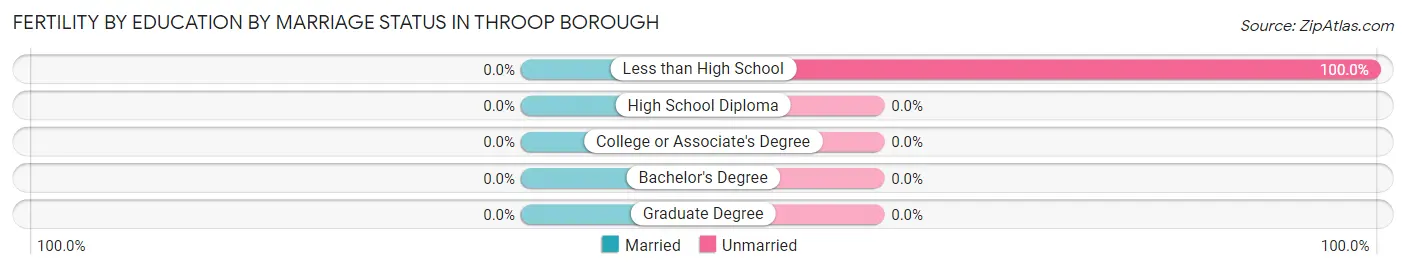
Fertility by Education by Marriage Status in Throop borough
| Educational Attainment | Married | Unmarried |
| Less than High School | 0 (0.0%) | 20 (100.0%) |
| High School Diploma | 0 (0.0%) | 0 (0.0%) |
| College or Associate's Degree | 0 (0.0%) | 0 (0.0%) |
| Bachelor's Degree | 0 (0.0%) | 0 (0.0%) |
| Graduate Degree | 0 (0.0%) | 0 (0.0%) |
| Total | 0 (0.0%) | 20 (100.0%) |
Employment Characteristics in Throop borough
Employment by Class of Employer in Throop borough
Among the 1,883 employed individuals in Throop borough, private company employees (1,446 | 76.8%), state government employees (145 | 7.7%), and not-for-profit organizations (132 | 7.0%) make up the most common classes of employment.
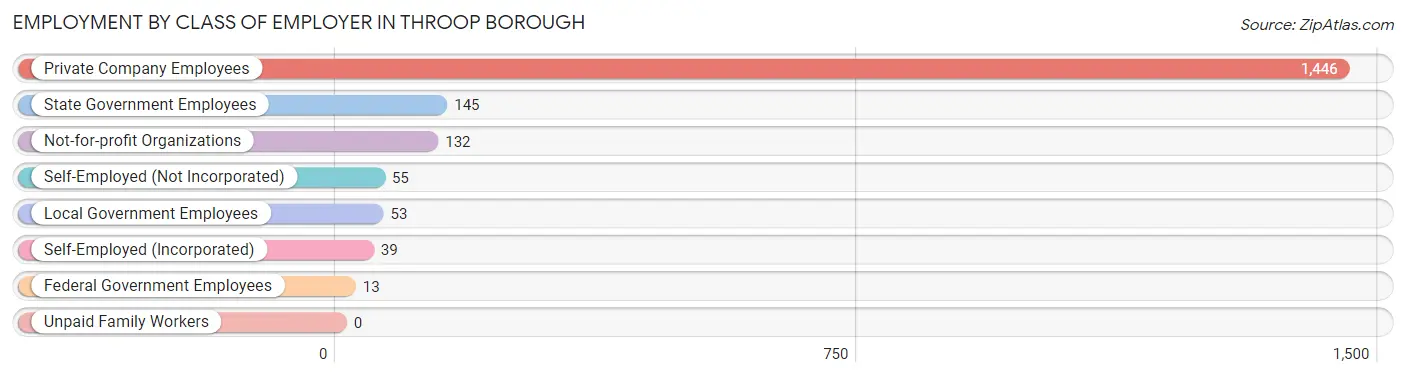
| Employer Class | # Employees | % Employees |
| Private Company Employees | 1,446 | 76.8% |
| Self-Employed (Incorporated) | 39 | 2.1% |
| Self-Employed (Not Incorporated) | 55 | 2.9% |
| Not-for-profit Organizations | 132 | 7.0% |
| Local Government Employees | 53 | 2.8% |
| State Government Employees | 145 | 7.7% |
| Federal Government Employees | 13 | 0.7% |
| Unpaid Family Workers | 0 | 0.0% |
| Total | 1,883 | 100.0% |
Employment Status by Age in Throop borough
According to the labor force statistics for Throop borough, out of the total population over 16 years of age (3,338), 59.8% or 1,996 individuals are in the labor force, with 2.7% or 54 of them unemployed. The age group with the highest labor force participation rate is 25 to 29 years, with 88.7% or 266 individuals in the labor force. Within the labor force, the 25 to 29 years age range has the highest percentage of unemployed individuals, with 6.4% or 17 of them being unemployed.
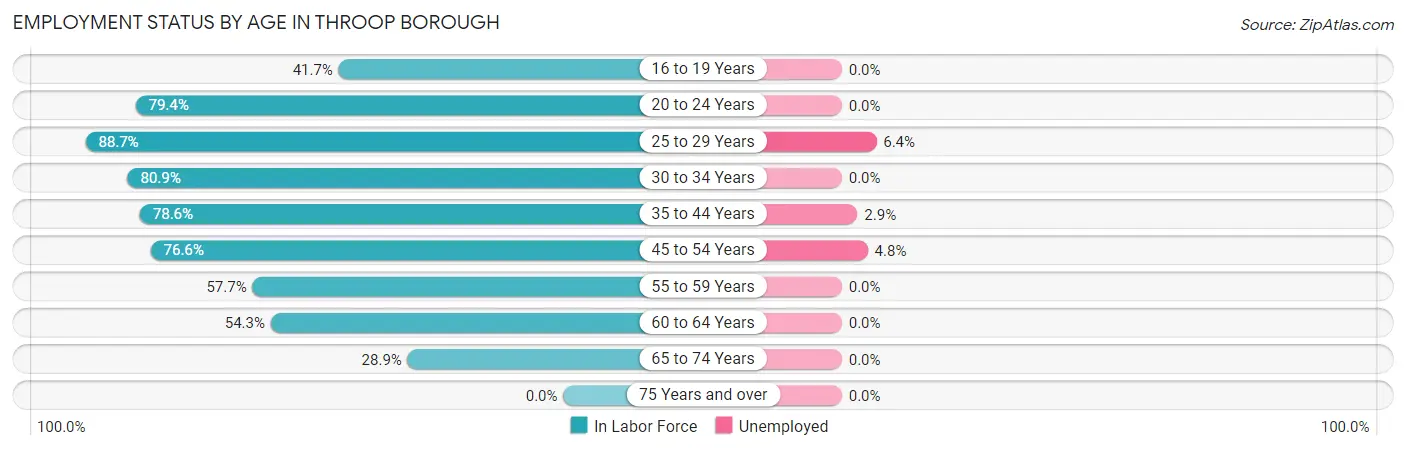
| Age Bracket | In Labor Force | Unemployed |
| 16 to 19 Years | 70 (41.7%) | 0 (0.0%) |
| 20 to 24 Years | 158 (79.4%) | 0 (0.0%) |
| 25 to 29 Years | 266 (88.7%) | 17 (6.4%) |
| 30 to 34 Years | 224 (80.9%) | 0 (0.0%) |
| 35 to 44 Years | 383 (78.6%) | 11 (2.9%) |
| 45 to 54 Years | 537 (76.6%) | 26 (4.8%) |
| 55 to 59 Years | 112 (57.7%) | 0 (0.0%) |
| 60 to 64 Years | 126 (54.3%) | 0 (0.0%) |
| 65 to 74 Years | 121 (28.9%) | 0 (0.0%) |
| 75 Years and over | 0 (0.0%) | 0 (0.0%) |
| Total | 1,996 (59.8%) | 54 (2.7%) |
Employment Status by Educational Attainment in Throop borough
According to labor force statistics for Throop borough, 75.2% of individuals (1,648) out of the total population between 25 and 64 years of age (2,191) are in the labor force, with 3.3% or 54 of them being unemployed. The group with the highest labor force participation rate are those with the educational attainment of bachelor's degree or higher, with 91.0% or 464 individuals in the labor force. Within the labor force, individuals with high school diploma education have the highest percentage of unemployment, with 7.1% or 40 of them being unemployed.

| Educational Attainment | In Labor Force | Unemployed |
| Less than High School | 59 (24.4%) | 0 (0.0%) |
| High School Diploma | 566 (76.7%) | 52 (7.1%) |
| College / Associate Degree | 559 (79.7%) | 18 (2.5%) |
| Bachelor's Degree or higher | 464 (91.0%) | 0 (0.0%) |
| Total | 1,648 (75.2%) | 72 (3.3%) |
Employment Occupations by Sex in Throop borough
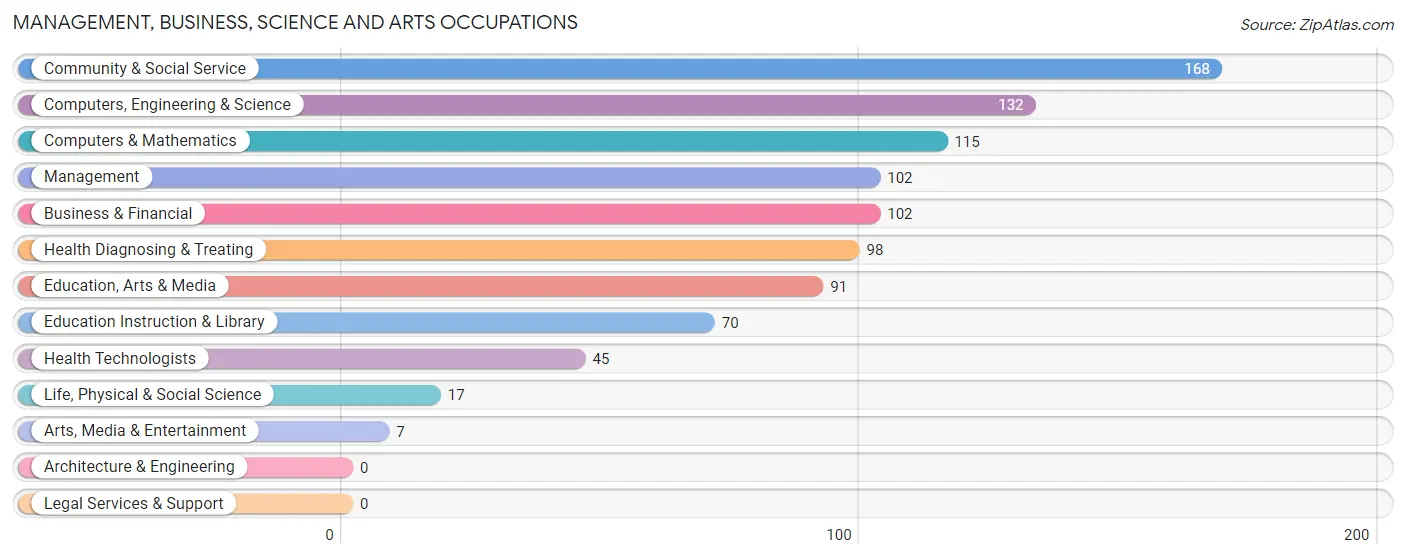
Management, Business, Science and Arts Occupations
The most common Management, Business, Science and Arts occupations in Throop borough are Community & Social Service (168 | 8.6%), Computers, Engineering & Science (132 | 6.8%), Computers & Mathematics (115 | 5.9%), Management (102 | 5.2%), and Business & Financial (102 | 5.2%).
Management, Business, Science and Arts Occupations by Sex
Within the Management, Business, Science and Arts occupations in Throop borough, the most male-oriented occupations are Health Technologists (82.2%), Computers & Mathematics (60.0%), and Computers, Engineering & Science (52.3%), while the most female-oriented occupations are Life, Physical & Social Science (100.0%), Arts, Media & Entertainment (100.0%), and Education Instruction & Library (82.9%).
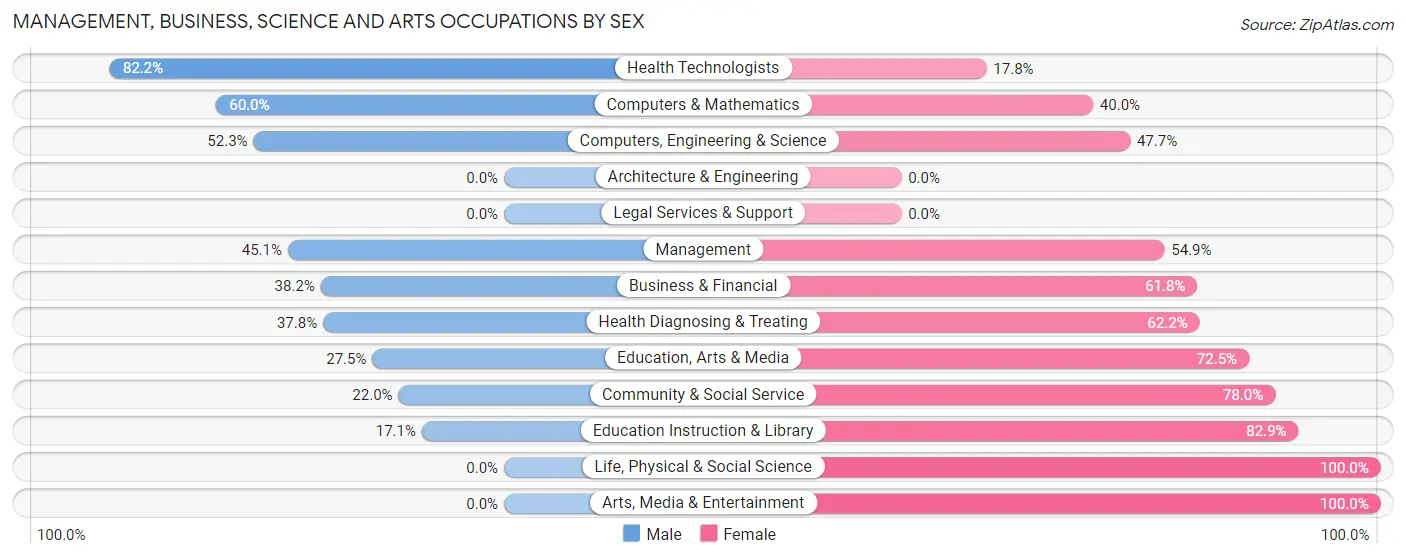
| Occupation | Male | Female |
| Management | 46 (45.1%) | 56 (54.9%) |
| Business & Financial | 39 (38.2%) | 63 (61.8%) |
| Computers, Engineering & Science | 69 (52.3%) | 63 (47.7%) |
| Computers & Mathematics | 69 (60.0%) | 46 (40.0%) |
| Architecture & Engineering | 0 (0.0%) | 0 (0.0%) |
| Life, Physical & Social Science | 0 (0.0%) | 17 (100.0%) |
| Community & Social Service | 37 (22.0%) | 131 (78.0%) |
| Education, Arts & Media | 25 (27.5%) | 66 (72.5%) |
| Legal Services & Support | 0 (0.0%) | 0 (0.0%) |
| Education Instruction & Library | 12 (17.1%) | 58 (82.9%) |
| Arts, Media & Entertainment | 0 (0.0%) | 7 (100.0%) |
| Health Diagnosing & Treating | 37 (37.8%) | 61 (62.2%) |
| Health Technologists | 37 (82.2%) | 8 (17.8%) |
| Total (Category) | 228 (37.9%) | 374 (62.1%) |
| Total (Overall) | 936 (48.2%) | 1,007 (51.8%) |
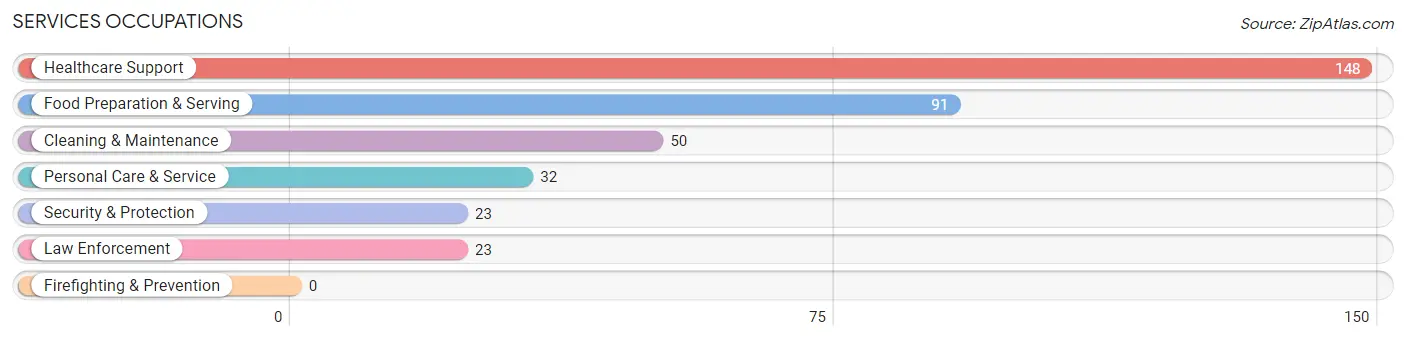
Services Occupations
The most common Services occupations in Throop borough are Healthcare Support (148 | 7.6%), Food Preparation & Serving (91 | 4.7%), Cleaning & Maintenance (50 | 2.6%), Personal Care & Service (32 | 1.7%), and Security & Protection (23 | 1.2%).
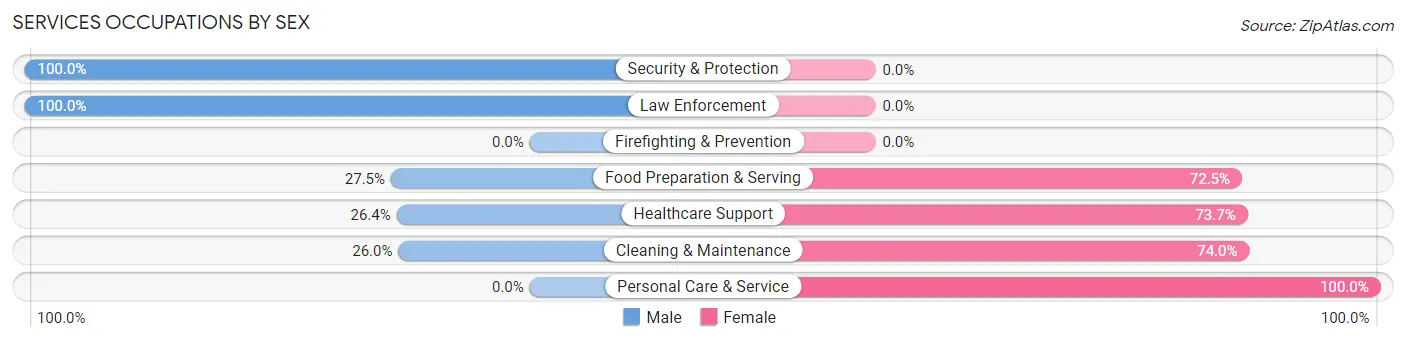
Services Occupations by Sex
Within the Services occupations in Throop borough, the most male-oriented occupations are Security & Protection (100.0%), Law Enforcement (100.0%), and Food Preparation & Serving (27.5%), while the most female-oriented occupations are Personal Care & Service (100.0%), Cleaning & Maintenance (74.0%), and Healthcare Support (73.7%).
| Occupation | Male | Female |
| Healthcare Support | 39 (26.4%) | 109 (73.7%) |
| Security & Protection | 23 (100.0%) | 0 (0.0%) |
| Firefighting & Prevention | 0 (0.0%) | 0 (0.0%) |
| Law Enforcement | 23 (100.0%) | 0 (0.0%) |
| Food Preparation & Serving | 25 (27.5%) | 66 (72.5%) |
| Cleaning & Maintenance | 13 (26.0%) | 37 (74.0%) |
| Personal Care & Service | 0 (0.0%) | 32 (100.0%) |
| Total (Category) | 100 (29.1%) | 244 (70.9%) |
| Total (Overall) | 936 (48.2%) | 1,007 (51.8%) |
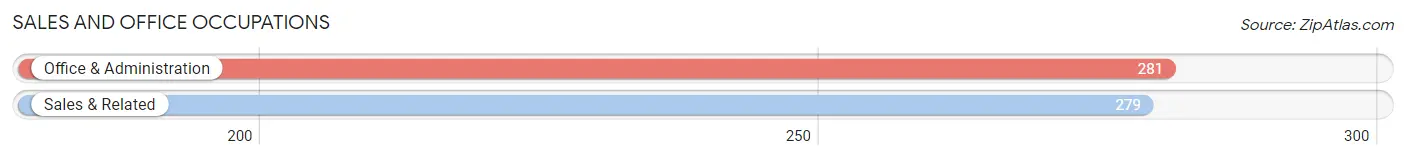
Sales and Office Occupations
The most common Sales and Office occupations in Throop borough are Office & Administration (281 | 14.5%), and Sales & Related (279 | 14.4%).
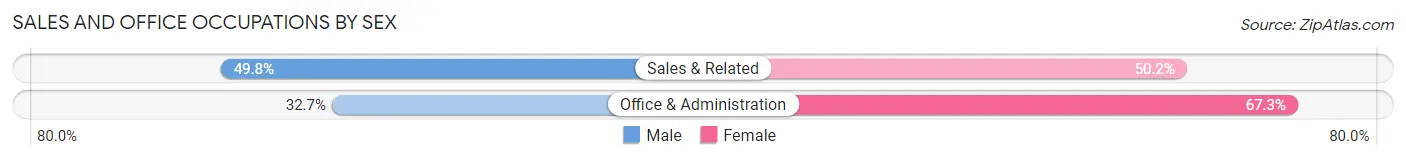
Sales and Office Occupations by Sex
| Occupation | Male | Female |
| Sales & Related | 139 (49.8%) | 140 (50.2%) |
| Office & Administration | 92 (32.7%) | 189 (67.3%) |
| Total (Category) | 231 (41.2%) | 329 (58.8%) |
| Total (Overall) | 936 (48.2%) | 1,007 (51.8%) |
Natural Resources, Construction and Maintenance Occupations
The most common Natural Resources, Construction and Maintenance occupations in Throop borough are Construction & Extraction (159 | 8.2%), and Installation, Maintenance & Repair (62 | 3.2%).
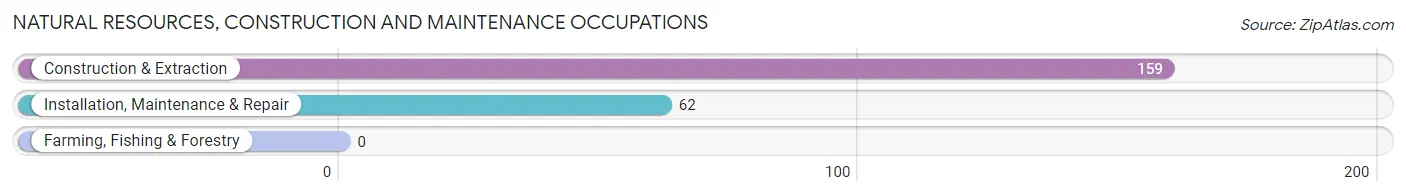
Natural Resources, Construction and Maintenance Occupations by Sex
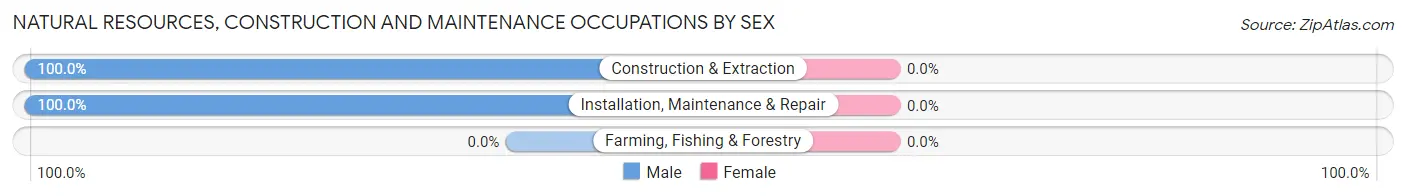
| Occupation | Male | Female |
| Farming, Fishing & Forestry | 0 (0.0%) | 0 (0.0%) |
| Construction & Extraction | 159 (100.0%) | 0 (0.0%) |
| Installation, Maintenance & Repair | 62 (100.0%) | 0 (0.0%) |
| Total (Category) | 221 (100.0%) | 0 (0.0%) |
| Total (Overall) | 936 (48.2%) | 1,007 (51.8%) |
Production, Transportation and Moving Occupations
The most common Production, Transportation and Moving occupations in Throop borough are Production (89 | 4.6%), Material Moving (71 | 3.6%), and Transportation (56 | 2.9%).
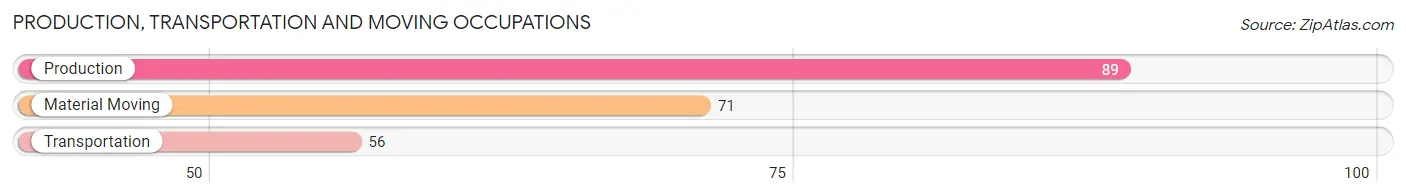
Production, Transportation and Moving Occupations by Sex
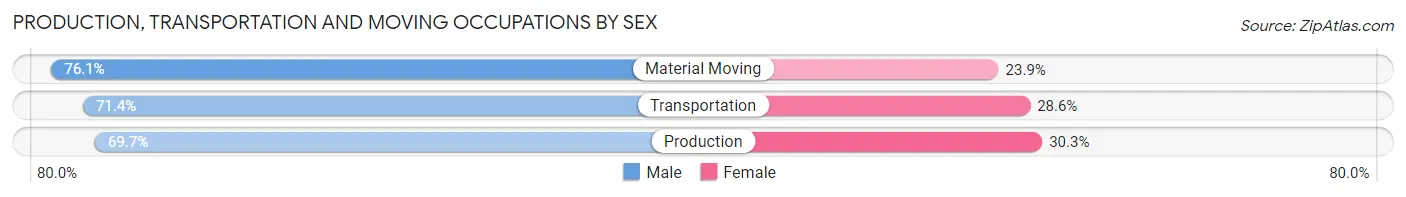
| Occupation | Male | Female |
| Production | 62 (69.7%) | 27 (30.3%) |
| Transportation | 40 (71.4%) | 16 (28.6%) |
| Material Moving | 54 (76.1%) | 17 (23.9%) |
| Total (Category) | 156 (72.2%) | 60 (27.8%) |
| Total (Overall) | 936 (48.2%) | 1,007 (51.8%) |
Employment Industries by Sex in Throop borough
Employment Industries in Throop borough
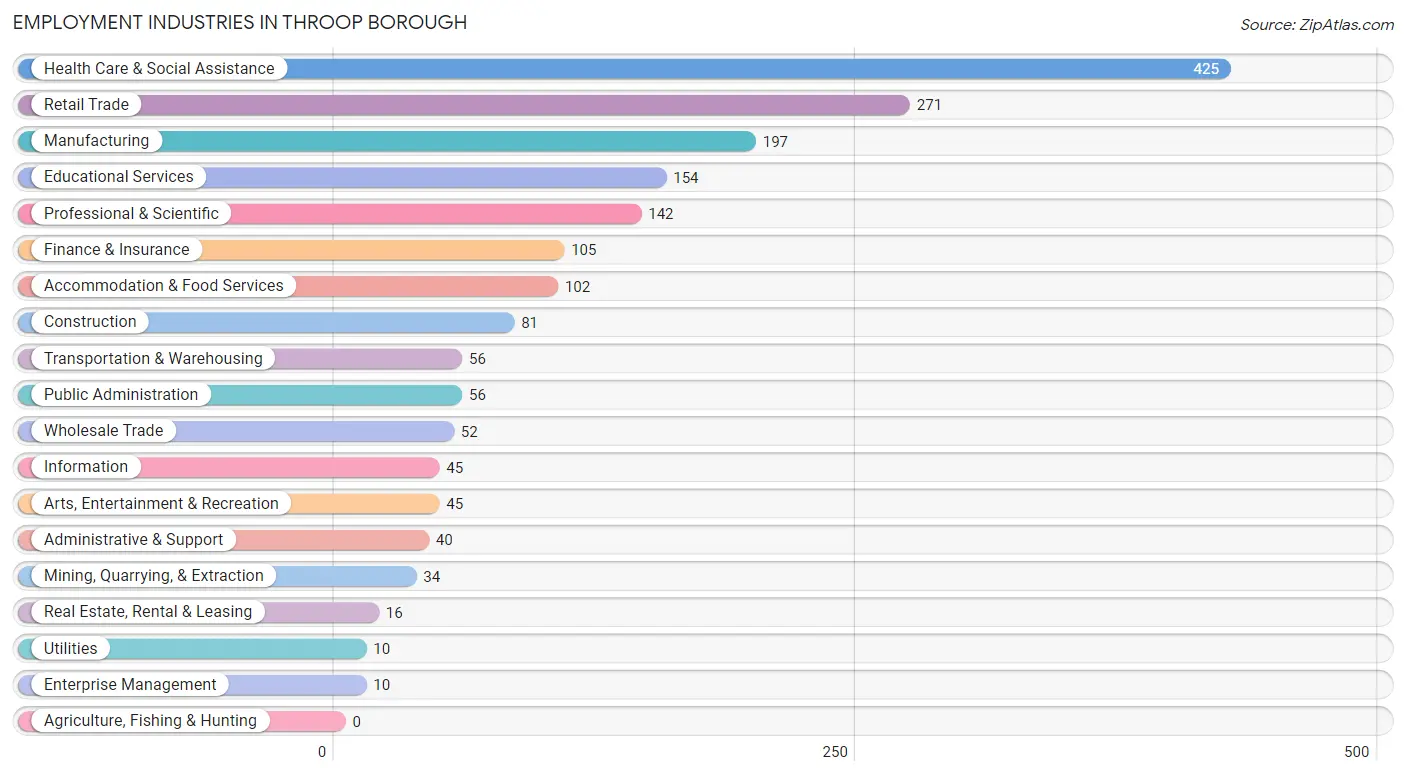
The major employment industries in Throop borough include Health Care & Social Assistance (425 | 21.9%), Retail Trade (271 | 14.0%), Manufacturing (197 | 10.1%), Educational Services (154 | 7.9%), and Professional & Scientific (142 | 7.3%).
Employment Industries by Sex in Throop borough
The Throop borough industries that see more men than women are Mining, Quarrying, & Extraction (100.0%), Construction (100.0%), and Utilities (100.0%), whereas the industries that tend to have a higher number of women are Enterprise Management (100.0%), Educational Services (86.4%), and Finance & Insurance (80.0%).
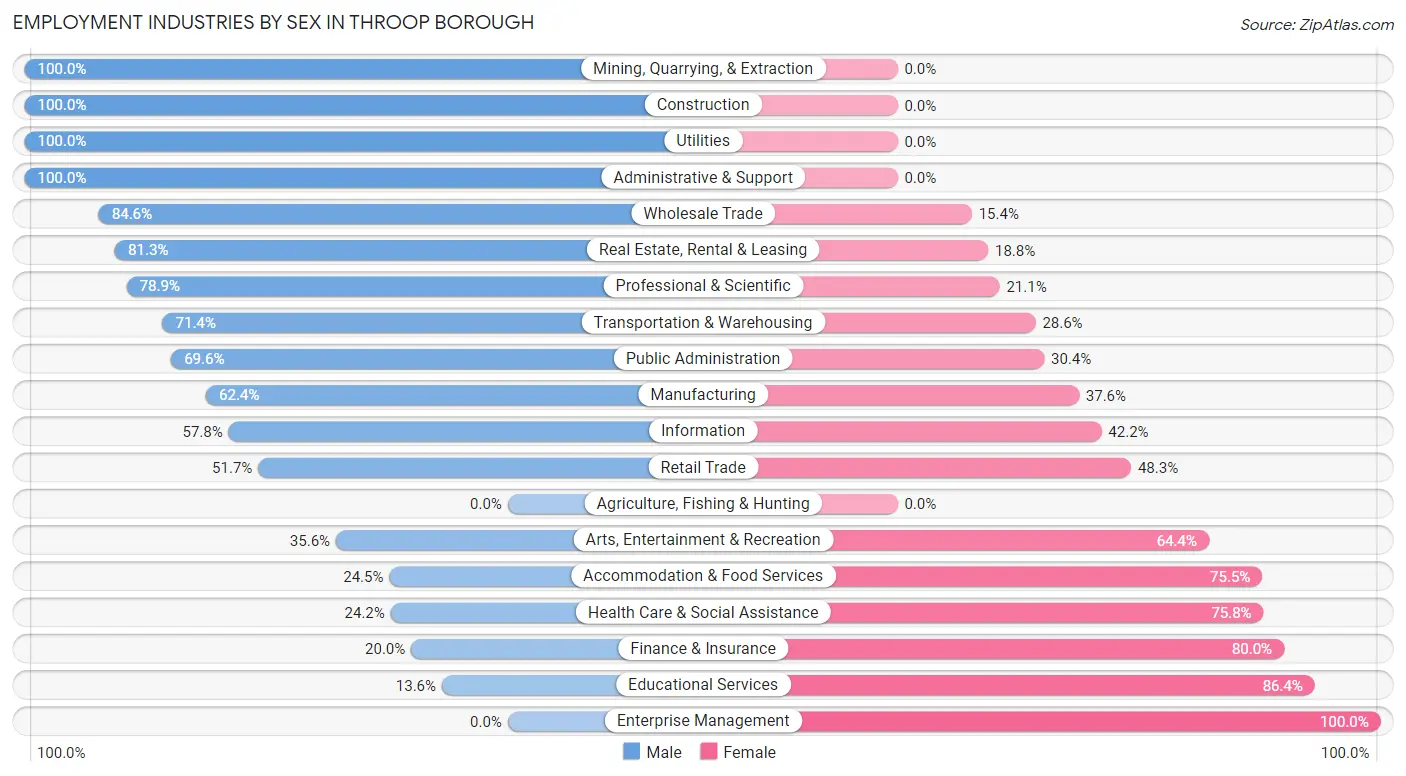
| Industry | Male | Female |
| Agriculture, Fishing & Hunting | 0 (0.0%) | 0 (0.0%) |
| Mining, Quarrying, & Extraction | 34 (100.0%) | 0 (0.0%) |
| Construction | 81 (100.0%) | 0 (0.0%) |
| Manufacturing | 123 (62.4%) | 74 (37.6%) |
| Wholesale Trade | 44 (84.6%) | 8 (15.4%) |
| Retail Trade | 140 (51.7%) | 131 (48.3%) |
| Transportation & Warehousing | 40 (71.4%) | 16 (28.6%) |
| Utilities | 10 (100.0%) | 0 (0.0%) |
| Information | 26 (57.8%) | 19 (42.2%) |
| Finance & Insurance | 21 (20.0%) | 84 (80.0%) |
| Real Estate, Rental & Leasing | 13 (81.2%) | 3 (18.8%) |
| Professional & Scientific | 112 (78.9%) | 30 (21.1%) |
| Enterprise Management | 0 (0.0%) | 10 (100.0%) |
| Administrative & Support | 40 (100.0%) | 0 (0.0%) |
| Educational Services | 21 (13.6%) | 133 (86.4%) |
| Health Care & Social Assistance | 103 (24.2%) | 322 (75.8%) |
| Arts, Entertainment & Recreation | 16 (35.6%) | 29 (64.4%) |
| Accommodation & Food Services | 25 (24.5%) | 77 (75.5%) |
| Public Administration | 39 (69.6%) | 17 (30.4%) |
| Total | 936 (48.2%) | 1,007 (51.8%) |
Education in Throop borough
School Enrollment in Throop borough
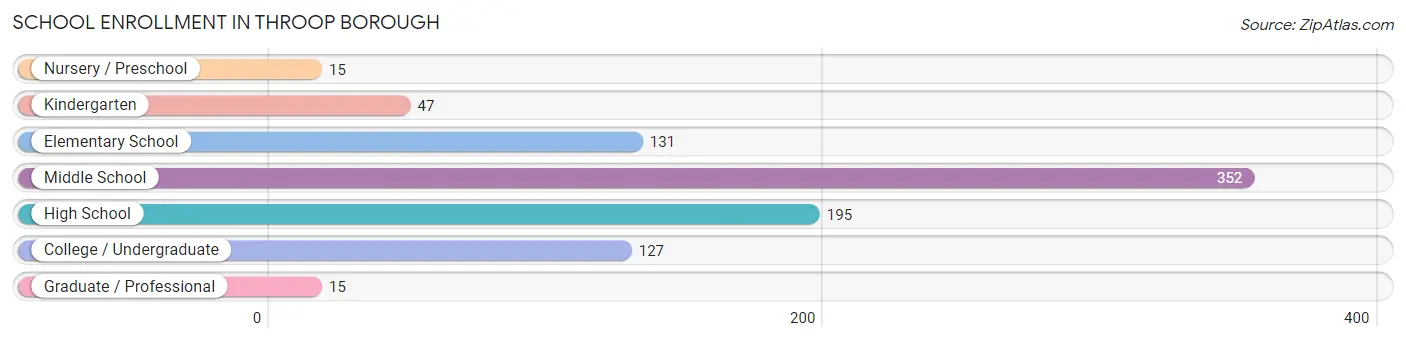
The most common levels of schooling among the 882 students in Throop borough are middle school (352 | 39.9%), high school (195 | 22.1%), and elementary school (131 | 14.8%).
| School Level | # Students | % Students |
| Nursery / Preschool | 15 | 1.7% |
| Kindergarten | 47 | 5.3% |
| Elementary School | 131 | 14.8% |
| Middle School | 352 | 39.9% |
| High School | 195 | 22.1% |
| College / Undergraduate | 127 | 14.4% |
| Graduate / Professional | 15 | 1.7% |
| Total | 882 | 100.0% |
School Enrollment by Age by Funding Source in Throop borough
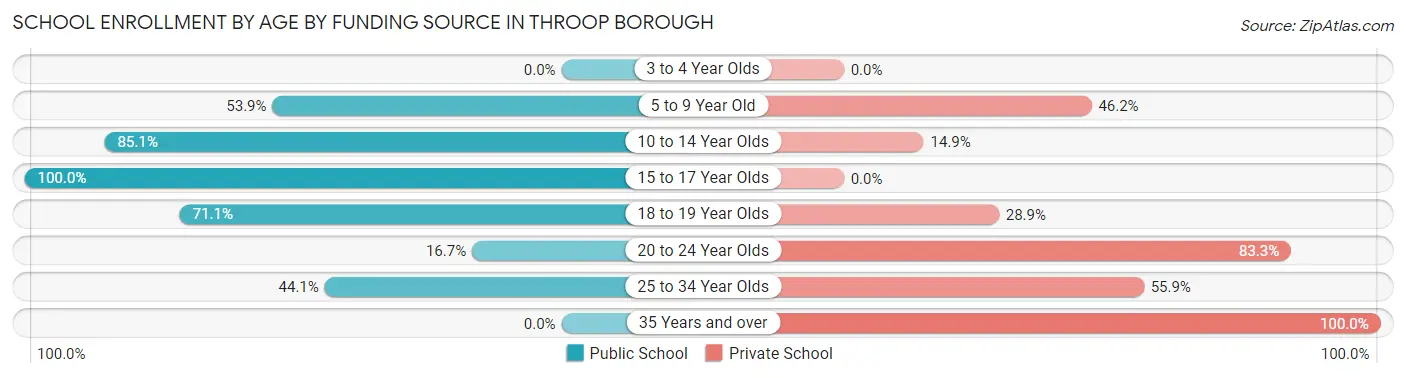
Out of a total of 882 students who are enrolled in schools in Throop borough, 261 (29.6%) attend a private institution, while the remaining 621 (70.4%) are enrolled in public schools. The age group of 35 years and over has the highest likelihood of being enrolled in private schools, with 22 (100.0% in the age bracket) enrolled. Conversely, the age group of 15 to 17 year olds has the lowest likelihood of being enrolled in a private school, with 91 (100.0% in the age bracket) attending a public institution.
| Age Bracket | Public School | Private School |
| 3 to 4 Year Olds | 0 (0.0%) | 0 (0.0%) |
| 5 to 9 Year Old | 98 (53.8%) | 84 (46.2%) |
| 10 to 14 Year Olds | 343 (85.1%) | 60 (14.9%) |
| 15 to 17 Year Olds | 91 (100.0%) | 0 (0.0%) |
| 18 to 19 Year Olds | 64 (71.1%) | 26 (28.9%) |
| 20 to 24 Year Olds | 10 (16.7%) | 50 (83.3%) |
| 25 to 34 Year Olds | 15 (44.1%) | 19 (55.9%) |
| 35 Years and over | 0 (0.0%) | 22 (100.0%) |
| Total | 621 (70.4%) | 261 (29.6%) |
Educational Attainment by Field of Study in Throop borough
Arts & humanities (156 | 24.8%), business (102 | 16.2%), communications (87 | 13.8%), education (82 | 13.0%), and science & technology (73 | 11.6%) are the most common fields of study among 630 individuals in Throop borough who have obtained a bachelor's degree or higher.
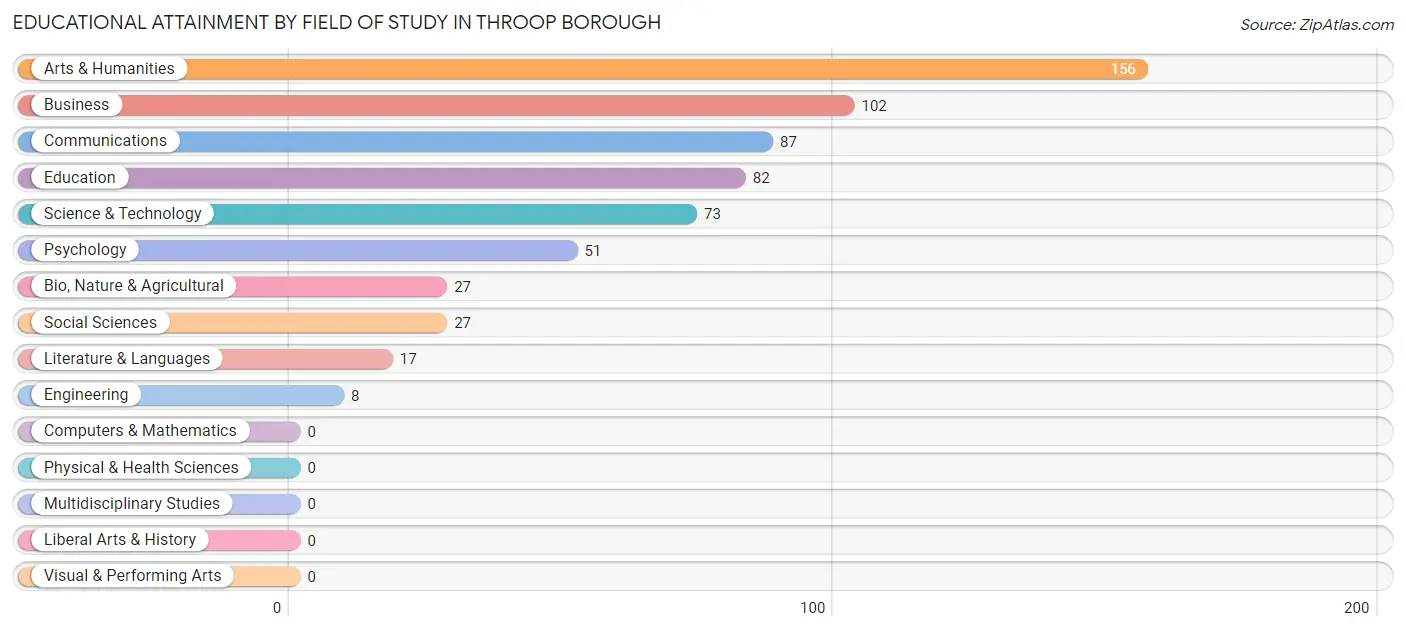
| Field of Study | # Graduates | % Graduates |
| Computers & Mathematics | 0 | 0.0% |
| Bio, Nature & Agricultural | 27 | 4.3% |
| Physical & Health Sciences | 0 | 0.0% |
| Psychology | 51 | 8.1% |
| Social Sciences | 27 | 4.3% |
| Engineering | 8 | 1.3% |
| Multidisciplinary Studies | 0 | 0.0% |
| Science & Technology | 73 | 11.6% |
| Business | 102 | 16.2% |
| Education | 82 | 13.0% |
| Literature & Languages | 17 | 2.7% |
| Liberal Arts & History | 0 | 0.0% |
| Visual & Performing Arts | 0 | 0.0% |
| Communications | 87 | 13.8% |
| Arts & Humanities | 156 | 24.8% |
| Total | 630 | 100.0% |
Transportation & Commute in Throop borough
Vehicle Availability by Sex in Throop borough
The most prevalent vehicle ownership categories in Throop borough are males with 2 vehicles (359, accounting for 39.0%) and females with 2 vehicles (467, making up 37.3%).
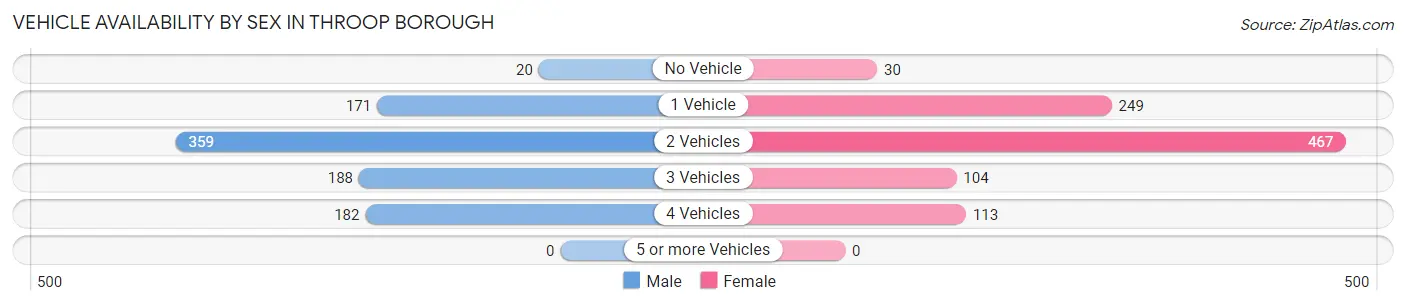
| Vehicles Available | Male | Female |
| No Vehicle | 20 (2.2%) | 30 (3.1%) |
| 1 Vehicle | 171 (18.6%) | 249 (25.9%) |
| 2 Vehicles | 359 (39.0%) | 467 (48.5%) |
| 3 Vehicles | 188 (20.4%) | 104 (10.8%) |
| 4 Vehicles | 182 (19.8%) | 113 (11.7%) |
| 5 or more Vehicles | 0 (0.0%) | 0 (0.0%) |
| Total | 920 (100.0%) | 963 (100.0%) |
Commute Time in Throop borough
The most frequently occuring commute durations in Throop borough are 15 to 19 minutes (485 commuters, 28.1%), 10 to 14 minutes (414 commuters, 24.0%), and 5 to 9 minutes (309 commuters, 17.9%).
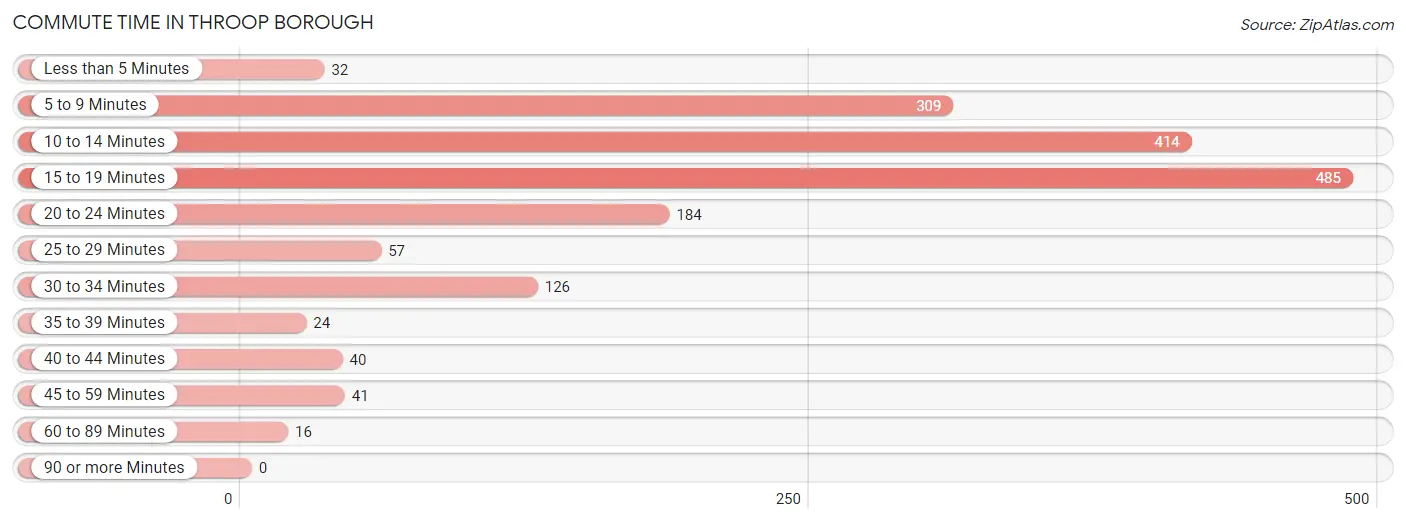
| Commute Time | # Commuters | % Commuters |
| Less than 5 Minutes | 32 | 1.8% |
| 5 to 9 Minutes | 309 | 17.9% |
| 10 to 14 Minutes | 414 | 24.0% |
| 15 to 19 Minutes | 485 | 28.1% |
| 20 to 24 Minutes | 184 | 10.6% |
| 25 to 29 Minutes | 57 | 3.3% |
| 30 to 34 Minutes | 126 | 7.3% |
| 35 to 39 Minutes | 24 | 1.4% |
| 40 to 44 Minutes | 40 | 2.3% |
| 45 to 59 Minutes | 41 | 2.4% |
| 60 to 89 Minutes | 16 | 0.9% |
| 90 or more Minutes | 0 | 0.0% |
Commute Time by Sex in Throop borough
The most common commute times in Throop borough are 15 to 19 minutes (261 commuters, 30.6%) for males and 15 to 19 minutes (224 commuters, 25.6%) for females.
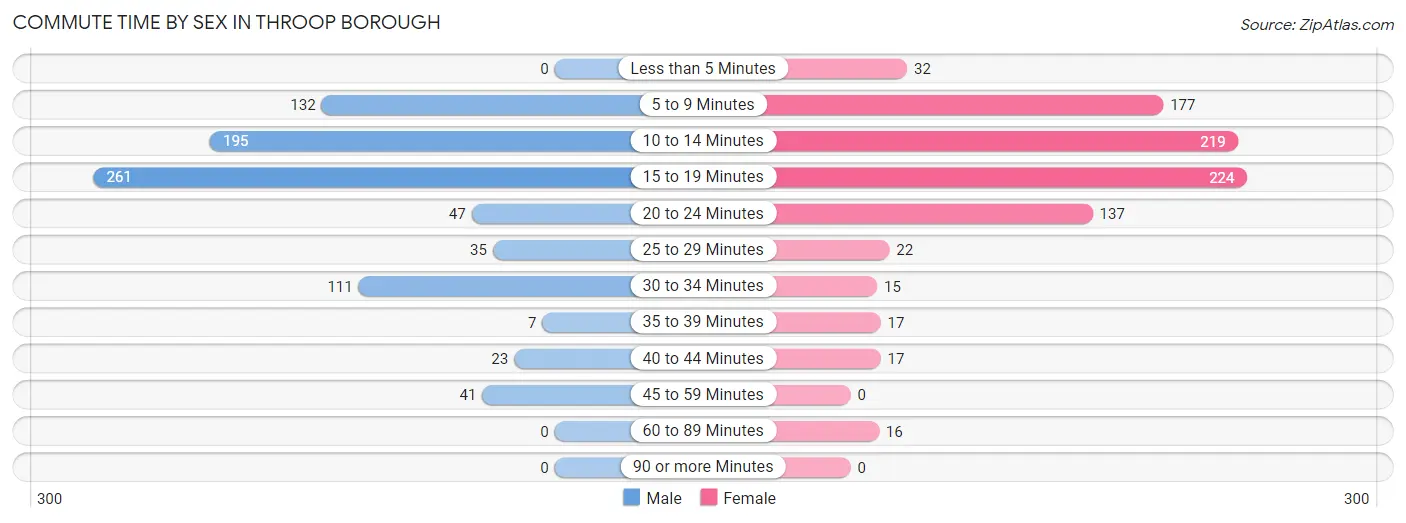
| Commute Time | Male | Female |
| Less than 5 Minutes | 0 (0.0%) | 32 (3.6%) |
| 5 to 9 Minutes | 132 (15.5%) | 177 (20.2%) |
| 10 to 14 Minutes | 195 (22.9%) | 219 (25.0%) |
| 15 to 19 Minutes | 261 (30.6%) | 224 (25.6%) |
| 20 to 24 Minutes | 47 (5.5%) | 137 (15.6%) |
| 25 to 29 Minutes | 35 (4.1%) | 22 (2.5%) |
| 30 to 34 Minutes | 111 (13.0%) | 15 (1.7%) |
| 35 to 39 Minutes | 7 (0.8%) | 17 (1.9%) |
| 40 to 44 Minutes | 23 (2.7%) | 17 (1.9%) |
| 45 to 59 Minutes | 41 (4.8%) | 0 (0.0%) |
| 60 to 89 Minutes | 0 (0.0%) | 16 (1.8%) |
| 90 or more Minutes | 0 (0.0%) | 0 (0.0%) |
Time of Departure to Work by Sex in Throop borough
The most frequent times of departure to work in Throop borough are 7:30 AM to 7:59 AM (170, 20.0%) for males and 6:30 AM to 6:59 AM (210, 24.0%) for females.
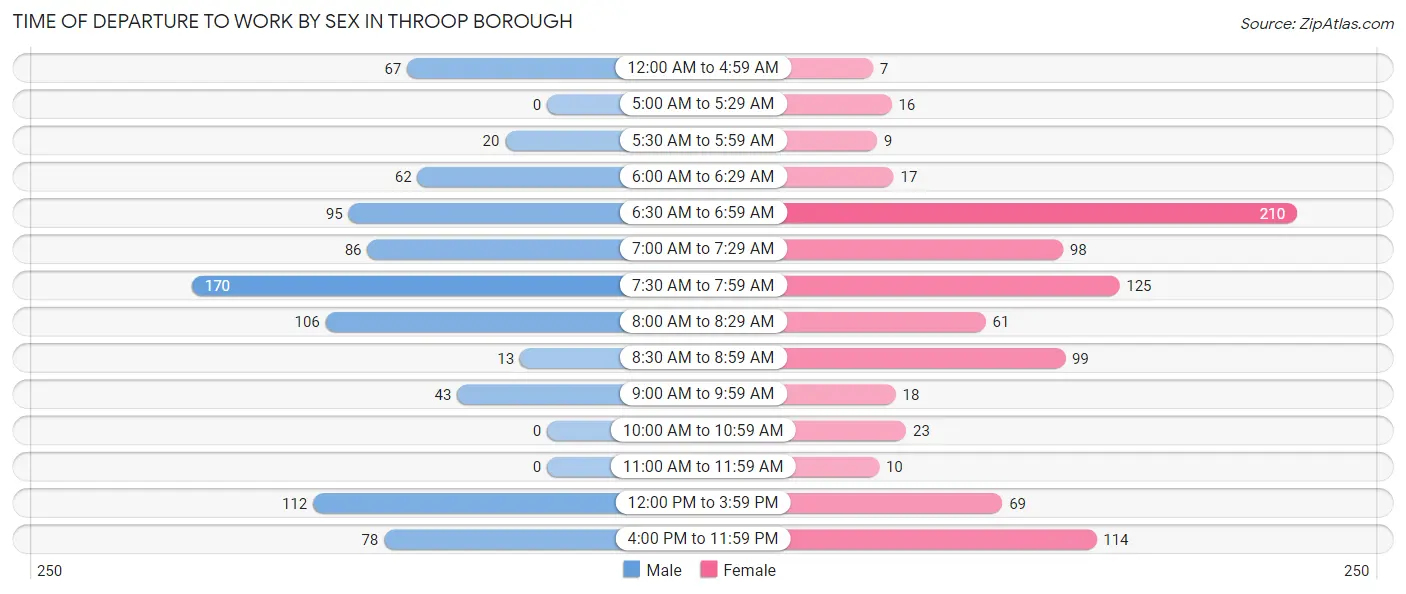
| Time of Departure | Male | Female |
| 12:00 AM to 4:59 AM | 67 (7.9%) | 7 (0.8%) |
| 5:00 AM to 5:29 AM | 0 (0.0%) | 16 (1.8%) |
| 5:30 AM to 5:59 AM | 20 (2.4%) | 9 (1.0%) |
| 6:00 AM to 6:29 AM | 62 (7.3%) | 17 (1.9%) |
| 6:30 AM to 6:59 AM | 95 (11.2%) | 210 (24.0%) |
| 7:00 AM to 7:29 AM | 86 (10.1%) | 98 (11.2%) |
| 7:30 AM to 7:59 AM | 170 (20.0%) | 125 (14.3%) |
| 8:00 AM to 8:29 AM | 106 (12.4%) | 61 (7.0%) |
| 8:30 AM to 8:59 AM | 13 (1.5%) | 99 (11.3%) |
| 9:00 AM to 9:59 AM | 43 (5.1%) | 18 (2.1%) |
| 10:00 AM to 10:59 AM | 0 (0.0%) | 23 (2.6%) |
| 11:00 AM to 11:59 AM | 0 (0.0%) | 10 (1.1%) |
| 12:00 PM to 3:59 PM | 112 (13.2%) | 69 (7.9%) |
| 4:00 PM to 11:59 PM | 78 (9.1%) | 114 (13.0%) |
| Total | 852 (100.0%) | 876 (100.0%) |
Housing Occupancy in Throop borough
Occupancy by Ownership in Throop borough
Of the total 1,829 dwellings in Throop borough, owner-occupied units account for 1,333 (72.9%), while renter-occupied units make up 496 (27.1%).
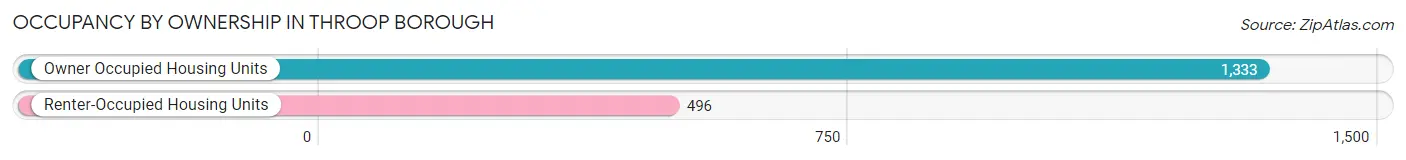
| Occupancy | # Housing Units | % Housing Units |
| Owner Occupied Housing Units | 1,333 | 72.9% |
| Renter-Occupied Housing Units | 496 | 27.1% |
| Total Occupied Housing Units | 1,829 | 100.0% |
Occupancy by Household Size in Throop borough
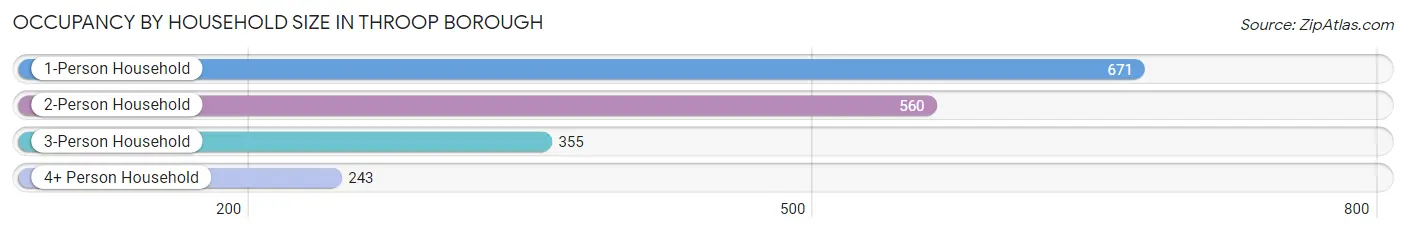
| Household Size | # Housing Units | % Housing Units |
| 1-Person Household | 671 | 36.7% |
| 2-Person Household | 560 | 30.6% |
| 3-Person Household | 355 | 19.4% |
| 4+ Person Household | 243 | 13.3% |
| Total Housing Units | 1,829 | 100.0% |
Occupancy by Ownership by Household Size in Throop borough
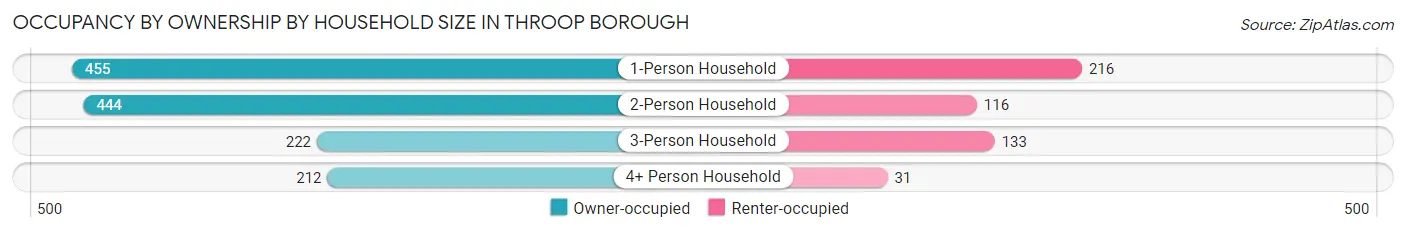
| Household Size | Owner-occupied | Renter-occupied |
| 1-Person Household | 455 (67.8%) | 216 (32.2%) |
| 2-Person Household | 444 (79.3%) | 116 (20.7%) |
| 3-Person Household | 222 (62.5%) | 133 (37.5%) |
| 4+ Person Household | 212 (87.2%) | 31 (12.8%) |
| Total Housing Units | 1,333 (72.9%) | 496 (27.1%) |
Occupancy by Educational Attainment in Throop borough
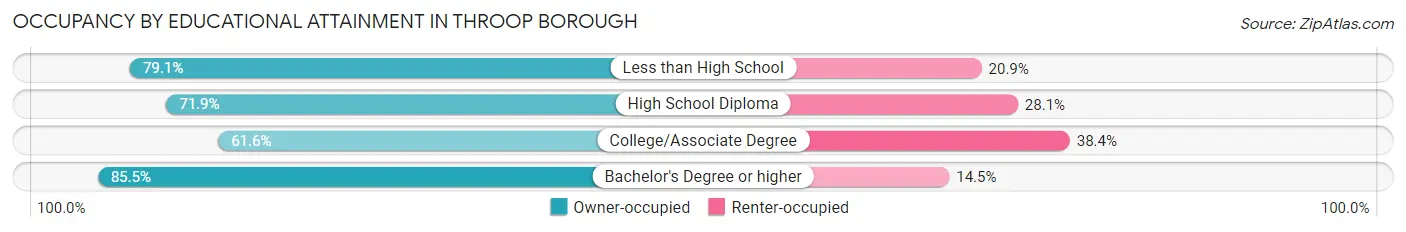
| Household Size | Owner-occupied | Renter-occupied |
| Less than High School | 140 (79.1%) | 37 (20.9%) |
| High School Diploma | 453 (71.9%) | 177 (28.1%) |
| College/Associate Degree | 345 (61.6%) | 215 (38.4%) |
| Bachelor's Degree or higher | 395 (85.5%) | 67 (14.5%) |
Occupancy by Age of Householder in Throop borough
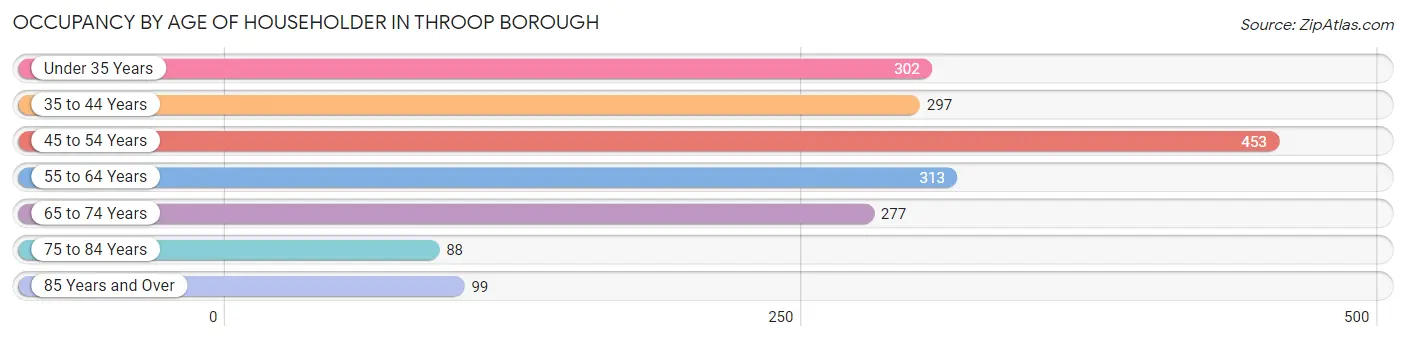
| Age Bracket | # Households | % Households |
| Under 35 Years | 302 | 16.5% |
| 35 to 44 Years | 297 | 16.2% |
| 45 to 54 Years | 453 | 24.8% |
| 55 to 64 Years | 313 | 17.1% |
| 65 to 74 Years | 277 | 15.1% |
| 75 to 84 Years | 88 | 4.8% |
| 85 Years and Over | 99 | 5.4% |
| Total | 1,829 | 100.0% |
Housing Finances in Throop borough
Median Income by Occupancy in Throop borough
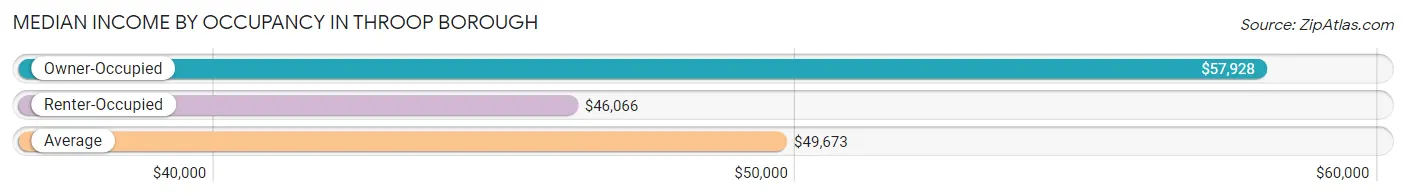
| Occupancy Type | # Households | Median Income |
| Owner-Occupied | 1,333 (72.9%) | $57,928 |
| Renter-Occupied | 496 (27.1%) | $46,066 |
| Average | 1,829 (100.0%) | $49,673 |
Occupancy by Householder Income Bracket in Throop borough
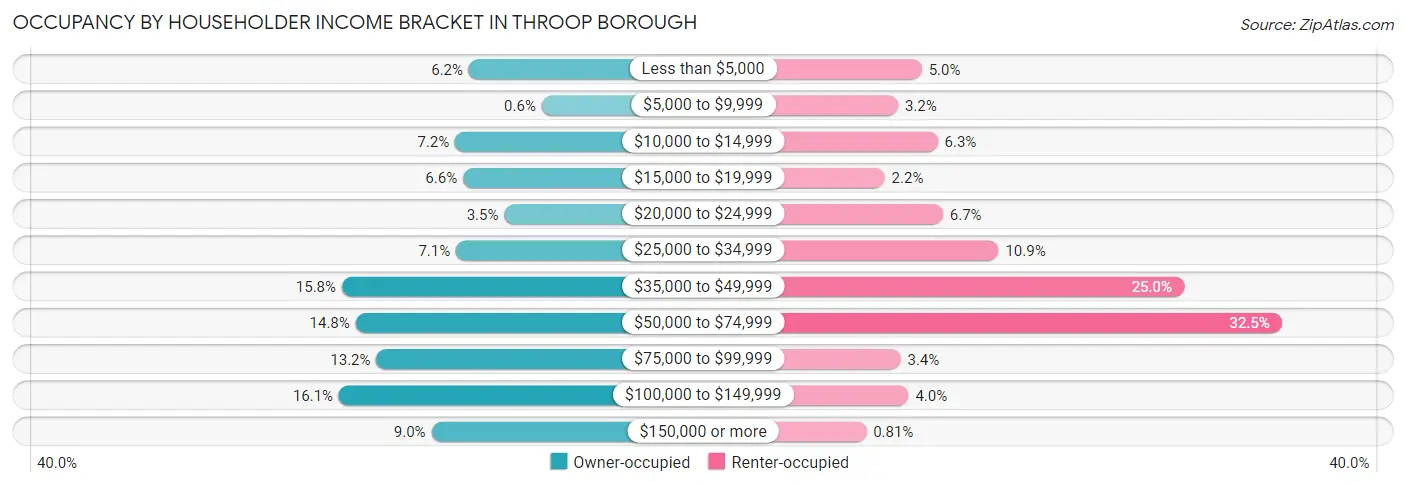
| Income Bracket | Owner-occupied | Renter-occupied |
| Less than $5,000 | 82 (6.1%) | 25 (5.0%) |
| $5,000 to $9,999 | 8 (0.6%) | 16 (3.2%) |
| $10,000 to $14,999 | 96 (7.2%) | 31 (6.2%) |
| $15,000 to $19,999 | 88 (6.6%) | 11 (2.2%) |
| $20,000 to $24,999 | 46 (3.5%) | 33 (6.7%) |
| $25,000 to $34,999 | 95 (7.1%) | 54 (10.9%) |
| $35,000 to $49,999 | 211 (15.8%) | 124 (25.0%) |
| $50,000 to $74,999 | 197 (14.8%) | 161 (32.5%) |
| $75,000 to $99,999 | 176 (13.2%) | 17 (3.4%) |
| $100,000 to $149,999 | 214 (16.1%) | 20 (4.0%) |
| $150,000 or more | 120 (9.0%) | 4 (0.8%) |
| Total | 1,333 (100.0%) | 496 (100.0%) |
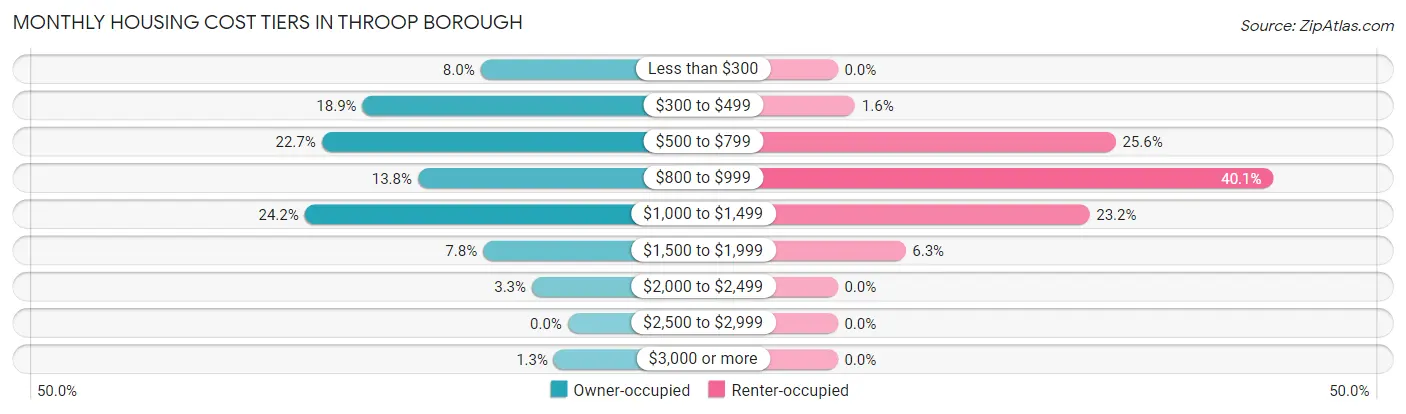
Monthly Housing Cost Tiers in Throop borough
| Monthly Cost | Owner-occupied | Renter-occupied |
| Less than $300 | 107 (8.0%) | 0 (0.0%) |
| $300 to $499 | 252 (18.9%) | 8 (1.6%) |
| $500 to $799 | 302 (22.7%) | 127 (25.6%) |
| $800 to $999 | 184 (13.8%) | 199 (40.1%) |
| $1,000 to $1,499 | 323 (24.2%) | 115 (23.2%) |
| $1,500 to $1,999 | 104 (7.8%) | 31 (6.2%) |
| $2,000 to $2,499 | 44 (3.3%) | 0 (0.0%) |
| $2,500 to $2,999 | 0 (0.0%) | 0 (0.0%) |
| $3,000 or more | 17 (1.3%) | 0 (0.0%) |
| Total | 1,333 (100.0%) | 496 (100.0%) |
Physical Housing Characteristics in Throop borough
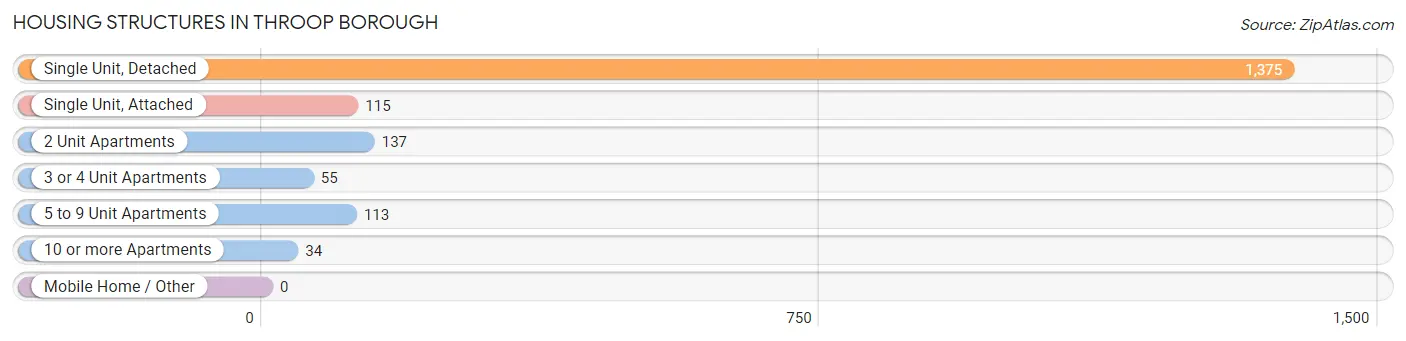
Housing Structures in Throop borough
| Structure Type | # Housing Units | % Housing Units |
| Single Unit, Detached | 1,375 | 75.2% |
| Single Unit, Attached | 115 | 6.3% |
| 2 Unit Apartments | 137 | 7.5% |
| 3 or 4 Unit Apartments | 55 | 3.0% |
| 5 to 9 Unit Apartments | 113 | 6.2% |
| 10 or more Apartments | 34 | 1.9% |
| Mobile Home / Other | 0 | 0.0% |
| Total | 1,829 | 100.0% |
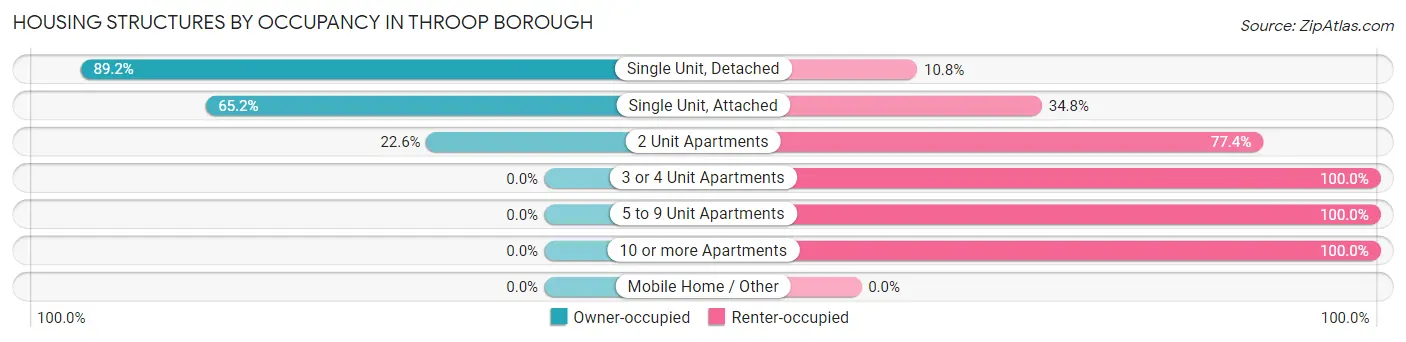
Housing Structures by Occupancy in Throop borough
| Structure Type | Owner-occupied | Renter-occupied |
| Single Unit, Detached | 1,227 (89.2%) | 148 (10.8%) |
| Single Unit, Attached | 75 (65.2%) | 40 (34.8%) |
| 2 Unit Apartments | 31 (22.6%) | 106 (77.4%) |
| 3 or 4 Unit Apartments | 0 (0.0%) | 55 (100.0%) |
| 5 to 9 Unit Apartments | 0 (0.0%) | 113 (100.0%) |
| 10 or more Apartments | 0 (0.0%) | 34 (100.0%) |
| Mobile Home / Other | 0 (0.0%) | 0 (0.0%) |
| Total | 1,333 (72.9%) | 496 (27.1%) |
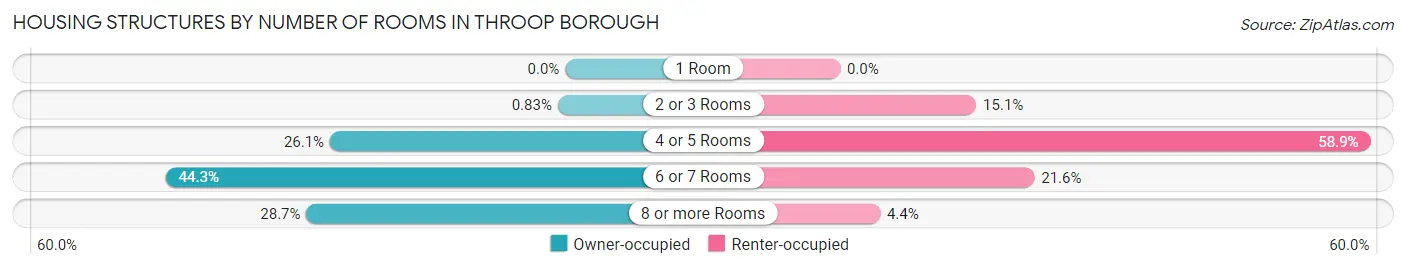
Housing Structures by Number of Rooms in Throop borough
| Number of Rooms | Owner-occupied | Renter-occupied |
| 1 Room | 0 (0.0%) | 0 (0.0%) |
| 2 or 3 Rooms | 11 (0.8%) | 75 (15.1%) |
| 4 or 5 Rooms | 348 (26.1%) | 292 (58.9%) |
| 6 or 7 Rooms | 591 (44.3%) | 107 (21.6%) |
| 8 or more Rooms | 383 (28.7%) | 22 (4.4%) |
| Total | 1,333 (100.0%) | 496 (100.0%) |
Housing Structure by Heating Type in Throop borough
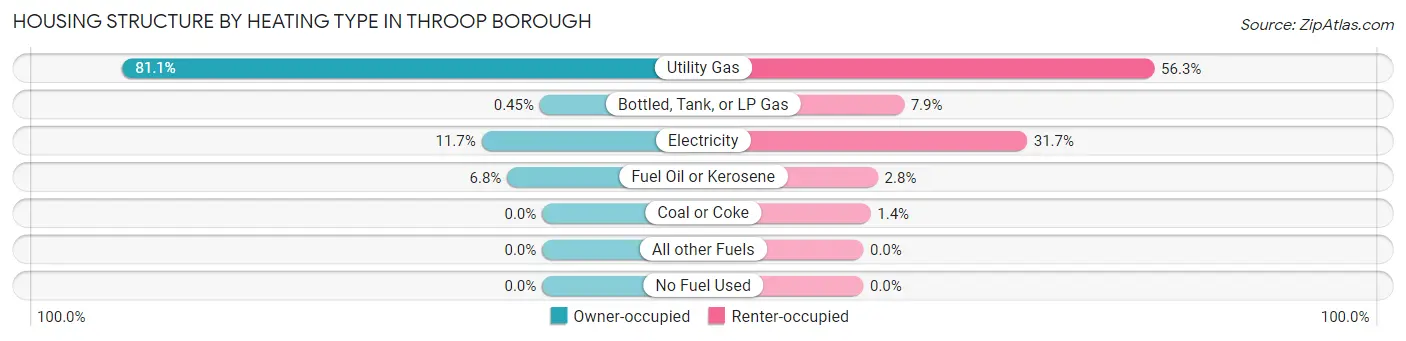
| Heating Type | Owner-occupied | Renter-occupied |
| Utility Gas | 1,081 (81.1%) | 279 (56.2%) |
| Bottled, Tank, or LP Gas | 6 (0.4%) | 39 (7.9%) |
| Electricity | 156 (11.7%) | 157 (31.7%) |
| Fuel Oil or Kerosene | 90 (6.8%) | 14 (2.8%) |
| Coal or Coke | 0 (0.0%) | 7 (1.4%) |
| All other Fuels | 0 (0.0%) | 0 (0.0%) |
| No Fuel Used | 0 (0.0%) | 0 (0.0%) |
| Total | 1,333 (100.0%) | 496 (100.0%) |
Household Vehicle Usage in Throop borough
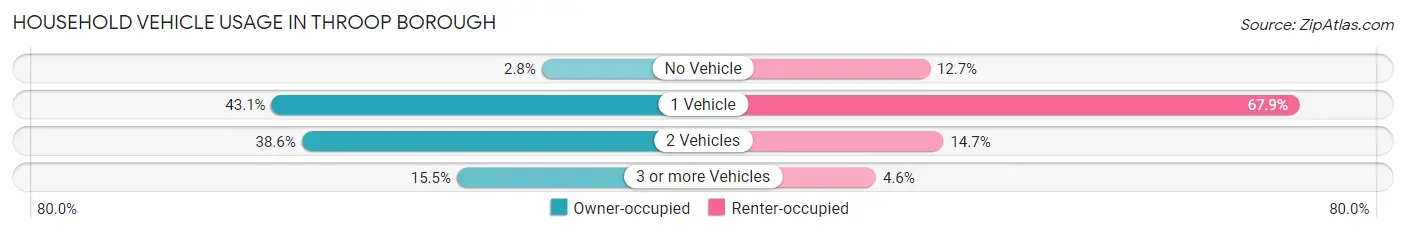
| Vehicles per Household | Owner-occupied | Renter-occupied |
| No Vehicle | 37 (2.8%) | 63 (12.7%) |
| 1 Vehicle | 575 (43.1%) | 337 (67.9%) |
| 2 Vehicles | 515 (38.6%) | 73 (14.7%) |
| 3 or more Vehicles | 206 (15.4%) | 23 (4.6%) |
| Total | 1,333 (100.0%) | 496 (100.0%) |
Real Estate & Mortgages in Throop borough
Real Estate and Mortgage Overview in Throop borough
| Characteristic | Without Mortgage | With Mortgage |
| Housing Units | 670 | 663 |
| Median Property Value | $130,800 | $174,000 |
| Median Household Income | $31,932 | $120 |
| Monthly Housing Costs | $481 | $17 |
| Real Estate Taxes | $1,461 | $0 |
Property Value by Mortgage Status in Throop borough
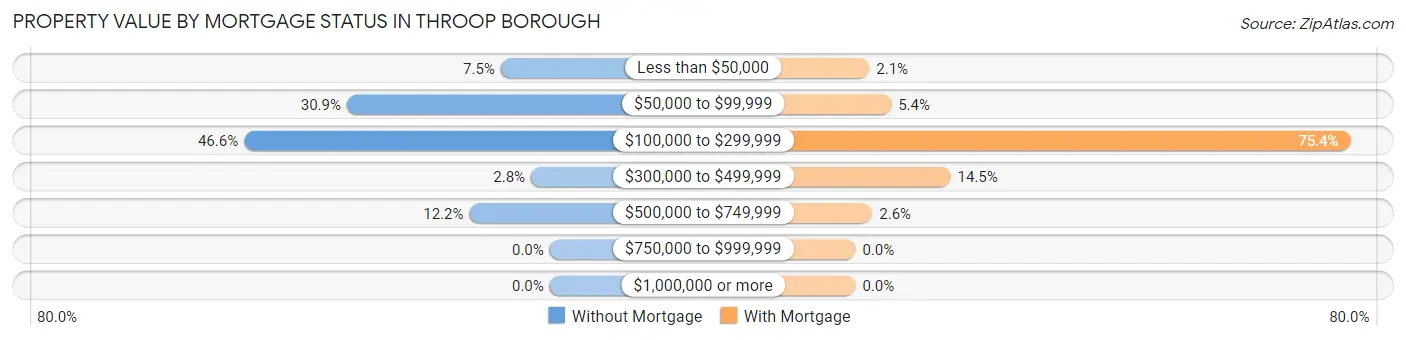
| Property Value | Without Mortgage | With Mortgage |
| Less than $50,000 | 50 (7.5%) | 14 (2.1%) |
| $50,000 to $99,999 | 207 (30.9%) | 36 (5.4%) |
| $100,000 to $299,999 | 312 (46.6%) | 500 (75.4%) |
| $300,000 to $499,999 | 19 (2.8%) | 96 (14.5%) |
| $500,000 to $749,999 | 82 (12.2%) | 17 (2.6%) |
| $750,000 to $999,999 | 0 (0.0%) | 0 (0.0%) |
| $1,000,000 or more | 0 (0.0%) | 0 (0.0%) |
| Total | 670 (100.0%) | 663 (100.0%) |
Household Income by Mortgage Status in Throop borough
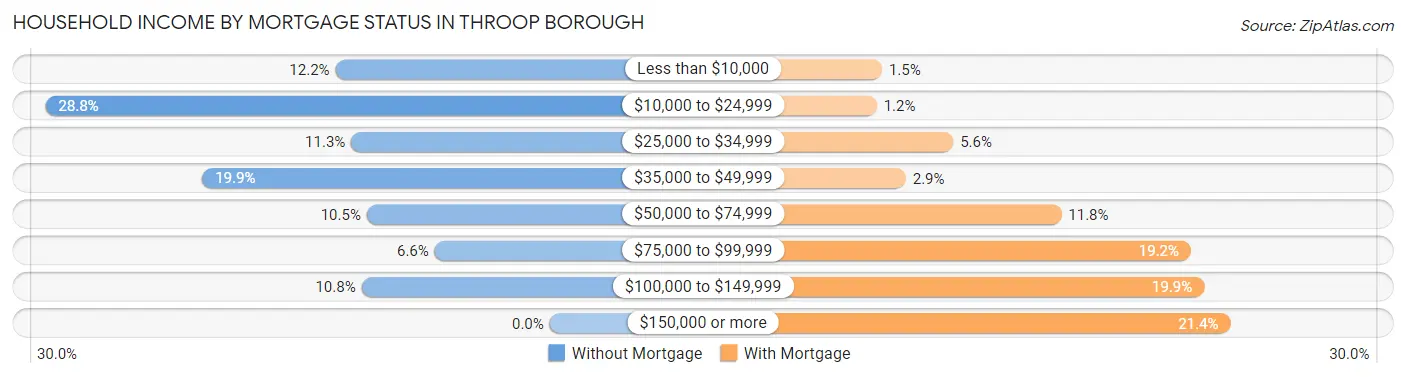
| Household Income | Without Mortgage | With Mortgage |
| Less than $10,000 | 82 (12.2%) | 10 (1.5%) |
| $10,000 to $24,999 | 193 (28.8%) | 8 (1.2%) |
| $25,000 to $34,999 | 76 (11.3%) | 37 (5.6%) |
| $35,000 to $49,999 | 133 (19.9%) | 19 (2.9%) |
| $50,000 to $74,999 | 70 (10.4%) | 78 (11.8%) |
| $75,000 to $99,999 | 44 (6.6%) | 127 (19.2%) |
| $100,000 to $149,999 | 72 (10.7%) | 132 (19.9%) |
| $150,000 or more | 0 (0.0%) | 142 (21.4%) |
| Total | 670 (100.0%) | 663 (100.0%) |
Property Value to Household Income Ratio in Throop borough
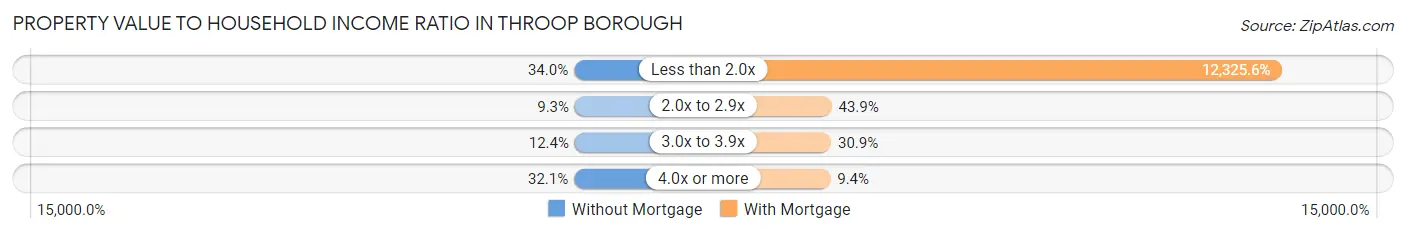
| Value-to-Income Ratio | Without Mortgage | With Mortgage |
| Less than 2.0x | 228 (34.0%) | 81,719 (12,325.6%) |
| 2.0x to 2.9x | 62 (9.2%) | 291 (43.9%) |
| 3.0x to 3.9x | 83 (12.4%) | 205 (30.9%) |
| 4.0x or more | 215 (32.1%) | 62 (9.3%) |
| Total | 670 (100.0%) | 663 (100.0%) |
Real Estate Taxes by Mortgage Status in Throop borough
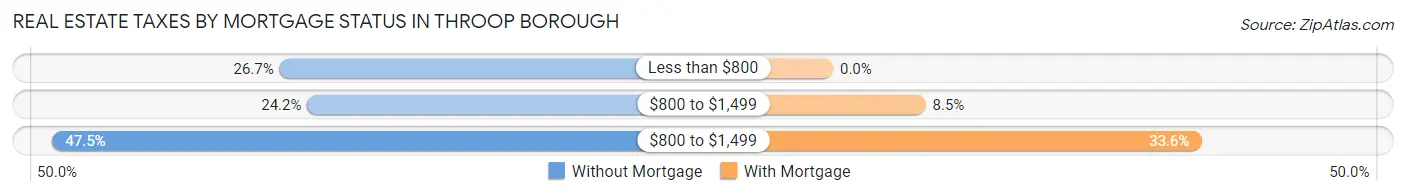
| Property Taxes | Without Mortgage | With Mortgage |
| Less than $800 | 179 (26.7%) | 0 (0.0%) |
| $800 to $1,499 | 162 (24.2%) | 56 (8.5%) |
| $800 to $1,499 | 318 (47.5%) | 223 (33.6%) |
| Total | 670 (100.0%) | 663 (100.0%) |
Health & Disability in Throop borough
Health Insurance Coverage by Age in Throop borough
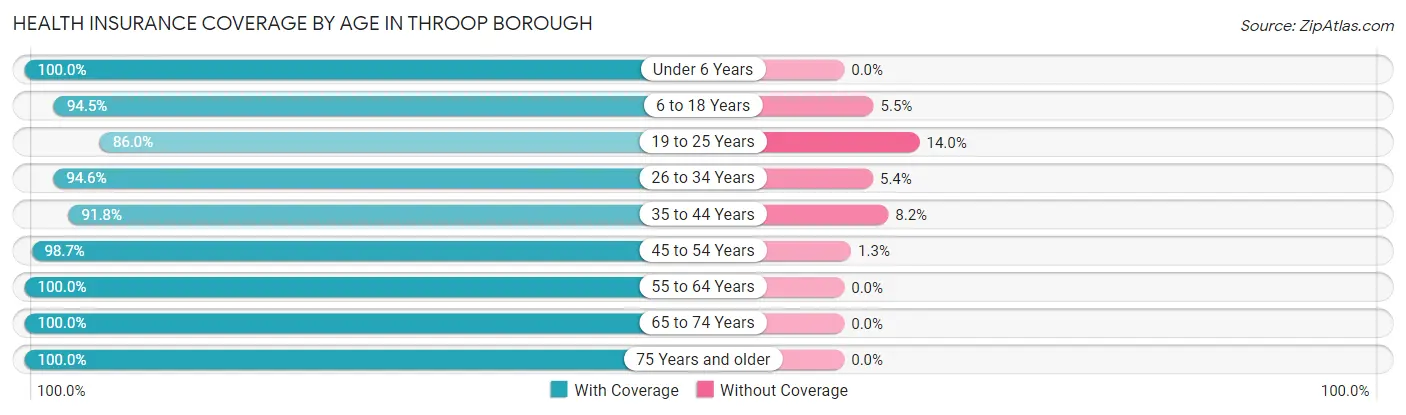
| Age Bracket | With Coverage | Without Coverage |
| Under 6 Years | 142 (100.0%) | 0 (0.0%) |
| 6 to 18 Years | 691 (94.5%) | 40 (5.5%) |
| 19 to 25 Years | 202 (86.0%) | 33 (14.0%) |
| 26 to 34 Years | 530 (94.6%) | 30 (5.4%) |
| 35 to 44 Years | 447 (91.8%) | 40 (8.2%) |
| 45 to 54 Years | 692 (98.7%) | 9 (1.3%) |
| 55 to 64 Years | 426 (100.0%) | 0 (0.0%) |
| 65 to 74 Years | 419 (100.0%) | 0 (0.0%) |
| 75 Years and older | 361 (100.0%) | 0 (0.0%) |
| Total | 3,910 (96.3%) | 152 (3.7%) |
Health Insurance Coverage by Citizenship Status in Throop borough
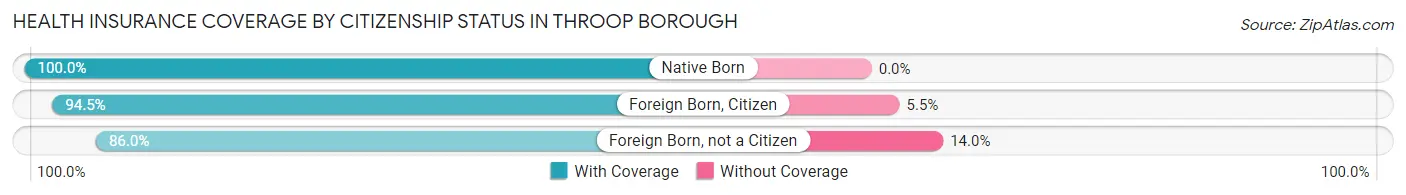
| Citizenship Status | With Coverage | Without Coverage |
| Native Born | 142 (100.0%) | 0 (0.0%) |
| Foreign Born, Citizen | 691 (94.5%) | 40 (5.5%) |
| Foreign Born, not a Citizen | 202 (86.0%) | 33 (14.0%) |
Health Insurance Coverage by Household Income in Throop borough
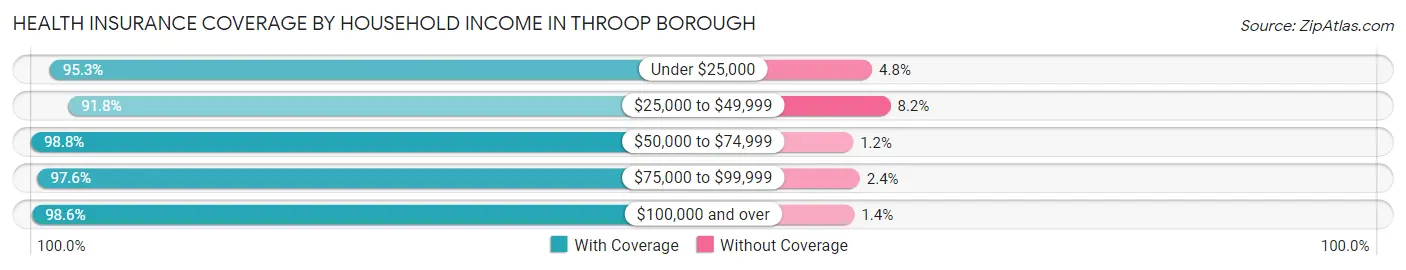
| Household Income | With Coverage | Without Coverage |
| Under $25,000 | 561 (95.3%) | 28 (4.8%) |
| $25,000 to $49,999 | 951 (91.8%) | 85 (8.2%) |
| $50,000 to $74,999 | 738 (98.8%) | 9 (1.2%) |
| $75,000 to $99,999 | 559 (97.6%) | 14 (2.4%) |
| $100,000 and over | 1,096 (98.6%) | 16 (1.4%) |
Public vs Private Health Insurance Coverage by Age in Throop borough
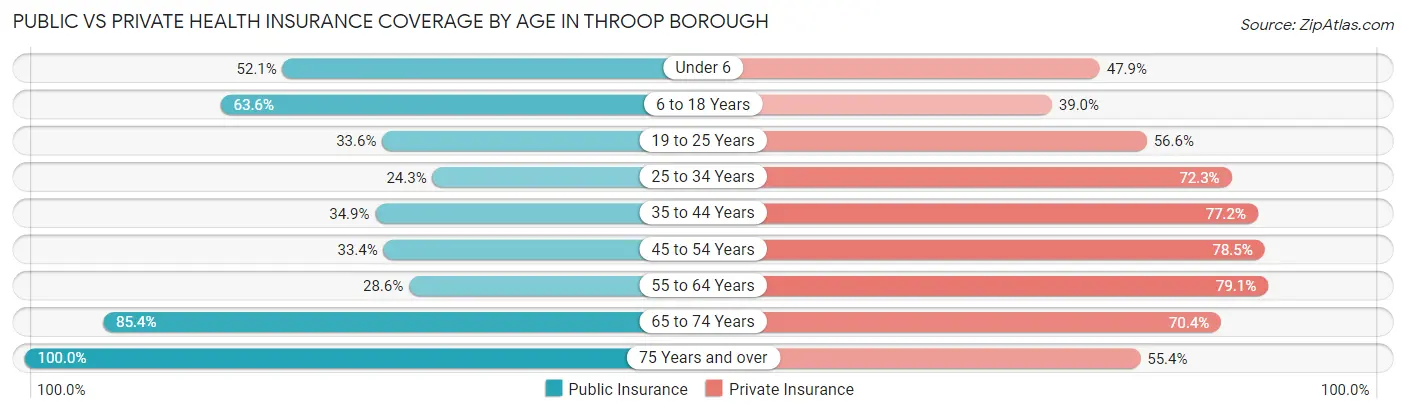
| Age Bracket | Public Insurance | Private Insurance |
| Under 6 | 74 (52.1%) | 68 (47.9%) |
| 6 to 18 Years | 465 (63.6%) | 285 (39.0%) |
| 19 to 25 Years | 79 (33.6%) | 133 (56.6%) |
| 25 to 34 Years | 136 (24.3%) | 405 (72.3%) |
| 35 to 44 Years | 170 (34.9%) | 376 (77.2%) |
| 45 to 54 Years | 234 (33.4%) | 550 (78.5%) |
| 55 to 64 Years | 122 (28.6%) | 337 (79.1%) |
| 65 to 74 Years | 358 (85.4%) | 295 (70.4%) |
| 75 Years and over | 361 (100.0%) | 200 (55.4%) |
| Total | 1,999 (49.2%) | 2,649 (65.2%) |
Disability Status by Sex by Age in Throop borough
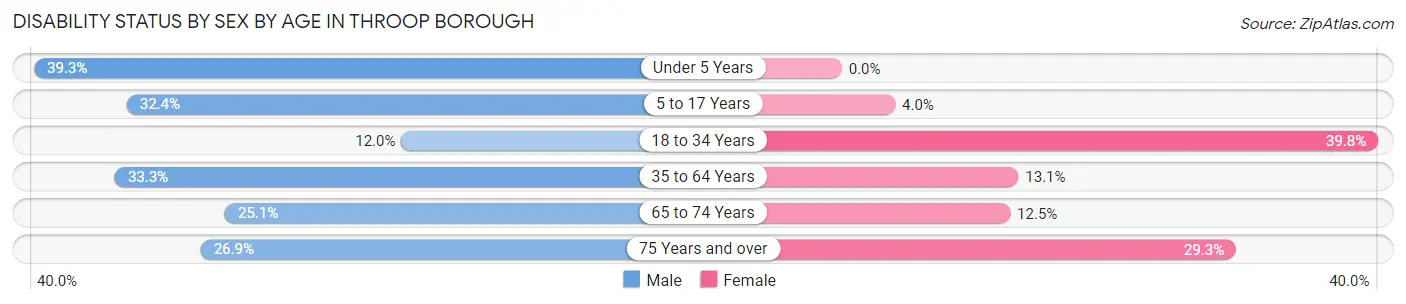
| Age Bracket | Male | Female |
| Under 5 Years | 11 (39.3%) | 0 (0.0%) |
| 5 to 17 Years | 129 (32.4%) | 11 (4.0%) |
| 18 to 34 Years | 58 (12.0%) | 164 (39.8%) |
| 35 to 64 Years | 263 (33.3%) | 108 (13.1%) |
| 65 to 74 Years | 51 (25.1%) | 27 (12.5%) |
| 75 Years and over | 42 (26.9%) | 60 (29.3%) |
Disability Class by Sex by Age in Throop borough
Disability Class: Hearing Difficulty
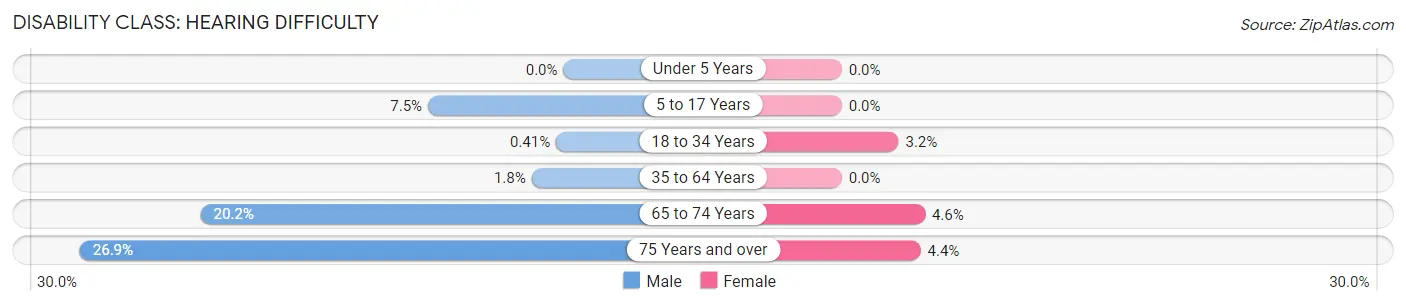
| Age Bracket | Male | Female |
| Under 5 Years | 0 (0.0%) | 0 (0.0%) |
| 5 to 17 Years | 30 (7.5%) | 0 (0.0%) |
| 18 to 34 Years | 2 (0.4%) | 13 (3.2%) |
| 35 to 64 Years | 14 (1.8%) | 0 (0.0%) |
| 65 to 74 Years | 41 (20.2%) | 10 (4.6%) |
| 75 Years and over | 42 (26.9%) | 9 (4.4%) |
Disability Class: Vision Difficulty
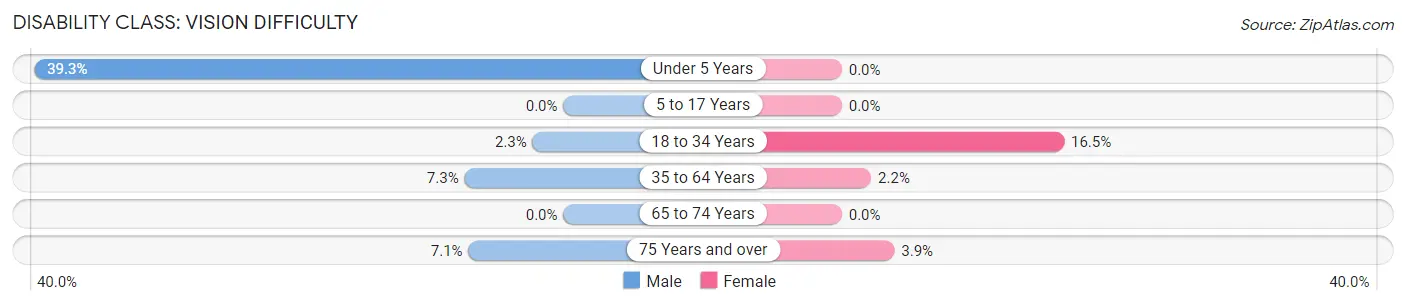
| Age Bracket | Male | Female |
| Under 5 Years | 11 (39.3%) | 0 (0.0%) |
| 5 to 17 Years | 0 (0.0%) | 0 (0.0%) |
| 18 to 34 Years | 11 (2.3%) | 68 (16.5%) |
| 35 to 64 Years | 58 (7.3%) | 18 (2.2%) |
| 65 to 74 Years | 0 (0.0%) | 0 (0.0%) |
| 75 Years and over | 11 (7.0%) | 8 (3.9%) |
Disability Class: Cognitive Difficulty
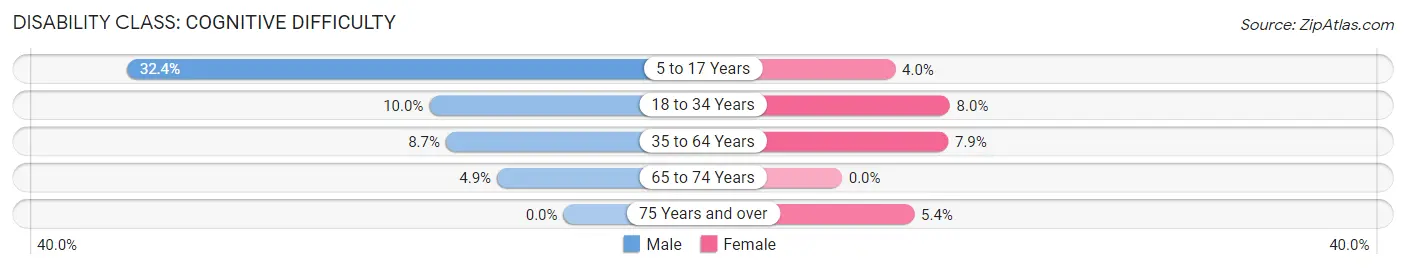
| Age Bracket | Male | Female |
| 5 to 17 Years | 129 (32.4%) | 11 (4.0%) |
| 18 to 34 Years | 48 (10.0%) | 33 (8.0%) |
| 35 to 64 Years | 69 (8.7%) | 65 (7.9%) |
| 65 to 74 Years | 10 (4.9%) | 0 (0.0%) |
| 75 Years and over | 0 (0.0%) | 11 (5.4%) |
Disability Class: Ambulatory Difficulty
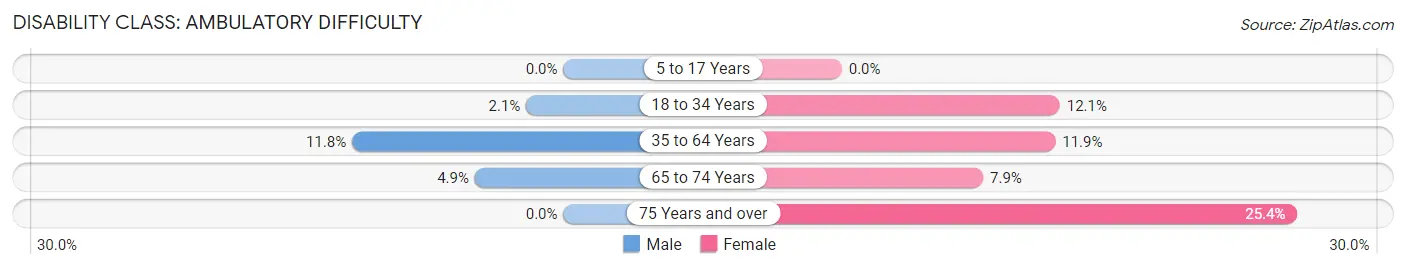
| Age Bracket | Male | Female |
| 5 to 17 Years | 0 (0.0%) | 0 (0.0%) |
| 18 to 34 Years | 10 (2.1%) | 50 (12.1%) |
| 35 to 64 Years | 93 (11.8%) | 98 (11.9%) |
| 65 to 74 Years | 10 (4.9%) | 17 (7.9%) |
| 75 Years and over | 0 (0.0%) | 52 (25.4%) |
Disability Class: Self-Care Difficulty
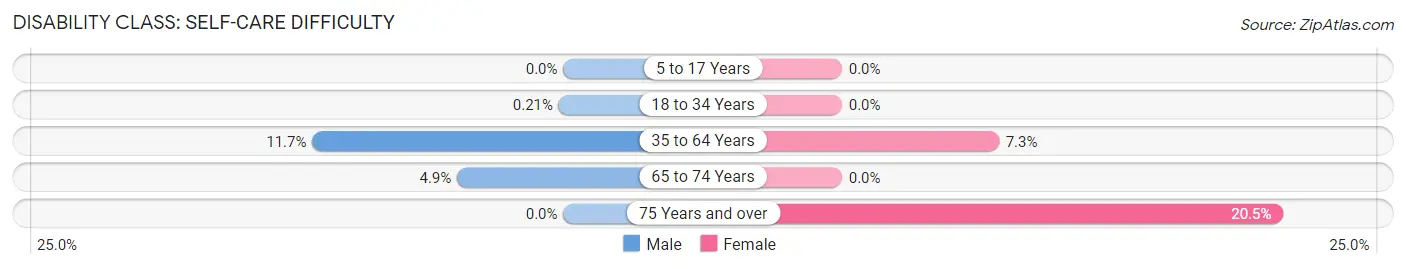
| Age Bracket | Male | Female |
| 5 to 17 Years | 0 (0.0%) | 0 (0.0%) |
| 18 to 34 Years | 1 (0.2%) | 0 (0.0%) |
| 35 to 64 Years | 92 (11.7%) | 60 (7.3%) |
| 65 to 74 Years | 10 (4.9%) | 0 (0.0%) |
| 75 Years and over | 0 (0.0%) | 42 (20.5%) |
Technology Access in Throop borough
Computing Device Access in Throop borough
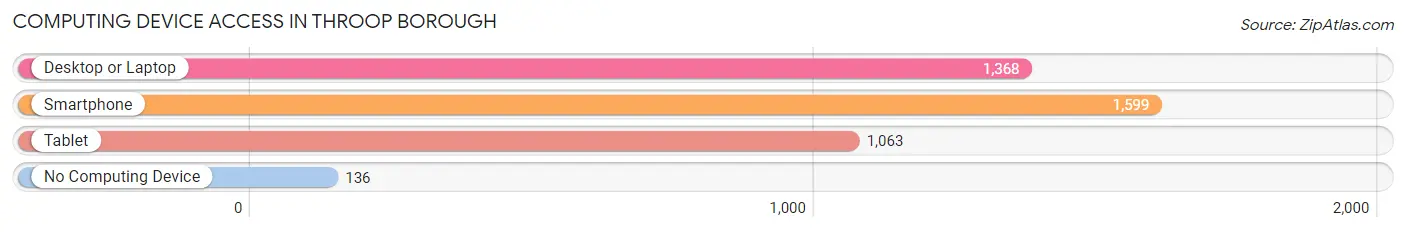
| Device Type | # Households | % Households |
| Desktop or Laptop | 1,368 | 74.8% |
| Smartphone | 1,599 | 87.4% |
| Tablet | 1,063 | 58.1% |
| No Computing Device | 136 | 7.4% |
| Total | 1,829 | 100.0% |
Internet Access in Throop borough
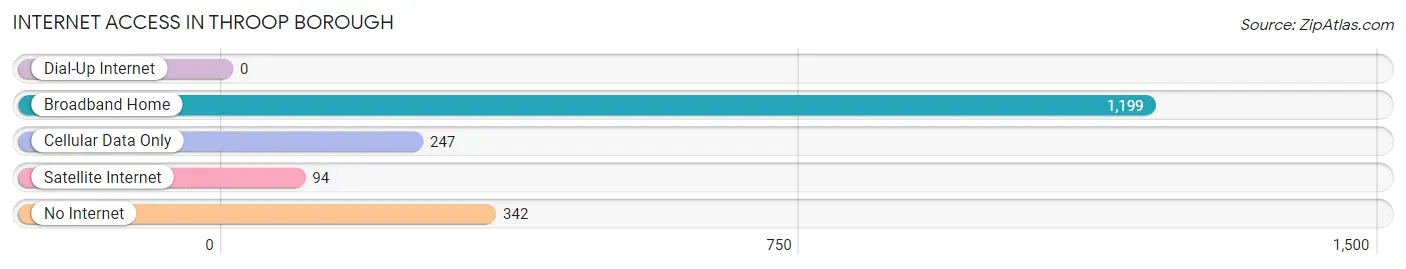
| Internet Type | # Households | % Households |
| Dial-Up Internet | 0 | 0.0% |
| Broadband Home | 1,199 | 65.5% |
| Cellular Data Only | 247 | 13.5% |
| Satellite Internet | 94 | 5.1% |
| No Internet | 342 | 18.7% |
| Total | 1,829 | 100.0% |
Throop borough Summary
Throop Borough is a small borough located in Lackawanna County, Pennsylvania. It is situated in the heart of the Pocono Mountains and is home to a population of approximately 2,000 people. The borough is bordered by the townships of Covington, Roaring Brook, and Jefferson.
History
Throop Borough was founded in 1845 by a group of settlers from Throop, New York. The settlers were attracted to the area due to its abundance of natural resources, including timber, coal, and iron ore. The borough was named after the original settlers’ hometown of Throop, New York.
The borough was incorporated in 1851 and quickly became a thriving industrial center. The Lackawanna Iron and Coal Company was established in 1853 and quickly became the largest employer in the area. The company operated several mines and factories in the area, providing employment for many of the borough’s residents.
The borough also became a popular tourist destination in the late 19th century. The Lackawanna Valley Railroad provided easy access to the area, and the borough became a popular destination for outdoor recreation. The borough was also home to several resorts, including the Lackawanna Hotel and the Hotel Throop.
Geography
Throop Borough is located in the heart of the Pocono Mountains in northeastern Pennsylvania. The borough is situated in the Lackawanna Valley, which is surrounded by the Pocono Mountains to the north and the Endless Mountains to the south. The borough is bordered by the townships of Covington, Roaring Brook, and Jefferson.
The borough is located at an elevation of 1,400 feet above sea level and covers an area of 1.2 square miles. The borough is located approximately 20 miles from Scranton and is accessible via Interstate 81 and the Lackawanna Valley Railroad.
Economy
The economy of Throop Borough is largely based on tourism and manufacturing. The borough is home to several resorts, including the Lackawanna Hotel and the Hotel Throop. The borough is also home to several manufacturing companies, including the Lackawanna Iron and Coal Company.
The borough is also home to several small businesses, including restaurants, retail stores, and service providers. The borough is also home to several educational institutions, including the Lackawanna College and the University of Scranton.
Demographics
As of the 2010 census, the population of Throop Borough was 2,000. The racial makeup of the borough was 97.5% White, 0.5% African American, 0.5% Native American, 0.5% Asian, and 1.0% from other races. Hispanic or Latino of any race were 1.5% of the population.
The median household income in the borough was $41,250, and the median family income was $50,000. The per capita income in the borough was $20,000. Approximately 10.5% of the population was below the poverty line.
Common Questions
What is Per Capita Income in Throop borough?
Per Capita income in Throop borough is $30,234.
What is the Median Family Income in Throop borough?
Median Family Income in Throop borough is $66,250.
What is the Median Household income in Throop borough?
Median Household Income in Throop borough is $49,673.
What is Income or Wage Gap in Throop borough?
Income or Wage Gap in Throop borough is 12.0%.
Women in Throop borough earn 88.0 cents for every dollar earned by a man.
What is Inequality or Gini Index in Throop borough?
Inequality or Gini Index in Throop borough is 0.45.
What is the Total Population of Throop borough?
Total Population of Throop borough is 4,062.
What is the Total Male Population of Throop borough?
Total Male Population of Throop borough is 2,057.
What is the Total Female Population of Throop borough?
Total Female Population of Throop borough is 2,005.
What is the Ratio of Males per 100 Females in Throop borough?
There are 102.59 Males per 100 Females in Throop borough.
What is the Ratio of Females per 100 Males in Throop borough?
There are 97.47 Females per 100 Males in Throop borough.
What is the Median Population Age in Throop borough?
Median Population Age in Throop borough is 40.6 Years.
What is the Average Family Size in Throop borough
Average Family Size in Throop borough is 2.9 People.
What is the Average Household Size in Throop borough
Average Household Size in Throop borough is 2.2 People.
How Large is the Labor Force in Throop borough?
There are 1,996 People in the Labor Forcein in Throop borough.
What is the Percentage of People in the Labor Force in Throop borough?
59.8% of People are in the Labor Force in Throop borough.
What is the Unemployment Rate in Throop borough?
Unemployment Rate in Throop borough is 2.7%.