Paxtonia, PA Map & Demographics
Paxtonia Map
Paxtonia Overview
$38,914
PER CAPITA INCOME
$81,534
AVG FAMILY INCOME
$81,113
AVG HOUSEHOLD INCOME
32.1%
WAGE / INCOME GAP [ % ]
67.9¢/ $1
WAGE / INCOME GAP [ $ ]
0.39
INEQUALITY / GINI INDEX
5,480
TOTAL POPULATION
2,549
MALE POPULATION
2,931
FEMALE POPULATION
86.97
MALES / 100 FEMALES
114.99
FEMALES / 100 MALES
43.2
MEDIAN AGE
3.1
AVG FAMILY SIZE
2.5
AVG HOUSEHOLD SIZE
2,887
LABOR FORCE [ PEOPLE ]
63.6%
PERCENT IN LABOR FORCE
2.8%
UNEMPLOYMENT RATE
Paxtonia Area Codes
Income in Paxtonia
Income Overview in Paxtonia
Per Capita Income in Paxtonia is $38,914, while median incomes of families and households are $81,534 and $81,113 respectively.
| Characteristic | Number | Measure |
| Per Capita Income | 5,480 | $38,914 |
| Median Family Income | 1,521 | $81,534 |
| Mean Family Income | 1,521 | $107,617 |
| Median Household Income | 2,164 | $81,113 |
| Mean Household Income | 2,164 | $96,383 |
| Income Deficit | 1,521 | $0 |
| Wage / Income Gap (%) | 5,480 | 32.12% |
| Wage / Income Gap ($) | 5,480 | 67.88¢ per $1 |
| Gini / Inequality Index | 5,480 | 0.39 |
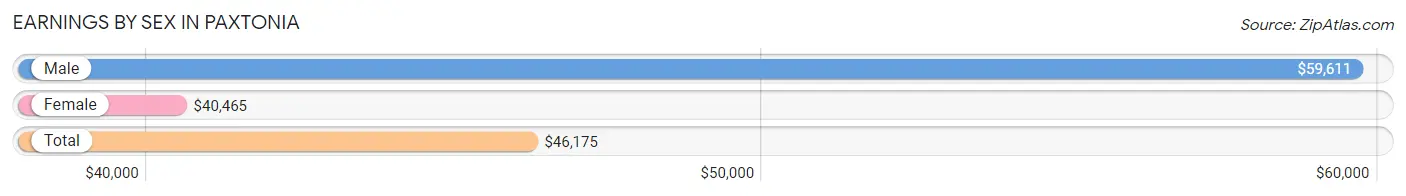
Earnings by Sex in Paxtonia
Average Earnings in Paxtonia are $46,175, $59,611 for men and $40,465 for women, a difference of 32.1%.
| Sex | Number | Average Earnings |
| Male | 1,310 (44.6%) | $59,611 |
| Female | 1,627 (55.4%) | $40,465 |
| Total | 2,937 (100.0%) | $46,175 |
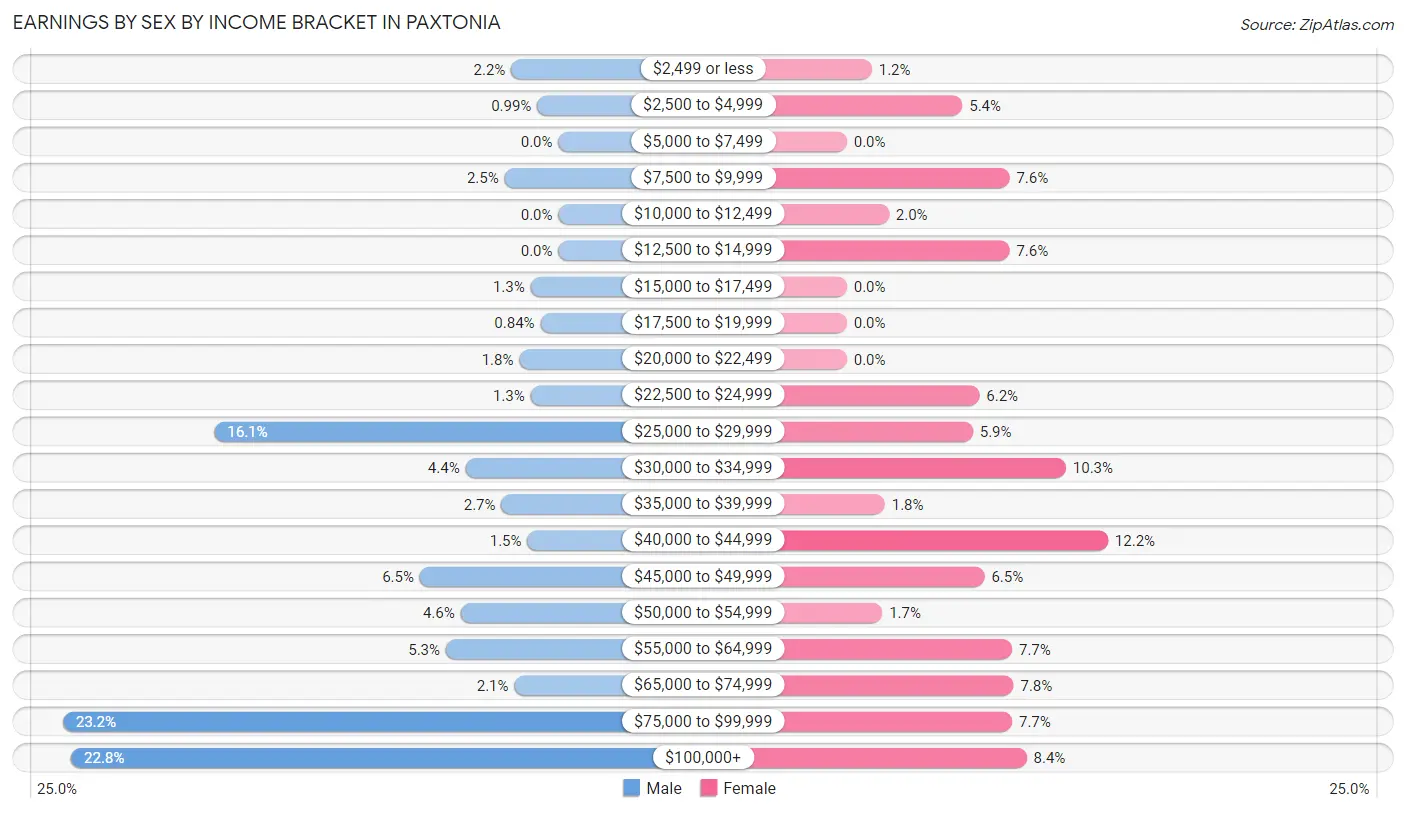
Earnings by Sex by Income Bracket in Paxtonia
The most common earnings brackets in Paxtonia are $75,000 to $99,999 for men (304 | 23.2%) and $40,000 to $44,999 for women (199 | 12.2%).
| Income | Male | Female |
| $2,499 or less | 29 (2.2%) | 19 (1.2%) |
| $2,500 to $4,999 | 13 (1.0%) | 88 (5.4%) |
| $5,000 to $7,499 | 0 (0.0%) | 0 (0.0%) |
| $7,500 to $9,999 | 33 (2.5%) | 124 (7.6%) |
| $10,000 to $12,499 | 0 (0.0%) | 32 (2.0%) |
| $12,500 to $14,999 | 0 (0.0%) | 124 (7.6%) |
| $15,000 to $17,499 | 17 (1.3%) | 0 (0.0%) |
| $17,500 to $19,999 | 11 (0.8%) | 0 (0.0%) |
| $20,000 to $22,499 | 24 (1.8%) | 0 (0.0%) |
| $22,500 to $24,999 | 17 (1.3%) | 101 (6.2%) |
| $25,000 to $29,999 | 211 (16.1%) | 96 (5.9%) |
| $30,000 to $34,999 | 57 (4.3%) | 167 (10.3%) |
| $35,000 to $39,999 | 35 (2.7%) | 29 (1.8%) |
| $40,000 to $44,999 | 19 (1.5%) | 199 (12.2%) |
| $45,000 to $49,999 | 85 (6.5%) | 105 (6.5%) |
| $50,000 to $54,999 | 60 (4.6%) | 27 (1.7%) |
| $55,000 to $64,999 | 69 (5.3%) | 126 (7.7%) |
| $65,000 to $74,999 | 27 (2.1%) | 127 (7.8%) |
| $75,000 to $99,999 | 304 (23.2%) | 126 (7.7%) |
| $100,000+ | 299 (22.8%) | 137 (8.4%) |
| Total | 1,310 (100.0%) | 1,627 (100.0%) |
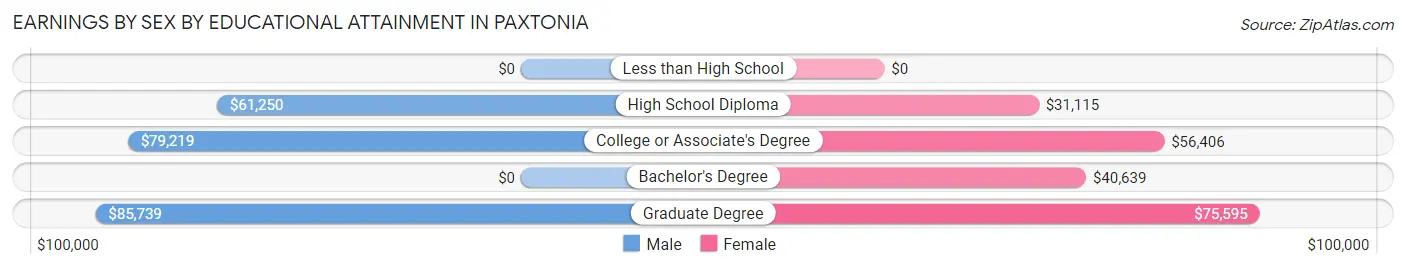
Earnings by Sex by Educational Attainment in Paxtonia
Average earnings in Paxtonia are $64,531 for men and $41,514 for women, a difference of 35.7%. Men with an educational attainment of graduate degree enjoy the highest average annual earnings of $85,739, while those with high school diploma education earn the least with $61,250. Women with an educational attainment of graduate degree earn the most with the average annual earnings of $75,595, while those with high school diploma education have the smallest earnings of $31,115.
| Educational Attainment | Male Income | Female Income |
| Less than High School | - | - |
| High School Diploma | $61,250 | $31,115 |
| College or Associate's Degree | $79,219 | $56,406 |
| Bachelor's Degree | - | - |
| Graduate Degree | $85,739 | $75,595 |
| Total | $64,531 | $41,514 |
Family Income in Paxtonia
Family Income Brackets in Paxtonia
According to the Paxtonia family income data, there are 265 families falling into the $75,000 to $99,999 income range, which is the most common income bracket and makes up 17.4% of all families.
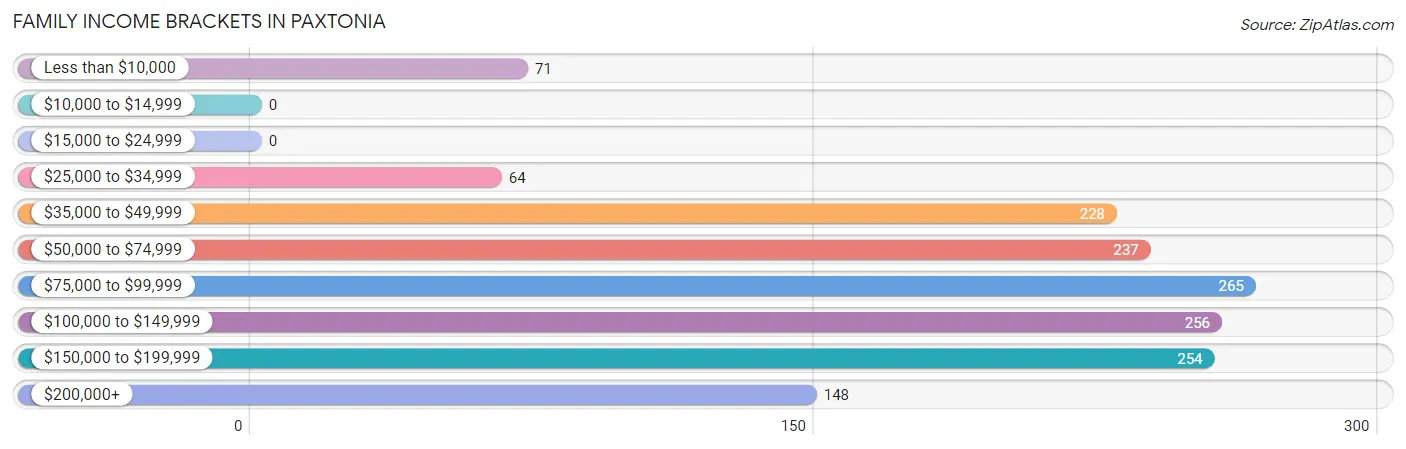
| Income Bracket | # Families | % Families |
| Less than $10,000 | 71 | 4.7% |
| $10,000 to $14,999 | 0 | 0.0% |
| $15,000 to $24,999 | 0 | 0.0% |
| $25,000 to $34,999 | 64 | 4.2% |
| $35,000 to $49,999 | 228 | 15.0% |
| $50,000 to $74,999 | 237 | 15.6% |
| $75,000 to $99,999 | 265 | 17.4% |
| $100,000 to $149,999 | 256 | 16.8% |
| $150,000 to $199,999 | 254 | 16.7% |
| $200,000+ | 148 | 9.7% |
Family Income by Famaliy Size in Paxtonia
4-person families (280 | 18.4%) account for the highest median family income in Paxtonia with $148,258 per family, while 2-person families (646 | 42.5%) have the highest median income of $40,188 per family member.
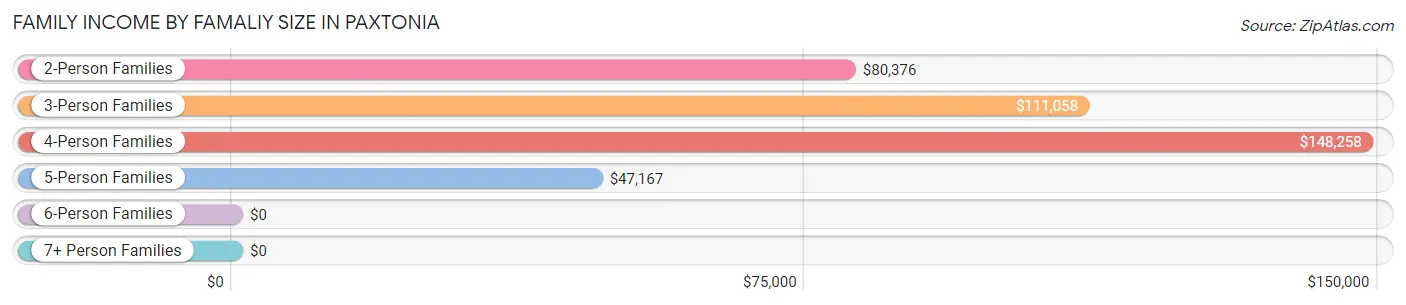
| Income Bracket | # Families | Median Income |
| 2-Person Families | 646 (42.5%) | $80,376 |
| 3-Person Families | 361 (23.7%) | $111,058 |
| 4-Person Families | 280 (18.4%) | $148,258 |
| 5-Person Families | 208 (13.7%) | $47,167 |
| 6-Person Families | 0 (0.0%) | $0 |
| 7+ Person Families | 26 (1.7%) | $0 |
| Total | 1,521 (100.0%) | $81,534 |
Family Income by Number of Earners in Paxtonia
The median family income in Paxtonia is $81,534, with families comprising 3+ earners (194) having the highest median family income of $151,842, while families with no earners (216) have the lowest median family income of $37,500, accounting for 12.8% and 14.2% of families, respectively.
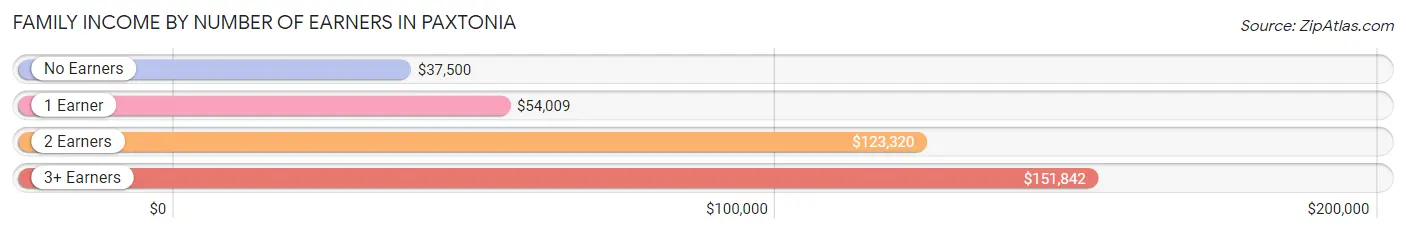
| Number of Earners | # Families | Median Income |
| No Earners | 216 (14.2%) | $37,500 |
| 1 Earner | 506 (33.3%) | $54,009 |
| 2 Earners | 605 (39.8%) | $123,320 |
| 3+ Earners | 194 (12.8%) | $151,842 |
| Total | 1,521 (100.0%) | $81,534 |
Household Income in Paxtonia
Household Income Brackets in Paxtonia
With 446 households falling in the category, the $75,000 to $99,999 income range is the most frequent in Paxtonia, accounting for 20.6% of all households. In contrast, only 13 households (0.6%) fall into the $10,000 to $14,999 income bracket, making it the least populous group.
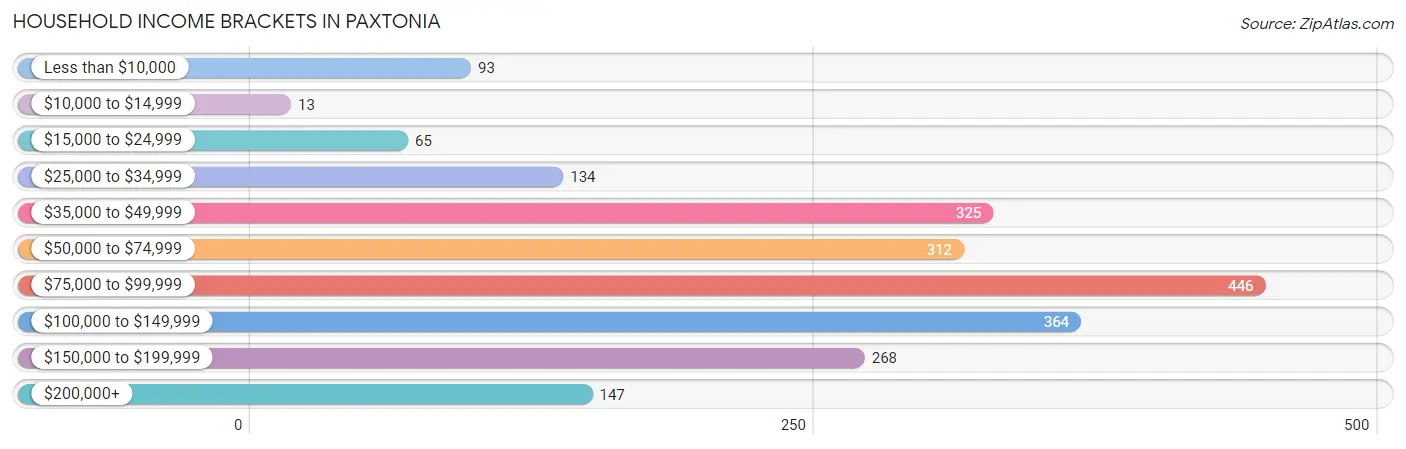
| Income Bracket | # Households | % Households |
| Less than $10,000 | 93 | 4.3% |
| $10,000 to $14,999 | 13 | 0.6% |
| $15,000 to $24,999 | 65 | 3.0% |
| $25,000 to $34,999 | 134 | 6.2% |
| $35,000 to $49,999 | 325 | 15.0% |
| $50,000 to $74,999 | 312 | 14.4% |
| $75,000 to $99,999 | 446 | 20.6% |
| $100,000 to $149,999 | 364 | 16.8% |
| $150,000 to $199,999 | 268 | 12.4% |
| $200,000+ | 147 | 6.8% |
Household Income by Householder Age in Paxtonia
The median household income in Paxtonia is $81,113, with the highest median household income of $95,048 found in the 25 to 44 years age bracket for the primary householder. A total of 737 households (34.1%) fall into this category.
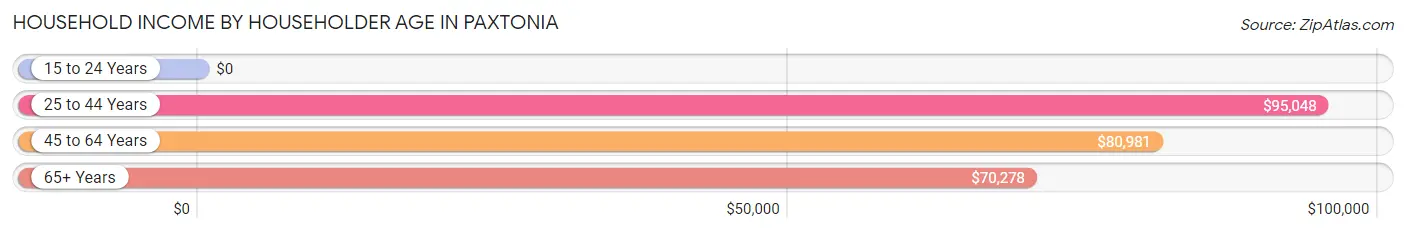
| Income Bracket | # Households | Median Income |
| 15 to 24 Years | 0 (0.0%) | $0 |
| 25 to 44 Years | 737 (34.1%) | $95,048 |
| 45 to 64 Years | 983 (45.4%) | $80,981 |
| 65+ Years | 444 (20.5%) | $70,278 |
| Total | 2,164 (100.0%) | $81,113 |
Poverty in Paxtonia
Income Below Poverty by Sex and Age in Paxtonia
With 4.8% poverty level for males and 5.9% for females among the residents of Paxtonia, 35 to 44 year old males and under 5 year old females are the most vulnerable to poverty, with 53 males (14.6%) and 51 females (85.0%) in their respective age groups living below the poverty level.
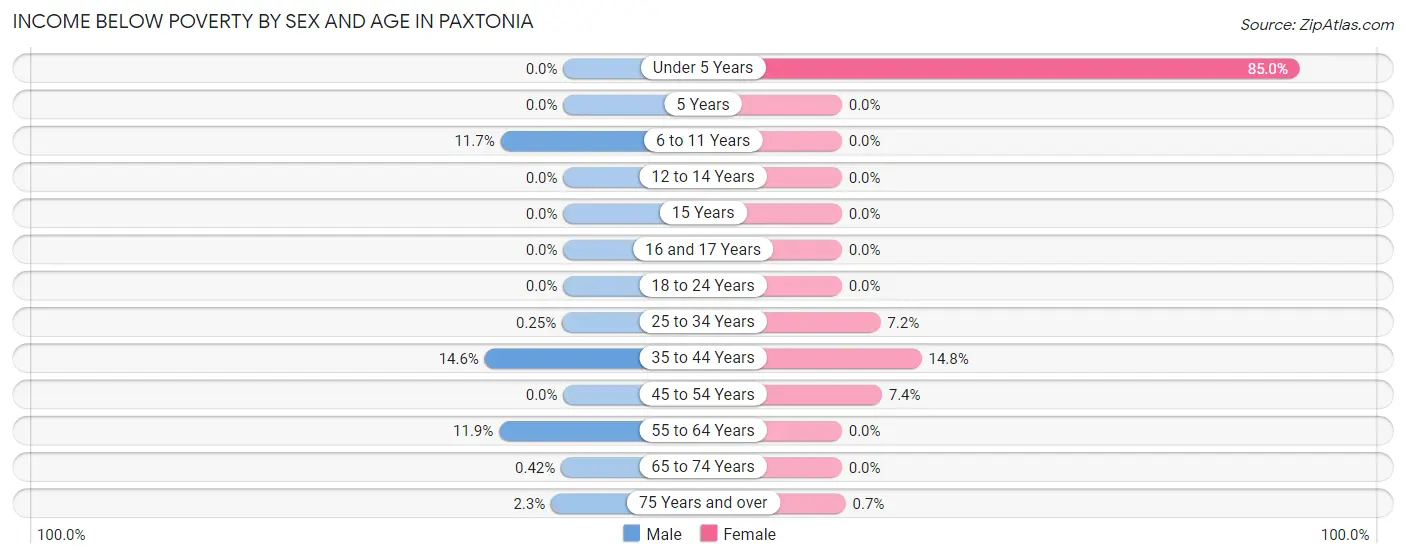
| Age Bracket | Male | Female |
| Under 5 Years | 0 (0.0%) | 51 (85.0%) |
| 5 Years | 0 (0.0%) | 0 (0.0%) |
| 6 to 11 Years | 14 (11.7%) | 0 (0.0%) |
| 12 to 14 Years | 0 (0.0%) | 0 (0.0%) |
| 15 Years | 0 (0.0%) | 0 (0.0%) |
| 16 and 17 Years | 0 (0.0%) | 0 (0.0%) |
| 18 to 24 Years | 0 (0.0%) | 0 (0.0%) |
| 25 to 34 Years | 1 (0.3%) | 18 (7.2%) |
| 35 to 44 Years | 53 (14.6%) | 70 (14.8%) |
| 45 to 54 Years | 0 (0.0%) | 32 (7.4%) |
| 55 to 64 Years | 51 (11.9%) | 0 (0.0%) |
| 65 to 74 Years | 1 (0.4%) | 0 (0.0%) |
| 75 Years and over | 3 (2.3%) | 1 (0.7%) |
| Total | 123 (4.8%) | 172 (5.9%) |
Income Above Poverty by Sex and Age in Paxtonia
According to the poverty statistics in Paxtonia, males aged under 5 years and females aged 5 years are the age groups that are most secure financially, with 100.0% of males and 100.0% of females in these age groups living above the poverty line.
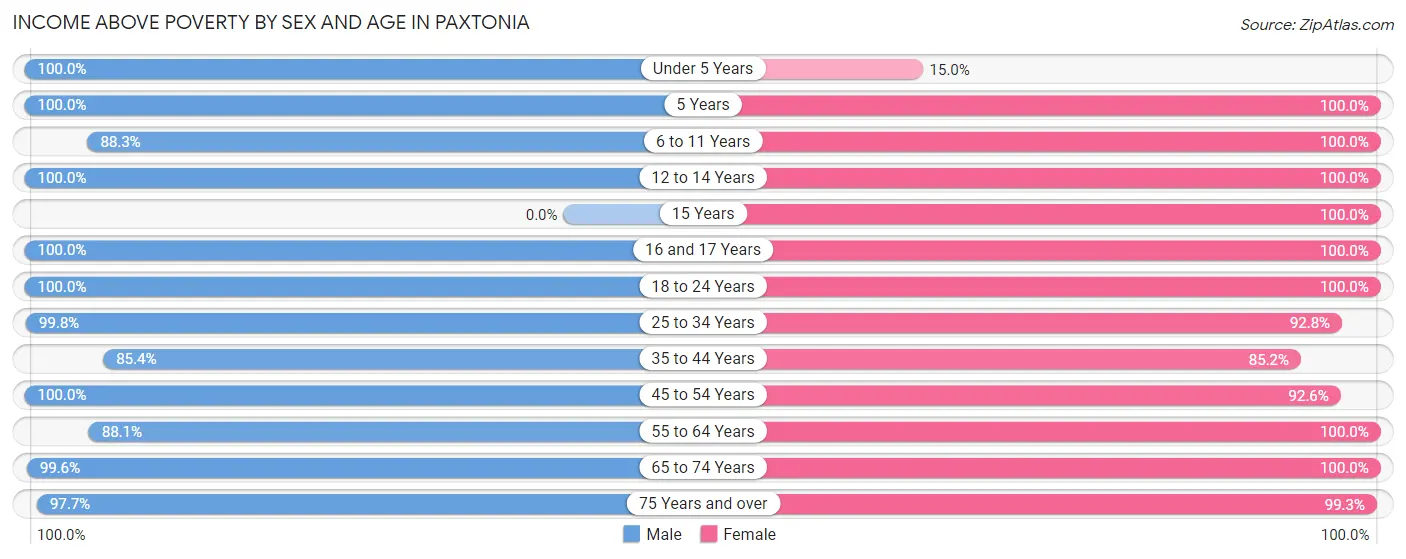
| Age Bracket | Male | Female |
| Under 5 Years | 132 (100.0%) | 9 (15.0%) |
| 5 Years | 143 (100.0%) | 26 (100.0%) |
| 6 to 11 Years | 106 (88.3%) | 312 (100.0%) |
| 12 to 14 Years | 68 (100.0%) | 65 (100.0%) |
| 15 Years | 0 (0.0%) | 15 (100.0%) |
| 16 and 17 Years | 46 (100.0%) | 34 (100.0%) |
| 18 to 24 Years | 208 (100.0%) | 155 (100.0%) |
| 25 to 34 Years | 406 (99.8%) | 233 (92.8%) |
| 35 to 44 Years | 310 (85.4%) | 403 (85.2%) |
| 45 to 54 Years | 264 (100.0%) | 399 (92.6%) |
| 55 to 64 Years | 377 (88.1%) | 566 (100.0%) |
| 65 to 74 Years | 238 (99.6%) | 400 (100.0%) |
| 75 Years and over | 128 (97.7%) | 142 (99.3%) |
| Total | 2,426 (95.2%) | 2,759 (94.1%) |
Income Below Poverty Among Married-Couple Families in Paxtonia
The poverty statistics for married-couple families in Paxtonia show that 5.0% or 55 of the total 1,101 families live below the poverty line. Families with 1 or 2 children have the highest poverty rate of 13.9%, comprising of 55 families. On the other hand, families with no children have the lowest poverty rate of 0.0%, which includes 0 families.
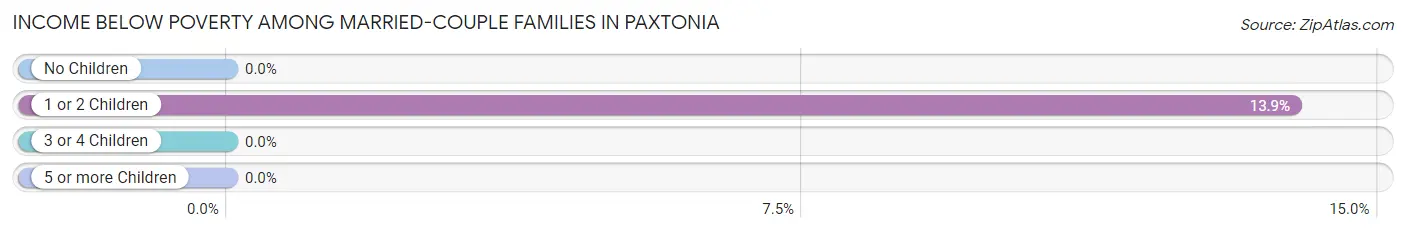
| Children | Above Poverty | Below Poverty |
| No Children | 677 (100.0%) | 0 (0.0%) |
| 1 or 2 Children | 341 (86.1%) | 55 (13.9%) |
| 3 or 4 Children | 28 (100.0%) | 0 (0.0%) |
| 5 or more Children | 0 (0.0%) | 0 (0.0%) |
| Total | 1,046 (95.0%) | 55 (5.0%) |
Income Below Poverty Among Single-Parent Households in Paxtonia
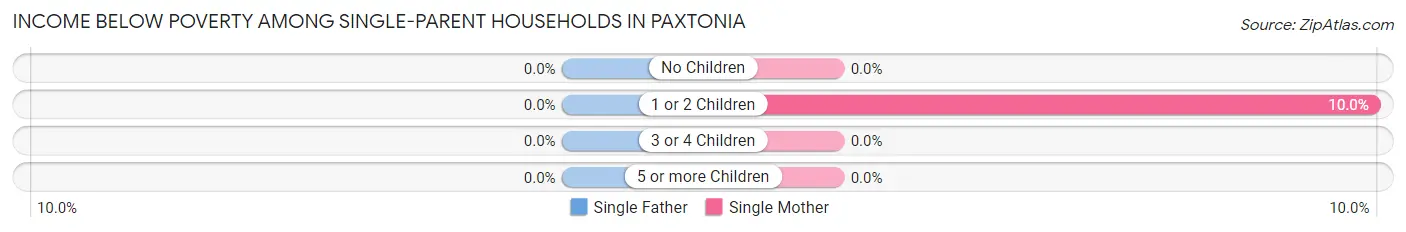
| Children | Single Father | Single Mother |
| No Children | 0 (0.0%) | 0 (0.0%) |
| 1 or 2 Children | 0 (0.0%) | 17 (10.0%) |
| 3 or 4 Children | 0 (0.0%) | 0 (0.0%) |
| 5 or more Children | 0 (0.0%) | 0 (0.0%) |
| Total | 0 (0.0%) | 17 (4.2%) |
Income Below Poverty Among Married-Couple vs Single-Parent Households in Paxtonia
The poverty data for Paxtonia shows that 55 of the married-couple family households (5.0%) and 17 of the single-parent households (4.1%) are living below the poverty level. Within the married-couple family households, those with 1 or 2 children have the highest poverty rate, with 55 households (13.9%) falling below the poverty line. Among the single-parent households, those with 1 or 2 children have the highest poverty rate, with 17 household (9.2%) living below poverty.
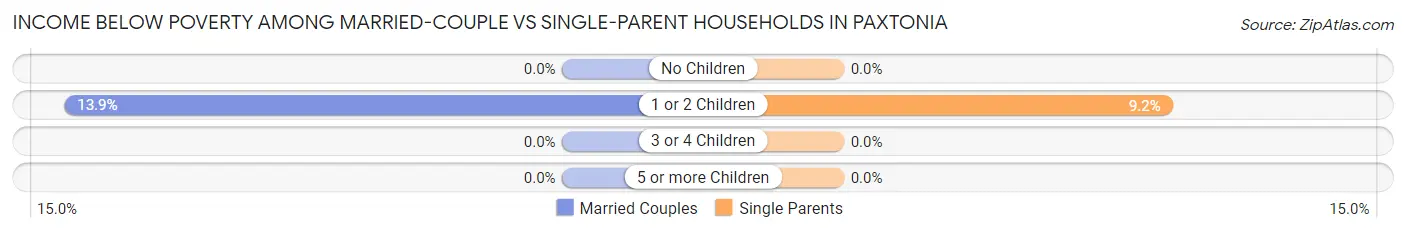
| Children | Married-Couple Families | Single-Parent Households |
| No Children | 0 (0.0%) | 0 (0.0%) |
| 1 or 2 Children | 55 (13.9%) | 17 (9.2%) |
| 3 or 4 Children | 0 (0.0%) | 0 (0.0%) |
| 5 or more Children | 0 (0.0%) | 0 (0.0%) |
| Total | 55 (5.0%) | 17 (4.1%) |
Race in Paxtonia
The most populous races in Paxtonia are White / Caucasian (3,811 | 69.5%), Asian (970 | 17.7%), and Black / African American (508 | 9.3%).
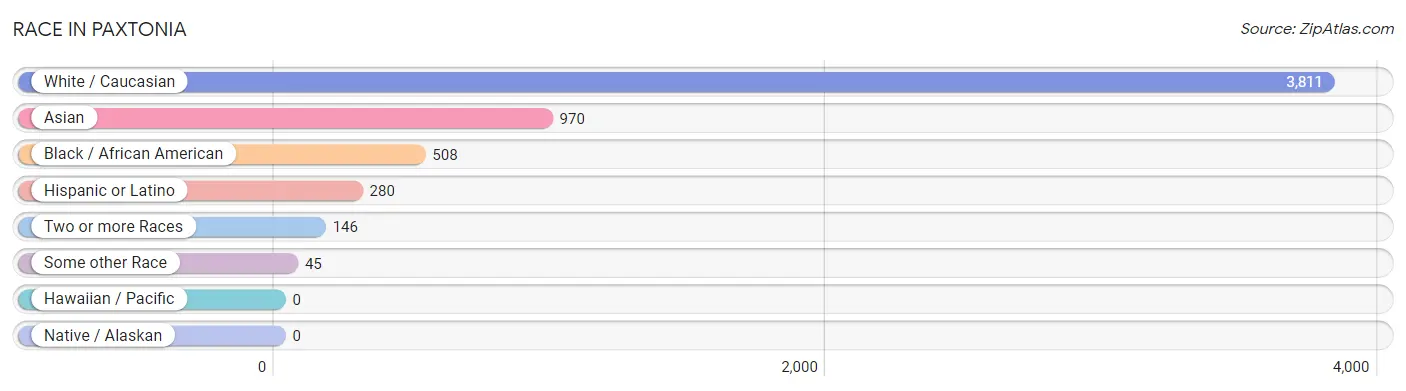
| Race | # Population | % Population |
| Asian | 970 | 17.7% |
| Black / African American | 508 | 9.3% |
| Hawaiian / Pacific | 0 | 0.0% |
| Hispanic or Latino | 280 | 5.1% |
| Native / Alaskan | 0 | 0.0% |
| White / Caucasian | 3,811 | 69.5% |
| Two or more Races | 146 | 2.7% |
| Some other Race | 45 | 0.8% |
| Total | 5,480 | 100.0% |
Ancestry in Paxtonia
The most populous ancestries reported in Paxtonia are German (1,348 | 24.6%), Italian (557 | 10.2%), Irish (520 | 9.5%), English (431 | 7.9%), and American (330 | 6.0%), together accounting for 58.1% of all Paxtonia residents.
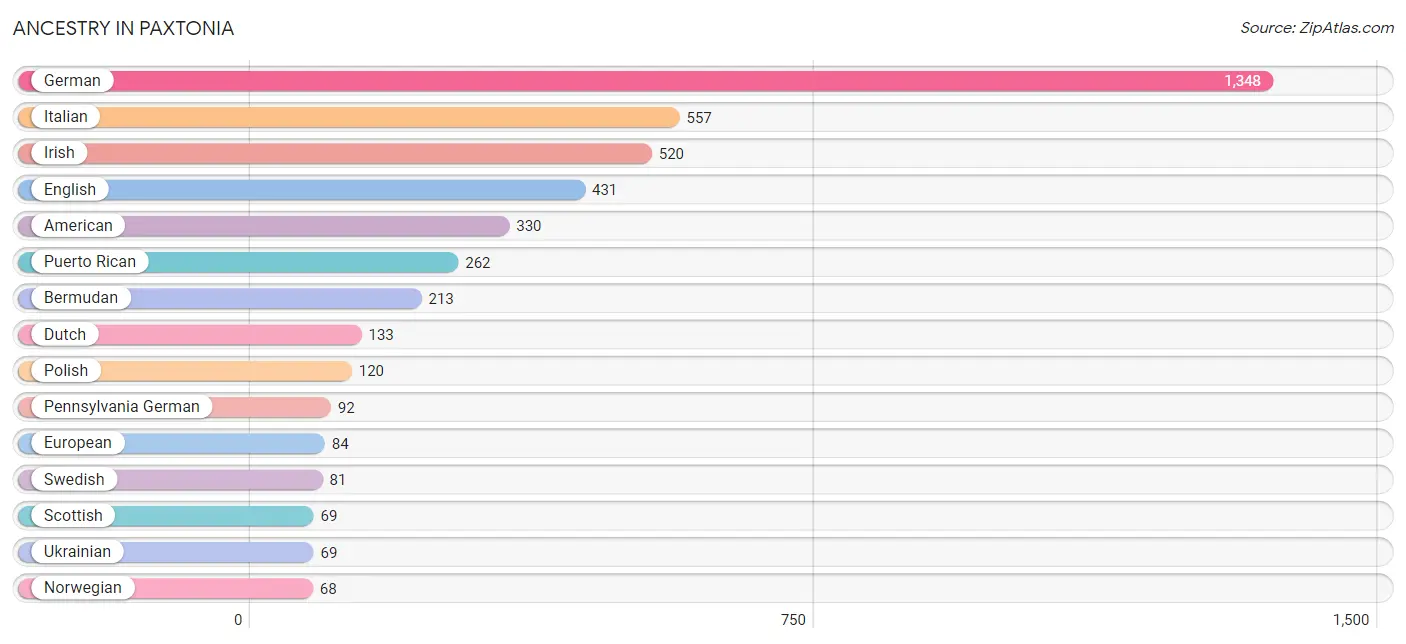
| Ancestry | # Population | % Population |
| African | 1 | 0.0% |
| American | 330 | 6.0% |
| Bermudan | 213 | 3.9% |
| Bhutanese | 12 | 0.2% |
| British | 13 | 0.2% |
| Colombian | 17 | 0.3% |
| Croatian | 42 | 0.8% |
| Dutch | 133 | 2.4% |
| Eastern European | 24 | 0.4% |
| English | 431 | 7.9% |
| European | 84 | 1.5% |
| French | 50 | 0.9% |
| German | 1,348 | 24.6% |
| Hungarian | 17 | 0.3% |
| Irish | 520 | 9.5% |
| Iroquois | 16 | 0.3% |
| Italian | 557 | 10.2% |
| Lithuanian | 3 | 0.1% |
| Mexican | 1 | 0.0% |
| Northern European | 12 | 0.2% |
| Norwegian | 68 | 1.2% |
| Pennsylvania German | 92 | 1.7% |
| Polish | 120 | 2.2% |
| Puerto Rican | 262 | 4.8% |
| Russian | 34 | 0.6% |
| Scandinavian | 12 | 0.2% |
| Scotch-Irish | 43 | 0.8% |
| Scottish | 69 | 1.3% |
| Slavic | 14 | 0.3% |
| Slovak | 23 | 0.4% |
| South American | 17 | 0.3% |
| Sri Lankan | 28 | 0.5% |
| Subsaharan African | 1 | 0.0% |
| Swedish | 81 | 1.5% |
| Thai | 37 | 0.7% |
| Ukrainian | 69 | 1.3% |
| Welsh | 29 | 0.5% |
| Yugoslavian | 40 | 0.7% | View All 38 Rows |
Immigrants in Paxtonia
The most numerous immigrant groups reported in Paxtonia came from Asia (633 | 11.6%), South Central Asia (618 | 11.3%), Nepal (256 | 4.7%), Europe (81 | 1.5%), and Eastern Europe (61 | 1.1%), together accounting for 30.1% of all Paxtonia residents.
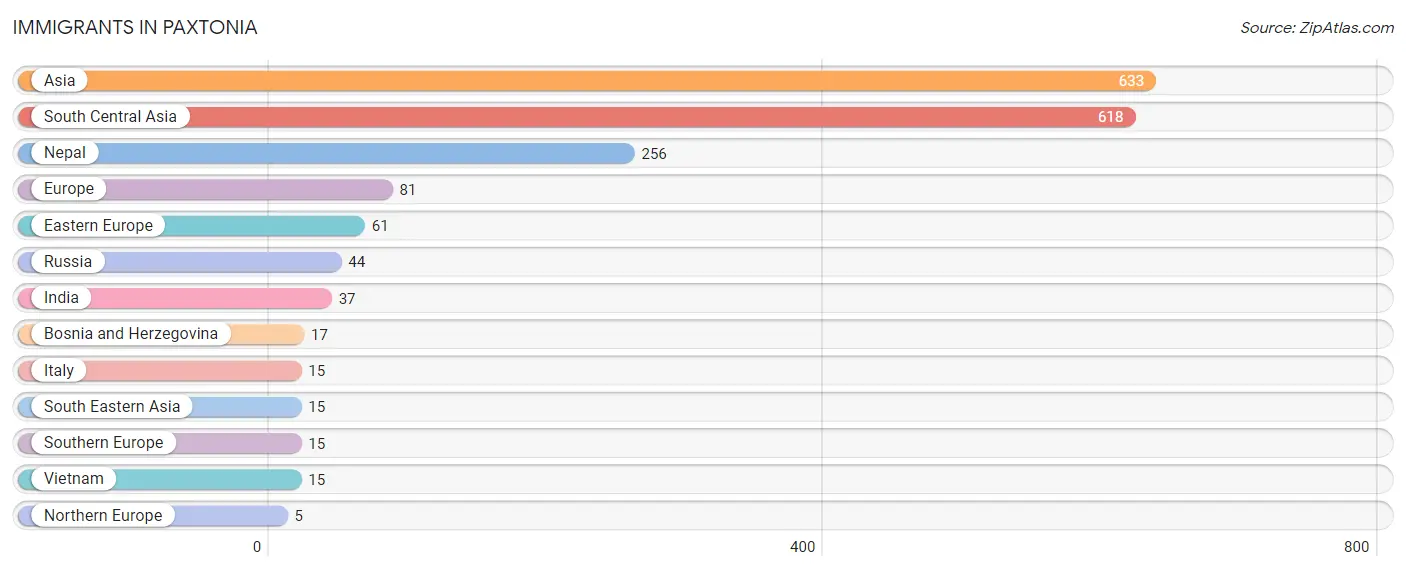
| Immigration Origin | # Population | % Population |
| Asia | 633 | 11.6% |
| Bosnia and Herzegovina | 17 | 0.3% |
| Eastern Europe | 61 | 1.1% |
| Europe | 81 | 1.5% |
| India | 37 | 0.7% |
| Italy | 15 | 0.3% |
| Nepal | 256 | 4.7% |
| Northern Europe | 5 | 0.1% |
| Russia | 44 | 0.8% |
| South Central Asia | 618 | 11.3% |
| South Eastern Asia | 15 | 0.3% |
| Southern Europe | 15 | 0.3% |
| Vietnam | 15 | 0.3% | View All 13 Rows |
Sex and Age in Paxtonia
Sex and Age in Paxtonia
The most populous age groups in Paxtonia are 60 to 64 Years (282 | 11.1%) for men and 35 to 39 Years (350 | 11.9%) for women.
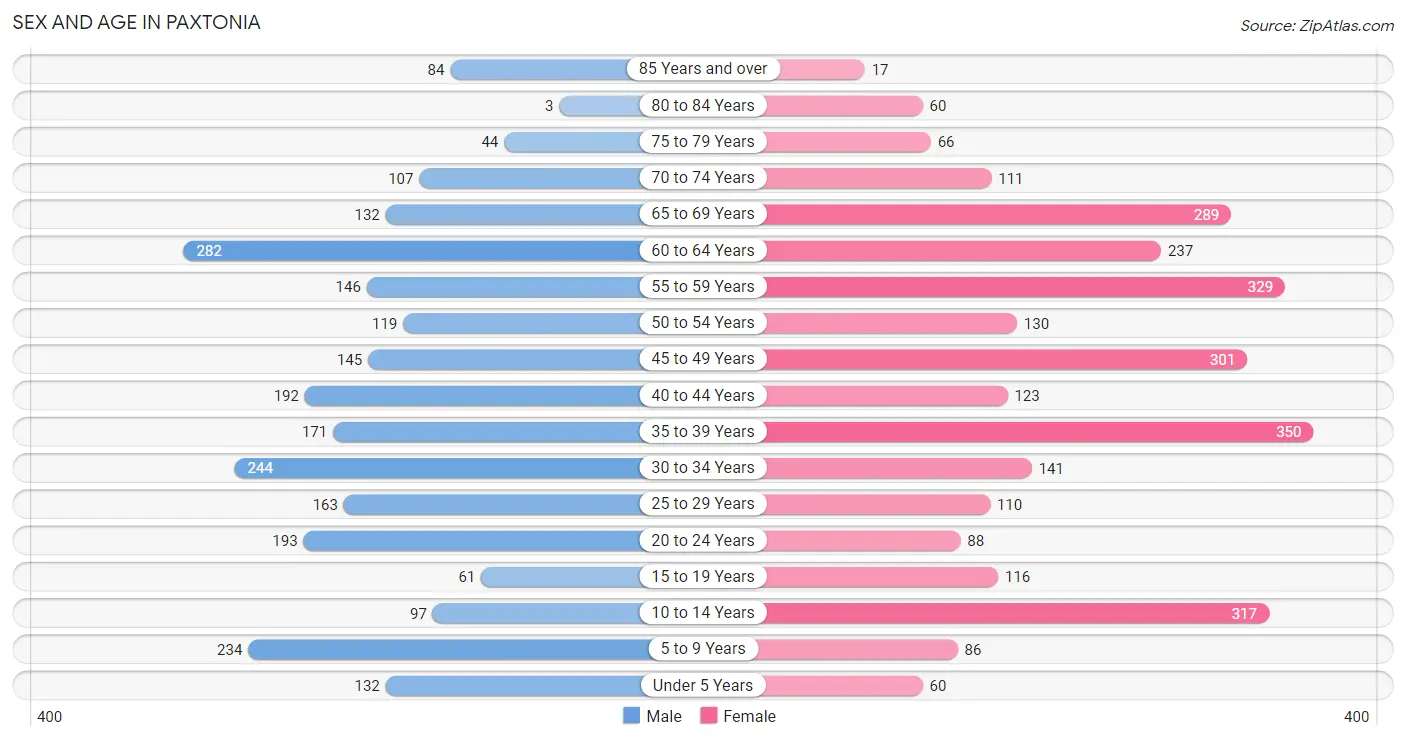
| Age Bracket | Male | Female |
| Under 5 Years | 132 (5.2%) | 60 (2.1%) |
| 5 to 9 Years | 234 (9.2%) | 86 (2.9%) |
| 10 to 14 Years | 97 (3.8%) | 317 (10.8%) |
| 15 to 19 Years | 61 (2.4%) | 116 (4.0%) |
| 20 to 24 Years | 193 (7.6%) | 88 (3.0%) |
| 25 to 29 Years | 163 (6.4%) | 110 (3.7%) |
| 30 to 34 Years | 244 (9.6%) | 141 (4.8%) |
| 35 to 39 Years | 171 (6.7%) | 350 (11.9%) |
| 40 to 44 Years | 192 (7.5%) | 123 (4.2%) |
| 45 to 49 Years | 145 (5.7%) | 301 (10.3%) |
| 50 to 54 Years | 119 (4.7%) | 130 (4.4%) |
| 55 to 59 Years | 146 (5.7%) | 329 (11.2%) |
| 60 to 64 Years | 282 (11.1%) | 237 (8.1%) |
| 65 to 69 Years | 132 (5.2%) | 289 (9.9%) |
| 70 to 74 Years | 107 (4.2%) | 111 (3.8%) |
| 75 to 79 Years | 44 (1.7%) | 66 (2.2%) |
| 80 to 84 Years | 3 (0.1%) | 60 (2.1%) |
| 85 Years and over | 84 (3.3%) | 17 (0.6%) |
| Total | 2,549 (100.0%) | 2,931 (100.0%) |
Families and Households in Paxtonia
Median Family Size in Paxtonia
The median family size in Paxtonia is 3.12 persons per family, with single male/father families (15 | 1.0%) accounting for the largest median family size of 3.27 persons per family. On the other hand, single female/mother families (405 | 26.6%) represent the smallest median family size with 2.93 persons per family.
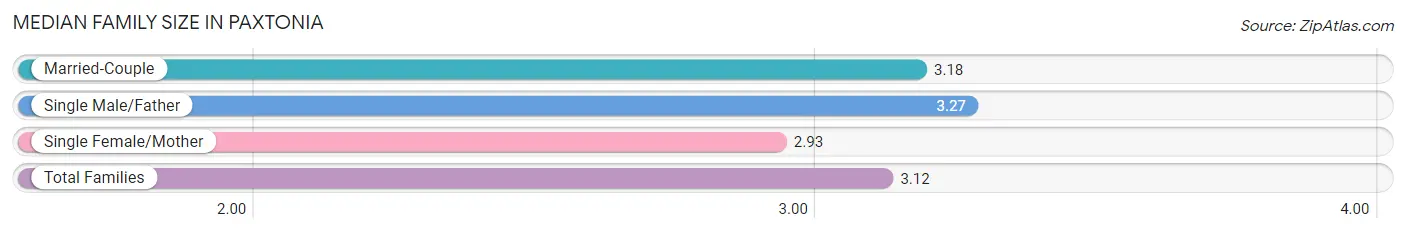
| Family Type | # Families | Family Size |
| Married-Couple | 1,101 (72.4%) | 3.18 |
| Single Male/Father | 15 (1.0%) | 3.27 |
| Single Female/Mother | 405 (26.6%) | 2.93 |
| Total Families | 1,521 (100.0%) | 3.12 |
Median Household Size in Paxtonia
The median household size in Paxtonia is 2.53 persons per household, with single male/father households (15 | 0.7%) accounting for the largest median household size of 4.13 persons per household. non-family households (643 | 29.7%) represent the smallest median household size with 1.11 persons per household.
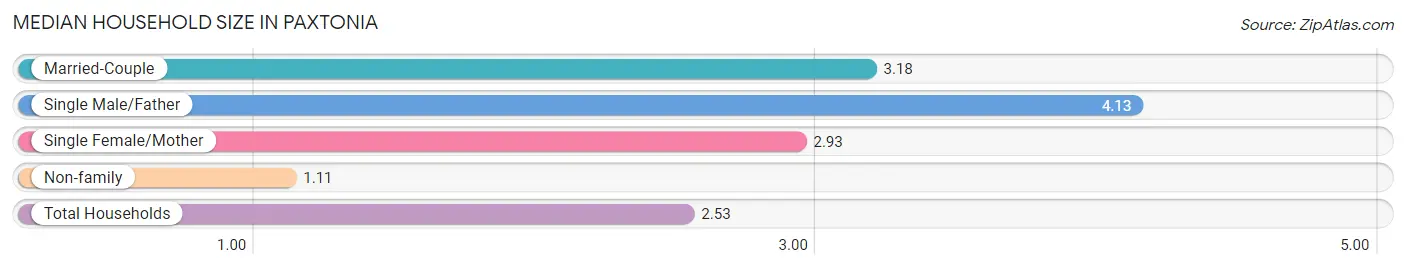
| Household Type | # Households | Household Size |
| Married-Couple | 1,101 (50.9%) | 3.18 |
| Single Male/Father | 15 (0.7%) | 4.13 |
| Single Female/Mother | 405 (18.7%) | 2.93 |
| Non-family | 643 (29.7%) | 1.11 |
| Total Households | 2,164 (100.0%) | 2.53 |
Household Size by Marriage Status in Paxtonia
Out of a total of 2,164 households in Paxtonia, 1,521 (70.3%) are family households, while 643 (29.7%) are nonfamily households. The most numerous type of family households are 2-person households, comprising 646, and the most common type of nonfamily households are 1-person households, comprising 566.
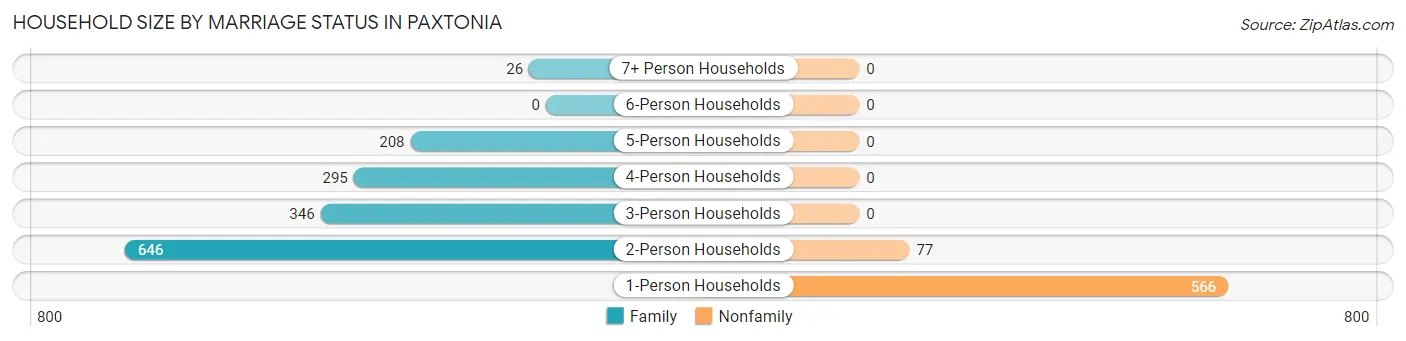
| Household Size | Family Households | Nonfamily Households |
| 1-Person Households | - | 566 (26.2%) |
| 2-Person Households | 646 (29.8%) | 77 (3.6%) |
| 3-Person Households | 346 (16.0%) | 0 (0.0%) |
| 4-Person Households | 295 (13.6%) | 0 (0.0%) |
| 5-Person Households | 208 (9.6%) | 0 (0.0%) |
| 6-Person Households | 0 (0.0%) | 0 (0.0%) |
| 7+ Person Households | 26 (1.2%) | 0 (0.0%) |
| Total | 1,521 (70.3%) | 643 (29.7%) |
Female Fertility in Paxtonia
Fertility by Age in Paxtonia
Average fertility rate in Paxtonia is 51.0 births per 1,000 women. Women in the age bracket of 35 to 50 years have the highest fertility rate with 69.0 births per 1,000 women. Women in the age bracket of 35 to 50 years acount for 85.9% of all women with births.
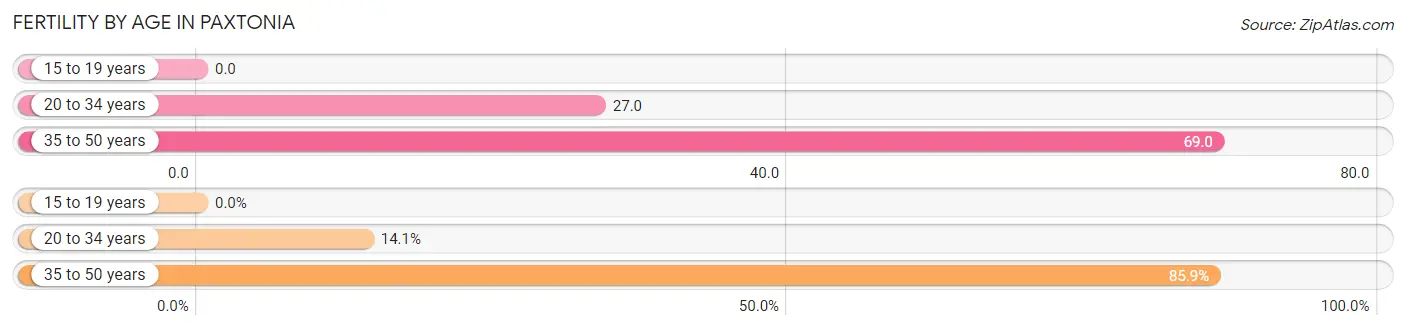
| Age Bracket | Women with Births | Births / 1,000 Women |
| 15 to 19 years | 0 (0.0%) | 0.0 |
| 20 to 34 years | 9 (14.1%) | 27.0 |
| 35 to 50 years | 55 (85.9%) | 69.0 |
| Total | 64 (100.0%) | 51.0 |
Fertility by Age by Marriage Status in Paxtonia
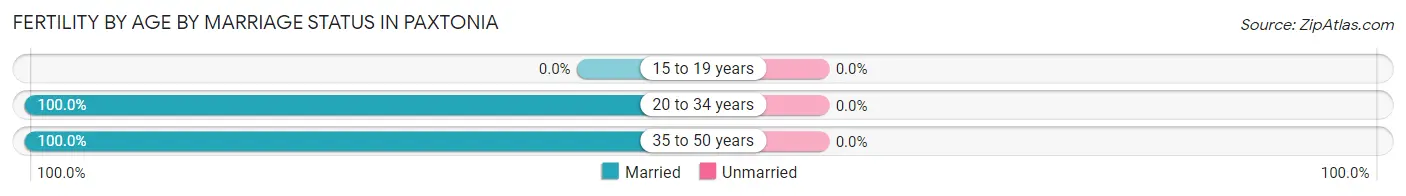
| Age Bracket | Married | Unmarried |
| 15 to 19 years | 0 (0.0%) | 0 (0.0%) |
| 20 to 34 years | 9 (100.0%) | 0 (0.0%) |
| 35 to 50 years | 55 (100.0%) | 0 (0.0%) |
| Total | 64 (100.0%) | 0 (0.0%) |
Fertility by Education in Paxtonia
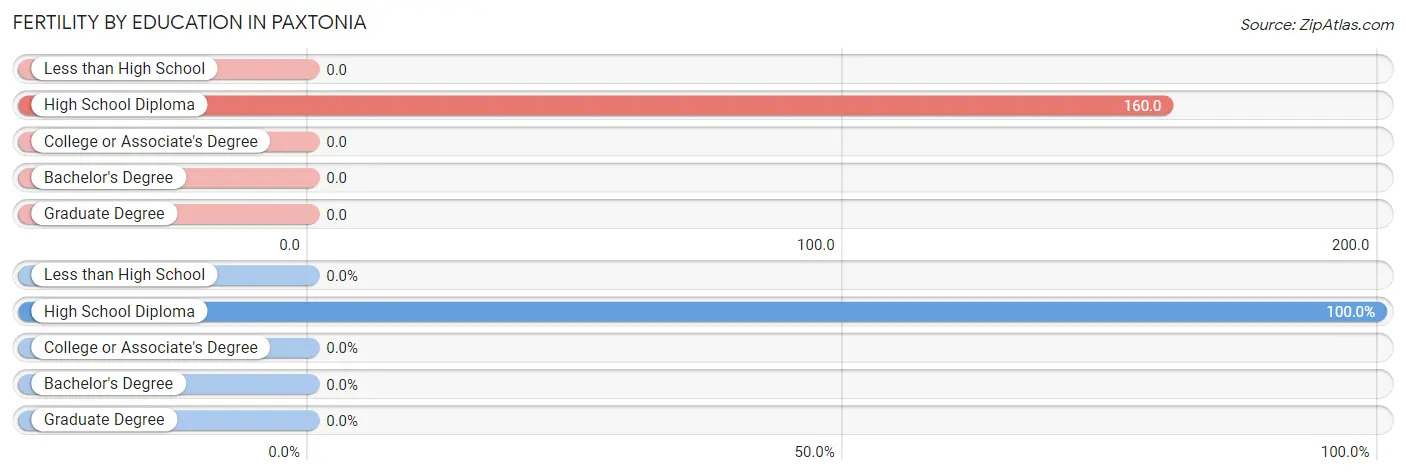
| Educational Attainment | Women with Births | Births / 1,000 Women |
| Less than High School | 0 (0.0%) | 0.0 |
| High School Diploma | 64 (100.0%) | 160.0 |
| College or Associate's Degree | 0 (0.0%) | 0.0 |
| Bachelor's Degree | 0 (0.0%) | 0.0 |
| Graduate Degree | 0 (0.0%) | 0.0 |
| Total | 64 (100.0%) | 51.0 |
Fertility by Education by Marriage Status in Paxtonia
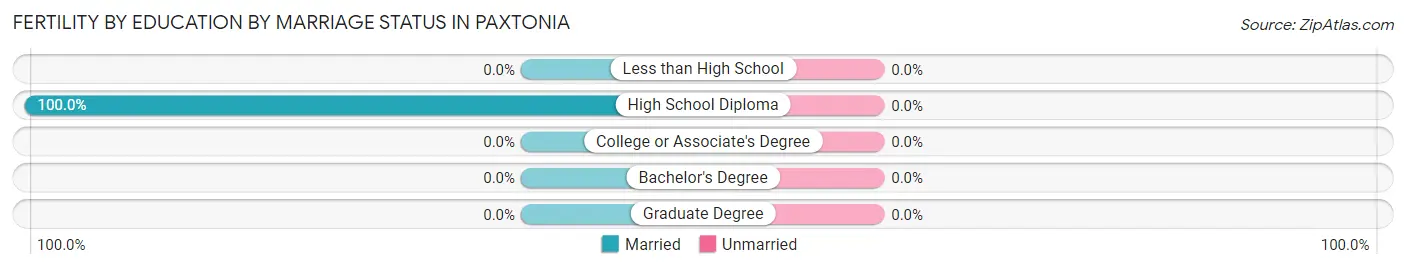
| Educational Attainment | Married | Unmarried |
| Less than High School | 0 (0.0%) | 0 (0.0%) |
| High School Diploma | 64 (100.0%) | 0 (0.0%) |
| College or Associate's Degree | 0 (0.0%) | 0 (0.0%) |
| Bachelor's Degree | 0 (0.0%) | 0 (0.0%) |
| Graduate Degree | 0 (0.0%) | 0 (0.0%) |
| Total | 64 (100.0%) | 0 (0.0%) |
Employment Characteristics in Paxtonia
Employment by Class of Employer in Paxtonia
Among the 2,806 employed individuals in Paxtonia, private company employees (1,860 | 66.3%), state government employees (345 | 12.3%), and not-for-profit organizations (297 | 10.6%) make up the most common classes of employment.
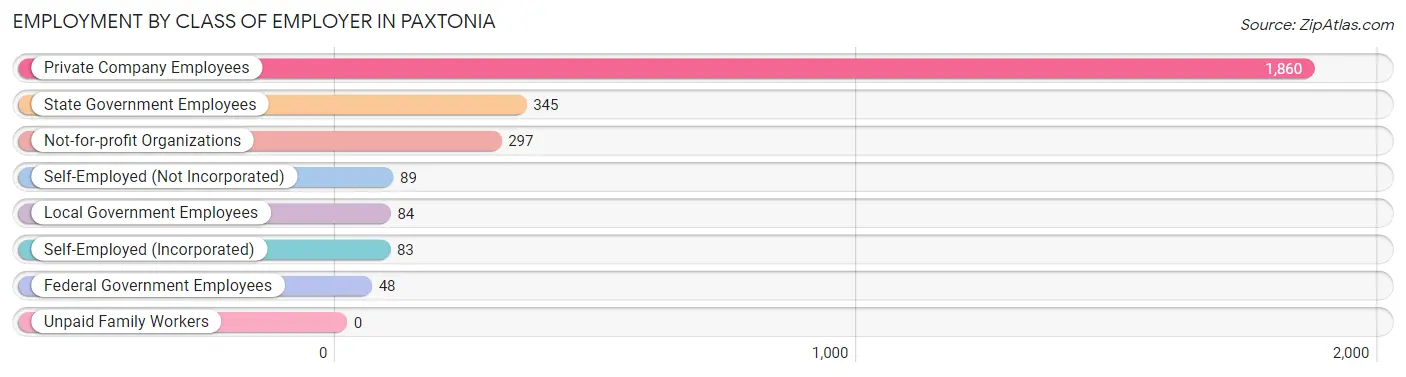
| Employer Class | # Employees | % Employees |
| Private Company Employees | 1,860 | 66.3% |
| Self-Employed (Incorporated) | 83 | 3.0% |
| Self-Employed (Not Incorporated) | 89 | 3.2% |
| Not-for-profit Organizations | 297 | 10.6% |
| Local Government Employees | 84 | 3.0% |
| State Government Employees | 345 | 12.3% |
| Federal Government Employees | 48 | 1.7% |
| Unpaid Family Workers | 0 | 0.0% |
| Total | 2,806 | 100.0% |
Employment Status by Age in Paxtonia
According to the labor force statistics for Paxtonia, out of the total population over 16 years of age (4,539), 63.6% or 2,887 individuals are in the labor force, with 2.8% or 81 of them unemployed. The age group with the highest labor force participation rate is 30 to 34 years, with 99.5% or 383 individuals in the labor force. Within the labor force, the 20 to 24 years age range has the highest percentage of unemployed individuals, with 49.5% or 51 of them being unemployed.
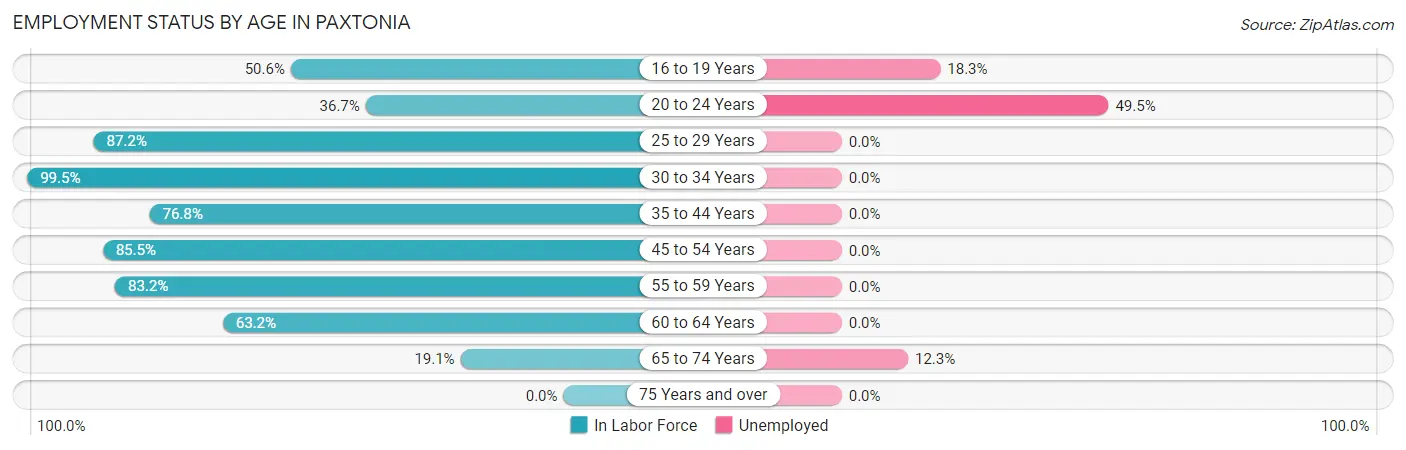
| Age Bracket | In Labor Force | Unemployed |
| 16 to 19 Years | 82 (50.6%) | 15 (18.3%) |
| 20 to 24 Years | 103 (36.7%) | 51 (49.5%) |
| 25 to 29 Years | 238 (87.2%) | 0 (0.0%) |
| 30 to 34 Years | 383 (99.5%) | 0 (0.0%) |
| 35 to 44 Years | 642 (76.8%) | 0 (0.0%) |
| 45 to 54 Years | 594 (85.5%) | 0 (0.0%) |
| 55 to 59 Years | 395 (83.2%) | 0 (0.0%) |
| 60 to 64 Years | 328 (63.2%) | 0 (0.0%) |
| 65 to 74 Years | 122 (19.1%) | 15 (12.3%) |
| 75 Years and over | 0 (0.0%) | 0 (0.0%) |
| Total | 2,887 (63.6%) | 81 (2.8%) |
Employment Status by Educational Attainment in Paxtonia
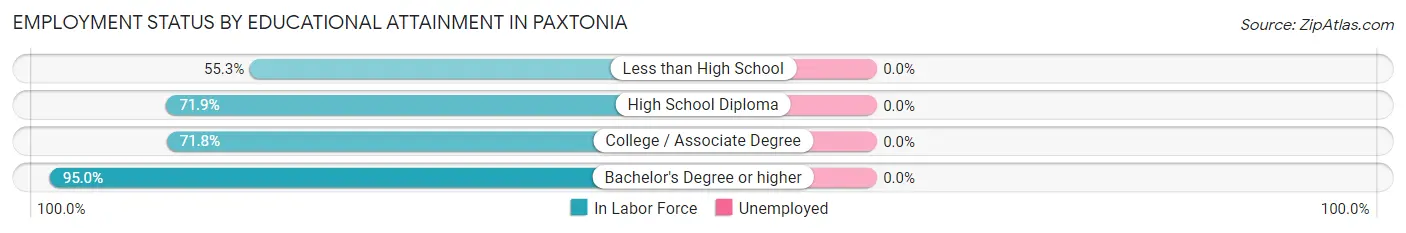
| Educational Attainment | In Labor Force | Unemployed |
| Less than High School | 141 (55.3%) | 0 (0.0%) |
| High School Diploma | 629 (71.9%) | 0 (0.0%) |
| College / Associate Degree | 435 (71.8%) | 0 (0.0%) |
| Bachelor's Degree or higher | 1,375 (95.0%) | 0 (0.0%) |
| Total | 2,581 (81.1%) | 0 (0.0%) |
Employment Occupations by Sex in Paxtonia
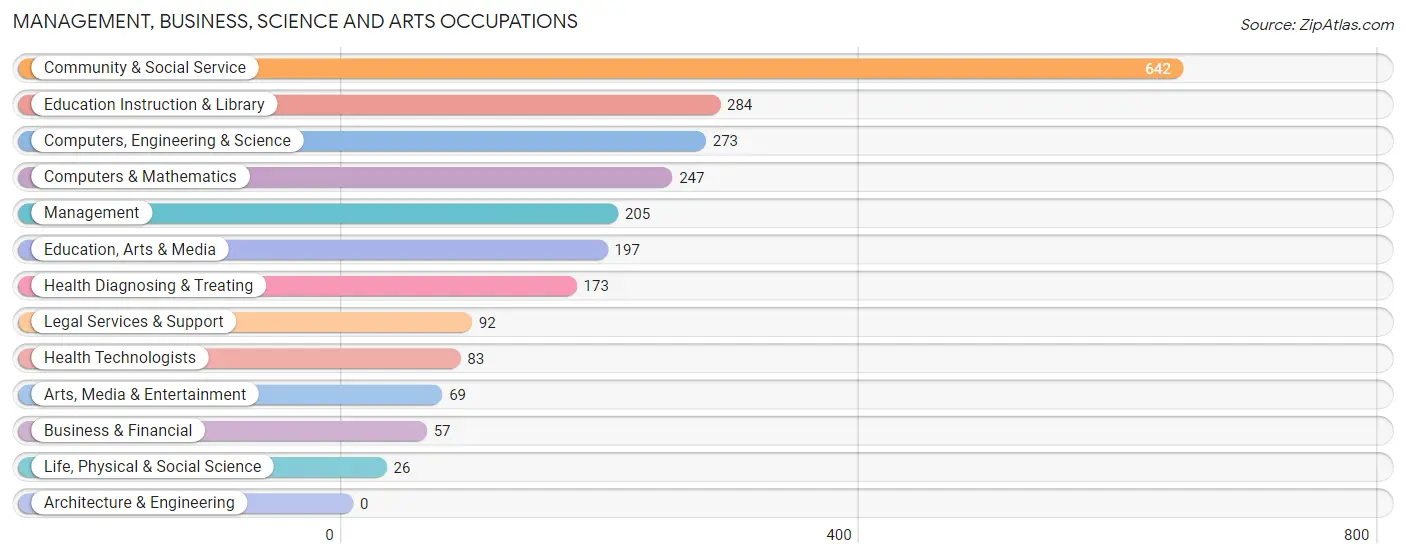
Management, Business, Science and Arts Occupations
The most common Management, Business, Science and Arts occupations in Paxtonia are Community & Social Service (642 | 22.9%), Education Instruction & Library (284 | 10.1%), Computers, Engineering & Science (273 | 9.7%), Computers & Mathematics (247 | 8.8%), and Management (205 | 7.3%).
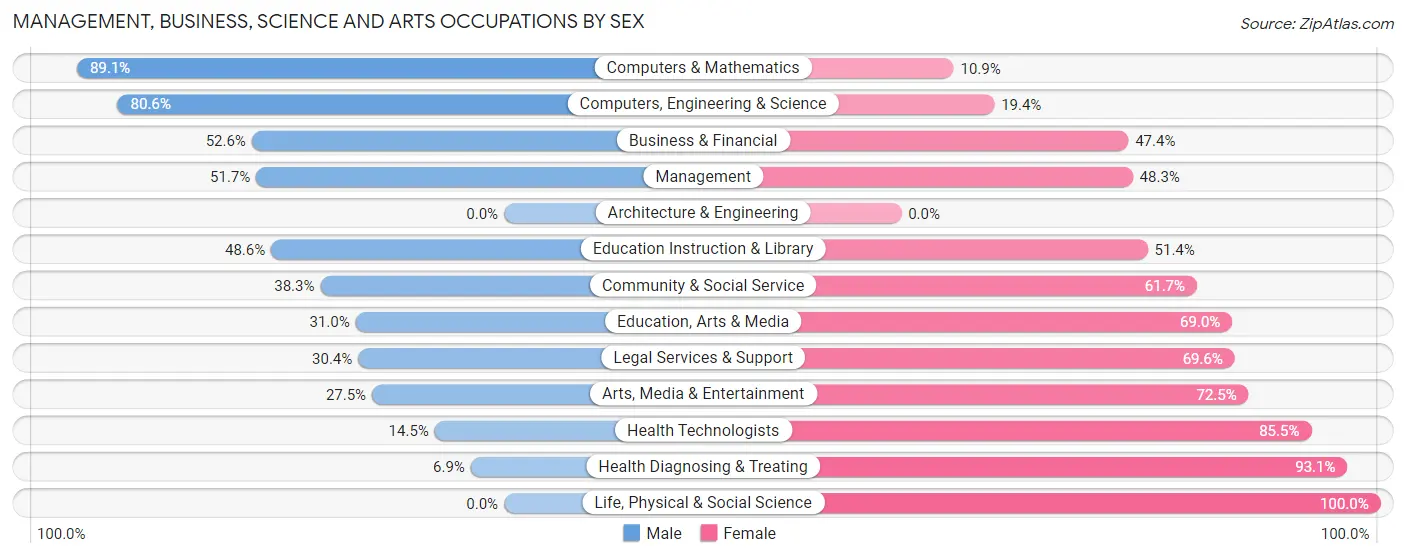
Management, Business, Science and Arts Occupations by Sex
Within the Management, Business, Science and Arts occupations in Paxtonia, the most male-oriented occupations are Computers & Mathematics (89.1%), Computers, Engineering & Science (80.6%), and Business & Financial (52.6%), while the most female-oriented occupations are Life, Physical & Social Science (100.0%), Health Diagnosing & Treating (93.1%), and Health Technologists (85.5%).
| Occupation | Male | Female |
| Management | 106 (51.7%) | 99 (48.3%) |
| Business & Financial | 30 (52.6%) | 27 (47.4%) |
| Computers, Engineering & Science | 220 (80.6%) | 53 (19.4%) |
| Computers & Mathematics | 220 (89.1%) | 27 (10.9%) |
| Architecture & Engineering | 0 (0.0%) | 0 (0.0%) |
| Life, Physical & Social Science | 0 (0.0%) | 26 (100.0%) |
| Community & Social Service | 246 (38.3%) | 396 (61.7%) |
| Education, Arts & Media | 61 (31.0%) | 136 (69.0%) |
| Legal Services & Support | 28 (30.4%) | 64 (69.6%) |
| Education Instruction & Library | 138 (48.6%) | 146 (51.4%) |
| Arts, Media & Entertainment | 19 (27.5%) | 50 (72.5%) |
| Health Diagnosing & Treating | 12 (6.9%) | 161 (93.1%) |
| Health Technologists | 12 (14.5%) | 71 (85.5%) |
| Total (Category) | 614 (45.5%) | 736 (54.5%) |
| Total (Overall) | 1,295 (46.2%) | 1,511 (53.8%) |
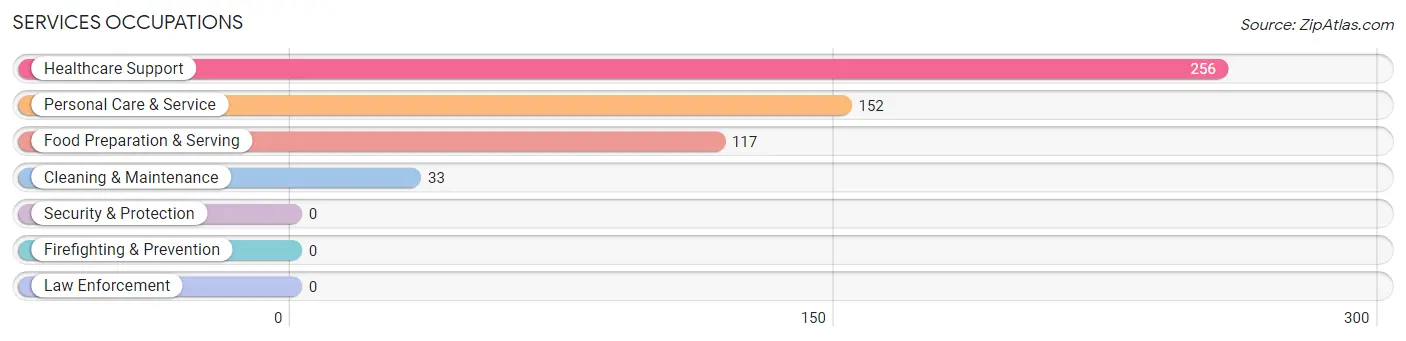
Services Occupations
The most common Services occupations in Paxtonia are Healthcare Support (256 | 9.1%), Personal Care & Service (152 | 5.4%), Food Preparation & Serving (117 | 4.2%), and Cleaning & Maintenance (33 | 1.2%).
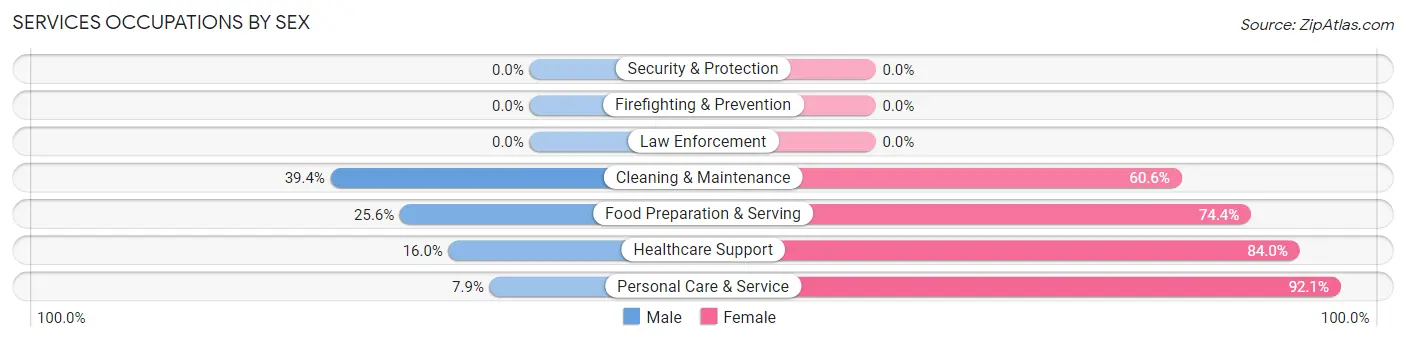
Services Occupations by Sex
Within the Services occupations in Paxtonia, the most male-oriented occupations are Cleaning & Maintenance (39.4%), Food Preparation & Serving (25.6%), and Healthcare Support (16.0%), while the most female-oriented occupations are Personal Care & Service (92.1%), Healthcare Support (84.0%), and Food Preparation & Serving (74.4%).
| Occupation | Male | Female |
| Healthcare Support | 41 (16.0%) | 215 (84.0%) |
| Security & Protection | 0 (0.0%) | 0 (0.0%) |
| Firefighting & Prevention | 0 (0.0%) | 0 (0.0%) |
| Law Enforcement | 0 (0.0%) | 0 (0.0%) |
| Food Preparation & Serving | 30 (25.6%) | 87 (74.4%) |
| Cleaning & Maintenance | 13 (39.4%) | 20 (60.6%) |
| Personal Care & Service | 12 (7.9%) | 140 (92.1%) |
| Total (Category) | 96 (17.2%) | 462 (82.8%) |
| Total (Overall) | 1,295 (46.2%) | 1,511 (53.8%) |
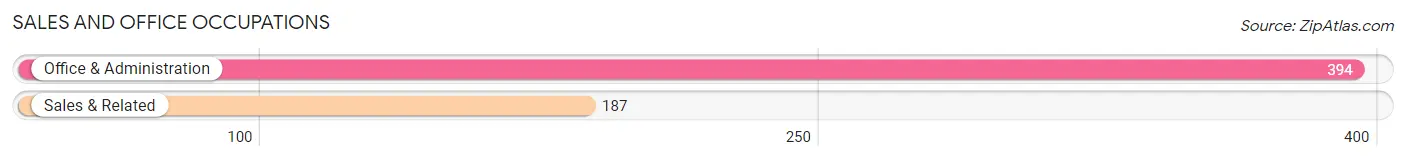
Sales and Office Occupations
The most common Sales and Office occupations in Paxtonia are Office & Administration (394 | 14.0%), and Sales & Related (187 | 6.7%).
Sales and Office Occupations by Sex
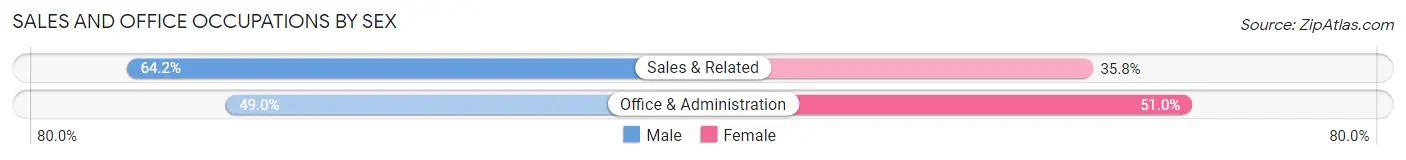
| Occupation | Male | Female |
| Sales & Related | 120 (64.2%) | 67 (35.8%) |
| Office & Administration | 193 (49.0%) | 201 (51.0%) |
| Total (Category) | 313 (53.9%) | 268 (46.1%) |
| Total (Overall) | 1,295 (46.2%) | 1,511 (53.8%) |
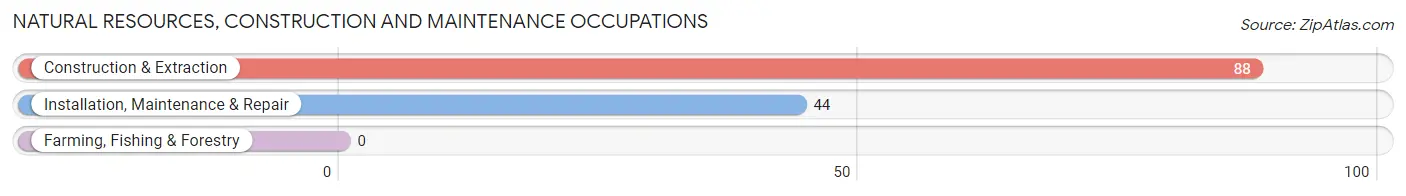
Natural Resources, Construction and Maintenance Occupations
The most common Natural Resources, Construction and Maintenance occupations in Paxtonia are Construction & Extraction (88 | 3.1%), and Installation, Maintenance & Repair (44 | 1.6%).
Natural Resources, Construction and Maintenance Occupations by Sex
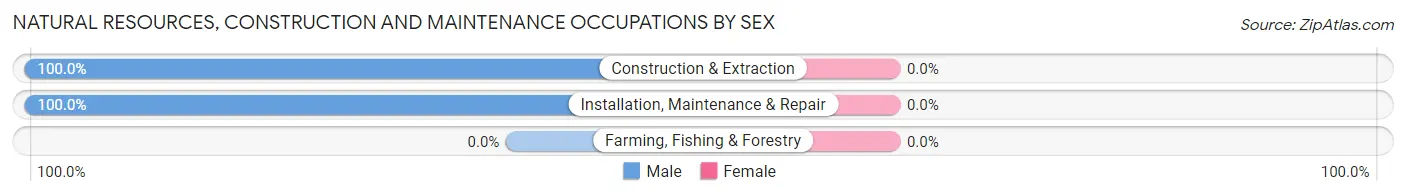
| Occupation | Male | Female |
| Farming, Fishing & Forestry | 0 (0.0%) | 0 (0.0%) |
| Construction & Extraction | 88 (100.0%) | 0 (0.0%) |
| Installation, Maintenance & Repair | 44 (100.0%) | 0 (0.0%) |
| Total (Category) | 132 (100.0%) | 0 (0.0%) |
| Total (Overall) | 1,295 (46.2%) | 1,511 (53.8%) |
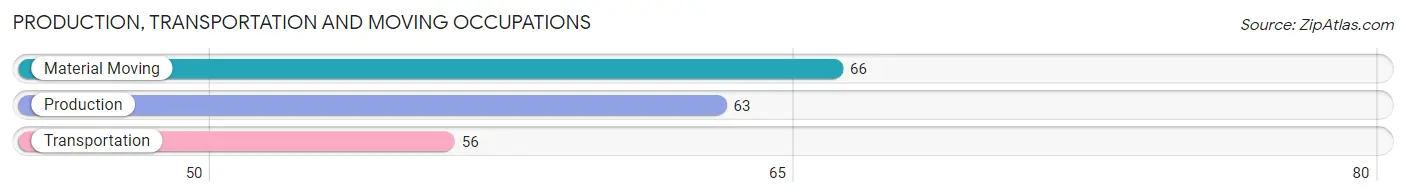
Production, Transportation and Moving Occupations
The most common Production, Transportation and Moving occupations in Paxtonia are Material Moving (66 | 2.4%), Production (63 | 2.2%), and Transportation (56 | 2.0%).
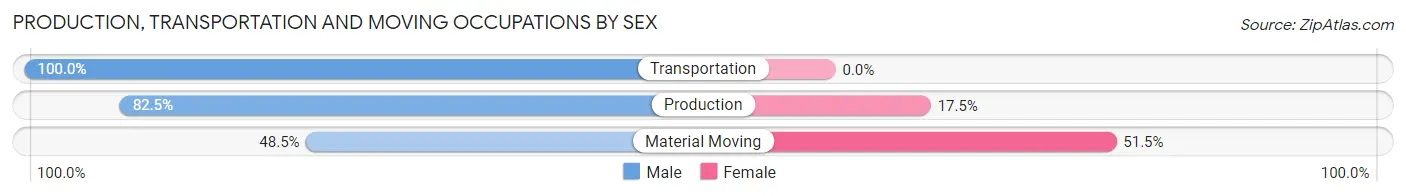
Production, Transportation and Moving Occupations by Sex
| Occupation | Male | Female |
| Production | 52 (82.5%) | 11 (17.5%) |
| Transportation | 56 (100.0%) | 0 (0.0%) |
| Material Moving | 32 (48.5%) | 34 (51.5%) |
| Total (Category) | 140 (75.7%) | 45 (24.3%) |
| Total (Overall) | 1,295 (46.2%) | 1,511 (53.8%) |
Employment Industries by Sex in Paxtonia
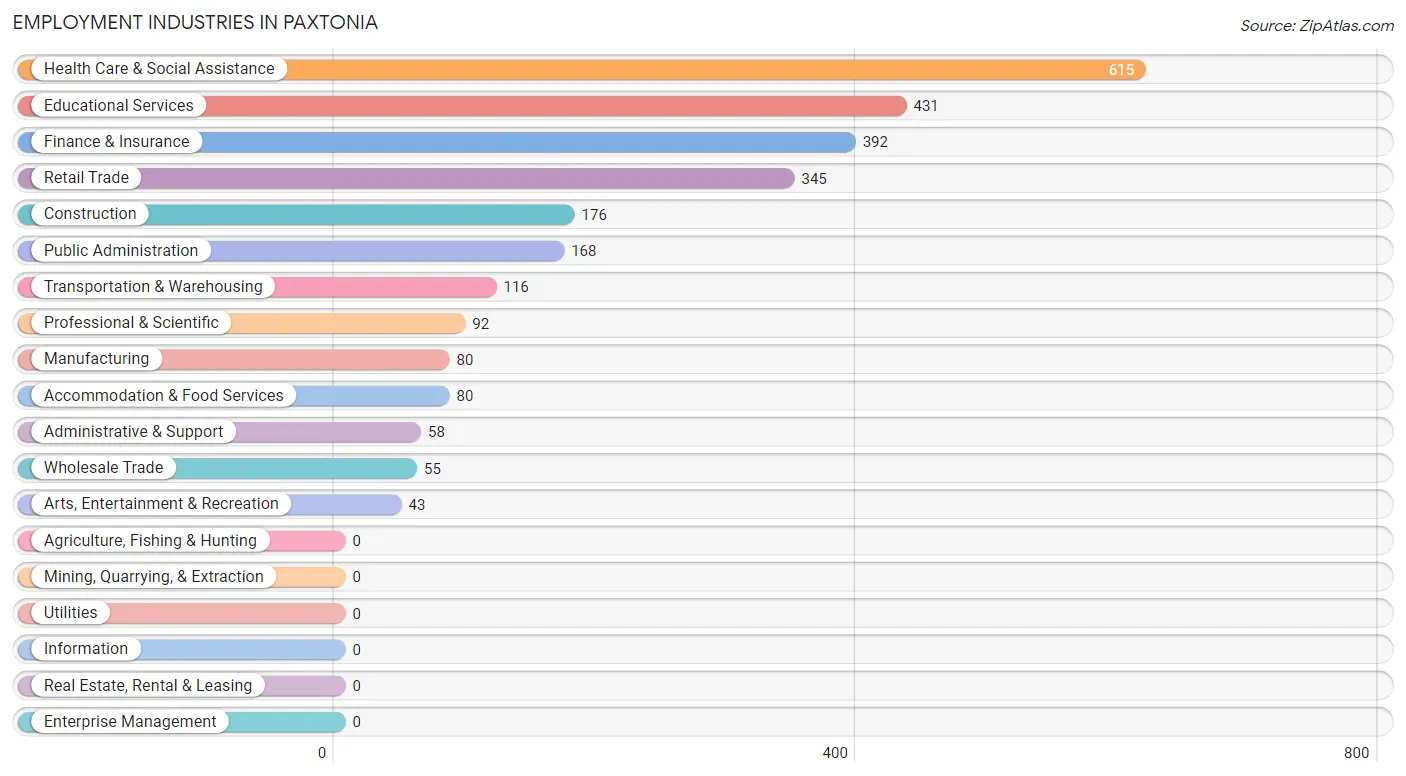
Employment Industries in Paxtonia
The major employment industries in Paxtonia include Health Care & Social Assistance (615 | 21.9%), Educational Services (431 | 15.4%), Finance & Insurance (392 | 14.0%), Retail Trade (345 | 12.3%), and Construction (176 | 6.3%).
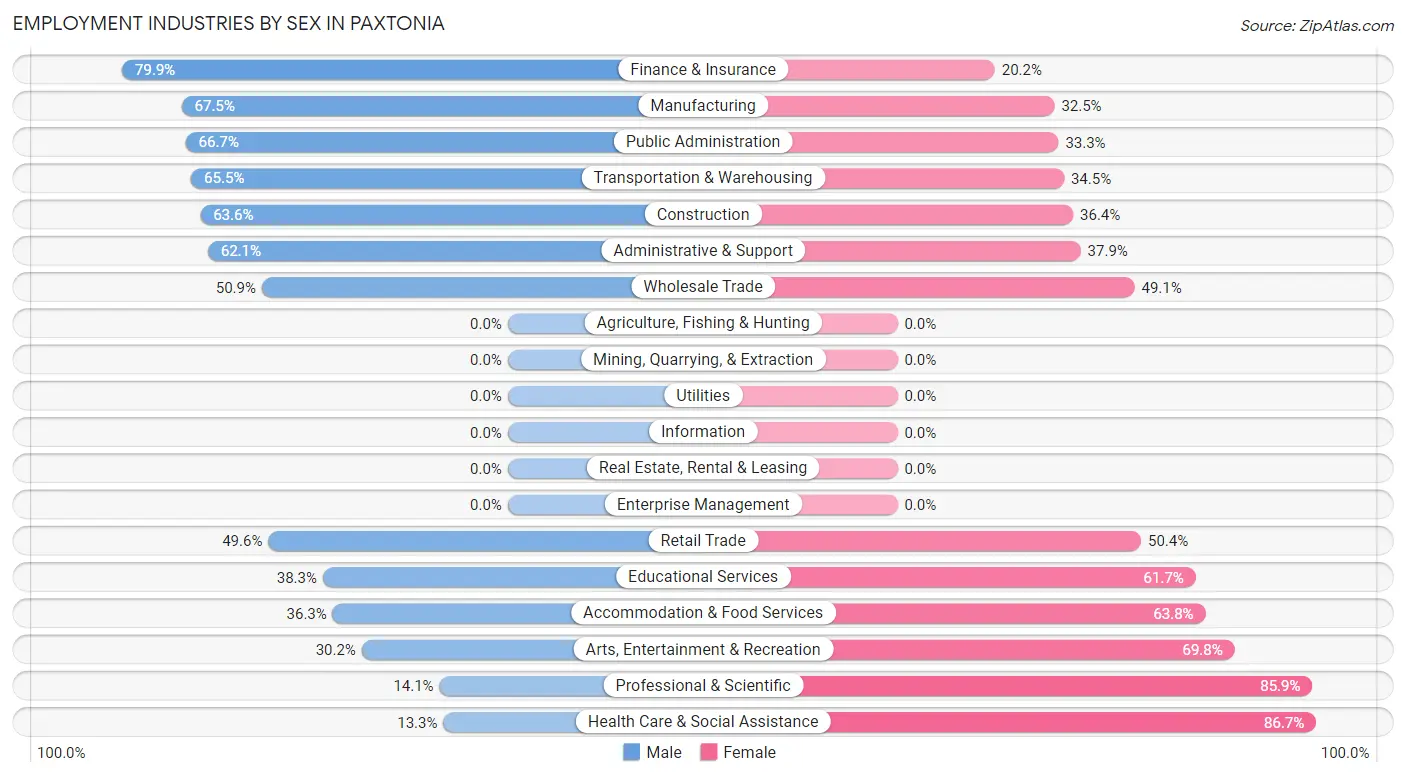
Employment Industries by Sex in Paxtonia
The Paxtonia industries that see more men than women are Finance & Insurance (79.8%), Manufacturing (67.5%), and Public Administration (66.7%), whereas the industries that tend to have a higher number of women are Health Care & Social Assistance (86.7%), Professional & Scientific (85.9%), and Arts, Entertainment & Recreation (69.8%).
| Industry | Male | Female |
| Agriculture, Fishing & Hunting | 0 (0.0%) | 0 (0.0%) |
| Mining, Quarrying, & Extraction | 0 (0.0%) | 0 (0.0%) |
| Construction | 112 (63.6%) | 64 (36.4%) |
| Manufacturing | 54 (67.5%) | 26 (32.5%) |
| Wholesale Trade | 28 (50.9%) | 27 (49.1%) |
| Retail Trade | 171 (49.6%) | 174 (50.4%) |
| Transportation & Warehousing | 76 (65.5%) | 40 (34.5%) |
| Utilities | 0 (0.0%) | 0 (0.0%) |
| Information | 0 (0.0%) | 0 (0.0%) |
| Finance & Insurance | 313 (79.8%) | 79 (20.2%) |
| Real Estate, Rental & Leasing | 0 (0.0%) | 0 (0.0%) |
| Professional & Scientific | 13 (14.1%) | 79 (85.9%) |
| Enterprise Management | 0 (0.0%) | 0 (0.0%) |
| Administrative & Support | 36 (62.1%) | 22 (37.9%) |
| Educational Services | 165 (38.3%) | 266 (61.7%) |
| Health Care & Social Assistance | 82 (13.3%) | 533 (86.7%) |
| Arts, Entertainment & Recreation | 13 (30.2%) | 30 (69.8%) |
| Accommodation & Food Services | 29 (36.2%) | 51 (63.7%) |
| Public Administration | 112 (66.7%) | 56 (33.3%) |
| Total | 1,295 (46.2%) | 1,511 (53.8%) |
Education in Paxtonia
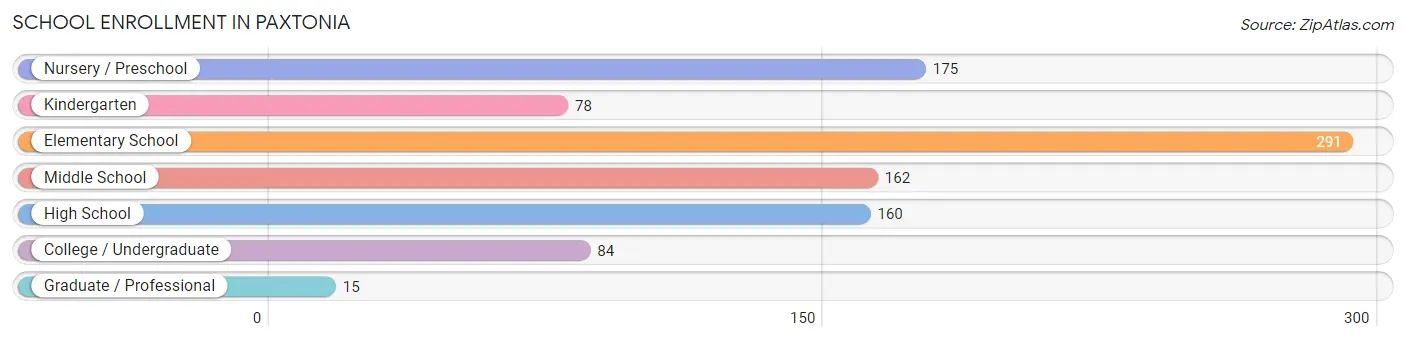
School Enrollment in Paxtonia
The most common levels of schooling among the 965 students in Paxtonia are elementary school (291 | 30.2%), nursery / preschool (175 | 18.1%), and middle school (162 | 16.8%).
| School Level | # Students | % Students |
| Nursery / Preschool | 175 | 18.1% |
| Kindergarten | 78 | 8.1% |
| Elementary School | 291 | 30.2% |
| Middle School | 162 | 16.8% |
| High School | 160 | 16.6% |
| College / Undergraduate | 84 | 8.7% |
| Graduate / Professional | 15 | 1.5% |
| Total | 965 | 100.0% |
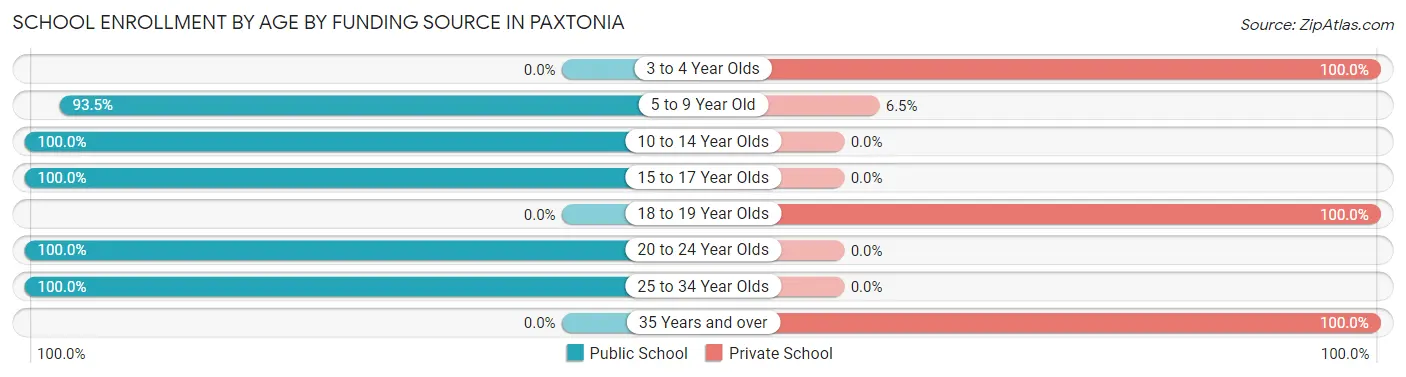
School Enrollment by Age by Funding Source in Paxtonia
Out of a total of 965 students who are enrolled in schools in Paxtonia, 111 (11.5%) attend a private institution, while the remaining 854 (88.5%) are enrolled in public schools. The age group of 3 to 4 year olds has the highest likelihood of being enrolled in private schools, with 51 (100.0% in the age bracket) enrolled. Conversely, the age group of 10 to 14 year olds has the lowest likelihood of being enrolled in a private school, with 414 (100.0% in the age bracket) attending a public institution.
| Age Bracket | Public School | Private School |
| 3 to 4 Year Olds | 0 (0.0%) | 51 (100.0%) |
| 5 to 9 Year Old | 286 (93.5%) | 20 (6.5%) |
| 10 to 14 Year Olds | 414 (100.0%) | 0 (0.0%) |
| 15 to 17 Year Olds | 95 (100.0%) | 0 (0.0%) |
| 18 to 19 Year Olds | 0 (0.0%) | 25 (100.0%) |
| 20 to 24 Year Olds | 34 (100.0%) | 0 (0.0%) |
| 25 to 34 Year Olds | 25 (100.0%) | 0 (0.0%) |
| 35 Years and over | 0 (0.0%) | 15 (100.0%) |
| Total | 854 (88.5%) | 111 (11.5%) |
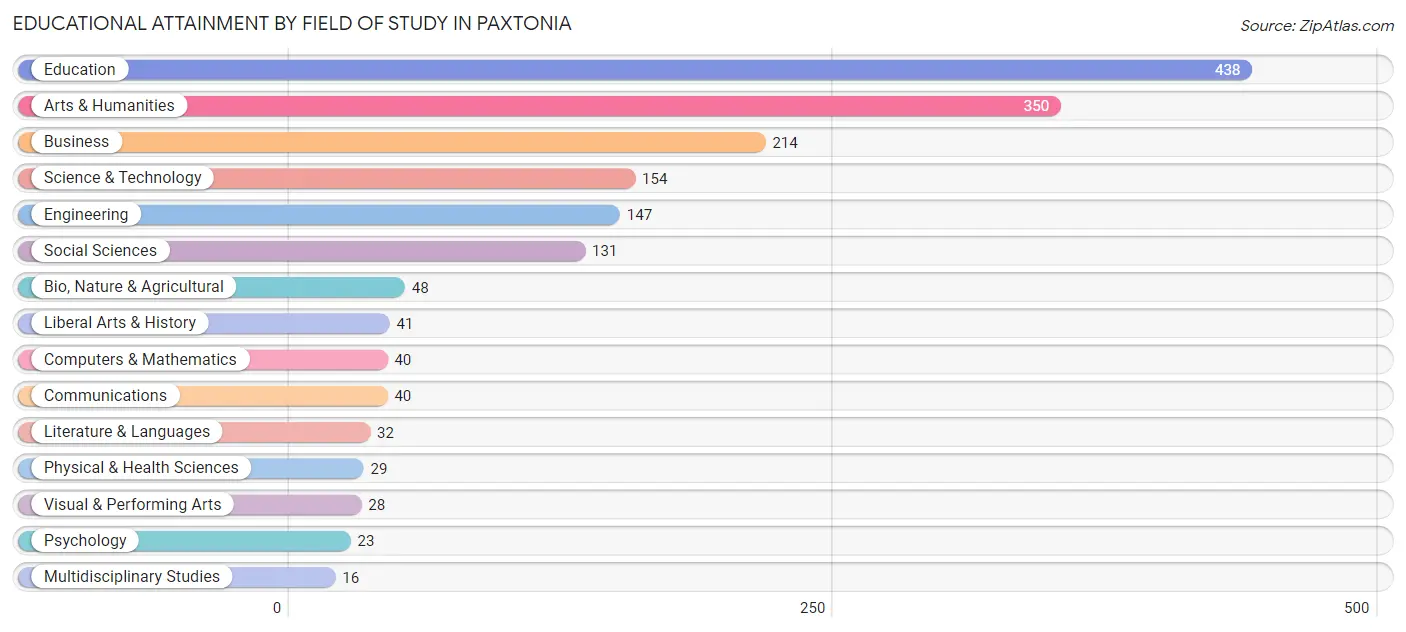
Educational Attainment by Field of Study in Paxtonia
Education (438 | 25.3%), arts & humanities (350 | 20.2%), business (214 | 12.4%), science & technology (154 | 8.9%), and engineering (147 | 8.5%) are the most common fields of study among 1,731 individuals in Paxtonia who have obtained a bachelor's degree or higher.
| Field of Study | # Graduates | % Graduates |
| Computers & Mathematics | 40 | 2.3% |
| Bio, Nature & Agricultural | 48 | 2.8% |
| Physical & Health Sciences | 29 | 1.7% |
| Psychology | 23 | 1.3% |
| Social Sciences | 131 | 7.6% |
| Engineering | 147 | 8.5% |
| Multidisciplinary Studies | 16 | 0.9% |
| Science & Technology | 154 | 8.9% |
| Business | 214 | 12.4% |
| Education | 438 | 25.3% |
| Literature & Languages | 32 | 1.8% |
| Liberal Arts & History | 41 | 2.4% |
| Visual & Performing Arts | 28 | 1.6% |
| Communications | 40 | 2.3% |
| Arts & Humanities | 350 | 20.2% |
| Total | 1,731 | 100.0% |
Transportation & Commute in Paxtonia
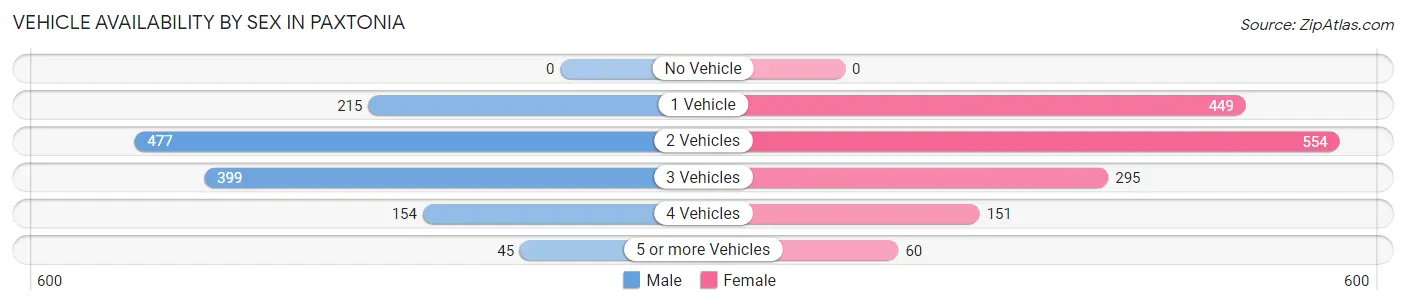
Vehicle Availability by Sex in Paxtonia
The most prevalent vehicle ownership categories in Paxtonia are males with 2 vehicles (477, accounting for 37.0%) and females with 2 vehicles (554, making up 31.6%).
| Vehicles Available | Male | Female |
| No Vehicle | 0 (0.0%) | 0 (0.0%) |
| 1 Vehicle | 215 (16.7%) | 449 (29.7%) |
| 2 Vehicles | 477 (37.0%) | 554 (36.7%) |
| 3 Vehicles | 399 (30.9%) | 295 (19.6%) |
| 4 Vehicles | 154 (11.9%) | 151 (10.0%) |
| 5 or more Vehicles | 45 (3.5%) | 60 (4.0%) |
| Total | 1,290 (100.0%) | 1,509 (100.0%) |
Commute Time in Paxtonia
The most frequently occuring commute durations in Paxtonia are 15 to 19 minutes (787 commuters, 31.3%), 20 to 24 minutes (594 commuters, 23.7%), and 10 to 14 minutes (320 commuters, 12.7%).
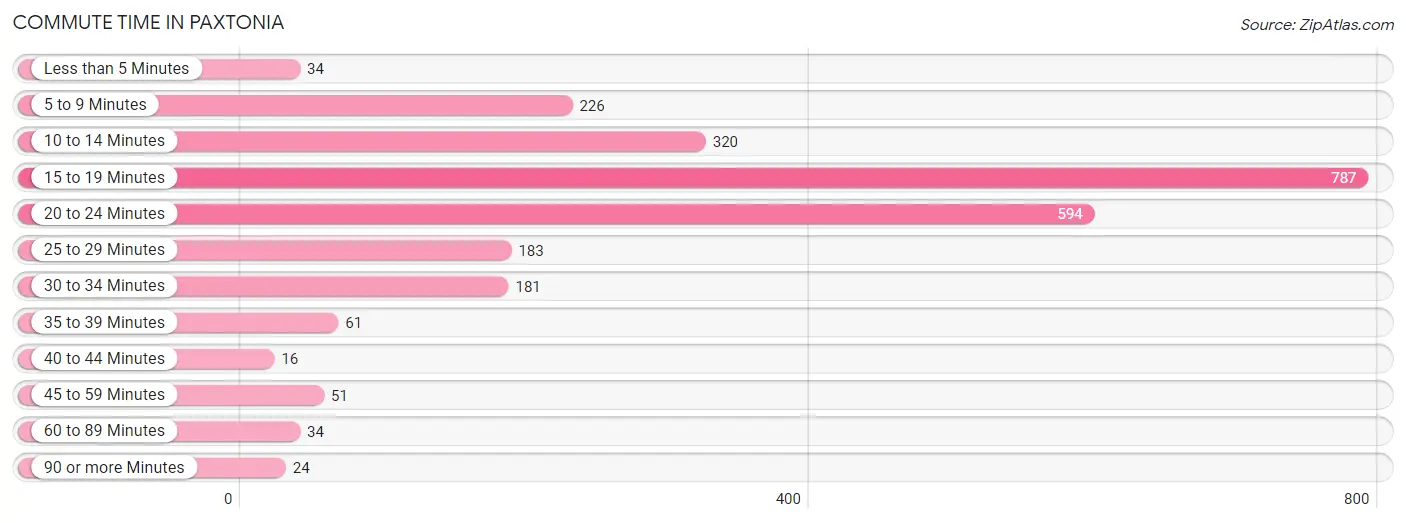
| Commute Time | # Commuters | % Commuters |
| Less than 5 Minutes | 34 | 1.3% |
| 5 to 9 Minutes | 226 | 9.0% |
| 10 to 14 Minutes | 320 | 12.7% |
| 15 to 19 Minutes | 787 | 31.3% |
| 20 to 24 Minutes | 594 | 23.7% |
| 25 to 29 Minutes | 183 | 7.3% |
| 30 to 34 Minutes | 181 | 7.2% |
| 35 to 39 Minutes | 61 | 2.4% |
| 40 to 44 Minutes | 16 | 0.6% |
| 45 to 59 Minutes | 51 | 2.0% |
| 60 to 89 Minutes | 34 | 1.3% |
| 90 or more Minutes | 24 | 1.0% |
Commute Time by Sex in Paxtonia
The most common commute times in Paxtonia are 20 to 24 minutes (375 commuters, 32.4%) for males and 15 to 19 minutes (514 commuters, 37.9%) for females.
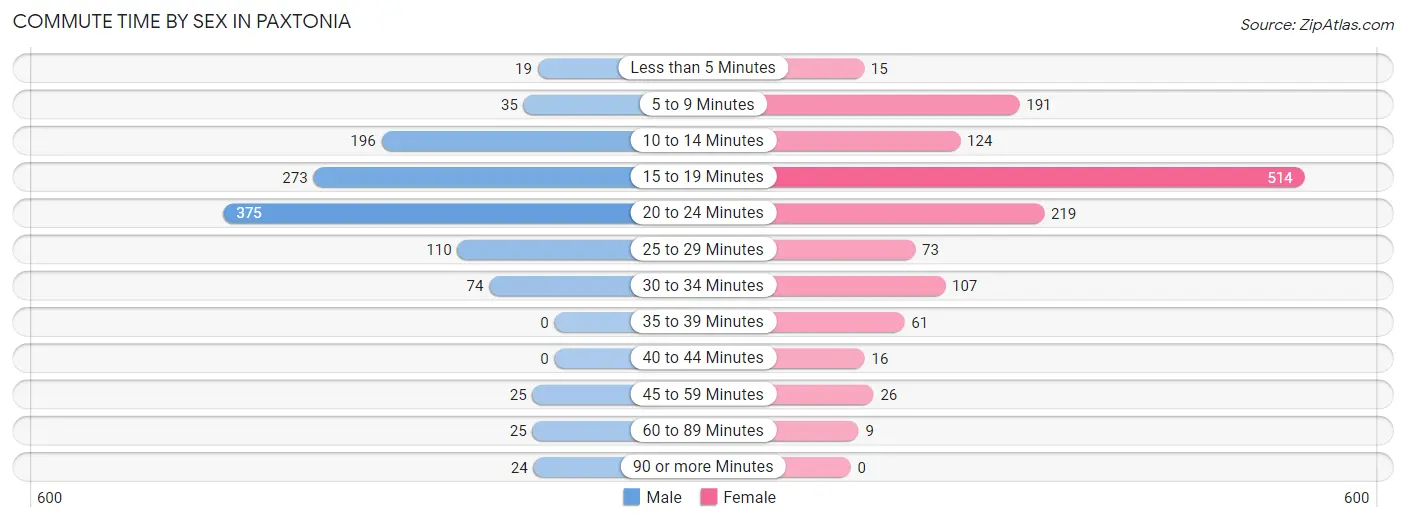
| Commute Time | Male | Female |
| Less than 5 Minutes | 19 (1.6%) | 15 (1.1%) |
| 5 to 9 Minutes | 35 (3.0%) | 191 (14.1%) |
| 10 to 14 Minutes | 196 (17.0%) | 124 (9.1%) |
| 15 to 19 Minutes | 273 (23.6%) | 514 (37.9%) |
| 20 to 24 Minutes | 375 (32.4%) | 219 (16.2%) |
| 25 to 29 Minutes | 110 (9.5%) | 73 (5.4%) |
| 30 to 34 Minutes | 74 (6.4%) | 107 (7.9%) |
| 35 to 39 Minutes | 0 (0.0%) | 61 (4.5%) |
| 40 to 44 Minutes | 0 (0.0%) | 16 (1.2%) |
| 45 to 59 Minutes | 25 (2.2%) | 26 (1.9%) |
| 60 to 89 Minutes | 25 (2.2%) | 9 (0.7%) |
| 90 or more Minutes | 24 (2.1%) | 0 (0.0%) |
Time of Departure to Work by Sex in Paxtonia
The most frequent times of departure to work in Paxtonia are 8:00 AM to 8:29 AM (227, 19.6%) for males and 7:00 AM to 7:29 AM (297, 21.9%) for females.
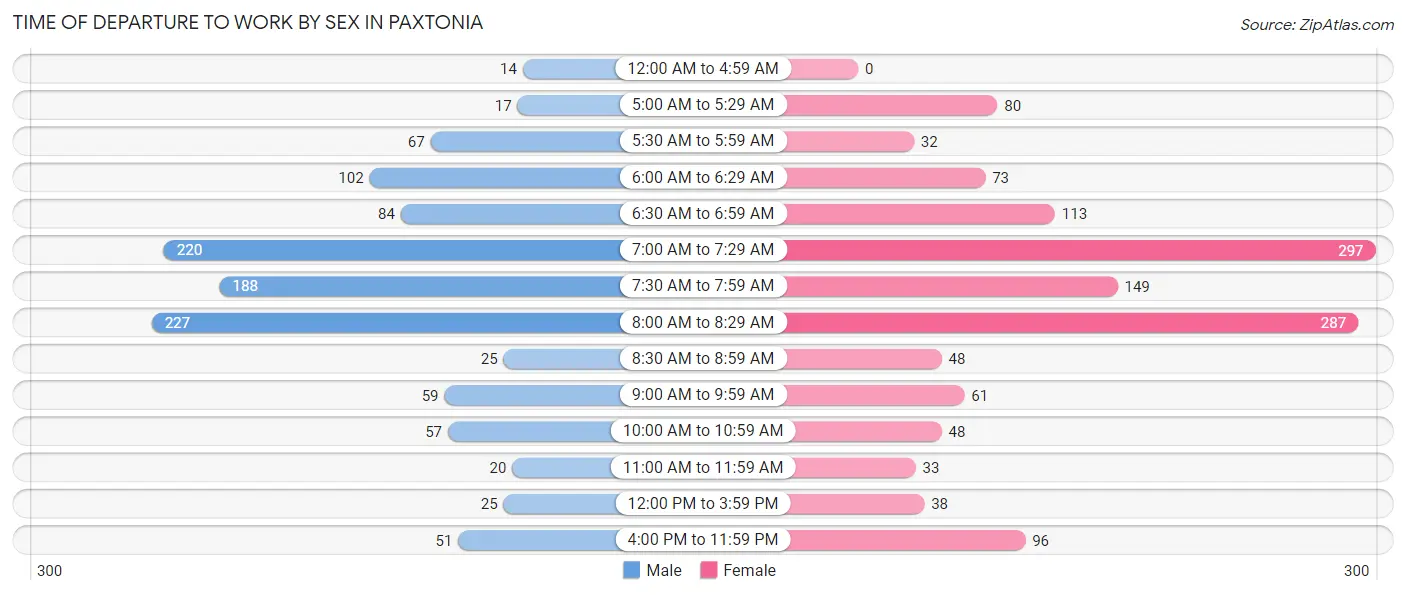
| Time of Departure | Male | Female |
| 12:00 AM to 4:59 AM | 14 (1.2%) | 0 (0.0%) |
| 5:00 AM to 5:29 AM | 17 (1.5%) | 80 (5.9%) |
| 5:30 AM to 5:59 AM | 67 (5.8%) | 32 (2.4%) |
| 6:00 AM to 6:29 AM | 102 (8.8%) | 73 (5.4%) |
| 6:30 AM to 6:59 AM | 84 (7.3%) | 113 (8.3%) |
| 7:00 AM to 7:29 AM | 220 (19.0%) | 297 (21.9%) |
| 7:30 AM to 7:59 AM | 188 (16.3%) | 149 (11.0%) |
| 8:00 AM to 8:29 AM | 227 (19.6%) | 287 (21.2%) |
| 8:30 AM to 8:59 AM | 25 (2.2%) | 48 (3.5%) |
| 9:00 AM to 9:59 AM | 59 (5.1%) | 61 (4.5%) |
| 10:00 AM to 10:59 AM | 57 (4.9%) | 48 (3.5%) |
| 11:00 AM to 11:59 AM | 20 (1.7%) | 33 (2.4%) |
| 12:00 PM to 3:59 PM | 25 (2.2%) | 38 (2.8%) |
| 4:00 PM to 11:59 PM | 51 (4.4%) | 96 (7.1%) |
| Total | 1,156 (100.0%) | 1,355 (100.0%) |
Housing Occupancy in Paxtonia
Occupancy by Ownership in Paxtonia
Of the total 2,164 dwellings in Paxtonia, owner-occupied units account for 1,342 (62.0%), while renter-occupied units make up 822 (38.0%).
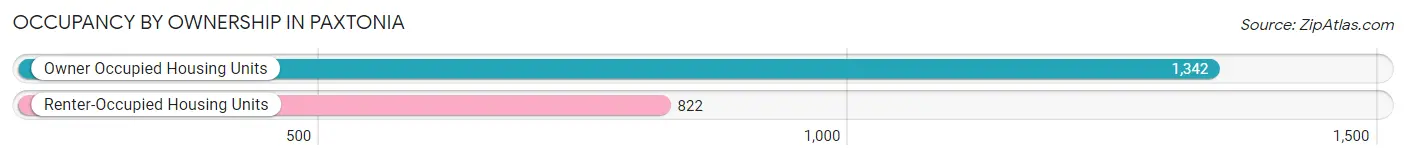
| Occupancy | # Housing Units | % Housing Units |
| Owner Occupied Housing Units | 1,342 | 62.0% |
| Renter-Occupied Housing Units | 822 | 38.0% |
| Total Occupied Housing Units | 2,164 | 100.0% |
Occupancy by Household Size in Paxtonia
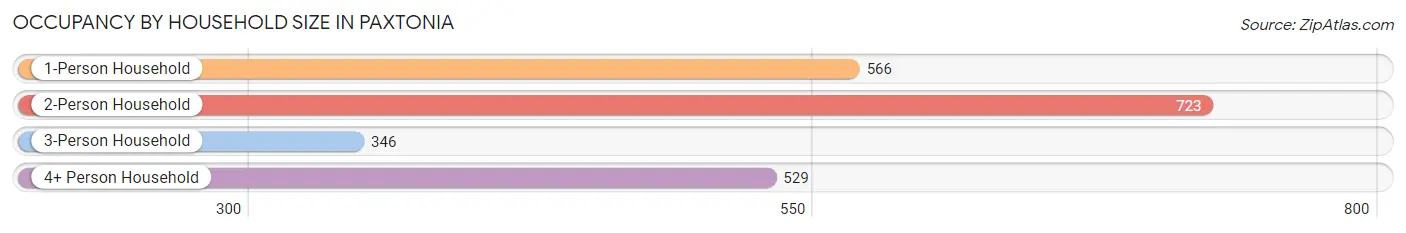
| Household Size | # Housing Units | % Housing Units |
| 1-Person Household | 566 | 26.2% |
| 2-Person Household | 723 | 33.4% |
| 3-Person Household | 346 | 16.0% |
| 4+ Person Household | 529 | 24.4% |
| Total Housing Units | 2,164 | 100.0% |
Occupancy by Ownership by Household Size in Paxtonia
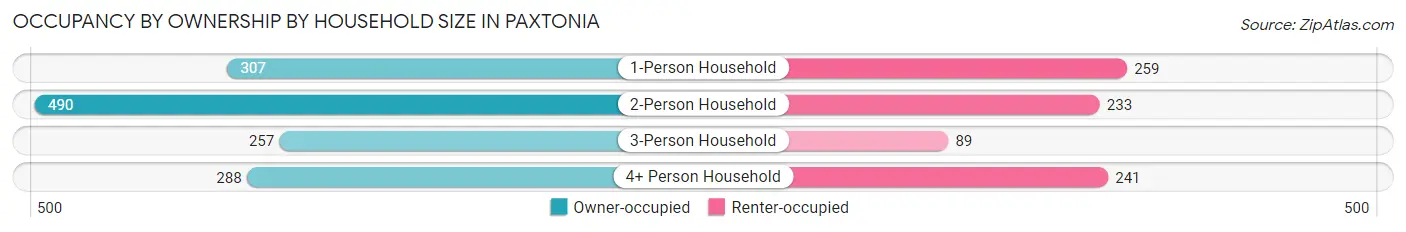
| Household Size | Owner-occupied | Renter-occupied |
| 1-Person Household | 307 (54.2%) | 259 (45.8%) |
| 2-Person Household | 490 (67.8%) | 233 (32.2%) |
| 3-Person Household | 257 (74.3%) | 89 (25.7%) |
| 4+ Person Household | 288 (54.4%) | 241 (45.6%) |
| Total Housing Units | 1,342 (62.0%) | 822 (38.0%) |
Occupancy by Educational Attainment in Paxtonia
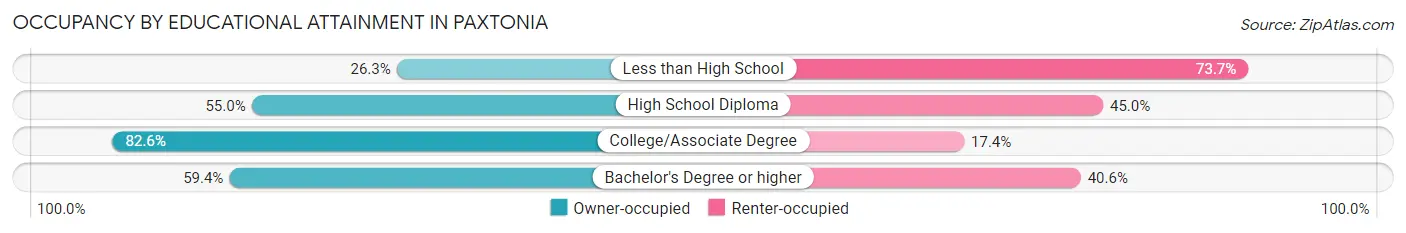
| Household Size | Owner-occupied | Renter-occupied |
| Less than High School | 26 (26.3%) | 73 (73.7%) |
| High School Diploma | 285 (55.0%) | 233 (45.0%) |
| College/Associate Degree | 398 (82.6%) | 84 (17.4%) |
| Bachelor's Degree or higher | 633 (59.4%) | 432 (40.6%) |
Occupancy by Age of Householder in Paxtonia
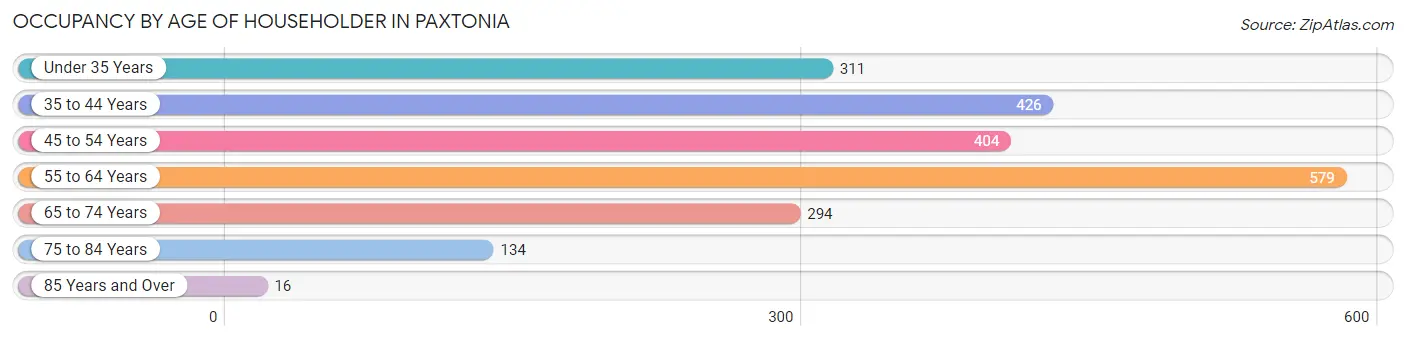
| Age Bracket | # Households | % Households |
| Under 35 Years | 311 | 14.4% |
| 35 to 44 Years | 426 | 19.7% |
| 45 to 54 Years | 404 | 18.7% |
| 55 to 64 Years | 579 | 26.8% |
| 65 to 74 Years | 294 | 13.6% |
| 75 to 84 Years | 134 | 6.2% |
| 85 Years and Over | 16 | 0.7% |
| Total | 2,164 | 100.0% |
Housing Finances in Paxtonia
Median Income by Occupancy in Paxtonia
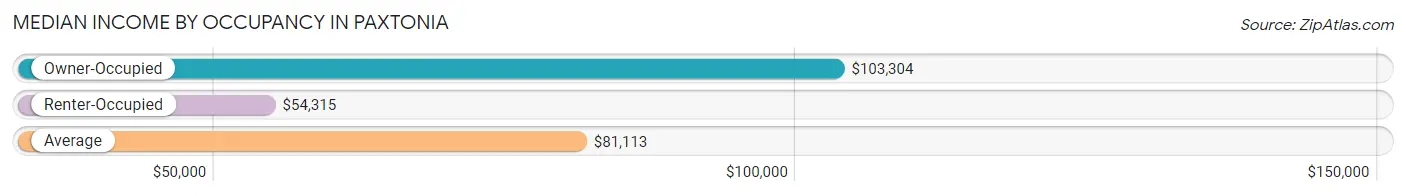
| Occupancy Type | # Households | Median Income |
| Owner-Occupied | 1,342 (62.0%) | $103,304 |
| Renter-Occupied | 822 (38.0%) | $54,315 |
| Average | 2,164 (100.0%) | $81,113 |
Occupancy by Householder Income Bracket in Paxtonia
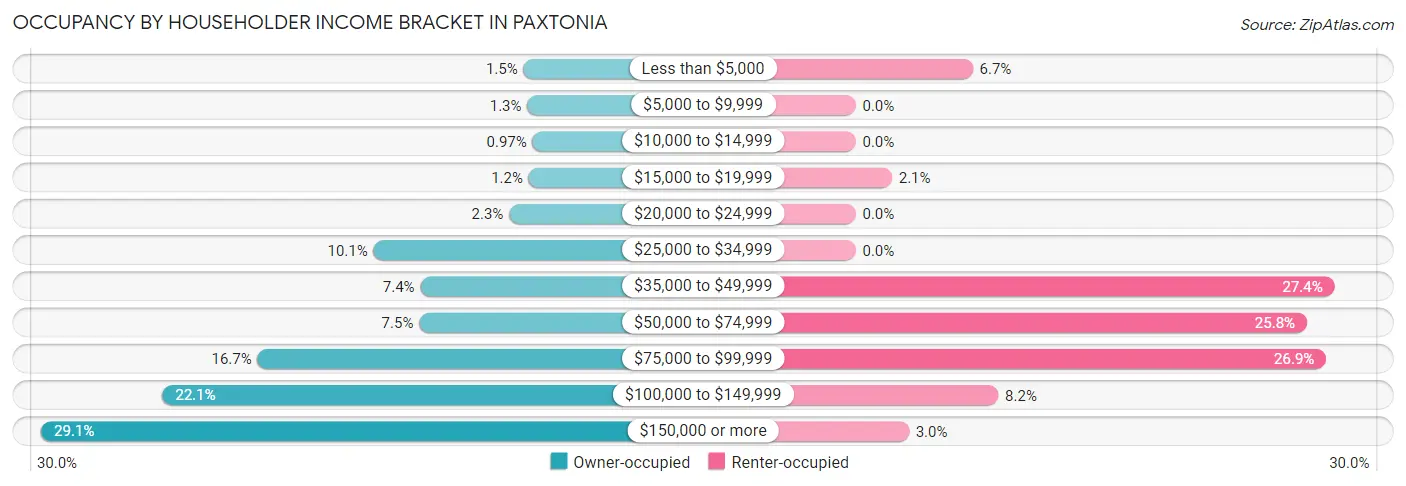
| Income Bracket | Owner-occupied | Renter-occupied |
| Less than $5,000 | 20 (1.5%) | 55 (6.7%) |
| $5,000 to $9,999 | 17 (1.3%) | 0 (0.0%) |
| $10,000 to $14,999 | 13 (1.0%) | 0 (0.0%) |
| $15,000 to $19,999 | 16 (1.2%) | 17 (2.1%) |
| $20,000 to $24,999 | 31 (2.3%) | 0 (0.0%) |
| $25,000 to $34,999 | 135 (10.1%) | 0 (0.0%) |
| $35,000 to $49,999 | 99 (7.4%) | 225 (27.4%) |
| $50,000 to $74,999 | 100 (7.4%) | 212 (25.8%) |
| $75,000 to $99,999 | 224 (16.7%) | 221 (26.9%) |
| $100,000 to $149,999 | 297 (22.1%) | 67 (8.2%) |
| $150,000 or more | 390 (29.1%) | 25 (3.0%) |
| Total | 1,342 (100.0%) | 822 (100.0%) |
Monthly Housing Cost Tiers in Paxtonia
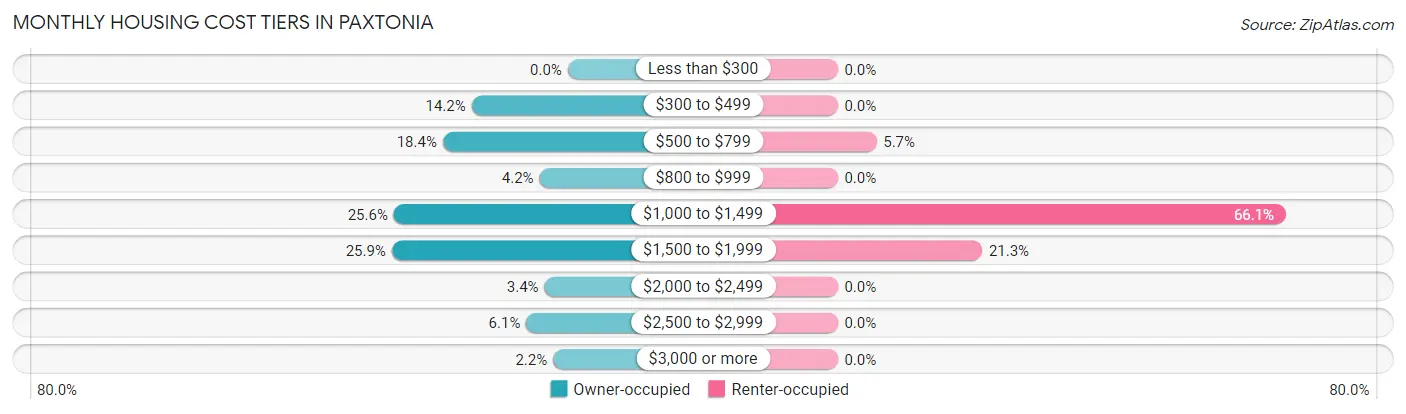
| Monthly Cost | Owner-occupied | Renter-occupied |
| Less than $300 | 0 (0.0%) | 0 (0.0%) |
| $300 to $499 | 190 (14.2%) | 0 (0.0%) |
| $500 to $799 | 247 (18.4%) | 47 (5.7%) |
| $800 to $999 | 56 (4.2%) | 0 (0.0%) |
| $1,000 to $1,499 | 344 (25.6%) | 543 (66.1%) |
| $1,500 to $1,999 | 348 (25.9%) | 175 (21.3%) |
| $2,000 to $2,499 | 46 (3.4%) | 0 (0.0%) |
| $2,500 to $2,999 | 82 (6.1%) | 0 (0.0%) |
| $3,000 or more | 29 (2.2%) | 0 (0.0%) |
| Total | 1,342 (100.0%) | 822 (100.0%) |
Physical Housing Characteristics in Paxtonia
Housing Structures in Paxtonia
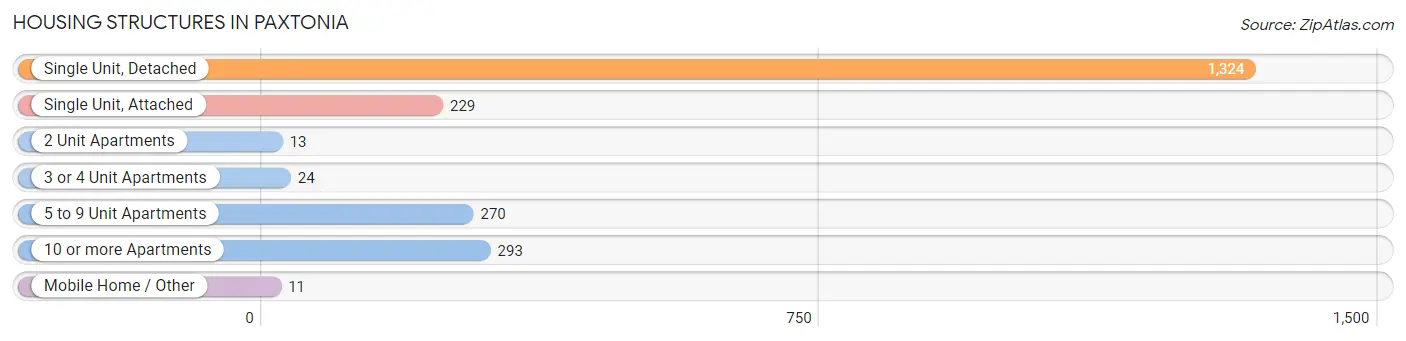
| Structure Type | # Housing Units | % Housing Units |
| Single Unit, Detached | 1,324 | 61.2% |
| Single Unit, Attached | 229 | 10.6% |
| 2 Unit Apartments | 13 | 0.6% |
| 3 or 4 Unit Apartments | 24 | 1.1% |
| 5 to 9 Unit Apartments | 270 | 12.5% |
| 10 or more Apartments | 293 | 13.5% |
| Mobile Home / Other | 11 | 0.5% |
| Total | 2,164 | 100.0% |
Housing Structures by Occupancy in Paxtonia
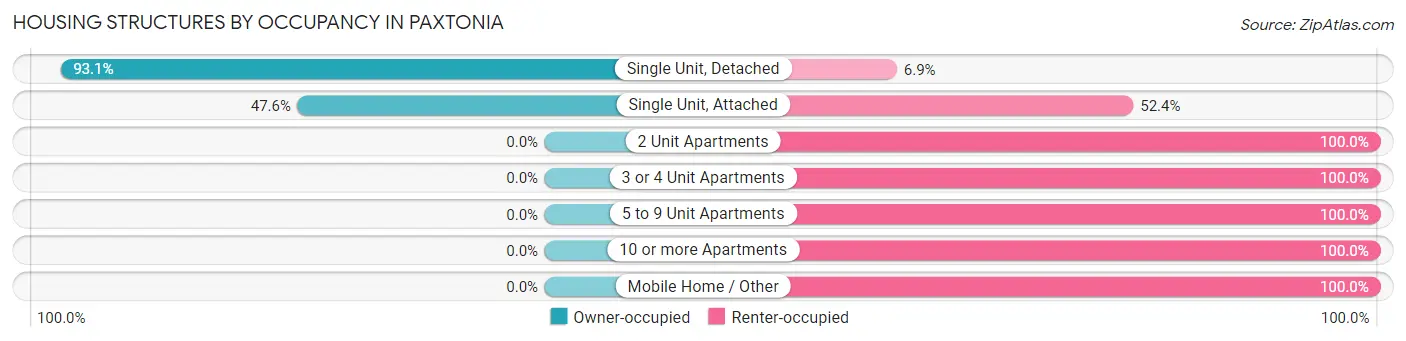
| Structure Type | Owner-occupied | Renter-occupied |
| Single Unit, Detached | 1,233 (93.1%) | 91 (6.9%) |
| Single Unit, Attached | 109 (47.6%) | 120 (52.4%) |
| 2 Unit Apartments | 0 (0.0%) | 13 (100.0%) |
| 3 or 4 Unit Apartments | 0 (0.0%) | 24 (100.0%) |
| 5 to 9 Unit Apartments | 0 (0.0%) | 270 (100.0%) |
| 10 or more Apartments | 0 (0.0%) | 293 (100.0%) |
| Mobile Home / Other | 0 (0.0%) | 11 (100.0%) |
| Total | 1,342 (62.0%) | 822 (38.0%) |
Housing Structures by Number of Rooms in Paxtonia
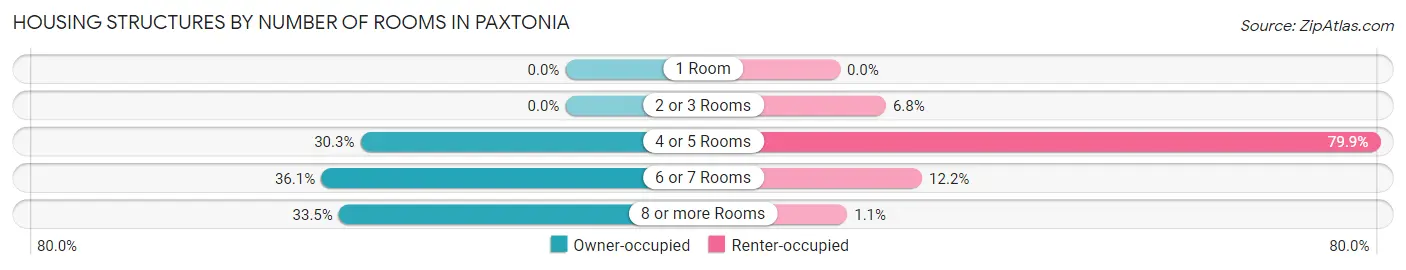
| Number of Rooms | Owner-occupied | Renter-occupied |
| 1 Room | 0 (0.0%) | 0 (0.0%) |
| 2 or 3 Rooms | 0 (0.0%) | 56 (6.8%) |
| 4 or 5 Rooms | 407 (30.3%) | 657 (79.9%) |
| 6 or 7 Rooms | 485 (36.1%) | 100 (12.2%) |
| 8 or more Rooms | 450 (33.5%) | 9 (1.1%) |
| Total | 1,342 (100.0%) | 822 (100.0%) |
Housing Structure by Heating Type in Paxtonia
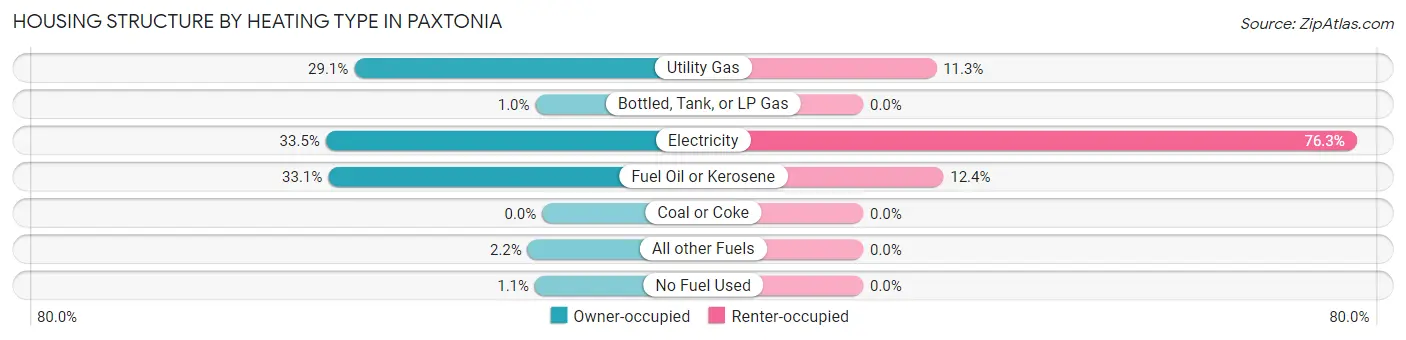
| Heating Type | Owner-occupied | Renter-occupied |
| Utility Gas | 390 (29.1%) | 93 (11.3%) |
| Bottled, Tank, or LP Gas | 14 (1.0%) | 0 (0.0%) |
| Electricity | 449 (33.5%) | 627 (76.3%) |
| Fuel Oil or Kerosene | 444 (33.1%) | 102 (12.4%) |
| Coal or Coke | 0 (0.0%) | 0 (0.0%) |
| All other Fuels | 30 (2.2%) | 0 (0.0%) |
| No Fuel Used | 15 (1.1%) | 0 (0.0%) |
| Total | 1,342 (100.0%) | 822 (100.0%) |
Household Vehicle Usage in Paxtonia
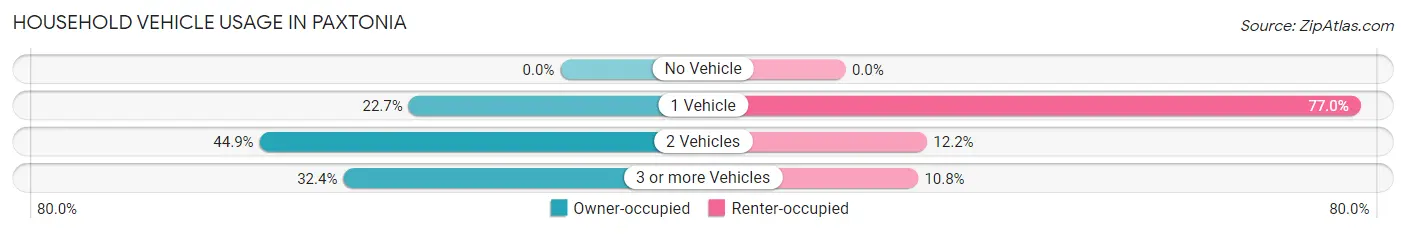
| Vehicles per Household | Owner-occupied | Renter-occupied |
| No Vehicle | 0 (0.0%) | 0 (0.0%) |
| 1 Vehicle | 304 (22.7%) | 633 (77.0%) |
| 2 Vehicles | 603 (44.9%) | 100 (12.2%) |
| 3 or more Vehicles | 435 (32.4%) | 89 (10.8%) |
| Total | 1,342 (100.0%) | 822 (100.0%) |
Real Estate & Mortgages in Paxtonia
Real Estate and Mortgage Overview in Paxtonia
| Characteristic | Without Mortgage | With Mortgage |
| Housing Units | 474 | 868 |
| Median Property Value | $229,000 | $236,500 |
| Median Household Income | $77,813 | $298 |
| Monthly Housing Costs | $536 | $29 |
| Real Estate Taxes | $2,454 | $0 |
Property Value by Mortgage Status in Paxtonia
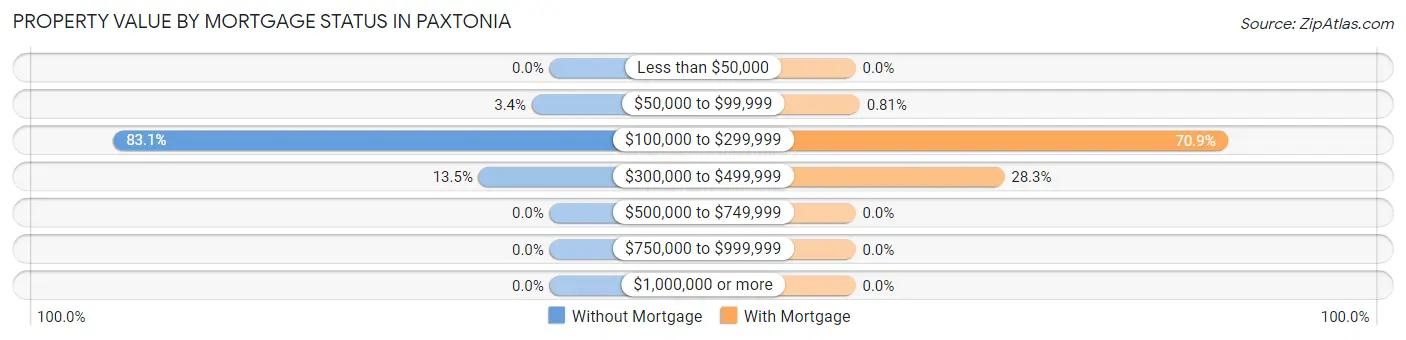
| Property Value | Without Mortgage | With Mortgage |
| Less than $50,000 | 0 (0.0%) | 0 (0.0%) |
| $50,000 to $99,999 | 16 (3.4%) | 7 (0.8%) |
| $100,000 to $299,999 | 394 (83.1%) | 615 (70.9%) |
| $300,000 to $499,999 | 64 (13.5%) | 246 (28.3%) |
| $500,000 to $749,999 | 0 (0.0%) | 0 (0.0%) |
| $750,000 to $999,999 | 0 (0.0%) | 0 (0.0%) |
| $1,000,000 or more | 0 (0.0%) | 0 (0.0%) |
| Total | 474 (100.0%) | 868 (100.0%) |
Household Income by Mortgage Status in Paxtonia
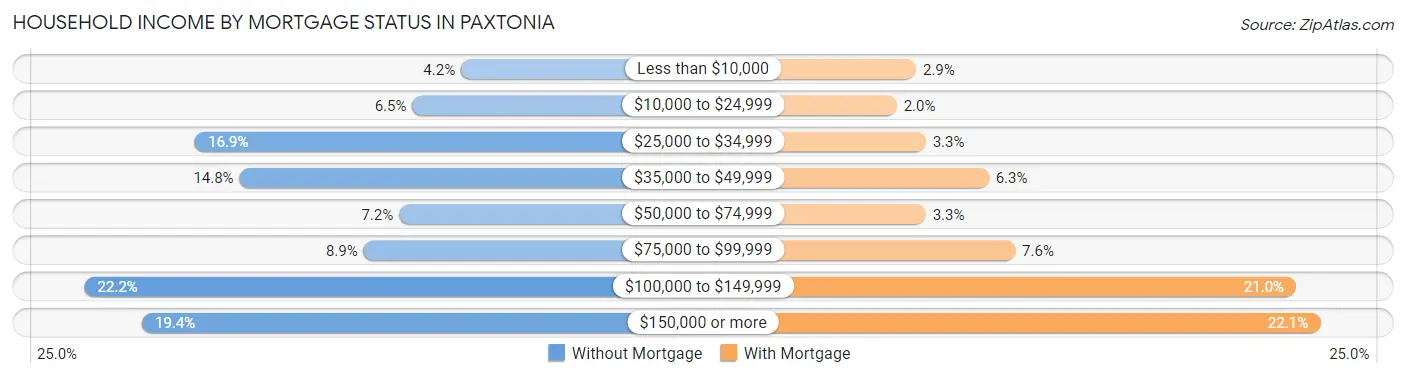
| Household Income | Without Mortgage | With Mortgage |
| Less than $10,000 | 20 (4.2%) | 25 (2.9%) |
| $10,000 to $24,999 | 31 (6.5%) | 17 (2.0%) |
| $25,000 to $34,999 | 80 (16.9%) | 29 (3.3%) |
| $35,000 to $49,999 | 70 (14.8%) | 55 (6.3%) |
| $50,000 to $74,999 | 34 (7.2%) | 29 (3.3%) |
| $75,000 to $99,999 | 42 (8.9%) | 66 (7.6%) |
| $100,000 to $149,999 | 105 (22.2%) | 182 (21.0%) |
| $150,000 or more | 92 (19.4%) | 192 (22.1%) |
| Total | 474 (100.0%) | 868 (100.0%) |
Property Value to Household Income Ratio in Paxtonia
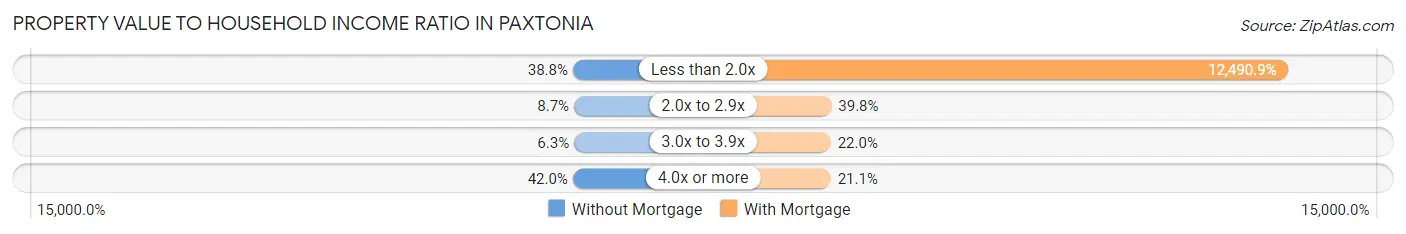
| Value-to-Income Ratio | Without Mortgage | With Mortgage |
| Less than 2.0x | 184 (38.8%) | 108,421 (12,490.9%) |
| 2.0x to 2.9x | 41 (8.6%) | 345 (39.8%) |
| 3.0x to 3.9x | 30 (6.3%) | 191 (22.0%) |
| 4.0x or more | 199 (42.0%) | 183 (21.1%) |
| Total | 474 (100.0%) | 868 (100.0%) |
Real Estate Taxes by Mortgage Status in Paxtonia
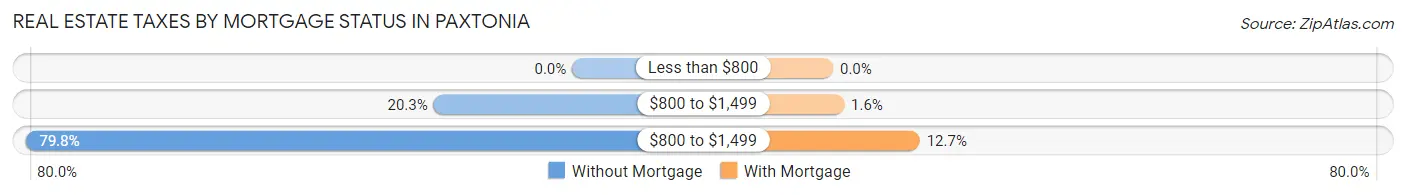
| Property Taxes | Without Mortgage | With Mortgage |
| Less than $800 | 0 (0.0%) | 0 (0.0%) |
| $800 to $1,499 | 96 (20.3%) | 14 (1.6%) |
| $800 to $1,499 | 378 (79.7%) | 110 (12.7%) |
| Total | 474 (100.0%) | 868 (100.0%) |
Health & Disability in Paxtonia
Health Insurance Coverage by Age in Paxtonia
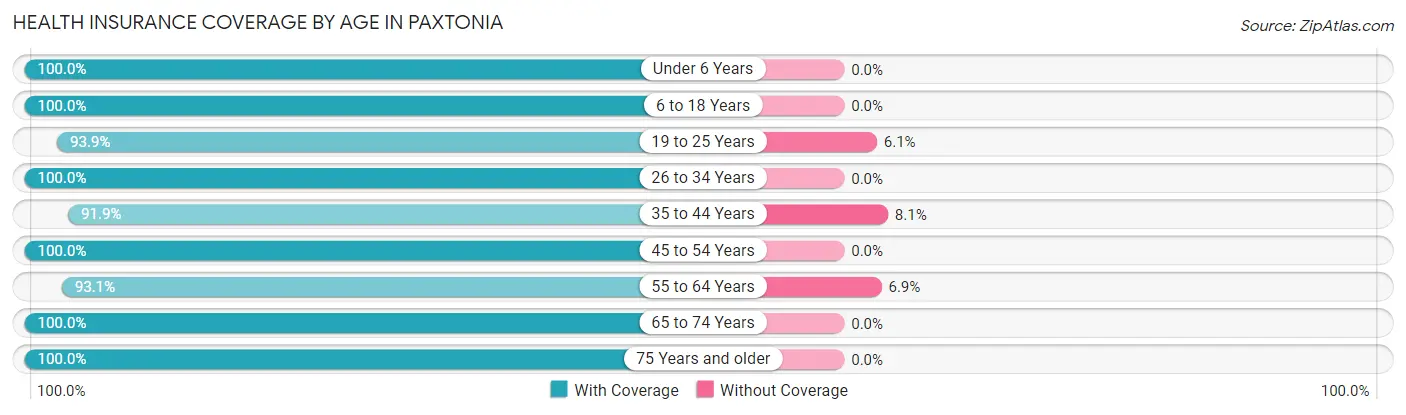
| Age Bracket | With Coverage | Without Coverage |
| Under 6 Years | 361 (100.0%) | 0 (0.0%) |
| 6 to 18 Years | 675 (100.0%) | 0 (0.0%) |
| 19 to 25 Years | 464 (93.9%) | 30 (6.1%) |
| 26 to 34 Years | 512 (100.0%) | 0 (0.0%) |
| 35 to 44 Years | 768 (91.9%) | 68 (8.1%) |
| 45 to 54 Years | 695 (100.0%) | 0 (0.0%) |
| 55 to 64 Years | 925 (93.1%) | 69 (6.9%) |
| 65 to 74 Years | 639 (100.0%) | 0 (0.0%) |
| 75 Years and older | 274 (100.0%) | 0 (0.0%) |
| Total | 5,313 (97.0%) | 167 (3.0%) |
Health Insurance Coverage by Citizenship Status in Paxtonia
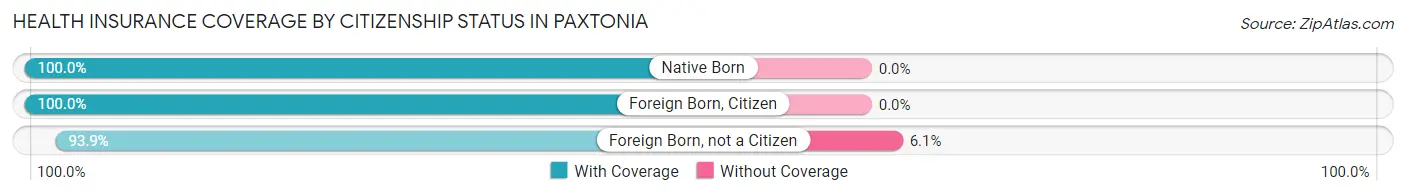
| Citizenship Status | With Coverage | Without Coverage |
| Native Born | 361 (100.0%) | 0 (0.0%) |
| Foreign Born, Citizen | 675 (100.0%) | 0 (0.0%) |
| Foreign Born, not a Citizen | 464 (93.9%) | 30 (6.1%) |
Health Insurance Coverage by Household Income in Paxtonia
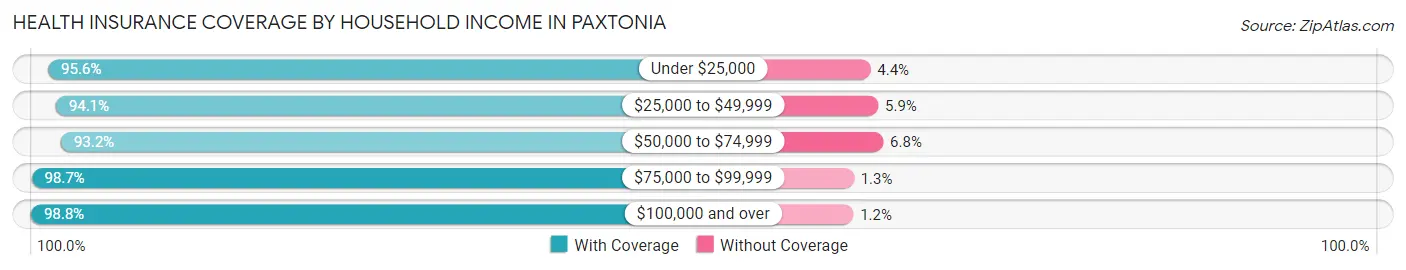
| Household Income | With Coverage | Without Coverage |
| Under $25,000 | 325 (95.6%) | 15 (4.4%) |
| $25,000 to $49,999 | 1,029 (94.1%) | 64 (5.9%) |
| $50,000 to $74,999 | 643 (93.2%) | 47 (6.8%) |
| $75,000 to $99,999 | 996 (98.7%) | 13 (1.3%) |
| $100,000 and over | 2,306 (98.8%) | 28 (1.2%) |
Public vs Private Health Insurance Coverage by Age in Paxtonia
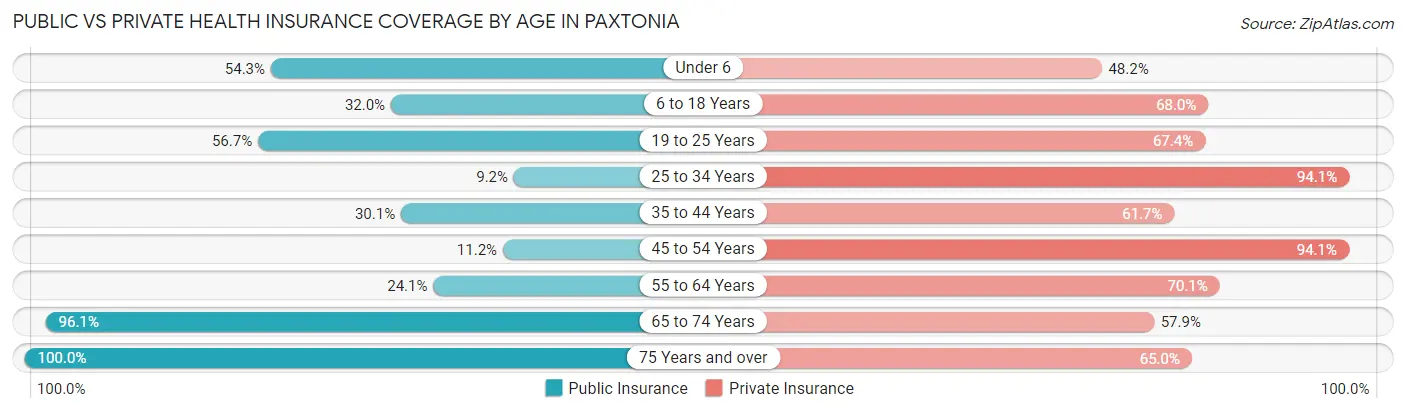
| Age Bracket | Public Insurance | Private Insurance |
| Under 6 | 196 (54.3%) | 174 (48.2%) |
| 6 to 18 Years | 216 (32.0%) | 459 (68.0%) |
| 19 to 25 Years | 280 (56.7%) | 333 (67.4%) |
| 25 to 34 Years | 47 (9.2%) | 482 (94.1%) |
| 35 to 44 Years | 252 (30.1%) | 516 (61.7%) |
| 45 to 54 Years | 78 (11.2%) | 654 (94.1%) |
| 55 to 64 Years | 240 (24.1%) | 697 (70.1%) |
| 65 to 74 Years | 614 (96.1%) | 370 (57.9%) |
| 75 Years and over | 274 (100.0%) | 178 (65.0%) |
| Total | 2,197 (40.1%) | 3,863 (70.5%) |
Disability Status by Sex by Age in Paxtonia
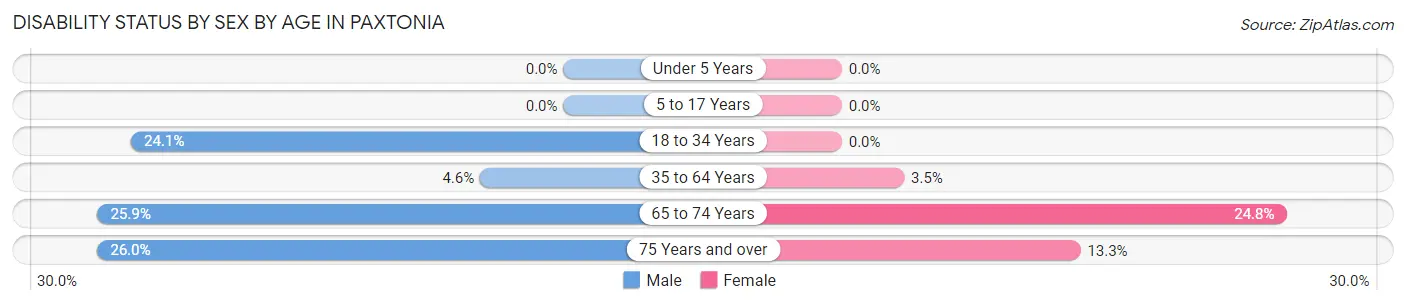
| Age Bracket | Male | Female |
| Under 5 Years | 0 (0.0%) | 0 (0.0%) |
| 5 to 17 Years | 0 (0.0%) | 0 (0.0%) |
| 18 to 34 Years | 148 (24.1%) | 0 (0.0%) |
| 35 to 64 Years | 49 (4.6%) | 51 (3.5%) |
| 65 to 74 Years | 62 (25.9%) | 99 (24.7%) |
| 75 Years and over | 34 (26.0%) | 19 (13.3%) |
Disability Class by Sex by Age in Paxtonia
Disability Class: Hearing Difficulty
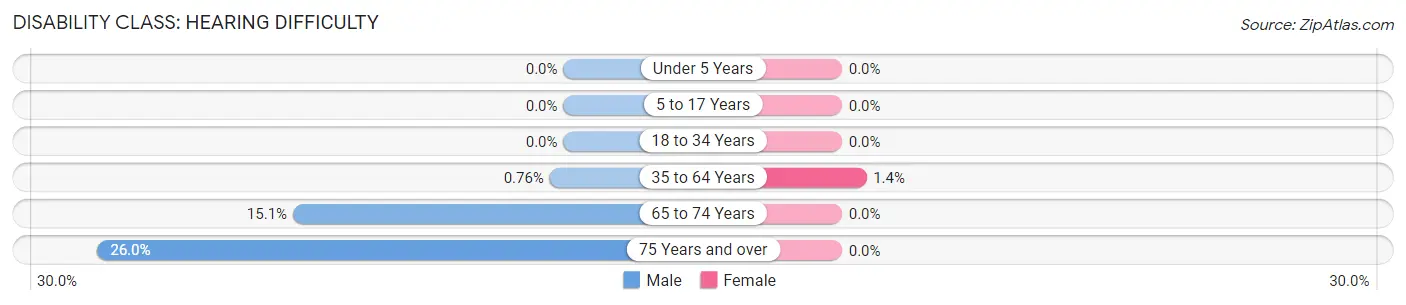
| Age Bracket | Male | Female |
| Under 5 Years | 0 (0.0%) | 0 (0.0%) |
| 5 to 17 Years | 0 (0.0%) | 0 (0.0%) |
| 18 to 34 Years | 0 (0.0%) | 0 (0.0%) |
| 35 to 64 Years | 8 (0.8%) | 20 (1.4%) |
| 65 to 74 Years | 36 (15.1%) | 0 (0.0%) |
| 75 Years and over | 34 (26.0%) | 0 (0.0%) |
Disability Class: Vision Difficulty
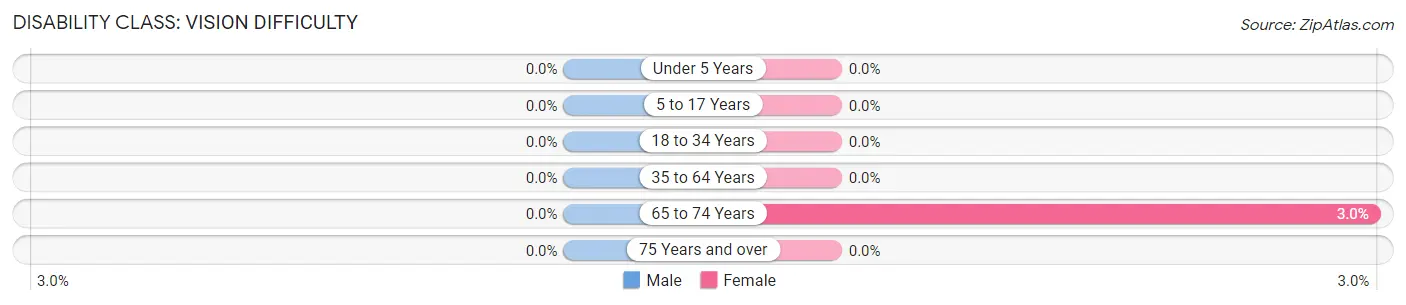
| Age Bracket | Male | Female |
| Under 5 Years | 0 (0.0%) | 0 (0.0%) |
| 5 to 17 Years | 0 (0.0%) | 0 (0.0%) |
| 18 to 34 Years | 0 (0.0%) | 0 (0.0%) |
| 35 to 64 Years | 0 (0.0%) | 0 (0.0%) |
| 65 to 74 Years | 0 (0.0%) | 12 (3.0%) |
| 75 Years and over | 0 (0.0%) | 0 (0.0%) |
Disability Class: Cognitive Difficulty
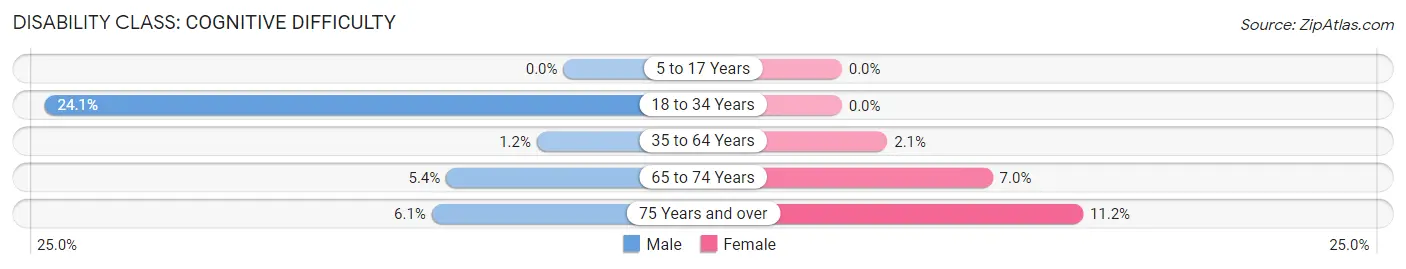
| Age Bracket | Male | Female |
| 5 to 17 Years | 0 (0.0%) | 0 (0.0%) |
| 18 to 34 Years | 148 (24.1%) | 0 (0.0%) |
| 35 to 64 Years | 13 (1.2%) | 31 (2.1%) |
| 65 to 74 Years | 13 (5.4%) | 28 (7.0%) |
| 75 Years and over | 8 (6.1%) | 16 (11.2%) |
Disability Class: Ambulatory Difficulty
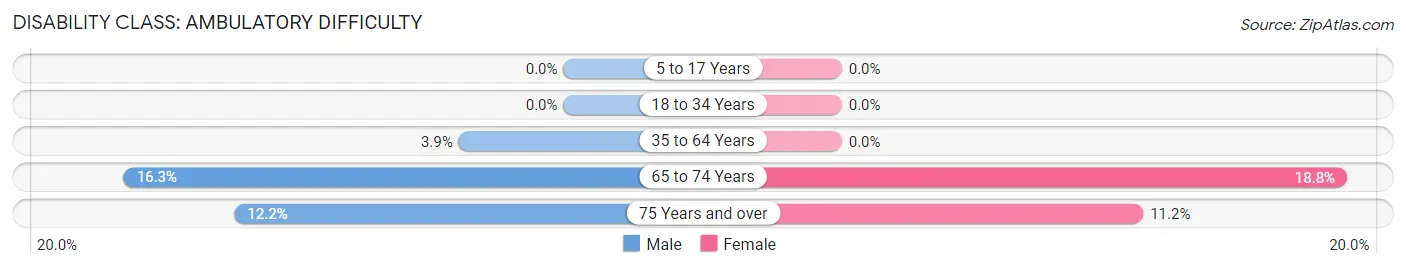
| Age Bracket | Male | Female |
| 5 to 17 Years | 0 (0.0%) | 0 (0.0%) |
| 18 to 34 Years | 0 (0.0%) | 0 (0.0%) |
| 35 to 64 Years | 41 (3.9%) | 0 (0.0%) |
| 65 to 74 Years | 39 (16.3%) | 75 (18.8%) |
| 75 Years and over | 16 (12.2%) | 16 (11.2%) |
Disability Class: Self-Care Difficulty
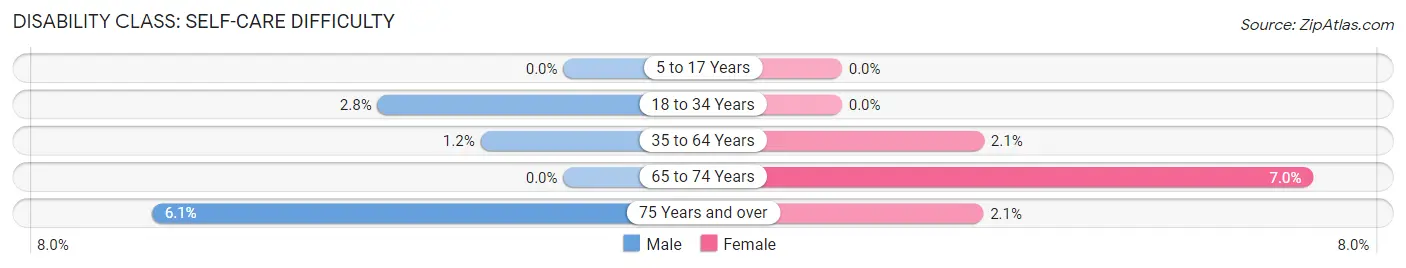
| Age Bracket | Male | Female |
| 5 to 17 Years | 0 (0.0%) | 0 (0.0%) |
| 18 to 34 Years | 17 (2.8%) | 0 (0.0%) |
| 35 to 64 Years | 13 (1.2%) | 31 (2.1%) |
| 65 to 74 Years | 0 (0.0%) | 28 (7.0%) |
| 75 Years and over | 8 (6.1%) | 3 (2.1%) |
Technology Access in Paxtonia
Computing Device Access in Paxtonia
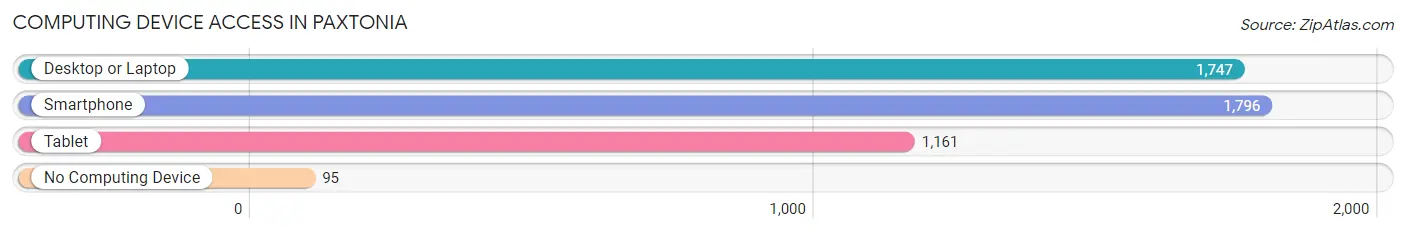
| Device Type | # Households | % Households |
| Desktop or Laptop | 1,747 | 80.7% |
| Smartphone | 1,796 | 83.0% |
| Tablet | 1,161 | 53.6% |
| No Computing Device | 95 | 4.4% |
| Total | 2,164 | 100.0% |
Internet Access in Paxtonia
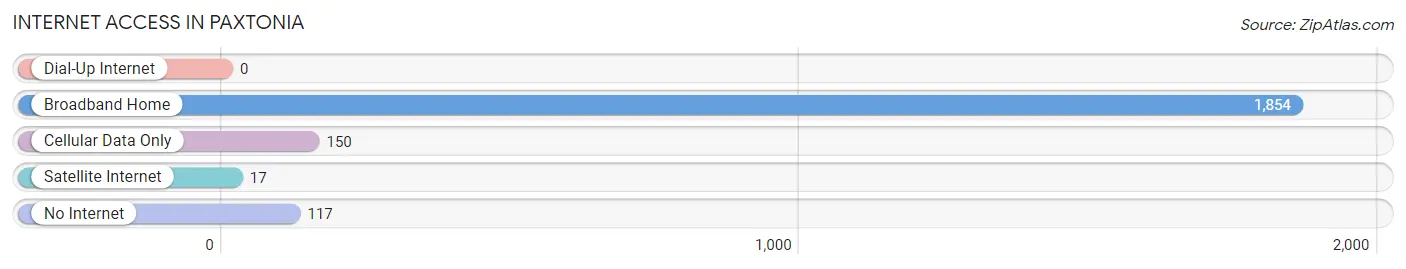
| Internet Type | # Households | % Households |
| Dial-Up Internet | 0 | 0.0% |
| Broadband Home | 1,854 | 85.7% |
| Cellular Data Only | 150 | 6.9% |
| Satellite Internet | 17 | 0.8% |
| No Internet | 117 | 5.4% |
| Total | 2,164 | 100.0% |
Paxtonia Summary
Paxtonia is a census-designated place (CDP) located in Lower Paxton Township, Dauphin County, Pennsylvania. It is part of the Harrisburg–Carlisle Metropolitan Statistical Area. The population was 8,945 at the 2010 census.
History
The area now known as Paxtonia was first settled in the late 1700s by German immigrants. The area was originally known as "Pax Town" after the Pax family, who were among the first settlers. The name was eventually changed to Paxtonia.
In the early 1900s, the area was largely agricultural, with many farms and small businesses. In the 1950s, the area began to experience rapid growth as the city of Harrisburg expanded and more people moved to the suburbs. This growth continued into the 1970s and 1980s, and Paxtonia became a popular residential area.
Geography
Paxtonia is located at 40°19'45" North, 76°51'45" West (40.329167, -76.862500). According to the United States Census Bureau, the CDP has a total area of 4.2 square miles (10.8 km2), all of it land.
Economy
Paxtonia is primarily a residential area, but there are several businesses located in the area. These include restaurants, retail stores, and professional services. The area is also home to several industrial parks, which provide employment opportunities for local residents.
Demographics
As of the 2010 census, there were 8,945 people, 3,717 households, and 2,541 families residing in the CDP. The population density was 2,125.2 people per square mile (819.7/km2). There were 3,945 housing units at an average density of 937.2/sq mi (362.3/km2). The racial makeup of the CDP was 92.2% White, 4.2% African American, 0.2% Native American, 1.3% Asian, 0.1% Pacific Islander, 0.7% from other races, and 1.3% from two or more races. Hispanic or Latino of any race were 2.2% of the population.
There were 3,717 households, out of which 28.2% had children under the age of 18 living with them, 54.2% were married couples living together, 10.2% had a female householder with no husband present, and 31.2% were non-families. 25.7% of all households were made up of individuals, and 10.2% had someone living alone who was 65 years of age or older. The average household size was 2.41 and the average family size was 2.89.
In the CDP, the population was spread out, with 22.2% under the age of 18, 6.7% from 18 to 24, 28.2% from 25 to 44, 25.7% from 45 to 64, and 17.2% who were 65 years of age or older. The median age was 40 years. For every 100 females, there were 92.2 males. For every 100 females age 18 and over, there were 88.7 males.
The median income for a household in the CDP was $50,945, and the median income for a family was $60,945. Males had a median income of $41,945 versus $30,945 for females. The per capita income for the CDP was $24,945. About 3.2% of families and 4.2% of the population were below the poverty line, including 5.2% of those under age 18 and 4.2% of those age 65 or over.
Common Questions
What is Per Capita Income in Paxtonia?
Per Capita income in Paxtonia is $38,914.
What is the Median Family Income in Paxtonia?
Median Family Income in Paxtonia is $81,534.
What is the Median Household income in Paxtonia?
Median Household Income in Paxtonia is $81,113.
What is Income or Wage Gap in Paxtonia?
Income or Wage Gap in Paxtonia is 32.1%.
Women in Paxtonia earn 67.9 cents for every dollar earned by a man.
What is Inequality or Gini Index in Paxtonia?
Inequality or Gini Index in Paxtonia is 0.39.
What is the Total Population of Paxtonia?
Total Population of Paxtonia is 5,480.
What is the Total Male Population of Paxtonia?
Total Male Population of Paxtonia is 2,549.
What is the Total Female Population of Paxtonia?
Total Female Population of Paxtonia is 2,931.
What is the Ratio of Males per 100 Females in Paxtonia?
There are 86.97 Males per 100 Females in Paxtonia.
What is the Ratio of Females per 100 Males in Paxtonia?
There are 114.99 Females per 100 Males in Paxtonia.
What is the Median Population Age in Paxtonia?
Median Population Age in Paxtonia is 43.2 Years.
What is the Average Family Size in Paxtonia
Average Family Size in Paxtonia is 3.1 People.
What is the Average Household Size in Paxtonia
Average Household Size in Paxtonia is 2.5 People.
How Large is the Labor Force in Paxtonia?
There are 2,887 People in the Labor Forcein in Paxtonia.
What is the Percentage of People in the Labor Force in Paxtonia?
63.6% of People are in the Labor Force in Paxtonia.
What is the Unemployment Rate in Paxtonia?
Unemployment Rate in Paxtonia is 2.8%.