Rockledge borough, PA Map & Demographics
Rockledge borough Overview
$44,609
PER CAPITA INCOME
$107,500
AVG FAMILY INCOME
$78,333
AVG HOUSEHOLD INCOME
2.0%
WAGE / INCOME GAP [ % ]
98.0¢/ $1
WAGE / INCOME GAP [ $ ]
0.45
INEQUALITY / GINI INDEX
2,624
TOTAL POPULATION
1,296
MALE POPULATION
1,328
FEMALE POPULATION
97.59
MALES / 100 FEMALES
102.47
FEMALES / 100 MALES
39.2
MEDIAN AGE
3.0
AVG FAMILY SIZE
2.4
AVG HOUSEHOLD SIZE
1,507
LABOR FORCE [ PEOPLE ]
68.1%
PERCENT IN LABOR FORCE
8.6%
UNEMPLOYMENT RATE
Income in Rockledge borough
Income Overview in Rockledge borough
Per Capita Income in Rockledge borough is $44,609, while median incomes of families and households are $107,500 and $78,333 respectively.
| Characteristic | Number | Measure |
| Per Capita Income | 2,624 | $44,609 |
| Median Family Income | 736 | $107,500 |
| Mean Family Income | 736 | $117,605 |
| Median Household Income | 1,076 | $78,333 |
| Mean Household Income | 1,076 | $106,604 |
| Income Deficit | 736 | $0 |
| Wage / Income Gap (%) | 2,624 | 2.01% |
| Wage / Income Gap ($) | 2,624 | 97.99¢ per $1 |
| Gini / Inequality Index | 2,624 | 0.45 |
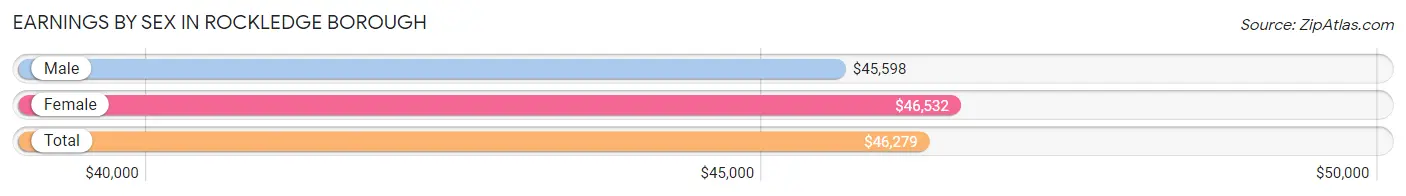
Earnings by Sex in Rockledge borough
Average Earnings in Rockledge borough are $46,279, $45,598 for men and $46,532 for women, a difference of 2.0%.
| Sex | Number | Average Earnings |
| Male | 751 (48.9%) | $45,598 |
| Female | 784 (51.1%) | $46,532 |
| Total | 1,535 (100.0%) | $46,279 |
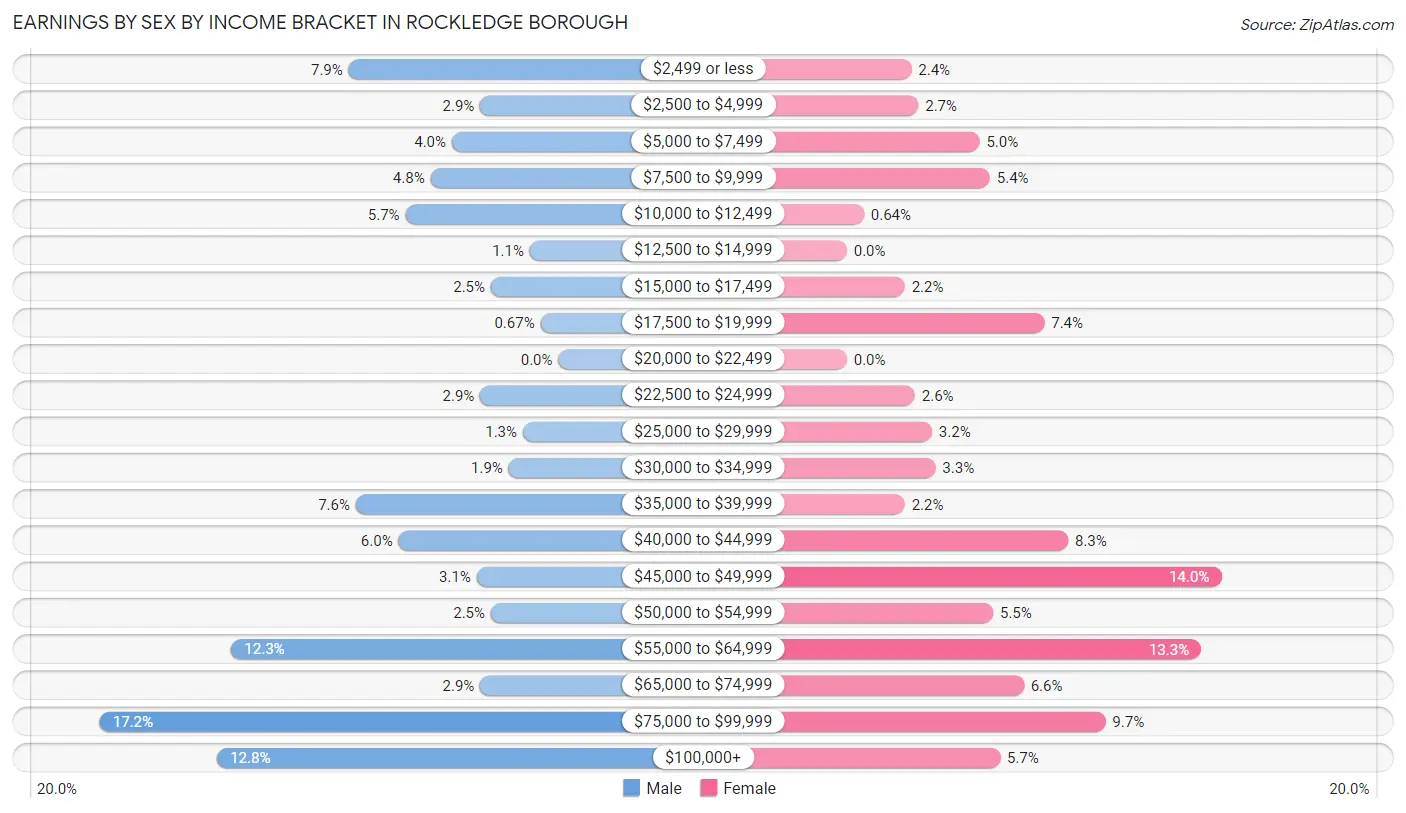
Earnings by Sex by Income Bracket in Rockledge borough
The most common earnings brackets in Rockledge borough are $75,000 to $99,999 for men (129 | 17.2%) and $45,000 to $49,999 for women (110 | 14.0%).
| Income | Male | Female |
| $2,499 or less | 59 (7.9%) | 19 (2.4%) |
| $2,500 to $4,999 | 22 (2.9%) | 21 (2.7%) |
| $5,000 to $7,499 | 30 (4.0%) | 39 (5.0%) |
| $7,500 to $9,999 | 36 (4.8%) | 42 (5.4%) |
| $10,000 to $12,499 | 43 (5.7%) | 5 (0.6%) |
| $12,500 to $14,999 | 8 (1.1%) | 0 (0.0%) |
| $15,000 to $17,499 | 19 (2.5%) | 17 (2.2%) |
| $17,500 to $19,999 | 5 (0.7%) | 58 (7.4%) |
| $20,000 to $22,499 | 0 (0.0%) | 0 (0.0%) |
| $22,500 to $24,999 | 22 (2.9%) | 20 (2.5%) |
| $25,000 to $29,999 | 10 (1.3%) | 25 (3.2%) |
| $30,000 to $34,999 | 14 (1.9%) | 26 (3.3%) |
| $35,000 to $39,999 | 57 (7.6%) | 17 (2.2%) |
| $40,000 to $44,999 | 45 (6.0%) | 65 (8.3%) |
| $45,000 to $49,999 | 23 (3.1%) | 110 (14.0%) |
| $50,000 to $54,999 | 19 (2.5%) | 43 (5.5%) |
| $55,000 to $64,999 | 92 (12.2%) | 104 (13.3%) |
| $65,000 to $74,999 | 22 (2.9%) | 52 (6.6%) |
| $75,000 to $99,999 | 129 (17.2%) | 76 (9.7%) |
| $100,000+ | 96 (12.8%) | 45 (5.7%) |
| Total | 751 (100.0%) | 784 (100.0%) |
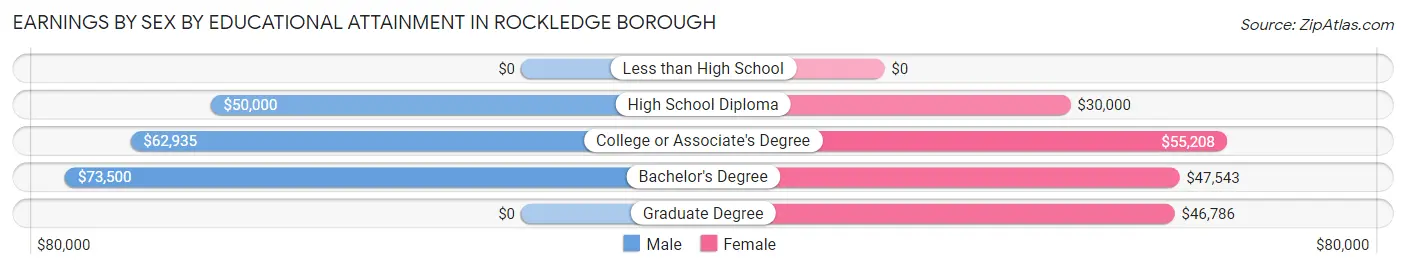
Earnings by Sex by Educational Attainment in Rockledge borough
Average earnings in Rockledge borough are $60,764 for men and $48,151 for women, a difference of 20.8%. Men with an educational attainment of bachelor's degree enjoy the highest average annual earnings of $73,500, while those with high school diploma education earn the least with $50,000. Women with an educational attainment of college or associate's degree earn the most with the average annual earnings of $55,208, while those with high school diploma education have the smallest earnings of $30,000.
| Educational Attainment | Male Income | Female Income |
| Less than High School | - | - |
| High School Diploma | $50,000 | $30,000 |
| College or Associate's Degree | $62,935 | $55,208 |
| Bachelor's Degree | $73,500 | $47,543 |
| Graduate Degree | - | - |
| Total | $60,764 | $48,151 |
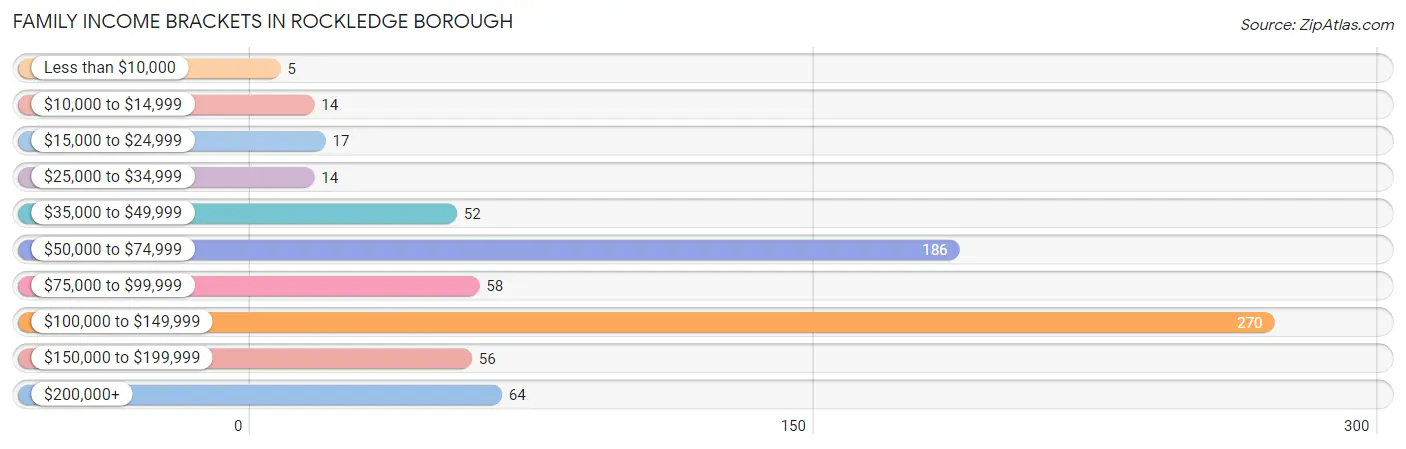
Family Income in Rockledge borough
Family Income Brackets in Rockledge borough
According to the Rockledge borough family income data, there are 270 families falling into the $100,000 to $149,999 income range, which is the most common income bracket and makes up 36.7% of all families. Conversely, the less than $10,000 income bracket is the least frequent group with only 5 families (0.7%) belonging to this category.
| Income Bracket | # Families | % Families |
| Less than $10,000 | 5 | 0.7% |
| $10,000 to $14,999 | 14 | 1.9% |
| $15,000 to $24,999 | 17 | 2.3% |
| $25,000 to $34,999 | 14 | 1.9% |
| $35,000 to $49,999 | 52 | 7.1% |
| $50,000 to $74,999 | 186 | 25.3% |
| $75,000 to $99,999 | 58 | 7.9% |
| $100,000 to $149,999 | 270 | 36.7% |
| $150,000 to $199,999 | 56 | 7.6% |
| $200,000+ | 64 | 8.7% |
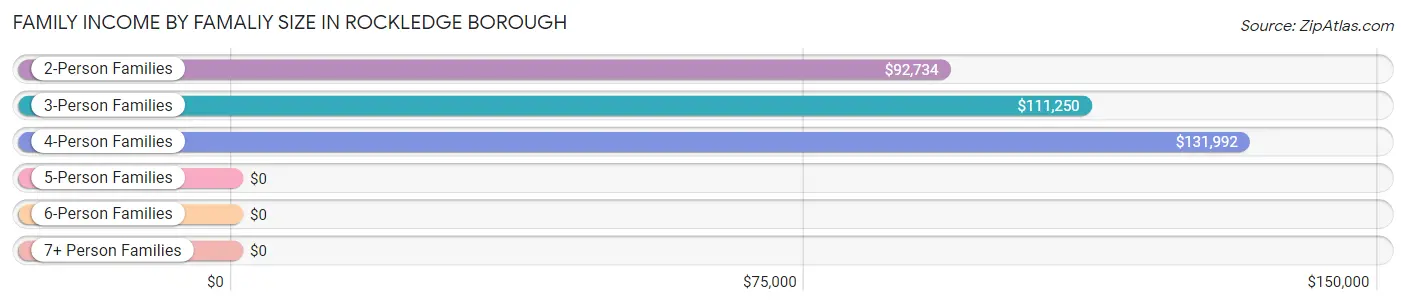
Family Income by Famaliy Size in Rockledge borough
4-person families (105 | 14.3%) account for the highest median family income in Rockledge borough with $131,992 per family, while 2-person families (355 | 48.2%) have the highest median income of $46,367 per family member.
| Income Bracket | # Families | Median Income |
| 2-Person Families | 355 (48.2%) | $92,734 |
| 3-Person Families | 195 (26.5%) | $111,250 |
| 4-Person Families | 105 (14.3%) | $131,992 |
| 5-Person Families | 31 (4.2%) | $0 |
| 6-Person Families | 50 (6.8%) | $0 |
| 7+ Person Families | 0 (0.0%) | $0 |
| Total | 736 (100.0%) | $107,500 |
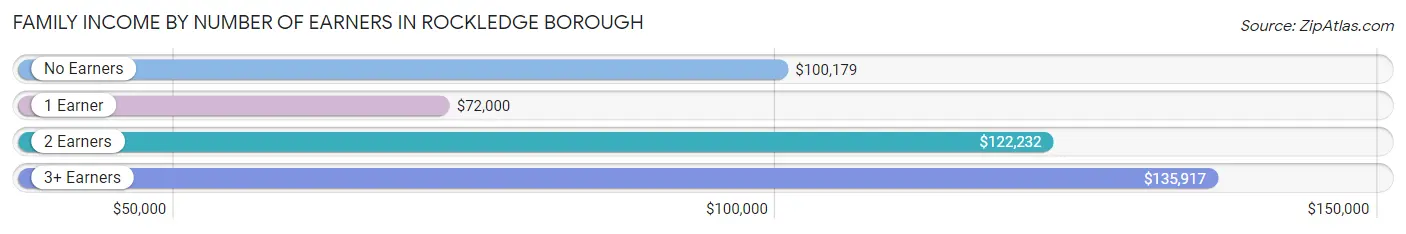
Family Income by Number of Earners in Rockledge borough
The median family income in Rockledge borough is $107,500, with families comprising 3+ earners (108) having the highest median family income of $135,917, while families with 1 earner (234) have the lowest median family income of $72,000, accounting for 14.7% and 31.8% of families, respectively.
| Number of Earners | # Families | Median Income |
| No Earners | 119 (16.2%) | $100,179 |
| 1 Earner | 234 (31.8%) | $72,000 |
| 2 Earners | 275 (37.4%) | $122,232 |
| 3+ Earners | 108 (14.7%) | $135,917 |
| Total | 736 (100.0%) | $107,500 |
Household Income in Rockledge borough
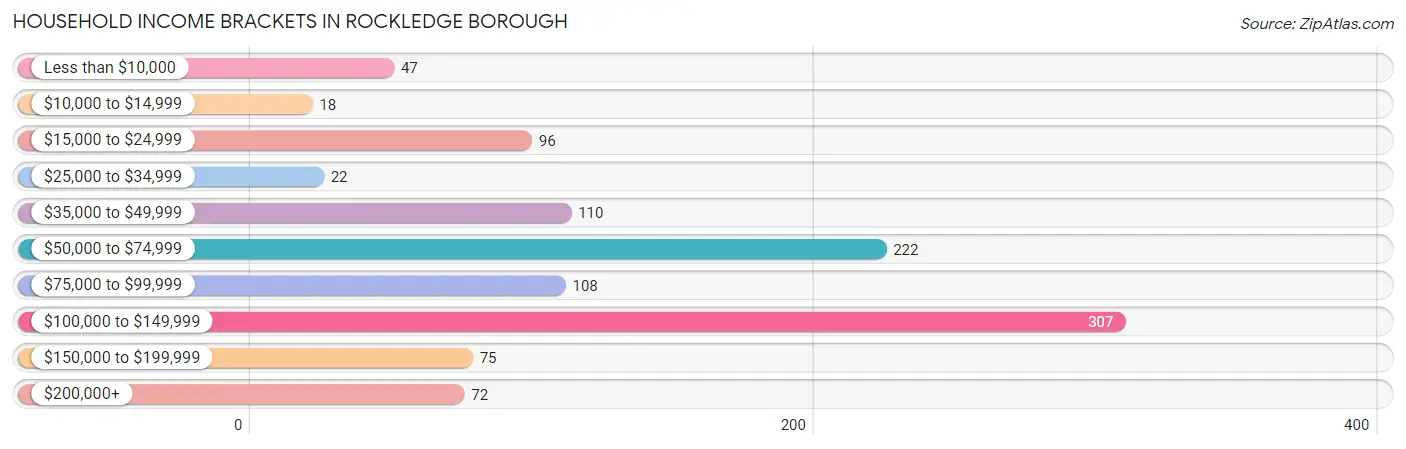
Household Income Brackets in Rockledge borough
With 307 households falling in the category, the $100,000 to $149,999 income range is the most frequent in Rockledge borough, accounting for 28.5% of all households. In contrast, only 18 households (1.7%) fall into the $10,000 to $14,999 income bracket, making it the least populous group.
| Income Bracket | # Households | % Households |
| Less than $10,000 | 47 | 4.4% |
| $10,000 to $14,999 | 18 | 1.7% |
| $15,000 to $24,999 | 96 | 8.9% |
| $25,000 to $34,999 | 22 | 2.0% |
| $35,000 to $49,999 | 110 | 10.2% |
| $50,000 to $74,999 | 222 | 20.6% |
| $75,000 to $99,999 | 108 | 10.0% |
| $100,000 to $149,999 | 307 | 28.5% |
| $150,000 to $199,999 | 75 | 7.0% |
| $200,000+ | 72 | 6.7% |
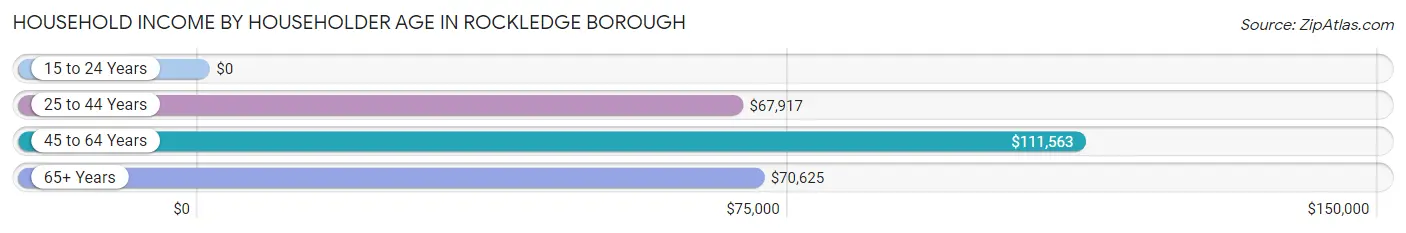
Household Income by Householder Age in Rockledge borough
The median household income in Rockledge borough is $78,333, with the highest median household income of $111,563 found in the 45 to 64 years age bracket for the primary householder. A total of 364 households (33.8%) fall into this category. Meanwhile, the 15 to 24 years age bracket for the primary householder has the lowest median household income of $0, with 5 households (0.5%) in this group.
| Income Bracket | # Households | Median Income |
| 15 to 24 Years | 5 (0.5%) | $0 |
| 25 to 44 Years | 426 (39.6%) | $67,917 |
| 45 to 64 Years | 364 (33.8%) | $111,563 |
| 65+ Years | 281 (26.1%) | $70,625 |
| Total | 1,076 (100.0%) | $78,333 |
Poverty in Rockledge borough
Income Below Poverty by Sex and Age in Rockledge borough
With 9.5% poverty level for males and 5.3% for females among the residents of Rockledge borough, 6 to 11 year old males and 45 to 54 year old females are the most vulnerable to poverty, with 27 males (27.3%) and 24 females (15.0%) in their respective age groups living below the poverty level.
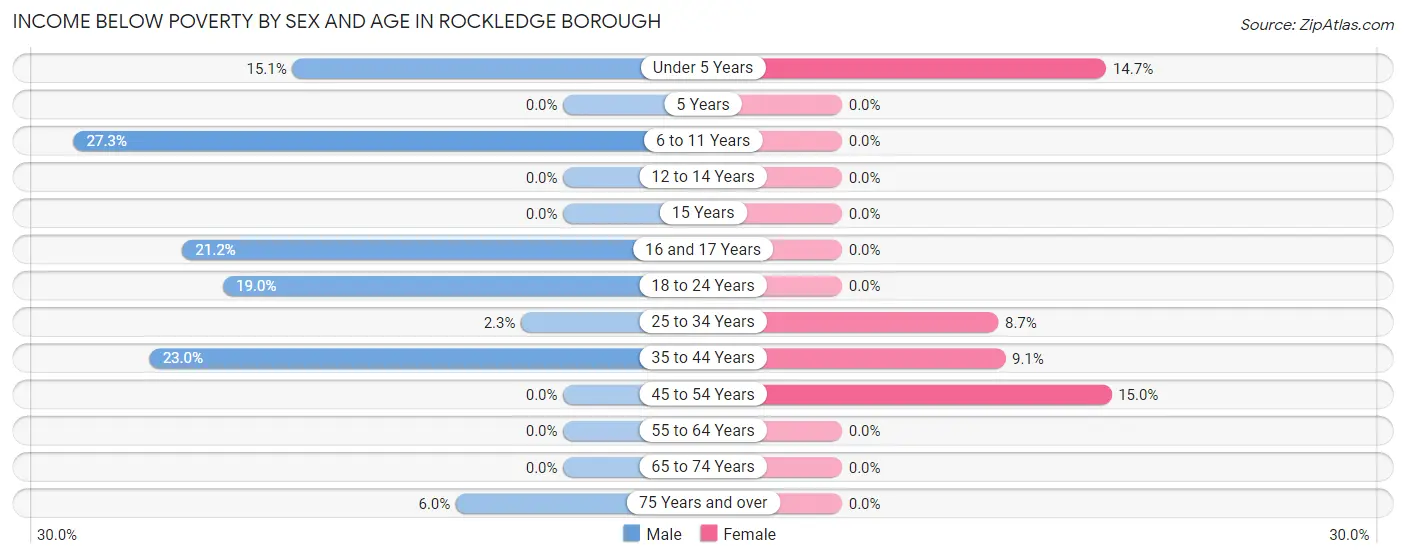
| Age Bracket | Male | Female |
| Under 5 Years | 19 (15.1%) | 5 (14.7%) |
| 5 Years | 0 (0.0%) | 0 (0.0%) |
| 6 to 11 Years | 27 (27.3%) | 0 (0.0%) |
| 12 to 14 Years | 0 (0.0%) | 0 (0.0%) |
| 15 Years | 0 (0.0%) | 0 (0.0%) |
| 16 and 17 Years | 14 (21.2%) | 0 (0.0%) |
| 18 to 24 Years | 18 (19.0%) | 0 (0.0%) |
| 25 to 34 Years | 5 (2.3%) | 24 (8.7%) |
| 35 to 44 Years | 35 (23.0%) | 17 (9.1%) |
| 45 to 54 Years | 0 (0.0%) | 24 (15.0%) |
| 55 to 64 Years | 0 (0.0%) | 0 (0.0%) |
| 65 to 74 Years | 0 (0.0%) | 0 (0.0%) |
| 75 Years and over | 4 (6.0%) | 0 (0.0%) |
| Total | 122 (9.5%) | 70 (5.3%) |
Income Above Poverty by Sex and Age in Rockledge borough
According to the poverty statistics in Rockledge borough, males aged 12 to 14 years and females aged 5 years are the age groups that are most secure financially, with 100.0% of males and 100.0% of females in these age groups living above the poverty line.
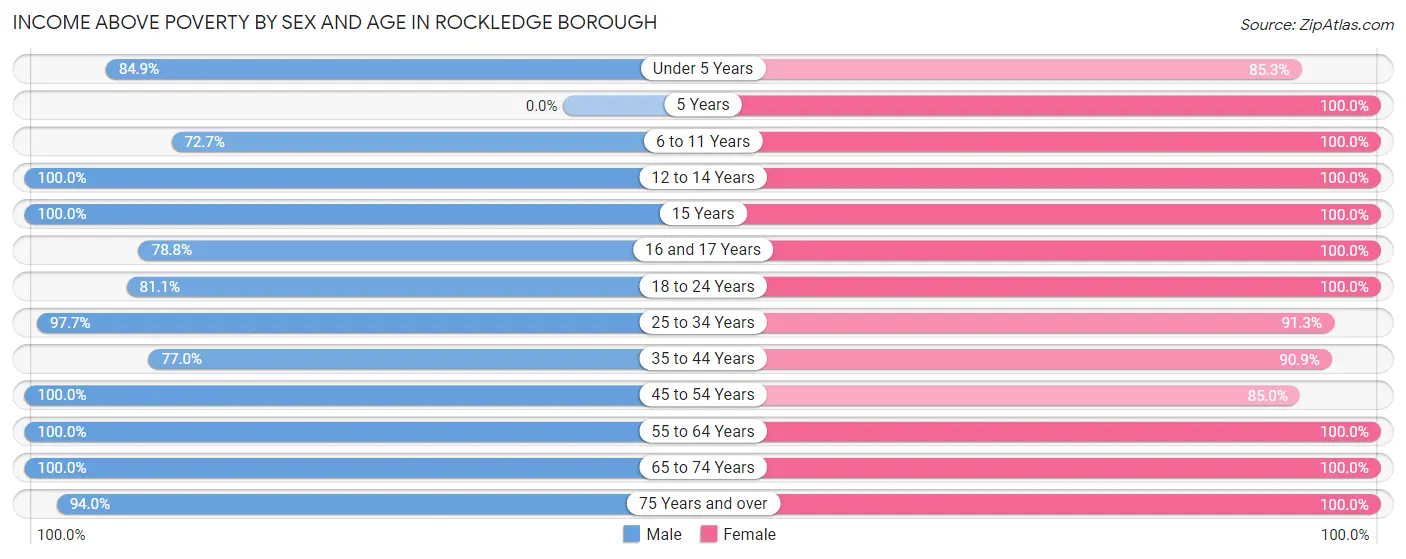
| Age Bracket | Male | Female |
| Under 5 Years | 107 (84.9%) | 29 (85.3%) |
| 5 Years | 0 (0.0%) | 7 (100.0%) |
| 6 to 11 Years | 72 (72.7%) | 38 (100.0%) |
| 12 to 14 Years | 20 (100.0%) | 66 (100.0%) |
| 15 Years | 9 (100.0%) | 7 (100.0%) |
| 16 and 17 Years | 52 (78.8%) | 3 (100.0%) |
| 18 to 24 Years | 77 (81.0%) | 73 (100.0%) |
| 25 to 34 Years | 209 (97.7%) | 252 (91.3%) |
| 35 to 44 Years | 117 (77.0%) | 170 (90.9%) |
| 45 to 54 Years | 100 (100.0%) | 136 (85.0%) |
| 55 to 64 Years | 215 (100.0%) | 190 (100.0%) |
| 65 to 74 Years | 128 (100.0%) | 160 (100.0%) |
| 75 Years and over | 63 (94.0%) | 127 (100.0%) |
| Total | 1,169 (90.5%) | 1,258 (94.7%) |
Income Below Poverty Among Married-Couple Families in Rockledge borough
The poverty statistics for married-couple families in Rockledge borough show that 3.5% or 19 of the total 535 families live below the poverty line. Families with 3 or 4 children have the highest poverty rate of 35.9%, comprising of 14 families. On the other hand, families with no children have the lowest poverty rate of 0.0%, which includes 0 families.
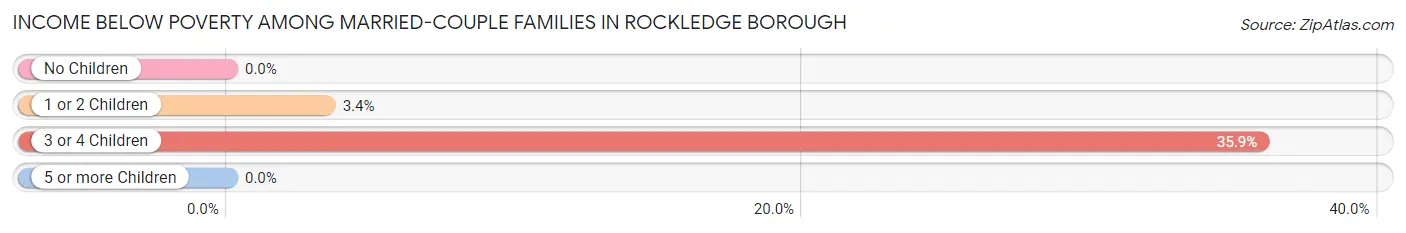
| Children | Above Poverty | Below Poverty |
| No Children | 349 (100.0%) | 0 (0.0%) |
| 1 or 2 Children | 142 (96.6%) | 5 (3.4%) |
| 3 or 4 Children | 25 (64.1%) | 14 (35.9%) |
| 5 or more Children | 0 (0.0%) | 0 (0.0%) |
| Total | 516 (96.5%) | 19 (3.5%) |
Income Below Poverty Among Single-Parent Households in Rockledge borough
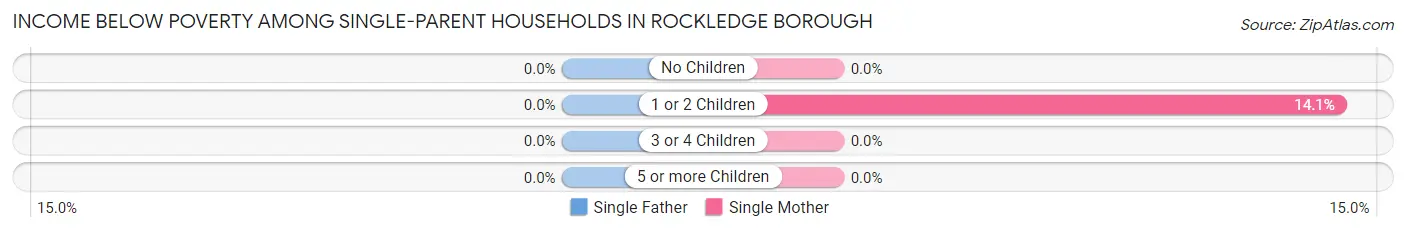
| Children | Single Father | Single Mother |
| No Children | 0 (0.0%) | 0 (0.0%) |
| 1 or 2 Children | 0 (0.0%) | 17 (14.1%) |
| 3 or 4 Children | 0 (0.0%) | 0 (0.0%) |
| 5 or more Children | 0 (0.0%) | 0 (0.0%) |
| Total | 0 (0.0%) | 17 (9.6%) |
Income Below Poverty Among Married-Couple vs Single-Parent Households in Rockledge borough
The poverty data for Rockledge borough shows that 19 of the married-couple family households (3.5%) and 17 of the single-parent households (8.5%) are living below the poverty level. Within the married-couple family households, those with 3 or 4 children have the highest poverty rate, with 14 households (35.9%) falling below the poverty line. Among the single-parent households, those with 1 or 2 children have the highest poverty rate, with 17 household (13.3%) living below poverty.
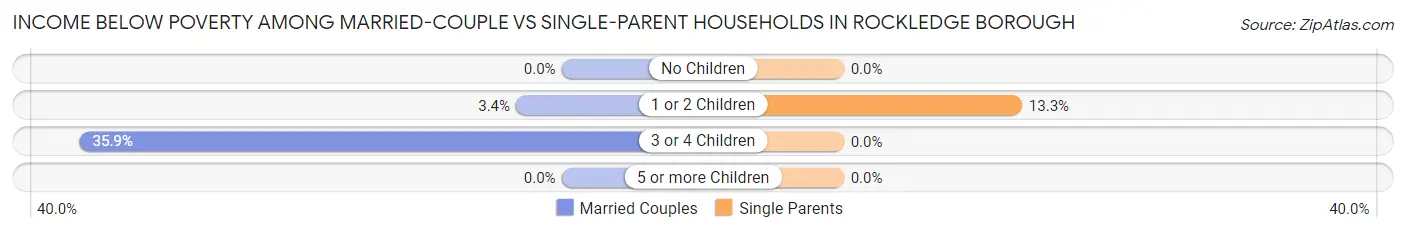
| Children | Married-Couple Families | Single-Parent Households |
| No Children | 0 (0.0%) | 0 (0.0%) |
| 1 or 2 Children | 5 (3.4%) | 17 (13.3%) |
| 3 or 4 Children | 14 (35.9%) | 0 (0.0%) |
| 5 or more Children | 0 (0.0%) | 0 (0.0%) |
| Total | 19 (3.5%) | 17 (8.5%) |
Race in Rockledge borough
The most populous races in Rockledge borough are White / Caucasian (2,434 | 92.8%), Two or more Races (182 | 6.9%), and Hispanic or Latino (56 | 2.1%).
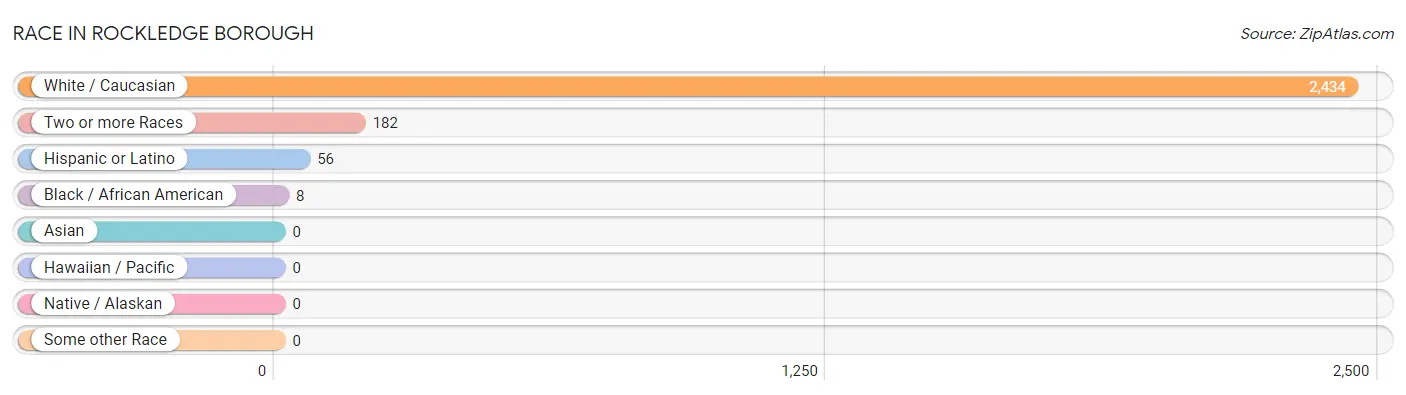
| Race | # Population | % Population |
| Asian | 0 | 0.0% |
| Black / African American | 8 | 0.3% |
| Hawaiian / Pacific | 0 | 0.0% |
| Hispanic or Latino | 56 | 2.1% |
| Native / Alaskan | 0 | 0.0% |
| White / Caucasian | 2,434 | 92.8% |
| Two or more Races | 182 | 6.9% |
| Some other Race | 0 | 0.0% |
| Total | 2,624 | 100.0% |
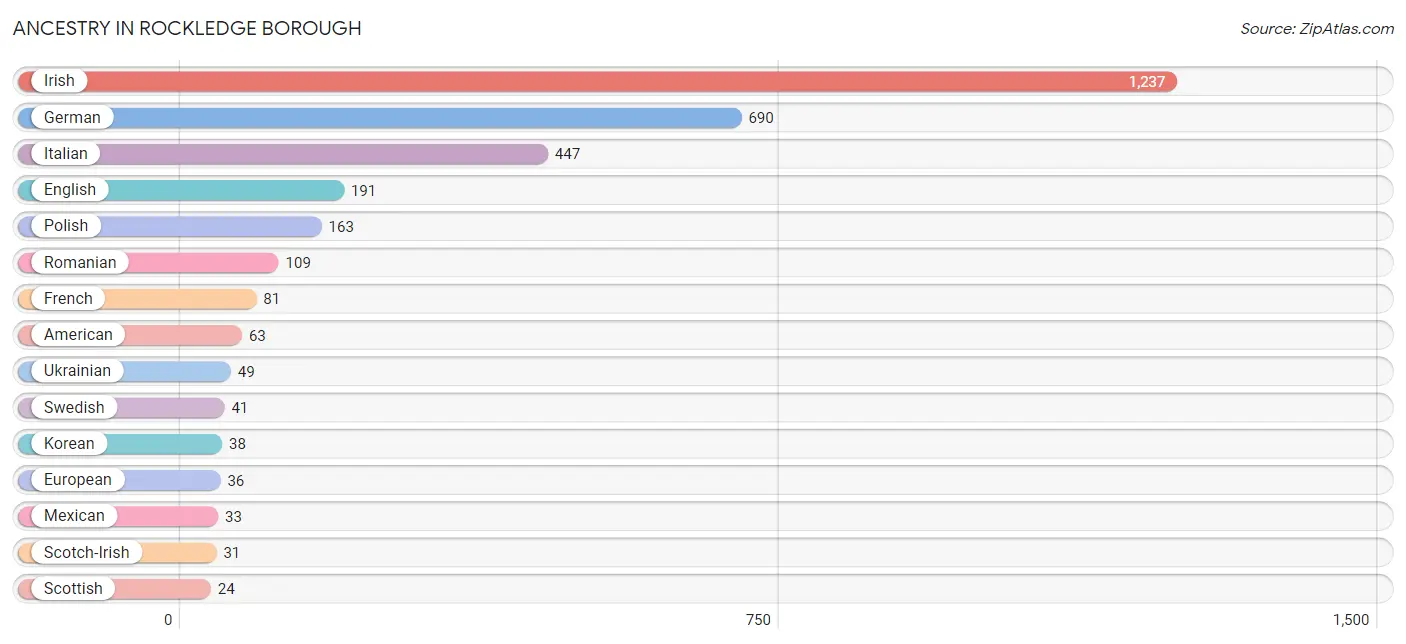
Ancestry in Rockledge borough
The most populous ancestries reported in Rockledge borough are Irish (1,237 | 47.1%), German (690 | 26.3%), Italian (447 | 17.0%), English (191 | 7.3%), and Polish (163 | 6.2%), together accounting for 104.0% of all Rockledge borough residents.
| Ancestry | # Population | % Population |
| American | 63 | 2.4% |
| Austrian | 6 | 0.2% |
| British | 10 | 0.4% |
| Burmese | 6 | 0.2% |
| Dutch | 19 | 0.7% |
| English | 191 | 7.3% |
| European | 36 | 1.4% |
| Finnish | 4 | 0.2% |
| French | 81 | 3.1% |
| French Canadian | 7 | 0.3% |
| German | 690 | 26.3% |
| Greek | 11 | 0.4% |
| Hungarian | 3 | 0.1% |
| Indian (Asian) | 5 | 0.2% |
| Irish | 1,237 | 47.1% |
| Italian | 447 | 17.0% |
| Korean | 38 | 1.5% |
| Mexican | 33 | 1.3% |
| Pennsylvania German | 4 | 0.2% |
| Polish | 163 | 6.2% |
| Puerto Rican | 14 | 0.5% |
| Romanian | 109 | 4.2% |
| Russian | 13 | 0.5% |
| Scandinavian | 6 | 0.2% |
| Scotch-Irish | 31 | 1.2% |
| Scottish | 24 | 0.9% |
| Spanish | 9 | 0.3% |
| Sri Lankan | 7 | 0.3% |
| Swedish | 41 | 1.6% |
| Ukrainian | 49 | 1.9% |
| Yugoslavian | 6 | 0.2% | View All 31 Rows |
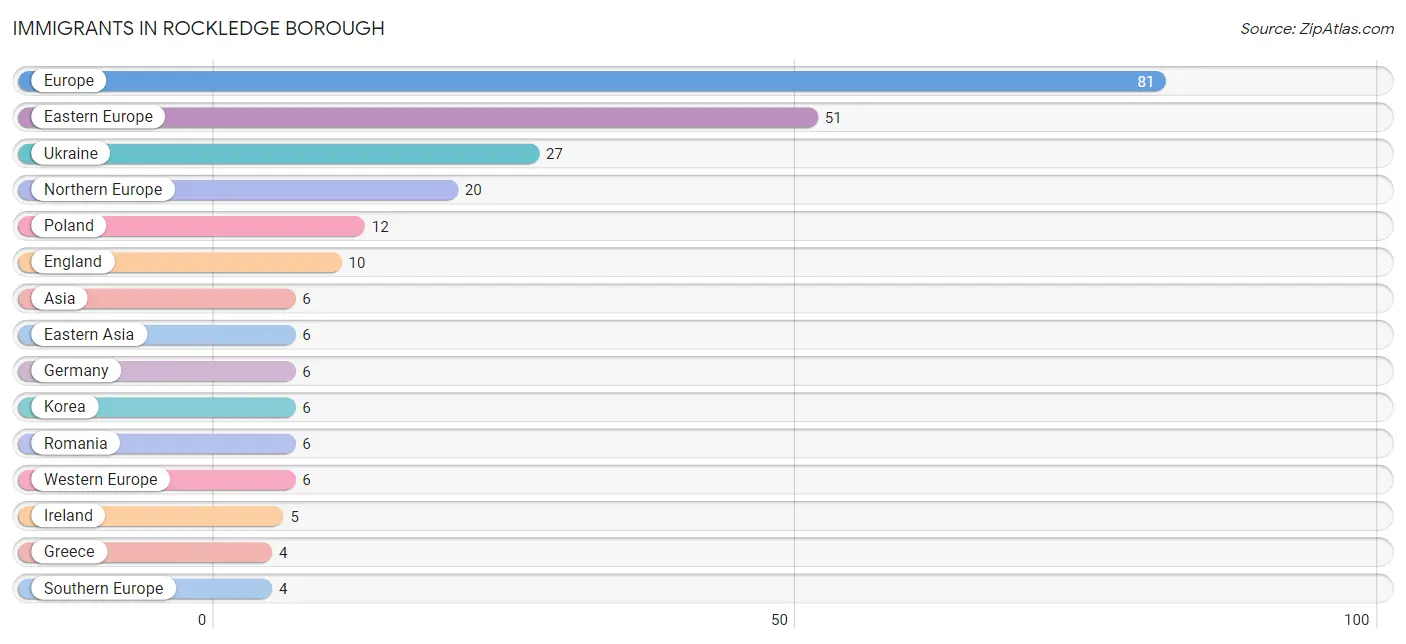
Immigrants in Rockledge borough
The most numerous immigrant groups reported in Rockledge borough came from Europe (81 | 3.1%), Eastern Europe (51 | 1.9%), Ukraine (27 | 1.0%), Northern Europe (20 | 0.8%), and Poland (12 | 0.5%), together accounting for 7.3% of all Rockledge borough residents.
| Immigration Origin | # Population | % Population |
| Asia | 6 | 0.2% |
| Eastern Asia | 6 | 0.2% |
| Eastern Europe | 51 | 1.9% |
| England | 10 | 0.4% |
| Europe | 81 | 3.1% |
| Germany | 6 | 0.2% |
| Greece | 4 | 0.2% |
| Ireland | 5 | 0.2% |
| Korea | 6 | 0.2% |
| Northern Europe | 20 | 0.8% |
| Poland | 12 | 0.5% |
| Romania | 6 | 0.2% |
| Southern Europe | 4 | 0.2% |
| Ukraine | 27 | 1.0% |
| Western Europe | 6 | 0.2% | View All 15 Rows |
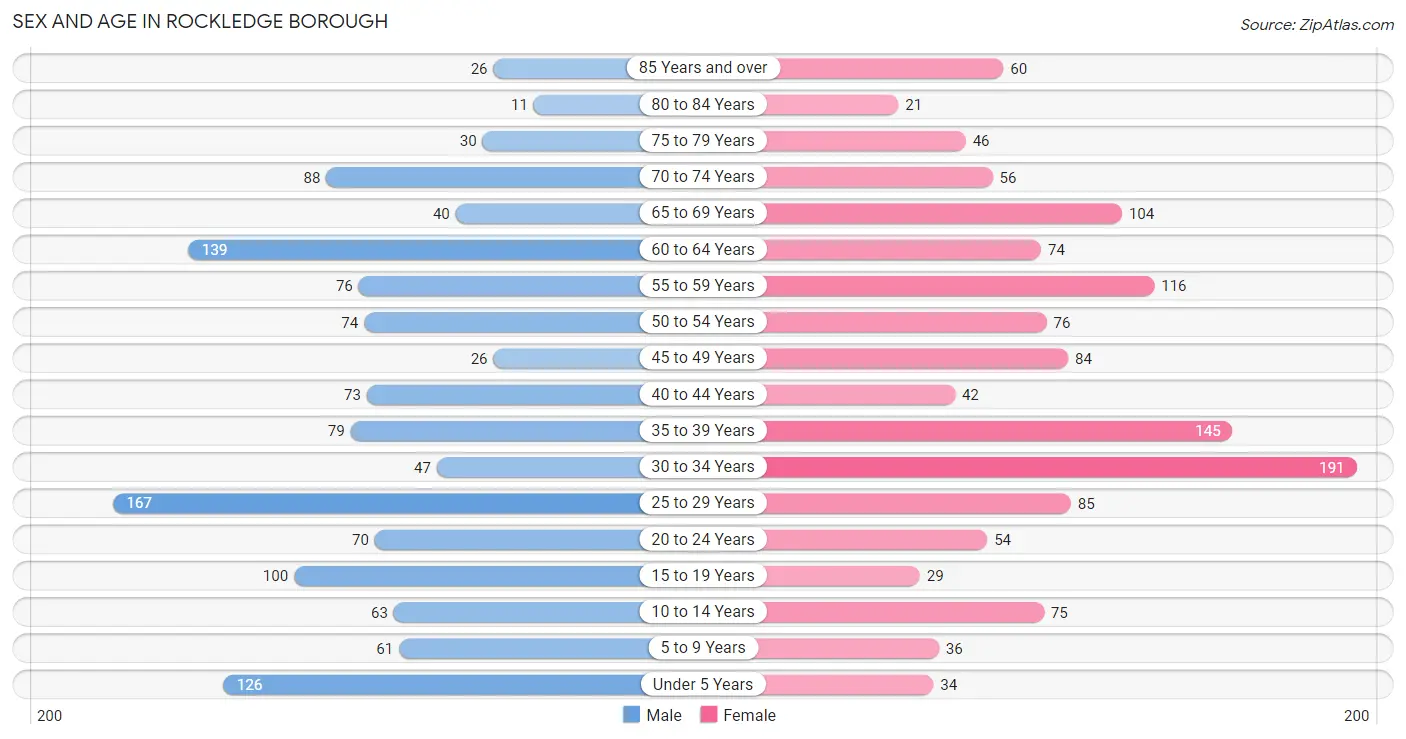
Sex and Age in Rockledge borough
Sex and Age in Rockledge borough
The most populous age groups in Rockledge borough are 25 to 29 Years (167 | 12.9%) for men and 30 to 34 Years (191 | 14.4%) for women.
| Age Bracket | Male | Female |
| Under 5 Years | 126 (9.7%) | 34 (2.6%) |
| 5 to 9 Years | 61 (4.7%) | 36 (2.7%) |
| 10 to 14 Years | 63 (4.9%) | 75 (5.7%) |
| 15 to 19 Years | 100 (7.7%) | 29 (2.2%) |
| 20 to 24 Years | 70 (5.4%) | 54 (4.1%) |
| 25 to 29 Years | 167 (12.9%) | 85 (6.4%) |
| 30 to 34 Years | 47 (3.6%) | 191 (14.4%) |
| 35 to 39 Years | 79 (6.1%) | 145 (10.9%) |
| 40 to 44 Years | 73 (5.6%) | 42 (3.2%) |
| 45 to 49 Years | 26 (2.0%) | 84 (6.3%) |
| 50 to 54 Years | 74 (5.7%) | 76 (5.7%) |
| 55 to 59 Years | 76 (5.9%) | 116 (8.7%) |
| 60 to 64 Years | 139 (10.7%) | 74 (5.6%) |
| 65 to 69 Years | 40 (3.1%) | 104 (7.8%) |
| 70 to 74 Years | 88 (6.8%) | 56 (4.2%) |
| 75 to 79 Years | 30 (2.3%) | 46 (3.5%) |
| 80 to 84 Years | 11 (0.9%) | 21 (1.6%) |
| 85 Years and over | 26 (2.0%) | 60 (4.5%) |
| Total | 1,296 (100.0%) | 1,328 (100.0%) |
Families and Households in Rockledge borough
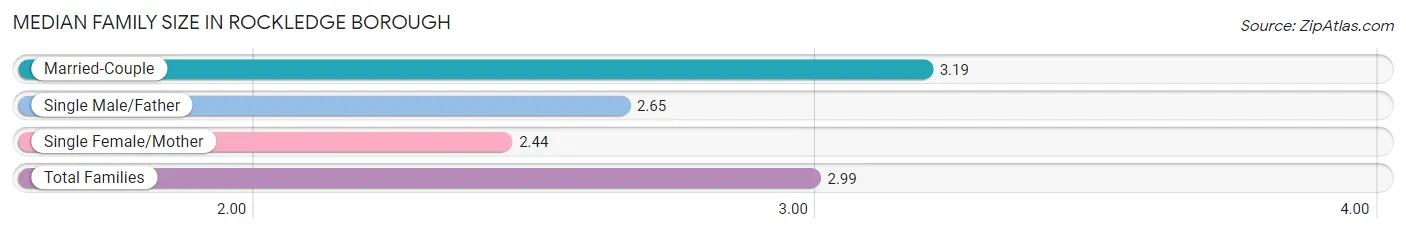
Median Family Size in Rockledge borough
The median family size in Rockledge borough is 2.99 persons per family, with married-couple families (535 | 72.7%) accounting for the largest median family size of 3.19 persons per family. On the other hand, single female/mother families (178 | 24.2%) represent the smallest median family size with 2.44 persons per family.
| Family Type | # Families | Family Size |
| Married-Couple | 535 (72.7%) | 3.19 |
| Single Male/Father | 23 (3.1%) | 2.65 |
| Single Female/Mother | 178 (24.2%) | 2.44 |
| Total Families | 736 (100.0%) | 2.99 |
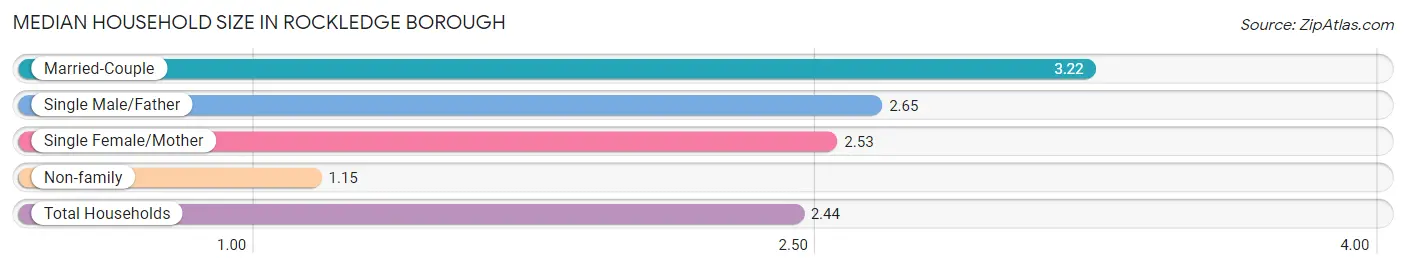
Median Household Size in Rockledge borough
The median household size in Rockledge borough is 2.44 persons per household, with married-couple households (535 | 49.7%) accounting for the largest median household size of 3.22 persons per household. non-family households (340 | 31.6%) represent the smallest median household size with 1.15 persons per household.
| Household Type | # Households | Household Size |
| Married-Couple | 535 (49.7%) | 3.22 |
| Single Male/Father | 23 (2.1%) | 2.65 |
| Single Female/Mother | 178 (16.5%) | 2.53 |
| Non-family | 340 (31.6%) | 1.15 |
| Total Households | 1,076 (100.0%) | 2.44 |
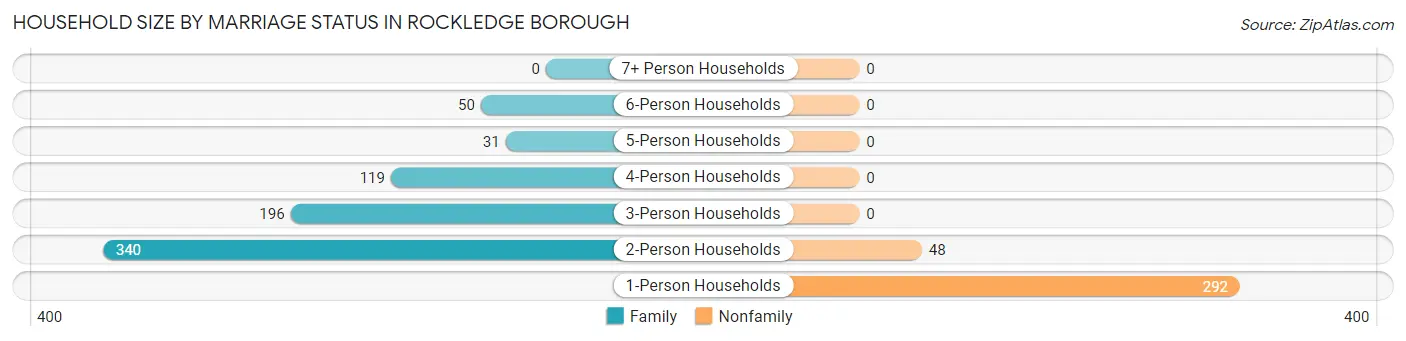
Household Size by Marriage Status in Rockledge borough
Out of a total of 1,076 households in Rockledge borough, 736 (68.4%) are family households, while 340 (31.6%) are nonfamily households. The most numerous type of family households are 2-person households, comprising 340, and the most common type of nonfamily households are 1-person households, comprising 292.
| Household Size | Family Households | Nonfamily Households |
| 1-Person Households | - | 292 (27.1%) |
| 2-Person Households | 340 (31.6%) | 48 (4.5%) |
| 3-Person Households | 196 (18.2%) | 0 (0.0%) |
| 4-Person Households | 119 (11.1%) | 0 (0.0%) |
| 5-Person Households | 31 (2.9%) | 0 (0.0%) |
| 6-Person Households | 50 (4.6%) | 0 (0.0%) |
| 7+ Person Households | 0 (0.0%) | 0 (0.0%) |
| Total | 736 (68.4%) | 340 (31.6%) |
Female Fertility in Rockledge borough
Fertility by Age in Rockledge borough
Average fertility rate in Rockledge borough is 66.0 births per 1,000 women. Women in the age bracket of 20 to 34 years have the highest fertility rate with 112.0 births per 1,000 women. Women in the age bracket of 20 to 34 years acount for 86.1% of all women with births.
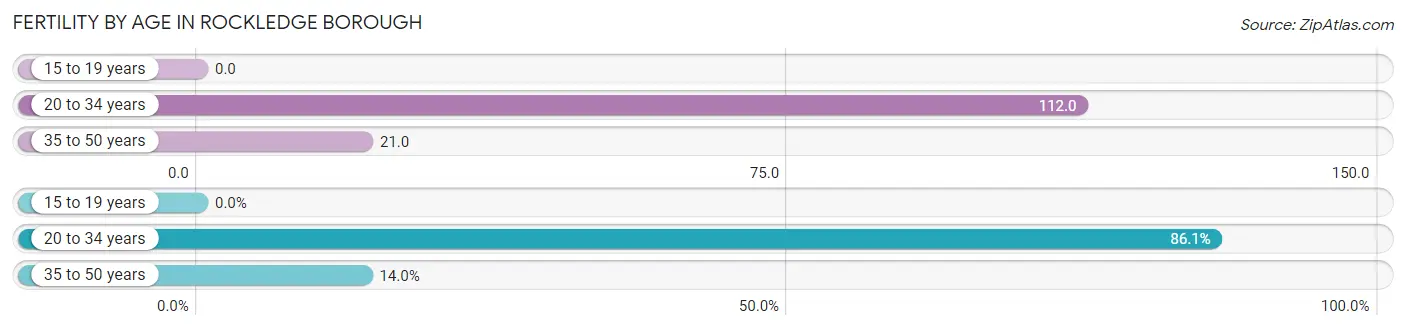
| Age Bracket | Women with Births | Births / 1,000 Women |
| 15 to 19 years | 0 (0.0%) | 0.0 |
| 20 to 34 years | 37 (86.1%) | 112.0 |
| 35 to 50 years | 6 (14.0%) | 21.0 |
| Total | 43 (100.0%) | 66.0 |
Fertility by Age by Marriage Status in Rockledge borough
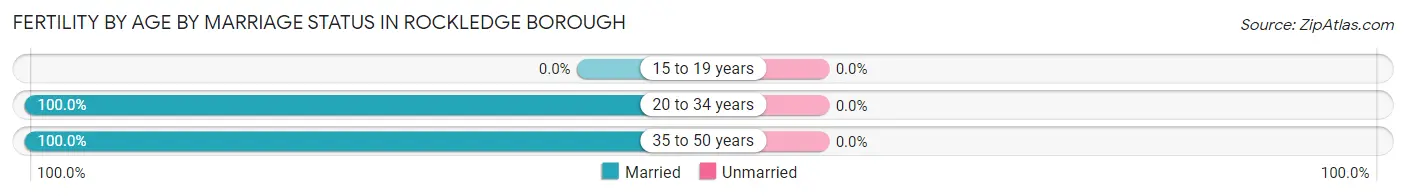
| Age Bracket | Married | Unmarried |
| 15 to 19 years | 0 (0.0%) | 0 (0.0%) |
| 20 to 34 years | 37 (100.0%) | 0 (0.0%) |
| 35 to 50 years | 6 (100.0%) | 0 (0.0%) |
| Total | 43 (100.0%) | 0 (0.0%) |
Fertility by Education in Rockledge borough
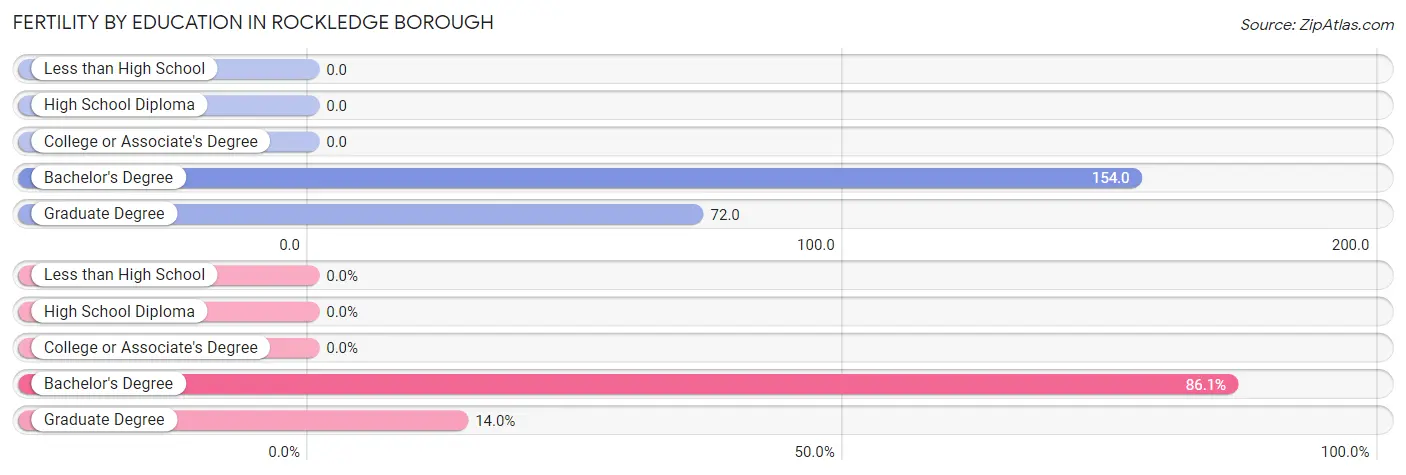
| Educational Attainment | Women with Births | Births / 1,000 Women |
| Less than High School | 0 (0.0%) | 0.0 |
| High School Diploma | 0 (0.0%) | 0.0 |
| College or Associate's Degree | 0 (0.0%) | 0.0 |
| Bachelor's Degree | 37 (86.1%) | 154.0 |
| Graduate Degree | 6 (14.0%) | 72.0 |
| Total | 43 (100.0%) | 66.0 |
Fertility by Education by Marriage Status in Rockledge borough
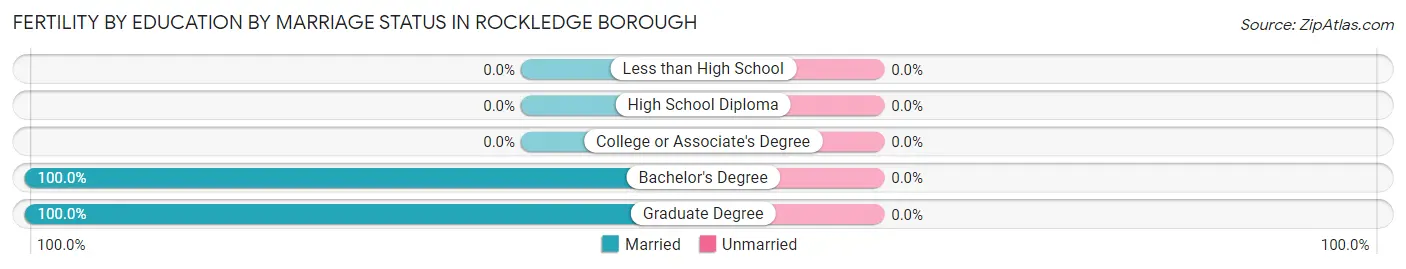
| Educational Attainment | Married | Unmarried |
| Less than High School | 0 (0.0%) | 0 (0.0%) |
| High School Diploma | 0 (0.0%) | 0 (0.0%) |
| College or Associate's Degree | 0 (0.0%) | 0 (0.0%) |
| Bachelor's Degree | 37 (100.0%) | 0 (0.0%) |
| Graduate Degree | 6 (100.0%) | 0 (0.0%) |
| Total | 43 (100.0%) | 0 (0.0%) |
Employment Characteristics in Rockledge borough
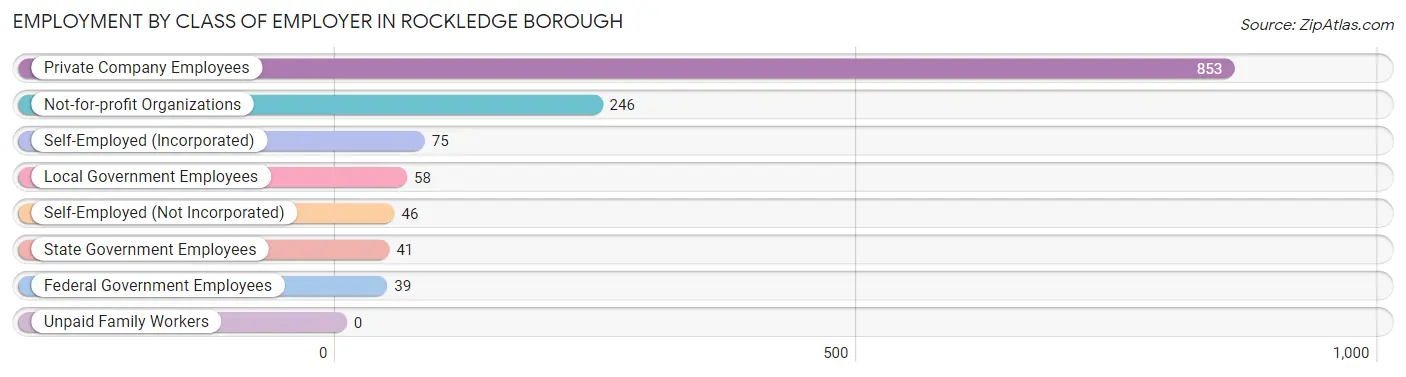
Employment by Class of Employer in Rockledge borough
Among the 1,358 employed individuals in Rockledge borough, private company employees (853 | 62.8%), not-for-profit organizations (246 | 18.1%), and self-employed (incorporated) (75 | 5.5%) make up the most common classes of employment.
| Employer Class | # Employees | % Employees |
| Private Company Employees | 853 | 62.8% |
| Self-Employed (Incorporated) | 75 | 5.5% |
| Self-Employed (Not Incorporated) | 46 | 3.4% |
| Not-for-profit Organizations | 246 | 18.1% |
| Local Government Employees | 58 | 4.3% |
| State Government Employees | 41 | 3.0% |
| Federal Government Employees | 39 | 2.9% |
| Unpaid Family Workers | 0 | 0.0% |
| Total | 1,358 | 100.0% |
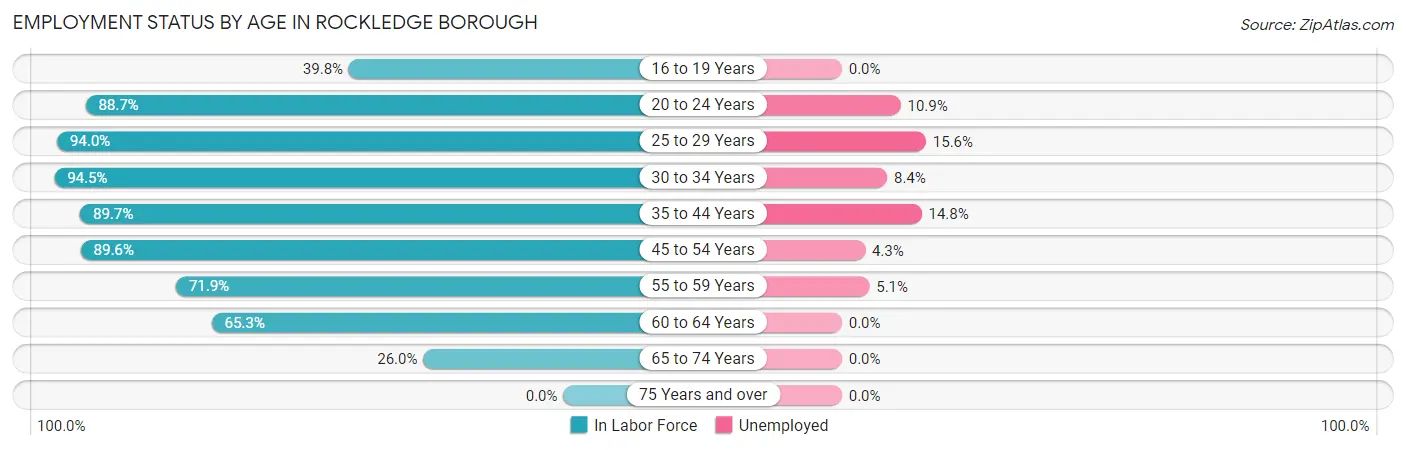
Employment Status by Age in Rockledge borough
According to the labor force statistics for Rockledge borough, out of the total population over 16 years of age (2,213), 68.1% or 1,507 individuals are in the labor force, with 8.6% or 130 of them unemployed. The age group with the highest labor force participation rate is 30 to 34 years, with 94.5% or 225 individuals in the labor force. Within the labor force, the 25 to 29 years age range has the highest percentage of unemployed individuals, with 15.6% or 37 of them being unemployed.
| Age Bracket | In Labor Force | Unemployed |
| 16 to 19 Years | 45 (39.8%) | 0 (0.0%) |
| 20 to 24 Years | 110 (88.7%) | 12 (10.9%) |
| 25 to 29 Years | 237 (94.0%) | 37 (15.6%) |
| 30 to 34 Years | 225 (94.5%) | 19 (8.4%) |
| 35 to 44 Years | 304 (89.7%) | 45 (14.8%) |
| 45 to 54 Years | 233 (89.6%) | 10 (4.3%) |
| 55 to 59 Years | 138 (71.9%) | 7 (5.1%) |
| 60 to 64 Years | 139 (65.3%) | 0 (0.0%) |
| 65 to 74 Years | 75 (26.0%) | 0 (0.0%) |
| 75 Years and over | 0 (0.0%) | 0 (0.0%) |
| Total | 1,507 (68.1%) | 130 (8.6%) |
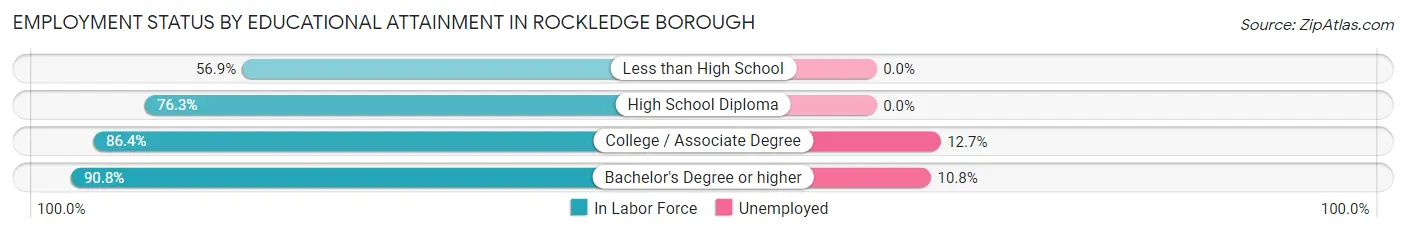
Employment Status by Educational Attainment in Rockledge borough
According to labor force statistics for Rockledge borough, 85.4% of individuals (1,276) out of the total population between 25 and 64 years of age (1,494) are in the labor force, with 9.2% or 117 of them being unemployed. The group with the highest labor force participation rate are those with the educational attainment of bachelor's degree or higher, with 90.8% or 621 individuals in the labor force. Within the labor force, individuals with college / associate degree education have the highest percentage of unemployment, with 12.7% or 51 of them being unemployed.
| Educational Attainment | In Labor Force | Unemployed |
| Less than High School | 29 (56.9%) | 0 (0.0%) |
| High School Diploma | 225 (76.3%) | 0 (0.0%) |
| College / Associate Degree | 401 (86.4%) | 59 (12.7%) |
| Bachelor's Degree or higher | 621 (90.8%) | 74 (10.8%) |
| Total | 1,276 (85.4%) | 137 (9.2%) |
Employment Occupations by Sex in Rockledge borough
Management, Business, Science and Arts Occupations
The most common Management, Business, Science and Arts occupations in Rockledge borough are Management (247 | 17.9%), Community & Social Service (161 | 11.7%), Education Instruction & Library (89 | 6.5%), Health Diagnosing & Treating (71 | 5.2%), and Business & Financial (69 | 5.0%).
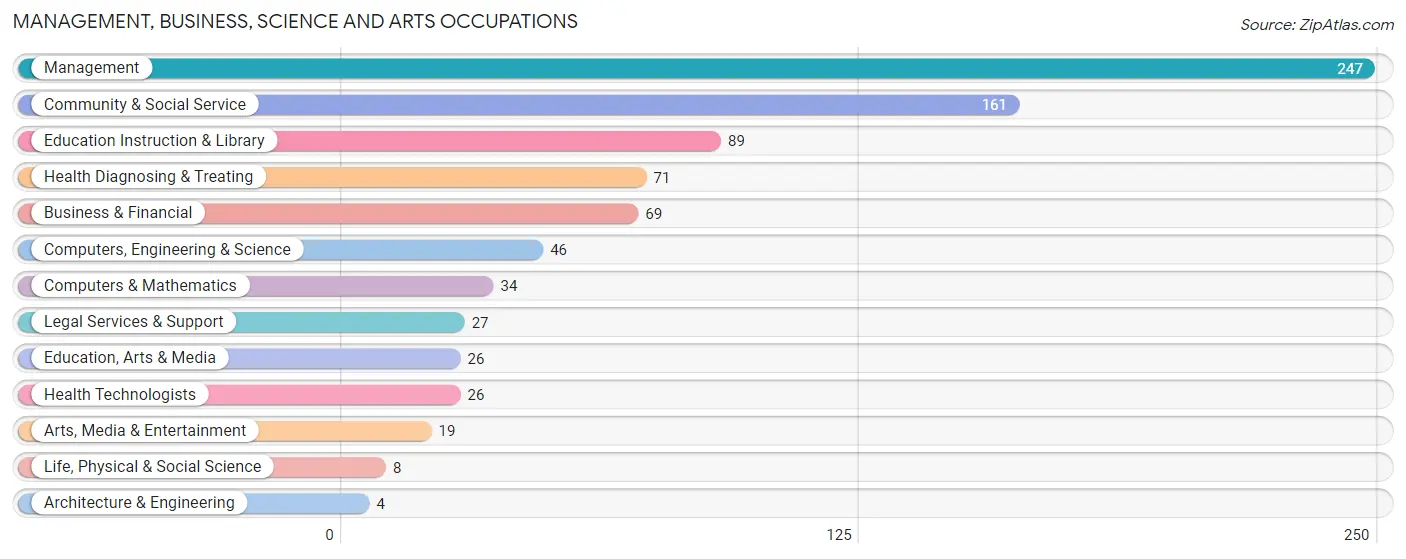
Management, Business, Science and Arts Occupations by Sex
Within the Management, Business, Science and Arts occupations in Rockledge borough, the most male-oriented occupations are Architecture & Engineering (100.0%), Computers & Mathematics (88.2%), and Computers, Engineering & Science (73.9%), while the most female-oriented occupations are Life, Physical & Social Science (100.0%), Education, Arts & Media (100.0%), and Arts, Media & Entertainment (100.0%).
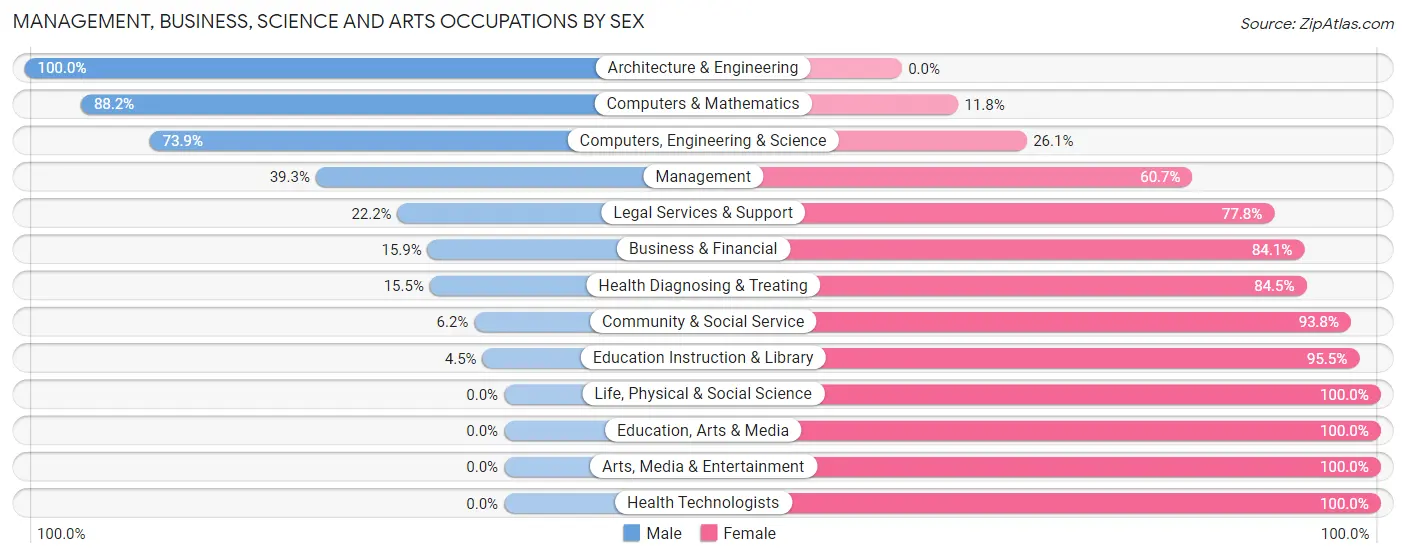
| Occupation | Male | Female |
| Management | 97 (39.3%) | 150 (60.7%) |
| Business & Financial | 11 (15.9%) | 58 (84.1%) |
| Computers, Engineering & Science | 34 (73.9%) | 12 (26.1%) |
| Computers & Mathematics | 30 (88.2%) | 4 (11.8%) |
| Architecture & Engineering | 4 (100.0%) | 0 (0.0%) |
| Life, Physical & Social Science | 0 (0.0%) | 8 (100.0%) |
| Community & Social Service | 10 (6.2%) | 151 (93.8%) |
| Education, Arts & Media | 0 (0.0%) | 26 (100.0%) |
| Legal Services & Support | 6 (22.2%) | 21 (77.8%) |
| Education Instruction & Library | 4 (4.5%) | 85 (95.5%) |
| Arts, Media & Entertainment | 0 (0.0%) | 19 (100.0%) |
| Health Diagnosing & Treating | 11 (15.5%) | 60 (84.5%) |
| Health Technologists | 0 (0.0%) | 26 (100.0%) |
| Total (Category) | 163 (27.4%) | 431 (72.6%) |
| Total (Overall) | 680 (49.4%) | 696 (50.6%) |
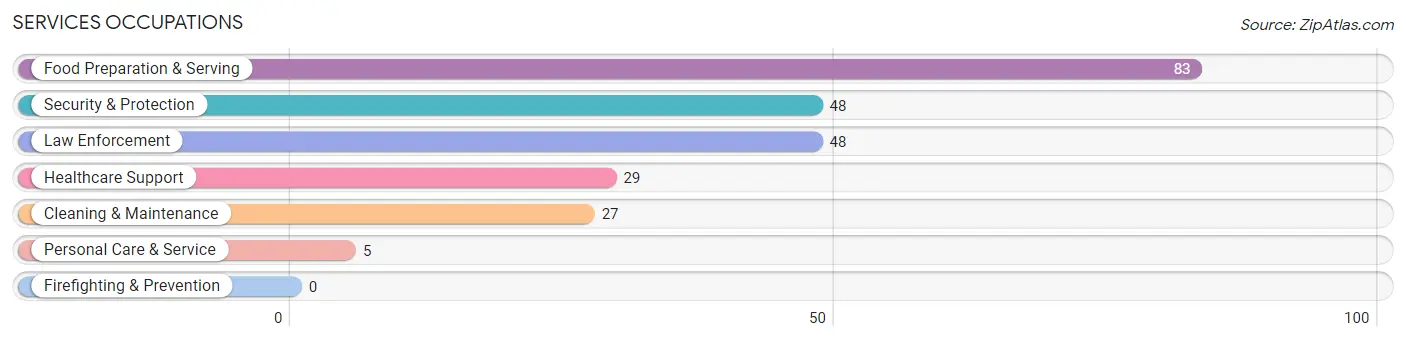
Services Occupations
The most common Services occupations in Rockledge borough are Food Preparation & Serving (83 | 6.0%), Security & Protection (48 | 3.5%), Law Enforcement (48 | 3.5%), Healthcare Support (29 | 2.1%), and Cleaning & Maintenance (27 | 2.0%).
Services Occupations by Sex
Within the Services occupations in Rockledge borough, the most male-oriented occupations are Security & Protection (100.0%), Law Enforcement (100.0%), and Cleaning & Maintenance (81.5%), while the most female-oriented occupations are Healthcare Support (100.0%), Personal Care & Service (100.0%), and Food Preparation & Serving (54.2%).
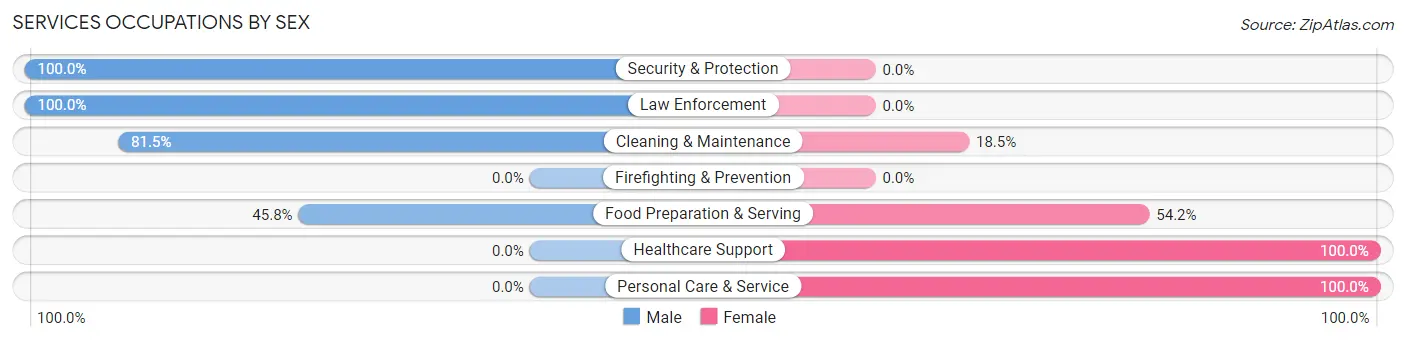
| Occupation | Male | Female |
| Healthcare Support | 0 (0.0%) | 29 (100.0%) |
| Security & Protection | 48 (100.0%) | 0 (0.0%) |
| Firefighting & Prevention | 0 (0.0%) | 0 (0.0%) |
| Law Enforcement | 48 (100.0%) | 0 (0.0%) |
| Food Preparation & Serving | 38 (45.8%) | 45 (54.2%) |
| Cleaning & Maintenance | 22 (81.5%) | 5 (18.5%) |
| Personal Care & Service | 0 (0.0%) | 5 (100.0%) |
| Total (Category) | 108 (56.2%) | 84 (43.8%) |
| Total (Overall) | 680 (49.4%) | 696 (50.6%) |
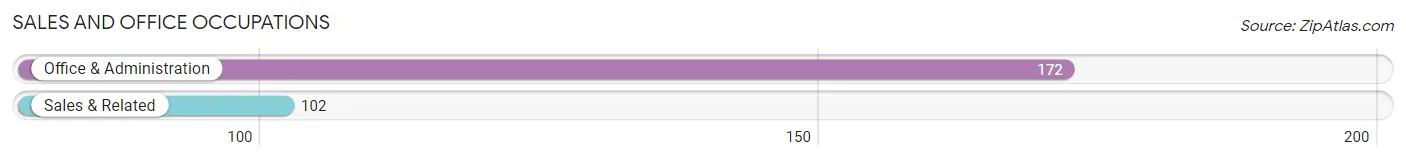
Sales and Office Occupations
The most common Sales and Office occupations in Rockledge borough are Office & Administration (172 | 12.5%), and Sales & Related (102 | 7.4%).
Sales and Office Occupations by Sex
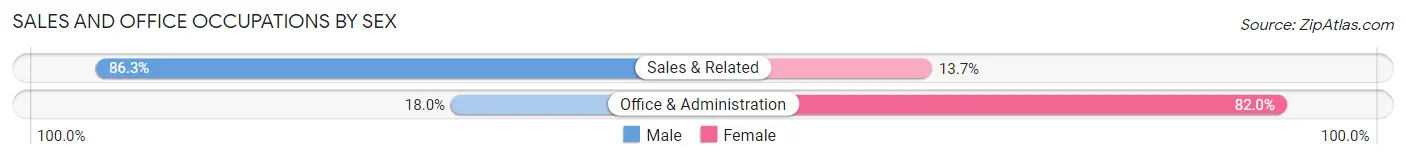
| Occupation | Male | Female |
| Sales & Related | 88 (86.3%) | 14 (13.7%) |
| Office & Administration | 31 (18.0%) | 141 (82.0%) |
| Total (Category) | 119 (43.4%) | 155 (56.6%) |
| Total (Overall) | 680 (49.4%) | 696 (50.6%) |
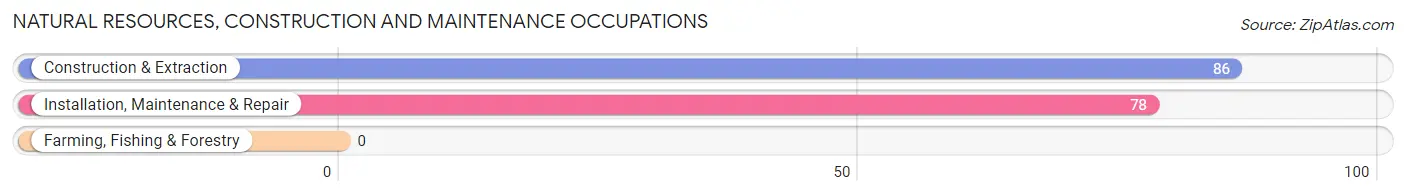
Natural Resources, Construction and Maintenance Occupations
The most common Natural Resources, Construction and Maintenance occupations in Rockledge borough are Construction & Extraction (86 | 6.2%), and Installation, Maintenance & Repair (78 | 5.7%).
Natural Resources, Construction and Maintenance Occupations by Sex
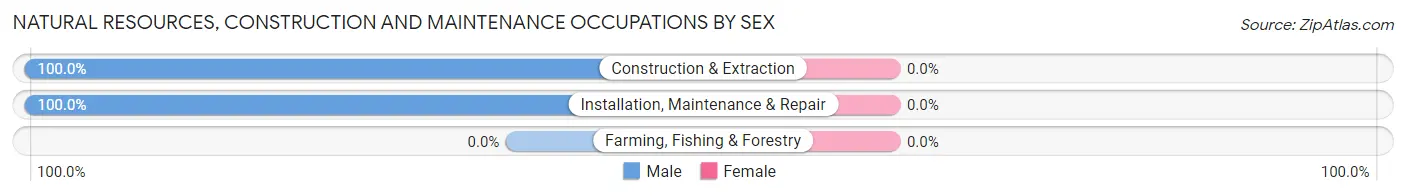
| Occupation | Male | Female |
| Farming, Fishing & Forestry | 0 (0.0%) | 0 (0.0%) |
| Construction & Extraction | 86 (100.0%) | 0 (0.0%) |
| Installation, Maintenance & Repair | 78 (100.0%) | 0 (0.0%) |
| Total (Category) | 164 (100.0%) | 0 (0.0%) |
| Total (Overall) | 680 (49.4%) | 696 (50.6%) |
Production, Transportation and Moving Occupations
The most common Production, Transportation and Moving occupations in Rockledge borough are Material Moving (72 | 5.2%), Production (53 | 3.8%), and Transportation (27 | 2.0%).
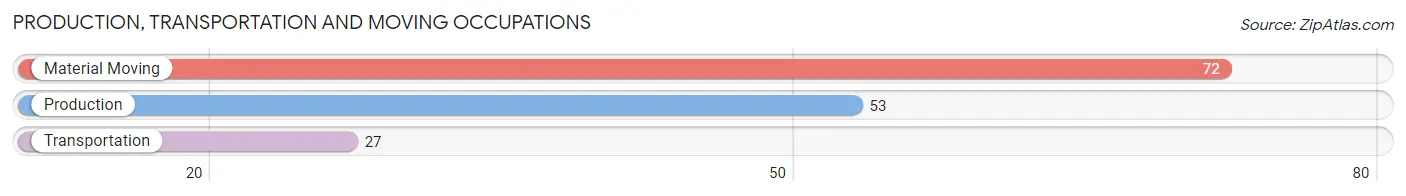
Production, Transportation and Moving Occupations by Sex
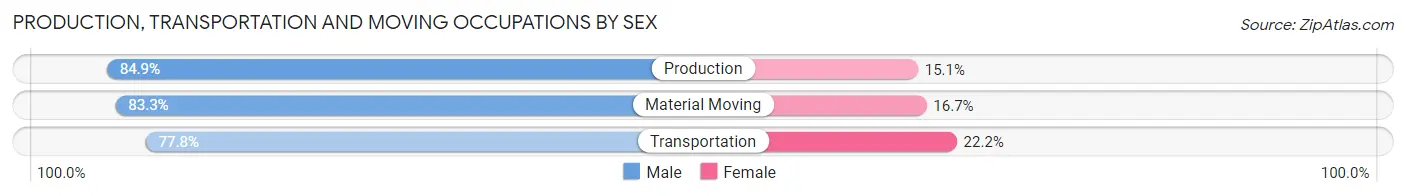
| Occupation | Male | Female |
| Production | 45 (84.9%) | 8 (15.1%) |
| Transportation | 21 (77.8%) | 6 (22.2%) |
| Material Moving | 60 (83.3%) | 12 (16.7%) |
| Total (Category) | 126 (82.9%) | 26 (17.1%) |
| Total (Overall) | 680 (49.4%) | 696 (50.6%) |
Employment Industries by Sex in Rockledge borough
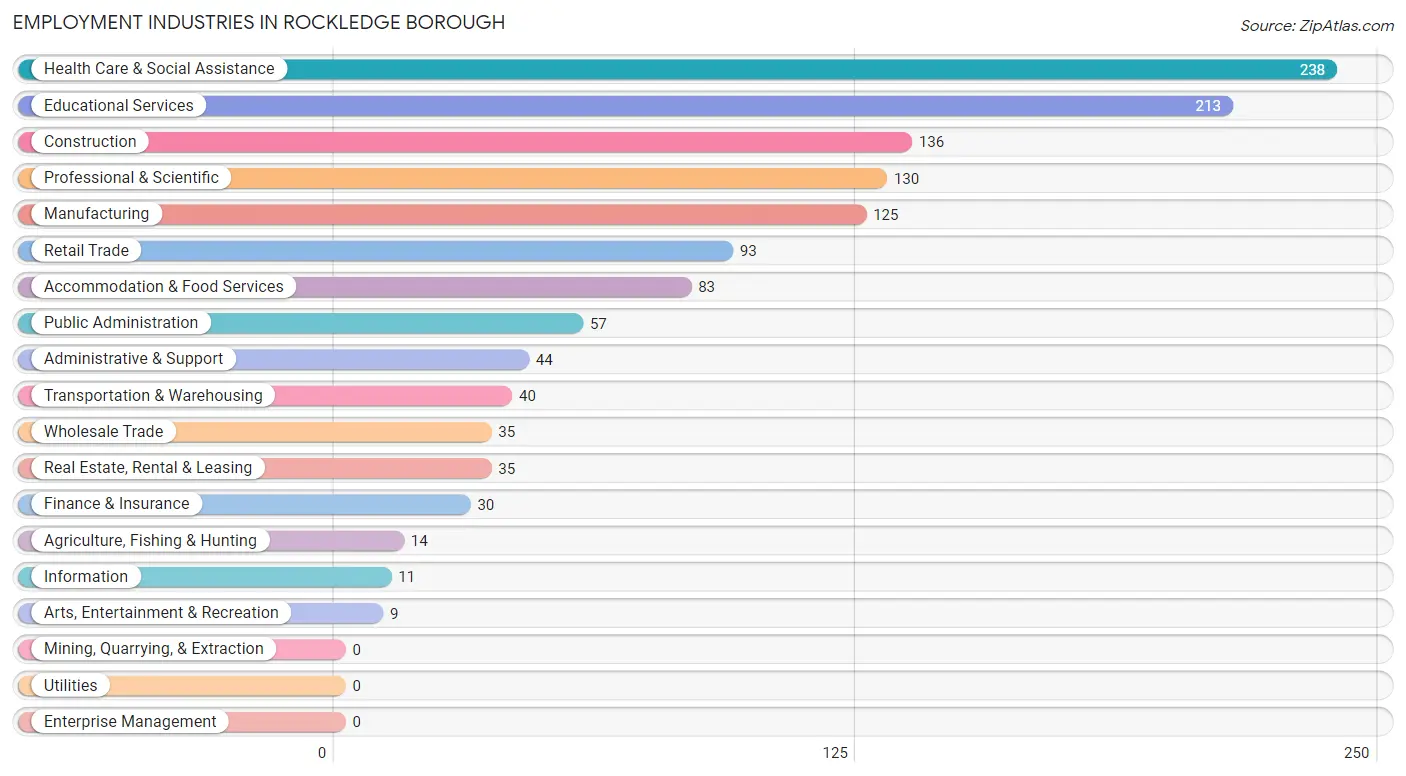
Employment Industries in Rockledge borough
The major employment industries in Rockledge borough include Health Care & Social Assistance (238 | 17.3%), Educational Services (213 | 15.5%), Construction (136 | 9.9%), Professional & Scientific (130 | 9.5%), and Manufacturing (125 | 9.1%).
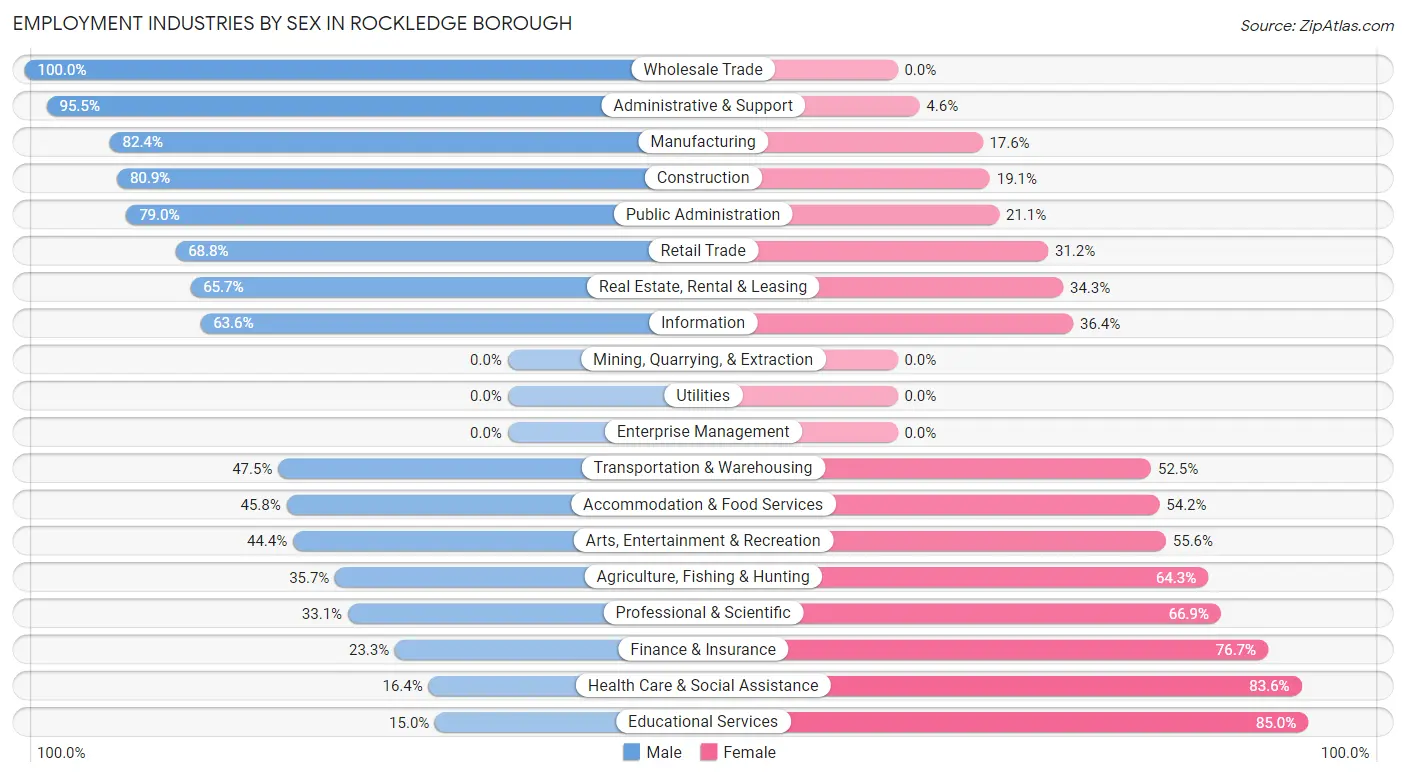
Employment Industries by Sex in Rockledge borough
The Rockledge borough industries that see more men than women are Wholesale Trade (100.0%), Administrative & Support (95.5%), and Manufacturing (82.4%), whereas the industries that tend to have a higher number of women are Educational Services (85.0%), Health Care & Social Assistance (83.6%), and Finance & Insurance (76.7%).
| Industry | Male | Female |
| Agriculture, Fishing & Hunting | 5 (35.7%) | 9 (64.3%) |
| Mining, Quarrying, & Extraction | 0 (0.0%) | 0 (0.0%) |
| Construction | 110 (80.9%) | 26 (19.1%) |
| Manufacturing | 103 (82.4%) | 22 (17.6%) |
| Wholesale Trade | 35 (100.0%) | 0 (0.0%) |
| Retail Trade | 64 (68.8%) | 29 (31.2%) |
| Transportation & Warehousing | 19 (47.5%) | 21 (52.5%) |
| Utilities | 0 (0.0%) | 0 (0.0%) |
| Information | 7 (63.6%) | 4 (36.4%) |
| Finance & Insurance | 7 (23.3%) | 23 (76.7%) |
| Real Estate, Rental & Leasing | 23 (65.7%) | 12 (34.3%) |
| Professional & Scientific | 43 (33.1%) | 87 (66.9%) |
| Enterprise Management | 0 (0.0%) | 0 (0.0%) |
| Administrative & Support | 42 (95.5%) | 2 (4.5%) |
| Educational Services | 32 (15.0%) | 181 (85.0%) |
| Health Care & Social Assistance | 39 (16.4%) | 199 (83.6%) |
| Arts, Entertainment & Recreation | 4 (44.4%) | 5 (55.6%) |
| Accommodation & Food Services | 38 (45.8%) | 45 (54.2%) |
| Public Administration | 45 (78.9%) | 12 (21.0%) |
| Total | 680 (49.4%) | 696 (50.6%) |
Education in Rockledge borough
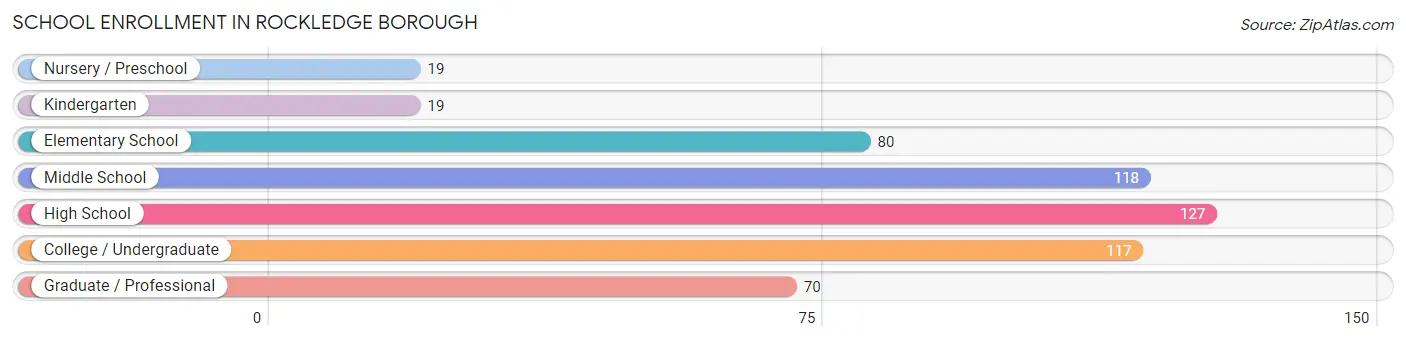
School Enrollment in Rockledge borough
The most common levels of schooling among the 550 students in Rockledge borough are high school (127 | 23.1%), middle school (118 | 21.4%), and college / undergraduate (117 | 21.3%).
| School Level | # Students | % Students |
| Nursery / Preschool | 19 | 3.5% |
| Kindergarten | 19 | 3.5% |
| Elementary School | 80 | 14.5% |
| Middle School | 118 | 21.4% |
| High School | 127 | 23.1% |
| College / Undergraduate | 117 | 21.3% |
| Graduate / Professional | 70 | 12.7% |
| Total | 550 | 100.0% |
School Enrollment by Age by Funding Source in Rockledge borough
Out of a total of 550 students who are enrolled in schools in Rockledge borough, 125 (22.7%) attend a private institution, while the remaining 425 (77.3%) are enrolled in public schools. The age group of 3 to 4 year olds has the highest likelihood of being enrolled in private schools, with 19 (100.0% in the age bracket) enrolled. Conversely, the age group of 5 to 9 year old has the lowest likelihood of being enrolled in a private school, with 97 (100.0% in the age bracket) attending a public institution.
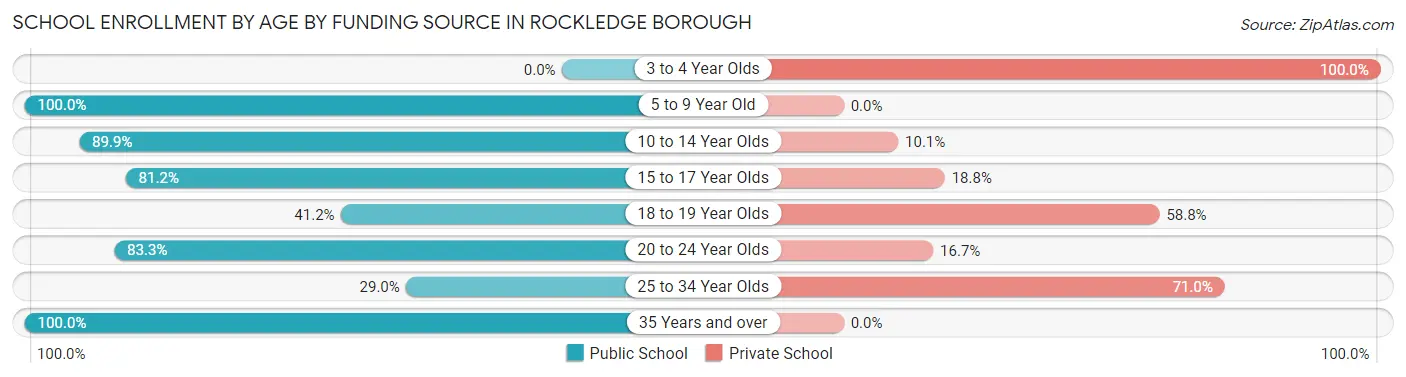
| Age Bracket | Public School | Private School |
| 3 to 4 Year Olds | 0 (0.0%) | 19 (100.0%) |
| 5 to 9 Year Old | 97 (100.0%) | 0 (0.0%) |
| 10 to 14 Year Olds | 124 (89.9%) | 14 (10.1%) |
| 15 to 17 Year Olds | 69 (81.2%) | 16 (18.8%) |
| 18 to 19 Year Olds | 14 (41.2%) | 20 (58.8%) |
| 20 to 24 Year Olds | 60 (83.3%) | 12 (16.7%) |
| 25 to 34 Year Olds | 18 (29.0%) | 44 (71.0%) |
| 35 Years and over | 43 (100.0%) | 0 (0.0%) |
| Total | 425 (77.3%) | 125 (22.7%) |
Educational Attainment by Field of Study in Rockledge borough
Business (172 | 19.9%), literature & languages (97 | 11.2%), psychology (95 | 11.0%), science & technology (90 | 10.4%), and social sciences (73 | 8.4%) are the most common fields of study among 865 individuals in Rockledge borough who have obtained a bachelor's degree or higher.
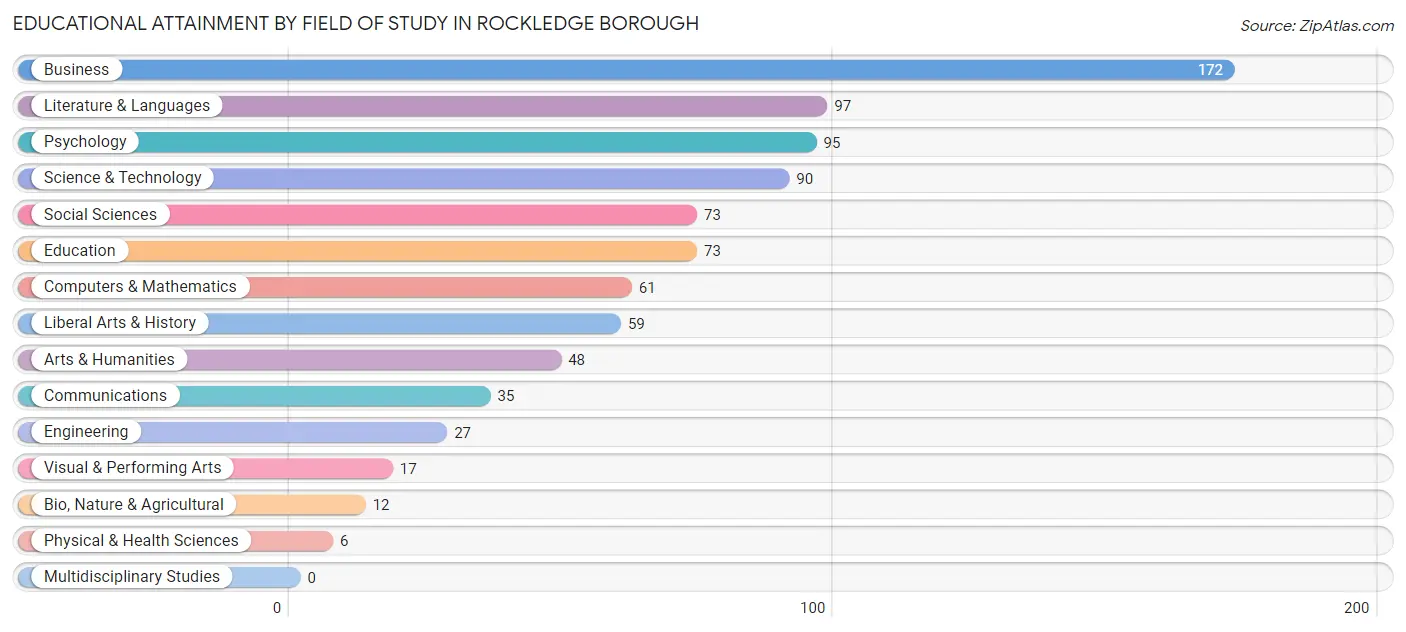
| Field of Study | # Graduates | % Graduates |
| Computers & Mathematics | 61 | 7.0% |
| Bio, Nature & Agricultural | 12 | 1.4% |
| Physical & Health Sciences | 6 | 0.7% |
| Psychology | 95 | 11.0% |
| Social Sciences | 73 | 8.4% |
| Engineering | 27 | 3.1% |
| Multidisciplinary Studies | 0 | 0.0% |
| Science & Technology | 90 | 10.4% |
| Business | 172 | 19.9% |
| Education | 73 | 8.4% |
| Literature & Languages | 97 | 11.2% |
| Liberal Arts & History | 59 | 6.8% |
| Visual & Performing Arts | 17 | 2.0% |
| Communications | 35 | 4.1% |
| Arts & Humanities | 48 | 5.6% |
| Total | 865 | 100.0% |
Transportation & Commute in Rockledge borough
Vehicle Availability by Sex in Rockledge borough
The most prevalent vehicle ownership categories in Rockledge borough are males with 2 vehicles (278, accounting for 41.3%) and females with 2 vehicles (309, making up 40.6%).
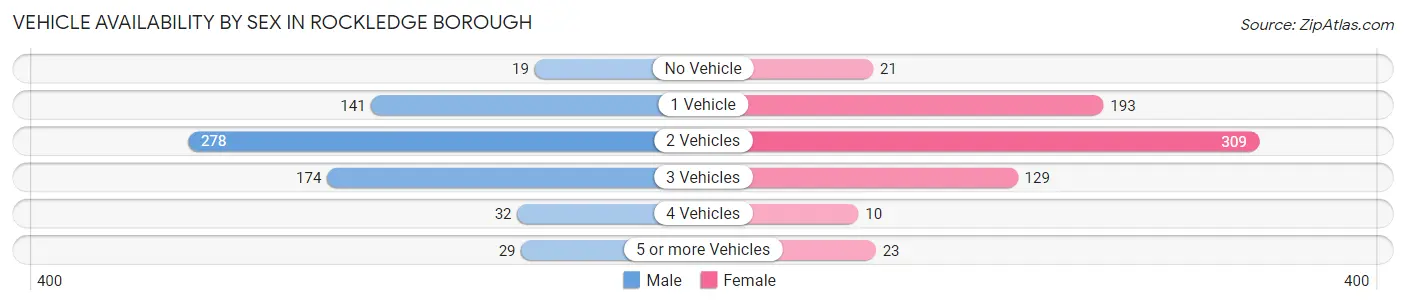
| Vehicles Available | Male | Female |
| No Vehicle | 19 (2.8%) | 21 (3.1%) |
| 1 Vehicle | 141 (20.9%) | 193 (28.2%) |
| 2 Vehicles | 278 (41.3%) | 309 (45.1%) |
| 3 Vehicles | 174 (25.9%) | 129 (18.8%) |
| 4 Vehicles | 32 (4.8%) | 10 (1.5%) |
| 5 or more Vehicles | 29 (4.3%) | 23 (3.4%) |
| Total | 673 (100.0%) | 685 (100.0%) |
Commute Time in Rockledge borough
The most frequently occuring commute durations in Rockledge borough are 45 to 59 minutes (252 commuters, 21.4%), 30 to 34 minutes (217 commuters, 18.4%), and 20 to 24 minutes (130 commuters, 11.0%).
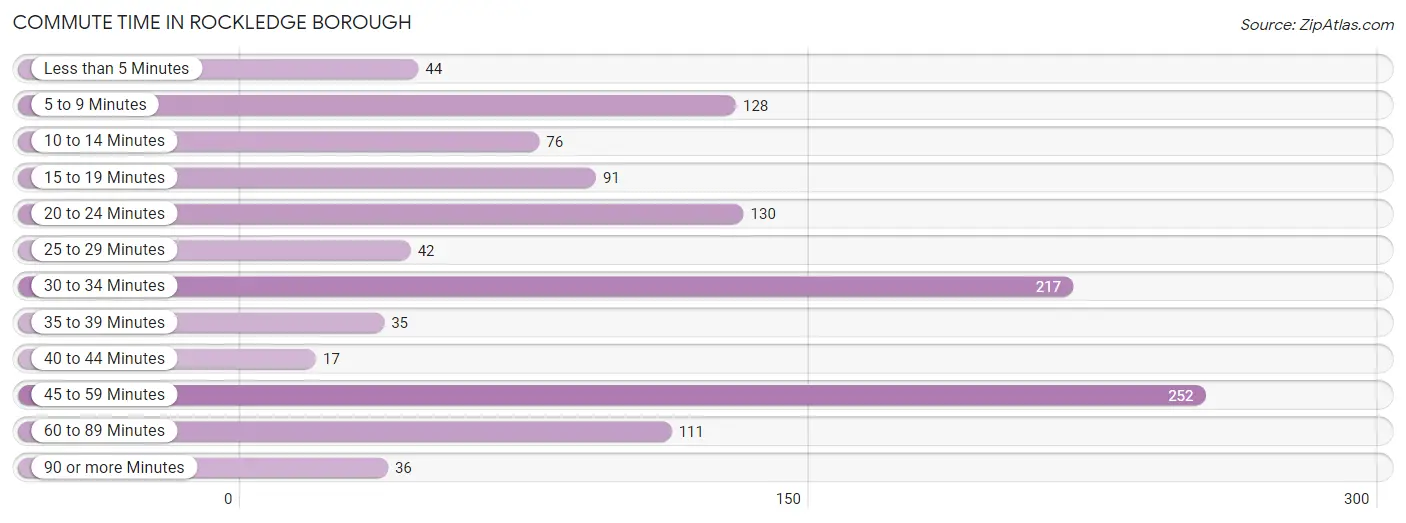
| Commute Time | # Commuters | % Commuters |
| Less than 5 Minutes | 44 | 3.7% |
| 5 to 9 Minutes | 128 | 10.9% |
| 10 to 14 Minutes | 76 | 6.5% |
| 15 to 19 Minutes | 91 | 7.7% |
| 20 to 24 Minutes | 130 | 11.0% |
| 25 to 29 Minutes | 42 | 3.6% |
| 30 to 34 Minutes | 217 | 18.4% |
| 35 to 39 Minutes | 35 | 3.0% |
| 40 to 44 Minutes | 17 | 1.4% |
| 45 to 59 Minutes | 252 | 21.4% |
| 60 to 89 Minutes | 111 | 9.4% |
| 90 or more Minutes | 36 | 3.0% |
Commute Time by Sex in Rockledge borough
The most common commute times in Rockledge borough are 45 to 59 minutes (172 commuters, 28.1%) for males and 30 to 34 minutes (99 commuters, 17.5%) for females.
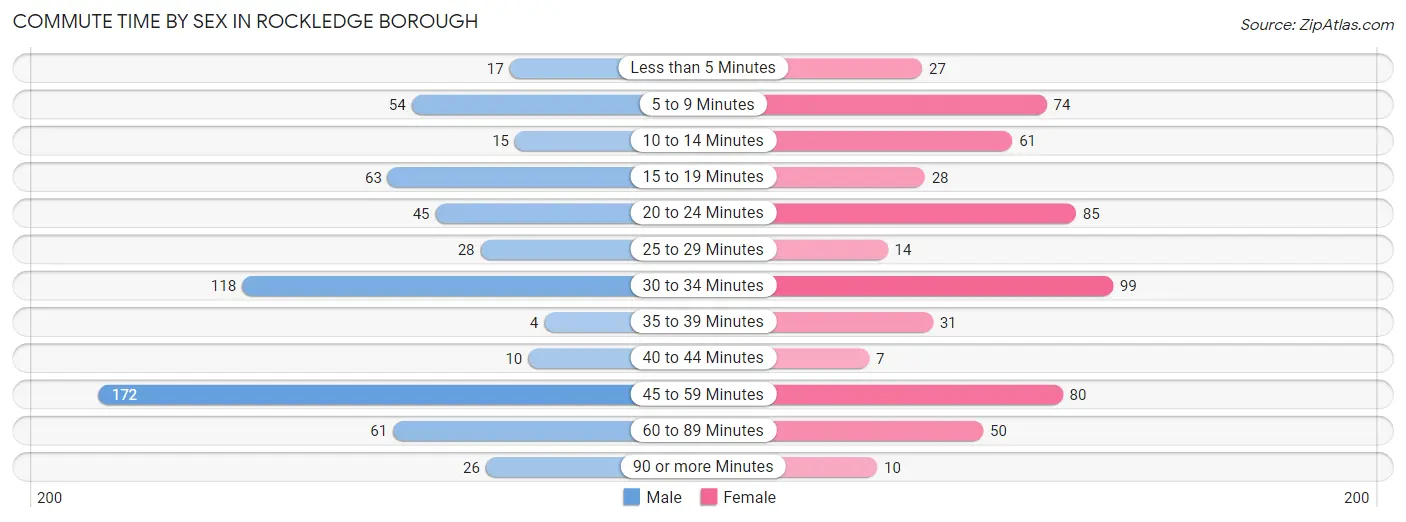
| Commute Time | Male | Female |
| Less than 5 Minutes | 17 (2.8%) | 27 (4.8%) |
| 5 to 9 Minutes | 54 (8.8%) | 74 (13.1%) |
| 10 to 14 Minutes | 15 (2.5%) | 61 (10.8%) |
| 15 to 19 Minutes | 63 (10.3%) | 28 (5.0%) |
| 20 to 24 Minutes | 45 (7.3%) | 85 (15.0%) |
| 25 to 29 Minutes | 28 (4.6%) | 14 (2.5%) |
| 30 to 34 Minutes | 118 (19.3%) | 99 (17.5%) |
| 35 to 39 Minutes | 4 (0.6%) | 31 (5.5%) |
| 40 to 44 Minutes | 10 (1.6%) | 7 (1.2%) |
| 45 to 59 Minutes | 172 (28.1%) | 80 (14.1%) |
| 60 to 89 Minutes | 61 (10.0%) | 50 (8.8%) |
| 90 or more Minutes | 26 (4.2%) | 10 (1.8%) |
Time of Departure to Work by Sex in Rockledge borough
The most frequent times of departure to work in Rockledge borough are 6:30 AM to 6:59 AM (107, 17.5%) for males and 7:30 AM to 7:59 AM (107, 18.9%) for females.
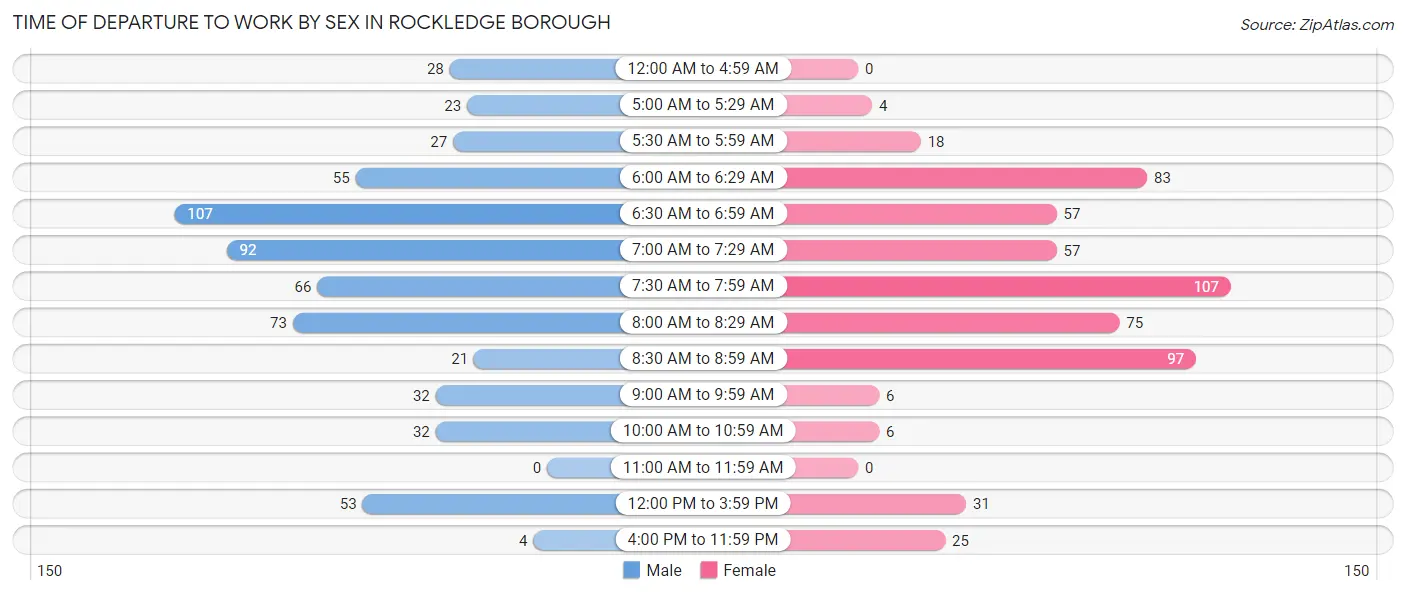
| Time of Departure | Male | Female |
| 12:00 AM to 4:59 AM | 28 (4.6%) | 0 (0.0%) |
| 5:00 AM to 5:29 AM | 23 (3.7%) | 4 (0.7%) |
| 5:30 AM to 5:59 AM | 27 (4.4%) | 18 (3.2%) |
| 6:00 AM to 6:29 AM | 55 (9.0%) | 83 (14.7%) |
| 6:30 AM to 6:59 AM | 107 (17.5%) | 57 (10.1%) |
| 7:00 AM to 7:29 AM | 92 (15.0%) | 57 (10.1%) |
| 7:30 AM to 7:59 AM | 66 (10.8%) | 107 (18.9%) |
| 8:00 AM to 8:29 AM | 73 (11.9%) | 75 (13.3%) |
| 8:30 AM to 8:59 AM | 21 (3.4%) | 97 (17.1%) |
| 9:00 AM to 9:59 AM | 32 (5.2%) | 6 (1.1%) |
| 10:00 AM to 10:59 AM | 32 (5.2%) | 6 (1.1%) |
| 11:00 AM to 11:59 AM | 0 (0.0%) | 0 (0.0%) |
| 12:00 PM to 3:59 PM | 53 (8.6%) | 31 (5.5%) |
| 4:00 PM to 11:59 PM | 4 (0.6%) | 25 (4.4%) |
| Total | 613 (100.0%) | 566 (100.0%) |
Housing Occupancy in Rockledge borough
Occupancy by Ownership in Rockledge borough
Of the total 1,076 dwellings in Rockledge borough, owner-occupied units account for 750 (69.7%), while renter-occupied units make up 326 (30.3%).
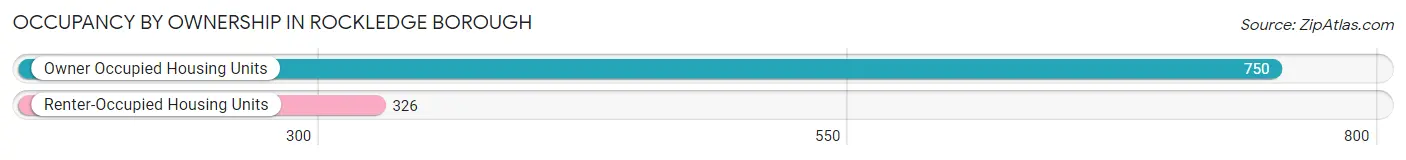
| Occupancy | # Housing Units | % Housing Units |
| Owner Occupied Housing Units | 750 | 69.7% |
| Renter-Occupied Housing Units | 326 | 30.3% |
| Total Occupied Housing Units | 1,076 | 100.0% |
Occupancy by Household Size in Rockledge borough
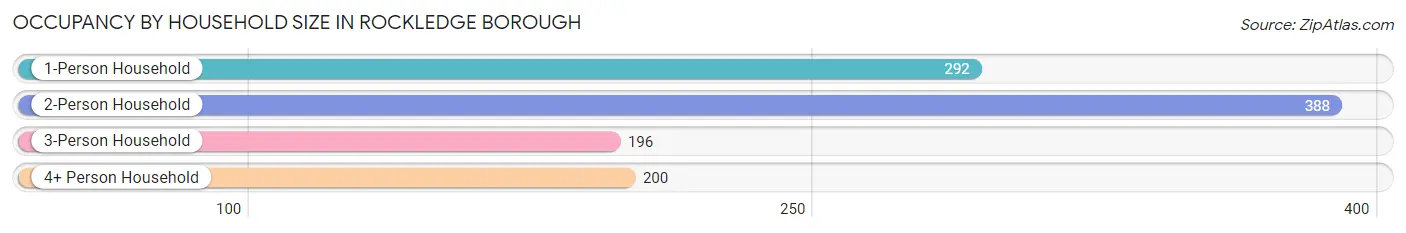
| Household Size | # Housing Units | % Housing Units |
| 1-Person Household | 292 | 27.1% |
| 2-Person Household | 388 | 36.1% |
| 3-Person Household | 196 | 18.2% |
| 4+ Person Household | 200 | 18.6% |
| Total Housing Units | 1,076 | 100.0% |
Occupancy by Ownership by Household Size in Rockledge borough
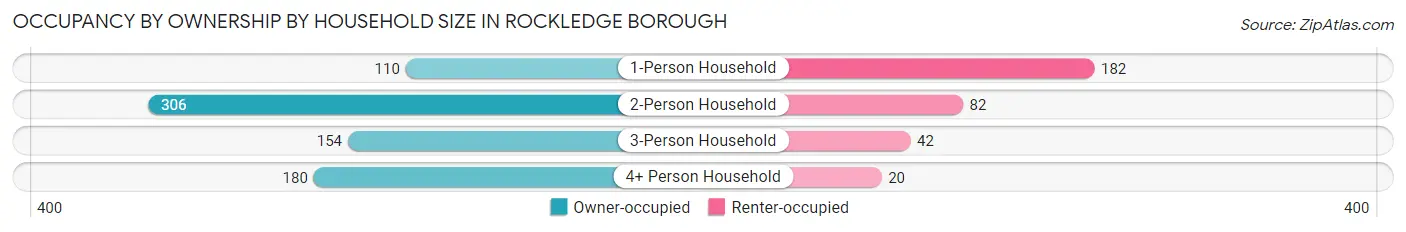
| Household Size | Owner-occupied | Renter-occupied |
| 1-Person Household | 110 (37.7%) | 182 (62.3%) |
| 2-Person Household | 306 (78.9%) | 82 (21.1%) |
| 3-Person Household | 154 (78.6%) | 42 (21.4%) |
| 4+ Person Household | 180 (90.0%) | 20 (10.0%) |
| Total Housing Units | 750 (69.7%) | 326 (30.3%) |
Occupancy by Educational Attainment in Rockledge borough
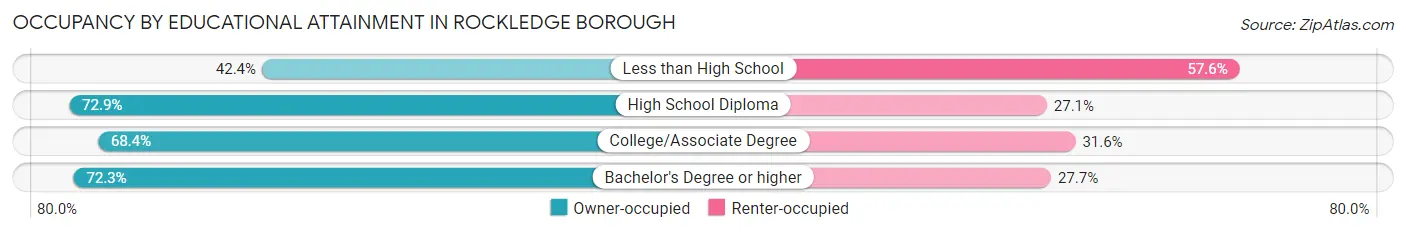
| Household Size | Owner-occupied | Renter-occupied |
| Less than High School | 25 (42.4%) | 34 (57.6%) |
| High School Diploma | 229 (72.9%) | 85 (27.1%) |
| College/Associate Degree | 212 (68.4%) | 98 (31.6%) |
| Bachelor's Degree or higher | 284 (72.3%) | 109 (27.7%) |
Occupancy by Age of Householder in Rockledge borough
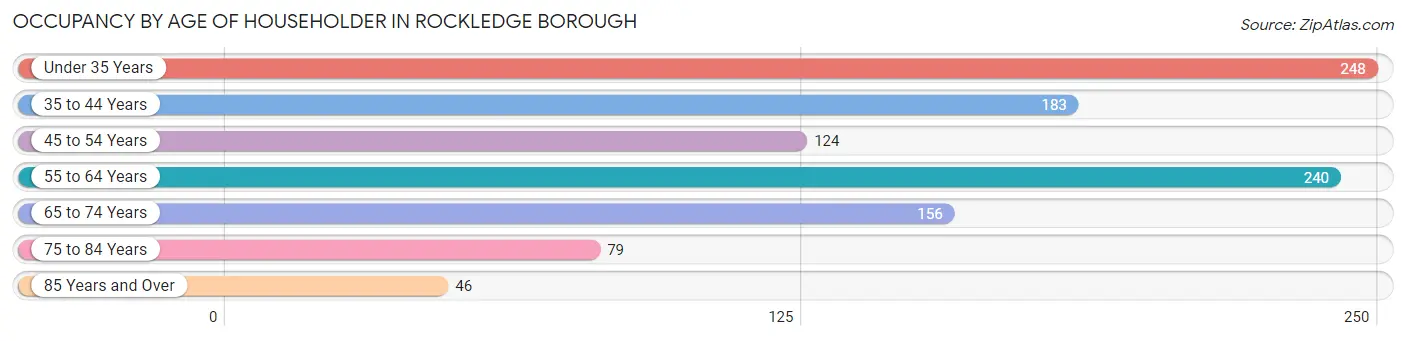
| Age Bracket | # Households | % Households |
| Under 35 Years | 248 | 23.1% |
| 35 to 44 Years | 183 | 17.0% |
| 45 to 54 Years | 124 | 11.5% |
| 55 to 64 Years | 240 | 22.3% |
| 65 to 74 Years | 156 | 14.5% |
| 75 to 84 Years | 79 | 7.3% |
| 85 Years and Over | 46 | 4.3% |
| Total | 1,076 | 100.0% |
Housing Finances in Rockledge borough
Median Income by Occupancy in Rockledge borough
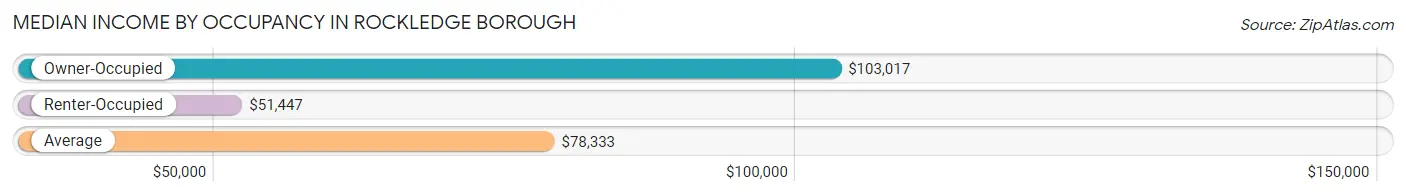
| Occupancy Type | # Households | Median Income |
| Owner-Occupied | 750 (69.7%) | $103,017 |
| Renter-Occupied | 326 (30.3%) | $51,447 |
| Average | 1,076 (100.0%) | $78,333 |
Occupancy by Householder Income Bracket in Rockledge borough
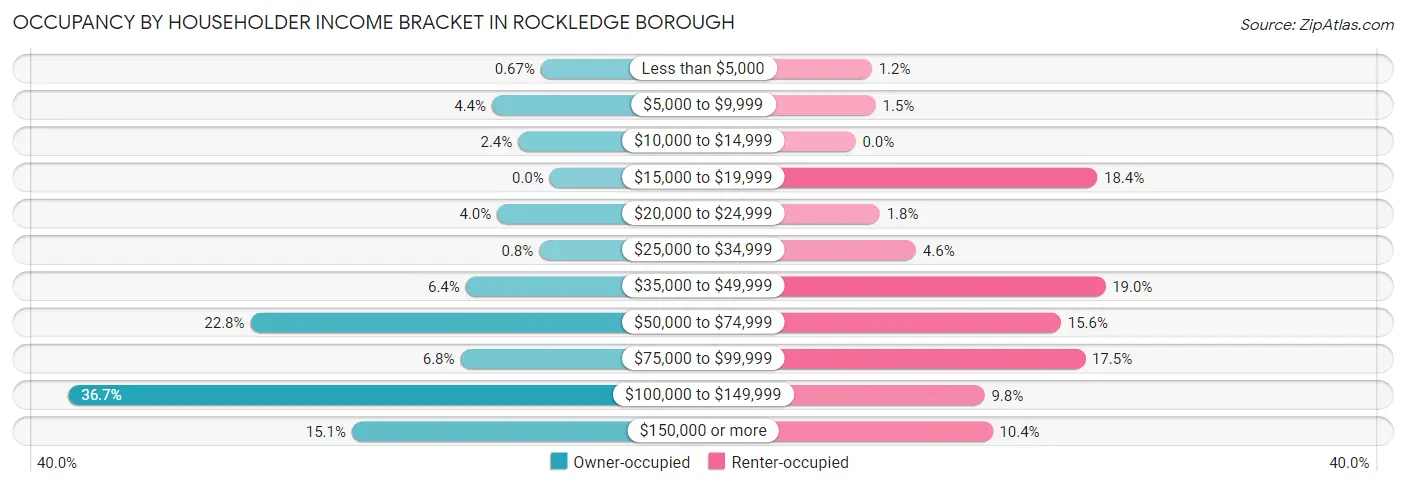
| Income Bracket | Owner-occupied | Renter-occupied |
| Less than $5,000 | 5 (0.7%) | 4 (1.2%) |
| $5,000 to $9,999 | 33 (4.4%) | 5 (1.5%) |
| $10,000 to $14,999 | 18 (2.4%) | 0 (0.0%) |
| $15,000 to $19,999 | 0 (0.0%) | 60 (18.4%) |
| $20,000 to $24,999 | 30 (4.0%) | 6 (1.8%) |
| $25,000 to $34,999 | 6 (0.8%) | 15 (4.6%) |
| $35,000 to $49,999 | 48 (6.4%) | 62 (19.0%) |
| $50,000 to $74,999 | 171 (22.8%) | 51 (15.6%) |
| $75,000 to $99,999 | 51 (6.8%) | 57 (17.5%) |
| $100,000 to $149,999 | 275 (36.7%) | 32 (9.8%) |
| $150,000 or more | 113 (15.1%) | 34 (10.4%) |
| Total | 750 (100.0%) | 326 (100.0%) |
Monthly Housing Cost Tiers in Rockledge borough
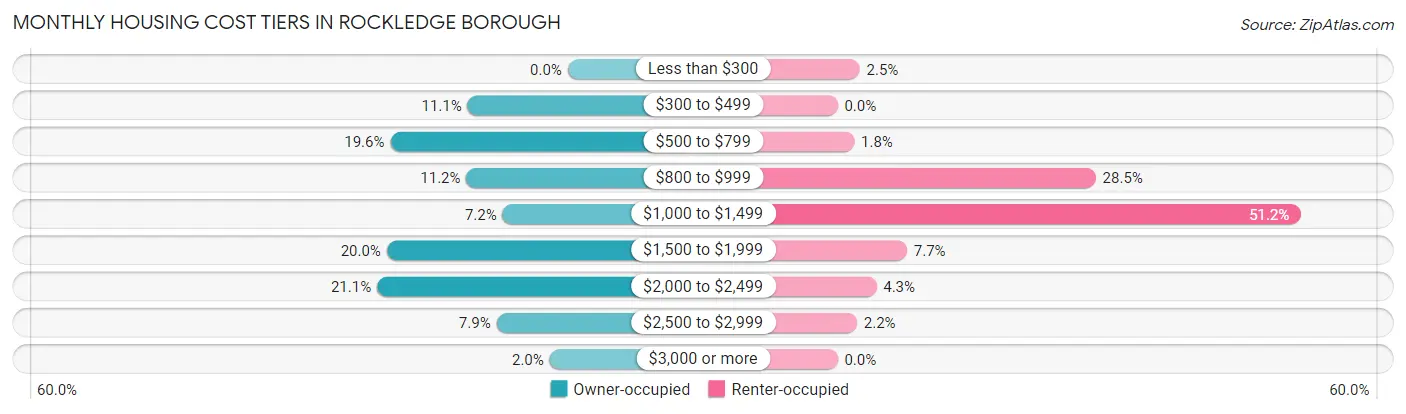
| Monthly Cost | Owner-occupied | Renter-occupied |
| Less than $300 | 0 (0.0%) | 8 (2.5%) |
| $300 to $499 | 83 (11.1%) | 0 (0.0%) |
| $500 to $799 | 147 (19.6%) | 6 (1.8%) |
| $800 to $999 | 84 (11.2%) | 93 (28.5%) |
| $1,000 to $1,499 | 54 (7.2%) | 167 (51.2%) |
| $1,500 to $1,999 | 150 (20.0%) | 25 (7.7%) |
| $2,000 to $2,499 | 158 (21.1%) | 14 (4.3%) |
| $2,500 to $2,999 | 59 (7.9%) | 7 (2.1%) |
| $3,000 or more | 15 (2.0%) | 0 (0.0%) |
| Total | 750 (100.0%) | 326 (100.0%) |
Physical Housing Characteristics in Rockledge borough
Housing Structures in Rockledge borough
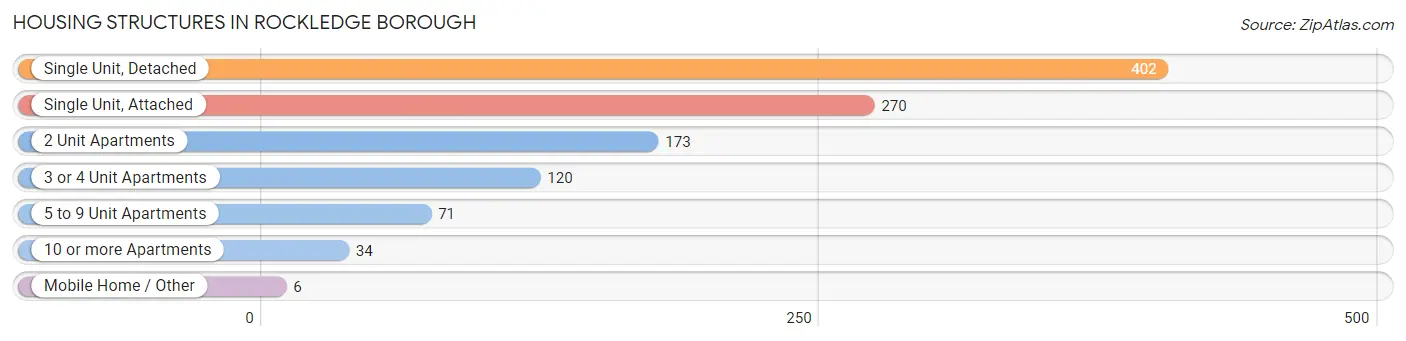
| Structure Type | # Housing Units | % Housing Units |
| Single Unit, Detached | 402 | 37.4% |
| Single Unit, Attached | 270 | 25.1% |
| 2 Unit Apartments | 173 | 16.1% |
| 3 or 4 Unit Apartments | 120 | 11.2% |
| 5 to 9 Unit Apartments | 71 | 6.6% |
| 10 or more Apartments | 34 | 3.2% |
| Mobile Home / Other | 6 | 0.6% |
| Total | 1,076 | 100.0% |
Housing Structures by Occupancy in Rockledge borough
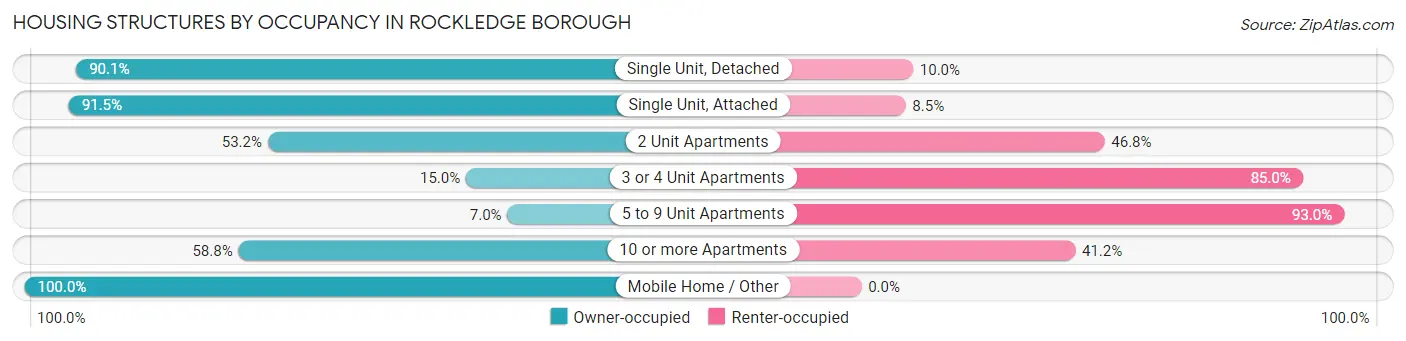
| Structure Type | Owner-occupied | Renter-occupied |
| Single Unit, Detached | 362 (90.0%) | 40 (10.0%) |
| Single Unit, Attached | 247 (91.5%) | 23 (8.5%) |
| 2 Unit Apartments | 92 (53.2%) | 81 (46.8%) |
| 3 or 4 Unit Apartments | 18 (15.0%) | 102 (85.0%) |
| 5 to 9 Unit Apartments | 5 (7.0%) | 66 (93.0%) |
| 10 or more Apartments | 20 (58.8%) | 14 (41.2%) |
| Mobile Home / Other | 6 (100.0%) | 0 (0.0%) |
| Total | 750 (69.7%) | 326 (30.3%) |
Housing Structures by Number of Rooms in Rockledge borough
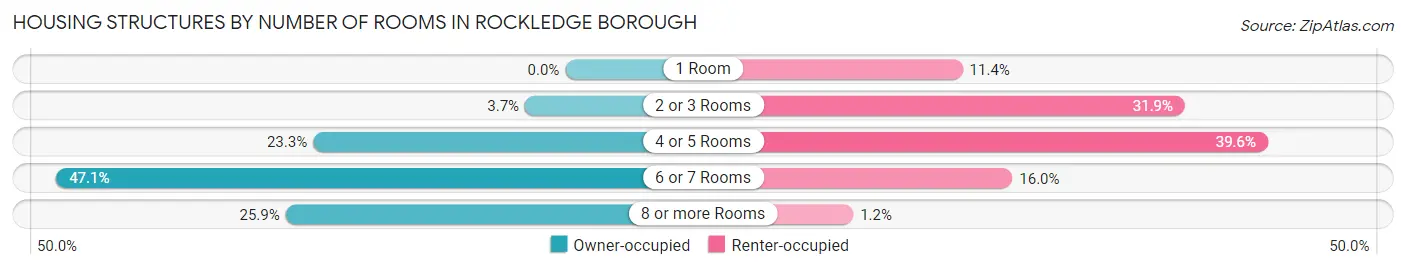
| Number of Rooms | Owner-occupied | Renter-occupied |
| 1 Room | 0 (0.0%) | 37 (11.4%) |
| 2 or 3 Rooms | 28 (3.7%) | 104 (31.9%) |
| 4 or 5 Rooms | 175 (23.3%) | 129 (39.6%) |
| 6 or 7 Rooms | 353 (47.1%) | 52 (16.0%) |
| 8 or more Rooms | 194 (25.9%) | 4 (1.2%) |
| Total | 750 (100.0%) | 326 (100.0%) |
Housing Structure by Heating Type in Rockledge borough
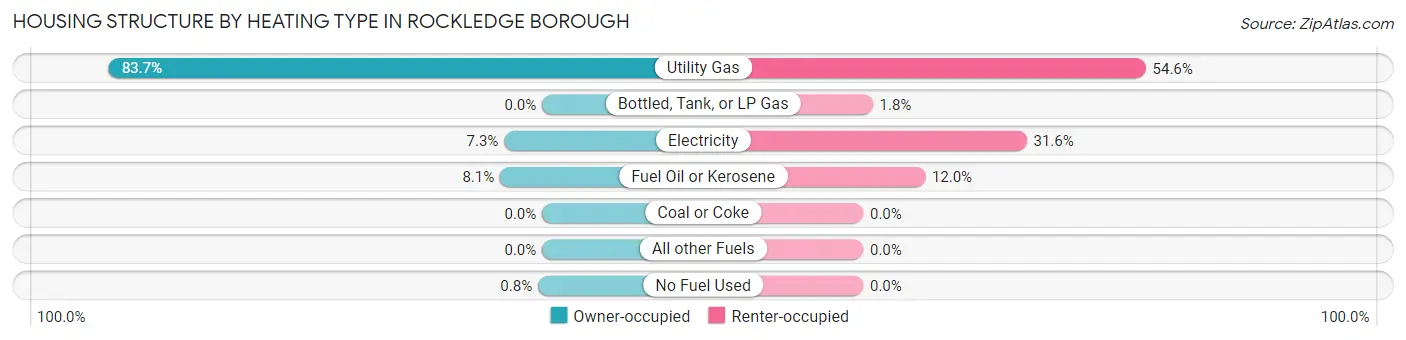
| Heating Type | Owner-occupied | Renter-occupied |
| Utility Gas | 628 (83.7%) | 178 (54.6%) |
| Bottled, Tank, or LP Gas | 0 (0.0%) | 6 (1.8%) |
| Electricity | 55 (7.3%) | 103 (31.6%) |
| Fuel Oil or Kerosene | 61 (8.1%) | 39 (12.0%) |
| Coal or Coke | 0 (0.0%) | 0 (0.0%) |
| All other Fuels | 0 (0.0%) | 0 (0.0%) |
| No Fuel Used | 6 (0.8%) | 0 (0.0%) |
| Total | 750 (100.0%) | 326 (100.0%) |
Household Vehicle Usage in Rockledge borough
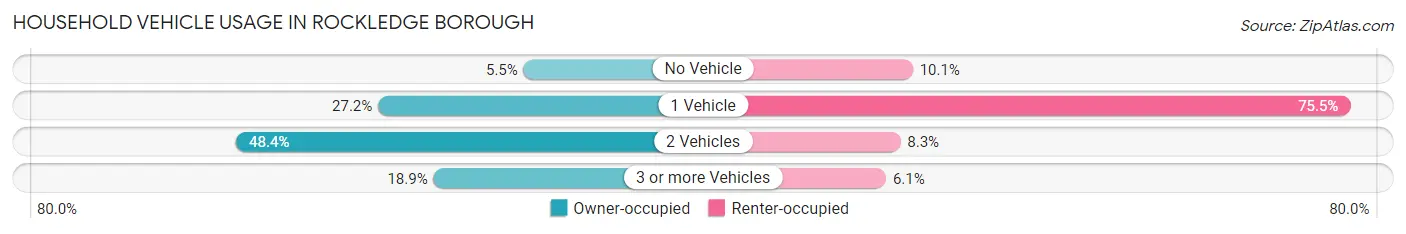
| Vehicles per Household | Owner-occupied | Renter-occupied |
| No Vehicle | 41 (5.5%) | 33 (10.1%) |
| 1 Vehicle | 204 (27.2%) | 246 (75.5%) |
| 2 Vehicles | 363 (48.4%) | 27 (8.3%) |
| 3 or more Vehicles | 142 (18.9%) | 20 (6.1%) |
| Total | 750 (100.0%) | 326 (100.0%) |
Real Estate & Mortgages in Rockledge borough
Real Estate and Mortgage Overview in Rockledge borough
| Characteristic | Without Mortgage | With Mortgage |
| Housing Units | 313 | 437 |
| Median Property Value | $265,200 | $285,200 |
| Median Household Income | $101,964 | $80 |
| Monthly Housing Costs | $599 | $15 |
| Real Estate Taxes | $4,244 | $0 |
Property Value by Mortgage Status in Rockledge borough
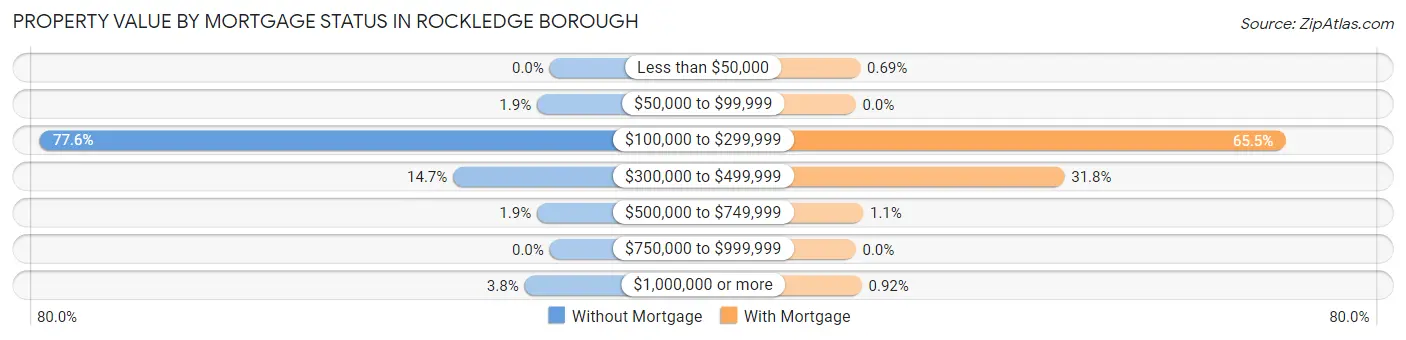
| Property Value | Without Mortgage | With Mortgage |
| Less than $50,000 | 0 (0.0%) | 3 (0.7%) |
| $50,000 to $99,999 | 6 (1.9%) | 0 (0.0%) |
| $100,000 to $299,999 | 243 (77.6%) | 286 (65.4%) |
| $300,000 to $499,999 | 46 (14.7%) | 139 (31.8%) |
| $500,000 to $749,999 | 6 (1.9%) | 5 (1.1%) |
| $750,000 to $999,999 | 0 (0.0%) | 0 (0.0%) |
| $1,000,000 or more | 12 (3.8%) | 4 (0.9%) |
| Total | 313 (100.0%) | 437 (100.0%) |
Household Income by Mortgage Status in Rockledge borough
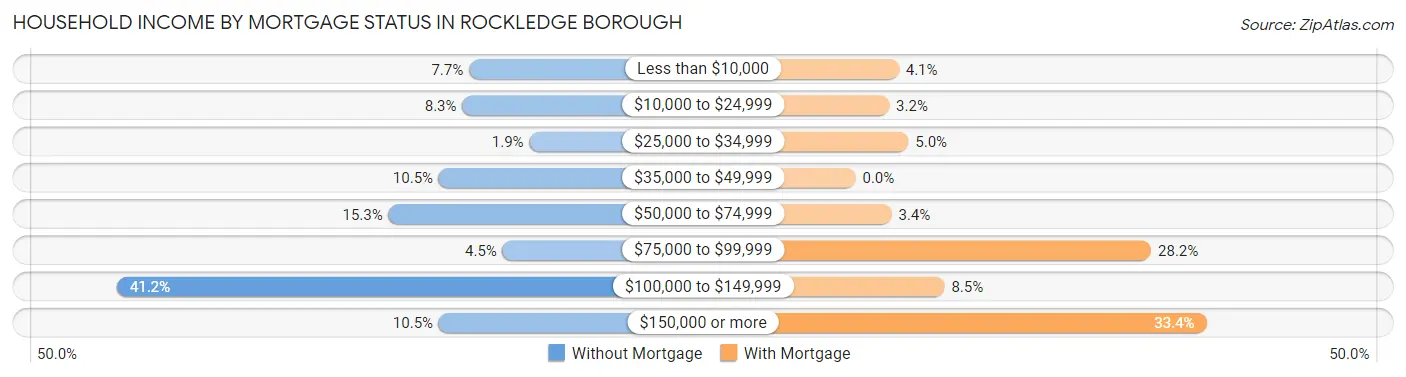
| Household Income | Without Mortgage | With Mortgage |
| Less than $10,000 | 24 (7.7%) | 18 (4.1%) |
| $10,000 to $24,999 | 26 (8.3%) | 14 (3.2%) |
| $25,000 to $34,999 | 6 (1.9%) | 22 (5.0%) |
| $35,000 to $49,999 | 33 (10.5%) | 0 (0.0%) |
| $50,000 to $74,999 | 48 (15.3%) | 15 (3.4%) |
| $75,000 to $99,999 | 14 (4.5%) | 123 (28.1%) |
| $100,000 to $149,999 | 129 (41.2%) | 37 (8.5%) |
| $150,000 or more | 33 (10.5%) | 146 (33.4%) |
| Total | 313 (100.0%) | 437 (100.0%) |
Property Value to Household Income Ratio in Rockledge borough
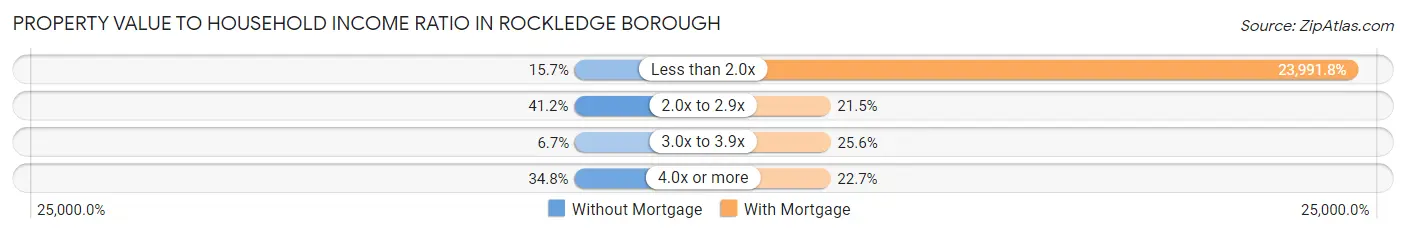
| Value-to-Income Ratio | Without Mortgage | With Mortgage |
| Less than 2.0x | 49 (15.7%) | 104,844 (23,991.8%) |
| 2.0x to 2.9x | 129 (41.2%) | 94 (21.5%) |
| 3.0x to 3.9x | 21 (6.7%) | 112 (25.6%) |
| 4.0x or more | 109 (34.8%) | 99 (22.7%) |
| Total | 313 (100.0%) | 437 (100.0%) |
Real Estate Taxes by Mortgage Status in Rockledge borough
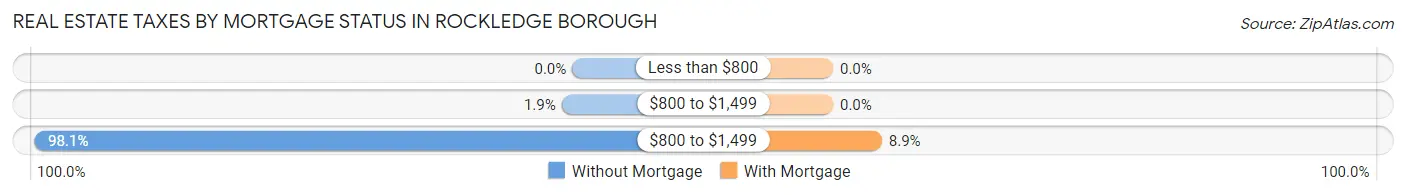
| Property Taxes | Without Mortgage | With Mortgage |
| Less than $800 | 0 (0.0%) | 0 (0.0%) |
| $800 to $1,499 | 6 (1.9%) | 0 (0.0%) |
| $800 to $1,499 | 307 (98.1%) | 39 (8.9%) |
| Total | 313 (100.0%) | 437 (100.0%) |
Health & Disability in Rockledge borough
Health Insurance Coverage by Age in Rockledge borough
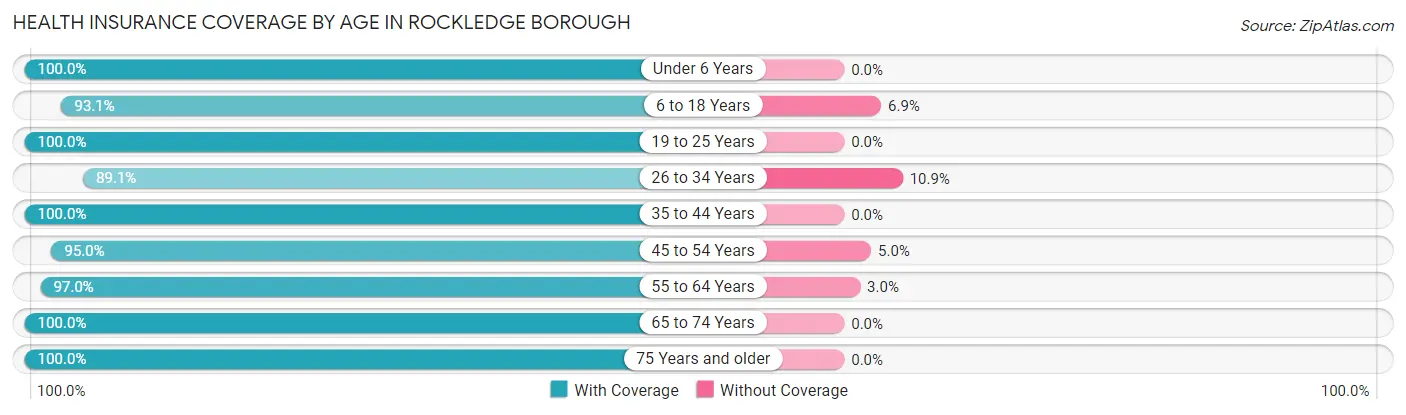
| Age Bracket | With Coverage | Without Coverage |
| Under 6 Years | 167 (100.0%) | 0 (0.0%) |
| 6 to 18 Years | 326 (93.1%) | 24 (6.9%) |
| 19 to 25 Years | 171 (100.0%) | 0 (0.0%) |
| 26 to 34 Years | 401 (89.1%) | 49 (10.9%) |
| 35 to 44 Years | 339 (100.0%) | 0 (0.0%) |
| 45 to 54 Years | 247 (95.0%) | 13 (5.0%) |
| 55 to 64 Years | 393 (97.0%) | 12 (3.0%) |
| 65 to 74 Years | 288 (100.0%) | 0 (0.0%) |
| 75 Years and older | 194 (100.0%) | 0 (0.0%) |
| Total | 2,526 (96.3%) | 98 (3.7%) |
Health Insurance Coverage by Citizenship Status in Rockledge borough
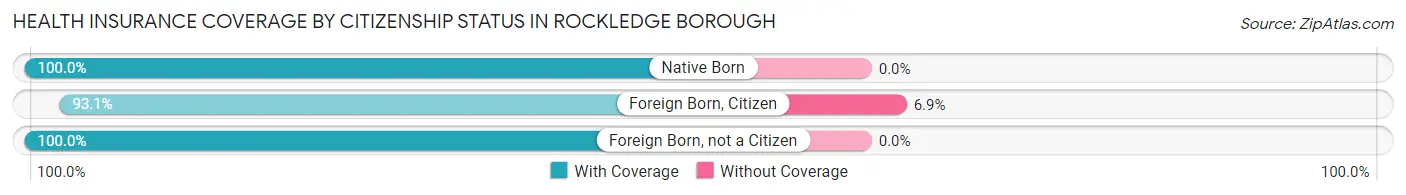
| Citizenship Status | With Coverage | Without Coverage |
| Native Born | 167 (100.0%) | 0 (0.0%) |
| Foreign Born, Citizen | 326 (93.1%) | 24 (6.9%) |
| Foreign Born, not a Citizen | 171 (100.0%) | 0 (0.0%) |
Health Insurance Coverage by Household Income in Rockledge borough
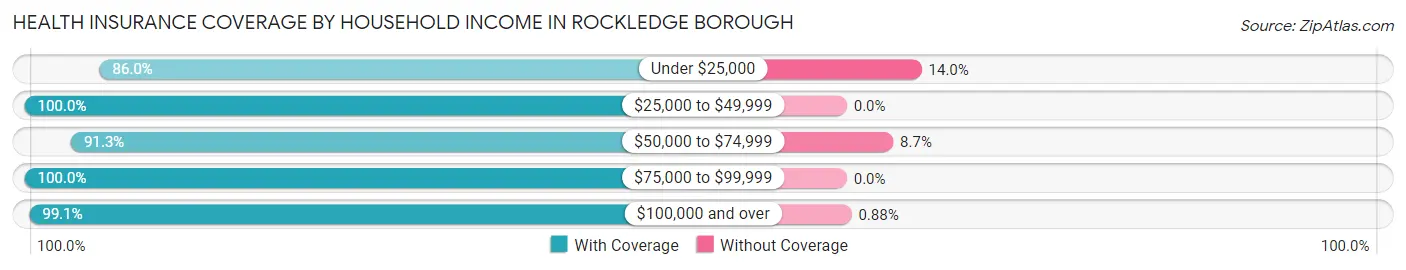
| Household Income | With Coverage | Without Coverage |
| Under $25,000 | 227 (86.0%) | 37 (14.0%) |
| $25,000 to $49,999 | 205 (100.0%) | 0 (0.0%) |
| $50,000 to $74,999 | 515 (91.3%) | 49 (8.7%) |
| $75,000 to $99,999 | 223 (100.0%) | 0 (0.0%) |
| $100,000 and over | 1,356 (99.1%) | 12 (0.9%) |
Public vs Private Health Insurance Coverage by Age in Rockledge borough
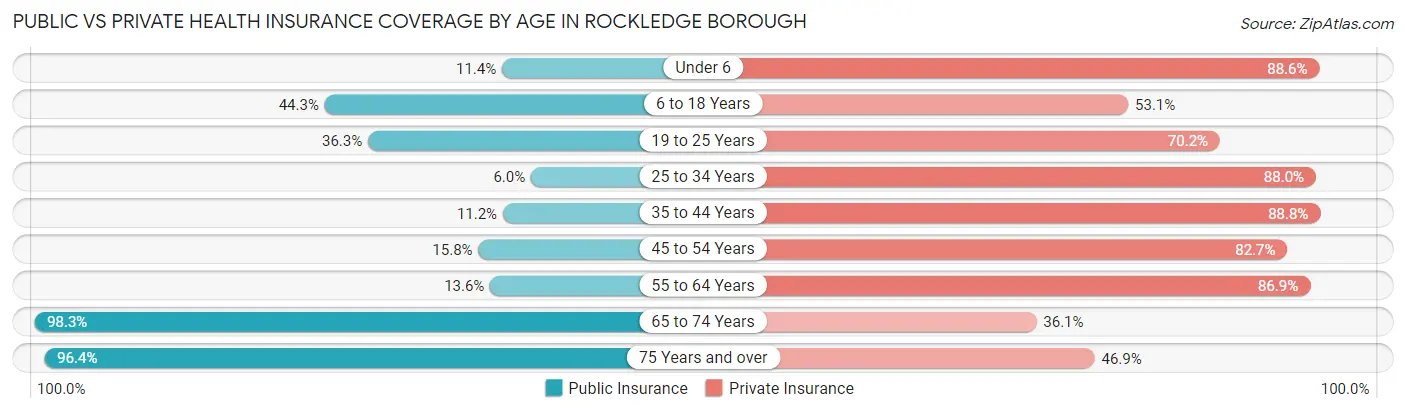
| Age Bracket | Public Insurance | Private Insurance |
| Under 6 | 19 (11.4%) | 148 (88.6%) |
| 6 to 18 Years | 155 (44.3%) | 186 (53.1%) |
| 19 to 25 Years | 62 (36.3%) | 120 (70.2%) |
| 25 to 34 Years | 27 (6.0%) | 396 (88.0%) |
| 35 to 44 Years | 38 (11.2%) | 301 (88.8%) |
| 45 to 54 Years | 41 (15.8%) | 215 (82.7%) |
| 55 to 64 Years | 55 (13.6%) | 352 (86.9%) |
| 65 to 74 Years | 283 (98.3%) | 104 (36.1%) |
| 75 Years and over | 187 (96.4%) | 91 (46.9%) |
| Total | 867 (33.0%) | 1,913 (72.9%) |
Disability Status by Sex by Age in Rockledge borough
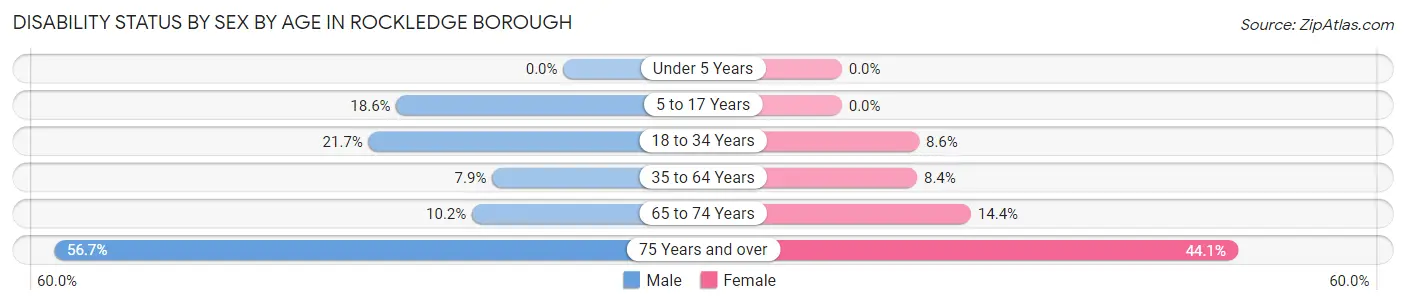
| Age Bracket | Male | Female |
| Under 5 Years | 0 (0.0%) | 0 (0.0%) |
| 5 to 17 Years | 37 (18.6%) | 0 (0.0%) |
| 18 to 34 Years | 67 (21.7%) | 30 (8.6%) |
| 35 to 64 Years | 37 (7.9%) | 45 (8.4%) |
| 65 to 74 Years | 13 (10.2%) | 23 (14.4%) |
| 75 Years and over | 38 (56.7%) | 56 (44.1%) |
Disability Class by Sex by Age in Rockledge borough
Disability Class: Hearing Difficulty
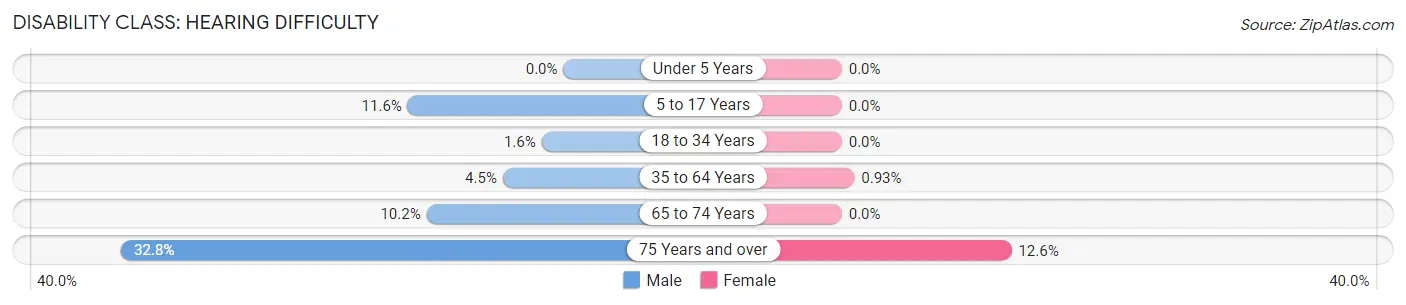
| Age Bracket | Male | Female |
| Under 5 Years | 0 (0.0%) | 0 (0.0%) |
| 5 to 17 Years | 23 (11.6%) | 0 (0.0%) |
| 18 to 34 Years | 5 (1.6%) | 0 (0.0%) |
| 35 to 64 Years | 21 (4.5%) | 5 (0.9%) |
| 65 to 74 Years | 13 (10.2%) | 0 (0.0%) |
| 75 Years and over | 22 (32.8%) | 16 (12.6%) |
Disability Class: Vision Difficulty
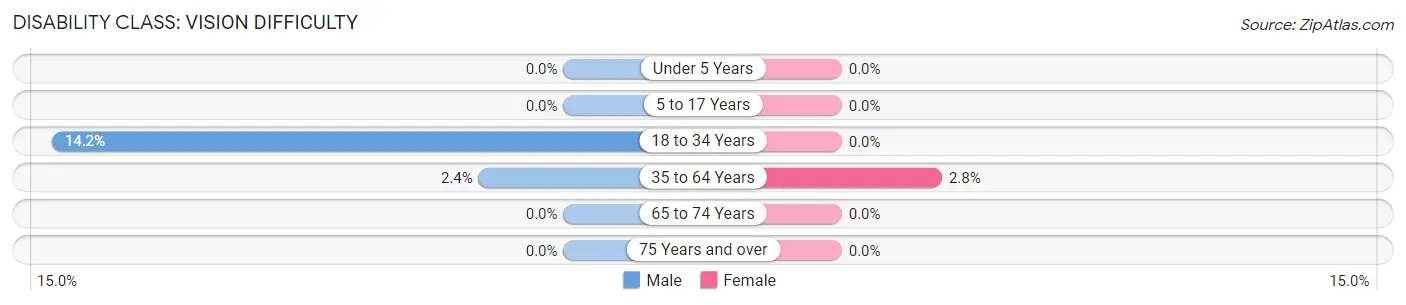
| Age Bracket | Male | Female |
| Under 5 Years | 0 (0.0%) | 0 (0.0%) |
| 5 to 17 Years | 0 (0.0%) | 0 (0.0%) |
| 18 to 34 Years | 44 (14.2%) | 0 (0.0%) |
| 35 to 64 Years | 11 (2.4%) | 15 (2.8%) |
| 65 to 74 Years | 0 (0.0%) | 0 (0.0%) |
| 75 Years and over | 0 (0.0%) | 0 (0.0%) |
Disability Class: Cognitive Difficulty
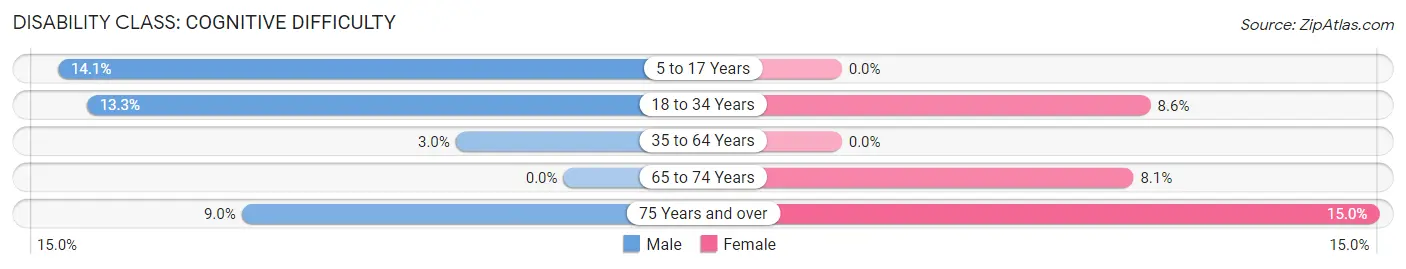
| Age Bracket | Male | Female |
| 5 to 17 Years | 28 (14.1%) | 0 (0.0%) |
| 18 to 34 Years | 41 (13.3%) | 30 (8.6%) |
| 35 to 64 Years | 14 (3.0%) | 0 (0.0%) |
| 65 to 74 Years | 0 (0.0%) | 13 (8.1%) |
| 75 Years and over | 6 (9.0%) | 19 (15.0%) |
Disability Class: Ambulatory Difficulty
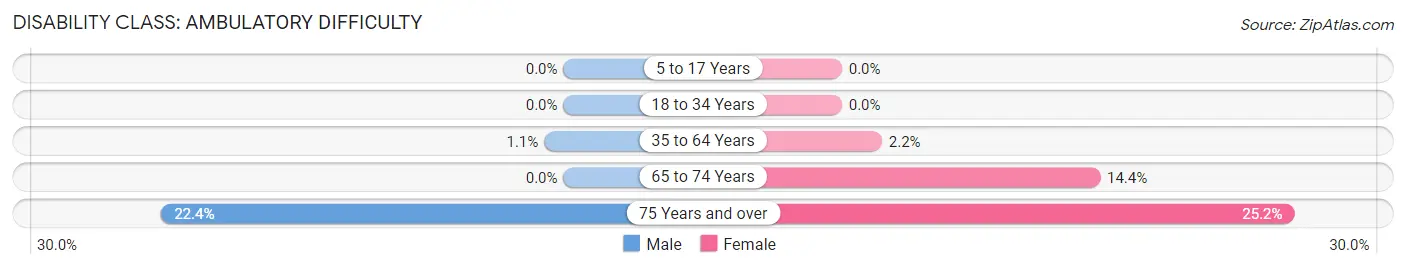
| Age Bracket | Male | Female |
| 5 to 17 Years | 0 (0.0%) | 0 (0.0%) |
| 18 to 34 Years | 0 (0.0%) | 0 (0.0%) |
| 35 to 64 Years | 5 (1.1%) | 12 (2.2%) |
| 65 to 74 Years | 0 (0.0%) | 23 (14.4%) |
| 75 Years and over | 15 (22.4%) | 32 (25.2%) |
Disability Class: Self-Care Difficulty
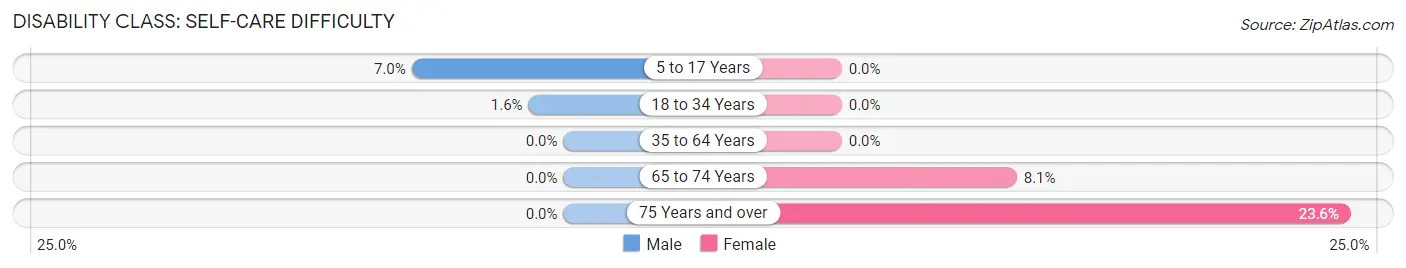
| Age Bracket | Male | Female |
| 5 to 17 Years | 14 (7.0%) | 0 (0.0%) |
| 18 to 34 Years | 5 (1.6%) | 0 (0.0%) |
| 35 to 64 Years | 0 (0.0%) | 0 (0.0%) |
| 65 to 74 Years | 0 (0.0%) | 13 (8.1%) |
| 75 Years and over | 0 (0.0%) | 30 (23.6%) |
Technology Access in Rockledge borough
Computing Device Access in Rockledge borough
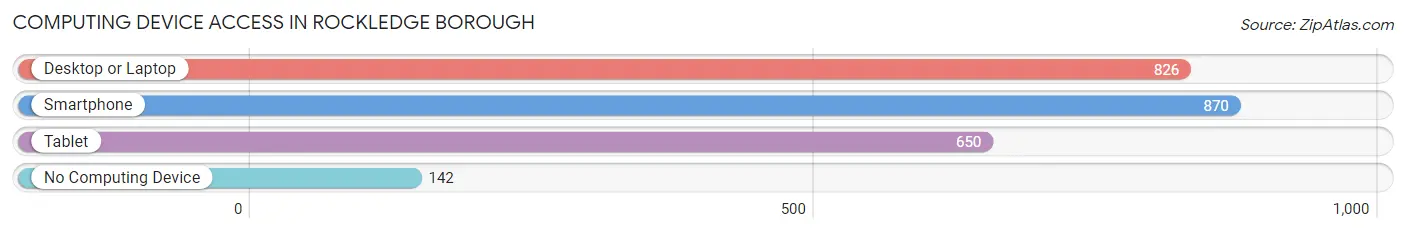
| Device Type | # Households | % Households |
| Desktop or Laptop | 826 | 76.8% |
| Smartphone | 870 | 80.9% |
| Tablet | 650 | 60.4% |
| No Computing Device | 142 | 13.2% |
| Total | 1,076 | 100.0% |
Internet Access in Rockledge borough
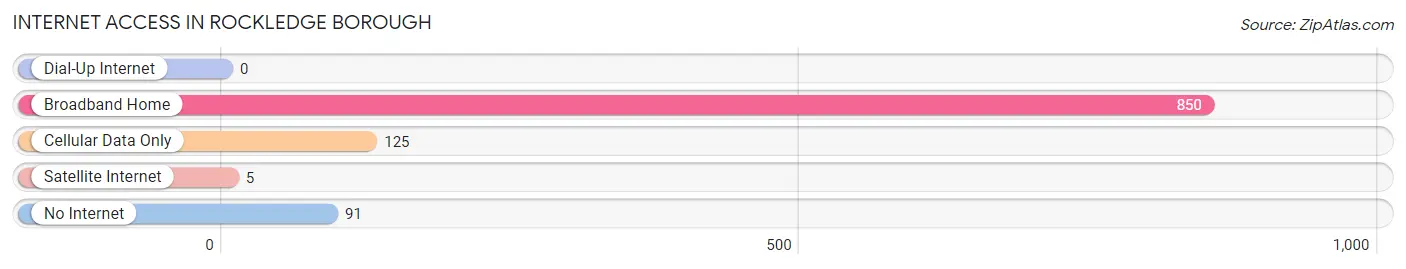
| Internet Type | # Households | % Households |
| Dial-Up Internet | 0 | 0.0% |
| Broadband Home | 850 | 79.0% |
| Cellular Data Only | 125 | 11.6% |
| Satellite Internet | 5 | 0.5% |
| No Internet | 91 | 8.5% |
| Total | 1,076 | 100.0% |
Rockledge borough Summary
Rockledge Borough is a small borough located in Montgomery County, Pennsylvania. It is situated in the southeastern corner of the county, just north of Philadelphia. The borough was incorporated in 1887 and has a population of approximately 2,500 people.
History
Rockledge Borough was originally part of the larger township of Lower Providence. The area was first settled in the late 1700s by a group of Quakers from England. The Quakers named the area Rockledge, after the rocky ledge that ran along the banks of the Perkiomen Creek. The area was primarily agricultural, with the main crops being wheat, corn, and oats.
In 1887, the residents of Rockledge petitioned the court to incorporate the area as a borough. The petition was granted and Rockledge was officially incorporated as a borough.
Geography
Rockledge Borough is located in southeastern Montgomery County, Pennsylvania. It is situated just north of Philadelphia and is bordered by Lower Providence Township to the north, Upper Providence Township to the east, and Upper Merion Township to the south. The borough is approximately 2.5 square miles in size and is situated on the banks of the Perkiomen Creek.
The terrain of Rockledge Borough is mostly flat, with some rolling hills in the northern part of the borough. The borough is home to several parks, including Rockledge Park, which features a playground, basketball court, and picnic area.
Economy
The economy of Rockledge Borough is primarily based on small businesses and services. The borough is home to several small businesses, including restaurants, retail stores, and professional services. The borough also has a few industrial businesses, including a printing company and a metal fabrication shop.
The borough is also home to several educational institutions, including a public elementary school, a private middle school, and a private high school.
Demographics
As of the 2010 census, the population of Rockledge Borough was 2,521. The racial makeup of the borough was 94.3% White, 2.2% African American, 0.3% Native American, 0.9% Asian, 0.1% Pacific Islander, and 1.2% from other races. Hispanic or Latino of any race were 2.2% of the population.
The median household income in Rockledge Borough was $63,958, and the median family income was $76,944. The per capita income was $30,945. About 4.3% of families and 5.7% of the population were below the poverty line, including 8.2% of those under age 18 and 4.2% of those age 65 or over.
Common Questions
What is Per Capita Income in Rockledge borough?
Per Capita income in Rockledge borough is $44,609.
What is the Median Family Income in Rockledge borough?
Median Family Income in Rockledge borough is $107,500.
What is the Median Household income in Rockledge borough?
Median Household Income in Rockledge borough is $78,333.
What is Income or Wage Gap in Rockledge borough?
Income or Wage Gap in Rockledge borough is 2.0%.
Women in Rockledge borough earn 98.0 cents for every dollar earned by a man.
What is Inequality or Gini Index in Rockledge borough?
Inequality or Gini Index in Rockledge borough is 0.45.
What is the Total Population of Rockledge borough?
Total Population of Rockledge borough is 2,624.
What is the Total Male Population of Rockledge borough?
Total Male Population of Rockledge borough is 1,296.
What is the Total Female Population of Rockledge borough?
Total Female Population of Rockledge borough is 1,328.
What is the Ratio of Males per 100 Females in Rockledge borough?
There are 97.59 Males per 100 Females in Rockledge borough.
What is the Ratio of Females per 100 Males in Rockledge borough?
There are 102.47 Females per 100 Males in Rockledge borough.
What is the Median Population Age in Rockledge borough?
Median Population Age in Rockledge borough is 39.2 Years.
What is the Average Family Size in Rockledge borough
Average Family Size in Rockledge borough is 3.0 People.
What is the Average Household Size in Rockledge borough
Average Household Size in Rockledge borough is 2.4 People.
How Large is the Labor Force in Rockledge borough?
There are 1,507 People in the Labor Forcein in Rockledge borough.
What is the Percentage of People in the Labor Force in Rockledge borough?
68.1% of People are in the Labor Force in Rockledge borough.
What is the Unemployment Rate in Rockledge borough?
Unemployment Rate in Rockledge borough is 8.6%.