Fellsburg, PA Map & Demographics
Fellsburg Map
Fellsburg Overview
$43,911
PER CAPITA INCOME
$103,259
AVG FAMILY INCOME
$86,840
AVG HOUSEHOLD INCOME
0.34
INEQUALITY / GINI INDEX
1,139
TOTAL POPULATION
586
MALE POPULATION
553
FEMALE POPULATION
105.97
MALES / 100 FEMALES
94.37
FEMALES / 100 MALES
46.5
MEDIAN AGE
3.0
AVG FAMILY SIZE
2.4
AVG HOUSEHOLD SIZE
610
LABOR FORCE [ PEOPLE ]
59.9%
PERCENT IN LABOR FORCE
4.4%
UNEMPLOYMENT RATE
Income in Fellsburg
Income Overview in Fellsburg
Per Capita Income in Fellsburg is $43,911, while median incomes of families and households are $103,259 and $86,840 respectively.
| Characteristic | Number | Measure |
| Per Capita Income | 1,139 | $43,911 |
| Median Family Income | 311 | $103,259 |
| Mean Family Income | 311 | $121,041 |
| Median Household Income | 475 | $86,840 |
| Mean Household Income | 475 | $104,441 |
| Income Deficit | 311 | $0 |
| Wage / Income Gap (%) | 1,139 | 0.00% |
| Wage / Income Gap ($) | 1,139 | 100.00¢ per $1 |
| Gini / Inequality Index | 1,139 | 0.34 |
Earnings by Sex in Fellsburg
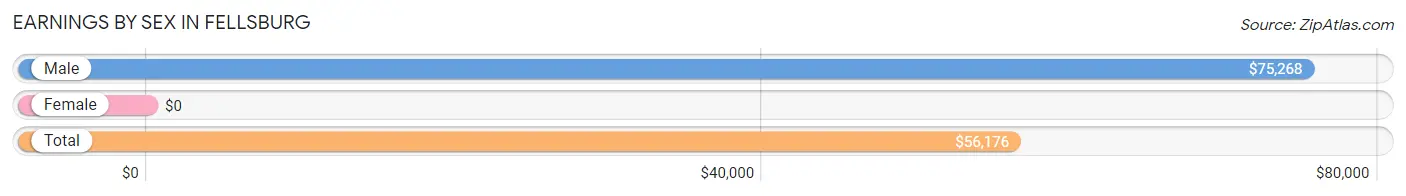
| Sex | Number | Average Earnings |
| Male | 294 (49.0%) | $75,268 |
| Female | 306 (51.0%) | $0 |
| Total | 600 (100.0%) | $56,176 |
Earnings by Sex by Income Bracket in Fellsburg
The most common earnings brackets in Fellsburg are $75,000 to $99,999 for men (118 | 40.1%) and $100,000+ for women (41 | 13.4%).
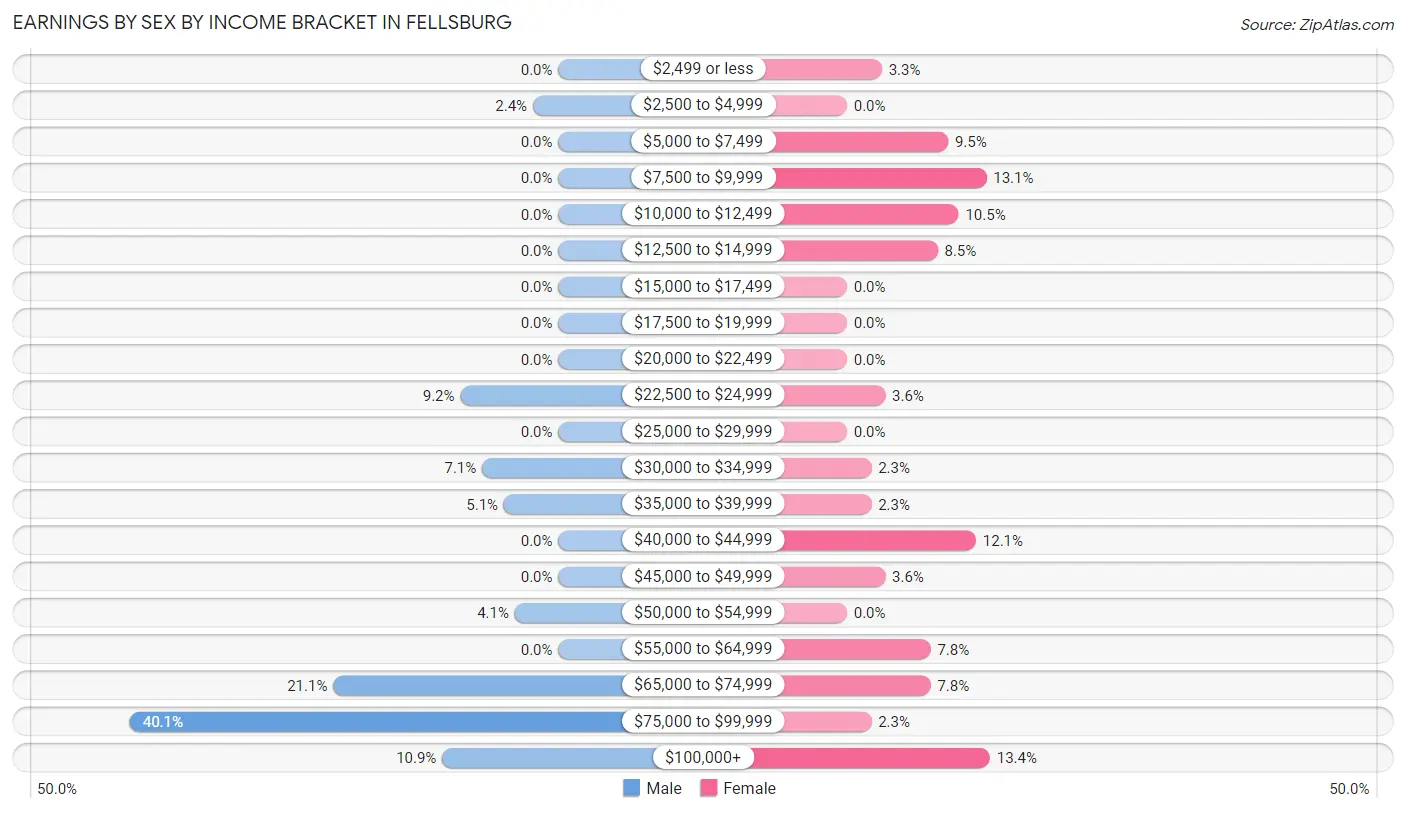
| Income | Male | Female |
| $2,499 or less | 0 (0.0%) | 10 (3.3%) |
| $2,500 to $4,999 | 7 (2.4%) | 0 (0.0%) |
| $5,000 to $7,499 | 0 (0.0%) | 29 (9.5%) |
| $7,500 to $9,999 | 0 (0.0%) | 40 (13.1%) |
| $10,000 to $12,499 | 0 (0.0%) | 32 (10.5%) |
| $12,500 to $14,999 | 0 (0.0%) | 26 (8.5%) |
| $15,000 to $17,499 | 0 (0.0%) | 0 (0.0%) |
| $17,500 to $19,999 | 0 (0.0%) | 0 (0.0%) |
| $20,000 to $22,499 | 0 (0.0%) | 0 (0.0%) |
| $22,500 to $24,999 | 27 (9.2%) | 11 (3.6%) |
| $25,000 to $29,999 | 0 (0.0%) | 0 (0.0%) |
| $30,000 to $34,999 | 21 (7.1%) | 7 (2.3%) |
| $35,000 to $39,999 | 15 (5.1%) | 7 (2.3%) |
| $40,000 to $44,999 | 0 (0.0%) | 37 (12.1%) |
| $45,000 to $49,999 | 0 (0.0%) | 11 (3.6%) |
| $50,000 to $54,999 | 12 (4.1%) | 0 (0.0%) |
| $55,000 to $64,999 | 0 (0.0%) | 24 (7.8%) |
| $65,000 to $74,999 | 62 (21.1%) | 24 (7.8%) |
| $75,000 to $99,999 | 118 (40.1%) | 7 (2.3%) |
| $100,000+ | 32 (10.9%) | 41 (13.4%) |
| Total | 294 (100.0%) | 306 (100.0%) |
Earnings by Sex by Educational Attainment in Fellsburg
Average earnings in Fellsburg are $76,473 for men and $41,554 for women, a difference of 45.7%. Men with an educational attainment of high school diploma enjoy the highest average annual earnings of $80,197, while those with college or associate's degree education earn the least with $73,281. Women with an educational attainment of college or associate's degree earn the most with the average annual earnings of $47,841, while those with college or associate's degree education have the smallest earnings of $47,841.
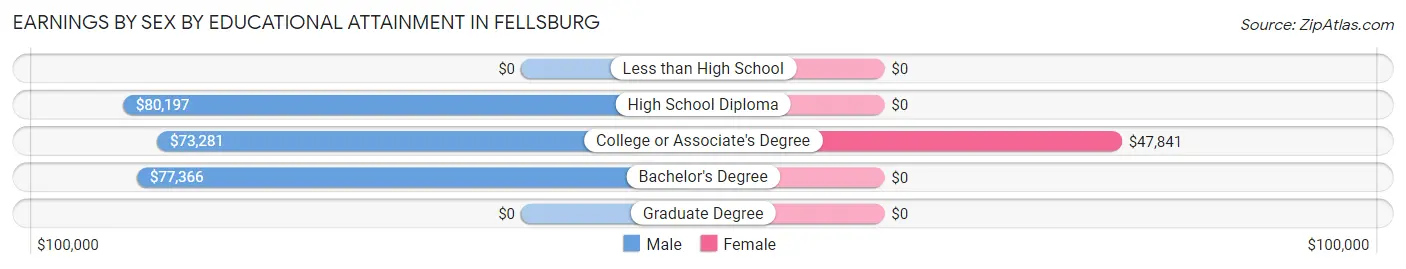
| Educational Attainment | Male Income | Female Income |
| Less than High School | - | - |
| High School Diploma | $80,197 | $0 |
| College or Associate's Degree | $73,281 | $47,841 |
| Bachelor's Degree | $77,366 | $0 |
| Graduate Degree | - | - |
| Total | $76,473 | $41,554 |
Family Income in Fellsburg
Family Income Brackets in Fellsburg
According to the Fellsburg family income data, there are 118 families falling into the $100,000 to $149,999 income range, which is the most common income bracket and makes up 37.9% of all families.
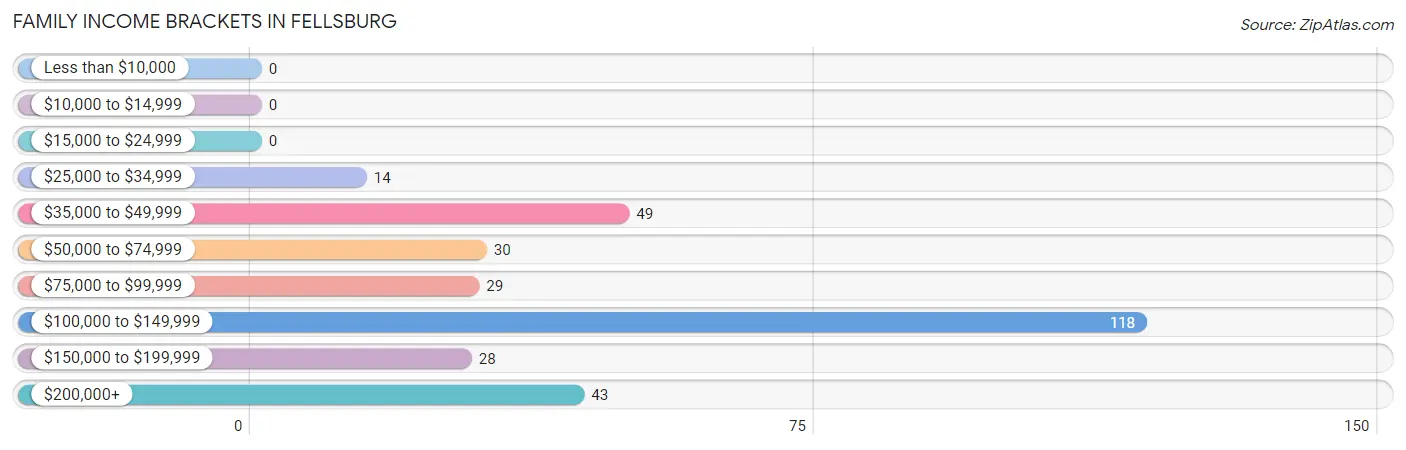
| Income Bracket | # Families | % Families |
| Less than $10,000 | 0 | 0.0% |
| $10,000 to $14,999 | 0 | 0.0% |
| $15,000 to $24,999 | 0 | 0.0% |
| $25,000 to $34,999 | 14 | 4.5% |
| $35,000 to $49,999 | 49 | 15.8% |
| $50,000 to $74,999 | 30 | 9.6% |
| $75,000 to $99,999 | 29 | 9.3% |
| $100,000 to $149,999 | 118 | 37.9% |
| $150,000 to $199,999 | 28 | 9.0% |
| $200,000+ | 43 | 13.8% |
Family Income by Famaliy Size in Fellsburg
5-person families (48 | 15.4%) account for the highest median family income in Fellsburg with $123,707 per family, while 2-person families (153 | 49.2%) have the highest median income of $30,734 per family member.
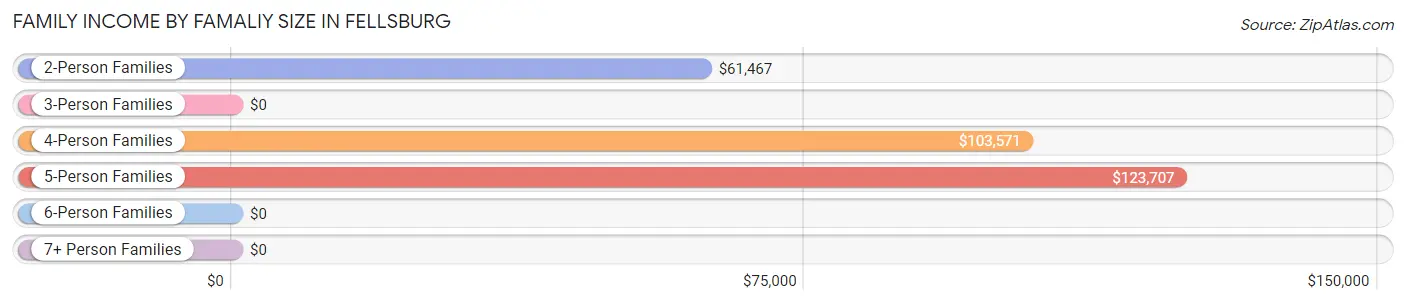
| Income Bracket | # Families | Median Income |
| 2-Person Families | 153 (49.2%) | $61,467 |
| 3-Person Families | 56 (18.0%) | $0 |
| 4-Person Families | 54 (17.4%) | $103,571 |
| 5-Person Families | 48 (15.4%) | $123,707 |
| 6-Person Families | 0 (0.0%) | $0 |
| 7+ Person Families | 0 (0.0%) | $0 |
| Total | 311 (100.0%) | $103,259 |
Family Income by Number of Earners in Fellsburg
The median family income in Fellsburg is $103,259, with families comprising 2 earners (100) having the highest median family income of $160,000, while families with no earners (84) have the lowest median family income of $39,167, accounting for 32.2% and 27.0% of families, respectively.
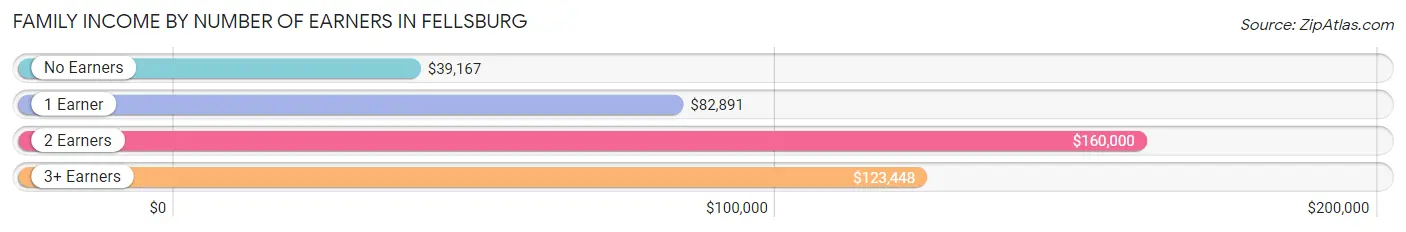
| Number of Earners | # Families | Median Income |
| No Earners | 84 (27.0%) | $39,167 |
| 1 Earner | 49 (15.8%) | $82,891 |
| 2 Earners | 100 (32.2%) | $160,000 |
| 3+ Earners | 78 (25.1%) | $123,448 |
| Total | 311 (100.0%) | $103,259 |
Household Income in Fellsburg
Household Income Brackets in Fellsburg
With 137 households falling in the category, the $100,000 to $149,999 income range is the most frequent in Fellsburg, accounting for 28.8% of all households.
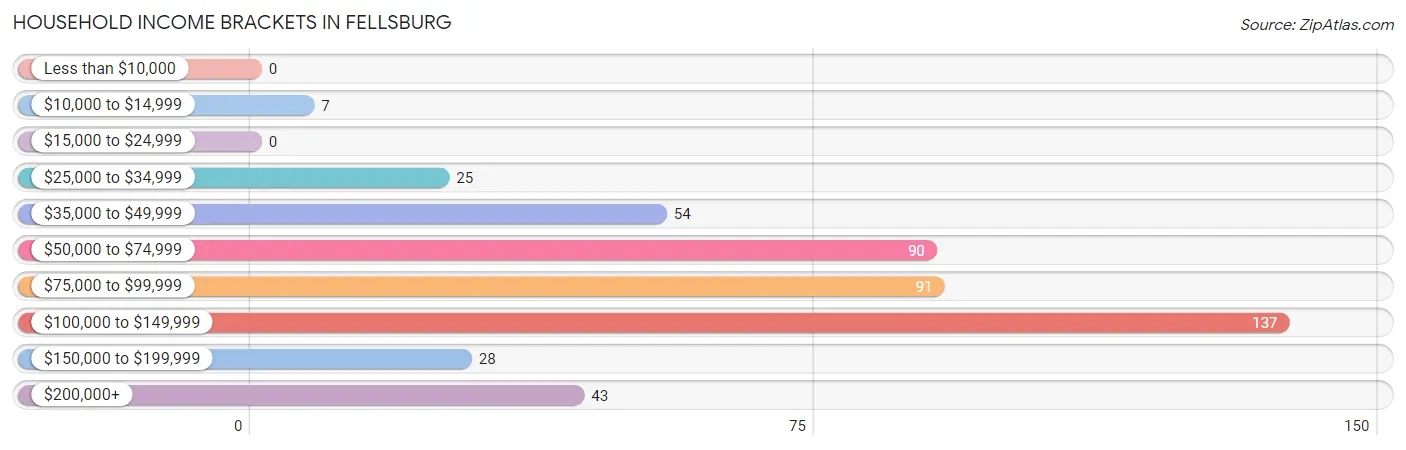
| Income Bracket | # Households | % Households |
| Less than $10,000 | 0 | 0.0% |
| $10,000 to $14,999 | 7 | 1.5% |
| $15,000 to $24,999 | 0 | 0.0% |
| $25,000 to $34,999 | 25 | 5.3% |
| $35,000 to $49,999 | 54 | 11.4% |
| $50,000 to $74,999 | 90 | 18.9% |
| $75,000 to $99,999 | 91 | 19.2% |
| $100,000 to $149,999 | 137 | 28.8% |
| $150,000 to $199,999 | 28 | 5.9% |
| $200,000+ | 43 | 9.1% |
Household Income by Householder Age in Fellsburg
The median household income in Fellsburg is $86,840, with the highest median household income of $172,000 found in the 25 to 44 years age bracket for the primary householder. A total of 94 households (19.8%) fall into this category.
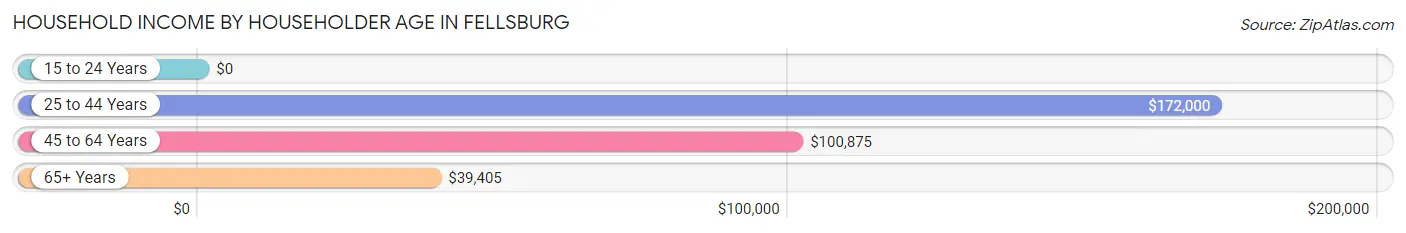
| Income Bracket | # Households | Median Income |
| 15 to 24 Years | 0 (0.0%) | $0 |
| 25 to 44 Years | 94 (19.8%) | $172,000 |
| 45 to 64 Years | 253 (53.3%) | $100,875 |
| 65+ Years | 128 (27.0%) | $39,405 |
| Total | 475 (100.0%) | $86,840 |
Poverty in Fellsburg
Income Below Poverty by Sex and Age in Fellsburg
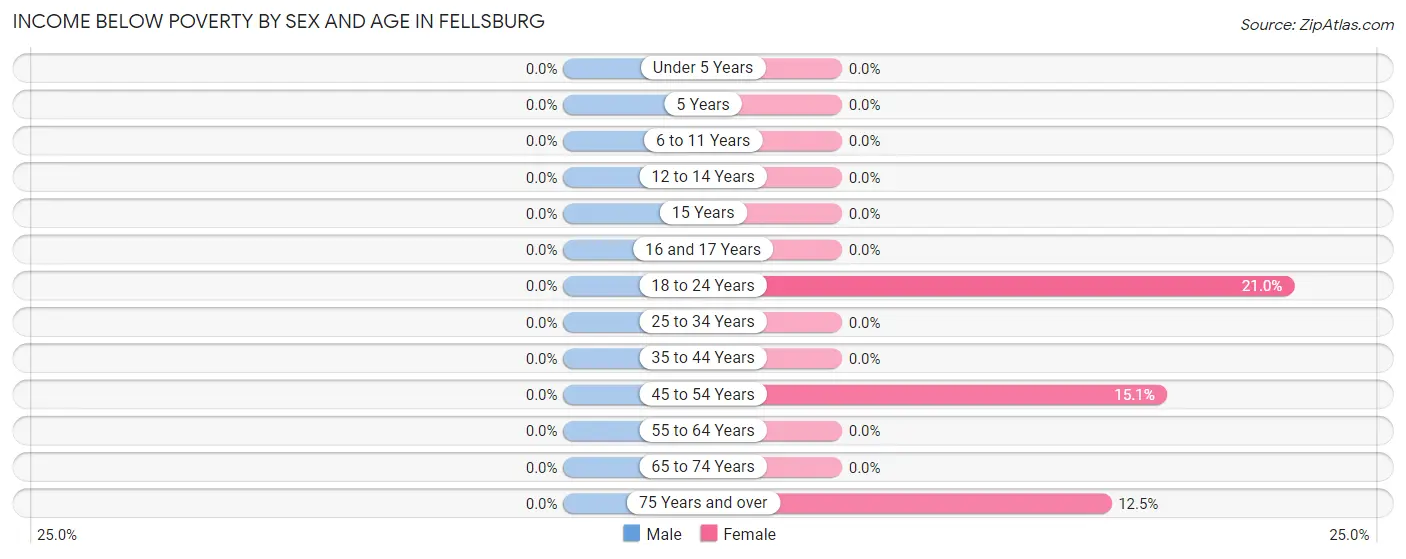
| Age Bracket | Male | Female |
| Under 5 Years | 0 (0.0%) | 0 (0.0%) |
| 5 Years | 0 (0.0%) | 0 (0.0%) |
| 6 to 11 Years | 0 (0.0%) | 0 (0.0%) |
| 12 to 14 Years | 0 (0.0%) | 0 (0.0%) |
| 15 Years | 0 (0.0%) | 0 (0.0%) |
| 16 and 17 Years | 0 (0.0%) | 0 (0.0%) |
| 18 to 24 Years | 0 (0.0%) | 17 (21.0%) |
| 25 to 34 Years | 0 (0.0%) | 0 (0.0%) |
| 35 to 44 Years | 0 (0.0%) | 0 (0.0%) |
| 45 to 54 Years | 0 (0.0%) | 11 (15.1%) |
| 55 to 64 Years | 0 (0.0%) | 0 (0.0%) |
| 65 to 74 Years | 0 (0.0%) | 0 (0.0%) |
| 75 Years and over | 0 (0.0%) | 1 (12.5%) |
| Total | 0 (0.0%) | 29 (5.2%) |
Income Above Poverty by Sex and Age in Fellsburg
According to the poverty statistics in Fellsburg, males aged under 5 years and females aged under 5 years are the age groups that are most secure financially, with 100.0% of males and 100.0% of females in these age groups living above the poverty line.
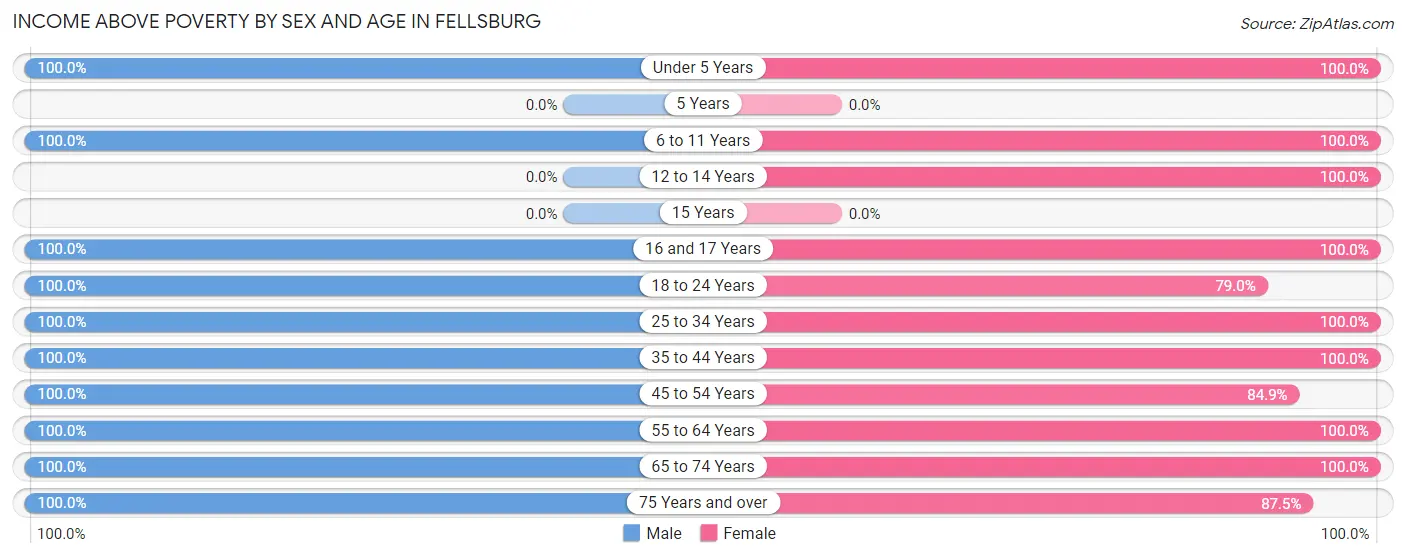
| Age Bracket | Male | Female |
| Under 5 Years | 21 (100.0%) | 22 (100.0%) |
| 5 Years | 0 (0.0%) | 0 (0.0%) |
| 6 to 11 Years | 37 (100.0%) | 30 (100.0%) |
| 12 to 14 Years | 0 (0.0%) | 11 (100.0%) |
| 15 Years | 0 (0.0%) | 0 (0.0%) |
| 16 and 17 Years | 58 (100.0%) | 16 (100.0%) |
| 18 to 24 Years | 38 (100.0%) | 64 (79.0%) |
| 25 to 34 Years | 16 (100.0%) | 63 (100.0%) |
| 35 to 44 Years | 82 (100.0%) | 69 (100.0%) |
| 45 to 54 Years | 78 (100.0%) | 62 (84.9%) |
| 55 to 64 Years | 136 (100.0%) | 77 (100.0%) |
| 65 to 74 Years | 68 (100.0%) | 103 (100.0%) |
| 75 Years and over | 52 (100.0%) | 7 (87.5%) |
| Total | 586 (100.0%) | 524 (94.8%) |
Income Below Poverty Among Married-Couple Families in Fellsburg
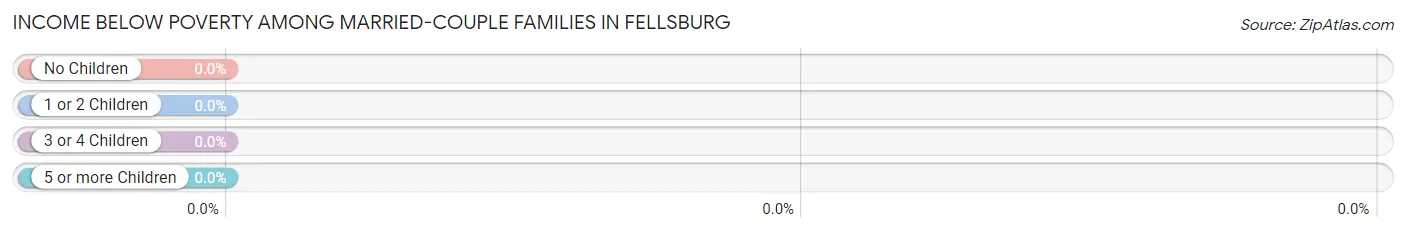
| Children | Above Poverty | Below Poverty |
| No Children | 202 (100.0%) | 0 (0.0%) |
| 1 or 2 Children | 79 (100.0%) | 0 (0.0%) |
| 3 or 4 Children | 19 (100.0%) | 0 (0.0%) |
| 5 or more Children | 0 (0.0%) | 0 (0.0%) |
| Total | 300 (100.0%) | 0 (0.0%) |
Income Below Poverty Among Single-Parent Households in Fellsburg
| Children | Single Father | Single Mother |
| No Children | 0 (0.0%) | 0 (0.0%) |
| 1 or 2 Children | 0 (0.0%) | 0 (0.0%) |
| 3 or 4 Children | 0 (0.0%) | 0 (0.0%) |
| 5 or more Children | 0 (0.0%) | 0 (0.0%) |
| Total | 0 (0.0%) | 0 (0.0%) |
Income Below Poverty Among Married-Couple vs Single-Parent Households in Fellsburg
| Children | Married-Couple Families | Single-Parent Households |
| No Children | 0 (0.0%) | 0 (0.0%) |
| 1 or 2 Children | 0 (0.0%) | 0 (0.0%) |
| 3 or 4 Children | 0 (0.0%) | 0 (0.0%) |
| 5 or more Children | 0 (0.0%) | 0 (0.0%) |
| Total | 0 (0.0%) | 0 (0.0%) |
Race in Fellsburg
The most populous races in Fellsburg are White / Caucasian (1,089 | 95.6%), and Some other Race (50 | 4.4%).
| Race | # Population | % Population |
| Asian | 0 | 0.0% |
| Black / African American | 0 | 0.0% |
| Hawaiian / Pacific | 0 | 0.0% |
| Hispanic or Latino | 0 | 0.0% |
| Native / Alaskan | 0 | 0.0% |
| White / Caucasian | 1,089 | 95.6% |
| Two or more Races | 0 | 0.0% |
| Some other Race | 50 | 4.4% |
| Total | 1,139 | 100.0% |
Ancestry in Fellsburg
The most populous ancestries reported in Fellsburg are Italian (297 | 26.1%), Slovak (221 | 19.4%), Irish (220 | 19.3%), German (173 | 15.2%), and English (123 | 10.8%), together accounting for 90.8% of all Fellsburg residents.
| Ancestry | # Population | % Population |
| Belgian | 11 | 1.0% |
| British | 40 | 3.5% |
| Croatian | 31 | 2.7% |
| Eastern European | 14 | 1.2% |
| English | 123 | 10.8% |
| European | 17 | 1.5% |
| Finnish | 31 | 2.7% |
| German | 173 | 15.2% |
| Hungarian | 40 | 3.5% |
| Irish | 220 | 19.3% |
| Italian | 297 | 26.1% |
| Pennsylvania German | 11 | 1.0% |
| Polish | 65 | 5.7% |
| Russian | 117 | 10.3% |
| Scotch-Irish | 25 | 2.2% |
| Scottish | 54 | 4.7% |
| Serbian | 14 | 1.2% |
| Slovak | 221 | 19.4% |
| Ukrainian | 87 | 7.6% |
| Welsh | 34 | 3.0% | View All 20 Rows |
Immigrants in Fellsburg

| Immigration Origin | # Population | % Population | View All 0 Rows |
Sex and Age in Fellsburg
Sex and Age in Fellsburg
The most populous age groups in Fellsburg are 60 to 64 Years (72 | 12.3%) for men and 65 to 69 Years (69 | 12.5%) for women.
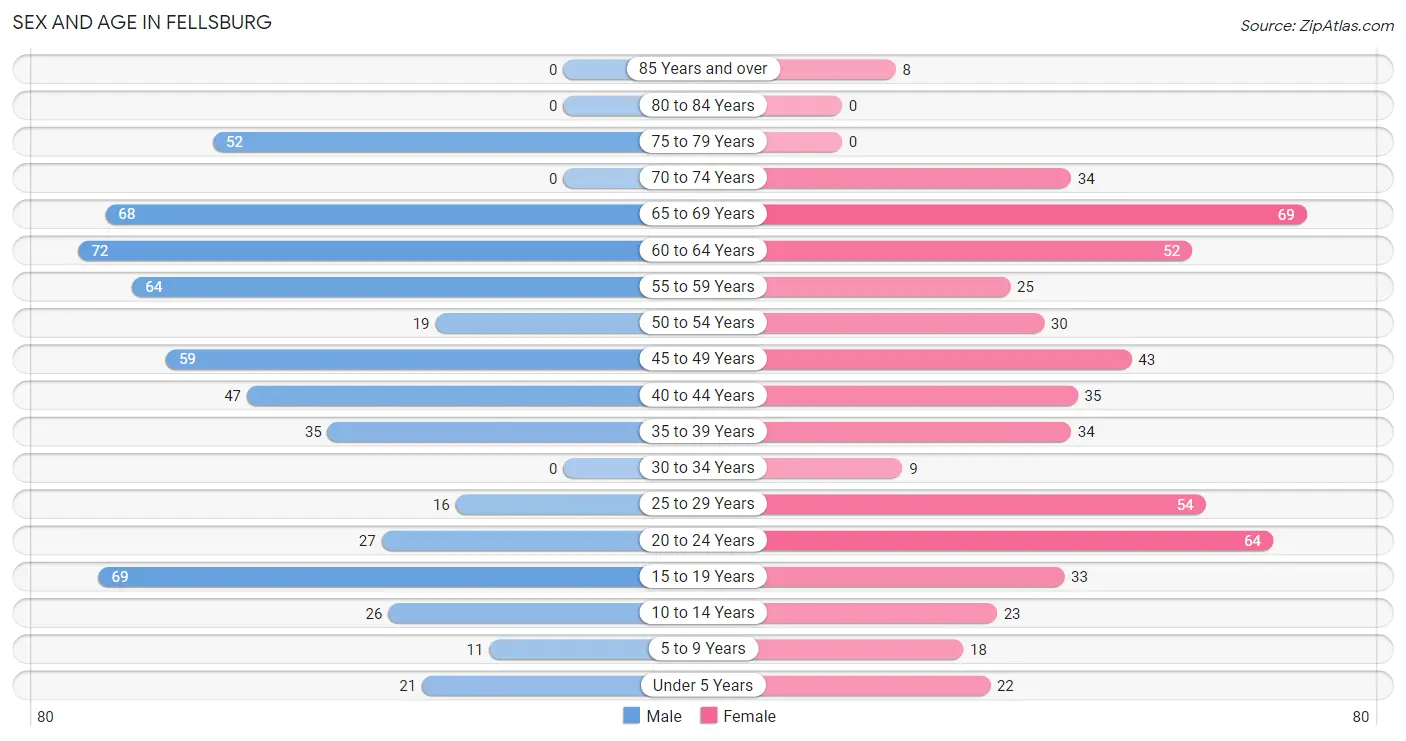
| Age Bracket | Male | Female |
| Under 5 Years | 21 (3.6%) | 22 (4.0%) |
| 5 to 9 Years | 11 (1.9%) | 18 (3.3%) |
| 10 to 14 Years | 26 (4.4%) | 23 (4.2%) |
| 15 to 19 Years | 69 (11.8%) | 33 (6.0%) |
| 20 to 24 Years | 27 (4.6%) | 64 (11.6%) |
| 25 to 29 Years | 16 (2.7%) | 54 (9.8%) |
| 30 to 34 Years | 0 (0.0%) | 9 (1.6%) |
| 35 to 39 Years | 35 (6.0%) | 34 (6.1%) |
| 40 to 44 Years | 47 (8.0%) | 35 (6.3%) |
| 45 to 49 Years | 59 (10.1%) | 43 (7.8%) |
| 50 to 54 Years | 19 (3.2%) | 30 (5.4%) |
| 55 to 59 Years | 64 (10.9%) | 25 (4.5%) |
| 60 to 64 Years | 72 (12.3%) | 52 (9.4%) |
| 65 to 69 Years | 68 (11.6%) | 69 (12.5%) |
| 70 to 74 Years | 0 (0.0%) | 34 (6.1%) |
| 75 to 79 Years | 52 (8.9%) | 0 (0.0%) |
| 80 to 84 Years | 0 (0.0%) | 0 (0.0%) |
| 85 Years and over | 0 (0.0%) | 8 (1.5%) |
| Total | 586 (100.0%) | 553 (100.0%) |
Families and Households in Fellsburg
Median Family Size in Fellsburg
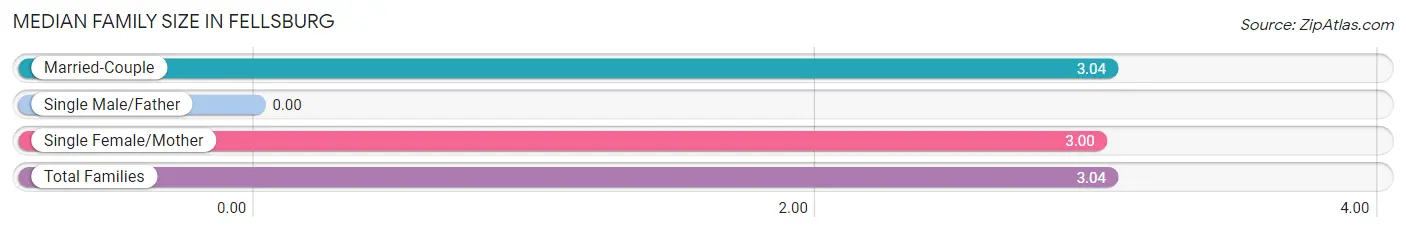
| Family Type | # Families | Family Size |
| Married-Couple | 300 (96.5%) | 3.04 |
| Single Male/Father | 0 (0.0%) | - |
| Single Female/Mother | 11 (3.5%) | 3.00 |
| Total Families | 311 (100.0%) | 3.04 |
Median Household Size in Fellsburg
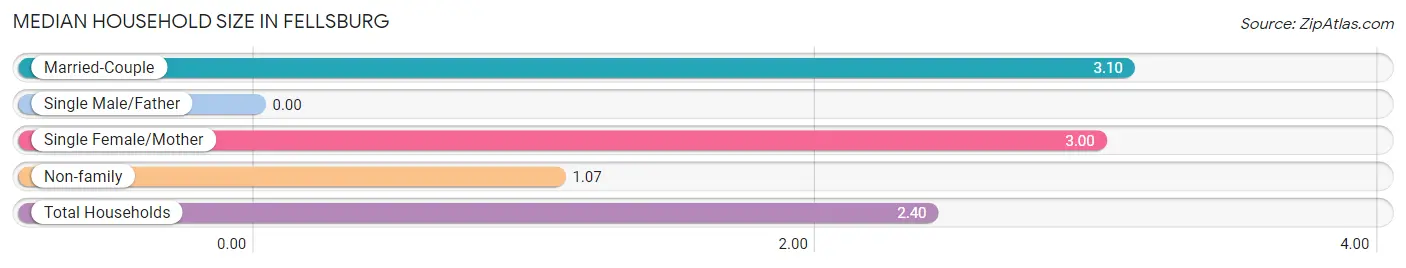
| Household Type | # Households | Household Size |
| Married-Couple | 300 (63.2%) | 3.10 |
| Single Male/Father | 0 (0.0%) | - |
| Single Female/Mother | 11 (2.3%) | 3.00 |
| Non-family | 164 (34.5%) | 1.07 |
| Total Households | 475 (100.0%) | 2.40 |
Household Size by Marriage Status in Fellsburg
Out of a total of 475 households in Fellsburg, 311 (65.5%) are family households, while 164 (34.5%) are nonfamily households. The most numerous type of family households are 2-person households, comprising 153, and the most common type of nonfamily households are 1-person households, comprising 152.
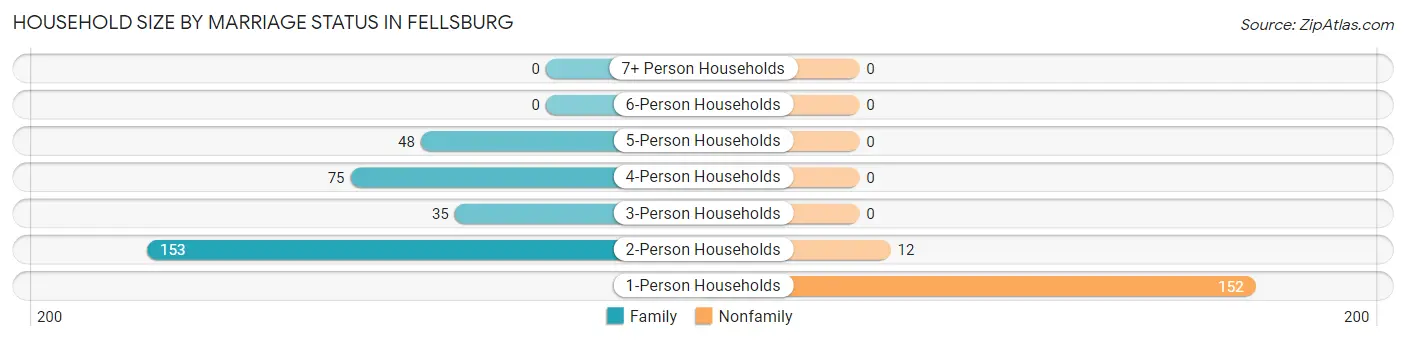
| Household Size | Family Households | Nonfamily Households |
| 1-Person Households | - | 152 (32.0%) |
| 2-Person Households | 153 (32.2%) | 12 (2.5%) |
| 3-Person Households | 35 (7.4%) | 0 (0.0%) |
| 4-Person Households | 75 (15.8%) | 0 (0.0%) |
| 5-Person Households | 48 (10.1%) | 0 (0.0%) |
| 6-Person Households | 0 (0.0%) | 0 (0.0%) |
| 7+ Person Households | 0 (0.0%) | 0 (0.0%) |
| Total | 311 (65.5%) | 164 (34.5%) |
Female Fertility in Fellsburg
Fertility by Age in Fellsburg
| Age Bracket | Women with Births | Births / 1,000 Women |
| 15 to 19 years | 0 (0.0%) | 0.0 |
| 20 to 34 years | 0 (0.0%) | 0.0 |
| 35 to 50 years | 0 (0.0%) | 0.0 |
| Total | 0 (0.0%) | 0.0 |
Fertility by Age by Marriage Status in Fellsburg
| Age Bracket | Married | Unmarried |
| 15 to 19 years | 0 (0.0%) | 0 (0.0%) |
| 20 to 34 years | 0 (0.0%) | 0 (0.0%) |
| 35 to 50 years | 0 (0.0%) | 0 (0.0%) |
| Total | 0 (0.0%) | 0 (0.0%) |
Fertility by Education in Fellsburg
| Educational Attainment | Women with Births | Births / 1,000 Women |
| Less than High School | 0 (0.0%) | 0.0 |
| High School Diploma | 0 (0.0%) | 0.0 |
| College or Associate's Degree | 0 (0.0%) | 0.0 |
| Bachelor's Degree | 0 (0.0%) | 0.0 |
| Graduate Degree | 0 (0.0%) | 0.0 |
| Total | 0 (0.0%) | 0.0 |
Fertility by Education by Marriage Status in Fellsburg
| Educational Attainment | Married | Unmarried |
| Less than High School | 0 (0.0%) | 0 (0.0%) |
| High School Diploma | 0 (0.0%) | 0 (0.0%) |
| College or Associate's Degree | 0 (0.0%) | 0 (0.0%) |
| Bachelor's Degree | 0 (0.0%) | 0 (0.0%) |
| Graduate Degree | 0 (0.0%) | 0 (0.0%) |
| Total | 0 (0.0%) | 0 (0.0%) |
Employment Characteristics in Fellsburg
Employment by Class of Employer in Fellsburg
Among the 583 employed individuals in Fellsburg, private company employees (350 | 60.0%), local government employees (77 | 13.2%), and not-for-profit organizations (58 | 10.0%) make up the most common classes of employment.
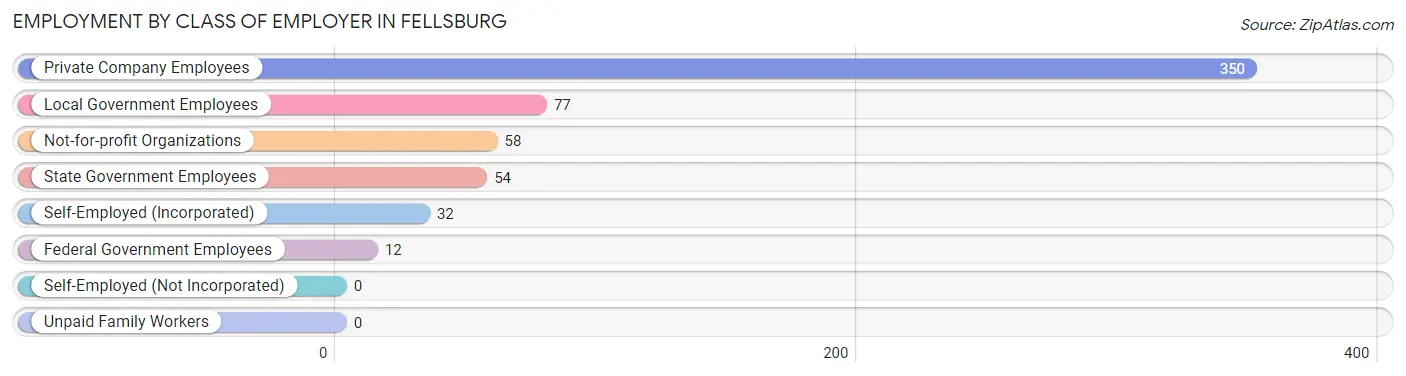
| Employer Class | # Employees | % Employees |
| Private Company Employees | 350 | 60.0% |
| Self-Employed (Incorporated) | 32 | 5.5% |
| Self-Employed (Not Incorporated) | 0 | 0.0% |
| Not-for-profit Organizations | 58 | 10.0% |
| Local Government Employees | 77 | 13.2% |
| State Government Employees | 54 | 9.3% |
| Federal Government Employees | 12 | 2.1% |
| Unpaid Family Workers | 0 | 0.0% |
| Total | 583 | 100.0% |
Employment Status by Age in Fellsburg
According to the labor force statistics for Fellsburg, out of the total population over 16 years of age (1,018), 59.9% or 610 individuals are in the labor force, with 4.4% or 27 of them unemployed. The age group with the highest labor force participation rate is 20 to 24 years, with 100.0% or 91 individuals in the labor force. Within the labor force, the 16 to 19 years age range has the highest percentage of unemployed individuals, with 100.0% or 17 of them being unemployed.
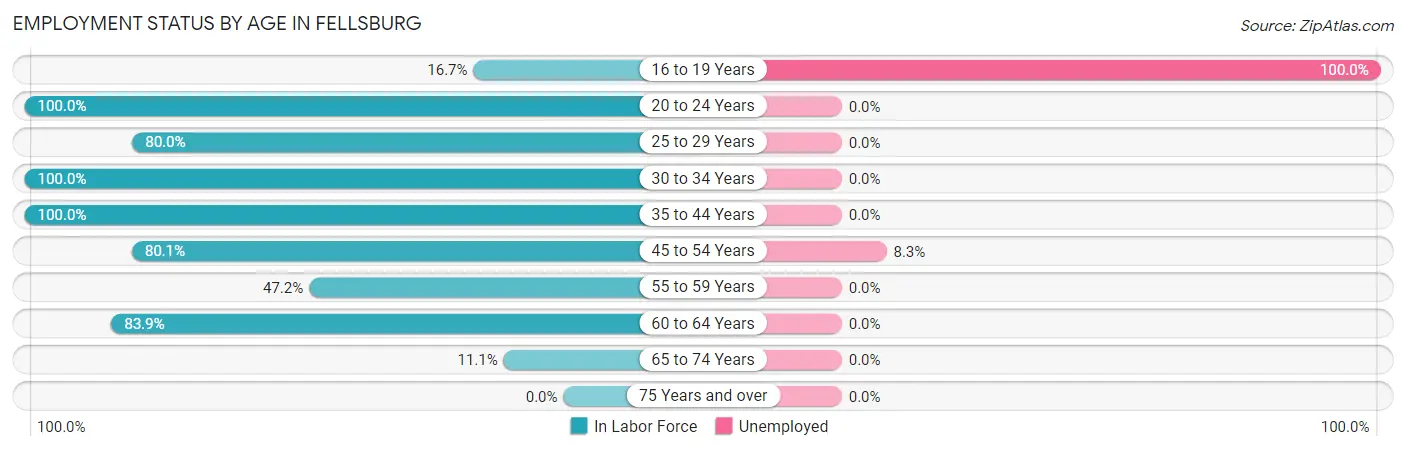
| Age Bracket | In Labor Force | Unemployed |
| 16 to 19 Years | 17 (16.7%) | 17 (100.0%) |
| 20 to 24 Years | 91 (100.0%) | 0 (0.0%) |
| 25 to 29 Years | 56 (80.0%) | 0 (0.0%) |
| 30 to 34 Years | 9 (100.0%) | 0 (0.0%) |
| 35 to 44 Years | 151 (100.0%) | 0 (0.0%) |
| 45 to 54 Years | 121 (80.1%) | 10 (8.3%) |
| 55 to 59 Years | 42 (47.2%) | 0 (0.0%) |
| 60 to 64 Years | 104 (83.9%) | 0 (0.0%) |
| 65 to 74 Years | 19 (11.1%) | 0 (0.0%) |
| 75 Years and over | 0 (0.0%) | 0 (0.0%) |
| Total | 610 (59.9%) | 27 (4.4%) |
Employment Status by Educational Attainment in Fellsburg
According to labor force statistics for Fellsburg, 81.3% of individuals (483) out of the total population between 25 and 64 years of age (594) are in the labor force, with 2.1% or 10 of them being unemployed. The group with the highest labor force participation rate are those with the educational attainment of bachelor's degree or higher, with 92.4% or 219 individuals in the labor force. Within the labor force, individuals with high school diploma education have the highest percentage of unemployment, with 11.0% or 10 of them being unemployed.
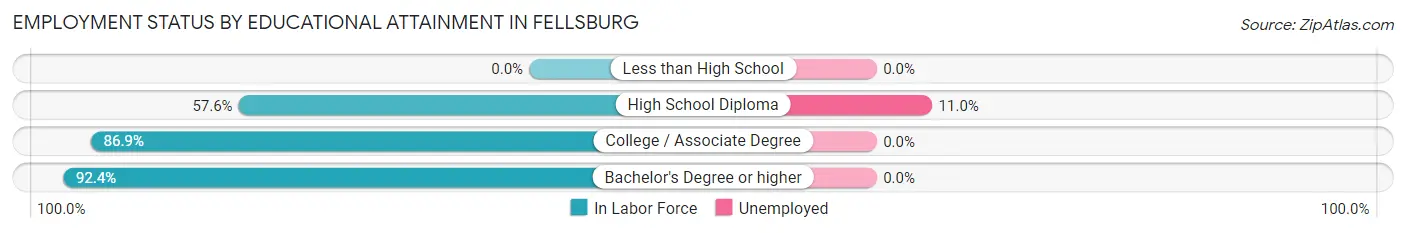
| Educational Attainment | In Labor Force | Unemployed |
| Less than High School | 0 (0.0%) | 0 (0.0%) |
| High School Diploma | 91 (57.6%) | 17 (11.0%) |
| College / Associate Degree | 173 (86.9%) | 0 (0.0%) |
| Bachelor's Degree or higher | 219 (92.4%) | 0 (0.0%) |
| Total | 483 (81.3%) | 12 (2.1%) |
Employment Occupations by Sex in Fellsburg
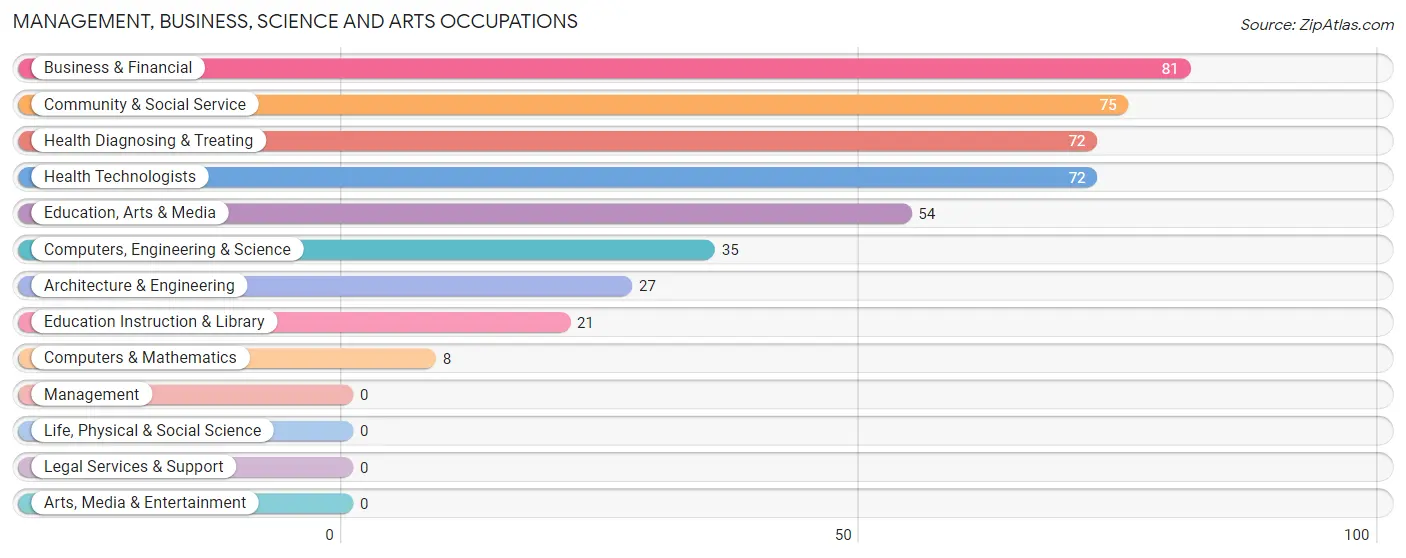
Management, Business, Science and Arts Occupations
The most common Management, Business, Science and Arts occupations in Fellsburg are Business & Financial (81 | 13.9%), Community & Social Service (75 | 12.9%), Health Diagnosing & Treating (72 | 12.3%), Health Technologists (72 | 12.3%), and Education, Arts & Media (54 | 9.3%).
Management, Business, Science and Arts Occupations by Sex
Within the Management, Business, Science and Arts occupations in Fellsburg, the most male-oriented occupations are Architecture & Engineering (100.0%), Computers, Engineering & Science (77.1%), and Education, Arts & Media (51.8%), while the most female-oriented occupations are Computers & Mathematics (100.0%), Education Instruction & Library (100.0%), and Community & Social Service (62.7%).
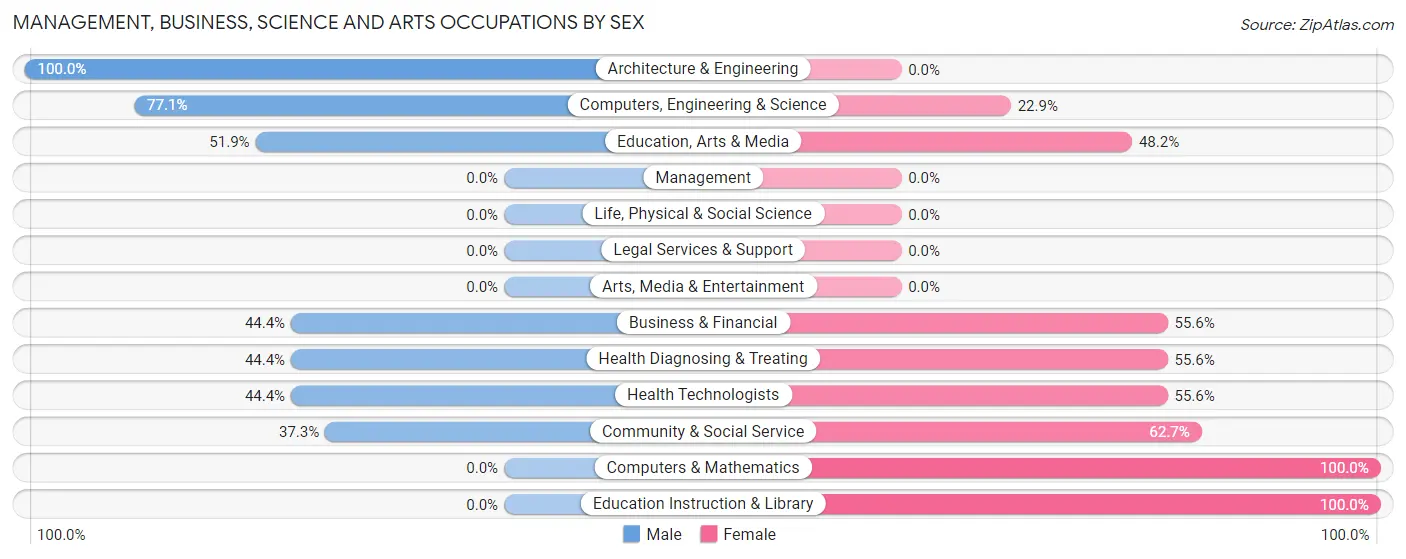
| Occupation | Male | Female |
| Management | 0 (0.0%) | 0 (0.0%) |
| Business & Financial | 36 (44.4%) | 45 (55.6%) |
| Computers, Engineering & Science | 27 (77.1%) | 8 (22.9%) |
| Computers & Mathematics | 0 (0.0%) | 8 (100.0%) |
| Architecture & Engineering | 27 (100.0%) | 0 (0.0%) |
| Life, Physical & Social Science | 0 (0.0%) | 0 (0.0%) |
| Community & Social Service | 28 (37.3%) | 47 (62.7%) |
| Education, Arts & Media | 28 (51.8%) | 26 (48.1%) |
| Legal Services & Support | 0 (0.0%) | 0 (0.0%) |
| Education Instruction & Library | 0 (0.0%) | 21 (100.0%) |
| Arts, Media & Entertainment | 0 (0.0%) | 0 (0.0%) |
| Health Diagnosing & Treating | 32 (44.4%) | 40 (55.6%) |
| Health Technologists | 32 (44.4%) | 40 (55.6%) |
| Total (Category) | 123 (46.8%) | 140 (53.2%) |
| Total (Overall) | 287 (49.2%) | 296 (50.8%) |
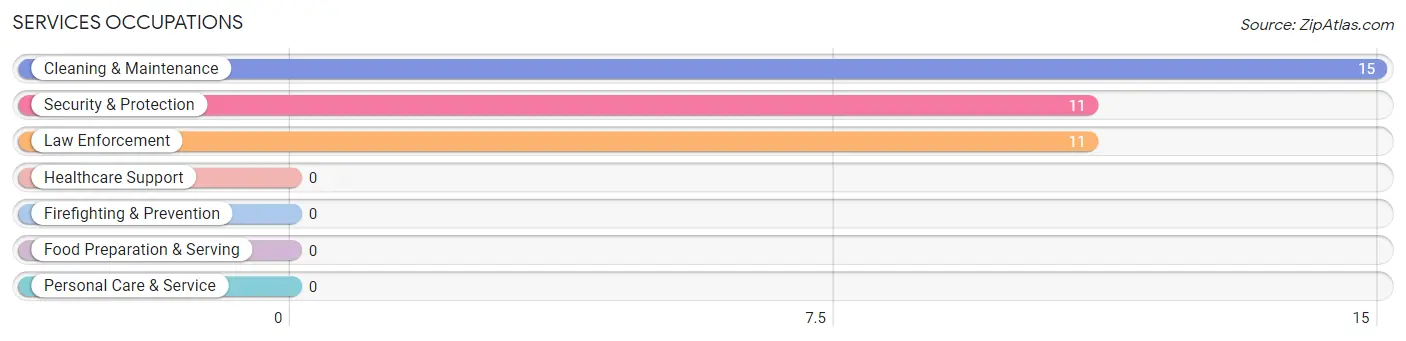
Services Occupations
The most common Services occupations in Fellsburg are Cleaning & Maintenance (15 | 2.6%), Security & Protection (11 | 1.9%), and Law Enforcement (11 | 1.9%).
Services Occupations by Sex
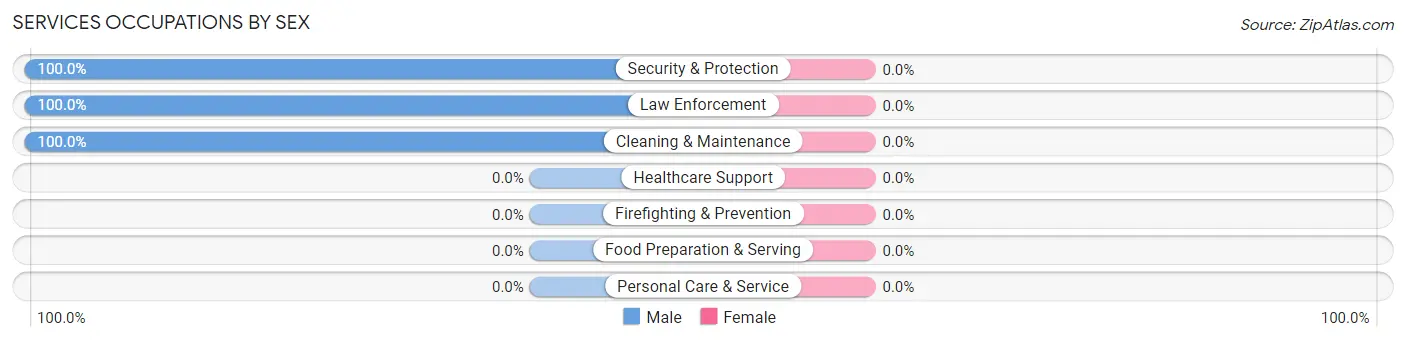
| Occupation | Male | Female |
| Healthcare Support | 0 (0.0%) | 0 (0.0%) |
| Security & Protection | 11 (100.0%) | 0 (0.0%) |
| Firefighting & Prevention | 0 (0.0%) | 0 (0.0%) |
| Law Enforcement | 11 (100.0%) | 0 (0.0%) |
| Food Preparation & Serving | 0 (0.0%) | 0 (0.0%) |
| Cleaning & Maintenance | 15 (100.0%) | 0 (0.0%) |
| Personal Care & Service | 0 (0.0%) | 0 (0.0%) |
| Total (Category) | 26 (100.0%) | 0 (0.0%) |
| Total (Overall) | 287 (49.2%) | 296 (50.8%) |
Sales and Office Occupations
The most common Sales and Office occupations in Fellsburg are Office & Administration (157 | 26.9%), and Sales & Related (11 | 1.9%).
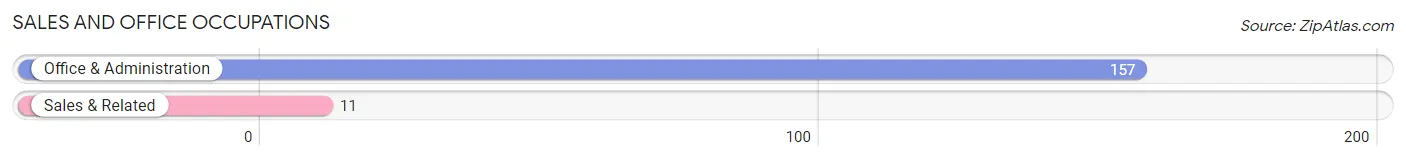
Sales and Office Occupations by Sex
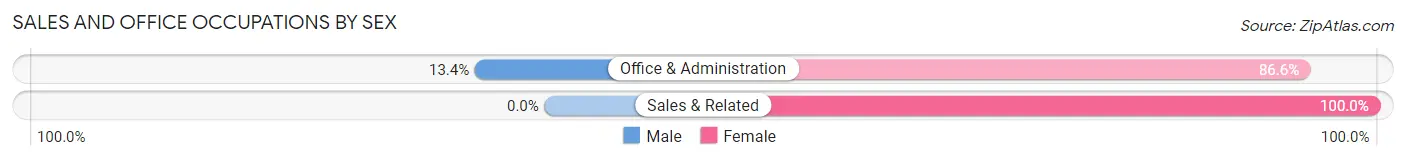
| Occupation | Male | Female |
| Sales & Related | 0 (0.0%) | 11 (100.0%) |
| Office & Administration | 21 (13.4%) | 136 (86.6%) |
| Total (Category) | 21 (12.5%) | 147 (87.5%) |
| Total (Overall) | 287 (49.2%) | 296 (50.8%) |
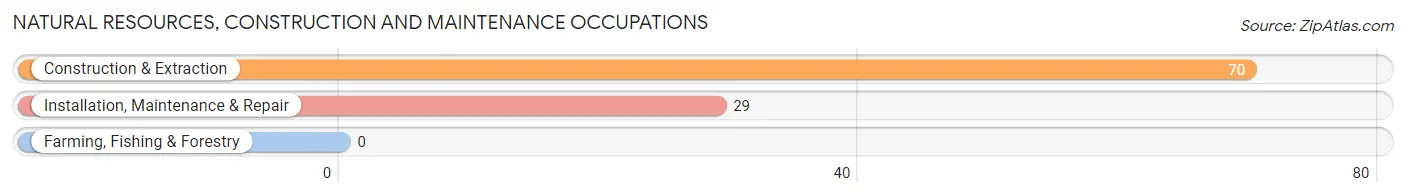
Natural Resources, Construction and Maintenance Occupations
The most common Natural Resources, Construction and Maintenance occupations in Fellsburg are Construction & Extraction (70 | 12.0%), and Installation, Maintenance & Repair (29 | 5.0%).
Natural Resources, Construction and Maintenance Occupations by Sex
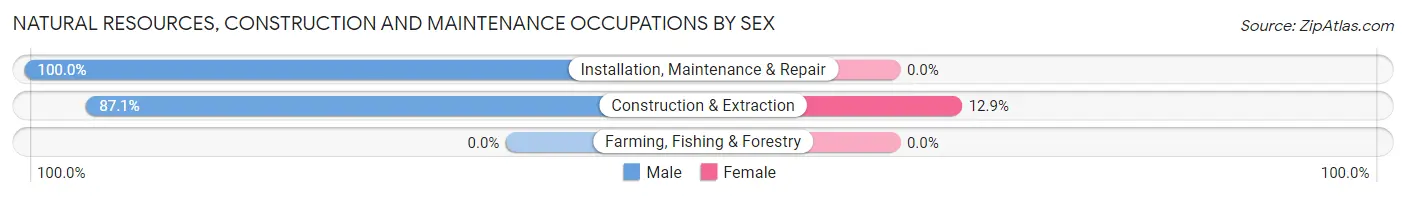
| Occupation | Male | Female |
| Farming, Fishing & Forestry | 0 (0.0%) | 0 (0.0%) |
| Construction & Extraction | 61 (87.1%) | 9 (12.9%) |
| Installation, Maintenance & Repair | 29 (100.0%) | 0 (0.0%) |
| Total (Category) | 90 (90.9%) | 9 (9.1%) |
| Total (Overall) | 287 (49.2%) | 296 (50.8%) |
Production, Transportation and Moving Occupations
The most common Production, Transportation and Moving occupations in Fellsburg are Production (19 | 3.3%), and Transportation (8 | 1.4%).
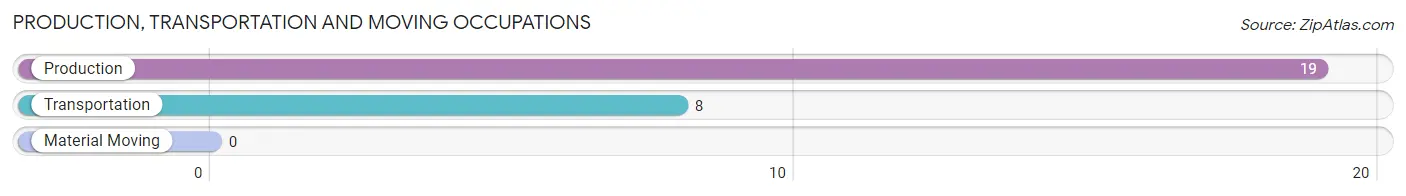
Production, Transportation and Moving Occupations by Sex
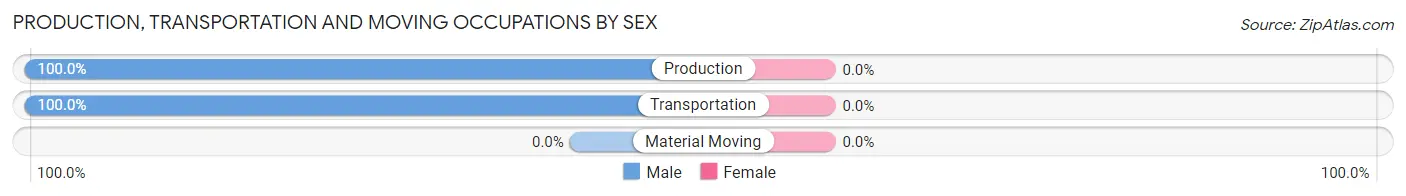
| Occupation | Male | Female |
| Production | 19 (100.0%) | 0 (0.0%) |
| Transportation | 8 (100.0%) | 0 (0.0%) |
| Material Moving | 0 (0.0%) | 0 (0.0%) |
| Total (Category) | 27 (100.0%) | 0 (0.0%) |
| Total (Overall) | 287 (49.2%) | 296 (50.8%) |
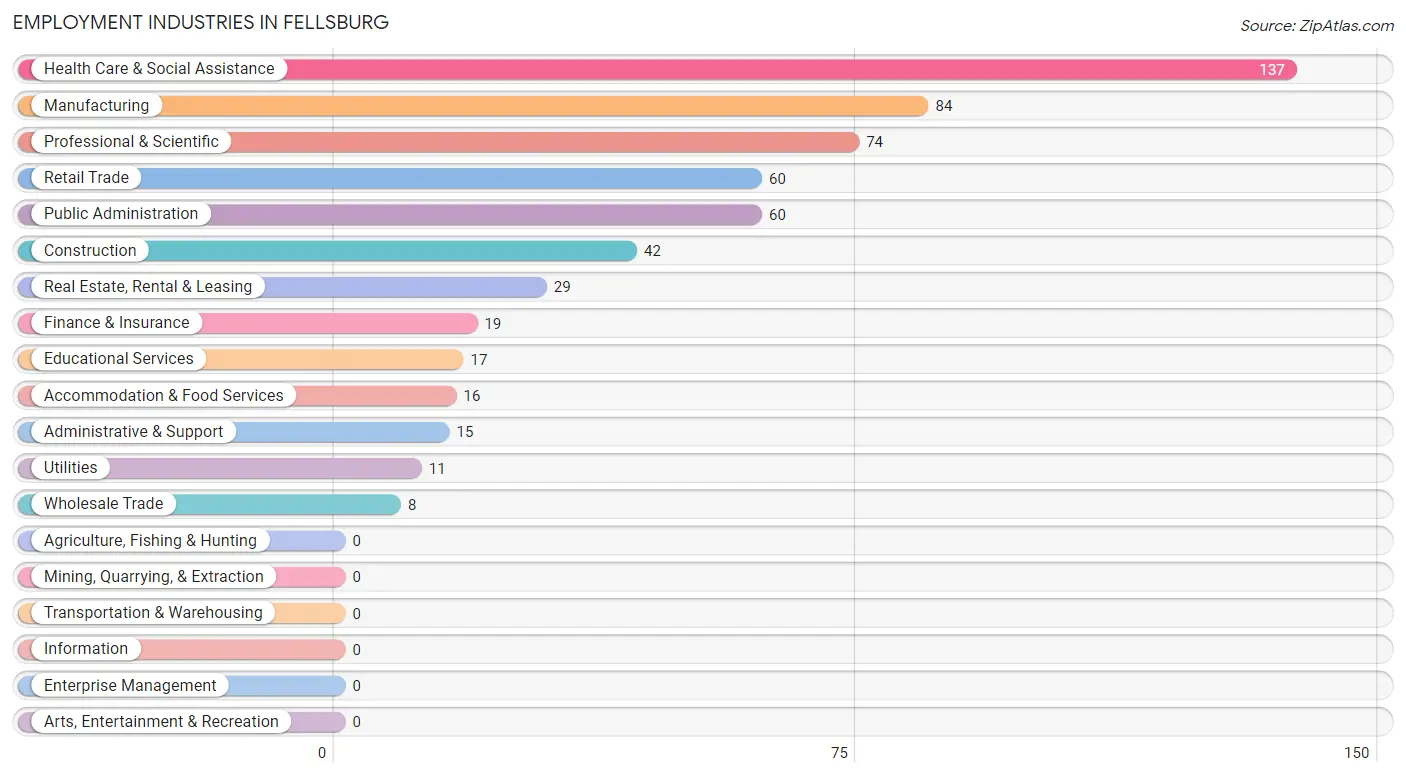
Employment Industries by Sex in Fellsburg
Employment Industries in Fellsburg
The major employment industries in Fellsburg include Health Care & Social Assistance (137 | 23.5%), Manufacturing (84 | 14.4%), Professional & Scientific (74 | 12.7%), Retail Trade (60 | 10.3%), and Public Administration (60 | 10.3%).
Employment Industries by Sex in Fellsburg
The Fellsburg industries that see more men than women are Wholesale Trade (100.0%), Administrative & Support (100.0%), and Accommodation & Food Services (100.0%), whereas the industries that tend to have a higher number of women are Utilities (100.0%), Finance & Insurance (100.0%), and Real Estate, Rental & Leasing (100.0%).
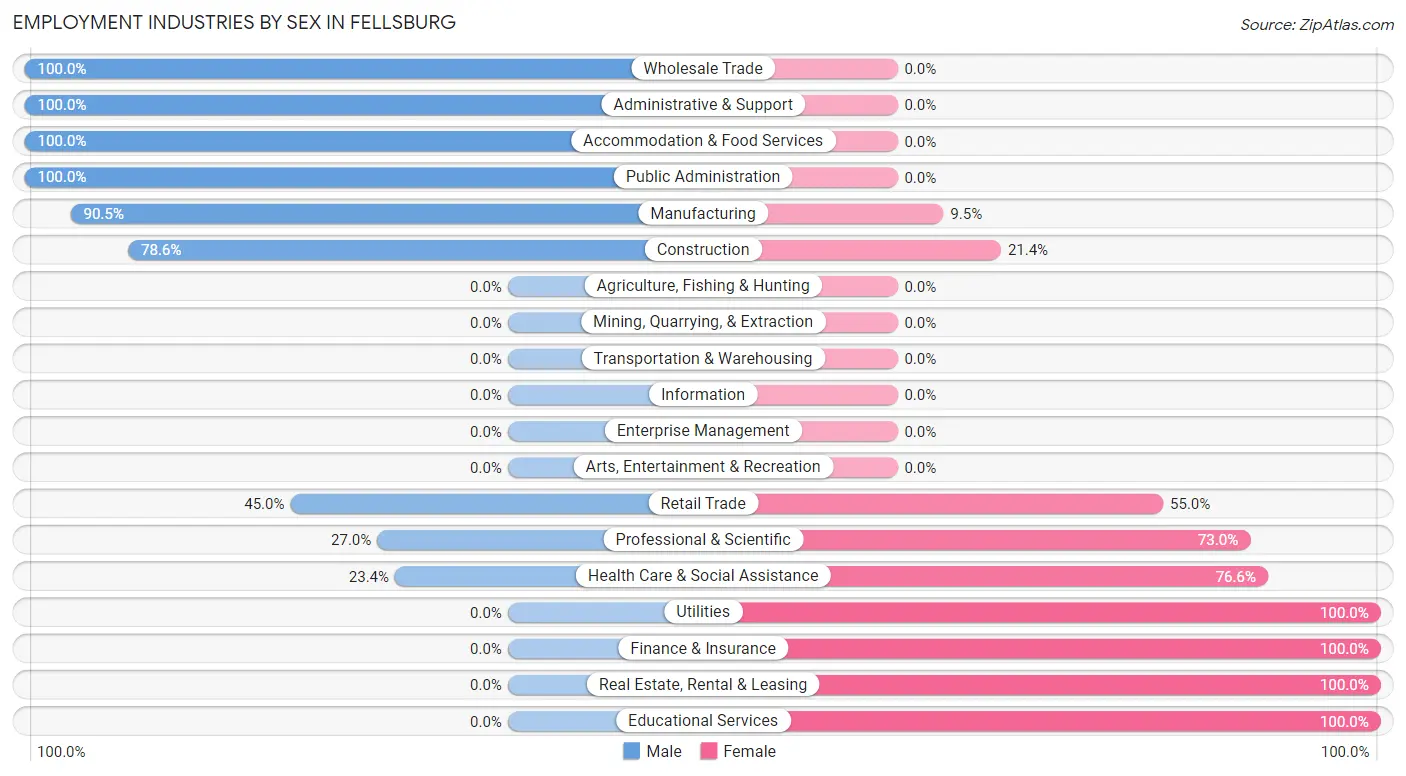
| Industry | Male | Female |
| Agriculture, Fishing & Hunting | 0 (0.0%) | 0 (0.0%) |
| Mining, Quarrying, & Extraction | 0 (0.0%) | 0 (0.0%) |
| Construction | 33 (78.6%) | 9 (21.4%) |
| Manufacturing | 76 (90.5%) | 8 (9.5%) |
| Wholesale Trade | 8 (100.0%) | 0 (0.0%) |
| Retail Trade | 27 (45.0%) | 33 (55.0%) |
| Transportation & Warehousing | 0 (0.0%) | 0 (0.0%) |
| Utilities | 0 (0.0%) | 11 (100.0%) |
| Information | 0 (0.0%) | 0 (0.0%) |
| Finance & Insurance | 0 (0.0%) | 19 (100.0%) |
| Real Estate, Rental & Leasing | 0 (0.0%) | 29 (100.0%) |
| Professional & Scientific | 20 (27.0%) | 54 (73.0%) |
| Enterprise Management | 0 (0.0%) | 0 (0.0%) |
| Administrative & Support | 15 (100.0%) | 0 (0.0%) |
| Educational Services | 0 (0.0%) | 17 (100.0%) |
| Health Care & Social Assistance | 32 (23.4%) | 105 (76.6%) |
| Arts, Entertainment & Recreation | 0 (0.0%) | 0 (0.0%) |
| Accommodation & Food Services | 16 (100.0%) | 0 (0.0%) |
| Public Administration | 60 (100.0%) | 0 (0.0%) |
| Total | 287 (49.2%) | 296 (50.8%) |
Education in Fellsburg
School Enrollment in Fellsburg
The most common levels of schooling among the 234 students in Fellsburg are high school (74 | 31.6%), college / undergraduate (71 | 30.3%), and middle school (49 | 20.9%).
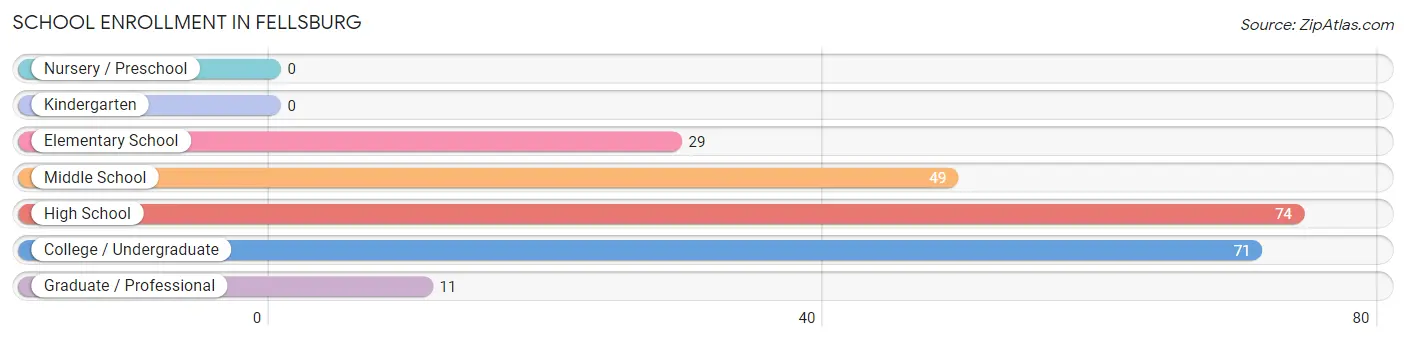
| School Level | # Students | % Students |
| Nursery / Preschool | 0 | 0.0% |
| Kindergarten | 0 | 0.0% |
| Elementary School | 29 | 12.4% |
| Middle School | 49 | 20.9% |
| High School | 74 | 31.6% |
| College / Undergraduate | 71 | 30.3% |
| Graduate / Professional | 11 | 4.7% |
| Total | 234 | 100.0% |
School Enrollment by Age by Funding Source in Fellsburg
Out of a total of 234 students who are enrolled in schools in Fellsburg, 63 (26.9%) attend a private institution, while the remaining 171 (73.1%) are enrolled in public schools. The age group of 25 to 34 year olds has the highest likelihood of being enrolled in private schools, with 11 (100.0% in the age bracket) enrolled. Conversely, the age group of 5 to 9 year old has the lowest likelihood of being enrolled in a private school, with 29 (100.0% in the age bracket) attending a public institution.
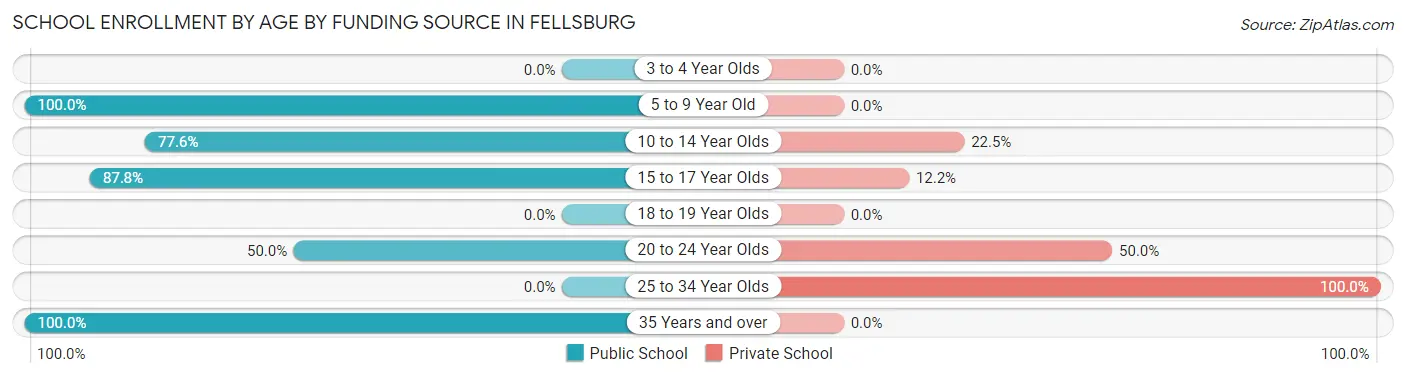
| Age Bracket | Public School | Private School |
| 3 to 4 Year Olds | 0 (0.0%) | 0 (0.0%) |
| 5 to 9 Year Old | 29 (100.0%) | 0 (0.0%) |
| 10 to 14 Year Olds | 38 (77.5%) | 11 (22.5%) |
| 15 to 17 Year Olds | 65 (87.8%) | 9 (12.2%) |
| 18 to 19 Year Olds | 0 (0.0%) | 0 (0.0%) |
| 20 to 24 Year Olds | 32 (50.0%) | 32 (50.0%) |
| 25 to 34 Year Olds | 0 (0.0%) | 11 (100.0%) |
| 35 Years and over | 7 (100.0%) | 0 (0.0%) |
| Total | 171 (73.1%) | 63 (26.9%) |
Educational Attainment by Field of Study in Fellsburg
Business (97 | 33.3%), education (67 | 23.0%), science & technology (54 | 18.6%), bio, nature & agricultural (22 | 7.6%), and psychology (12 | 4.1%) are the most common fields of study among 291 individuals in Fellsburg who have obtained a bachelor's degree or higher.
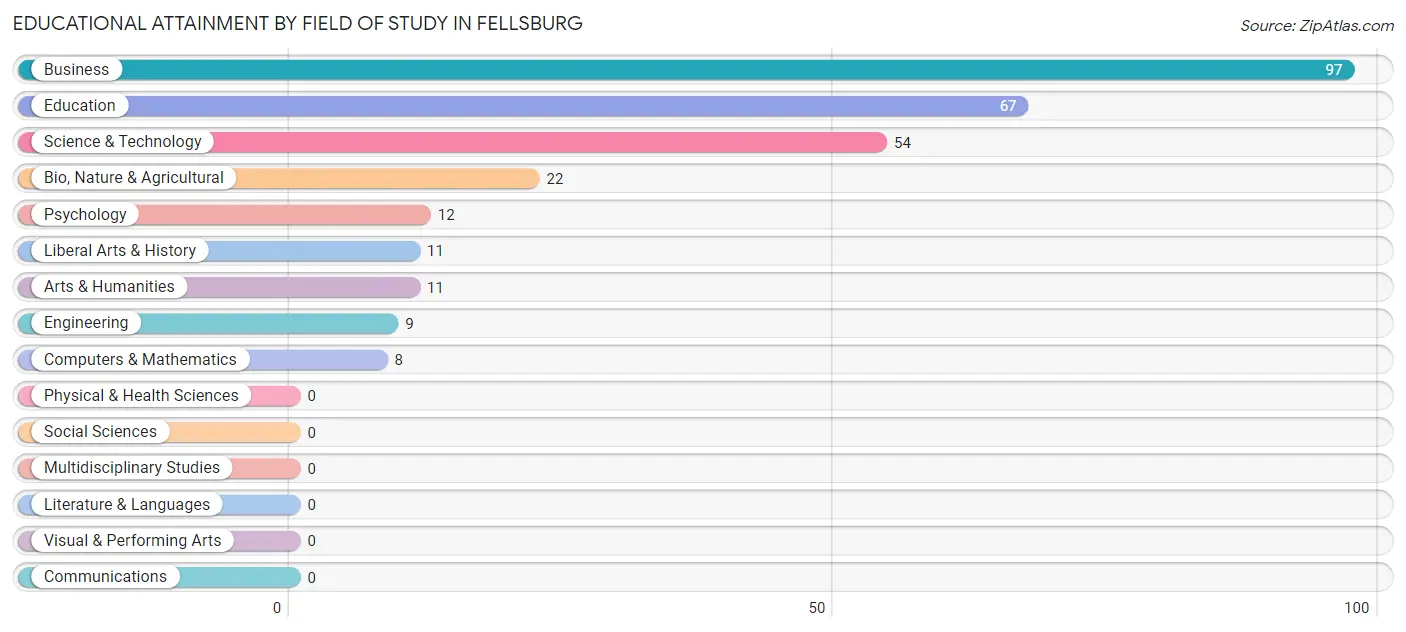
| Field of Study | # Graduates | % Graduates |
| Computers & Mathematics | 8 | 2.8% |
| Bio, Nature & Agricultural | 22 | 7.6% |
| Physical & Health Sciences | 0 | 0.0% |
| Psychology | 12 | 4.1% |
| Social Sciences | 0 | 0.0% |
| Engineering | 9 | 3.1% |
| Multidisciplinary Studies | 0 | 0.0% |
| Science & Technology | 54 | 18.6% |
| Business | 97 | 33.3% |
| Education | 67 | 23.0% |
| Literature & Languages | 0 | 0.0% |
| Liberal Arts & History | 11 | 3.8% |
| Visual & Performing Arts | 0 | 0.0% |
| Communications | 0 | 0.0% |
| Arts & Humanities | 11 | 3.8% |
| Total | 291 | 100.0% |
Transportation & Commute in Fellsburg
Vehicle Availability by Sex in Fellsburg
The most prevalent vehicle ownership categories in Fellsburg are males with 2 vehicles (122, accounting for 42.5%) and females with 2 vehicles (78, making up 41.2%).
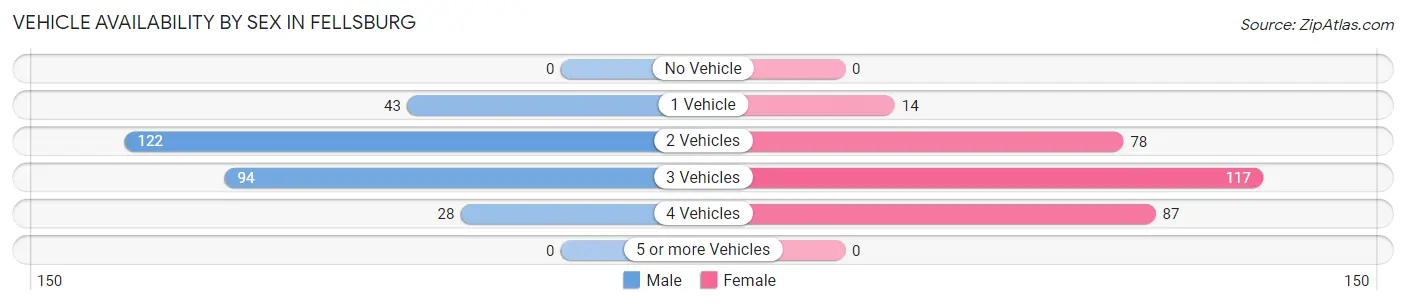
| Vehicles Available | Male | Female |
| No Vehicle | 0 (0.0%) | 0 (0.0%) |
| 1 Vehicle | 43 (15.0%) | 14 (4.7%) |
| 2 Vehicles | 122 (42.5%) | 78 (26.4%) |
| 3 Vehicles | 94 (32.8%) | 117 (39.5%) |
| 4 Vehicles | 28 (9.8%) | 87 (29.4%) |
| 5 or more Vehicles | 0 (0.0%) | 0 (0.0%) |
| Total | 287 (100.0%) | 296 (100.0%) |
Commute Time in Fellsburg
The most frequently occuring commute durations in Fellsburg are 20 to 24 minutes (147 commuters, 26.6%), 60 to 89 minutes (116 commuters, 21.0%), and 30 to 34 minutes (54 commuters, 9.8%).
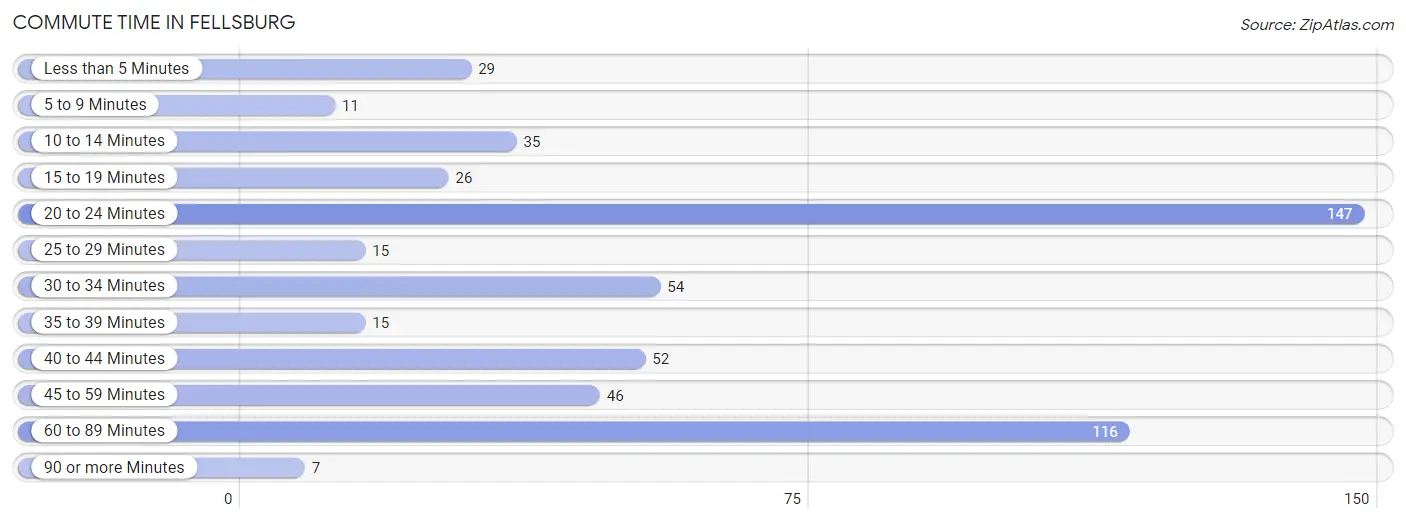
| Commute Time | # Commuters | % Commuters |
| Less than 5 Minutes | 29 | 5.2% |
| 5 to 9 Minutes | 11 | 2.0% |
| 10 to 14 Minutes | 35 | 6.3% |
| 15 to 19 Minutes | 26 | 4.7% |
| 20 to 24 Minutes | 147 | 26.6% |
| 25 to 29 Minutes | 15 | 2.7% |
| 30 to 34 Minutes | 54 | 9.8% |
| 35 to 39 Minutes | 15 | 2.7% |
| 40 to 44 Minutes | 52 | 9.4% |
| 45 to 59 Minutes | 46 | 8.3% |
| 60 to 89 Minutes | 116 | 21.0% |
| 90 or more Minutes | 7 | 1.3% |
Commute Time by Sex in Fellsburg
The most common commute times in Fellsburg are 20 to 24 minutes (78 commuters, 28.1%) for males and 60 to 89 minutes (100 commuters, 36.4%) for females.
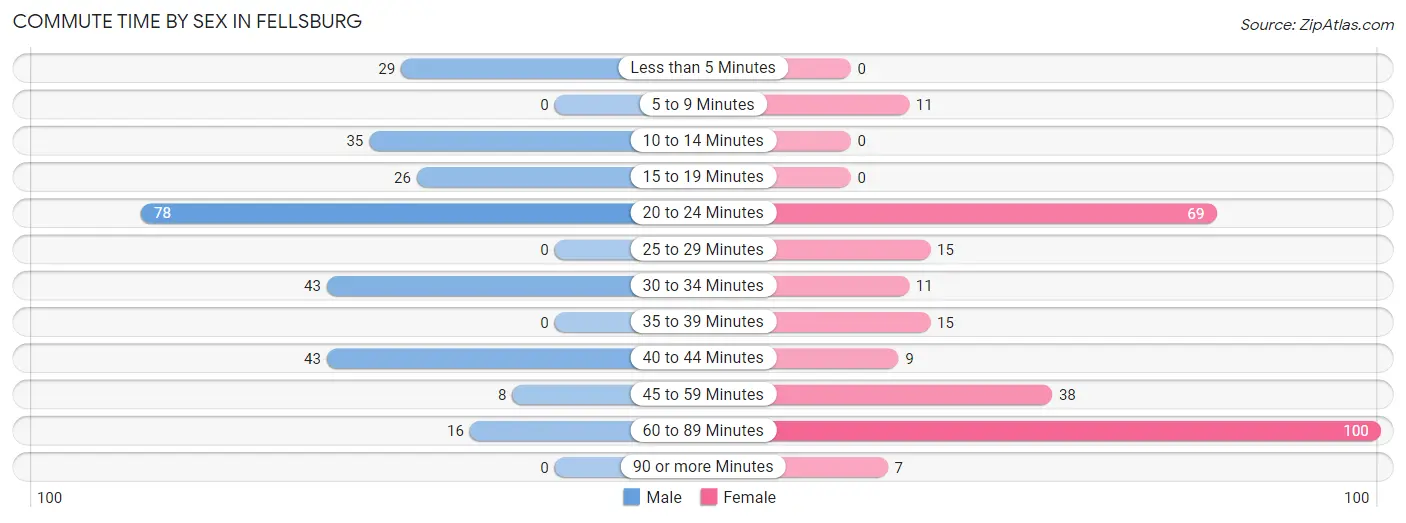
| Commute Time | Male | Female |
| Less than 5 Minutes | 29 (10.4%) | 0 (0.0%) |
| 5 to 9 Minutes | 0 (0.0%) | 11 (4.0%) |
| 10 to 14 Minutes | 35 (12.6%) | 0 (0.0%) |
| 15 to 19 Minutes | 26 (9.3%) | 0 (0.0%) |
| 20 to 24 Minutes | 78 (28.1%) | 69 (25.1%) |
| 25 to 29 Minutes | 0 (0.0%) | 15 (5.4%) |
| 30 to 34 Minutes | 43 (15.5%) | 11 (4.0%) |
| 35 to 39 Minutes | 0 (0.0%) | 15 (5.4%) |
| 40 to 44 Minutes | 43 (15.5%) | 9 (3.3%) |
| 45 to 59 Minutes | 8 (2.9%) | 38 (13.8%) |
| 60 to 89 Minutes | 16 (5.8%) | 100 (36.4%) |
| 90 or more Minutes | 0 (0.0%) | 7 (2.5%) |
Time of Departure to Work by Sex in Fellsburg
The most frequent times of departure to work in Fellsburg are 7:00 AM to 7:29 AM (105, 37.8%) for males and 7:30 AM to 7:59 AM (131, 47.6%) for females.
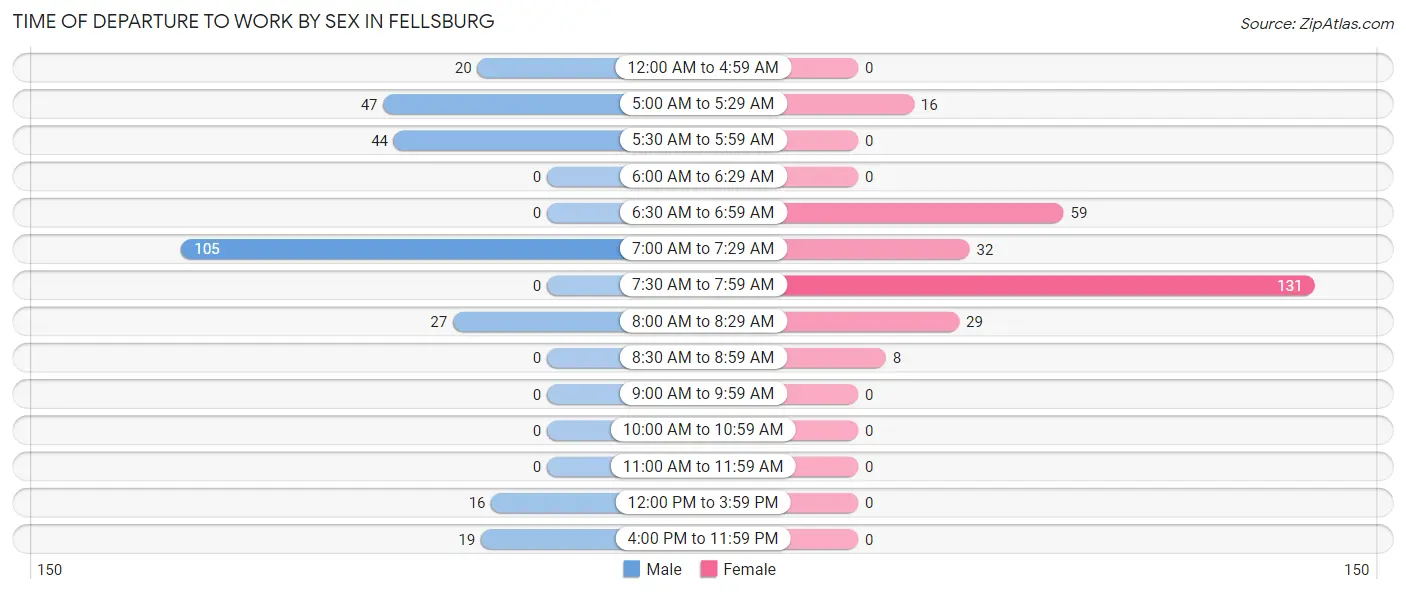
| Time of Departure | Male | Female |
| 12:00 AM to 4:59 AM | 20 (7.2%) | 0 (0.0%) |
| 5:00 AM to 5:29 AM | 47 (16.9%) | 16 (5.8%) |
| 5:30 AM to 5:59 AM | 44 (15.8%) | 0 (0.0%) |
| 6:00 AM to 6:29 AM | 0 (0.0%) | 0 (0.0%) |
| 6:30 AM to 6:59 AM | 0 (0.0%) | 59 (21.4%) |
| 7:00 AM to 7:29 AM | 105 (37.8%) | 32 (11.6%) |
| 7:30 AM to 7:59 AM | 0 (0.0%) | 131 (47.6%) |
| 8:00 AM to 8:29 AM | 27 (9.7%) | 29 (10.5%) |
| 8:30 AM to 8:59 AM | 0 (0.0%) | 8 (2.9%) |
| 9:00 AM to 9:59 AM | 0 (0.0%) | 0 (0.0%) |
| 10:00 AM to 10:59 AM | 0 (0.0%) | 0 (0.0%) |
| 11:00 AM to 11:59 AM | 0 (0.0%) | 0 (0.0%) |
| 12:00 PM to 3:59 PM | 16 (5.8%) | 0 (0.0%) |
| 4:00 PM to 11:59 PM | 19 (6.8%) | 0 (0.0%) |
| Total | 278 (100.0%) | 275 (100.0%) |
Housing Occupancy in Fellsburg
Occupancy by Ownership in Fellsburg
Of the total 475 dwellings in Fellsburg, owner-occupied units account for 457 (96.2%), while renter-occupied units make up 18 (3.8%).
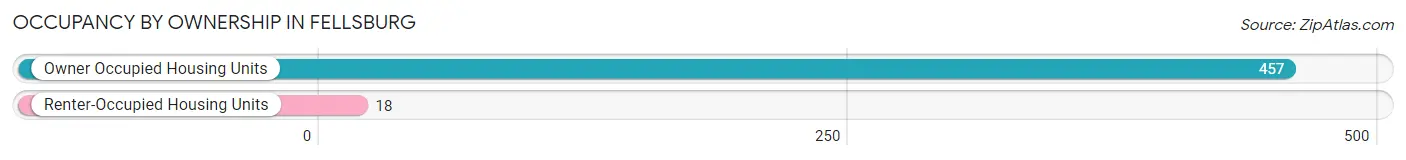
| Occupancy | # Housing Units | % Housing Units |
| Owner Occupied Housing Units | 457 | 96.2% |
| Renter-Occupied Housing Units | 18 | 3.8% |
| Total Occupied Housing Units | 475 | 100.0% |
Occupancy by Household Size in Fellsburg
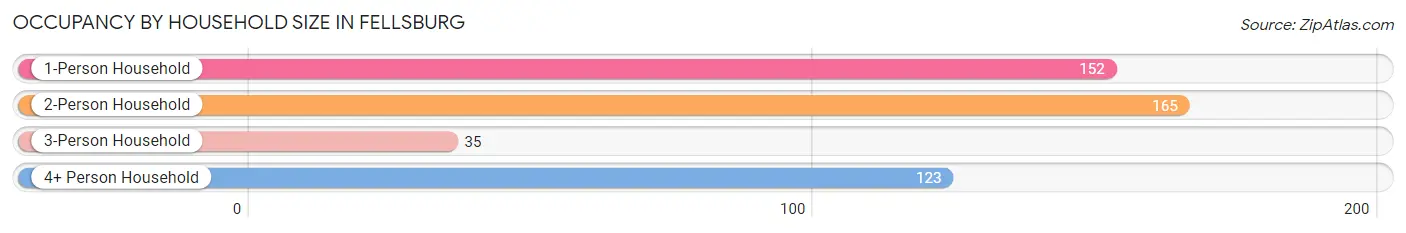
| Household Size | # Housing Units | % Housing Units |
| 1-Person Household | 152 | 32.0% |
| 2-Person Household | 165 | 34.7% |
| 3-Person Household | 35 | 7.4% |
| 4+ Person Household | 123 | 25.9% |
| Total Housing Units | 475 | 100.0% |
Occupancy by Ownership by Household Size in Fellsburg
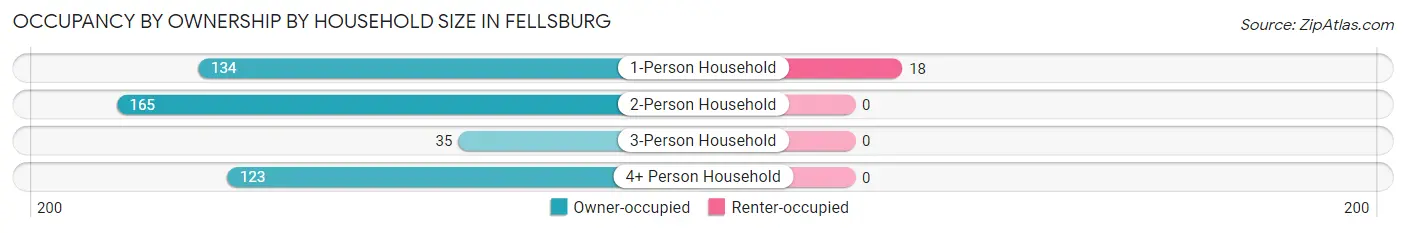
| Household Size | Owner-occupied | Renter-occupied |
| 1-Person Household | 134 (88.2%) | 18 (11.8%) |
| 2-Person Household | 165 (100.0%) | 0 (0.0%) |
| 3-Person Household | 35 (100.0%) | 0 (0.0%) |
| 4+ Person Household | 123 (100.0%) | 0 (0.0%) |
| Total Housing Units | 457 (96.2%) | 18 (3.8%) |
Occupancy by Educational Attainment in Fellsburg
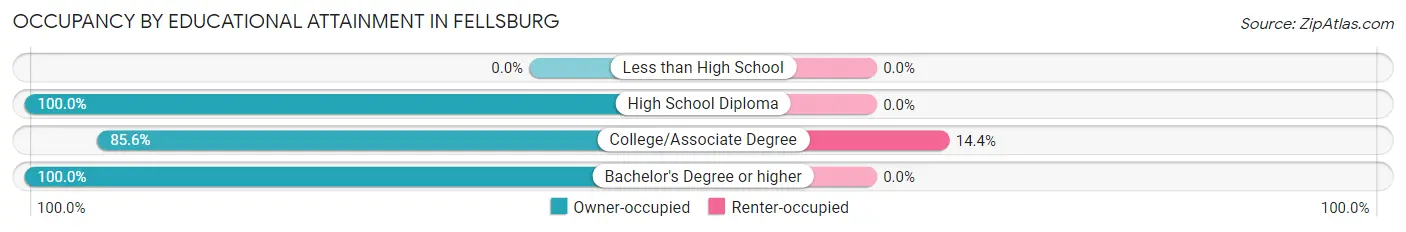
| Household Size | Owner-occupied | Renter-occupied |
| Less than High School | 0 (0.0%) | 0 (0.0%) |
| High School Diploma | 201 (100.0%) | 0 (0.0%) |
| College/Associate Degree | 107 (85.6%) | 18 (14.4%) |
| Bachelor's Degree or higher | 149 (100.0%) | 0 (0.0%) |
Occupancy by Age of Householder in Fellsburg
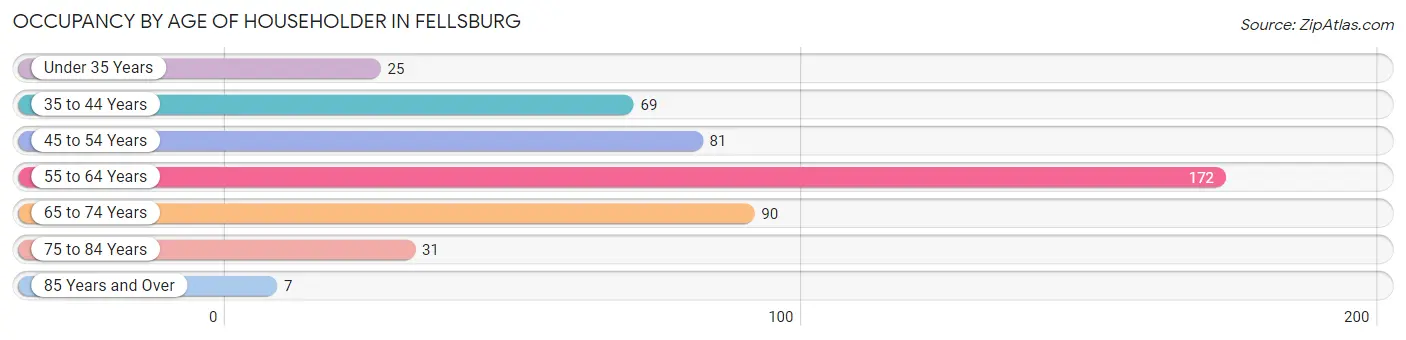
| Age Bracket | # Households | % Households |
| Under 35 Years | 25 | 5.3% |
| 35 to 44 Years | 69 | 14.5% |
| 45 to 54 Years | 81 | 17.1% |
| 55 to 64 Years | 172 | 36.2% |
| 65 to 74 Years | 90 | 19.0% |
| 75 to 84 Years | 31 | 6.5% |
| 85 Years and Over | 7 | 1.5% |
| Total | 475 | 100.0% |
Housing Finances in Fellsburg
Median Income by Occupancy in Fellsburg
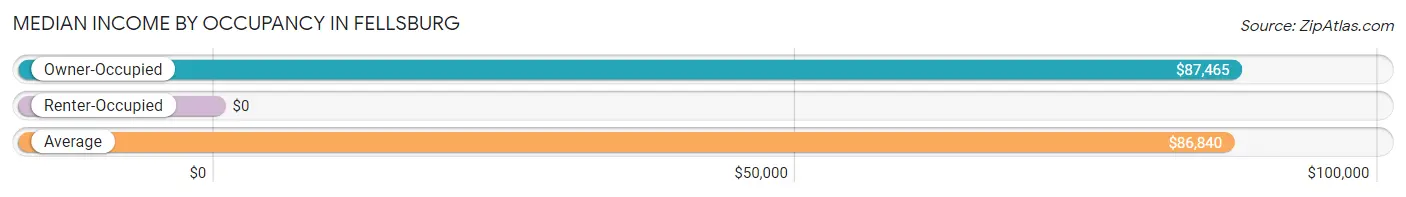
| Occupancy Type | # Households | Median Income |
| Owner-Occupied | 457 (96.2%) | $87,465 |
| Renter-Occupied | 18 (3.8%) | $0 |
| Average | 475 (100.0%) | $86,840 |
Occupancy by Householder Income Bracket in Fellsburg
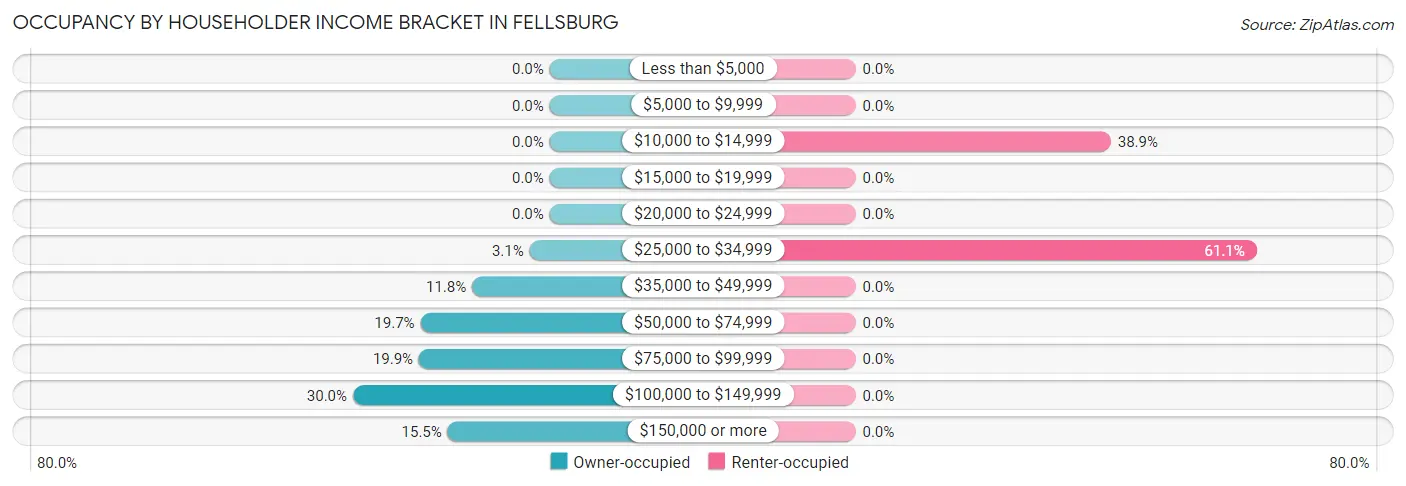
| Income Bracket | Owner-occupied | Renter-occupied |
| Less than $5,000 | 0 (0.0%) | 0 (0.0%) |
| $5,000 to $9,999 | 0 (0.0%) | 0 (0.0%) |
| $10,000 to $14,999 | 0 (0.0%) | 7 (38.9%) |
| $15,000 to $19,999 | 0 (0.0%) | 0 (0.0%) |
| $20,000 to $24,999 | 0 (0.0%) | 0 (0.0%) |
| $25,000 to $34,999 | 14 (3.1%) | 11 (61.1%) |
| $35,000 to $49,999 | 54 (11.8%) | 0 (0.0%) |
| $50,000 to $74,999 | 90 (19.7%) | 0 (0.0%) |
| $75,000 to $99,999 | 91 (19.9%) | 0 (0.0%) |
| $100,000 to $149,999 | 137 (30.0%) | 0 (0.0%) |
| $150,000 or more | 71 (15.5%) | 0 (0.0%) |
| Total | 457 (100.0%) | 18 (100.0%) |
Monthly Housing Cost Tiers in Fellsburg
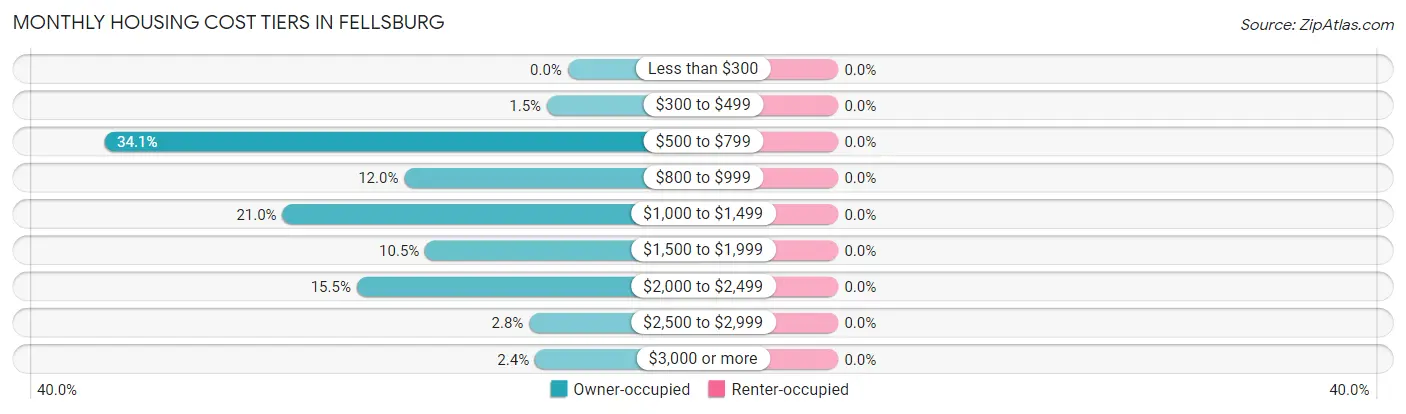
| Monthly Cost | Owner-occupied | Renter-occupied |
| Less than $300 | 0 (0.0%) | 0 (0.0%) |
| $300 to $499 | 7 (1.5%) | 0 (0.0%) |
| $500 to $799 | 156 (34.1%) | 0 (0.0%) |
| $800 to $999 | 55 (12.0%) | 0 (0.0%) |
| $1,000 to $1,499 | 96 (21.0%) | 0 (0.0%) |
| $1,500 to $1,999 | 48 (10.5%) | 0 (0.0%) |
| $2,000 to $2,499 | 71 (15.5%) | 0 (0.0%) |
| $2,500 to $2,999 | 13 (2.8%) | 0 (0.0%) |
| $3,000 or more | 11 (2.4%) | 0 (0.0%) |
| Total | 457 (100.0%) | 18 (100.0%) |
Physical Housing Characteristics in Fellsburg
Housing Structures in Fellsburg
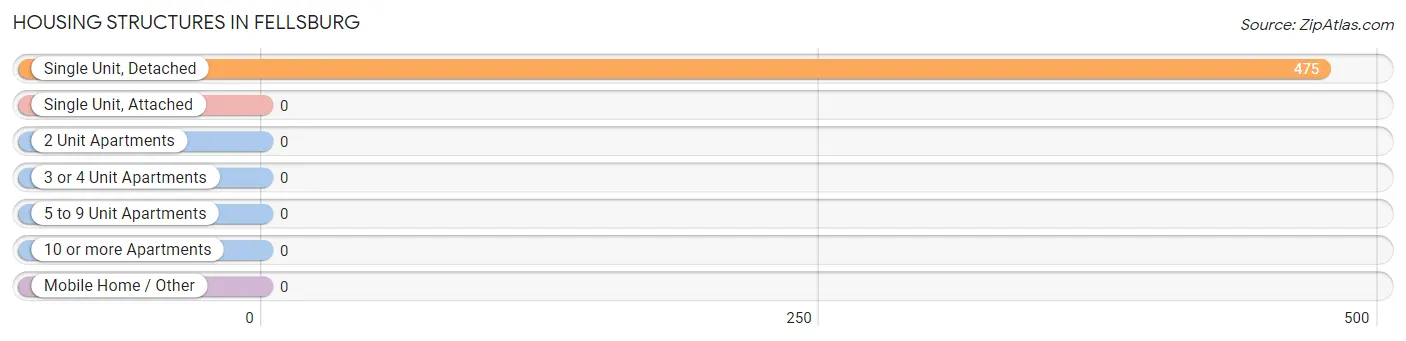
| Structure Type | # Housing Units | % Housing Units |
| Single Unit, Detached | 475 | 100.0% |
| Single Unit, Attached | 0 | 0.0% |
| 2 Unit Apartments | 0 | 0.0% |
| 3 or 4 Unit Apartments | 0 | 0.0% |
| 5 to 9 Unit Apartments | 0 | 0.0% |
| 10 or more Apartments | 0 | 0.0% |
| Mobile Home / Other | 0 | 0.0% |
| Total | 475 | 100.0% |
Housing Structures by Occupancy in Fellsburg
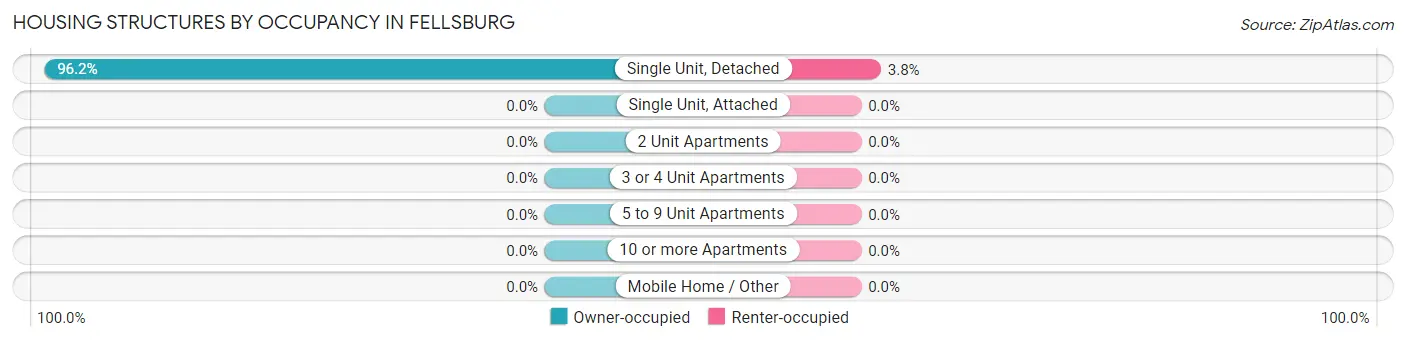
| Structure Type | Owner-occupied | Renter-occupied |
| Single Unit, Detached | 457 (96.2%) | 18 (3.8%) |
| Single Unit, Attached | 0 (0.0%) | 0 (0.0%) |
| 2 Unit Apartments | 0 (0.0%) | 0 (0.0%) |
| 3 or 4 Unit Apartments | 0 (0.0%) | 0 (0.0%) |
| 5 to 9 Unit Apartments | 0 (0.0%) | 0 (0.0%) |
| 10 or more Apartments | 0 (0.0%) | 0 (0.0%) |
| Mobile Home / Other | 0 (0.0%) | 0 (0.0%) |
| Total | 457 (96.2%) | 18 (3.8%) |
Housing Structures by Number of Rooms in Fellsburg
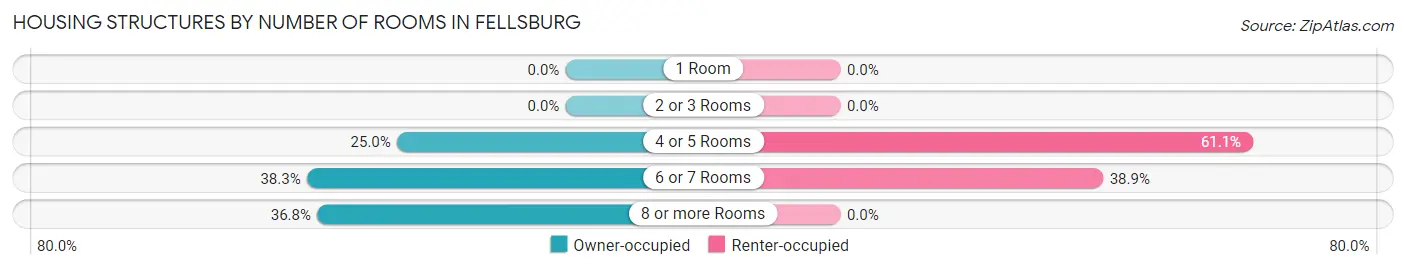
| Number of Rooms | Owner-occupied | Renter-occupied |
| 1 Room | 0 (0.0%) | 0 (0.0%) |
| 2 or 3 Rooms | 0 (0.0%) | 0 (0.0%) |
| 4 or 5 Rooms | 114 (24.9%) | 11 (61.1%) |
| 6 or 7 Rooms | 175 (38.3%) | 7 (38.9%) |
| 8 or more Rooms | 168 (36.8%) | 0 (0.0%) |
| Total | 457 (100.0%) | 18 (100.0%) |
Housing Structure by Heating Type in Fellsburg
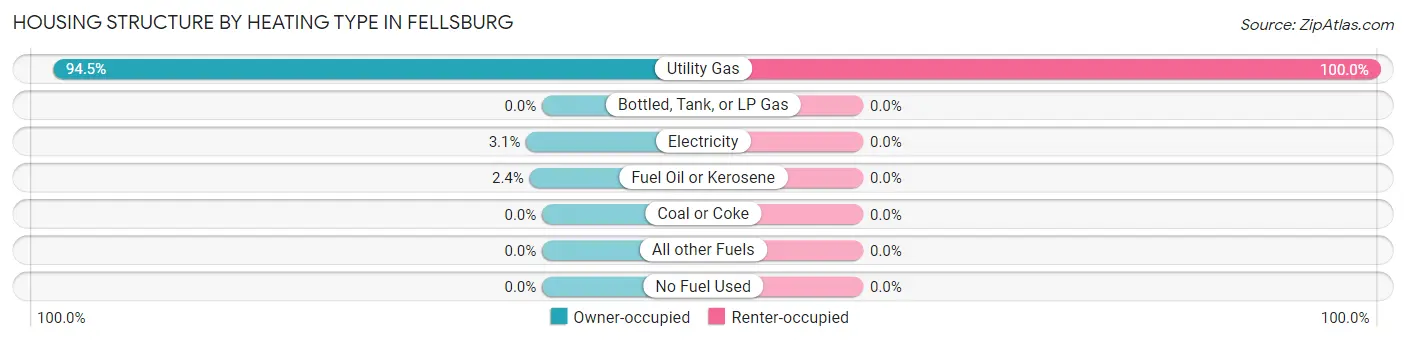
| Heating Type | Owner-occupied | Renter-occupied |
| Utility Gas | 432 (94.5%) | 18 (100.0%) |
| Bottled, Tank, or LP Gas | 0 (0.0%) | 0 (0.0%) |
| Electricity | 14 (3.1%) | 0 (0.0%) |
| Fuel Oil or Kerosene | 11 (2.4%) | 0 (0.0%) |
| Coal or Coke | 0 (0.0%) | 0 (0.0%) |
| All other Fuels | 0 (0.0%) | 0 (0.0%) |
| No Fuel Used | 0 (0.0%) | 0 (0.0%) |
| Total | 457 (100.0%) | 18 (100.0%) |
Household Vehicle Usage in Fellsburg
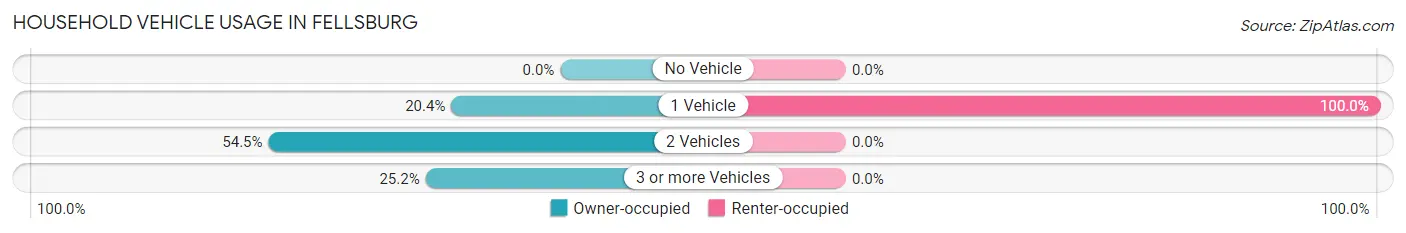
| Vehicles per Household | Owner-occupied | Renter-occupied |
| No Vehicle | 0 (0.0%) | 0 (0.0%) |
| 1 Vehicle | 93 (20.3%) | 18 (100.0%) |
| 2 Vehicles | 249 (54.5%) | 0 (0.0%) |
| 3 or more Vehicles | 115 (25.2%) | 0 (0.0%) |
| Total | 457 (100.0%) | 18 (100.0%) |
Real Estate & Mortgages in Fellsburg
Real Estate and Mortgage Overview in Fellsburg
| Characteristic | Without Mortgage | With Mortgage |
| Housing Units | 176 | 281 |
| Median Property Value | $210,800 | $247,700 |
| Median Household Income | $86,458 | $42 |
| Monthly Housing Costs | $632 | $11 |
| Real Estate Taxes | $2,418 | $0 |
Property Value by Mortgage Status in Fellsburg
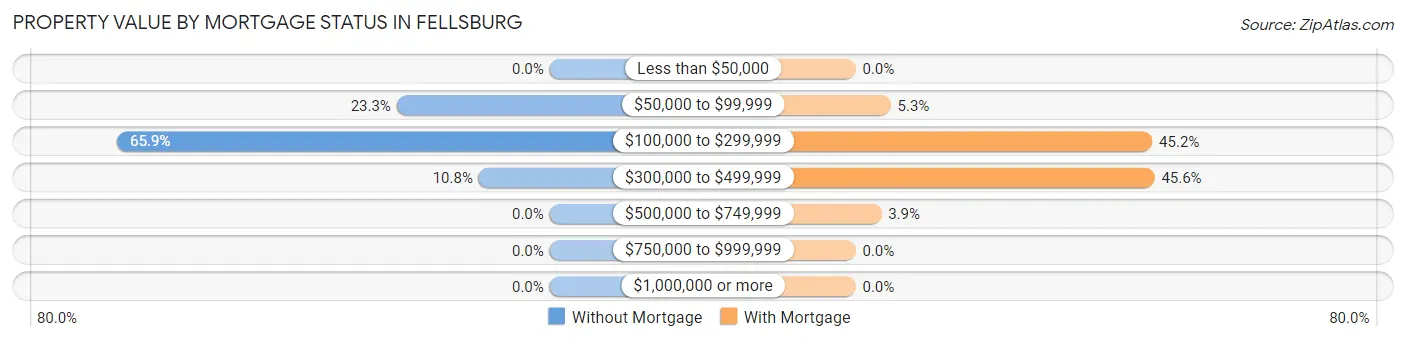
| Property Value | Without Mortgage | With Mortgage |
| Less than $50,000 | 0 (0.0%) | 0 (0.0%) |
| $50,000 to $99,999 | 41 (23.3%) | 15 (5.3%) |
| $100,000 to $299,999 | 116 (65.9%) | 127 (45.2%) |
| $300,000 to $499,999 | 19 (10.8%) | 128 (45.6%) |
| $500,000 to $749,999 | 0 (0.0%) | 11 (3.9%) |
| $750,000 to $999,999 | 0 (0.0%) | 0 (0.0%) |
| $1,000,000 or more | 0 (0.0%) | 0 (0.0%) |
| Total | 176 (100.0%) | 281 (100.0%) |
Household Income by Mortgage Status in Fellsburg
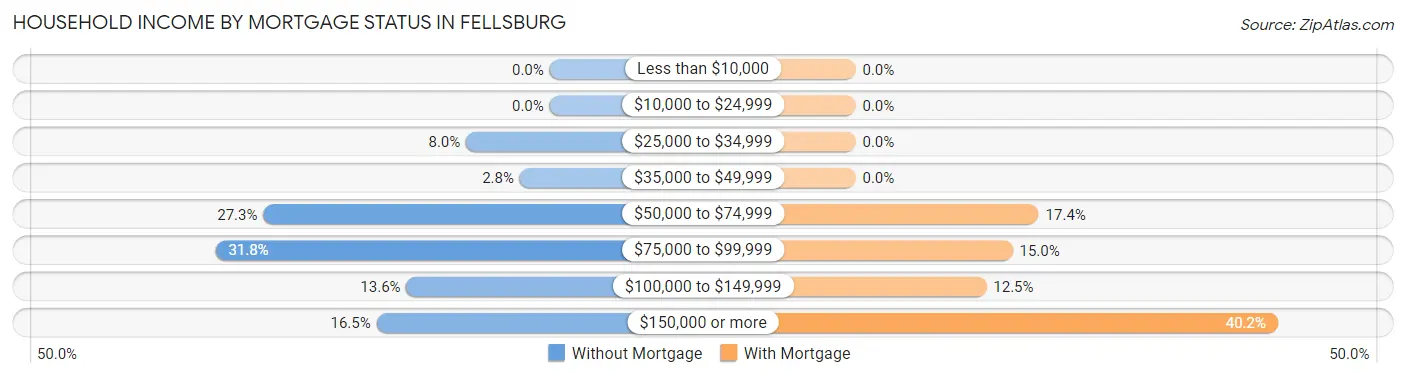
| Household Income | Without Mortgage | With Mortgage |
| Less than $10,000 | 0 (0.0%) | 0 (0.0%) |
| $10,000 to $24,999 | 0 (0.0%) | 0 (0.0%) |
| $25,000 to $34,999 | 14 (8.0%) | 0 (0.0%) |
| $35,000 to $49,999 | 5 (2.8%) | 0 (0.0%) |
| $50,000 to $74,999 | 48 (27.3%) | 49 (17.4%) |
| $75,000 to $99,999 | 56 (31.8%) | 42 (14.9%) |
| $100,000 to $149,999 | 24 (13.6%) | 35 (12.5%) |
| $150,000 or more | 29 (16.5%) | 113 (40.2%) |
| Total | 176 (100.0%) | 281 (100.0%) |
Property Value to Household Income Ratio in Fellsburg
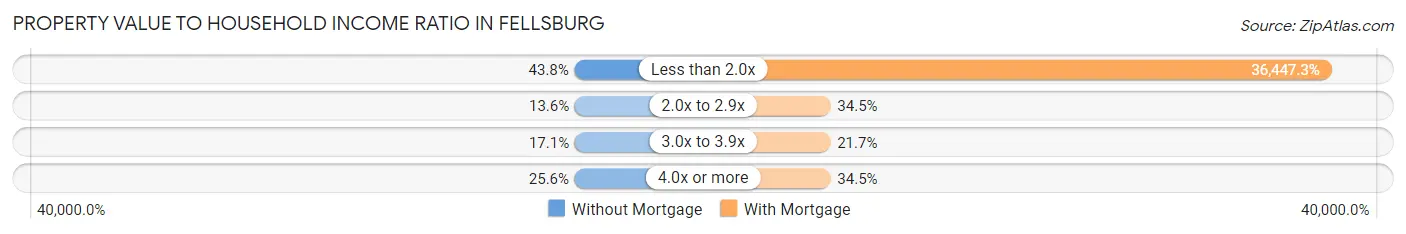
| Value-to-Income Ratio | Without Mortgage | With Mortgage |
| Less than 2.0x | 77 (43.8%) | 102,417 (36,447.3%) |
| 2.0x to 2.9x | 24 (13.6%) | 97 (34.5%) |
| 3.0x to 3.9x | 30 (17.1%) | 61 (21.7%) |
| 4.0x or more | 45 (25.6%) | 97 (34.5%) |
| Total | 176 (100.0%) | 281 (100.0%) |
Real Estate Taxes by Mortgage Status in Fellsburg
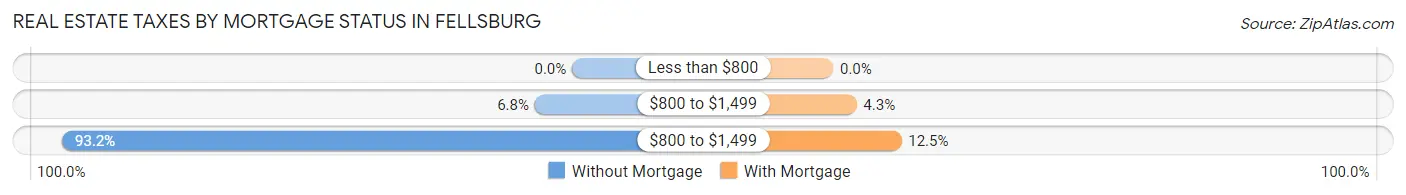
| Property Taxes | Without Mortgage | With Mortgage |
| Less than $800 | 0 (0.0%) | 0 (0.0%) |
| $800 to $1,499 | 12 (6.8%) | 12 (4.3%) |
| $800 to $1,499 | 164 (93.2%) | 35 (12.5%) |
| Total | 176 (100.0%) | 281 (100.0%) |
Health & Disability in Fellsburg
Health Insurance Coverage by Age in Fellsburg
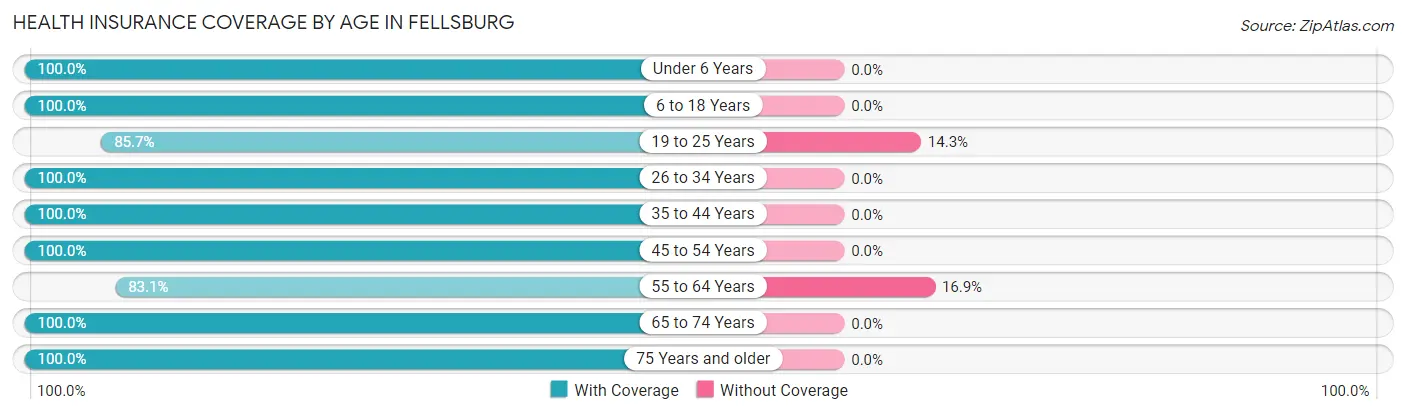
| Age Bracket | With Coverage | Without Coverage |
| Under 6 Years | 43 (100.0%) | 0 (0.0%) |
| 6 to 18 Years | 152 (100.0%) | 0 (0.0%) |
| 19 to 25 Years | 102 (85.7%) | 17 (14.3%) |
| 26 to 34 Years | 79 (100.0%) | 0 (0.0%) |
| 35 to 44 Years | 151 (100.0%) | 0 (0.0%) |
| 45 to 54 Years | 151 (100.0%) | 0 (0.0%) |
| 55 to 64 Years | 177 (83.1%) | 36 (16.9%) |
| 65 to 74 Years | 171 (100.0%) | 0 (0.0%) |
| 75 Years and older | 60 (100.0%) | 0 (0.0%) |
| Total | 1,086 (95.4%) | 53 (4.6%) |
Health Insurance Coverage by Citizenship Status in Fellsburg
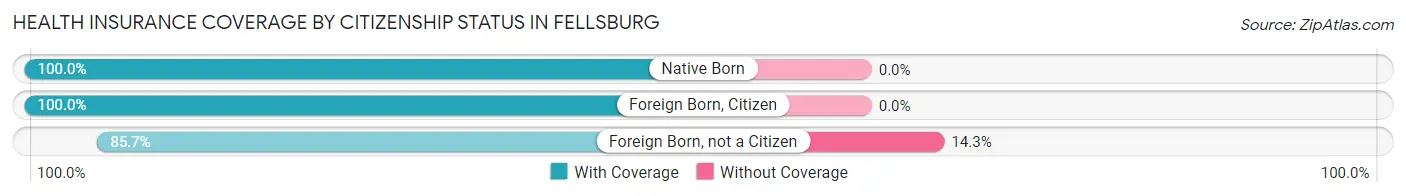
| Citizenship Status | With Coverage | Without Coverage |
| Native Born | 43 (100.0%) | 0 (0.0%) |
| Foreign Born, Citizen | 152 (100.0%) | 0 (0.0%) |
| Foreign Born, not a Citizen | 102 (85.7%) | 17 (14.3%) |
Health Insurance Coverage by Household Income in Fellsburg
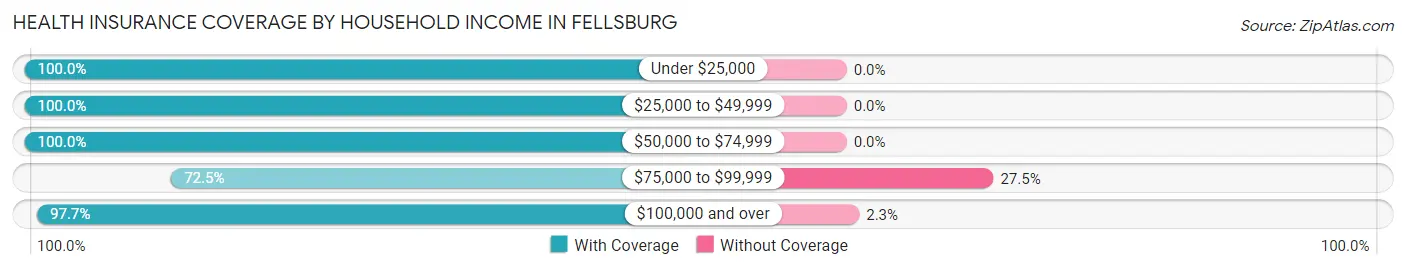
| Household Income | With Coverage | Without Coverage |
| Under $25,000 | 7 (100.0%) | 0 (0.0%) |
| $25,000 to $49,999 | 143 (100.0%) | 0 (0.0%) |
| $50,000 to $74,999 | 129 (100.0%) | 0 (0.0%) |
| $75,000 to $99,999 | 95 (72.5%) | 36 (27.5%) |
| $100,000 and over | 711 (97.7%) | 17 (2.3%) |
Public vs Private Health Insurance Coverage by Age in Fellsburg
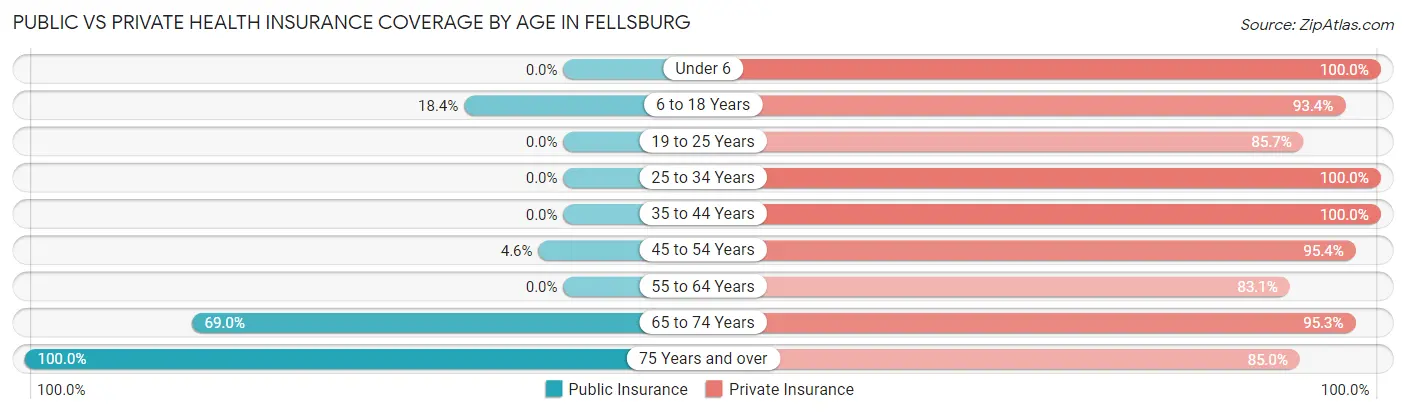
| Age Bracket | Public Insurance | Private Insurance |
| Under 6 | 0 (0.0%) | 43 (100.0%) |
| 6 to 18 Years | 28 (18.4%) | 142 (93.4%) |
| 19 to 25 Years | 0 (0.0%) | 102 (85.7%) |
| 25 to 34 Years | 0 (0.0%) | 79 (100.0%) |
| 35 to 44 Years | 0 (0.0%) | 151 (100.0%) |
| 45 to 54 Years | 7 (4.6%) | 144 (95.4%) |
| 55 to 64 Years | 0 (0.0%) | 177 (83.1%) |
| 65 to 74 Years | 118 (69.0%) | 163 (95.3%) |
| 75 Years and over | 60 (100.0%) | 51 (85.0%) |
| Total | 213 (18.7%) | 1,052 (92.4%) |
Disability Status by Sex by Age in Fellsburg
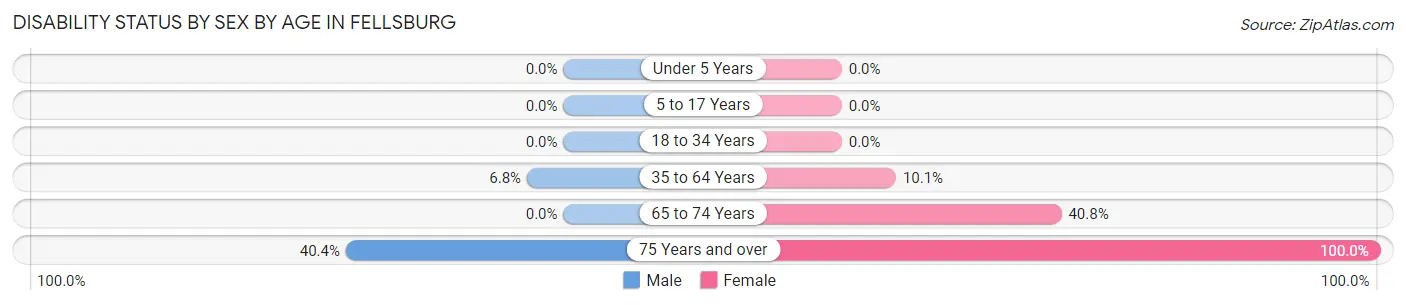
| Age Bracket | Male | Female |
| Under 5 Years | 0 (0.0%) | 0 (0.0%) |
| 5 to 17 Years | 0 (0.0%) | 0 (0.0%) |
| 18 to 34 Years | 0 (0.0%) | 0 (0.0%) |
| 35 to 64 Years | 20 (6.8%) | 22 (10.1%) |
| 65 to 74 Years | 0 (0.0%) | 42 (40.8%) |
| 75 Years and over | 21 (40.4%) | 8 (100.0%) |
Disability Class by Sex by Age in Fellsburg
Disability Class: Hearing Difficulty
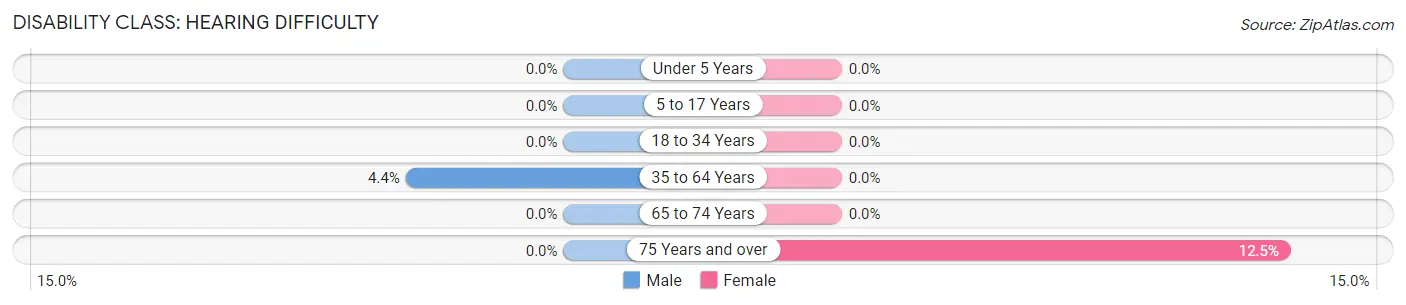
| Age Bracket | Male | Female |
| Under 5 Years | 0 (0.0%) | 0 (0.0%) |
| 5 to 17 Years | 0 (0.0%) | 0 (0.0%) |
| 18 to 34 Years | 0 (0.0%) | 0 (0.0%) |
| 35 to 64 Years | 13 (4.4%) | 0 (0.0%) |
| 65 to 74 Years | 0 (0.0%) | 0 (0.0%) |
| 75 Years and over | 0 (0.0%) | 1 (12.5%) |
Disability Class: Vision Difficulty
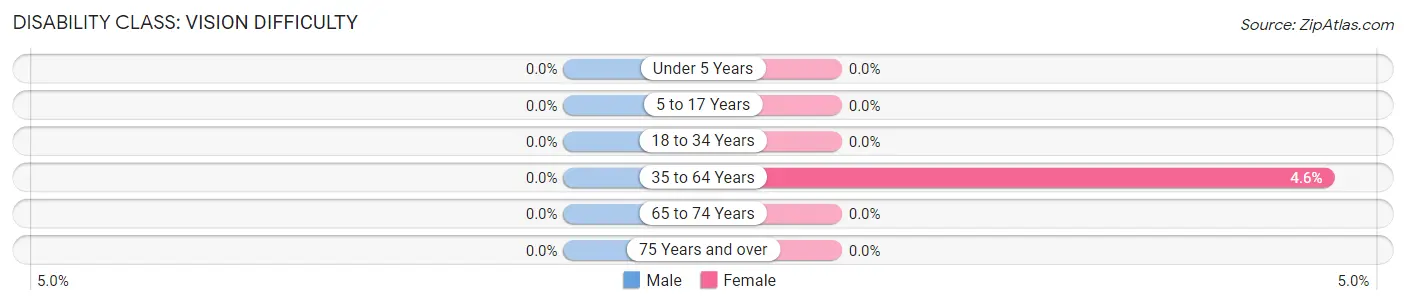
| Age Bracket | Male | Female |
| Under 5 Years | 0 (0.0%) | 0 (0.0%) |
| 5 to 17 Years | 0 (0.0%) | 0 (0.0%) |
| 18 to 34 Years | 0 (0.0%) | 0 (0.0%) |
| 35 to 64 Years | 0 (0.0%) | 10 (4.6%) |
| 65 to 74 Years | 0 (0.0%) | 0 (0.0%) |
| 75 Years and over | 0 (0.0%) | 0 (0.0%) |
Disability Class: Cognitive Difficulty
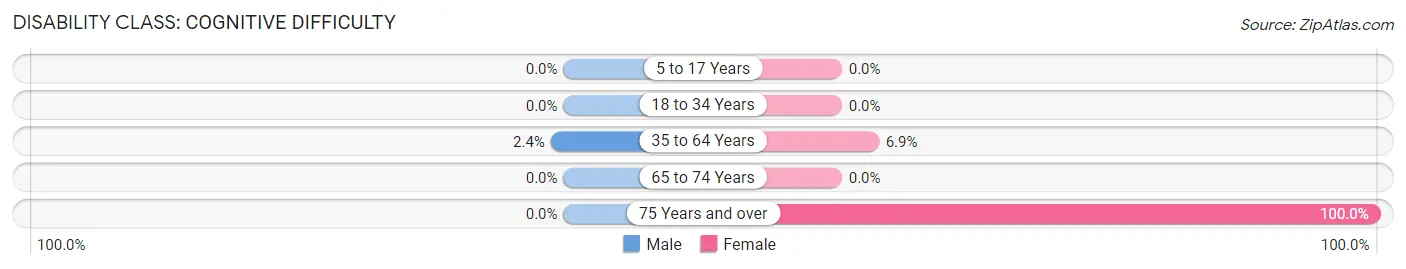
| Age Bracket | Male | Female |
| 5 to 17 Years | 0 (0.0%) | 0 (0.0%) |
| 18 to 34 Years | 0 (0.0%) | 0 (0.0%) |
| 35 to 64 Years | 7 (2.4%) | 15 (6.9%) |
| 65 to 74 Years | 0 (0.0%) | 0 (0.0%) |
| 75 Years and over | 0 (0.0%) | 8 (100.0%) |
Disability Class: Ambulatory Difficulty
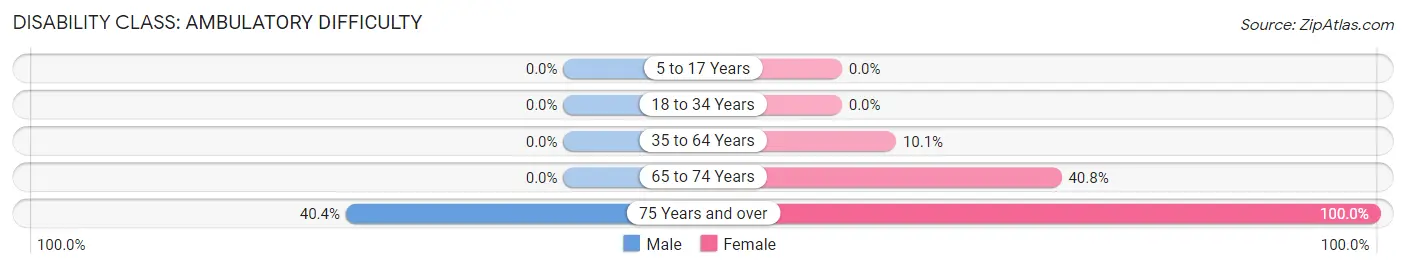
| Age Bracket | Male | Female |
| 5 to 17 Years | 0 (0.0%) | 0 (0.0%) |
| 18 to 34 Years | 0 (0.0%) | 0 (0.0%) |
| 35 to 64 Years | 0 (0.0%) | 22 (10.1%) |
| 65 to 74 Years | 0 (0.0%) | 42 (40.8%) |
| 75 Years and over | 21 (40.4%) | 8 (100.0%) |
Disability Class: Self-Care Difficulty
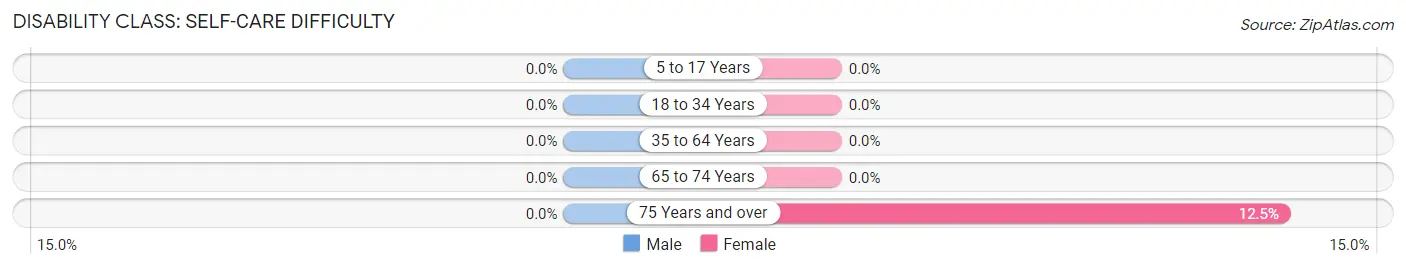
| Age Bracket | Male | Female |
| 5 to 17 Years | 0 (0.0%) | 0 (0.0%) |
| 18 to 34 Years | 0 (0.0%) | 0 (0.0%) |
| 35 to 64 Years | 0 (0.0%) | 0 (0.0%) |
| 65 to 74 Years | 0 (0.0%) | 0 (0.0%) |
| 75 Years and over | 0 (0.0%) | 1 (12.5%) |
Technology Access in Fellsburg
Computing Device Access in Fellsburg
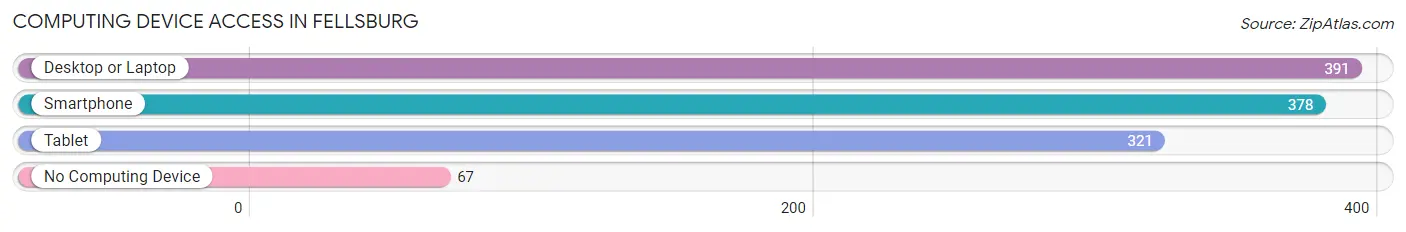
| Device Type | # Households | % Households |
| Desktop or Laptop | 391 | 82.3% |
| Smartphone | 378 | 79.6% |
| Tablet | 321 | 67.6% |
| No Computing Device | 67 | 14.1% |
| Total | 475 | 100.0% |
Internet Access in Fellsburg
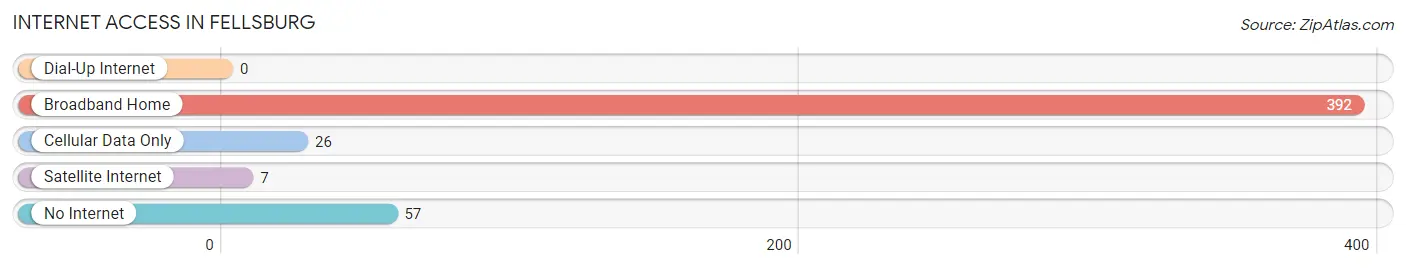
| Internet Type | # Households | % Households |
| Dial-Up Internet | 0 | 0.0% |
| Broadband Home | 392 | 82.5% |
| Cellular Data Only | 26 | 5.5% |
| Satellite Internet | 7 | 1.5% |
| No Internet | 57 | 12.0% |
| Total | 475 | 100.0% |
Fellsburg Summary
Fellsburg is a small borough located in Westmoreland County, Pennsylvania. It is situated in the foothills of the Allegheny Mountains, approximately 30 miles southeast of Pittsburgh. The population of Fellsburg was 1,093 at the 2010 census.
History
Fellsburg was founded in 1817 by John Fell, a Revolutionary War veteran. The town was originally known as Fell’s Crossroads, and was later renamed Fellsburg. The town was incorporated in 1845.
Fellsburg was a small farming community until the late 19th century, when the coal industry began to boom in the area. The town was home to several coal mines, and the population grew rapidly. By the early 20th century, Fellsburg was a bustling coal mining town.
Geography
Fellsburg is located at 40°19'45"N 79°37'45"W (40.329167, -79.629167). According to the United States Census Bureau, the borough has a total area of 0.6 square miles (1.6 km2), all of it land.
The borough is located in the foothills of the Allegheny Mountains, and is surrounded by rolling hills and forests. The Youghiogheny River flows through the town, and is a popular destination for fishing and boating.
Economy
Fellsburg’s economy is largely based on agriculture and tourism. The town is home to several small farms, and the surrounding area is known for its produce. The town also attracts tourists who come to enjoy the natural beauty of the area.
The town is also home to several small businesses, including a grocery store, a hardware store, and a few restaurants.
Demographics
As of the 2010 census, there were 1,093 people, 441 households, and 294 families residing in the borough. The population density was 1,817.3 people per square mile (700.3/km2). There were 471 housing units at an average density of 781.7 per square mile (301.7/km2). The racial makeup of the borough was 97.7% White, 0.7% African American, 0.2% Native American, 0.2% Asian, 0.2% from other races, and 1.1% from two or more races. Hispanic or Latino of any race were 0.7% of the population.
There were 441 households, out of which 28.2% had children under the age of 18 living with them, 48.2% were married couples living together, 12.7% had a female householder with no husband present, and 33.2% were non-families. 28.2% of all households were made up of individuals, and 14.3% had someone living alone who was 65 years of age or older. The average household size was 2.47 and the average family size was 3.02.
In the borough, the population was spread out, with 24.2% under the age of 18, 7.2% from 18 to 24, 27.2% from 25 to 44, 24.2% from 45 to 64, and 17.2% who were 65 years of age or older. The median age was 39 years. For every 100 females, there were 94.2 males. For every 100 females age 18 and over, there were 91.2 males.
The median income for a household in the borough was $31,250, and the median income for a family was $37,500. Males had a median income of $30,000 versus $21,250 for females. The per capita income for the borough was $15,945. About 8.2% of families and 10.2% of the population were below the poverty line, including 14.3% of those under age 18 and 8.3% of those age 65 or over.
Common Questions
What is Per Capita Income in Fellsburg?
Per Capita income in Fellsburg is $43,911.
What is the Median Family Income in Fellsburg?
Median Family Income in Fellsburg is $103,259.
What is the Median Household income in Fellsburg?
Median Household Income in Fellsburg is $86,840.
What is Inequality or Gini Index in Fellsburg?
Inequality or Gini Index in Fellsburg is 0.34.
What is the Total Population of Fellsburg?
Total Population of Fellsburg is 1,139.
What is the Total Male Population of Fellsburg?
Total Male Population of Fellsburg is 586.
What is the Total Female Population of Fellsburg?
Total Female Population of Fellsburg is 553.
What is the Ratio of Males per 100 Females in Fellsburg?
There are 105.97 Males per 100 Females in Fellsburg.
What is the Ratio of Females per 100 Males in Fellsburg?
There are 94.37 Females per 100 Males in Fellsburg.
What is the Median Population Age in Fellsburg?
Median Population Age in Fellsburg is 46.5 Years.
What is the Average Family Size in Fellsburg
Average Family Size in Fellsburg is 3.0 People.
What is the Average Household Size in Fellsburg
Average Household Size in Fellsburg is 2.4 People.
How Large is the Labor Force in Fellsburg?
There are 610 People in the Labor Forcein in Fellsburg.
What is the Percentage of People in the Labor Force in Fellsburg?
59.9% of People are in the Labor Force in Fellsburg.
What is the Unemployment Rate in Fellsburg?
Unemployment Rate in Fellsburg is 4.4%.