Union City borough, PA Map & Demographics
Union City borough Overview
$25,176
PER CAPITA INCOME
$54,554
AVG FAMILY INCOME
$41,764
AVG HOUSEHOLD INCOME
43.6%
WAGE / INCOME GAP [ % ]
56.4¢/ $1
WAGE / INCOME GAP [ $ ]
$7,356
FAMILY INCOME DEFICIT
0.46
INEQUALITY / GINI INDEX
2,937
TOTAL POPULATION
1,207
MALE POPULATION
1,730
FEMALE POPULATION
69.77
MALES / 100 FEMALES
143.33
FEMALES / 100 MALES
46.6
MEDIAN AGE
2.8
AVG FAMILY SIZE
2.2
AVG HOUSEHOLD SIZE
1,222
LABOR FORCE [ PEOPLE ]
48.6%
PERCENT IN LABOR FORCE
7.5%
UNEMPLOYMENT RATE
Income in Union City borough
Income Overview in Union City borough
Per Capita Income in Union City borough is $25,176, while median incomes of families and households are $54,554 and $41,764 respectively.
| Characteristic | Number | Measure |
| Per Capita Income | 2,937 | $25,176 |
| Median Family Income | 731 | $54,554 |
| Mean Family Income | 731 | $73,310 |
| Median Household Income | 1,357 | $41,764 |
| Mean Household Income | 1,357 | $55,419 |
| Income Deficit | 731 | $7,356 |
| Wage / Income Gap (%) | 2,937 | 43.56% |
| Wage / Income Gap ($) | 2,937 | 56.44¢ per $1 |
| Gini / Inequality Index | 2,937 | 0.46 |
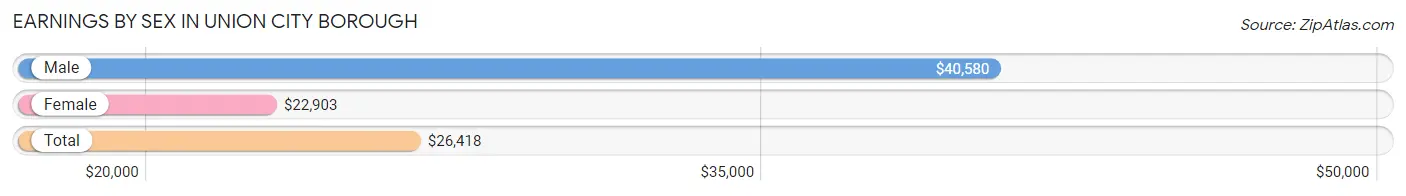
Earnings by Sex in Union City borough
Average Earnings in Union City borough are $26,418, $40,580 for men and $22,903 for women, a difference of 43.6%.
| Sex | Number | Average Earnings |
| Male | 598 (48.0%) | $40,580 |
| Female | 647 (52.0%) | $22,903 |
| Total | 1,245 (100.0%) | $26,418 |
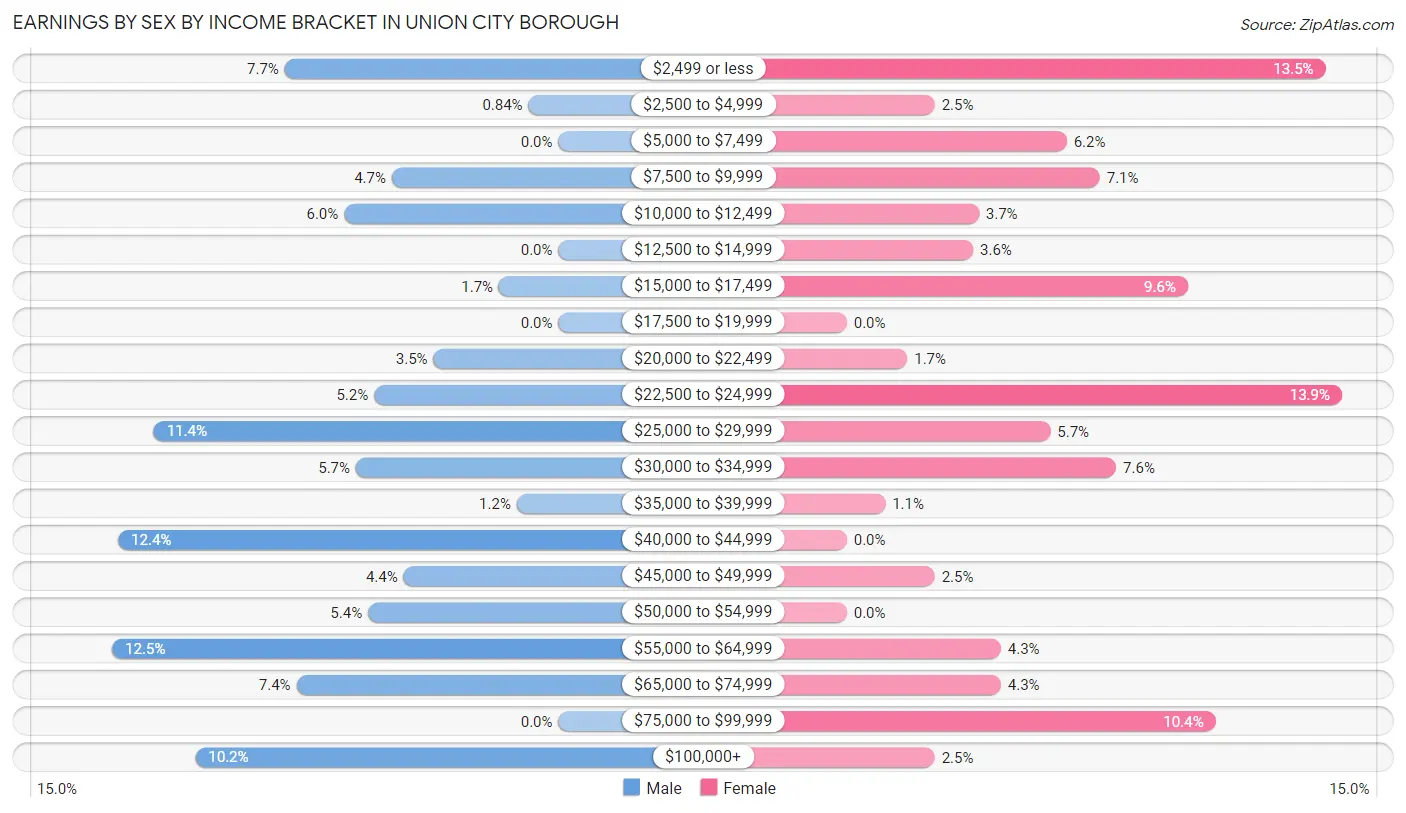
Earnings by Sex by Income Bracket in Union City borough
The most common earnings brackets in Union City borough are $55,000 to $64,999 for men (75 | 12.5%) and $22,500 to $24,999 for women (90 | 13.9%).
| Income | Male | Female |
| $2,499 or less | 46 (7.7%) | 87 (13.5%) |
| $2,500 to $4,999 | 5 (0.8%) | 16 (2.5%) |
| $5,000 to $7,499 | 0 (0.0%) | 40 (6.2%) |
| $7,500 to $9,999 | 28 (4.7%) | 46 (7.1%) |
| $10,000 to $12,499 | 36 (6.0%) | 24 (3.7%) |
| $12,500 to $14,999 | 0 (0.0%) | 23 (3.5%) |
| $15,000 to $17,499 | 10 (1.7%) | 62 (9.6%) |
| $17,500 to $19,999 | 0 (0.0%) | 0 (0.0%) |
| $20,000 to $22,499 | 21 (3.5%) | 11 (1.7%) |
| $22,500 to $24,999 | 31 (5.2%) | 90 (13.9%) |
| $25,000 to $29,999 | 68 (11.4%) | 37 (5.7%) |
| $30,000 to $34,999 | 34 (5.7%) | 49 (7.6%) |
| $35,000 to $39,999 | 7 (1.2%) | 7 (1.1%) |
| $40,000 to $44,999 | 74 (12.4%) | 0 (0.0%) |
| $45,000 to $49,999 | 26 (4.3%) | 16 (2.5%) |
| $50,000 to $54,999 | 32 (5.3%) | 0 (0.0%) |
| $55,000 to $64,999 | 75 (12.5%) | 28 (4.3%) |
| $65,000 to $74,999 | 44 (7.4%) | 28 (4.3%) |
| $75,000 to $99,999 | 0 (0.0%) | 67 (10.4%) |
| $100,000+ | 61 (10.2%) | 16 (2.5%) |
| Total | 598 (100.0%) | 647 (100.0%) |
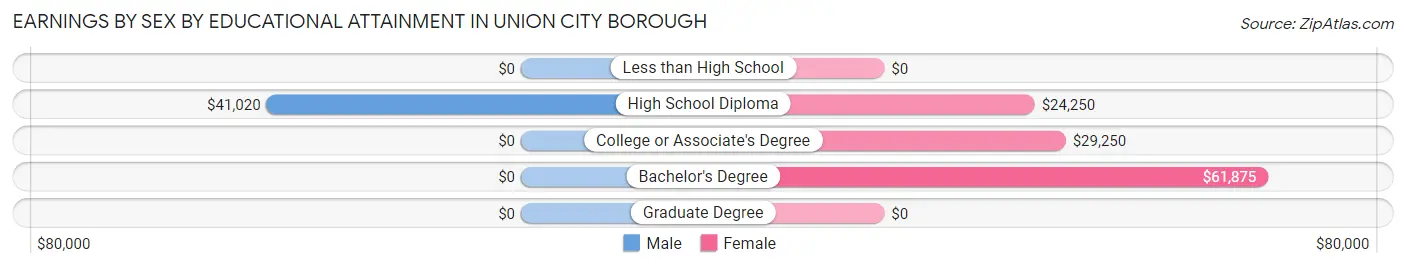
Earnings by Sex by Educational Attainment in Union City borough
Average earnings in Union City borough are $41,862 for men and $25,139 for women, a difference of 40.0%. Men with an educational attainment of high school diploma enjoy the highest average annual earnings of $41,020, while those with high school diploma education earn the least with $41,020. Women with an educational attainment of bachelor's degree earn the most with the average annual earnings of $61,875, while those with high school diploma education have the smallest earnings of $24,250.
| Educational Attainment | Male Income | Female Income |
| Less than High School | - | - |
| High School Diploma | $41,020 | $24,250 |
| College or Associate's Degree | - | - |
| Bachelor's Degree | - | - |
| Graduate Degree | - | - |
| Total | $41,862 | $25,139 |
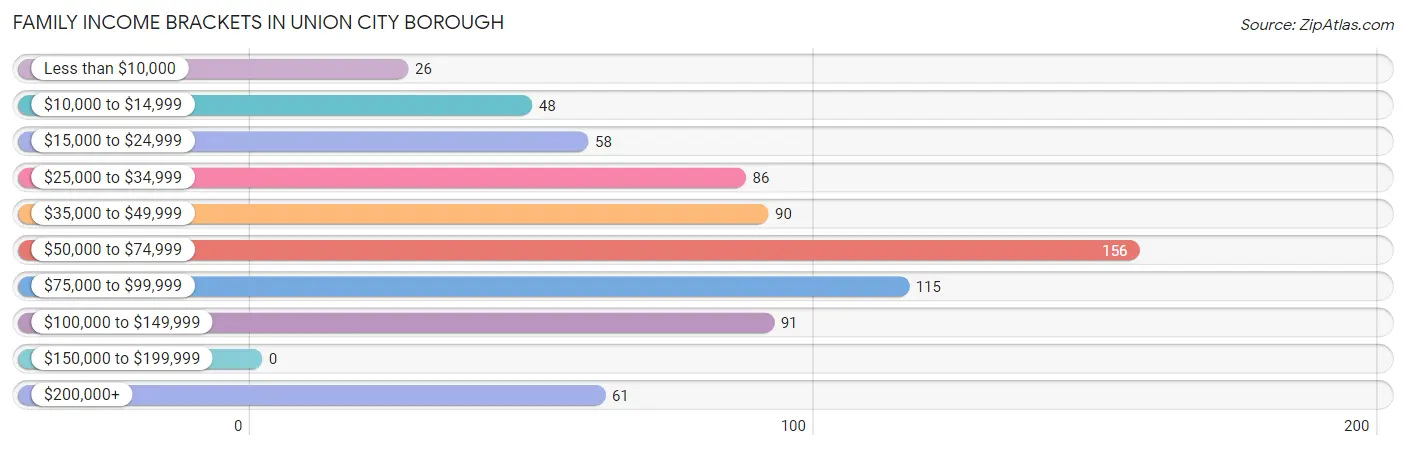
Family Income in Union City borough
Family Income Brackets in Union City borough
According to the Union City borough family income data, there are 156 families falling into the $50,000 to $74,999 income range, which is the most common income bracket and makes up 21.3% of all families.
| Income Bracket | # Families | % Families |
| Less than $10,000 | 26 | 3.6% |
| $10,000 to $14,999 | 48 | 6.6% |
| $15,000 to $24,999 | 58 | 7.9% |
| $25,000 to $34,999 | 86 | 11.8% |
| $35,000 to $49,999 | 90 | 12.3% |
| $50,000 to $74,999 | 156 | 21.3% |
| $75,000 to $99,999 | 115 | 15.7% |
| $100,000 to $149,999 | 91 | 12.4% |
| $150,000 to $199,999 | 0 | 0.0% |
| $200,000+ | 61 | 8.3% |
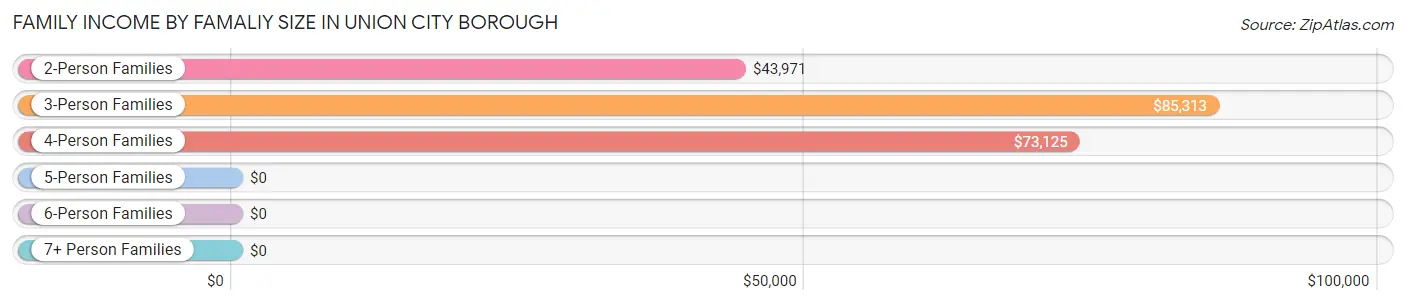
Family Income by Famaliy Size in Union City borough
3-person families (137 | 18.7%) account for the highest median family income in Union City borough with $85,313 per family, while 3-person families (137 | 18.7%) have the highest median income of $28,438 per family member.
| Income Bracket | # Families | Median Income |
| 2-Person Families | 412 (56.4%) | $43,971 |
| 3-Person Families | 137 (18.7%) | $85,313 |
| 4-Person Families | 113 (15.5%) | $73,125 |
| 5-Person Families | 33 (4.5%) | $0 |
| 6-Person Families | 36 (4.9%) | $0 |
| 7+ Person Families | 0 (0.0%) | $0 |
| Total | 731 (100.0%) | $54,554 |
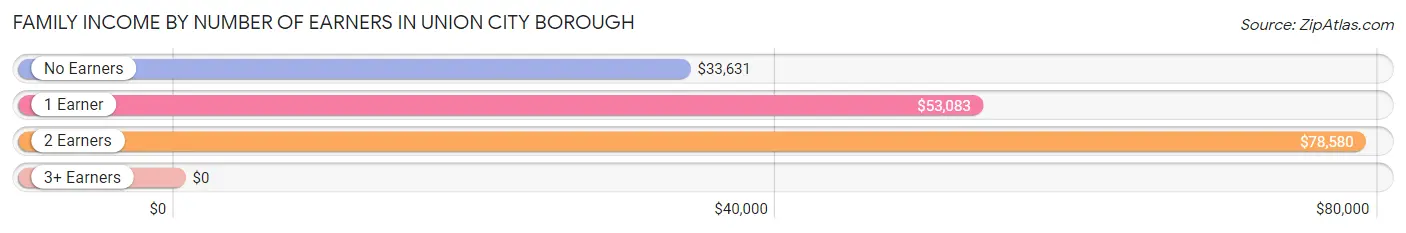
Family Income by Number of Earners in Union City borough
| Number of Earners | # Families | Median Income |
| No Earners | 193 (26.4%) | $33,631 |
| 1 Earner | 268 (36.7%) | $53,083 |
| 2 Earners | 233 (31.9%) | $78,580 |
| 3+ Earners | 37 (5.1%) | $0 |
| Total | 731 (100.0%) | $54,554 |
Household Income in Union City borough
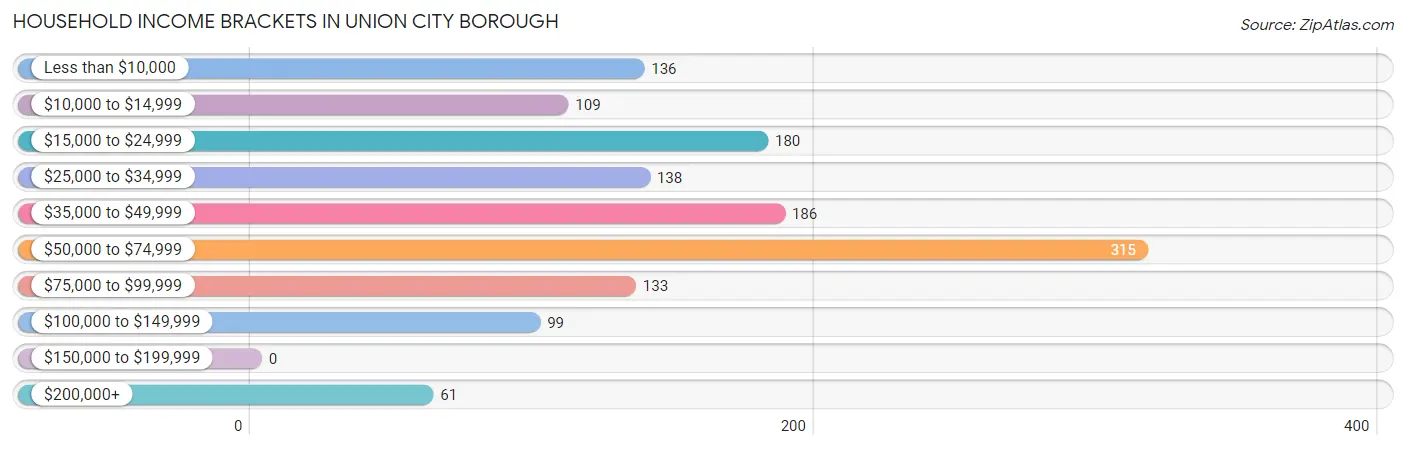
Household Income Brackets in Union City borough
With 315 households falling in the category, the $50,000 to $74,999 income range is the most frequent in Union City borough, accounting for 23.2% of all households.
| Income Bracket | # Households | % Households |
| Less than $10,000 | 136 | 10.0% |
| $10,000 to $14,999 | 109 | 8.0% |
| $15,000 to $24,999 | 180 | 13.3% |
| $25,000 to $34,999 | 138 | 10.2% |
| $35,000 to $49,999 | 186 | 13.7% |
| $50,000 to $74,999 | 315 | 23.2% |
| $75,000 to $99,999 | 133 | 9.8% |
| $100,000 to $149,999 | 99 | 7.3% |
| $150,000 to $199,999 | 0 | 0.0% |
| $200,000+ | 61 | 4.5% |
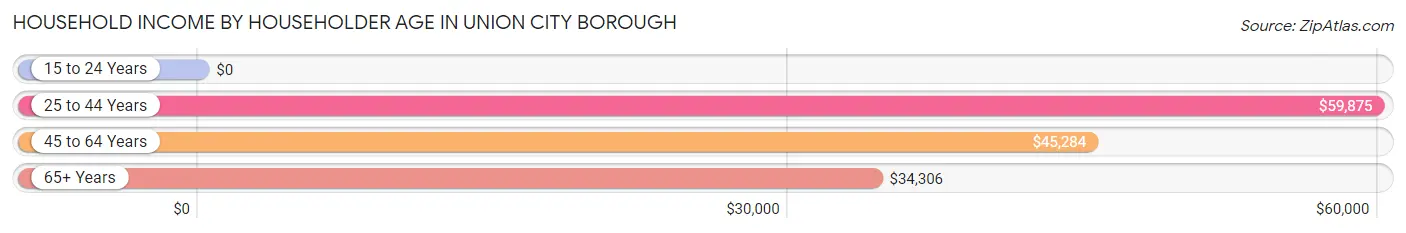
Household Income by Householder Age in Union City borough
The median household income in Union City borough is $41,764, with the highest median household income of $59,875 found in the 25 to 44 years age bracket for the primary householder. A total of 251 households (18.5%) fall into this category. Meanwhile, the 15 to 24 years age bracket for the primary householder has the lowest median household income of $0, with 66 households (4.9%) in this group.
| Income Bracket | # Households | Median Income |
| 15 to 24 Years | 66 (4.9%) | $0 |
| 25 to 44 Years | 251 (18.5%) | $59,875 |
| 45 to 64 Years | 503 (37.1%) | $45,284 |
| 65+ Years | 537 (39.6%) | $34,306 |
| Total | 1,357 (100.0%) | $41,764 |
Poverty in Union City borough
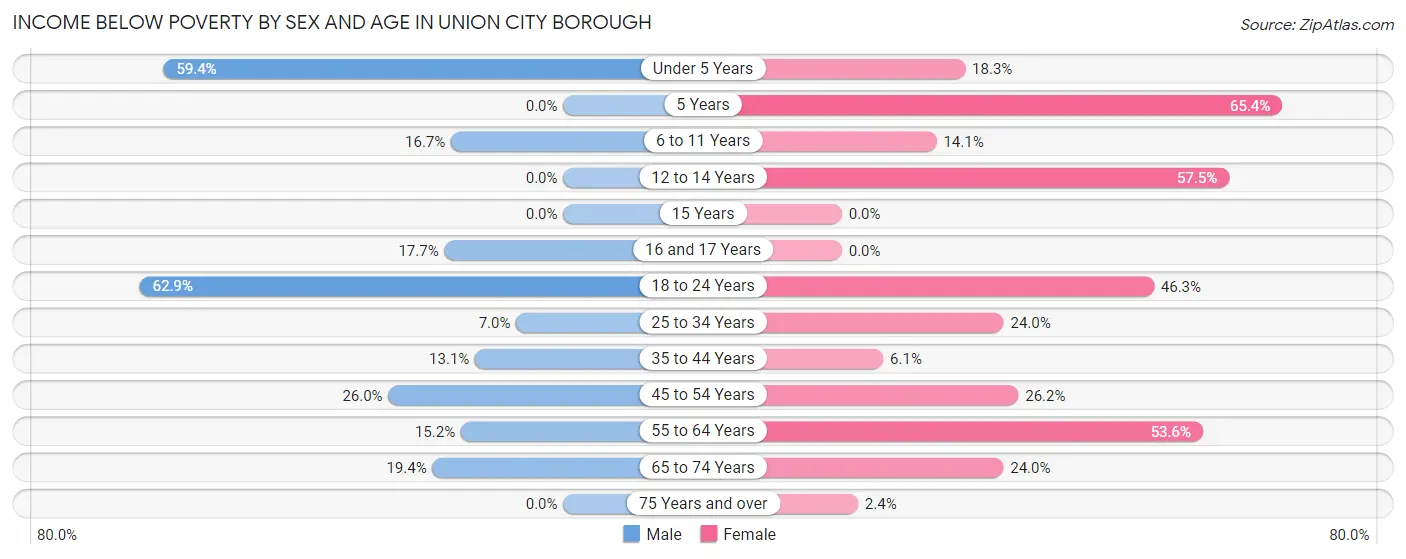
Income Below Poverty by Sex and Age in Union City borough
With 19.6% poverty level for males and 25.9% for females among the residents of Union City borough, 18 to 24 year old males and 5 year old females are the most vulnerable to poverty, with 56 males (62.9%) and 17 females (65.4%) in their respective age groups living below the poverty level.
| Age Bracket | Male | Female |
| Under 5 Years | 19 (59.4%) | 24 (18.3%) |
| 5 Years | 0 (0.0%) | 17 (65.4%) |
| 6 to 11 Years | 7 (16.7%) | 9 (14.1%) |
| 12 to 14 Years | 0 (0.0%) | 23 (57.5%) |
| 15 Years | 0 (0.0%) | 0 (0.0%) |
| 16 and 17 Years | 9 (17.6%) | 0 (0.0%) |
| 18 to 24 Years | 56 (62.9%) | 95 (46.3%) |
| 25 to 34 Years | 10 (7.0%) | 49 (24.0%) |
| 35 to 44 Years | 11 (13.1%) | 7 (6.1%) |
| 45 to 54 Years | 67 (26.0%) | 54 (26.2%) |
| 55 to 64 Years | 19 (15.2%) | 112 (53.6%) |
| 65 to 74 Years | 34 (19.4%) | 53 (24.0%) |
| 75 Years and over | 0 (0.0%) | 5 (2.4%) |
| Total | 232 (19.6%) | 448 (25.9%) |
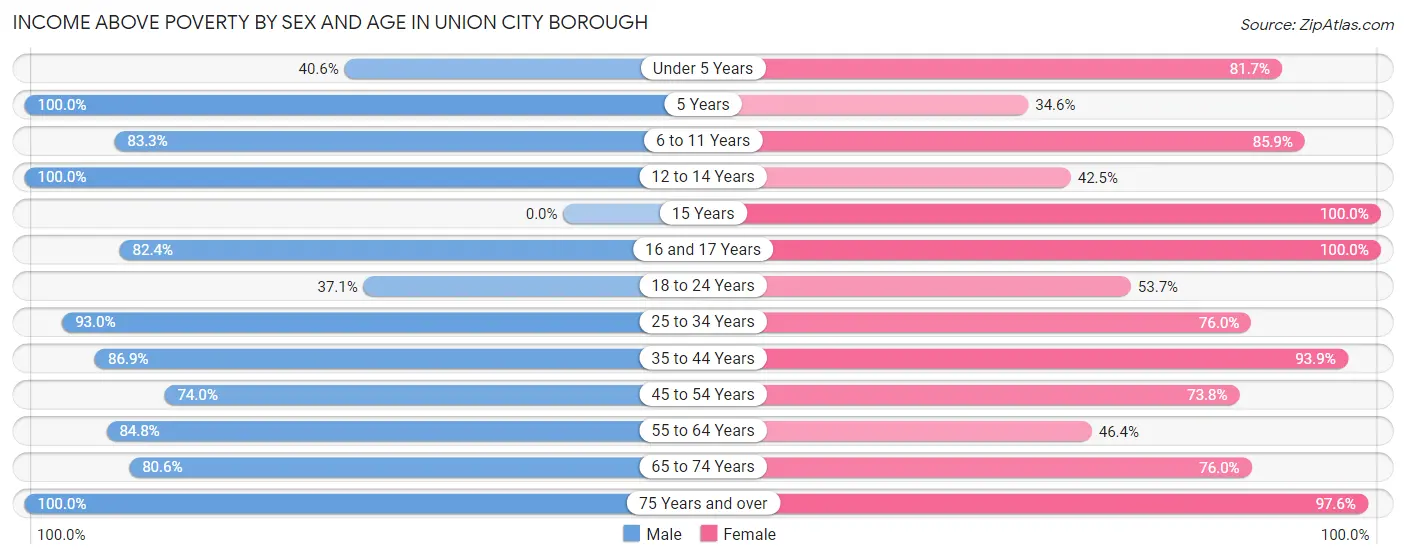
Income Above Poverty by Sex and Age in Union City borough
According to the poverty statistics in Union City borough, males aged 5 years and females aged 15 years are the age groups that are most secure financially, with 100.0% of males and 100.0% of females in these age groups living above the poverty line.
| Age Bracket | Male | Female |
| Under 5 Years | 13 (40.6%) | 107 (81.7%) |
| 5 Years | 16 (100.0%) | 9 (34.6%) |
| 6 to 11 Years | 35 (83.3%) | 55 (85.9%) |
| 12 to 14 Years | 18 (100.0%) | 17 (42.5%) |
| 15 Years | 0 (0.0%) | 31 (100.0%) |
| 16 and 17 Years | 42 (82.4%) | 70 (100.0%) |
| 18 to 24 Years | 33 (37.1%) | 110 (53.7%) |
| 25 to 34 Years | 133 (93.0%) | 155 (76.0%) |
| 35 to 44 Years | 73 (86.9%) | 107 (93.9%) |
| 45 to 54 Years | 191 (74.0%) | 152 (73.8%) |
| 55 to 64 Years | 106 (84.8%) | 97 (46.4%) |
| 65 to 74 Years | 141 (80.6%) | 168 (76.0%) |
| 75 Years and over | 151 (100.0%) | 204 (97.6%) |
| Total | 952 (80.4%) | 1,282 (74.1%) |
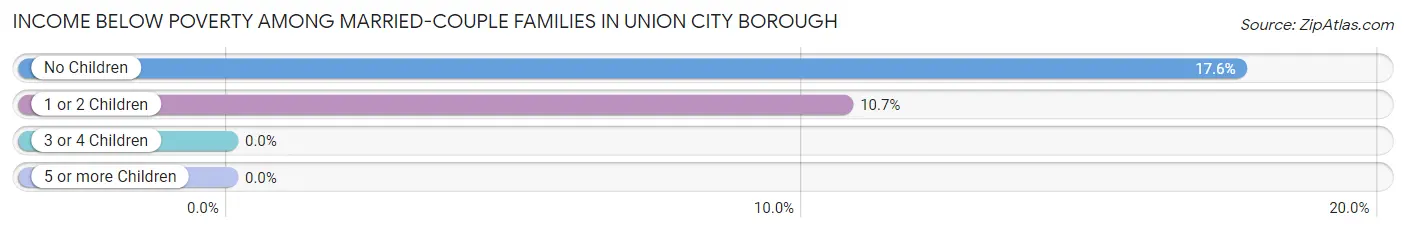
Income Below Poverty Among Married-Couple Families in Union City borough
The poverty statistics for married-couple families in Union City borough show that 13.9% or 76 of the total 545 families live below the poverty line. Families with no children have the highest poverty rate of 17.6%, comprising of 55 families. On the other hand, families with 3 or 4 children have the lowest poverty rate of 0.0%, which includes 0 families.
| Children | Above Poverty | Below Poverty |
| No Children | 258 (82.4%) | 55 (17.6%) |
| 1 or 2 Children | 175 (89.3%) | 21 (10.7%) |
| 3 or 4 Children | 36 (100.0%) | 0 (0.0%) |
| 5 or more Children | 0 (0.0%) | 0 (0.0%) |
| Total | 469 (86.1%) | 76 (13.9%) |
Income Below Poverty Among Single-Parent Households in Union City borough
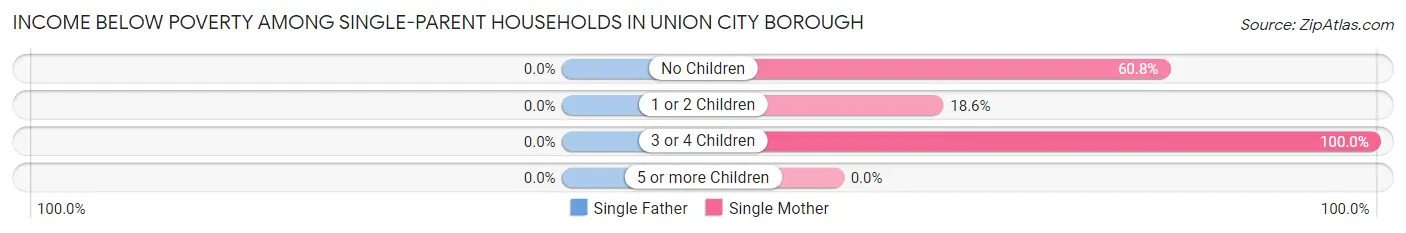
| Children | Single Father | Single Mother |
| No Children | 0 (0.0%) | 45 (60.8%) |
| 1 or 2 Children | 0 (0.0%) | 13 (18.6%) |
| 3 or 4 Children | 0 (0.0%) | 19 (100.0%) |
| 5 or more Children | 0 (0.0%) | 0 (0.0%) |
| Total | 0 (0.0%) | 77 (47.2%) |
Income Below Poverty Among Married-Couple vs Single-Parent Households in Union City borough
The poverty data for Union City borough shows that 76 of the married-couple family households (13.9%) and 77 of the single-parent households (41.4%) are living below the poverty level. Within the married-couple family households, those with no children have the highest poverty rate, with 55 households (17.6%) falling below the poverty line. Among the single-parent households, those with 3 or 4 children have the highest poverty rate, with 19 household (100.0%) living below poverty.
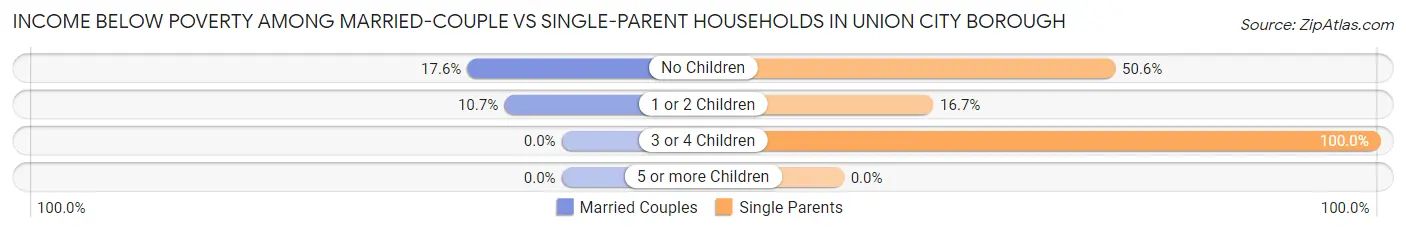
| Children | Married-Couple Families | Single-Parent Households |
| No Children | 55 (17.6%) | 45 (50.6%) |
| 1 or 2 Children | 21 (10.7%) | 13 (16.7%) |
| 3 or 4 Children | 0 (0.0%) | 19 (100.0%) |
| 5 or more Children | 0 (0.0%) | 0 (0.0%) |
| Total | 76 (13.9%) | 77 (41.4%) |
Race in Union City borough
The most populous races in Union City borough are White / Caucasian (2,766 | 94.2%), Two or more Races (137 | 4.7%), and Hispanic or Latino (106 | 3.6%).
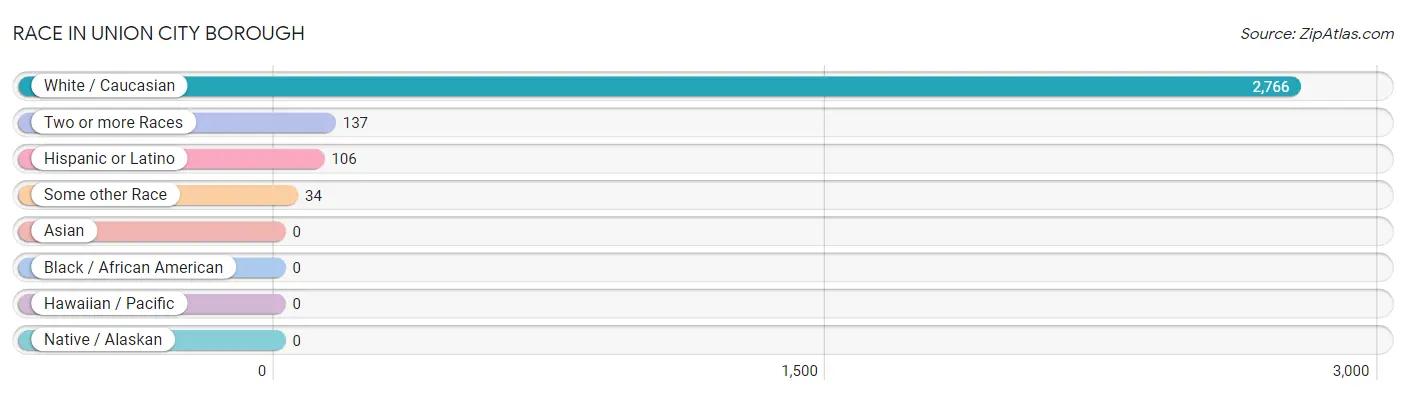
| Race | # Population | % Population |
| Asian | 0 | 0.0% |
| Black / African American | 0 | 0.0% |
| Hawaiian / Pacific | 0 | 0.0% |
| Hispanic or Latino | 106 | 3.6% |
| Native / Alaskan | 0 | 0.0% |
| White / Caucasian | 2,766 | 94.2% |
| Two or more Races | 137 | 4.7% |
| Some other Race | 34 | 1.2% |
| Total | 2,937 | 100.0% |
Ancestry in Union City borough
The most populous ancestries reported in Union City borough are English (363 | 12.4%), German (359 | 12.2%), Polish (224 | 7.6%), Irish (218 | 7.4%), and American (151 | 5.1%), together accounting for 44.8% of all Union City borough residents.
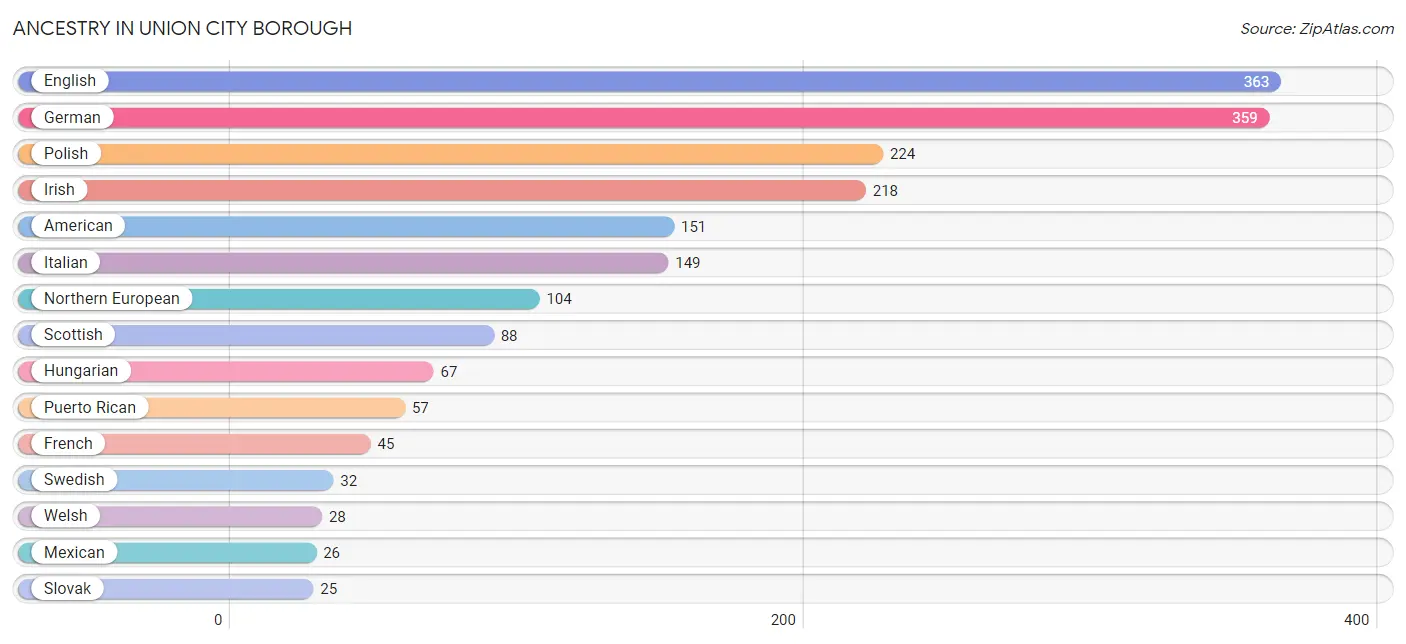
| Ancestry | # Population | % Population |
| African | 15 | 0.5% |
| American | 151 | 5.1% |
| Cherokee | 6 | 0.2% |
| Croatian | 9 | 0.3% |
| Czech | 13 | 0.4% |
| Dutch | 15 | 0.5% |
| English | 363 | 12.4% |
| French | 45 | 1.5% |
| German | 359 | 12.2% |
| Hungarian | 67 | 2.3% |
| Irish | 218 | 7.4% |
| Italian | 149 | 5.1% |
| Mexican | 26 | 0.9% |
| Northern European | 104 | 3.5% |
| Polish | 224 | 7.6% |
| Puerto Rican | 57 | 1.9% |
| Russian | 13 | 0.4% |
| Scottish | 88 | 3.0% |
| Slovak | 25 | 0.9% |
| Subsaharan African | 15 | 0.5% |
| Swedish | 32 | 1.1% |
| Ukrainian | 10 | 0.3% |
| Welsh | 28 | 0.9% | View All 23 Rows |
Immigrants in Union City borough

| Immigration Origin | # Population | % Population | View All 0 Rows |
Sex and Age in Union City borough
Sex and Age in Union City borough
The most populous age groups in Union City borough are 45 to 49 Years (153 | 12.7%) for men and 20 to 24 Years (170 | 9.8%) for women.
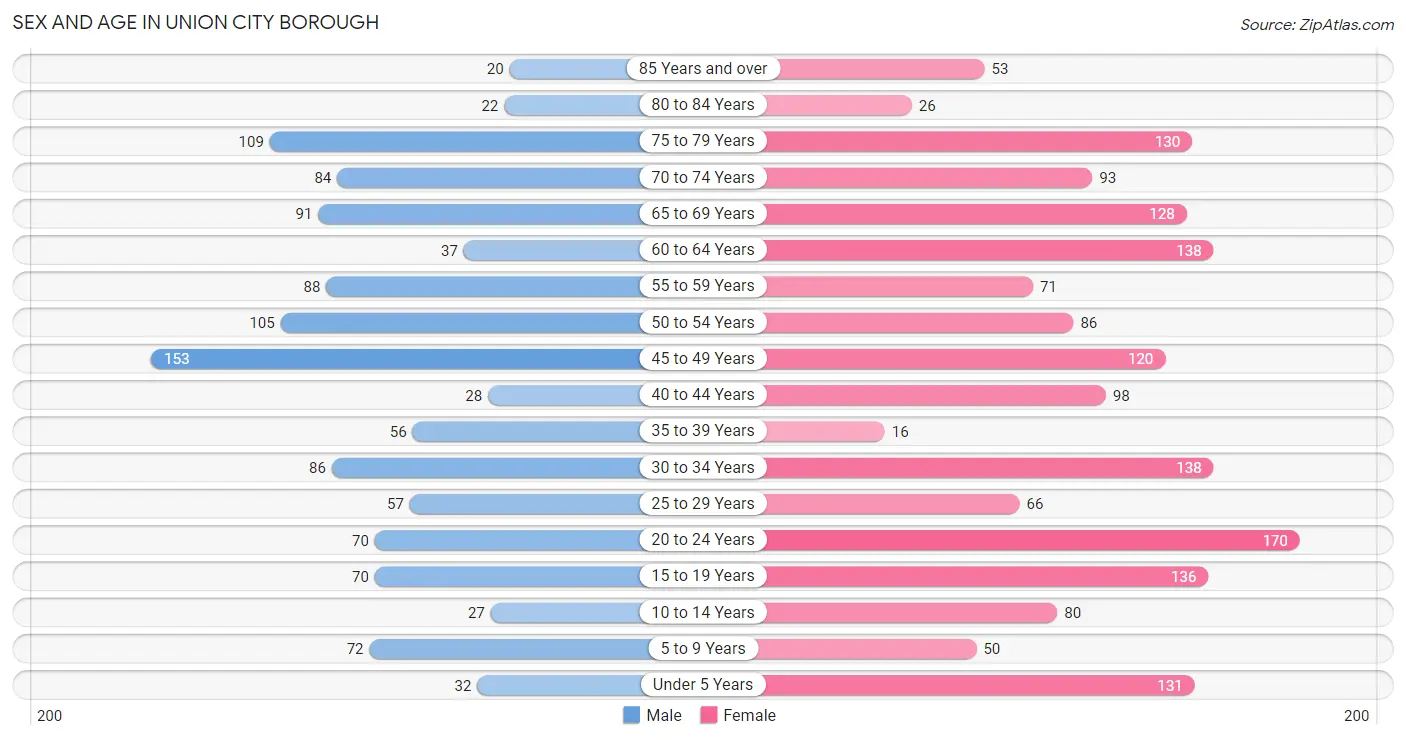
| Age Bracket | Male | Female |
| Under 5 Years | 32 (2.6%) | 131 (7.6%) |
| 5 to 9 Years | 72 (6.0%) | 50 (2.9%) |
| 10 to 14 Years | 27 (2.2%) | 80 (4.6%) |
| 15 to 19 Years | 70 (5.8%) | 136 (7.9%) |
| 20 to 24 Years | 70 (5.8%) | 170 (9.8%) |
| 25 to 29 Years | 57 (4.7%) | 66 (3.8%) |
| 30 to 34 Years | 86 (7.1%) | 138 (8.0%) |
| 35 to 39 Years | 56 (4.6%) | 16 (0.9%) |
| 40 to 44 Years | 28 (2.3%) | 98 (5.7%) |
| 45 to 49 Years | 153 (12.7%) | 120 (6.9%) |
| 50 to 54 Years | 105 (8.7%) | 86 (5.0%) |
| 55 to 59 Years | 88 (7.3%) | 71 (4.1%) |
| 60 to 64 Years | 37 (3.1%) | 138 (8.0%) |
| 65 to 69 Years | 91 (7.5%) | 128 (7.4%) |
| 70 to 74 Years | 84 (7.0%) | 93 (5.4%) |
| 75 to 79 Years | 109 (9.0%) | 130 (7.5%) |
| 80 to 84 Years | 22 (1.8%) | 26 (1.5%) |
| 85 Years and over | 20 (1.7%) | 53 (3.1%) |
| Total | 1,207 (100.0%) | 1,730 (100.0%) |
Families and Households in Union City borough
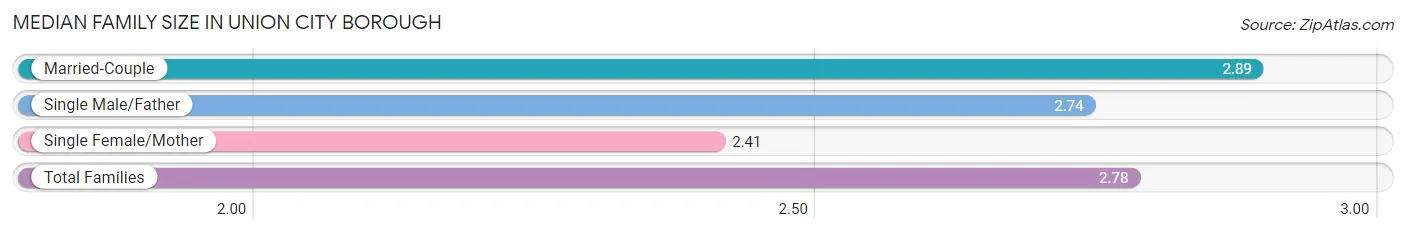
Median Family Size in Union City borough
The median family size in Union City borough is 2.78 persons per family, with married-couple families (545 | 74.6%) accounting for the largest median family size of 2.89 persons per family. On the other hand, single female/mother families (163 | 22.3%) represent the smallest median family size with 2.41 persons per family.
| Family Type | # Families | Family Size |
| Married-Couple | 545 (74.6%) | 2.89 |
| Single Male/Father | 23 (3.2%) | 2.74 |
| Single Female/Mother | 163 (22.3%) | 2.41 |
| Total Families | 731 (100.0%) | 2.78 |
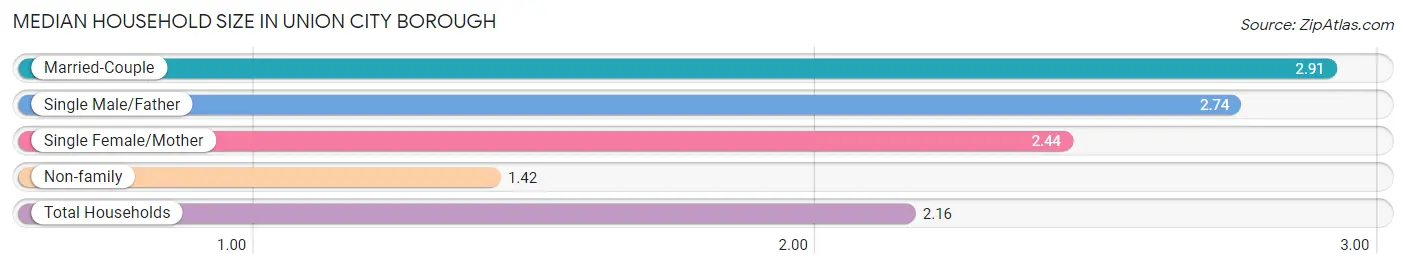
Median Household Size in Union City borough
The median household size in Union City borough is 2.16 persons per household, with married-couple households (545 | 40.2%) accounting for the largest median household size of 2.91 persons per household. non-family households (626 | 46.1%) represent the smallest median household size with 1.42 persons per household.
| Household Type | # Households | Household Size |
| Married-Couple | 545 (40.2%) | 2.91 |
| Single Male/Father | 23 (1.7%) | 2.74 |
| Single Female/Mother | 163 (12.0%) | 2.44 |
| Non-family | 626 (46.1%) | 1.42 |
| Total Households | 1,357 (100.0%) | 2.16 |
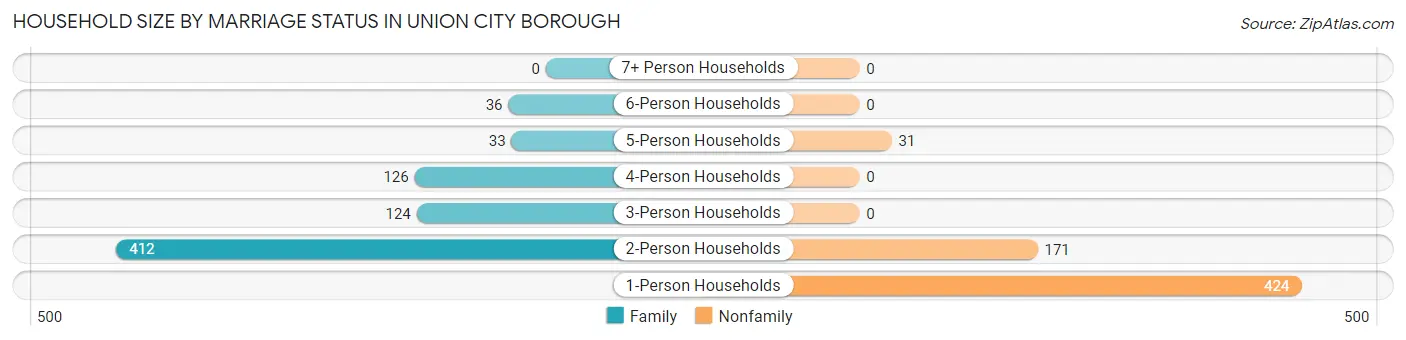
Household Size by Marriage Status in Union City borough
Out of a total of 1,357 households in Union City borough, 731 (53.9%) are family households, while 626 (46.1%) are nonfamily households. The most numerous type of family households are 2-person households, comprising 412, and the most common type of nonfamily households are 1-person households, comprising 424.
| Household Size | Family Households | Nonfamily Households |
| 1-Person Households | - | 424 (31.2%) |
| 2-Person Households | 412 (30.4%) | 171 (12.6%) |
| 3-Person Households | 124 (9.1%) | 0 (0.0%) |
| 4-Person Households | 126 (9.3%) | 0 (0.0%) |
| 5-Person Households | 33 (2.4%) | 31 (2.3%) |
| 6-Person Households | 36 (2.6%) | 0 (0.0%) |
| 7+ Person Households | 0 (0.0%) | 0 (0.0%) |
| Total | 731 (53.9%) | 626 (46.1%) |
Female Fertility in Union City borough
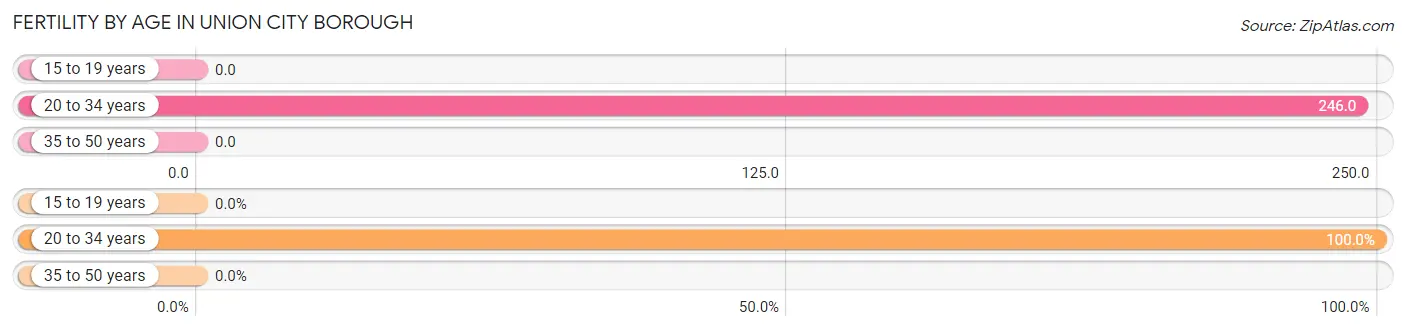
Fertility by Age in Union City borough
Average fertility rate in Union City borough is 123.0 births per 1,000 women. Women in the age bracket of 20 to 34 years have the highest fertility rate with 246.0 births per 1,000 women. Women in the age bracket of 20 to 34 years acount for 100.0% of all women with births.
| Age Bracket | Women with Births | Births / 1,000 Women |
| 15 to 19 years | 0 (0.0%) | 0.0 |
| 20 to 34 years | 92 (100.0%) | 246.0 |
| 35 to 50 years | 0 (0.0%) | 0.0 |
| Total | 92 (100.0%) | 123.0 |
Fertility by Age by Marriage Status in Union City borough
79.3% of women with births (92) in Union City borough are married. The highest percentage of unmarried women with births falls into 20 to 34 years age bracket with 20.6% of them unmarried at the time of birth, while the lowest percentage of unmarried women with births belong to 20 to 34 years age bracket with 20.7% of them unmarried.
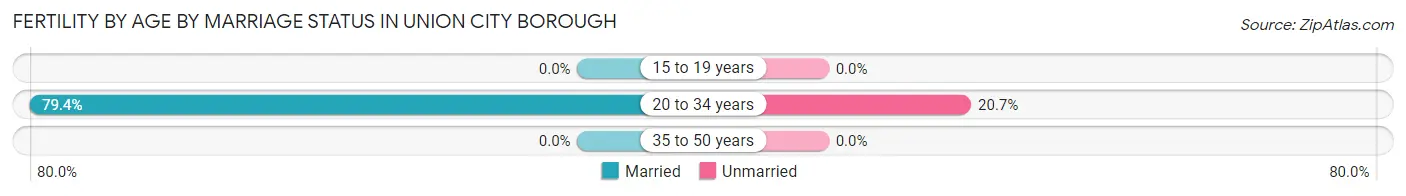
| Age Bracket | Married | Unmarried |
| 15 to 19 years | 0 (0.0%) | 0 (0.0%) |
| 20 to 34 years | 73 (79.3%) | 19 (20.6%) |
| 35 to 50 years | 0 (0.0%) | 0 (0.0%) |
| Total | 73 (79.3%) | 19 (20.6%) |
Fertility by Education in Union City borough
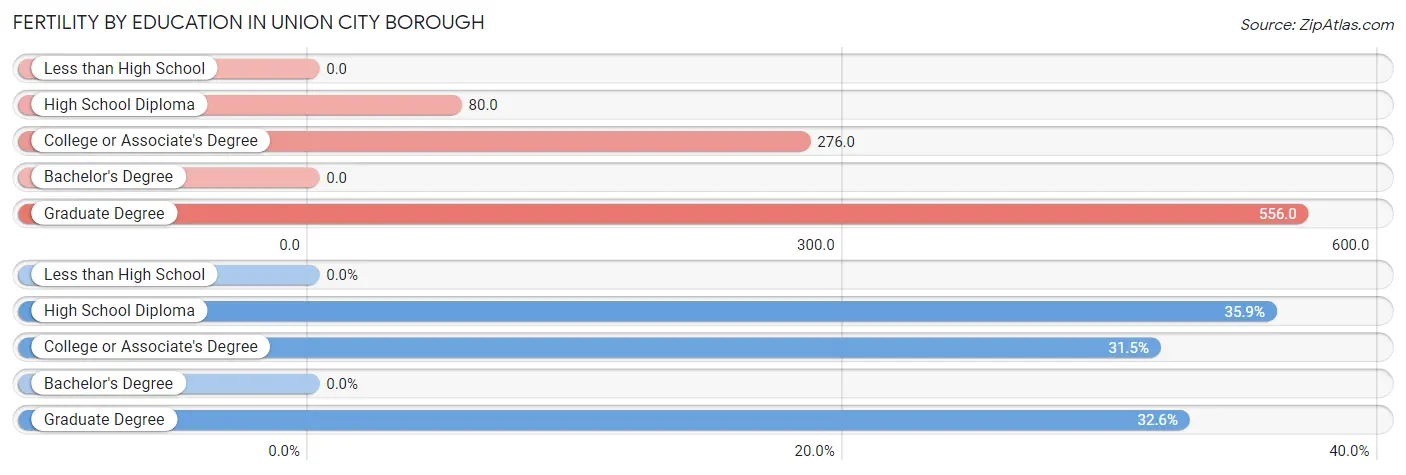
| Educational Attainment | Women with Births | Births / 1,000 Women |
| Less than High School | 0 (0.0%) | 0.0 |
| High School Diploma | 33 (35.9%) | 80.0 |
| College or Associate's Degree | 29 (31.5%) | 276.0 |
| Bachelor's Degree | 0 (0.0%) | 0.0 |
| Graduate Degree | 30 (32.6%) | 556.0 |
| Total | 92 (100.0%) | 123.0 |
Fertility by Education by Marriage Status in Union City borough
20.6% of women with births in Union City borough are unmarried. Women with the educational attainment of high school diploma are most likely to be married with 100.0% of them married at childbirth, while women with the educational attainment of college or associate's degree are least likely to be married with 65.5% of them unmarried at childbirth.
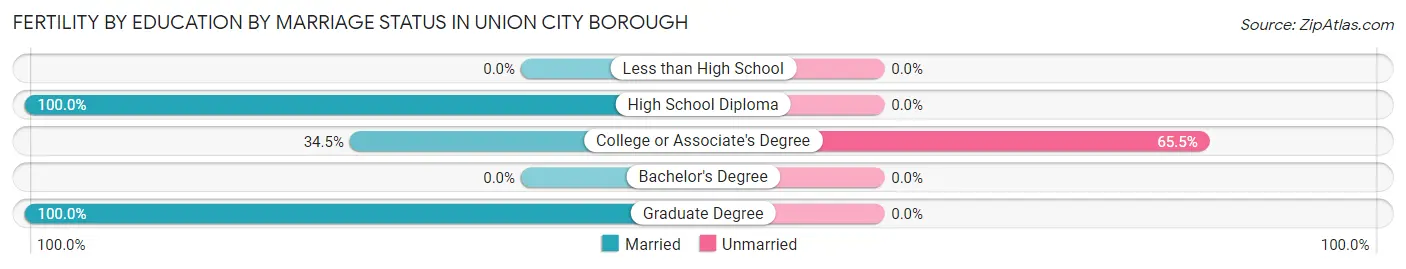
| Educational Attainment | Married | Unmarried |
| Less than High School | 0 (0.0%) | 0 (0.0%) |
| High School Diploma | 33 (100.0%) | 0 (0.0%) |
| College or Associate's Degree | 10 (34.5%) | 19 (65.5%) |
| Bachelor's Degree | 0 (0.0%) | 0 (0.0%) |
| Graduate Degree | 30 (100.0%) | 0 (0.0%) |
| Total | 73 (79.3%) | 19 (20.6%) |
Employment Characteristics in Union City borough
Employment by Class of Employer in Union City borough
Among the 1,129 employed individuals in Union City borough, private company employees (816 | 72.3%), not-for-profit organizations (197 | 17.4%), and self-employed (not incorporated) (75 | 6.6%) make up the most common classes of employment.
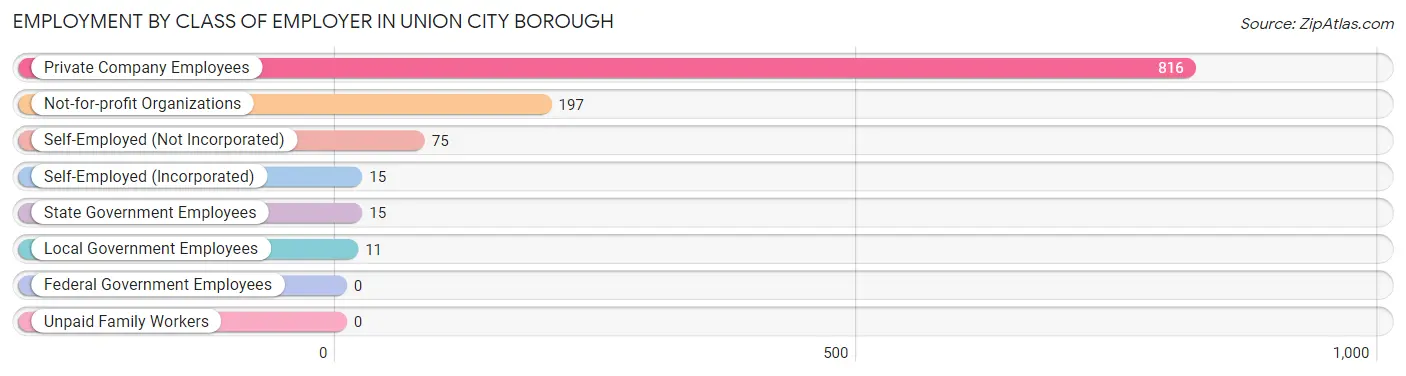
| Employer Class | # Employees | % Employees |
| Private Company Employees | 816 | 72.3% |
| Self-Employed (Incorporated) | 15 | 1.3% |
| Self-Employed (Not Incorporated) | 75 | 6.6% |
| Not-for-profit Organizations | 197 | 17.4% |
| Local Government Employees | 11 | 1.0% |
| State Government Employees | 15 | 1.3% |
| Federal Government Employees | 0 | 0.0% |
| Unpaid Family Workers | 0 | 0.0% |
| Total | 1,129 | 100.0% |
Employment Status by Age in Union City borough
According to the labor force statistics for Union City borough, out of the total population over 16 years of age (2,514), 48.6% or 1,222 individuals are in the labor force, with 7.5% or 92 of them unemployed. The age group with the highest labor force participation rate is 30 to 34 years, with 84.8% or 190 individuals in the labor force. Within the labor force, the 60 to 64 years age range has the highest percentage of unemployed individuals, with 23.2% or 13 of them being unemployed.
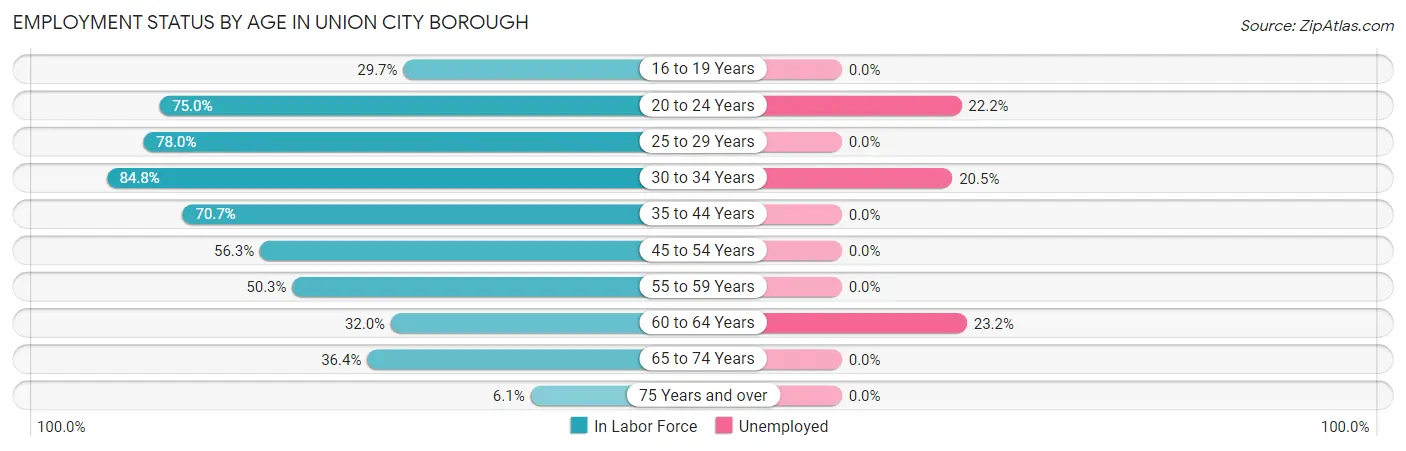
| Age Bracket | In Labor Force | Unemployed |
| 16 to 19 Years | 52 (29.7%) | 0 (0.0%) |
| 20 to 24 Years | 180 (75.0%) | 40 (22.2%) |
| 25 to 29 Years | 96 (78.0%) | 0 (0.0%) |
| 30 to 34 Years | 190 (84.8%) | 39 (20.5%) |
| 35 to 44 Years | 140 (70.7%) | 0 (0.0%) |
| 45 to 54 Years | 261 (56.3%) | 0 (0.0%) |
| 55 to 59 Years | 80 (50.3%) | 0 (0.0%) |
| 60 to 64 Years | 56 (32.0%) | 13 (23.2%) |
| 65 to 74 Years | 144 (36.4%) | 0 (0.0%) |
| 75 Years and over | 22 (6.1%) | 0 (0.0%) |
| Total | 1,222 (48.6%) | 92 (7.5%) |
Employment Status by Educational Attainment in Union City borough
According to labor force statistics for Union City borough, 61.3% of individuals (823) out of the total population between 25 and 64 years of age (1,343) are in the labor force, with 6.3% or 52 of them being unemployed. The group with the highest labor force participation rate are those with the educational attainment of bachelor's degree or higher, with 96.6% or 172 individuals in the labor force. Within the labor force, individuals with bachelor's degree or higher education have the highest percentage of unemployment, with 17.4% or 30 of them being unemployed.
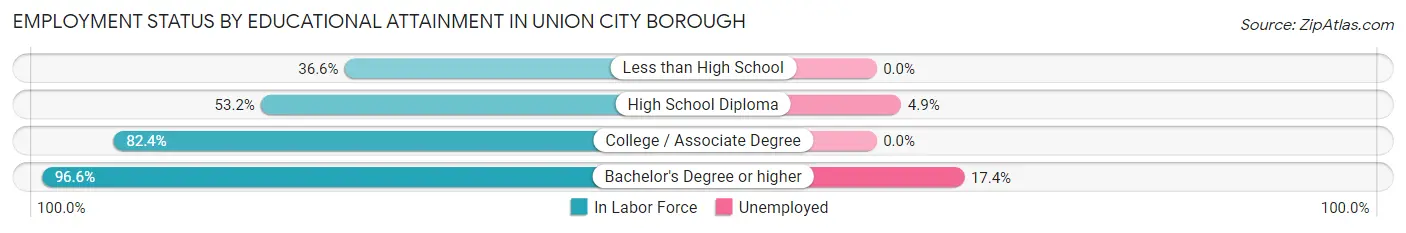
| Educational Attainment | In Labor Force | Unemployed |
| Less than High School | 49 (36.6%) | 0 (0.0%) |
| High School Diploma | 452 (53.2%) | 42 (4.9%) |
| College / Associate Degree | 150 (82.4%) | 0 (0.0%) |
| Bachelor's Degree or higher | 172 (96.6%) | 31 (17.4%) |
| Total | 823 (61.3%) | 85 (6.3%) |
Employment Occupations by Sex in Union City borough
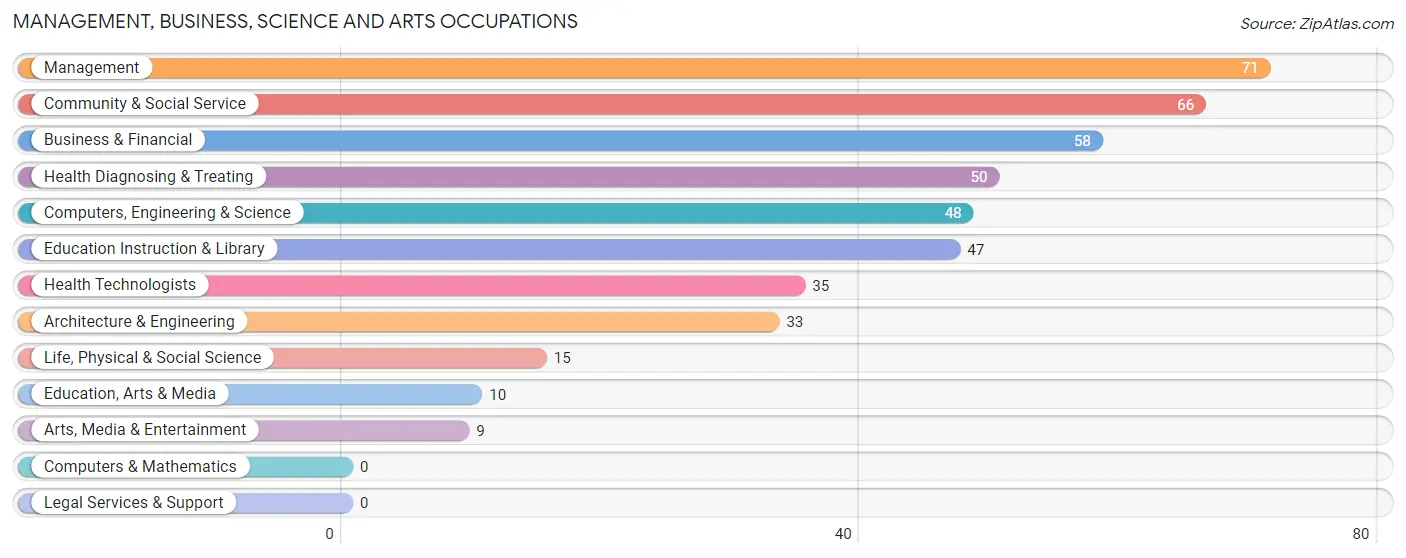
Management, Business, Science and Arts Occupations
The most common Management, Business, Science and Arts occupations in Union City borough are Management (71 | 6.3%), Community & Social Service (66 | 5.9%), Business & Financial (58 | 5.1%), Health Diagnosing & Treating (50 | 4.4%), and Computers, Engineering & Science (48 | 4.3%).
Management, Business, Science and Arts Occupations by Sex
Within the Management, Business, Science and Arts occupations in Union City borough, the most male-oriented occupations are Architecture & Engineering (100.0%), Education, Arts & Media (100.0%), and Management (77.5%), while the most female-oriented occupations are Life, Physical & Social Science (100.0%), Arts, Media & Entertainment (100.0%), and Health Diagnosing & Treating (100.0%).
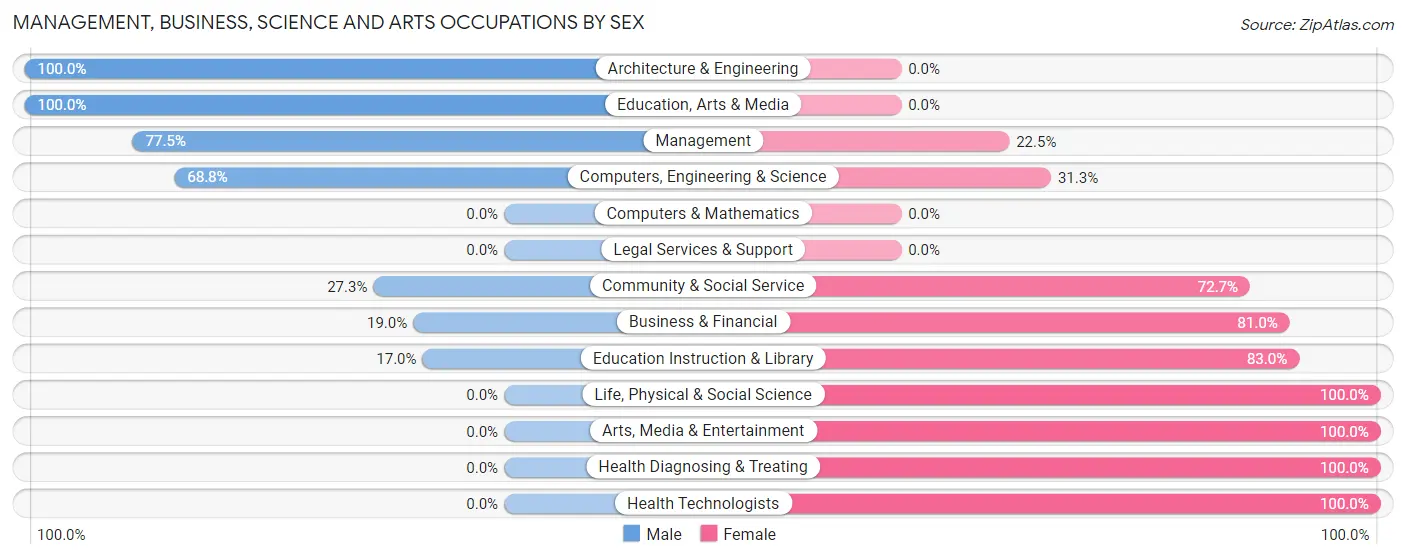
| Occupation | Male | Female |
| Management | 55 (77.5%) | 16 (22.5%) |
| Business & Financial | 11 (19.0%) | 47 (81.0%) |
| Computers, Engineering & Science | 33 (68.8%) | 15 (31.2%) |
| Computers & Mathematics | 0 (0.0%) | 0 (0.0%) |
| Architecture & Engineering | 33 (100.0%) | 0 (0.0%) |
| Life, Physical & Social Science | 0 (0.0%) | 15 (100.0%) |
| Community & Social Service | 18 (27.3%) | 48 (72.7%) |
| Education, Arts & Media | 10 (100.0%) | 0 (0.0%) |
| Legal Services & Support | 0 (0.0%) | 0 (0.0%) |
| Education Instruction & Library | 8 (17.0%) | 39 (83.0%) |
| Arts, Media & Entertainment | 0 (0.0%) | 9 (100.0%) |
| Health Diagnosing & Treating | 0 (0.0%) | 50 (100.0%) |
| Health Technologists | 0 (0.0%) | 35 (100.0%) |
| Total (Category) | 117 (39.9%) | 176 (60.1%) |
| Total (Overall) | 567 (50.2%) | 562 (49.8%) |
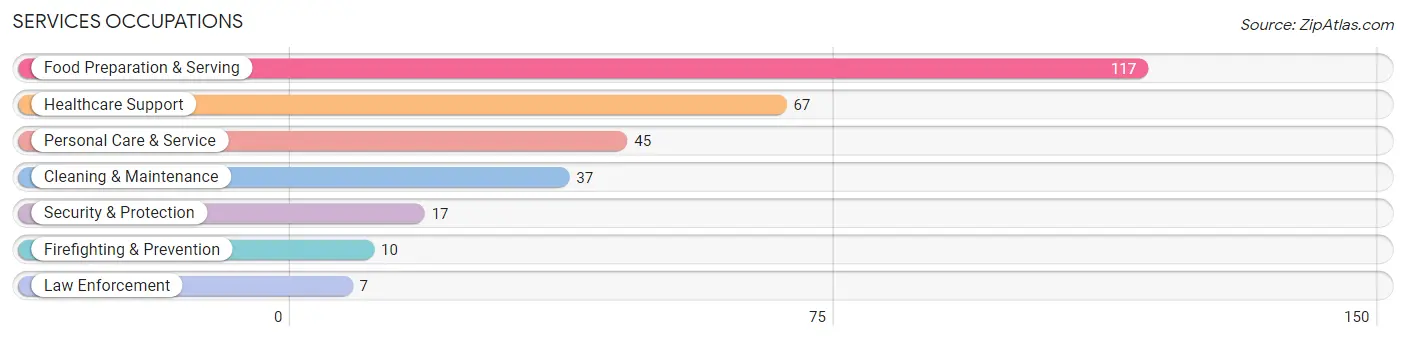
Services Occupations
The most common Services occupations in Union City borough are Food Preparation & Serving (117 | 10.4%), Healthcare Support (67 | 5.9%), Personal Care & Service (45 | 4.0%), Cleaning & Maintenance (37 | 3.3%), and Security & Protection (17 | 1.5%).
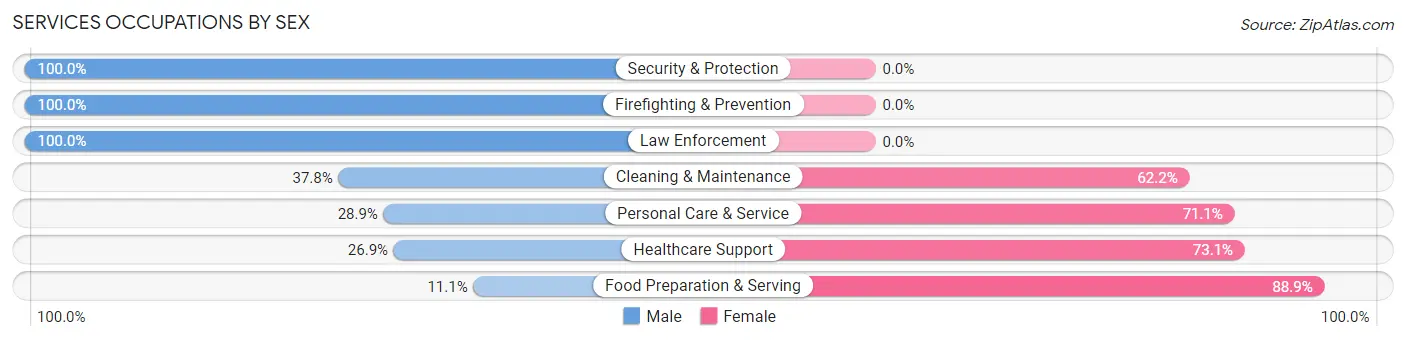
Services Occupations by Sex
Within the Services occupations in Union City borough, the most male-oriented occupations are Security & Protection (100.0%), Firefighting & Prevention (100.0%), and Law Enforcement (100.0%), while the most female-oriented occupations are Food Preparation & Serving (88.9%), Healthcare Support (73.1%), and Personal Care & Service (71.1%).
| Occupation | Male | Female |
| Healthcare Support | 18 (26.9%) | 49 (73.1%) |
| Security & Protection | 17 (100.0%) | 0 (0.0%) |
| Firefighting & Prevention | 10 (100.0%) | 0 (0.0%) |
| Law Enforcement | 7 (100.0%) | 0 (0.0%) |
| Food Preparation & Serving | 13 (11.1%) | 104 (88.9%) |
| Cleaning & Maintenance | 14 (37.8%) | 23 (62.2%) |
| Personal Care & Service | 13 (28.9%) | 32 (71.1%) |
| Total (Category) | 75 (26.5%) | 208 (73.5%) |
| Total (Overall) | 567 (50.2%) | 562 (49.8%) |
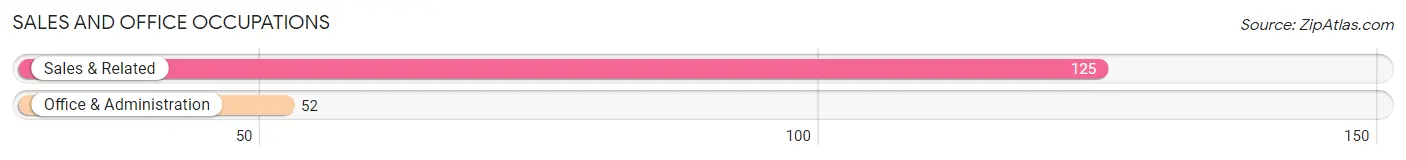
Sales and Office Occupations
The most common Sales and Office occupations in Union City borough are Sales & Related (125 | 11.1%), and Office & Administration (52 | 4.6%).
Sales and Office Occupations by Sex
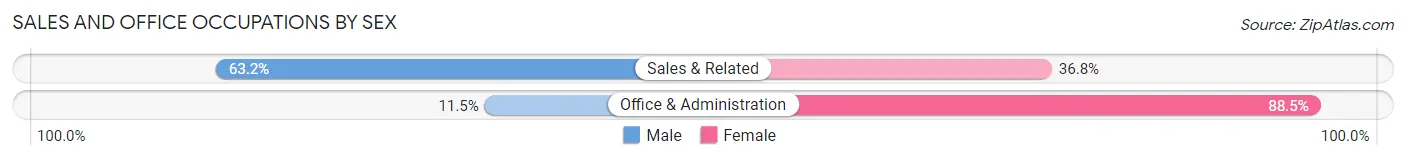
| Occupation | Male | Female |
| Sales & Related | 79 (63.2%) | 46 (36.8%) |
| Office & Administration | 6 (11.5%) | 46 (88.5%) |
| Total (Category) | 85 (48.0%) | 92 (52.0%) |
| Total (Overall) | 567 (50.2%) | 562 (49.8%) |
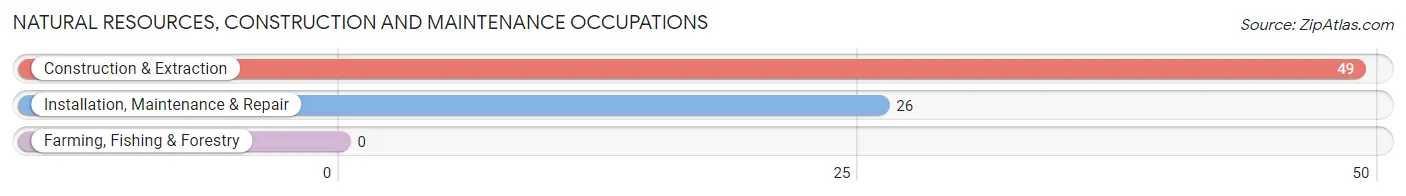
Natural Resources, Construction and Maintenance Occupations
The most common Natural Resources, Construction and Maintenance occupations in Union City borough are Construction & Extraction (49 | 4.3%), and Installation, Maintenance & Repair (26 | 2.3%).
Natural Resources, Construction and Maintenance Occupations by Sex
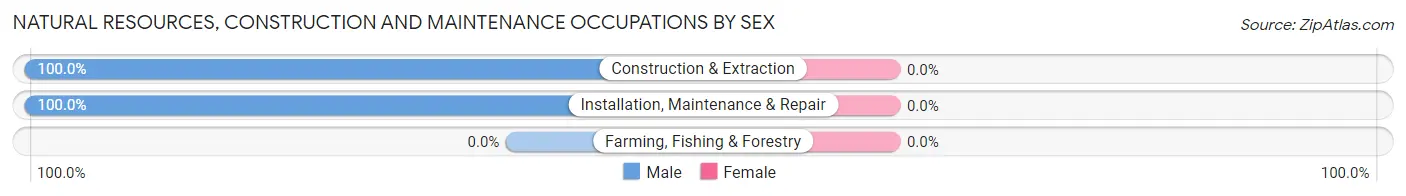
| Occupation | Male | Female |
| Farming, Fishing & Forestry | 0 (0.0%) | 0 (0.0%) |
| Construction & Extraction | 49 (100.0%) | 0 (0.0%) |
| Installation, Maintenance & Repair | 26 (100.0%) | 0 (0.0%) |
| Total (Category) | 75 (100.0%) | 0 (0.0%) |
| Total (Overall) | 567 (50.2%) | 562 (49.8%) |
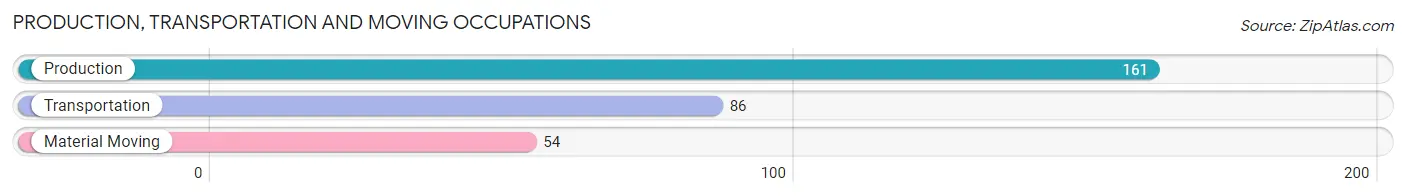
Production, Transportation and Moving Occupations
The most common Production, Transportation and Moving occupations in Union City borough are Production (161 | 14.3%), Transportation (86 | 7.6%), and Material Moving (54 | 4.8%).
Production, Transportation and Moving Occupations by Sex
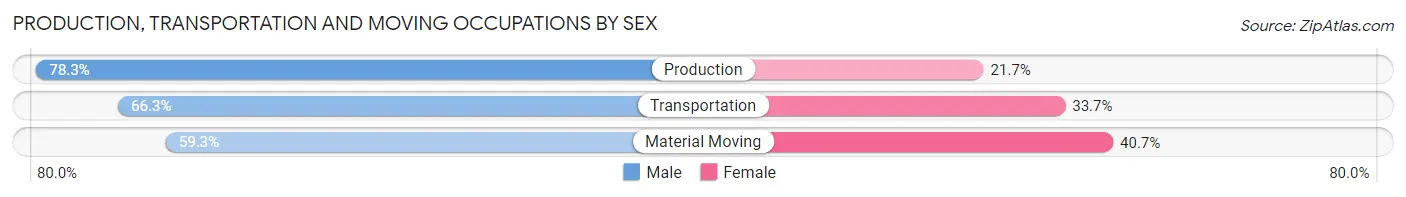
| Occupation | Male | Female |
| Production | 126 (78.3%) | 35 (21.7%) |
| Transportation | 57 (66.3%) | 29 (33.7%) |
| Material Moving | 32 (59.3%) | 22 (40.7%) |
| Total (Category) | 215 (71.4%) | 86 (28.6%) |
| Total (Overall) | 567 (50.2%) | 562 (49.8%) |
Employment Industries by Sex in Union City borough
Employment Industries in Union City borough
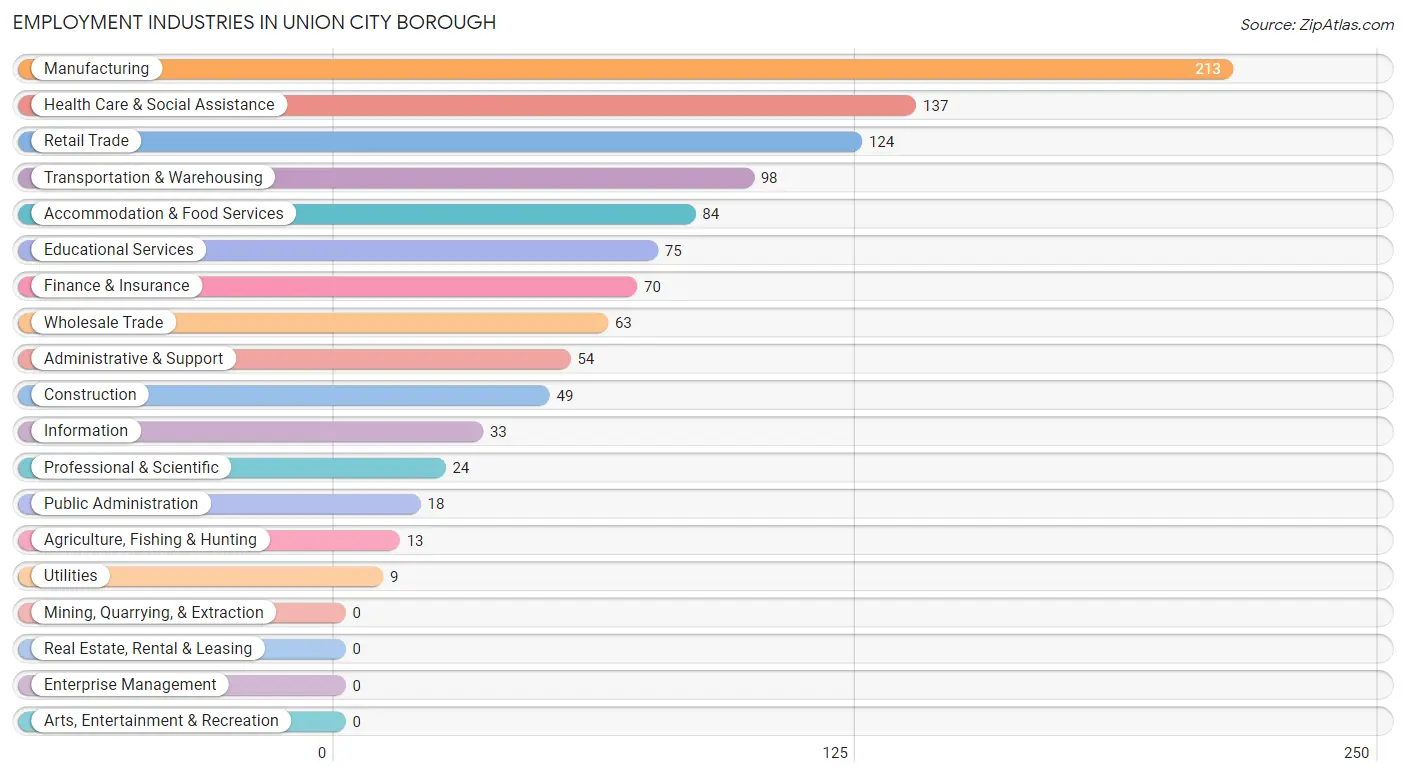
The major employment industries in Union City borough include Manufacturing (213 | 18.9%), Health Care & Social Assistance (137 | 12.1%), Retail Trade (124 | 11.0%), Transportation & Warehousing (98 | 8.7%), and Accommodation & Food Services (84 | 7.4%).
Employment Industries by Sex in Union City borough
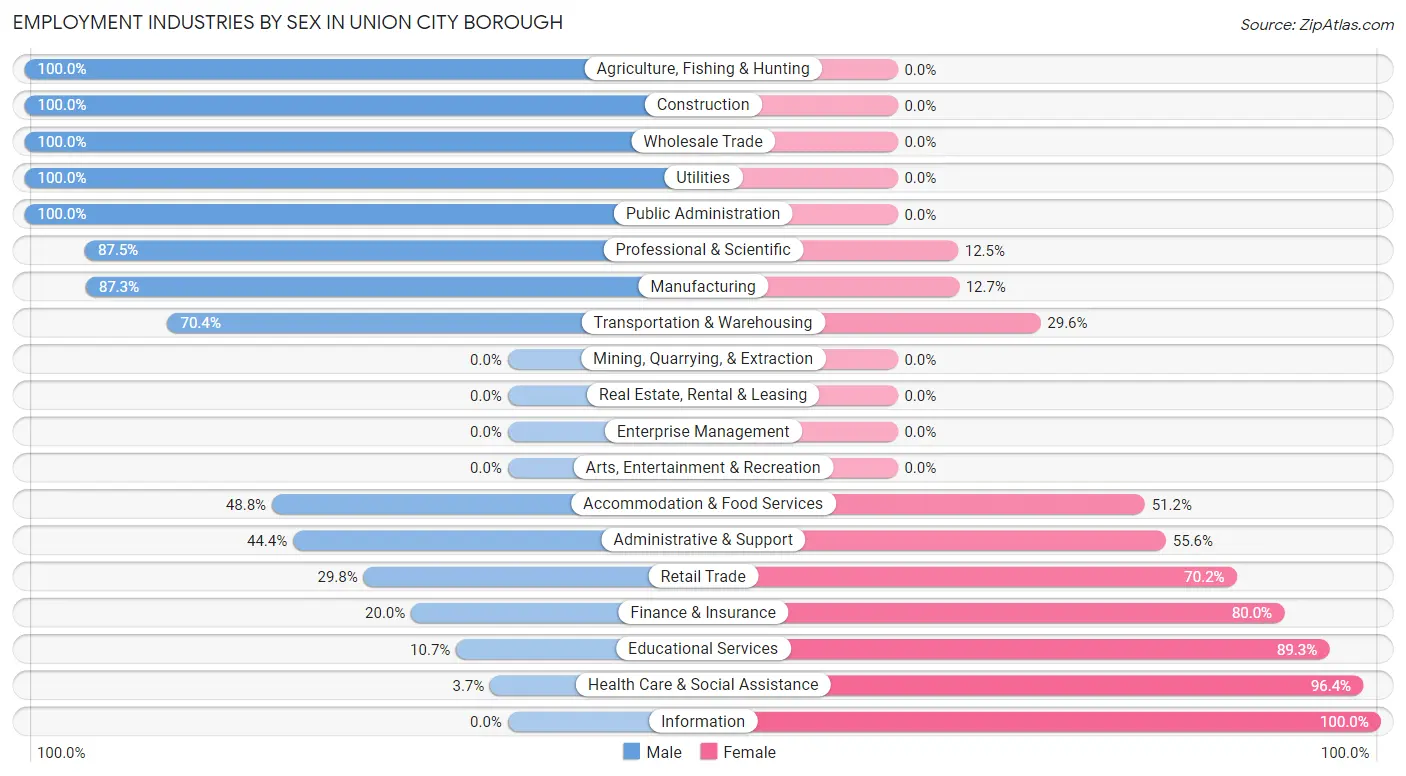
The Union City borough industries that see more men than women are Agriculture, Fishing & Hunting (100.0%), Construction (100.0%), and Wholesale Trade (100.0%), whereas the industries that tend to have a higher number of women are Information (100.0%), Health Care & Social Assistance (96.4%), and Educational Services (89.3%).
| Industry | Male | Female |
| Agriculture, Fishing & Hunting | 13 (100.0%) | 0 (0.0%) |
| Mining, Quarrying, & Extraction | 0 (0.0%) | 0 (0.0%) |
| Construction | 49 (100.0%) | 0 (0.0%) |
| Manufacturing | 186 (87.3%) | 27 (12.7%) |
| Wholesale Trade | 63 (100.0%) | 0 (0.0%) |
| Retail Trade | 37 (29.8%) | 87 (70.2%) |
| Transportation & Warehousing | 69 (70.4%) | 29 (29.6%) |
| Utilities | 9 (100.0%) | 0 (0.0%) |
| Information | 0 (0.0%) | 33 (100.0%) |
| Finance & Insurance | 14 (20.0%) | 56 (80.0%) |
| Real Estate, Rental & Leasing | 0 (0.0%) | 0 (0.0%) |
| Professional & Scientific | 21 (87.5%) | 3 (12.5%) |
| Enterprise Management | 0 (0.0%) | 0 (0.0%) |
| Administrative & Support | 24 (44.4%) | 30 (55.6%) |
| Educational Services | 8 (10.7%) | 67 (89.3%) |
| Health Care & Social Assistance | 5 (3.6%) | 132 (96.4%) |
| Arts, Entertainment & Recreation | 0 (0.0%) | 0 (0.0%) |
| Accommodation & Food Services | 41 (48.8%) | 43 (51.2%) |
| Public Administration | 18 (100.0%) | 0 (0.0%) |
| Total | 567 (50.2%) | 562 (49.8%) |
Education in Union City borough
School Enrollment in Union City borough
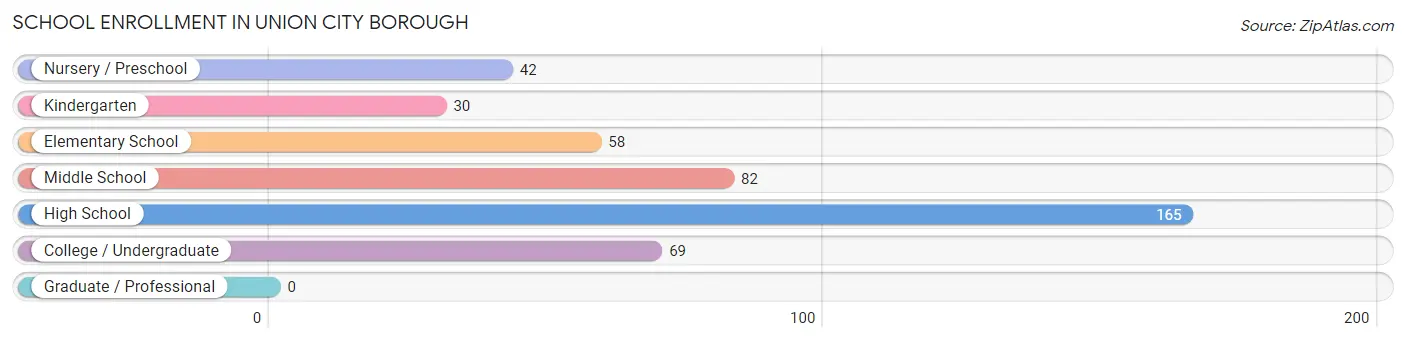
The most common levels of schooling among the 446 students in Union City borough are high school (165 | 37.0%), middle school (82 | 18.4%), and college / undergraduate (69 | 15.5%).
| School Level | # Students | % Students |
| Nursery / Preschool | 42 | 9.4% |
| Kindergarten | 30 | 6.7% |
| Elementary School | 58 | 13.0% |
| Middle School | 82 | 18.4% |
| High School | 165 | 37.0% |
| College / Undergraduate | 69 | 15.5% |
| Graduate / Professional | 0 | 0.0% |
| Total | 446 | 100.0% |
School Enrollment by Age by Funding Source in Union City borough
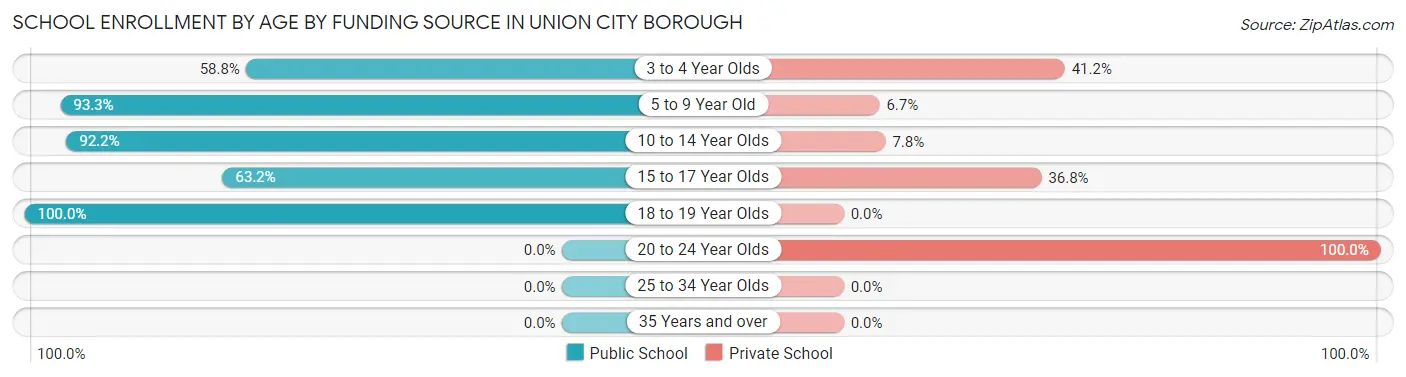
Out of a total of 446 students who are enrolled in schools in Union City borough, 137 (30.7%) attend a private institution, while the remaining 309 (69.3%) are enrolled in public schools. The age group of 20 to 24 year olds has the highest likelihood of being enrolled in private schools, with 60 (100.0% in the age bracket) enrolled. Conversely, the age group of 18 to 19 year olds has the lowest likelihood of being enrolled in a private school, with 22 (100.0% in the age bracket) attending a public institution.
| Age Bracket | Public School | Private School |
| 3 to 4 Year Olds | 10 (58.8%) | 7 (41.2%) |
| 5 to 9 Year Old | 98 (93.3%) | 7 (6.7%) |
| 10 to 14 Year Olds | 83 (92.2%) | 7 (7.8%) |
| 15 to 17 Year Olds | 96 (63.2%) | 56 (36.8%) |
| 18 to 19 Year Olds | 22 (100.0%) | 0 (0.0%) |
| 20 to 24 Year Olds | 0 (0.0%) | 60 (100.0%) |
| 25 to 34 Year Olds | 0 (0.0%) | 0 (0.0%) |
| 35 Years and over | 0 (0.0%) | 0 (0.0%) |
| Total | 309 (69.3%) | 137 (30.7%) |
Educational Attainment by Field of Study in Union City borough
Education (51 | 18.6%), science & technology (45 | 16.4%), liberal arts & history (40 | 14.6%), psychology (39 | 14.2%), and business (27 | 9.9%) are the most common fields of study among 274 individuals in Union City borough who have obtained a bachelor's degree or higher.
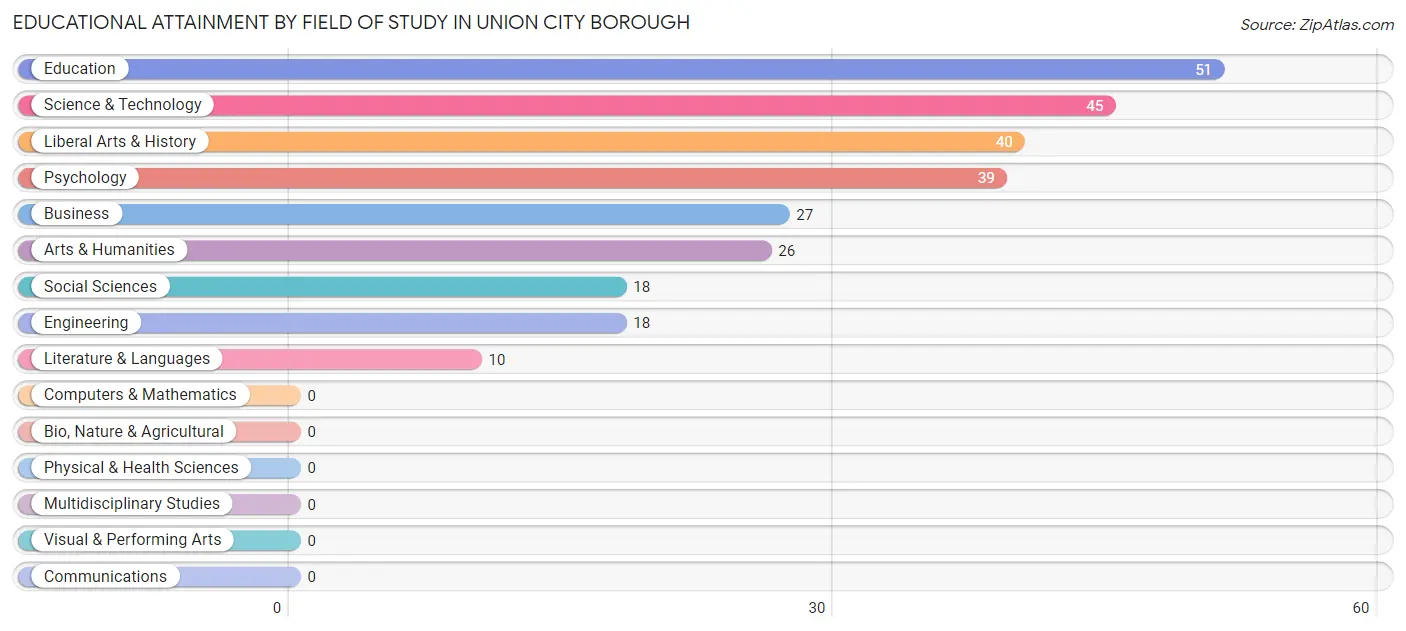
| Field of Study | # Graduates | % Graduates |
| Computers & Mathematics | 0 | 0.0% |
| Bio, Nature & Agricultural | 0 | 0.0% |
| Physical & Health Sciences | 0 | 0.0% |
| Psychology | 39 | 14.2% |
| Social Sciences | 18 | 6.6% |
| Engineering | 18 | 6.6% |
| Multidisciplinary Studies | 0 | 0.0% |
| Science & Technology | 45 | 16.4% |
| Business | 27 | 9.9% |
| Education | 51 | 18.6% |
| Literature & Languages | 10 | 3.6% |
| Liberal Arts & History | 40 | 14.6% |
| Visual & Performing Arts | 0 | 0.0% |
| Communications | 0 | 0.0% |
| Arts & Humanities | 26 | 9.5% |
| Total | 274 | 100.0% |
Transportation & Commute in Union City borough
Vehicle Availability by Sex in Union City borough
The most prevalent vehicle ownership categories in Union City borough are males with 1 vehicle (252, accounting for 44.4%) and females with 1 vehicle (265, making up 44.8%).
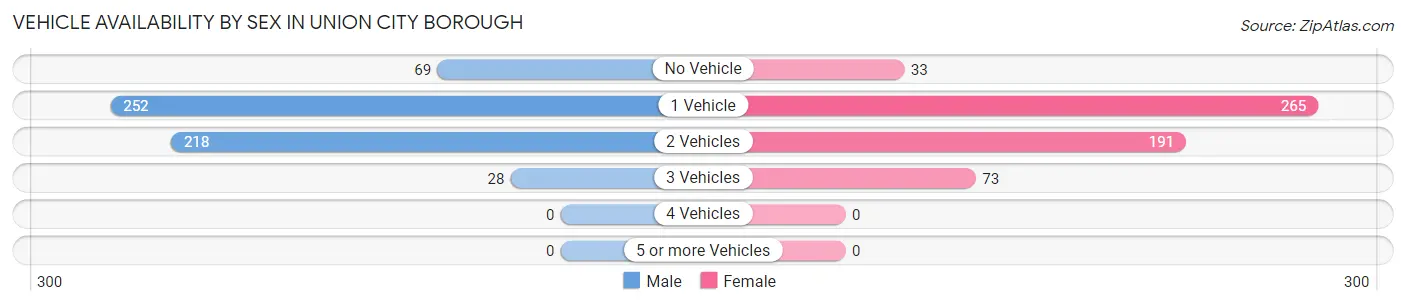
| Vehicles Available | Male | Female |
| No Vehicle | 69 (12.2%) | 33 (5.9%) |
| 1 Vehicle | 252 (44.4%) | 265 (47.1%) |
| 2 Vehicles | 218 (38.5%) | 191 (34.0%) |
| 3 Vehicles | 28 (4.9%) | 73 (13.0%) |
| 4 Vehicles | 0 (0.0%) | 0 (0.0%) |
| 5 or more Vehicles | 0 (0.0%) | 0 (0.0%) |
| Total | 567 (100.0%) | 562 (100.0%) |
Commute Time in Union City borough
The most frequently occuring commute durations in Union City borough are 5 to 9 minutes (309 commuters, 28.5%), less than 5 minutes (160 commuters, 14.7%), and 40 to 44 minutes (98 commuters, 9.0%).
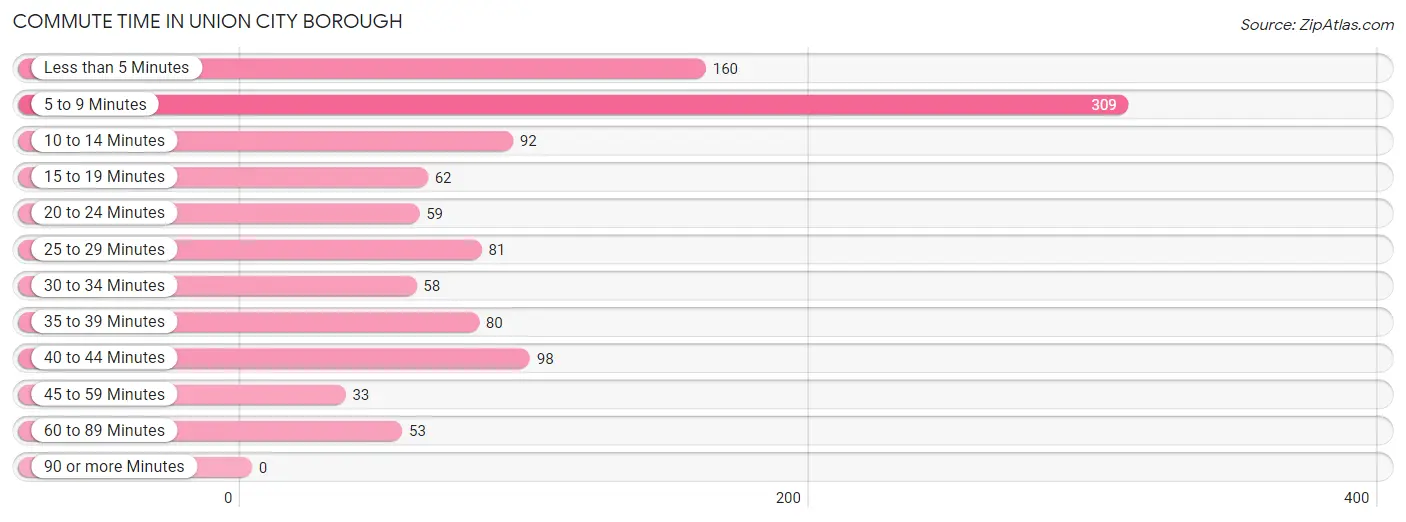
| Commute Time | # Commuters | % Commuters |
| Less than 5 Minutes | 160 | 14.7% |
| 5 to 9 Minutes | 309 | 28.5% |
| 10 to 14 Minutes | 92 | 8.5% |
| 15 to 19 Minutes | 62 | 5.7% |
| 20 to 24 Minutes | 59 | 5.4% |
| 25 to 29 Minutes | 81 | 7.5% |
| 30 to 34 Minutes | 58 | 5.3% |
| 35 to 39 Minutes | 80 | 7.4% |
| 40 to 44 Minutes | 98 | 9.0% |
| 45 to 59 Minutes | 33 | 3.0% |
| 60 to 89 Minutes | 53 | 4.9% |
| 90 or more Minutes | 0 | 0.0% |
Commute Time by Sex in Union City borough
The most common commute times in Union City borough are 5 to 9 minutes (220 commuters, 40.2%) for males and less than 5 minutes (117 commuters, 21.8%) for females.
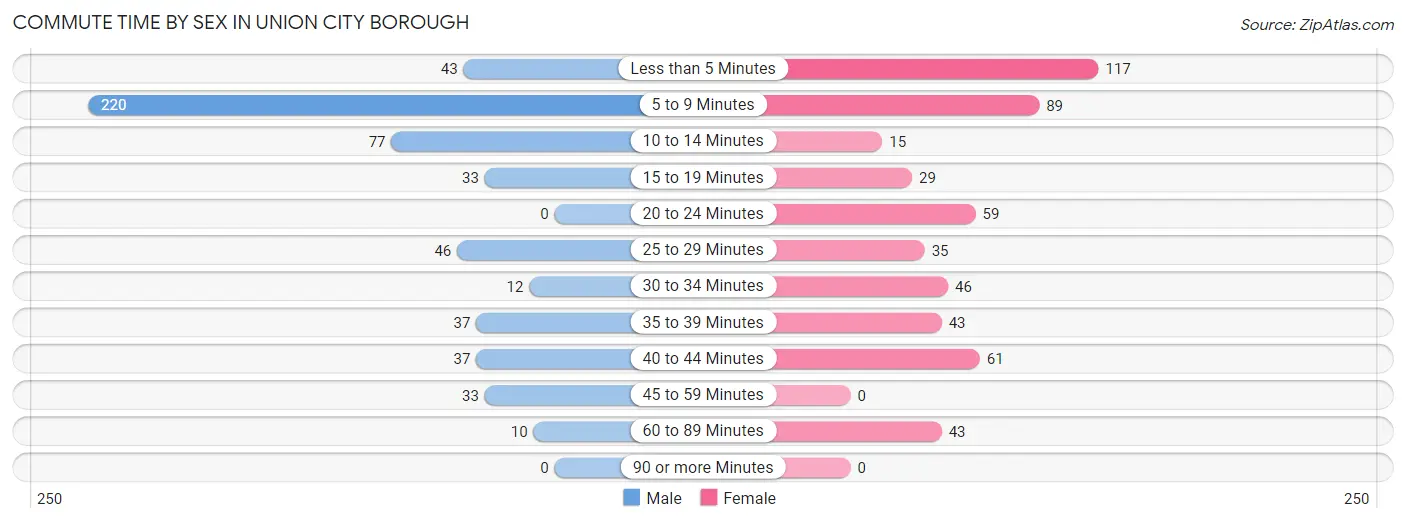
| Commute Time | Male | Female |
| Less than 5 Minutes | 43 (7.9%) | 117 (21.8%) |
| 5 to 9 Minutes | 220 (40.2%) | 89 (16.6%) |
| 10 to 14 Minutes | 77 (14.1%) | 15 (2.8%) |
| 15 to 19 Minutes | 33 (6.0%) | 29 (5.4%) |
| 20 to 24 Minutes | 0 (0.0%) | 59 (11.0%) |
| 25 to 29 Minutes | 46 (8.4%) | 35 (6.5%) |
| 30 to 34 Minutes | 12 (2.2%) | 46 (8.6%) |
| 35 to 39 Minutes | 37 (6.8%) | 43 (8.0%) |
| 40 to 44 Minutes | 37 (6.8%) | 61 (11.4%) |
| 45 to 59 Minutes | 33 (6.0%) | 0 (0.0%) |
| 60 to 89 Minutes | 10 (1.8%) | 43 (8.0%) |
| 90 or more Minutes | 0 (0.0%) | 0 (0.0%) |
Time of Departure to Work by Sex in Union City borough
The most frequent times of departure to work in Union City borough are 12:00 PM to 3:59 PM (139, 25.4%) for males and 4:00 PM to 11:59 PM (86, 16.0%) for females.
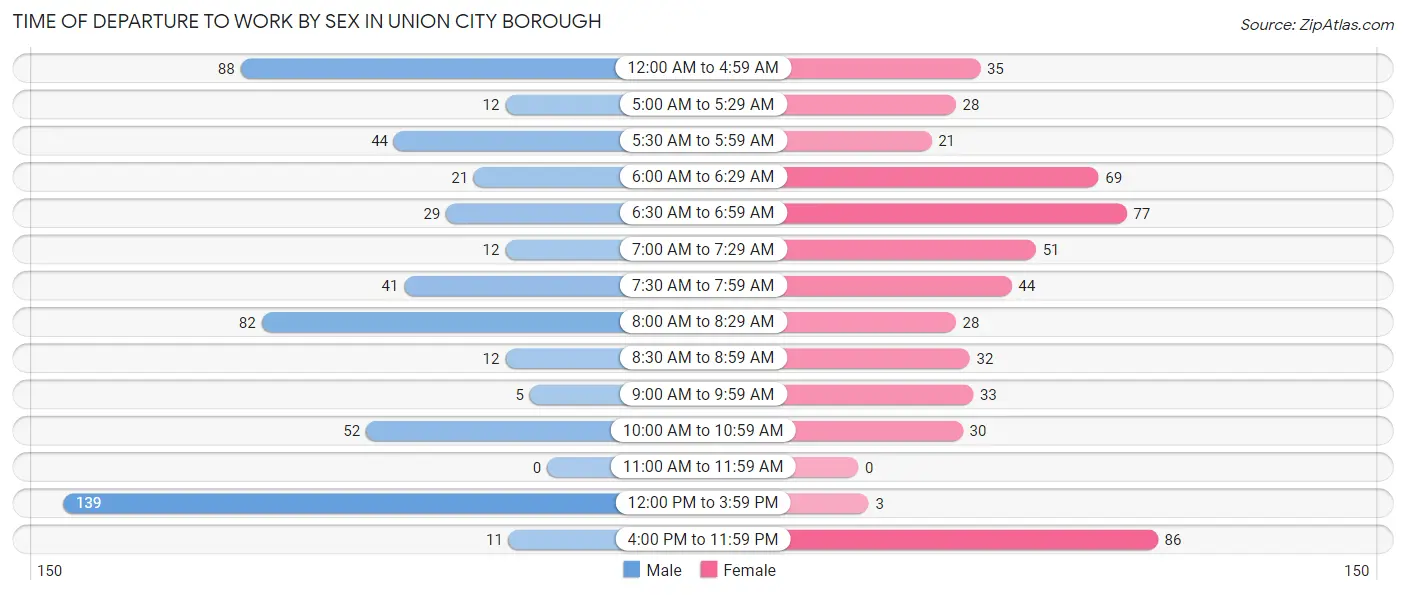
| Time of Departure | Male | Female |
| 12:00 AM to 4:59 AM | 88 (16.1%) | 35 (6.5%) |
| 5:00 AM to 5:29 AM | 12 (2.2%) | 28 (5.2%) |
| 5:30 AM to 5:59 AM | 44 (8.0%) | 21 (3.9%) |
| 6:00 AM to 6:29 AM | 21 (3.8%) | 69 (12.9%) |
| 6:30 AM to 6:59 AM | 29 (5.3%) | 77 (14.3%) |
| 7:00 AM to 7:29 AM | 12 (2.2%) | 51 (9.5%) |
| 7:30 AM to 7:59 AM | 41 (7.5%) | 44 (8.2%) |
| 8:00 AM to 8:29 AM | 82 (15.0%) | 28 (5.2%) |
| 8:30 AM to 8:59 AM | 12 (2.2%) | 32 (6.0%) |
| 9:00 AM to 9:59 AM | 5 (0.9%) | 33 (6.1%) |
| 10:00 AM to 10:59 AM | 52 (9.5%) | 30 (5.6%) |
| 11:00 AM to 11:59 AM | 0 (0.0%) | 0 (0.0%) |
| 12:00 PM to 3:59 PM | 139 (25.4%) | 3 (0.6%) |
| 4:00 PM to 11:59 PM | 11 (2.0%) | 86 (16.0%) |
| Total | 548 (100.0%) | 537 (100.0%) |
Housing Occupancy in Union City borough
Occupancy by Ownership in Union City borough
Of the total 1,357 dwellings in Union City borough, owner-occupied units account for 772 (56.9%), while renter-occupied units make up 585 (43.1%).
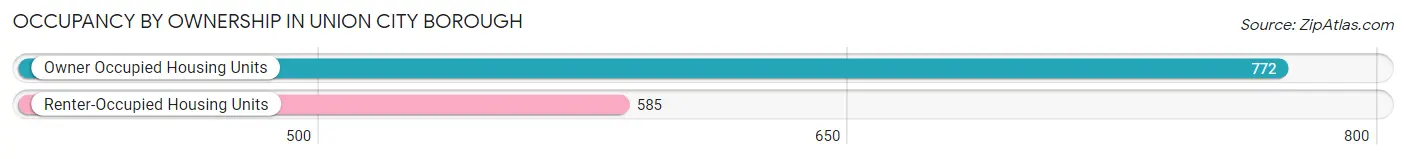
| Occupancy | # Housing Units | % Housing Units |
| Owner Occupied Housing Units | 772 | 56.9% |
| Renter-Occupied Housing Units | 585 | 43.1% |
| Total Occupied Housing Units | 1,357 | 100.0% |
Occupancy by Household Size in Union City borough
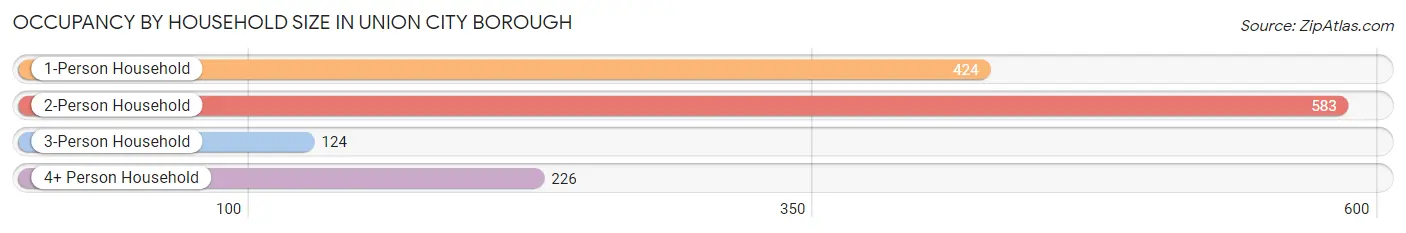
| Household Size | # Housing Units | % Housing Units |
| 1-Person Household | 424 | 31.2% |
| 2-Person Household | 583 | 43.0% |
| 3-Person Household | 124 | 9.1% |
| 4+ Person Household | 226 | 16.7% |
| Total Housing Units | 1,357 | 100.0% |
Occupancy by Ownership by Household Size in Union City borough
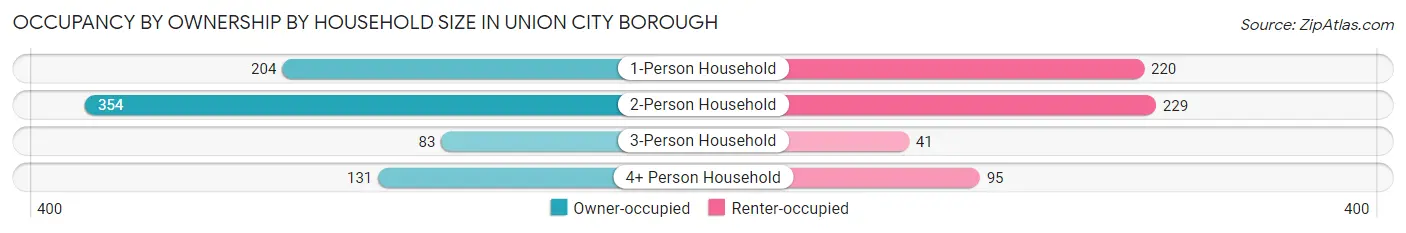
| Household Size | Owner-occupied | Renter-occupied |
| 1-Person Household | 204 (48.1%) | 220 (51.9%) |
| 2-Person Household | 354 (60.7%) | 229 (39.3%) |
| 3-Person Household | 83 (66.9%) | 41 (33.1%) |
| 4+ Person Household | 131 (58.0%) | 95 (42.0%) |
| Total Housing Units | 772 (56.9%) | 585 (43.1%) |
Occupancy by Educational Attainment in Union City borough
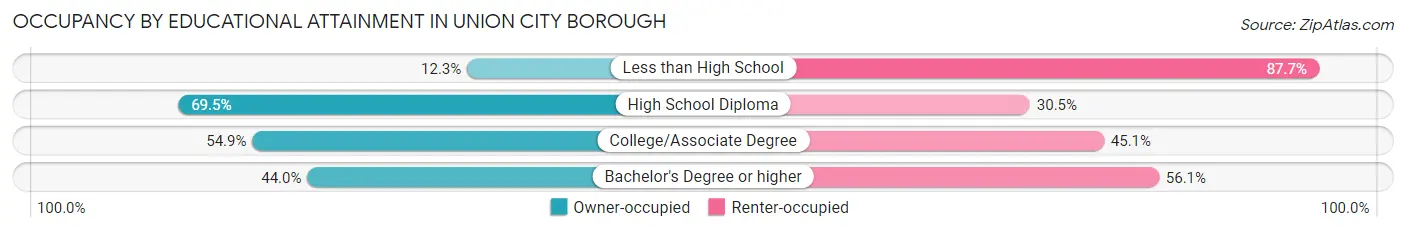
| Household Size | Owner-occupied | Renter-occupied |
| Less than High School | 19 (12.3%) | 136 (87.7%) |
| High School Diploma | 559 (69.5%) | 245 (30.5%) |
| College/Associate Degree | 96 (54.9%) | 79 (45.1%) |
| Bachelor's Degree or higher | 98 (44.0%) | 125 (56.0%) |
Occupancy by Age of Householder in Union City borough
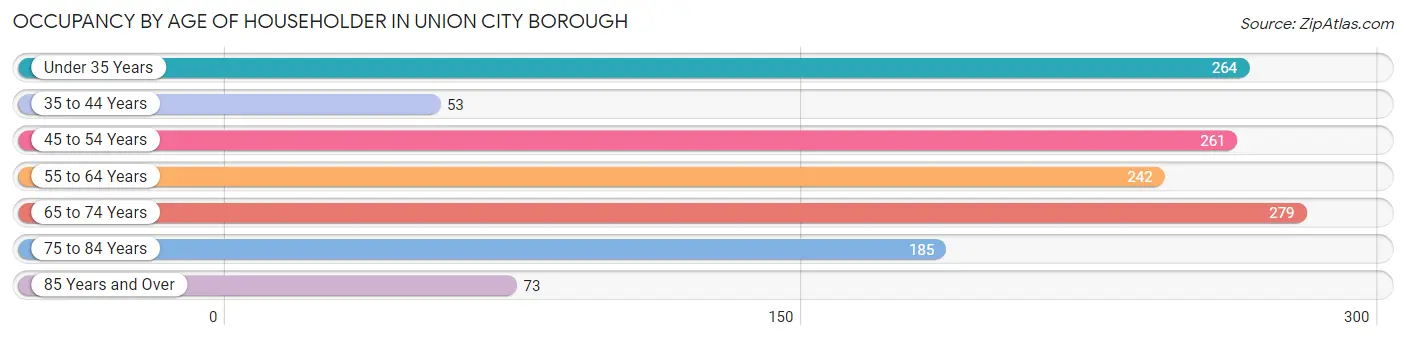
| Age Bracket | # Households | % Households |
| Under 35 Years | 264 | 19.5% |
| 35 to 44 Years | 53 | 3.9% |
| 45 to 54 Years | 261 | 19.2% |
| 55 to 64 Years | 242 | 17.8% |
| 65 to 74 Years | 279 | 20.6% |
| 75 to 84 Years | 185 | 13.6% |
| 85 Years and Over | 73 | 5.4% |
| Total | 1,357 | 100.0% |
Housing Finances in Union City borough
Median Income by Occupancy in Union City borough
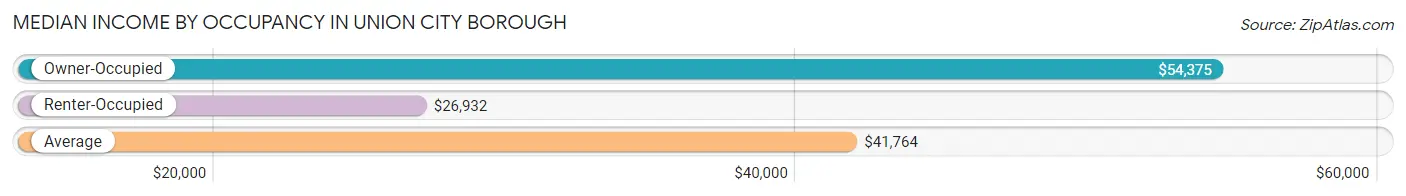
| Occupancy Type | # Households | Median Income |
| Owner-Occupied | 772 (56.9%) | $54,375 |
| Renter-Occupied | 585 (43.1%) | $26,932 |
| Average | 1,357 (100.0%) | $41,764 |
Occupancy by Householder Income Bracket in Union City borough
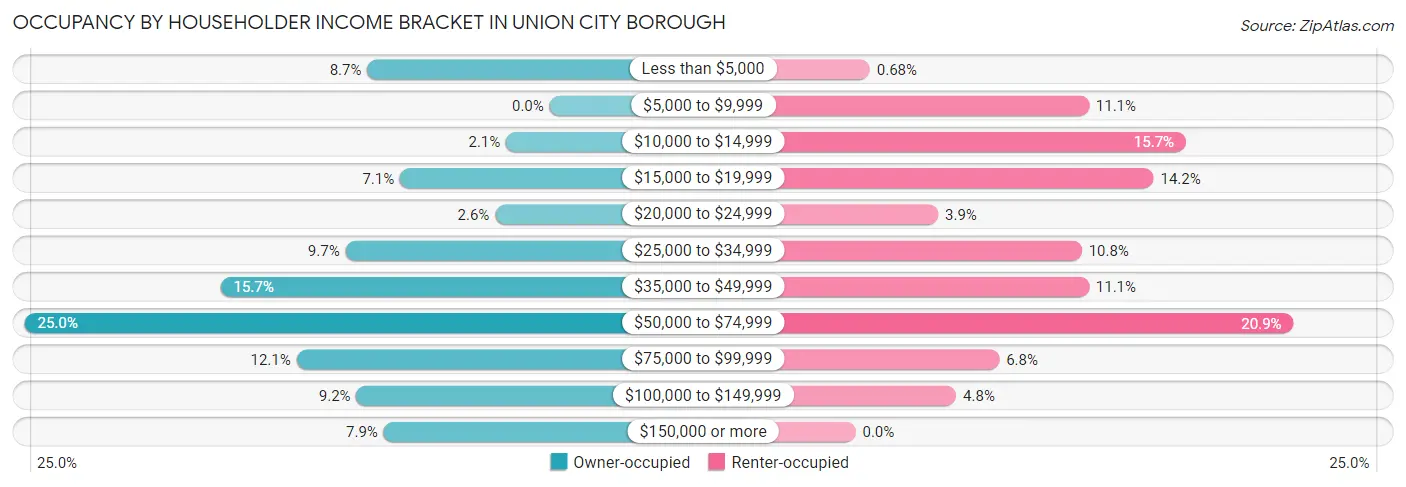
| Income Bracket | Owner-occupied | Renter-occupied |
| Less than $5,000 | 67 (8.7%) | 4 (0.7%) |
| $5,000 to $9,999 | 0 (0.0%) | 65 (11.1%) |
| $10,000 to $14,999 | 16 (2.1%) | 92 (15.7%) |
| $15,000 to $19,999 | 55 (7.1%) | 83 (14.2%) |
| $20,000 to $24,999 | 20 (2.6%) | 23 (3.9%) |
| $25,000 to $34,999 | 75 (9.7%) | 63 (10.8%) |
| $35,000 to $49,999 | 121 (15.7%) | 65 (11.1%) |
| $50,000 to $74,999 | 193 (25.0%) | 122 (20.8%) |
| $75,000 to $99,999 | 93 (12.0%) | 40 (6.8%) |
| $100,000 to $149,999 | 71 (9.2%) | 28 (4.8%) |
| $150,000 or more | 61 (7.9%) | 0 (0.0%) |
| Total | 772 (100.0%) | 585 (100.0%) |
Monthly Housing Cost Tiers in Union City borough
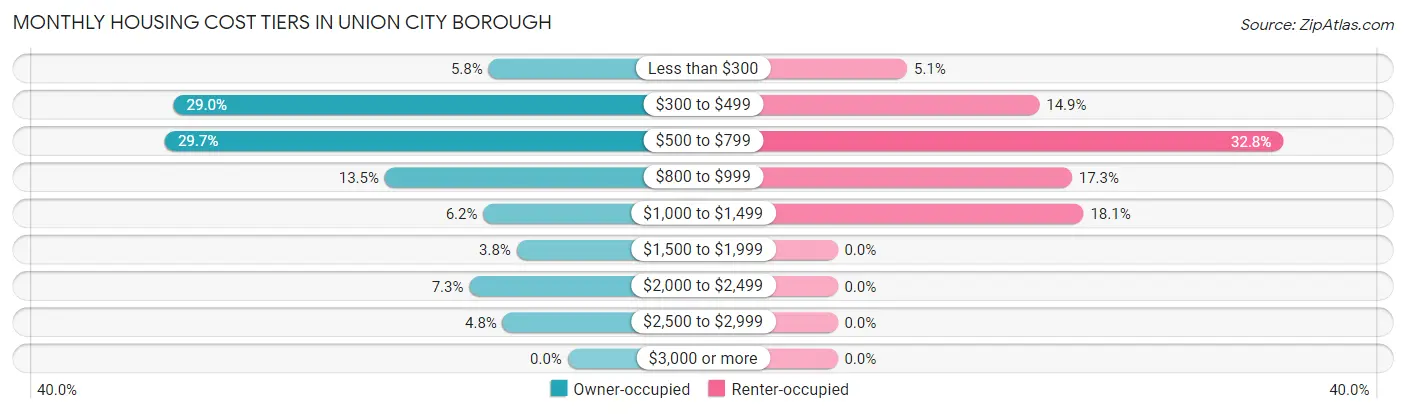
| Monthly Cost | Owner-occupied | Renter-occupied |
| Less than $300 | 45 (5.8%) | 30 (5.1%) |
| $300 to $499 | 224 (29.0%) | 87 (14.9%) |
| $500 to $799 | 229 (29.7%) | 192 (32.8%) |
| $800 to $999 | 104 (13.5%) | 101 (17.3%) |
| $1,000 to $1,499 | 48 (6.2%) | 106 (18.1%) |
| $1,500 to $1,999 | 29 (3.8%) | 0 (0.0%) |
| $2,000 to $2,499 | 56 (7.2%) | 0 (0.0%) |
| $2,500 to $2,999 | 37 (4.8%) | 0 (0.0%) |
| $3,000 or more | 0 (0.0%) | 0 (0.0%) |
| Total | 772 (100.0%) | 585 (100.0%) |
Physical Housing Characteristics in Union City borough
Housing Structures in Union City borough
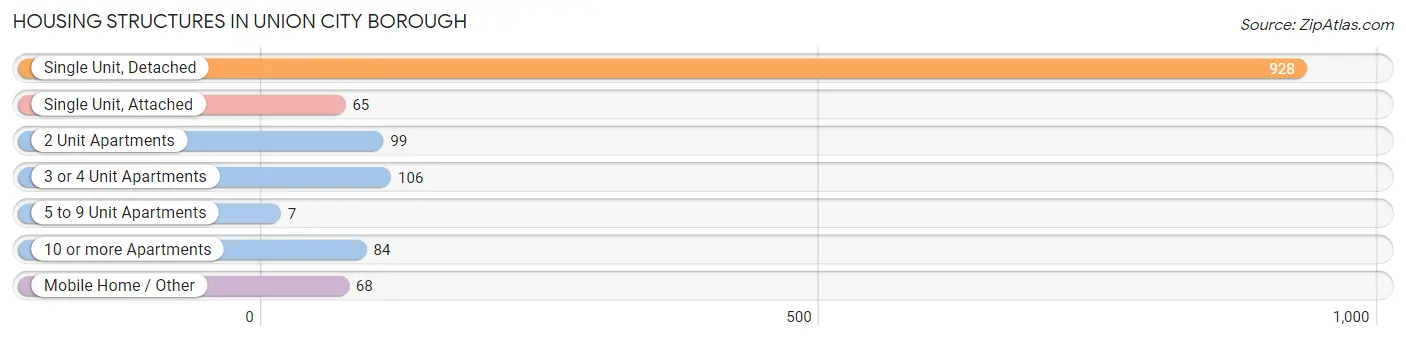
| Structure Type | # Housing Units | % Housing Units |
| Single Unit, Detached | 928 | 68.4% |
| Single Unit, Attached | 65 | 4.8% |
| 2 Unit Apartments | 99 | 7.3% |
| 3 or 4 Unit Apartments | 106 | 7.8% |
| 5 to 9 Unit Apartments | 7 | 0.5% |
| 10 or more Apartments | 84 | 6.2% |
| Mobile Home / Other | 68 | 5.0% |
| Total | 1,357 | 100.0% |
Housing Structures by Occupancy in Union City borough
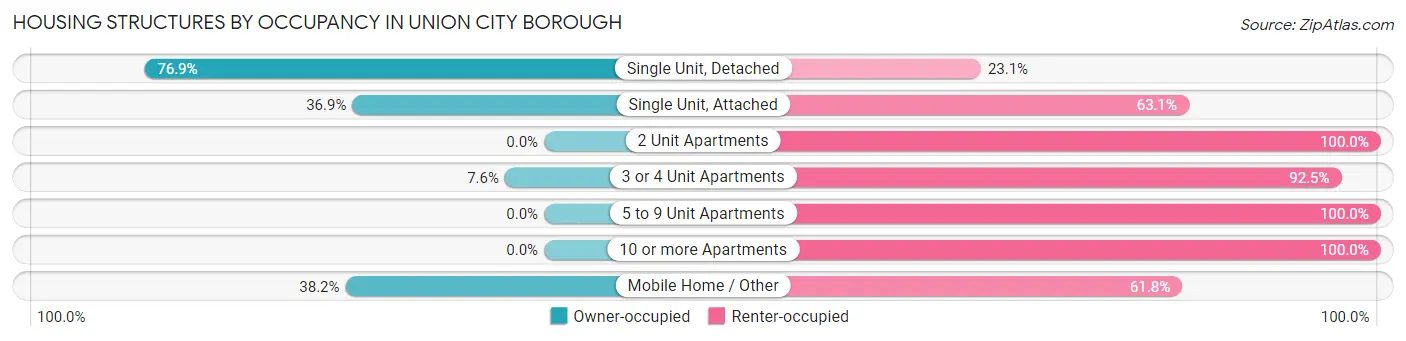
| Structure Type | Owner-occupied | Renter-occupied |
| Single Unit, Detached | 714 (76.9%) | 214 (23.1%) |
| Single Unit, Attached | 24 (36.9%) | 41 (63.1%) |
| 2 Unit Apartments | 0 (0.0%) | 99 (100.0%) |
| 3 or 4 Unit Apartments | 8 (7.5%) | 98 (92.4%) |
| 5 to 9 Unit Apartments | 0 (0.0%) | 7 (100.0%) |
| 10 or more Apartments | 0 (0.0%) | 84 (100.0%) |
| Mobile Home / Other | 26 (38.2%) | 42 (61.8%) |
| Total | 772 (56.9%) | 585 (43.1%) |
Housing Structures by Number of Rooms in Union City borough
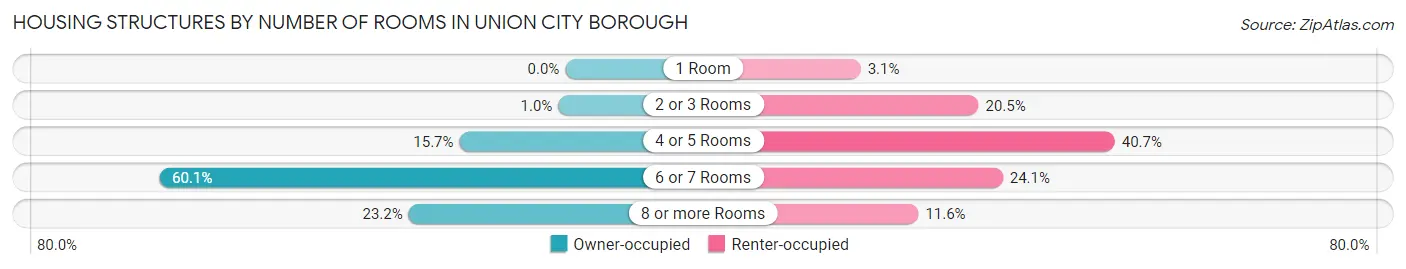
| Number of Rooms | Owner-occupied | Renter-occupied |
| 1 Room | 0 (0.0%) | 18 (3.1%) |
| 2 or 3 Rooms | 8 (1.0%) | 120 (20.5%) |
| 4 or 5 Rooms | 121 (15.7%) | 238 (40.7%) |
| 6 or 7 Rooms | 464 (60.1%) | 141 (24.1%) |
| 8 or more Rooms | 179 (23.2%) | 68 (11.6%) |
| Total | 772 (100.0%) | 585 (100.0%) |
Housing Structure by Heating Type in Union City borough
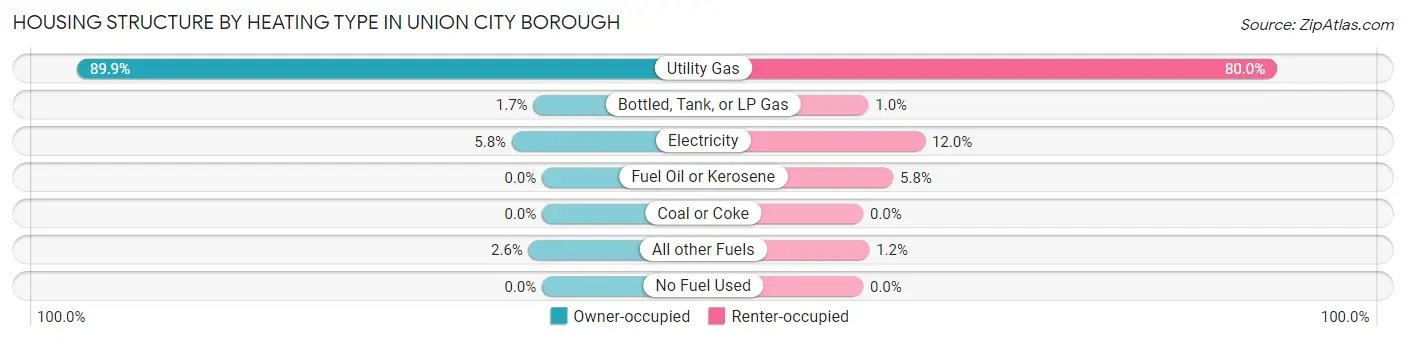
| Heating Type | Owner-occupied | Renter-occupied |
| Utility Gas | 694 (89.9%) | 468 (80.0%) |
| Bottled, Tank, or LP Gas | 13 (1.7%) | 6 (1.0%) |
| Electricity | 45 (5.8%) | 70 (12.0%) |
| Fuel Oil or Kerosene | 0 (0.0%) | 34 (5.8%) |
| Coal or Coke | 0 (0.0%) | 0 (0.0%) |
| All other Fuels | 20 (2.6%) | 7 (1.2%) |
| No Fuel Used | 0 (0.0%) | 0 (0.0%) |
| Total | 772 (100.0%) | 585 (100.0%) |
Household Vehicle Usage in Union City borough
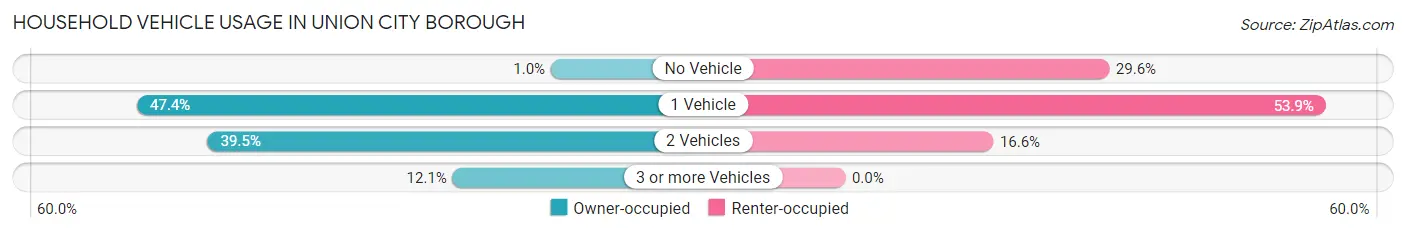
| Vehicles per Household | Owner-occupied | Renter-occupied |
| No Vehicle | 8 (1.0%) | 173 (29.6%) |
| 1 Vehicle | 366 (47.4%) | 315 (53.8%) |
| 2 Vehicles | 305 (39.5%) | 97 (16.6%) |
| 3 or more Vehicles | 93 (12.0%) | 0 (0.0%) |
| Total | 772 (100.0%) | 585 (100.0%) |
Real Estate & Mortgages in Union City borough
Real Estate and Mortgage Overview in Union City borough
| Characteristic | Without Mortgage | With Mortgage |
| Housing Units | 403 | 369 |
| Median Property Value | $96,300 | $101,600 |
| Median Household Income | $52,228 | $53 |
| Monthly Housing Costs | $448 | $0 |
| Real Estate Taxes | $2,120 | $0 |
Property Value by Mortgage Status in Union City borough
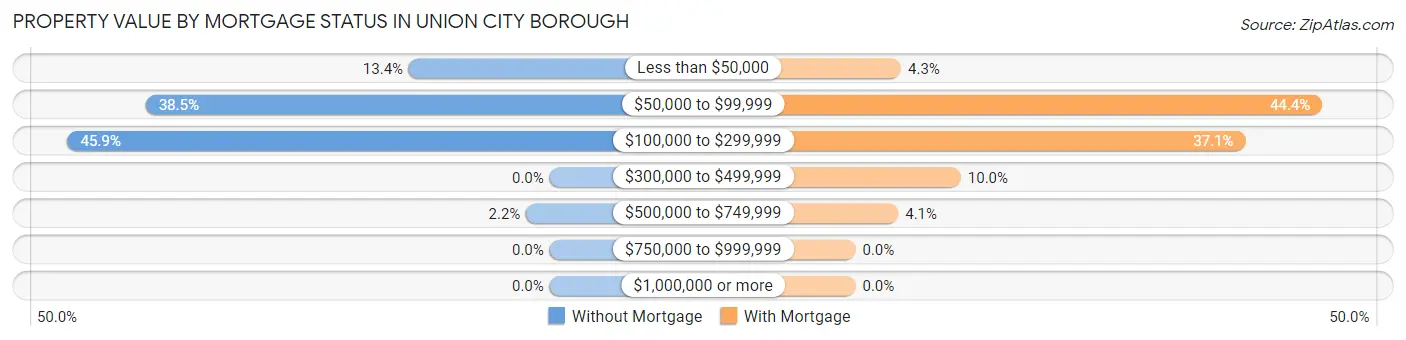
| Property Value | Without Mortgage | With Mortgage |
| Less than $50,000 | 54 (13.4%) | 16 (4.3%) |
| $50,000 to $99,999 | 155 (38.5%) | 164 (44.4%) |
| $100,000 to $299,999 | 185 (45.9%) | 137 (37.1%) |
| $300,000 to $499,999 | 0 (0.0%) | 37 (10.0%) |
| $500,000 to $749,999 | 9 (2.2%) | 15 (4.1%) |
| $750,000 to $999,999 | 0 (0.0%) | 0 (0.0%) |
| $1,000,000 or more | 0 (0.0%) | 0 (0.0%) |
| Total | 403 (100.0%) | 369 (100.0%) |
Household Income by Mortgage Status in Union City borough
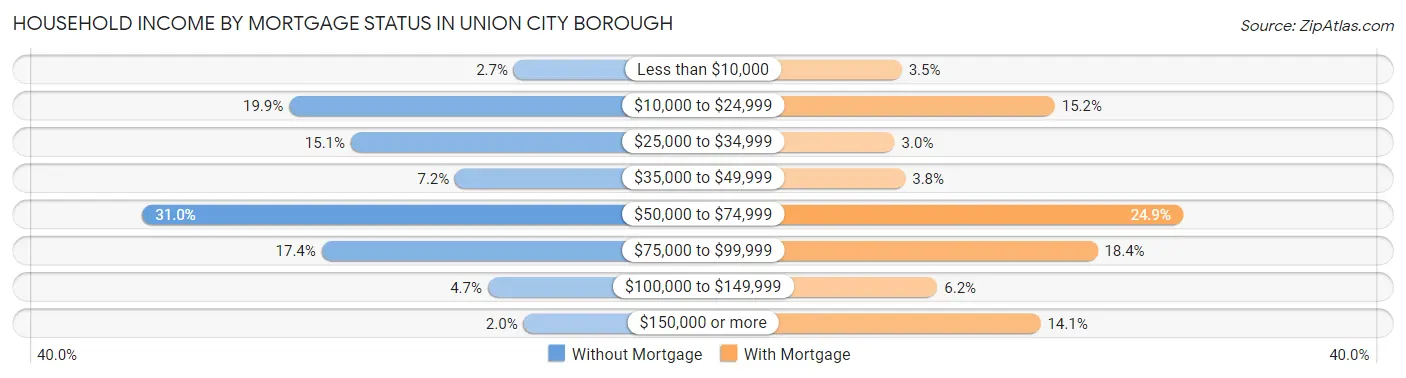
| Household Income | Without Mortgage | With Mortgage |
| Less than $10,000 | 11 (2.7%) | 13 (3.5%) |
| $10,000 to $24,999 | 80 (19.9%) | 56 (15.2%) |
| $25,000 to $34,999 | 61 (15.1%) | 11 (3.0%) |
| $35,000 to $49,999 | 29 (7.2%) | 14 (3.8%) |
| $50,000 to $74,999 | 125 (31.0%) | 92 (24.9%) |
| $75,000 to $99,999 | 70 (17.4%) | 68 (18.4%) |
| $100,000 to $149,999 | 19 (4.7%) | 23 (6.2%) |
| $150,000 or more | 8 (2.0%) | 52 (14.1%) |
| Total | 403 (100.0%) | 369 (100.0%) |
Property Value to Household Income Ratio in Union City borough
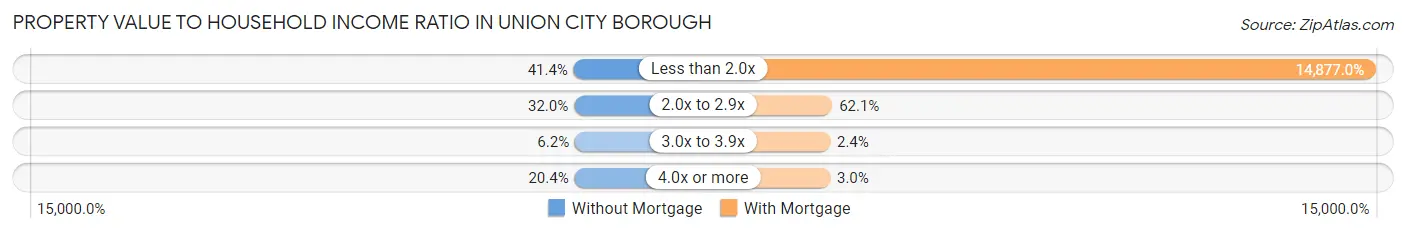
| Value-to-Income Ratio | Without Mortgage | With Mortgage |
| Less than 2.0x | 167 (41.4%) | 54,896 (14,877.0%) |
| 2.0x to 2.9x | 129 (32.0%) | 229 (62.1%) |
| 3.0x to 3.9x | 25 (6.2%) | 9 (2.4%) |
| 4.0x or more | 82 (20.3%) | 11 (3.0%) |
| Total | 403 (100.0%) | 369 (100.0%) |
Real Estate Taxes by Mortgage Status in Union City borough
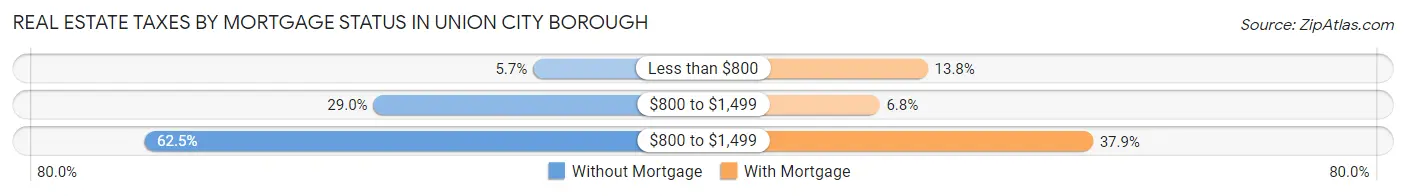
| Property Taxes | Without Mortgage | With Mortgage |
| Less than $800 | 23 (5.7%) | 51 (13.8%) |
| $800 to $1,499 | 117 (29.0%) | 25 (6.8%) |
| $800 to $1,499 | 252 (62.5%) | 140 (37.9%) |
| Total | 403 (100.0%) | 369 (100.0%) |
Health & Disability in Union City borough
Health Insurance Coverage by Age in Union City borough
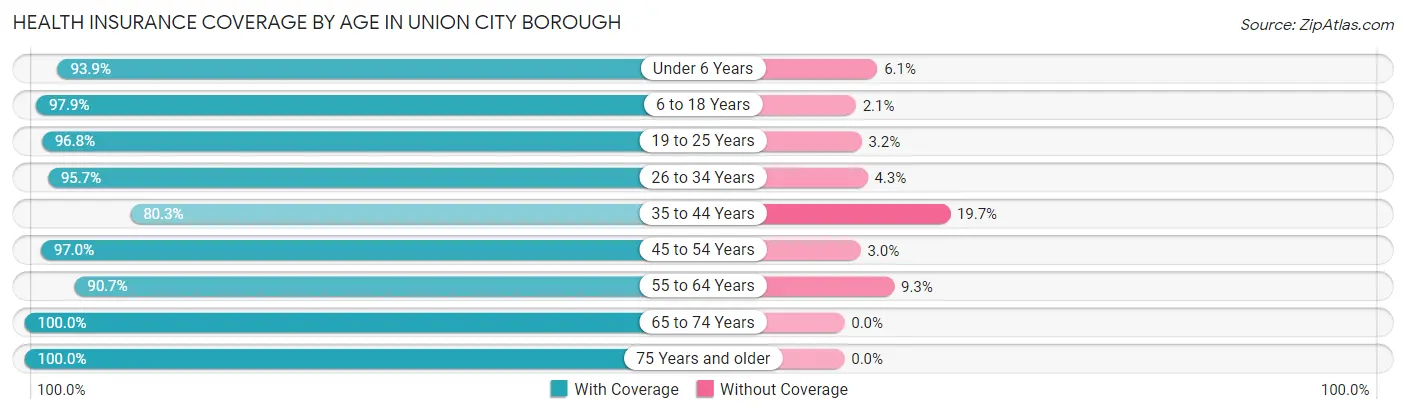
| Age Bracket | With Coverage | Without Coverage |
| Under 6 Years | 214 (93.9%) | 14 (6.1%) |
| 6 to 18 Years | 322 (97.9%) | 7 (2.1%) |
| 19 to 25 Years | 272 (96.8%) | 9 (3.2%) |
| 26 to 34 Years | 332 (95.7%) | 15 (4.3%) |
| 35 to 44 Years | 159 (80.3%) | 39 (19.7%) |
| 45 to 54 Years | 450 (97.0%) | 14 (3.0%) |
| 55 to 64 Years | 303 (90.7%) | 31 (9.3%) |
| 65 to 74 Years | 396 (100.0%) | 0 (0.0%) |
| 75 Years and older | 360 (100.0%) | 0 (0.0%) |
| Total | 2,808 (95.6%) | 129 (4.4%) |
Health Insurance Coverage by Citizenship Status in Union City borough
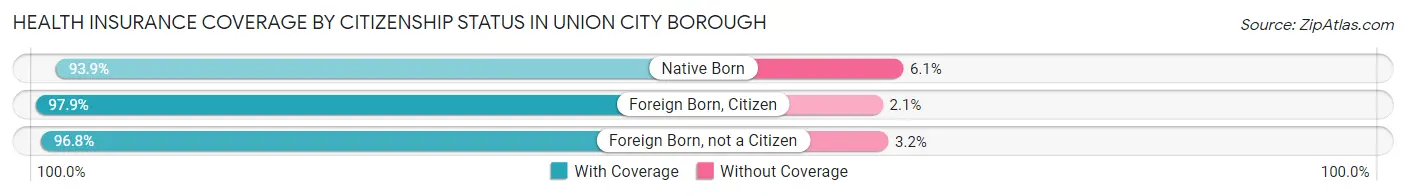
| Citizenship Status | With Coverage | Without Coverage |
| Native Born | 214 (93.9%) | 14 (6.1%) |
| Foreign Born, Citizen | 322 (97.9%) | 7 (2.1%) |
| Foreign Born, not a Citizen | 272 (96.8%) | 9 (3.2%) |
Health Insurance Coverage by Household Income in Union City borough
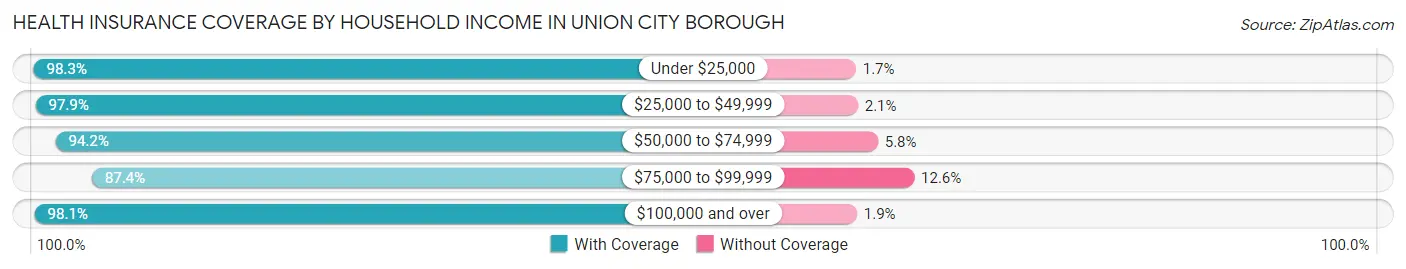
| Household Income | With Coverage | Without Coverage |
| Under $25,000 | 582 (98.3%) | 10 (1.7%) |
| $25,000 to $49,999 | 618 (97.9%) | 13 (2.1%) |
| $50,000 to $74,999 | 894 (94.2%) | 55 (5.8%) |
| $75,000 to $99,999 | 298 (87.4%) | 43 (12.6%) |
| $100,000 and over | 416 (98.1%) | 8 (1.9%) |
Public vs Private Health Insurance Coverage by Age in Union City borough
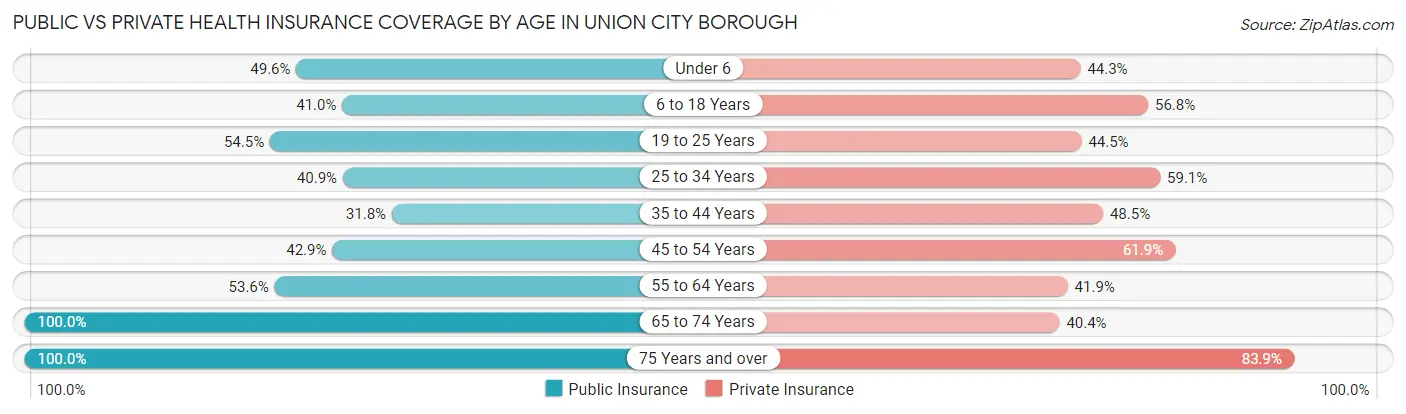
| Age Bracket | Public Insurance | Private Insurance |
| Under 6 | 113 (49.6%) | 101 (44.3%) |
| 6 to 18 Years | 135 (41.0%) | 187 (56.8%) |
| 19 to 25 Years | 153 (54.4%) | 125 (44.5%) |
| 25 to 34 Years | 142 (40.9%) | 205 (59.1%) |
| 35 to 44 Years | 63 (31.8%) | 96 (48.5%) |
| 45 to 54 Years | 199 (42.9%) | 287 (61.9%) |
| 55 to 64 Years | 179 (53.6%) | 140 (41.9%) |
| 65 to 74 Years | 396 (100.0%) | 160 (40.4%) |
| 75 Years and over | 360 (100.0%) | 302 (83.9%) |
| Total | 1,740 (59.2%) | 1,603 (54.6%) |
Disability Status by Sex by Age in Union City borough
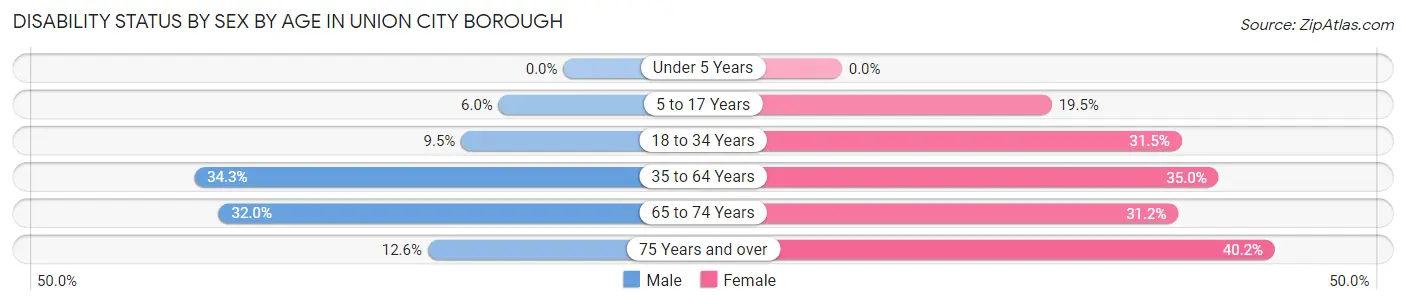
| Age Bracket | Male | Female |
| Under 5 Years | 0 (0.0%) | 0 (0.0%) |
| 5 to 17 Years | 9 (6.0%) | 45 (19.5%) |
| 18 to 34 Years | 22 (9.5%) | 129 (31.5%) |
| 35 to 64 Years | 160 (34.3%) | 185 (35.0%) |
| 65 to 74 Years | 56 (32.0%) | 69 (31.2%) |
| 75 Years and over | 19 (12.6%) | 84 (40.2%) |
Disability Class by Sex by Age in Union City borough
Disability Class: Hearing Difficulty
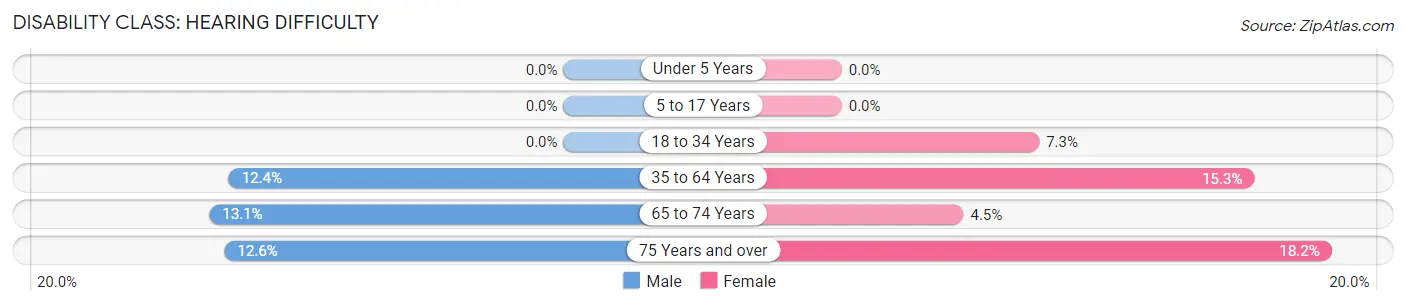
| Age Bracket | Male | Female |
| Under 5 Years | 0 (0.0%) | 0 (0.0%) |
| 5 to 17 Years | 0 (0.0%) | 0 (0.0%) |
| 18 to 34 Years | 0 (0.0%) | 30 (7.3%) |
| 35 to 64 Years | 58 (12.4%) | 81 (15.3%) |
| 65 to 74 Years | 23 (13.1%) | 10 (4.5%) |
| 75 Years and over | 19 (12.6%) | 38 (18.2%) |
Disability Class: Vision Difficulty
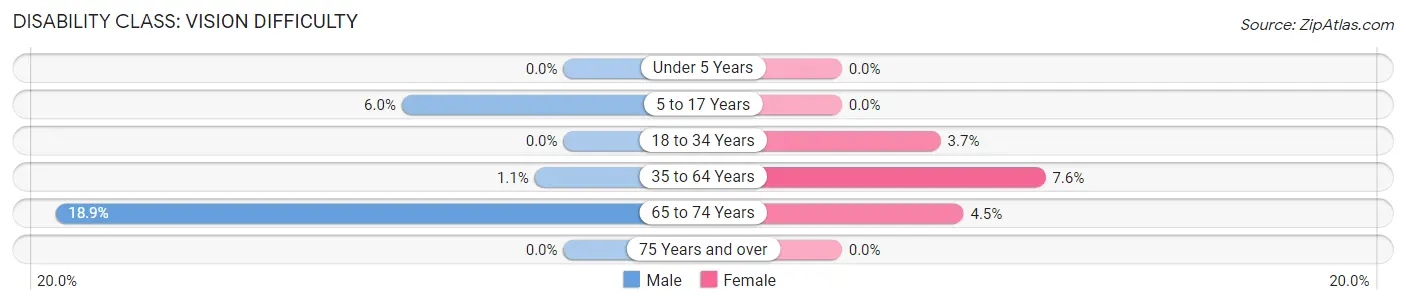
| Age Bracket | Male | Female |
| Under 5 Years | 0 (0.0%) | 0 (0.0%) |
| 5 to 17 Years | 9 (6.0%) | 0 (0.0%) |
| 18 to 34 Years | 0 (0.0%) | 15 (3.7%) |
| 35 to 64 Years | 5 (1.1%) | 40 (7.6%) |
| 65 to 74 Years | 33 (18.9%) | 10 (4.5%) |
| 75 Years and over | 0 (0.0%) | 0 (0.0%) |
Disability Class: Cognitive Difficulty
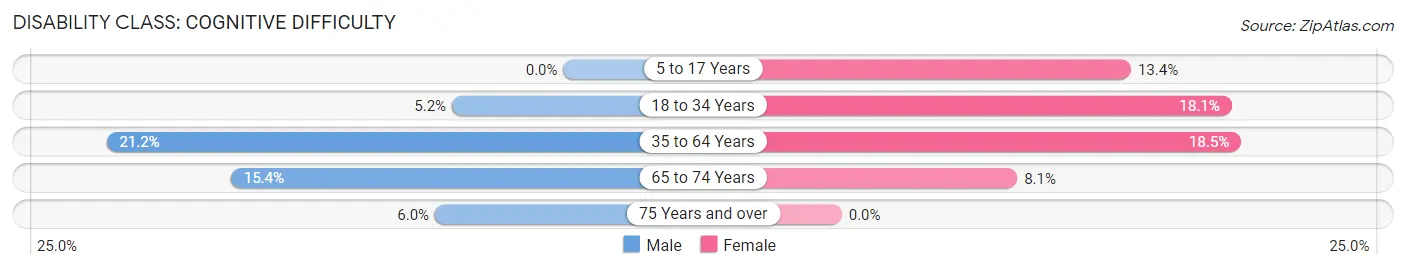
| Age Bracket | Male | Female |
| 5 to 17 Years | 0 (0.0%) | 31 (13.4%) |
| 18 to 34 Years | 12 (5.2%) | 74 (18.1%) |
| 35 to 64 Years | 99 (21.2%) | 98 (18.5%) |
| 65 to 74 Years | 27 (15.4%) | 18 (8.1%) |
| 75 Years and over | 9 (6.0%) | 0 (0.0%) |
Disability Class: Ambulatory Difficulty
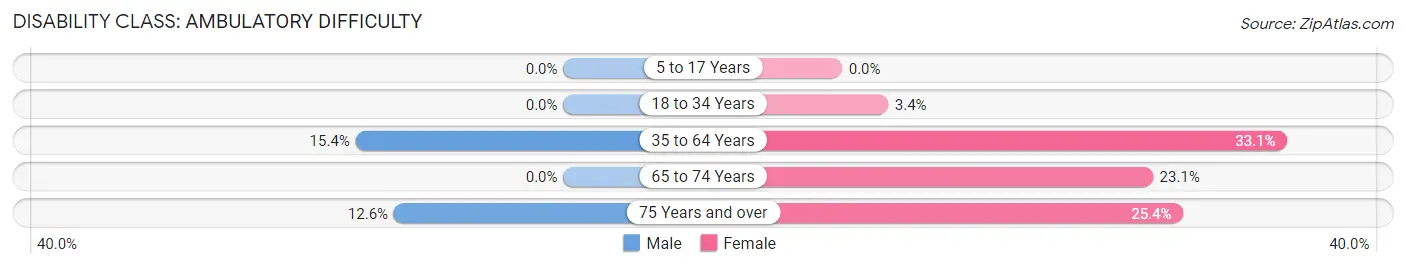
| Age Bracket | Male | Female |
| 5 to 17 Years | 0 (0.0%) | 0 (0.0%) |
| 18 to 34 Years | 0 (0.0%) | 14 (3.4%) |
| 35 to 64 Years | 72 (15.4%) | 175 (33.1%) |
| 65 to 74 Years | 0 (0.0%) | 51 (23.1%) |
| 75 Years and over | 19 (12.6%) | 53 (25.4%) |
Disability Class: Self-Care Difficulty
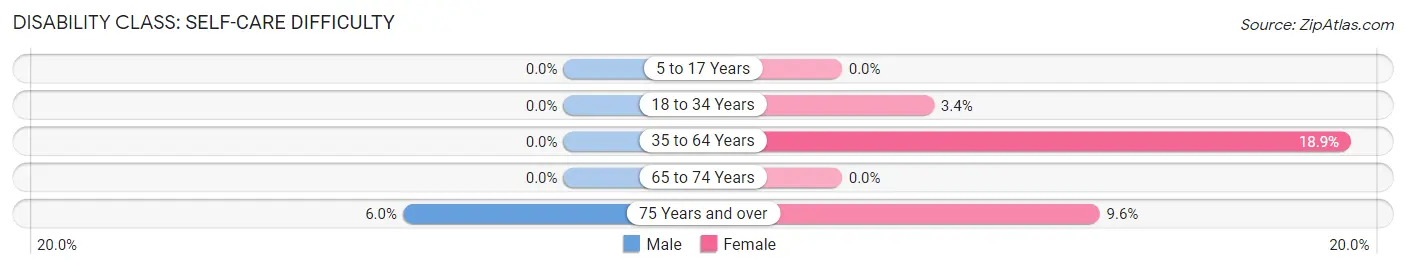
| Age Bracket | Male | Female |
| 5 to 17 Years | 0 (0.0%) | 0 (0.0%) |
| 18 to 34 Years | 0 (0.0%) | 14 (3.4%) |
| 35 to 64 Years | 0 (0.0%) | 100 (18.9%) |
| 65 to 74 Years | 0 (0.0%) | 0 (0.0%) |
| 75 Years and over | 9 (6.0%) | 20 (9.6%) |
Technology Access in Union City borough
Computing Device Access in Union City borough
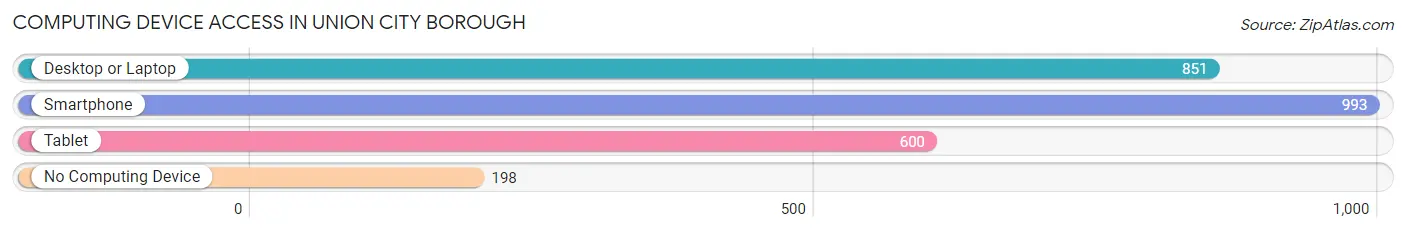
| Device Type | # Households | % Households |
| Desktop or Laptop | 851 | 62.7% |
| Smartphone | 993 | 73.2% |
| Tablet | 600 | 44.2% |
| No Computing Device | 198 | 14.6% |
| Total | 1,357 | 100.0% |
Internet Access in Union City borough
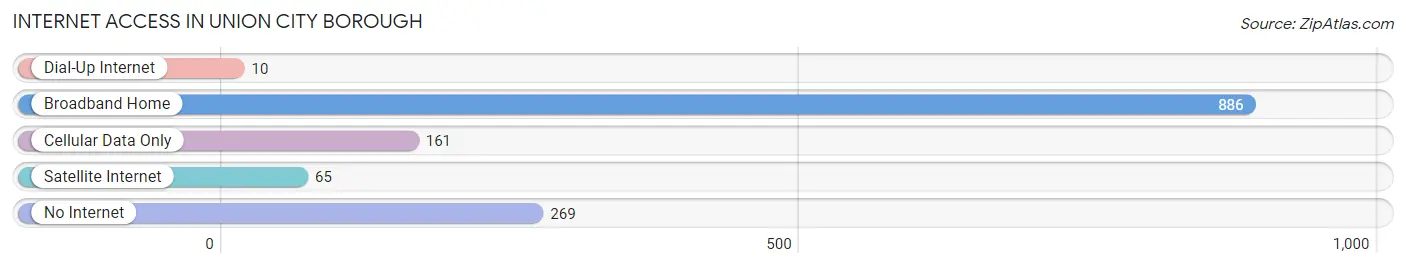
| Internet Type | # Households | % Households |
| Dial-Up Internet | 10 | 0.7% |
| Broadband Home | 886 | 65.3% |
| Cellular Data Only | 161 | 11.9% |
| Satellite Internet | 65 | 4.8% |
| No Internet | 269 | 19.8% |
| Total | 1,357 | 100.0% |
Union City borough Summary
Introduction
Union City Borough is a small borough located in Erie County, Pennsylvania. It is situated in the northwestern corner of the state, along the New York border. The borough is home to a population of approximately 2,000 people, and is part of the Erie Metropolitan Statistical Area. Union City Borough is a small, rural community with a rich history and a vibrant economy.
History
Union City Borough was founded in 1851 by a group of settlers from New York. The settlers were attracted to the area due to its proximity to the Erie Canal, which provided easy access to the Great Lakes. The borough was originally known as Unionville, and was later renamed Union City. The borough was officially incorporated in 1868.
The borough was an important stop on the Underground Railroad, and was home to several prominent abolitionists. During the Civil War, Union City was a major supplier of food and supplies to the Union Army.
Geography
Union City Borough is located in the northwestern corner of Pennsylvania, along the New York border. The borough is situated in the foothills of the Allegheny Mountains, and is part of the Erie Metropolitan Statistical Area. The borough is bordered by the boroughs of Corry to the north, and Waterford to the east. The borough is approximately 10 miles from the city of Erie.
The borough has a total area of 1.2 square miles, all of which is land. The borough is located in a humid continental climate zone, with cold winters and warm summers. The average annual temperature is 46 degrees Fahrenheit, and the average annual precipitation is 36 inches.
Economy
Union City Borough has a vibrant economy, with a variety of businesses and industries. The borough is home to several manufacturing companies, including a plastics manufacturer, a metal fabricator, and a machine shop. The borough is also home to several retail stores, restaurants, and other businesses.
The borough is home to several educational institutions, including Union City High School, Union City Middle School, and Union City Elementary School. The borough is also home to a branch of the Erie County Library System.
Demographics
As of the 2010 census, the population of Union City Borough was 2,039. The racial makeup of the borough was 97.3% White, 0.7% African American, 0.3% Native American, 0.3% Asian, 0.1% Pacific Islander, 0.3% from other races, and 0.9% from two or more races. Hispanic or Latino of any race were 1.2% of the population.
The median household income in the borough was $37,917, and the median family income was $45,938. The per capita income in the borough was $18,945. About 11.3% of families and 14.2% of the population were below the poverty line, including 19.2% of those under age 18 and 8.3% of those age 65 or over.
Conclusion
Union City Borough is a small, rural borough located in Erie County, Pennsylvania. The borough has a rich history and a vibrant economy, and is home to a population of approximately 2,000 people. The borough is home to several manufacturing companies, retail stores, restaurants, and educational institutions. The borough has a diverse population, with a median household income of $37,917 and a median family income of $45,938. Union City Borough is an important part of the Erie Metropolitan Statistical Area, and is a great place to live and work.
Common Questions
What is Per Capita Income in Union City borough?
Per Capita income in Union City borough is $25,176.
What is the Median Family Income in Union City borough?
Median Family Income in Union City borough is $54,554.
What is the Median Household income in Union City borough?
Median Household Income in Union City borough is $41,764.
What is Income or Wage Gap in Union City borough?
Income or Wage Gap in Union City borough is 43.6%.
Women in Union City borough earn 56.4 cents for every dollar earned by a man.
What is Family Income Deficit in Union City borough?
Family Income Deficit in Union City borough is $7,356.
Families that are below poverty line in Union City borough earn $7,356 less on average than the poverty threshold level.
What is Inequality or Gini Index in Union City borough?
Inequality or Gini Index in Union City borough is 0.46.
What is the Total Population of Union City borough?
Total Population of Union City borough is 2,937.
What is the Total Male Population of Union City borough?
Total Male Population of Union City borough is 1,207.
What is the Total Female Population of Union City borough?
Total Female Population of Union City borough is 1,730.
What is the Ratio of Males per 100 Females in Union City borough?
There are 69.77 Males per 100 Females in Union City borough.
What is the Ratio of Females per 100 Males in Union City borough?
There are 143.33 Females per 100 Males in Union City borough.
What is the Median Population Age in Union City borough?
Median Population Age in Union City borough is 46.6 Years.
What is the Average Family Size in Union City borough
Average Family Size in Union City borough is 2.8 People.
What is the Average Household Size in Union City borough
Average Household Size in Union City borough is 2.2 People.
How Large is the Labor Force in Union City borough?
There are 1,222 People in the Labor Forcein in Union City borough.
What is the Percentage of People in the Labor Force in Union City borough?
48.6% of People are in the Labor Force in Union City borough.
What is the Unemployment Rate in Union City borough?
Unemployment Rate in Union City borough is 7.5%.