Greencastle borough, PA Map & Demographics
Greencastle borough Overview
$44,613
PER CAPITA INCOME
$88,859
AVG FAMILY INCOME
$75,000
AVG HOUSEHOLD INCOME
13.0%
WAGE / INCOME GAP [ % ]
87.0¢/ $1
WAGE / INCOME GAP [ $ ]
0.48
INEQUALITY / GINI INDEX
4,235
TOTAL POPULATION
2,011
MALE POPULATION
2,224
FEMALE POPULATION
90.42
MALES / 100 FEMALES
110.59
FEMALES / 100 MALES
42.3
MEDIAN AGE
3.1
AVG FAMILY SIZE
2.5
AVG HOUSEHOLD SIZE
2,080
LABOR FORCE [ PEOPLE ]
63.7%
PERCENT IN LABOR FORCE
1.6%
UNEMPLOYMENT RATE
Income in Greencastle borough
Income Overview in Greencastle borough
Per Capita Income in Greencastle borough is $44,613, while median incomes of families and households are $88,859 and $75,000 respectively.
| Characteristic | Number | Measure |
| Per Capita Income | 4,235 | $44,613 |
| Median Family Income | 1,150 | $88,859 |
| Mean Family Income | 1,150 | $135,512 |
| Median Household Income | 1,698 | $75,000 |
| Mean Household Income | 1,698 | $109,183 |
| Income Deficit | 1,150 | $0 |
| Wage / Income Gap (%) | 4,235 | 12.97% |
| Wage / Income Gap ($) | 4,235 | 87.03¢ per $1 |
| Gini / Inequality Index | 4,235 | 0.48 |
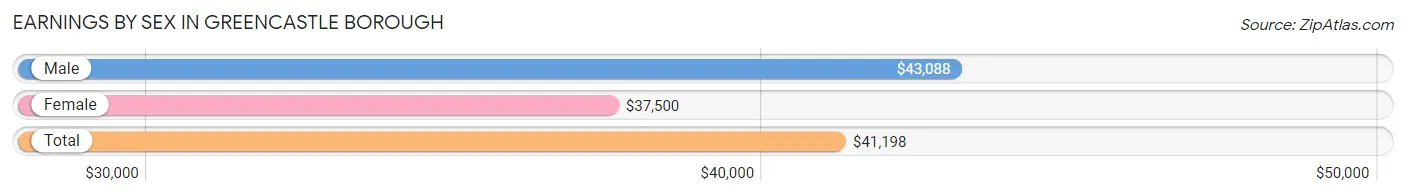
Earnings by Sex in Greencastle borough
Average Earnings in Greencastle borough are $41,198, $43,088 for men and $37,500 for women, a difference of 13.0%.
| Sex | Number | Average Earnings |
| Male | 1,158 (51.2%) | $43,088 |
| Female | 1,104 (48.8%) | $37,500 |
| Total | 2,262 (100.0%) | $41,198 |
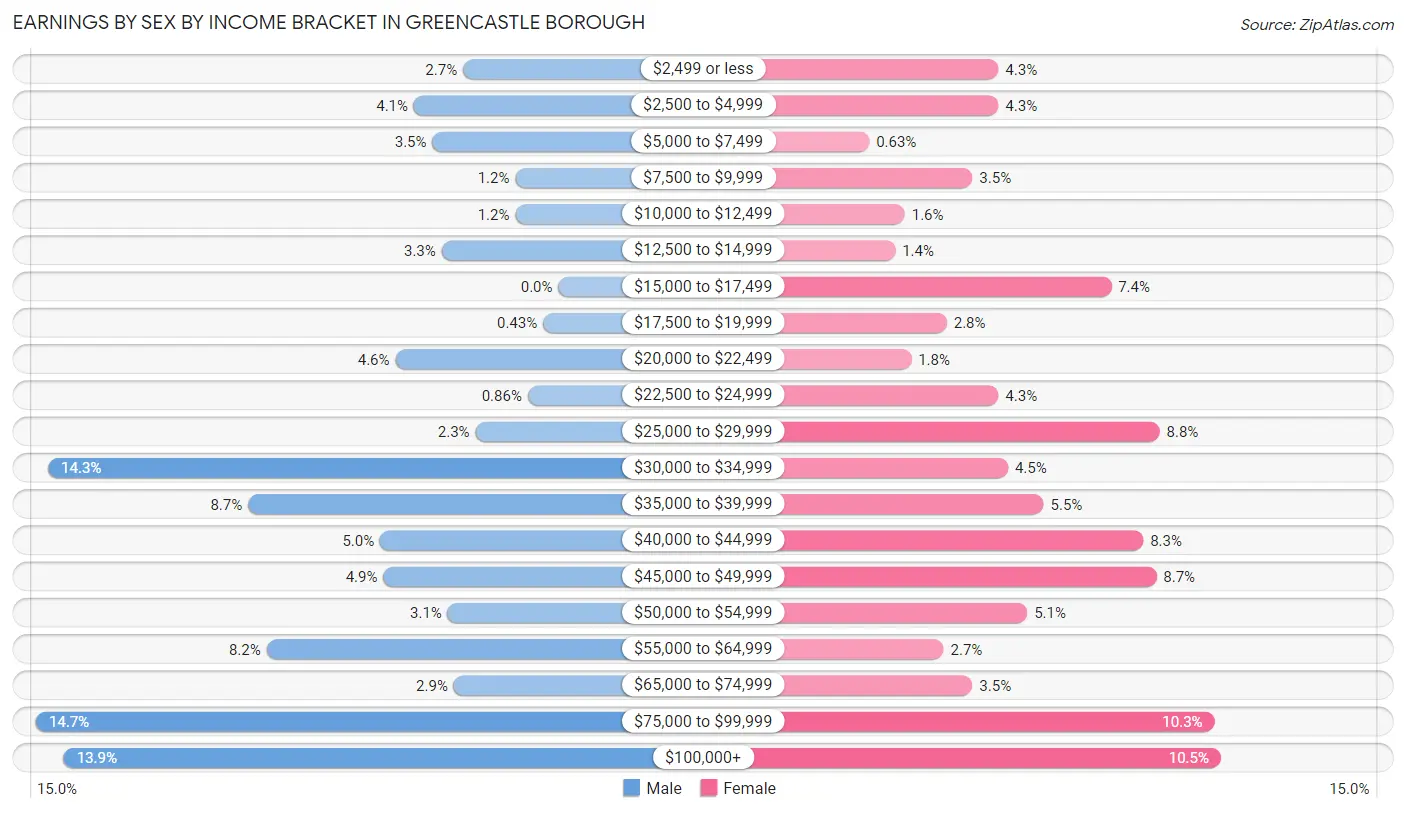
Earnings by Sex by Income Bracket in Greencastle borough
The most common earnings brackets in Greencastle borough are $75,000 to $99,999 for men (170 | 14.7%) and $100,000+ for women (116 | 10.5%).
| Income | Male | Female |
| $2,499 or less | 31 (2.7%) | 47 (4.3%) |
| $2,500 to $4,999 | 47 (4.1%) | 47 (4.3%) |
| $5,000 to $7,499 | 41 (3.5%) | 7 (0.6%) |
| $7,500 to $9,999 | 14 (1.2%) | 39 (3.5%) |
| $10,000 to $12,499 | 14 (1.2%) | 18 (1.6%) |
| $12,500 to $14,999 | 38 (3.3%) | 15 (1.4%) |
| $15,000 to $17,499 | 0 (0.0%) | 82 (7.4%) |
| $17,500 to $19,999 | 5 (0.4%) | 31 (2.8%) |
| $20,000 to $22,499 | 53 (4.6%) | 20 (1.8%) |
| $22,500 to $24,999 | 10 (0.9%) | 47 (4.3%) |
| $25,000 to $29,999 | 27 (2.3%) | 97 (8.8%) |
| $30,000 to $34,999 | 166 (14.3%) | 50 (4.5%) |
| $35,000 to $39,999 | 101 (8.7%) | 61 (5.5%) |
| $40,000 to $44,999 | 58 (5.0%) | 92 (8.3%) |
| $45,000 to $49,999 | 57 (4.9%) | 96 (8.7%) |
| $50,000 to $54,999 | 36 (3.1%) | 56 (5.1%) |
| $55,000 to $64,999 | 95 (8.2%) | 30 (2.7%) |
| $65,000 to $74,999 | 34 (2.9%) | 39 (3.5%) |
| $75,000 to $99,999 | 170 (14.7%) | 114 (10.3%) |
| $100,000+ | 161 (13.9%) | 116 (10.5%) |
| Total | 1,158 (100.0%) | 1,104 (100.0%) |
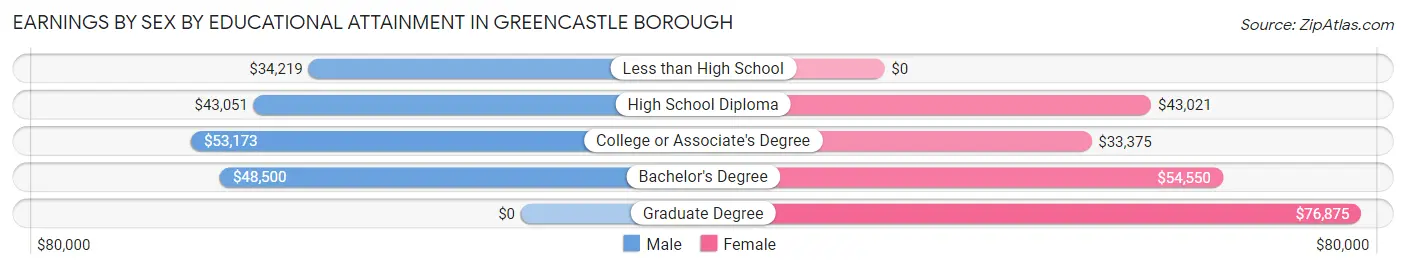
Earnings by Sex by Educational Attainment in Greencastle borough
Average earnings in Greencastle borough are $52,569 for men and $41,488 for women, a difference of 21.1%. Men with an educational attainment of college or associate's degree enjoy the highest average annual earnings of $53,173, while those with less than high school education earn the least with $34,219. Women with an educational attainment of graduate degree earn the most with the average annual earnings of $76,875, while those with college or associate's degree education have the smallest earnings of $33,375.
| Educational Attainment | Male Income | Female Income |
| Less than High School | $34,219 | $0 |
| High School Diploma | $43,051 | $43,021 |
| College or Associate's Degree | $53,173 | $33,375 |
| Bachelor's Degree | $48,500 | $54,550 |
| Graduate Degree | - | - |
| Total | $52,569 | $41,488 |
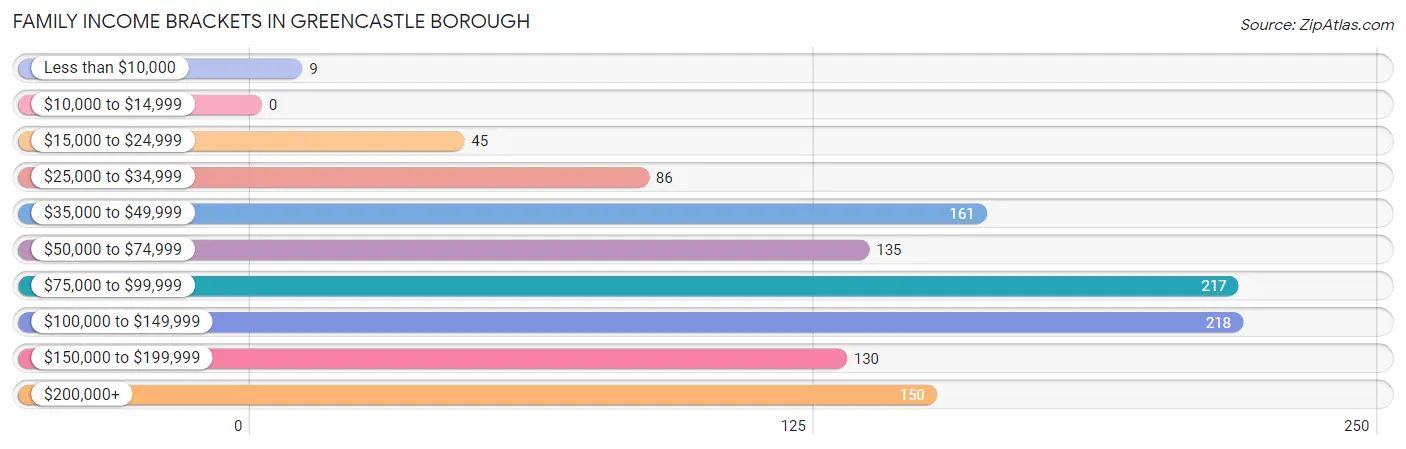
Family Income in Greencastle borough
Family Income Brackets in Greencastle borough
According to the Greencastle borough family income data, there are 218 families falling into the $100,000 to $149,999 income range, which is the most common income bracket and makes up 19.0% of all families.
| Income Bracket | # Families | % Families |
| Less than $10,000 | 9 | 0.8% |
| $10,000 to $14,999 | 0 | 0.0% |
| $15,000 to $24,999 | 45 | 3.9% |
| $25,000 to $34,999 | 86 | 7.5% |
| $35,000 to $49,999 | 161 | 14.0% |
| $50,000 to $74,999 | 135 | 11.7% |
| $75,000 to $99,999 | 217 | 18.9% |
| $100,000 to $149,999 | 218 | 19.0% |
| $150,000 to $199,999 | 130 | 11.3% |
| $200,000+ | 150 | 13.0% |
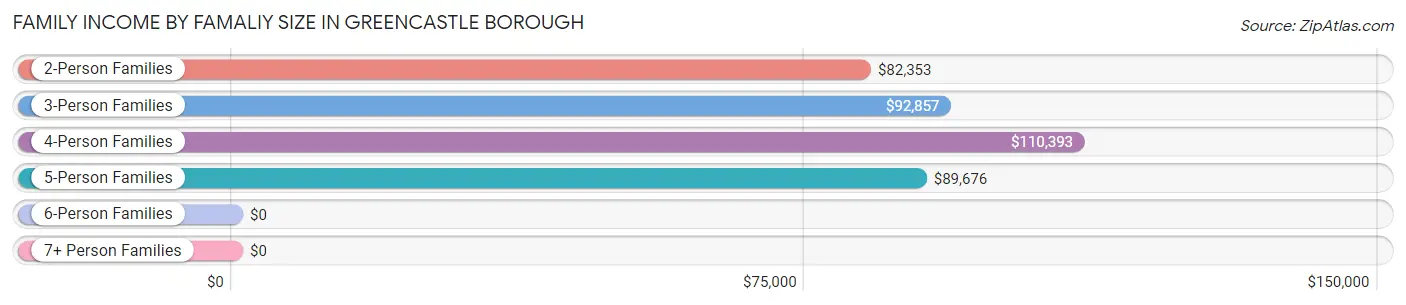
Family Income by Famaliy Size in Greencastle borough
4-person families (157 | 13.7%) account for the highest median family income in Greencastle borough with $110,393 per family, while 2-person families (658 | 57.2%) have the highest median income of $41,176 per family member.
| Income Bracket | # Families | Median Income |
| 2-Person Families | 658 (57.2%) | $82,353 |
| 3-Person Families | 148 (12.9%) | $92,857 |
| 4-Person Families | 157 (13.7%) | $110,393 |
| 5-Person Families | 117 (10.2%) | $89,676 |
| 6-Person Families | 13 (1.1%) | $0 |
| 7+ Person Families | 57 (5.0%) | $0 |
| Total | 1,150 (100.0%) | $88,859 |
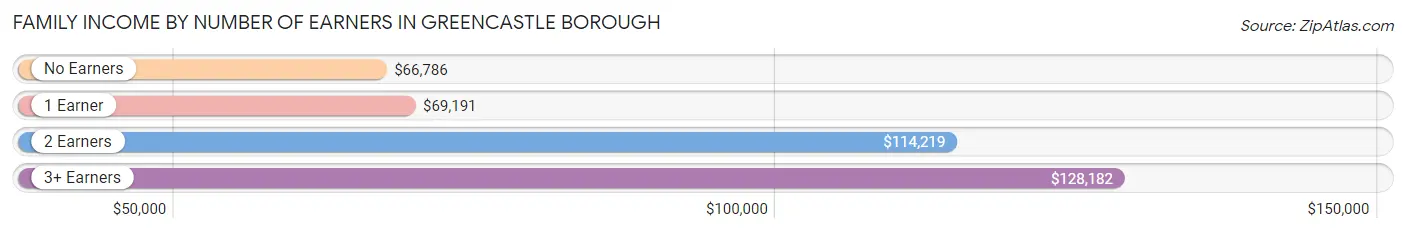
Family Income by Number of Earners in Greencastle borough
The median family income in Greencastle borough is $88,859, with families comprising 3+ earners (98) having the highest median family income of $128,182, while families with no earners (138) have the lowest median family income of $66,786, accounting for 8.5% and 12.0% of families, respectively.
| Number of Earners | # Families | Median Income |
| No Earners | 138 (12.0%) | $66,786 |
| 1 Earner | 457 (39.7%) | $69,191 |
| 2 Earners | 457 (39.7%) | $114,219 |
| 3+ Earners | 98 (8.5%) | $128,182 |
| Total | 1,150 (100.0%) | $88,859 |
Household Income in Greencastle borough
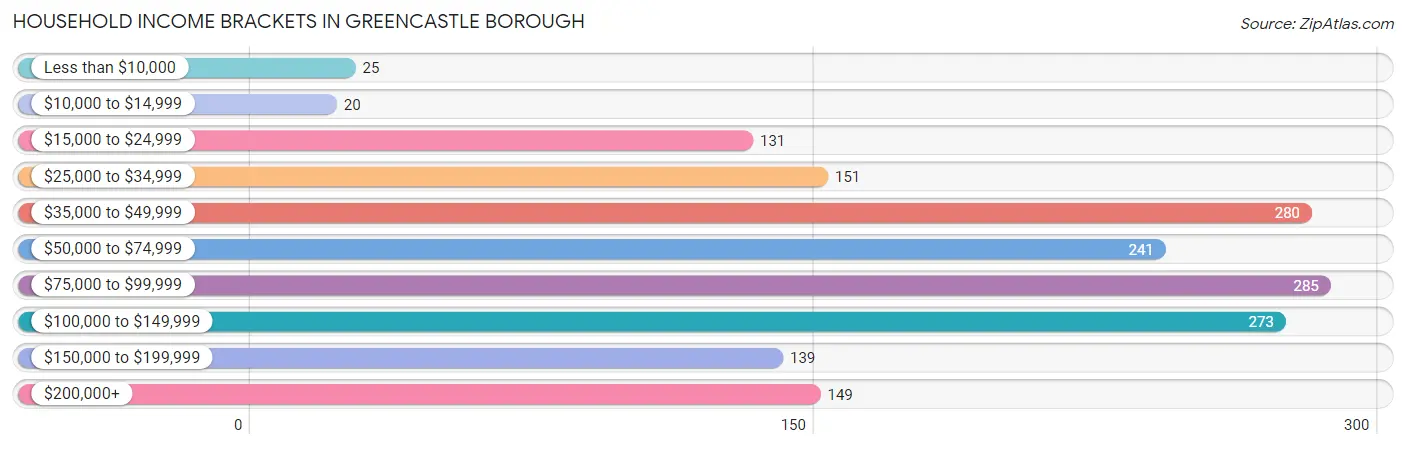
Household Income Brackets in Greencastle borough
With 285 households falling in the category, the $75,000 to $99,999 income range is the most frequent in Greencastle borough, accounting for 16.8% of all households. In contrast, only 20 households (1.2%) fall into the $10,000 to $14,999 income bracket, making it the least populous group.
| Income Bracket | # Households | % Households |
| Less than $10,000 | 25 | 1.5% |
| $10,000 to $14,999 | 20 | 1.2% |
| $15,000 to $24,999 | 131 | 7.7% |
| $25,000 to $34,999 | 151 | 8.9% |
| $35,000 to $49,999 | 280 | 16.5% |
| $50,000 to $74,999 | 241 | 14.2% |
| $75,000 to $99,999 | 285 | 16.8% |
| $100,000 to $149,999 | 273 | 16.1% |
| $150,000 to $199,999 | 139 | 8.2% |
| $200,000+ | 149 | 8.8% |
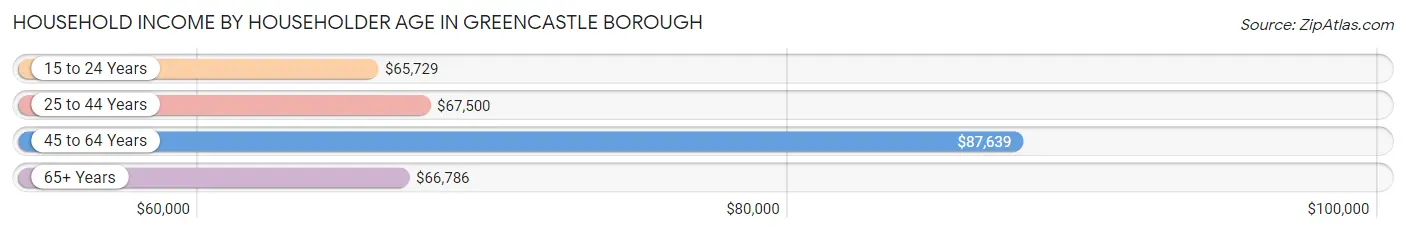
Household Income by Householder Age in Greencastle borough
The median household income in Greencastle borough is $75,000, with the highest median household income of $87,639 found in the 45 to 64 years age bracket for the primary householder. A total of 703 households (41.4%) fall into this category. Meanwhile, the 15 to 24 years age bracket for the primary householder has the lowest median household income of $65,729, with 33 households (1.9%) in this group.
| Income Bracket | # Households | Median Income |
| 15 to 24 Years | 33 (1.9%) | $65,729 |
| 25 to 44 Years | 480 (28.3%) | $67,500 |
| 45 to 64 Years | 703 (41.4%) | $87,639 |
| 65+ Years | 482 (28.4%) | $66,786 |
| Total | 1,698 (100.0%) | $75,000 |
Poverty in Greencastle borough
Income Below Poverty by Sex and Age in Greencastle borough
With 3.7% poverty level for males and 8.3% for females among the residents of Greencastle borough, under 5 year old males and 5 year old females are the most vulnerable to poverty, with 24 males (19.5%) and 20 females (100.0%) in their respective age groups living below the poverty level.
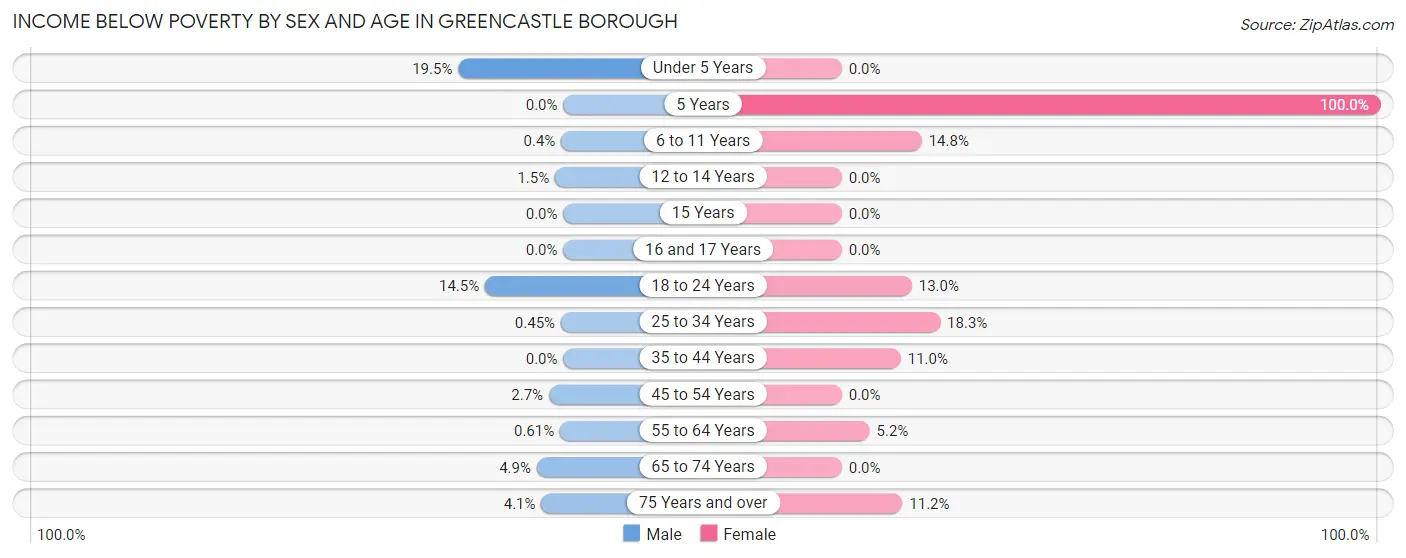
| Age Bracket | Male | Female |
| Under 5 Years | 24 (19.5%) | 0 (0.0%) |
| 5 Years | 0 (0.0%) | 20 (100.0%) |
| 6 to 11 Years | 1 (0.4%) | 23 (14.8%) |
| 12 to 14 Years | 1 (1.5%) | 0 (0.0%) |
| 15 Years | 0 (0.0%) | 0 (0.0%) |
| 16 and 17 Years | 0 (0.0%) | 0 (0.0%) |
| 18 to 24 Years | 25 (14.5%) | 13 (13.0%) |
| 25 to 34 Years | 1 (0.4%) | 44 (18.3%) |
| 35 to 44 Years | 0 (0.0%) | 37 (11.0%) |
| 45 to 54 Years | 4 (2.7%) | 0 (0.0%) |
| 55 to 64 Years | 2 (0.6%) | 19 (5.2%) |
| 65 to 74 Years | 9 (4.9%) | 0 (0.0%) |
| 75 Years and over | 8 (4.1%) | 29 (11.2%) |
| Total | 75 (3.7%) | 185 (8.3%) |
Income Above Poverty by Sex and Age in Greencastle borough
According to the poverty statistics in Greencastle borough, males aged 5 years and females aged under 5 years are the age groups that are most secure financially, with 100.0% of males and 100.0% of females in these age groups living above the poverty line.
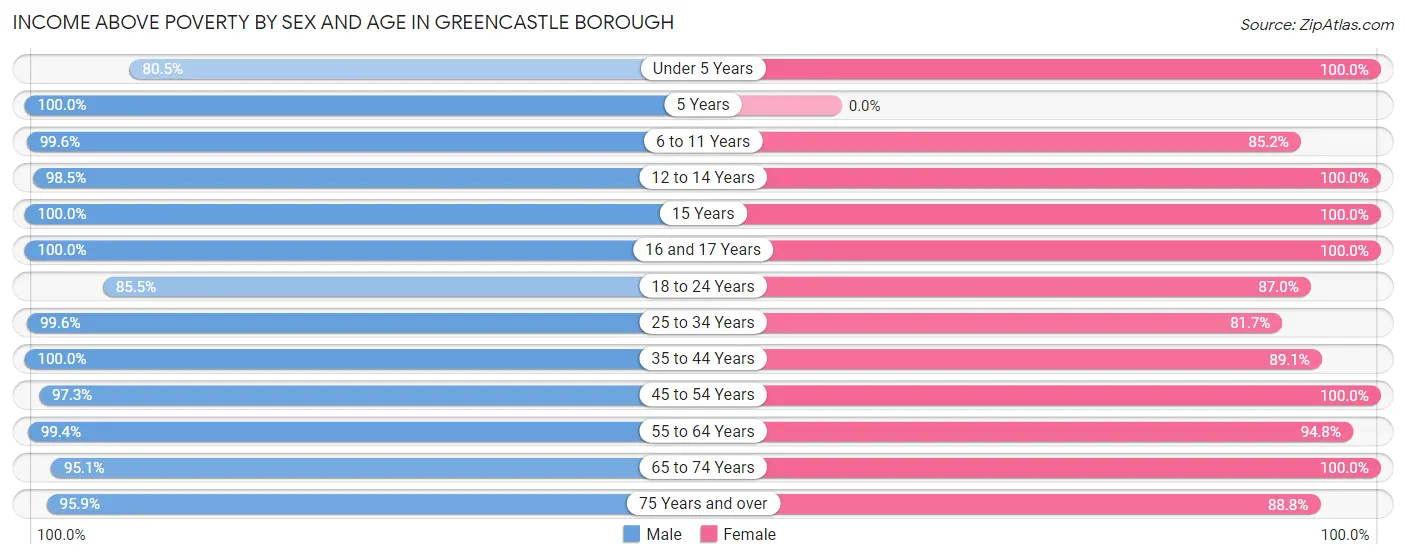
| Age Bracket | Male | Female |
| Under 5 Years | 99 (80.5%) | 265 (100.0%) |
| 5 Years | 9 (100.0%) | 0 (0.0%) |
| 6 to 11 Years | 247 (99.6%) | 132 (85.2%) |
| 12 to 14 Years | 64 (98.5%) | 34 (100.0%) |
| 15 Years | 15 (100.0%) | 35 (100.0%) |
| 16 and 17 Years | 58 (100.0%) | 10 (100.0%) |
| 18 to 24 Years | 147 (85.5%) | 87 (87.0%) |
| 25 to 34 Years | 223 (99.6%) | 197 (81.7%) |
| 35 to 44 Years | 239 (100.0%) | 301 (89.0%) |
| 45 to 54 Years | 146 (97.3%) | 255 (100.0%) |
| 55 to 64 Years | 327 (99.4%) | 349 (94.8%) |
| 65 to 74 Years | 174 (95.1%) | 145 (100.0%) |
| 75 Years and over | 188 (95.9%) | 229 (88.8%) |
| Total | 1,936 (96.3%) | 2,039 (91.7%) |
Income Below Poverty Among Married-Couple Families in Greencastle borough
The poverty statistics for married-couple families in Greencastle borough show that 2.9% or 25 of the total 864 families live below the poverty line. Families with 3 or 4 children have the highest poverty rate of 19.1%, comprising of 16 families. On the other hand, families with 1 or 2 children have the lowest poverty rate of 0.0%, which includes 0 families.
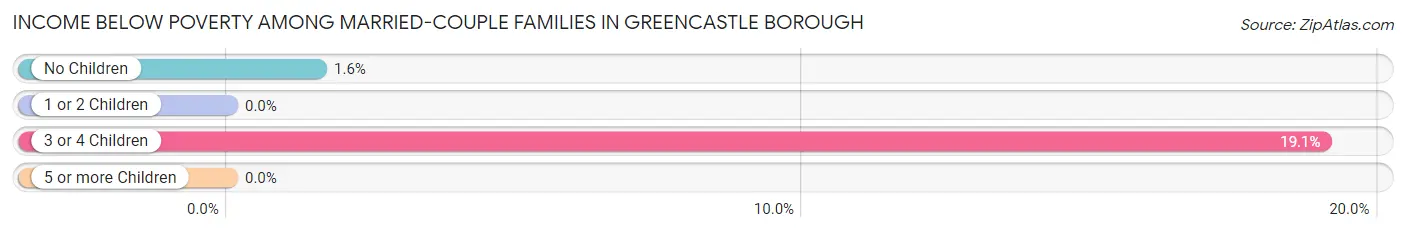
| Children | Above Poverty | Below Poverty |
| No Children | 572 (98.5%) | 9 (1.5%) |
| 1 or 2 Children | 142 (100.0%) | 0 (0.0%) |
| 3 or 4 Children | 68 (80.9%) | 16 (19.1%) |
| 5 or more Children | 57 (100.0%) | 0 (0.0%) |
| Total | 839 (97.1%) | 25 (2.9%) |
Income Below Poverty Among Single-Parent Households in Greencastle borough
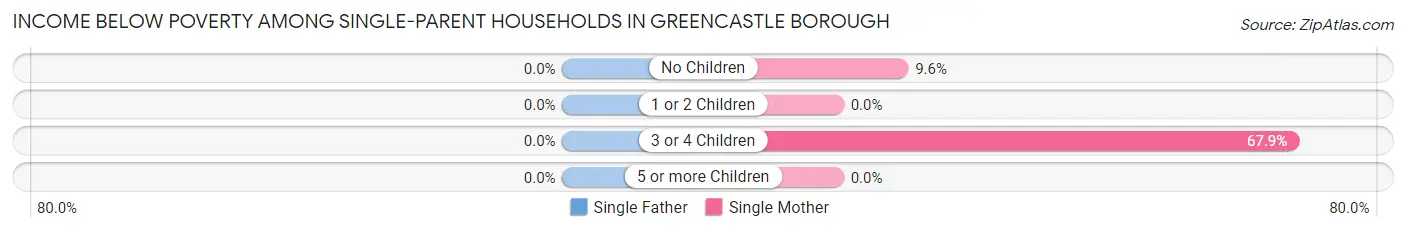
| Children | Single Father | Single Mother |
| No Children | 0 (0.0%) | 10 (9.6%) |
| 1 or 2 Children | 0 (0.0%) | 0 (0.0%) |
| 3 or 4 Children | 0 (0.0%) | 19 (67.9%) |
| 5 or more Children | 0 (0.0%) | 0 (0.0%) |
| Total | 0 (0.0%) | 29 (12.4%) |
Income Below Poverty Among Married-Couple vs Single-Parent Households in Greencastle borough
The poverty data for Greencastle borough shows that 25 of the married-couple family households (2.9%) and 29 of the single-parent households (10.1%) are living below the poverty level. Within the married-couple family households, those with 3 or 4 children have the highest poverty rate, with 16 households (19.1%) falling below the poverty line. Among the single-parent households, those with 3 or 4 children have the highest poverty rate, with 19 household (67.9%) living below poverty.
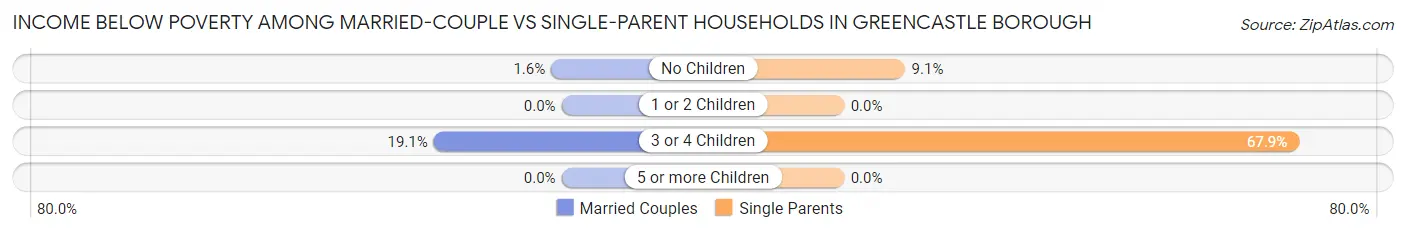
| Children | Married-Couple Families | Single-Parent Households |
| No Children | 9 (1.5%) | 10 (9.1%) |
| 1 or 2 Children | 0 (0.0%) | 0 (0.0%) |
| 3 or 4 Children | 16 (19.1%) | 19 (67.9%) |
| 5 or more Children | 0 (0.0%) | 0 (0.0%) |
| Total | 25 (2.9%) | 29 (10.1%) |
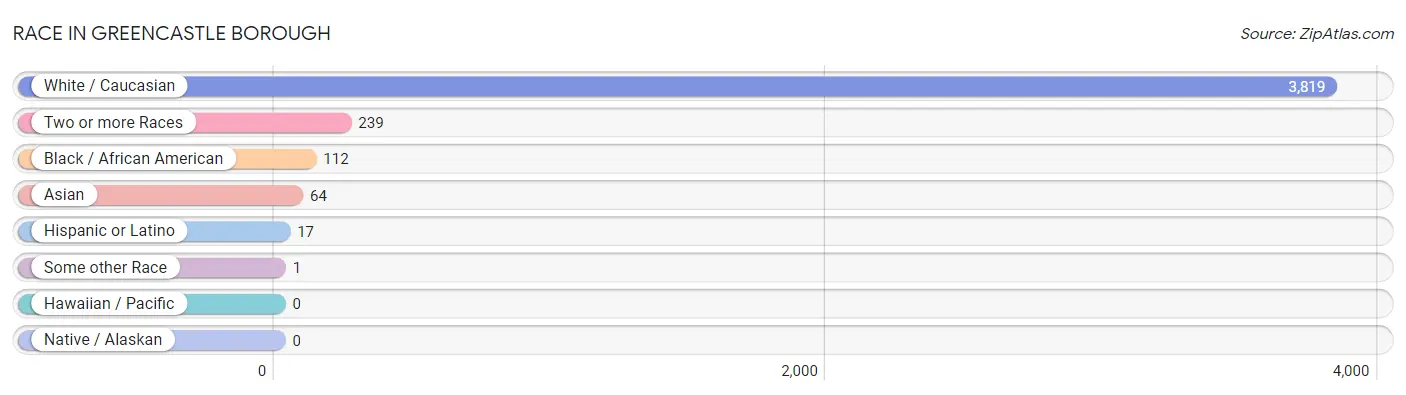
Race in Greencastle borough
The most populous races in Greencastle borough are White / Caucasian (3,819 | 90.2%), Two or more Races (239 | 5.6%), and Black / African American (112 | 2.6%).
| Race | # Population | % Population |
| Asian | 64 | 1.5% |
| Black / African American | 112 | 2.6% |
| Hawaiian / Pacific | 0 | 0.0% |
| Hispanic or Latino | 17 | 0.4% |
| Native / Alaskan | 0 | 0.0% |
| White / Caucasian | 3,819 | 90.2% |
| Two or more Races | 239 | 5.6% |
| Some other Race | 1 | 0.0% |
| Total | 4,235 | 100.0% |
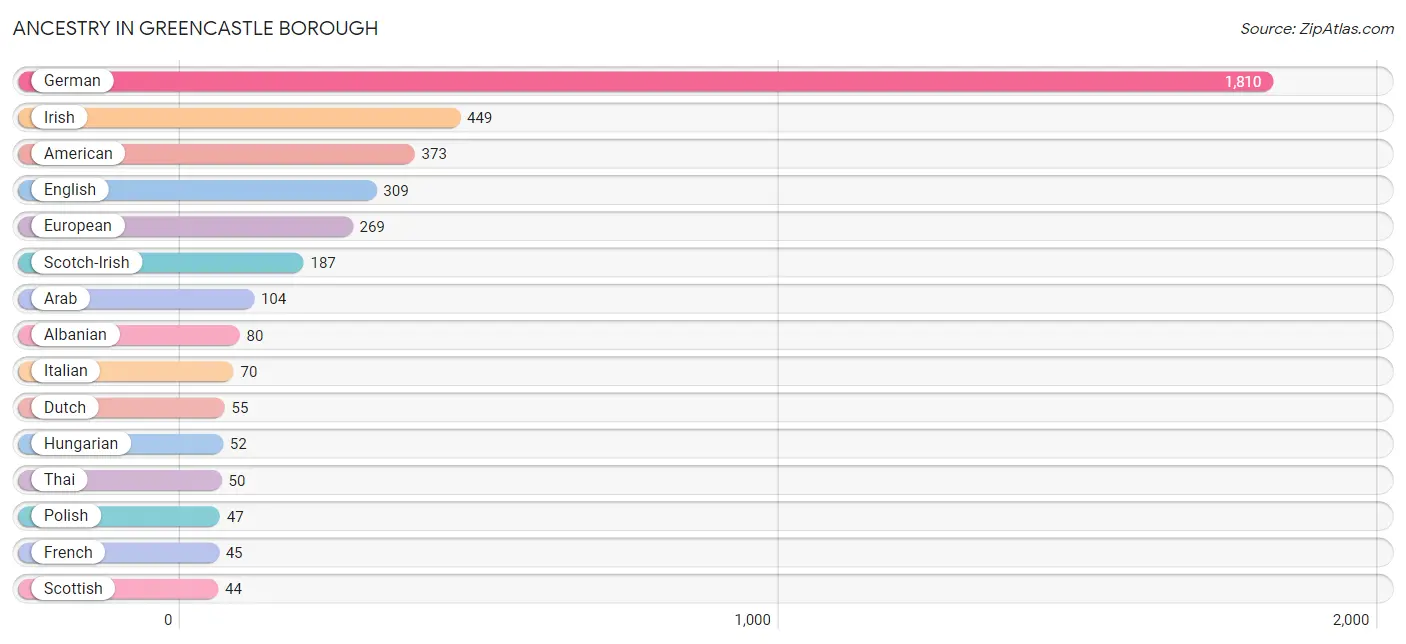
Ancestry in Greencastle borough
The most populous ancestries reported in Greencastle borough are German (1,810 | 42.7%), Irish (449 | 10.6%), American (373 | 8.8%), English (309 | 7.3%), and European (269 | 6.4%), together accounting for 75.8% of all Greencastle borough residents.
| Ancestry | # Population | % Population |
| African | 21 | 0.5% |
| Albanian | 80 | 1.9% |
| American | 373 | 8.8% |
| Arab | 104 | 2.5% |
| Austrian | 16 | 0.4% |
| Burmese | 14 | 0.3% |
| Carpatho Rusyn | 9 | 0.2% |
| Cherokee | 16 | 0.4% |
| Dutch | 55 | 1.3% |
| English | 309 | 7.3% |
| European | 269 | 6.4% |
| French | 45 | 1.1% |
| French Canadian | 21 | 0.5% |
| German | 1,810 | 42.7% |
| Hungarian | 52 | 1.2% |
| Irish | 449 | 10.6% |
| Italian | 70 | 1.7% |
| Mexican | 15 | 0.4% |
| Polish | 47 | 1.1% |
| Puerto Rican | 2 | 0.1% |
| Scandinavian | 9 | 0.2% |
| Scotch-Irish | 187 | 4.4% |
| Scottish | 44 | 1.0% |
| Serbian | 11 | 0.3% |
| Subsaharan African | 21 | 0.5% |
| Swedish | 16 | 0.4% |
| Swiss | 18 | 0.4% |
| Thai | 50 | 1.2% |
| Yugoslavian | 14 | 0.3% | View All 29 Rows |
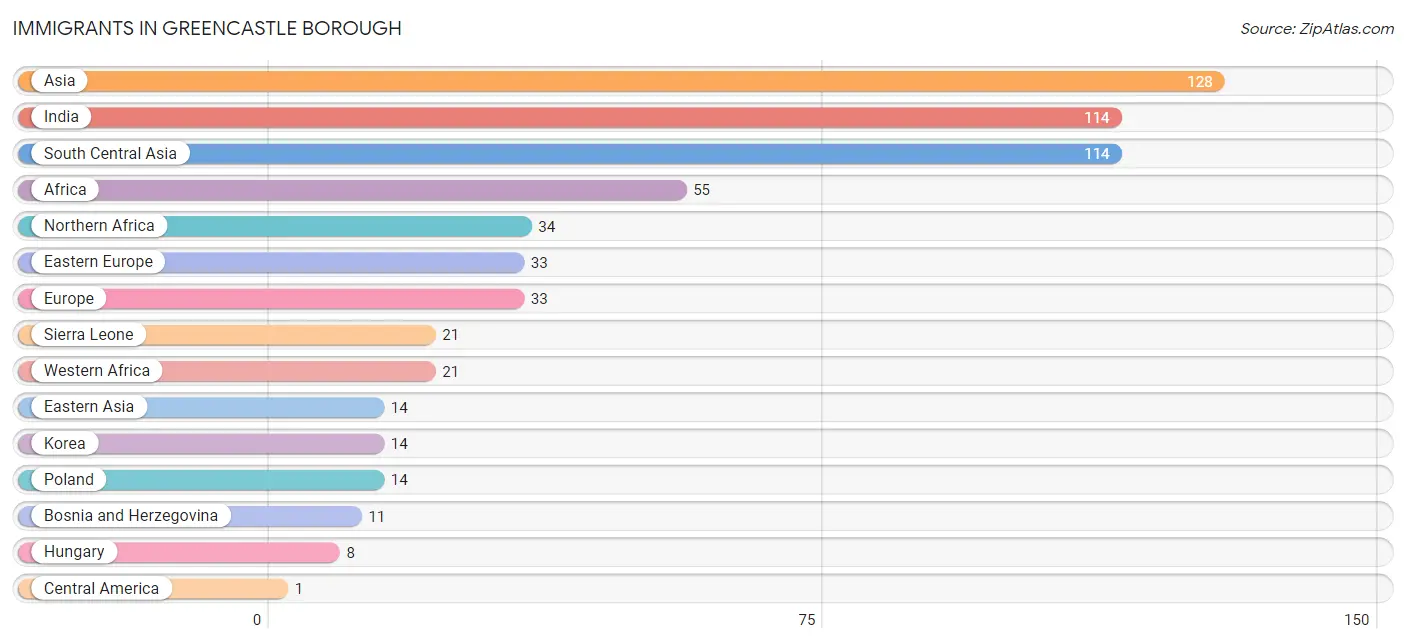
Immigrants in Greencastle borough
The most numerous immigrant groups reported in Greencastle borough came from Asia (128 | 3.0%), India (114 | 2.7%), South Central Asia (114 | 2.7%), Africa (55 | 1.3%), and Northern Africa (34 | 0.8%), together accounting for 10.5% of all Greencastle borough residents.
| Immigration Origin | # Population | % Population |
| Africa | 55 | 1.3% |
| Asia | 128 | 3.0% |
| Bosnia and Herzegovina | 11 | 0.3% |
| Central America | 1 | 0.0% |
| Eastern Asia | 14 | 0.3% |
| Eastern Europe | 33 | 0.8% |
| Europe | 33 | 0.8% |
| Hungary | 8 | 0.2% |
| India | 114 | 2.7% |
| Korea | 14 | 0.3% |
| Latin America | 1 | 0.0% |
| Mexico | 1 | 0.0% |
| Northern Africa | 34 | 0.8% |
| Poland | 14 | 0.3% |
| Sierra Leone | 21 | 0.5% |
| South Central Asia | 114 | 2.7% |
| Western Africa | 21 | 0.5% | View All 17 Rows |
Sex and Age in Greencastle borough
Sex and Age in Greencastle borough
The most populous age groups in Greencastle borough are 40 to 44 Years (181 | 9.0%) for men and Under 5 Years (265 | 11.9%) for women.
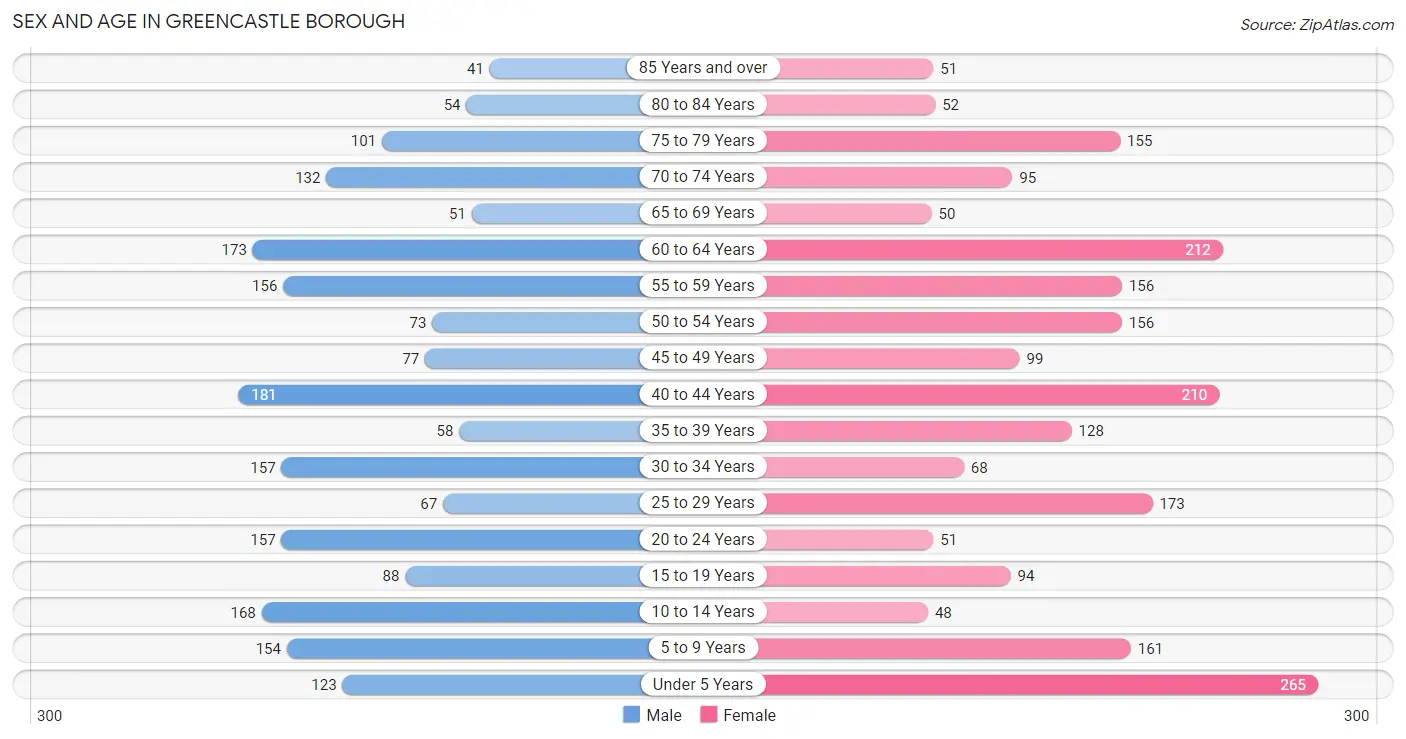
| Age Bracket | Male | Female |
| Under 5 Years | 123 (6.1%) | 265 (11.9%) |
| 5 to 9 Years | 154 (7.7%) | 161 (7.2%) |
| 10 to 14 Years | 168 (8.4%) | 48 (2.2%) |
| 15 to 19 Years | 88 (4.4%) | 94 (4.2%) |
| 20 to 24 Years | 157 (7.8%) | 51 (2.3%) |
| 25 to 29 Years | 67 (3.3%) | 173 (7.8%) |
| 30 to 34 Years | 157 (7.8%) | 68 (3.1%) |
| 35 to 39 Years | 58 (2.9%) | 128 (5.8%) |
| 40 to 44 Years | 181 (9.0%) | 210 (9.4%) |
| 45 to 49 Years | 77 (3.8%) | 99 (4.4%) |
| 50 to 54 Years | 73 (3.6%) | 156 (7.0%) |
| 55 to 59 Years | 156 (7.8%) | 156 (7.0%) |
| 60 to 64 Years | 173 (8.6%) | 212 (9.5%) |
| 65 to 69 Years | 51 (2.5%) | 50 (2.2%) |
| 70 to 74 Years | 132 (6.6%) | 95 (4.3%) |
| 75 to 79 Years | 101 (5.0%) | 155 (7.0%) |
| 80 to 84 Years | 54 (2.7%) | 52 (2.3%) |
| 85 Years and over | 41 (2.0%) | 51 (2.3%) |
| Total | 2,011 (100.0%) | 2,224 (100.0%) |
Families and Households in Greencastle borough
Median Family Size in Greencastle borough
The median family size in Greencastle borough is 3.07 persons per family, with single male/father families (52 | 4.5%) accounting for the largest median family size of 4.42 persons per family. On the other hand, single female/mother families (234 | 20.3%) represent the smallest median family size with 2.60 persons per family.
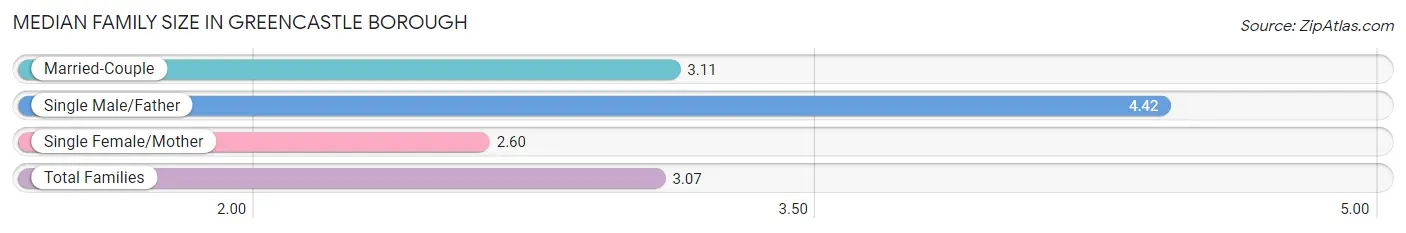
| Family Type | # Families | Family Size |
| Married-Couple | 864 (75.1%) | 3.11 |
| Single Male/Father | 52 (4.5%) | 4.42 |
| Single Female/Mother | 234 (20.3%) | 2.60 |
| Total Families | 1,150 (100.0%) | 3.07 |
Median Household Size in Greencastle borough
The median household size in Greencastle borough is 2.49 persons per household, with single male/father households (52 | 3.1%) accounting for the largest median household size of 4.63 persons per household. non-family households (548 | 32.3%) represent the smallest median household size with 1.20 persons per household.
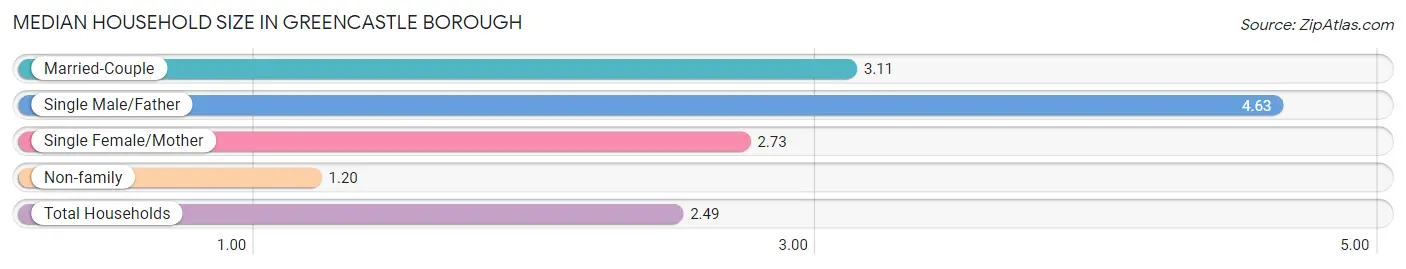
| Household Type | # Households | Household Size |
| Married-Couple | 864 (50.9%) | 3.11 |
| Single Male/Father | 52 (3.1%) | 4.63 |
| Single Female/Mother | 234 (13.8%) | 2.73 |
| Non-family | 548 (32.3%) | 1.20 |
| Total Households | 1,698 (100.0%) | 2.49 |
Household Size by Marriage Status in Greencastle borough
Out of a total of 1,698 households in Greencastle borough, 1,150 (67.7%) are family households, while 548 (32.3%) are nonfamily households. The most numerous type of family households are 2-person households, comprising 658, and the most common type of nonfamily households are 1-person households, comprising 462.
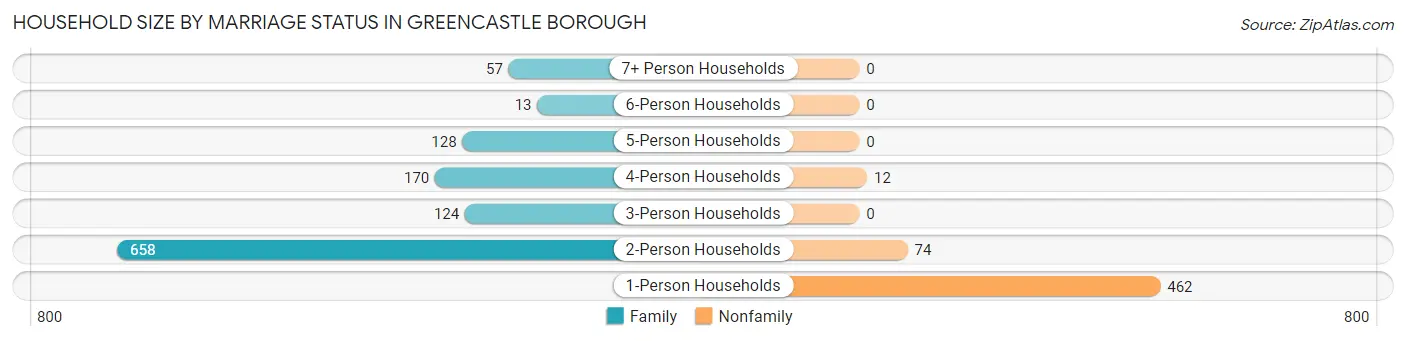
| Household Size | Family Households | Nonfamily Households |
| 1-Person Households | - | 462 (27.2%) |
| 2-Person Households | 658 (38.8%) | 74 (4.4%) |
| 3-Person Households | 124 (7.3%) | 0 (0.0%) |
| 4-Person Households | 170 (10.0%) | 12 (0.7%) |
| 5-Person Households | 128 (7.5%) | 0 (0.0%) |
| 6-Person Households | 13 (0.8%) | 0 (0.0%) |
| 7+ Person Households | 57 (3.4%) | 0 (0.0%) |
| Total | 1,150 (67.7%) | 548 (32.3%) |
Female Fertility in Greencastle borough
Fertility by Age in Greencastle borough
Average fertility rate in Greencastle borough is 73.0 births per 1,000 women. Women in the age bracket of 35 to 50 years have the highest fertility rate with 88.0 births per 1,000 women. Women in the age bracket of 35 to 50 years acount for 66.1% of all women with births.
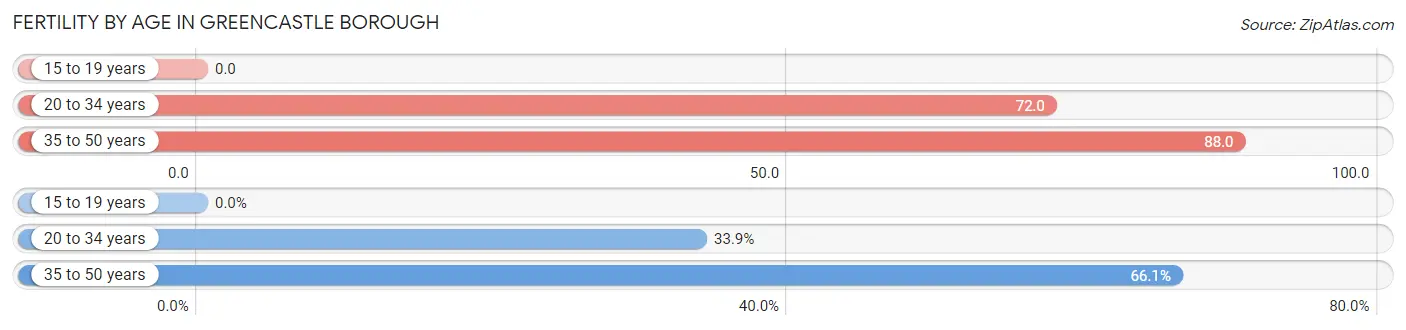
| Age Bracket | Women with Births | Births / 1,000 Women |
| 15 to 19 years | 0 (0.0%) | 0.0 |
| 20 to 34 years | 21 (33.9%) | 72.0 |
| 35 to 50 years | 41 (66.1%) | 88.0 |
| Total | 62 (100.0%) | 73.0 |
Fertility by Age by Marriage Status in Greencastle borough
30.6% of women with births (62) in Greencastle borough are married. The highest percentage of unmarried women with births falls into 35 to 50 years age bracket with 78.0% of them unmarried at the time of birth, while the lowest percentage of unmarried women with births belong to 20 to 34 years age bracket with 52.4% of them unmarried.
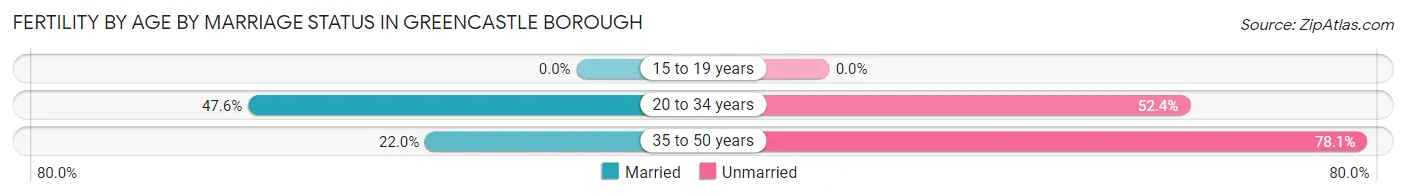
| Age Bracket | Married | Unmarried |
| 15 to 19 years | 0 (0.0%) | 0 (0.0%) |
| 20 to 34 years | 10 (47.6%) | 11 (52.4%) |
| 35 to 50 years | 9 (22.0%) | 32 (78.0%) |
| Total | 19 (30.6%) | 43 (69.4%) |
Fertility by Education in Greencastle borough
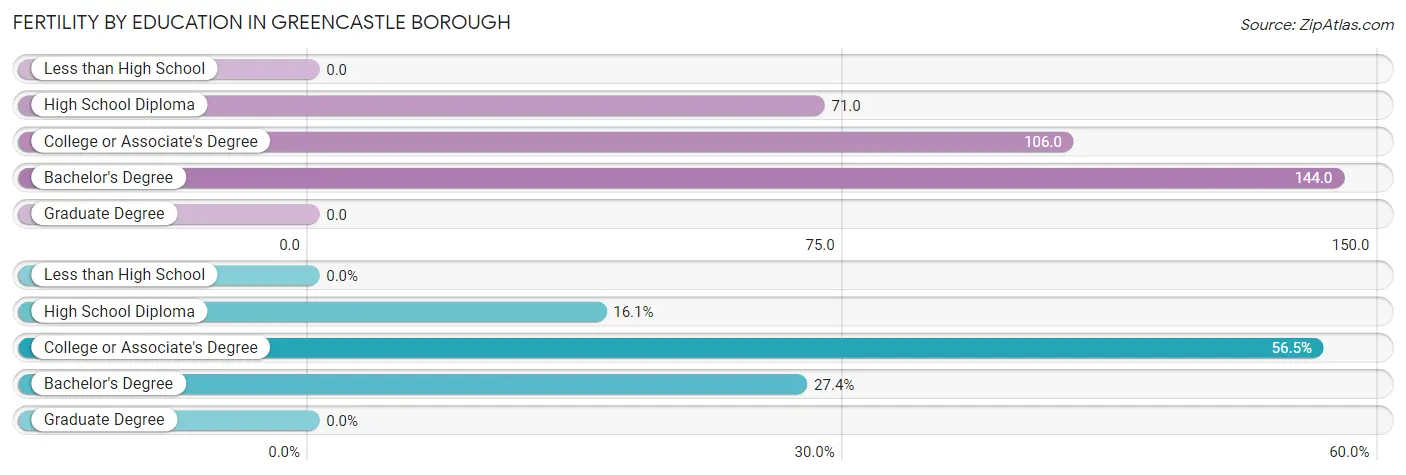
| Educational Attainment | Women with Births | Births / 1,000 Women |
| Less than High School | 0 (0.0%) | 0.0 |
| High School Diploma | 10 (16.1%) | 71.0 |
| College or Associate's Degree | 35 (56.5%) | 106.0 |
| Bachelor's Degree | 17 (27.4%) | 144.0 |
| Graduate Degree | 0 (0.0%) | 0.0 |
| Total | 62 (100.0%) | 73.0 |
Fertility by Education by Marriage Status in Greencastle borough
69.4% of women with births in Greencastle borough are unmarried. Women with the educational attainment of high school diploma are most likely to be married with 100.0% of them married at childbirth, while women with the educational attainment of college or associate's degree are least likely to be married with 100.0% of them unmarried at childbirth.
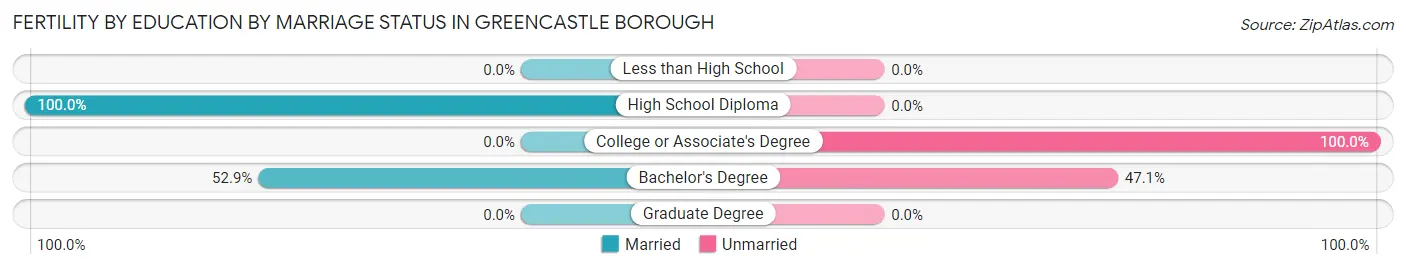
| Educational Attainment | Married | Unmarried |
| Less than High School | 0 (0.0%) | 0 (0.0%) |
| High School Diploma | 10 (100.0%) | 0 (0.0%) |
| College or Associate's Degree | 0 (0.0%) | 35 (100.0%) |
| Bachelor's Degree | 9 (52.9%) | 8 (47.1%) |
| Graduate Degree | 0 (0.0%) | 0 (0.0%) |
| Total | 19 (30.6%) | 43 (69.4%) |
Employment Characteristics in Greencastle borough
Employment by Class of Employer in Greencastle borough
Among the 2,035 employed individuals in Greencastle borough, private company employees (1,389 | 68.3%), not-for-profit organizations (193 | 9.5%), and self-employed (not incorporated) (152 | 7.5%) make up the most common classes of employment.
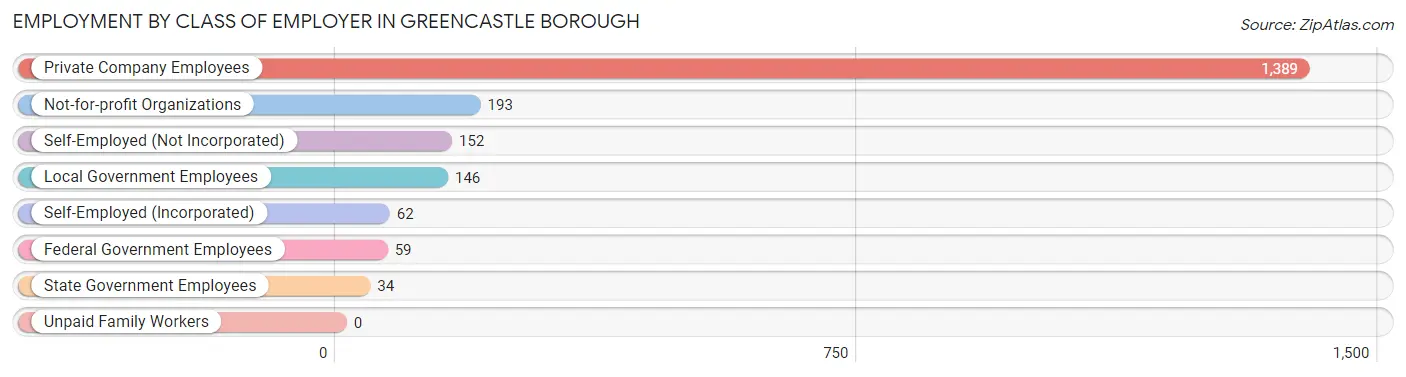
| Employer Class | # Employees | % Employees |
| Private Company Employees | 1,389 | 68.3% |
| Self-Employed (Incorporated) | 62 | 3.0% |
| Self-Employed (Not Incorporated) | 152 | 7.5% |
| Not-for-profit Organizations | 193 | 9.5% |
| Local Government Employees | 146 | 7.2% |
| State Government Employees | 34 | 1.7% |
| Federal Government Employees | 59 | 2.9% |
| Unpaid Family Workers | 0 | 0.0% |
| Total | 2,035 | 100.0% |
Employment Status by Age in Greencastle borough
According to the labor force statistics for Greencastle borough, out of the total population over 16 years of age (3,266), 63.7% or 2,080 individuals are in the labor force, with 1.6% or 33 of them unemployed. The age group with the highest labor force participation rate is 45 to 54 years, with 95.6% or 387 individuals in the labor force. Within the labor force, the 55 to 59 years age range has the highest percentage of unemployed individuals, with 5.8% or 14 of them being unemployed.
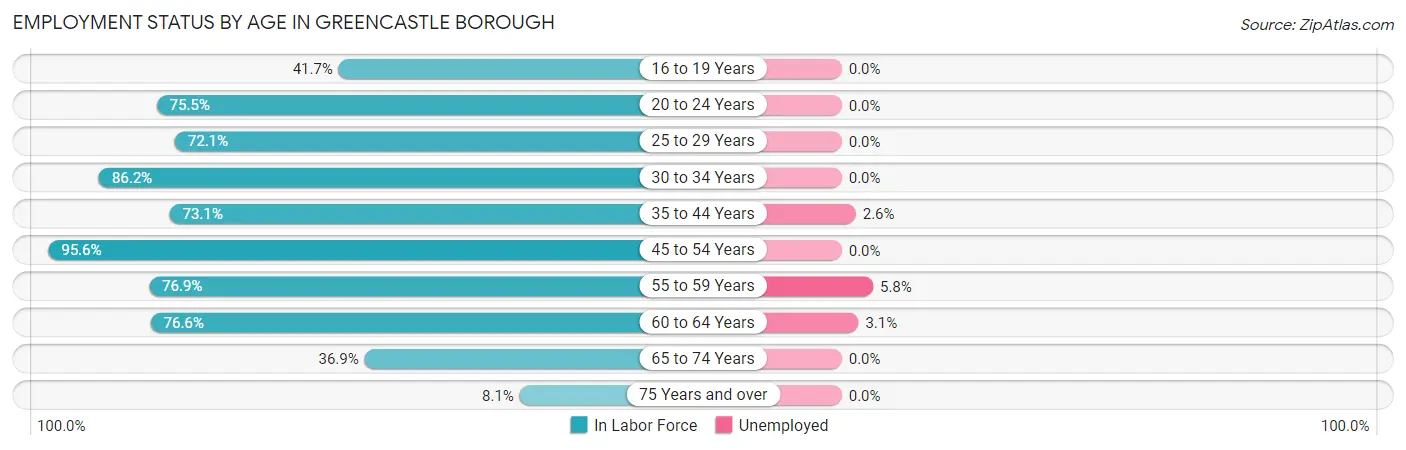
| Age Bracket | In Labor Force | Unemployed |
| 16 to 19 Years | 55 (41.7%) | 0 (0.0%) |
| 20 to 24 Years | 157 (75.5%) | 0 (0.0%) |
| 25 to 29 Years | 173 (72.1%) | 0 (0.0%) |
| 30 to 34 Years | 194 (86.2%) | 0 (0.0%) |
| 35 to 44 Years | 422 (73.1%) | 11 (2.6%) |
| 45 to 54 Years | 387 (95.6%) | 0 (0.0%) |
| 55 to 59 Years | 240 (76.9%) | 14 (5.8%) |
| 60 to 64 Years | 295 (76.6%) | 9 (3.1%) |
| 65 to 74 Years | 121 (36.9%) | 0 (0.0%) |
| 75 Years and over | 37 (8.1%) | 0 (0.0%) |
| Total | 2,080 (63.7%) | 33 (1.6%) |
Employment Status by Educational Attainment in Greencastle borough
According to labor force statistics for Greencastle borough, 79.8% of individuals (1,711) out of the total population between 25 and 64 years of age (2,144) are in the labor force, with 2.0% or 34 of them being unemployed. The group with the highest labor force participation rate are those with the educational attainment of bachelor's degree or higher, with 84.1% or 578 individuals in the labor force. Within the labor force, individuals with college / associate degree education have the highest percentage of unemployment, with 4.4% or 21 of them being unemployed.
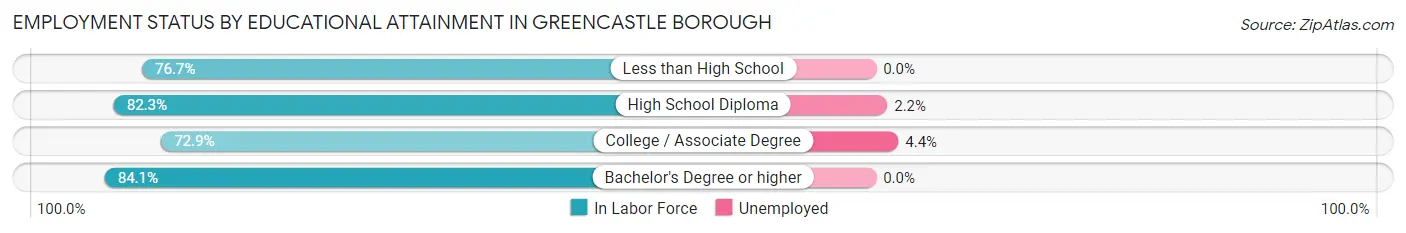
| Educational Attainment | In Labor Force | Unemployed |
| Less than High School | 46 (76.7%) | 0 (0.0%) |
| High School Diploma | 604 (82.3%) | 16 (2.2%) |
| College / Associate Degree | 483 (72.9%) | 29 (4.4%) |
| Bachelor's Degree or higher | 578 (84.1%) | 0 (0.0%) |
| Total | 1,711 (79.8%) | 43 (2.0%) |
Employment Occupations by Sex in Greencastle borough
Management, Business, Science and Arts Occupations
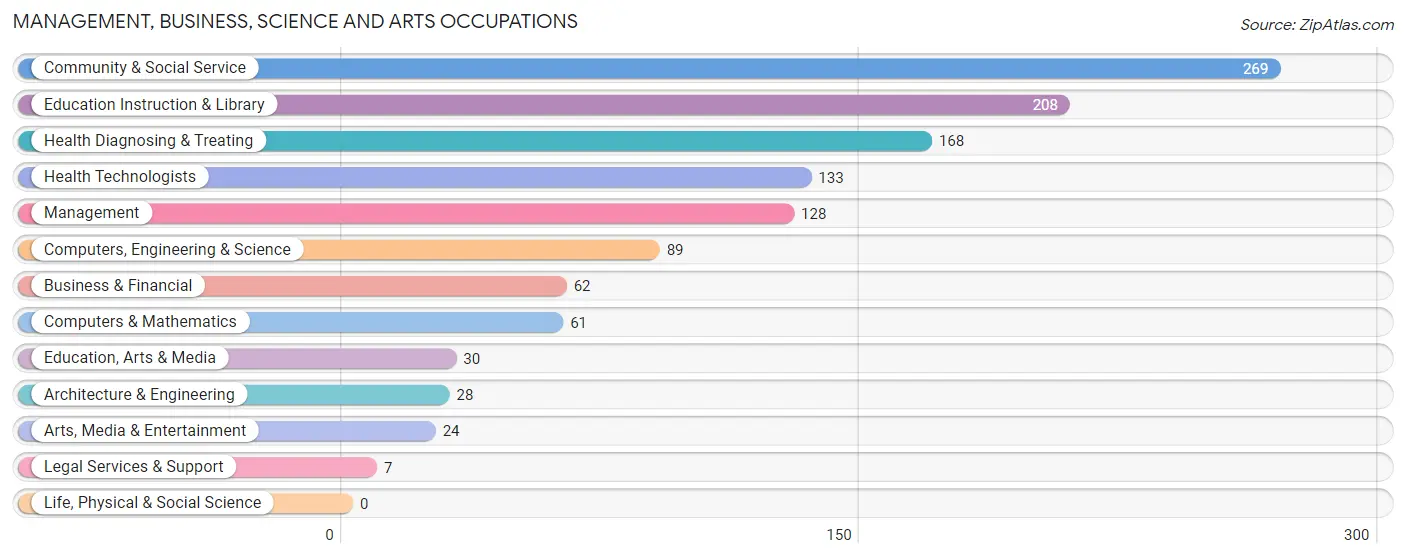
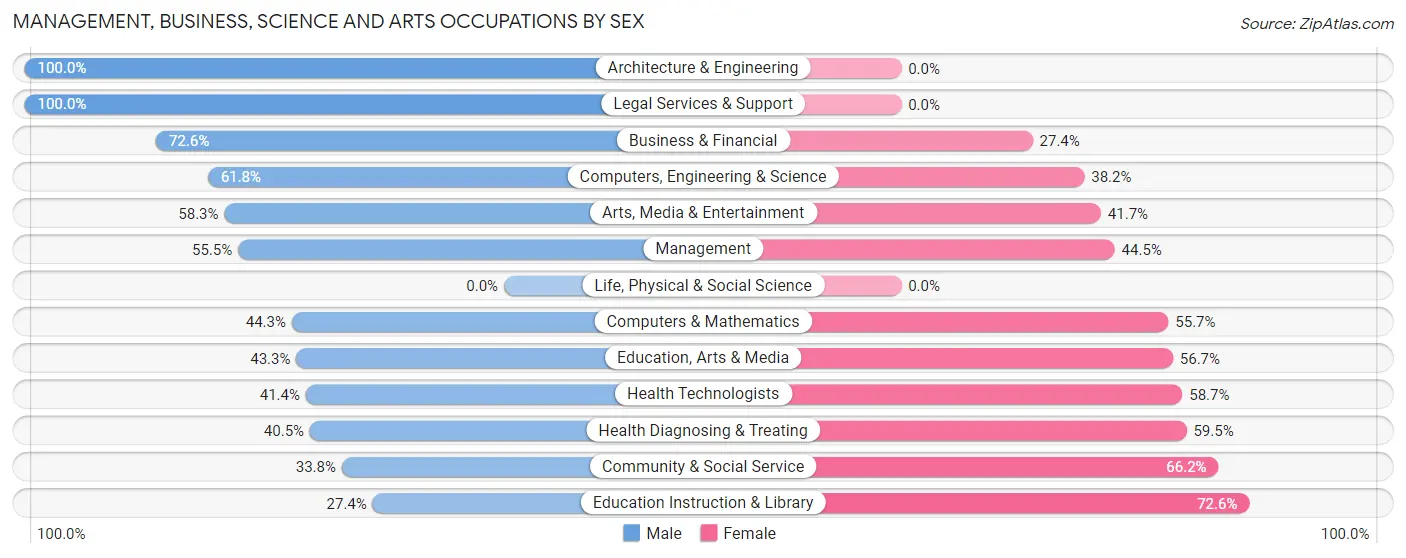
The most common Management, Business, Science and Arts occupations in Greencastle borough are Community & Social Service (269 | 13.2%), Education Instruction & Library (208 | 10.2%), Health Diagnosing & Treating (168 | 8.2%), Health Technologists (133 | 6.5%), and Management (128 | 6.3%).
Management, Business, Science and Arts Occupations by Sex
Within the Management, Business, Science and Arts occupations in Greencastle borough, the most male-oriented occupations are Architecture & Engineering (100.0%), Legal Services & Support (100.0%), and Business & Financial (72.6%), while the most female-oriented occupations are Education Instruction & Library (72.6%), Community & Social Service (66.2%), and Health Diagnosing & Treating (59.5%).
| Occupation | Male | Female |
| Management | 71 (55.5%) | 57 (44.5%) |
| Business & Financial | 45 (72.6%) | 17 (27.4%) |
| Computers, Engineering & Science | 55 (61.8%) | 34 (38.2%) |
| Computers & Mathematics | 27 (44.3%) | 34 (55.7%) |
| Architecture & Engineering | 28 (100.0%) | 0 (0.0%) |
| Life, Physical & Social Science | 0 (0.0%) | 0 (0.0%) |
| Community & Social Service | 91 (33.8%) | 178 (66.2%) |
| Education, Arts & Media | 13 (43.3%) | 17 (56.7%) |
| Legal Services & Support | 7 (100.0%) | 0 (0.0%) |
| Education Instruction & Library | 57 (27.4%) | 151 (72.6%) |
| Arts, Media & Entertainment | 14 (58.3%) | 10 (41.7%) |
| Health Diagnosing & Treating | 68 (40.5%) | 100 (59.5%) |
| Health Technologists | 55 (41.3%) | 78 (58.7%) |
| Total (Category) | 330 (46.1%) | 386 (53.9%) |
| Total (Overall) | 1,029 (50.4%) | 1,012 (49.6%) |
Services Occupations
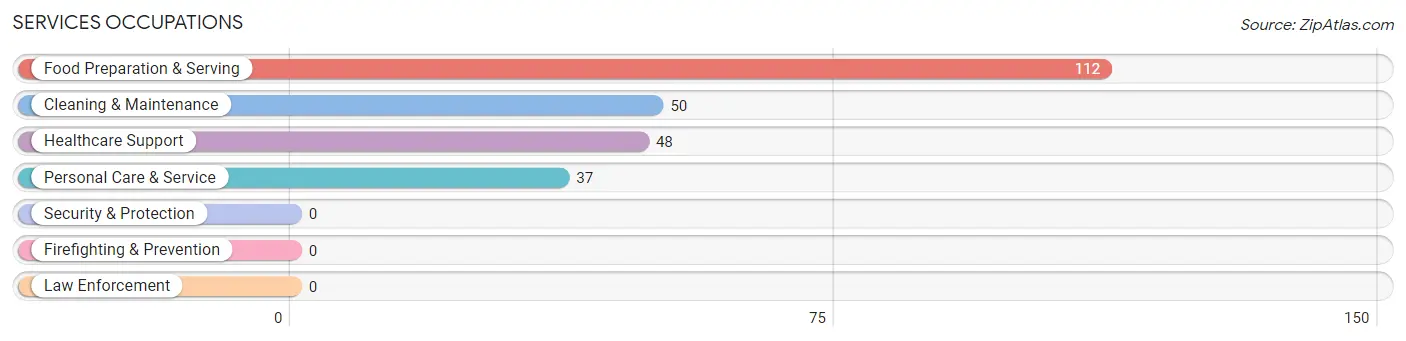
The most common Services occupations in Greencastle borough are Food Preparation & Serving (112 | 5.5%), Cleaning & Maintenance (50 | 2.5%), Healthcare Support (48 | 2.4%), and Personal Care & Service (37 | 1.8%).
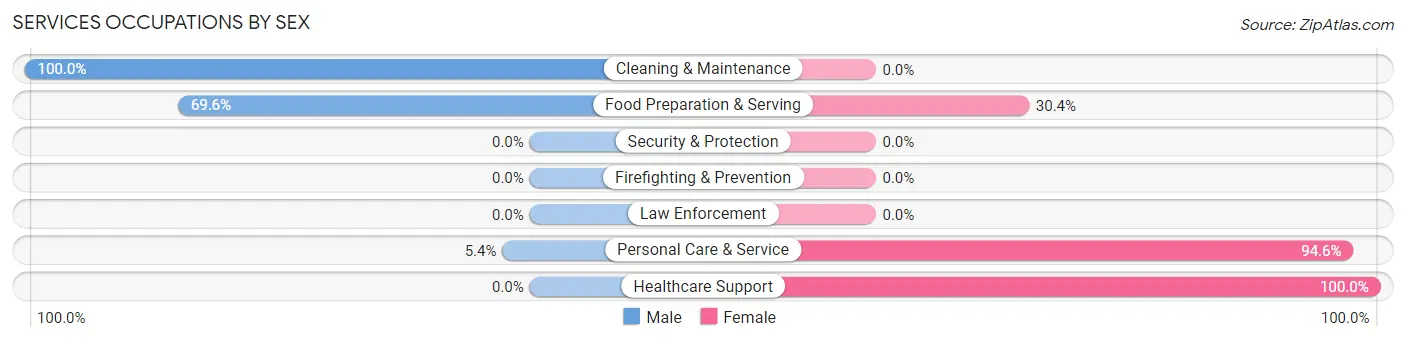
Services Occupations by Sex
Within the Services occupations in Greencastle borough, the most male-oriented occupations are Cleaning & Maintenance (100.0%), Food Preparation & Serving (69.6%), and Personal Care & Service (5.4%), while the most female-oriented occupations are Healthcare Support (100.0%), Personal Care & Service (94.6%), and Food Preparation & Serving (30.4%).
| Occupation | Male | Female |
| Healthcare Support | 0 (0.0%) | 48 (100.0%) |
| Security & Protection | 0 (0.0%) | 0 (0.0%) |
| Firefighting & Prevention | 0 (0.0%) | 0 (0.0%) |
| Law Enforcement | 0 (0.0%) | 0 (0.0%) |
| Food Preparation & Serving | 78 (69.6%) | 34 (30.4%) |
| Cleaning & Maintenance | 50 (100.0%) | 0 (0.0%) |
| Personal Care & Service | 2 (5.4%) | 35 (94.6%) |
| Total (Category) | 130 (52.6%) | 117 (47.4%) |
| Total (Overall) | 1,029 (50.4%) | 1,012 (49.6%) |
Sales and Office Occupations
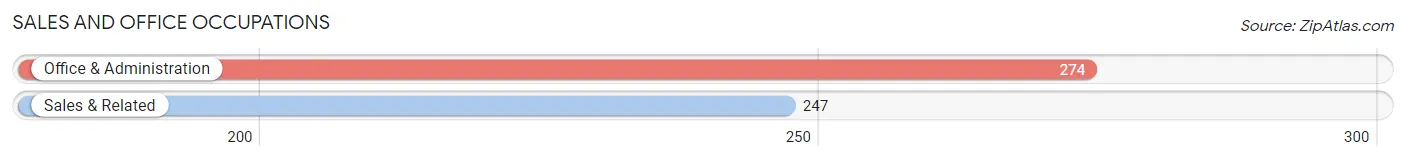
The most common Sales and Office occupations in Greencastle borough are Office & Administration (274 | 13.4%), and Sales & Related (247 | 12.1%).
Sales and Office Occupations by Sex
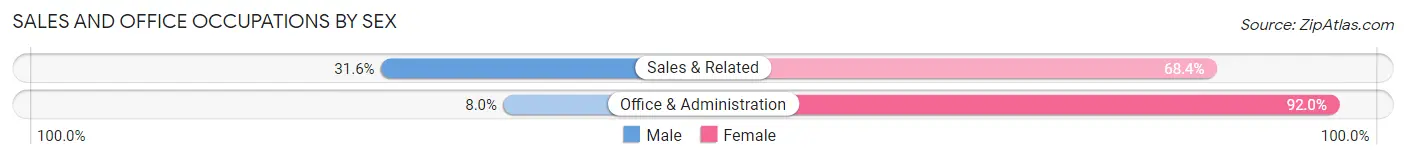
| Occupation | Male | Female |
| Sales & Related | 78 (31.6%) | 169 (68.4%) |
| Office & Administration | 22 (8.0%) | 252 (92.0%) |
| Total (Category) | 100 (19.2%) | 421 (80.8%) |
| Total (Overall) | 1,029 (50.4%) | 1,012 (49.6%) |
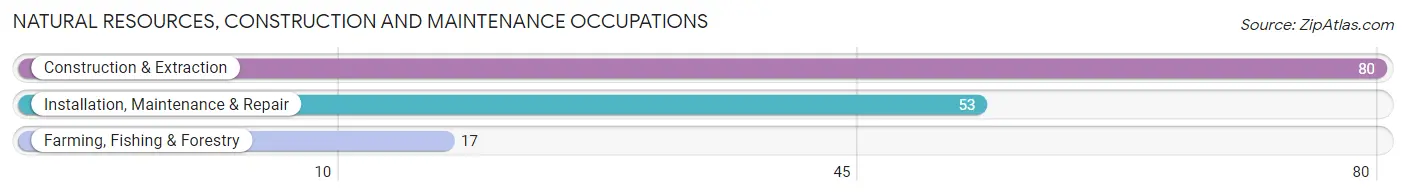
Natural Resources, Construction and Maintenance Occupations
The most common Natural Resources, Construction and Maintenance occupations in Greencastle borough are Construction & Extraction (80 | 3.9%), Installation, Maintenance & Repair (53 | 2.6%), and Farming, Fishing & Forestry (17 | 0.8%).
Natural Resources, Construction and Maintenance Occupations by Sex
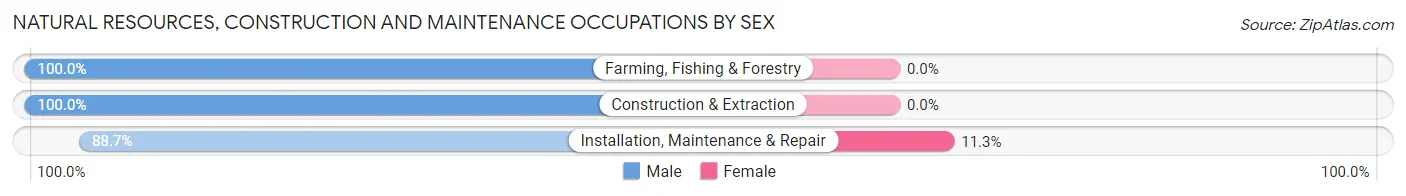
| Occupation | Male | Female |
| Farming, Fishing & Forestry | 17 (100.0%) | 0 (0.0%) |
| Construction & Extraction | 80 (100.0%) | 0 (0.0%) |
| Installation, Maintenance & Repair | 47 (88.7%) | 6 (11.3%) |
| Total (Category) | 144 (96.0%) | 6 (4.0%) |
| Total (Overall) | 1,029 (50.4%) | 1,012 (49.6%) |
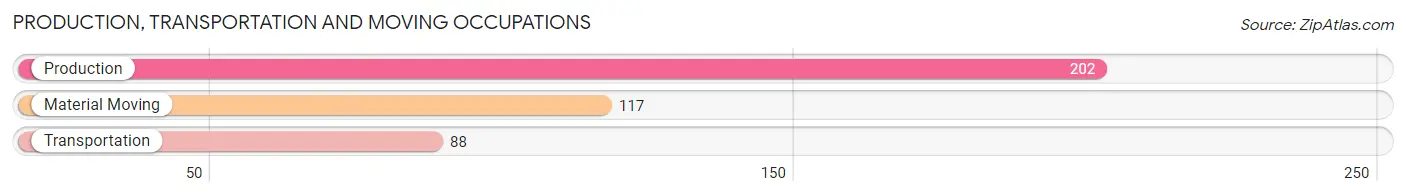
Production, Transportation and Moving Occupations
The most common Production, Transportation and Moving occupations in Greencastle borough are Production (202 | 9.9%), Material Moving (117 | 5.7%), and Transportation (88 | 4.3%).
Production, Transportation and Moving Occupations by Sex
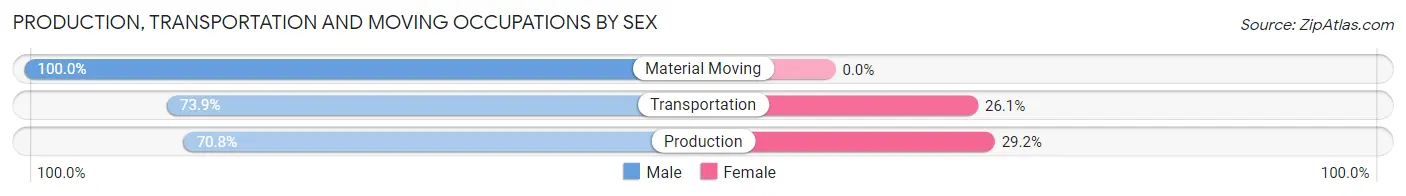
| Occupation | Male | Female |
| Production | 143 (70.8%) | 59 (29.2%) |
| Transportation | 65 (73.9%) | 23 (26.1%) |
| Material Moving | 117 (100.0%) | 0 (0.0%) |
| Total (Category) | 325 (79.8%) | 82 (20.2%) |
| Total (Overall) | 1,029 (50.4%) | 1,012 (49.6%) |
Employment Industries by Sex in Greencastle borough
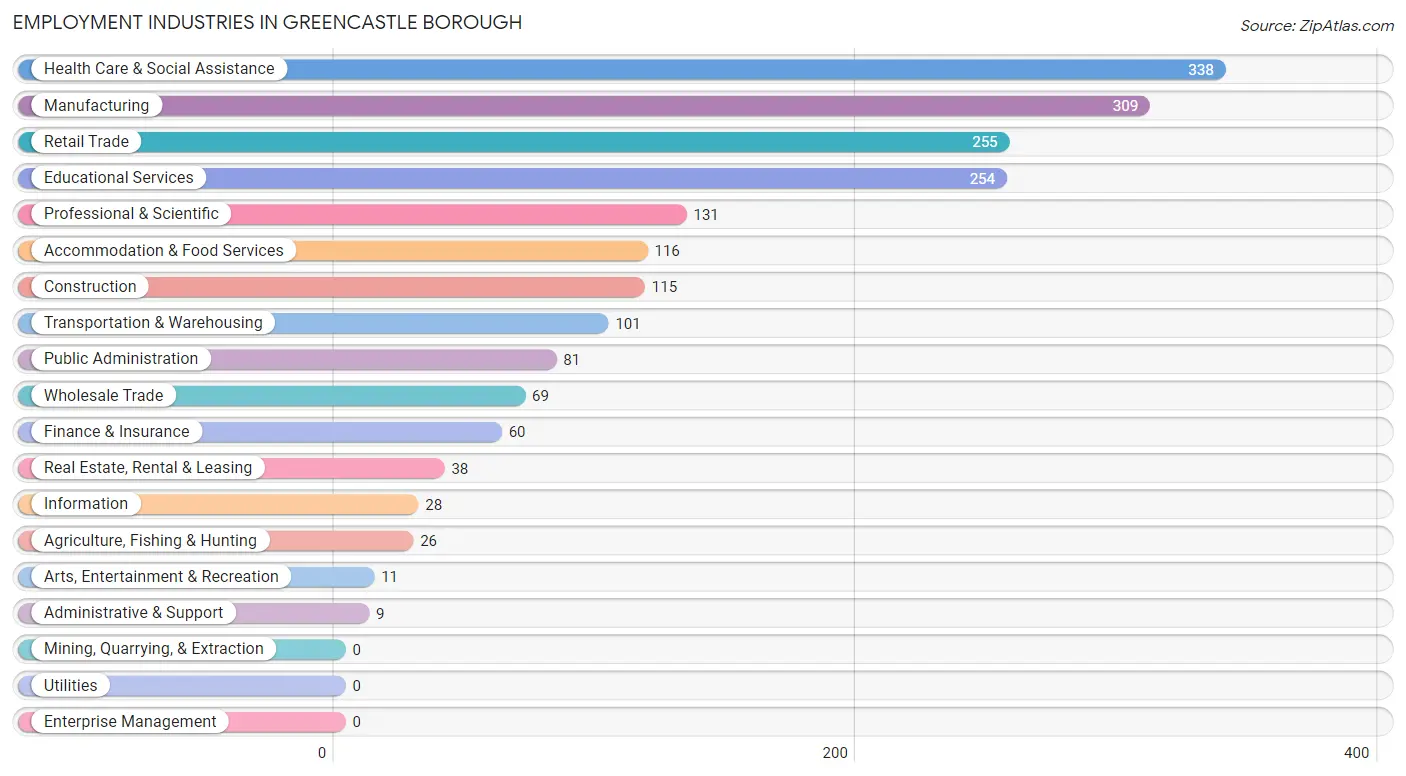
Employment Industries in Greencastle borough
The major employment industries in Greencastle borough include Health Care & Social Assistance (338 | 16.6%), Manufacturing (309 | 15.1%), Retail Trade (255 | 12.5%), Educational Services (254 | 12.4%), and Professional & Scientific (131 | 6.4%).
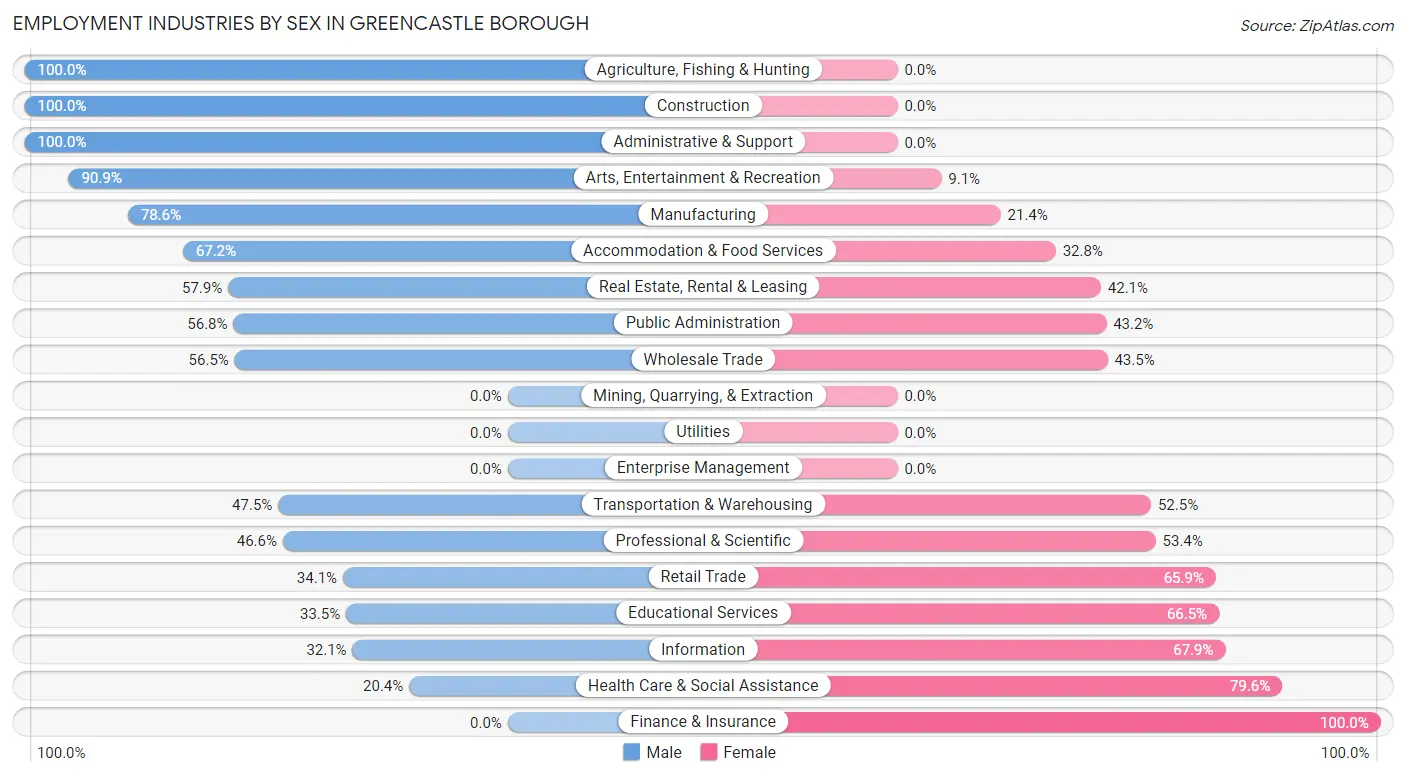
Employment Industries by Sex in Greencastle borough
The Greencastle borough industries that see more men than women are Agriculture, Fishing & Hunting (100.0%), Construction (100.0%), and Administrative & Support (100.0%), whereas the industries that tend to have a higher number of women are Finance & Insurance (100.0%), Health Care & Social Assistance (79.6%), and Information (67.9%).
| Industry | Male | Female |
| Agriculture, Fishing & Hunting | 26 (100.0%) | 0 (0.0%) |
| Mining, Quarrying, & Extraction | 0 (0.0%) | 0 (0.0%) |
| Construction | 115 (100.0%) | 0 (0.0%) |
| Manufacturing | 243 (78.6%) | 66 (21.4%) |
| Wholesale Trade | 39 (56.5%) | 30 (43.5%) |
| Retail Trade | 87 (34.1%) | 168 (65.9%) |
| Transportation & Warehousing | 48 (47.5%) | 53 (52.5%) |
| Utilities | 0 (0.0%) | 0 (0.0%) |
| Information | 9 (32.1%) | 19 (67.9%) |
| Finance & Insurance | 0 (0.0%) | 60 (100.0%) |
| Real Estate, Rental & Leasing | 22 (57.9%) | 16 (42.1%) |
| Professional & Scientific | 61 (46.6%) | 70 (53.4%) |
| Enterprise Management | 0 (0.0%) | 0 (0.0%) |
| Administrative & Support | 9 (100.0%) | 0 (0.0%) |
| Educational Services | 85 (33.5%) | 169 (66.5%) |
| Health Care & Social Assistance | 69 (20.4%) | 269 (79.6%) |
| Arts, Entertainment & Recreation | 10 (90.9%) | 1 (9.1%) |
| Accommodation & Food Services | 78 (67.2%) | 38 (32.8%) |
| Public Administration | 46 (56.8%) | 35 (43.2%) |
| Total | 1,029 (50.4%) | 1,012 (49.6%) |
Education in Greencastle borough
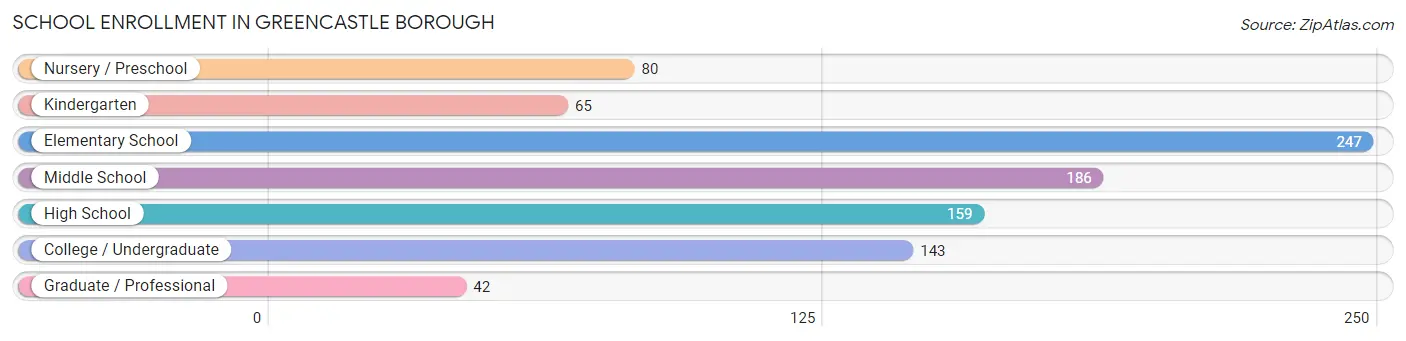
School Enrollment in Greencastle borough
The most common levels of schooling among the 922 students in Greencastle borough are elementary school (247 | 26.8%), middle school (186 | 20.2%), and high school (159 | 17.2%).
| School Level | # Students | % Students |
| Nursery / Preschool | 80 | 8.7% |
| Kindergarten | 65 | 7.0% |
| Elementary School | 247 | 26.8% |
| Middle School | 186 | 20.2% |
| High School | 159 | 17.2% |
| College / Undergraduate | 143 | 15.5% |
| Graduate / Professional | 42 | 4.6% |
| Total | 922 | 100.0% |
School Enrollment by Age by Funding Source in Greencastle borough
Out of a total of 922 students who are enrolled in schools in Greencastle borough, 278 (30.2%) attend a private institution, while the remaining 644 (69.8%) are enrolled in public schools. The age group of 3 to 4 year olds has the highest likelihood of being enrolled in private schools, with 27 (52.9% in the age bracket) enrolled. Conversely, the age group of 18 to 19 year olds has the lowest likelihood of being enrolled in a private school, with 37 (94.9% in the age bracket) attending a public institution.
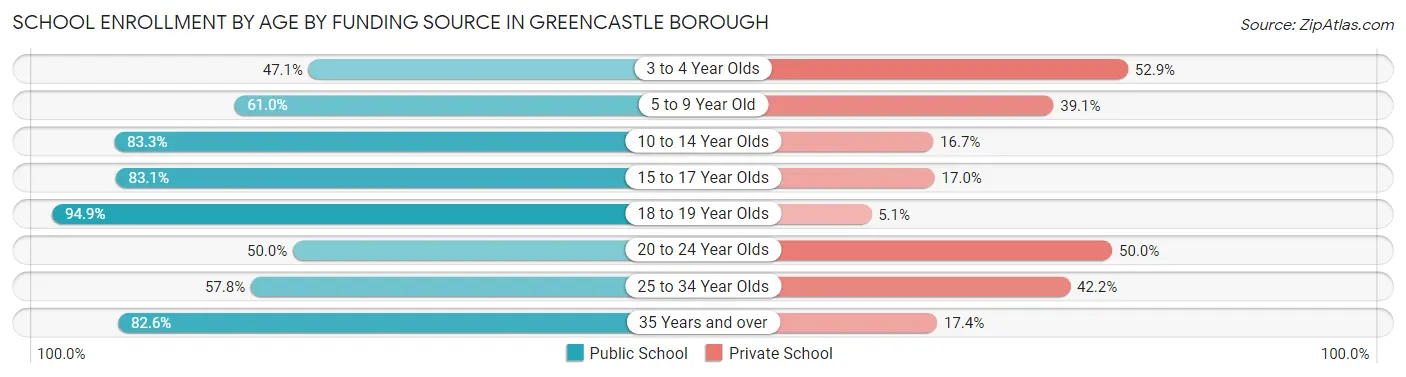
| Age Bracket | Public School | Private School |
| 3 to 4 Year Olds | 24 (47.1%) | 27 (52.9%) |
| 5 to 9 Year Old | 192 (61.0%) | 123 (39.1%) |
| 10 to 14 Year Olds | 180 (83.3%) | 36 (16.7%) |
| 15 to 17 Year Olds | 98 (83.1%) | 20 (17.0%) |
| 18 to 19 Year Olds | 37 (94.9%) | 2 (5.1%) |
| 20 to 24 Year Olds | 27 (50.0%) | 27 (50.0%) |
| 25 to 34 Year Olds | 48 (57.8%) | 35 (42.2%) |
| 35 Years and over | 38 (82.6%) | 8 (17.4%) |
| Total | 644 (69.8%) | 278 (30.2%) |
Educational Attainment by Field of Study in Greencastle borough
Education (202 | 21.6%), bio, nature & agricultural (153 | 16.4%), business (143 | 15.3%), science & technology (72 | 7.7%), and liberal arts & history (72 | 7.7%) are the most common fields of study among 934 individuals in Greencastle borough who have obtained a bachelor's degree or higher.
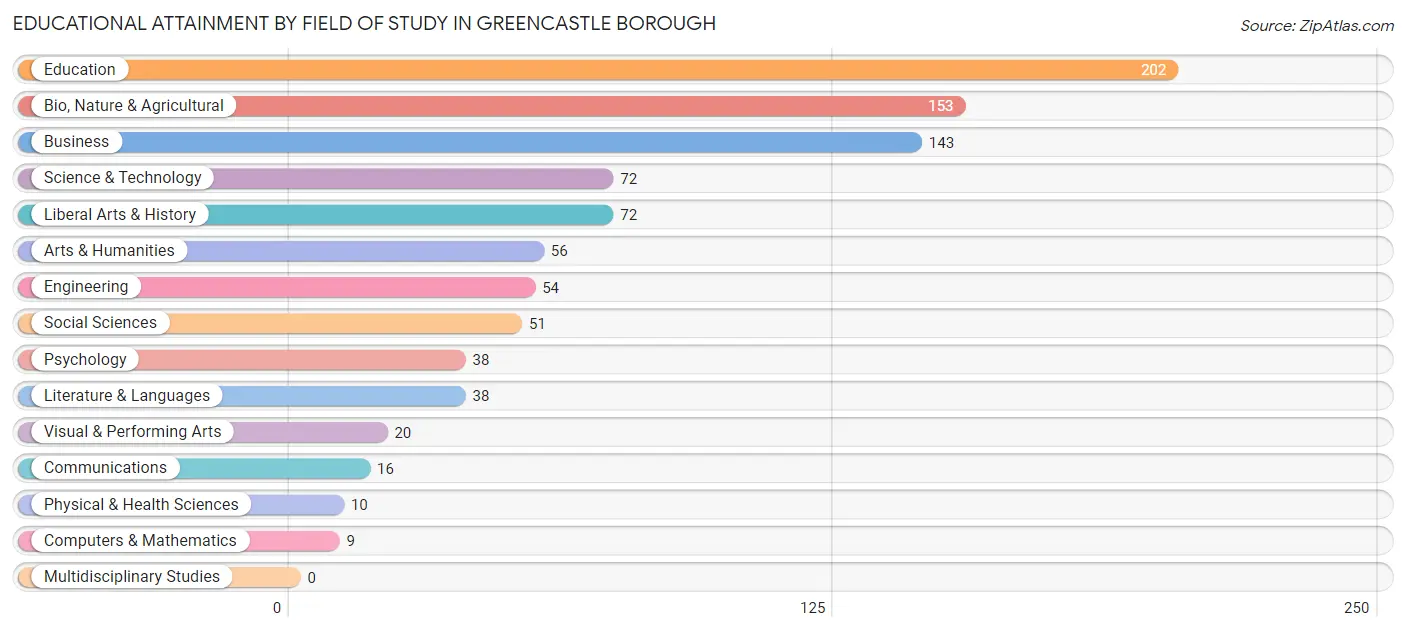
| Field of Study | # Graduates | % Graduates |
| Computers & Mathematics | 9 | 1.0% |
| Bio, Nature & Agricultural | 153 | 16.4% |
| Physical & Health Sciences | 10 | 1.1% |
| Psychology | 38 | 4.1% |
| Social Sciences | 51 | 5.5% |
| Engineering | 54 | 5.8% |
| Multidisciplinary Studies | 0 | 0.0% |
| Science & Technology | 72 | 7.7% |
| Business | 143 | 15.3% |
| Education | 202 | 21.6% |
| Literature & Languages | 38 | 4.1% |
| Liberal Arts & History | 72 | 7.7% |
| Visual & Performing Arts | 20 | 2.1% |
| Communications | 16 | 1.7% |
| Arts & Humanities | 56 | 6.0% |
| Total | 934 | 100.0% |
Transportation & Commute in Greencastle borough
Vehicle Availability by Sex in Greencastle borough
The most prevalent vehicle ownership categories in Greencastle borough are males with 2 vehicles (379, accounting for 36.8%) and females with 2 vehicles (294, making up 38.0%).
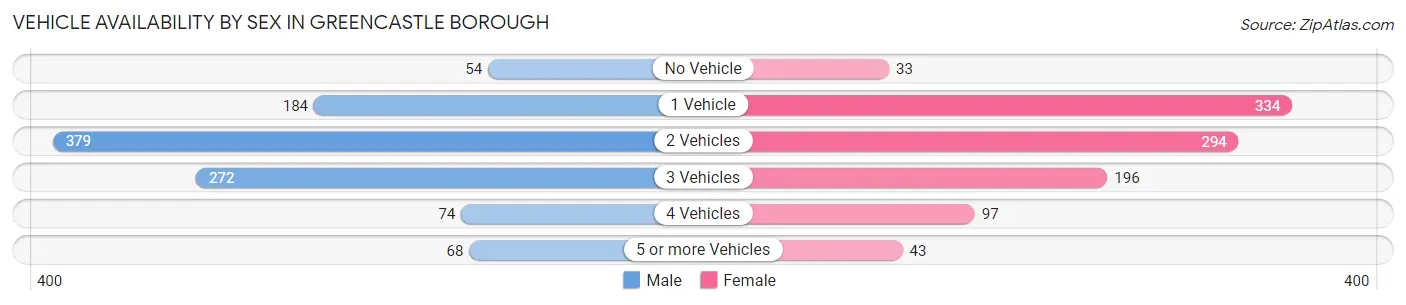
| Vehicles Available | Male | Female |
| No Vehicle | 54 (5.2%) | 33 (3.3%) |
| 1 Vehicle | 184 (17.8%) | 334 (33.5%) |
| 2 Vehicles | 379 (36.8%) | 294 (29.5%) |
| 3 Vehicles | 272 (26.4%) | 196 (19.7%) |
| 4 Vehicles | 74 (7.2%) | 97 (9.7%) |
| 5 or more Vehicles | 68 (6.6%) | 43 (4.3%) |
| Total | 1,031 (100.0%) | 997 (100.0%) |
Commute Time in Greencastle borough
The most frequently occuring commute durations in Greencastle borough are 20 to 24 minutes (542 commuters, 29.5%), 15 to 19 minutes (347 commuters, 18.9%), and 5 to 9 minutes (202 commuters, 11.0%).
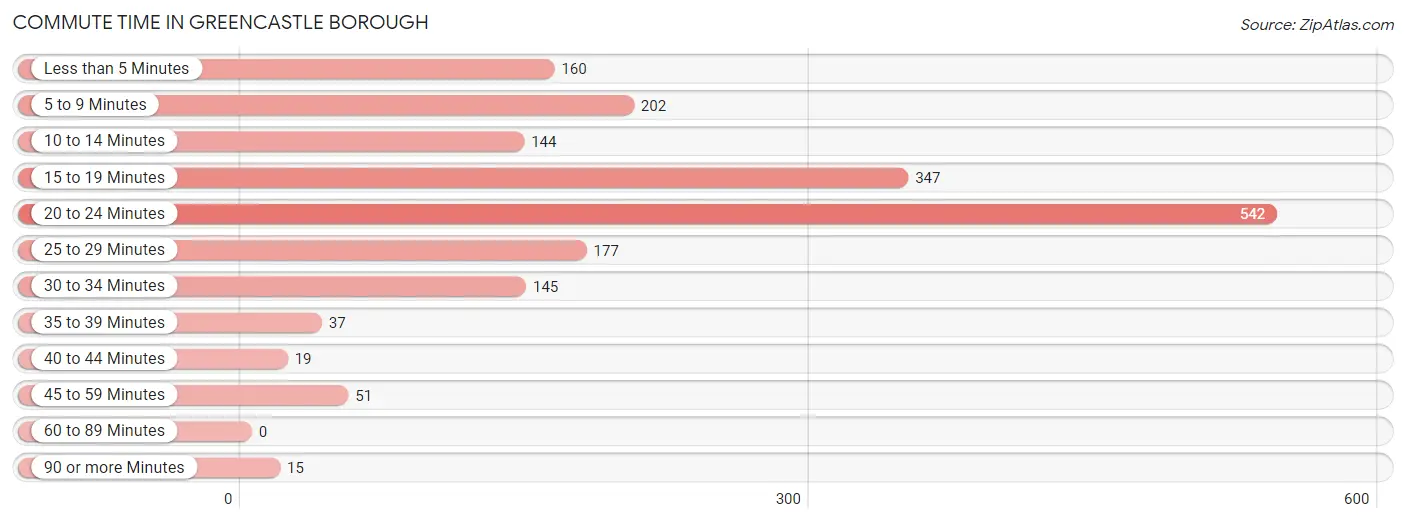
| Commute Time | # Commuters | % Commuters |
| Less than 5 Minutes | 160 | 8.7% |
| 5 to 9 Minutes | 202 | 11.0% |
| 10 to 14 Minutes | 144 | 7.8% |
| 15 to 19 Minutes | 347 | 18.9% |
| 20 to 24 Minutes | 542 | 29.5% |
| 25 to 29 Minutes | 177 | 9.6% |
| 30 to 34 Minutes | 145 | 7.9% |
| 35 to 39 Minutes | 37 | 2.0% |
| 40 to 44 Minutes | 19 | 1.0% |
| 45 to 59 Minutes | 51 | 2.8% |
| 60 to 89 Minutes | 0 | 0.0% |
| 90 or more Minutes | 15 | 0.8% |
Commute Time by Sex in Greencastle borough
The most common commute times in Greencastle borough are 20 to 24 minutes (297 commuters, 30.0%) for males and 20 to 24 minutes (245 commuters, 28.9%) for females.
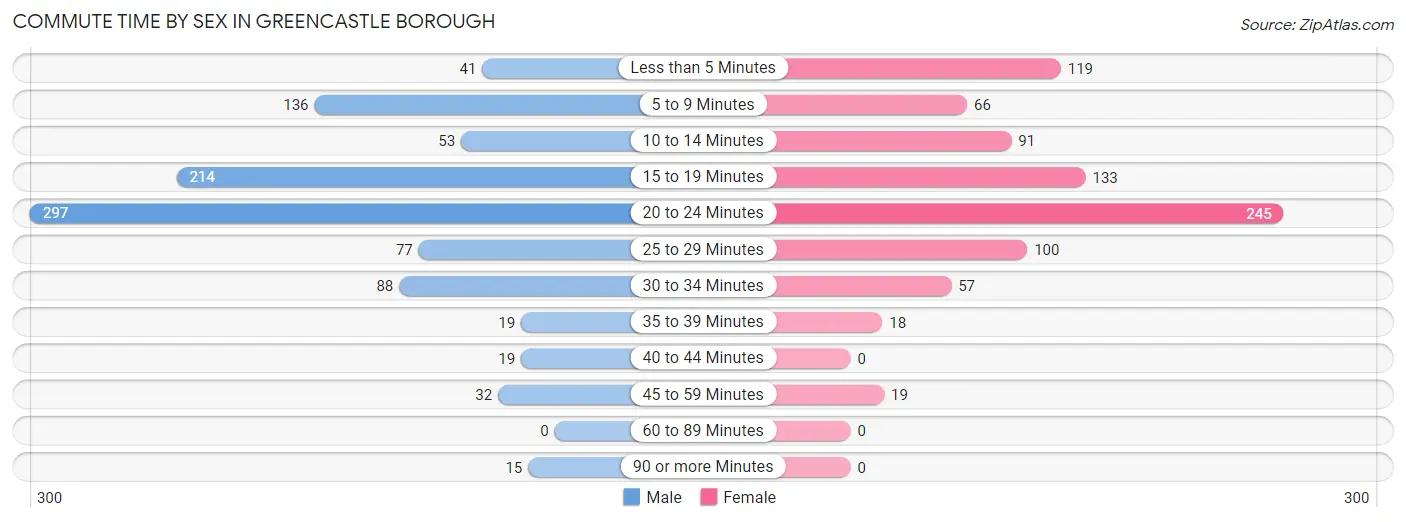
| Commute Time | Male | Female |
| Less than 5 Minutes | 41 (4.1%) | 119 (14.0%) |
| 5 to 9 Minutes | 136 (13.7%) | 66 (7.8%) |
| 10 to 14 Minutes | 53 (5.3%) | 91 (10.7%) |
| 15 to 19 Minutes | 214 (21.6%) | 133 (15.7%) |
| 20 to 24 Minutes | 297 (30.0%) | 245 (28.9%) |
| 25 to 29 Minutes | 77 (7.8%) | 100 (11.8%) |
| 30 to 34 Minutes | 88 (8.9%) | 57 (6.7%) |
| 35 to 39 Minutes | 19 (1.9%) | 18 (2.1%) |
| 40 to 44 Minutes | 19 (1.9%) | 0 (0.0%) |
| 45 to 59 Minutes | 32 (3.2%) | 19 (2.2%) |
| 60 to 89 Minutes | 0 (0.0%) | 0 (0.0%) |
| 90 or more Minutes | 15 (1.5%) | 0 (0.0%) |
Time of Departure to Work by Sex in Greencastle borough
The most frequent times of departure to work in Greencastle borough are 6:00 AM to 6:29 AM (242, 24.4%) for males and 7:30 AM to 7:59 AM (173, 20.4%) for females.
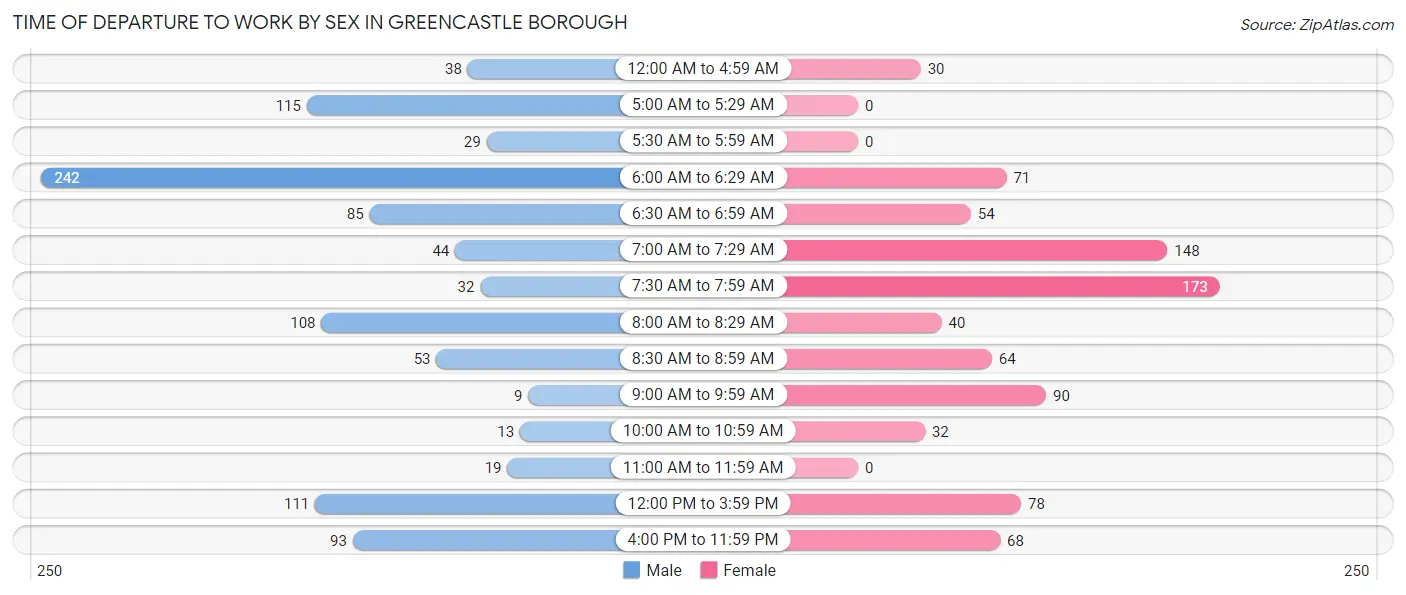
| Time of Departure | Male | Female |
| 12:00 AM to 4:59 AM | 38 (3.8%) | 30 (3.5%) |
| 5:00 AM to 5:29 AM | 115 (11.6%) | 0 (0.0%) |
| 5:30 AM to 5:59 AM | 29 (2.9%) | 0 (0.0%) |
| 6:00 AM to 6:29 AM | 242 (24.4%) | 71 (8.4%) |
| 6:30 AM to 6:59 AM | 85 (8.6%) | 54 (6.4%) |
| 7:00 AM to 7:29 AM | 44 (4.4%) | 148 (17.4%) |
| 7:30 AM to 7:59 AM | 32 (3.2%) | 173 (20.4%) |
| 8:00 AM to 8:29 AM | 108 (10.9%) | 40 (4.7%) |
| 8:30 AM to 8:59 AM | 53 (5.3%) | 64 (7.5%) |
| 9:00 AM to 9:59 AM | 9 (0.9%) | 90 (10.6%) |
| 10:00 AM to 10:59 AM | 13 (1.3%) | 32 (3.8%) |
| 11:00 AM to 11:59 AM | 19 (1.9%) | 0 (0.0%) |
| 12:00 PM to 3:59 PM | 111 (11.2%) | 78 (9.2%) |
| 4:00 PM to 11:59 PM | 93 (9.4%) | 68 (8.0%) |
| Total | 991 (100.0%) | 848 (100.0%) |
Housing Occupancy in Greencastle borough
Occupancy by Ownership in Greencastle borough
Of the total 1,698 dwellings in Greencastle borough, owner-occupied units account for 1,145 (67.4%), while renter-occupied units make up 553 (32.6%).
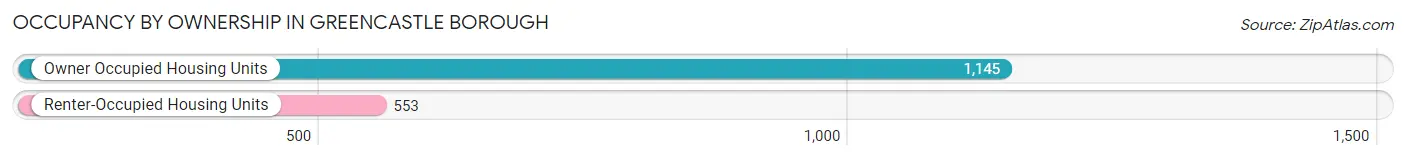
| Occupancy | # Housing Units | % Housing Units |
| Owner Occupied Housing Units | 1,145 | 67.4% |
| Renter-Occupied Housing Units | 553 | 32.6% |
| Total Occupied Housing Units | 1,698 | 100.0% |
Occupancy by Household Size in Greencastle borough
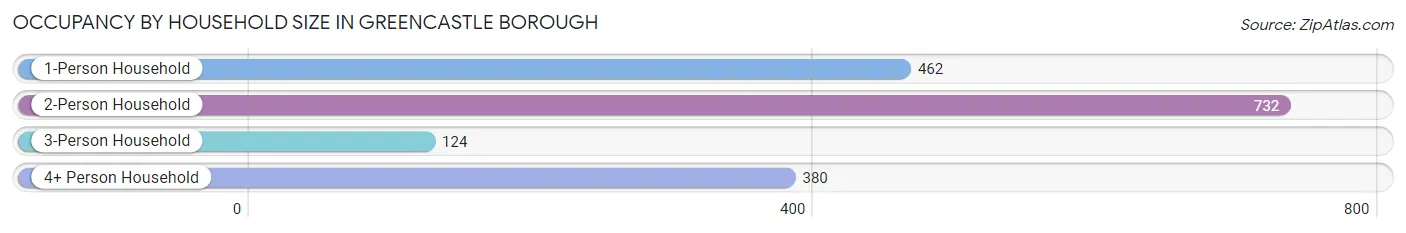
| Household Size | # Housing Units | % Housing Units |
| 1-Person Household | 462 | 27.2% |
| 2-Person Household | 732 | 43.1% |
| 3-Person Household | 124 | 7.3% |
| 4+ Person Household | 380 | 22.4% |
| Total Housing Units | 1,698 | 100.0% |
Occupancy by Ownership by Household Size in Greencastle borough
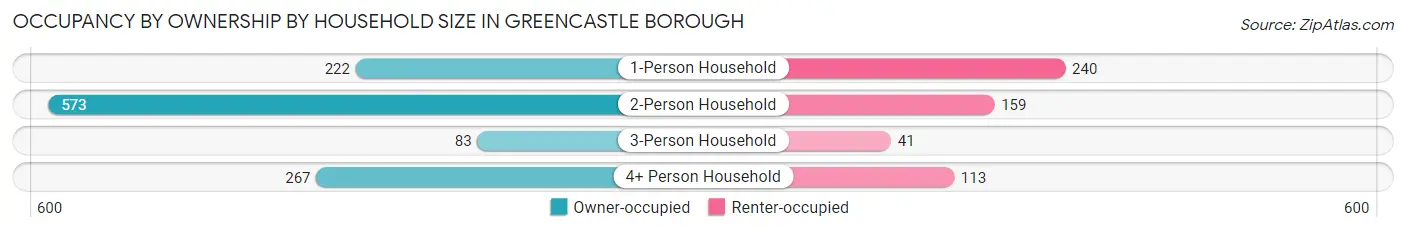
| Household Size | Owner-occupied | Renter-occupied |
| 1-Person Household | 222 (48.0%) | 240 (51.9%) |
| 2-Person Household | 573 (78.3%) | 159 (21.7%) |
| 3-Person Household | 83 (66.9%) | 41 (33.1%) |
| 4+ Person Household | 267 (70.3%) | 113 (29.7%) |
| Total Housing Units | 1,145 (67.4%) | 553 (32.6%) |
Occupancy by Educational Attainment in Greencastle borough
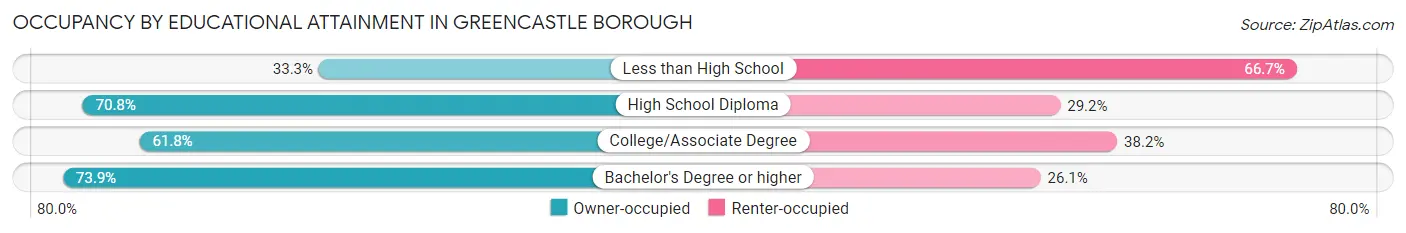
| Household Size | Owner-occupied | Renter-occupied |
| Less than High School | 23 (33.3%) | 46 (66.7%) |
| High School Diploma | 378 (70.8%) | 156 (29.2%) |
| College/Associate Degree | 333 (61.8%) | 206 (38.2%) |
| Bachelor's Degree or higher | 411 (73.9%) | 145 (26.1%) |
Occupancy by Age of Householder in Greencastle borough
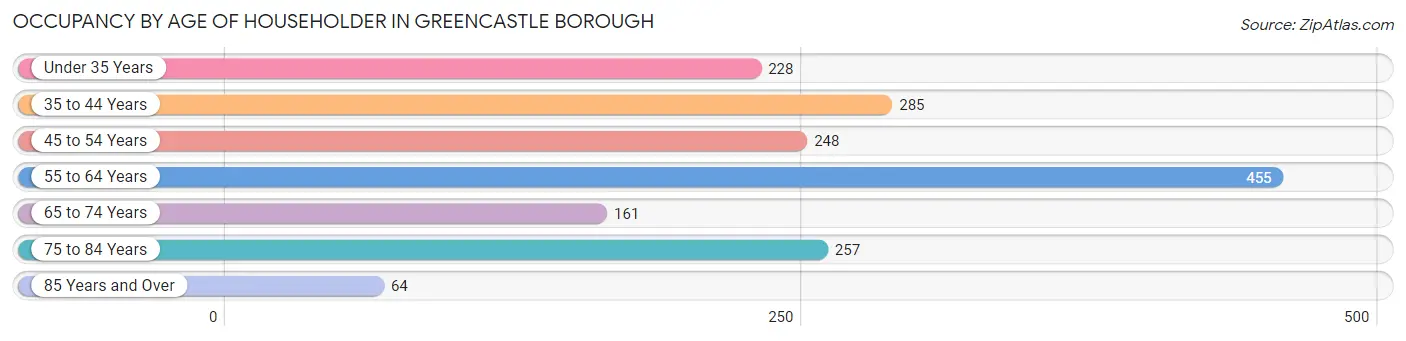
| Age Bracket | # Households | % Households |
| Under 35 Years | 228 | 13.4% |
| 35 to 44 Years | 285 | 16.8% |
| 45 to 54 Years | 248 | 14.6% |
| 55 to 64 Years | 455 | 26.8% |
| 65 to 74 Years | 161 | 9.5% |
| 75 to 84 Years | 257 | 15.1% |
| 85 Years and Over | 64 | 3.8% |
| Total | 1,698 | 100.0% |
Housing Finances in Greencastle borough
Median Income by Occupancy in Greencastle borough
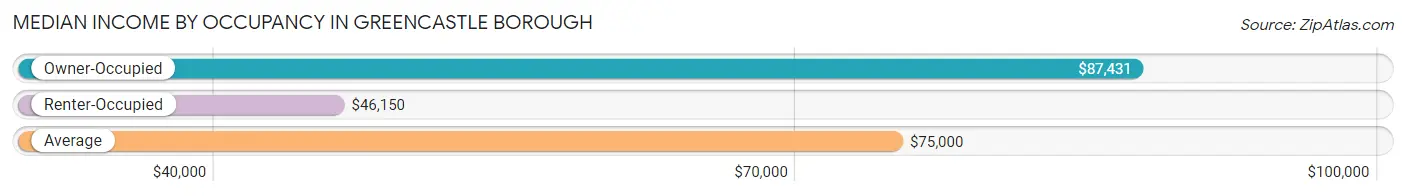
| Occupancy Type | # Households | Median Income |
| Owner-Occupied | 1,145 (67.4%) | $87,431 |
| Renter-Occupied | 553 (32.6%) | $46,150 |
| Average | 1,698 (100.0%) | $75,000 |
Occupancy by Householder Income Bracket in Greencastle borough
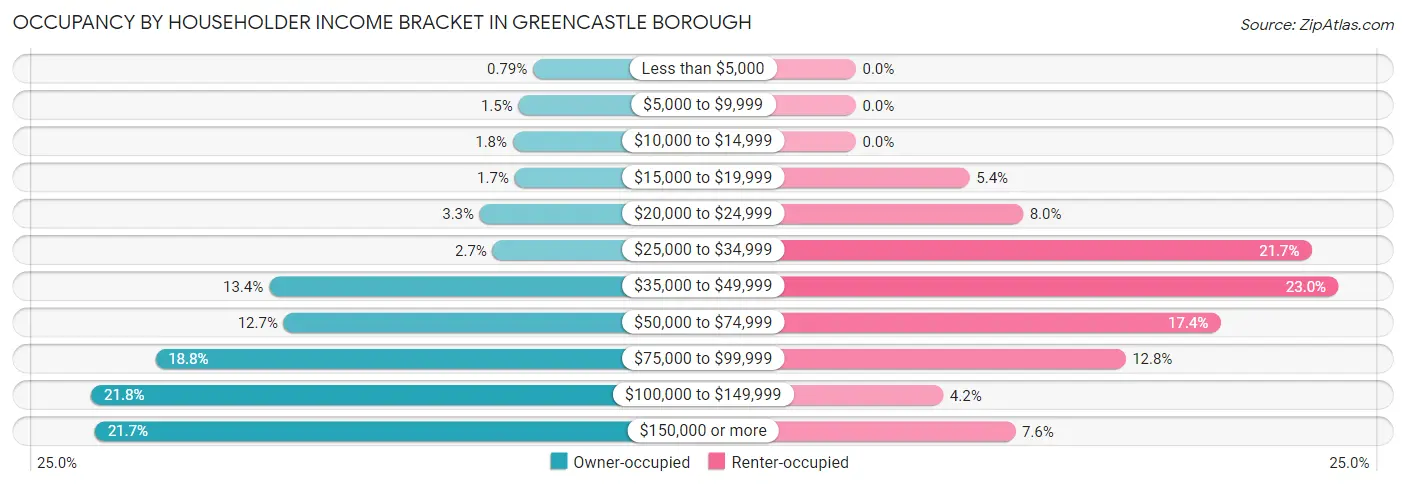
| Income Bracket | Owner-occupied | Renter-occupied |
| Less than $5,000 | 9 (0.8%) | 0 (0.0%) |
| $5,000 to $9,999 | 17 (1.5%) | 0 (0.0%) |
| $10,000 to $14,999 | 20 (1.8%) | 0 (0.0%) |
| $15,000 to $19,999 | 19 (1.7%) | 30 (5.4%) |
| $20,000 to $24,999 | 38 (3.3%) | 44 (8.0%) |
| $25,000 to $34,999 | 31 (2.7%) | 120 (21.7%) |
| $35,000 to $49,999 | 153 (13.4%) | 127 (23.0%) |
| $50,000 to $74,999 | 145 (12.7%) | 96 (17.4%) |
| $75,000 to $99,999 | 215 (18.8%) | 71 (12.8%) |
| $100,000 to $149,999 | 250 (21.8%) | 23 (4.2%) |
| $150,000 or more | 248 (21.7%) | 42 (7.6%) |
| Total | 1,145 (100.0%) | 553 (100.0%) |
Monthly Housing Cost Tiers in Greencastle borough
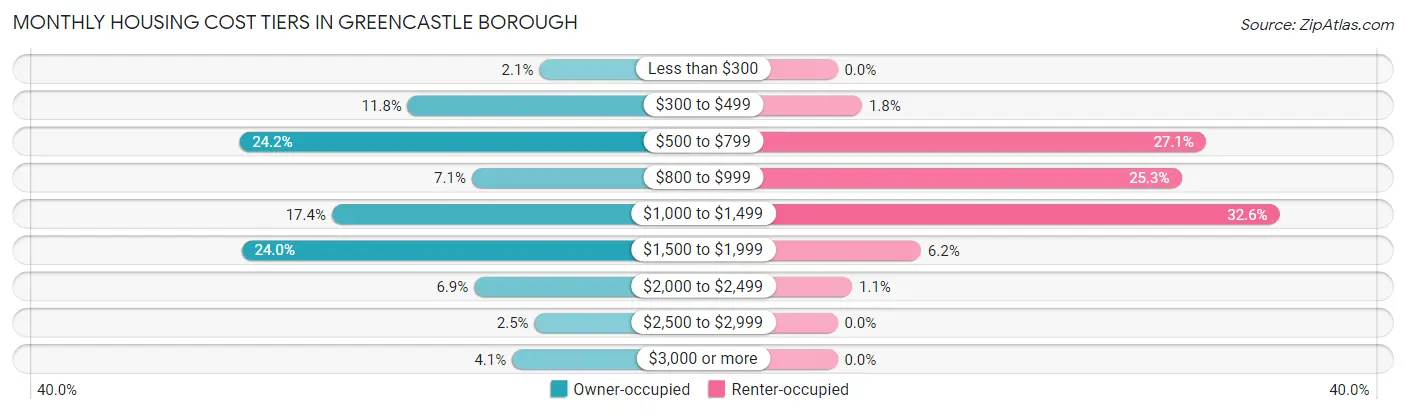
| Monthly Cost | Owner-occupied | Renter-occupied |
| Less than $300 | 24 (2.1%) | 0 (0.0%) |
| $300 to $499 | 135 (11.8%) | 10 (1.8%) |
| $500 to $799 | 277 (24.2%) | 150 (27.1%) |
| $800 to $999 | 81 (7.1%) | 140 (25.3%) |
| $1,000 to $1,499 | 199 (17.4%) | 180 (32.6%) |
| $1,500 to $1,999 | 275 (24.0%) | 34 (6.1%) |
| $2,000 to $2,499 | 79 (6.9%) | 6 (1.1%) |
| $2,500 to $2,999 | 28 (2.5%) | 0 (0.0%) |
| $3,000 or more | 47 (4.1%) | 0 (0.0%) |
| Total | 1,145 (100.0%) | 553 (100.0%) |
Physical Housing Characteristics in Greencastle borough
Housing Structures in Greencastle borough
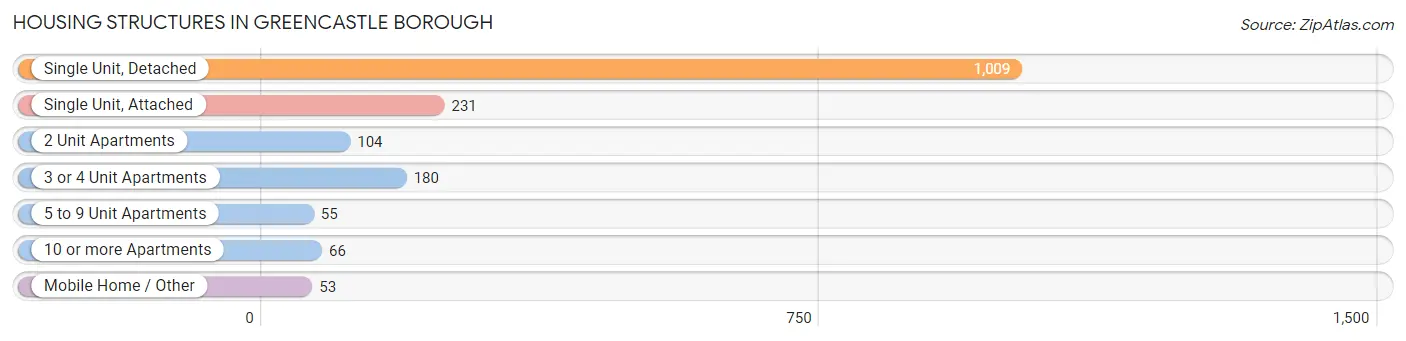
| Structure Type | # Housing Units | % Housing Units |
| Single Unit, Detached | 1,009 | 59.4% |
| Single Unit, Attached | 231 | 13.6% |
| 2 Unit Apartments | 104 | 6.1% |
| 3 or 4 Unit Apartments | 180 | 10.6% |
| 5 to 9 Unit Apartments | 55 | 3.2% |
| 10 or more Apartments | 66 | 3.9% |
| Mobile Home / Other | 53 | 3.1% |
| Total | 1,698 | 100.0% |
Housing Structures by Occupancy in Greencastle borough
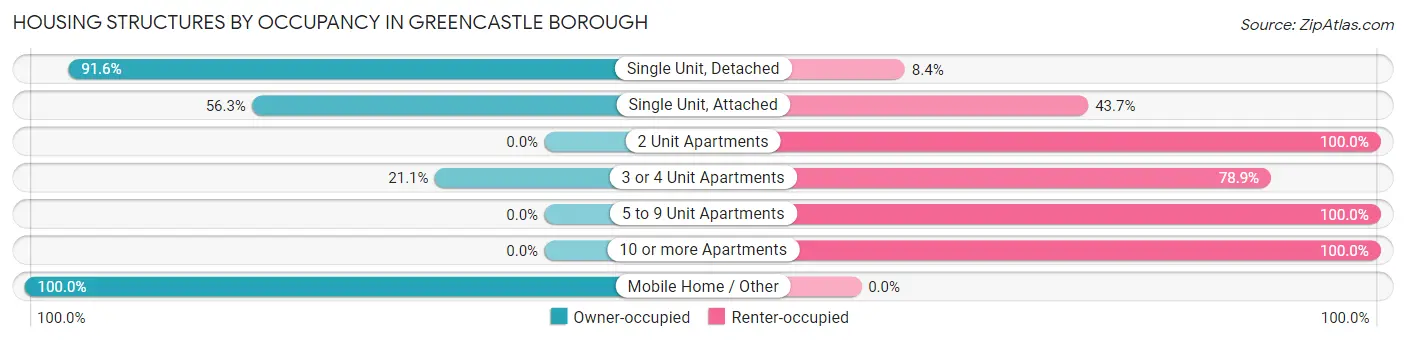
| Structure Type | Owner-occupied | Renter-occupied |
| Single Unit, Detached | 924 (91.6%) | 85 (8.4%) |
| Single Unit, Attached | 130 (56.3%) | 101 (43.7%) |
| 2 Unit Apartments | 0 (0.0%) | 104 (100.0%) |
| 3 or 4 Unit Apartments | 38 (21.1%) | 142 (78.9%) |
| 5 to 9 Unit Apartments | 0 (0.0%) | 55 (100.0%) |
| 10 or more Apartments | 0 (0.0%) | 66 (100.0%) |
| Mobile Home / Other | 53 (100.0%) | 0 (0.0%) |
| Total | 1,145 (67.4%) | 553 (32.6%) |
Housing Structures by Number of Rooms in Greencastle borough
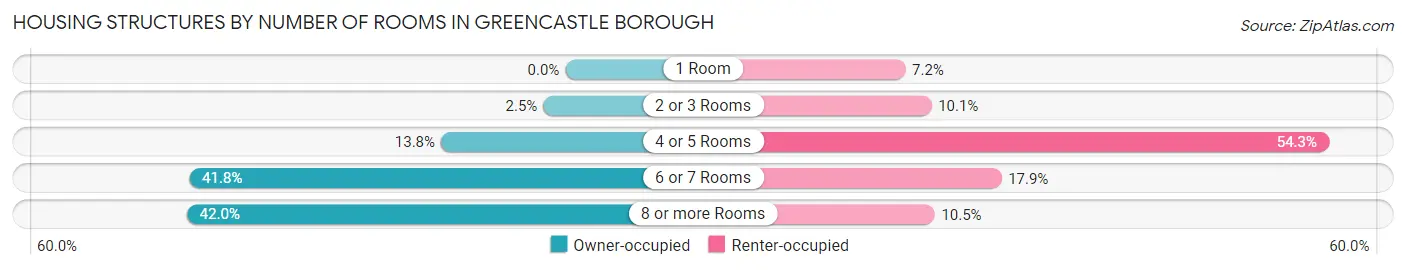
| Number of Rooms | Owner-occupied | Renter-occupied |
| 1 Room | 0 (0.0%) | 40 (7.2%) |
| 2 or 3 Rooms | 28 (2.5%) | 56 (10.1%) |
| 4 or 5 Rooms | 158 (13.8%) | 300 (54.2%) |
| 6 or 7 Rooms | 478 (41.7%) | 99 (17.9%) |
| 8 or more Rooms | 481 (42.0%) | 58 (10.5%) |
| Total | 1,145 (100.0%) | 553 (100.0%) |
Housing Structure by Heating Type in Greencastle borough
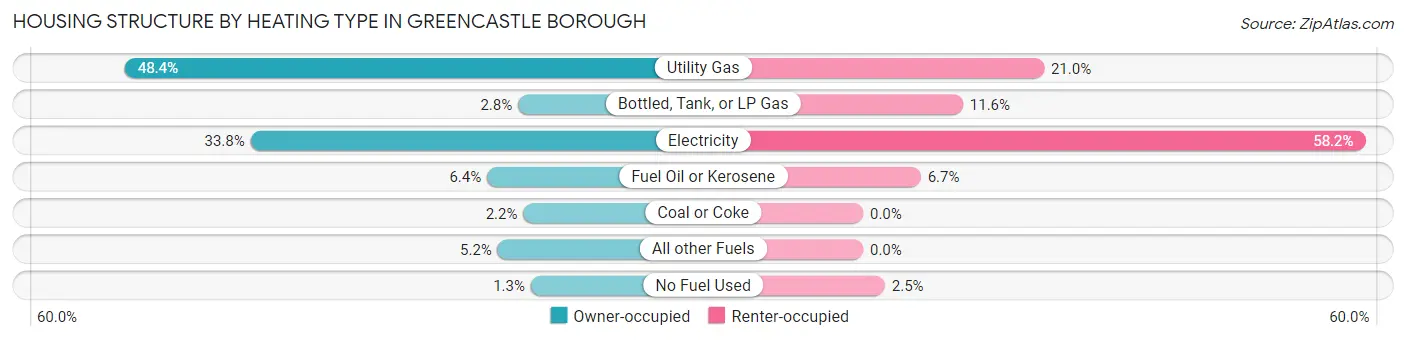
| Heating Type | Owner-occupied | Renter-occupied |
| Utility Gas | 554 (48.4%) | 116 (21.0%) |
| Bottled, Tank, or LP Gas | 32 (2.8%) | 64 (11.6%) |
| Electricity | 387 (33.8%) | 322 (58.2%) |
| Fuel Oil or Kerosene | 73 (6.4%) | 37 (6.7%) |
| Coal or Coke | 25 (2.2%) | 0 (0.0%) |
| All other Fuels | 59 (5.1%) | 0 (0.0%) |
| No Fuel Used | 15 (1.3%) | 14 (2.5%) |
| Total | 1,145 (100.0%) | 553 (100.0%) |
Household Vehicle Usage in Greencastle borough
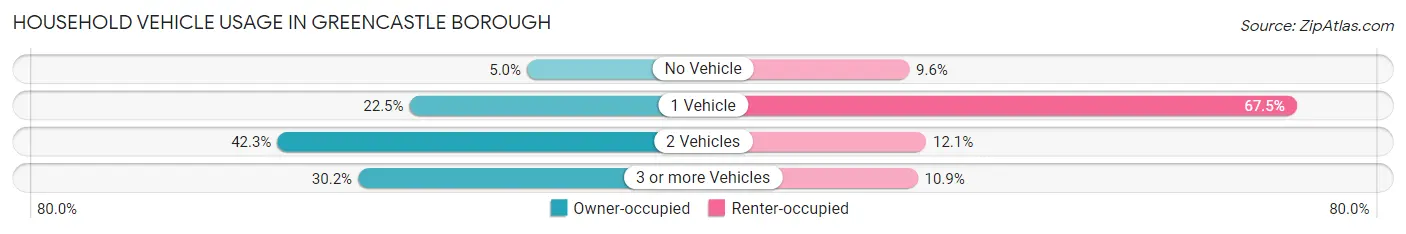
| Vehicles per Household | Owner-occupied | Renter-occupied |
| No Vehicle | 57 (5.0%) | 53 (9.6%) |
| 1 Vehicle | 258 (22.5%) | 373 (67.4%) |
| 2 Vehicles | 484 (42.3%) | 67 (12.1%) |
| 3 or more Vehicles | 346 (30.2%) | 60 (10.8%) |
| Total | 1,145 (100.0%) | 553 (100.0%) |
Real Estate & Mortgages in Greencastle borough
Real Estate and Mortgage Overview in Greencastle borough
| Characteristic | Without Mortgage | With Mortgage |
| Housing Units | 501 | 644 |
| Median Property Value | $237,000 | $241,300 |
| Median Household Income | $67,768 | $162 |
| Monthly Housing Costs | $567 | $47 |
| Real Estate Taxes | $3,104 | $0 |
Property Value by Mortgage Status in Greencastle borough
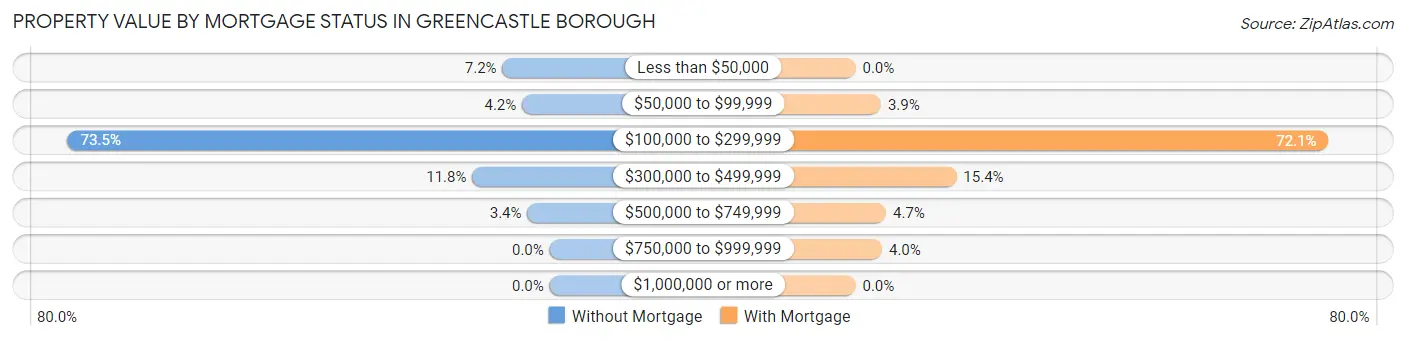
| Property Value | Without Mortgage | With Mortgage |
| Less than $50,000 | 36 (7.2%) | 0 (0.0%) |
| $50,000 to $99,999 | 21 (4.2%) | 25 (3.9%) |
| $100,000 to $299,999 | 368 (73.5%) | 464 (72.1%) |
| $300,000 to $499,999 | 59 (11.8%) | 99 (15.4%) |
| $500,000 to $749,999 | 17 (3.4%) | 30 (4.7%) |
| $750,000 to $999,999 | 0 (0.0%) | 26 (4.0%) |
| $1,000,000 or more | 0 (0.0%) | 0 (0.0%) |
| Total | 501 (100.0%) | 644 (100.0%) |
Household Income by Mortgage Status in Greencastle borough
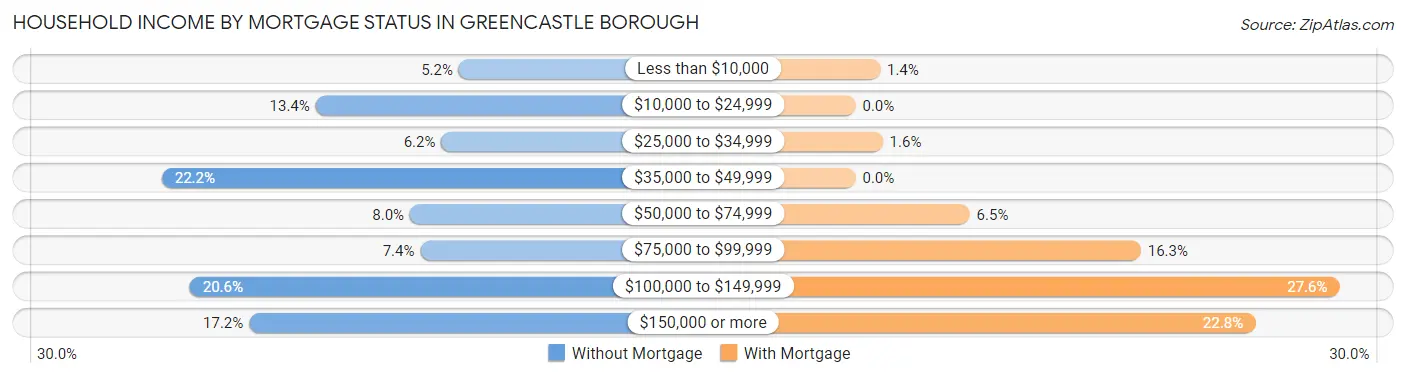
| Household Income | Without Mortgage | With Mortgage |
| Less than $10,000 | 26 (5.2%) | 9 (1.4%) |
| $10,000 to $24,999 | 67 (13.4%) | 0 (0.0%) |
| $25,000 to $34,999 | 31 (6.2%) | 10 (1.5%) |
| $35,000 to $49,999 | 111 (22.2%) | 0 (0.0%) |
| $50,000 to $74,999 | 40 (8.0%) | 42 (6.5%) |
| $75,000 to $99,999 | 37 (7.4%) | 105 (16.3%) |
| $100,000 to $149,999 | 103 (20.6%) | 178 (27.6%) |
| $150,000 or more | 86 (17.2%) | 147 (22.8%) |
| Total | 501 (100.0%) | 644 (100.0%) |
Property Value to Household Income Ratio in Greencastle borough
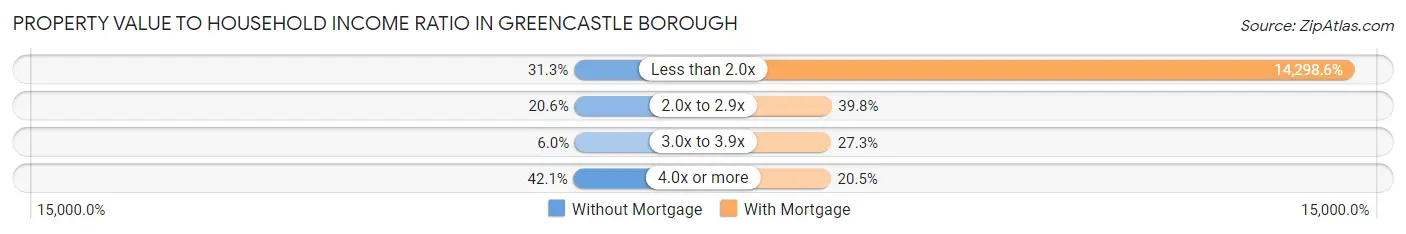
| Value-to-Income Ratio | Without Mortgage | With Mortgage |
| Less than 2.0x | 157 (31.3%) | 92,083 (14,298.6%) |
| 2.0x to 2.9x | 103 (20.6%) | 256 (39.8%) |
| 3.0x to 3.9x | 30 (6.0%) | 176 (27.3%) |
| 4.0x or more | 211 (42.1%) | 132 (20.5%) |
| Total | 501 (100.0%) | 644 (100.0%) |
Real Estate Taxes by Mortgage Status in Greencastle borough
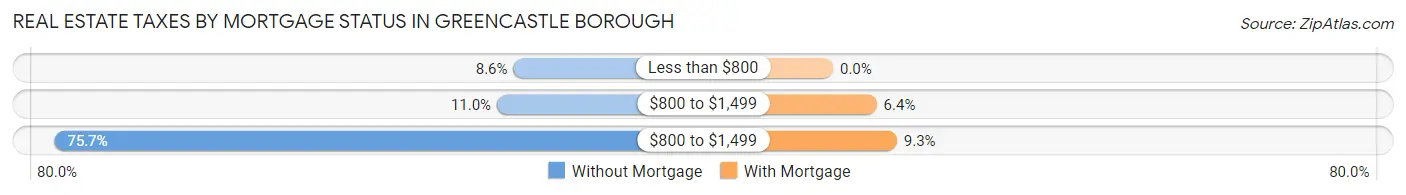
| Property Taxes | Without Mortgage | With Mortgage |
| Less than $800 | 43 (8.6%) | 0 (0.0%) |
| $800 to $1,499 | 55 (11.0%) | 41 (6.4%) |
| $800 to $1,499 | 379 (75.6%) | 60 (9.3%) |
| Total | 501 (100.0%) | 644 (100.0%) |
Health & Disability in Greencastle borough
Health Insurance Coverage by Age in Greencastle borough
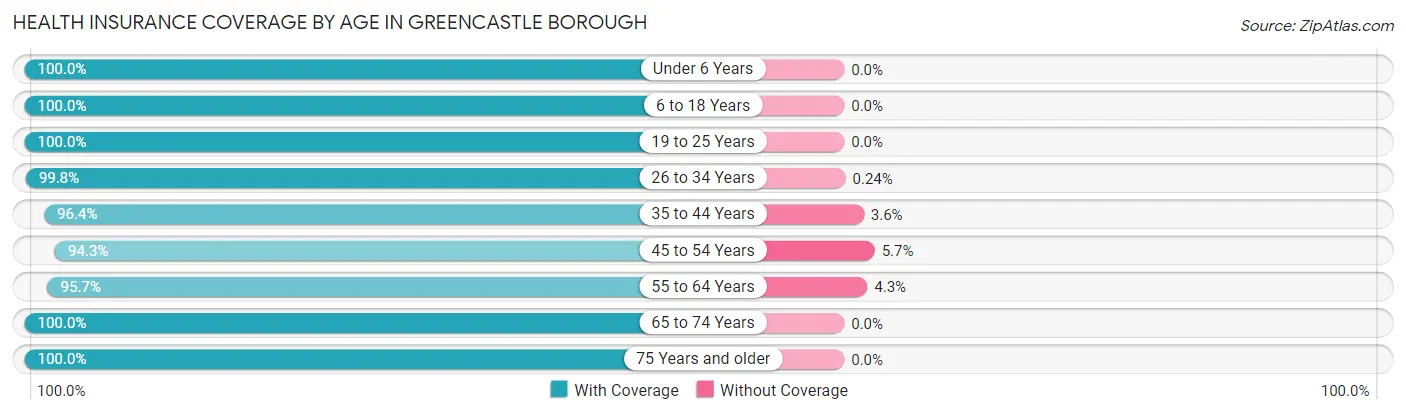
| Age Bracket | With Coverage | Without Coverage |
| Under 6 Years | 417 (100.0%) | 0 (0.0%) |
| 6 to 18 Years | 657 (100.0%) | 0 (0.0%) |
| 19 to 25 Years | 282 (100.0%) | 0 (0.0%) |
| 26 to 34 Years | 411 (99.8%) | 1 (0.2%) |
| 35 to 44 Years | 556 (96.4%) | 21 (3.6%) |
| 45 to 54 Years | 382 (94.3%) | 23 (5.7%) |
| 55 to 64 Years | 667 (95.7%) | 30 (4.3%) |
| 65 to 74 Years | 328 (100.0%) | 0 (0.0%) |
| 75 Years and older | 454 (100.0%) | 0 (0.0%) |
| Total | 4,154 (98.2%) | 75 (1.8%) |
Health Insurance Coverage by Citizenship Status in Greencastle borough
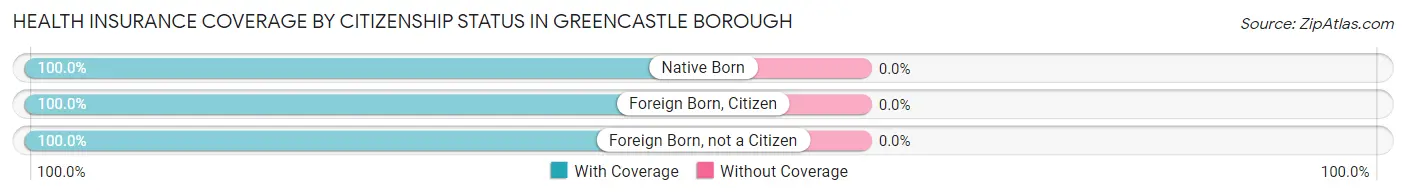
| Citizenship Status | With Coverage | Without Coverage |
| Native Born | 417 (100.0%) | 0 (0.0%) |
| Foreign Born, Citizen | 657 (100.0%) | 0 (0.0%) |
| Foreign Born, not a Citizen | 282 (100.0%) | 0 (0.0%) |
Health Insurance Coverage by Household Income in Greencastle borough
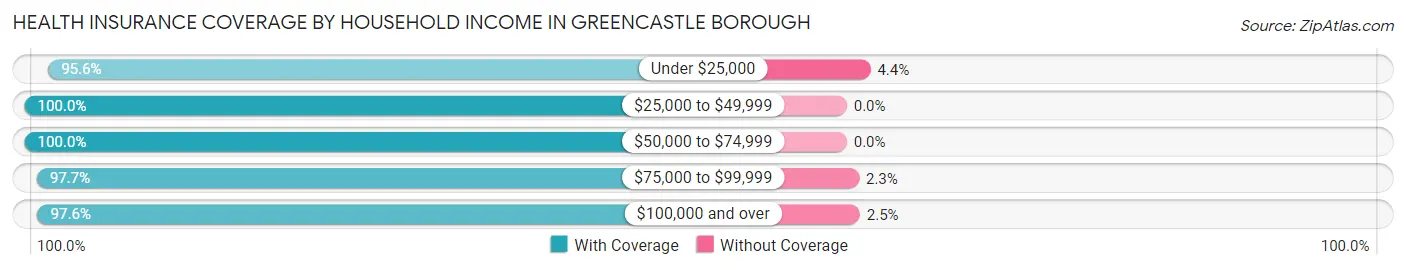
| Household Income | With Coverage | Without Coverage |
| Under $25,000 | 259 (95.6%) | 12 (4.4%) |
| $25,000 to $49,999 | 852 (100.0%) | 0 (0.0%) |
| $50,000 to $74,999 | 514 (100.0%) | 0 (0.0%) |
| $75,000 to $99,999 | 769 (97.7%) | 18 (2.3%) |
| $100,000 and over | 1,749 (97.6%) | 44 (2.5%) |
Public vs Private Health Insurance Coverage by Age in Greencastle borough
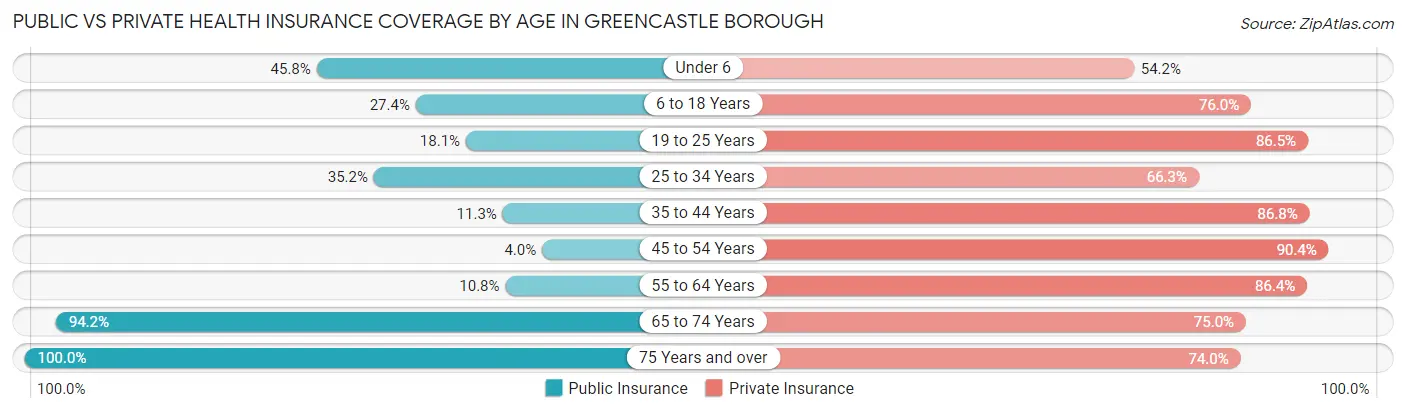
| Age Bracket | Public Insurance | Private Insurance |
| Under 6 | 191 (45.8%) | 226 (54.2%) |
| 6 to 18 Years | 180 (27.4%) | 499 (75.9%) |
| 19 to 25 Years | 51 (18.1%) | 244 (86.5%) |
| 25 to 34 Years | 145 (35.2%) | 273 (66.3%) |
| 35 to 44 Years | 65 (11.3%) | 501 (86.8%) |
| 45 to 54 Years | 16 (4.0%) | 366 (90.4%) |
| 55 to 64 Years | 75 (10.8%) | 602 (86.4%) |
| 65 to 74 Years | 309 (94.2%) | 246 (75.0%) |
| 75 Years and over | 454 (100.0%) | 336 (74.0%) |
| Total | 1,486 (35.1%) | 3,293 (77.9%) |
Disability Status by Sex by Age in Greencastle borough
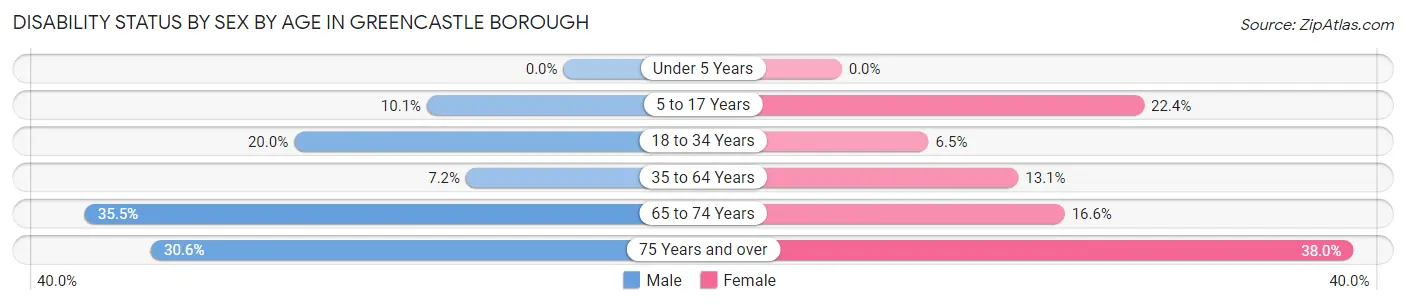
| Age Bracket | Male | Female |
| Under 5 Years | 0 (0.0%) | 0 (0.0%) |
| 5 to 17 Years | 40 (10.1%) | 57 (22.4%) |
| 18 to 34 Years | 78 (20.0%) | 22 (6.5%) |
| 35 to 64 Years | 52 (7.2%) | 126 (13.1%) |
| 65 to 74 Years | 65 (35.5%) | 24 (16.6%) |
| 75 Years and over | 60 (30.6%) | 98 (38.0%) |
Disability Class by Sex by Age in Greencastle borough
Disability Class: Hearing Difficulty
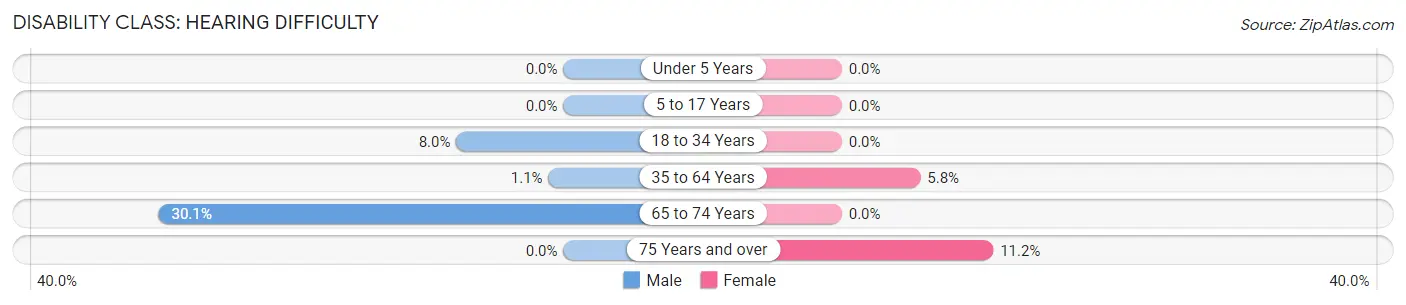
| Age Bracket | Male | Female |
| Under 5 Years | 0 (0.0%) | 0 (0.0%) |
| 5 to 17 Years | 0 (0.0%) | 0 (0.0%) |
| 18 to 34 Years | 31 (8.0%) | 0 (0.0%) |
| 35 to 64 Years | 8 (1.1%) | 56 (5.8%) |
| 65 to 74 Years | 55 (30.0%) | 0 (0.0%) |
| 75 Years and over | 0 (0.0%) | 29 (11.2%) |
Disability Class: Vision Difficulty
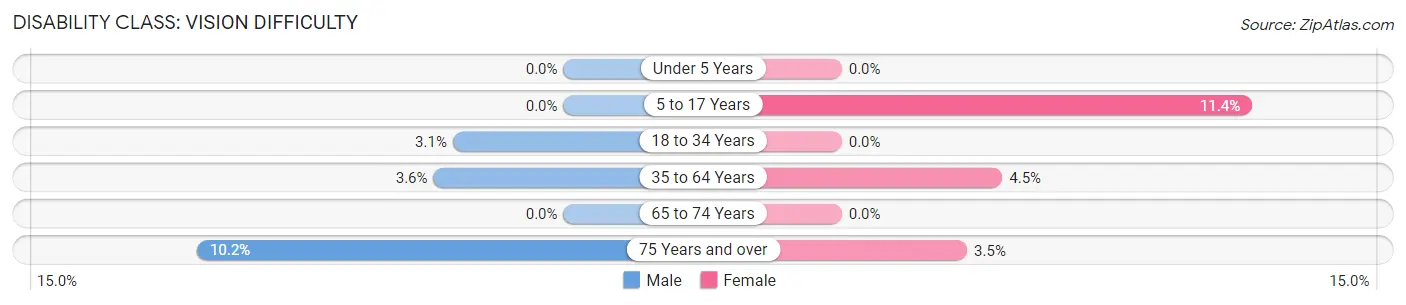
| Age Bracket | Male | Female |
| Under 5 Years | 0 (0.0%) | 0 (0.0%) |
| 5 to 17 Years | 0 (0.0%) | 29 (11.4%) |
| 18 to 34 Years | 12 (3.1%) | 0 (0.0%) |
| 35 to 64 Years | 26 (3.6%) | 43 (4.5%) |
| 65 to 74 Years | 0 (0.0%) | 0 (0.0%) |
| 75 Years and over | 20 (10.2%) | 9 (3.5%) |
Disability Class: Cognitive Difficulty
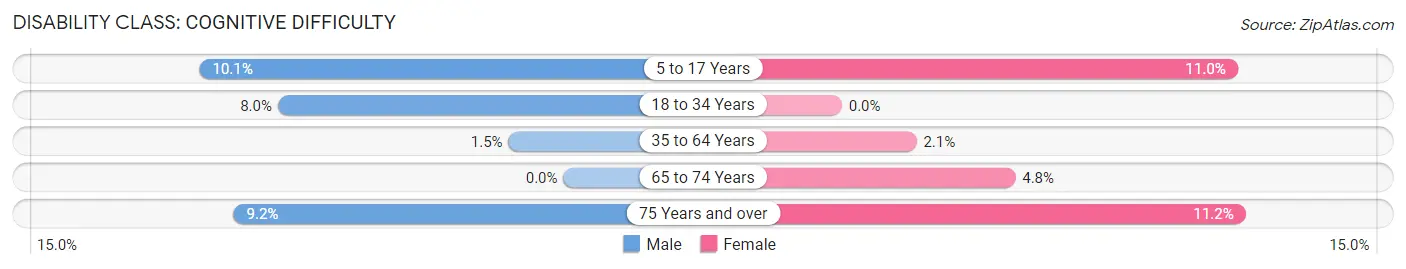
| Age Bracket | Male | Female |
| 5 to 17 Years | 40 (10.1%) | 28 (11.0%) |
| 18 to 34 Years | 31 (8.0%) | 0 (0.0%) |
| 35 to 64 Years | 11 (1.5%) | 20 (2.1%) |
| 65 to 74 Years | 0 (0.0%) | 7 (4.8%) |
| 75 Years and over | 18 (9.2%) | 29 (11.2%) |
Disability Class: Ambulatory Difficulty
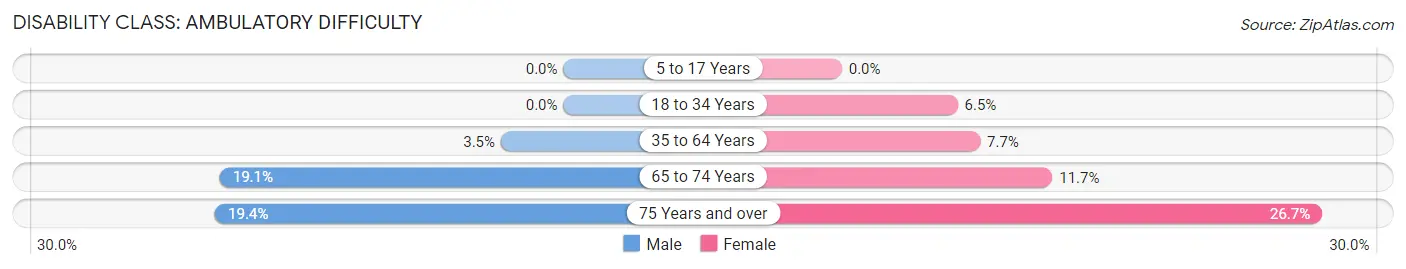
| Age Bracket | Male | Female |
| 5 to 17 Years | 0 (0.0%) | 0 (0.0%) |
| 18 to 34 Years | 0 (0.0%) | 22 (6.5%) |
| 35 to 64 Years | 25 (3.5%) | 74 (7.7%) |
| 65 to 74 Years | 35 (19.1%) | 17 (11.7%) |
| 75 Years and over | 38 (19.4%) | 69 (26.7%) |
Disability Class: Self-Care Difficulty
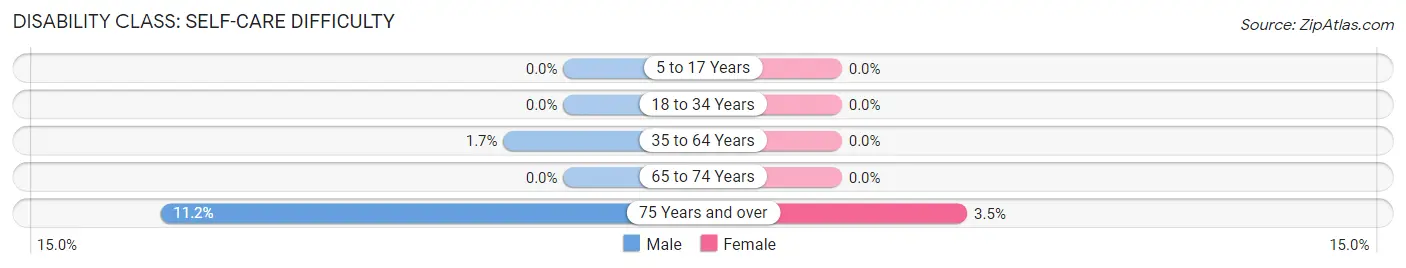
| Age Bracket | Male | Female |
| 5 to 17 Years | 0 (0.0%) | 0 (0.0%) |
| 18 to 34 Years | 0 (0.0%) | 0 (0.0%) |
| 35 to 64 Years | 12 (1.7%) | 0 (0.0%) |
| 65 to 74 Years | 0 (0.0%) | 0 (0.0%) |
| 75 Years and over | 22 (11.2%) | 9 (3.5%) |
Technology Access in Greencastle borough
Computing Device Access in Greencastle borough
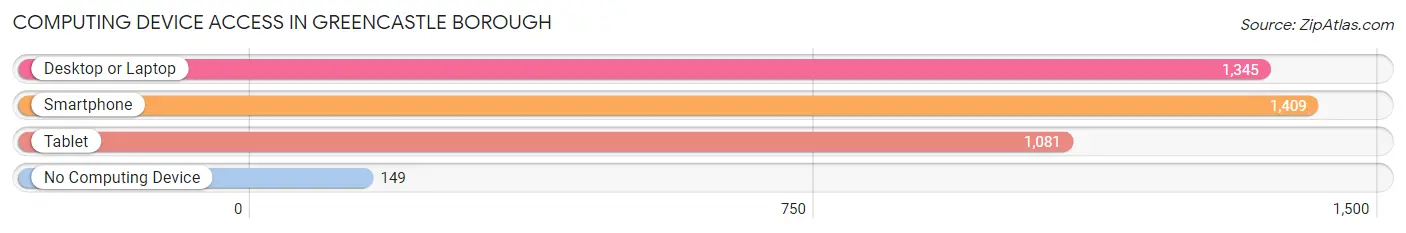
| Device Type | # Households | % Households |
| Desktop or Laptop | 1,345 | 79.2% |
| Smartphone | 1,409 | 83.0% |
| Tablet | 1,081 | 63.7% |
| No Computing Device | 149 | 8.8% |
| Total | 1,698 | 100.0% |
Internet Access in Greencastle borough
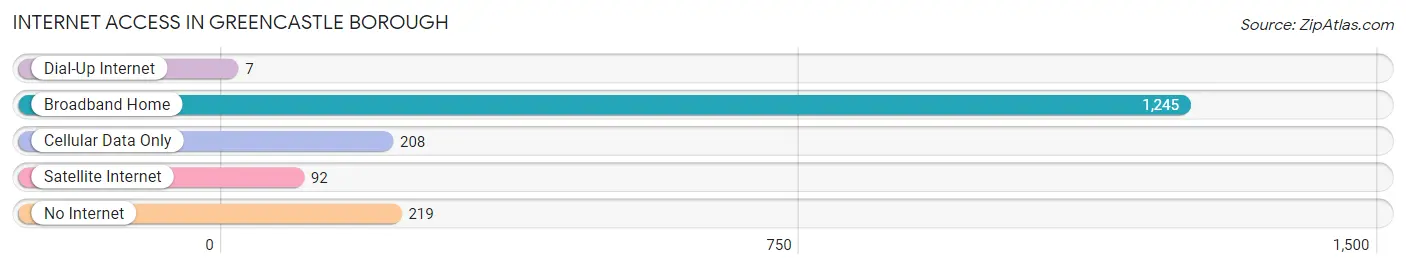
| Internet Type | # Households | % Households |
| Dial-Up Internet | 7 | 0.4% |
| Broadband Home | 1,245 | 73.3% |
| Cellular Data Only | 208 | 12.2% |
| Satellite Internet | 92 | 5.4% |
| No Internet | 219 | 12.9% |
| Total | 1,698 | 100.0% |
Greencastle borough Summary
Geography
Greencastle Borough is located in Franklin County, Pennsylvania, in the south-central part of the state. It is situated in the Cumberland Valley, which is part of the Great Appalachian Valley. The borough is bordered by Antrim Township to the north, Montgomery Township to the east, and Washington Township to the south and west. The borough is located approximately 10 miles northwest of Chambersburg, the county seat, and approximately 90 miles west of Philadelphia.
The borough covers an area of 1.2 square miles, all of which is land. The terrain is generally flat, with some rolling hills in the northern part of the borough. The borough is drained by the Conococheague Creek, which flows through the center of the borough.
History
Greencastle Borough was founded in 1782 by John Allison, a Revolutionary War veteran. The borough was named after Greencastle, Ireland, the hometown of Allison’s wife. The borough was incorporated in 1815.
In the 19th century, Greencastle was a major center of the iron industry. The borough was home to several iron furnaces, which produced pig iron for use in the production of steel. The iron industry declined in the late 19th century, and the borough shifted to a more agricultural economy.
In the 20th century, Greencastle became a popular tourist destination. The borough is home to several historic sites, including the Allison-Antrim Museum, the Greencastle Historic District, and the Greencastle-Antrim Railroad.
Economy
Greencastle Borough’s economy is largely based on tourism and retail. The borough is home to several tourist attractions, including the Allison-Antrim Museum, the Greencastle Historic District, and the Greencastle-Antrim Railroad. The borough is also home to several retail stores, including antique shops, clothing stores, and gift shops.
The borough is also home to several manufacturing companies, including a plastics manufacturer, a metal fabricator, and a printing company. The borough is also home to several service-based businesses, including restaurants, hotels, and auto repair shops.
Demographics
As of the 2010 census, the population of Greencastle Borough was 4,621. The racial makeup of the borough was 95.3% White, 1.2% African American, 0.3% Native American, 0.7% Asian, 0.1% Pacific Islander, 0.7% from other races, and 1.9% from two or more races. Hispanic or Latino of any race were 2.2% of the population.
The median household income in Greencastle Borough was $45,938, and the median family income was $54,844. The per capita income was $22,845. About 8.3% of families and 10.2% of the population were below the poverty line, including 14.2% of those under age 18 and 6.2% of those age 65 or over.
Common Questions
What is Per Capita Income in Greencastle borough?
Per Capita income in Greencastle borough is $44,613.
What is the Median Family Income in Greencastle borough?
Median Family Income in Greencastle borough is $88,859.
What is the Median Household income in Greencastle borough?
Median Household Income in Greencastle borough is $75,000.
What is Income or Wage Gap in Greencastle borough?
Income or Wage Gap in Greencastle borough is 13.0%.
Women in Greencastle borough earn 87.0 cents for every dollar earned by a man.
What is Inequality or Gini Index in Greencastle borough?
Inequality or Gini Index in Greencastle borough is 0.48.
What is the Total Population of Greencastle borough?
Total Population of Greencastle borough is 4,235.
What is the Total Male Population of Greencastle borough?
Total Male Population of Greencastle borough is 2,011.
What is the Total Female Population of Greencastle borough?
Total Female Population of Greencastle borough is 2,224.
What is the Ratio of Males per 100 Females in Greencastle borough?
There are 90.42 Males per 100 Females in Greencastle borough.
What is the Ratio of Females per 100 Males in Greencastle borough?
There are 110.59 Females per 100 Males in Greencastle borough.
What is the Median Population Age in Greencastle borough?
Median Population Age in Greencastle borough is 42.3 Years.
What is the Average Family Size in Greencastle borough
Average Family Size in Greencastle borough is 3.1 People.
What is the Average Household Size in Greencastle borough
Average Household Size in Greencastle borough is 2.5 People.
How Large is the Labor Force in Greencastle borough?
There are 2,080 People in the Labor Forcein in Greencastle borough.
What is the Percentage of People in the Labor Force in Greencastle borough?
63.7% of People are in the Labor Force in Greencastle borough.
What is the Unemployment Rate in Greencastle borough?
Unemployment Rate in Greencastle borough is 1.6%.