Dormont borough, PA Map & Demographics
Dormont borough Overview
$45,008
PER CAPITA INCOME
$104,023
AVG FAMILY INCOME
$73,798
AVG HOUSEHOLD INCOME
27.1%
WAGE / INCOME GAP [ % ]
72.9¢/ $1
WAGE / INCOME GAP [ $ ]
0.42
INEQUALITY / GINI INDEX
8,199
TOTAL POPULATION
4,159
MALE POPULATION
4,040
FEMALE POPULATION
102.95
MALES / 100 FEMALES
97.14
FEMALES / 100 MALES
37.3
MEDIAN AGE
2.8
AVG FAMILY SIZE
2.0
AVG HOUSEHOLD SIZE
5,589
LABOR FORCE [ PEOPLE ]
79.5%
PERCENT IN LABOR FORCE
5.3%
UNEMPLOYMENT RATE
Income in Dormont borough
Income Overview in Dormont borough
Per Capita Income in Dormont borough is $45,008, while median incomes of families and households are $104,023 and $73,798 respectively.
| Characteristic | Number | Measure |
| Per Capita Income | 8,199 | $45,008 |
| Median Family Income | 1,835 | $104,023 |
| Mean Family Income | 1,835 | $119,879 |
| Median Household Income | 4,157 | $73,798 |
| Mean Household Income | 4,157 | $87,528 |
| Income Deficit | 1,835 | $0 |
| Wage / Income Gap (%) | 8,199 | 27.08% |
| Wage / Income Gap ($) | 8,199 | 72.92¢ per $1 |
| Gini / Inequality Index | 8,199 | 0.42 |
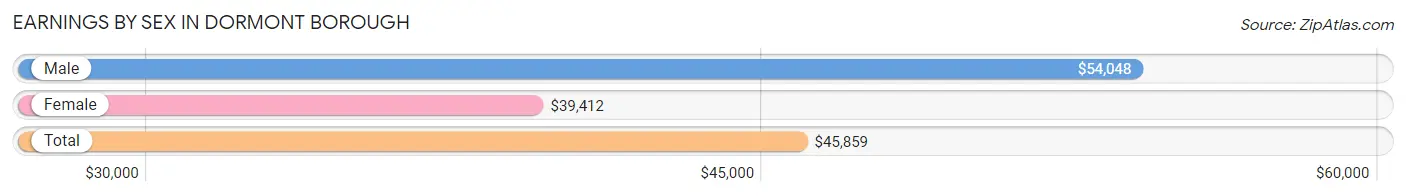
Earnings by Sex in Dormont borough
Average Earnings in Dormont borough are $45,859, $54,048 for men and $39,412 for women, a difference of 27.1%.
| Sex | Number | Average Earnings |
| Male | 2,964 (51.9%) | $54,048 |
| Female | 2,744 (48.1%) | $39,412 |
| Total | 5,708 (100.0%) | $45,859 |
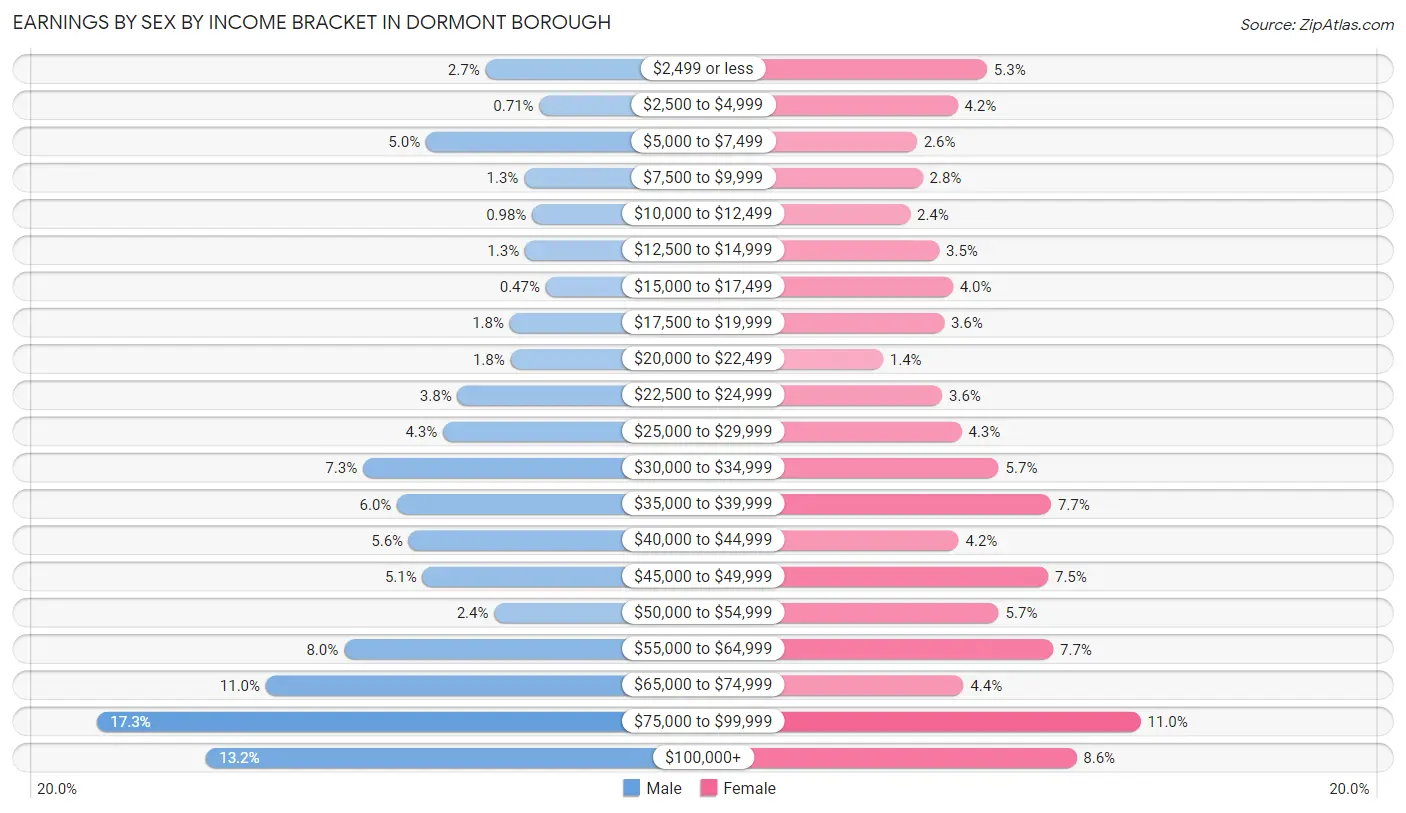
Earnings by Sex by Income Bracket in Dormont borough
The most common earnings brackets in Dormont borough are $75,000 to $99,999 for men (512 | 17.3%) and $75,000 to $99,999 for women (302 | 11.0%).
| Income | Male | Female |
| $2,499 or less | 81 (2.7%) | 144 (5.2%) |
| $2,500 to $4,999 | 21 (0.7%) | 114 (4.2%) |
| $5,000 to $7,499 | 147 (5.0%) | 72 (2.6%) |
| $7,500 to $9,999 | 38 (1.3%) | 78 (2.8%) |
| $10,000 to $12,499 | 29 (1.0%) | 65 (2.4%) |
| $12,500 to $14,999 | 37 (1.3%) | 95 (3.5%) |
| $15,000 to $17,499 | 14 (0.5%) | 109 (4.0%) |
| $17,500 to $19,999 | 54 (1.8%) | 100 (3.6%) |
| $20,000 to $22,499 | 53 (1.8%) | 37 (1.3%) |
| $22,500 to $24,999 | 112 (3.8%) | 98 (3.6%) |
| $25,000 to $29,999 | 128 (4.3%) | 118 (4.3%) |
| $30,000 to $34,999 | 217 (7.3%) | 156 (5.7%) |
| $35,000 to $39,999 | 179 (6.0%) | 210 (7.6%) |
| $40,000 to $44,999 | 166 (5.6%) | 115 (4.2%) |
| $45,000 to $49,999 | 151 (5.1%) | 207 (7.5%) |
| $50,000 to $54,999 | 71 (2.4%) | 156 (5.7%) |
| $55,000 to $64,999 | 238 (8.0%) | 212 (7.7%) |
| $65,000 to $74,999 | 325 (11.0%) | 120 (4.4%) |
| $75,000 to $99,999 | 512 (17.3%) | 302 (11.0%) |
| $100,000+ | 391 (13.2%) | 236 (8.6%) |
| Total | 2,964 (100.0%) | 2,744 (100.0%) |
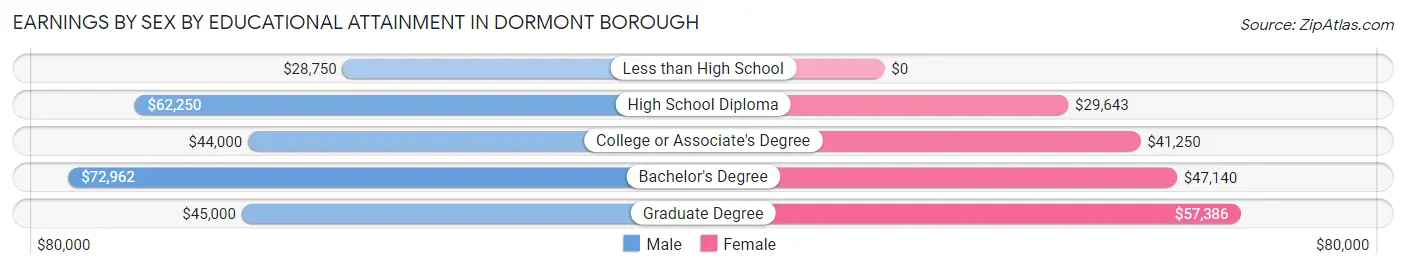
Earnings by Sex by Educational Attainment in Dormont borough
Average earnings in Dormont borough are $59,348 for men and $42,349 for women, a difference of 28.6%. Men with an educational attainment of bachelor's degree enjoy the highest average annual earnings of $72,962, while those with less than high school education earn the least with $28,750. Women with an educational attainment of graduate degree earn the most with the average annual earnings of $57,386, while those with high school diploma education have the smallest earnings of $29,643.
| Educational Attainment | Male Income | Female Income |
| Less than High School | $28,750 | $0 |
| High School Diploma | $62,250 | $29,643 |
| College or Associate's Degree | $44,000 | $41,250 |
| Bachelor's Degree | $72,962 | $47,140 |
| Graduate Degree | $45,000 | $57,386 |
| Total | $59,348 | $42,349 |
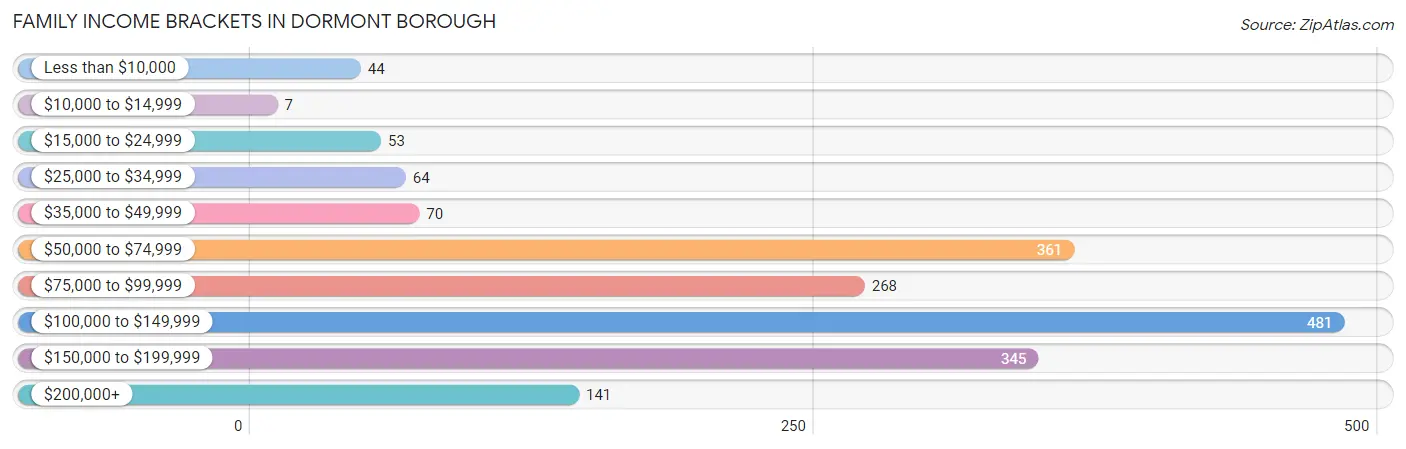
Family Income in Dormont borough
Family Income Brackets in Dormont borough
According to the Dormont borough family income data, there are 481 families falling into the $100,000 to $149,999 income range, which is the most common income bracket and makes up 26.2% of all families. Conversely, the $10,000 to $14,999 income bracket is the least frequent group with only 7 families (0.4%) belonging to this category.
| Income Bracket | # Families | % Families |
| Less than $10,000 | 44 | 2.4% |
| $10,000 to $14,999 | 7 | 0.4% |
| $15,000 to $24,999 | 53 | 2.9% |
| $25,000 to $34,999 | 64 | 3.5% |
| $35,000 to $49,999 | 70 | 3.8% |
| $50,000 to $74,999 | 361 | 19.7% |
| $75,000 to $99,999 | 268 | 14.6% |
| $100,000 to $149,999 | 481 | 26.2% |
| $150,000 to $199,999 | 345 | 18.8% |
| $200,000+ | 141 | 7.7% |
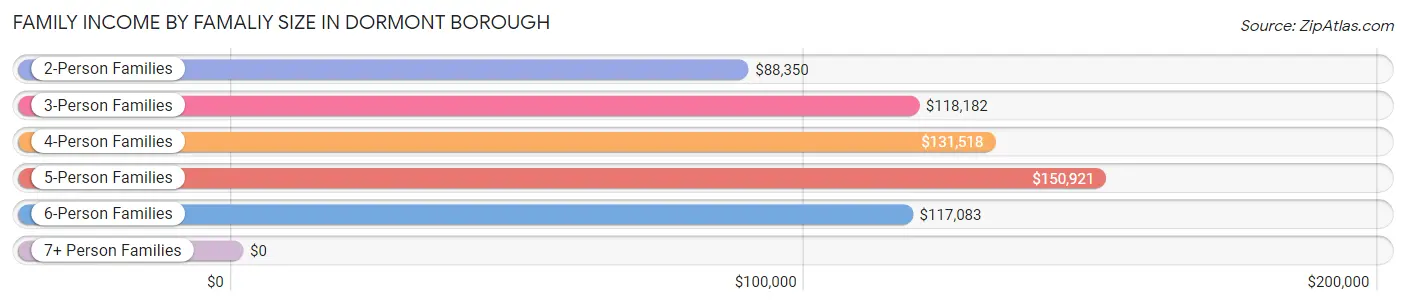
Family Income by Famaliy Size in Dormont borough
5-person families (80 | 4.4%) account for the highest median family income in Dormont borough with $150,921 per family, while 2-person families (1,029 | 56.1%) have the highest median income of $44,175 per family member.
| Income Bracket | # Families | Median Income |
| 2-Person Families | 1,029 (56.1%) | $88,350 |
| 3-Person Families | 316 (17.2%) | $118,182 |
| 4-Person Families | 385 (21.0%) | $131,518 |
| 5-Person Families | 80 (4.4%) | $150,921 |
| 6-Person Families | 25 (1.4%) | $117,083 |
| 7+ Person Families | 0 (0.0%) | $0 |
| Total | 1,835 (100.0%) | $104,023 |
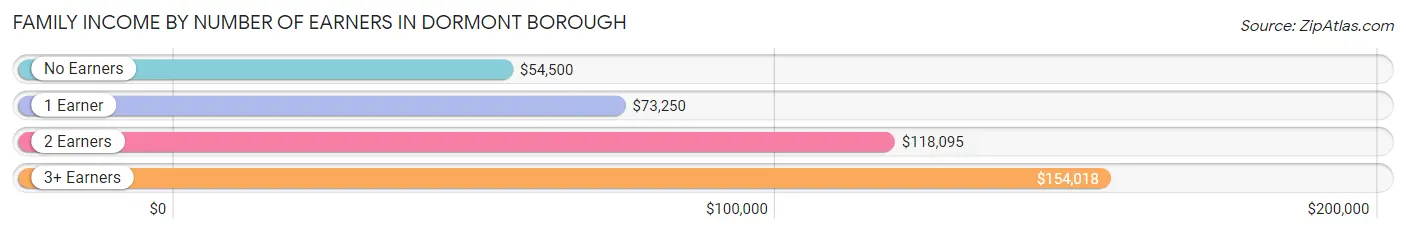
Family Income by Number of Earners in Dormont borough
The median family income in Dormont borough is $104,023, with families comprising 3+ earners (155) having the highest median family income of $154,018, while families with no earners (96) have the lowest median family income of $54,500, accounting for 8.5% and 5.2% of families, respectively.
| Number of Earners | # Families | Median Income |
| No Earners | 96 (5.2%) | $54,500 |
| 1 Earner | 632 (34.4%) | $73,250 |
| 2 Earners | 952 (51.9%) | $118,095 |
| 3+ Earners | 155 (8.5%) | $154,018 |
| Total | 1,835 (100.0%) | $104,023 |
Household Income in Dormont borough
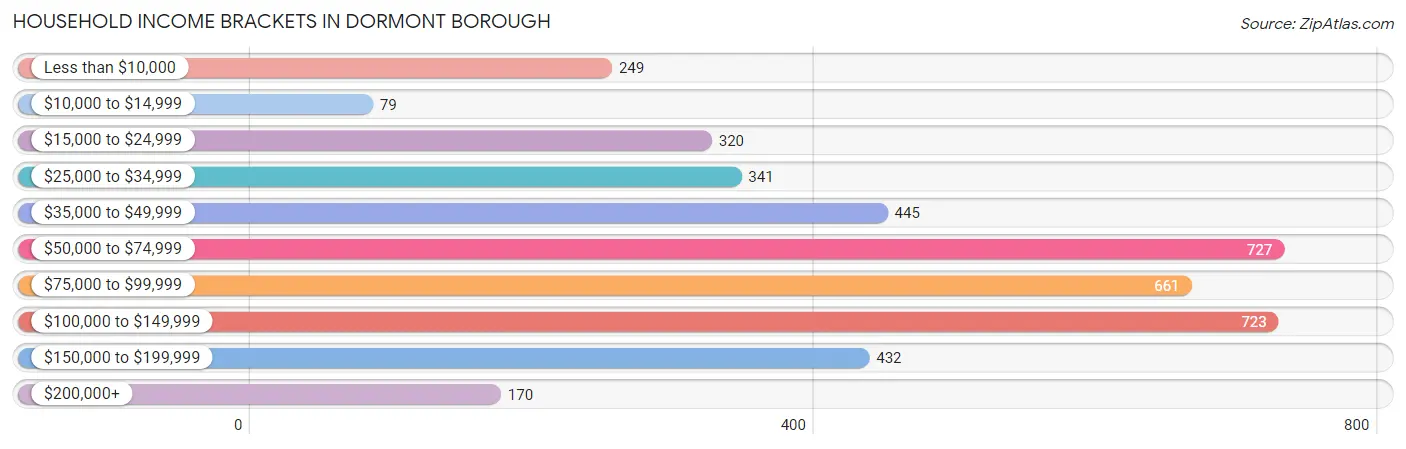
Household Income Brackets in Dormont borough
With 727 households falling in the category, the $50,000 to $74,999 income range is the most frequent in Dormont borough, accounting for 17.5% of all households. In contrast, only 79 households (1.9%) fall into the $10,000 to $14,999 income bracket, making it the least populous group.
| Income Bracket | # Households | % Households |
| Less than $10,000 | 249 | 6.0% |
| $10,000 to $14,999 | 79 | 1.9% |
| $15,000 to $24,999 | 320 | 7.7% |
| $25,000 to $34,999 | 341 | 8.2% |
| $35,000 to $49,999 | 445 | 10.7% |
| $50,000 to $74,999 | 727 | 17.5% |
| $75,000 to $99,999 | 661 | 15.9% |
| $100,000 to $149,999 | 723 | 17.4% |
| $150,000 to $199,999 | 432 | 10.4% |
| $200,000+ | 170 | 4.1% |
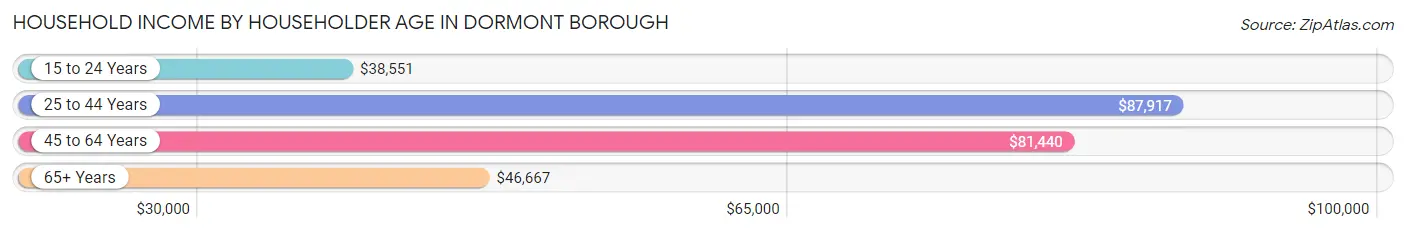
Household Income by Householder Age in Dormont borough
The median household income in Dormont borough is $73,798, with the highest median household income of $87,917 found in the 25 to 44 years age bracket for the primary householder. A total of 1,867 households (44.9%) fall into this category. Meanwhile, the 15 to 24 years age bracket for the primary householder has the lowest median household income of $38,551, with 209 households (5.0%) in this group.
| Income Bracket | # Households | Median Income |
| 15 to 24 Years | 209 (5.0%) | $38,551 |
| 25 to 44 Years | 1,867 (44.9%) | $87,917 |
| 45 to 64 Years | 1,149 (27.6%) | $81,440 |
| 65+ Years | 932 (22.4%) | $46,667 |
| Total | 4,157 (100.0%) | $73,798 |
Poverty in Dormont borough
Income Below Poverty by Sex and Age in Dormont borough
With 7.2% poverty level for males and 9.9% for females among the residents of Dormont borough, 45 to 54 year old males and 5 year old females are the most vulnerable to poverty, with 140 males (30.9%) and 39 females (49.4%) in their respective age groups living below the poverty level.
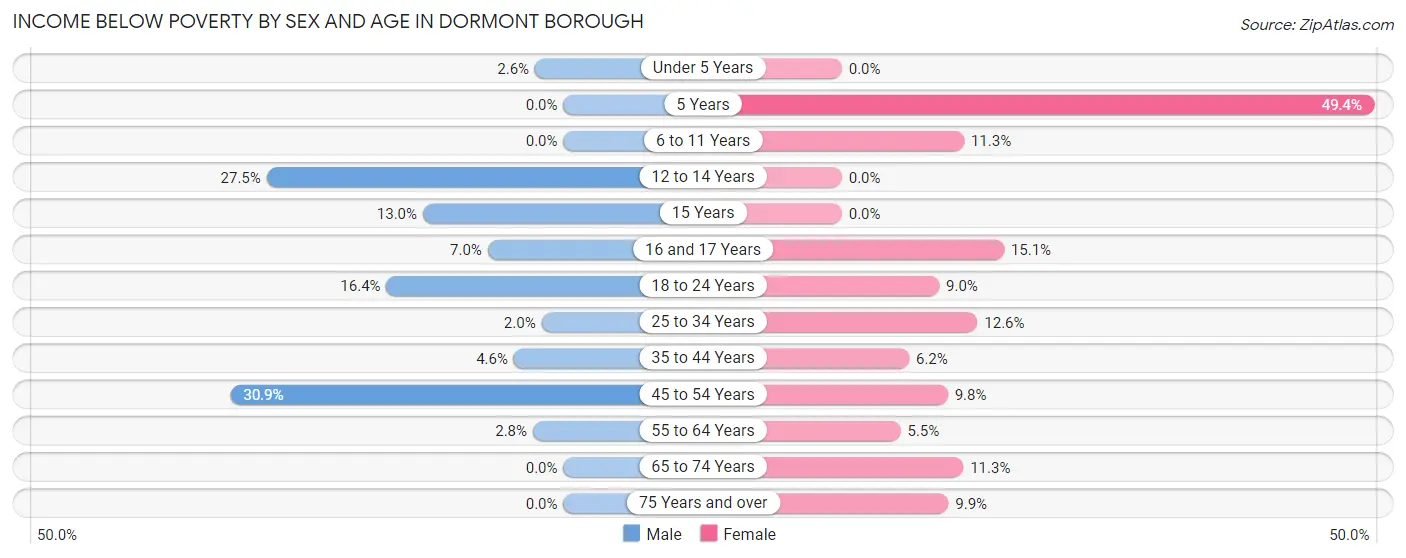
| Age Bracket | Male | Female |
| Under 5 Years | 7 (2.6%) | 0 (0.0%) |
| 5 Years | 0 (0.0%) | 39 (49.4%) |
| 6 to 11 Years | 0 (0.0%) | 28 (11.3%) |
| 12 to 14 Years | 19 (27.5%) | 0 (0.0%) |
| 15 Years | 12 (13.0%) | 0 (0.0%) |
| 16 and 17 Years | 4 (7.0%) | 14 (15.0%) |
| 18 to 24 Years | 44 (16.4%) | 25 (9.0%) |
| 25 to 34 Years | 19 (2.0%) | 112 (12.6%) |
| 35 to 44 Years | 39 (4.6%) | 35 (6.2%) |
| 45 to 54 Years | 140 (30.9%) | 41 (9.8%) |
| 55 to 64 Years | 14 (2.8%) | 25 (5.4%) |
| 65 to 74 Years | 0 (0.0%) | 55 (11.3%) |
| 75 Years and over | 0 (0.0%) | 26 (9.9%) |
| Total | 298 (7.2%) | 400 (9.9%) |
Income Above Poverty by Sex and Age in Dormont borough
According to the poverty statistics in Dormont borough, males aged 5 years and females aged under 5 years are the age groups that are most secure financially, with 100.0% of males and 100.0% of females in these age groups living above the poverty line.
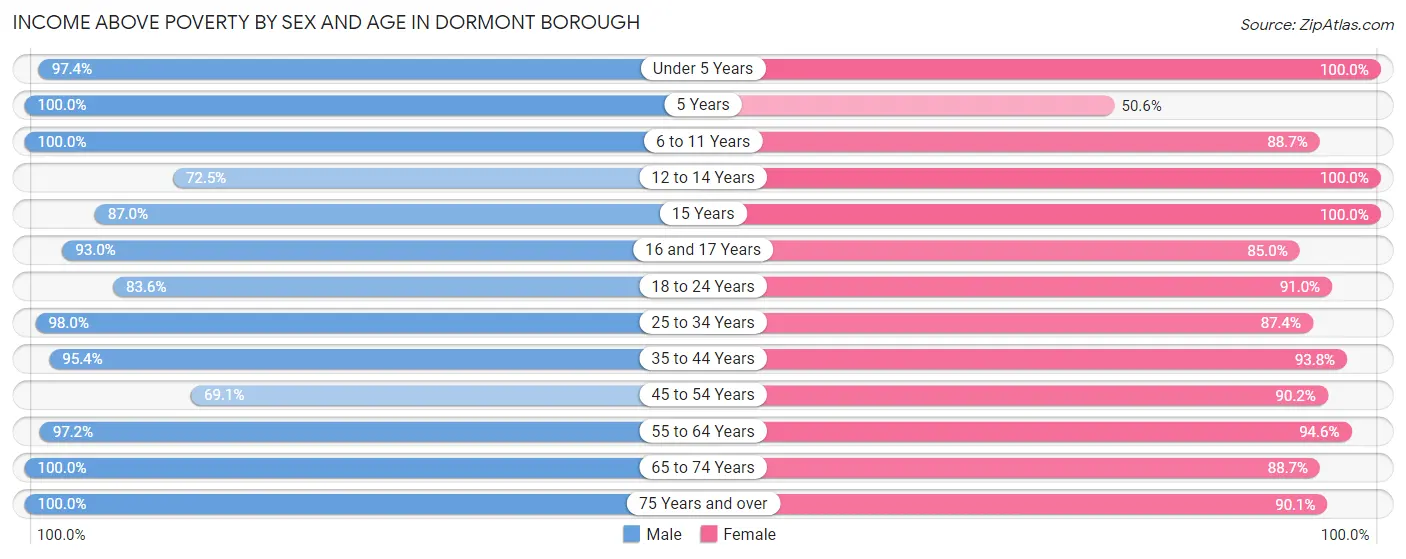
| Age Bracket | Male | Female |
| Under 5 Years | 258 (97.4%) | 113 (100.0%) |
| 5 Years | 3 (100.0%) | 40 (50.6%) |
| 6 to 11 Years | 148 (100.0%) | 219 (88.7%) |
| 12 to 14 Years | 50 (72.5%) | 133 (100.0%) |
| 15 Years | 80 (87.0%) | 20 (100.0%) |
| 16 and 17 Years | 53 (93.0%) | 79 (85.0%) |
| 18 to 24 Years | 224 (83.6%) | 252 (91.0%) |
| 25 to 34 Years | 919 (98.0%) | 778 (87.4%) |
| 35 to 44 Years | 808 (95.4%) | 526 (93.8%) |
| 45 to 54 Years | 313 (69.1%) | 376 (90.2%) |
| 55 to 64 Years | 481 (97.2%) | 434 (94.6%) |
| 65 to 74 Years | 397 (100.0%) | 433 (88.7%) |
| 75 Years and over | 127 (100.0%) | 237 (90.1%) |
| Total | 3,861 (92.8%) | 3,640 (90.1%) |
Income Below Poverty Among Married-Couple Families in Dormont borough
The poverty statistics for married-couple families in Dormont borough show that 1.2% or 17 of the total 1,409 families live below the poverty line. Families with 1 or 2 children have the highest poverty rate of 1.6%, comprising of 7 families. On the other hand, families with 3 or 4 children have the lowest poverty rate of 0.0%, which includes 0 families.
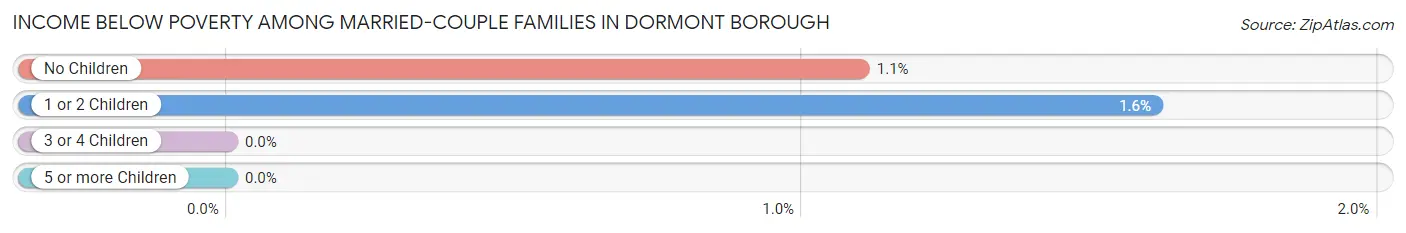
| Children | Above Poverty | Below Poverty |
| No Children | 898 (98.9%) | 10 (1.1%) |
| 1 or 2 Children | 428 (98.4%) | 7 (1.6%) |
| 3 or 4 Children | 66 (100.0%) | 0 (0.0%) |
| 5 or more Children | 0 (0.0%) | 0 (0.0%) |
| Total | 1,392 (98.8%) | 17 (1.2%) |
Income Below Poverty Among Single-Parent Households in Dormont borough
According to the poverty data in Dormont borough, 14.9% or 18 single-father households and 20.0% or 61 single-mother households are living below the poverty line. Among single-father households, those with 1 or 2 children have the highest poverty rate, with 18 households (40.9%) experiencing poverty. Likewise, among single-mother households, those with 1 or 2 children have the highest poverty rate, with 61 households (29.3%) falling below the poverty line.
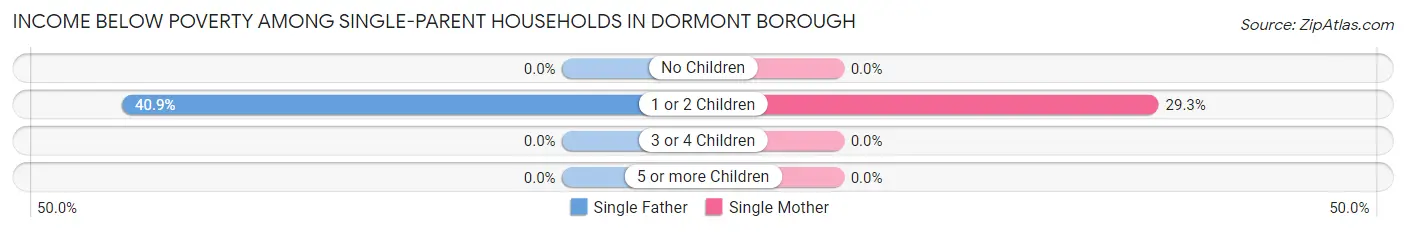
| Children | Single Father | Single Mother |
| No Children | 0 (0.0%) | 0 (0.0%) |
| 1 or 2 Children | 18 (40.9%) | 61 (29.3%) |
| 3 or 4 Children | 0 (0.0%) | 0 (0.0%) |
| 5 or more Children | 0 (0.0%) | 0 (0.0%) |
| Total | 18 (14.9%) | 61 (20.0%) |
Income Below Poverty Among Married-Couple vs Single-Parent Households in Dormont borough
The poverty data for Dormont borough shows that 17 of the married-couple family households (1.2%) and 79 of the single-parent households (18.5%) are living below the poverty level. Within the married-couple family households, those with 1 or 2 children have the highest poverty rate, with 7 households (1.6%) falling below the poverty line. Among the single-parent households, those with 1 or 2 children have the highest poverty rate, with 79 household (31.4%) living below poverty.
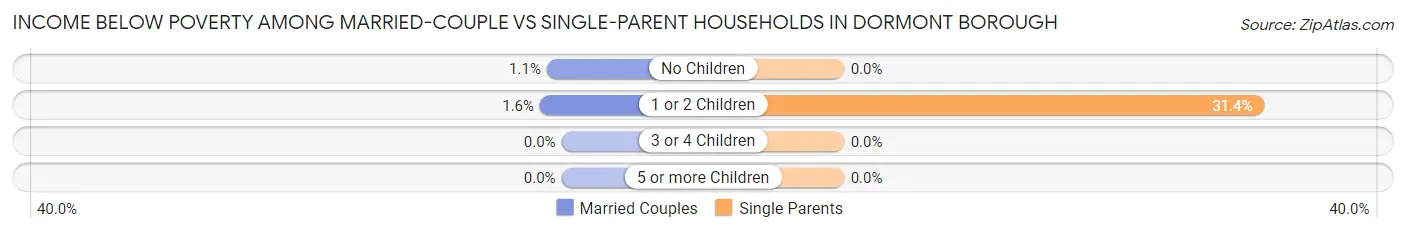
| Children | Married-Couple Families | Single-Parent Households |
| No Children | 10 (1.1%) | 0 (0.0%) |
| 1 or 2 Children | 7 (1.6%) | 79 (31.4%) |
| 3 or 4 Children | 0 (0.0%) | 0 (0.0%) |
| 5 or more Children | 0 (0.0%) | 0 (0.0%) |
| Total | 17 (1.2%) | 79 (18.5%) |
Race in Dormont borough
The most populous races in Dormont borough are White / Caucasian (7,554 | 92.1%), Hispanic or Latino (365 | 4.4%), and Two or more Races (273 | 3.3%).
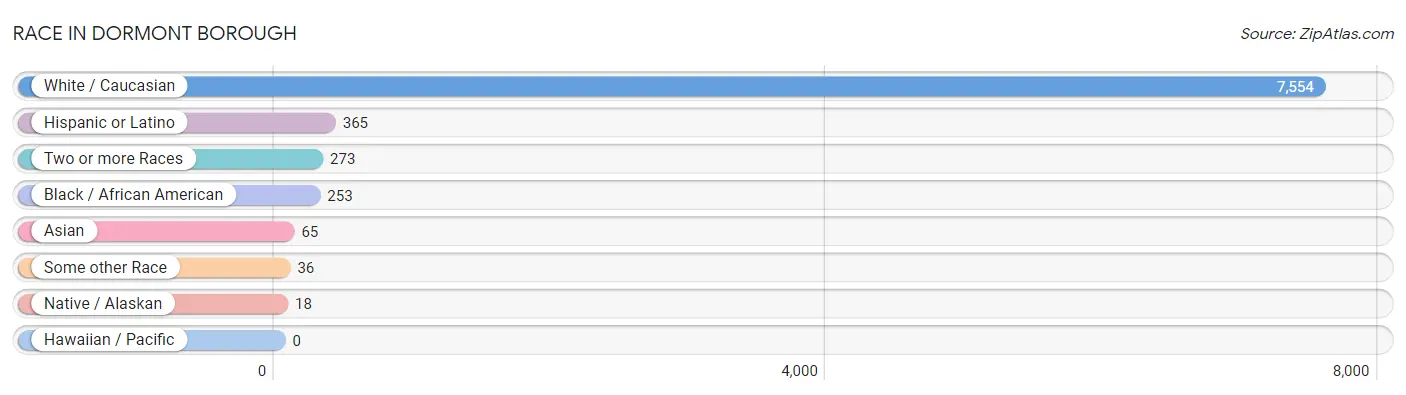
| Race | # Population | % Population |
| Asian | 65 | 0.8% |
| Black / African American | 253 | 3.1% |
| Hawaiian / Pacific | 0 | 0.0% |
| Hispanic or Latino | 365 | 4.4% |
| Native / Alaskan | 18 | 0.2% |
| White / Caucasian | 7,554 | 92.1% |
| Two or more Races | 273 | 3.3% |
| Some other Race | 36 | 0.4% |
| Total | 8,199 | 100.0% |
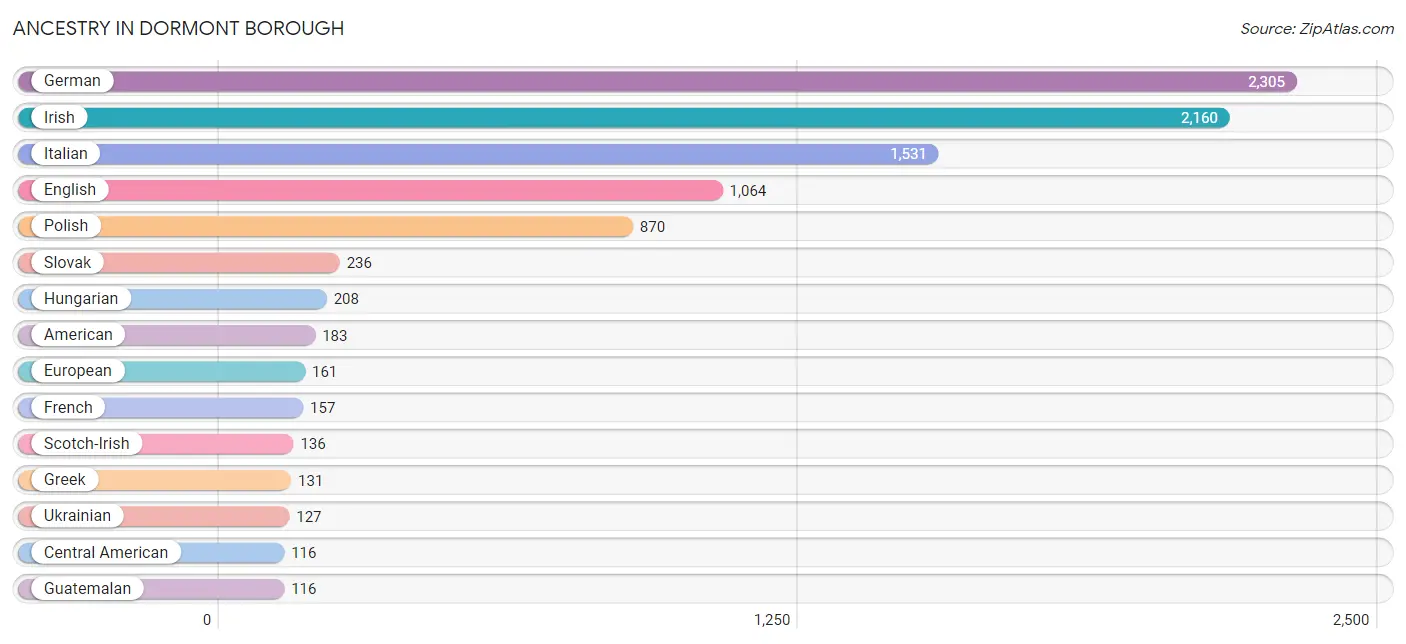
Ancestry in Dormont borough
The most populous ancestries reported in Dormont borough are German (2,305 | 28.1%), Irish (2,160 | 26.3%), Italian (1,531 | 18.7%), English (1,064 | 13.0%), and Polish (870 | 10.6%), together accounting for 96.7% of all Dormont borough residents.
| Ancestry | # Population | % Population |
| American | 183 | 2.2% |
| Arab | 61 | 0.7% |
| Austrian | 19 | 0.2% |
| Bhutanese | 5 | 0.1% |
| British | 49 | 0.6% |
| Bulgarian | 8 | 0.1% |
| Burmese | 20 | 0.2% |
| Central American | 116 | 1.4% |
| Cherokee | 8 | 0.1% |
| Chilean | 5 | 0.1% |
| Choctaw | 10 | 0.1% |
| Croatian | 113 | 1.4% |
| Czech | 40 | 0.5% |
| Czechoslovakian | 21 | 0.3% |
| Dominican | 97 | 1.2% |
| Dutch | 66 | 0.8% |
| Eastern European | 91 | 1.1% |
| Ecuadorian | 27 | 0.3% |
| English | 1,064 | 13.0% |
| European | 161 | 2.0% |
| Finnish | 22 | 0.3% |
| French | 157 | 1.9% |
| French Canadian | 52 | 0.6% |
| German | 2,305 | 28.1% |
| Greek | 131 | 1.6% |
| Guatemalan | 116 | 1.4% |
| Haitian | 36 | 0.4% |
| Hungarian | 208 | 2.5% |
| Indian (Asian) | 45 | 0.5% |
| Indonesian | 14 | 0.2% |
| Irish | 2,160 | 26.3% |
| Israeli | 9 | 0.1% |
| Italian | 1,531 | 18.7% |
| Korean | 3 | 0.0% |
| Latvian | 7 | 0.1% |
| Lebanese | 34 | 0.4% |
| Lithuanian | 54 | 0.7% |
| Mexican | 23 | 0.3% |
| Nigerian | 13 | 0.2% |
| Northern European | 13 | 0.2% |
| Norwegian | 20 | 0.2% |
| Pakistani | 8 | 0.1% |
| Polish | 870 | 10.6% |
| Puerto Rican | 6 | 0.1% |
| Russian | 86 | 1.1% |
| Samoan | 7 | 0.1% |
| Scandinavian | 34 | 0.4% |
| Scotch-Irish | 136 | 1.7% |
| Scottish | 60 | 0.7% |
| Serbian | 61 | 0.7% |
| Sioux | 5 | 0.1% |
| Slavic | 14 | 0.2% |
| Slovak | 236 | 2.9% |
| Slovene | 27 | 0.3% |
| South African | 13 | 0.2% |
| South American | 32 | 0.4% |
| Spaniard | 3 | 0.0% |
| Spanish | 9 | 0.1% |
| Sri Lankan | 24 | 0.3% |
| Subsaharan African | 37 | 0.4% |
| Swedish | 74 | 0.9% |
| Swiss | 24 | 0.3% |
| Syrian | 15 | 0.2% |
| Thai | 6 | 0.1% |
| Ukrainian | 127 | 1.5% |
| Welsh | 17 | 0.2% |
| Yugoslavian | 9 | 0.1% | View All 67 Rows |
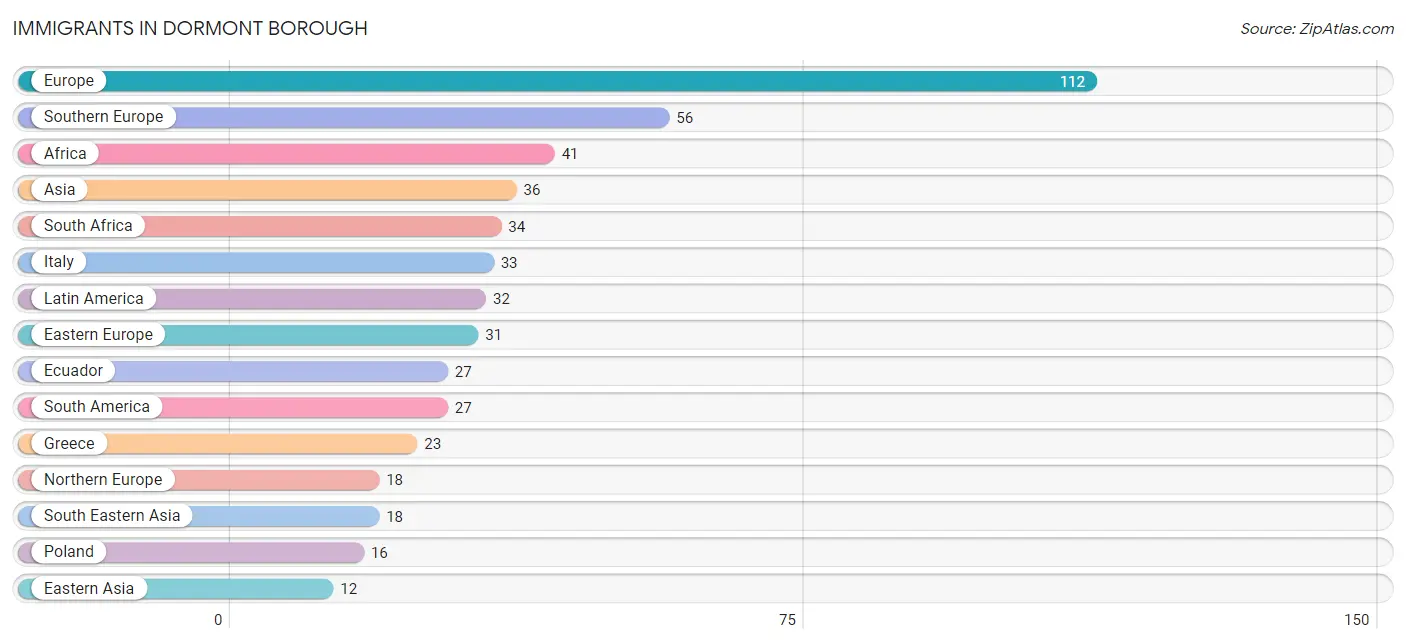
Immigrants in Dormont borough
The most numerous immigrant groups reported in Dormont borough came from Europe (112 | 1.4%), Southern Europe (56 | 0.7%), Africa (41 | 0.5%), Asia (36 | 0.4%), and South Africa (34 | 0.4%), together accounting for 3.4% of all Dormont borough residents.
| Immigration Origin | # Population | % Population |
| Africa | 41 | 0.5% |
| Asia | 36 | 0.4% |
| Canada | 7 | 0.1% |
| Central America | 5 | 0.1% |
| China | 7 | 0.1% |
| Eastern Asia | 12 | 0.2% |
| Eastern Europe | 31 | 0.4% |
| Ecuador | 27 | 0.3% |
| Egypt | 7 | 0.1% |
| Europe | 112 | 1.4% |
| Germany | 7 | 0.1% |
| Greece | 23 | 0.3% |
| Guatemala | 5 | 0.1% |
| Hong Kong | 7 | 0.1% |
| India | 6 | 0.1% |
| Italy | 33 | 0.4% |
| Japan | 5 | 0.1% |
| Latin America | 32 | 0.4% |
| Latvia | 8 | 0.1% |
| Northern Africa | 7 | 0.1% |
| Northern Europe | 18 | 0.2% |
| Poland | 16 | 0.2% |
| Serbia | 7 | 0.1% |
| South Africa | 34 | 0.4% |
| South America | 27 | 0.3% |
| South Central Asia | 6 | 0.1% |
| South Eastern Asia | 18 | 0.2% |
| Southern Europe | 56 | 0.7% |
| Vietnam | 4 | 0.1% |
| Western Europe | 7 | 0.1% | View All 30 Rows |
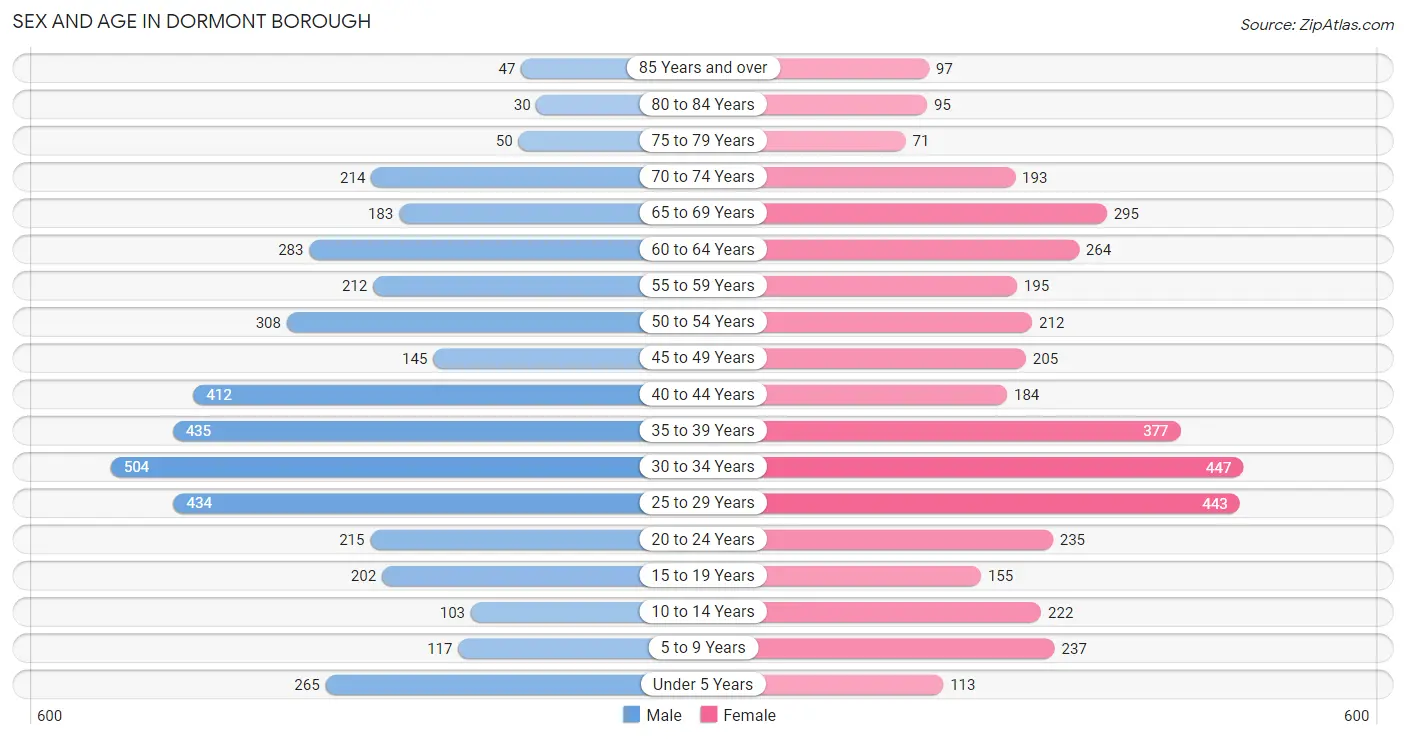
Sex and Age in Dormont borough
Sex and Age in Dormont borough
The most populous age groups in Dormont borough are 30 to 34 Years (504 | 12.1%) for men and 30 to 34 Years (447 | 11.1%) for women.
| Age Bracket | Male | Female |
| Under 5 Years | 265 (6.4%) | 113 (2.8%) |
| 5 to 9 Years | 117 (2.8%) | 237 (5.9%) |
| 10 to 14 Years | 103 (2.5%) | 222 (5.5%) |
| 15 to 19 Years | 202 (4.9%) | 155 (3.8%) |
| 20 to 24 Years | 215 (5.2%) | 235 (5.8%) |
| 25 to 29 Years | 434 (10.4%) | 443 (11.0%) |
| 30 to 34 Years | 504 (12.1%) | 447 (11.1%) |
| 35 to 39 Years | 435 (10.5%) | 377 (9.3%) |
| 40 to 44 Years | 412 (9.9%) | 184 (4.5%) |
| 45 to 49 Years | 145 (3.5%) | 205 (5.1%) |
| 50 to 54 Years | 308 (7.4%) | 212 (5.2%) |
| 55 to 59 Years | 212 (5.1%) | 195 (4.8%) |
| 60 to 64 Years | 283 (6.8%) | 264 (6.5%) |
| 65 to 69 Years | 183 (4.4%) | 295 (7.3%) |
| 70 to 74 Years | 214 (5.1%) | 193 (4.8%) |
| 75 to 79 Years | 50 (1.2%) | 71 (1.8%) |
| 80 to 84 Years | 30 (0.7%) | 95 (2.4%) |
| 85 Years and over | 47 (1.1%) | 97 (2.4%) |
| Total | 4,159 (100.0%) | 4,040 (100.0%) |
Families and Households in Dormont borough
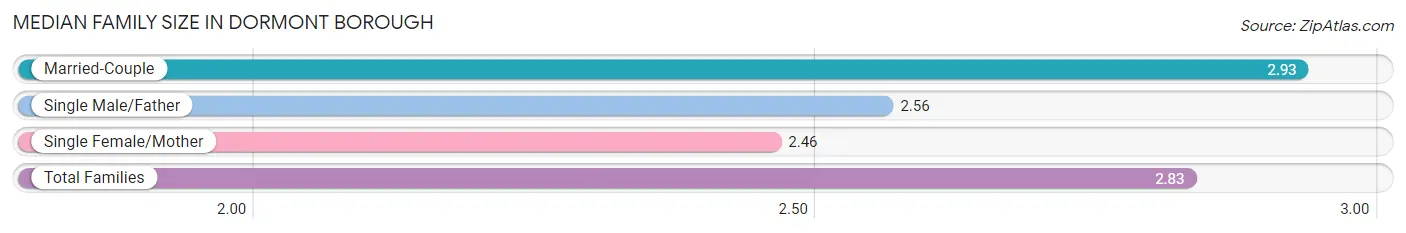
Median Family Size in Dormont borough
The median family size in Dormont borough is 2.83 persons per family, with married-couple families (1,409 | 76.8%) accounting for the largest median family size of 2.93 persons per family. On the other hand, single female/mother families (305 | 16.6%) represent the smallest median family size with 2.46 persons per family.
| Family Type | # Families | Family Size |
| Married-Couple | 1,409 (76.8%) | 2.93 |
| Single Male/Father | 121 (6.6%) | 2.56 |
| Single Female/Mother | 305 (16.6%) | 2.46 |
| Total Families | 1,835 (100.0%) | 2.83 |
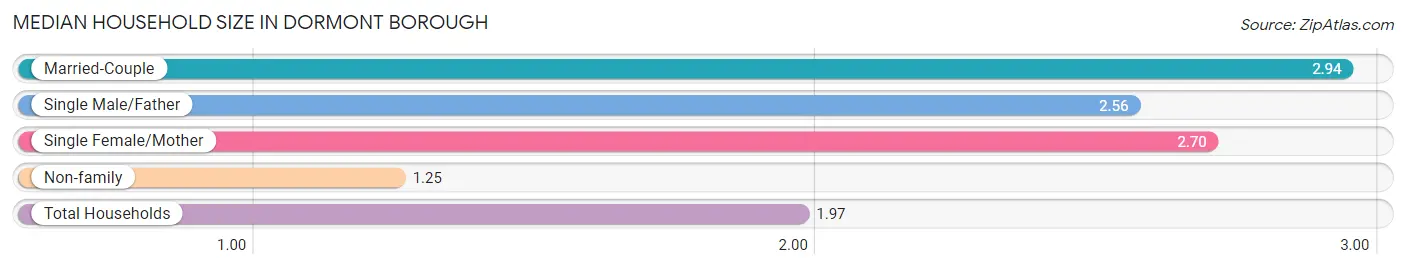
Median Household Size in Dormont borough
The median household size in Dormont borough is 1.97 persons per household, with married-couple households (1,409 | 33.9%) accounting for the largest median household size of 2.94 persons per household. non-family households (2,322 | 55.9%) represent the smallest median household size with 1.25 persons per household.
| Household Type | # Households | Household Size |
| Married-Couple | 1,409 (33.9%) | 2.94 |
| Single Male/Father | 121 (2.9%) | 2.56 |
| Single Female/Mother | 305 (7.3%) | 2.70 |
| Non-family | 2,322 (55.9%) | 1.25 |
| Total Households | 4,157 (100.0%) | 1.97 |
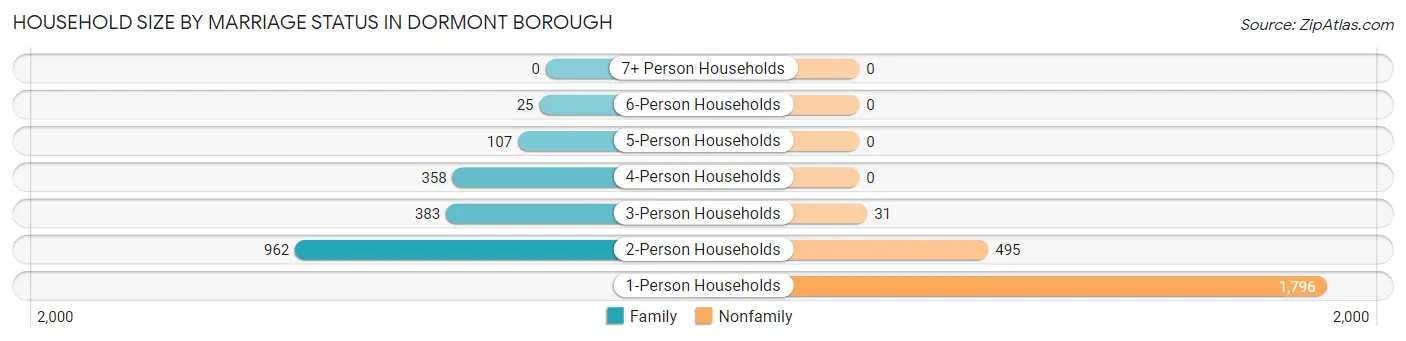
Household Size by Marriage Status in Dormont borough
Out of a total of 4,157 households in Dormont borough, 1,835 (44.1%) are family households, while 2,322 (55.9%) are nonfamily households. The most numerous type of family households are 2-person households, comprising 962, and the most common type of nonfamily households are 1-person households, comprising 1,796.
| Household Size | Family Households | Nonfamily Households |
| 1-Person Households | - | 1,796 (43.2%) |
| 2-Person Households | 962 (23.1%) | 495 (11.9%) |
| 3-Person Households | 383 (9.2%) | 31 (0.7%) |
| 4-Person Households | 358 (8.6%) | 0 (0.0%) |
| 5-Person Households | 107 (2.6%) | 0 (0.0%) |
| 6-Person Households | 25 (0.6%) | 0 (0.0%) |
| 7+ Person Households | 0 (0.0%) | 0 (0.0%) |
| Total | 1,835 (44.1%) | 2,322 (55.9%) |
Female Fertility in Dormont borough
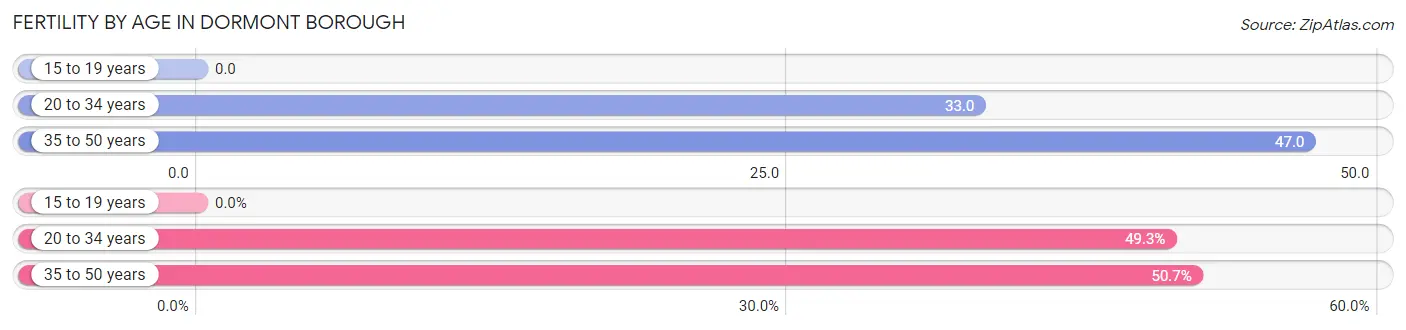
Fertility by Age in Dormont borough
Average fertility rate in Dormont borough is 36.0 births per 1,000 women. Women in the age bracket of 35 to 50 years have the highest fertility rate with 47.0 births per 1,000 women. Women in the age bracket of 35 to 50 years acount for 50.7% of all women with births.
| Age Bracket | Women with Births | Births / 1,000 Women |
| 15 to 19 years | 0 (0.0%) | 0.0 |
| 20 to 34 years | 37 (49.3%) | 33.0 |
| 35 to 50 years | 38 (50.7%) | 47.0 |
| Total | 75 (100.0%) | 36.0 |
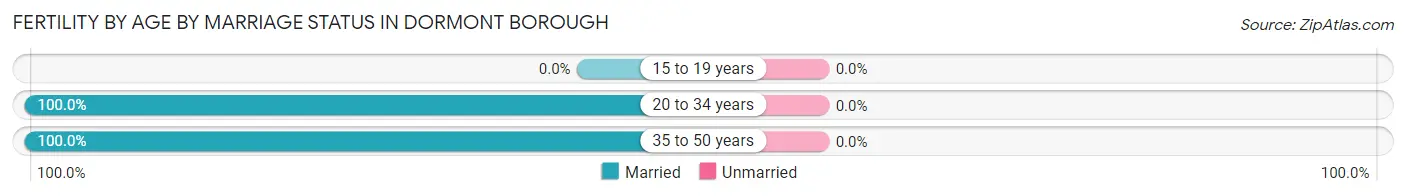
Fertility by Age by Marriage Status in Dormont borough
| Age Bracket | Married | Unmarried |
| 15 to 19 years | 0 (0.0%) | 0 (0.0%) |
| 20 to 34 years | 37 (100.0%) | 0 (0.0%) |
| 35 to 50 years | 38 (100.0%) | 0 (0.0%) |
| Total | 75 (100.0%) | 0 (0.0%) |
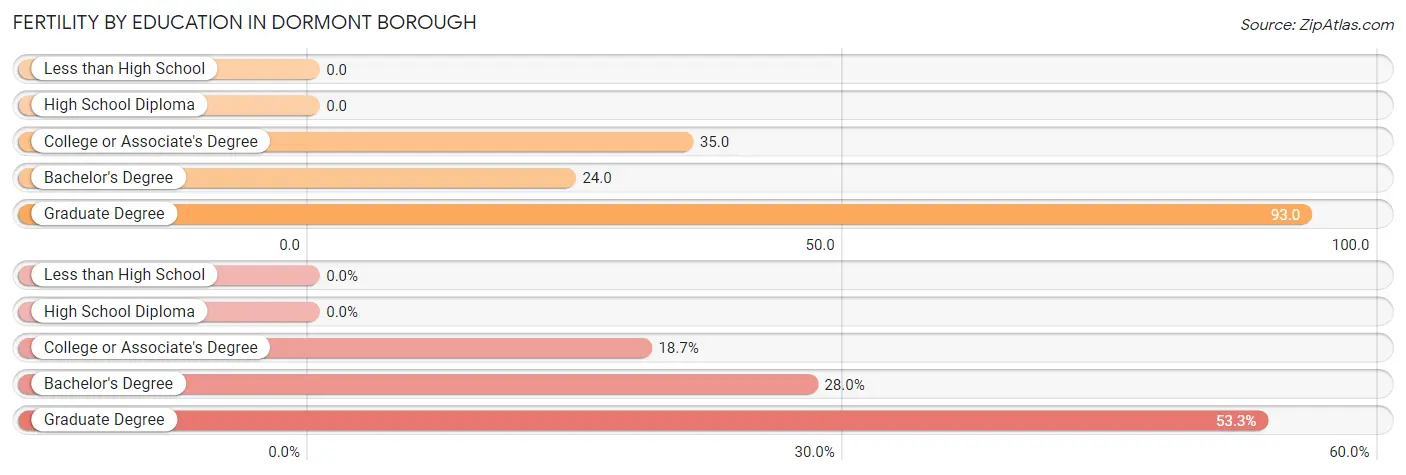
Fertility by Education in Dormont borough
| Educational Attainment | Women with Births | Births / 1,000 Women |
| Less than High School | 0 (0.0%) | 0.0 |
| High School Diploma | 0 (0.0%) | 0.0 |
| College or Associate's Degree | 14 (18.7%) | 35.0 |
| Bachelor's Degree | 21 (28.0%) | 24.0 |
| Graduate Degree | 40 (53.3%) | 93.0 |
| Total | 75 (100.0%) | 36.0 |
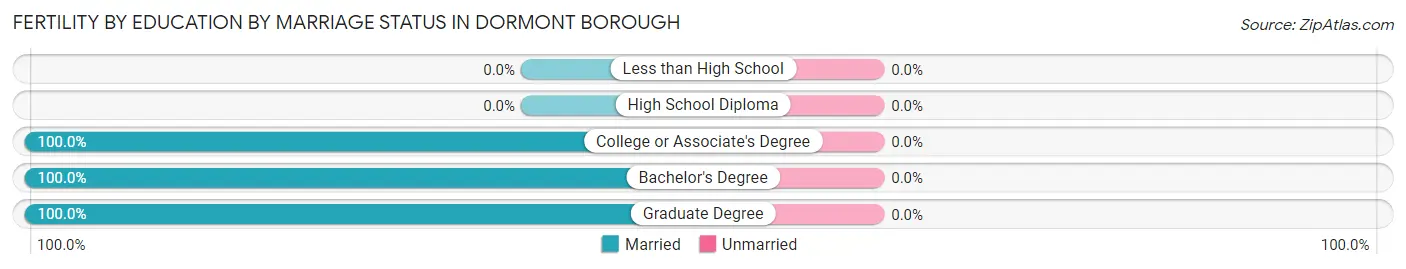
Fertility by Education by Marriage Status in Dormont borough
| Educational Attainment | Married | Unmarried |
| Less than High School | 0 (0.0%) | 0 (0.0%) |
| High School Diploma | 0 (0.0%) | 0 (0.0%) |
| College or Associate's Degree | 14 (100.0%) | 0 (0.0%) |
| Bachelor's Degree | 21 (100.0%) | 0 (0.0%) |
| Graduate Degree | 40 (100.0%) | 0 (0.0%) |
| Total | 75 (100.0%) | 0 (0.0%) |
Employment Characteristics in Dormont borough
Employment by Class of Employer in Dormont borough
Among the 5,203 employed individuals in Dormont borough, private company employees (3,624 | 69.7%), not-for-profit organizations (814 | 15.6%), and local government employees (198 | 3.8%) make up the most common classes of employment.
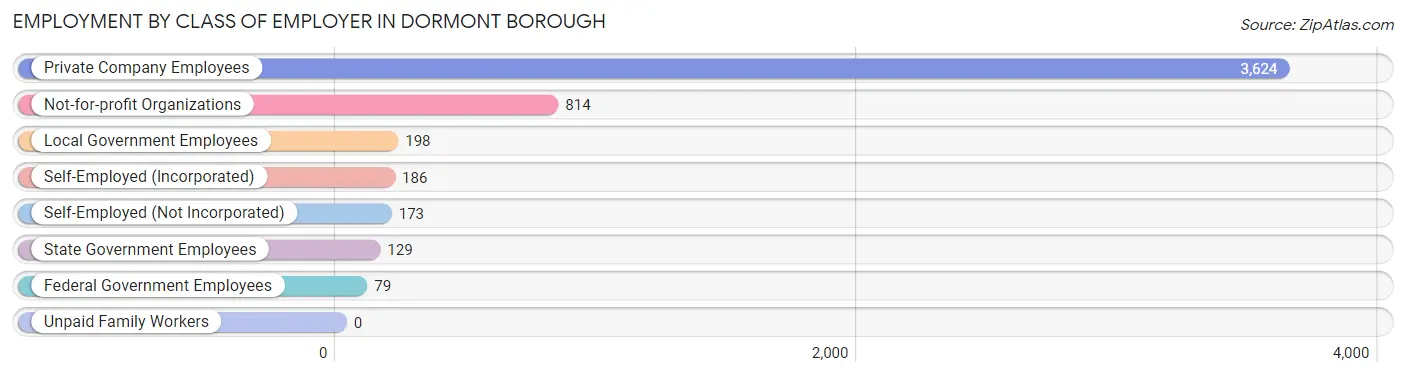
| Employer Class | # Employees | % Employees |
| Private Company Employees | 3,624 | 69.7% |
| Self-Employed (Incorporated) | 186 | 3.6% |
| Self-Employed (Not Incorporated) | 173 | 3.3% |
| Not-for-profit Organizations | 814 | 15.6% |
| Local Government Employees | 198 | 3.8% |
| State Government Employees | 129 | 2.5% |
| Federal Government Employees | 79 | 1.5% |
| Unpaid Family Workers | 0 | 0.0% |
| Total | 5,203 | 100.0% |
Employment Status by Age in Dormont borough
According to the labor force statistics for Dormont borough, out of the total population over 16 years of age (7,030), 79.5% or 5,589 individuals are in the labor force, with 5.3% or 296 of them unemployed. The age group with the highest labor force participation rate is 20 to 24 years, with 96.0% or 432 individuals in the labor force. Within the labor force, the 45 to 54 years age range has the highest percentage of unemployed individuals, with 13.8% or 108 of them being unemployed.
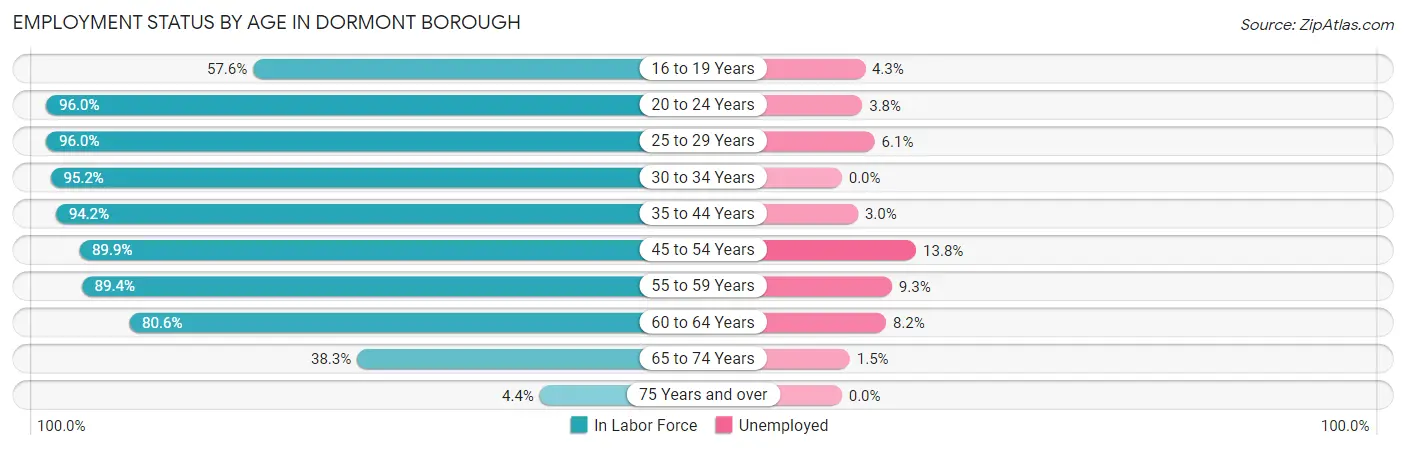
| Age Bracket | In Labor Force | Unemployed |
| 16 to 19 Years | 141 (57.6%) | 6 (4.3%) |
| 20 to 24 Years | 432 (96.0%) | 16 (3.8%) |
| 25 to 29 Years | 842 (96.0%) | 51 (6.1%) |
| 30 to 34 Years | 905 (95.2%) | 0 (0.0%) |
| 35 to 44 Years | 1,326 (94.2%) | 40 (3.0%) |
| 45 to 54 Years | 782 (89.9%) | 108 (13.8%) |
| 55 to 59 Years | 364 (89.4%) | 34 (9.3%) |
| 60 to 64 Years | 441 (80.6%) | 36 (8.2%) |
| 65 to 74 Years | 339 (38.3%) | 5 (1.5%) |
| 75 Years and over | 17 (4.4%) | 0 (0.0%) |
| Total | 5,589 (79.5%) | 296 (5.3%) |
Employment Status by Educational Attainment in Dormont borough
According to labor force statistics for Dormont borough, 92.1% of individuals (4,660) out of the total population between 25 and 64 years of age (5,060) are in the labor force, with 5.8% or 270 of them being unemployed. The group with the highest labor force participation rate are those with the educational attainment of bachelor's degree or higher, with 94.7% or 2,648 individuals in the labor force. Within the labor force, individuals with college / associate degree education have the highest percentage of unemployment, with 6.3% or 76 of them being unemployed.
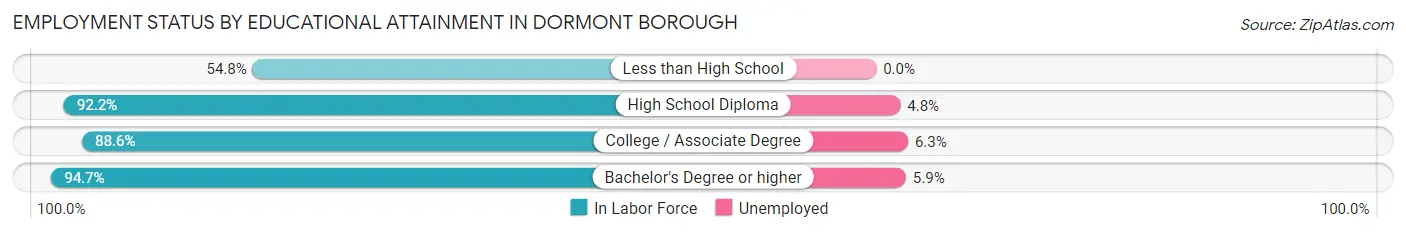
| Educational Attainment | In Labor Force | Unemployed |
| Less than High School | 40 (54.8%) | 0 (0.0%) |
| High School Diploma | 772 (92.2%) | 40 (4.8%) |
| College / Associate Degree | 1,200 (88.6%) | 85 (6.3%) |
| Bachelor's Degree or higher | 2,648 (94.7%) | 165 (5.9%) |
| Total | 4,660 (92.1%) | 293 (5.8%) |
Employment Occupations by Sex in Dormont borough
Management, Business, Science and Arts Occupations
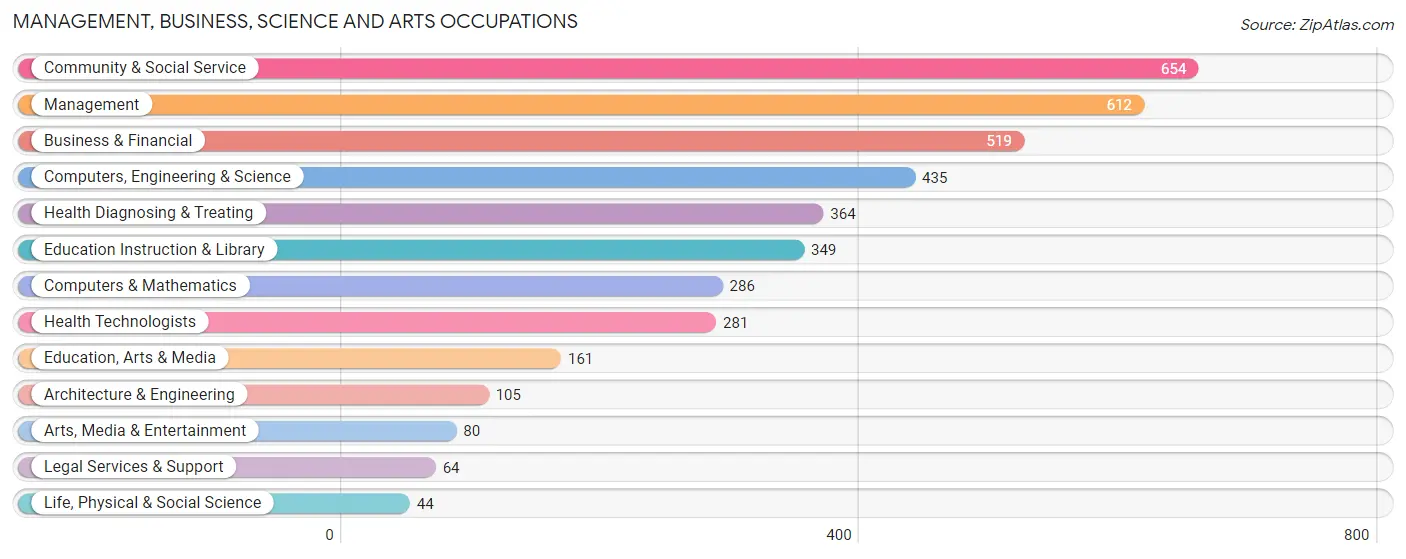
The most common Management, Business, Science and Arts occupations in Dormont borough are Community & Social Service (654 | 12.4%), Management (612 | 11.6%), Business & Financial (519 | 9.8%), Computers, Engineering & Science (435 | 8.2%), and Health Diagnosing & Treating (364 | 6.9%).
Management, Business, Science and Arts Occupations by Sex
Within the Management, Business, Science and Arts occupations in Dormont borough, the most male-oriented occupations are Architecture & Engineering (91.4%), Computers, Engineering & Science (68.3%), and Computers & Mathematics (66.1%), while the most female-oriented occupations are Education, Arts & Media (87.6%), Legal Services & Support (84.4%), and Health Diagnosing & Treating (79.4%).
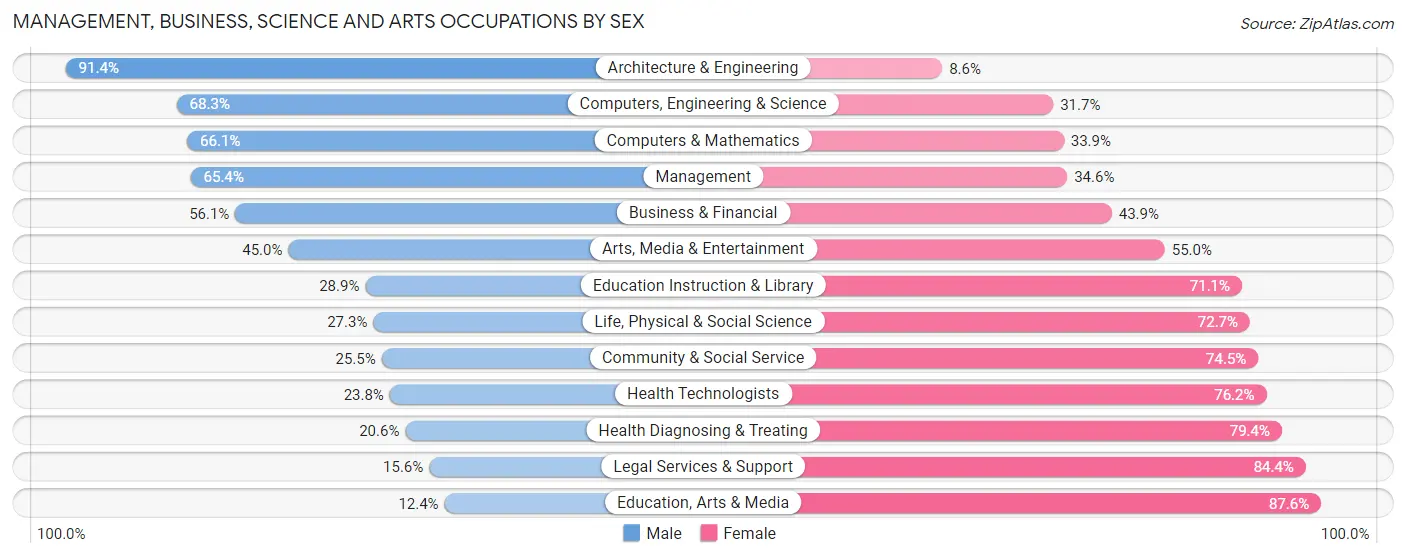
| Occupation | Male | Female |
| Management | 400 (65.4%) | 212 (34.6%) |
| Business & Financial | 291 (56.1%) | 228 (43.9%) |
| Computers, Engineering & Science | 297 (68.3%) | 138 (31.7%) |
| Computers & Mathematics | 189 (66.1%) | 97 (33.9%) |
| Architecture & Engineering | 96 (91.4%) | 9 (8.6%) |
| Life, Physical & Social Science | 12 (27.3%) | 32 (72.7%) |
| Community & Social Service | 167 (25.5%) | 487 (74.5%) |
| Education, Arts & Media | 20 (12.4%) | 141 (87.6%) |
| Legal Services & Support | 10 (15.6%) | 54 (84.4%) |
| Education Instruction & Library | 101 (28.9%) | 248 (71.1%) |
| Arts, Media & Entertainment | 36 (45.0%) | 44 (55.0%) |
| Health Diagnosing & Treating | 75 (20.6%) | 289 (79.4%) |
| Health Technologists | 67 (23.8%) | 214 (76.2%) |
| Total (Category) | 1,230 (47.6%) | 1,354 (52.4%) |
| Total (Overall) | 2,725 (51.6%) | 2,560 (48.4%) |
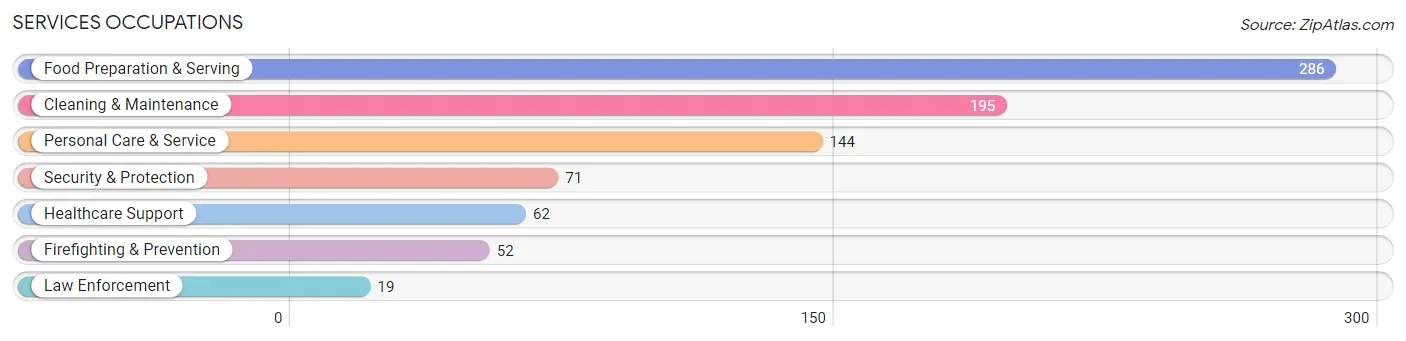
Services Occupations
The most common Services occupations in Dormont borough are Food Preparation & Serving (286 | 5.4%), Cleaning & Maintenance (195 | 3.7%), Personal Care & Service (144 | 2.7%), Security & Protection (71 | 1.3%), and Healthcare Support (62 | 1.2%).
Services Occupations by Sex
Within the Services occupations in Dormont borough, the most male-oriented occupations are Law Enforcement (100.0%), Security & Protection (70.4%), and Firefighting & Prevention (59.6%), while the most female-oriented occupations are Personal Care & Service (89.6%), Food Preparation & Serving (69.6%), and Healthcare Support (62.9%).
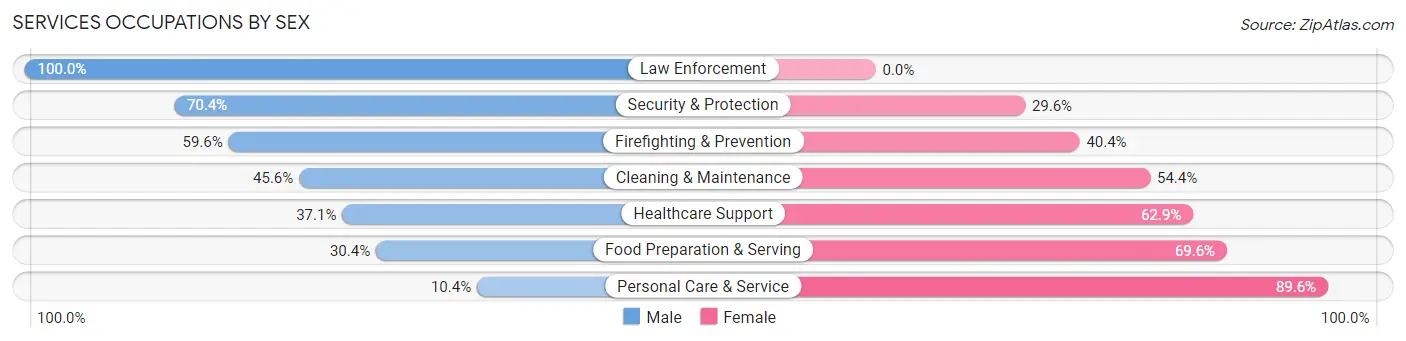
| Occupation | Male | Female |
| Healthcare Support | 23 (37.1%) | 39 (62.9%) |
| Security & Protection | 50 (70.4%) | 21 (29.6%) |
| Firefighting & Prevention | 31 (59.6%) | 21 (40.4%) |
| Law Enforcement | 19 (100.0%) | 0 (0.0%) |
| Food Preparation & Serving | 87 (30.4%) | 199 (69.6%) |
| Cleaning & Maintenance | 89 (45.6%) | 106 (54.4%) |
| Personal Care & Service | 15 (10.4%) | 129 (89.6%) |
| Total (Category) | 264 (34.8%) | 494 (65.2%) |
| Total (Overall) | 2,725 (51.6%) | 2,560 (48.4%) |
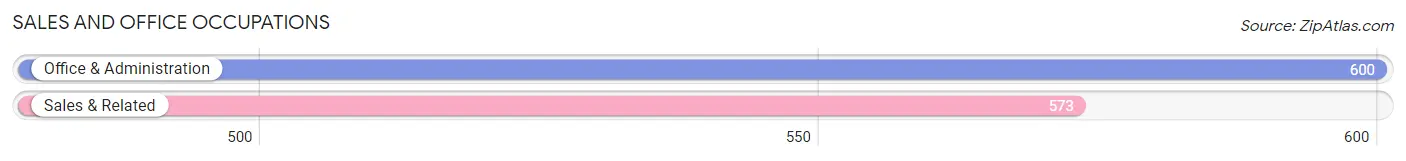
Sales and Office Occupations
The most common Sales and Office occupations in Dormont borough are Office & Administration (600 | 11.4%), and Sales & Related (573 | 10.8%).
Sales and Office Occupations by Sex
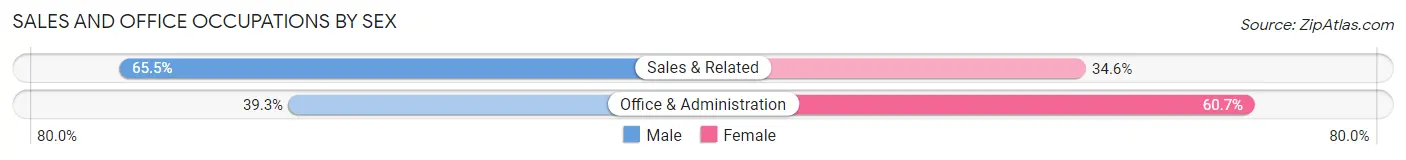
| Occupation | Male | Female |
| Sales & Related | 375 (65.4%) | 198 (34.5%) |
| Office & Administration | 236 (39.3%) | 364 (60.7%) |
| Total (Category) | 611 (52.1%) | 562 (47.9%) |
| Total (Overall) | 2,725 (51.6%) | 2,560 (48.4%) |
Natural Resources, Construction and Maintenance Occupations
The most common Natural Resources, Construction and Maintenance occupations in Dormont borough are Construction & Extraction (295 | 5.6%), and Installation, Maintenance & Repair (64 | 1.2%).

Natural Resources, Construction and Maintenance Occupations by Sex
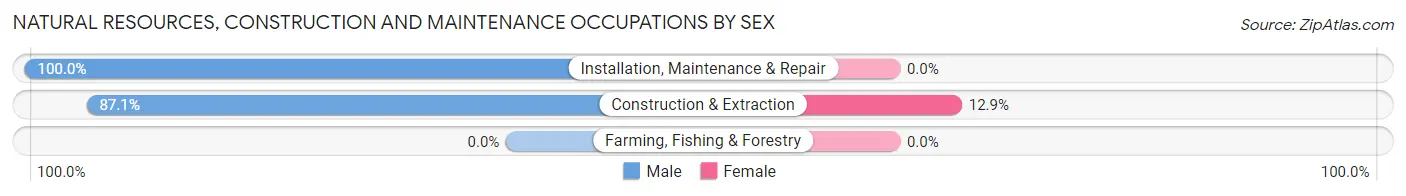
| Occupation | Male | Female |
| Farming, Fishing & Forestry | 0 (0.0%) | 0 (0.0%) |
| Construction & Extraction | 257 (87.1%) | 38 (12.9%) |
| Installation, Maintenance & Repair | 64 (100.0%) | 0 (0.0%) |
| Total (Category) | 321 (89.4%) | 38 (10.6%) |
| Total (Overall) | 2,725 (51.6%) | 2,560 (48.4%) |
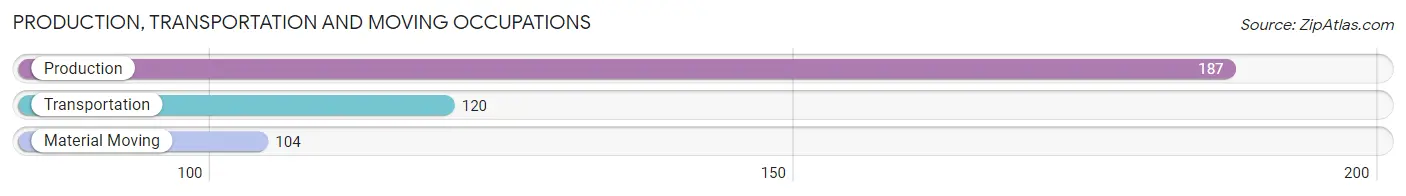
Production, Transportation and Moving Occupations
The most common Production, Transportation and Moving occupations in Dormont borough are Production (187 | 3.5%), Transportation (120 | 2.3%), and Material Moving (104 | 2.0%).
Production, Transportation and Moving Occupations by Sex
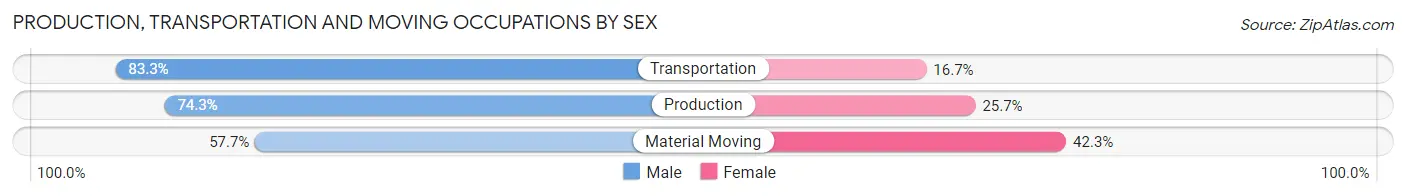
| Occupation | Male | Female |
| Production | 139 (74.3%) | 48 (25.7%) |
| Transportation | 100 (83.3%) | 20 (16.7%) |
| Material Moving | 60 (57.7%) | 44 (42.3%) |
| Total (Category) | 299 (72.8%) | 112 (27.3%) |
| Total (Overall) | 2,725 (51.6%) | 2,560 (48.4%) |
Employment Industries by Sex in Dormont borough
Employment Industries in Dormont borough
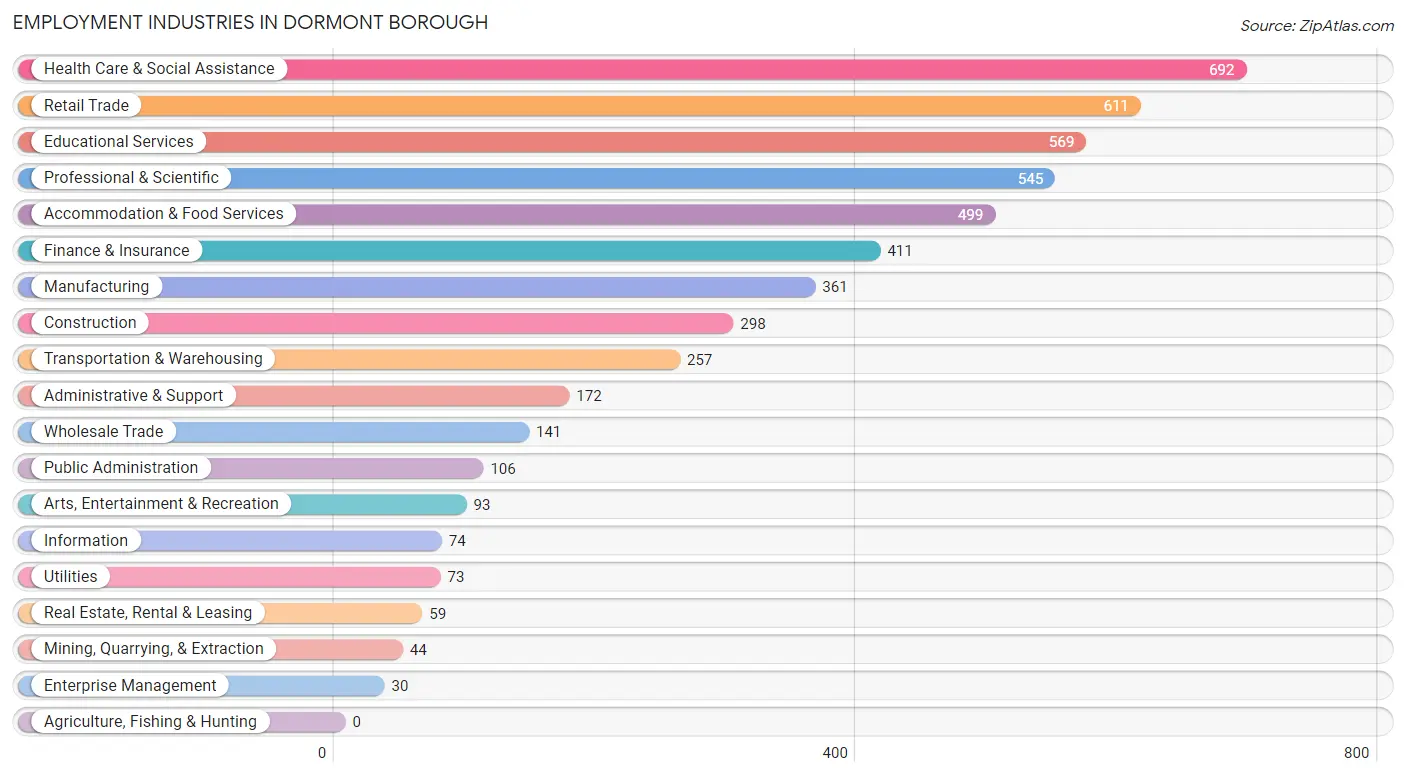
The major employment industries in Dormont borough include Health Care & Social Assistance (692 | 13.1%), Retail Trade (611 | 11.6%), Educational Services (569 | 10.8%), Professional & Scientific (545 | 10.3%), and Accommodation & Food Services (499 | 9.4%).
Employment Industries by Sex in Dormont borough
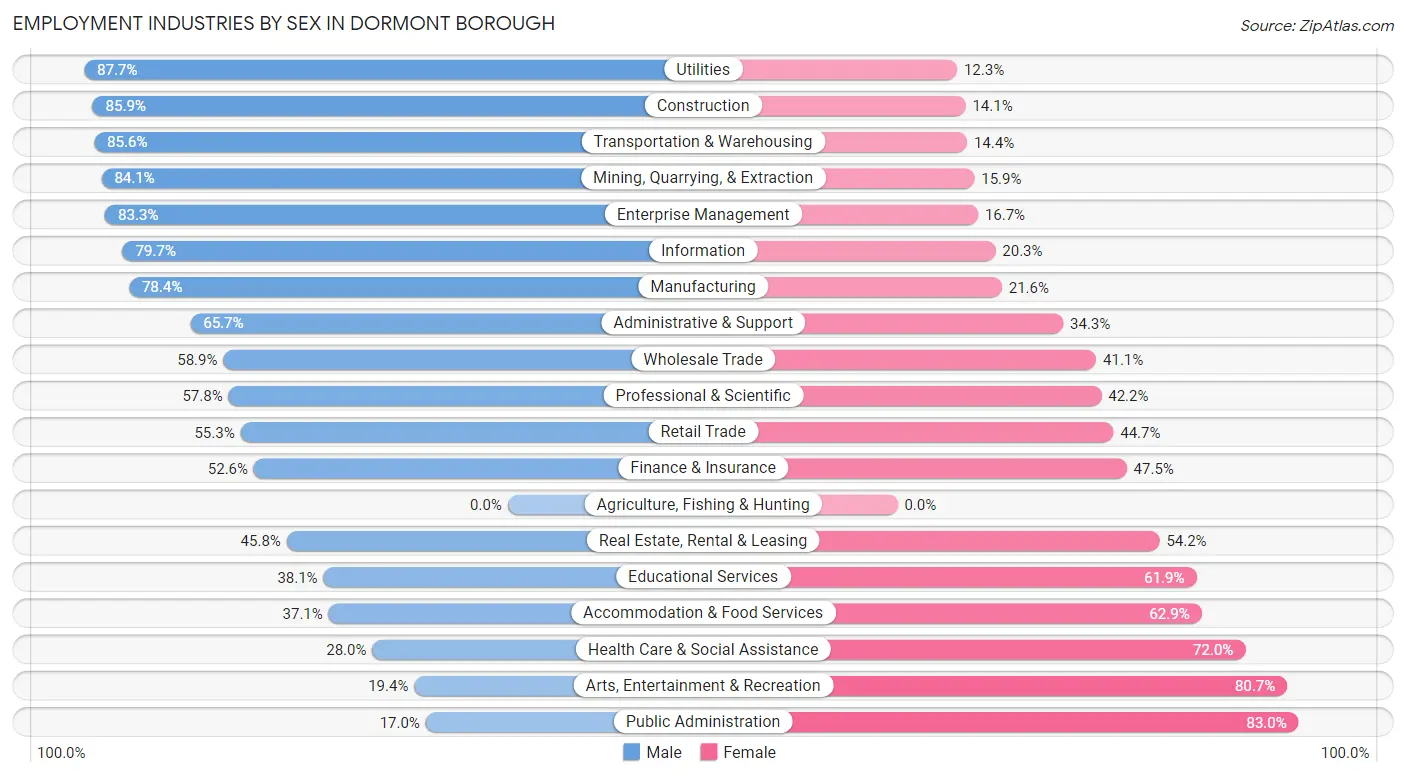
The Dormont borough industries that see more men than women are Utilities (87.7%), Construction (85.9%), and Transportation & Warehousing (85.6%), whereas the industries that tend to have a higher number of women are Public Administration (83.0%), Arts, Entertainment & Recreation (80.6%), and Health Care & Social Assistance (72.0%).
| Industry | Male | Female |
| Agriculture, Fishing & Hunting | 0 (0.0%) | 0 (0.0%) |
| Mining, Quarrying, & Extraction | 37 (84.1%) | 7 (15.9%) |
| Construction | 256 (85.9%) | 42 (14.1%) |
| Manufacturing | 283 (78.4%) | 78 (21.6%) |
| Wholesale Trade | 83 (58.9%) | 58 (41.1%) |
| Retail Trade | 338 (55.3%) | 273 (44.7%) |
| Transportation & Warehousing | 220 (85.6%) | 37 (14.4%) |
| Utilities | 64 (87.7%) | 9 (12.3%) |
| Information | 59 (79.7%) | 15 (20.3%) |
| Finance & Insurance | 216 (52.5%) | 195 (47.4%) |
| Real Estate, Rental & Leasing | 27 (45.8%) | 32 (54.2%) |
| Professional & Scientific | 315 (57.8%) | 230 (42.2%) |
| Enterprise Management | 25 (83.3%) | 5 (16.7%) |
| Administrative & Support | 113 (65.7%) | 59 (34.3%) |
| Educational Services | 217 (38.1%) | 352 (61.9%) |
| Health Care & Social Assistance | 194 (28.0%) | 498 (72.0%) |
| Arts, Entertainment & Recreation | 18 (19.4%) | 75 (80.6%) |
| Accommodation & Food Services | 185 (37.1%) | 314 (62.9%) |
| Public Administration | 18 (17.0%) | 88 (83.0%) |
| Total | 2,725 (51.6%) | 2,560 (48.4%) |
Education in Dormont borough
School Enrollment in Dormont borough
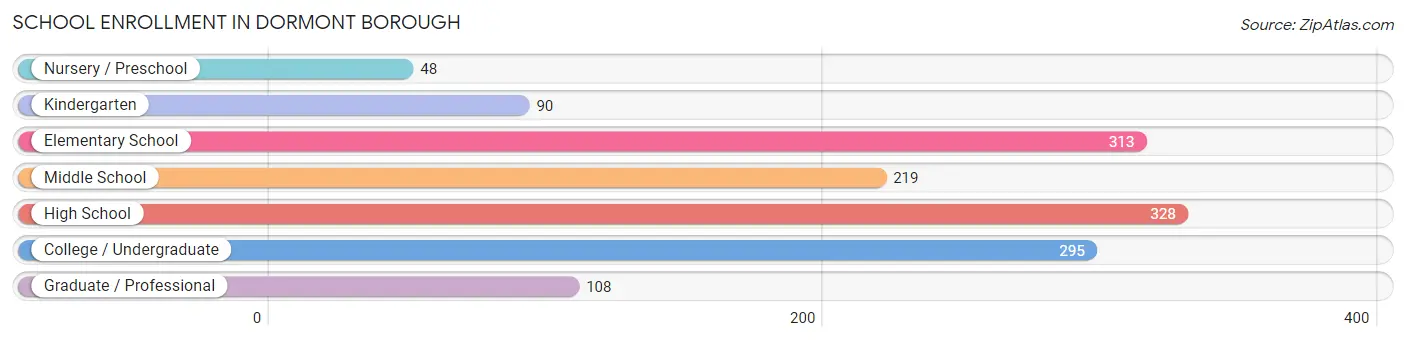
The most common levels of schooling among the 1,401 students in Dormont borough are high school (328 | 23.4%), elementary school (313 | 22.3%), and college / undergraduate (295 | 21.1%).
| School Level | # Students | % Students |
| Nursery / Preschool | 48 | 3.4% |
| Kindergarten | 90 | 6.4% |
| Elementary School | 313 | 22.3% |
| Middle School | 219 | 15.6% |
| High School | 328 | 23.4% |
| College / Undergraduate | 295 | 21.1% |
| Graduate / Professional | 108 | 7.7% |
| Total | 1,401 | 100.0% |
School Enrollment by Age by Funding Source in Dormont borough
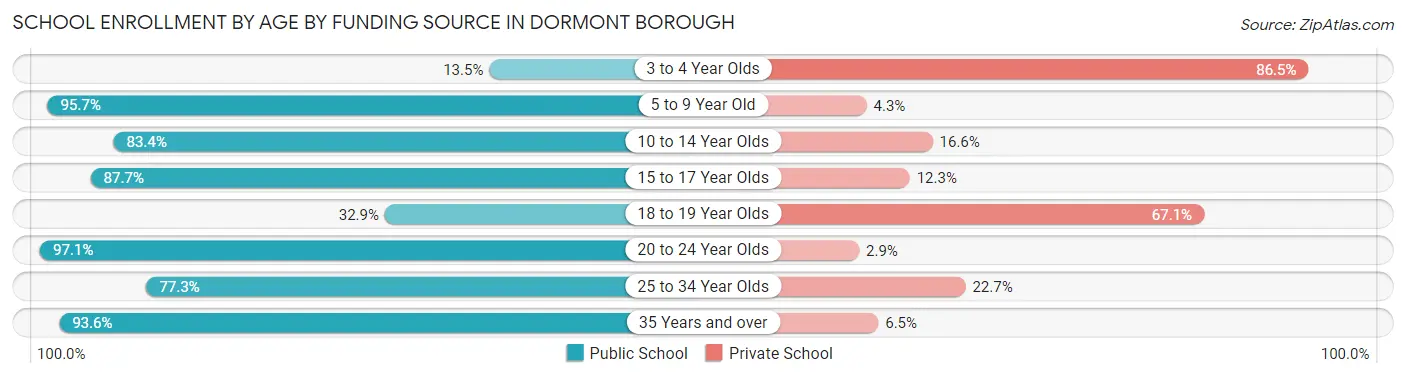
Out of a total of 1,401 students who are enrolled in schools in Dormont borough, 235 (16.8%) attend a private institution, while the remaining 1,166 (83.2%) are enrolled in public schools. The age group of 3 to 4 year olds has the highest likelihood of being enrolled in private schools, with 45 (86.5% in the age bracket) enrolled. Conversely, the age group of 20 to 24 year olds has the lowest likelihood of being enrolled in a private school, with 101 (97.1% in the age bracket) attending a public institution.
| Age Bracket | Public School | Private School |
| 3 to 4 Year Olds | 7 (13.5%) | 45 (86.5%) |
| 5 to 9 Year Old | 336 (95.7%) | 15 (4.3%) |
| 10 to 14 Year Olds | 267 (83.4%) | 53 (16.6%) |
| 15 to 17 Year Olds | 221 (87.7%) | 31 (12.3%) |
| 18 to 19 Year Olds | 26 (32.9%) | 53 (67.1%) |
| 20 to 24 Year Olds | 101 (97.1%) | 3 (2.9%) |
| 25 to 34 Year Olds | 92 (77.3%) | 27 (22.7%) |
| 35 Years and over | 116 (93.5%) | 8 (6.5%) |
| Total | 1,166 (83.2%) | 235 (16.8%) |
Educational Attainment by Field of Study in Dormont borough
Business (677 | 19.5%), visual & performing arts (347 | 10.0%), science & technology (323 | 9.3%), education (315 | 9.0%), and social sciences (292 | 8.4%) are the most common fields of study among 3,481 individuals in Dormont borough who have obtained a bachelor's degree or higher.
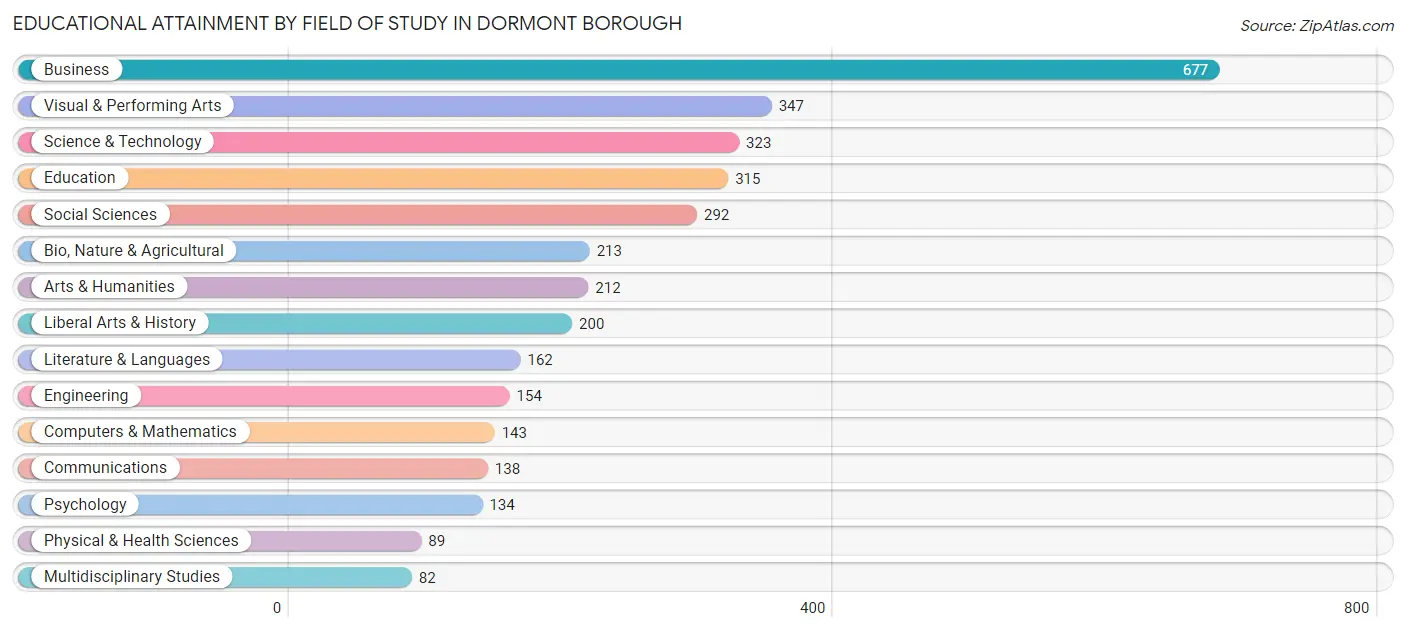
| Field of Study | # Graduates | % Graduates |
| Computers & Mathematics | 143 | 4.1% |
| Bio, Nature & Agricultural | 213 | 6.1% |
| Physical & Health Sciences | 89 | 2.6% |
| Psychology | 134 | 3.8% |
| Social Sciences | 292 | 8.4% |
| Engineering | 154 | 4.4% |
| Multidisciplinary Studies | 82 | 2.4% |
| Science & Technology | 323 | 9.3% |
| Business | 677 | 19.5% |
| Education | 315 | 9.0% |
| Literature & Languages | 162 | 4.6% |
| Liberal Arts & History | 200 | 5.8% |
| Visual & Performing Arts | 347 | 10.0% |
| Communications | 138 | 4.0% |
| Arts & Humanities | 212 | 6.1% |
| Total | 3,481 | 100.0% |
Transportation & Commute in Dormont borough
Vehicle Availability by Sex in Dormont borough
The most prevalent vehicle ownership categories in Dormont borough are males with 2 vehicles (1,305, accounting for 48.4%) and females with 2 vehicles (1,223, making up 52.1%).
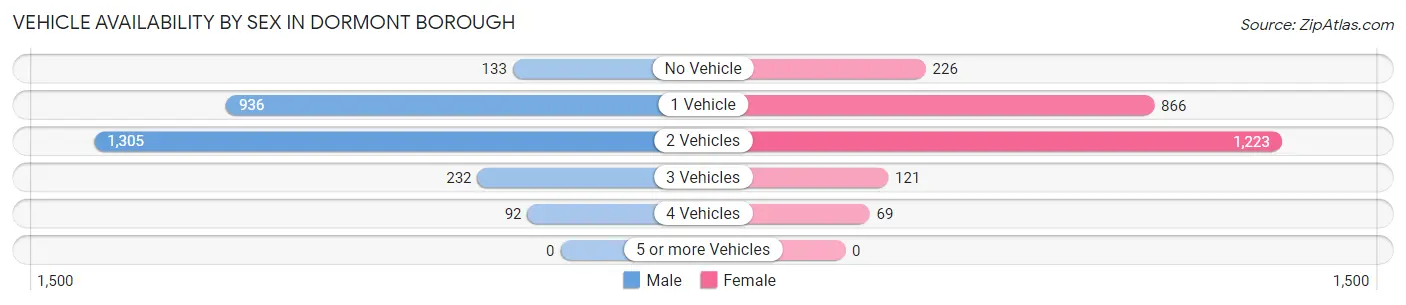
| Vehicles Available | Male | Female |
| No Vehicle | 133 (4.9%) | 226 (9.0%) |
| 1 Vehicle | 936 (34.7%) | 866 (34.6%) |
| 2 Vehicles | 1,305 (48.4%) | 1,223 (48.8%) |
| 3 Vehicles | 232 (8.6%) | 121 (4.8%) |
| 4 Vehicles | 92 (3.4%) | 69 (2.8%) |
| 5 or more Vehicles | 0 (0.0%) | 0 (0.0%) |
| Total | 2,698 (100.0%) | 2,505 (100.0%) |
Commute Time in Dormont borough
The most frequently occuring commute durations in Dormont borough are 30 to 34 minutes (893 commuters, 21.6%), 20 to 24 minutes (821 commuters, 19.9%), and 15 to 19 minutes (644 commuters, 15.6%).
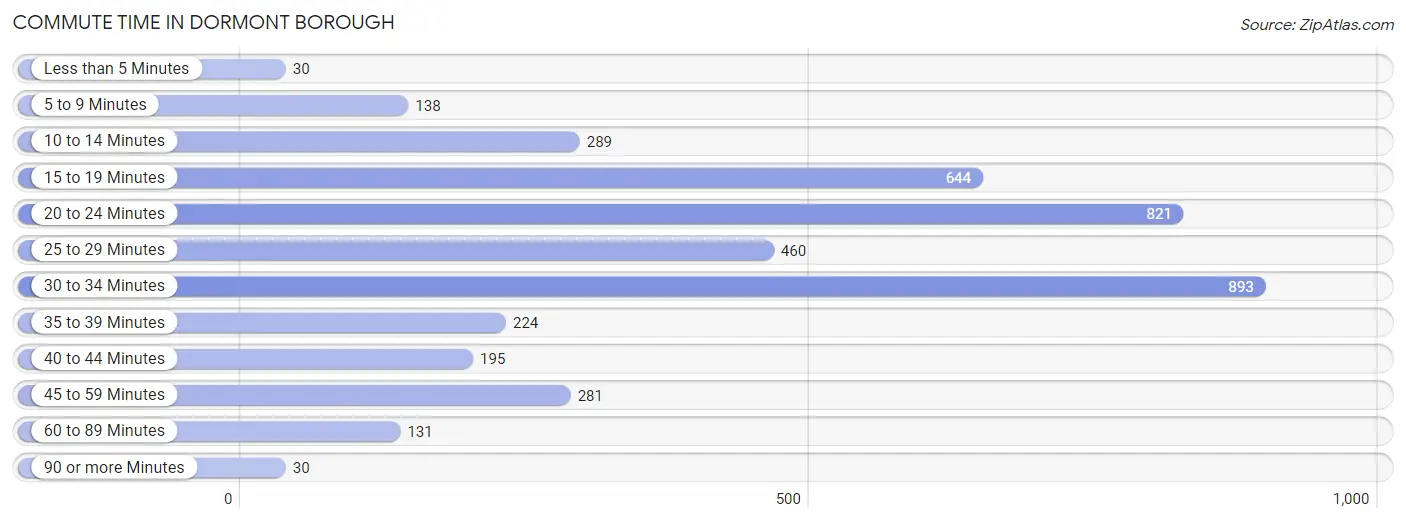
| Commute Time | # Commuters | % Commuters |
| Less than 5 Minutes | 30 | 0.7% |
| 5 to 9 Minutes | 138 | 3.3% |
| 10 to 14 Minutes | 289 | 7.0% |
| 15 to 19 Minutes | 644 | 15.6% |
| 20 to 24 Minutes | 821 | 19.9% |
| 25 to 29 Minutes | 460 | 11.1% |
| 30 to 34 Minutes | 893 | 21.6% |
| 35 to 39 Minutes | 224 | 5.4% |
| 40 to 44 Minutes | 195 | 4.7% |
| 45 to 59 Minutes | 281 | 6.8% |
| 60 to 89 Minutes | 131 | 3.2% |
| 90 or more Minutes | 30 | 0.7% |
Commute Time by Sex in Dormont borough
The most common commute times in Dormont borough are 20 to 24 minutes (509 commuters, 23.1%) for males and 30 to 34 minutes (393 commuters, 20.3%) for females.
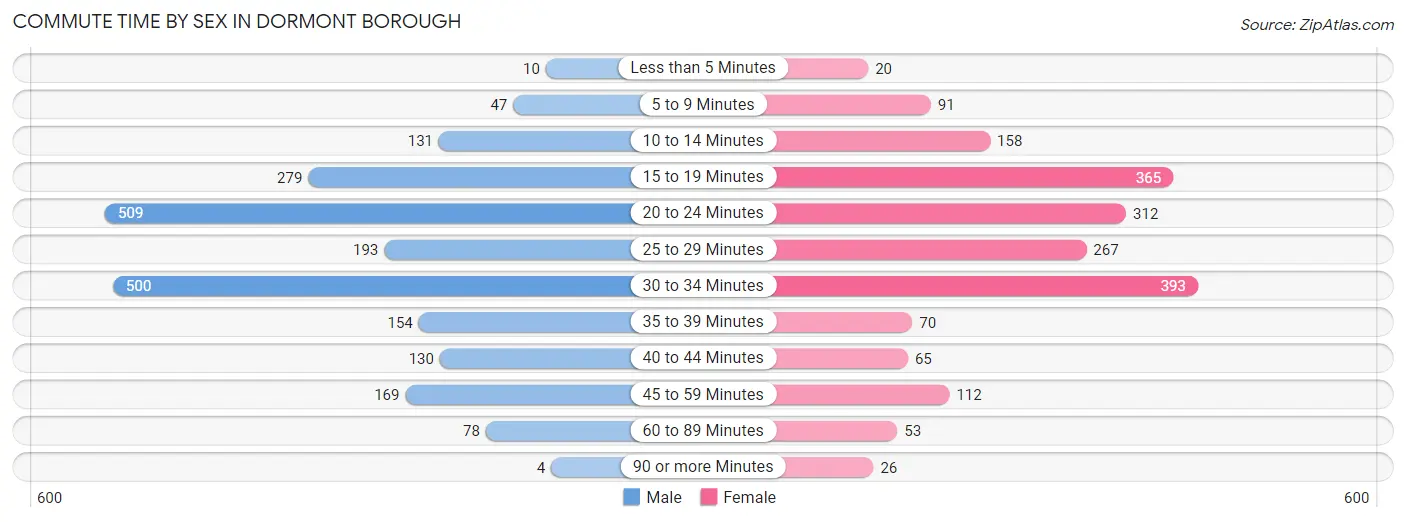
| Commute Time | Male | Female |
| Less than 5 Minutes | 10 (0.4%) | 20 (1.0%) |
| 5 to 9 Minutes | 47 (2.1%) | 91 (4.7%) |
| 10 to 14 Minutes | 131 (5.9%) | 158 (8.2%) |
| 15 to 19 Minutes | 279 (12.7%) | 365 (18.9%) |
| 20 to 24 Minutes | 509 (23.1%) | 312 (16.2%) |
| 25 to 29 Minutes | 193 (8.8%) | 267 (13.8%) |
| 30 to 34 Minutes | 500 (22.7%) | 393 (20.3%) |
| 35 to 39 Minutes | 154 (7.0%) | 70 (3.6%) |
| 40 to 44 Minutes | 130 (5.9%) | 65 (3.4%) |
| 45 to 59 Minutes | 169 (7.7%) | 112 (5.8%) |
| 60 to 89 Minutes | 78 (3.5%) | 53 (2.7%) |
| 90 or more Minutes | 4 (0.2%) | 26 (1.3%) |
Time of Departure to Work by Sex in Dormont borough
The most frequent times of departure to work in Dormont borough are 7:00 AM to 7:29 AM (361, 16.4%) for males and 8:00 AM to 8:29 AM (307, 15.9%) for females.
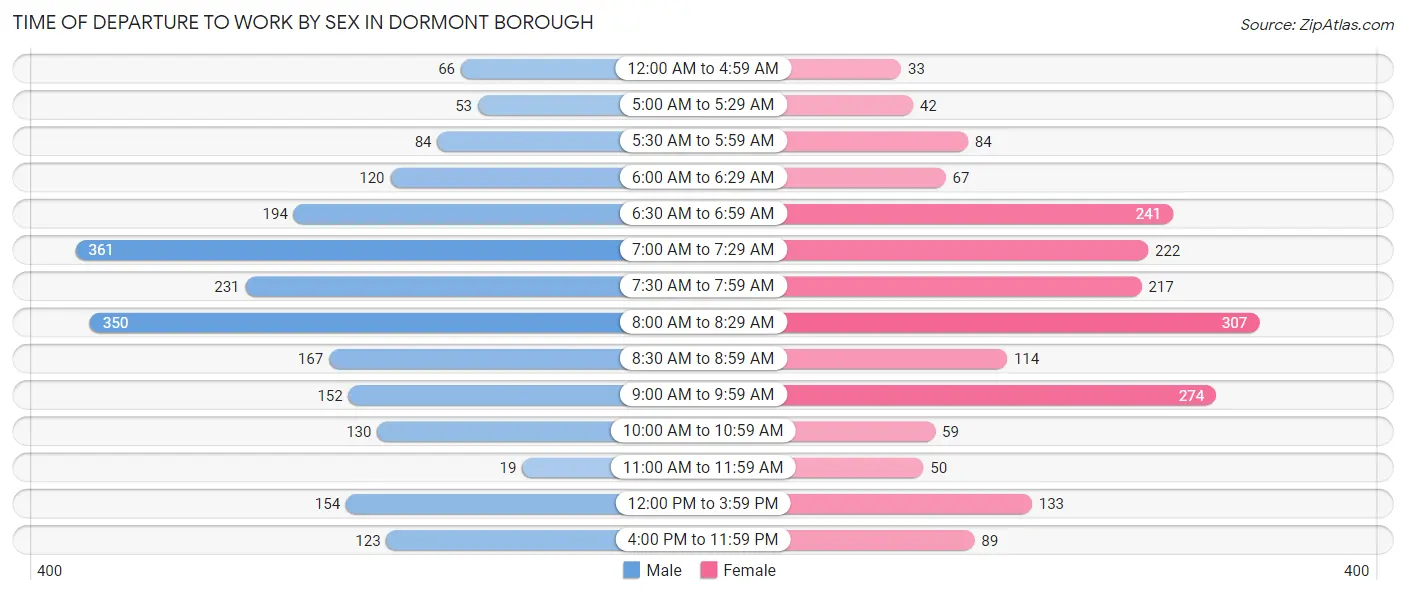
| Time of Departure | Male | Female |
| 12:00 AM to 4:59 AM | 66 (3.0%) | 33 (1.7%) |
| 5:00 AM to 5:29 AM | 53 (2.4%) | 42 (2.2%) |
| 5:30 AM to 5:59 AM | 84 (3.8%) | 84 (4.3%) |
| 6:00 AM to 6:29 AM | 120 (5.4%) | 67 (3.5%) |
| 6:30 AM to 6:59 AM | 194 (8.8%) | 241 (12.5%) |
| 7:00 AM to 7:29 AM | 361 (16.4%) | 222 (11.5%) |
| 7:30 AM to 7:59 AM | 231 (10.5%) | 217 (11.2%) |
| 8:00 AM to 8:29 AM | 350 (15.9%) | 307 (15.9%) |
| 8:30 AM to 8:59 AM | 167 (7.6%) | 114 (5.9%) |
| 9:00 AM to 9:59 AM | 152 (6.9%) | 274 (14.2%) |
| 10:00 AM to 10:59 AM | 130 (5.9%) | 59 (3.0%) |
| 11:00 AM to 11:59 AM | 19 (0.9%) | 50 (2.6%) |
| 12:00 PM to 3:59 PM | 154 (7.0%) | 133 (6.9%) |
| 4:00 PM to 11:59 PM | 123 (5.6%) | 89 (4.6%) |
| Total | 2,204 (100.0%) | 1,932 (100.0%) |
Housing Occupancy in Dormont borough
Occupancy by Ownership in Dormont borough
Of the total 4,157 dwellings in Dormont borough, owner-occupied units account for 2,401 (57.8%), while renter-occupied units make up 1,756 (42.2%).
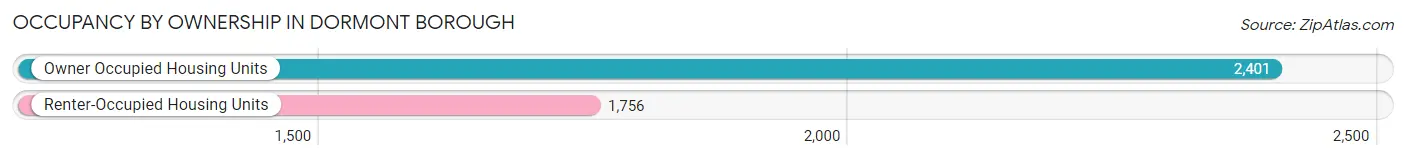
| Occupancy | # Housing Units | % Housing Units |
| Owner Occupied Housing Units | 2,401 | 57.8% |
| Renter-Occupied Housing Units | 1,756 | 42.2% |
| Total Occupied Housing Units | 4,157 | 100.0% |
Occupancy by Household Size in Dormont borough
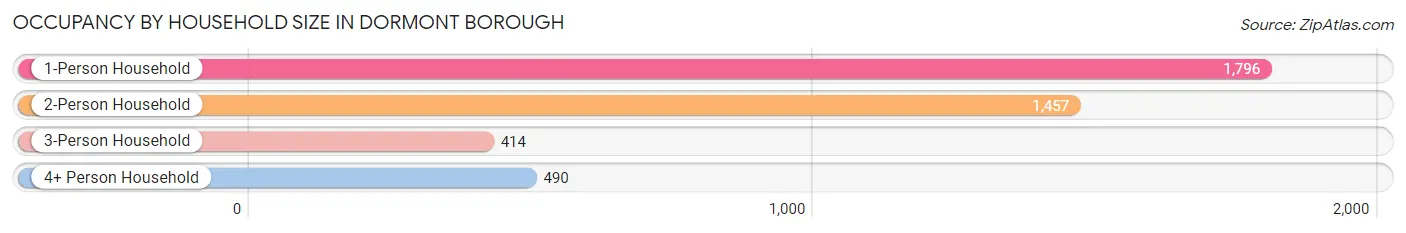
| Household Size | # Housing Units | % Housing Units |
| 1-Person Household | 1,796 | 43.2% |
| 2-Person Household | 1,457 | 35.0% |
| 3-Person Household | 414 | 10.0% |
| 4+ Person Household | 490 | 11.8% |
| Total Housing Units | 4,157 | 100.0% |
Occupancy by Ownership by Household Size in Dormont borough
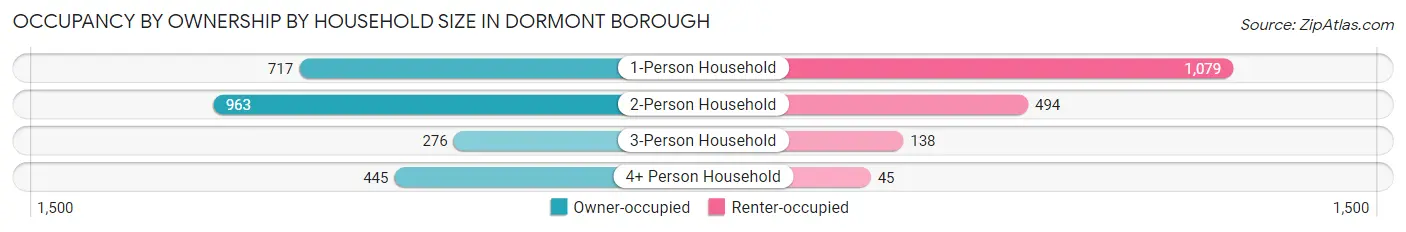
| Household Size | Owner-occupied | Renter-occupied |
| 1-Person Household | 717 (39.9%) | 1,079 (60.1%) |
| 2-Person Household | 963 (66.1%) | 494 (33.9%) |
| 3-Person Household | 276 (66.7%) | 138 (33.3%) |
| 4+ Person Household | 445 (90.8%) | 45 (9.2%) |
| Total Housing Units | 2,401 (57.8%) | 1,756 (42.2%) |
Occupancy by Educational Attainment in Dormont borough
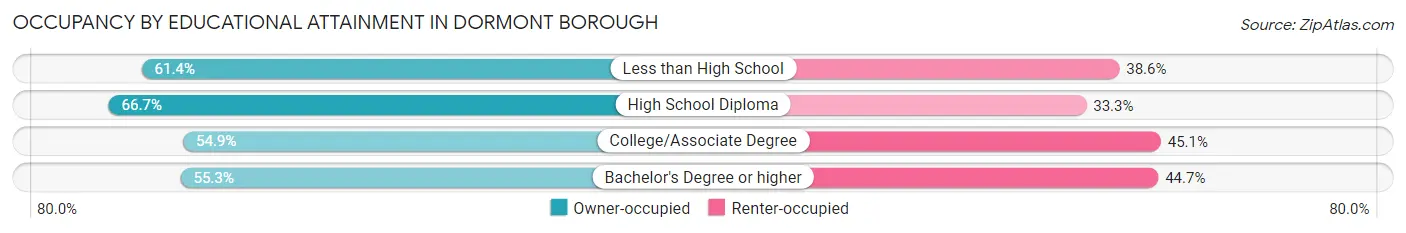
| Household Size | Owner-occupied | Renter-occupied |
| Less than High School | 94 (61.4%) | 59 (38.6%) |
| High School Diploma | 576 (66.7%) | 288 (33.3%) |
| College/Associate Degree | 576 (54.9%) | 474 (45.1%) |
| Bachelor's Degree or higher | 1,155 (55.3%) | 935 (44.7%) |
Occupancy by Age of Householder in Dormont borough
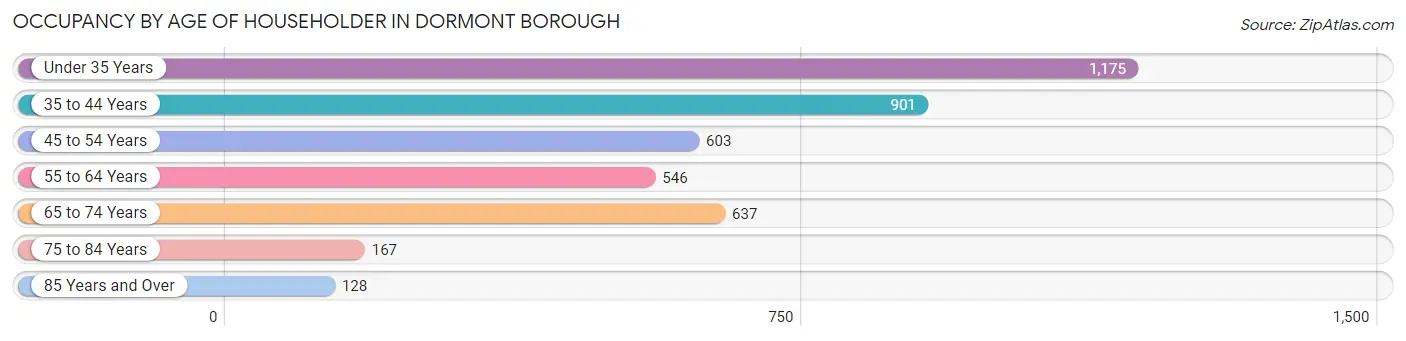
| Age Bracket | # Households | % Households |
| Under 35 Years | 1,175 | 28.3% |
| 35 to 44 Years | 901 | 21.7% |
| 45 to 54 Years | 603 | 14.5% |
| 55 to 64 Years | 546 | 13.1% |
| 65 to 74 Years | 637 | 15.3% |
| 75 to 84 Years | 167 | 4.0% |
| 85 Years and Over | 128 | 3.1% |
| Total | 4,157 | 100.0% |
Housing Finances in Dormont borough
Median Income by Occupancy in Dormont borough
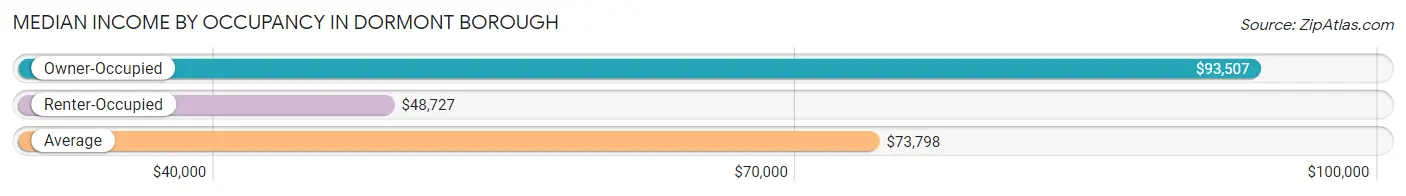
| Occupancy Type | # Households | Median Income |
| Owner-Occupied | 2,401 (57.8%) | $93,507 |
| Renter-Occupied | 1,756 (42.2%) | $48,727 |
| Average | 4,157 (100.0%) | $73,798 |
Occupancy by Householder Income Bracket in Dormont borough
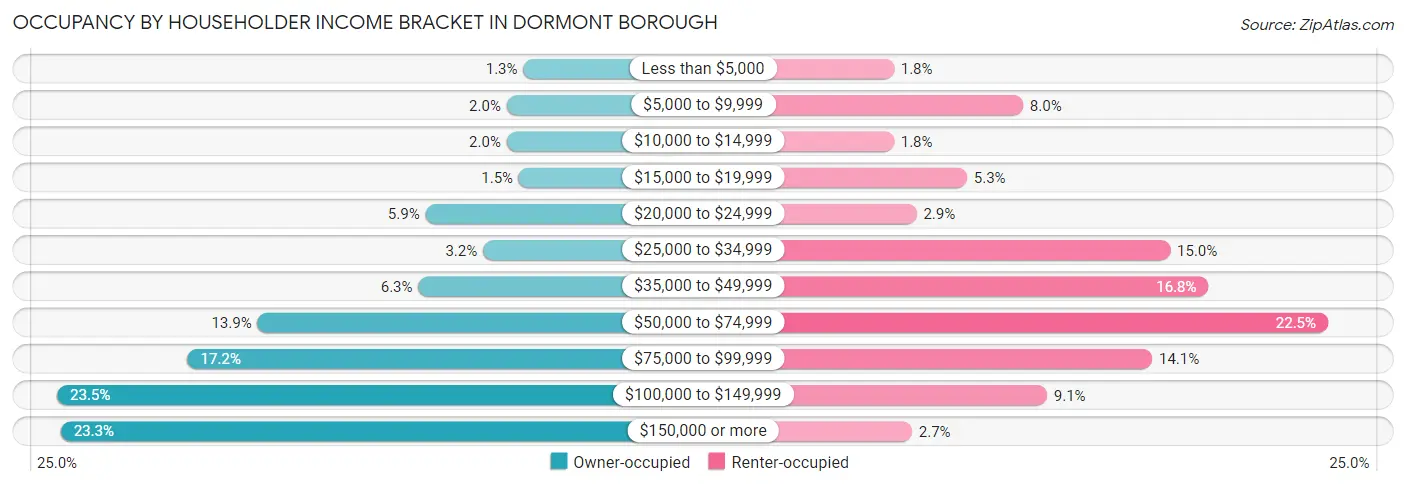
| Income Bracket | Owner-occupied | Renter-occupied |
| Less than $5,000 | 30 (1.3%) | 32 (1.8%) |
| $5,000 to $9,999 | 49 (2.0%) | 140 (8.0%) |
| $10,000 to $14,999 | 49 (2.0%) | 32 (1.8%) |
| $15,000 to $19,999 | 35 (1.5%) | 93 (5.3%) |
| $20,000 to $24,999 | 142 (5.9%) | 51 (2.9%) |
| $25,000 to $34,999 | 76 (3.2%) | 263 (15.0%) |
| $35,000 to $49,999 | 150 (6.2%) | 295 (16.8%) |
| $50,000 to $74,999 | 334 (13.9%) | 395 (22.5%) |
| $75,000 to $99,999 | 414 (17.2%) | 248 (14.1%) |
| $100,000 to $149,999 | 563 (23.4%) | 160 (9.1%) |
| $150,000 or more | 559 (23.3%) | 47 (2.7%) |
| Total | 2,401 (100.0%) | 1,756 (100.0%) |
Monthly Housing Cost Tiers in Dormont borough
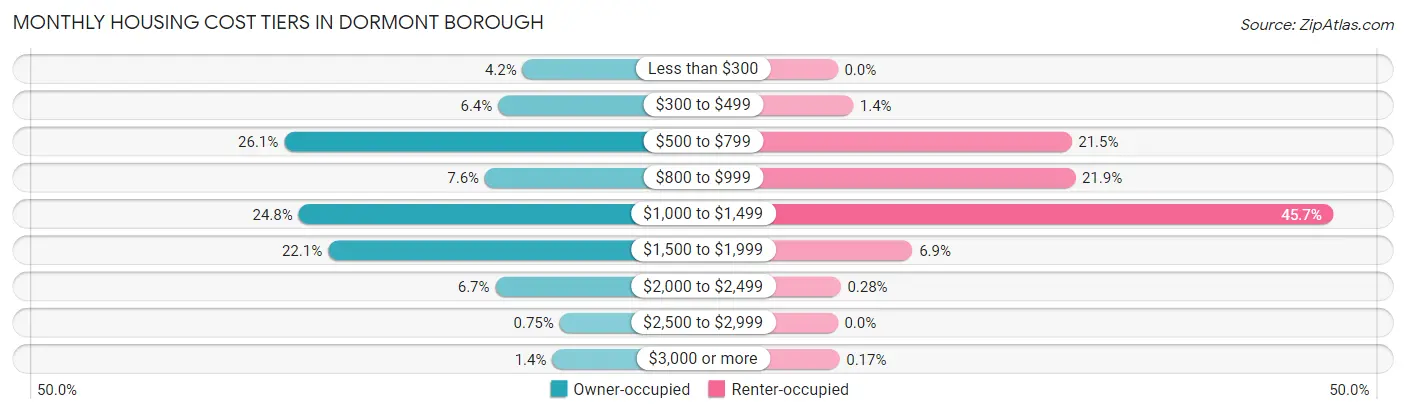
| Monthly Cost | Owner-occupied | Renter-occupied |
| Less than $300 | 100 (4.2%) | 0 (0.0%) |
| $300 to $499 | 154 (6.4%) | 25 (1.4%) |
| $500 to $799 | 627 (26.1%) | 378 (21.5%) |
| $800 to $999 | 183 (7.6%) | 384 (21.9%) |
| $1,000 to $1,499 | 595 (24.8%) | 802 (45.7%) |
| $1,500 to $1,999 | 530 (22.1%) | 121 (6.9%) |
| $2,000 to $2,499 | 160 (6.7%) | 5 (0.3%) |
| $2,500 to $2,999 | 18 (0.7%) | 0 (0.0%) |
| $3,000 or more | 34 (1.4%) | 3 (0.2%) |
| Total | 2,401 (100.0%) | 1,756 (100.0%) |
Physical Housing Characteristics in Dormont borough
Housing Structures in Dormont borough
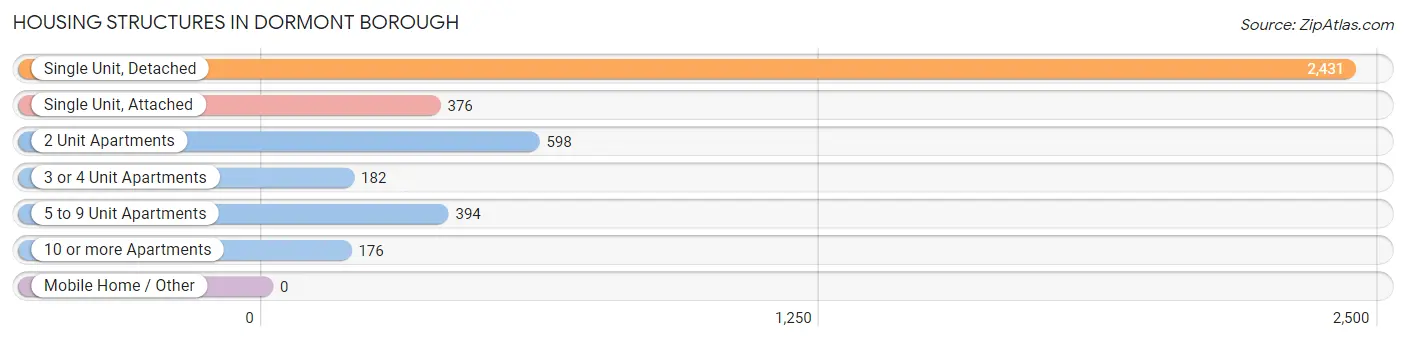
| Structure Type | # Housing Units | % Housing Units |
| Single Unit, Detached | 2,431 | 58.5% |
| Single Unit, Attached | 376 | 9.0% |
| 2 Unit Apartments | 598 | 14.4% |
| 3 or 4 Unit Apartments | 182 | 4.4% |
| 5 to 9 Unit Apartments | 394 | 9.5% |
| 10 or more Apartments | 176 | 4.2% |
| Mobile Home / Other | 0 | 0.0% |
| Total | 4,157 | 100.0% |
Housing Structures by Occupancy in Dormont borough
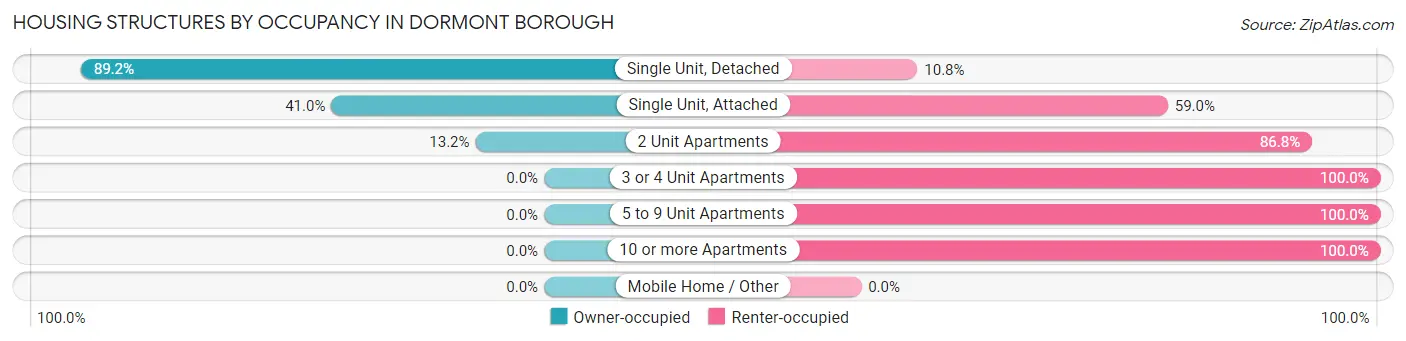
| Structure Type | Owner-occupied | Renter-occupied |
| Single Unit, Detached | 2,168 (89.2%) | 263 (10.8%) |
| Single Unit, Attached | 154 (41.0%) | 222 (59.0%) |
| 2 Unit Apartments | 79 (13.2%) | 519 (86.8%) |
| 3 or 4 Unit Apartments | 0 (0.0%) | 182 (100.0%) |
| 5 to 9 Unit Apartments | 0 (0.0%) | 394 (100.0%) |
| 10 or more Apartments | 0 (0.0%) | 176 (100.0%) |
| Mobile Home / Other | 0 (0.0%) | 0 (0.0%) |
| Total | 2,401 (57.8%) | 1,756 (42.2%) |
Housing Structures by Number of Rooms in Dormont borough
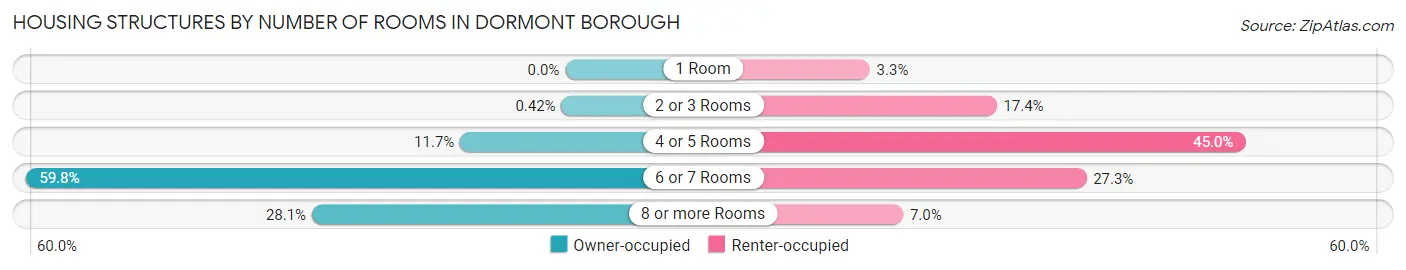
| Number of Rooms | Owner-occupied | Renter-occupied |
| 1 Room | 0 (0.0%) | 58 (3.3%) |
| 2 or 3 Rooms | 10 (0.4%) | 305 (17.4%) |
| 4 or 5 Rooms | 280 (11.7%) | 790 (45.0%) |
| 6 or 7 Rooms | 1,436 (59.8%) | 480 (27.3%) |
| 8 or more Rooms | 675 (28.1%) | 123 (7.0%) |
| Total | 2,401 (100.0%) | 1,756 (100.0%) |
Housing Structure by Heating Type in Dormont borough
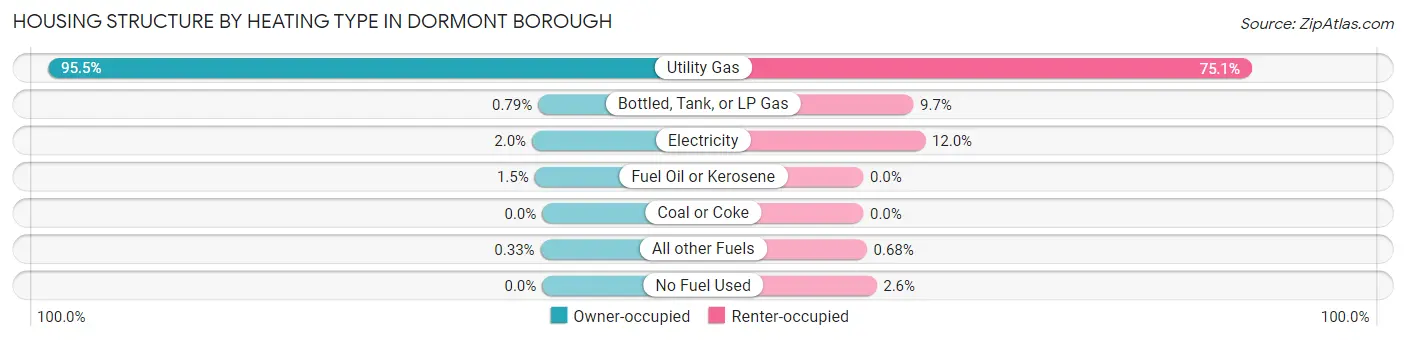
| Heating Type | Owner-occupied | Renter-occupied |
| Utility Gas | 2,292 (95.5%) | 1,319 (75.1%) |
| Bottled, Tank, or LP Gas | 19 (0.8%) | 170 (9.7%) |
| Electricity | 47 (2.0%) | 210 (12.0%) |
| Fuel Oil or Kerosene | 35 (1.5%) | 0 (0.0%) |
| Coal or Coke | 0 (0.0%) | 0 (0.0%) |
| All other Fuels | 8 (0.3%) | 12 (0.7%) |
| No Fuel Used | 0 (0.0%) | 45 (2.6%) |
| Total | 2,401 (100.0%) | 1,756 (100.0%) |
Household Vehicle Usage in Dormont borough
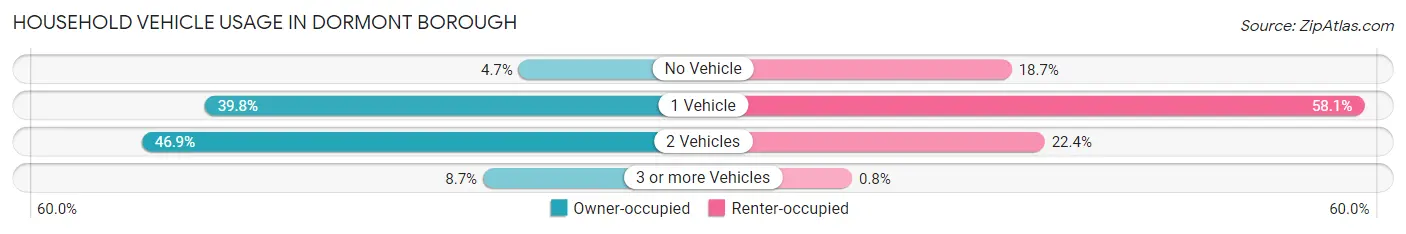
| Vehicles per Household | Owner-occupied | Renter-occupied |
| No Vehicle | 112 (4.7%) | 328 (18.7%) |
| 1 Vehicle | 956 (39.8%) | 1,021 (58.1%) |
| 2 Vehicles | 1,125 (46.9%) | 393 (22.4%) |
| 3 or more Vehicles | 208 (8.7%) | 14 (0.8%) |
| Total | 2,401 (100.0%) | 1,756 (100.0%) |
Real Estate & Mortgages in Dormont borough
Real Estate and Mortgage Overview in Dormont borough
| Characteristic | Without Mortgage | With Mortgage |
| Housing Units | 980 | 1,421 |
| Median Property Value | $165,000 | $197,400 |
| Median Household Income | $74,203 | $435 |
| Monthly Housing Costs | $618 | $34 |
| Real Estate Taxes | $3,167 | $30 |
Property Value by Mortgage Status in Dormont borough
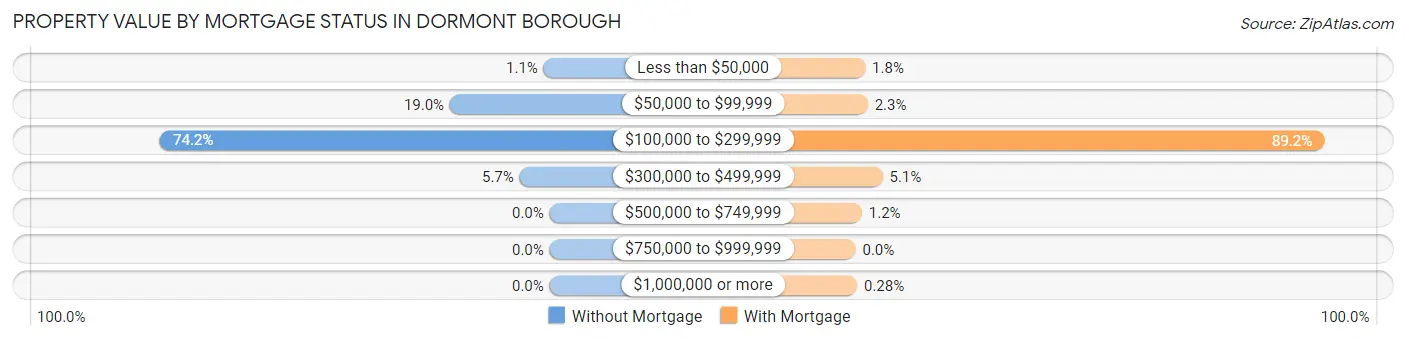
| Property Value | Without Mortgage | With Mortgage |
| Less than $50,000 | 11 (1.1%) | 26 (1.8%) |
| $50,000 to $99,999 | 186 (19.0%) | 33 (2.3%) |
| $100,000 to $299,999 | 727 (74.2%) | 1,268 (89.2%) |
| $300,000 to $499,999 | 56 (5.7%) | 73 (5.1%) |
| $500,000 to $749,999 | 0 (0.0%) | 17 (1.2%) |
| $750,000 to $999,999 | 0 (0.0%) | 0 (0.0%) |
| $1,000,000 or more | 0 (0.0%) | 4 (0.3%) |
| Total | 980 (100.0%) | 1,421 (100.0%) |
Household Income by Mortgage Status in Dormont borough
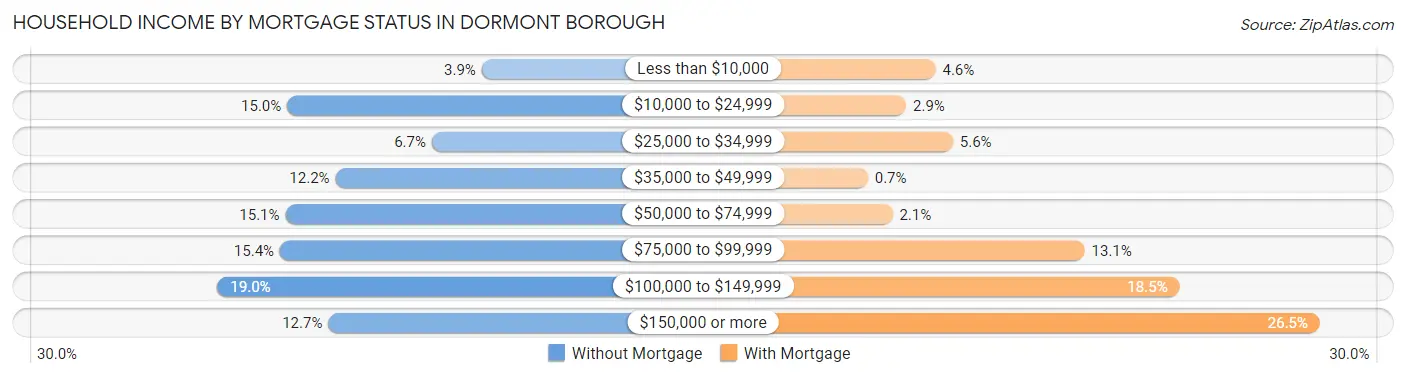
| Household Income | Without Mortgage | With Mortgage |
| Less than $10,000 | 38 (3.9%) | 65 (4.6%) |
| $10,000 to $24,999 | 147 (15.0%) | 41 (2.9%) |
| $25,000 to $34,999 | 66 (6.7%) | 79 (5.6%) |
| $35,000 to $49,999 | 120 (12.2%) | 10 (0.7%) |
| $50,000 to $74,999 | 148 (15.1%) | 30 (2.1%) |
| $75,000 to $99,999 | 151 (15.4%) | 186 (13.1%) |
| $100,000 to $149,999 | 186 (19.0%) | 263 (18.5%) |
| $150,000 or more | 124 (12.7%) | 377 (26.5%) |
| Total | 980 (100.0%) | 1,421 (100.0%) |
Property Value to Household Income Ratio in Dormont borough
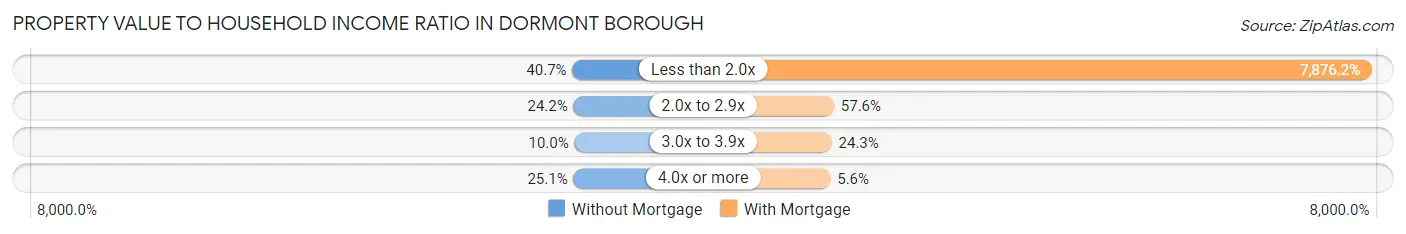
| Value-to-Income Ratio | Without Mortgage | With Mortgage |
| Less than 2.0x | 399 (40.7%) | 111,921 (7,876.2%) |
| 2.0x to 2.9x | 237 (24.2%) | 818 (57.6%) |
| 3.0x to 3.9x | 98 (10.0%) | 345 (24.3%) |
| 4.0x or more | 246 (25.1%) | 79 (5.6%) |
| Total | 980 (100.0%) | 1,421 (100.0%) |
Real Estate Taxes by Mortgage Status in Dormont borough
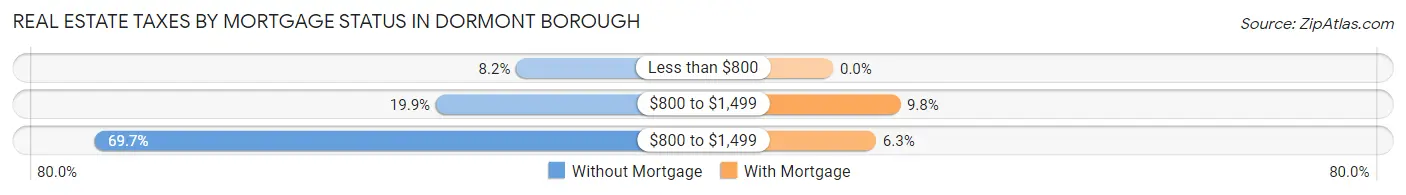
| Property Taxes | Without Mortgage | With Mortgage |
| Less than $800 | 80 (8.2%) | 0 (0.0%) |
| $800 to $1,499 | 195 (19.9%) | 139 (9.8%) |
| $800 to $1,499 | 683 (69.7%) | 89 (6.3%) |
| Total | 980 (100.0%) | 1,421 (100.0%) |
Health & Disability in Dormont borough
Health Insurance Coverage by Age in Dormont borough
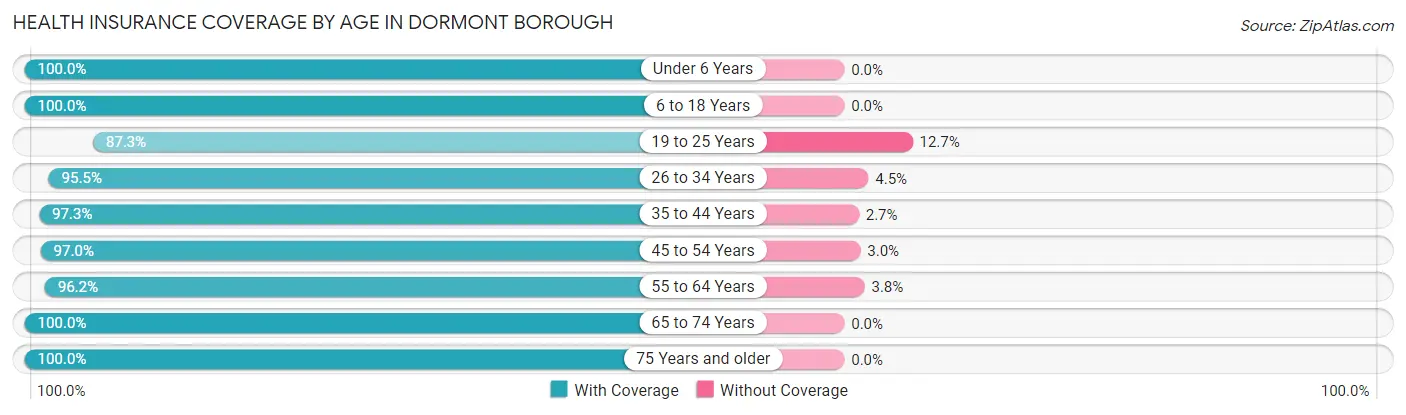
| Age Bracket | With Coverage | Without Coverage |
| Under 6 Years | 460 (100.0%) | 0 (0.0%) |
| 6 to 18 Years | 889 (100.0%) | 0 (0.0%) |
| 19 to 25 Years | 617 (87.3%) | 90 (12.7%) |
| 26 to 34 Years | 1,555 (95.5%) | 73 (4.5%) |
| 35 to 44 Years | 1,370 (97.3%) | 38 (2.7%) |
| 45 to 54 Years | 844 (97.0%) | 26 (3.0%) |
| 55 to 64 Years | 918 (96.2%) | 36 (3.8%) |
| 65 to 74 Years | 885 (100.0%) | 0 (0.0%) |
| 75 Years and older | 390 (100.0%) | 0 (0.0%) |
| Total | 7,928 (96.8%) | 263 (3.2%) |
Health Insurance Coverage by Citizenship Status in Dormont borough
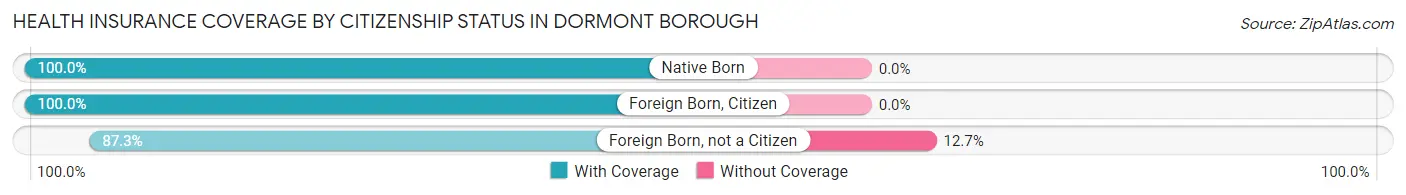
| Citizenship Status | With Coverage | Without Coverage |
| Native Born | 460 (100.0%) | 0 (0.0%) |
| Foreign Born, Citizen | 889 (100.0%) | 0 (0.0%) |
| Foreign Born, not a Citizen | 617 (87.3%) | 90 (12.7%) |
Health Insurance Coverage by Household Income in Dormont borough
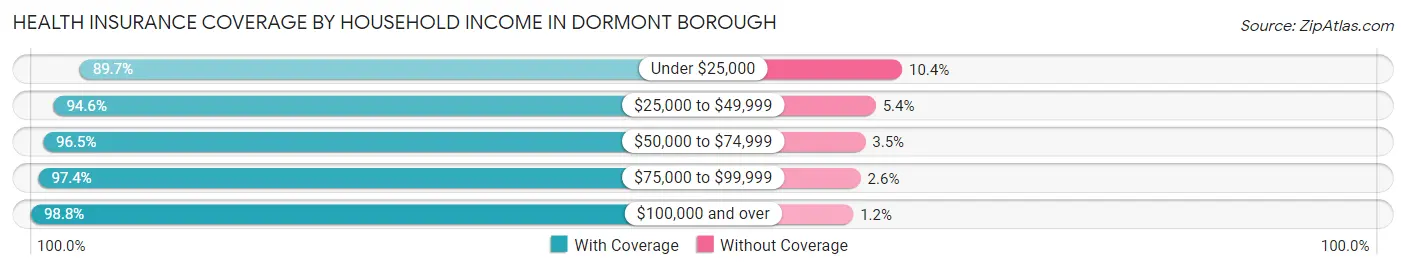
| Household Income | With Coverage | Without Coverage |
| Under $25,000 | 684 (89.6%) | 79 (10.3%) |
| $25,000 to $49,999 | 1,047 (94.6%) | 60 (5.4%) |
| $50,000 to $74,999 | 1,279 (96.5%) | 46 (3.5%) |
| $75,000 to $99,999 | 1,276 (97.4%) | 34 (2.6%) |
| $100,000 and over | 3,614 (98.8%) | 44 (1.2%) |
Public vs Private Health Insurance Coverage by Age in Dormont borough
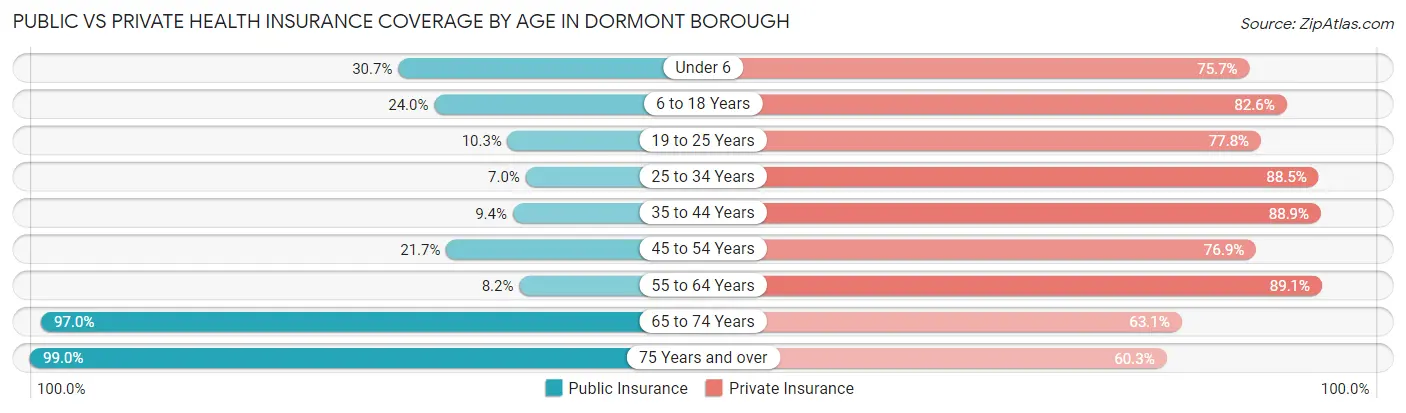
| Age Bracket | Public Insurance | Private Insurance |
| Under 6 | 141 (30.6%) | 348 (75.6%) |
| 6 to 18 Years | 213 (24.0%) | 734 (82.6%) |
| 19 to 25 Years | 73 (10.3%) | 550 (77.8%) |
| 25 to 34 Years | 114 (7.0%) | 1,441 (88.5%) |
| 35 to 44 Years | 132 (9.4%) | 1,252 (88.9%) |
| 45 to 54 Years | 189 (21.7%) | 669 (76.9%) |
| 55 to 64 Years | 78 (8.2%) | 850 (89.1%) |
| 65 to 74 Years | 858 (97.0%) | 558 (63.0%) |
| 75 Years and over | 386 (99.0%) | 235 (60.3%) |
| Total | 2,184 (26.7%) | 6,637 (81.0%) |
Disability Status by Sex by Age in Dormont borough
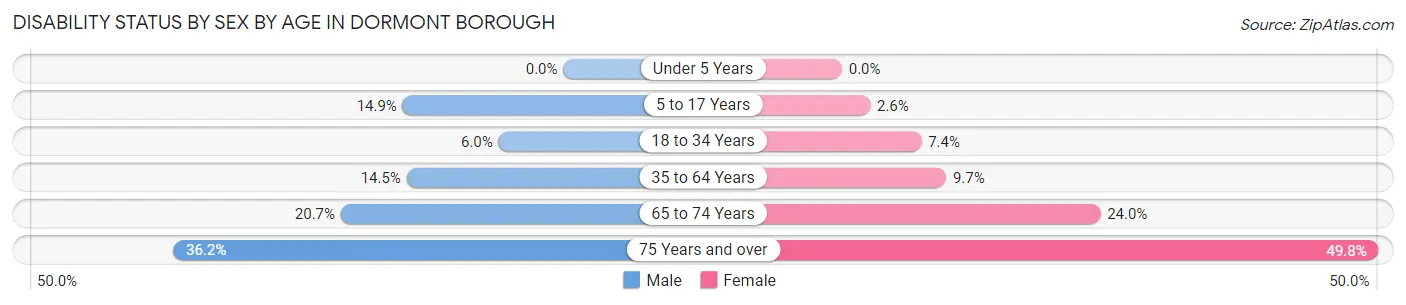
| Age Bracket | Male | Female |
| Under 5 Years | 0 (0.0%) | 0 (0.0%) |
| 5 to 17 Years | 55 (14.9%) | 15 (2.6%) |
| 18 to 34 Years | 72 (6.0%) | 86 (7.4%) |
| 35 to 64 Years | 261 (14.5%) | 139 (9.7%) |
| 65 to 74 Years | 82 (20.6%) | 117 (24.0%) |
| 75 Years and over | 46 (36.2%) | 131 (49.8%) |
Disability Class by Sex by Age in Dormont borough
Disability Class: Hearing Difficulty
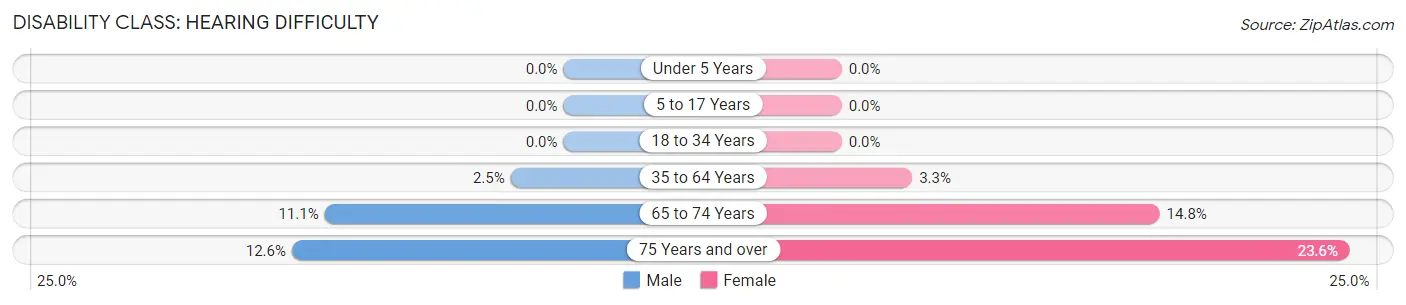
| Age Bracket | Male | Female |
| Under 5 Years | 0 (0.0%) | 0 (0.0%) |
| 5 to 17 Years | 0 (0.0%) | 0 (0.0%) |
| 18 to 34 Years | 0 (0.0%) | 0 (0.0%) |
| 35 to 64 Years | 44 (2.5%) | 47 (3.3%) |
| 65 to 74 Years | 44 (11.1%) | 72 (14.7%) |
| 75 Years and over | 16 (12.6%) | 62 (23.6%) |
Disability Class: Vision Difficulty
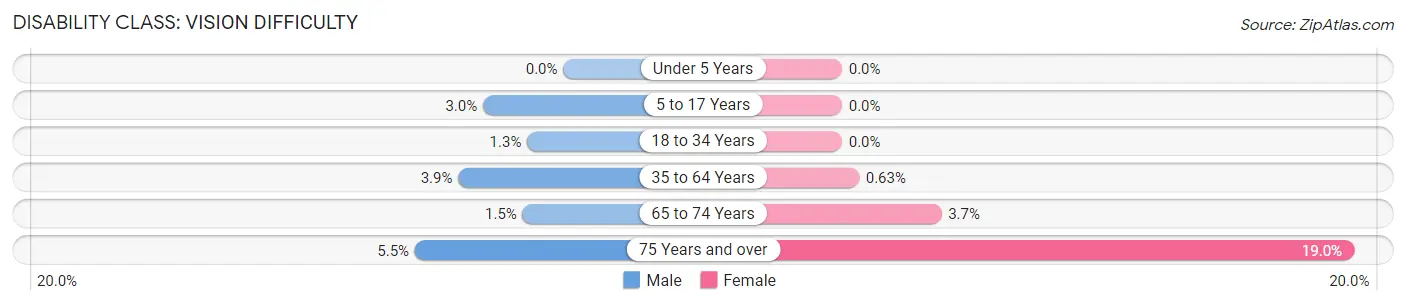
| Age Bracket | Male | Female |
| Under 5 Years | 0 (0.0%) | 0 (0.0%) |
| 5 to 17 Years | 11 (3.0%) | 0 (0.0%) |
| 18 to 34 Years | 16 (1.3%) | 0 (0.0%) |
| 35 to 64 Years | 70 (3.9%) | 9 (0.6%) |
| 65 to 74 Years | 6 (1.5%) | 18 (3.7%) |
| 75 Years and over | 7 (5.5%) | 50 (19.0%) |
Disability Class: Cognitive Difficulty
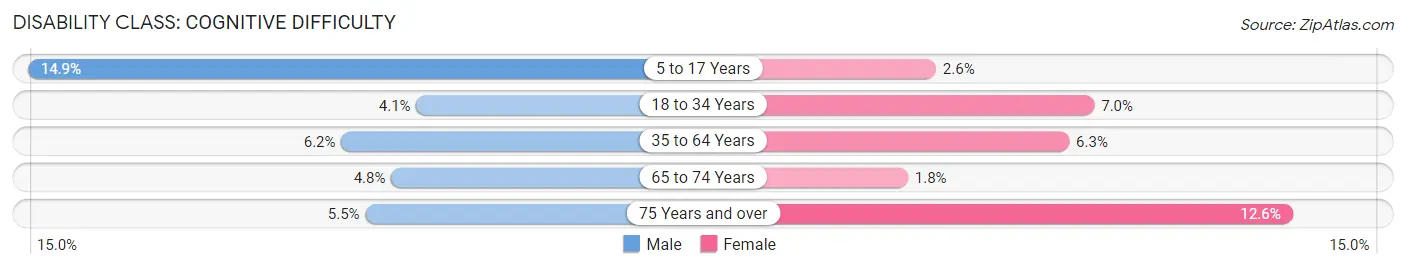
| Age Bracket | Male | Female |
| 5 to 17 Years | 55 (14.9%) | 15 (2.6%) |
| 18 to 34 Years | 49 (4.1%) | 82 (7.0%) |
| 35 to 64 Years | 111 (6.2%) | 91 (6.3%) |
| 65 to 74 Years | 19 (4.8%) | 9 (1.8%) |
| 75 Years and over | 7 (5.5%) | 33 (12.6%) |
Disability Class: Ambulatory Difficulty
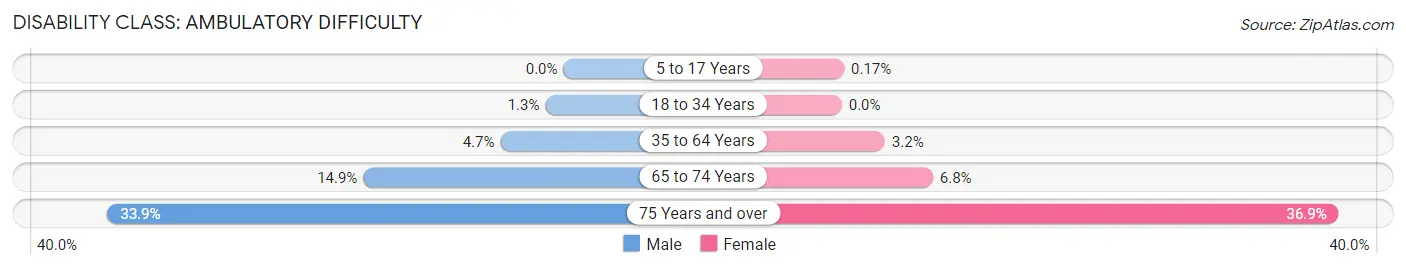
| Age Bracket | Male | Female |
| 5 to 17 Years | 0 (0.0%) | 1 (0.2%) |
| 18 to 34 Years | 16 (1.3%) | 0 (0.0%) |
| 35 to 64 Years | 84 (4.7%) | 46 (3.2%) |
| 65 to 74 Years | 59 (14.9%) | 33 (6.8%) |
| 75 Years and over | 43 (33.9%) | 97 (36.9%) |
Disability Class: Self-Care Difficulty
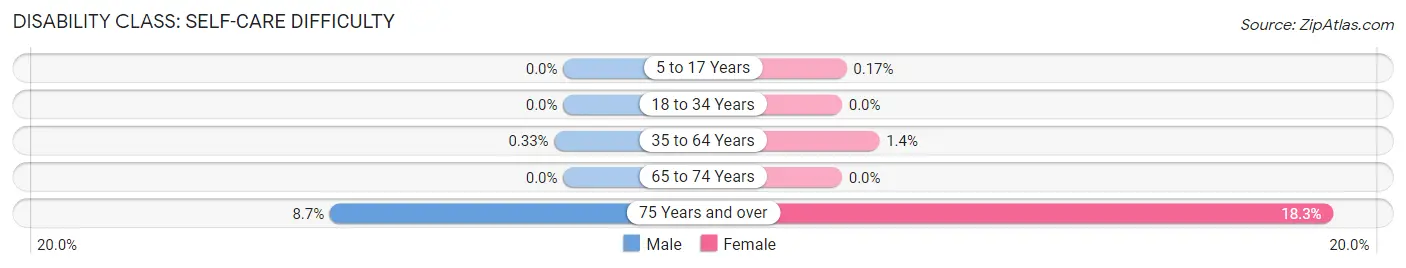
| Age Bracket | Male | Female |
| 5 to 17 Years | 0 (0.0%) | 1 (0.2%) |
| 18 to 34 Years | 0 (0.0%) | 0 (0.0%) |
| 35 to 64 Years | 6 (0.3%) | 20 (1.4%) |
| 65 to 74 Years | 0 (0.0%) | 0 (0.0%) |
| 75 Years and over | 11 (8.7%) | 48 (18.2%) |
Technology Access in Dormont borough
Computing Device Access in Dormont borough
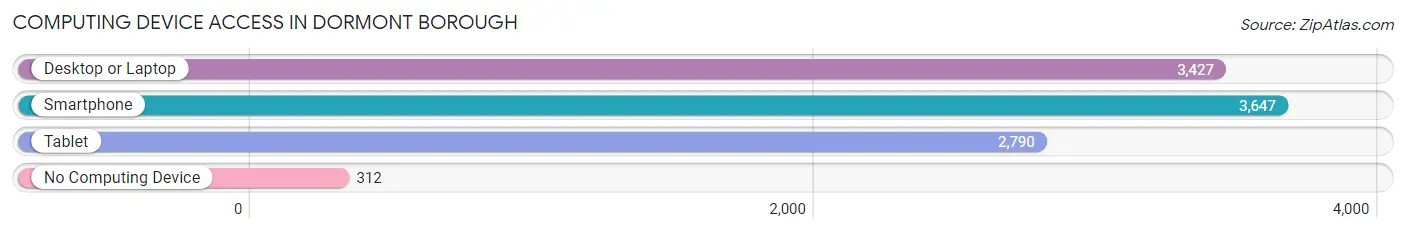
| Device Type | # Households | % Households |
| Desktop or Laptop | 3,427 | 82.4% |
| Smartphone | 3,647 | 87.7% |
| Tablet | 2,790 | 67.1% |
| No Computing Device | 312 | 7.5% |
| Total | 4,157 | 100.0% |
Internet Access in Dormont borough
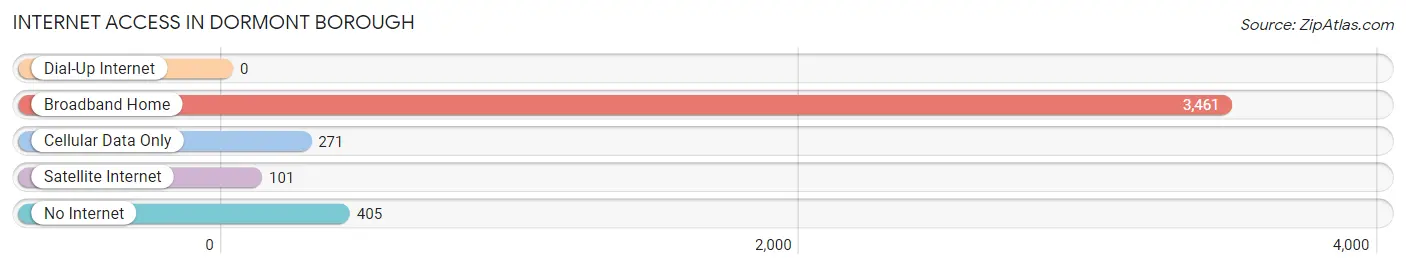
| Internet Type | # Households | % Households |
| Dial-Up Internet | 0 | 0.0% |
| Broadband Home | 3,461 | 83.3% |
| Cellular Data Only | 271 | 6.5% |
| Satellite Internet | 101 | 2.4% |
| No Internet | 405 | 9.7% |
| Total | 4,157 | 100.0% |
Dormont borough Summary
Dormont Borough is a small borough located in Allegheny County, Pennsylvania. It is a suburb of Pittsburgh and is part of the South Hills area. The population of Dormont Borough was 8,593 at the 2010 census.
History
Dormont Borough was founded in 1894 and was named after the French word for mountain, “dormont”. The area was originally part of Scott Township, but was incorporated as its own borough in 1894. The first mayor of Dormont was William H. Smith.
The area was originally home to Native American tribes, including the Shawnee and the Delaware. The first European settlers arrived in the area in the late 1700s. The area was primarily agricultural until the late 1800s, when the railroad was built through the area. This allowed for the development of industry and the growth of the population.
Geography
Dormont Borough is located in Allegheny County, Pennsylvania. It is a suburb of Pittsburgh and is part of the South Hills area. The borough is bordered by the city of Pittsburgh to the north, Scott Township to the east, Mt. Lebanon to the south, and Castle Shannon to the west.
The borough is located in the Allegheny Plateau region of Pennsylvania. The terrain is mostly hilly, with some flat areas. The highest point in the borough is located at the intersection of Potomac Avenue and Dormont Avenue, at an elevation of 1,092 feet.
The borough is located in the Eastern Standard Time Zone and observes Daylight Saving Time
Economy
The economy of Dormont Borough is primarily based on retail and services. The borough is home to several small businesses, including restaurants, shops, and professional services. The borough is also home to several large employers, including UPMC, Highmark, and the University of Pittsburgh Medical Center.
Demographics
As of the 2010 census, the population of Dormont Borough was 8,593. The racial makeup of the borough was 91.3% White, 4.2% African American, 0.3% Native American, 1.7% Asian, 0.1% Pacific Islander, 0.7% from other races, and 1.9% from two or more races. Hispanic or Latino of any race were 2.2% of the population.
The median household income in Dormont Borough was $50,945, and the median family income was $62,917. The per capita income for the borough was $27,945. About 4.3% of families and 6.2% of the population were below the poverty line, including 8.2% of those under age 18 and 4.2% of those age 65 or over.
Common Questions
What is Per Capita Income in Dormont borough?
Per Capita income in Dormont borough is $45,008.
What is the Median Family Income in Dormont borough?
Median Family Income in Dormont borough is $104,023.
What is the Median Household income in Dormont borough?
Median Household Income in Dormont borough is $73,798.
What is Income or Wage Gap in Dormont borough?
Income or Wage Gap in Dormont borough is 27.1%.
Women in Dormont borough earn 72.9 cents for every dollar earned by a man.
What is Inequality or Gini Index in Dormont borough?
Inequality or Gini Index in Dormont borough is 0.42.
What is the Total Population of Dormont borough?
Total Population of Dormont borough is 8,199.
What is the Total Male Population of Dormont borough?
Total Male Population of Dormont borough is 4,159.
What is the Total Female Population of Dormont borough?
Total Female Population of Dormont borough is 4,040.
What is the Ratio of Males per 100 Females in Dormont borough?
There are 102.95 Males per 100 Females in Dormont borough.
What is the Ratio of Females per 100 Males in Dormont borough?
There are 97.14 Females per 100 Males in Dormont borough.
What is the Median Population Age in Dormont borough?
Median Population Age in Dormont borough is 37.3 Years.
What is the Average Family Size in Dormont borough
Average Family Size in Dormont borough is 2.8 People.
What is the Average Household Size in Dormont borough
Average Household Size in Dormont borough is 2.0 People.
How Large is the Labor Force in Dormont borough?
There are 5,589 People in the Labor Forcein in Dormont borough.
What is the Percentage of People in the Labor Force in Dormont borough?
79.5% of People are in the Labor Force in Dormont borough.
What is the Unemployment Rate in Dormont borough?
Unemployment Rate in Dormont borough is 5.3%.