Duncannon borough, PA Map & Demographics
Duncannon borough Overview
$31,870
PER CAPITA INCOME
$79,063
AVG FAMILY INCOME
$52,500
AVG HOUSEHOLD INCOME
39.7%
WAGE / INCOME GAP [ % ]
60.3¢/ $1
WAGE / INCOME GAP [ $ ]
0.40
INEQUALITY / GINI INDEX
1,361
TOTAL POPULATION
738
MALE POPULATION
623
FEMALE POPULATION
118.46
MALES / 100 FEMALES
84.42
FEMALES / 100 MALES
45.0
MEDIAN AGE
3.0
AVG FAMILY SIZE
2.1
AVG HOUSEHOLD SIZE
799
LABOR FORCE [ PEOPLE ]
68.8%
PERCENT IN LABOR FORCE
5.6%
UNEMPLOYMENT RATE
Income in Duncannon borough
Income Overview in Duncannon borough
Per Capita Income in Duncannon borough is $31,870, while median incomes of families and households are $79,063 and $52,500 respectively.
| Characteristic | Number | Measure |
| Per Capita Income | 1,361 | $31,870 |
| Median Family Income | 333 | $79,063 |
| Mean Family Income | 333 | $86,644 |
| Median Household Income | 632 | $52,500 |
| Mean Household Income | 632 | $65,510 |
| Income Deficit | 333 | $0 |
| Wage / Income Gap (%) | 1,361 | 39.74% |
| Wage / Income Gap ($) | 1,361 | 60.26¢ per $1 |
| Gini / Inequality Index | 1,361 | 0.40 |
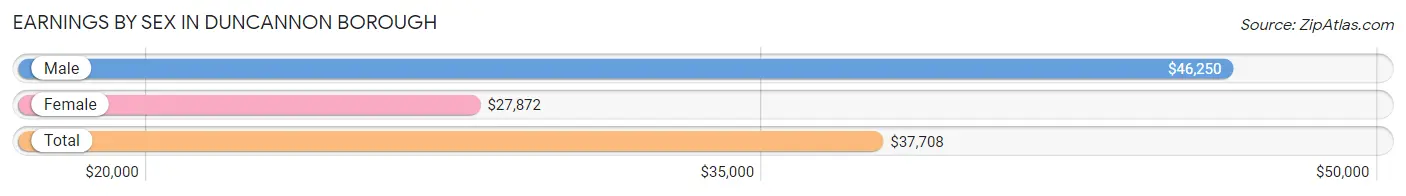
Earnings by Sex in Duncannon borough
Average Earnings in Duncannon borough are $37,708, $46,250 for men and $27,872 for women, a difference of 39.7%.
| Sex | Number | Average Earnings |
| Male | 448 (54.7%) | $46,250 |
| Female | 371 (45.3%) | $27,872 |
| Total | 819 (100.0%) | $37,708 |
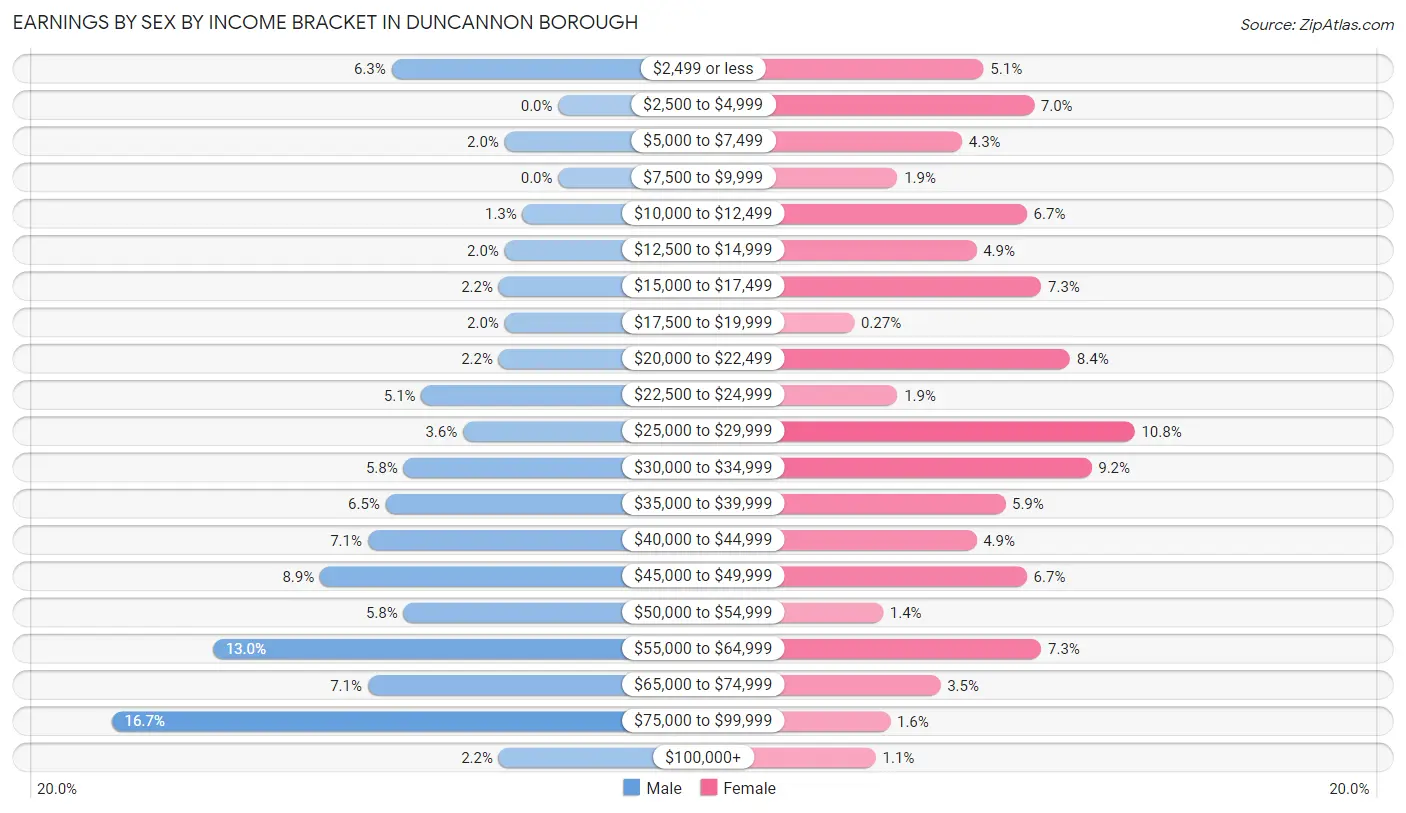
Earnings by Sex by Income Bracket in Duncannon borough
The most common earnings brackets in Duncannon borough are $75,000 to $99,999 for men (75 | 16.7%) and $25,000 to $29,999 for women (40 | 10.8%).
| Income | Male | Female |
| $2,499 or less | 28 (6.2%) | 19 (5.1%) |
| $2,500 to $4,999 | 0 (0.0%) | 26 (7.0%) |
| $5,000 to $7,499 | 9 (2.0%) | 16 (4.3%) |
| $7,500 to $9,999 | 0 (0.0%) | 7 (1.9%) |
| $10,000 to $12,499 | 6 (1.3%) | 25 (6.7%) |
| $12,500 to $14,999 | 9 (2.0%) | 18 (4.9%) |
| $15,000 to $17,499 | 10 (2.2%) | 27 (7.3%) |
| $17,500 to $19,999 | 9 (2.0%) | 1 (0.3%) |
| $20,000 to $22,499 | 10 (2.2%) | 31 (8.4%) |
| $22,500 to $24,999 | 23 (5.1%) | 7 (1.9%) |
| $25,000 to $29,999 | 16 (3.6%) | 40 (10.8%) |
| $30,000 to $34,999 | 26 (5.8%) | 34 (9.2%) |
| $35,000 to $39,999 | 29 (6.5%) | 22 (5.9%) |
| $40,000 to $44,999 | 32 (7.1%) | 18 (4.9%) |
| $45,000 to $49,999 | 40 (8.9%) | 25 (6.7%) |
| $50,000 to $54,999 | 26 (5.8%) | 5 (1.3%) |
| $55,000 to $64,999 | 58 (13.0%) | 27 (7.3%) |
| $65,000 to $74,999 | 32 (7.1%) | 13 (3.5%) |
| $75,000 to $99,999 | 75 (16.7%) | 6 (1.6%) |
| $100,000+ | 10 (2.2%) | 4 (1.1%) |
| Total | 448 (100.0%) | 371 (100.0%) |
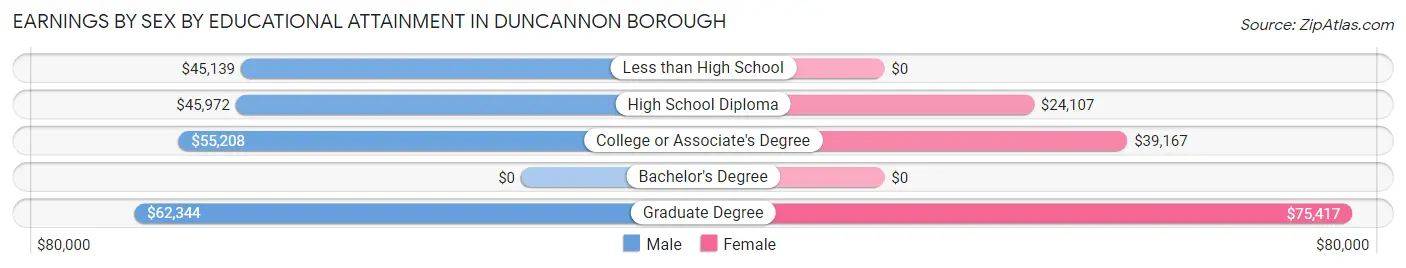
Earnings by Sex by Educational Attainment in Duncannon borough
Average earnings in Duncannon borough are $46,855 for men and $29,291 for women, a difference of 37.5%. Men with an educational attainment of graduate degree enjoy the highest average annual earnings of $62,344, while those with less than high school education earn the least with $45,139. Women with an educational attainment of graduate degree earn the most with the average annual earnings of $75,417, while those with high school diploma education have the smallest earnings of $24,107.
| Educational Attainment | Male Income | Female Income |
| Less than High School | $45,139 | $0 |
| High School Diploma | $45,972 | $24,107 |
| College or Associate's Degree | $55,208 | $39,167 |
| Bachelor's Degree | - | - |
| Graduate Degree | $62,344 | $75,417 |
| Total | $46,855 | $29,291 |
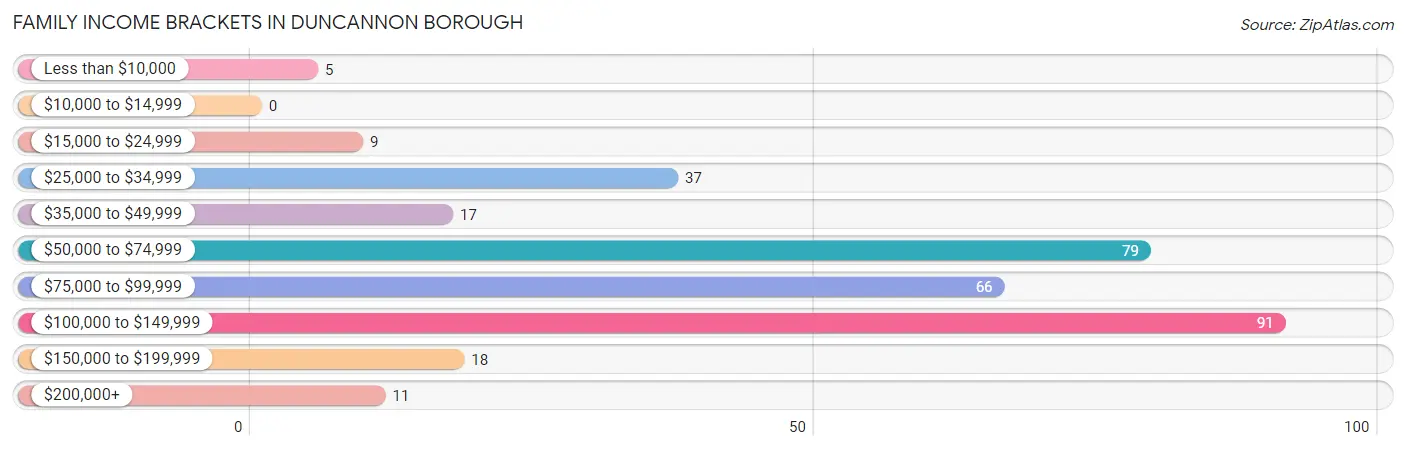
Family Income in Duncannon borough
Family Income Brackets in Duncannon borough
According to the Duncannon borough family income data, there are 91 families falling into the $100,000 to $149,999 income range, which is the most common income bracket and makes up 27.3% of all families.
| Income Bracket | # Families | % Families |
| Less than $10,000 | 5 | 1.5% |
| $10,000 to $14,999 | 0 | 0.0% |
| $15,000 to $24,999 | 9 | 2.7% |
| $25,000 to $34,999 | 37 | 11.1% |
| $35,000 to $49,999 | 17 | 5.1% |
| $50,000 to $74,999 | 79 | 23.7% |
| $75,000 to $99,999 | 66 | 19.8% |
| $100,000 to $149,999 | 91 | 27.3% |
| $150,000 to $199,999 | 18 | 5.4% |
| $200,000+ | 11 | 3.3% |
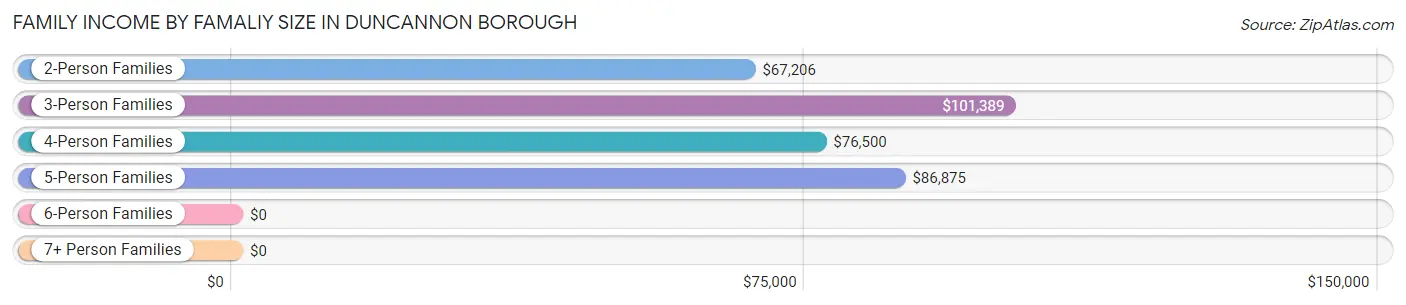
Family Income by Famaliy Size in Duncannon borough
3-person families (104 | 31.2%) account for the highest median family income in Duncannon borough with $101,389 per family, while 3-person families (104 | 31.2%) have the highest median income of $33,796 per family member.
| Income Bracket | # Families | Median Income |
| 2-Person Families | 158 (47.4%) | $67,206 |
| 3-Person Families | 104 (31.2%) | $101,389 |
| 4-Person Families | 36 (10.8%) | $76,500 |
| 5-Person Families | 27 (8.1%) | $86,875 |
| 6-Person Families | 8 (2.4%) | $0 |
| 7+ Person Families | 0 (0.0%) | $0 |
| Total | 333 (100.0%) | $79,063 |
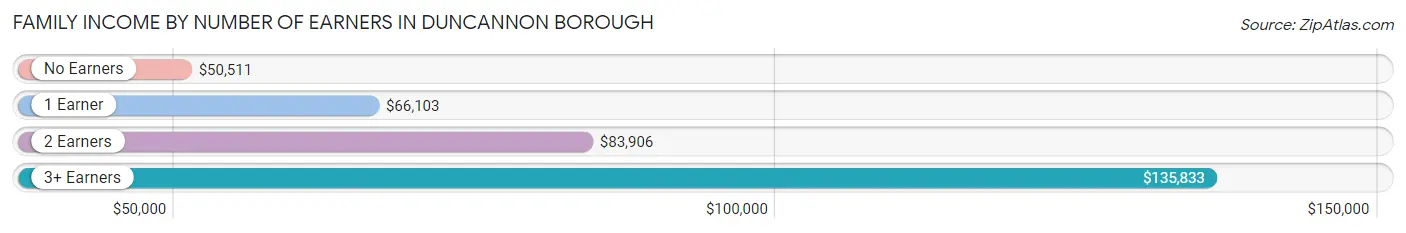
Family Income by Number of Earners in Duncannon borough
The median family income in Duncannon borough is $79,063, with families comprising 3+ earners (66) having the highest median family income of $135,833, while families with no earners (53) have the lowest median family income of $50,511, accounting for 19.8% and 15.9% of families, respectively.
| Number of Earners | # Families | Median Income |
| No Earners | 53 (15.9%) | $50,511 |
| 1 Earner | 75 (22.5%) | $66,103 |
| 2 Earners | 139 (41.7%) | $83,906 |
| 3+ Earners | 66 (19.8%) | $135,833 |
| Total | 333 (100.0%) | $79,063 |
Household Income in Duncannon borough
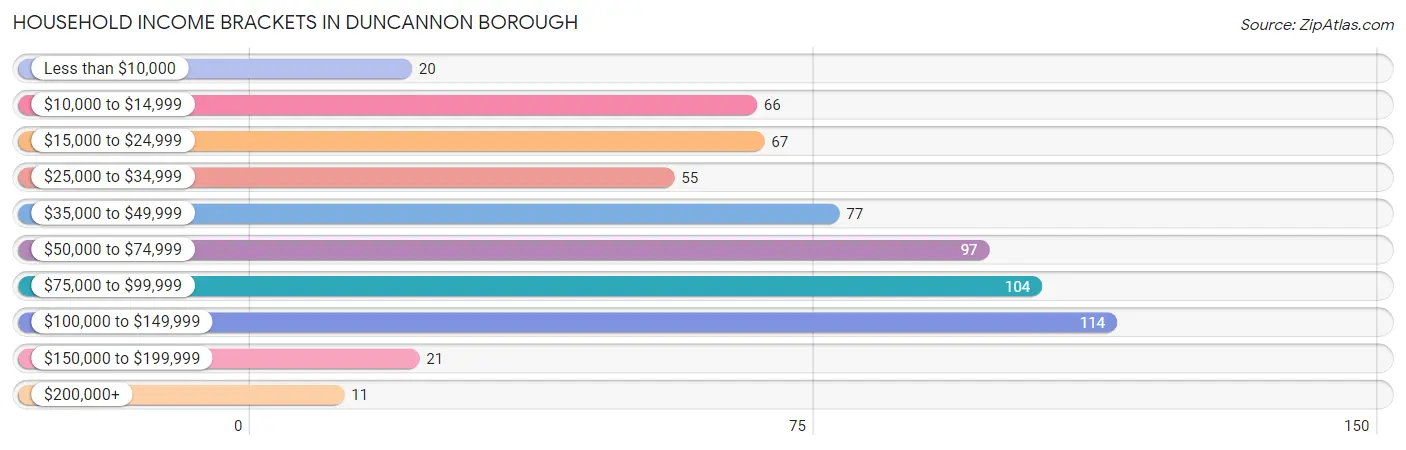
Household Income Brackets in Duncannon borough
With 114 households falling in the category, the $100,000 to $149,999 income range is the most frequent in Duncannon borough, accounting for 18.0% of all households. In contrast, only 11 households (1.7%) fall into the $200,000+ income bracket, making it the least populous group.
| Income Bracket | # Households | % Households |
| Less than $10,000 | 20 | 3.2% |
| $10,000 to $14,999 | 66 | 10.4% |
| $15,000 to $24,999 | 67 | 10.6% |
| $25,000 to $34,999 | 55 | 8.7% |
| $35,000 to $49,999 | 77 | 12.2% |
| $50,000 to $74,999 | 97 | 15.3% |
| $75,000 to $99,999 | 104 | 16.5% |
| $100,000 to $149,999 | 114 | 18.0% |
| $150,000 to $199,999 | 21 | 3.3% |
| $200,000+ | 11 | 1.7% |
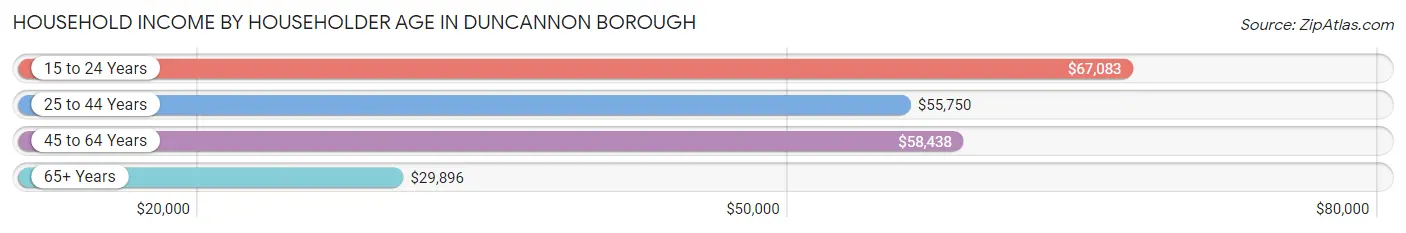
Household Income by Householder Age in Duncannon borough
The median household income in Duncannon borough is $52,500, with the highest median household income of $67,083 found in the 15 to 24 years age bracket for the primary householder. A total of 29 households (4.6%) fall into this category. Meanwhile, the 65+ years age bracket for the primary householder has the lowest median household income of $29,896, with 129 households (20.4%) in this group.
| Income Bracket | # Households | Median Income |
| 15 to 24 Years | 29 (4.6%) | $67,083 |
| 25 to 44 Years | 179 (28.3%) | $55,750 |
| 45 to 64 Years | 295 (46.7%) | $58,438 |
| 65+ Years | 129 (20.4%) | $29,896 |
| Total | 632 (100.0%) | $52,500 |
Poverty in Duncannon borough
Income Below Poverty by Sex and Age in Duncannon borough
With 8.6% poverty level for males and 12.4% for females among the residents of Duncannon borough, 16 and 17 year old males and 45 to 54 year old females are the most vulnerable to poverty, with 2 males (100.0%) and 24 females (20.5%) in their respective age groups living below the poverty level.
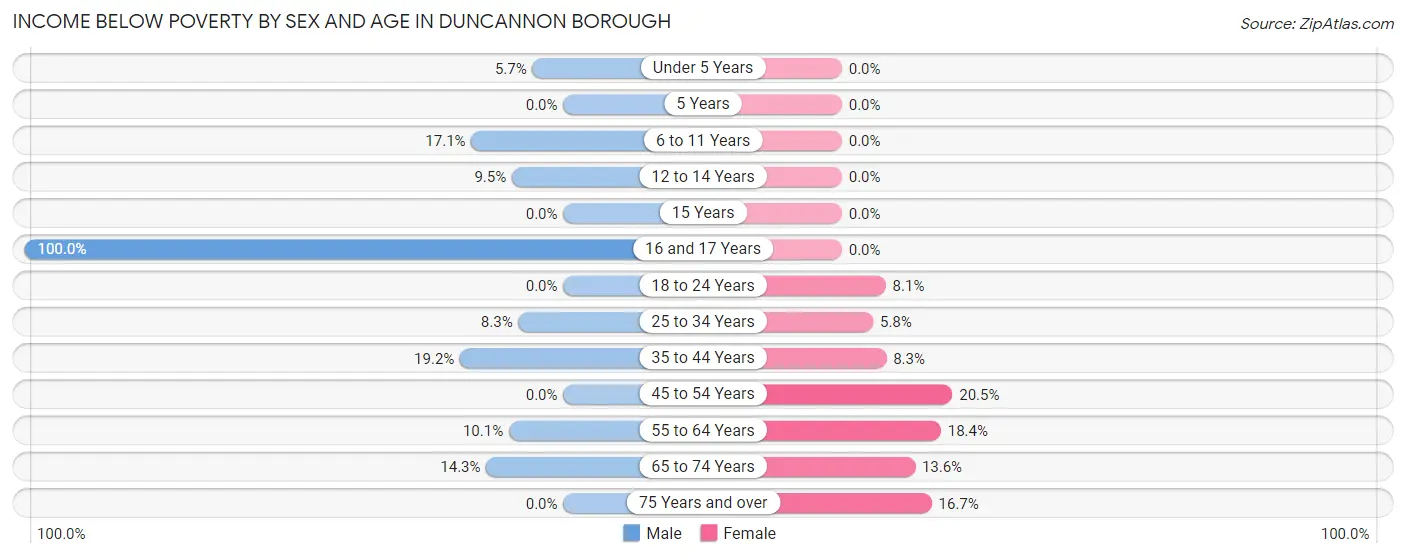
| Age Bracket | Male | Female |
| Under 5 Years | 4 (5.7%) | 0 (0.0%) |
| 5 Years | 0 (0.0%) | 0 (0.0%) |
| 6 to 11 Years | 7 (17.1%) | 0 (0.0%) |
| 12 to 14 Years | 2 (9.5%) | 0 (0.0%) |
| 15 Years | 0 (0.0%) | 0 (0.0%) |
| 16 and 17 Years | 2 (100.0%) | 0 (0.0%) |
| 18 to 24 Years | 0 (0.0%) | 7 (8.1%) |
| 25 to 34 Years | 8 (8.3%) | 4 (5.8%) |
| 35 to 44 Years | 18 (19.2%) | 8 (8.3%) |
| 45 to 54 Years | 0 (0.0%) | 24 (20.5%) |
| 55 to 64 Years | 11 (10.1%) | 18 (18.4%) |
| 65 to 74 Years | 11 (14.3%) | 11 (13.6%) |
| 75 Years and over | 0 (0.0%) | 5 (16.7%) |
| Total | 63 (8.6%) | 77 (12.4%) |
Income Above Poverty by Sex and Age in Duncannon borough
According to the poverty statistics in Duncannon borough, males aged 5 years and females aged under 5 years are the age groups that are most secure financially, with 100.0% of males and 100.0% of females in these age groups living above the poverty line.
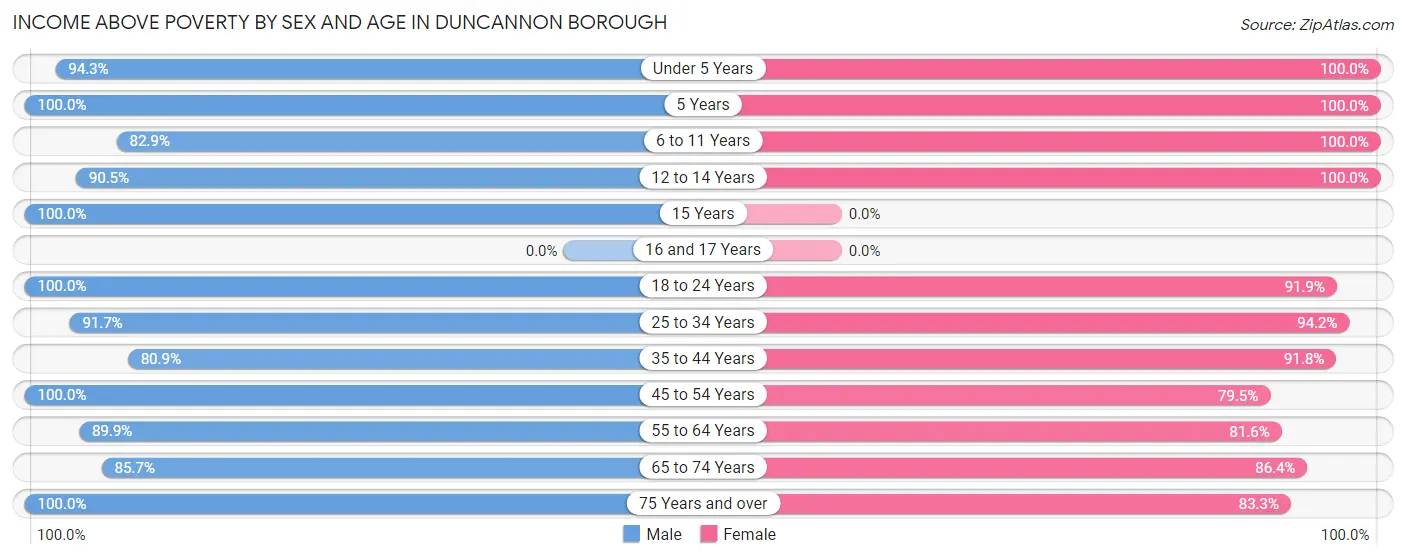
| Age Bracket | Male | Female |
| Under 5 Years | 66 (94.3%) | 14 (100.0%) |
| 5 Years | 17 (100.0%) | 6 (100.0%) |
| 6 to 11 Years | 34 (82.9%) | 15 (100.0%) |
| 12 to 14 Years | 19 (90.5%) | 7 (100.0%) |
| 15 Years | 4 (100.0%) | 0 (0.0%) |
| 16 and 17 Years | 0 (0.0%) | 0 (0.0%) |
| 18 to 24 Years | 35 (100.0%) | 79 (91.9%) |
| 25 to 34 Years | 88 (91.7%) | 65 (94.2%) |
| 35 to 44 Years | 76 (80.8%) | 89 (91.7%) |
| 45 to 54 Years | 137 (100.0%) | 93 (79.5%) |
| 55 to 64 Years | 98 (89.9%) | 80 (81.6%) |
| 65 to 74 Years | 66 (85.7%) | 70 (86.4%) |
| 75 Years and over | 33 (100.0%) | 25 (83.3%) |
| Total | 673 (91.4%) | 543 (87.6%) |
Income Below Poverty Among Married-Couple Families in Duncannon borough
The poverty statistics for married-couple families in Duncannon borough show that 3.0% or 8 of the total 262 families live below the poverty line. Families with no children have the highest poverty rate of 4.2%, comprising of 8 families. On the other hand, families with 1 or 2 children have the lowest poverty rate of 0.0%, which includes 0 families.
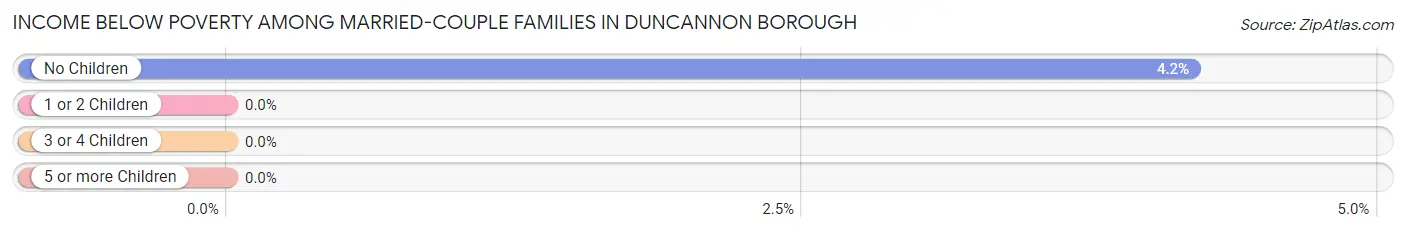
| Children | Above Poverty | Below Poverty |
| No Children | 183 (95.8%) | 8 (4.2%) |
| 1 or 2 Children | 49 (100.0%) | 0 (0.0%) |
| 3 or 4 Children | 22 (100.0%) | 0 (0.0%) |
| 5 or more Children | 0 (0.0%) | 0 (0.0%) |
| Total | 254 (97.0%) | 8 (3.0%) |
Income Below Poverty Among Single-Parent Households in Duncannon borough
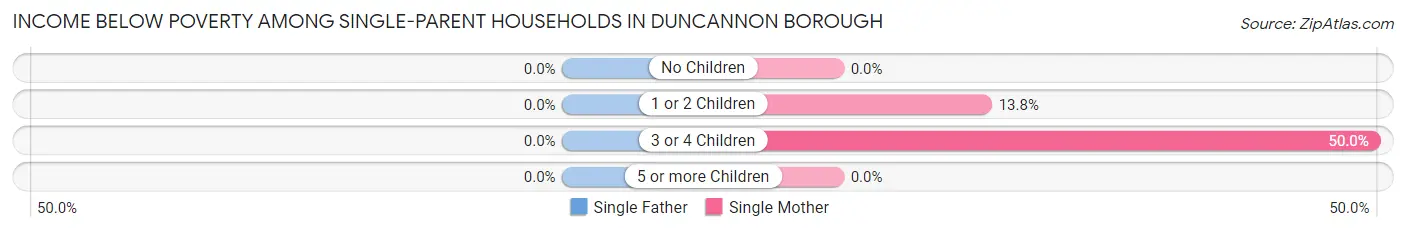
| Children | Single Father | Single Mother |
| No Children | 0 (0.0%) | 0 (0.0%) |
| 1 or 2 Children | 0 (0.0%) | 4 (13.8%) |
| 3 or 4 Children | 0 (0.0%) | 2 (50.0%) |
| 5 or more Children | 0 (0.0%) | 0 (0.0%) |
| Total | 0 (0.0%) | 6 (10.5%) |
Income Below Poverty Among Married-Couple vs Single-Parent Households in Duncannon borough
The poverty data for Duncannon borough shows that 8 of the married-couple family households (3.0%) and 6 of the single-parent households (8.5%) are living below the poverty level. Within the married-couple family households, those with no children have the highest poverty rate, with 8 households (4.2%) falling below the poverty line. Among the single-parent households, those with 3 or 4 children have the highest poverty rate, with 2 household (50.0%) living below poverty.
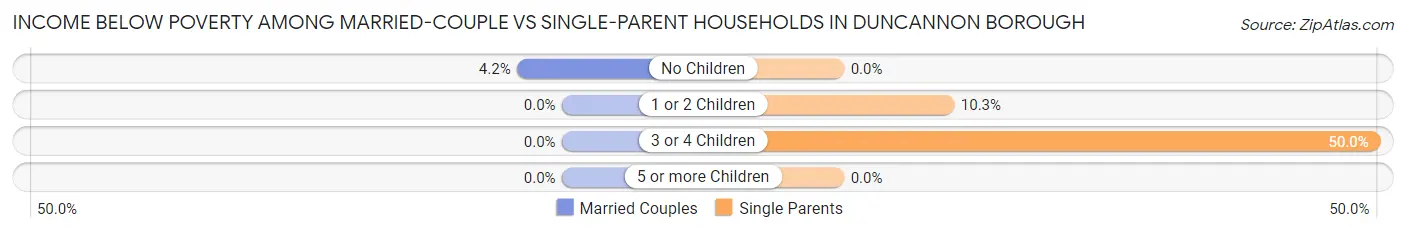
| Children | Married-Couple Families | Single-Parent Households |
| No Children | 8 (4.2%) | 0 (0.0%) |
| 1 or 2 Children | 0 (0.0%) | 4 (10.3%) |
| 3 or 4 Children | 0 (0.0%) | 2 (50.0%) |
| 5 or more Children | 0 (0.0%) | 0 (0.0%) |
| Total | 8 (3.0%) | 6 (8.5%) |
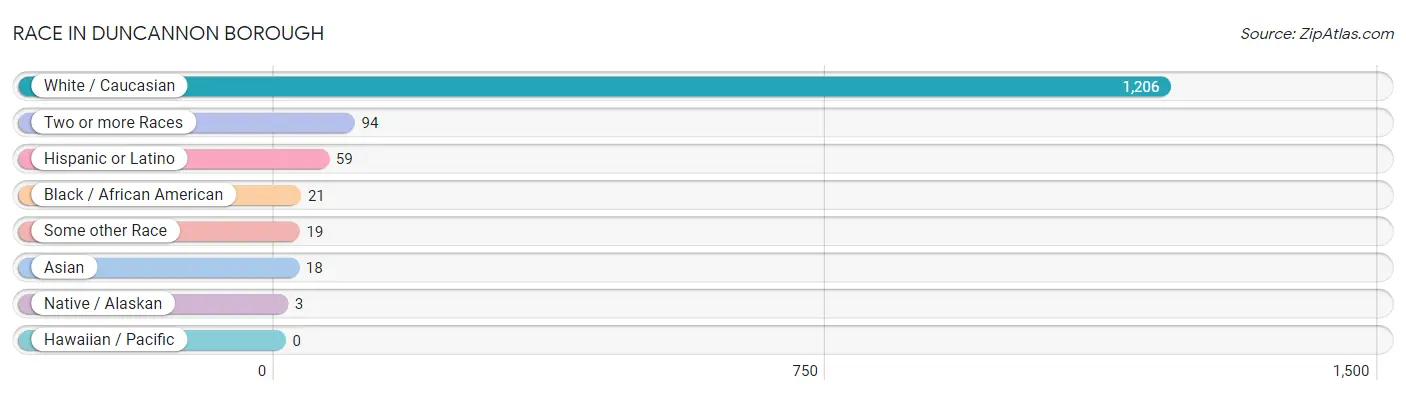
Race in Duncannon borough
The most populous races in Duncannon borough are White / Caucasian (1,206 | 88.6%), Two or more Races (94 | 6.9%), and Hispanic or Latino (59 | 4.3%).
| Race | # Population | % Population |
| Asian | 18 | 1.3% |
| Black / African American | 21 | 1.5% |
| Hawaiian / Pacific | 0 | 0.0% |
| Hispanic or Latino | 59 | 4.3% |
| Native / Alaskan | 3 | 0.2% |
| White / Caucasian | 1,206 | 88.6% |
| Two or more Races | 94 | 6.9% |
| Some other Race | 19 | 1.4% |
| Total | 1,361 | 100.0% |
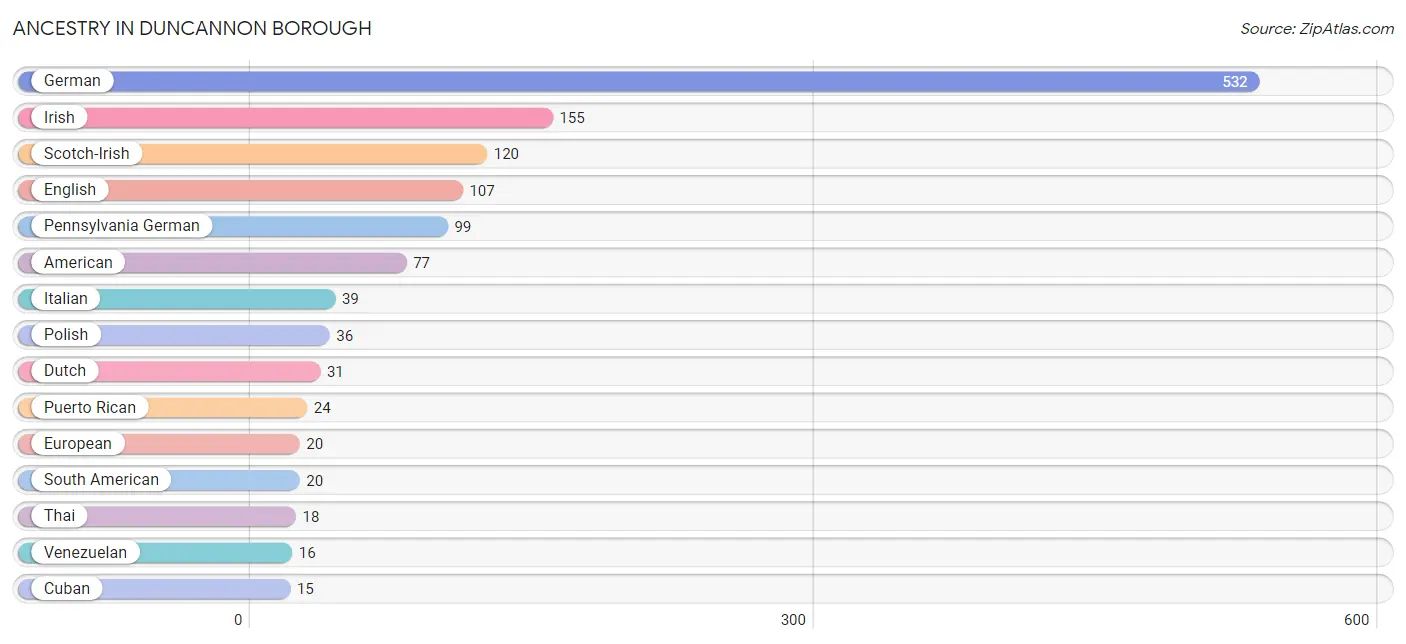
Ancestry in Duncannon borough
The most populous ancestries reported in Duncannon borough are German (532 | 39.1%), Irish (155 | 11.4%), Scotch-Irish (120 | 8.8%), English (107 | 7.9%), and Pennsylvania German (99 | 7.3%), together accounting for 74.4% of all Duncannon borough residents.
| Ancestry | # Population | % Population |
| American | 77 | 5.7% |
| Argentinean | 4 | 0.3% |
| Armenian | 11 | 0.8% |
| British | 3 | 0.2% |
| Croatian | 4 | 0.3% |
| Cuban | 15 | 1.1% |
| Czech | 9 | 0.7% |
| Dutch | 31 | 2.3% |
| English | 107 | 7.9% |
| European | 20 | 1.5% |
| French | 11 | 0.8% |
| German | 532 | 39.1% |
| Greek | 10 | 0.7% |
| Indian (Asian) | 7 | 0.5% |
| Irish | 155 | 11.4% |
| Italian | 39 | 2.9% |
| Jamaican | 5 | 0.4% |
| Macedonian | 10 | 0.7% |
| Pennsylvania German | 99 | 7.3% |
| Polish | 36 | 2.6% |
| Puerto Rican | 24 | 1.8% |
| Scandinavian | 6 | 0.4% |
| Scotch-Irish | 120 | 8.8% |
| Scottish | 11 | 0.8% |
| Slavic | 2 | 0.2% |
| Slovak | 3 | 0.2% |
| South American | 20 | 1.5% |
| Swedish | 7 | 0.5% |
| Swiss | 3 | 0.2% |
| Thai | 18 | 1.3% |
| Trinidadian and Tobagonian | 11 | 0.8% |
| Venezuelan | 16 | 1.2% |
| Welsh | 14 | 1.0% |
| Yugoslavian | 10 | 0.7% | View All 34 Rows |
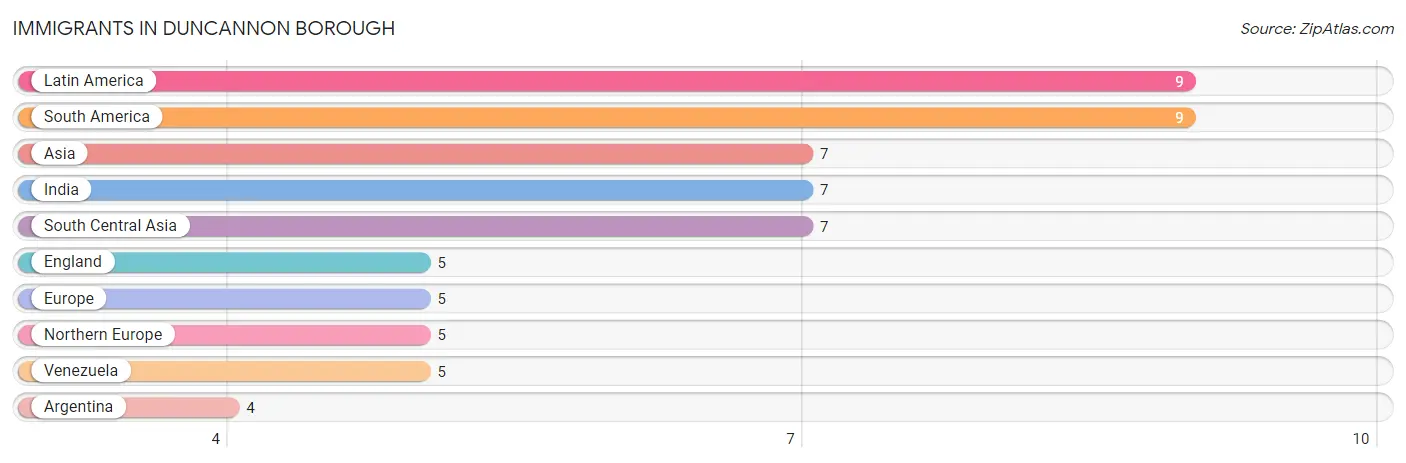
Immigrants in Duncannon borough
The most numerous immigrant groups reported in Duncannon borough came from Latin America (9 | 0.7%), South America (9 | 0.7%), Asia (7 | 0.5%), India (7 | 0.5%), and South Central Asia (7 | 0.5%), together accounting for 2.9% of all Duncannon borough residents.
| Immigration Origin | # Population | % Population |
| Argentina | 4 | 0.3% |
| Asia | 7 | 0.5% |
| England | 5 | 0.4% |
| Europe | 5 | 0.4% |
| India | 7 | 0.5% |
| Latin America | 9 | 0.7% |
| Northern Europe | 5 | 0.4% |
| South America | 9 | 0.7% |
| South Central Asia | 7 | 0.5% |
| Venezuela | 5 | 0.4% | View All 10 Rows |
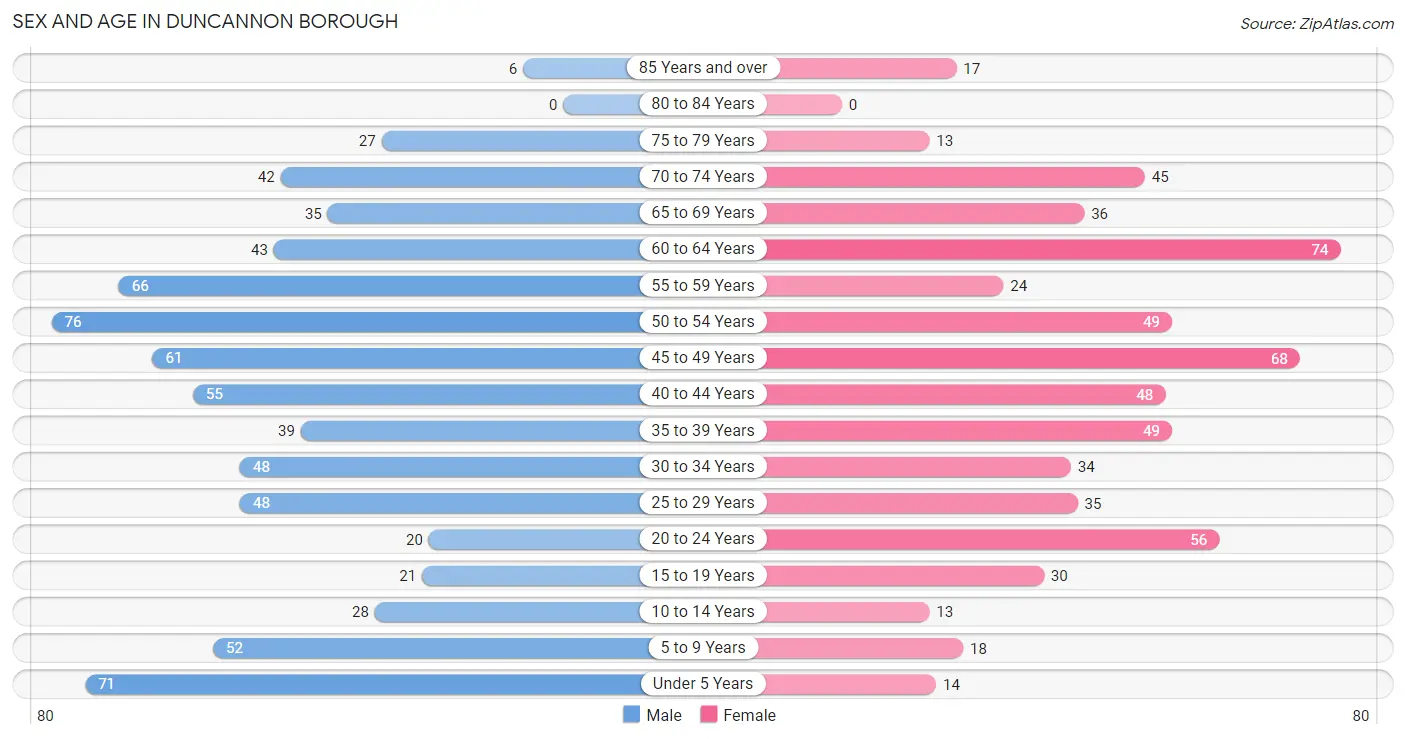
Sex and Age in Duncannon borough
Sex and Age in Duncannon borough
The most populous age groups in Duncannon borough are 50 to 54 Years (76 | 10.3%) for men and 60 to 64 Years (74 | 11.9%) for women.
| Age Bracket | Male | Female |
| Under 5 Years | 71 (9.6%) | 14 (2.2%) |
| 5 to 9 Years | 52 (7.0%) | 18 (2.9%) |
| 10 to 14 Years | 28 (3.8%) | 13 (2.1%) |
| 15 to 19 Years | 21 (2.9%) | 30 (4.8%) |
| 20 to 24 Years | 20 (2.7%) | 56 (9.0%) |
| 25 to 29 Years | 48 (6.5%) | 35 (5.6%) |
| 30 to 34 Years | 48 (6.5%) | 34 (5.5%) |
| 35 to 39 Years | 39 (5.3%) | 49 (7.9%) |
| 40 to 44 Years | 55 (7.4%) | 48 (7.7%) |
| 45 to 49 Years | 61 (8.3%) | 68 (10.9%) |
| 50 to 54 Years | 76 (10.3%) | 49 (7.9%) |
| 55 to 59 Years | 66 (8.9%) | 24 (3.8%) |
| 60 to 64 Years | 43 (5.8%) | 74 (11.9%) |
| 65 to 69 Years | 35 (4.7%) | 36 (5.8%) |
| 70 to 74 Years | 42 (5.7%) | 45 (7.2%) |
| 75 to 79 Years | 27 (3.7%) | 13 (2.1%) |
| 80 to 84 Years | 0 (0.0%) | 0 (0.0%) |
| 85 Years and over | 6 (0.8%) | 17 (2.7%) |
| Total | 738 (100.0%) | 623 (100.0%) |
Families and Households in Duncannon borough
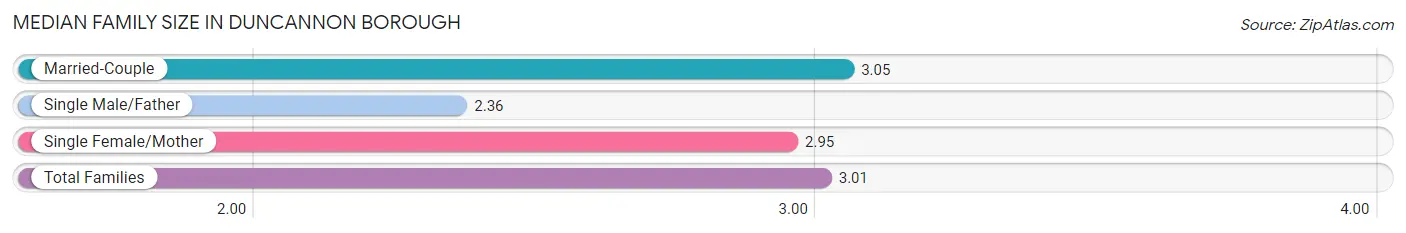
Median Family Size in Duncannon borough
The median family size in Duncannon borough is 3.01 persons per family, with married-couple families (262 | 78.7%) accounting for the largest median family size of 3.05 persons per family. On the other hand, single male/father families (14 | 4.2%) represent the smallest median family size with 2.36 persons per family.
| Family Type | # Families | Family Size |
| Married-Couple | 262 (78.7%) | 3.05 |
| Single Male/Father | 14 (4.2%) | 2.36 |
| Single Female/Mother | 57 (17.1%) | 2.95 |
| Total Families | 333 (100.0%) | 3.01 |
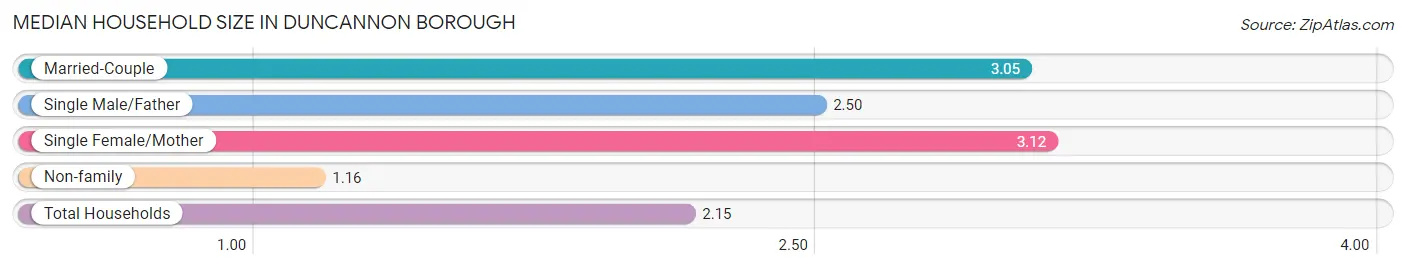
Median Household Size in Duncannon borough
The median household size in Duncannon borough is 2.15 persons per household, with single female/mother households (57 | 9.0%) accounting for the largest median household size of 3.12 persons per household. non-family households (299 | 47.3%) represent the smallest median household size with 1.16 persons per household.
| Household Type | # Households | Household Size |
| Married-Couple | 262 (41.5%) | 3.05 |
| Single Male/Father | 14 (2.2%) | 2.50 |
| Single Female/Mother | 57 (9.0%) | 3.12 |
| Non-family | 299 (47.3%) | 1.16 |
| Total Households | 632 (100.0%) | 2.15 |
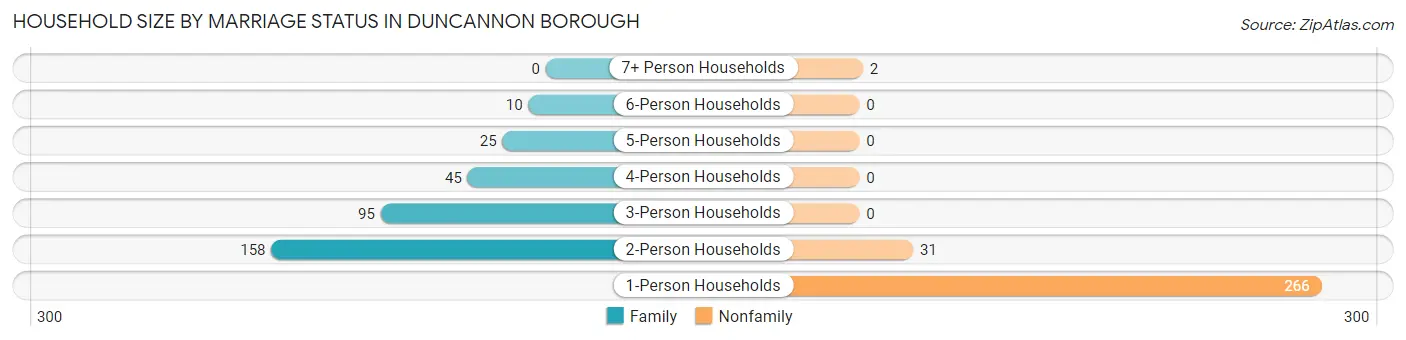
Household Size by Marriage Status in Duncannon borough
Out of a total of 632 households in Duncannon borough, 333 (52.7%) are family households, while 299 (47.3%) are nonfamily households. The most numerous type of family households are 2-person households, comprising 158, and the most common type of nonfamily households are 1-person households, comprising 266.
| Household Size | Family Households | Nonfamily Households |
| 1-Person Households | - | 266 (42.1%) |
| 2-Person Households | 158 (25.0%) | 31 (4.9%) |
| 3-Person Households | 95 (15.0%) | 0 (0.0%) |
| 4-Person Households | 45 (7.1%) | 0 (0.0%) |
| 5-Person Households | 25 (4.0%) | 0 (0.0%) |
| 6-Person Households | 10 (1.6%) | 0 (0.0%) |
| 7+ Person Households | 0 (0.0%) | 2 (0.3%) |
| Total | 333 (52.7%) | 299 (47.3%) |
Female Fertility in Duncannon borough
Fertility by Age in Duncannon borough
Average fertility rate in Duncannon borough is 82.0 births per 1,000 women. Women in the age bracket of 20 to 34 years have the highest fertility rate with 192.0 births per 1,000 women. Women in the age bracket of 20 to 34 years acount for 88.9% of all women with births.
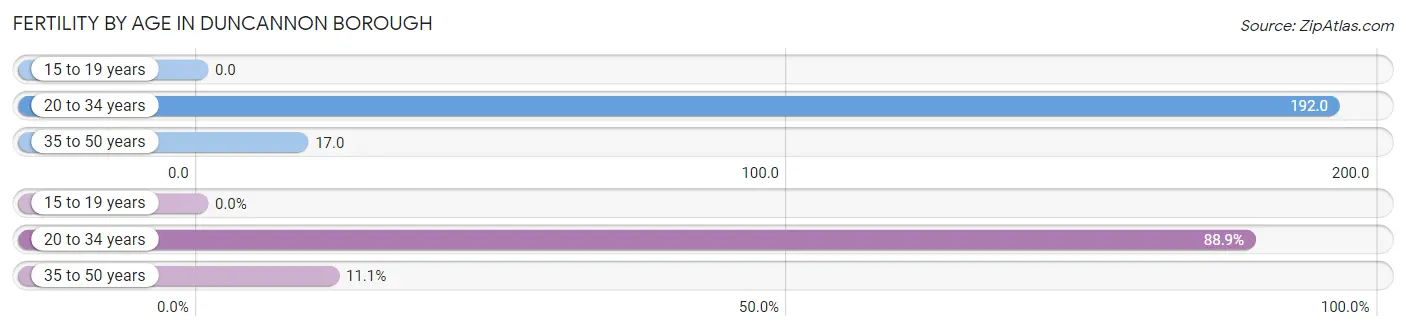
| Age Bracket | Women with Births | Births / 1,000 Women |
| 15 to 19 years | 0 (0.0%) | 0.0 |
| 20 to 34 years | 24 (88.9%) | 192.0 |
| 35 to 50 years | 3 (11.1%) | 17.0 |
| Total | 27 (100.0%) | 82.0 |
Fertility by Age by Marriage Status in Duncannon borough
88.9% of women with births (27) in Duncannon borough are married. The highest percentage of unmarried women with births falls into 35 to 50 years age bracket with 100.0% of them unmarried at the time of birth, while the lowest percentage of unmarried women with births belong to 20 to 34 years age bracket with 0.0% of them unmarried.
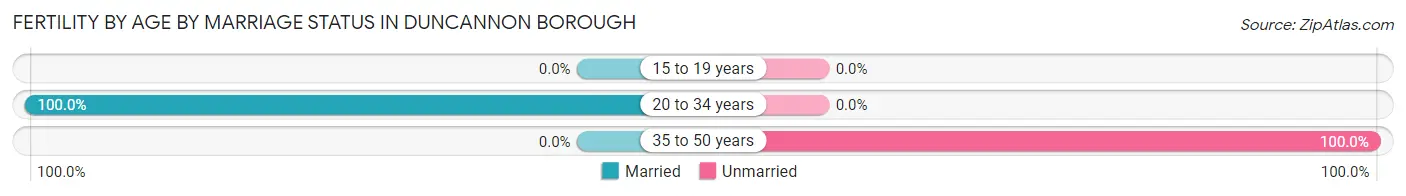
| Age Bracket | Married | Unmarried |
| 15 to 19 years | 0 (0.0%) | 0 (0.0%) |
| 20 to 34 years | 24 (100.0%) | 0 (0.0%) |
| 35 to 50 years | 0 (0.0%) | 3 (100.0%) |
| Total | 24 (88.9%) | 3 (11.1%) |
Fertility by Education in Duncannon borough
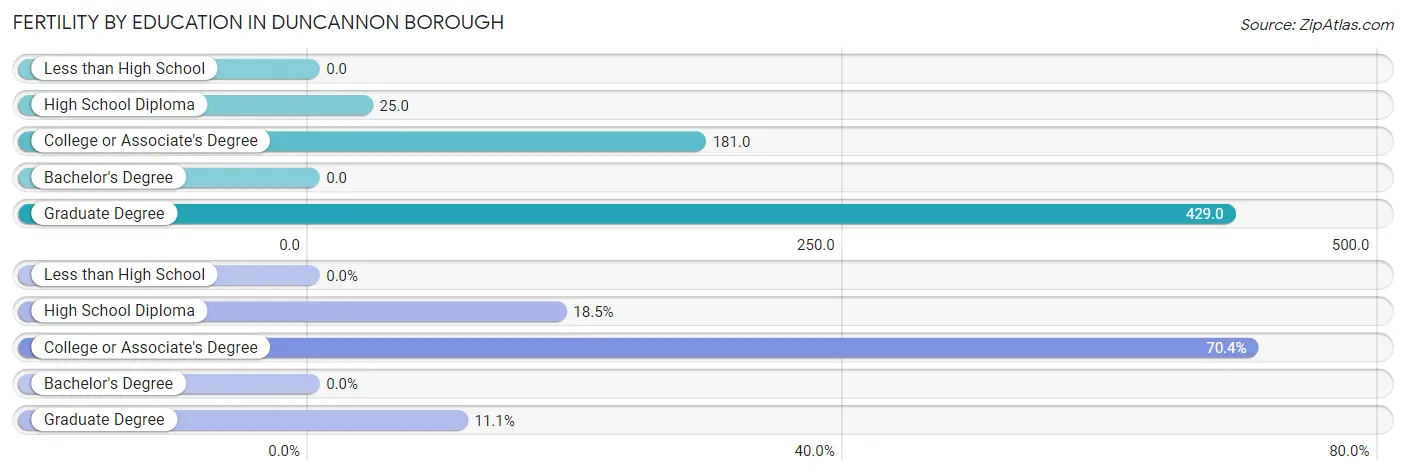
| Educational Attainment | Women with Births | Births / 1,000 Women |
| Less than High School | 0 (0.0%) | 0.0 |
| High School Diploma | 5 (18.5%) | 25.0 |
| College or Associate's Degree | 19 (70.4%) | 181.0 |
| Bachelor's Degree | 0 (0.0%) | 0.0 |
| Graduate Degree | 3 (11.1%) | 429.0 |
| Total | 27 (100.0%) | 82.0 |
Fertility by Education by Marriage Status in Duncannon borough
11.1% of women with births in Duncannon borough are unmarried. Women with the educational attainment of high school diploma are most likely to be married with 100.0% of them married at childbirth, while women with the educational attainment of graduate degree are least likely to be married with 100.0% of them unmarried at childbirth.
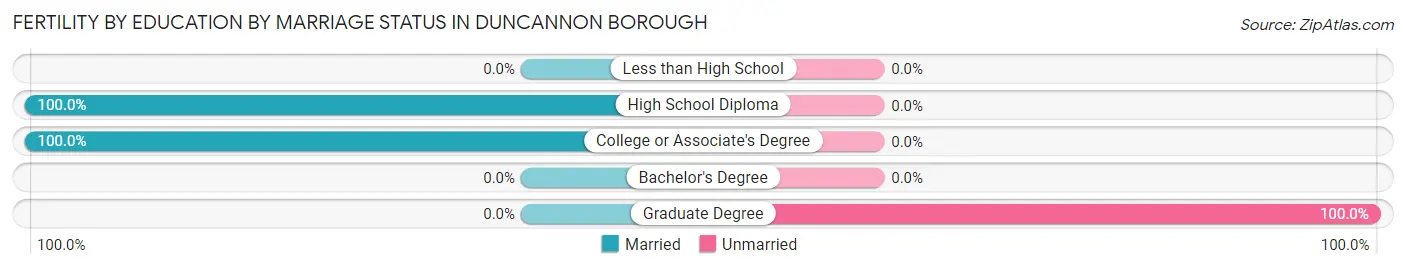
| Educational Attainment | Married | Unmarried |
| Less than High School | 0 (0.0%) | 0 (0.0%) |
| High School Diploma | 5 (100.0%) | 0 (0.0%) |
| College or Associate's Degree | 19 (100.0%) | 0 (0.0%) |
| Bachelor's Degree | 0 (0.0%) | 0 (0.0%) |
| Graduate Degree | 0 (0.0%) | 3 (100.0%) |
| Total | 24 (88.9%) | 3 (11.1%) |
Employment Characteristics in Duncannon borough
Employment by Class of Employer in Duncannon borough
Among the 733 employed individuals in Duncannon borough, private company employees (538 | 73.4%), state government employees (54 | 7.4%), and not-for-profit organizations (43 | 5.9%) make up the most common classes of employment.
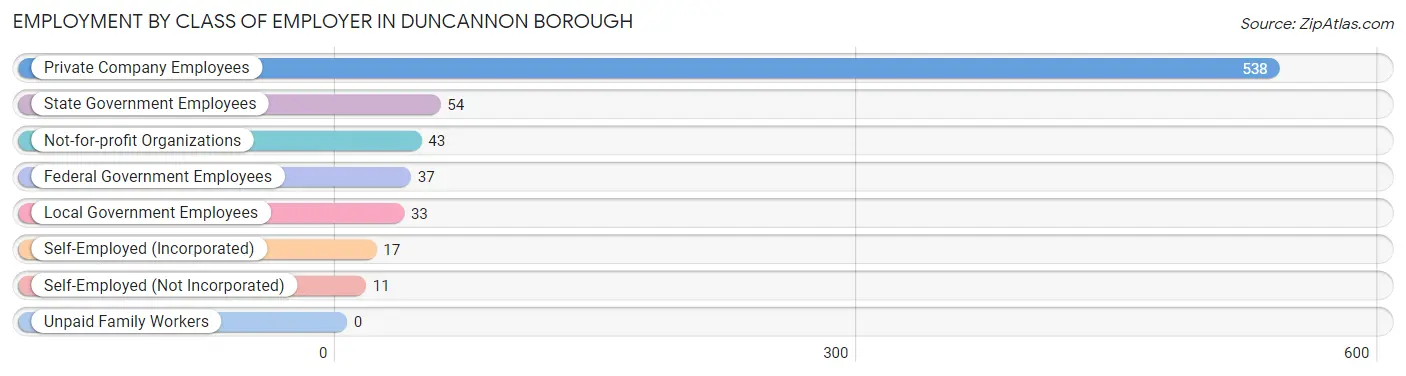
| Employer Class | # Employees | % Employees |
| Private Company Employees | 538 | 73.4% |
| Self-Employed (Incorporated) | 17 | 2.3% |
| Self-Employed (Not Incorporated) | 11 | 1.5% |
| Not-for-profit Organizations | 43 | 5.9% |
| Local Government Employees | 33 | 4.5% |
| State Government Employees | 54 | 7.4% |
| Federal Government Employees | 37 | 5.1% |
| Unpaid Family Workers | 0 | 0.0% |
| Total | 733 | 100.0% |
Employment Status by Age in Duncannon borough
According to the labor force statistics for Duncannon borough, out of the total population over 16 years of age (1,161), 68.8% or 799 individuals are in the labor force, with 5.6% or 45 of them unemployed. The age group with the highest labor force participation rate is 25 to 29 years, with 94.0% or 78 individuals in the labor force. Within the labor force, the 16 to 19 years age range has the highest percentage of unemployed individuals, with 19.5% or 8 of them being unemployed.
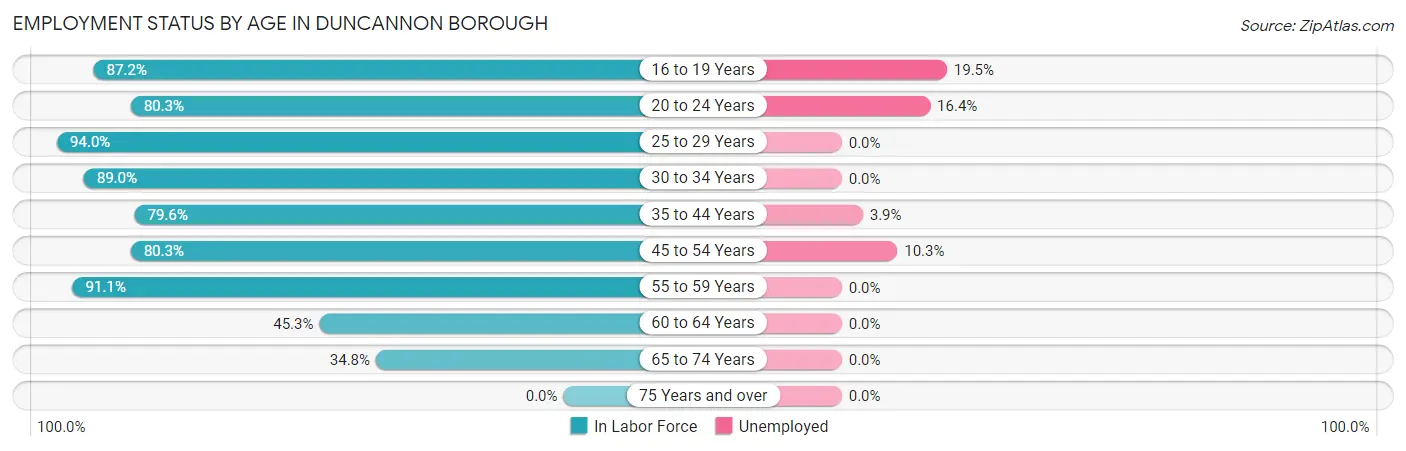
| Age Bracket | In Labor Force | Unemployed |
| 16 to 19 Years | 41 (87.2%) | 8 (19.5%) |
| 20 to 24 Years | 61 (80.3%) | 10 (16.4%) |
| 25 to 29 Years | 78 (94.0%) | 0 (0.0%) |
| 30 to 34 Years | 73 (89.0%) | 0 (0.0%) |
| 35 to 44 Years | 152 (79.6%) | 6 (3.9%) |
| 45 to 54 Years | 204 (80.3%) | 21 (10.3%) |
| 55 to 59 Years | 82 (91.1%) | 0 (0.0%) |
| 60 to 64 Years | 53 (45.3%) | 0 (0.0%) |
| 65 to 74 Years | 55 (34.8%) | 0 (0.0%) |
| 75 Years and over | 0 (0.0%) | 0 (0.0%) |
| Total | 799 (68.8%) | 45 (5.6%) |
Employment Status by Educational Attainment in Duncannon borough
According to labor force statistics for Duncannon borough, 78.6% of individuals (642) out of the total population between 25 and 64 years of age (817) are in the labor force, with 4.2% or 27 of them being unemployed. The group with the highest labor force participation rate are those with the educational attainment of high school diploma, with 81.4% or 333 individuals in the labor force. Within the labor force, individuals with high school diploma education have the highest percentage of unemployment, with 7.2% or 24 of them being unemployed.
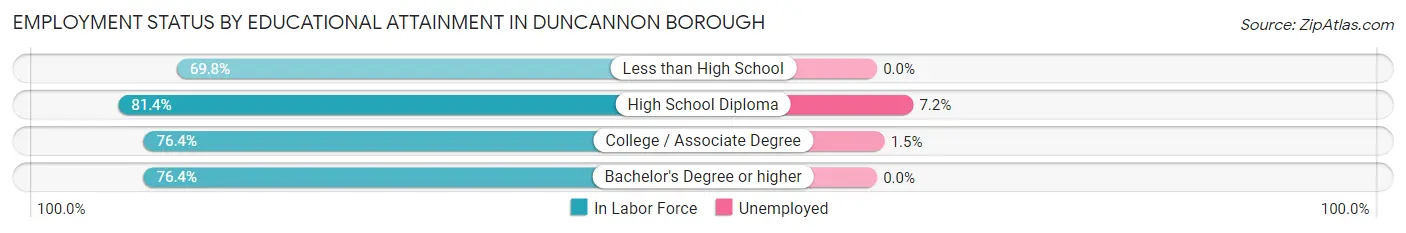
| Educational Attainment | In Labor Force | Unemployed |
| Less than High School | 30 (69.8%) | 0 (0.0%) |
| High School Diploma | 333 (81.4%) | 29 (7.2%) |
| College / Associate Degree | 198 (76.4%) | 4 (1.5%) |
| Bachelor's Degree or higher | 81 (76.4%) | 0 (0.0%) |
| Total | 642 (78.6%) | 34 (4.2%) |
Employment Occupations by Sex in Duncannon borough
Management, Business, Science and Arts Occupations
The most common Management, Business, Science and Arts occupations in Duncannon borough are Business & Financial (43 | 5.7%), Community & Social Service (43 | 5.7%), Management (31 | 4.1%), Computers, Engineering & Science (26 | 3.5%), and Computers & Mathematics (20 | 2.6%).
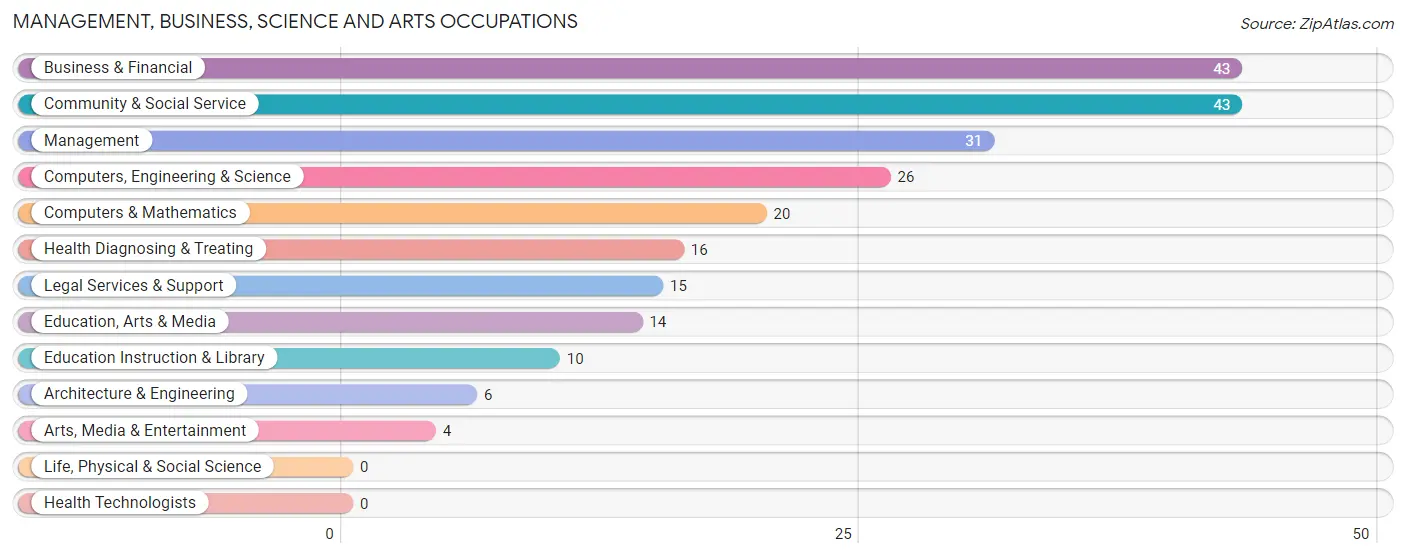
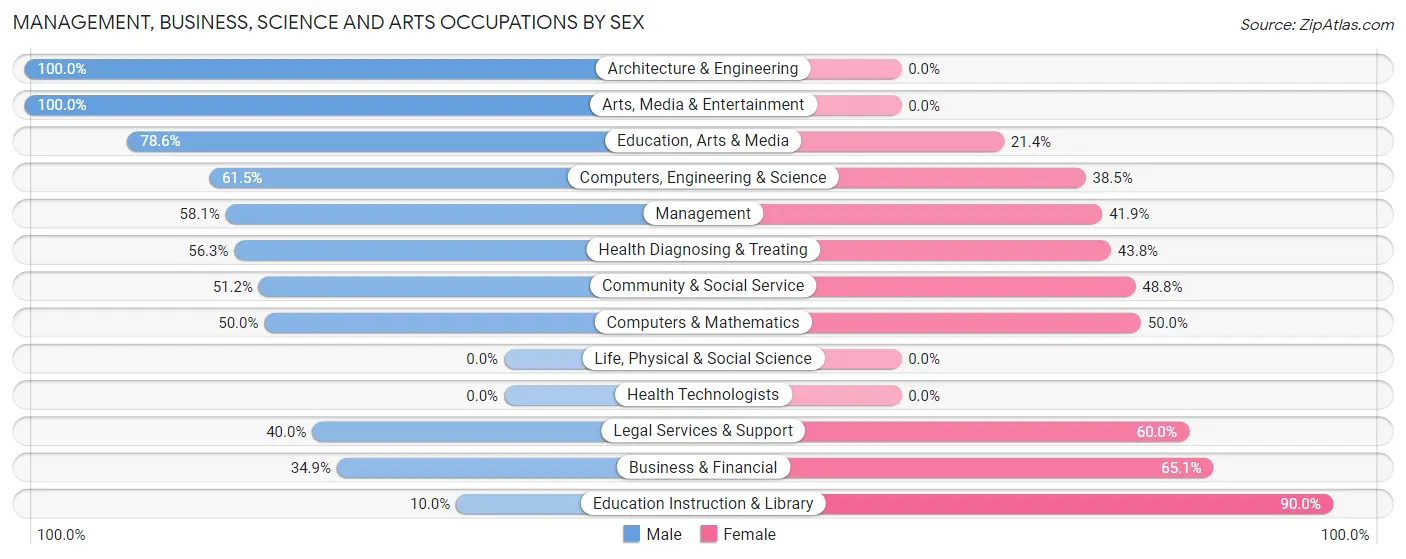
Management, Business, Science and Arts Occupations by Sex
Within the Management, Business, Science and Arts occupations in Duncannon borough, the most male-oriented occupations are Architecture & Engineering (100.0%), Arts, Media & Entertainment (100.0%), and Education, Arts & Media (78.6%), while the most female-oriented occupations are Education Instruction & Library (90.0%), Business & Financial (65.1%), and Legal Services & Support (60.0%).
| Occupation | Male | Female |
| Management | 18 (58.1%) | 13 (41.9%) |
| Business & Financial | 15 (34.9%) | 28 (65.1%) |
| Computers, Engineering & Science | 16 (61.5%) | 10 (38.5%) |
| Computers & Mathematics | 10 (50.0%) | 10 (50.0%) |
| Architecture & Engineering | 6 (100.0%) | 0 (0.0%) |
| Life, Physical & Social Science | 0 (0.0%) | 0 (0.0%) |
| Community & Social Service | 22 (51.2%) | 21 (48.8%) |
| Education, Arts & Media | 11 (78.6%) | 3 (21.4%) |
| Legal Services & Support | 6 (40.0%) | 9 (60.0%) |
| Education Instruction & Library | 1 (10.0%) | 9 (90.0%) |
| Arts, Media & Entertainment | 4 (100.0%) | 0 (0.0%) |
| Health Diagnosing & Treating | 9 (56.2%) | 7 (43.8%) |
| Health Technologists | 0 (0.0%) | 0 (0.0%) |
| Total (Category) | 80 (50.3%) | 79 (49.7%) |
| Total (Overall) | 428 (56.8%) | 326 (43.2%) |
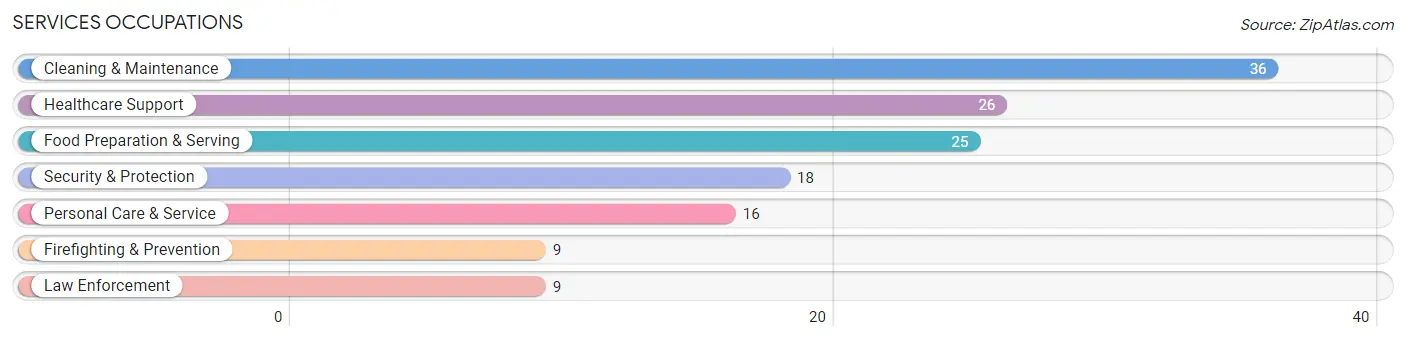
Services Occupations
The most common Services occupations in Duncannon borough are Cleaning & Maintenance (36 | 4.8%), Healthcare Support (26 | 3.5%), Food Preparation & Serving (25 | 3.3%), Security & Protection (18 | 2.4%), and Personal Care & Service (16 | 2.1%).
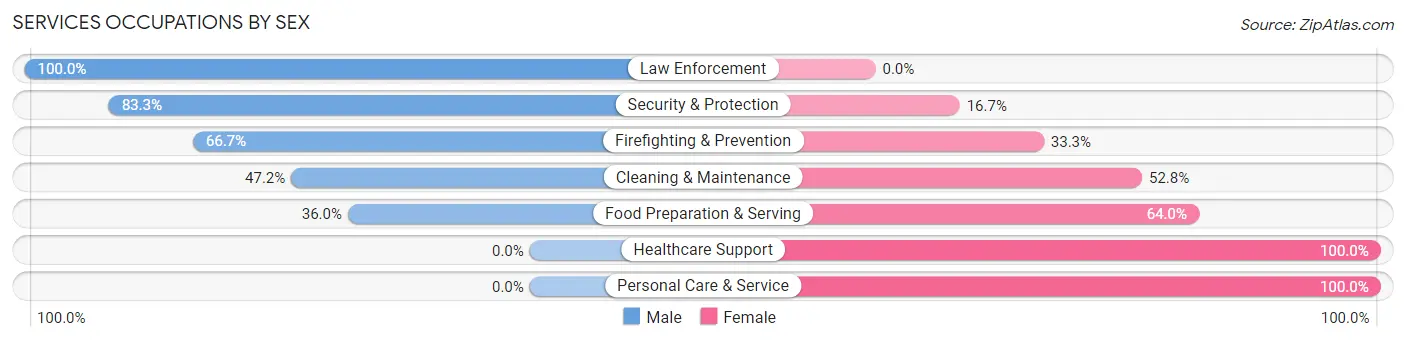
Services Occupations by Sex
Within the Services occupations in Duncannon borough, the most male-oriented occupations are Law Enforcement (100.0%), Security & Protection (83.3%), and Firefighting & Prevention (66.7%), while the most female-oriented occupations are Healthcare Support (100.0%), Personal Care & Service (100.0%), and Food Preparation & Serving (64.0%).
| Occupation | Male | Female |
| Healthcare Support | 0 (0.0%) | 26 (100.0%) |
| Security & Protection | 15 (83.3%) | 3 (16.7%) |
| Firefighting & Prevention | 6 (66.7%) | 3 (33.3%) |
| Law Enforcement | 9 (100.0%) | 0 (0.0%) |
| Food Preparation & Serving | 9 (36.0%) | 16 (64.0%) |
| Cleaning & Maintenance | 17 (47.2%) | 19 (52.8%) |
| Personal Care & Service | 0 (0.0%) | 16 (100.0%) |
| Total (Category) | 41 (33.9%) | 80 (66.1%) |
| Total (Overall) | 428 (56.8%) | 326 (43.2%) |
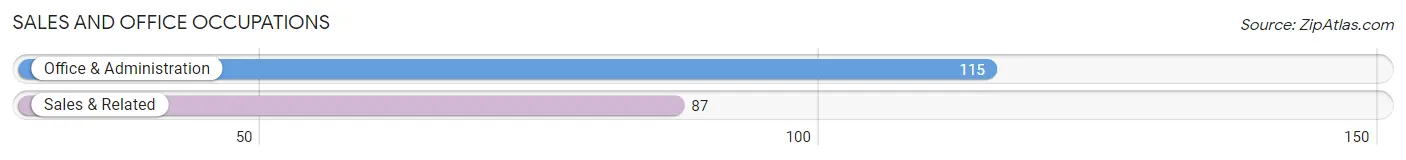
Sales and Office Occupations
The most common Sales and Office occupations in Duncannon borough are Office & Administration (115 | 15.2%), and Sales & Related (87 | 11.5%).
Sales and Office Occupations by Sex
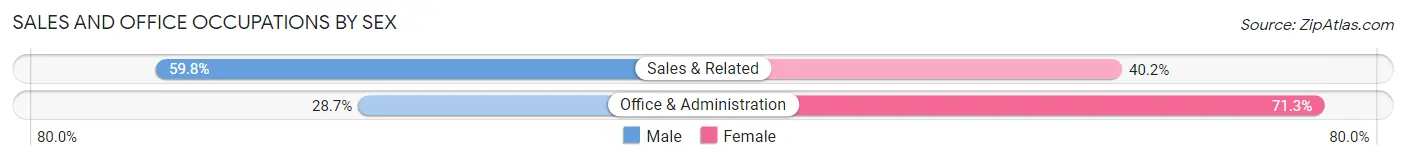
| Occupation | Male | Female |
| Sales & Related | 52 (59.8%) | 35 (40.2%) |
| Office & Administration | 33 (28.7%) | 82 (71.3%) |
| Total (Category) | 85 (42.1%) | 117 (57.9%) |
| Total (Overall) | 428 (56.8%) | 326 (43.2%) |
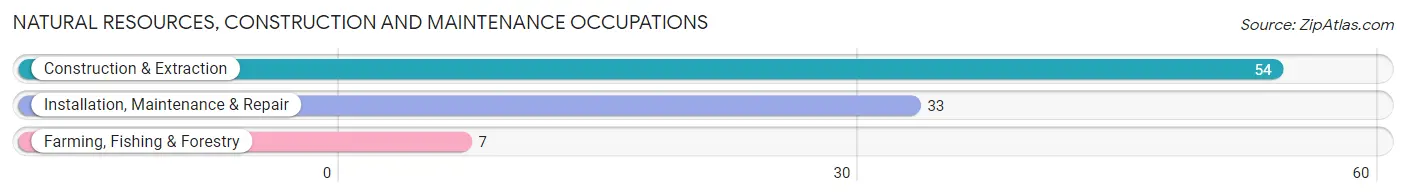
Natural Resources, Construction and Maintenance Occupations
The most common Natural Resources, Construction and Maintenance occupations in Duncannon borough are Construction & Extraction (54 | 7.2%), Installation, Maintenance & Repair (33 | 4.4%), and Farming, Fishing & Forestry (7 | 0.9%).
Natural Resources, Construction and Maintenance Occupations by Sex
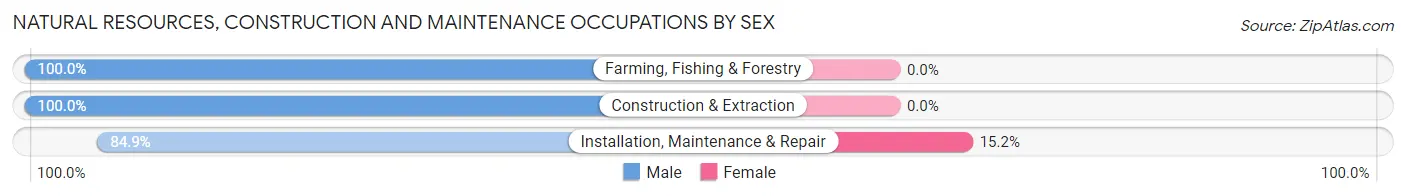
| Occupation | Male | Female |
| Farming, Fishing & Forestry | 7 (100.0%) | 0 (0.0%) |
| Construction & Extraction | 54 (100.0%) | 0 (0.0%) |
| Installation, Maintenance & Repair | 28 (84.9%) | 5 (15.1%) |
| Total (Category) | 89 (94.7%) | 5 (5.3%) |
| Total (Overall) | 428 (56.8%) | 326 (43.2%) |
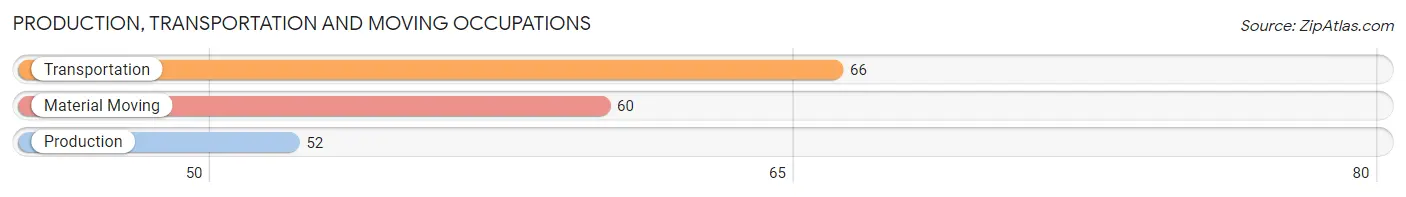
Production, Transportation and Moving Occupations
The most common Production, Transportation and Moving occupations in Duncannon borough are Transportation (66 | 8.7%), Material Moving (60 | 8.0%), and Production (52 | 6.9%).
Production, Transportation and Moving Occupations by Sex
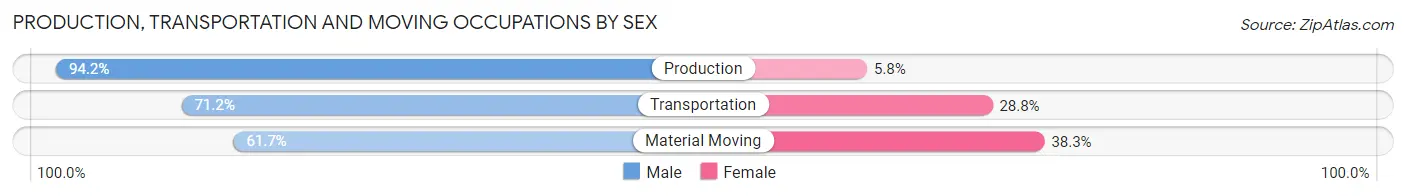
| Occupation | Male | Female |
| Production | 49 (94.2%) | 3 (5.8%) |
| Transportation | 47 (71.2%) | 19 (28.8%) |
| Material Moving | 37 (61.7%) | 23 (38.3%) |
| Total (Category) | 133 (74.7%) | 45 (25.3%) |
| Total (Overall) | 428 (56.8%) | 326 (43.2%) |
Employment Industries by Sex in Duncannon borough
Employment Industries in Duncannon borough
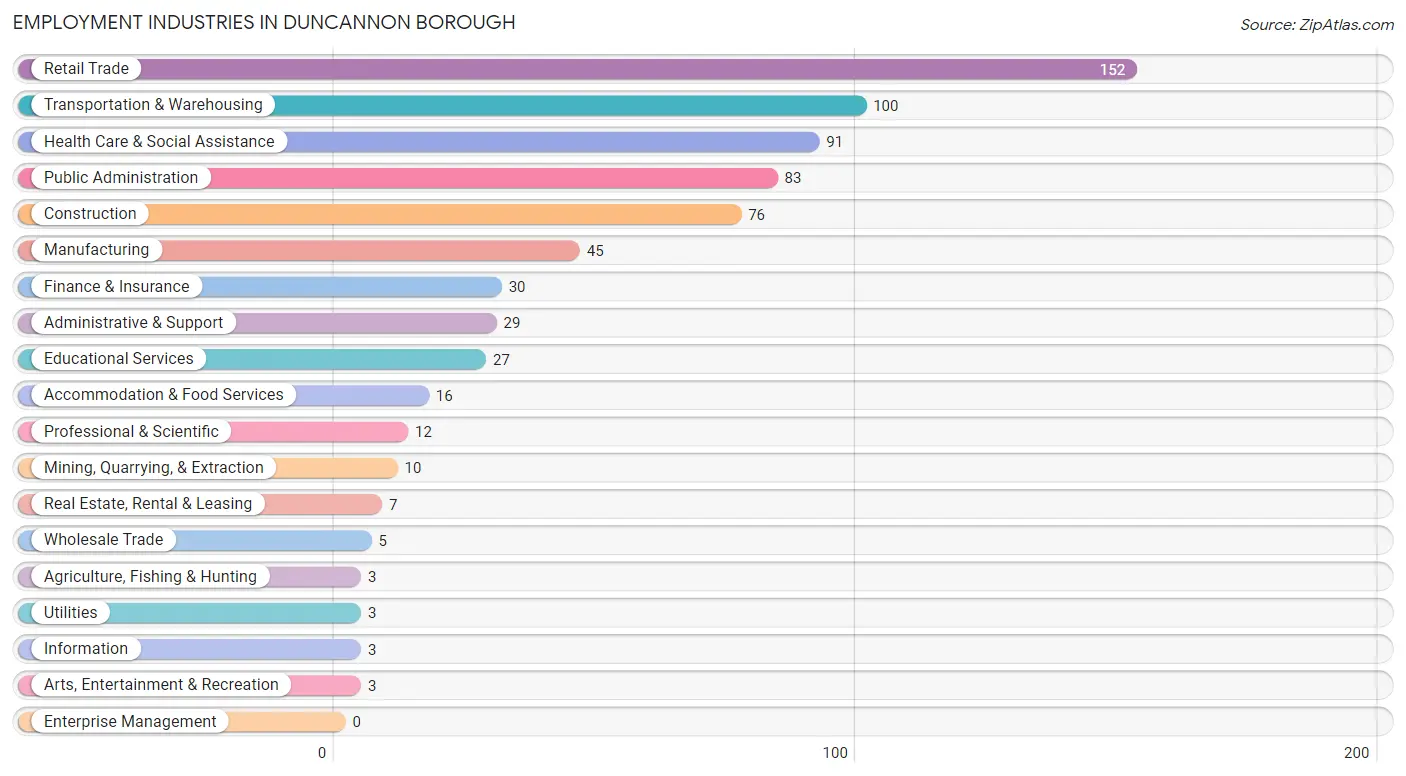
The major employment industries in Duncannon borough include Retail Trade (152 | 20.2%), Transportation & Warehousing (100 | 13.3%), Health Care & Social Assistance (91 | 12.1%), Public Administration (83 | 11.0%), and Construction (76 | 10.1%).
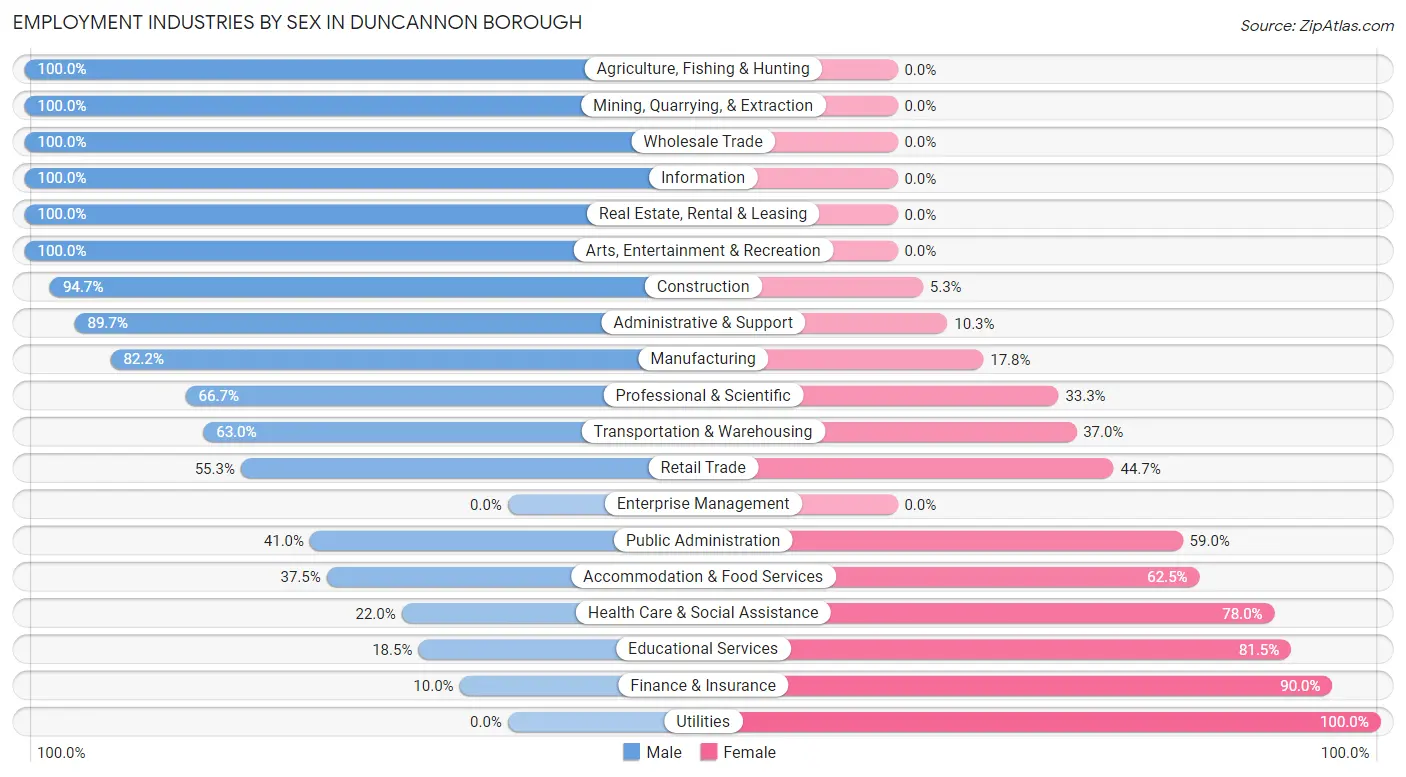
Employment Industries by Sex in Duncannon borough
The Duncannon borough industries that see more men than women are Agriculture, Fishing & Hunting (100.0%), Mining, Quarrying, & Extraction (100.0%), and Wholesale Trade (100.0%), whereas the industries that tend to have a higher number of women are Utilities (100.0%), Finance & Insurance (90.0%), and Educational Services (81.5%).
| Industry | Male | Female |
| Agriculture, Fishing & Hunting | 3 (100.0%) | 0 (0.0%) |
| Mining, Quarrying, & Extraction | 10 (100.0%) | 0 (0.0%) |
| Construction | 72 (94.7%) | 4 (5.3%) |
| Manufacturing | 37 (82.2%) | 8 (17.8%) |
| Wholesale Trade | 5 (100.0%) | 0 (0.0%) |
| Retail Trade | 84 (55.3%) | 68 (44.7%) |
| Transportation & Warehousing | 63 (63.0%) | 37 (37.0%) |
| Utilities | 0 (0.0%) | 3 (100.0%) |
| Information | 3 (100.0%) | 0 (0.0%) |
| Finance & Insurance | 3 (10.0%) | 27 (90.0%) |
| Real Estate, Rental & Leasing | 7 (100.0%) | 0 (0.0%) |
| Professional & Scientific | 8 (66.7%) | 4 (33.3%) |
| Enterprise Management | 0 (0.0%) | 0 (0.0%) |
| Administrative & Support | 26 (89.7%) | 3 (10.3%) |
| Educational Services | 5 (18.5%) | 22 (81.5%) |
| Health Care & Social Assistance | 20 (22.0%) | 71 (78.0%) |
| Arts, Entertainment & Recreation | 3 (100.0%) | 0 (0.0%) |
| Accommodation & Food Services | 6 (37.5%) | 10 (62.5%) |
| Public Administration | 34 (41.0%) | 49 (59.0%) |
| Total | 428 (56.8%) | 326 (43.2%) |
Education in Duncannon borough
School Enrollment in Duncannon borough
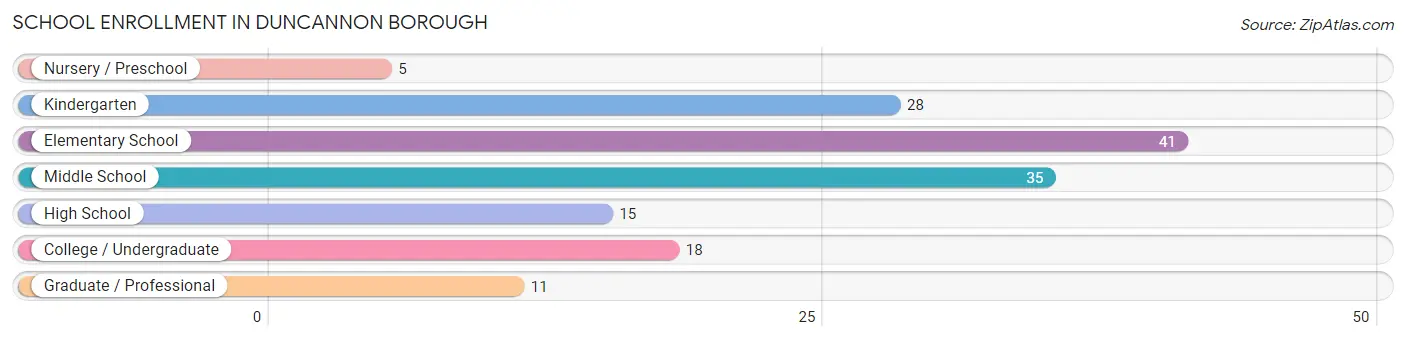
The most common levels of schooling among the 153 students in Duncannon borough are elementary school (41 | 26.8%), middle school (35 | 22.9%), and kindergarten (28 | 18.3%).
| School Level | # Students | % Students |
| Nursery / Preschool | 5 | 3.3% |
| Kindergarten | 28 | 18.3% |
| Elementary School | 41 | 26.8% |
| Middle School | 35 | 22.9% |
| High School | 15 | 9.8% |
| College / Undergraduate | 18 | 11.8% |
| Graduate / Professional | 11 | 7.2% |
| Total | 153 | 100.0% |
School Enrollment by Age by Funding Source in Duncannon borough
Out of a total of 153 students who are enrolled in schools in Duncannon borough, 22 (14.4%) attend a private institution, while the remaining 131 (85.6%) are enrolled in public schools. The age group of 35 years and over has the highest likelihood of being enrolled in private schools, with 12 (92.3% in the age bracket) enrolled. Conversely, the age group of 3 to 4 year olds has the lowest likelihood of being enrolled in a private school, with 3 (100.0% in the age bracket) attending a public institution.
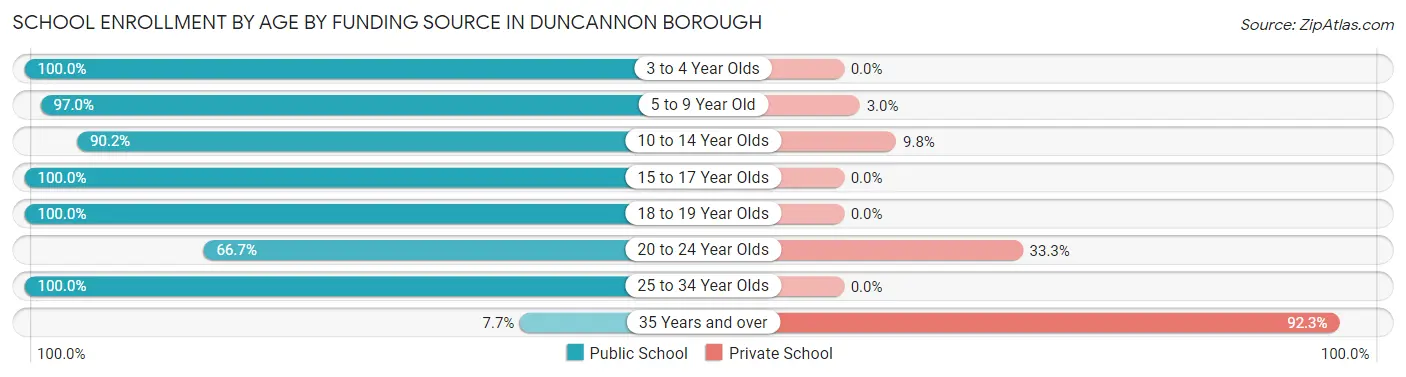
| Age Bracket | Public School | Private School |
| 3 to 4 Year Olds | 3 (100.0%) | 0 (0.0%) |
| 5 to 9 Year Old | 65 (97.0%) | 2 (3.0%) |
| 10 to 14 Year Olds | 37 (90.2%) | 4 (9.8%) |
| 15 to 17 Year Olds | 6 (100.0%) | 0 (0.0%) |
| 18 to 19 Year Olds | 6 (100.0%) | 0 (0.0%) |
| 20 to 24 Year Olds | 8 (66.7%) | 4 (33.3%) |
| 25 to 34 Year Olds | 5 (100.0%) | 0 (0.0%) |
| 35 Years and over | 1 (7.7%) | 12 (92.3%) |
| Total | 131 (85.6%) | 22 (14.4%) |
Educational Attainment by Field of Study in Duncannon borough
Education (27 | 18.6%), arts & humanities (24 | 16.6%), computers & mathematics (19 | 13.1%), psychology (19 | 13.1%), and engineering (13 | 9.0%) are the most common fields of study among 145 individuals in Duncannon borough who have obtained a bachelor's degree or higher.
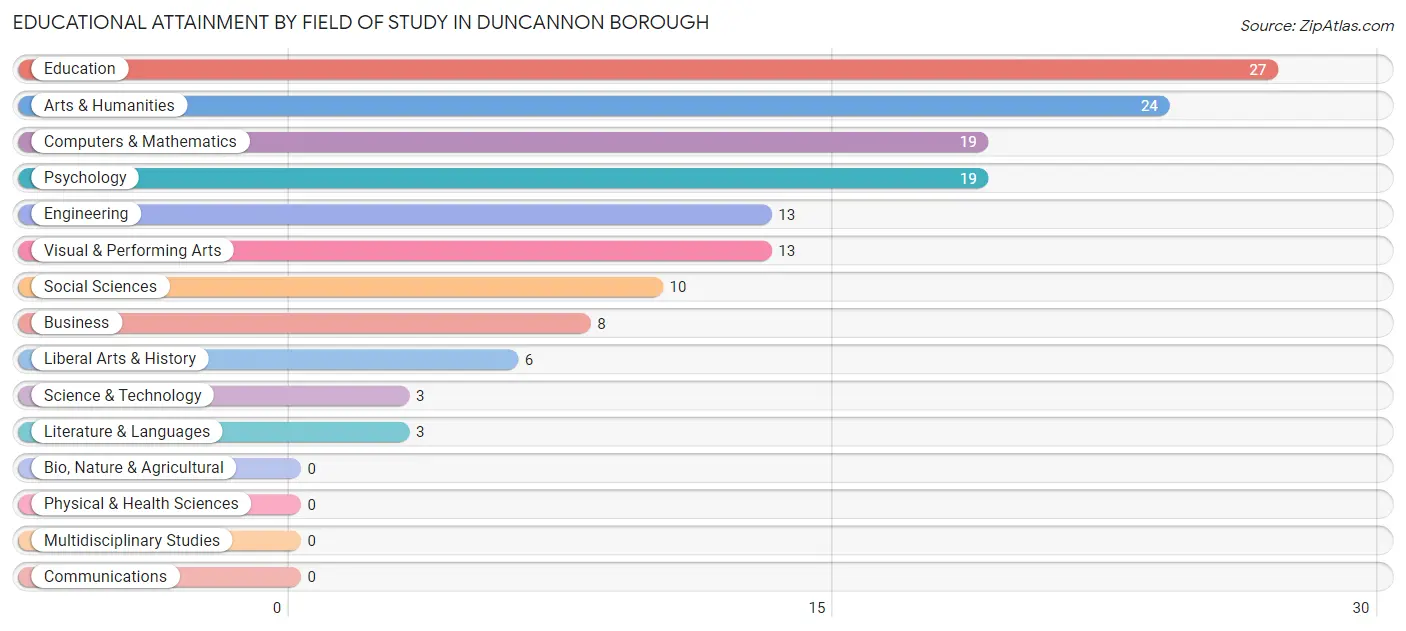
| Field of Study | # Graduates | % Graduates |
| Computers & Mathematics | 19 | 13.1% |
| Bio, Nature & Agricultural | 0 | 0.0% |
| Physical & Health Sciences | 0 | 0.0% |
| Psychology | 19 | 13.1% |
| Social Sciences | 10 | 6.9% |
| Engineering | 13 | 9.0% |
| Multidisciplinary Studies | 0 | 0.0% |
| Science & Technology | 3 | 2.1% |
| Business | 8 | 5.5% |
| Education | 27 | 18.6% |
| Literature & Languages | 3 | 2.1% |
| Liberal Arts & History | 6 | 4.1% |
| Visual & Performing Arts | 13 | 9.0% |
| Communications | 0 | 0.0% |
| Arts & Humanities | 24 | 16.6% |
| Total | 145 | 100.0% |
Transportation & Commute in Duncannon borough
Vehicle Availability by Sex in Duncannon borough
The most prevalent vehicle ownership categories in Duncannon borough are males with 2 vehicles (140, accounting for 34.2%) and females with 2 vehicles (103, making up 43.3%).
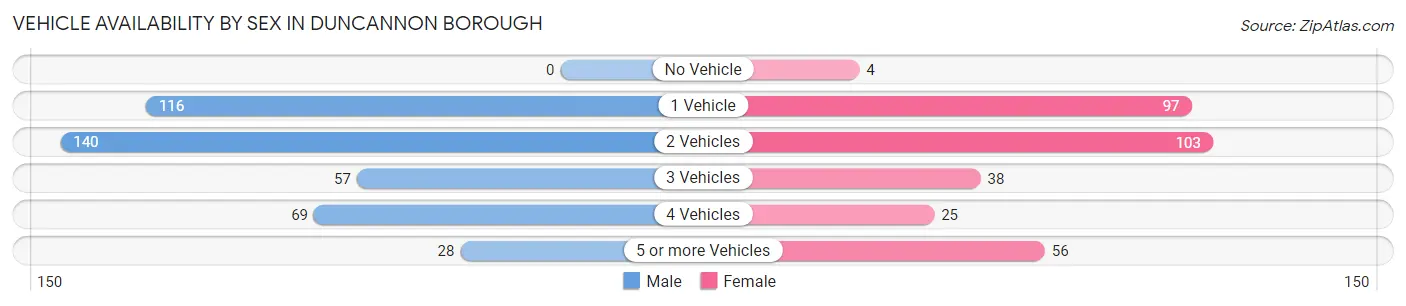
| Vehicles Available | Male | Female |
| No Vehicle | 0 (0.0%) | 4 (1.2%) |
| 1 Vehicle | 116 (28.3%) | 97 (30.0%) |
| 2 Vehicles | 140 (34.2%) | 103 (31.9%) |
| 3 Vehicles | 57 (13.9%) | 38 (11.8%) |
| 4 Vehicles | 69 (16.8%) | 25 (7.7%) |
| 5 or more Vehicles | 28 (6.8%) | 56 (17.3%) |
| Total | 410 (100.0%) | 323 (100.0%) |
Commute Time in Duncannon borough
The most frequently occuring commute durations in Duncannon borough are 30 to 34 minutes (232 commuters, 34.1%), 25 to 29 minutes (133 commuters, 19.5%), and 5 to 9 minutes (61 commuters, 9.0%).
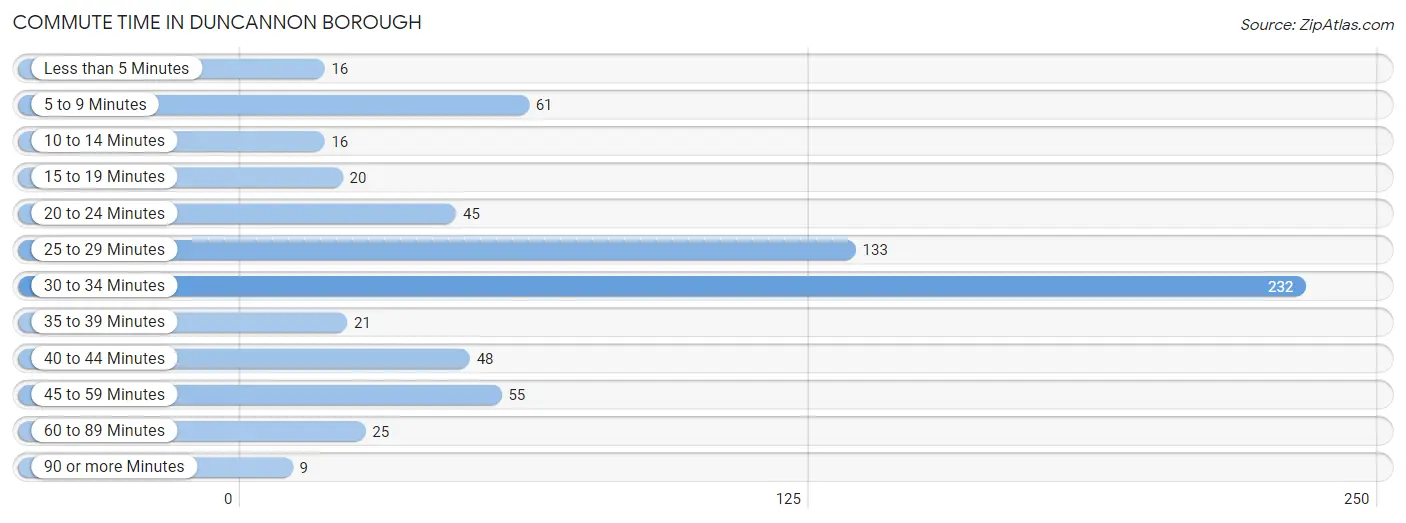
| Commute Time | # Commuters | % Commuters |
| Less than 5 Minutes | 16 | 2.4% |
| 5 to 9 Minutes | 61 | 9.0% |
| 10 to 14 Minutes | 16 | 2.4% |
| 15 to 19 Minutes | 20 | 2.9% |
| 20 to 24 Minutes | 45 | 6.6% |
| 25 to 29 Minutes | 133 | 19.5% |
| 30 to 34 Minutes | 232 | 34.1% |
| 35 to 39 Minutes | 21 | 3.1% |
| 40 to 44 Minutes | 48 | 7.0% |
| 45 to 59 Minutes | 55 | 8.1% |
| 60 to 89 Minutes | 25 | 3.7% |
| 90 or more Minutes | 9 | 1.3% |
Commute Time by Sex in Duncannon borough
The most common commute times in Duncannon borough are 30 to 34 minutes (131 commuters, 34.6%) for males and 30 to 34 minutes (101 commuters, 33.4%) for females.
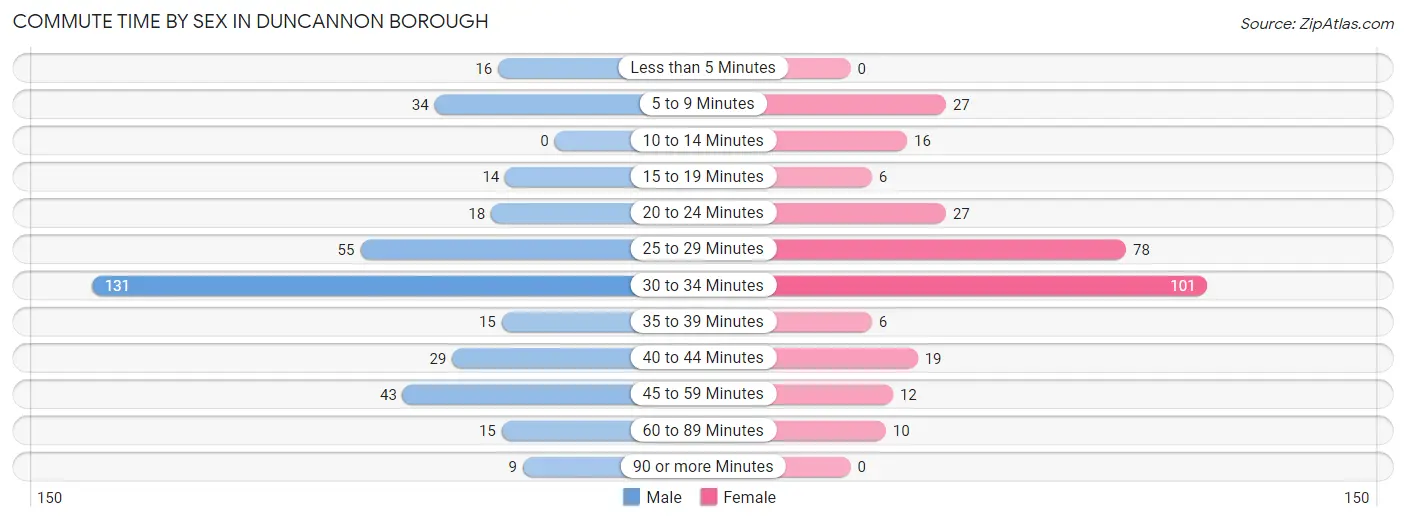
| Commute Time | Male | Female |
| Less than 5 Minutes | 16 (4.2%) | 0 (0.0%) |
| 5 to 9 Minutes | 34 (9.0%) | 27 (8.9%) |
| 10 to 14 Minutes | 0 (0.0%) | 16 (5.3%) |
| 15 to 19 Minutes | 14 (3.7%) | 6 (2.0%) |
| 20 to 24 Minutes | 18 (4.8%) | 27 (8.9%) |
| 25 to 29 Minutes | 55 (14.5%) | 78 (25.8%) |
| 30 to 34 Minutes | 131 (34.6%) | 101 (33.4%) |
| 35 to 39 Minutes | 15 (4.0%) | 6 (2.0%) |
| 40 to 44 Minutes | 29 (7.6%) | 19 (6.3%) |
| 45 to 59 Minutes | 43 (11.4%) | 12 (4.0%) |
| 60 to 89 Minutes | 15 (4.0%) | 10 (3.3%) |
| 90 or more Minutes | 9 (2.4%) | 0 (0.0%) |
Time of Departure to Work by Sex in Duncannon borough
The most frequent times of departure to work in Duncannon borough are 6:00 AM to 6:29 AM (77, 20.3%) for males and 6:30 AM to 6:59 AM (40, 13.3%) for females.
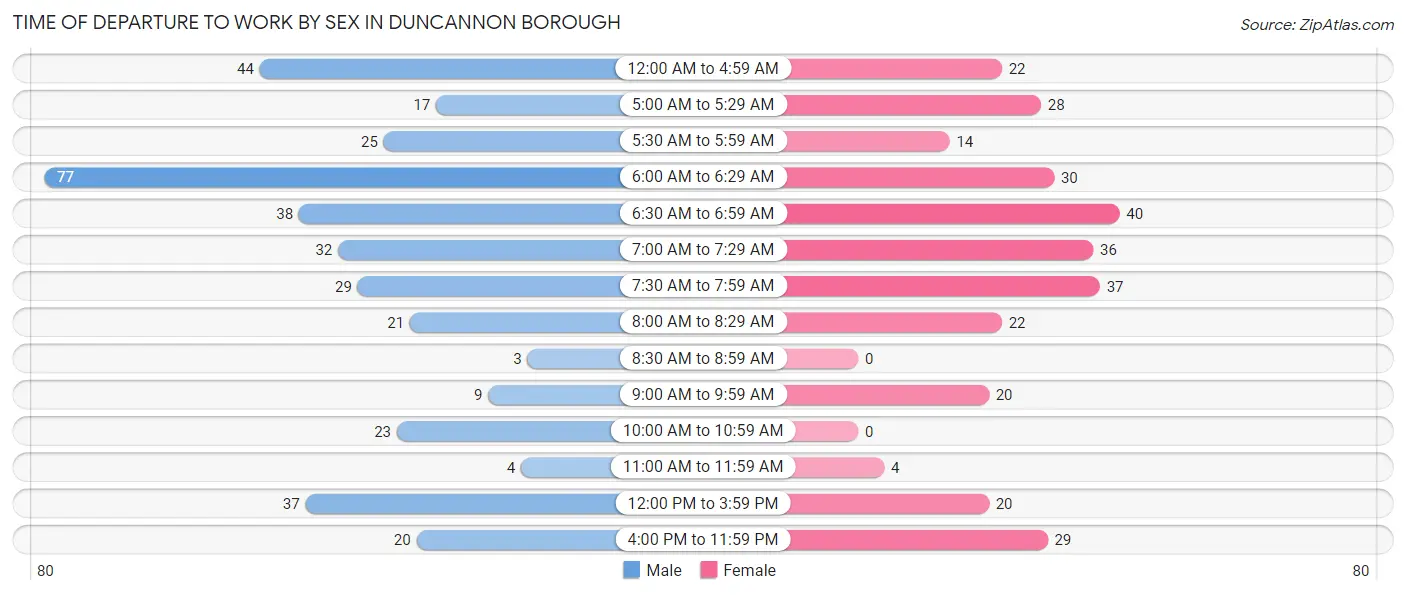
| Time of Departure | Male | Female |
| 12:00 AM to 4:59 AM | 44 (11.6%) | 22 (7.3%) |
| 5:00 AM to 5:29 AM | 17 (4.5%) | 28 (9.3%) |
| 5:30 AM to 5:59 AM | 25 (6.6%) | 14 (4.6%) |
| 6:00 AM to 6:29 AM | 77 (20.3%) | 30 (9.9%) |
| 6:30 AM to 6:59 AM | 38 (10.0%) | 40 (13.3%) |
| 7:00 AM to 7:29 AM | 32 (8.4%) | 36 (11.9%) |
| 7:30 AM to 7:59 AM | 29 (7.6%) | 37 (12.2%) |
| 8:00 AM to 8:29 AM | 21 (5.5%) | 22 (7.3%) |
| 8:30 AM to 8:59 AM | 3 (0.8%) | 0 (0.0%) |
| 9:00 AM to 9:59 AM | 9 (2.4%) | 20 (6.6%) |
| 10:00 AM to 10:59 AM | 23 (6.1%) | 0 (0.0%) |
| 11:00 AM to 11:59 AM | 4 (1.1%) | 4 (1.3%) |
| 12:00 PM to 3:59 PM | 37 (9.8%) | 20 (6.6%) |
| 4:00 PM to 11:59 PM | 20 (5.3%) | 29 (9.6%) |
| Total | 379 (100.0%) | 302 (100.0%) |
Housing Occupancy in Duncannon borough
Occupancy by Ownership in Duncannon borough
Of the total 632 dwellings in Duncannon borough, owner-occupied units account for 320 (50.6%), while renter-occupied units make up 312 (49.4%).
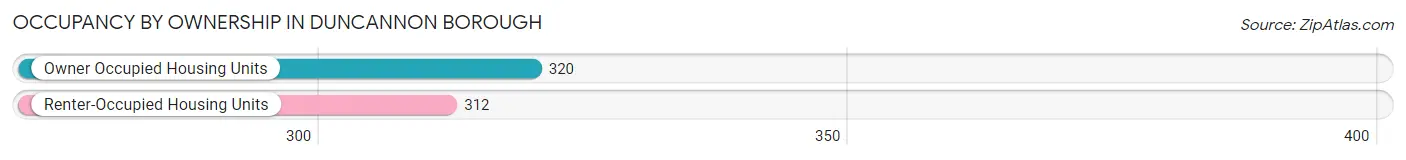
| Occupancy | # Housing Units | % Housing Units |
| Owner Occupied Housing Units | 320 | 50.6% |
| Renter-Occupied Housing Units | 312 | 49.4% |
| Total Occupied Housing Units | 632 | 100.0% |
Occupancy by Household Size in Duncannon borough
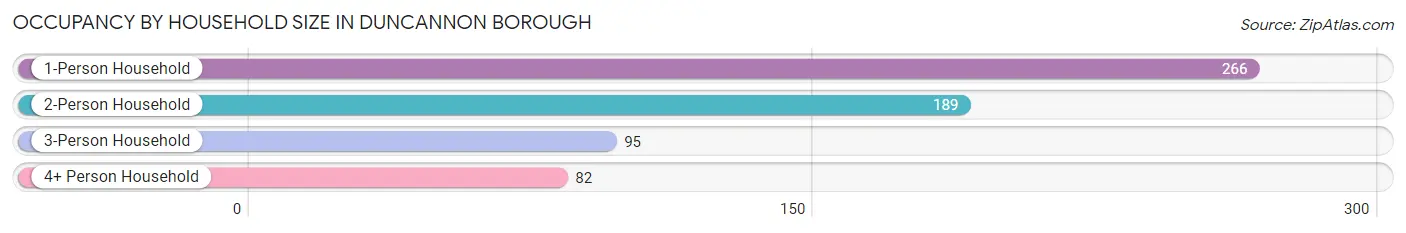
| Household Size | # Housing Units | % Housing Units |
| 1-Person Household | 266 | 42.1% |
| 2-Person Household | 189 | 29.9% |
| 3-Person Household | 95 | 15.0% |
| 4+ Person Household | 82 | 13.0% |
| Total Housing Units | 632 | 100.0% |
Occupancy by Ownership by Household Size in Duncannon borough
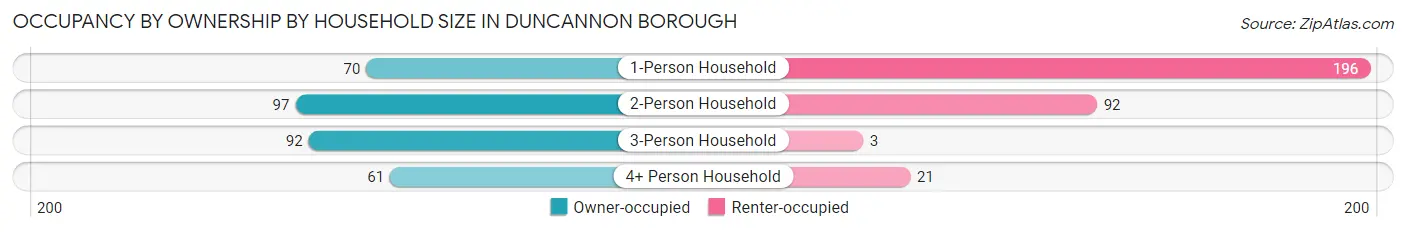
| Household Size | Owner-occupied | Renter-occupied |
| 1-Person Household | 70 (26.3%) | 196 (73.7%) |
| 2-Person Household | 97 (51.3%) | 92 (48.7%) |
| 3-Person Household | 92 (96.8%) | 3 (3.2%) |
| 4+ Person Household | 61 (74.4%) | 21 (25.6%) |
| Total Housing Units | 320 (50.6%) | 312 (49.4%) |
Occupancy by Educational Attainment in Duncannon borough
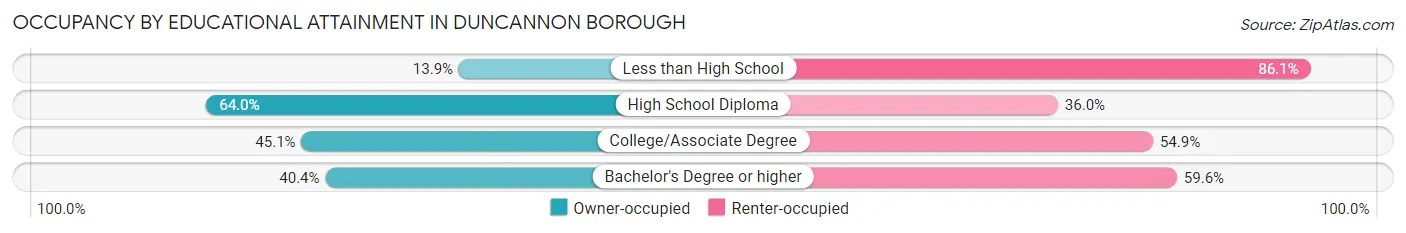
| Household Size | Owner-occupied | Renter-occupied |
| Less than High School | 5 (13.9%) | 31 (86.1%) |
| High School Diploma | 174 (64.0%) | 98 (36.0%) |
| College/Associate Degree | 97 (45.1%) | 118 (54.9%) |
| Bachelor's Degree or higher | 44 (40.4%) | 65 (59.6%) |
Occupancy by Age of Householder in Duncannon borough
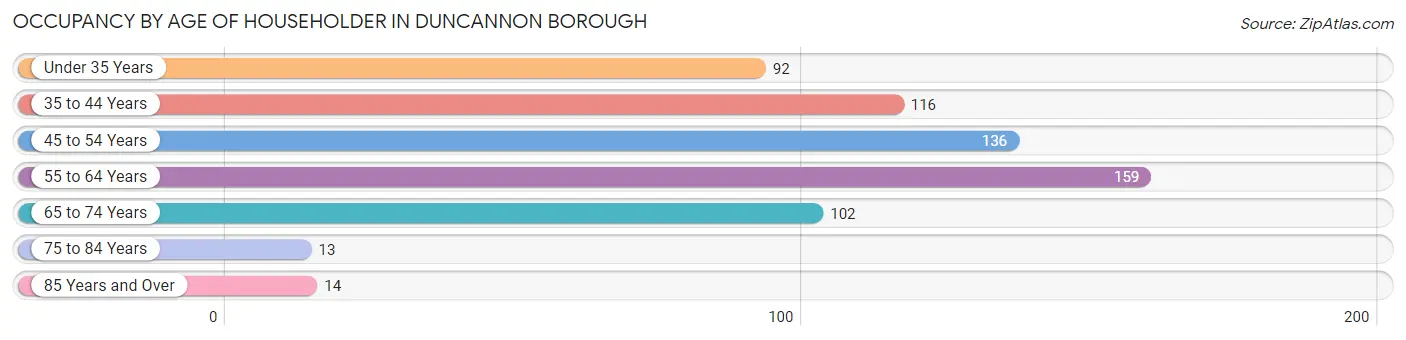
| Age Bracket | # Households | % Households |
| Under 35 Years | 92 | 14.6% |
| 35 to 44 Years | 116 | 18.3% |
| 45 to 54 Years | 136 | 21.5% |
| 55 to 64 Years | 159 | 25.2% |
| 65 to 74 Years | 102 | 16.1% |
| 75 to 84 Years | 13 | 2.1% |
| 85 Years and Over | 14 | 2.2% |
| Total | 632 | 100.0% |
Housing Finances in Duncannon borough
Median Income by Occupancy in Duncannon borough
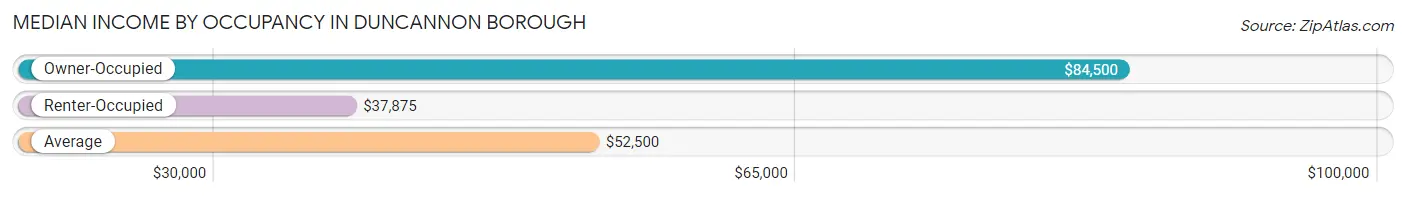
| Occupancy Type | # Households | Median Income |
| Owner-Occupied | 320 (50.6%) | $84,500 |
| Renter-Occupied | 312 (49.4%) | $37,875 |
| Average | 632 (100.0%) | $52,500 |
Occupancy by Householder Income Bracket in Duncannon borough
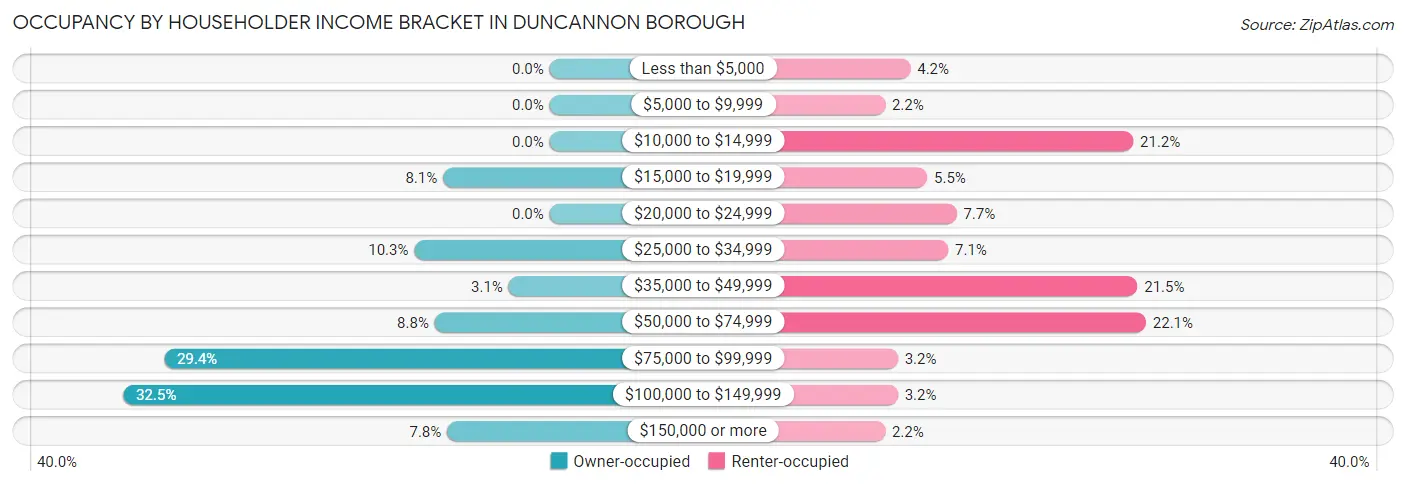
| Income Bracket | Owner-occupied | Renter-occupied |
| Less than $5,000 | 0 (0.0%) | 13 (4.2%) |
| $5,000 to $9,999 | 0 (0.0%) | 7 (2.2%) |
| $10,000 to $14,999 | 0 (0.0%) | 66 (21.1%) |
| $15,000 to $19,999 | 26 (8.1%) | 17 (5.4%) |
| $20,000 to $24,999 | 0 (0.0%) | 24 (7.7%) |
| $25,000 to $34,999 | 33 (10.3%) | 22 (7.0%) |
| $35,000 to $49,999 | 10 (3.1%) | 67 (21.5%) |
| $50,000 to $74,999 | 28 (8.7%) | 69 (22.1%) |
| $75,000 to $99,999 | 94 (29.4%) | 10 (3.2%) |
| $100,000 to $149,999 | 104 (32.5%) | 10 (3.2%) |
| $150,000 or more | 25 (7.8%) | 7 (2.2%) |
| Total | 320 (100.0%) | 312 (100.0%) |
Monthly Housing Cost Tiers in Duncannon borough
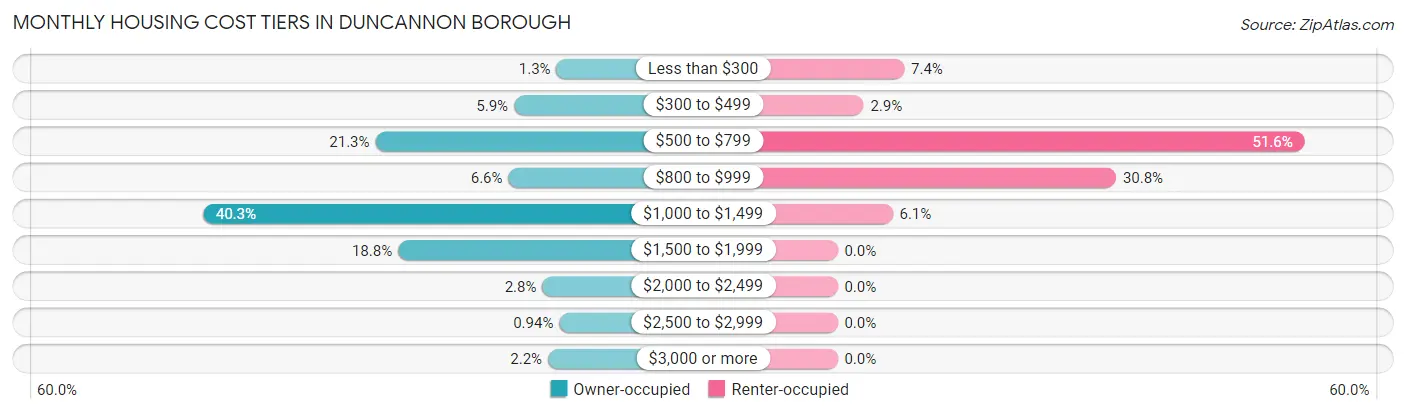
| Monthly Cost | Owner-occupied | Renter-occupied |
| Less than $300 | 4 (1.3%) | 23 (7.4%) |
| $300 to $499 | 19 (5.9%) | 9 (2.9%) |
| $500 to $799 | 68 (21.2%) | 161 (51.6%) |
| $800 to $999 | 21 (6.6%) | 96 (30.8%) |
| $1,000 to $1,499 | 129 (40.3%) | 19 (6.1%) |
| $1,500 to $1,999 | 60 (18.8%) | 0 (0.0%) |
| $2,000 to $2,499 | 9 (2.8%) | 0 (0.0%) |
| $2,500 to $2,999 | 3 (0.9%) | 0 (0.0%) |
| $3,000 or more | 7 (2.2%) | 0 (0.0%) |
| Total | 320 (100.0%) | 312 (100.0%) |
Physical Housing Characteristics in Duncannon borough
Housing Structures in Duncannon borough
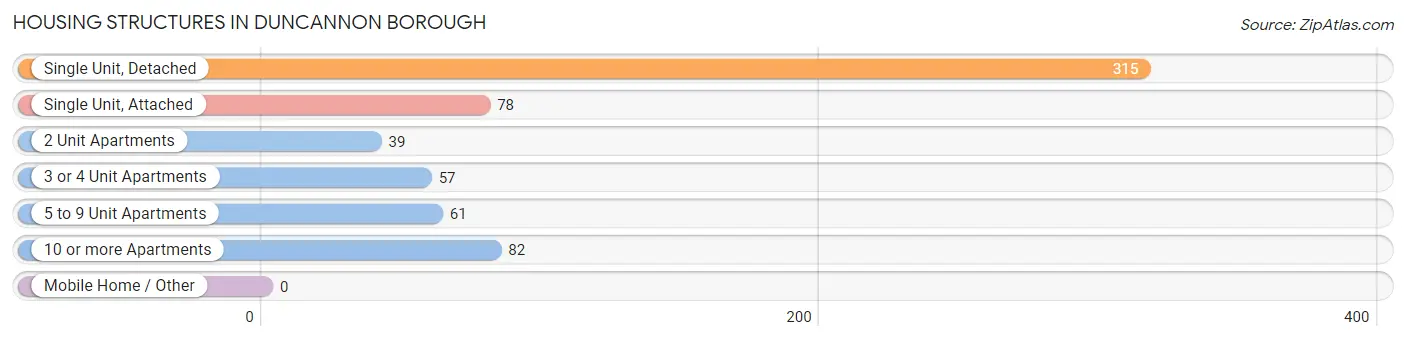
| Structure Type | # Housing Units | % Housing Units |
| Single Unit, Detached | 315 | 49.8% |
| Single Unit, Attached | 78 | 12.3% |
| 2 Unit Apartments | 39 | 6.2% |
| 3 or 4 Unit Apartments | 57 | 9.0% |
| 5 to 9 Unit Apartments | 61 | 9.7% |
| 10 or more Apartments | 82 | 13.0% |
| Mobile Home / Other | 0 | 0.0% |
| Total | 632 | 100.0% |
Housing Structures by Occupancy in Duncannon borough
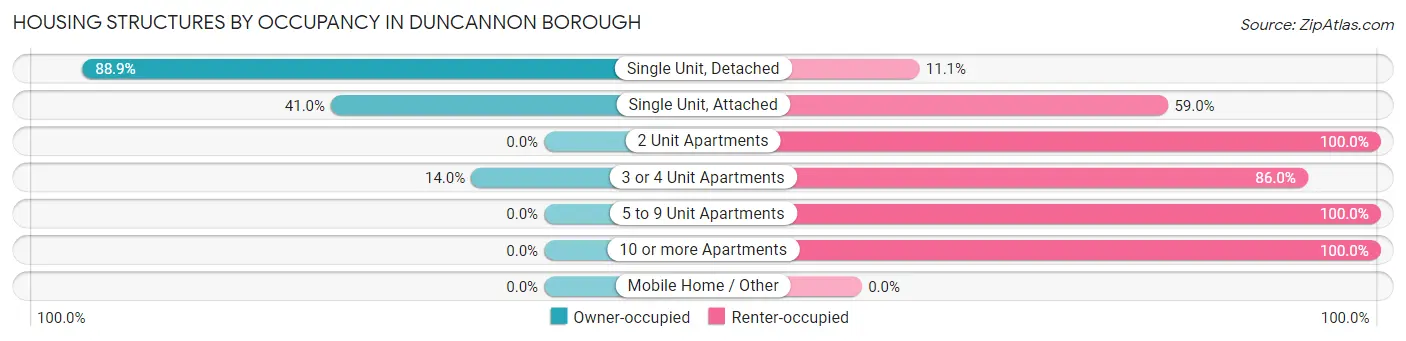
| Structure Type | Owner-occupied | Renter-occupied |
| Single Unit, Detached | 280 (88.9%) | 35 (11.1%) |
| Single Unit, Attached | 32 (41.0%) | 46 (59.0%) |
| 2 Unit Apartments | 0 (0.0%) | 39 (100.0%) |
| 3 or 4 Unit Apartments | 8 (14.0%) | 49 (86.0%) |
| 5 to 9 Unit Apartments | 0 (0.0%) | 61 (100.0%) |
| 10 or more Apartments | 0 (0.0%) | 82 (100.0%) |
| Mobile Home / Other | 0 (0.0%) | 0 (0.0%) |
| Total | 320 (50.6%) | 312 (49.4%) |
Housing Structures by Number of Rooms in Duncannon borough
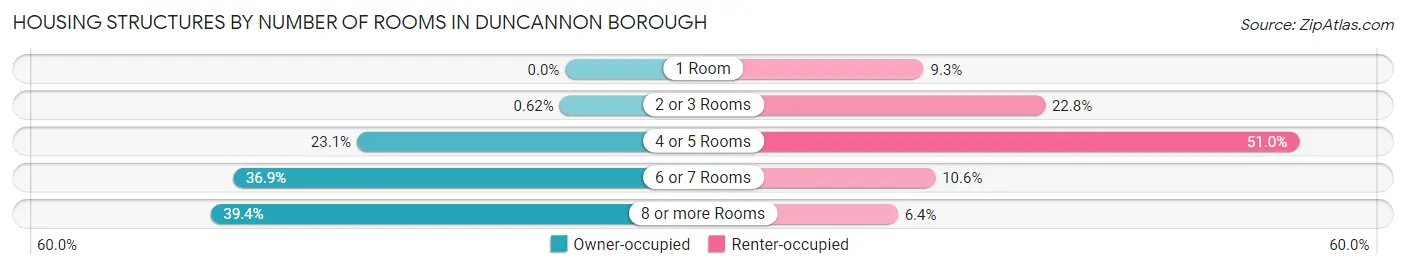
| Number of Rooms | Owner-occupied | Renter-occupied |
| 1 Room | 0 (0.0%) | 29 (9.3%) |
| 2 or 3 Rooms | 2 (0.6%) | 71 (22.8%) |
| 4 or 5 Rooms | 74 (23.1%) | 159 (51.0%) |
| 6 or 7 Rooms | 118 (36.9%) | 33 (10.6%) |
| 8 or more Rooms | 126 (39.4%) | 20 (6.4%) |
| Total | 320 (100.0%) | 312 (100.0%) |
Housing Structure by Heating Type in Duncannon borough
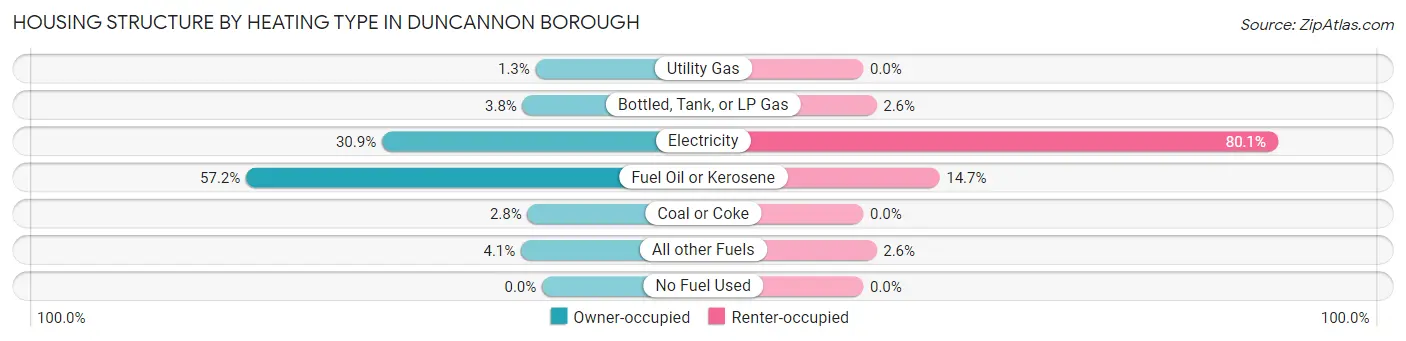
| Heating Type | Owner-occupied | Renter-occupied |
| Utility Gas | 4 (1.3%) | 0 (0.0%) |
| Bottled, Tank, or LP Gas | 12 (3.7%) | 8 (2.6%) |
| Electricity | 99 (30.9%) | 250 (80.1%) |
| Fuel Oil or Kerosene | 183 (57.2%) | 46 (14.7%) |
| Coal or Coke | 9 (2.8%) | 0 (0.0%) |
| All other Fuels | 13 (4.1%) | 8 (2.6%) |
| No Fuel Used | 0 (0.0%) | 0 (0.0%) |
| Total | 320 (100.0%) | 312 (100.0%) |
Household Vehicle Usage in Duncannon borough
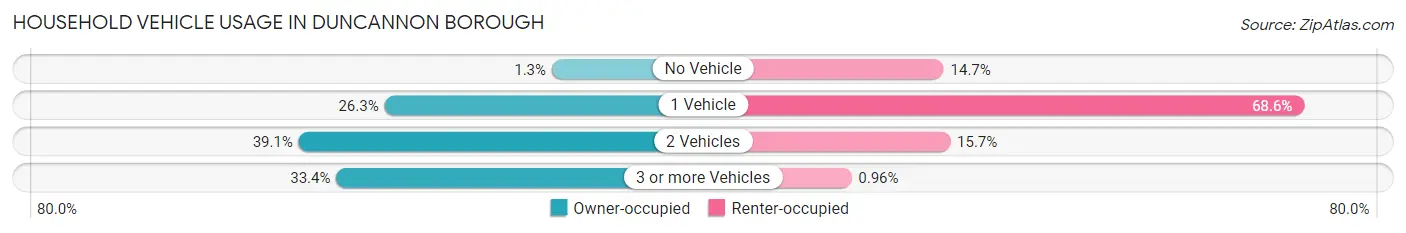
| Vehicles per Household | Owner-occupied | Renter-occupied |
| No Vehicle | 4 (1.3%) | 46 (14.7%) |
| 1 Vehicle | 84 (26.3%) | 214 (68.6%) |
| 2 Vehicles | 125 (39.1%) | 49 (15.7%) |
| 3 or more Vehicles | 107 (33.4%) | 3 (1.0%) |
| Total | 320 (100.0%) | 312 (100.0%) |
Real Estate & Mortgages in Duncannon borough
Real Estate and Mortgage Overview in Duncannon borough
| Characteristic | Without Mortgage | With Mortgage |
| Housing Units | 74 | 246 |
| Median Property Value | $93,300 | $139,600 |
| Median Household Income | $78,333 | $22 |
| Monthly Housing Costs | $600 | $7 |
| Real Estate Taxes | $2,107 | $4 |
Property Value by Mortgage Status in Duncannon borough
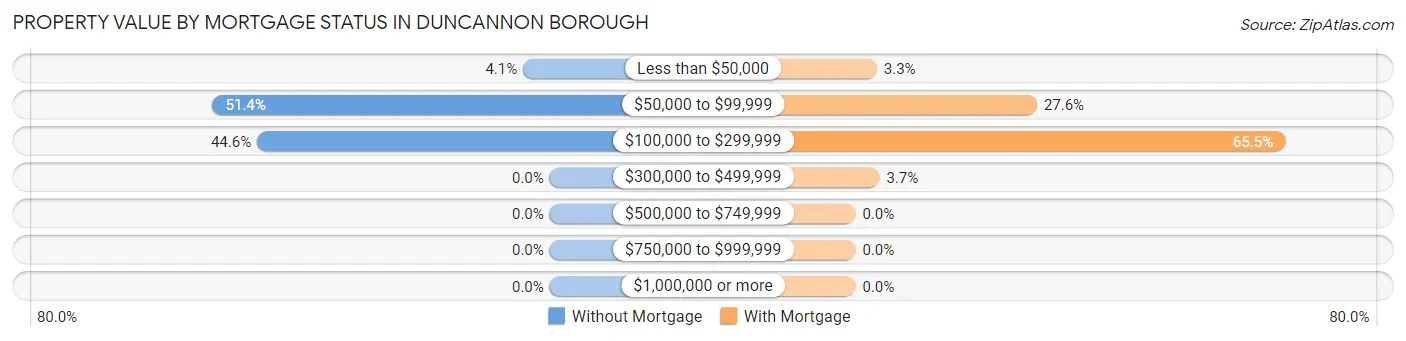
| Property Value | Without Mortgage | With Mortgage |
| Less than $50,000 | 3 (4.1%) | 8 (3.3%) |
| $50,000 to $99,999 | 38 (51.3%) | 68 (27.6%) |
| $100,000 to $299,999 | 33 (44.6%) | 161 (65.4%) |
| $300,000 to $499,999 | 0 (0.0%) | 9 (3.7%) |
| $500,000 to $749,999 | 0 (0.0%) | 0 (0.0%) |
| $750,000 to $999,999 | 0 (0.0%) | 0 (0.0%) |
| $1,000,000 or more | 0 (0.0%) | 0 (0.0%) |
| Total | 74 (100.0%) | 246 (100.0%) |
Household Income by Mortgage Status in Duncannon borough
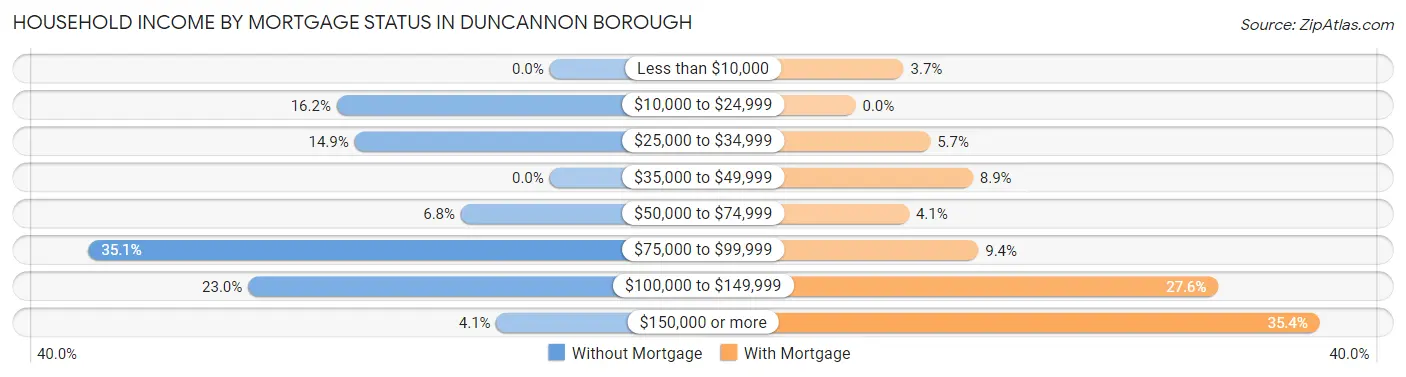
| Household Income | Without Mortgage | With Mortgage |
| Less than $10,000 | 0 (0.0%) | 9 (3.7%) |
| $10,000 to $24,999 | 12 (16.2%) | 0 (0.0%) |
| $25,000 to $34,999 | 11 (14.9%) | 14 (5.7%) |
| $35,000 to $49,999 | 0 (0.0%) | 22 (8.9%) |
| $50,000 to $74,999 | 5 (6.8%) | 10 (4.1%) |
| $75,000 to $99,999 | 26 (35.1%) | 23 (9.3%) |
| $100,000 to $149,999 | 17 (23.0%) | 68 (27.6%) |
| $150,000 or more | 3 (4.1%) | 87 (35.4%) |
| Total | 74 (100.0%) | 246 (100.0%) |
Property Value to Household Income Ratio in Duncannon borough
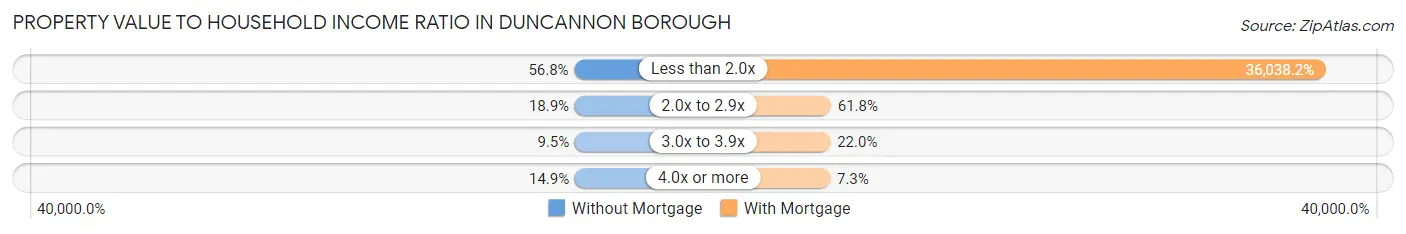
| Value-to-Income Ratio | Without Mortgage | With Mortgage |
| Less than 2.0x | 42 (56.8%) | 88,654 (36,038.2%) |
| 2.0x to 2.9x | 14 (18.9%) | 152 (61.8%) |
| 3.0x to 3.9x | 7 (9.5%) | 54 (22.0%) |
| 4.0x or more | 11 (14.9%) | 18 (7.3%) |
| Total | 74 (100.0%) | 246 (100.0%) |
Real Estate Taxes by Mortgage Status in Duncannon borough
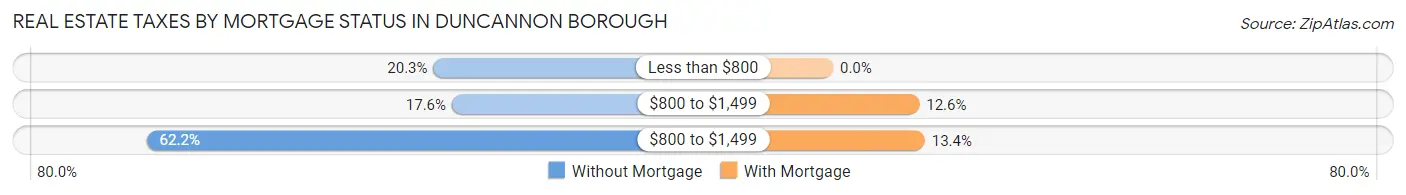
| Property Taxes | Without Mortgage | With Mortgage |
| Less than $800 | 15 (20.3%) | 0 (0.0%) |
| $800 to $1,499 | 13 (17.6%) | 31 (12.6%) |
| $800 to $1,499 | 46 (62.2%) | 33 (13.4%) |
| Total | 74 (100.0%) | 246 (100.0%) |
Health & Disability in Duncannon borough
Health Insurance Coverage by Age in Duncannon borough
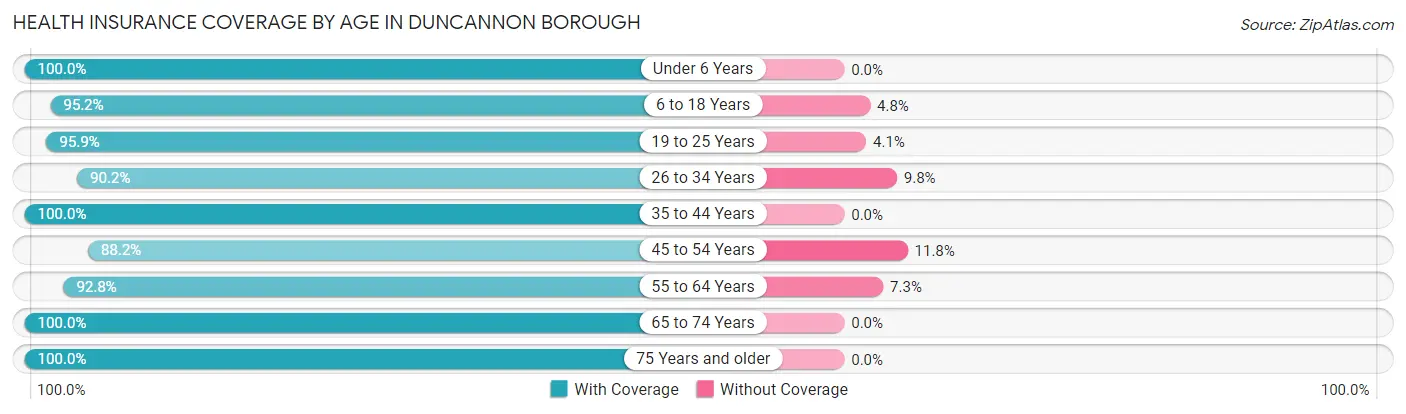
| Age Bracket | With Coverage | Without Coverage |
| Under 6 Years | 108 (100.0%) | 0 (0.0%) |
| 6 to 18 Years | 99 (95.2%) | 5 (4.8%) |
| 19 to 25 Years | 118 (95.9%) | 5 (4.1%) |
| 26 to 34 Years | 138 (90.2%) | 15 (9.8%) |
| 35 to 44 Years | 191 (100.0%) | 0 (0.0%) |
| 45 to 54 Years | 224 (88.2%) | 30 (11.8%) |
| 55 to 64 Years | 192 (92.7%) | 15 (7.2%) |
| 65 to 74 Years | 158 (100.0%) | 0 (0.0%) |
| 75 Years and older | 63 (100.0%) | 0 (0.0%) |
| Total | 1,291 (94.9%) | 70 (5.1%) |
Health Insurance Coverage by Citizenship Status in Duncannon borough
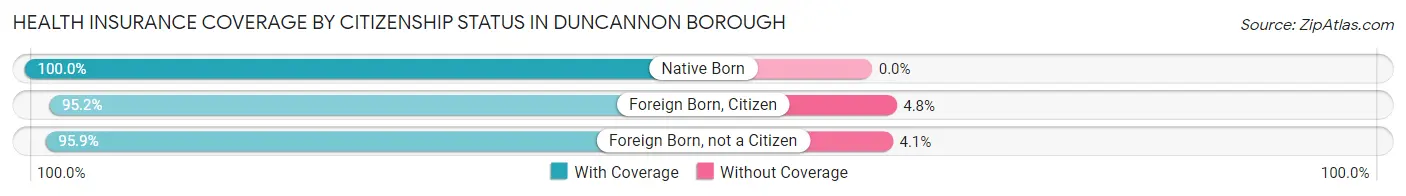
| Citizenship Status | With Coverage | Without Coverage |
| Native Born | 108 (100.0%) | 0 (0.0%) |
| Foreign Born, Citizen | 99 (95.2%) | 5 (4.8%) |
| Foreign Born, not a Citizen | 118 (95.9%) | 5 (4.1%) |
Health Insurance Coverage by Household Income in Duncannon borough
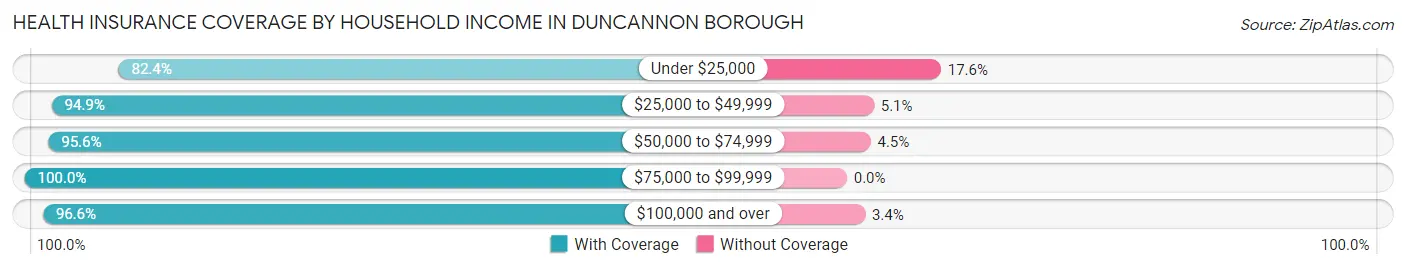
| Household Income | With Coverage | Without Coverage |
| Under $25,000 | 145 (82.4%) | 31 (17.6%) |
| $25,000 to $49,999 | 225 (94.9%) | 12 (5.1%) |
| $50,000 to $74,999 | 236 (95.6%) | 11 (4.4%) |
| $75,000 to $99,999 | 232 (100.0%) | 0 (0.0%) |
| $100,000 and over | 453 (96.6%) | 16 (3.4%) |
Public vs Private Health Insurance Coverage by Age in Duncannon borough
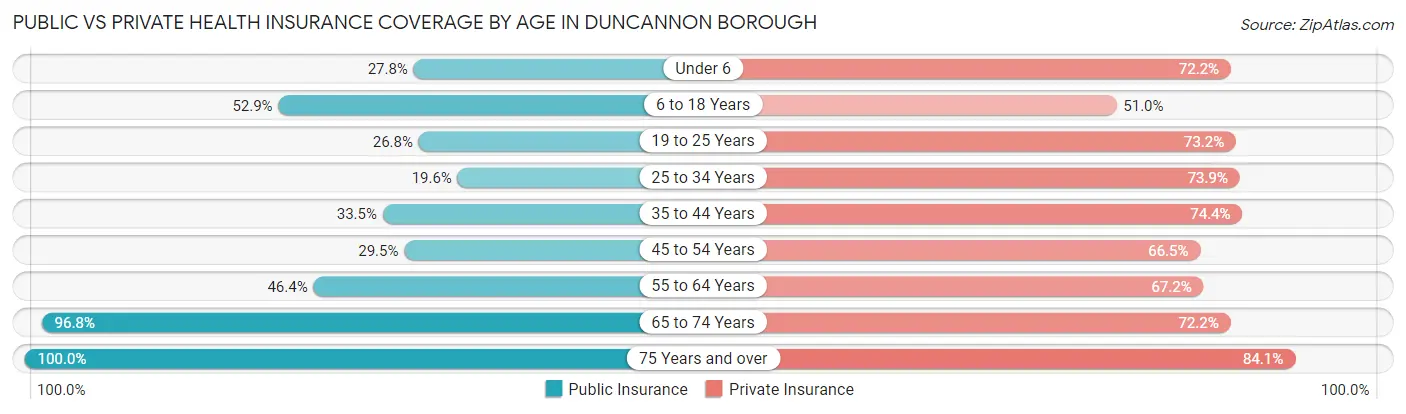
| Age Bracket | Public Insurance | Private Insurance |
| Under 6 | 30 (27.8%) | 78 (72.2%) |
| 6 to 18 Years | 55 (52.9%) | 53 (51.0%) |
| 19 to 25 Years | 33 (26.8%) | 90 (73.2%) |
| 25 to 34 Years | 30 (19.6%) | 113 (73.9%) |
| 35 to 44 Years | 64 (33.5%) | 142 (74.4%) |
| 45 to 54 Years | 75 (29.5%) | 169 (66.5%) |
| 55 to 64 Years | 96 (46.4%) | 139 (67.1%) |
| 65 to 74 Years | 153 (96.8%) | 114 (72.2%) |
| 75 Years and over | 63 (100.0%) | 53 (84.1%) |
| Total | 599 (44.0%) | 951 (69.9%) |
Disability Status by Sex by Age in Duncannon borough
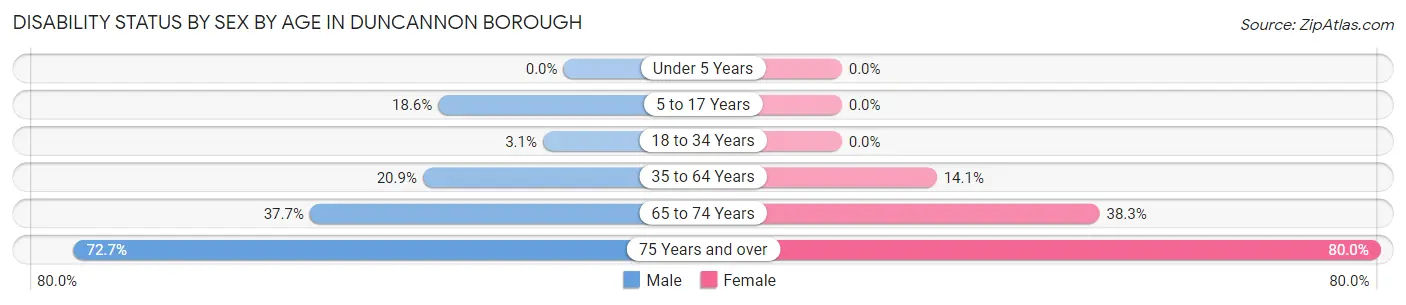
| Age Bracket | Male | Female |
| Under 5 Years | 0 (0.0%) | 0 (0.0%) |
| 5 to 17 Years | 16 (18.6%) | 0 (0.0%) |
| 18 to 34 Years | 4 (3.0%) | 0 (0.0%) |
| 35 to 64 Years | 71 (20.9%) | 44 (14.1%) |
| 65 to 74 Years | 29 (37.7%) | 31 (38.3%) |
| 75 Years and over | 24 (72.7%) | 24 (80.0%) |
Disability Class by Sex by Age in Duncannon borough
Disability Class: Hearing Difficulty
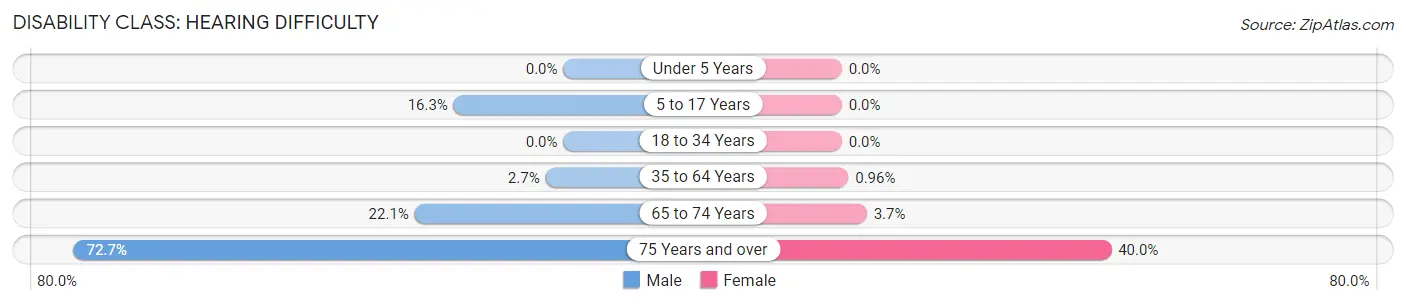
| Age Bracket | Male | Female |
| Under 5 Years | 0 (0.0%) | 0 (0.0%) |
| 5 to 17 Years | 14 (16.3%) | 0 (0.0%) |
| 18 to 34 Years | 0 (0.0%) | 0 (0.0%) |
| 35 to 64 Years | 9 (2.6%) | 3 (1.0%) |
| 65 to 74 Years | 17 (22.1%) | 3 (3.7%) |
| 75 Years and over | 24 (72.7%) | 12 (40.0%) |
Disability Class: Vision Difficulty
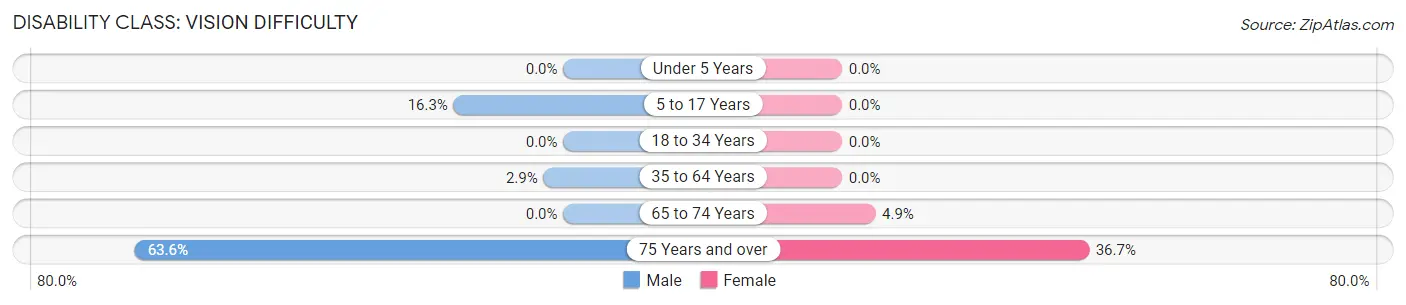
| Age Bracket | Male | Female |
| Under 5 Years | 0 (0.0%) | 0 (0.0%) |
| 5 to 17 Years | 14 (16.3%) | 0 (0.0%) |
| 18 to 34 Years | 0 (0.0%) | 0 (0.0%) |
| 35 to 64 Years | 10 (2.9%) | 0 (0.0%) |
| 65 to 74 Years | 0 (0.0%) | 4 (4.9%) |
| 75 Years and over | 21 (63.6%) | 11 (36.7%) |
Disability Class: Cognitive Difficulty
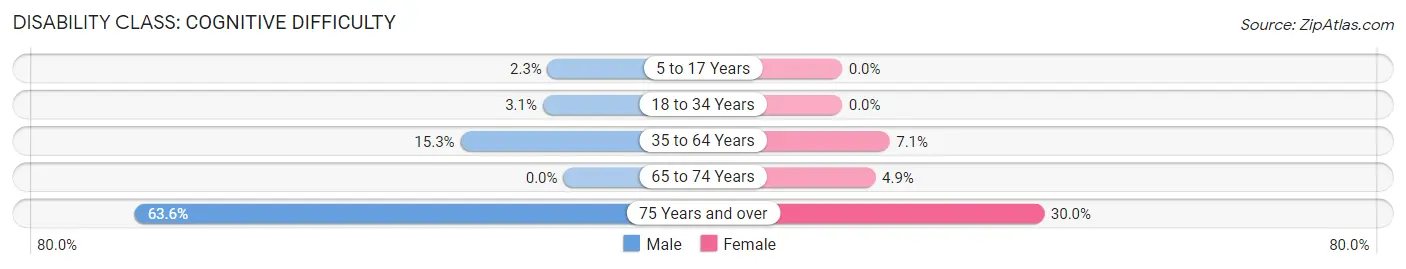
| Age Bracket | Male | Female |
| 5 to 17 Years | 2 (2.3%) | 0 (0.0%) |
| 18 to 34 Years | 4 (3.0%) | 0 (0.0%) |
| 35 to 64 Years | 52 (15.3%) | 22 (7.0%) |
| 65 to 74 Years | 0 (0.0%) | 4 (4.9%) |
| 75 Years and over | 21 (63.6%) | 9 (30.0%) |
Disability Class: Ambulatory Difficulty
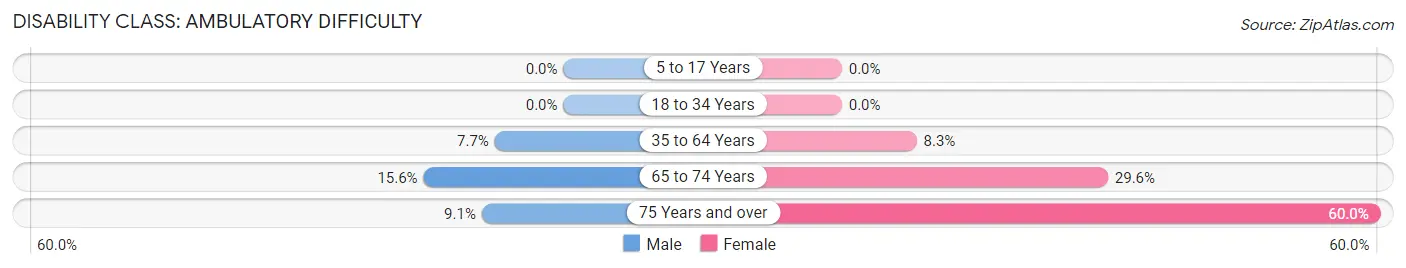
| Age Bracket | Male | Female |
| 5 to 17 Years | 0 (0.0%) | 0 (0.0%) |
| 18 to 34 Years | 0 (0.0%) | 0 (0.0%) |
| 35 to 64 Years | 26 (7.6%) | 26 (8.3%) |
| 65 to 74 Years | 12 (15.6%) | 24 (29.6%) |
| 75 Years and over | 3 (9.1%) | 18 (60.0%) |
Disability Class: Self-Care Difficulty
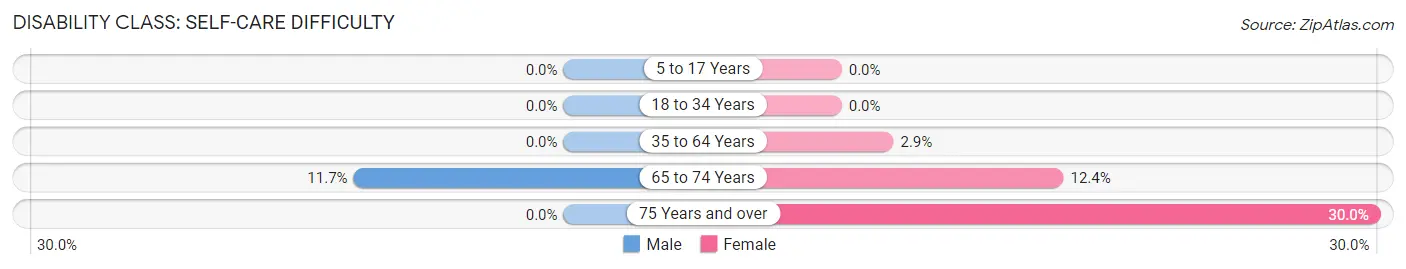
| Age Bracket | Male | Female |
| 5 to 17 Years | 0 (0.0%) | 0 (0.0%) |
| 18 to 34 Years | 0 (0.0%) | 0 (0.0%) |
| 35 to 64 Years | 0 (0.0%) | 9 (2.9%) |
| 65 to 74 Years | 9 (11.7%) | 10 (12.3%) |
| 75 Years and over | 0 (0.0%) | 9 (30.0%) |
Technology Access in Duncannon borough
Computing Device Access in Duncannon borough
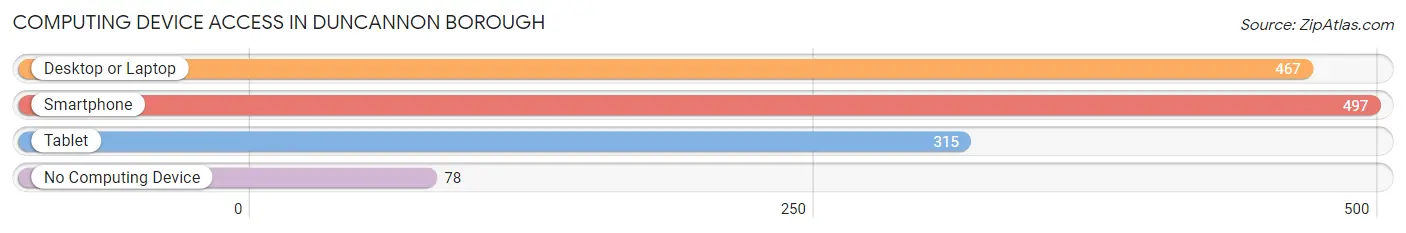
| Device Type | # Households | % Households |
| Desktop or Laptop | 467 | 73.9% |
| Smartphone | 497 | 78.6% |
| Tablet | 315 | 49.8% |
| No Computing Device | 78 | 12.3% |
| Total | 632 | 100.0% |
Internet Access in Duncannon borough
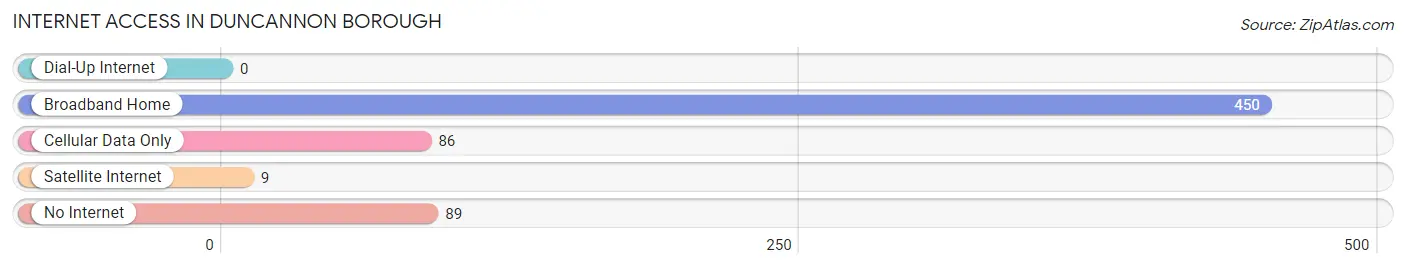
| Internet Type | # Households | % Households |
| Dial-Up Internet | 0 | 0.0% |
| Broadband Home | 450 | 71.2% |
| Cellular Data Only | 86 | 13.6% |
| Satellite Internet | 9 | 1.4% |
| No Internet | 89 | 14.1% |
| Total | 632 | 100.0% |
Duncannon borough Summary
Duncannon Borough is a small borough located in Perry County, Pennsylvania. It is situated along the Susquehanna River, approximately 10 miles northwest of Harrisburg. The borough has a population of 1,788 as of the 2010 census.
History
Duncannon Borough was founded in 1827 by John Duncannon, a local landowner. The borough was incorporated in 1845 and was named after John Duncannon. The borough was originally a farming community, but it soon developed into a small industrial center. The first industry in the borough was a sawmill, which was built in 1828. Other industries soon followed, including a grist mill, a tannery, and a brickyard.
In the late 19th century, Duncannon Borough became a popular tourist destination. The borough was home to several resorts, including the Duncannon House, which was built in 1876. The resort was a popular destination for visitors from Harrisburg and other nearby cities.
In the early 20th century, Duncannon Borough experienced a period of growth. The borough was home to several factories, including a paper mill, a canning factory, and a furniture factory. The borough also had a thriving business district, which included several stores, restaurants, and hotels.
Geography
Duncannon Borough is located in Perry County, Pennsylvania. It is situated along the Susquehanna River, approximately 10 miles northwest of Harrisburg. The borough has a total area of 1.2 square miles, all of which is land.
The borough is located in the Appalachian Mountains, and the terrain is mostly hilly. The highest point in the borough is located at an elevation of 1,068 feet. The borough is located in a humid continental climate zone, and the average annual temperature is 50 degrees Fahrenheit.
Economy
Duncannon Borough has a diverse economy. The borough is home to several small businesses, including restaurants, retail stores, and service providers. The borough also has several manufacturing companies, including a paper mill, a canning factory, and a furniture factory.
The borough is also home to several tourist attractions, including the Duncannon House, which was built in 1876. The resort is a popular destination for visitors from Harrisburg and other nearby cities.
Demographics
As of the 2010 census, Duncannon Borough had a population of 1,788. The racial makeup of the borough was 95.3% White, 1.2% African American, 0.3% Native American, 0.7% Asian, 0.1% Pacific Islander, 0.7% from other races, and 1.9% from two or more races. Hispanic or Latino of any race were 2.2% of the population.
The median household income in the borough was $41,250, and the median family income was $50,000. The per capita income in the borough was $20,945. About 11.2% of families and 14.2% of the population were below the poverty line, including 19.2% of those under age 18 and 8.2% of those age 65 or over.
Common Questions
What is Per Capita Income in Duncannon borough?
Per Capita income in Duncannon borough is $31,870.
What is the Median Family Income in Duncannon borough?
Median Family Income in Duncannon borough is $79,063.
What is the Median Household income in Duncannon borough?
Median Household Income in Duncannon borough is $52,500.
What is Income or Wage Gap in Duncannon borough?
Income or Wage Gap in Duncannon borough is 39.7%.
Women in Duncannon borough earn 60.3 cents for every dollar earned by a man.
What is Inequality or Gini Index in Duncannon borough?
Inequality or Gini Index in Duncannon borough is 0.40.
What is the Total Population of Duncannon borough?
Total Population of Duncannon borough is 1,361.
What is the Total Male Population of Duncannon borough?
Total Male Population of Duncannon borough is 738.
What is the Total Female Population of Duncannon borough?
Total Female Population of Duncannon borough is 623.
What is the Ratio of Males per 100 Females in Duncannon borough?
There are 118.46 Males per 100 Females in Duncannon borough.
What is the Ratio of Females per 100 Males in Duncannon borough?
There are 84.42 Females per 100 Males in Duncannon borough.
What is the Median Population Age in Duncannon borough?
Median Population Age in Duncannon borough is 45.0 Years.
What is the Average Family Size in Duncannon borough
Average Family Size in Duncannon borough is 3.0 People.
What is the Average Household Size in Duncannon borough
Average Household Size in Duncannon borough is 2.1 People.
How Large is the Labor Force in Duncannon borough?
There are 799 People in the Labor Forcein in Duncannon borough.
What is the Percentage of People in the Labor Force in Duncannon borough?
68.8% of People are in the Labor Force in Duncannon borough.
What is the Unemployment Rate in Duncannon borough?
Unemployment Rate in Duncannon borough is 5.6%.