Catasauqua borough, PA Map & Demographics
Catasauqua borough Overview
$35,551
PER CAPITA INCOME
$86,591
AVG FAMILY INCOME
$62,134
AVG HOUSEHOLD INCOME
19.9%
WAGE / INCOME GAP [ % ]
80.1¢/ $1
WAGE / INCOME GAP [ $ ]
0.43
INEQUALITY / GINI INDEX
6,512
TOTAL POPULATION
3,413
MALE POPULATION
3,099
FEMALE POPULATION
110.13
MALES / 100 FEMALES
90.80
FEMALES / 100 MALES
37.7
MEDIAN AGE
2.9
AVG FAMILY SIZE
2.4
AVG HOUSEHOLD SIZE
3,949
LABOR FORCE [ PEOPLE ]
73.3%
PERCENT IN LABOR FORCE
8.3%
UNEMPLOYMENT RATE
Income in Catasauqua borough
Income Overview in Catasauqua borough
Per Capita Income in Catasauqua borough is $35,551, while median incomes of families and households are $86,591 and $62,134 respectively.
| Characteristic | Number | Measure |
| Per Capita Income | 6,512 | $35,551 |
| Median Family Income | 1,778 | $86,591 |
| Mean Family Income | 1,778 | $104,121 |
| Median Household Income | 2,757 | $62,134 |
| Mean Household Income | 2,757 | $85,402 |
| Income Deficit | 1,778 | $0 |
| Wage / Income Gap (%) | 6,512 | 19.88% |
| Wage / Income Gap ($) | 6,512 | 80.12¢ per $1 |
| Gini / Inequality Index | 6,512 | 0.43 |
Earnings by Sex in Catasauqua borough
Average Earnings in Catasauqua borough are $41,984, $47,520 for men and $38,073 for women, a difference of 19.9%.
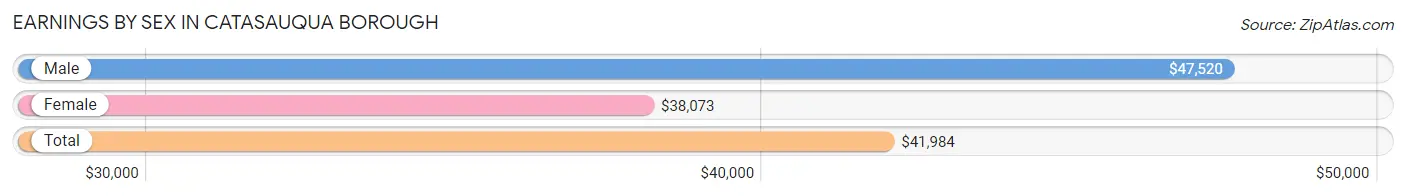
| Sex | Number | Average Earnings |
| Male | 2,173 (56.6%) | $47,520 |
| Female | 1,669 (43.4%) | $38,073 |
| Total | 3,842 (100.0%) | $41,984 |
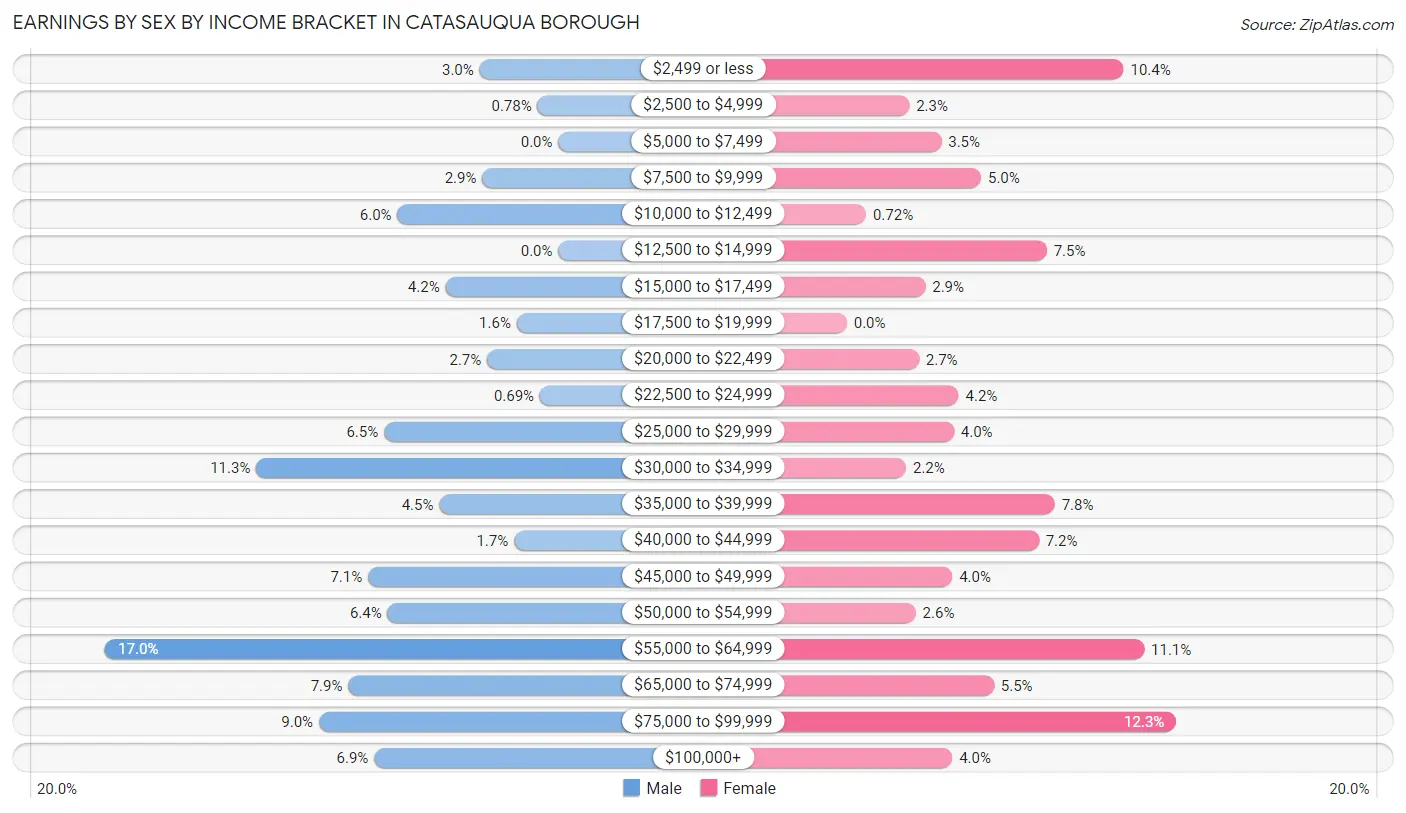
Earnings by Sex by Income Bracket in Catasauqua borough
The most common earnings brackets in Catasauqua borough are $55,000 to $64,999 for men (369 | 17.0%) and $75,000 to $99,999 for women (206 | 12.3%).
| Income | Male | Female |
| $2,499 or less | 64 (2.9%) | 173 (10.4%) |
| $2,500 to $4,999 | 17 (0.8%) | 39 (2.3%) |
| $5,000 to $7,499 | 0 (0.0%) | 59 (3.5%) |
| $7,500 to $9,999 | 62 (2.9%) | 84 (5.0%) |
| $10,000 to $12,499 | 131 (6.0%) | 12 (0.7%) |
| $12,500 to $14,999 | 0 (0.0%) | 125 (7.5%) |
| $15,000 to $17,499 | 92 (4.2%) | 49 (2.9%) |
| $17,500 to $19,999 | 34 (1.6%) | 0 (0.0%) |
| $20,000 to $22,499 | 58 (2.7%) | 45 (2.7%) |
| $22,500 to $24,999 | 15 (0.7%) | 70 (4.2%) |
| $25,000 to $29,999 | 142 (6.5%) | 67 (4.0%) |
| $30,000 to $34,999 | 246 (11.3%) | 37 (2.2%) |
| $35,000 to $39,999 | 97 (4.5%) | 130 (7.8%) |
| $40,000 to $44,999 | 36 (1.7%) | 120 (7.2%) |
| $45,000 to $49,999 | 155 (7.1%) | 66 (4.0%) |
| $50,000 to $54,999 | 139 (6.4%) | 43 (2.6%) |
| $55,000 to $64,999 | 369 (17.0%) | 186 (11.1%) |
| $65,000 to $74,999 | 171 (7.9%) | 92 (5.5%) |
| $75,000 to $99,999 | 195 (9.0%) | 206 (12.3%) |
| $100,000+ | 150 (6.9%) | 66 (4.0%) |
| Total | 2,173 (100.0%) | 1,669 (100.0%) |
Earnings by Sex by Educational Attainment in Catasauqua borough
Average earnings in Catasauqua borough are $54,573 for men and $44,297 for women, a difference of 18.8%. Men with an educational attainment of graduate degree enjoy the highest average annual earnings of $98,824, while those with less than high school education earn the least with $46,442. Women with an educational attainment of graduate degree earn the most with the average annual earnings of $82,857, while those with high school diploma education have the smallest earnings of $38,229.
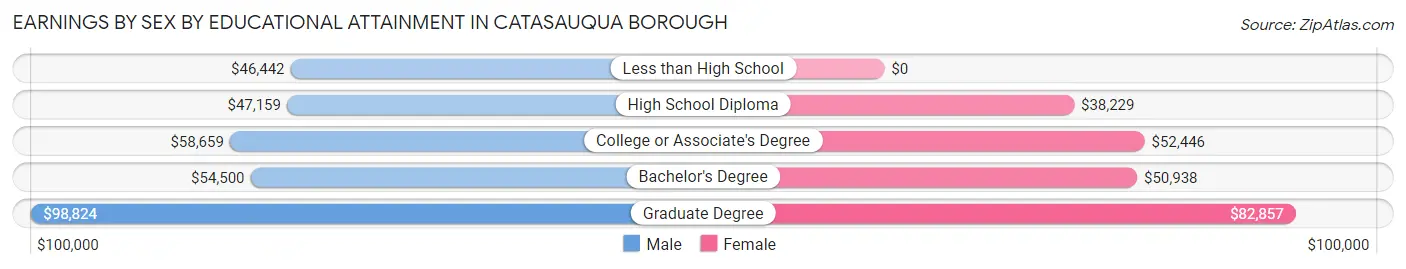
| Educational Attainment | Male Income | Female Income |
| Less than High School | $46,442 | $0 |
| High School Diploma | $47,159 | $38,229 |
| College or Associate's Degree | $58,659 | $52,446 |
| Bachelor's Degree | $54,500 | $50,938 |
| Graduate Degree | $98,824 | $82,857 |
| Total | $54,573 | $44,297 |
Family Income in Catasauqua borough
Family Income Brackets in Catasauqua borough
According to the Catasauqua borough family income data, there are 473 families falling into the $100,000 to $149,999 income range, which is the most common income bracket and makes up 26.6% of all families.
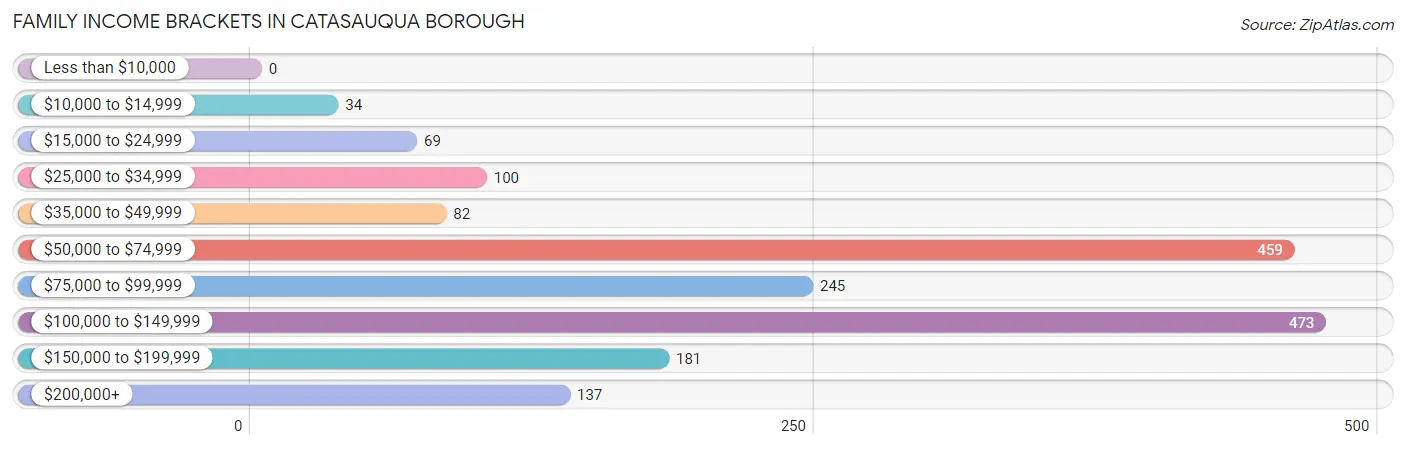
| Income Bracket | # Families | % Families |
| Less than $10,000 | 0 | 0.0% |
| $10,000 to $14,999 | 34 | 1.9% |
| $15,000 to $24,999 | 69 | 3.9% |
| $25,000 to $34,999 | 100 | 5.6% |
| $35,000 to $49,999 | 82 | 4.6% |
| $50,000 to $74,999 | 459 | 25.8% |
| $75,000 to $99,999 | 245 | 13.8% |
| $100,000 to $149,999 | 473 | 26.6% |
| $150,000 to $199,999 | 181 | 10.2% |
| $200,000+ | 137 | 7.7% |
Family Income by Famaliy Size in Catasauqua borough
5-person families (67 | 3.8%) account for the highest median family income in Catasauqua borough with $157,880 per family, while 2-person families (812 | 45.7%) have the highest median income of $39,107 per family member.
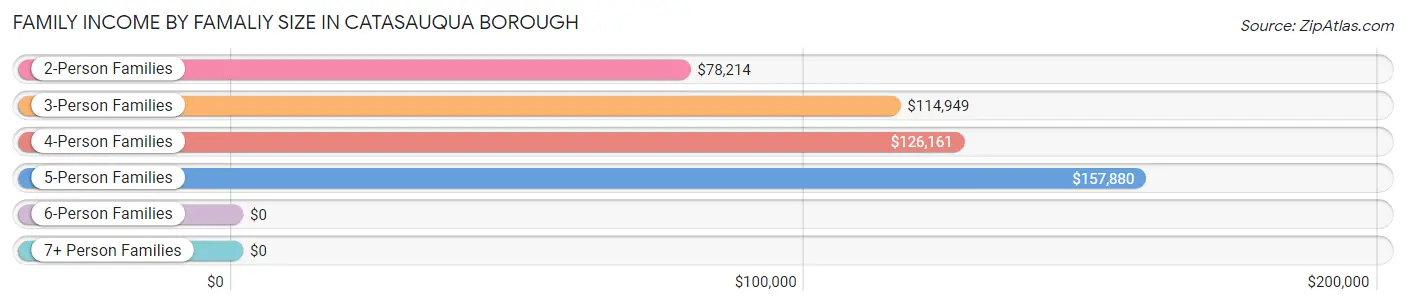
| Income Bracket | # Families | Median Income |
| 2-Person Families | 812 (45.7%) | $78,214 |
| 3-Person Families | 498 (28.0%) | $114,949 |
| 4-Person Families | 365 (20.5%) | $126,161 |
| 5-Person Families | 67 (3.8%) | $157,880 |
| 6-Person Families | 0 (0.0%) | $0 |
| 7+ Person Families | 36 (2.0%) | $0 |
| Total | 1,778 (100.0%) | $86,591 |
Family Income by Number of Earners in Catasauqua borough
The median family income in Catasauqua borough is $86,591, with families comprising 3+ earners (138) having the highest median family income of $125,882, while families with no earners (207) have the lowest median family income of $53,836, accounting for 7.8% and 11.6% of families, respectively.
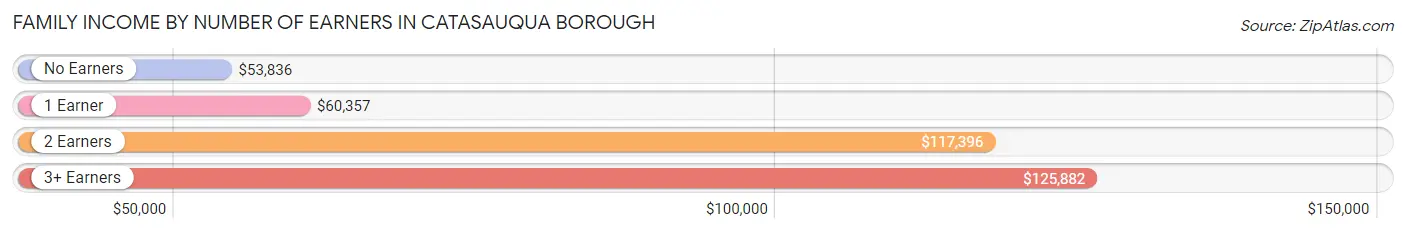
| Number of Earners | # Families | Median Income |
| No Earners | 207 (11.6%) | $53,836 |
| 1 Earner | 464 (26.1%) | $60,357 |
| 2 Earners | 969 (54.5%) | $117,396 |
| 3+ Earners | 138 (7.8%) | $125,882 |
| Total | 1,778 (100.0%) | $86,591 |
Household Income in Catasauqua borough
Household Income Brackets in Catasauqua borough
With 557 households falling in the category, the $50,000 to $74,999 income range is the most frequent in Catasauqua borough, accounting for 20.2% of all households. In contrast, only 77 households (2.8%) fall into the less than $10,000 income bracket, making it the least populous group.
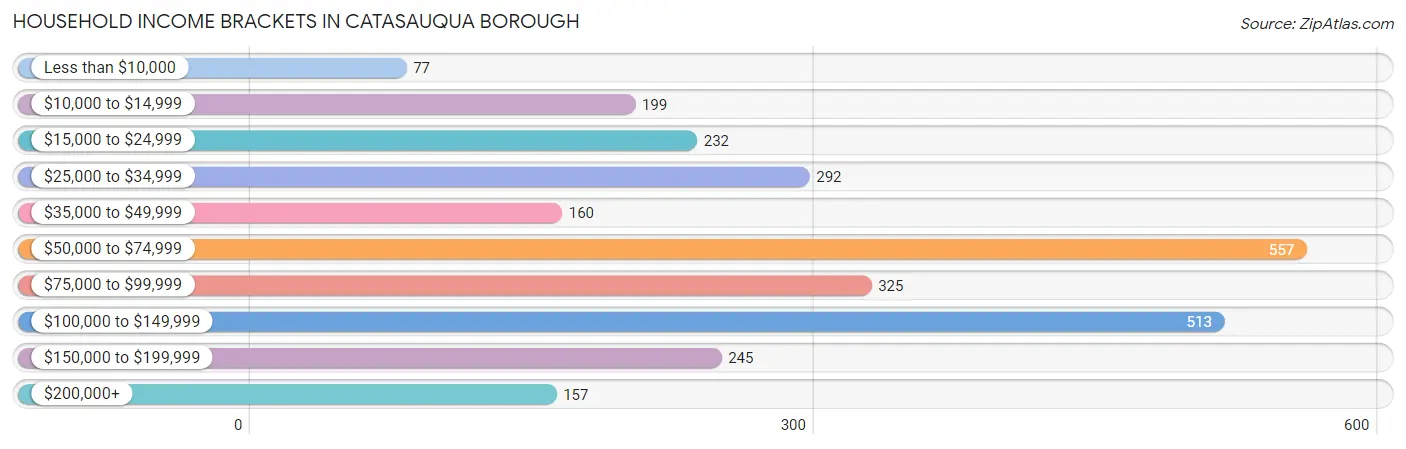
| Income Bracket | # Households | % Households |
| Less than $10,000 | 77 | 2.8% |
| $10,000 to $14,999 | 199 | 7.2% |
| $15,000 to $24,999 | 232 | 8.4% |
| $25,000 to $34,999 | 292 | 10.6% |
| $35,000 to $49,999 | 160 | 5.8% |
| $50,000 to $74,999 | 557 | 20.2% |
| $75,000 to $99,999 | 325 | 11.8% |
| $100,000 to $149,999 | 513 | 18.6% |
| $150,000 to $199,999 | 245 | 8.9% |
| $200,000+ | 157 | 5.7% |
Household Income by Householder Age in Catasauqua borough
The median household income in Catasauqua borough is $62,134, with the highest median household income of $84,335 found in the 25 to 44 years age bracket for the primary householder. A total of 929 households (33.7%) fall into this category. Meanwhile, the 15 to 24 years age bracket for the primary householder has the lowest median household income of $33,973, with 170 households (6.2%) in this group.
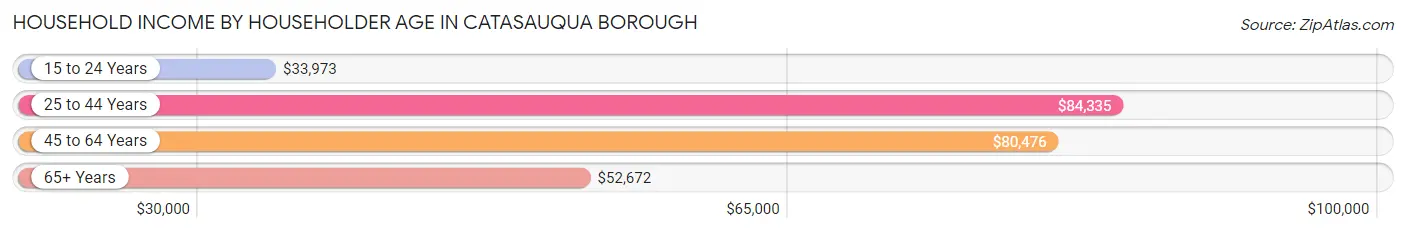
| Income Bracket | # Households | Median Income |
| 15 to 24 Years | 170 (6.2%) | $33,973 |
| 25 to 44 Years | 929 (33.7%) | $84,335 |
| 45 to 64 Years | 1,004 (36.4%) | $80,476 |
| 65+ Years | 654 (23.7%) | $52,672 |
| Total | 2,757 (100.0%) | $62,134 |
Poverty in Catasauqua borough
Income Below Poverty by Sex and Age in Catasauqua borough
With 5.0% poverty level for males and 12.0% for females among the residents of Catasauqua borough, 16 and 17 year old males and 75 year old and over females are the most vulnerable to poverty, with 26 males (24.8%) and 67 females (26.9%) in their respective age groups living below the poverty level.
| Age Bracket | Male | Female |
| Under 5 Years | 22 (7.0%) | 0 (0.0%) |
| 5 Years | 0 (0.0%) | 0 (0.0%) |
| 6 to 11 Years | 0 (0.0%) | 0 (0.0%) |
| 12 to 14 Years | 0 (0.0%) | 17 (9.4%) |
| 15 Years | 0 (0.0%) | 0 (0.0%) |
| 16 and 17 Years | 26 (24.8%) | 0 (0.0%) |
| 18 to 24 Years | 0 (0.0%) | 26 (11.2%) |
| 25 to 34 Years | 0 (0.0%) | 72 (17.6%) |
| 35 to 44 Years | 25 (4.5%) | 33 (9.7%) |
| 45 to 54 Years | 1 (0.2%) | 56 (15.0%) |
| 55 to 64 Years | 80 (22.3%) | 75 (18.2%) |
| 65 to 74 Years | 17 (7.0%) | 25 (8.0%) |
| 75 Years and over | 0 (0.0%) | 67 (26.9%) |
| Total | 171 (5.0%) | 371 (12.0%) |
Income Above Poverty by Sex and Age in Catasauqua borough
According to the poverty statistics in Catasauqua borough, males aged 6 to 11 years and females aged under 5 years are the age groups that are most secure financially, with 100.0% of males and 100.0% of females in these age groups living above the poverty line.
| Age Bracket | Male | Female |
| Under 5 Years | 291 (93.0%) | 224 (100.0%) |
| 5 Years | 0 (0.0%) | 13 (100.0%) |
| 6 to 11 Years | 194 (100.0%) | 80 (100.0%) |
| 12 to 14 Years | 95 (100.0%) | 163 (90.6%) |
| 15 Years | 0 (0.0%) | 25 (100.0%) |
| 16 and 17 Years | 79 (75.2%) | 247 (100.0%) |
| 18 to 24 Years | 544 (100.0%) | 206 (88.8%) |
| 25 to 34 Years | 407 (100.0%) | 337 (82.4%) |
| 35 to 44 Years | 533 (95.5%) | 308 (90.3%) |
| 45 to 54 Years | 471 (99.8%) | 318 (85.0%) |
| 55 to 64 Years | 279 (77.7%) | 337 (81.8%) |
| 65 to 74 Years | 226 (93.0%) | 288 (92.0%) |
| 75 Years and over | 123 (100.0%) | 182 (73.1%) |
| Total | 3,242 (95.0%) | 2,728 (88.0%) |
Income Below Poverty Among Married-Couple Families in Catasauqua borough
The poverty statistics for married-couple families in Catasauqua borough show that 3.7% or 41 of the total 1,120 families live below the poverty line. Families with 1 or 2 children have the highest poverty rate of 5.1%, comprising of 24 families. On the other hand, families with 5 or more children have the lowest poverty rate of 0.0%, which includes 0 families.
| Children | Above Poverty | Below Poverty |
| No Children | 618 (97.3%) | 17 (2.7%) |
| 1 or 2 Children | 442 (94.9%) | 24 (5.1%) |
| 3 or 4 Children | 0 (0.0%) | 0 (0.0%) |
| 5 or more Children | 19 (100.0%) | 0 (0.0%) |
| Total | 1,079 (96.3%) | 41 (3.7%) |
Income Below Poverty Among Single-Parent Households in Catasauqua borough
| Children | Single Father | Single Mother |
| No Children | 0 (0.0%) | 0 (0.0%) |
| 1 or 2 Children | 0 (0.0%) | 34 (15.9%) |
| 3 or 4 Children | 0 (0.0%) | 0 (0.0%) |
| 5 or more Children | 0 (0.0%) | 0 (0.0%) |
| Total | 0 (0.0%) | 34 (9.1%) |
Income Below Poverty Among Married-Couple vs Single-Parent Households in Catasauqua borough
The poverty data for Catasauqua borough shows that 41 of the married-couple family households (3.7%) and 34 of the single-parent households (5.2%) are living below the poverty level. Within the married-couple family households, those with 1 or 2 children have the highest poverty rate, with 24 households (5.1%) falling below the poverty line. Among the single-parent households, those with 1 or 2 children have the highest poverty rate, with 34 household (9.4%) living below poverty.

| Children | Married-Couple Families | Single-Parent Households |
| No Children | 17 (2.7%) | 0 (0.0%) |
| 1 or 2 Children | 24 (5.1%) | 34 (9.4%) |
| 3 or 4 Children | 0 (0.0%) | 0 (0.0%) |
| 5 or more Children | 0 (0.0%) | 0 (0.0%) |
| Total | 41 (3.7%) | 34 (5.2%) |
Race in Catasauqua borough
The most populous races in Catasauqua borough are White / Caucasian (5,513 | 84.7%), Hispanic or Latino (1,135 | 17.4%), and Two or more Races (626 | 9.6%).
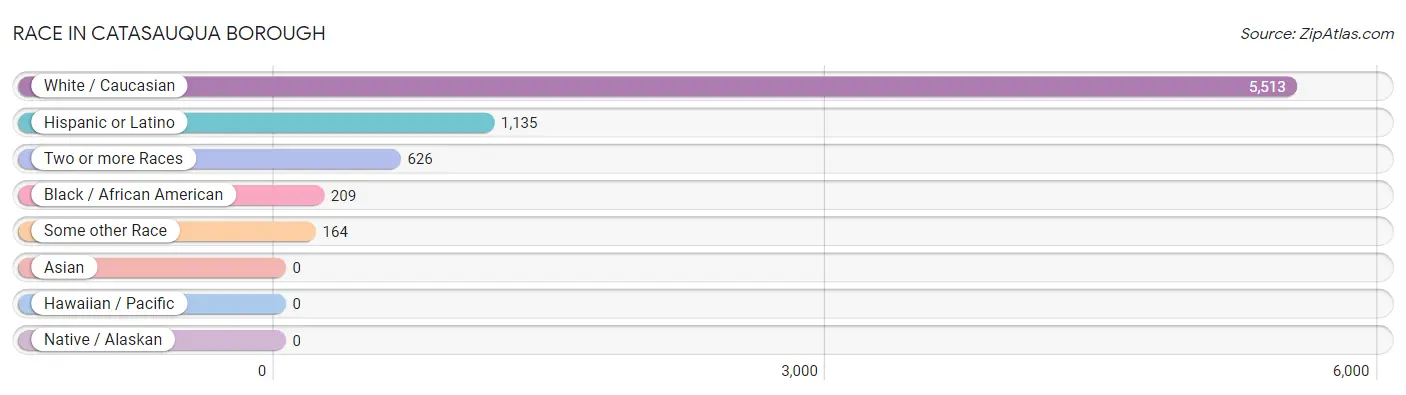
| Race | # Population | % Population |
| Asian | 0 | 0.0% |
| Black / African American | 209 | 3.2% |
| Hawaiian / Pacific | 0 | 0.0% |
| Hispanic or Latino | 1,135 | 17.4% |
| Native / Alaskan | 0 | 0.0% |
| White / Caucasian | 5,513 | 84.7% |
| Two or more Races | 626 | 9.6% |
| Some other Race | 164 | 2.5% |
| Total | 6,512 | 100.0% |
Ancestry in Catasauqua borough
The most populous ancestries reported in Catasauqua borough are German (1,778 | 27.3%), Irish (995 | 15.3%), Puerto Rican (885 | 13.6%), Italian (624 | 9.6%), and English (448 | 6.9%), together accounting for 72.6% of all Catasauqua borough residents.
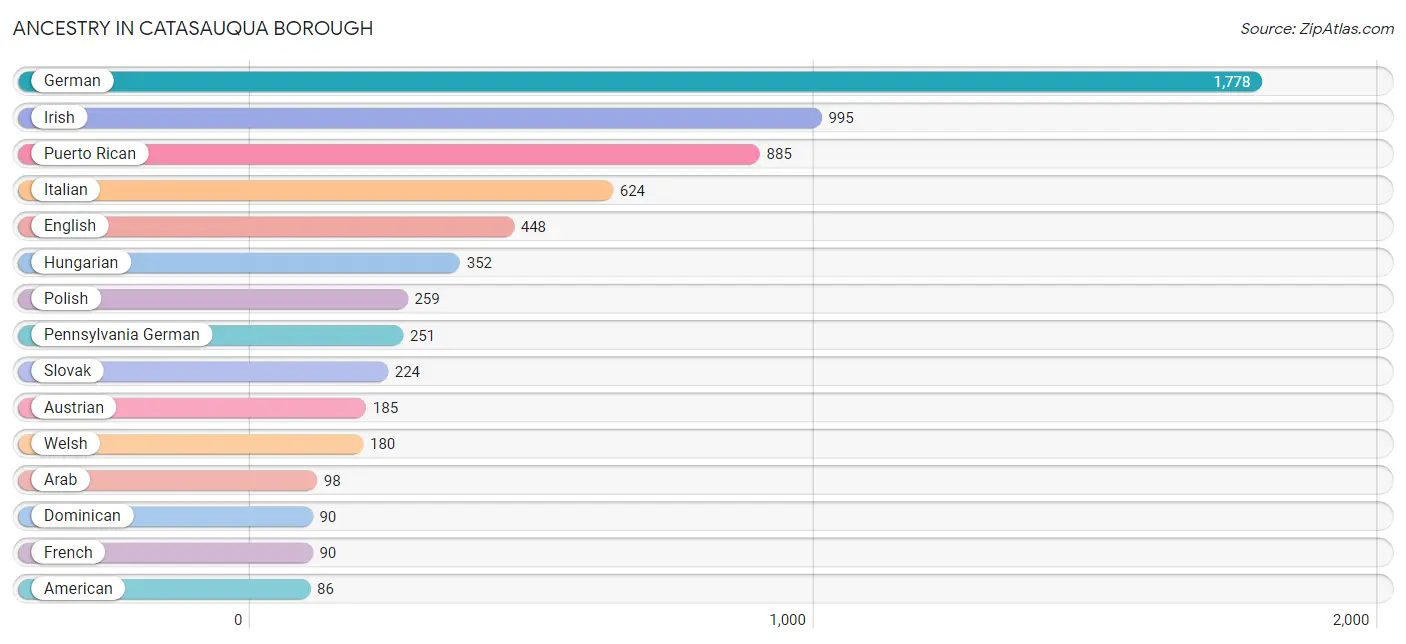
| Ancestry | # Population | % Population |
| American | 86 | 1.3% |
| Arab | 98 | 1.5% |
| Austrian | 185 | 2.8% |
| Central American | 63 | 1.0% |
| Colombian | 13 | 0.2% |
| Czech | 71 | 1.1% |
| Czechoslovakian | 43 | 0.7% |
| Dominican | 90 | 1.4% |
| Dutch | 41 | 0.6% |
| Eastern European | 56 | 0.9% |
| Egyptian | 35 | 0.5% |
| English | 448 | 6.9% |
| European | 60 | 0.9% |
| French | 90 | 1.4% |
| German | 1,778 | 27.3% |
| Hungarian | 352 | 5.4% |
| Irish | 995 | 15.3% |
| Italian | 624 | 9.6% |
| Jamaican | 9 | 0.1% |
| Jordanian | 21 | 0.3% |
| Lebanese | 21 | 0.3% |
| Nigerian | 53 | 0.8% |
| Pennsylvania German | 251 | 3.8% |
| Peruvian | 17 | 0.3% |
| Polish | 259 | 4.0% |
| Puerto Rican | 885 | 13.6% |
| Russian | 13 | 0.2% |
| Salvadoran | 63 | 1.0% |
| Scotch-Irish | 39 | 0.6% |
| Scottish | 45 | 0.7% |
| Sioux | 70 | 1.1% |
| Slavic | 15 | 0.2% |
| Slovak | 224 | 3.4% |
| South American | 30 | 0.5% |
| Subsaharan African | 54 | 0.8% |
| Swedish | 19 | 0.3% |
| Syrian | 25 | 0.4% |
| Ugandan | 1 | 0.0% |
| Ukrainian | 38 | 0.6% |
| Welsh | 180 | 2.8% | View All 40 Rows |
Immigrants in Catasauqua borough
The most numerous immigrant groups reported in Catasauqua borough came from Latin America (107 | 1.6%), Caribbean (63 | 1.0%), Dominican Republic (63 | 1.0%), Central America (39 | 0.6%), and El Salvador (39 | 0.6%), together accounting for 4.8% of all Catasauqua borough residents.
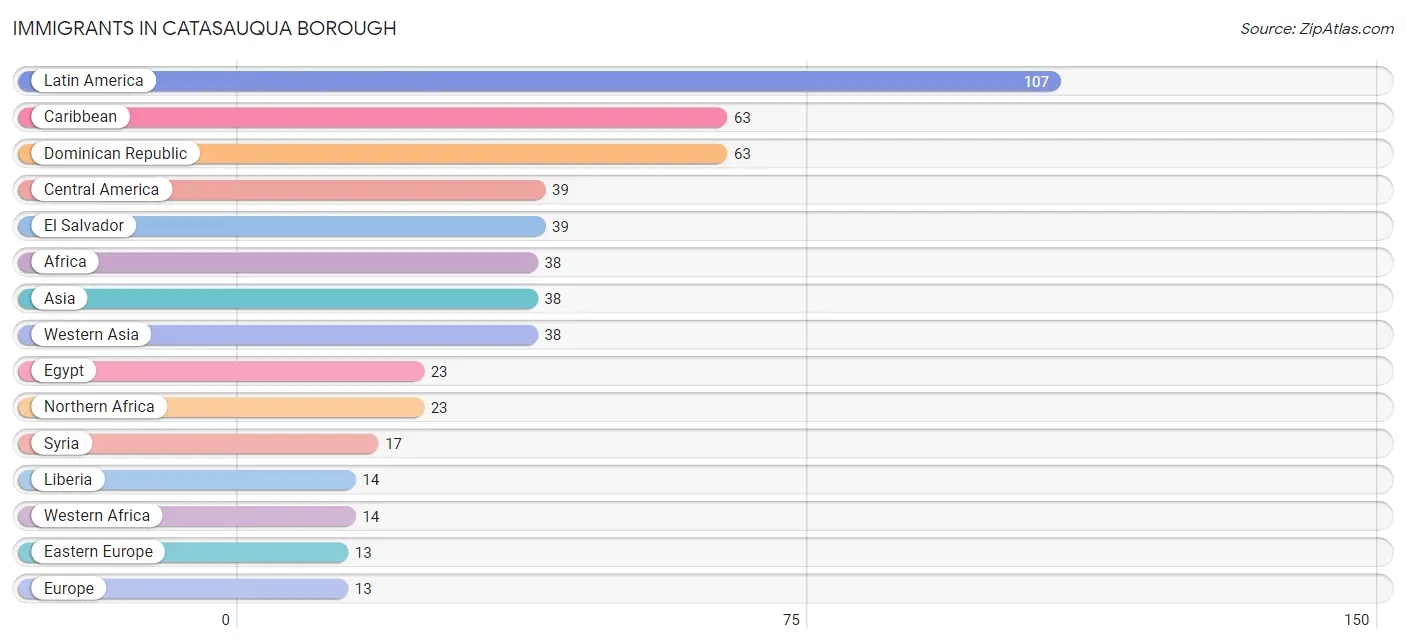
| Immigration Origin | # Population | % Population |
| Africa | 38 | 0.6% |
| Asia | 38 | 0.6% |
| Caribbean | 63 | 1.0% |
| Central America | 39 | 0.6% |
| Dominican Republic | 63 | 1.0% |
| Eastern Africa | 1 | 0.0% |
| Eastern Europe | 13 | 0.2% |
| Egypt | 23 | 0.4% |
| El Salvador | 39 | 0.6% |
| Europe | 13 | 0.2% |
| Latin America | 107 | 1.6% |
| Liberia | 14 | 0.2% |
| Northern Africa | 23 | 0.4% |
| Peru | 5 | 0.1% |
| Romania | 13 | 0.2% |
| South America | 5 | 0.1% |
| Syria | 17 | 0.3% |
| Uganda | 1 | 0.0% |
| Western Africa | 14 | 0.2% |
| Western Asia | 38 | 0.6% | View All 20 Rows |
Sex and Age in Catasauqua borough
Sex and Age in Catasauqua borough
The most populous age groups in Catasauqua borough are 20 to 24 Years (505 | 14.8%) for men and 15 to 19 Years (339 | 10.9%) for women.
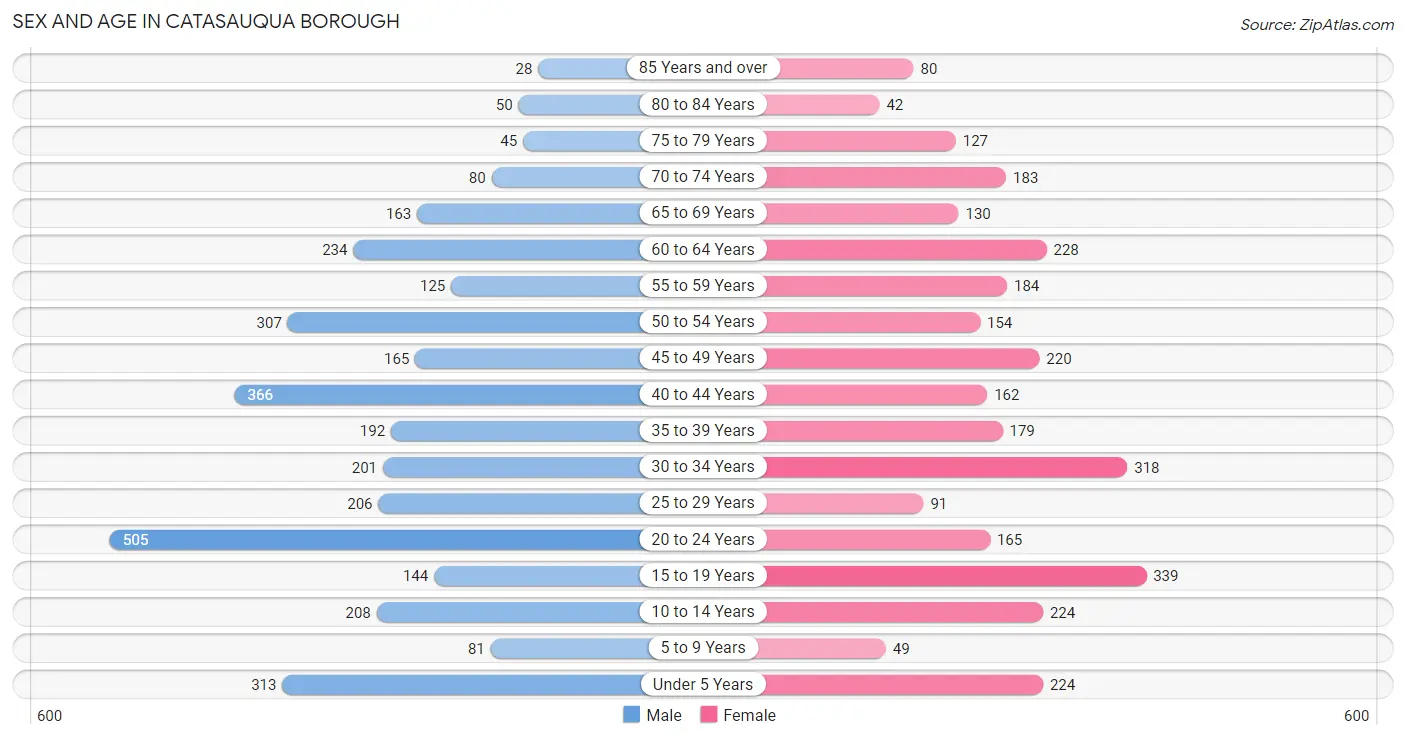
| Age Bracket | Male | Female |
| Under 5 Years | 313 (9.2%) | 224 (7.2%) |
| 5 to 9 Years | 81 (2.4%) | 49 (1.6%) |
| 10 to 14 Years | 208 (6.1%) | 224 (7.2%) |
| 15 to 19 Years | 144 (4.2%) | 339 (10.9%) |
| 20 to 24 Years | 505 (14.8%) | 165 (5.3%) |
| 25 to 29 Years | 206 (6.0%) | 91 (2.9%) |
| 30 to 34 Years | 201 (5.9%) | 318 (10.3%) |
| 35 to 39 Years | 192 (5.6%) | 179 (5.8%) |
| 40 to 44 Years | 366 (10.7%) | 162 (5.2%) |
| 45 to 49 Years | 165 (4.8%) | 220 (7.1%) |
| 50 to 54 Years | 307 (9.0%) | 154 (5.0%) |
| 55 to 59 Years | 125 (3.7%) | 184 (5.9%) |
| 60 to 64 Years | 234 (6.9%) | 228 (7.4%) |
| 65 to 69 Years | 163 (4.8%) | 130 (4.2%) |
| 70 to 74 Years | 80 (2.3%) | 183 (5.9%) |
| 75 to 79 Years | 45 (1.3%) | 127 (4.1%) |
| 80 to 84 Years | 50 (1.5%) | 42 (1.4%) |
| 85 Years and over | 28 (0.8%) | 80 (2.6%) |
| Total | 3,413 (100.0%) | 3,099 (100.0%) |
Families and Households in Catasauqua borough
Median Family Size in Catasauqua borough
The median family size in Catasauqua borough is 2.91 persons per family, with married-couple families (1,120 | 63.0%) accounting for the largest median family size of 3.04 persons per family. On the other hand, single male/father families (283 | 15.9%) represent the smallest median family size with 2.55 persons per family.
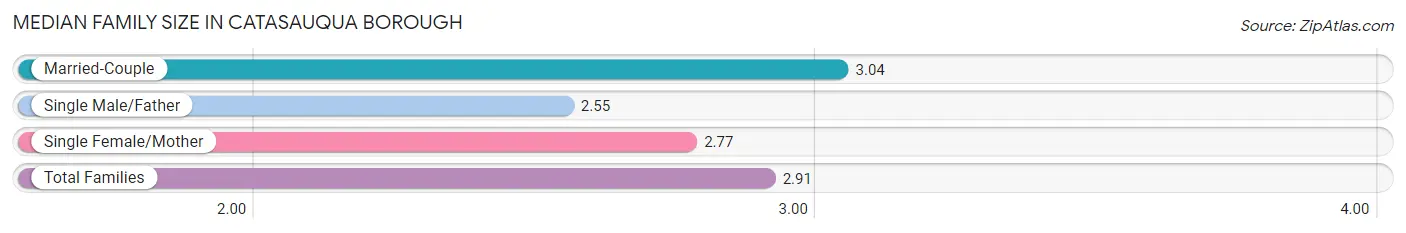
| Family Type | # Families | Family Size |
| Married-Couple | 1,120 (63.0%) | 3.04 |
| Single Male/Father | 283 (15.9%) | 2.55 |
| Single Female/Mother | 375 (21.1%) | 2.77 |
| Total Families | 1,778 (100.0%) | 2.91 |
Median Household Size in Catasauqua borough
The median household size in Catasauqua borough is 2.36 persons per household, with married-couple households (1,120 | 40.6%) accounting for the largest median household size of 3.07 persons per household. non-family households (979 | 35.5%) represent the smallest median household size with 1.23 persons per household.
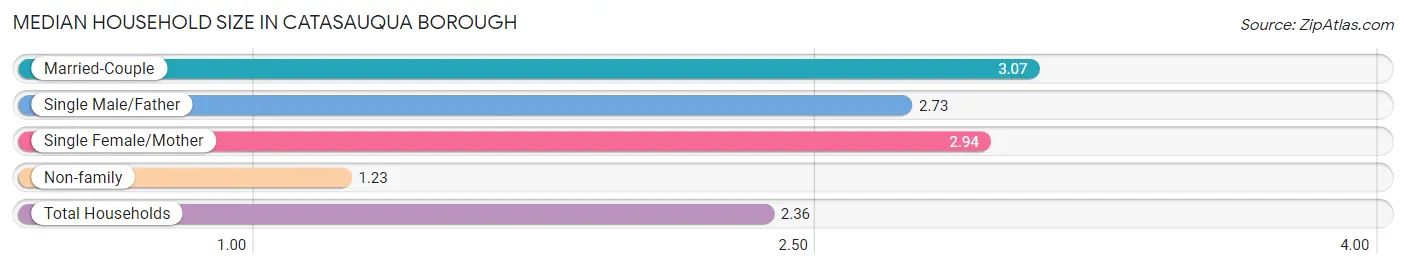
| Household Type | # Households | Household Size |
| Married-Couple | 1,120 (40.6%) | 3.07 |
| Single Male/Father | 283 (10.3%) | 2.73 |
| Single Female/Mother | 375 (13.6%) | 2.94 |
| Non-family | 979 (35.5%) | 1.23 |
| Total Households | 2,757 (100.0%) | 2.36 |
Household Size by Marriage Status in Catasauqua borough
Out of a total of 2,757 households in Catasauqua borough, 1,778 (64.5%) are family households, while 979 (35.5%) are nonfamily households. The most numerous type of family households are 2-person households, comprising 799, and the most common type of nonfamily households are 1-person households, comprising 811.
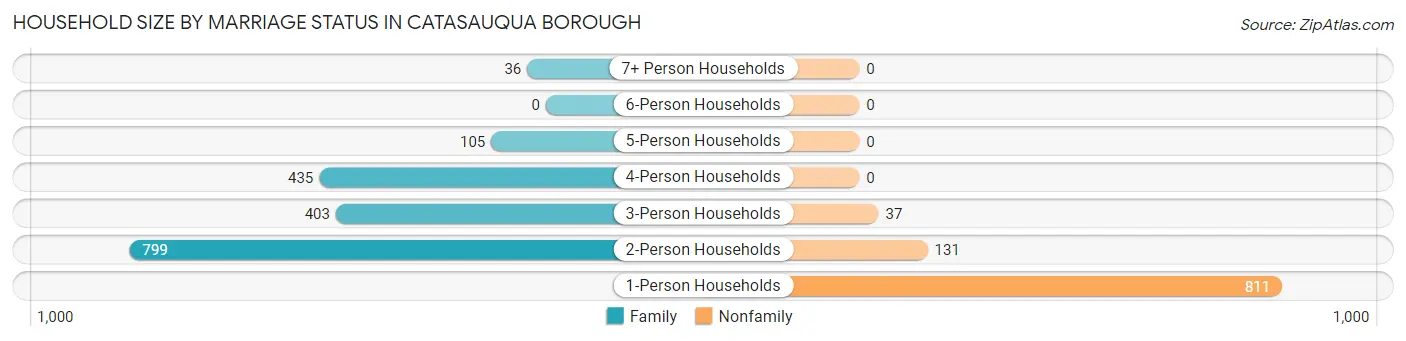
| Household Size | Family Households | Nonfamily Households |
| 1-Person Households | - | 811 (29.4%) |
| 2-Person Households | 799 (29.0%) | 131 (4.8%) |
| 3-Person Households | 403 (14.6%) | 37 (1.3%) |
| 4-Person Households | 435 (15.8%) | 0 (0.0%) |
| 5-Person Households | 105 (3.8%) | 0 (0.0%) |
| 6-Person Households | 0 (0.0%) | 0 (0.0%) |
| 7+ Person Households | 36 (1.3%) | 0 (0.0%) |
| Total | 1,778 (64.5%) | 979 (35.5%) |
Female Fertility in Catasauqua borough
Fertility by Age in Catasauqua borough
Average fertility rate in Catasauqua borough is 28.0 births per 1,000 women. Women in the age bracket of 20 to 34 years have the highest fertility rate with 75.0 births per 1,000 women. Women in the age bracket of 20 to 34 years acount for 100.0% of all women with births.
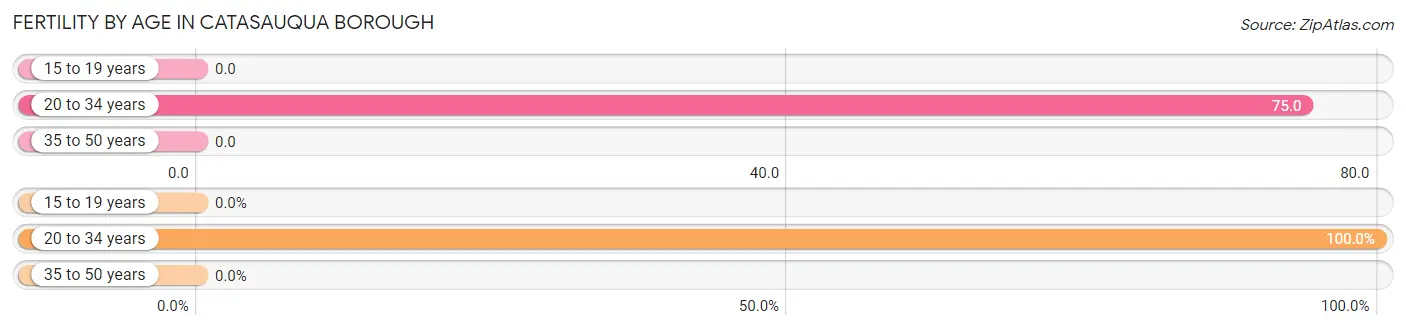
| Age Bracket | Women with Births | Births / 1,000 Women |
| 15 to 19 years | 0 (0.0%) | 0.0 |
| 20 to 34 years | 43 (100.0%) | 75.0 |
| 35 to 50 years | 0 (0.0%) | 0.0 |
| Total | 43 (100.0%) | 28.0 |
Fertility by Age by Marriage Status in Catasauqua borough
51.2% of women with births (43) in Catasauqua borough are married. The highest percentage of unmarried women with births falls into 20 to 34 years age bracket with 48.8% of them unmarried at the time of birth, while the lowest percentage of unmarried women with births belong to 20 to 34 years age bracket with 48.8% of them unmarried.
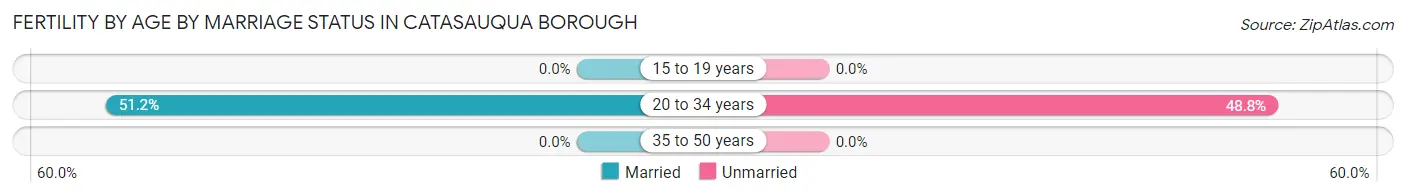
| Age Bracket | Married | Unmarried |
| 15 to 19 years | 0 (0.0%) | 0 (0.0%) |
| 20 to 34 years | 22 (51.2%) | 21 (48.8%) |
| 35 to 50 years | 0 (0.0%) | 0 (0.0%) |
| Total | 22 (51.2%) | 21 (48.8%) |
Fertility by Education in Catasauqua borough
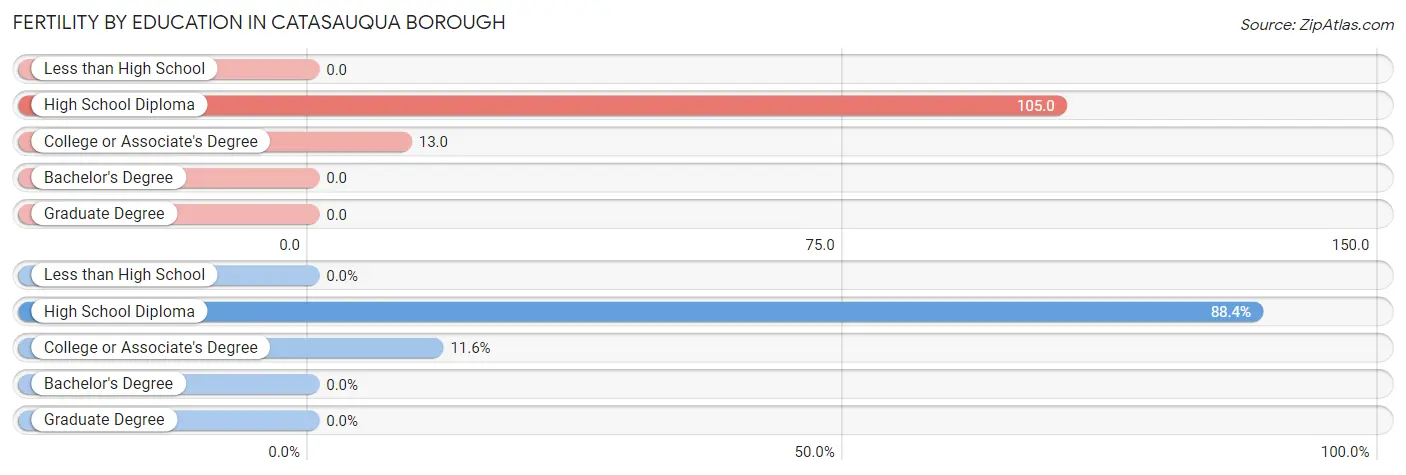
| Educational Attainment | Women with Births | Births / 1,000 Women |
| Less than High School | 0 (0.0%) | 0.0 |
| High School Diploma | 38 (88.4%) | 105.0 |
| College or Associate's Degree | 5 (11.6%) | 13.0 |
| Bachelor's Degree | 0 (0.0%) | 0.0 |
| Graduate Degree | 0 (0.0%) | 0.0 |
| Total | 43 (100.0%) | 28.0 |
Fertility by Education by Marriage Status in Catasauqua borough
48.8% of women with births in Catasauqua borough are unmarried. Women with the educational attainment of college or associate's degree are most likely to be married with 100.0% of them married at childbirth, while women with the educational attainment of high school diploma are least likely to be married with 55.3% of them unmarried at childbirth.
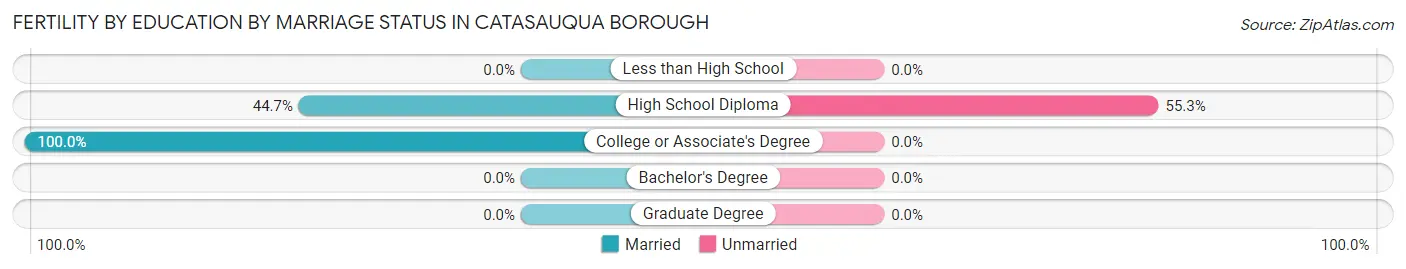
| Educational Attainment | Married | Unmarried |
| Less than High School | 0 (0.0%) | 0 (0.0%) |
| High School Diploma | 17 (44.7%) | 21 (55.3%) |
| College or Associate's Degree | 5 (100.0%) | 0 (0.0%) |
| Bachelor's Degree | 0 (0.0%) | 0 (0.0%) |
| Graduate Degree | 0 (0.0%) | 0 (0.0%) |
| Total | 22 (51.2%) | 21 (48.8%) |
Employment Characteristics in Catasauqua borough
Employment by Class of Employer in Catasauqua borough
Among the 3,593 employed individuals in Catasauqua borough, private company employees (2,624 | 73.0%), not-for-profit organizations (452 | 12.6%), and self-employed (not incorporated) (153 | 4.3%) make up the most common classes of employment.
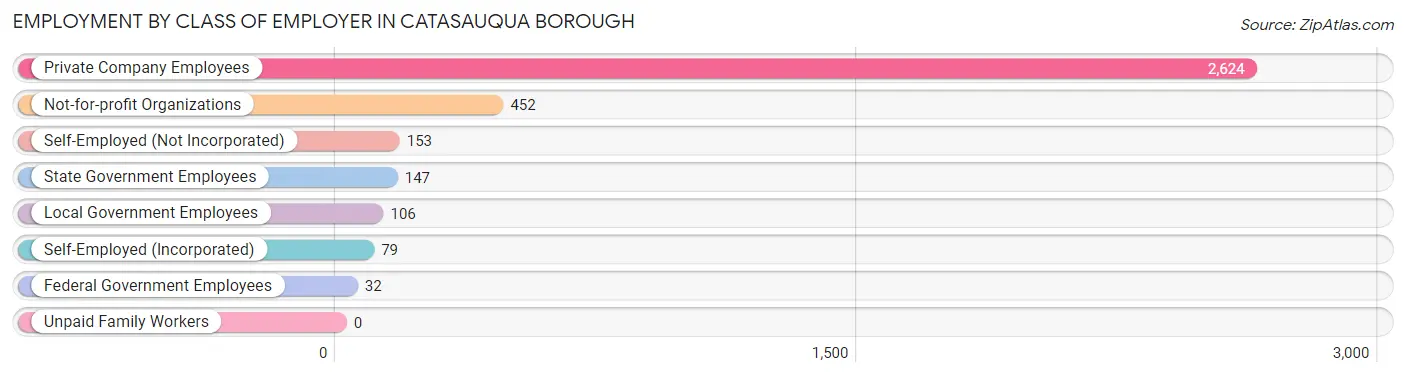
| Employer Class | # Employees | % Employees |
| Private Company Employees | 2,624 | 73.0% |
| Self-Employed (Incorporated) | 79 | 2.2% |
| Self-Employed (Not Incorporated) | 153 | 4.3% |
| Not-for-profit Organizations | 452 | 12.6% |
| Local Government Employees | 106 | 2.9% |
| State Government Employees | 147 | 4.1% |
| Federal Government Employees | 32 | 0.9% |
| Unpaid Family Workers | 0 | 0.0% |
| Total | 3,593 | 100.0% |
Employment Status by Age in Catasauqua borough
According to the labor force statistics for Catasauqua borough, out of the total population over 16 years of age (5,388), 73.3% or 3,949 individuals are in the labor force, with 8.3% or 328 of them unemployed. The age group with the highest labor force participation rate is 30 to 34 years, with 97.1% or 504 individuals in the labor force. Within the labor force, the 16 to 19 years age range has the highest percentage of unemployed individuals, with 55.3% or 177 of them being unemployed.
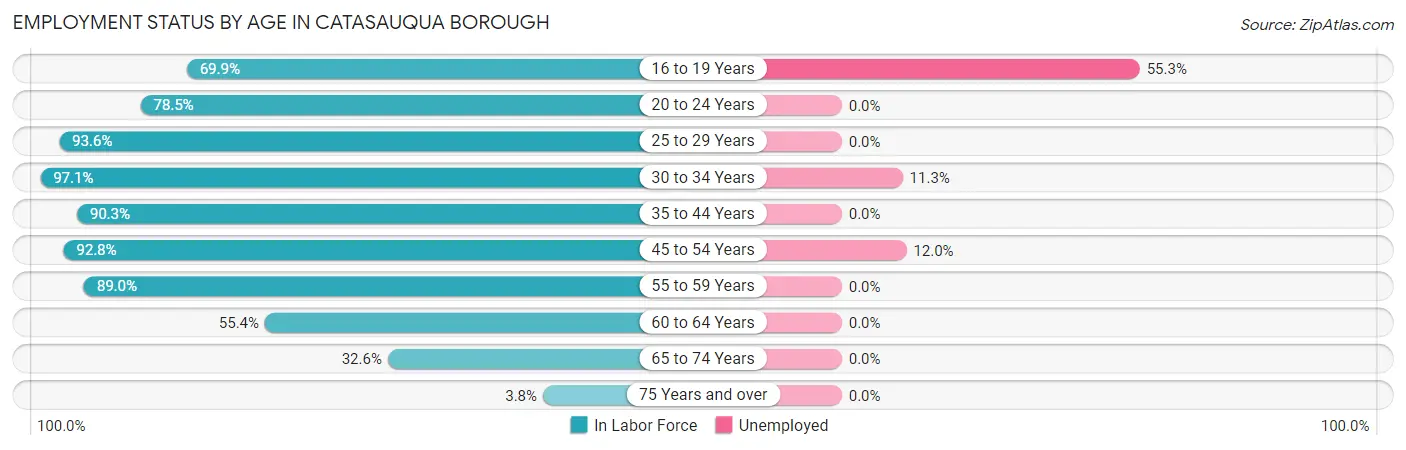
| Age Bracket | In Labor Force | Unemployed |
| 16 to 19 Years | 320 (69.9%) | 177 (55.3%) |
| 20 to 24 Years | 526 (78.5%) | 0 (0.0%) |
| 25 to 29 Years | 278 (93.6%) | 0 (0.0%) |
| 30 to 34 Years | 504 (97.1%) | 57 (11.3%) |
| 35 to 44 Years | 812 (90.3%) | 0 (0.0%) |
| 45 to 54 Years | 785 (92.8%) | 94 (12.0%) |
| 55 to 59 Years | 275 (89.0%) | 0 (0.0%) |
| 60 to 64 Years | 256 (55.4%) | 0 (0.0%) |
| 65 to 74 Years | 181 (32.6%) | 0 (0.0%) |
| 75 Years and over | 14 (3.8%) | 0 (0.0%) |
| Total | 3,949 (73.3%) | 328 (8.3%) |
Employment Status by Educational Attainment in Catasauqua borough
According to labor force statistics for Catasauqua borough, 87.3% of individuals (2,909) out of the total population between 25 and 64 years of age (3,332) are in the labor force, with 5.2% or 151 of them being unemployed. The group with the highest labor force participation rate are those with the educational attainment of college / associate degree, with 98.4% or 1,016 individuals in the labor force. Within the labor force, individuals with less than high school education have the highest percentage of unemployment, with 14.4% or 17 of them being unemployed.
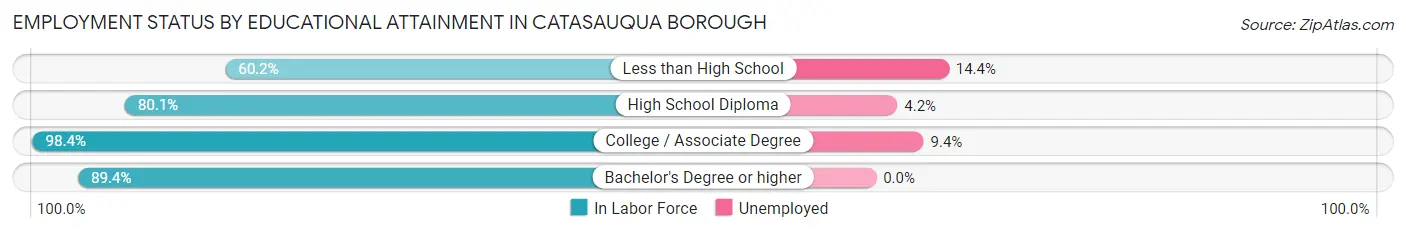
| Educational Attainment | In Labor Force | Unemployed |
| Less than High School | 118 (60.2%) | 28 (14.4%) |
| High School Diploma | 896 (80.1%) | 47 (4.2%) |
| College / Associate Degree | 1,016 (98.4%) | 97 (9.4%) |
| Bachelor's Degree or higher | 880 (89.4%) | 0 (0.0%) |
| Total | 2,909 (87.3%) | 173 (5.2%) |
Employment Occupations by Sex in Catasauqua borough
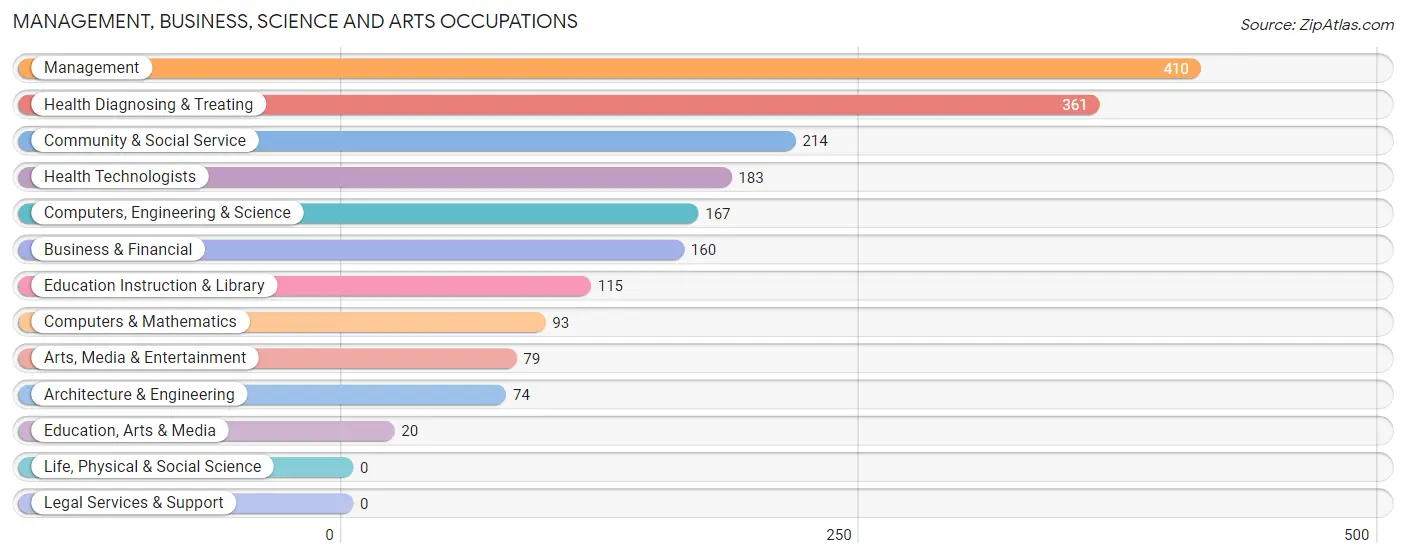
Management, Business, Science and Arts Occupations
The most common Management, Business, Science and Arts occupations in Catasauqua borough are Management (410 | 11.3%), Health Diagnosing & Treating (361 | 10.0%), Community & Social Service (214 | 5.9%), Health Technologists (183 | 5.1%), and Computers, Engineering & Science (167 | 4.6%).
Management, Business, Science and Arts Occupations by Sex
Within the Management, Business, Science and Arts occupations in Catasauqua borough, the most male-oriented occupations are Architecture & Engineering (100.0%), Computers, Engineering & Science (85.0%), and Computers & Mathematics (73.1%), while the most female-oriented occupations are Education, Arts & Media (100.0%), Health Technologists (100.0%), and Health Diagnosing & Treating (74.2%).
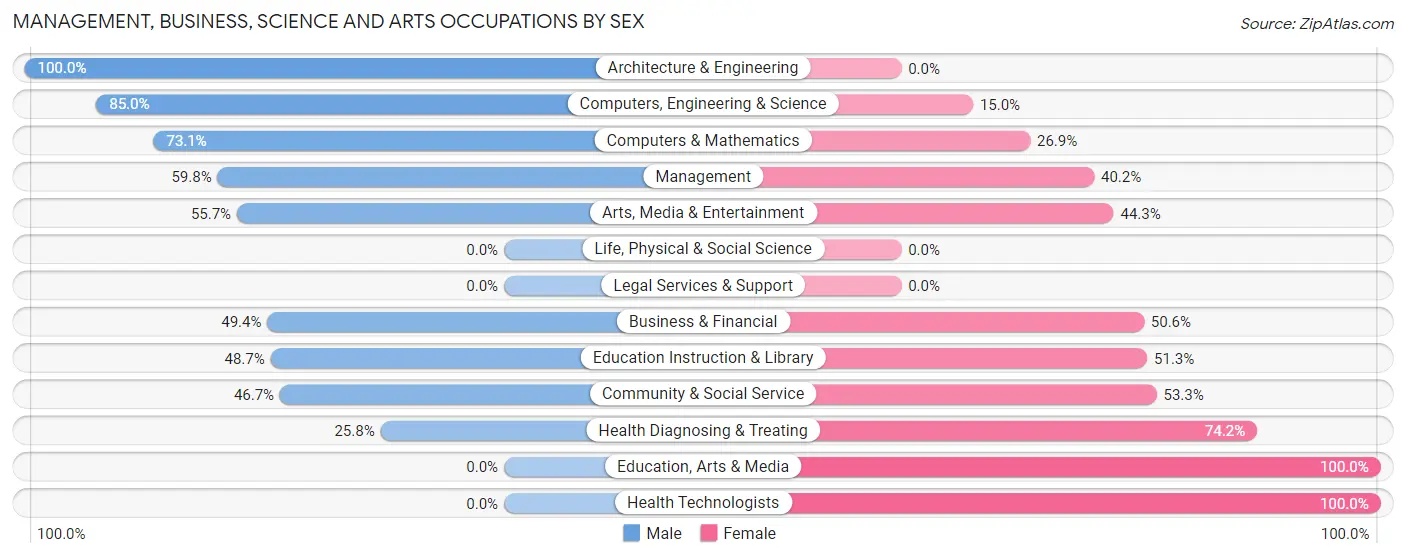
| Occupation | Male | Female |
| Management | 245 (59.8%) | 165 (40.2%) |
| Business & Financial | 79 (49.4%) | 81 (50.6%) |
| Computers, Engineering & Science | 142 (85.0%) | 25 (15.0%) |
| Computers & Mathematics | 68 (73.1%) | 25 (26.9%) |
| Architecture & Engineering | 74 (100.0%) | 0 (0.0%) |
| Life, Physical & Social Science | 0 (0.0%) | 0 (0.0%) |
| Community & Social Service | 100 (46.7%) | 114 (53.3%) |
| Education, Arts & Media | 0 (0.0%) | 20 (100.0%) |
| Legal Services & Support | 0 (0.0%) | 0 (0.0%) |
| Education Instruction & Library | 56 (48.7%) | 59 (51.3%) |
| Arts, Media & Entertainment | 44 (55.7%) | 35 (44.3%) |
| Health Diagnosing & Treating | 93 (25.8%) | 268 (74.2%) |
| Health Technologists | 0 (0.0%) | 183 (100.0%) |
| Total (Category) | 659 (50.2%) | 653 (49.8%) |
| Total (Overall) | 2,062 (56.9%) | 1,561 (43.1%) |
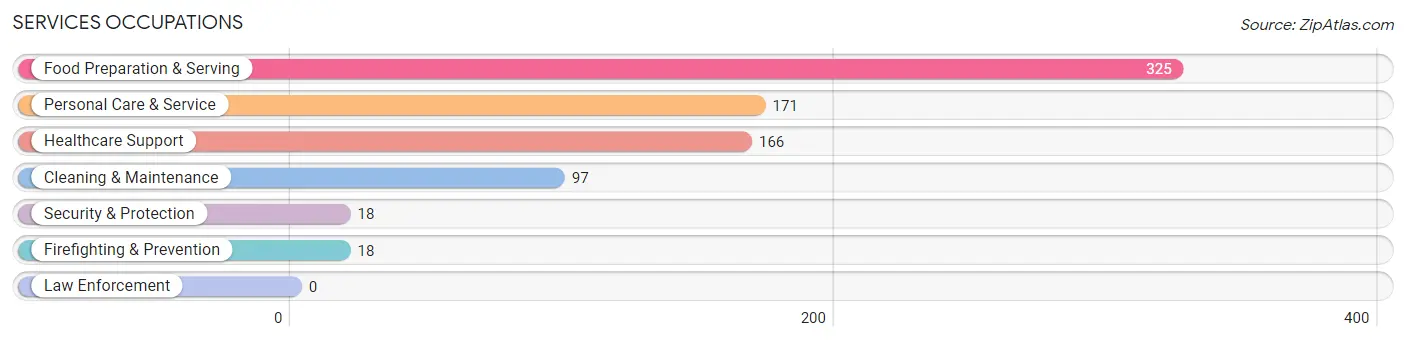
Services Occupations
The most common Services occupations in Catasauqua borough are Food Preparation & Serving (325 | 9.0%), Personal Care & Service (171 | 4.7%), Healthcare Support (166 | 4.6%), Cleaning & Maintenance (97 | 2.7%), and Security & Protection (18 | 0.5%).
Services Occupations by Sex
Within the Services occupations in Catasauqua borough, the most male-oriented occupations are Security & Protection (100.0%), Firefighting & Prevention (100.0%), and Cleaning & Maintenance (62.9%), while the most female-oriented occupations are Healthcare Support (90.4%), Personal Care & Service (70.8%), and Food Preparation & Serving (56.6%).
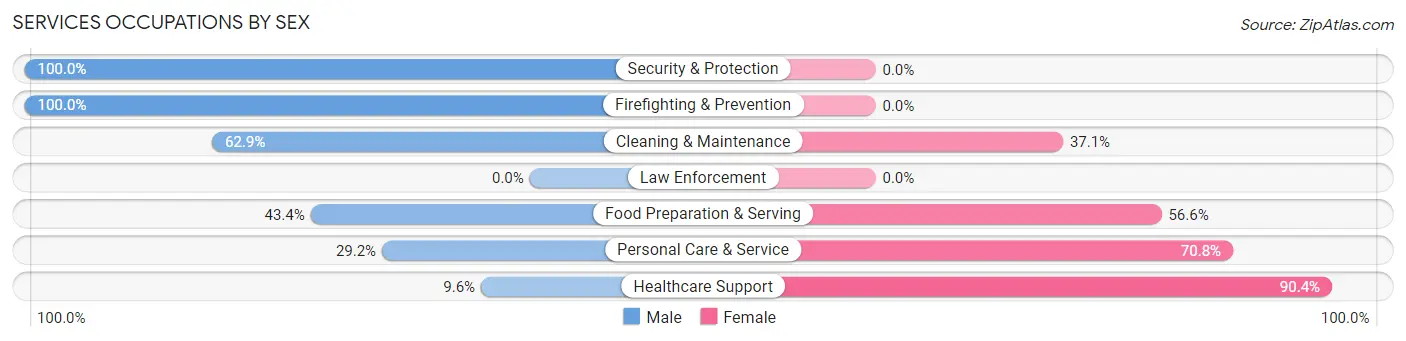
| Occupation | Male | Female |
| Healthcare Support | 16 (9.6%) | 150 (90.4%) |
| Security & Protection | 18 (100.0%) | 0 (0.0%) |
| Firefighting & Prevention | 18 (100.0%) | 0 (0.0%) |
| Law Enforcement | 0 (0.0%) | 0 (0.0%) |
| Food Preparation & Serving | 141 (43.4%) | 184 (56.6%) |
| Cleaning & Maintenance | 61 (62.9%) | 36 (37.1%) |
| Personal Care & Service | 50 (29.2%) | 121 (70.8%) |
| Total (Category) | 286 (36.8%) | 491 (63.2%) |
| Total (Overall) | 2,062 (56.9%) | 1,561 (43.1%) |
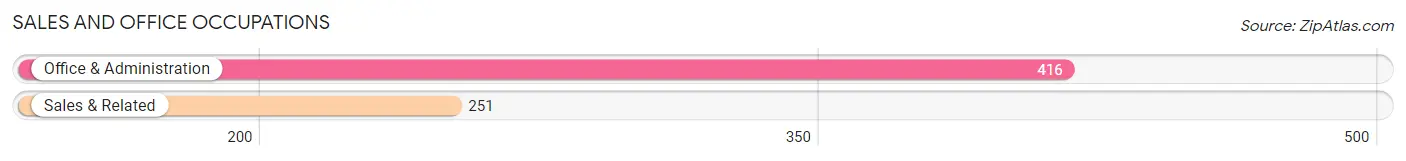
Sales and Office Occupations
The most common Sales and Office occupations in Catasauqua borough are Office & Administration (416 | 11.5%), and Sales & Related (251 | 6.9%).
Sales and Office Occupations by Sex
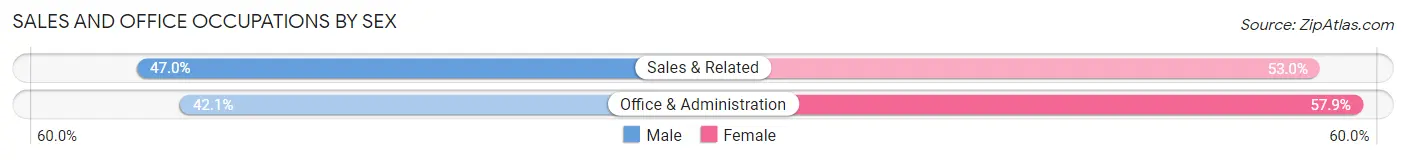
| Occupation | Male | Female |
| Sales & Related | 118 (47.0%) | 133 (53.0%) |
| Office & Administration | 175 (42.1%) | 241 (57.9%) |
| Total (Category) | 293 (43.9%) | 374 (56.1%) |
| Total (Overall) | 2,062 (56.9%) | 1,561 (43.1%) |
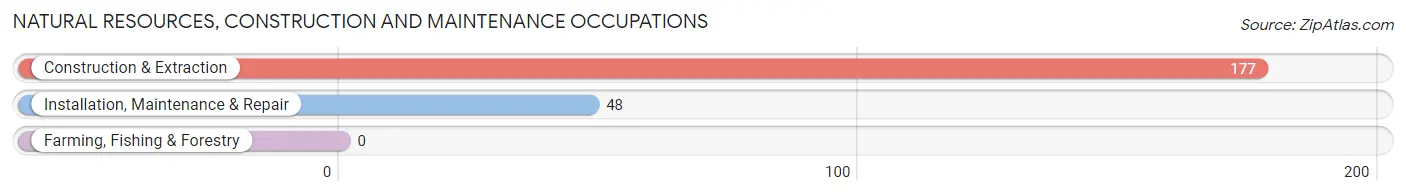
Natural Resources, Construction and Maintenance Occupations
The most common Natural Resources, Construction and Maintenance occupations in Catasauqua borough are Construction & Extraction (177 | 4.9%), and Installation, Maintenance & Repair (48 | 1.3%).
Natural Resources, Construction and Maintenance Occupations by Sex
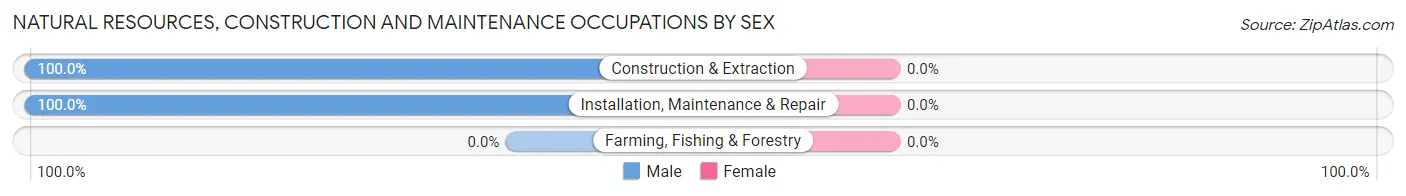
| Occupation | Male | Female |
| Farming, Fishing & Forestry | 0 (0.0%) | 0 (0.0%) |
| Construction & Extraction | 177 (100.0%) | 0 (0.0%) |
| Installation, Maintenance & Repair | 48 (100.0%) | 0 (0.0%) |
| Total (Category) | 225 (100.0%) | 0 (0.0%) |
| Total (Overall) | 2,062 (56.9%) | 1,561 (43.1%) |
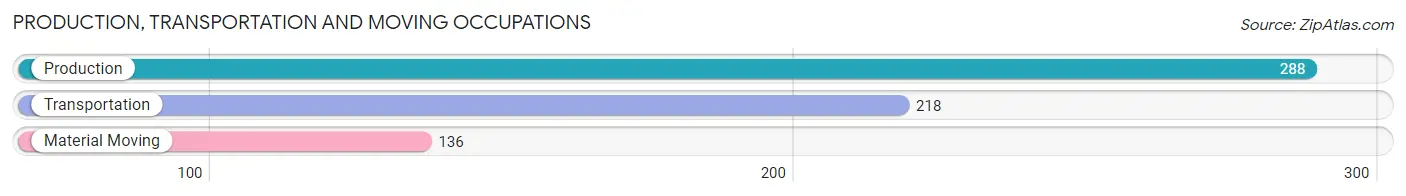
Production, Transportation and Moving Occupations
The most common Production, Transportation and Moving occupations in Catasauqua borough are Production (288 | 8.0%), Transportation (218 | 6.0%), and Material Moving (136 | 3.7%).
Production, Transportation and Moving Occupations by Sex
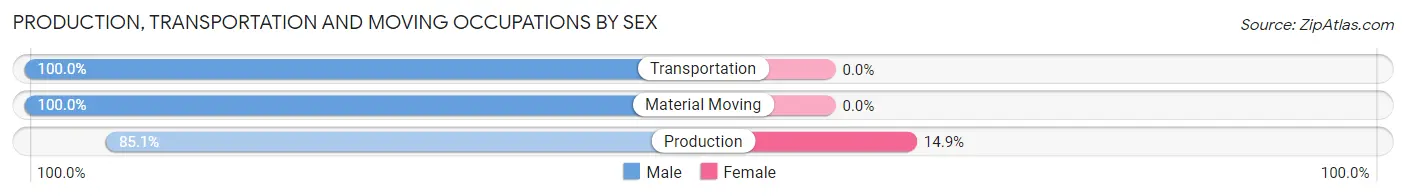
| Occupation | Male | Female |
| Production | 245 (85.1%) | 43 (14.9%) |
| Transportation | 218 (100.0%) | 0 (0.0%) |
| Material Moving | 136 (100.0%) | 0 (0.0%) |
| Total (Category) | 599 (93.3%) | 43 (6.7%) |
| Total (Overall) | 2,062 (56.9%) | 1,561 (43.1%) |
Employment Industries by Sex in Catasauqua borough
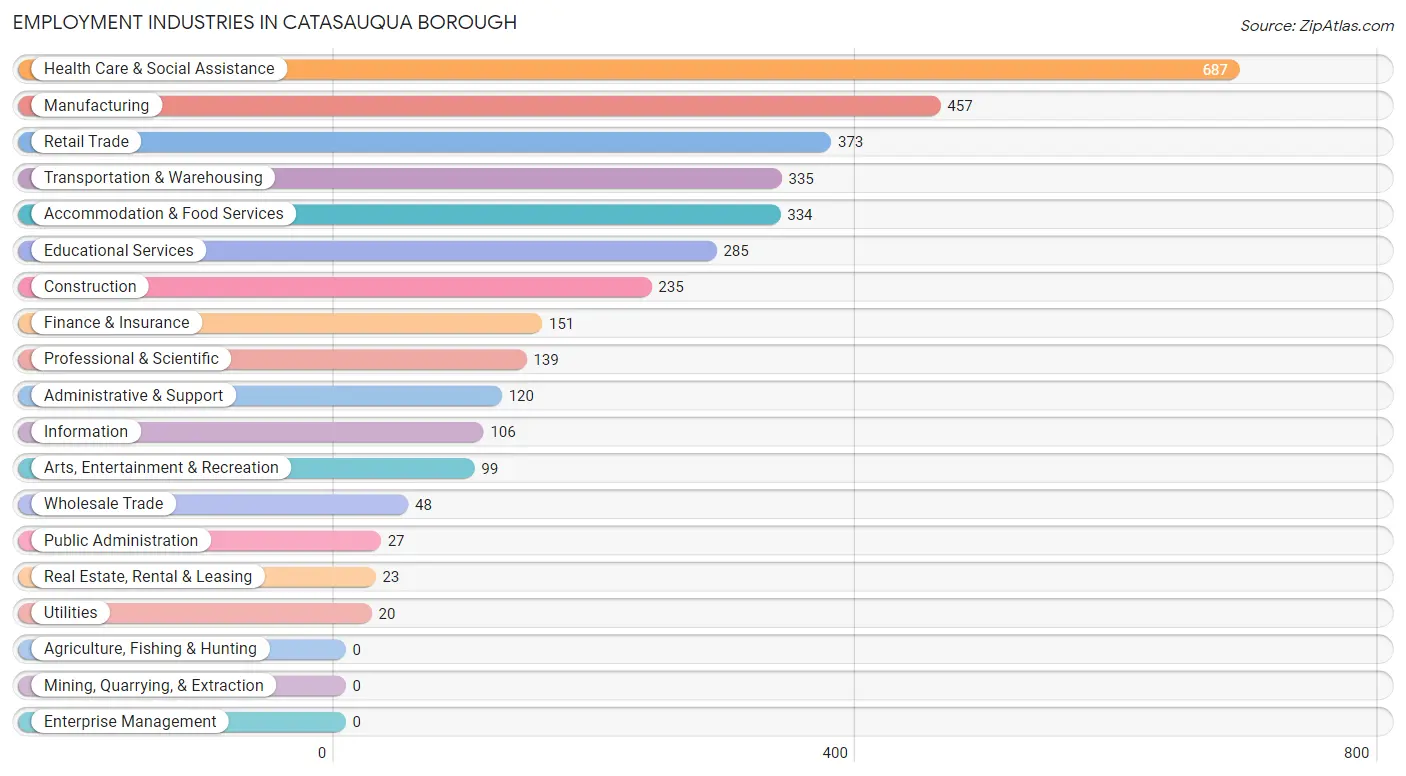
Employment Industries in Catasauqua borough
The major employment industries in Catasauqua borough include Health Care & Social Assistance (687 | 19.0%), Manufacturing (457 | 12.6%), Retail Trade (373 | 10.3%), Transportation & Warehousing (335 | 9.2%), and Accommodation & Food Services (334 | 9.2%).
Employment Industries by Sex in Catasauqua borough
The Catasauqua borough industries that see more men than women are Construction (100.0%), Wholesale Trade (100.0%), and Utilities (100.0%), whereas the industries that tend to have a higher number of women are Health Care & Social Assistance (73.5%), Finance & Insurance (69.5%), and Arts, Entertainment & Recreation (64.6%).
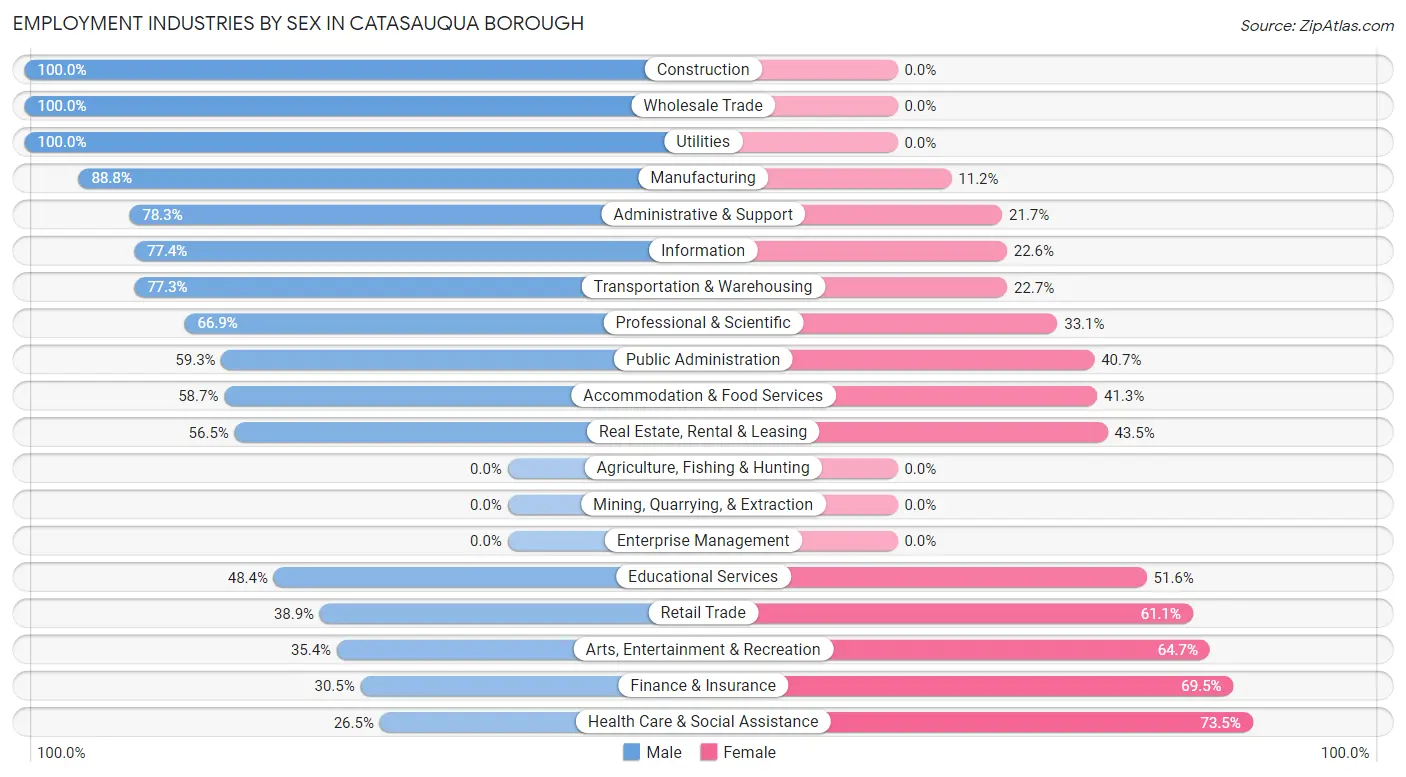
| Industry | Male | Female |
| Agriculture, Fishing & Hunting | 0 (0.0%) | 0 (0.0%) |
| Mining, Quarrying, & Extraction | 0 (0.0%) | 0 (0.0%) |
| Construction | 235 (100.0%) | 0 (0.0%) |
| Manufacturing | 406 (88.8%) | 51 (11.2%) |
| Wholesale Trade | 48 (100.0%) | 0 (0.0%) |
| Retail Trade | 145 (38.9%) | 228 (61.1%) |
| Transportation & Warehousing | 259 (77.3%) | 76 (22.7%) |
| Utilities | 20 (100.0%) | 0 (0.0%) |
| Information | 82 (77.4%) | 24 (22.6%) |
| Finance & Insurance | 46 (30.5%) | 105 (69.5%) |
| Real Estate, Rental & Leasing | 13 (56.5%) | 10 (43.5%) |
| Professional & Scientific | 93 (66.9%) | 46 (33.1%) |
| Enterprise Management | 0 (0.0%) | 0 (0.0%) |
| Administrative & Support | 94 (78.3%) | 26 (21.7%) |
| Educational Services | 138 (48.4%) | 147 (51.6%) |
| Health Care & Social Assistance | 182 (26.5%) | 505 (73.5%) |
| Arts, Entertainment & Recreation | 35 (35.3%) | 64 (64.6%) |
| Accommodation & Food Services | 196 (58.7%) | 138 (41.3%) |
| Public Administration | 16 (59.3%) | 11 (40.7%) |
| Total | 2,062 (56.9%) | 1,561 (43.1%) |
Education in Catasauqua borough
School Enrollment in Catasauqua borough
The most common levels of schooling among the 1,234 students in Catasauqua borough are high school (467 | 37.8%), middle school (382 | 31.0%), and college / undergraduate (215 | 17.4%).
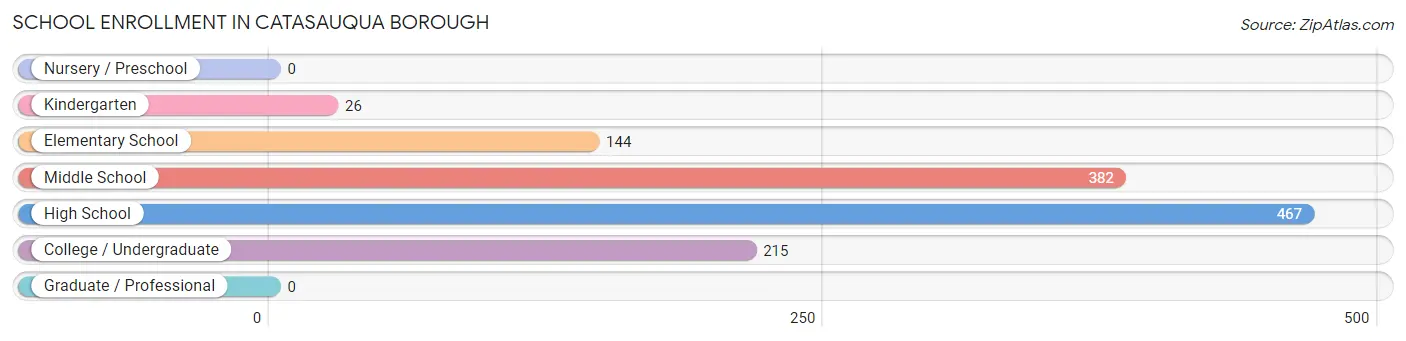
| School Level | # Students | % Students |
| Nursery / Preschool | 0 | 0.0% |
| Kindergarten | 26 | 2.1% |
| Elementary School | 144 | 11.7% |
| Middle School | 382 | 31.0% |
| High School | 467 | 37.8% |
| College / Undergraduate | 215 | 17.4% |
| Graduate / Professional | 0 | 0.0% |
| Total | 1,234 | 100.0% |
School Enrollment by Age by Funding Source in Catasauqua borough
Out of a total of 1,234 students who are enrolled in schools in Catasauqua borough, 60 (4.9%) attend a private institution, while the remaining 1,174 (95.1%) are enrolled in public schools. The age group of 35 years and over has the highest likelihood of being enrolled in private schools, with 12 (46.2% in the age bracket) enrolled. Conversely, the age group of 5 to 9 year old has the lowest likelihood of being enrolled in a private school, with 130 (100.0% in the age bracket) attending a public institution.
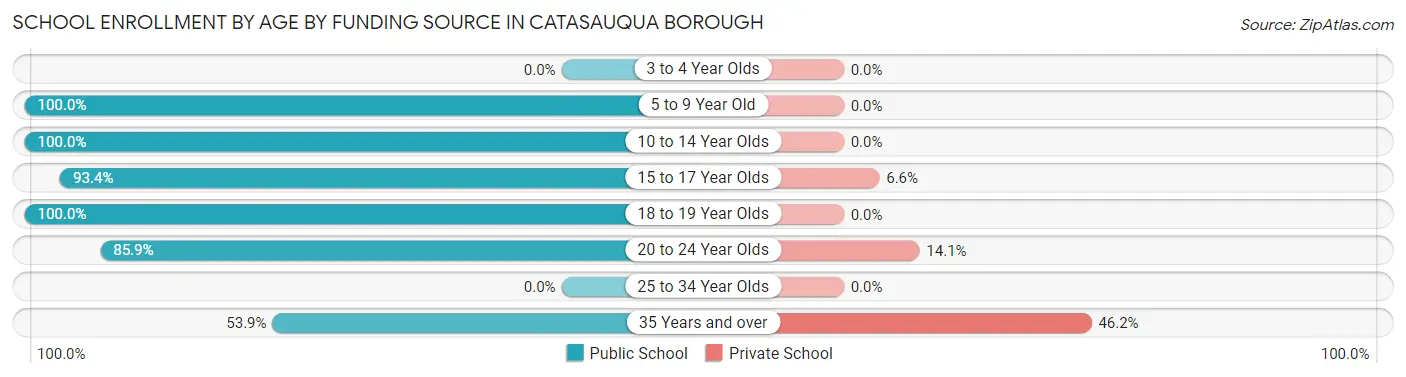
| Age Bracket | Public School | Private School |
| 3 to 4 Year Olds | 0 (0.0%) | 0 (0.0%) |
| 5 to 9 Year Old | 130 (100.0%) | 0 (0.0%) |
| 10 to 14 Year Olds | 432 (100.0%) | 0 (0.0%) |
| 15 to 17 Year Olds | 352 (93.4%) | 25 (6.6%) |
| 18 to 19 Year Olds | 106 (100.0%) | 0 (0.0%) |
| 20 to 24 Year Olds | 140 (85.9%) | 23 (14.1%) |
| 25 to 34 Year Olds | 0 (0.0%) | 0 (0.0%) |
| 35 Years and over | 14 (53.8%) | 12 (46.2%) |
| Total | 1,174 (95.1%) | 60 (4.9%) |
Educational Attainment by Field of Study in Catasauqua borough
Education (238 | 18.3%), business (196 | 15.1%), arts & humanities (156 | 12.0%), science & technology (140 | 10.8%), and engineering (125 | 9.6%) are the most common fields of study among 1,300 individuals in Catasauqua borough who have obtained a bachelor's degree or higher.
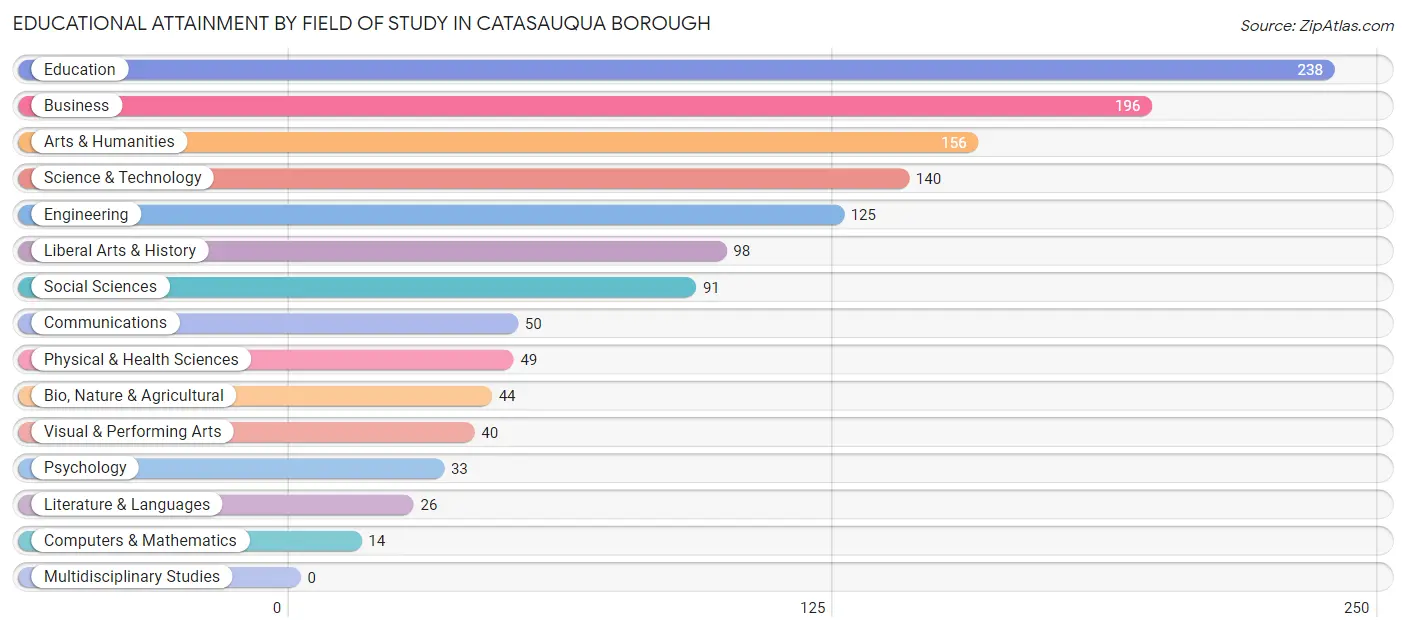
| Field of Study | # Graduates | % Graduates |
| Computers & Mathematics | 14 | 1.1% |
| Bio, Nature & Agricultural | 44 | 3.4% |
| Physical & Health Sciences | 49 | 3.8% |
| Psychology | 33 | 2.5% |
| Social Sciences | 91 | 7.0% |
| Engineering | 125 | 9.6% |
| Multidisciplinary Studies | 0 | 0.0% |
| Science & Technology | 140 | 10.8% |
| Business | 196 | 15.1% |
| Education | 238 | 18.3% |
| Literature & Languages | 26 | 2.0% |
| Liberal Arts & History | 98 | 7.5% |
| Visual & Performing Arts | 40 | 3.1% |
| Communications | 50 | 3.8% |
| Arts & Humanities | 156 | 12.0% |
| Total | 1,300 | 100.0% |
Transportation & Commute in Catasauqua borough
Vehicle Availability by Sex in Catasauqua borough
The most prevalent vehicle ownership categories in Catasauqua borough are males with 2 vehicles (1,062, accounting for 51.5%) and females with 2 vehicles (709, making up 69.4%).
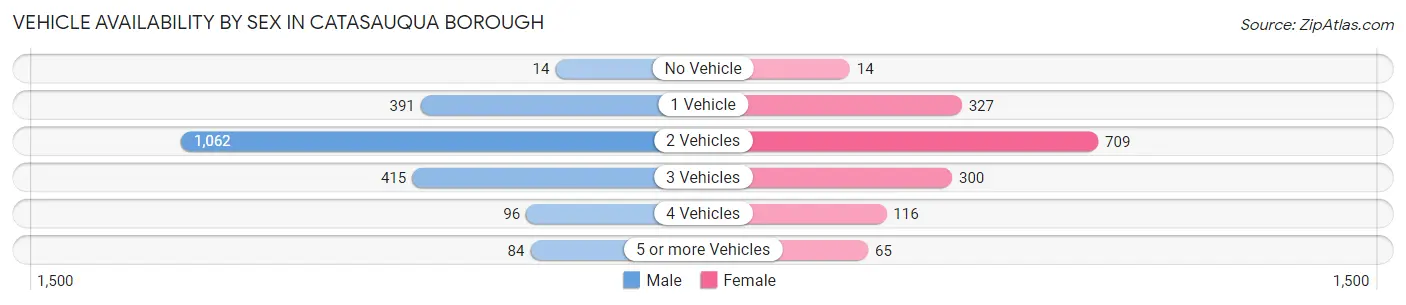
| Vehicles Available | Male | Female |
| No Vehicle | 14 (0.7%) | 14 (0.9%) |
| 1 Vehicle | 391 (19.0%) | 327 (21.4%) |
| 2 Vehicles | 1,062 (51.5%) | 709 (46.3%) |
| 3 Vehicles | 415 (20.1%) | 300 (19.6%) |
| 4 Vehicles | 96 (4.7%) | 116 (7.6%) |
| 5 or more Vehicles | 84 (4.1%) | 65 (4.3%) |
| Total | 2,062 (100.0%) | 1,531 (100.0%) |
Commute Time in Catasauqua borough
The most frequently occuring commute durations in Catasauqua borough are 20 to 24 minutes (774 commuters, 23.0%), 15 to 19 minutes (719 commuters, 21.3%), and 10 to 14 minutes (560 commuters, 16.6%).
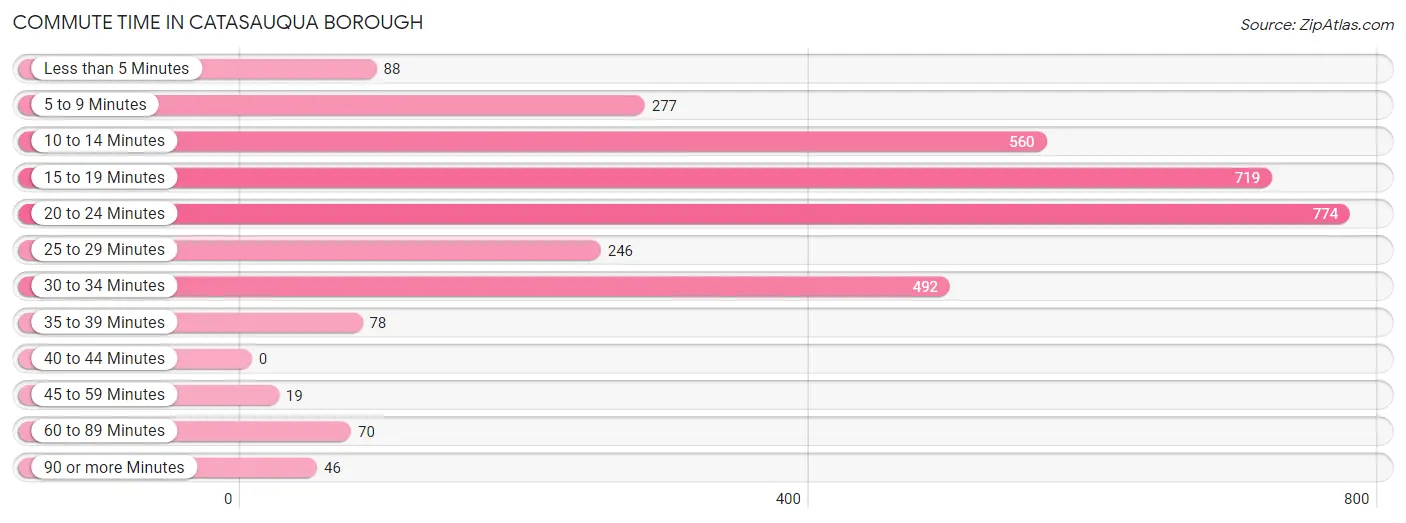
| Commute Time | # Commuters | % Commuters |
| Less than 5 Minutes | 88 | 2.6% |
| 5 to 9 Minutes | 277 | 8.2% |
| 10 to 14 Minutes | 560 | 16.6% |
| 15 to 19 Minutes | 719 | 21.3% |
| 20 to 24 Minutes | 774 | 23.0% |
| 25 to 29 Minutes | 246 | 7.3% |
| 30 to 34 Minutes | 492 | 14.6% |
| 35 to 39 Minutes | 78 | 2.3% |
| 40 to 44 Minutes | 0 | 0.0% |
| 45 to 59 Minutes | 19 | 0.6% |
| 60 to 89 Minutes | 70 | 2.1% |
| 90 or more Minutes | 46 | 1.4% |
Commute Time by Sex in Catasauqua borough
The most common commute times in Catasauqua borough are 20 to 24 minutes (467 commuters, 24.9%) for males and 15 to 19 minutes (349 commuters, 23.4%) for females.
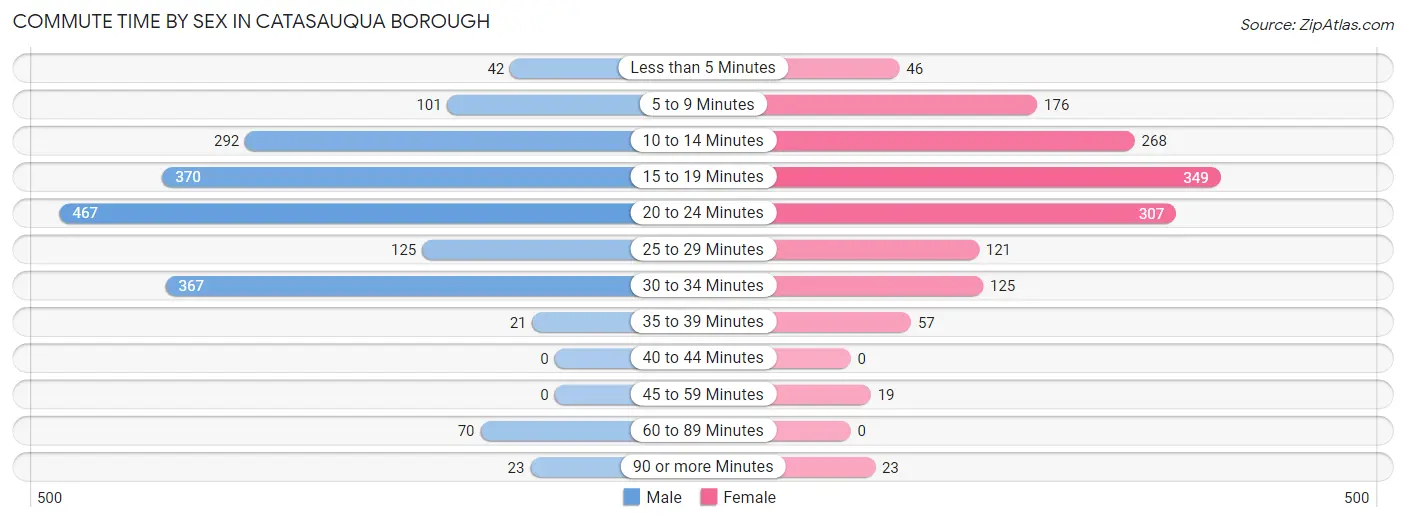
| Commute Time | Male | Female |
| Less than 5 Minutes | 42 (2.2%) | 46 (3.1%) |
| 5 to 9 Minutes | 101 (5.4%) | 176 (11.8%) |
| 10 to 14 Minutes | 292 (15.5%) | 268 (18.0%) |
| 15 to 19 Minutes | 370 (19.7%) | 349 (23.4%) |
| 20 to 24 Minutes | 467 (24.9%) | 307 (20.6%) |
| 25 to 29 Minutes | 125 (6.7%) | 121 (8.1%) |
| 30 to 34 Minutes | 367 (19.5%) | 125 (8.4%) |
| 35 to 39 Minutes | 21 (1.1%) | 57 (3.8%) |
| 40 to 44 Minutes | 0 (0.0%) | 0 (0.0%) |
| 45 to 59 Minutes | 0 (0.0%) | 19 (1.3%) |
| 60 to 89 Minutes | 70 (3.7%) | 0 (0.0%) |
| 90 or more Minutes | 23 (1.2%) | 23 (1.5%) |
Time of Departure to Work by Sex in Catasauqua borough
The most frequent times of departure to work in Catasauqua borough are 6:00 AM to 6:29 AM (309, 16.5%) for males and 7:30 AM to 7:59 AM (285, 19.1%) for females.
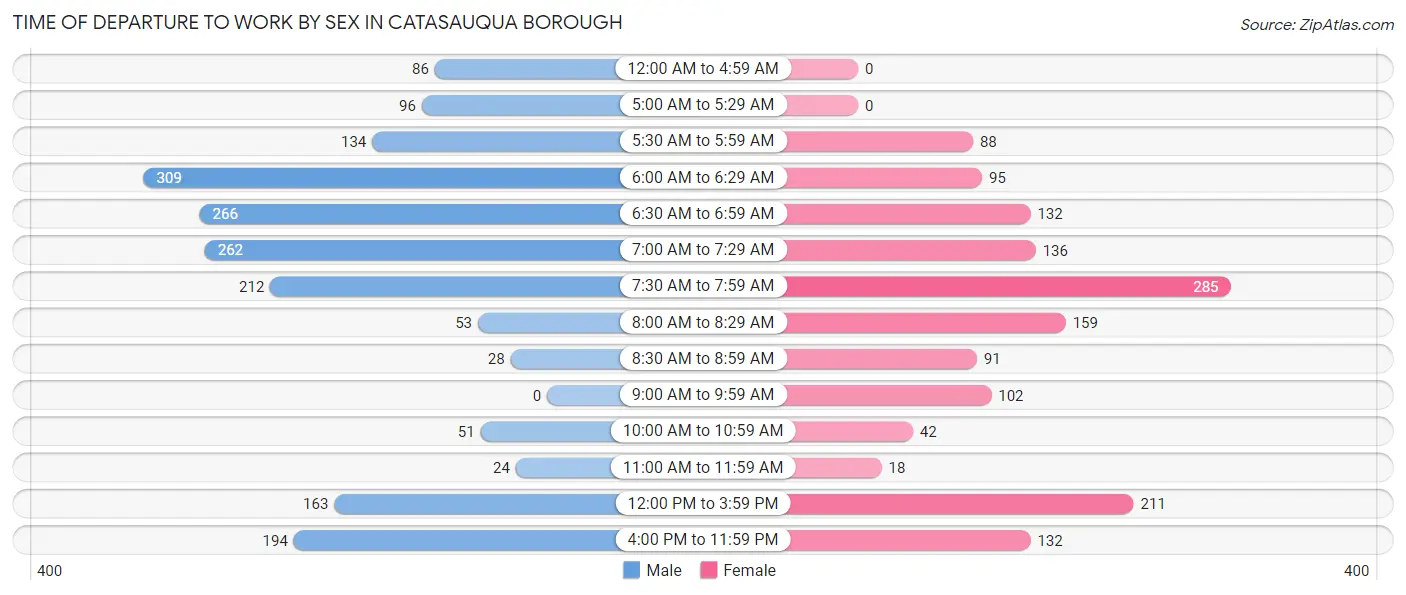
| Time of Departure | Male | Female |
| 12:00 AM to 4:59 AM | 86 (4.6%) | 0 (0.0%) |
| 5:00 AM to 5:29 AM | 96 (5.1%) | 0 (0.0%) |
| 5:30 AM to 5:59 AM | 134 (7.1%) | 88 (5.9%) |
| 6:00 AM to 6:29 AM | 309 (16.5%) | 95 (6.4%) |
| 6:30 AM to 6:59 AM | 266 (14.2%) | 132 (8.8%) |
| 7:00 AM to 7:29 AM | 262 (14.0%) | 136 (9.1%) |
| 7:30 AM to 7:59 AM | 212 (11.3%) | 285 (19.1%) |
| 8:00 AM to 8:29 AM | 53 (2.8%) | 159 (10.7%) |
| 8:30 AM to 8:59 AM | 28 (1.5%) | 91 (6.1%) |
| 9:00 AM to 9:59 AM | 0 (0.0%) | 102 (6.8%) |
| 10:00 AM to 10:59 AM | 51 (2.7%) | 42 (2.8%) |
| 11:00 AM to 11:59 AM | 24 (1.3%) | 18 (1.2%) |
| 12:00 PM to 3:59 PM | 163 (8.7%) | 211 (14.1%) |
| 4:00 PM to 11:59 PM | 194 (10.3%) | 132 (8.8%) |
| Total | 1,878 (100.0%) | 1,491 (100.0%) |
Housing Occupancy in Catasauqua borough
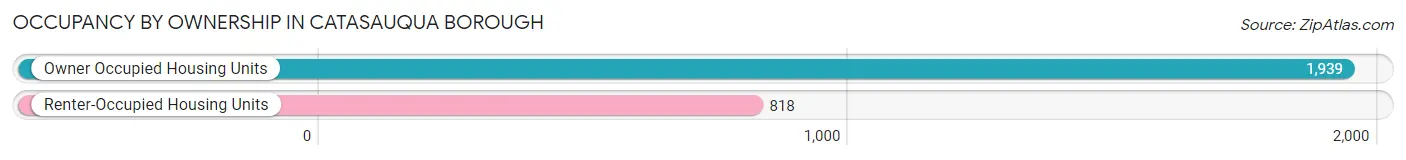
Occupancy by Ownership in Catasauqua borough
Of the total 2,757 dwellings in Catasauqua borough, owner-occupied units account for 1,939 (70.3%), while renter-occupied units make up 818 (29.7%).
| Occupancy | # Housing Units | % Housing Units |
| Owner Occupied Housing Units | 1,939 | 70.3% |
| Renter-Occupied Housing Units | 818 | 29.7% |
| Total Occupied Housing Units | 2,757 | 100.0% |
Occupancy by Household Size in Catasauqua borough
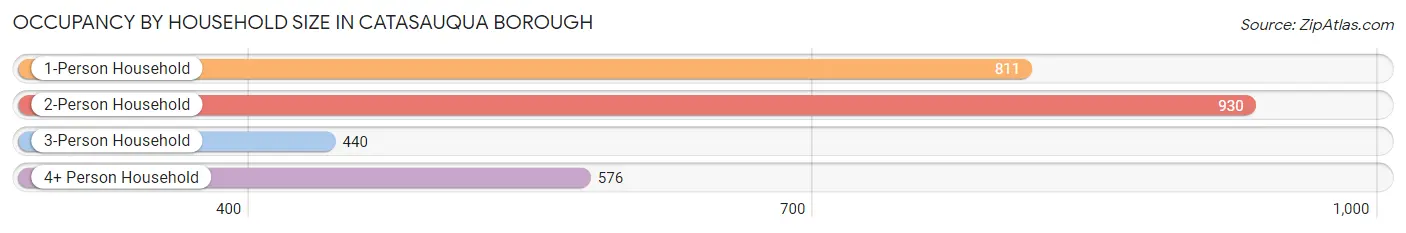
| Household Size | # Housing Units | % Housing Units |
| 1-Person Household | 811 | 29.4% |
| 2-Person Household | 930 | 33.7% |
| 3-Person Household | 440 | 16.0% |
| 4+ Person Household | 576 | 20.9% |
| Total Housing Units | 2,757 | 100.0% |
Occupancy by Ownership by Household Size in Catasauqua borough
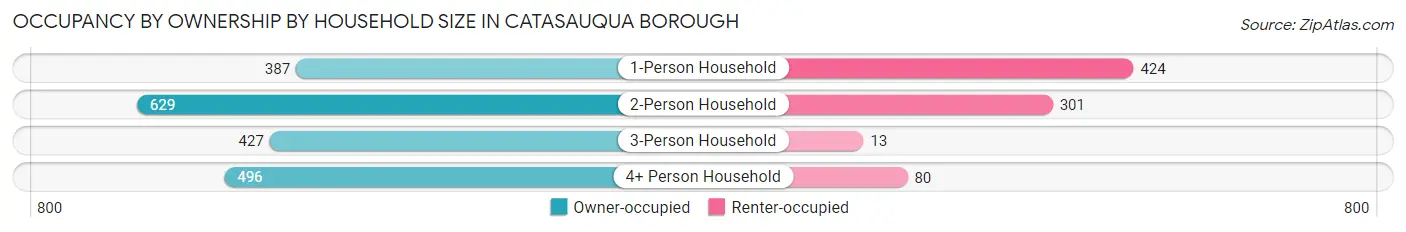
| Household Size | Owner-occupied | Renter-occupied |
| 1-Person Household | 387 (47.7%) | 424 (52.3%) |
| 2-Person Household | 629 (67.6%) | 301 (32.4%) |
| 3-Person Household | 427 (97.1%) | 13 (2.9%) |
| 4+ Person Household | 496 (86.1%) | 80 (13.9%) |
| Total Housing Units | 1,939 (70.3%) | 818 (29.7%) |
Occupancy by Educational Attainment in Catasauqua borough
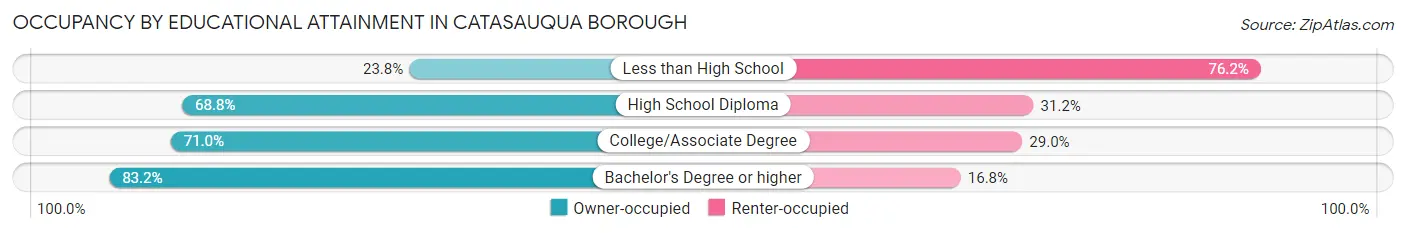
| Household Size | Owner-occupied | Renter-occupied |
| Less than High School | 39 (23.8%) | 125 (76.2%) |
| High School Diploma | 674 (68.8%) | 306 (31.2%) |
| College/Associate Degree | 676 (71.0%) | 276 (29.0%) |
| Bachelor's Degree or higher | 550 (83.2%) | 111 (16.8%) |
Occupancy by Age of Householder in Catasauqua borough
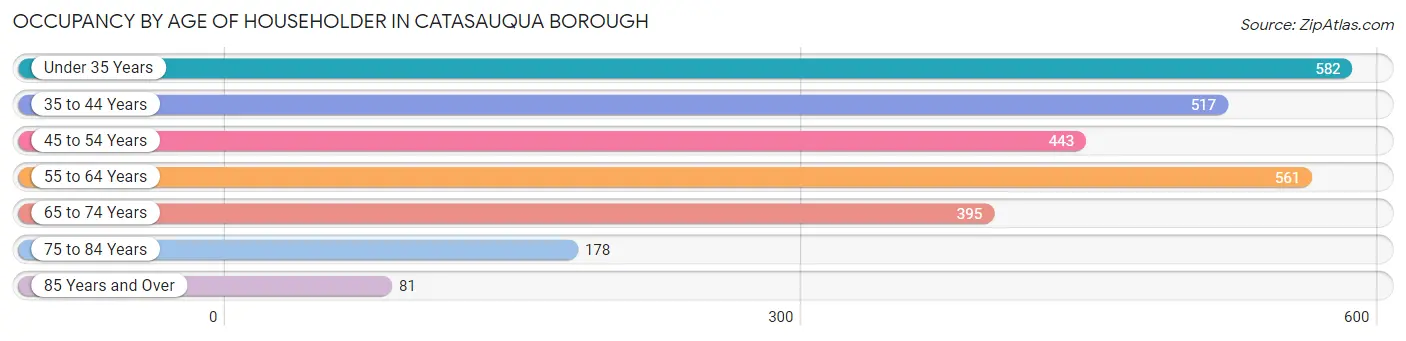
| Age Bracket | # Households | % Households |
| Under 35 Years | 582 | 21.1% |
| 35 to 44 Years | 517 | 18.8% |
| 45 to 54 Years | 443 | 16.1% |
| 55 to 64 Years | 561 | 20.3% |
| 65 to 74 Years | 395 | 14.3% |
| 75 to 84 Years | 178 | 6.5% |
| 85 Years and Over | 81 | 2.9% |
| Total | 2,757 | 100.0% |
Housing Finances in Catasauqua borough
Median Income by Occupancy in Catasauqua borough
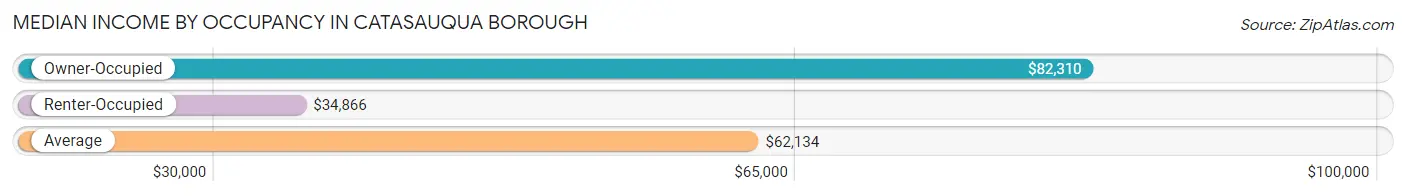
| Occupancy Type | # Households | Median Income |
| Owner-Occupied | 1,939 (70.3%) | $82,310 |
| Renter-Occupied | 818 (29.7%) | $34,866 |
| Average | 2,757 (100.0%) | $62,134 |
Occupancy by Householder Income Bracket in Catasauqua borough
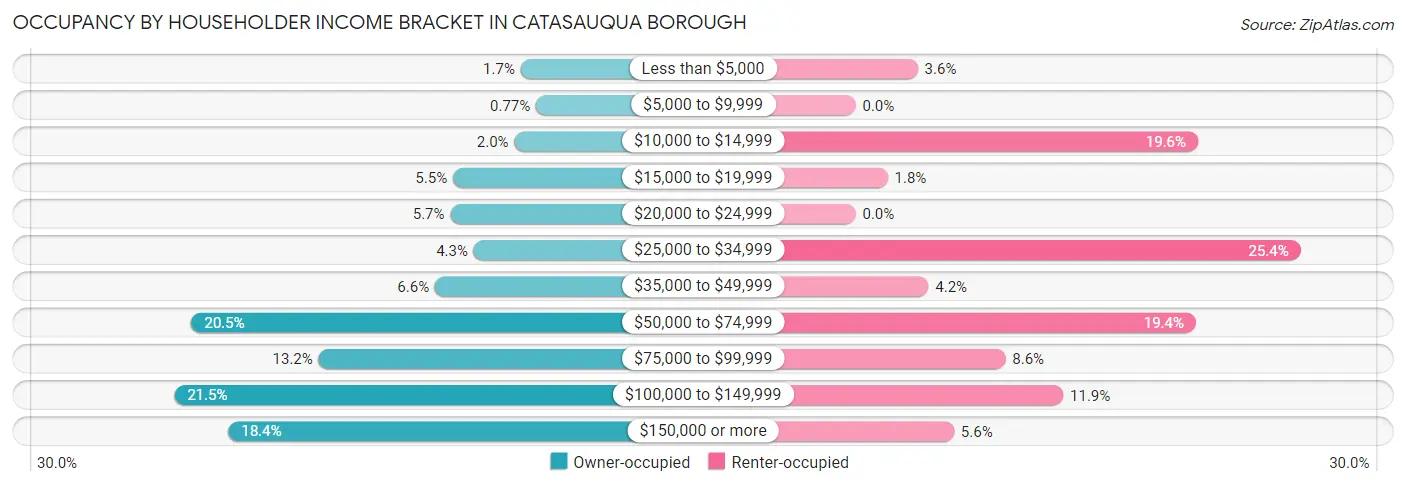
| Income Bracket | Owner-occupied | Renter-occupied |
| Less than $5,000 | 32 (1.7%) | 29 (3.5%) |
| $5,000 to $9,999 | 15 (0.8%) | 0 (0.0%) |
| $10,000 to $14,999 | 39 (2.0%) | 160 (19.6%) |
| $15,000 to $19,999 | 107 (5.5%) | 15 (1.8%) |
| $20,000 to $24,999 | 110 (5.7%) | 0 (0.0%) |
| $25,000 to $34,999 | 84 (4.3%) | 208 (25.4%) |
| $35,000 to $49,999 | 127 (6.6%) | 34 (4.2%) |
| $50,000 to $74,999 | 397 (20.5%) | 159 (19.4%) |
| $75,000 to $99,999 | 256 (13.2%) | 70 (8.6%) |
| $100,000 to $149,999 | 416 (21.4%) | 97 (11.9%) |
| $150,000 or more | 356 (18.4%) | 46 (5.6%) |
| Total | 1,939 (100.0%) | 818 (100.0%) |
Monthly Housing Cost Tiers in Catasauqua borough
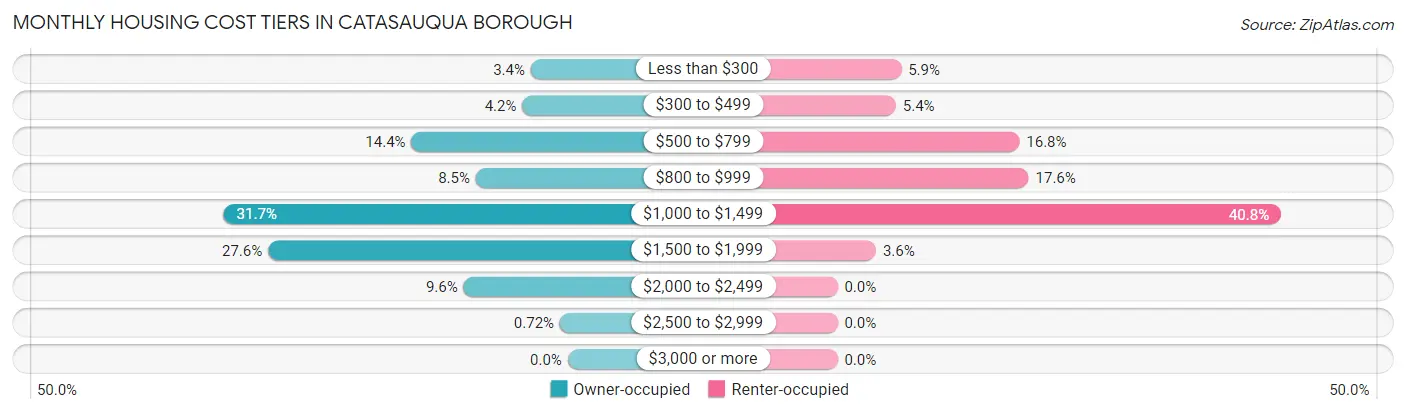
| Monthly Cost | Owner-occupied | Renter-occupied |
| Less than $300 | 66 (3.4%) | 48 (5.9%) |
| $300 to $499 | 81 (4.2%) | 44 (5.4%) |
| $500 to $799 | 279 (14.4%) | 137 (16.8%) |
| $800 to $999 | 164 (8.5%) | 144 (17.6%) |
| $1,000 to $1,499 | 614 (31.7%) | 334 (40.8%) |
| $1,500 to $1,999 | 535 (27.6%) | 29 (3.5%) |
| $2,000 to $2,499 | 186 (9.6%) | 0 (0.0%) |
| $2,500 to $2,999 | 14 (0.7%) | 0 (0.0%) |
| $3,000 or more | 0 (0.0%) | 0 (0.0%) |
| Total | 1,939 (100.0%) | 818 (100.0%) |
Physical Housing Characteristics in Catasauqua borough
Housing Structures in Catasauqua borough
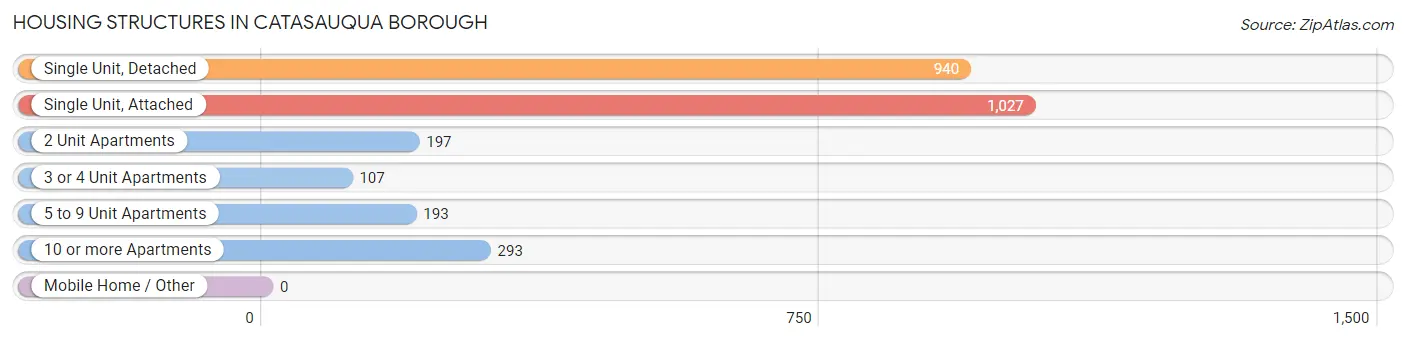
| Structure Type | # Housing Units | % Housing Units |
| Single Unit, Detached | 940 | 34.1% |
| Single Unit, Attached | 1,027 | 37.2% |
| 2 Unit Apartments | 197 | 7.1% |
| 3 or 4 Unit Apartments | 107 | 3.9% |
| 5 to 9 Unit Apartments | 193 | 7.0% |
| 10 or more Apartments | 293 | 10.6% |
| Mobile Home / Other | 0 | 0.0% |
| Total | 2,757 | 100.0% |
Housing Structures by Occupancy in Catasauqua borough
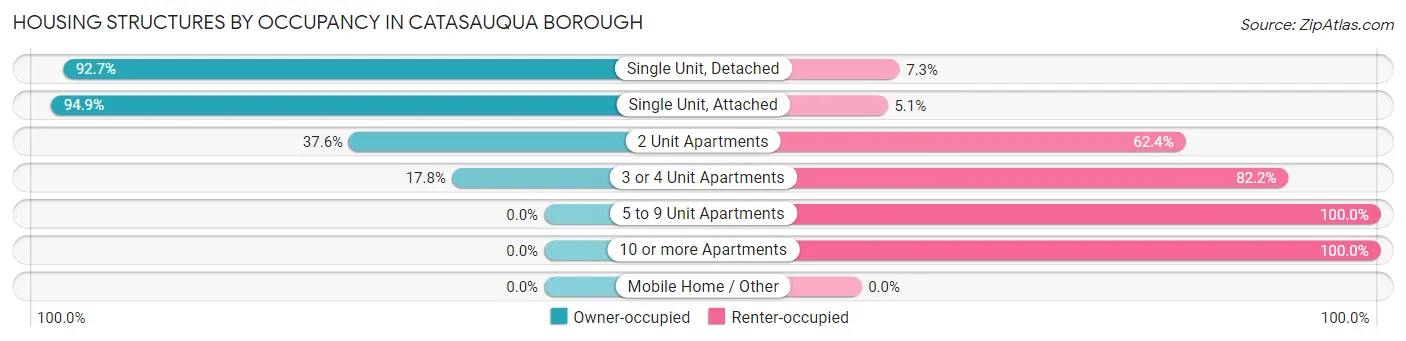
| Structure Type | Owner-occupied | Renter-occupied |
| Single Unit, Detached | 871 (92.7%) | 69 (7.3%) |
| Single Unit, Attached | 975 (94.9%) | 52 (5.1%) |
| 2 Unit Apartments | 74 (37.6%) | 123 (62.4%) |
| 3 or 4 Unit Apartments | 19 (17.8%) | 88 (82.2%) |
| 5 to 9 Unit Apartments | 0 (0.0%) | 193 (100.0%) |
| 10 or more Apartments | 0 (0.0%) | 293 (100.0%) |
| Mobile Home / Other | 0 (0.0%) | 0 (0.0%) |
| Total | 1,939 (70.3%) | 818 (29.7%) |
Housing Structures by Number of Rooms in Catasauqua borough
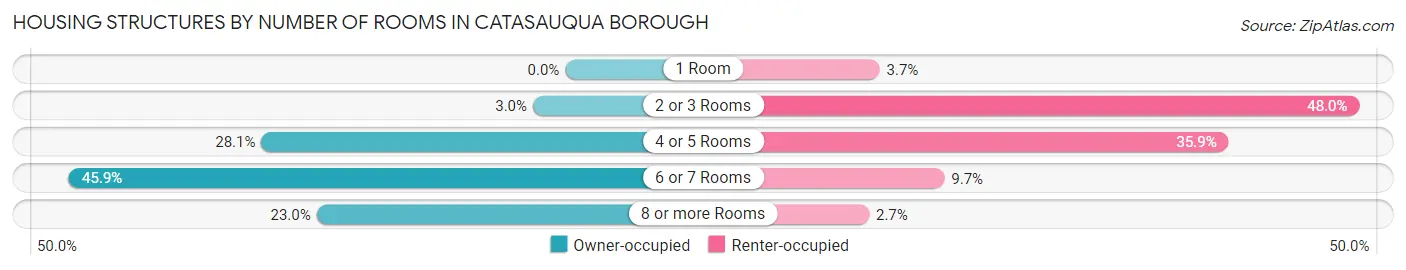
| Number of Rooms | Owner-occupied | Renter-occupied |
| 1 Room | 0 (0.0%) | 30 (3.7%) |
| 2 or 3 Rooms | 58 (3.0%) | 393 (48.0%) |
| 4 or 5 Rooms | 545 (28.1%) | 294 (35.9%) |
| 6 or 7 Rooms | 890 (45.9%) | 79 (9.7%) |
| 8 or more Rooms | 446 (23.0%) | 22 (2.7%) |
| Total | 1,939 (100.0%) | 818 (100.0%) |
Housing Structure by Heating Type in Catasauqua borough
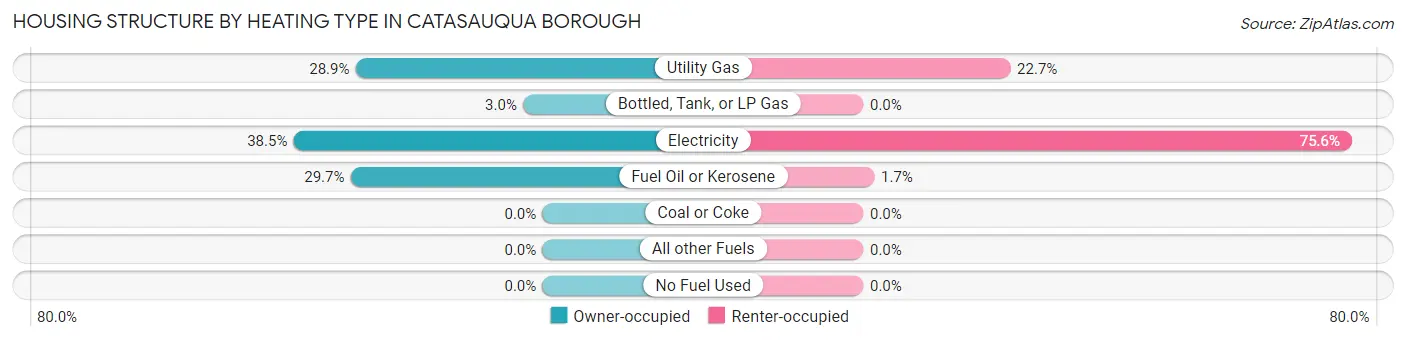
| Heating Type | Owner-occupied | Renter-occupied |
| Utility Gas | 560 (28.9%) | 186 (22.7%) |
| Bottled, Tank, or LP Gas | 58 (3.0%) | 0 (0.0%) |
| Electricity | 746 (38.5%) | 618 (75.5%) |
| Fuel Oil or Kerosene | 575 (29.6%) | 14 (1.7%) |
| Coal or Coke | 0 (0.0%) | 0 (0.0%) |
| All other Fuels | 0 (0.0%) | 0 (0.0%) |
| No Fuel Used | 0 (0.0%) | 0 (0.0%) |
| Total | 1,939 (100.0%) | 818 (100.0%) |
Household Vehicle Usage in Catasauqua borough
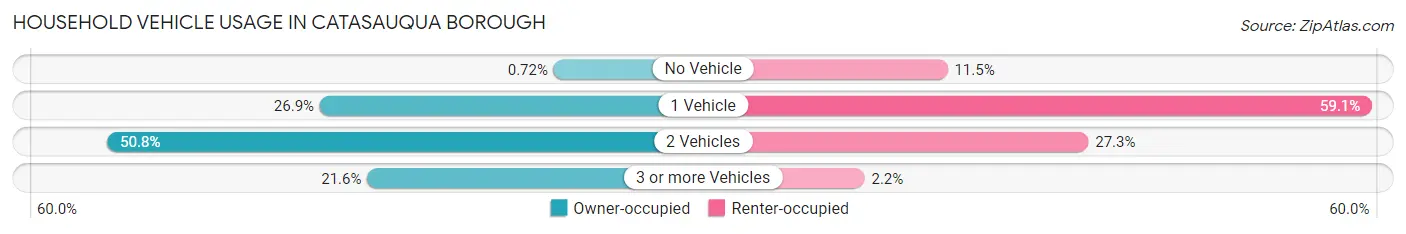
| Vehicles per Household | Owner-occupied | Renter-occupied |
| No Vehicle | 14 (0.7%) | 94 (11.5%) |
| 1 Vehicle | 522 (26.9%) | 483 (59.1%) |
| 2 Vehicles | 984 (50.7%) | 223 (27.3%) |
| 3 or more Vehicles | 419 (21.6%) | 18 (2.2%) |
| Total | 1,939 (100.0%) | 818 (100.0%) |
Real Estate & Mortgages in Catasauqua borough
Real Estate and Mortgage Overview in Catasauqua borough
| Characteristic | Without Mortgage | With Mortgage |
| Housing Units | 432 | 1,507 |
| Median Property Value | $168,700 | $179,600 |
| Median Household Income | $52,586 | $304 |
| Monthly Housing Costs | $629 | $0 |
| Real Estate Taxes | $3,993 | $0 |
Property Value by Mortgage Status in Catasauqua borough
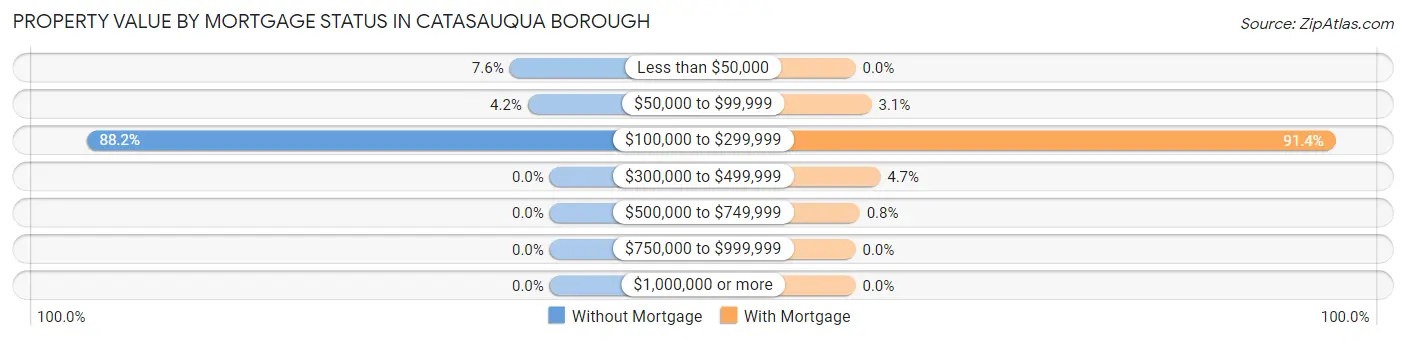
| Property Value | Without Mortgage | With Mortgage |
| Less than $50,000 | 33 (7.6%) | 0 (0.0%) |
| $50,000 to $99,999 | 18 (4.2%) | 46 (3.0%) |
| $100,000 to $299,999 | 381 (88.2%) | 1,378 (91.4%) |
| $300,000 to $499,999 | 0 (0.0%) | 71 (4.7%) |
| $500,000 to $749,999 | 0 (0.0%) | 12 (0.8%) |
| $750,000 to $999,999 | 0 (0.0%) | 0 (0.0%) |
| $1,000,000 or more | 0 (0.0%) | 0 (0.0%) |
| Total | 432 (100.0%) | 1,507 (100.0%) |
Household Income by Mortgage Status in Catasauqua borough
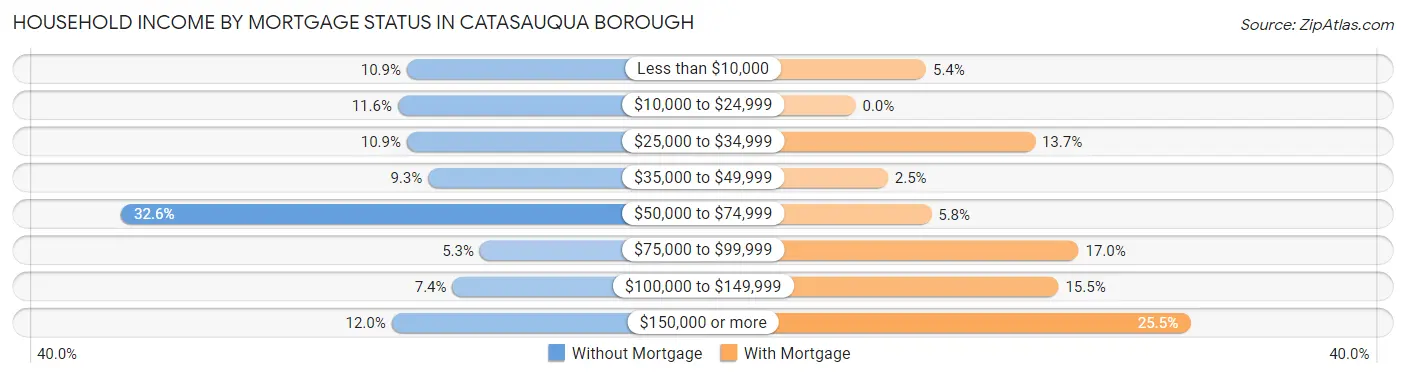
| Household Income | Without Mortgage | With Mortgage |
| Less than $10,000 | 47 (10.9%) | 81 (5.4%) |
| $10,000 to $24,999 | 50 (11.6%) | 0 (0.0%) |
| $25,000 to $34,999 | 47 (10.9%) | 206 (13.7%) |
| $35,000 to $49,999 | 40 (9.3%) | 37 (2.5%) |
| $50,000 to $74,999 | 141 (32.6%) | 87 (5.8%) |
| $75,000 to $99,999 | 23 (5.3%) | 256 (17.0%) |
| $100,000 to $149,999 | 32 (7.4%) | 233 (15.5%) |
| $150,000 or more | 52 (12.0%) | 384 (25.5%) |
| Total | 432 (100.0%) | 1,507 (100.0%) |
Property Value to Household Income Ratio in Catasauqua borough
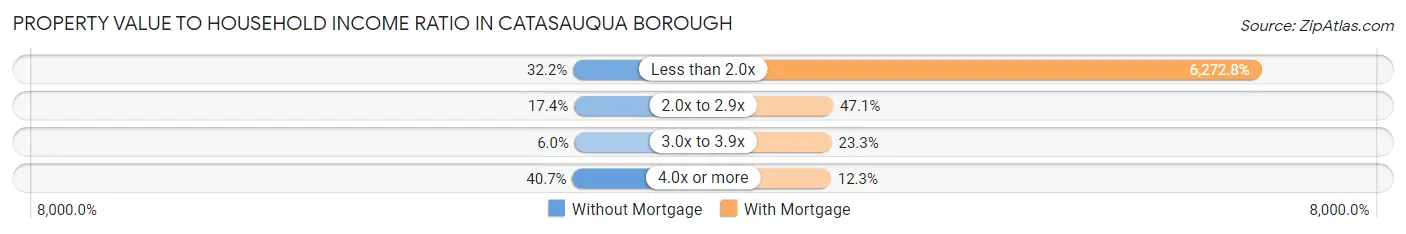
| Value-to-Income Ratio | Without Mortgage | With Mortgage |
| Less than 2.0x | 139 (32.2%) | 94,531 (6,272.8%) |
| 2.0x to 2.9x | 75 (17.4%) | 709 (47.0%) |
| 3.0x to 3.9x | 26 (6.0%) | 351 (23.3%) |
| 4.0x or more | 176 (40.7%) | 186 (12.3%) |
| Total | 432 (100.0%) | 1,507 (100.0%) |
Real Estate Taxes by Mortgage Status in Catasauqua borough
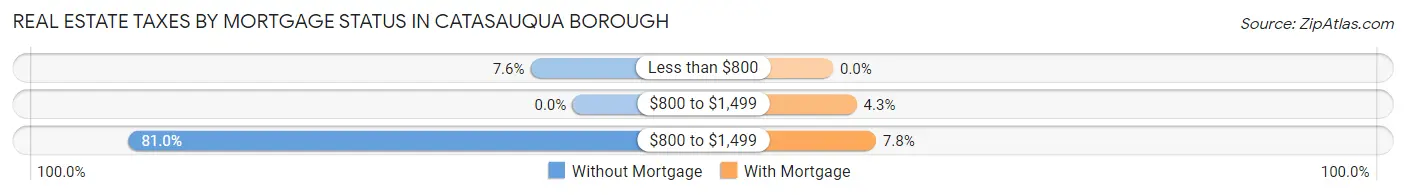
| Property Taxes | Without Mortgage | With Mortgage |
| Less than $800 | 33 (7.6%) | 0 (0.0%) |
| $800 to $1,499 | 0 (0.0%) | 65 (4.3%) |
| $800 to $1,499 | 350 (81.0%) | 118 (7.8%) |
| Total | 432 (100.0%) | 1,507 (100.0%) |
Health & Disability in Catasauqua borough
Health Insurance Coverage by Age in Catasauqua borough
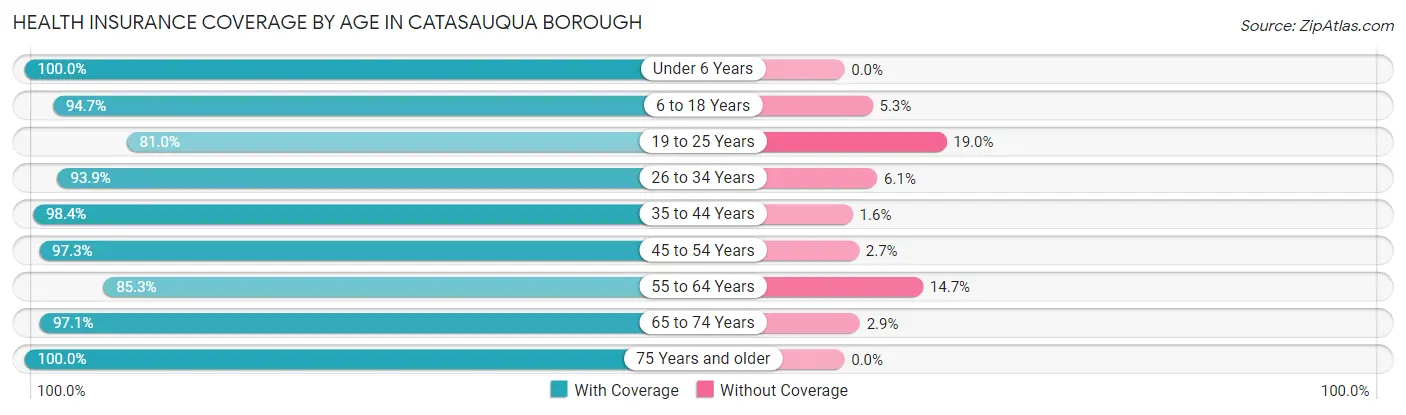
| Age Bracket | With Coverage | Without Coverage |
| Under 6 Years | 550 (100.0%) | 0 (0.0%) |
| 6 to 18 Years | 953 (94.7%) | 53 (5.3%) |
| 19 to 25 Years | 630 (81.0%) | 148 (19.0%) |
| 26 to 34 Years | 689 (93.9%) | 45 (6.1%) |
| 35 to 44 Years | 885 (98.4%) | 14 (1.6%) |
| 45 to 54 Years | 823 (97.3%) | 23 (2.7%) |
| 55 to 64 Years | 658 (85.3%) | 113 (14.7%) |
| 65 to 74 Years | 540 (97.1%) | 16 (2.9%) |
| 75 Years and older | 372 (100.0%) | 0 (0.0%) |
| Total | 6,100 (93.7%) | 412 (6.3%) |
Health Insurance Coverage by Citizenship Status in Catasauqua borough
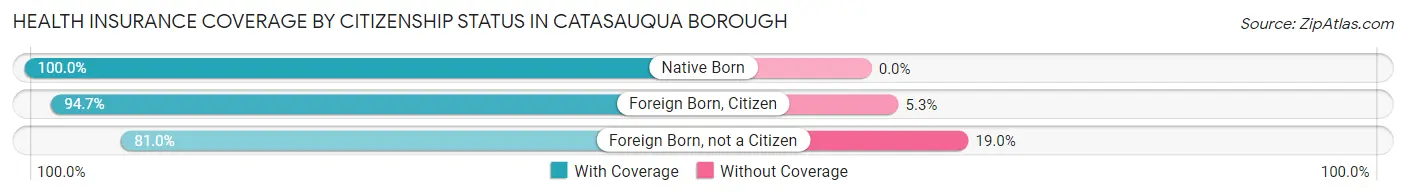
| Citizenship Status | With Coverage | Without Coverage |
| Native Born | 550 (100.0%) | 0 (0.0%) |
| Foreign Born, Citizen | 953 (94.7%) | 53 (5.3%) |
| Foreign Born, not a Citizen | 630 (81.0%) | 148 (19.0%) |
Health Insurance Coverage by Household Income in Catasauqua borough
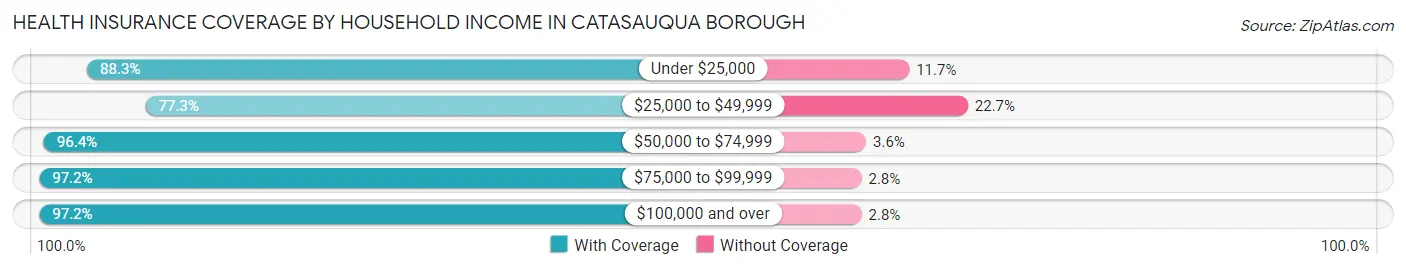
| Household Income | With Coverage | Without Coverage |
| Under $25,000 | 513 (88.3%) | 68 (11.7%) |
| $25,000 to $49,999 | 651 (77.3%) | 191 (22.7%) |
| $50,000 to $74,999 | 1,383 (96.4%) | 52 (3.6%) |
| $75,000 to $99,999 | 810 (97.2%) | 23 (2.8%) |
| $100,000 and over | 2,739 (97.2%) | 78 (2.8%) |
Public vs Private Health Insurance Coverage by Age in Catasauqua borough
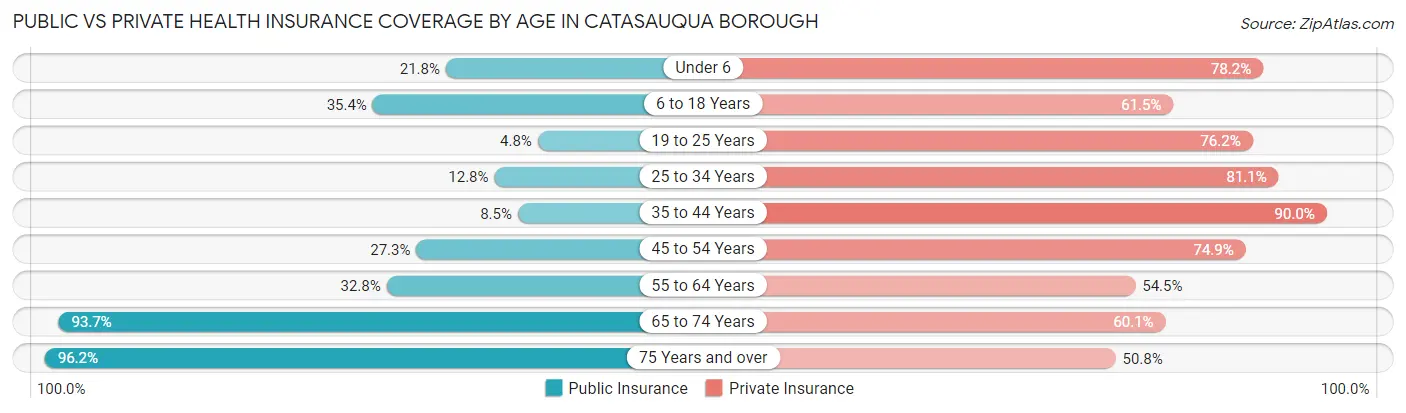
| Age Bracket | Public Insurance | Private Insurance |
| Under 6 | 120 (21.8%) | 430 (78.2%) |
| 6 to 18 Years | 356 (35.4%) | 619 (61.5%) |
| 19 to 25 Years | 37 (4.8%) | 593 (76.2%) |
| 25 to 34 Years | 94 (12.8%) | 595 (81.1%) |
| 35 to 44 Years | 76 (8.5%) | 809 (90.0%) |
| 45 to 54 Years | 231 (27.3%) | 634 (74.9%) |
| 55 to 64 Years | 253 (32.8%) | 420 (54.5%) |
| 65 to 74 Years | 521 (93.7%) | 334 (60.1%) |
| 75 Years and over | 358 (96.2%) | 189 (50.8%) |
| Total | 2,046 (31.4%) | 4,623 (71.0%) |
Disability Status by Sex by Age in Catasauqua borough
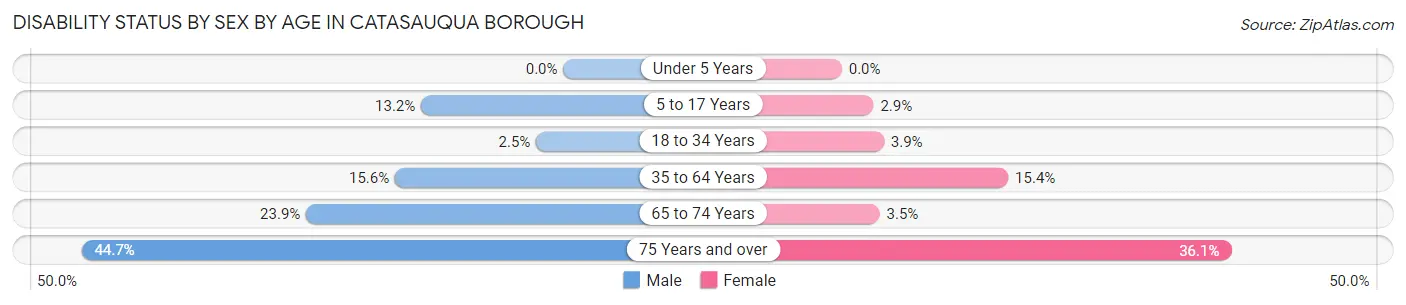
| Age Bracket | Male | Female |
| Under 5 Years | 0 (0.0%) | 0 (0.0%) |
| 5 to 17 Years | 52 (13.2%) | 16 (2.9%) |
| 18 to 34 Years | 24 (2.5%) | 25 (3.9%) |
| 35 to 64 Years | 217 (15.6%) | 174 (15.4%) |
| 65 to 74 Years | 58 (23.9%) | 11 (3.5%) |
| 75 Years and over | 55 (44.7%) | 90 (36.1%) |
Disability Class by Sex by Age in Catasauqua borough
Disability Class: Hearing Difficulty
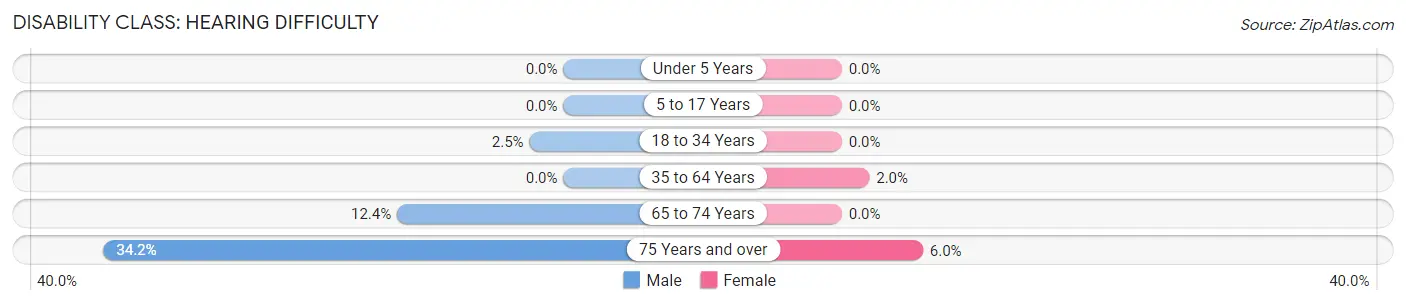
| Age Bracket | Male | Female |
| Under 5 Years | 0 (0.0%) | 0 (0.0%) |
| 5 to 17 Years | 0 (0.0%) | 0 (0.0%) |
| 18 to 34 Years | 24 (2.5%) | 0 (0.0%) |
| 35 to 64 Years | 0 (0.0%) | 23 (2.0%) |
| 65 to 74 Years | 30 (12.3%) | 0 (0.0%) |
| 75 Years and over | 42 (34.2%) | 15 (6.0%) |
Disability Class: Vision Difficulty
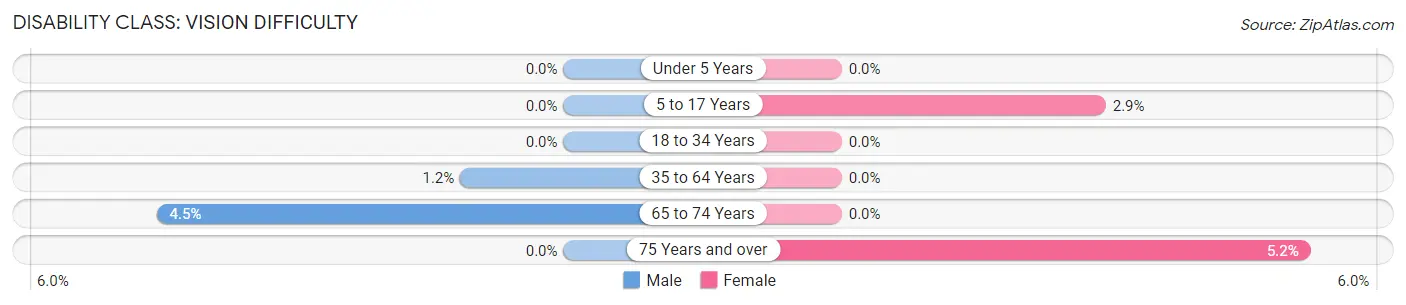
| Age Bracket | Male | Female |
| Under 5 Years | 0 (0.0%) | 0 (0.0%) |
| 5 to 17 Years | 0 (0.0%) | 16 (2.9%) |
| 18 to 34 Years | 0 (0.0%) | 0 (0.0%) |
| 35 to 64 Years | 16 (1.1%) | 0 (0.0%) |
| 65 to 74 Years | 11 (4.5%) | 0 (0.0%) |
| 75 Years and over | 0 (0.0%) | 13 (5.2%) |
Disability Class: Cognitive Difficulty
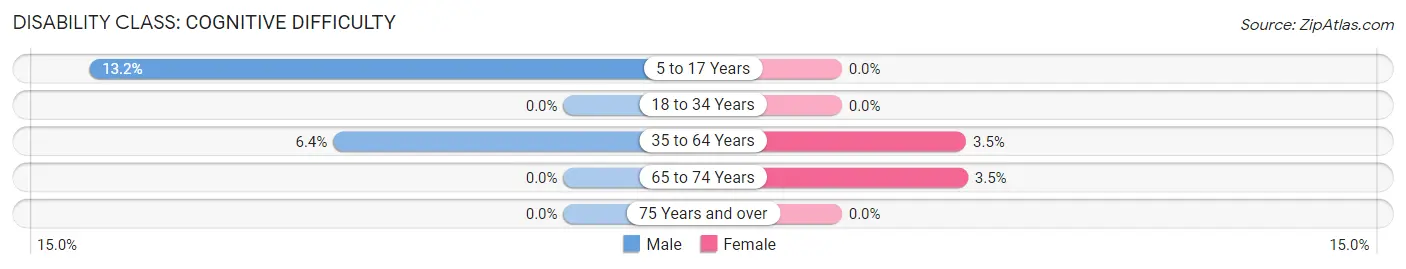
| Age Bracket | Male | Female |
| 5 to 17 Years | 52 (13.2%) | 0 (0.0%) |
| 18 to 34 Years | 0 (0.0%) | 0 (0.0%) |
| 35 to 64 Years | 89 (6.4%) | 39 (3.5%) |
| 65 to 74 Years | 0 (0.0%) | 11 (3.5%) |
| 75 Years and over | 0 (0.0%) | 0 (0.0%) |
Disability Class: Ambulatory Difficulty
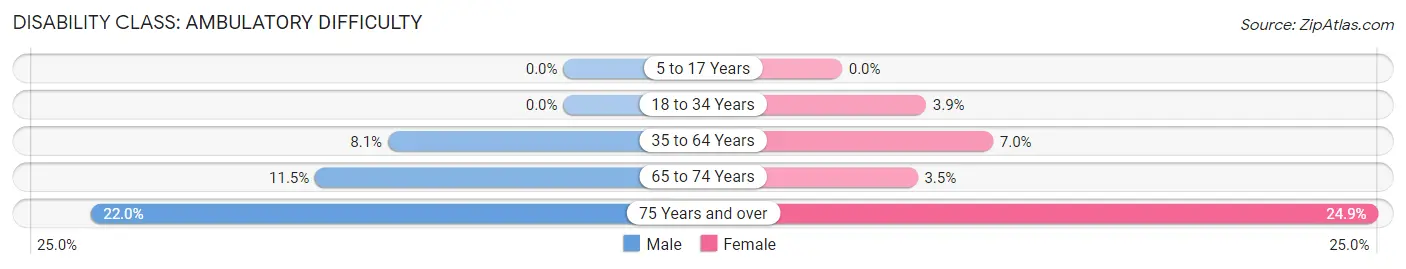
| Age Bracket | Male | Female |
| 5 to 17 Years | 0 (0.0%) | 0 (0.0%) |
| 18 to 34 Years | 0 (0.0%) | 25 (3.9%) |
| 35 to 64 Years | 113 (8.1%) | 79 (7.0%) |
| 65 to 74 Years | 28 (11.5%) | 11 (3.5%) |
| 75 Years and over | 27 (22.0%) | 62 (24.9%) |
Disability Class: Self-Care Difficulty
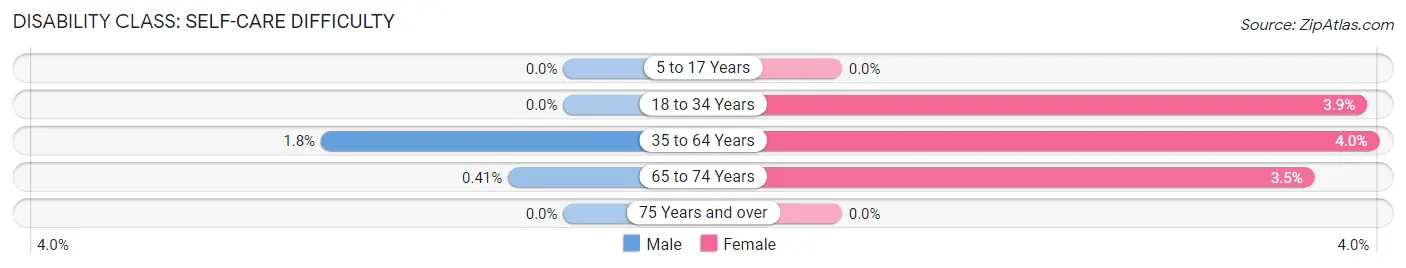
| Age Bracket | Male | Female |
| 5 to 17 Years | 0 (0.0%) | 0 (0.0%) |
| 18 to 34 Years | 0 (0.0%) | 25 (3.9%) |
| 35 to 64 Years | 25 (1.8%) | 45 (4.0%) |
| 65 to 74 Years | 1 (0.4%) | 11 (3.5%) |
| 75 Years and over | 0 (0.0%) | 0 (0.0%) |
Technology Access in Catasauqua borough
Computing Device Access in Catasauqua borough
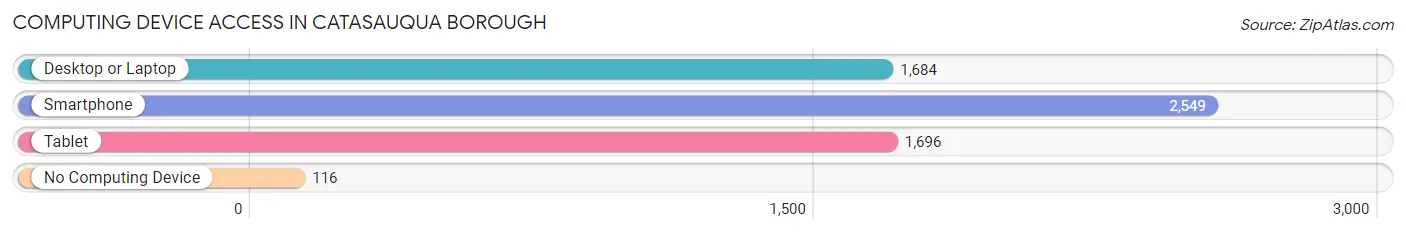
| Device Type | # Households | % Households |
| Desktop or Laptop | 1,684 | 61.1% |
| Smartphone | 2,549 | 92.5% |
| Tablet | 1,696 | 61.5% |
| No Computing Device | 116 | 4.2% |
| Total | 2,757 | 100.0% |
Internet Access in Catasauqua borough
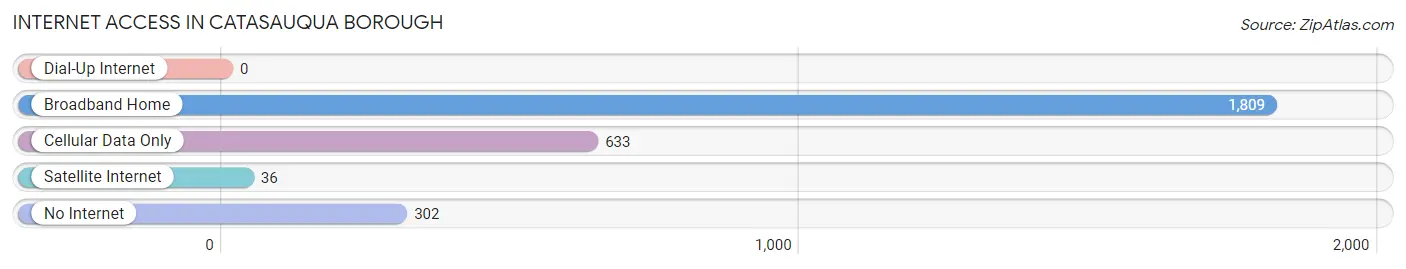
| Internet Type | # Households | % Households |
| Dial-Up Internet | 0 | 0.0% |
| Broadband Home | 1,809 | 65.6% |
| Cellular Data Only | 633 | 23.0% |
| Satellite Internet | 36 | 1.3% |
| No Internet | 302 | 11.0% |
| Total | 2,757 | 100.0% |
Catasauqua borough Summary
Catasauqua Borough is a borough located in Lehigh County, Pennsylvania, United States. It is located in the Lehigh Valley region of the state. As of the 2010 census, the borough had a population of 6,588.
History
Catasauqua was founded in 1832 by the Catasauqua and Fogelsville Railroad Company. The name is derived from the Native American term for "place of the lost river". The town was originally a stop on the railroad line, and the railroad company built a hotel and a few other buildings in the area.
The town grew rapidly in the late 19th century, and by the early 20th century it had become a major industrial center. The town was home to several large steel mills, as well as a number of other factories and businesses. The town was also home to a large number of immigrants, mostly from Eastern Europe.
In the late 20th century, the town's economy shifted away from manufacturing and towards services. The steel mills closed, and the town's population declined. However, the town has seen a resurgence in recent years, with new businesses and development projects.
Geography
Catasauqua is located in Lehigh County, Pennsylvania, in the Lehigh Valley region of the state. It is situated on the Lehigh River, about 10 miles (16 km) north of Allentown. The borough is bordered by North Catasauqua to the north, Whitehall Township to the east, Coplay to the south, and Hanover Township to the west.
The borough has a total area of 1 3 square miles 3 4 km2 all of which is land
Economy
Catasauqua's economy is largely based on services. The town is home to a number of retail stores, restaurants, and other businesses. The town is also home to a number of light industrial businesses, including a printing company and a metal fabrication plant.
Demographics
As of the 2010 census, the borough had a population of 6,588. The racial makeup of the borough was 87.3% White, 5.7% African American, 0.3% Native American, 1.2% Asian, 0.1% Pacific Islander, 3.2% from other races, and 2.4% from two or more races. Hispanic or Latino of any race were 8.2% of the population.
The median household income in the borough was $41,944, and the median family income was $50,944. About 11.3% of families and 14.2% of the population were below the poverty line, including 22.2% of those under age 18 and 8.2% of those age 65 or over.
Common Questions
What is Per Capita Income in Catasauqua borough?
Per Capita income in Catasauqua borough is $35,551.
What is the Median Family Income in Catasauqua borough?
Median Family Income in Catasauqua borough is $86,591.
What is the Median Household income in Catasauqua borough?
Median Household Income in Catasauqua borough is $62,134.
What is Income or Wage Gap in Catasauqua borough?
Income or Wage Gap in Catasauqua borough is 19.9%.
Women in Catasauqua borough earn 80.1 cents for every dollar earned by a man.
What is Inequality or Gini Index in Catasauqua borough?
Inequality or Gini Index in Catasauqua borough is 0.43.
What is the Total Population of Catasauqua borough?
Total Population of Catasauqua borough is 6,512.
What is the Total Male Population of Catasauqua borough?
Total Male Population of Catasauqua borough is 3,413.
What is the Total Female Population of Catasauqua borough?
Total Female Population of Catasauqua borough is 3,099.
What is the Ratio of Males per 100 Females in Catasauqua borough?
There are 110.13 Males per 100 Females in Catasauqua borough.
What is the Ratio of Females per 100 Males in Catasauqua borough?
There are 90.80 Females per 100 Males in Catasauqua borough.
What is the Median Population Age in Catasauqua borough?
Median Population Age in Catasauqua borough is 37.7 Years.
What is the Average Family Size in Catasauqua borough
Average Family Size in Catasauqua borough is 2.9 People.
What is the Average Household Size in Catasauqua borough
Average Household Size in Catasauqua borough is 2.4 People.
How Large is the Labor Force in Catasauqua borough?
There are 3,949 People in the Labor Forcein in Catasauqua borough.
What is the Percentage of People in the Labor Force in Catasauqua borough?
73.3% of People are in the Labor Force in Catasauqua borough.
What is the Unemployment Rate in Catasauqua borough?
Unemployment Rate in Catasauqua borough is 8.3%.