Glenshaw, PA Map & Demographics
Glenshaw Map
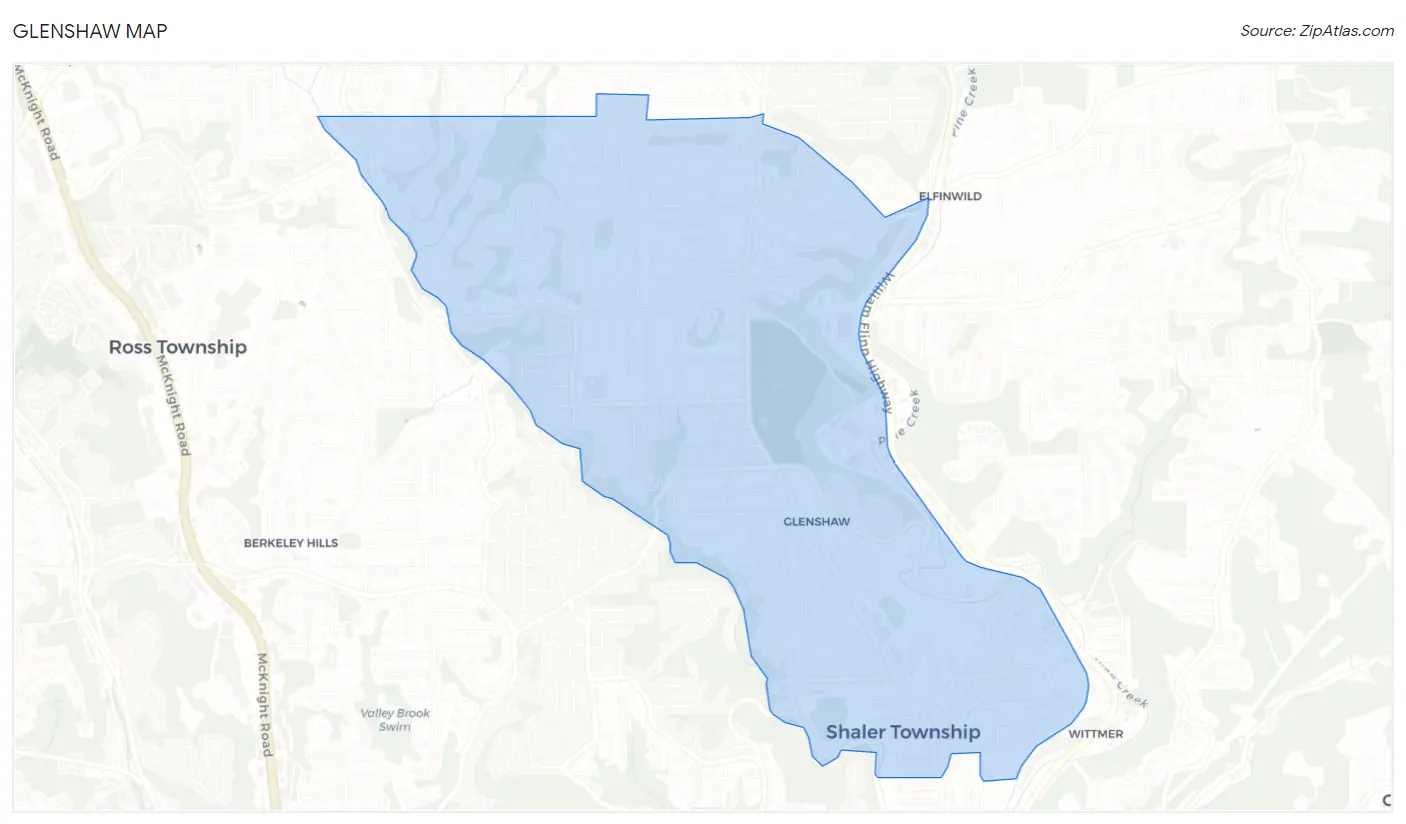
Glenshaw Overview
$47,951
PER CAPITA INCOME
$118,036
AVG FAMILY INCOME
$92,028
AVG HOUSEHOLD INCOME
19.2%
WAGE / INCOME GAP [ % ]
80.8¢/ $1
WAGE / INCOME GAP [ $ ]
0.40
INEQUALITY / GINI INDEX
9,418
TOTAL POPULATION
4,895
MALE POPULATION
4,523
FEMALE POPULATION
108.22
MALES / 100 FEMALES
92.40
FEMALES / 100 MALES
46.3
MEDIAN AGE
2.9
AVG FAMILY SIZE
2.5
AVG HOUSEHOLD SIZE
5,076
LABOR FORCE [ PEOPLE ]
65.5%
PERCENT IN LABOR FORCE
6.5%
UNEMPLOYMENT RATE
Glenshaw Zip Codes
Glenshaw Area Codes
Income in Glenshaw
Income Overview in Glenshaw
Per Capita Income in Glenshaw is $47,951, while median incomes of families and households are $118,036 and $92,028 respectively.
| Characteristic | Number | Measure |
| Per Capita Income | 9,418 | $47,951 |
| Median Family Income | 2,855 | $118,036 |
| Mean Family Income | 2,855 | $137,912 |
| Median Household Income | 3,796 | $92,028 |
| Mean Household Income | 3,796 | $117,760 |
| Income Deficit | 2,855 | $0 |
| Wage / Income Gap (%) | 9,418 | 19.22% |
| Wage / Income Gap ($) | 9,418 | 80.78¢ per $1 |
| Gini / Inequality Index | 9,418 | 0.40 |
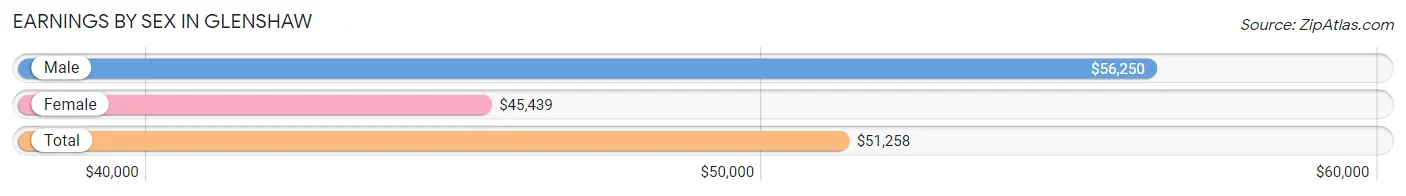
Earnings by Sex in Glenshaw
Average Earnings in Glenshaw are $51,258, $56,250 for men and $45,439 for women, a difference of 19.2%.
| Sex | Number | Average Earnings |
| Male | 2,879 (55.2%) | $56,250 |
| Female | 2,335 (44.8%) | $45,439 |
| Total | 5,214 (100.0%) | $51,258 |
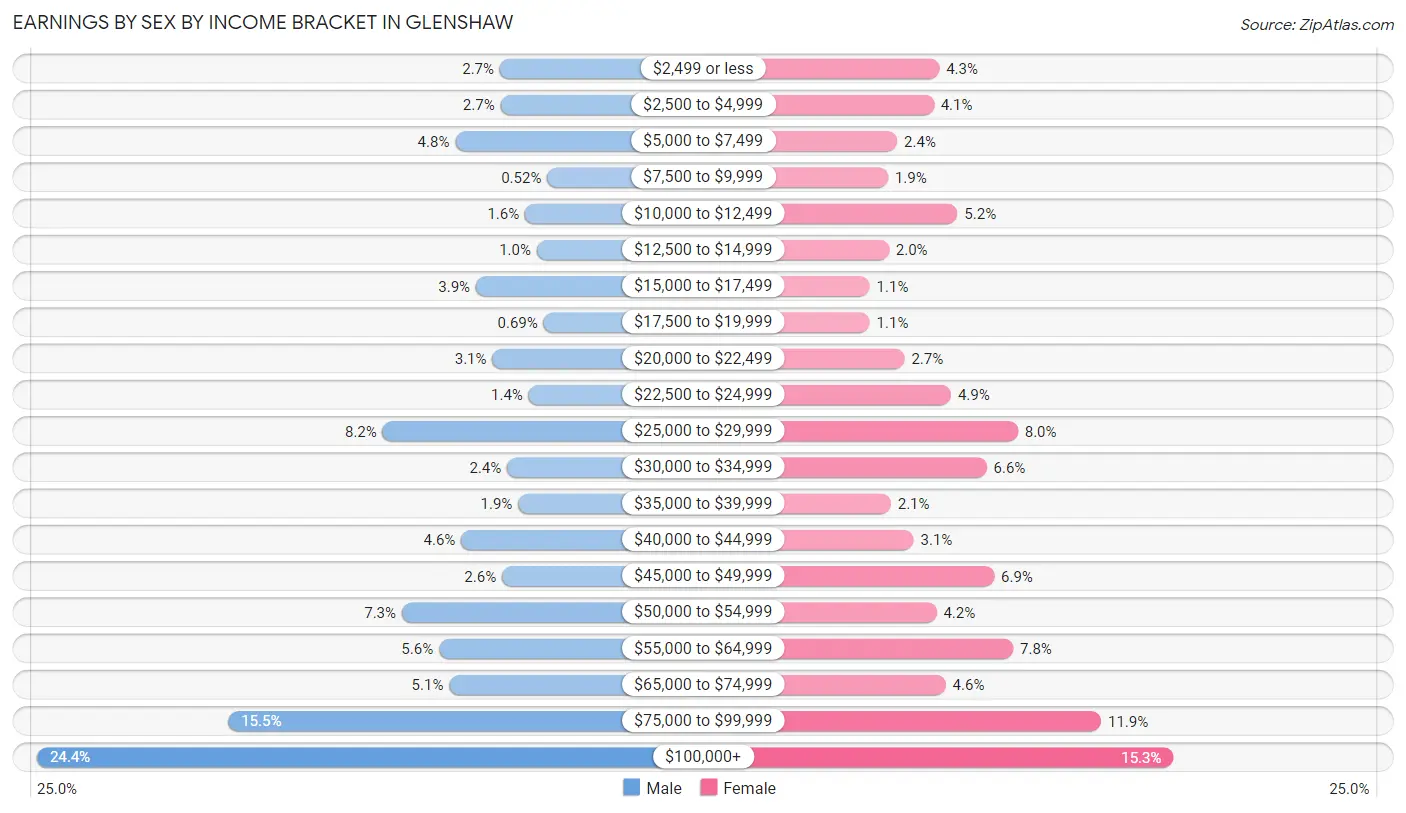
Earnings by Sex by Income Bracket in Glenshaw
The most common earnings brackets in Glenshaw are $100,000+ for men (703 | 24.4%) and $100,000+ for women (357 | 15.3%).
| Income | Male | Female |
| $2,499 or less | 79 (2.7%) | 101 (4.3%) |
| $2,500 to $4,999 | 78 (2.7%) | 95 (4.1%) |
| $5,000 to $7,499 | 139 (4.8%) | 55 (2.4%) |
| $7,500 to $9,999 | 15 (0.5%) | 45 (1.9%) |
| $10,000 to $12,499 | 45 (1.6%) | 121 (5.2%) |
| $12,500 to $14,999 | 29 (1.0%) | 46 (2.0%) |
| $15,000 to $17,499 | 111 (3.9%) | 25 (1.1%) |
| $17,500 to $19,999 | 20 (0.7%) | 25 (1.1%) |
| $20,000 to $22,499 | 89 (3.1%) | 63 (2.7%) |
| $22,500 to $24,999 | 40 (1.4%) | 114 (4.9%) |
| $25,000 to $29,999 | 237 (8.2%) | 187 (8.0%) |
| $30,000 to $34,999 | 69 (2.4%) | 153 (6.6%) |
| $35,000 to $39,999 | 54 (1.9%) | 48 (2.1%) |
| $40,000 to $44,999 | 131 (4.5%) | 73 (3.1%) |
| $45,000 to $49,999 | 76 (2.6%) | 161 (6.9%) |
| $50,000 to $54,999 | 211 (7.3%) | 98 (4.2%) |
| $55,000 to $64,999 | 161 (5.6%) | 182 (7.8%) |
| $65,000 to $74,999 | 147 (5.1%) | 108 (4.6%) |
| $75,000 to $99,999 | 445 (15.5%) | 278 (11.9%) |
| $100,000+ | 703 (24.4%) | 357 (15.3%) |
| Total | 2,879 (100.0%) | 2,335 (100.0%) |
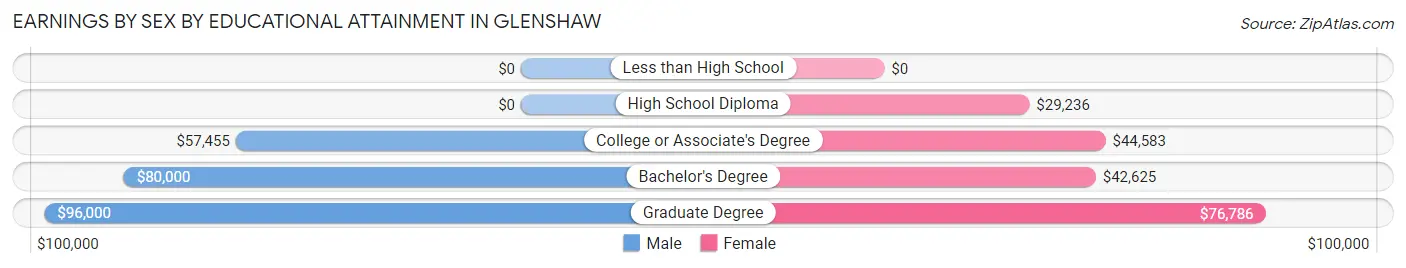
Earnings by Sex by Educational Attainment in Glenshaw
Average earnings in Glenshaw are $63,000 for men and $47,181 for women, a difference of 25.1%. Men with an educational attainment of graduate degree enjoy the highest average annual earnings of $96,000, while those with college or associate's degree education earn the least with $57,455. Women with an educational attainment of graduate degree earn the most with the average annual earnings of $76,786, while those with high school diploma education have the smallest earnings of $29,236.
| Educational Attainment | Male Income | Female Income |
| Less than High School | - | - |
| High School Diploma | - | - |
| College or Associate's Degree | $57,455 | $44,583 |
| Bachelor's Degree | $80,000 | $42,625 |
| Graduate Degree | $96,000 | $76,786 |
| Total | $63,000 | $47,181 |
Family Income in Glenshaw
Family Income Brackets in Glenshaw
According to the Glenshaw family income data, there are 677 families falling into the $100,000 to $149,999 income range, which is the most common income bracket and makes up 23.7% of all families. Conversely, the $25,000 to $34,999 income bracket is the least frequent group with only 9 families (0.3%) belonging to this category.
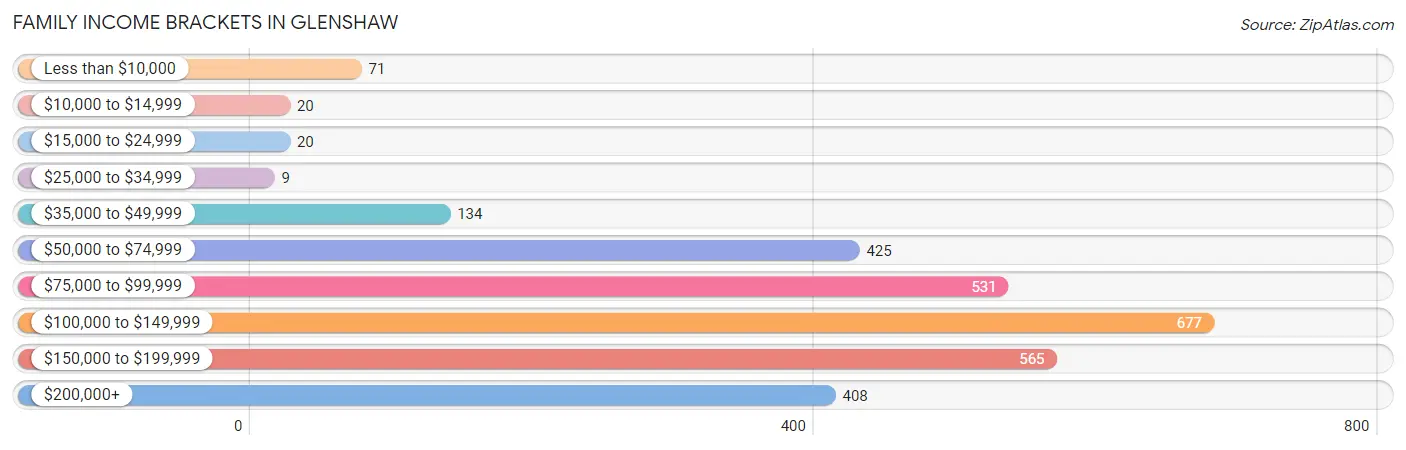
| Income Bracket | # Families | % Families |
| Less than $10,000 | 71 | 2.5% |
| $10,000 to $14,999 | 20 | 0.7% |
| $15,000 to $24,999 | 20 | 0.7% |
| $25,000 to $34,999 | 9 | 0.3% |
| $35,000 to $49,999 | 134 | 4.7% |
| $50,000 to $74,999 | 425 | 14.9% |
| $75,000 to $99,999 | 531 | 18.6% |
| $100,000 to $149,999 | 677 | 23.7% |
| $150,000 to $199,999 | 565 | 19.8% |
| $200,000+ | 408 | 14.3% |
Family Income by Famaliy Size in Glenshaw
4-person families (615 | 21.5%) account for the highest median family income in Glenshaw with $138,194 per family, while 2-person families (1,641 | 57.5%) have the highest median income of $46,008 per family member.
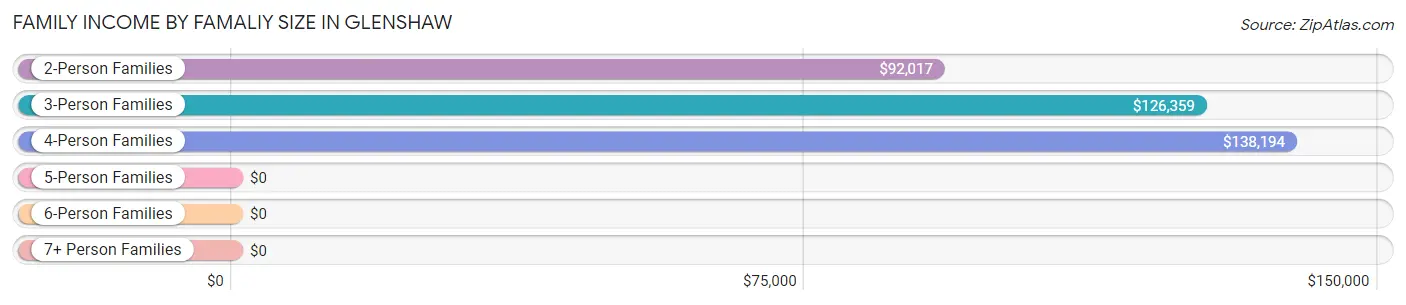
| Income Bracket | # Families | Median Income |
| 2-Person Families | 1,641 (57.5%) | $92,017 |
| 3-Person Families | 371 (13.0%) | $126,359 |
| 4-Person Families | 615 (21.5%) | $138,194 |
| 5-Person Families | 142 (5.0%) | $0 |
| 6-Person Families | 86 (3.0%) | $0 |
| 7+ Person Families | 0 (0.0%) | $0 |
| Total | 2,855 (100.0%) | $118,036 |
Family Income by Number of Earners in Glenshaw
The median family income in Glenshaw is $118,036, with families comprising 3+ earners (396) having the highest median family income of $138,125, while families with no earners (452) have the lowest median family income of $74,306, accounting for 13.9% and 15.8% of families, respectively.
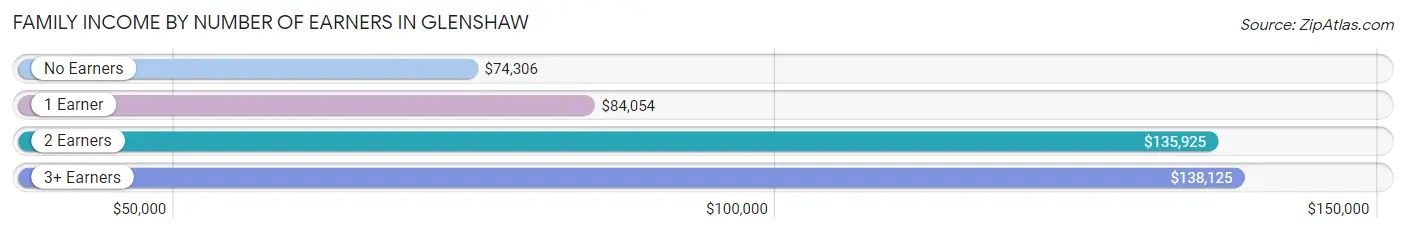
| Number of Earners | # Families | Median Income |
| No Earners | 452 (15.8%) | $74,306 |
| 1 Earner | 714 (25.0%) | $84,054 |
| 2 Earners | 1,293 (45.3%) | $135,925 |
| 3+ Earners | 396 (13.9%) | $138,125 |
| Total | 2,855 (100.0%) | $118,036 |
Household Income in Glenshaw
Household Income Brackets in Glenshaw
With 797 households falling in the category, the $100,000 to $149,999 income range is the most frequent in Glenshaw, accounting for 21.0% of all households. In contrast, only 38 households (1.0%) fall into the $10,000 to $14,999 income bracket, making it the least populous group.
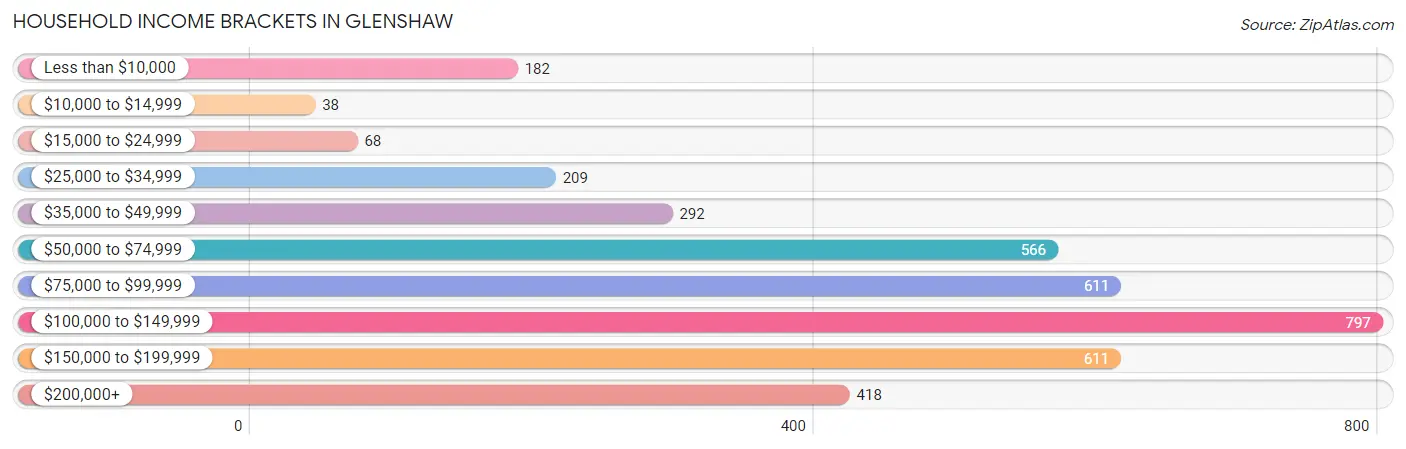
| Income Bracket | # Households | % Households |
| Less than $10,000 | 182 | 4.8% |
| $10,000 to $14,999 | 38 | 1.0% |
| $15,000 to $24,999 | 68 | 1.8% |
| $25,000 to $34,999 | 209 | 5.5% |
| $35,000 to $49,999 | 292 | 7.7% |
| $50,000 to $74,999 | 566 | 14.9% |
| $75,000 to $99,999 | 611 | 16.1% |
| $100,000 to $149,999 | 797 | 21.0% |
| $150,000 to $199,999 | 611 | 16.1% |
| $200,000+ | 418 | 11.0% |
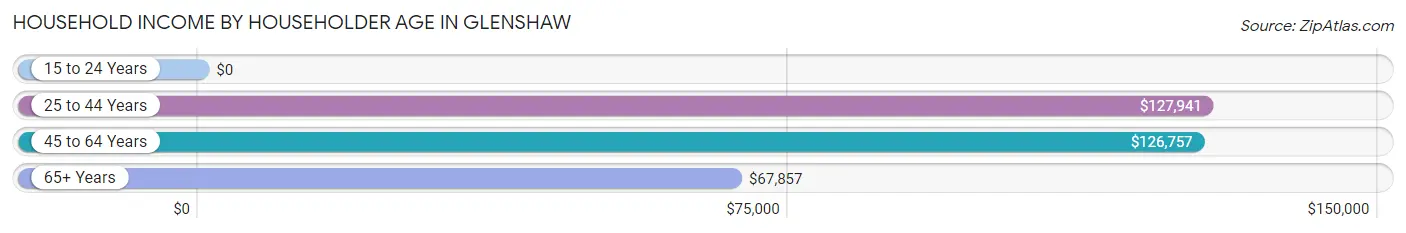
Household Income by Householder Age in Glenshaw
The median household income in Glenshaw is $92,028, with the highest median household income of $127,941 found in the 25 to 44 years age bracket for the primary householder. A total of 962 households (25.3%) fall into this category.
| Income Bracket | # Households | Median Income |
| 15 to 24 Years | 0 (0.0%) | $0 |
| 25 to 44 Years | 962 (25.3%) | $127,941 |
| 45 to 64 Years | 1,262 (33.3%) | $126,757 |
| 65+ Years | 1,572 (41.4%) | $67,857 |
| Total | 3,796 (100.0%) | $92,028 |
Poverty in Glenshaw
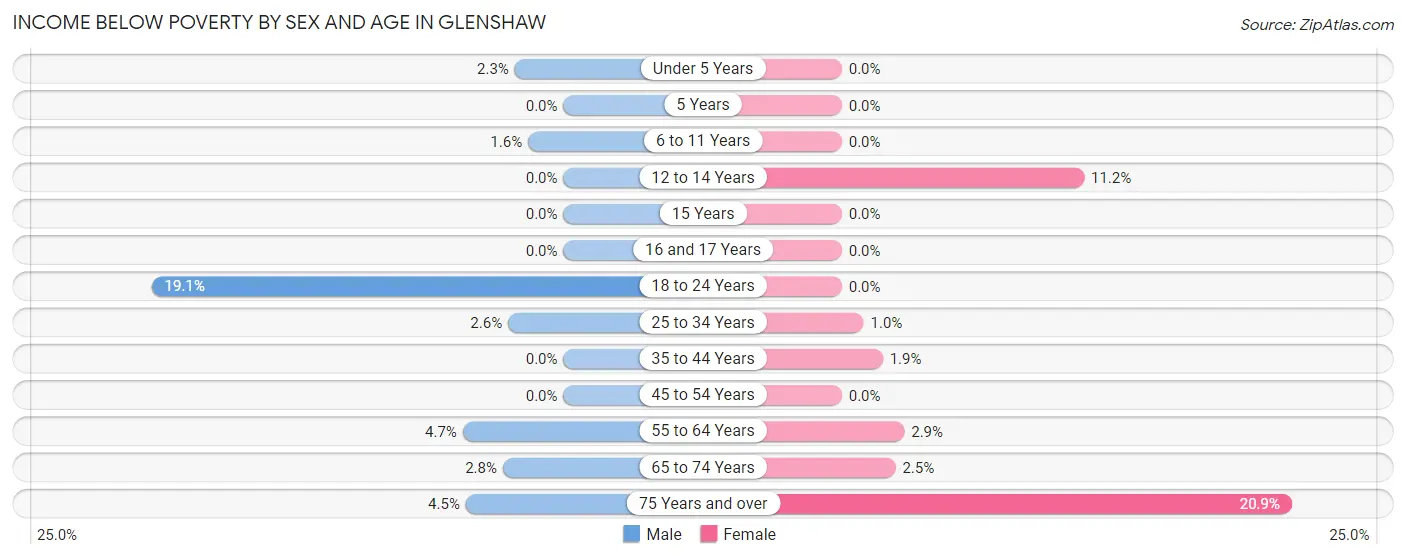
Income Below Poverty by Sex and Age in Glenshaw
With 3.2% poverty level for males and 4.4% for females among the residents of Glenshaw, 18 to 24 year old males and 75 year old and over females are the most vulnerable to poverty, with 60 males (19.1%) and 119 females (20.9%) in their respective age groups living below the poverty level.
| Age Bracket | Male | Female |
| Under 5 Years | 5 (2.3%) | 0 (0.0%) |
| 5 Years | 0 (0.0%) | 0 (0.0%) |
| 6 to 11 Years | 7 (1.6%) | 0 (0.0%) |
| 12 to 14 Years | 0 (0.0%) | 20 (11.2%) |
| 15 Years | 0 (0.0%) | 0 (0.0%) |
| 16 and 17 Years | 0 (0.0%) | 0 (0.0%) |
| 18 to 24 Years | 60 (19.1%) | 0 (0.0%) |
| 25 to 34 Years | 15 (2.6%) | 5 (1.0%) |
| 35 to 44 Years | 0 (0.0%) | 10 (1.9%) |
| 45 to 54 Years | 0 (0.0%) | 0 (0.0%) |
| 55 to 64 Years | 30 (4.7%) | 24 (2.9%) |
| 65 to 74 Years | 21 (2.8%) | 20 (2.5%) |
| 75 Years and over | 17 (4.5%) | 119 (20.9%) |
| Total | 155 (3.2%) | 198 (4.4%) |
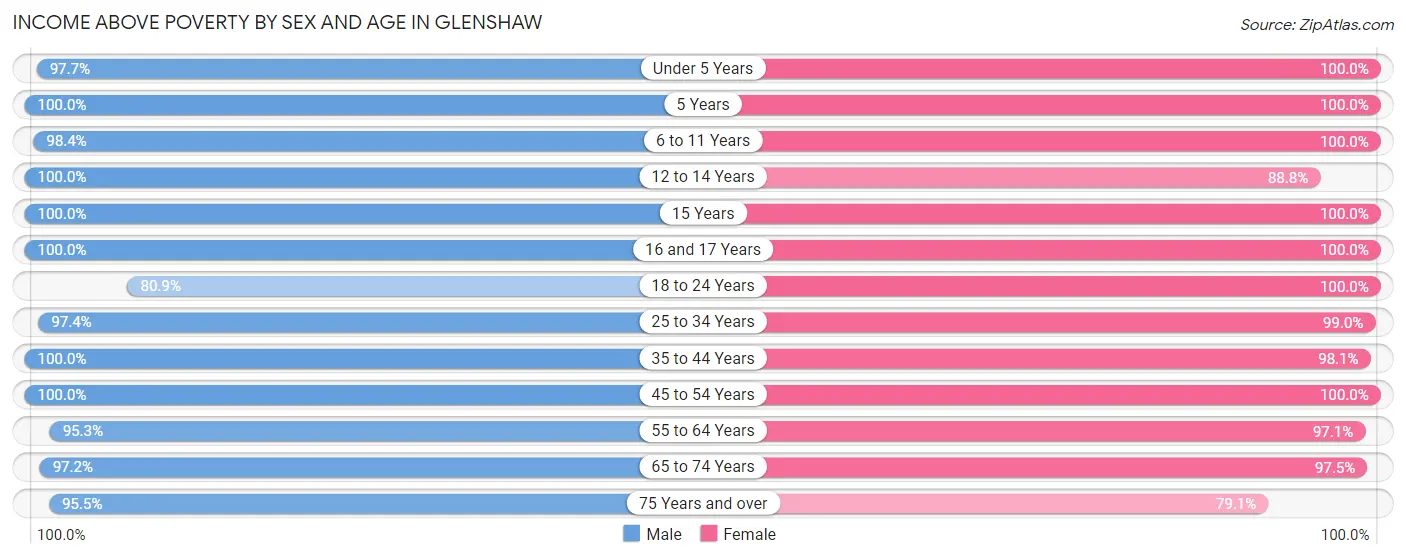
Income Above Poverty by Sex and Age in Glenshaw
According to the poverty statistics in Glenshaw, males aged 5 years and females aged under 5 years are the age groups that are most secure financially, with 100.0% of males and 100.0% of females in these age groups living above the poverty line.
| Age Bracket | Male | Female |
| Under 5 Years | 216 (97.7%) | 219 (100.0%) |
| 5 Years | 41 (100.0%) | 138 (100.0%) |
| 6 to 11 Years | 420 (98.4%) | 192 (100.0%) |
| 12 to 14 Years | 145 (100.0%) | 158 (88.8%) |
| 15 Years | 21 (100.0%) | 41 (100.0%) |
| 16 and 17 Years | 137 (100.0%) | 91 (100.0%) |
| 18 to 24 Years | 254 (80.9%) | 66 (100.0%) |
| 25 to 34 Years | 569 (97.4%) | 491 (99.0%) |
| 35 to 44 Years | 755 (100.0%) | 515 (98.1%) |
| 45 to 54 Years | 485 (100.0%) | 333 (100.0%) |
| 55 to 64 Years | 613 (95.3%) | 803 (97.1%) |
| 65 to 74 Years | 726 (97.2%) | 782 (97.5%) |
| 75 Years and over | 358 (95.5%) | 451 (79.1%) |
| Total | 4,740 (96.8%) | 4,280 (95.6%) |
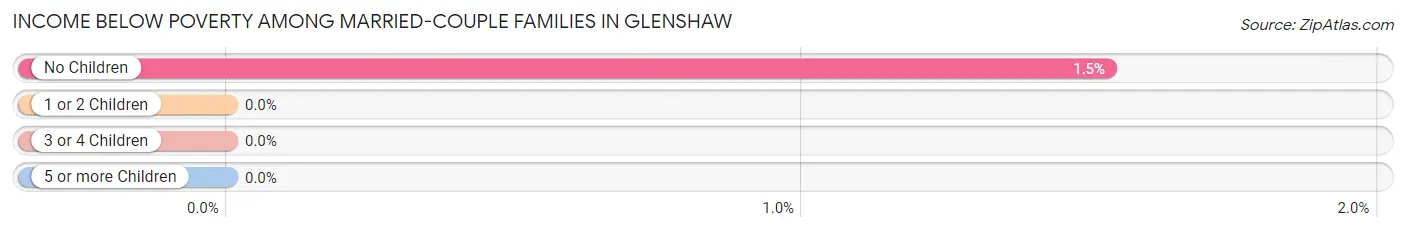
Income Below Poverty Among Married-Couple Families in Glenshaw
The poverty statistics for married-couple families in Glenshaw show that 1.0% or 24 of the total 2,455 families live below the poverty line. Families with no children have the highest poverty rate of 1.5%, comprising of 24 families. On the other hand, families with 1 or 2 children have the lowest poverty rate of 0.0%, which includes 0 families.
| Children | Above Poverty | Below Poverty |
| No Children | 1,542 (98.5%) | 24 (1.5%) |
| 1 or 2 Children | 748 (100.0%) | 0 (0.0%) |
| 3 or 4 Children | 141 (100.0%) | 0 (0.0%) |
| 5 or more Children | 0 (0.0%) | 0 (0.0%) |
| Total | 2,431 (99.0%) | 24 (1.0%) |
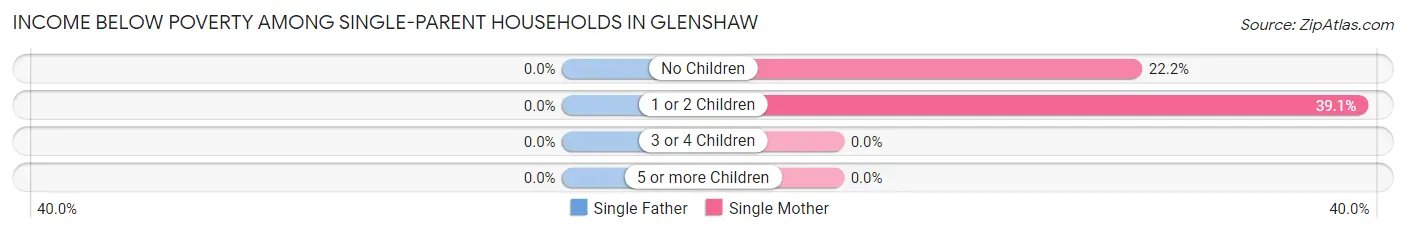
Income Below Poverty Among Single-Parent Households in Glenshaw
| Children | Single Father | Single Mother |
| No Children | 0 (0.0%) | 48 (22.2%) |
| 1 or 2 Children | 0 (0.0%) | 25 (39.1%) |
| 3 or 4 Children | 0 (0.0%) | 0 (0.0%) |
| 5 or more Children | 0 (0.0%) | 0 (0.0%) |
| Total | 0 (0.0%) | 73 (26.1%) |
Income Below Poverty Among Married-Couple vs Single-Parent Households in Glenshaw
The poverty data for Glenshaw shows that 24 of the married-couple family households (1.0%) and 73 of the single-parent households (18.2%) are living below the poverty level. Within the married-couple family households, those with no children have the highest poverty rate, with 24 households (1.5%) falling below the poverty line. Among the single-parent households, those with 1 or 2 children have the highest poverty rate, with 25 household (18.7%) living below poverty.
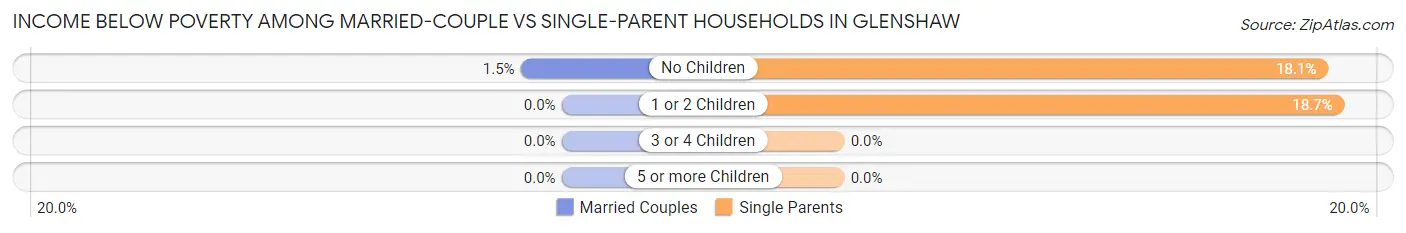
| Children | Married-Couple Families | Single-Parent Households |
| No Children | 24 (1.5%) | 48 (18.0%) |
| 1 or 2 Children | 0 (0.0%) | 25 (18.7%) |
| 3 or 4 Children | 0 (0.0%) | 0 (0.0%) |
| 5 or more Children | 0 (0.0%) | 0 (0.0%) |
| Total | 24 (1.0%) | 73 (18.2%) |
Race in Glenshaw
The most populous races in Glenshaw are White / Caucasian (8,943 | 95.0%), Two or more Races (333 | 3.5%), and Asian (123 | 1.3%).
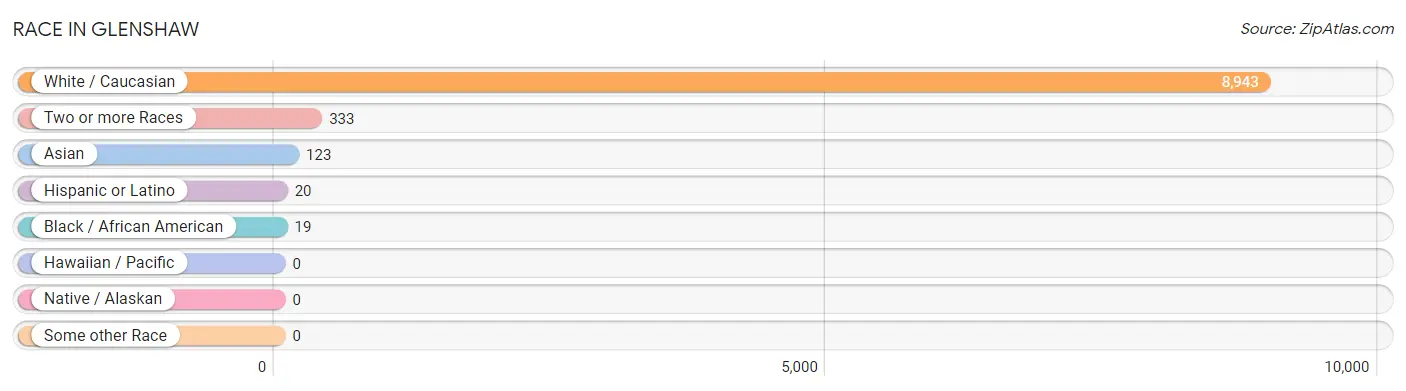
| Race | # Population | % Population |
| Asian | 123 | 1.3% |
| Black / African American | 19 | 0.2% |
| Hawaiian / Pacific | 0 | 0.0% |
| Hispanic or Latino | 20 | 0.2% |
| Native / Alaskan | 0 | 0.0% |
| White / Caucasian | 8,943 | 95.0% |
| Two or more Races | 333 | 3.5% |
| Some other Race | 0 | 0.0% |
| Total | 9,418 | 100.0% |
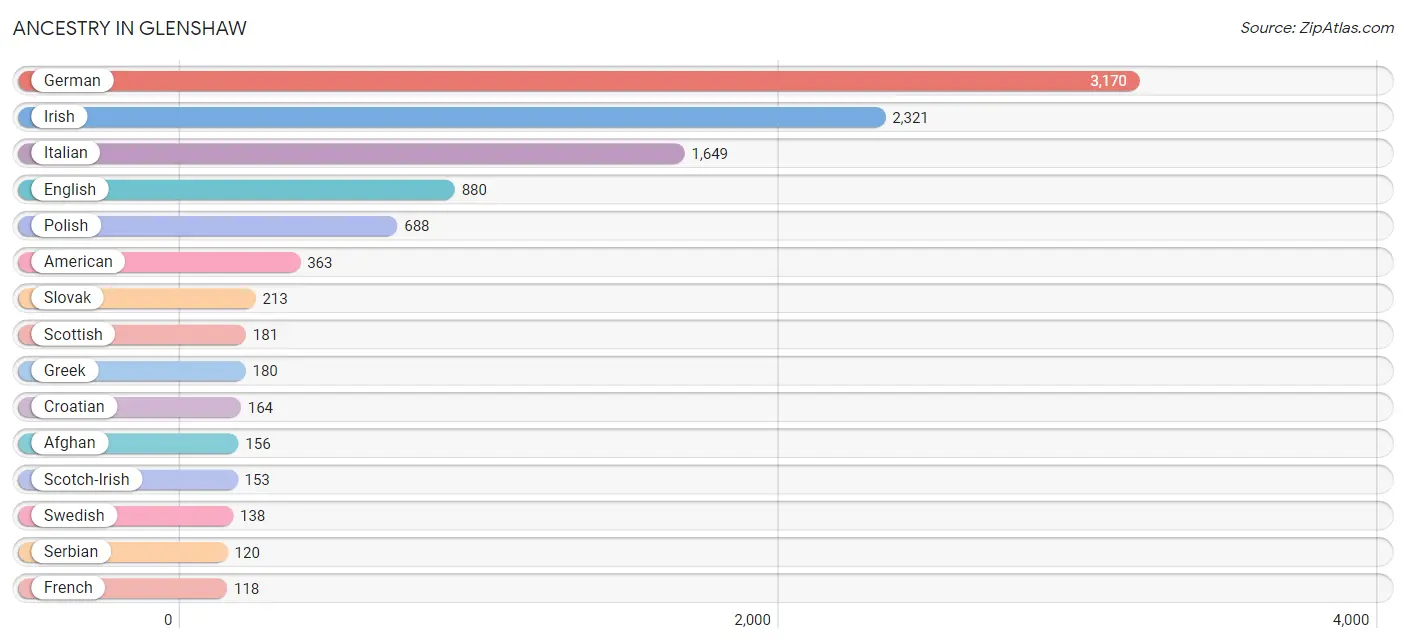
Ancestry in Glenshaw
The most populous ancestries reported in Glenshaw are German (3,170 | 33.7%), Irish (2,321 | 24.6%), Italian (1,649 | 17.5%), English (880 | 9.3%), and Polish (688 | 7.3%), together accounting for 92.5% of all Glenshaw residents.
| Ancestry | # Population | % Population |
| Afghan | 156 | 1.7% |
| American | 363 | 3.8% |
| Arab | 71 | 0.7% |
| Austrian | 24 | 0.3% |
| Belgian | 34 | 0.4% |
| British | 7 | 0.1% |
| Cherokee | 16 | 0.2% |
| Croatian | 164 | 1.7% |
| Czech | 37 | 0.4% |
| Dutch | 106 | 1.1% |
| Eastern European | 29 | 0.3% |
| English | 880 | 9.3% |
| European | 101 | 1.1% |
| French | 118 | 1.3% |
| French Canadian | 47 | 0.5% |
| German | 3,170 | 33.7% |
| Greek | 180 | 1.9% |
| Hungarian | 77 | 0.8% |
| Indian (Asian) | 16 | 0.2% |
| Iranian | 6 | 0.1% |
| Irish | 2,321 | 24.6% |
| Italian | 1,649 | 17.5% |
| Jamaican | 1 | 0.0% |
| Korean | 49 | 0.5% |
| Lebanese | 55 | 0.6% |
| Lithuanian | 24 | 0.3% |
| Norwegian | 7 | 0.1% |
| Peruvian | 20 | 0.2% |
| Polish | 688 | 7.3% |
| Romanian | 17 | 0.2% |
| Russian | 75 | 0.8% |
| Scotch-Irish | 153 | 1.6% |
| Scottish | 181 | 1.9% |
| Serbian | 120 | 1.3% |
| Slavic | 33 | 0.4% |
| Slovak | 213 | 2.3% |
| Slovene | 79 | 0.8% |
| South American | 20 | 0.2% |
| Swedish | 138 | 1.5% |
| Swiss | 16 | 0.2% |
| Syrian | 16 | 0.2% |
| Thai | 63 | 0.7% |
| Turkish | 9 | 0.1% |
| Ukrainian | 79 | 0.8% |
| Welsh | 35 | 0.4% | View All 45 Rows |
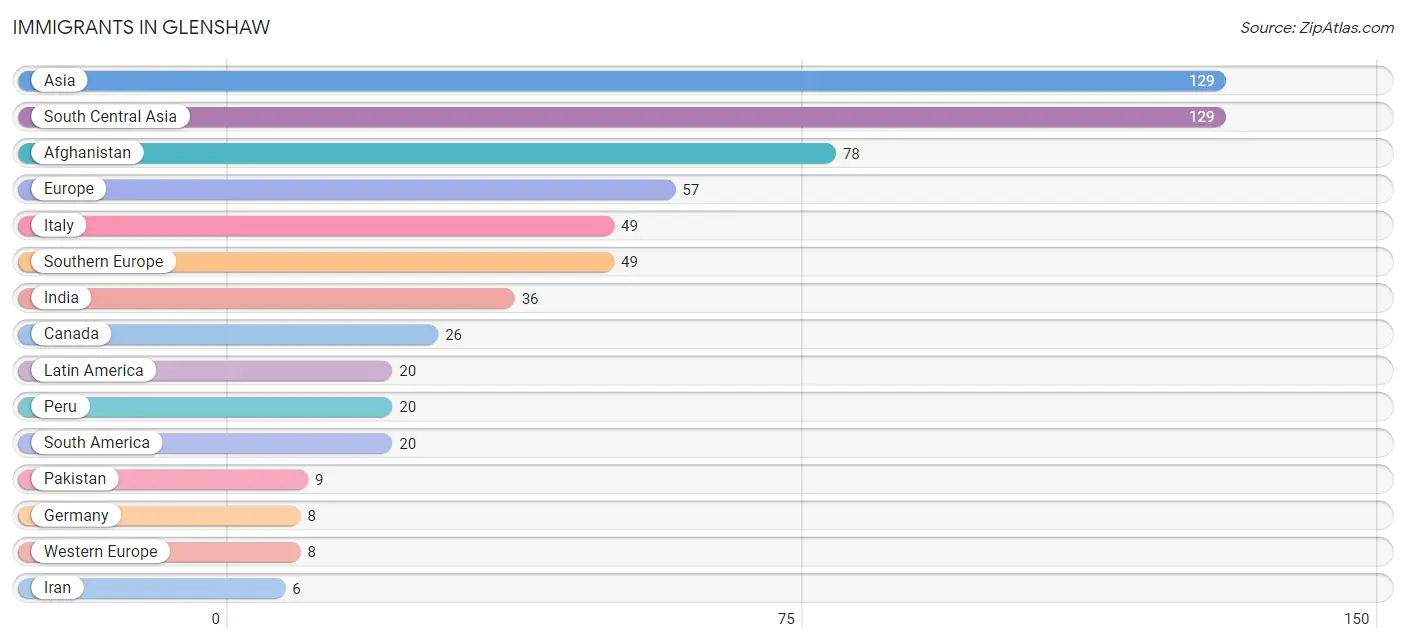
Immigrants in Glenshaw
The most numerous immigrant groups reported in Glenshaw came from Asia (129 | 1.4%), South Central Asia (129 | 1.4%), Afghanistan (78 | 0.8%), Europe (57 | 0.6%), and Italy (49 | 0.5%), together accounting for 4.7% of all Glenshaw residents.
| Immigration Origin | # Population | % Population |
| Afghanistan | 78 | 0.8% |
| Asia | 129 | 1.4% |
| Canada | 26 | 0.3% |
| Europe | 57 | 0.6% |
| Germany | 8 | 0.1% |
| India | 36 | 0.4% |
| Iran | 6 | 0.1% |
| Italy | 49 | 0.5% |
| Latin America | 20 | 0.2% |
| Pakistan | 9 | 0.1% |
| Peru | 20 | 0.2% |
| South America | 20 | 0.2% |
| South Central Asia | 129 | 1.4% |
| Southern Europe | 49 | 0.5% |
| Western Europe | 8 | 0.1% | View All 15 Rows |
Sex and Age in Glenshaw
Sex and Age in Glenshaw
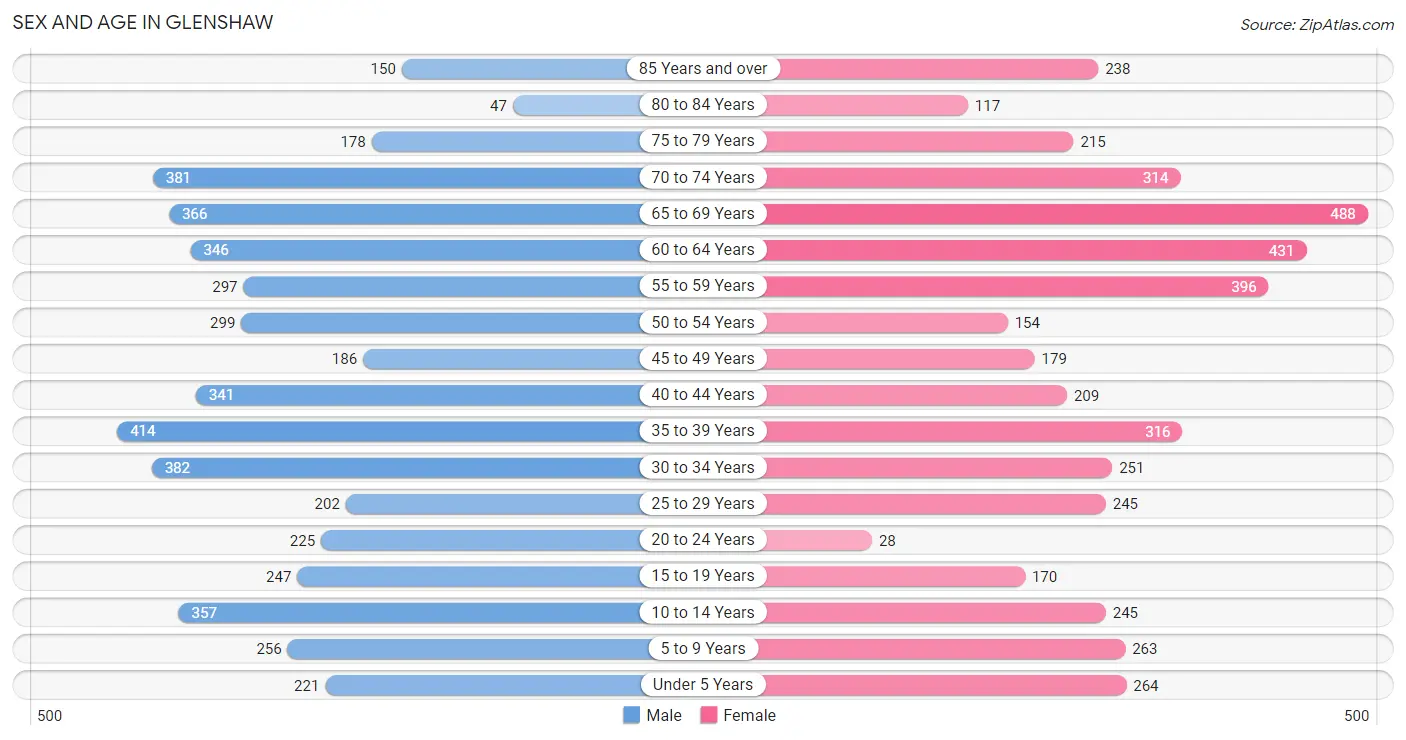
The most populous age groups in Glenshaw are 35 to 39 Years (414 | 8.5%) for men and 65 to 69 Years (488 | 10.8%) for women.
| Age Bracket | Male | Female |
| Under 5 Years | 221 (4.5%) | 264 (5.8%) |
| 5 to 9 Years | 256 (5.2%) | 263 (5.8%) |
| 10 to 14 Years | 357 (7.3%) | 245 (5.4%) |
| 15 to 19 Years | 247 (5.1%) | 170 (3.8%) |
| 20 to 24 Years | 225 (4.6%) | 28 (0.6%) |
| 25 to 29 Years | 202 (4.1%) | 245 (5.4%) |
| 30 to 34 Years | 382 (7.8%) | 251 (5.6%) |
| 35 to 39 Years | 414 (8.5%) | 316 (7.0%) |
| 40 to 44 Years | 341 (7.0%) | 209 (4.6%) |
| 45 to 49 Years | 186 (3.8%) | 179 (4.0%) |
| 50 to 54 Years | 299 (6.1%) | 154 (3.4%) |
| 55 to 59 Years | 297 (6.1%) | 396 (8.8%) |
| 60 to 64 Years | 346 (7.1%) | 431 (9.5%) |
| 65 to 69 Years | 366 (7.5%) | 488 (10.8%) |
| 70 to 74 Years | 381 (7.8%) | 314 (6.9%) |
| 75 to 79 Years | 178 (3.6%) | 215 (4.8%) |
| 80 to 84 Years | 47 (1.0%) | 117 (2.6%) |
| 85 Years and over | 150 (3.1%) | 238 (5.3%) |
| Total | 4,895 (100.0%) | 4,523 (100.0%) |
Families and Households in Glenshaw
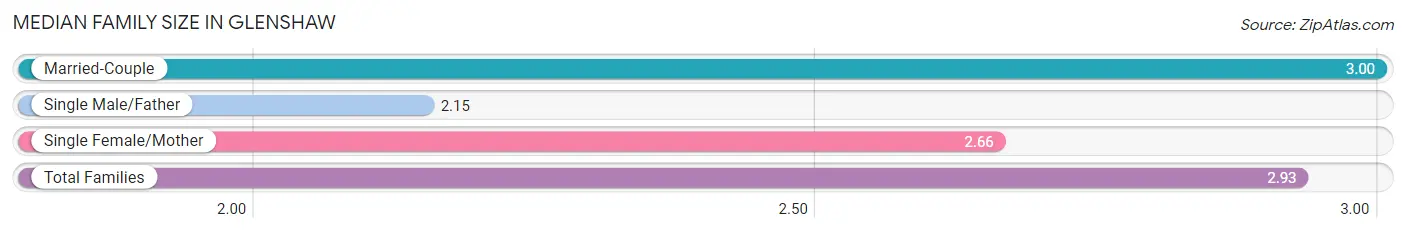
Median Family Size in Glenshaw
The median family size in Glenshaw is 2.93 persons per family, with married-couple families (2,455 | 86.0%) accounting for the largest median family size of 3 persons per family. On the other hand, single male/father families (120 | 4.2%) represent the smallest median family size with 2.15 persons per family.
| Family Type | # Families | Family Size |
| Married-Couple | 2,455 (86.0%) | 3.00 |
| Single Male/Father | 120 (4.2%) | 2.15 |
| Single Female/Mother | 280 (9.8%) | 2.66 |
| Total Families | 2,855 (100.0%) | 2.93 |
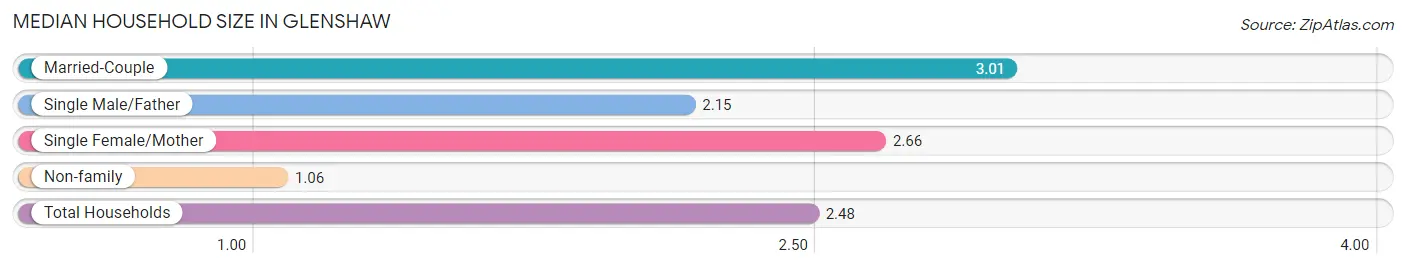
Median Household Size in Glenshaw
The median household size in Glenshaw is 2.48 persons per household, with married-couple households (2,455 | 64.7%) accounting for the largest median household size of 3.01 persons per household. non-family households (941 | 24.8%) represent the smallest median household size with 1.06 persons per household.
| Household Type | # Households | Household Size |
| Married-Couple | 2,455 (64.7%) | 3.01 |
| Single Male/Father | 120 (3.2%) | 2.15 |
| Single Female/Mother | 280 (7.4%) | 2.66 |
| Non-family | 941 (24.8%) | 1.06 |
| Total Households | 3,796 (100.0%) | 2.48 |
Household Size by Marriage Status in Glenshaw
Out of a total of 3,796 households in Glenshaw, 2,855 (75.2%) are family households, while 941 (24.8%) are nonfamily households. The most numerous type of family households are 2-person households, comprising 1,641, and the most common type of nonfamily households are 1-person households, comprising 889.
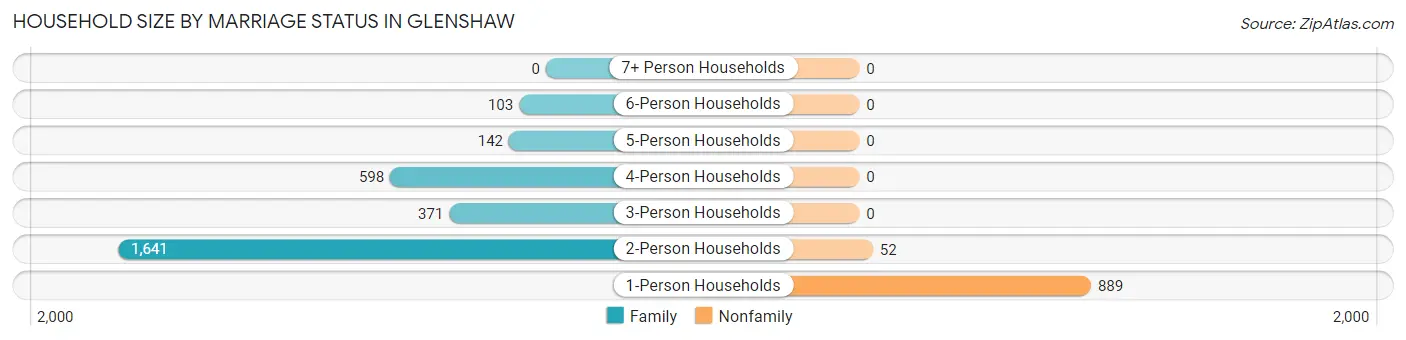
| Household Size | Family Households | Nonfamily Households |
| 1-Person Households | - | 889 (23.4%) |
| 2-Person Households | 1,641 (43.2%) | 52 (1.4%) |
| 3-Person Households | 371 (9.8%) | 0 (0.0%) |
| 4-Person Households | 598 (15.8%) | 0 (0.0%) |
| 5-Person Households | 142 (3.7%) | 0 (0.0%) |
| 6-Person Households | 103 (2.7%) | 0 (0.0%) |
| 7+ Person Households | 0 (0.0%) | 0 (0.0%) |
| Total | 2,855 (75.2%) | 941 (24.8%) |
Female Fertility in Glenshaw
Fertility by Age in Glenshaw
Average fertility rate in Glenshaw is 70.0 births per 1,000 women. Women in the age bracket of 35 to 50 years have the highest fertility rate with 92.0 births per 1,000 women. Women in the age bracket of 35 to 50 years acount for 67.0% of all women with births.
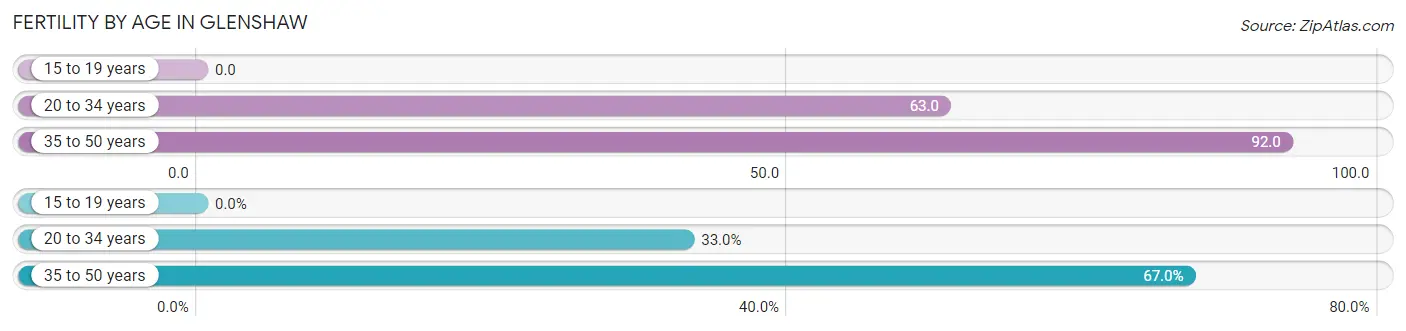
| Age Bracket | Women with Births | Births / 1,000 Women |
| 15 to 19 years | 0 (0.0%) | 0.0 |
| 20 to 34 years | 33 (33.0%) | 63.0 |
| 35 to 50 years | 67 (67.0%) | 92.0 |
| Total | 100 (100.0%) | 70.0 |
Fertility by Age by Marriage Status in Glenshaw
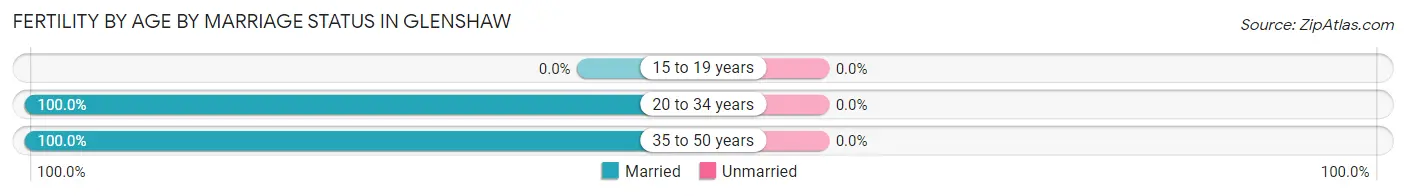
| Age Bracket | Married | Unmarried |
| 15 to 19 years | 0 (0.0%) | 0 (0.0%) |
| 20 to 34 years | 33 (100.0%) | 0 (0.0%) |
| 35 to 50 years | 67 (100.0%) | 0 (0.0%) |
| Total | 100 (100.0%) | 0 (0.0%) |
Fertility by Education in Glenshaw
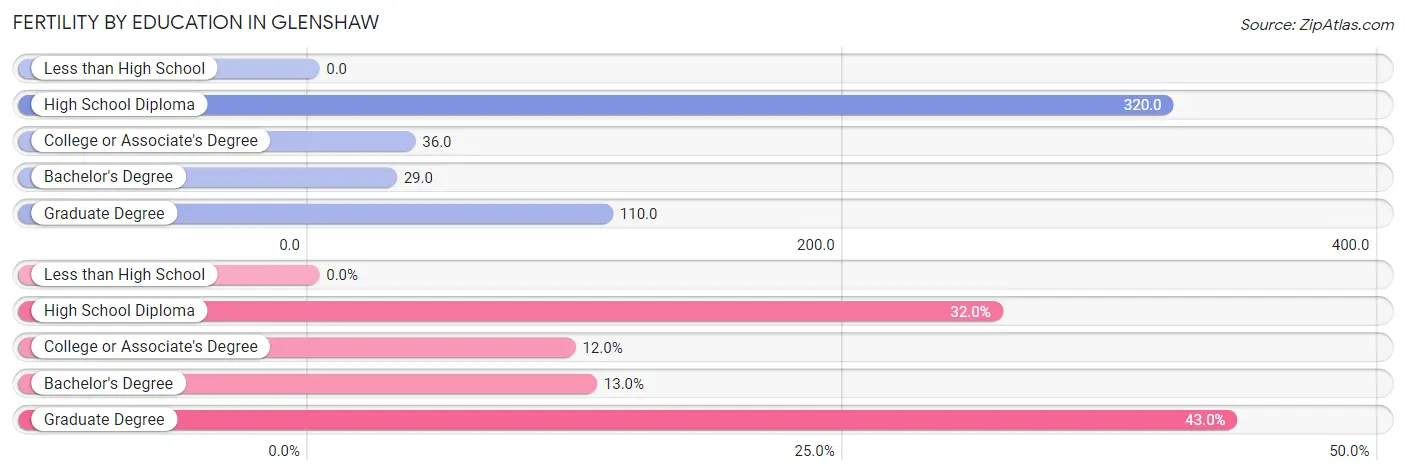
| Educational Attainment | Women with Births | Births / 1,000 Women |
| Less than High School | 0 (0.0%) | 0.0 |
| High School Diploma | 32 (32.0%) | 320.0 |
| College or Associate's Degree | 12 (12.0%) | 36.0 |
| Bachelor's Degree | 13 (13.0%) | 29.0 |
| Graduate Degree | 43 (43.0%) | 110.0 |
| Total | 100 (100.0%) | 70.0 |
Fertility by Education by Marriage Status in Glenshaw
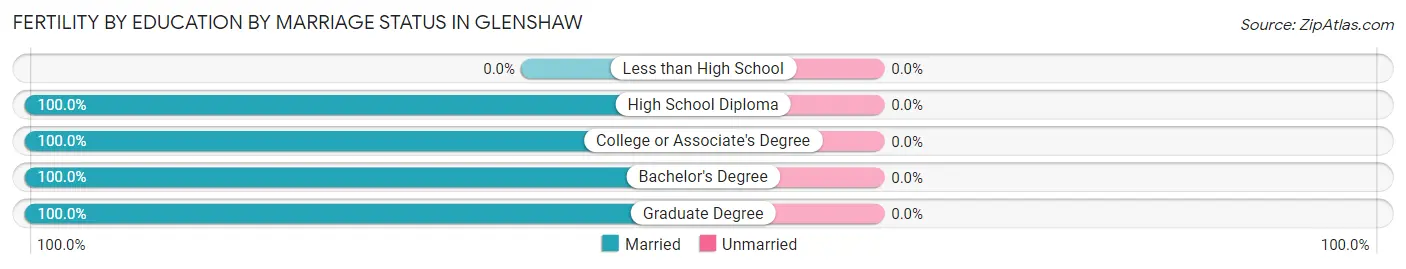
| Educational Attainment | Married | Unmarried |
| Less than High School | 0 (0.0%) | 0 (0.0%) |
| High School Diploma | 32 (100.0%) | 0 (0.0%) |
| College or Associate's Degree | 12 (100.0%) | 0 (0.0%) |
| Bachelor's Degree | 13 (100.0%) | 0 (0.0%) |
| Graduate Degree | 43 (100.0%) | 0 (0.0%) |
| Total | 100 (100.0%) | 0 (0.0%) |
Employment Characteristics in Glenshaw
Employment by Class of Employer in Glenshaw
Among the 4,562 employed individuals in Glenshaw, private company employees (3,088 | 67.7%), not-for-profit organizations (579 | 12.7%), and local government employees (446 | 9.8%) make up the most common classes of employment.
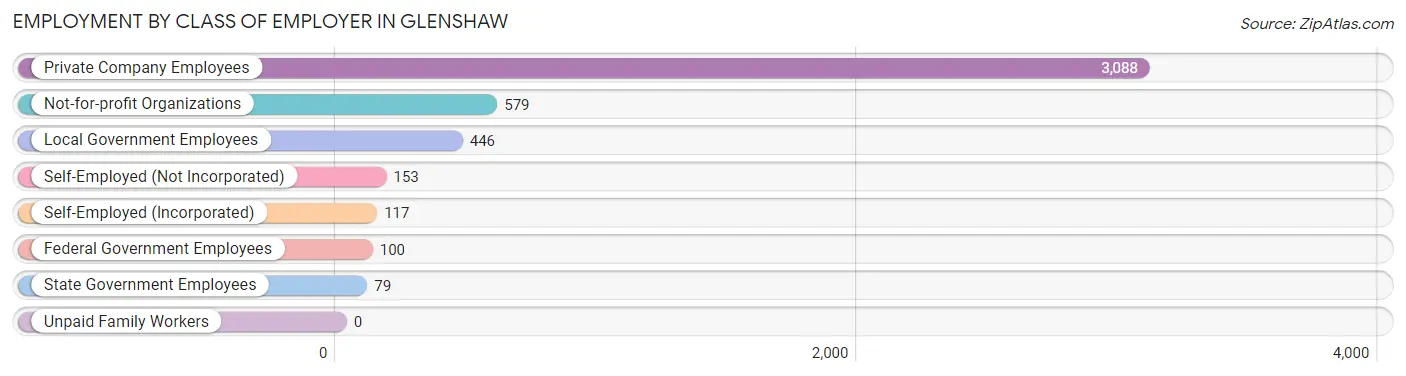
| Employer Class | # Employees | % Employees |
| Private Company Employees | 3,088 | 67.7% |
| Self-Employed (Incorporated) | 117 | 2.6% |
| Self-Employed (Not Incorporated) | 153 | 3.4% |
| Not-for-profit Organizations | 579 | 12.7% |
| Local Government Employees | 446 | 9.8% |
| State Government Employees | 79 | 1.7% |
| Federal Government Employees | 100 | 2.2% |
| Unpaid Family Workers | 0 | 0.0% |
| Total | 4,562 | 100.0% |
Employment Status by Age in Glenshaw
According to the labor force statistics for Glenshaw, out of the total population over 16 years of age (7,750), 65.5% or 5,076 individuals are in the labor force, with 6.5% or 330 of them unemployed. The age group with the highest labor force participation rate is 30 to 34 years, with 98.3% or 622 individuals in the labor force. Within the labor force, the 20 to 24 years age range has the highest percentage of unemployed individuals, with 36.8% or 74 of them being unemployed.
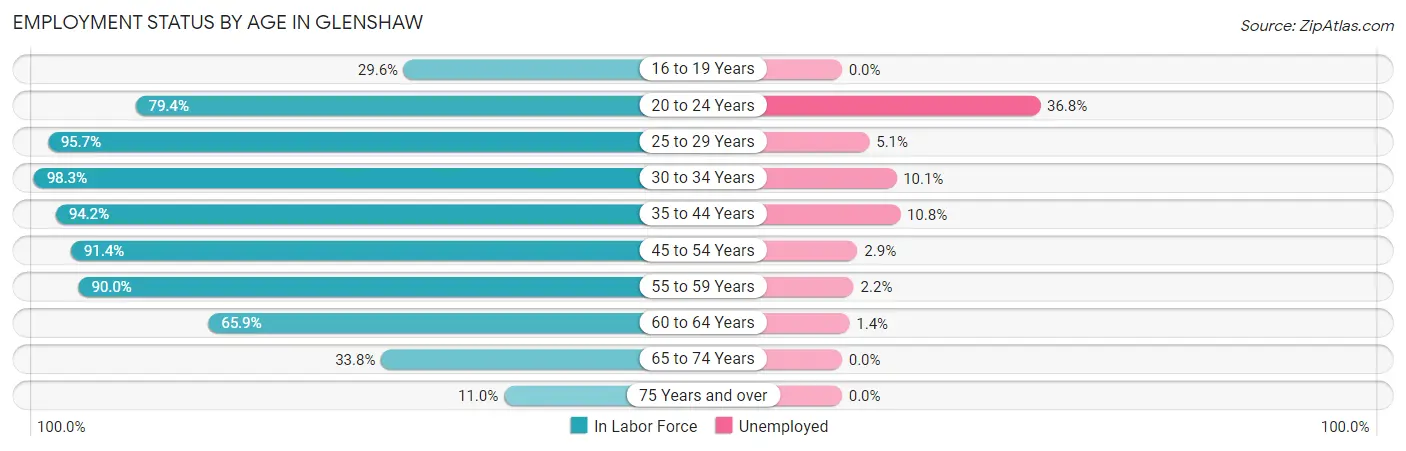
| Age Bracket | In Labor Force | Unemployed |
| 16 to 19 Years | 105 (29.6%) | 0 (0.0%) |
| 20 to 24 Years | 201 (79.4%) | 74 (36.8%) |
| 25 to 29 Years | 428 (95.7%) | 22 (5.1%) |
| 30 to 34 Years | 622 (98.3%) | 63 (10.1%) |
| 35 to 44 Years | 1,206 (94.2%) | 130 (10.8%) |
| 45 to 54 Years | 748 (91.4%) | 22 (2.9%) |
| 55 to 59 Years | 624 (90.0%) | 14 (2.2%) |
| 60 to 64 Years | 512 (65.9%) | 7 (1.4%) |
| 65 to 74 Years | 524 (33.8%) | 0 (0.0%) |
| 75 Years and over | 104 (11.0%) | 0 (0.0%) |
| Total | 5,076 (65.5%) | 330 (6.5%) |
Employment Status by Educational Attainment in Glenshaw
According to labor force statistics for Glenshaw, 89.1% of individuals (4,141) out of the total population between 25 and 64 years of age (4,648) are in the labor force, with 6.2% or 257 of them being unemployed. The group with the highest labor force participation rate are those with the educational attainment of college / associate degree, with 89.8% or 966 individuals in the labor force. Within the labor force, individuals with high school diploma education have the highest percentage of unemployment, with 21.4% or 125 of them being unemployed.
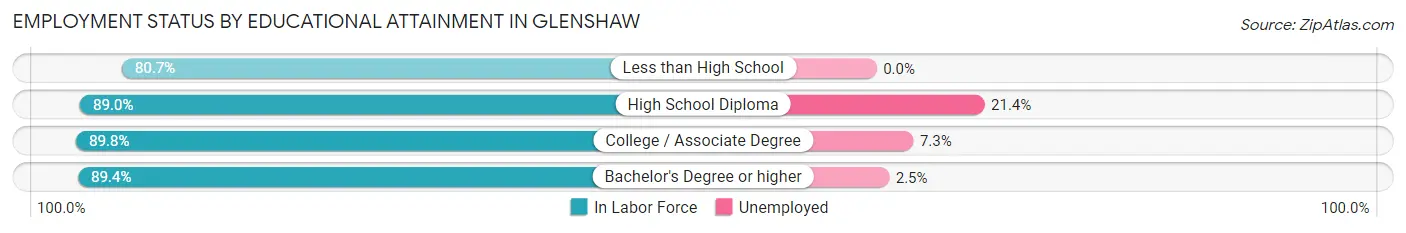
| Educational Attainment | In Labor Force | Unemployed |
| Less than High School | 151 (80.7%) | 0 (0.0%) |
| High School Diploma | 584 (89.0%) | 140 (21.4%) |
| College / Associate Degree | 966 (89.8%) | 79 (7.3%) |
| Bachelor's Degree or higher | 2,440 (89.4%) | 68 (2.5%) |
| Total | 4,141 (89.1%) | 288 (6.2%) |
Employment Occupations by Sex in Glenshaw
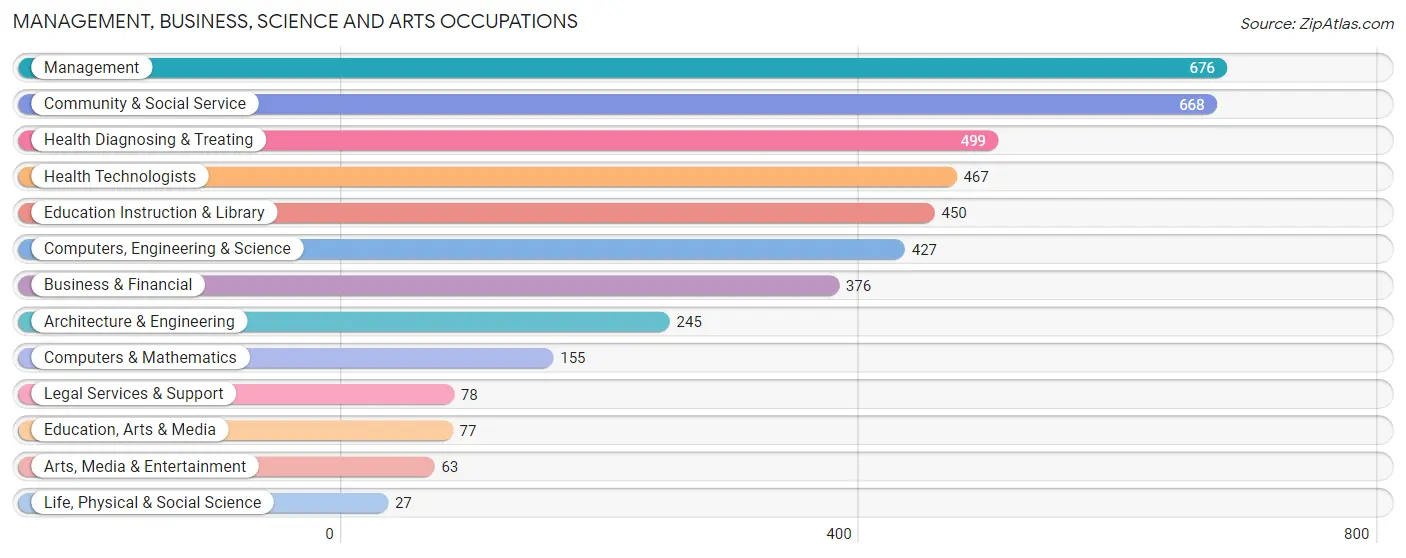
Management, Business, Science and Arts Occupations
The most common Management, Business, Science and Arts occupations in Glenshaw are Management (676 | 14.3%), Community & Social Service (668 | 14.1%), Health Diagnosing & Treating (499 | 10.5%), Health Technologists (467 | 9.9%), and Education Instruction & Library (450 | 9.5%).
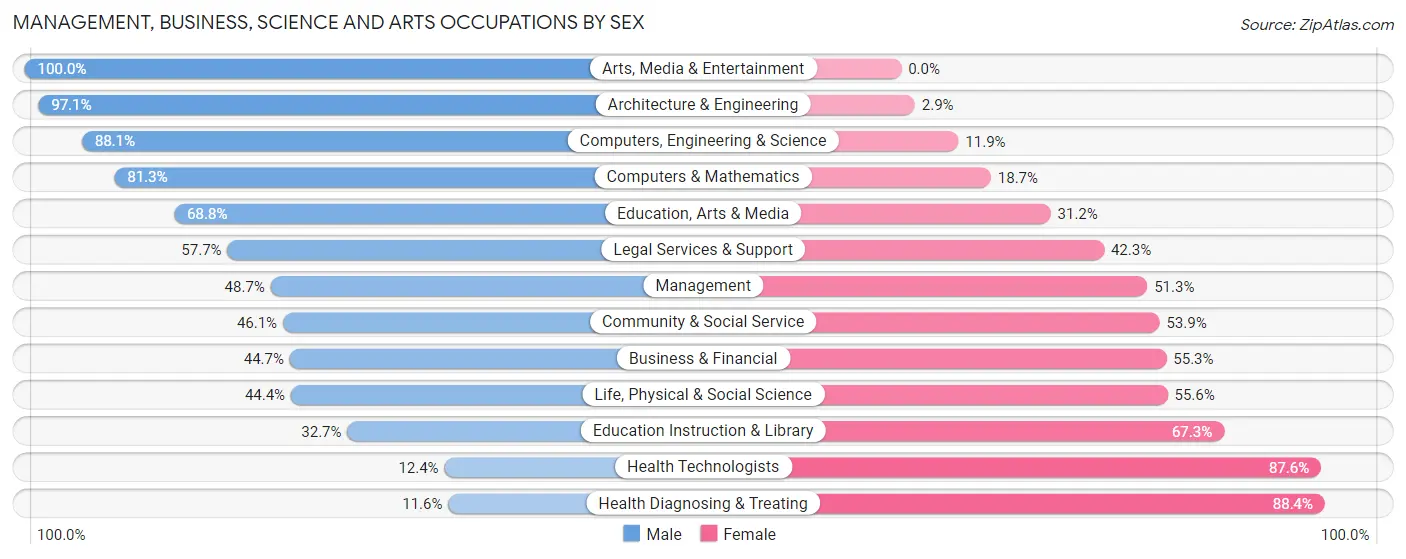
Management, Business, Science and Arts Occupations by Sex
Within the Management, Business, Science and Arts occupations in Glenshaw, the most male-oriented occupations are Arts, Media & Entertainment (100.0%), Architecture & Engineering (97.1%), and Computers, Engineering & Science (88.1%), while the most female-oriented occupations are Health Diagnosing & Treating (88.4%), Health Technologists (87.6%), and Education Instruction & Library (67.3%).
| Occupation | Male | Female |
| Management | 329 (48.7%) | 347 (51.3%) |
| Business & Financial | 168 (44.7%) | 208 (55.3%) |
| Computers, Engineering & Science | 376 (88.1%) | 51 (11.9%) |
| Computers & Mathematics | 126 (81.3%) | 29 (18.7%) |
| Architecture & Engineering | 238 (97.1%) | 7 (2.9%) |
| Life, Physical & Social Science | 12 (44.4%) | 15 (55.6%) |
| Community & Social Service | 308 (46.1%) | 360 (53.9%) |
| Education, Arts & Media | 53 (68.8%) | 24 (31.2%) |
| Legal Services & Support | 45 (57.7%) | 33 (42.3%) |
| Education Instruction & Library | 147 (32.7%) | 303 (67.3%) |
| Arts, Media & Entertainment | 63 (100.0%) | 0 (0.0%) |
| Health Diagnosing & Treating | 58 (11.6%) | 441 (88.4%) |
| Health Technologists | 58 (12.4%) | 409 (87.6%) |
| Total (Category) | 1,239 (46.8%) | 1,407 (53.2%) |
| Total (Overall) | 2,473 (52.1%) | 2,269 (47.8%) |
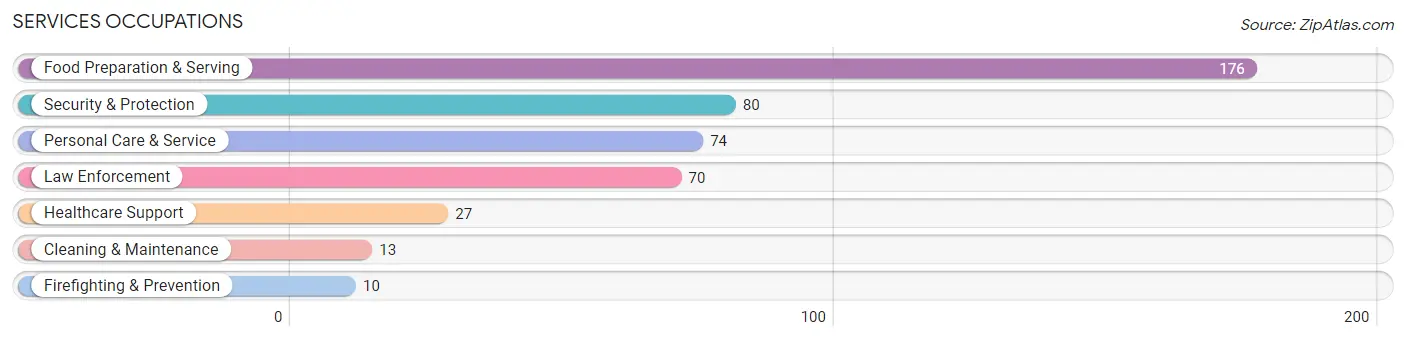
Services Occupations
The most common Services occupations in Glenshaw are Food Preparation & Serving (176 | 3.7%), Security & Protection (80 | 1.7%), Personal Care & Service (74 | 1.6%), Law Enforcement (70 | 1.5%), and Healthcare Support (27 | 0.6%).
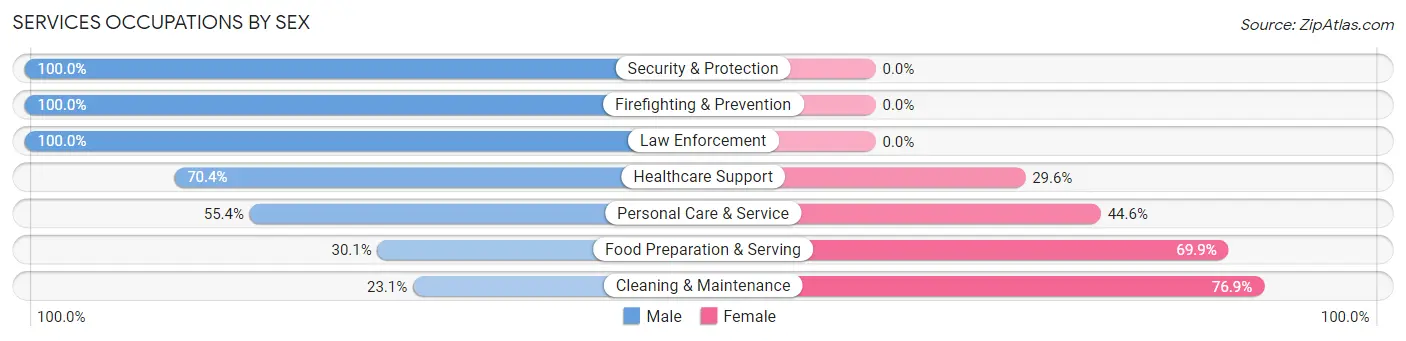
Services Occupations by Sex
Within the Services occupations in Glenshaw, the most male-oriented occupations are Security & Protection (100.0%), Firefighting & Prevention (100.0%), and Law Enforcement (100.0%), while the most female-oriented occupations are Cleaning & Maintenance (76.9%), Food Preparation & Serving (69.9%), and Personal Care & Service (44.6%).
| Occupation | Male | Female |
| Healthcare Support | 19 (70.4%) | 8 (29.6%) |
| Security & Protection | 80 (100.0%) | 0 (0.0%) |
| Firefighting & Prevention | 10 (100.0%) | 0 (0.0%) |
| Law Enforcement | 70 (100.0%) | 0 (0.0%) |
| Food Preparation & Serving | 53 (30.1%) | 123 (69.9%) |
| Cleaning & Maintenance | 3 (23.1%) | 10 (76.9%) |
| Personal Care & Service | 41 (55.4%) | 33 (44.6%) |
| Total (Category) | 196 (53.0%) | 174 (47.0%) |
| Total (Overall) | 2,473 (52.1%) | 2,269 (47.8%) |
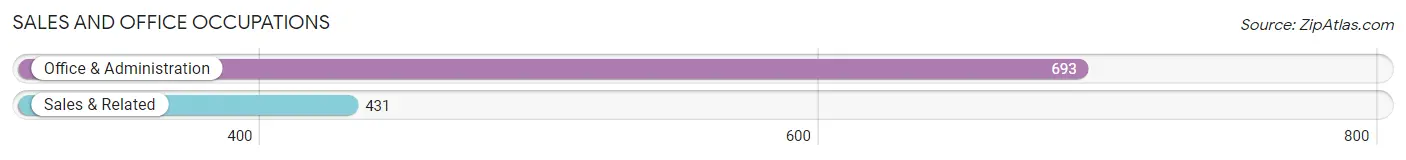
Sales and Office Occupations
The most common Sales and Office occupations in Glenshaw are Office & Administration (693 | 14.6%), and Sales & Related (431 | 9.1%).
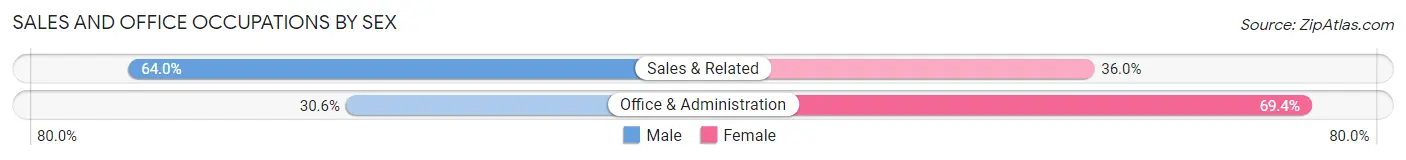
Sales and Office Occupations by Sex
| Occupation | Male | Female |
| Sales & Related | 276 (64.0%) | 155 (36.0%) |
| Office & Administration | 212 (30.6%) | 481 (69.4%) |
| Total (Category) | 488 (43.4%) | 636 (56.6%) |
| Total (Overall) | 2,473 (52.1%) | 2,269 (47.8%) |
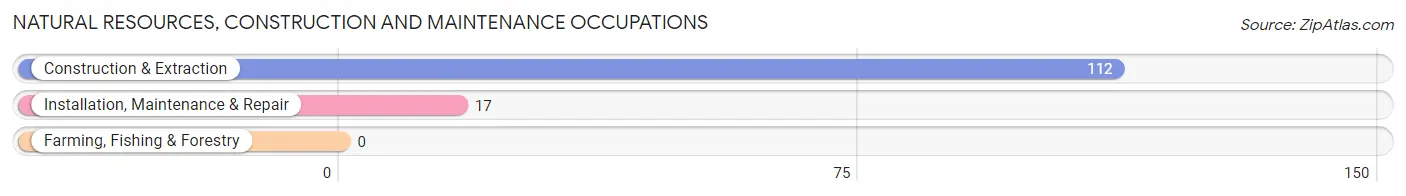
Natural Resources, Construction and Maintenance Occupations
The most common Natural Resources, Construction and Maintenance occupations in Glenshaw are Construction & Extraction (112 | 2.4%), and Installation, Maintenance & Repair (17 | 0.4%).
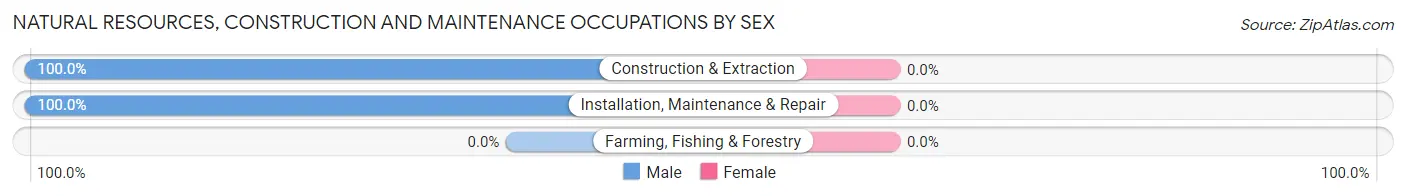
Natural Resources, Construction and Maintenance Occupations by Sex
| Occupation | Male | Female |
| Farming, Fishing & Forestry | 0 (0.0%) | 0 (0.0%) |
| Construction & Extraction | 112 (100.0%) | 0 (0.0%) |
| Installation, Maintenance & Repair | 17 (100.0%) | 0 (0.0%) |
| Total (Category) | 129 (100.0%) | 0 (0.0%) |
| Total (Overall) | 2,473 (52.1%) | 2,269 (47.8%) |
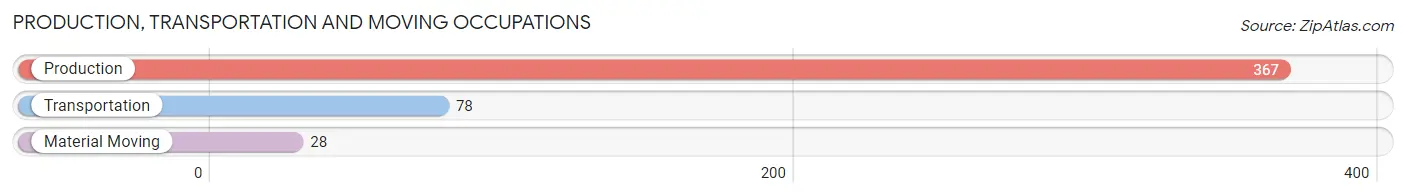
Production, Transportation and Moving Occupations
The most common Production, Transportation and Moving occupations in Glenshaw are Production (367 | 7.7%), Transportation (78 | 1.6%), and Material Moving (28 | 0.6%).
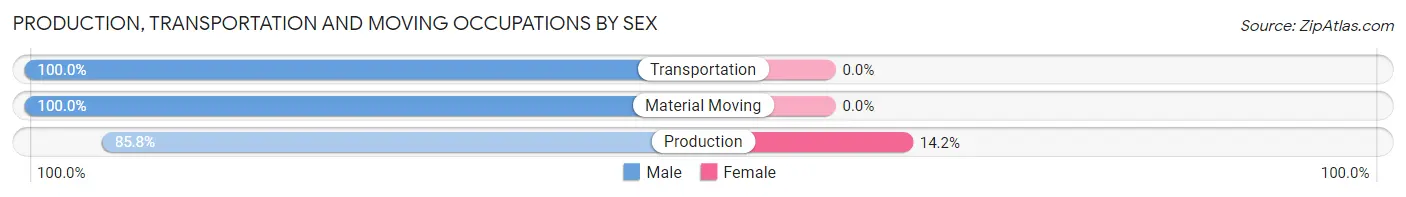
Production, Transportation and Moving Occupations by Sex
| Occupation | Male | Female |
| Production | 315 (85.8%) | 52 (14.2%) |
| Transportation | 78 (100.0%) | 0 (0.0%) |
| Material Moving | 28 (100.0%) | 0 (0.0%) |
| Total (Category) | 421 (89.0%) | 52 (11.0%) |
| Total (Overall) | 2,473 (52.1%) | 2,269 (47.8%) |
Employment Industries by Sex in Glenshaw
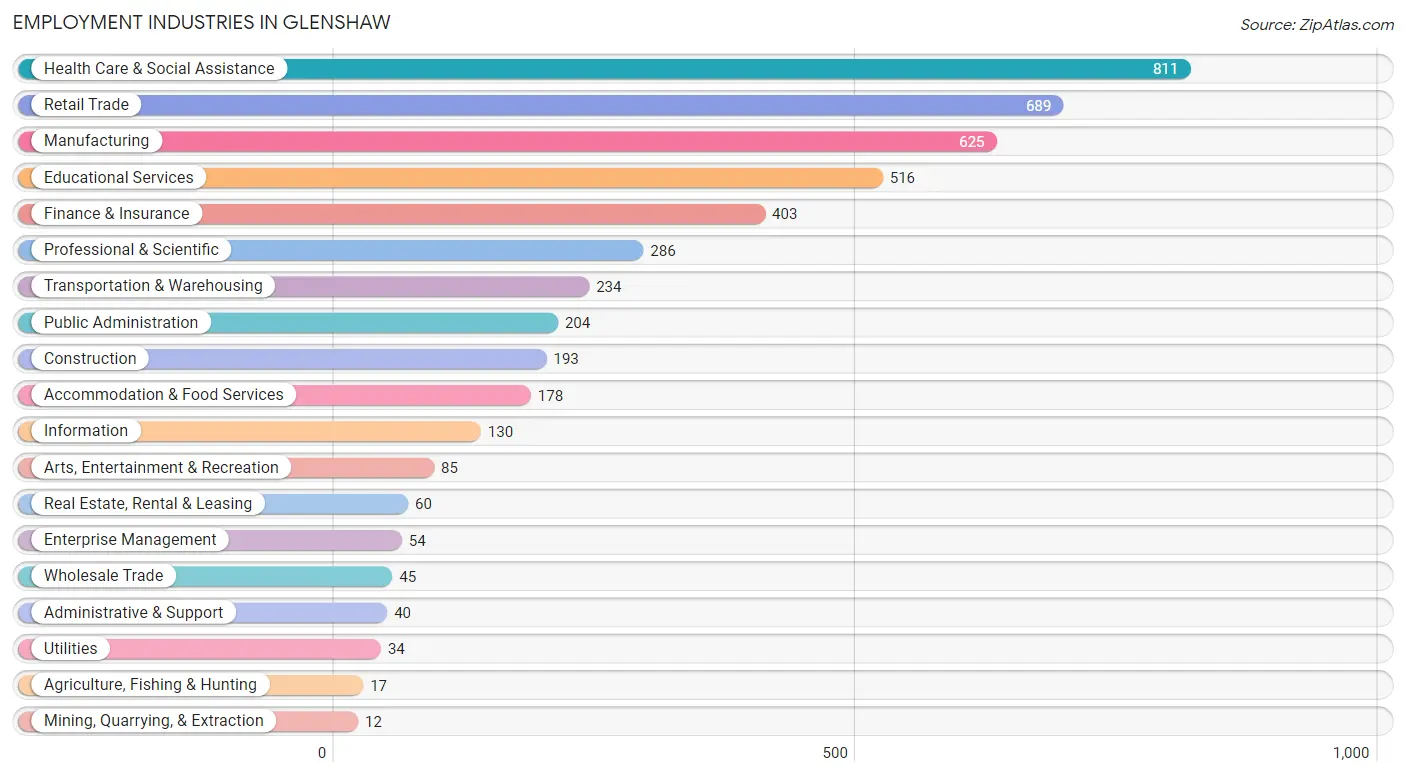
Employment Industries in Glenshaw
The major employment industries in Glenshaw include Health Care & Social Assistance (811 | 17.1%), Retail Trade (689 | 14.5%), Manufacturing (625 | 13.2%), Educational Services (516 | 10.9%), and Finance & Insurance (403 | 8.5%).
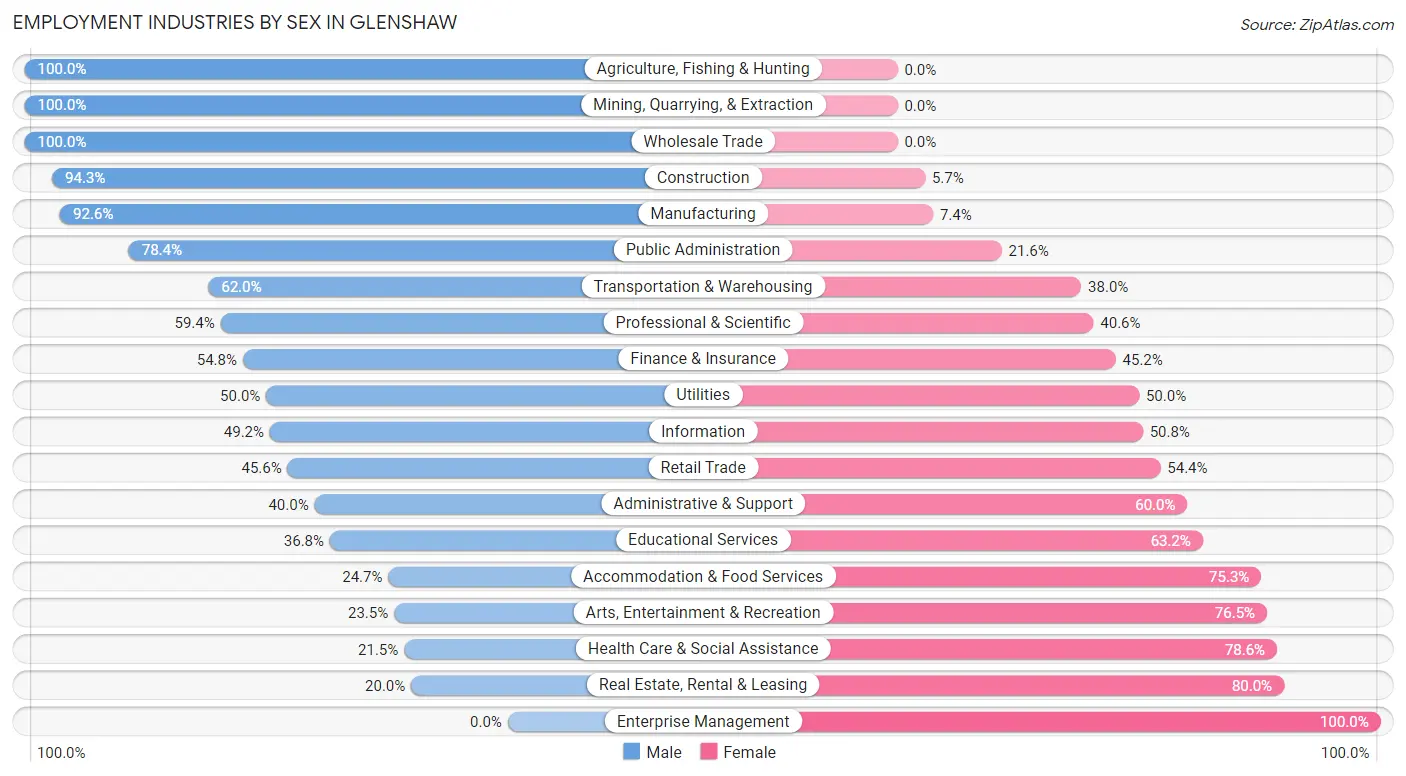
Employment Industries by Sex in Glenshaw
The Glenshaw industries that see more men than women are Agriculture, Fishing & Hunting (100.0%), Mining, Quarrying, & Extraction (100.0%), and Wholesale Trade (100.0%), whereas the industries that tend to have a higher number of women are Enterprise Management (100.0%), Real Estate, Rental & Leasing (80.0%), and Health Care & Social Assistance (78.5%).
| Industry | Male | Female |
| Agriculture, Fishing & Hunting | 17 (100.0%) | 0 (0.0%) |
| Mining, Quarrying, & Extraction | 12 (100.0%) | 0 (0.0%) |
| Construction | 182 (94.3%) | 11 (5.7%) |
| Manufacturing | 579 (92.6%) | 46 (7.4%) |
| Wholesale Trade | 45 (100.0%) | 0 (0.0%) |
| Retail Trade | 314 (45.6%) | 375 (54.4%) |
| Transportation & Warehousing | 145 (62.0%) | 89 (38.0%) |
| Utilities | 17 (50.0%) | 17 (50.0%) |
| Information | 64 (49.2%) | 66 (50.8%) |
| Finance & Insurance | 221 (54.8%) | 182 (45.2%) |
| Real Estate, Rental & Leasing | 12 (20.0%) | 48 (80.0%) |
| Professional & Scientific | 170 (59.4%) | 116 (40.6%) |
| Enterprise Management | 0 (0.0%) | 54 (100.0%) |
| Administrative & Support | 16 (40.0%) | 24 (60.0%) |
| Educational Services | 190 (36.8%) | 326 (63.2%) |
| Health Care & Social Assistance | 174 (21.4%) | 637 (78.5%) |
| Arts, Entertainment & Recreation | 20 (23.5%) | 65 (76.5%) |
| Accommodation & Food Services | 44 (24.7%) | 134 (75.3%) |
| Public Administration | 160 (78.4%) | 44 (21.6%) |
| Total | 2,473 (52.1%) | 2,269 (47.8%) |
Education in Glenshaw
School Enrollment in Glenshaw
The most common levels of schooling among the 1,831 students in Glenshaw are middle school (510 | 27.9%), high school (413 | 22.6%), and elementary school (390 | 21.3%).
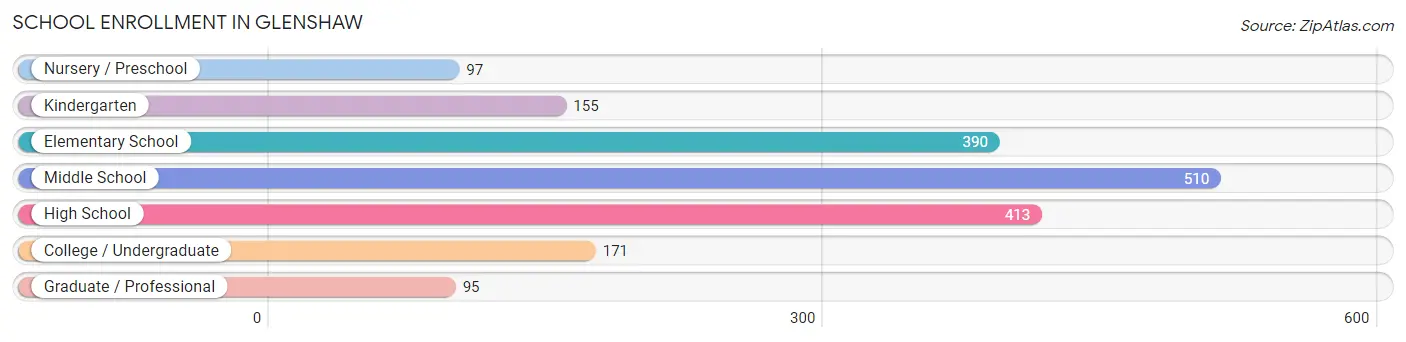
| School Level | # Students | % Students |
| Nursery / Preschool | 97 | 5.3% |
| Kindergarten | 155 | 8.5% |
| Elementary School | 390 | 21.3% |
| Middle School | 510 | 27.9% |
| High School | 413 | 22.6% |
| College / Undergraduate | 171 | 9.3% |
| Graduate / Professional | 95 | 5.2% |
| Total | 1,831 | 100.0% |
School Enrollment by Age by Funding Source in Glenshaw
Out of a total of 1,831 students who are enrolled in schools in Glenshaw, 216 (11.8%) attend a private institution, while the remaining 1,615 (88.2%) are enrolled in public schools. The age group of 35 years and over has the highest likelihood of being enrolled in private schools, with 41 (73.2% in the age bracket) enrolled. Conversely, the age group of 10 to 14 year olds has the lowest likelihood of being enrolled in a private school, with 602 (100.0% in the age bracket) attending a public institution.
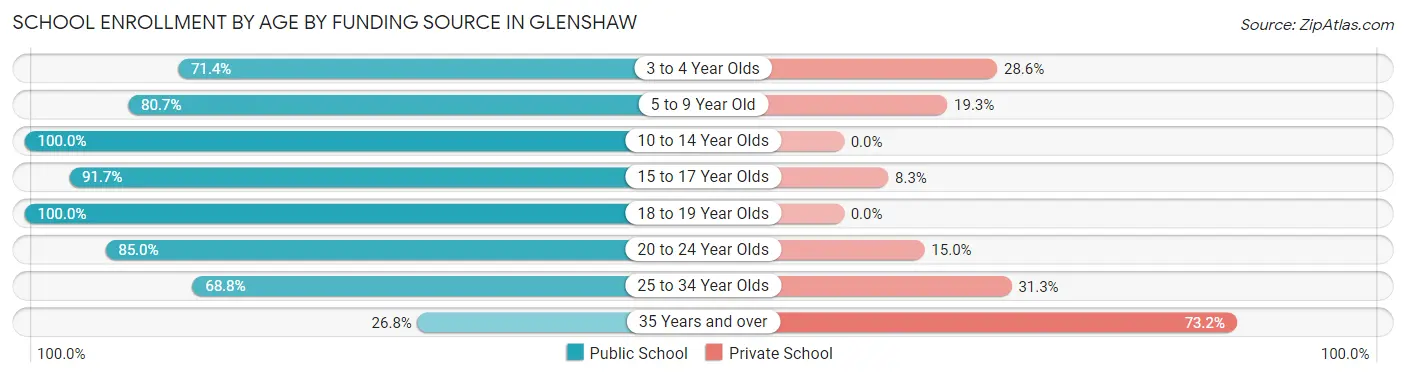
| Age Bracket | Public School | Private School |
| 3 to 4 Year Olds | 40 (71.4%) | 16 (28.6%) |
| 5 to 9 Year Old | 419 (80.7%) | 100 (19.3%) |
| 10 to 14 Year Olds | 602 (100.0%) | 0 (0.0%) |
| 15 to 17 Year Olds | 266 (91.7%) | 24 (8.3%) |
| 18 to 19 Year Olds | 127 (100.0%) | 0 (0.0%) |
| 20 to 24 Year Olds | 113 (85.0%) | 20 (15.0%) |
| 25 to 34 Year Olds | 33 (68.8%) | 15 (31.2%) |
| 35 Years and over | 15 (26.8%) | 41 (73.2%) |
| Total | 1,615 (88.2%) | 216 (11.8%) |
Educational Attainment by Field of Study in Glenshaw
Business (713 | 17.7%), education (471 | 11.7%), science & technology (409 | 10.2%), communications (334 | 8.3%), and engineering (313 | 7.8%) are the most common fields of study among 4,029 individuals in Glenshaw who have obtained a bachelor's degree or higher.
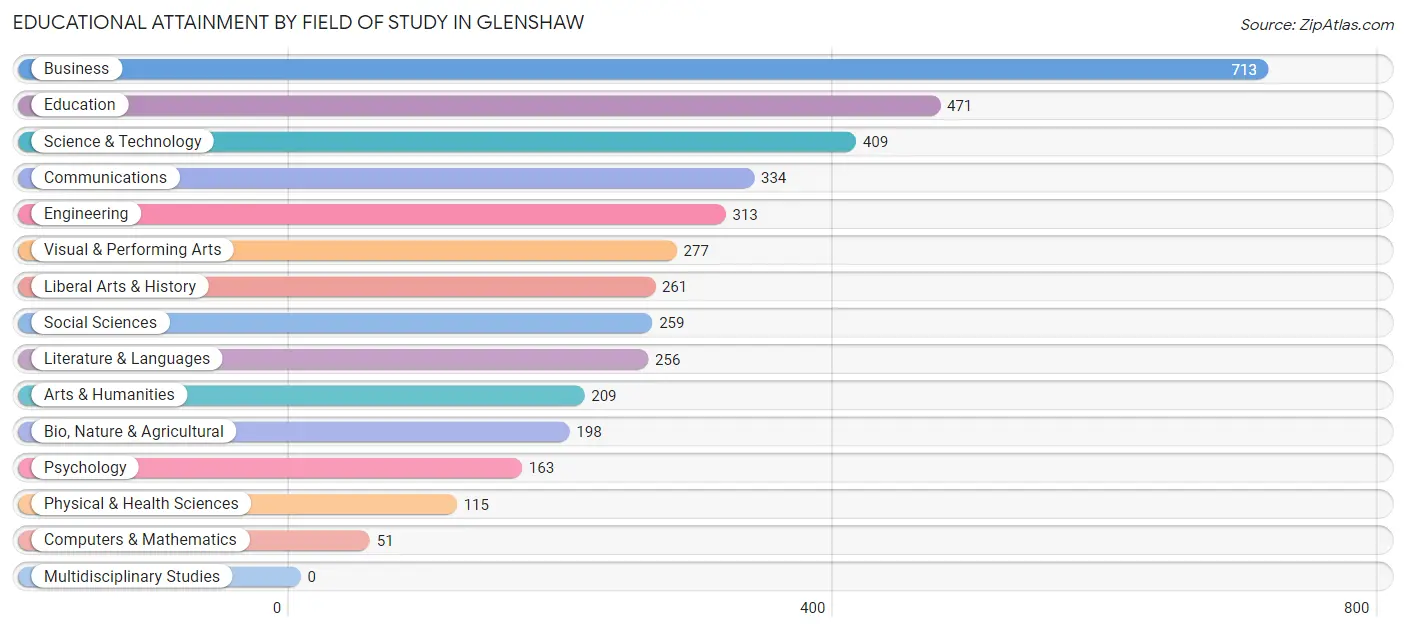
| Field of Study | # Graduates | % Graduates |
| Computers & Mathematics | 51 | 1.3% |
| Bio, Nature & Agricultural | 198 | 4.9% |
| Physical & Health Sciences | 115 | 2.9% |
| Psychology | 163 | 4.1% |
| Social Sciences | 259 | 6.4% |
| Engineering | 313 | 7.8% |
| Multidisciplinary Studies | 0 | 0.0% |
| Science & Technology | 409 | 10.2% |
| Business | 713 | 17.7% |
| Education | 471 | 11.7% |
| Literature & Languages | 256 | 6.4% |
| Liberal Arts & History | 261 | 6.5% |
| Visual & Performing Arts | 277 | 6.9% |
| Communications | 334 | 8.3% |
| Arts & Humanities | 209 | 5.2% |
| Total | 4,029 | 100.0% |
Transportation & Commute in Glenshaw
Vehicle Availability by Sex in Glenshaw
The most prevalent vehicle ownership categories in Glenshaw are males with 2 vehicles (1,392, accounting for 58.3%) and females with 2 vehicles (1,280, making up 64.1%).
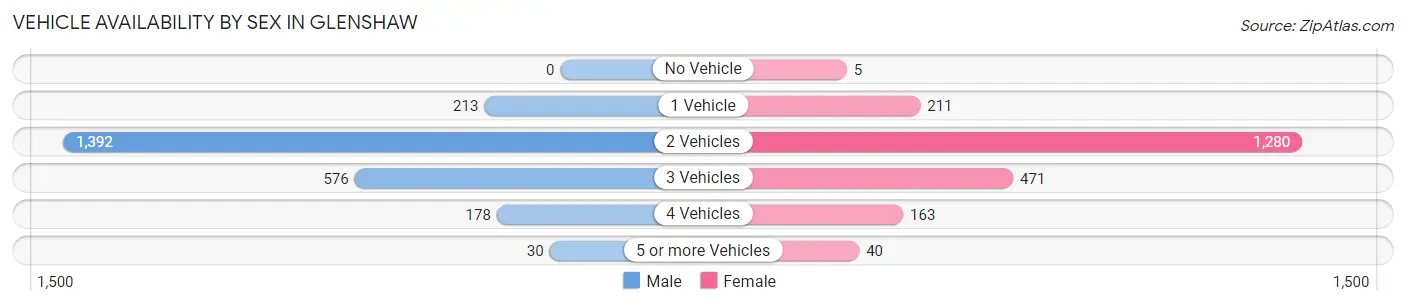
| Vehicles Available | Male | Female |
| No Vehicle | 0 (0.0%) | 5 (0.2%) |
| 1 Vehicle | 213 (8.9%) | 211 (9.7%) |
| 2 Vehicles | 1,392 (58.3%) | 1,280 (59.0%) |
| 3 Vehicles | 576 (24.1%) | 471 (21.7%) |
| 4 Vehicles | 178 (7.4%) | 163 (7.5%) |
| 5 or more Vehicles | 30 (1.3%) | 40 (1.8%) |
| Total | 2,389 (100.0%) | 2,170 (100.0%) |
Commute Time in Glenshaw
The most frequently occuring commute durations in Glenshaw are 30 to 34 minutes (903 commuters, 23.1%), 20 to 24 minutes (535 commuters, 13.7%), and 10 to 14 minutes (494 commuters, 12.6%).
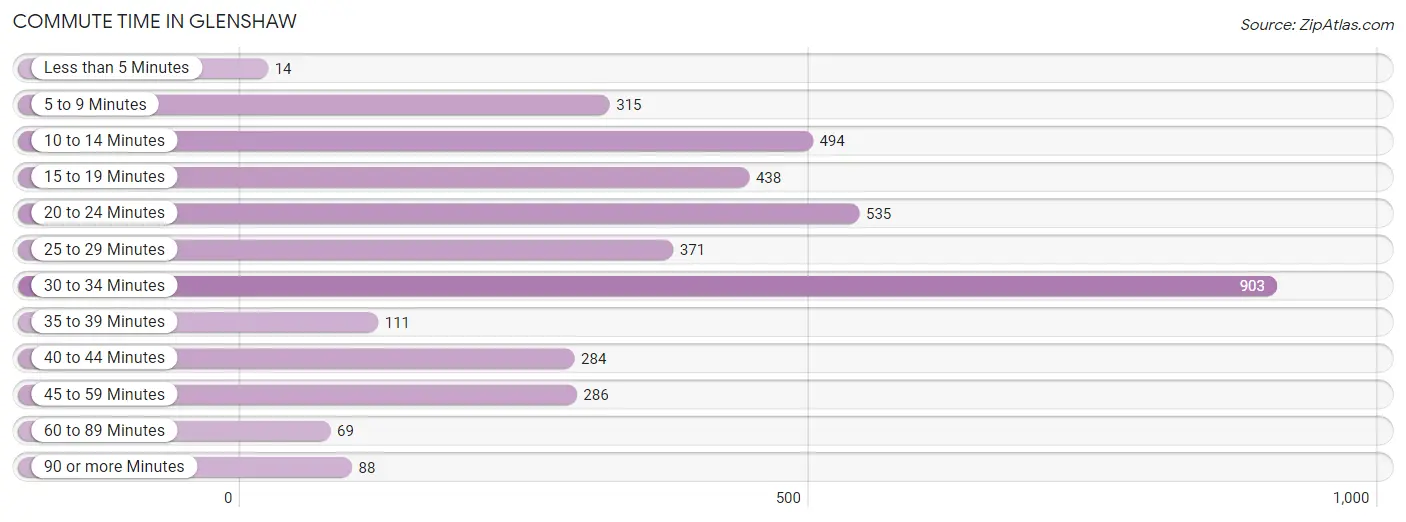
| Commute Time | # Commuters | % Commuters |
| Less than 5 Minutes | 14 | 0.4% |
| 5 to 9 Minutes | 315 | 8.1% |
| 10 to 14 Minutes | 494 | 12.6% |
| 15 to 19 Minutes | 438 | 11.2% |
| 20 to 24 Minutes | 535 | 13.7% |
| 25 to 29 Minutes | 371 | 9.5% |
| 30 to 34 Minutes | 903 | 23.1% |
| 35 to 39 Minutes | 111 | 2.8% |
| 40 to 44 Minutes | 284 | 7.3% |
| 45 to 59 Minutes | 286 | 7.3% |
| 60 to 89 Minutes | 69 | 1.8% |
| 90 or more Minutes | 88 | 2.2% |
Commute Time by Sex in Glenshaw
The most common commute times in Glenshaw are 30 to 34 minutes (509 commuters, 24.3%) for males and 30 to 34 minutes (394 commuters, 21.7%) for females.
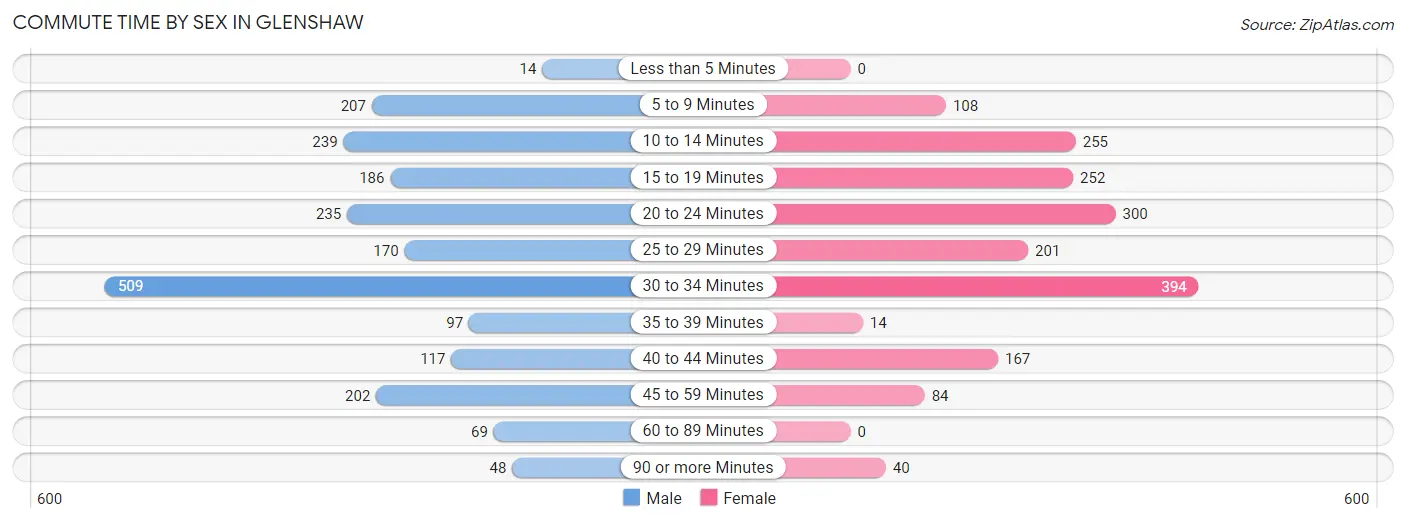
| Commute Time | Male | Female |
| Less than 5 Minutes | 14 (0.7%) | 0 (0.0%) |
| 5 to 9 Minutes | 207 (9.9%) | 108 (5.9%) |
| 10 to 14 Minutes | 239 (11.4%) | 255 (14.1%) |
| 15 to 19 Minutes | 186 (8.9%) | 252 (13.9%) |
| 20 to 24 Minutes | 235 (11.2%) | 300 (16.5%) |
| 25 to 29 Minutes | 170 (8.1%) | 201 (11.1%) |
| 30 to 34 Minutes | 509 (24.3%) | 394 (21.7%) |
| 35 to 39 Minutes | 97 (4.6%) | 14 (0.8%) |
| 40 to 44 Minutes | 117 (5.6%) | 167 (9.2%) |
| 45 to 59 Minutes | 202 (9.7%) | 84 (4.6%) |
| 60 to 89 Minutes | 69 (3.3%) | 0 (0.0%) |
| 90 or more Minutes | 48 (2.3%) | 40 (2.2%) |
Time of Departure to Work by Sex in Glenshaw
The most frequent times of departure to work in Glenshaw are 7:30 AM to 7:59 AM (354, 16.9%) for males and 6:30 AM to 6:59 AM (413, 22.8%) for females.
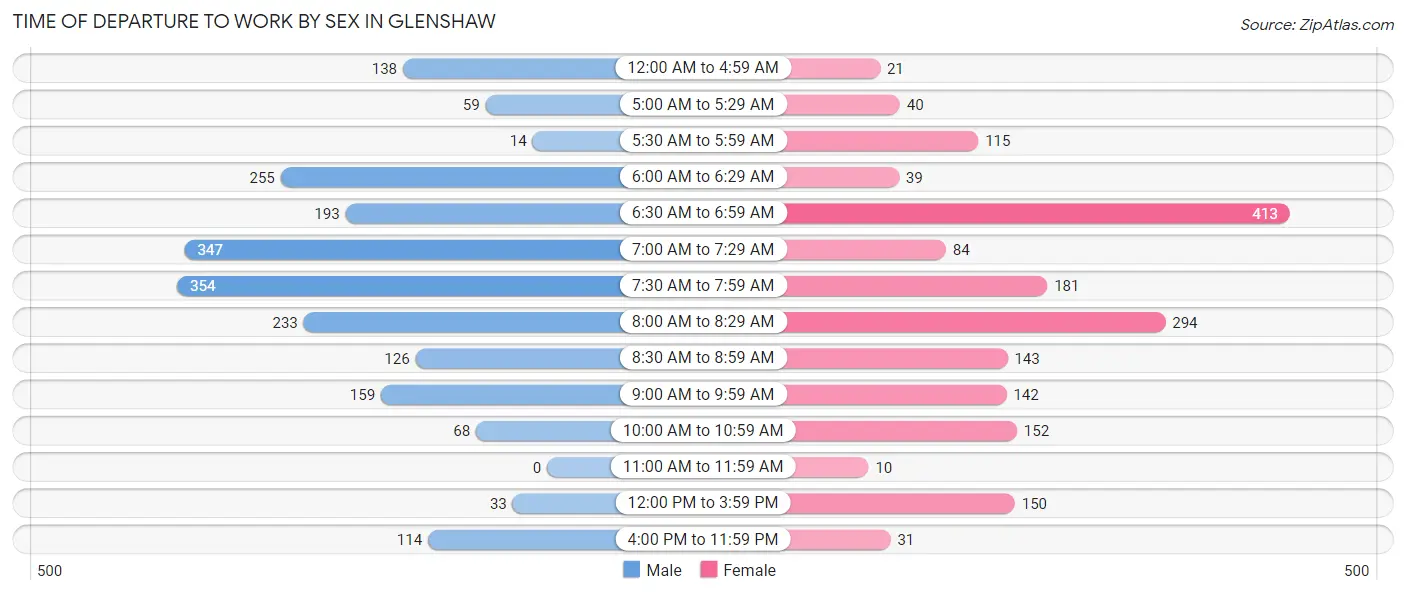
| Time of Departure | Male | Female |
| 12:00 AM to 4:59 AM | 138 (6.6%) | 21 (1.2%) |
| 5:00 AM to 5:29 AM | 59 (2.8%) | 40 (2.2%) |
| 5:30 AM to 5:59 AM | 14 (0.7%) | 115 (6.3%) |
| 6:00 AM to 6:29 AM | 255 (12.2%) | 39 (2.1%) |
| 6:30 AM to 6:59 AM | 193 (9.2%) | 413 (22.8%) |
| 7:00 AM to 7:29 AM | 347 (16.6%) | 84 (4.6%) |
| 7:30 AM to 7:59 AM | 354 (16.9%) | 181 (10.0%) |
| 8:00 AM to 8:29 AM | 233 (11.1%) | 294 (16.2%) |
| 8:30 AM to 8:59 AM | 126 (6.0%) | 143 (7.9%) |
| 9:00 AM to 9:59 AM | 159 (7.6%) | 142 (7.8%) |
| 10:00 AM to 10:59 AM | 68 (3.3%) | 152 (8.4%) |
| 11:00 AM to 11:59 AM | 0 (0.0%) | 10 (0.5%) |
| 12:00 PM to 3:59 PM | 33 (1.6%) | 150 (8.3%) |
| 4:00 PM to 11:59 PM | 114 (5.4%) | 31 (1.7%) |
| Total | 2,093 (100.0%) | 1,815 (100.0%) |
Housing Occupancy in Glenshaw
Occupancy by Ownership in Glenshaw
Of the total 3,796 dwellings in Glenshaw, owner-occupied units account for 3,550 (93.5%), while renter-occupied units make up 246 (6.5%).
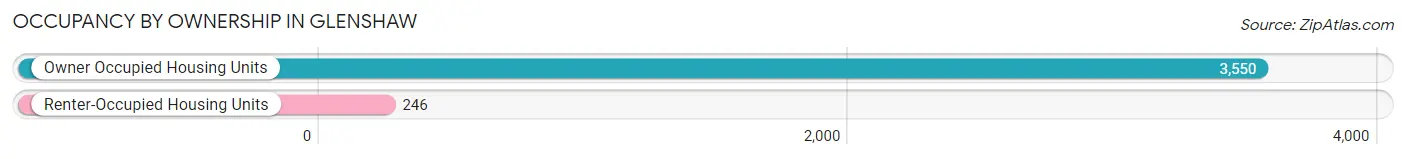
| Occupancy | # Housing Units | % Housing Units |
| Owner Occupied Housing Units | 3,550 | 93.5% |
| Renter-Occupied Housing Units | 246 | 6.5% |
| Total Occupied Housing Units | 3,796 | 100.0% |
Occupancy by Household Size in Glenshaw
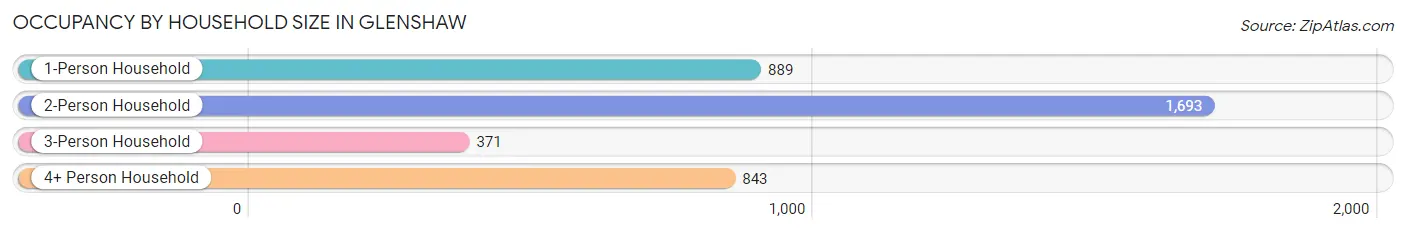
| Household Size | # Housing Units | % Housing Units |
| 1-Person Household | 889 | 23.4% |
| 2-Person Household | 1,693 | 44.6% |
| 3-Person Household | 371 | 9.8% |
| 4+ Person Household | 843 | 22.2% |
| Total Housing Units | 3,796 | 100.0% |
Occupancy by Ownership by Household Size in Glenshaw
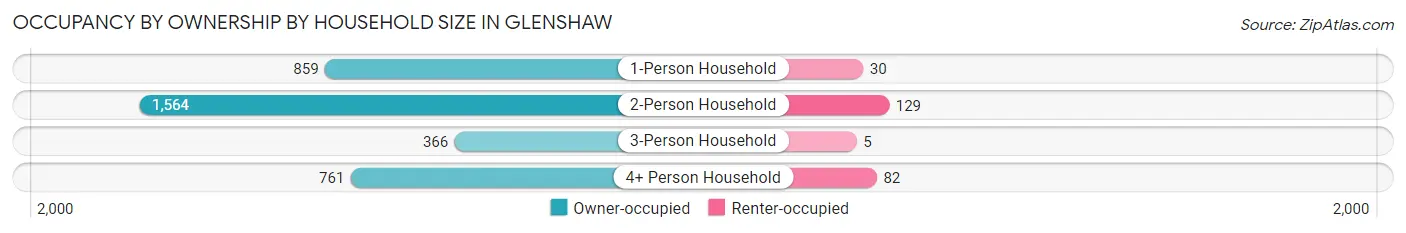
| Household Size | Owner-occupied | Renter-occupied |
| 1-Person Household | 859 (96.6%) | 30 (3.4%) |
| 2-Person Household | 1,564 (92.4%) | 129 (7.6%) |
| 3-Person Household | 366 (98.7%) | 5 (1.3%) |
| 4+ Person Household | 761 (90.3%) | 82 (9.7%) |
| Total Housing Units | 3,550 (93.5%) | 246 (6.5%) |
Occupancy by Educational Attainment in Glenshaw
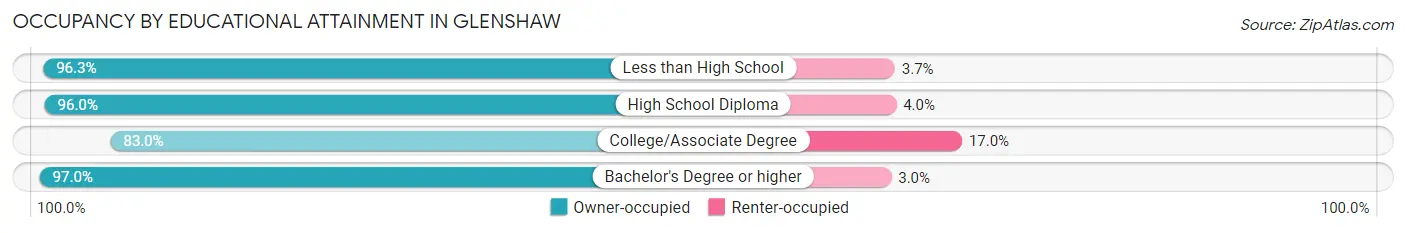
| Household Size | Owner-occupied | Renter-occupied |
| Less than High School | 130 (96.3%) | 5 (3.7%) |
| High School Diploma | 775 (96.0%) | 32 (4.0%) |
| College/Associate Degree | 732 (83.0%) | 150 (17.0%) |
| Bachelor's Degree or higher | 1,913 (97.0%) | 59 (3.0%) |
Occupancy by Age of Householder in Glenshaw
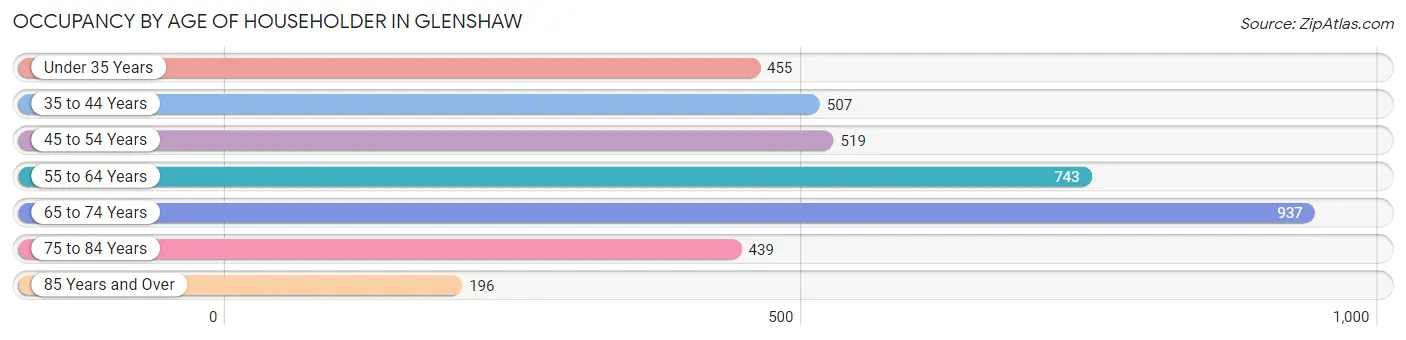
| Age Bracket | # Households | % Households |
| Under 35 Years | 455 | 12.0% |
| 35 to 44 Years | 507 | 13.4% |
| 45 to 54 Years | 519 | 13.7% |
| 55 to 64 Years | 743 | 19.6% |
| 65 to 74 Years | 937 | 24.7% |
| 75 to 84 Years | 439 | 11.6% |
| 85 Years and Over | 196 | 5.2% |
| Total | 3,796 | 100.0% |
Housing Finances in Glenshaw
Median Income by Occupancy in Glenshaw
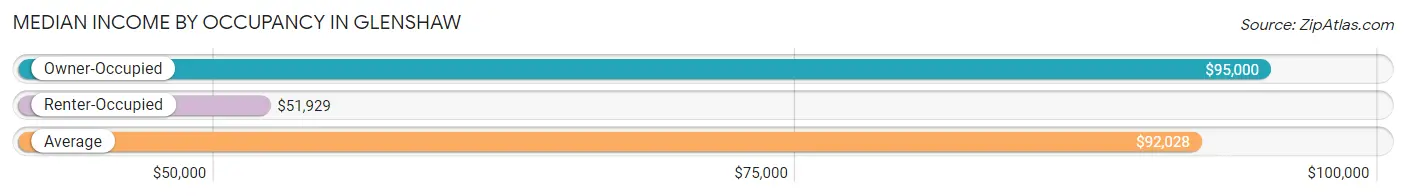
| Occupancy Type | # Households | Median Income |
| Owner-Occupied | 3,550 (93.5%) | $95,000 |
| Renter-Occupied | 246 (6.5%) | $51,929 |
| Average | 3,796 (100.0%) | $92,028 |
Occupancy by Householder Income Bracket in Glenshaw
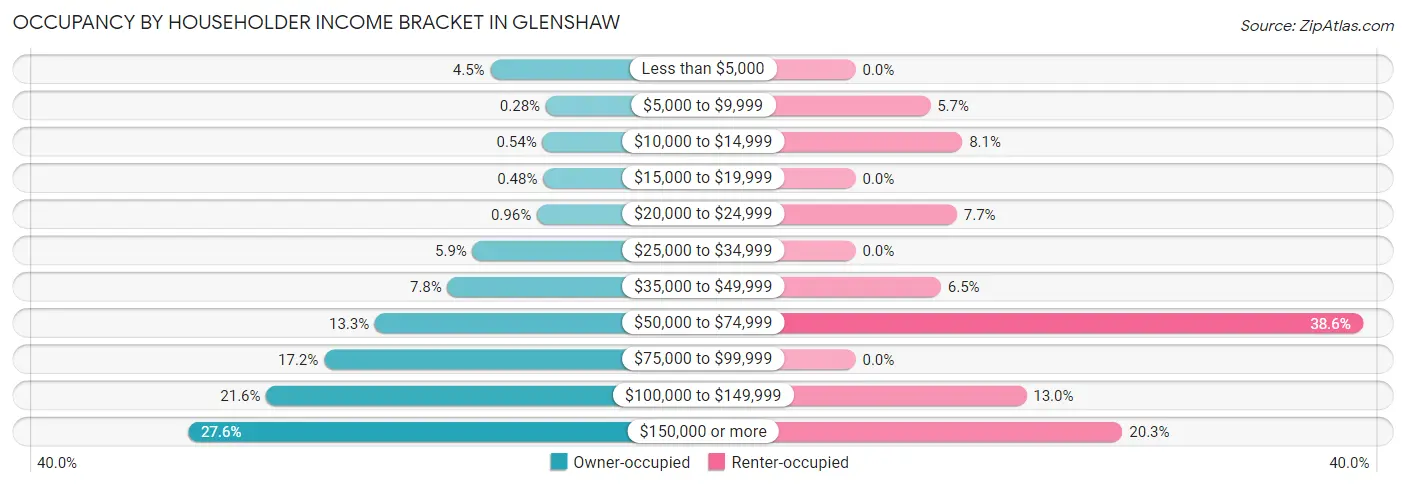
| Income Bracket | Owner-occupied | Renter-occupied |
| Less than $5,000 | 160 (4.5%) | 0 (0.0%) |
| $5,000 to $9,999 | 10 (0.3%) | 14 (5.7%) |
| $10,000 to $14,999 | 19 (0.5%) | 20 (8.1%) |
| $15,000 to $19,999 | 17 (0.5%) | 0 (0.0%) |
| $20,000 to $24,999 | 34 (1.0%) | 19 (7.7%) |
| $25,000 to $34,999 | 208 (5.9%) | 0 (0.0%) |
| $35,000 to $49,999 | 276 (7.8%) | 16 (6.5%) |
| $50,000 to $74,999 | 472 (13.3%) | 95 (38.6%) |
| $75,000 to $99,999 | 610 (17.2%) | 0 (0.0%) |
| $100,000 to $149,999 | 766 (21.6%) | 32 (13.0%) |
| $150,000 or more | 978 (27.6%) | 50 (20.3%) |
| Total | 3,550 (100.0%) | 246 (100.0%) |
Monthly Housing Cost Tiers in Glenshaw
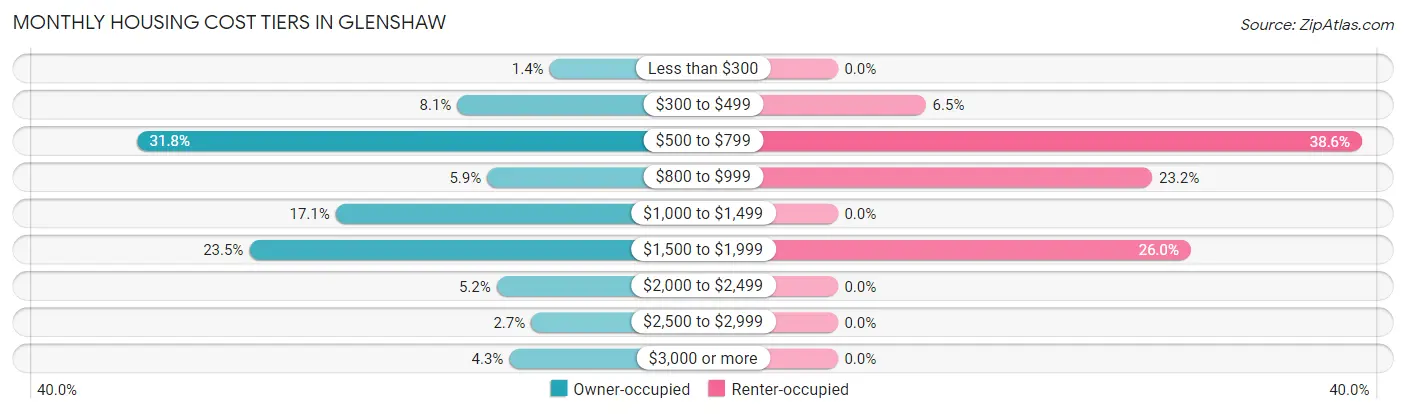
| Monthly Cost | Owner-occupied | Renter-occupied |
| Less than $300 | 48 (1.3%) | 0 (0.0%) |
| $300 to $499 | 289 (8.1%) | 16 (6.5%) |
| $500 to $799 | 1,127 (31.8%) | 95 (38.6%) |
| $800 to $999 | 211 (5.9%) | 57 (23.2%) |
| $1,000 to $1,499 | 607 (17.1%) | 0 (0.0%) |
| $1,500 to $1,999 | 833 (23.5%) | 64 (26.0%) |
| $2,000 to $2,499 | 186 (5.2%) | 0 (0.0%) |
| $2,500 to $2,999 | 96 (2.7%) | 0 (0.0%) |
| $3,000 or more | 153 (4.3%) | 0 (0.0%) |
| Total | 3,550 (100.0%) | 246 (100.0%) |
Physical Housing Characteristics in Glenshaw
Housing Structures in Glenshaw
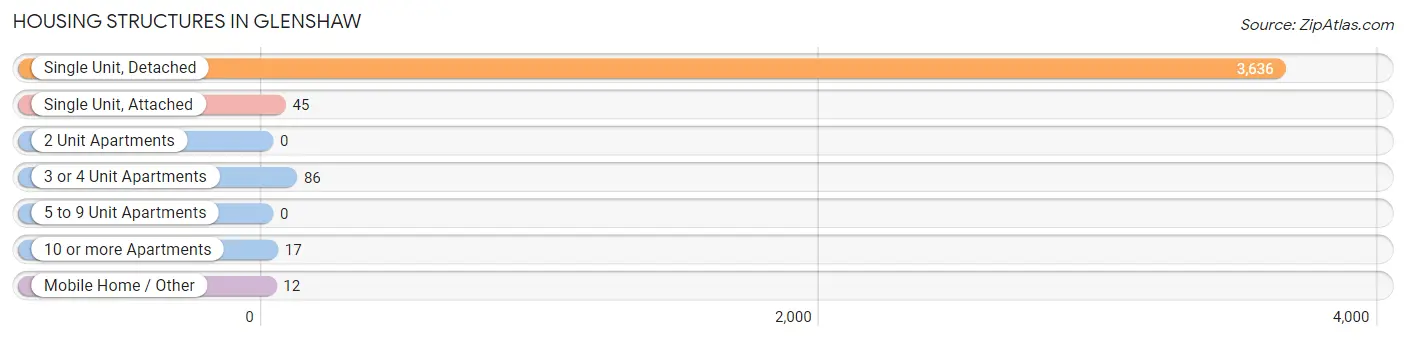
| Structure Type | # Housing Units | % Housing Units |
| Single Unit, Detached | 3,636 | 95.8% |
| Single Unit, Attached | 45 | 1.2% |
| 2 Unit Apartments | 0 | 0.0% |
| 3 or 4 Unit Apartments | 86 | 2.3% |
| 5 to 9 Unit Apartments | 0 | 0.0% |
| 10 or more Apartments | 17 | 0.4% |
| Mobile Home / Other | 12 | 0.3% |
| Total | 3,796 | 100.0% |
Housing Structures by Occupancy in Glenshaw
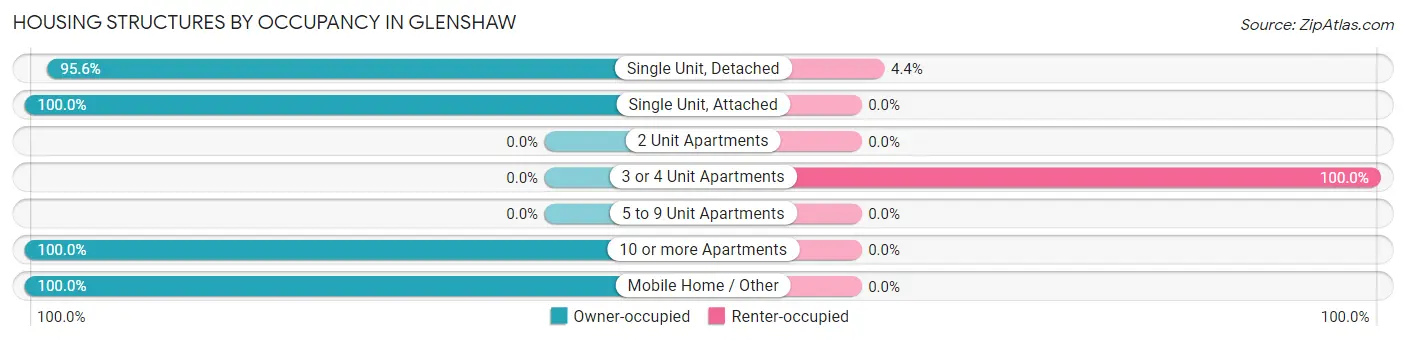
| Structure Type | Owner-occupied | Renter-occupied |
| Single Unit, Detached | 3,476 (95.6%) | 160 (4.4%) |
| Single Unit, Attached | 45 (100.0%) | 0 (0.0%) |
| 2 Unit Apartments | 0 (0.0%) | 0 (0.0%) |
| 3 or 4 Unit Apartments | 0 (0.0%) | 86 (100.0%) |
| 5 to 9 Unit Apartments | 0 (0.0%) | 0 (0.0%) |
| 10 or more Apartments | 17 (100.0%) | 0 (0.0%) |
| Mobile Home / Other | 12 (100.0%) | 0 (0.0%) |
| Total | 3,550 (93.5%) | 246 (6.5%) |
Housing Structures by Number of Rooms in Glenshaw
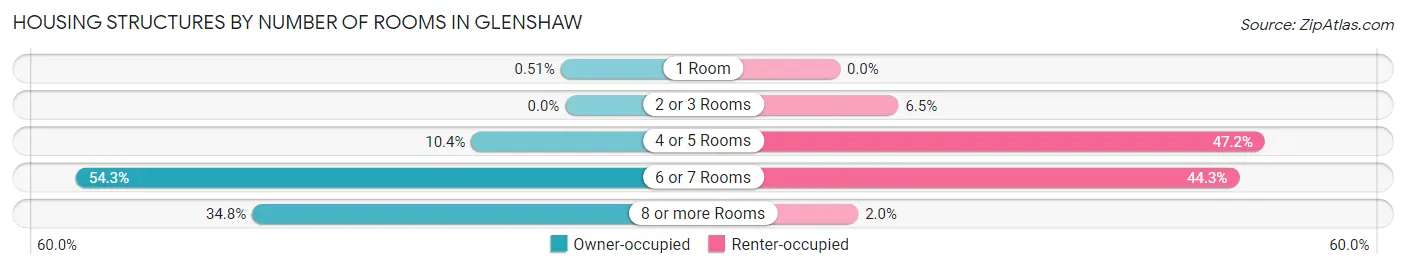
| Number of Rooms | Owner-occupied | Renter-occupied |
| 1 Room | 18 (0.5%) | 0 (0.0%) |
| 2 or 3 Rooms | 0 (0.0%) | 16 (6.5%) |
| 4 or 5 Rooms | 370 (10.4%) | 116 (47.1%) |
| 6 or 7 Rooms | 1,928 (54.3%) | 109 (44.3%) |
| 8 or more Rooms | 1,234 (34.8%) | 5 (2.0%) |
| Total | 3,550 (100.0%) | 246 (100.0%) |
Housing Structure by Heating Type in Glenshaw
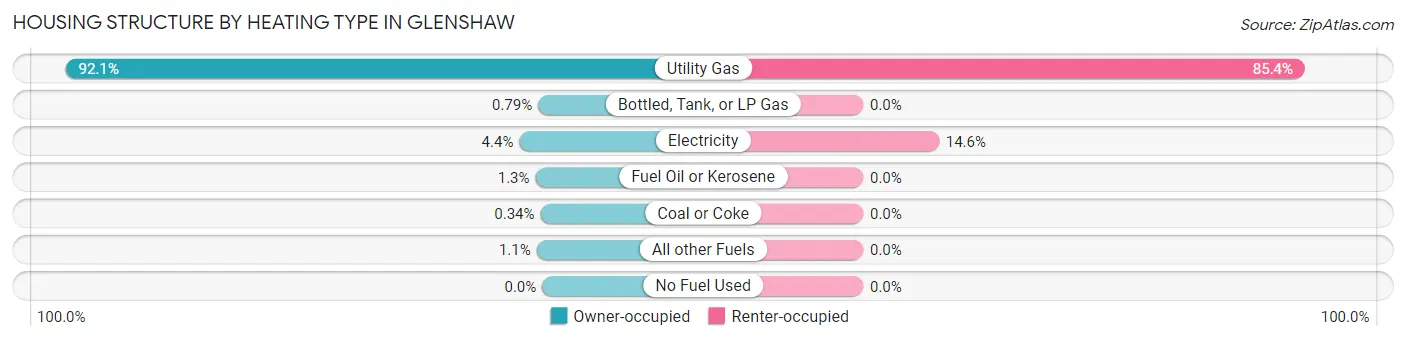
| Heating Type | Owner-occupied | Renter-occupied |
| Utility Gas | 3,269 (92.1%) | 210 (85.4%) |
| Bottled, Tank, or LP Gas | 28 (0.8%) | 0 (0.0%) |
| Electricity | 157 (4.4%) | 36 (14.6%) |
| Fuel Oil or Kerosene | 46 (1.3%) | 0 (0.0%) |
| Coal or Coke | 12 (0.3%) | 0 (0.0%) |
| All other Fuels | 38 (1.1%) | 0 (0.0%) |
| No Fuel Used | 0 (0.0%) | 0 (0.0%) |
| Total | 3,550 (100.0%) | 246 (100.0%) |
Household Vehicle Usage in Glenshaw
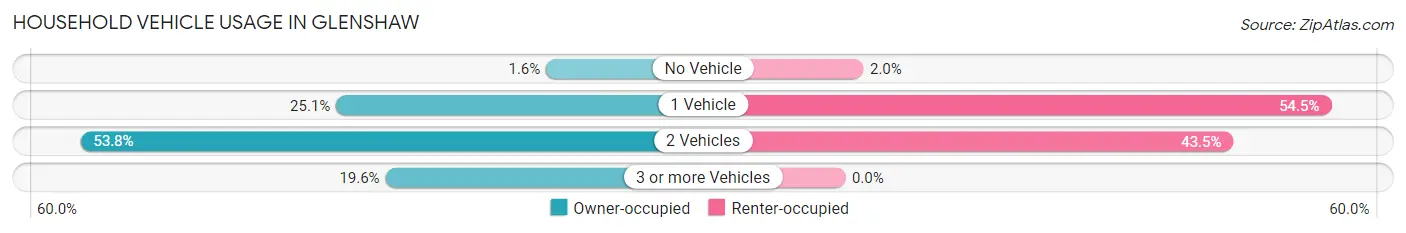
| Vehicles per Household | Owner-occupied | Renter-occupied |
| No Vehicle | 56 (1.6%) | 5 (2.0%) |
| 1 Vehicle | 891 (25.1%) | 134 (54.5%) |
| 2 Vehicles | 1,908 (53.7%) | 107 (43.5%) |
| 3 or more Vehicles | 695 (19.6%) | 0 (0.0%) |
| Total | 3,550 (100.0%) | 246 (100.0%) |
Real Estate & Mortgages in Glenshaw
Real Estate and Mortgage Overview in Glenshaw
| Characteristic | Without Mortgage | With Mortgage |
| Housing Units | 1,552 | 1,998 |
| Median Property Value | $223,300 | $232,800 |
| Median Household Income | $72,233 | $712 |
| Monthly Housing Costs | $656 | $153 |
| Real Estate Taxes | $3,468 | $0 |
Property Value by Mortgage Status in Glenshaw
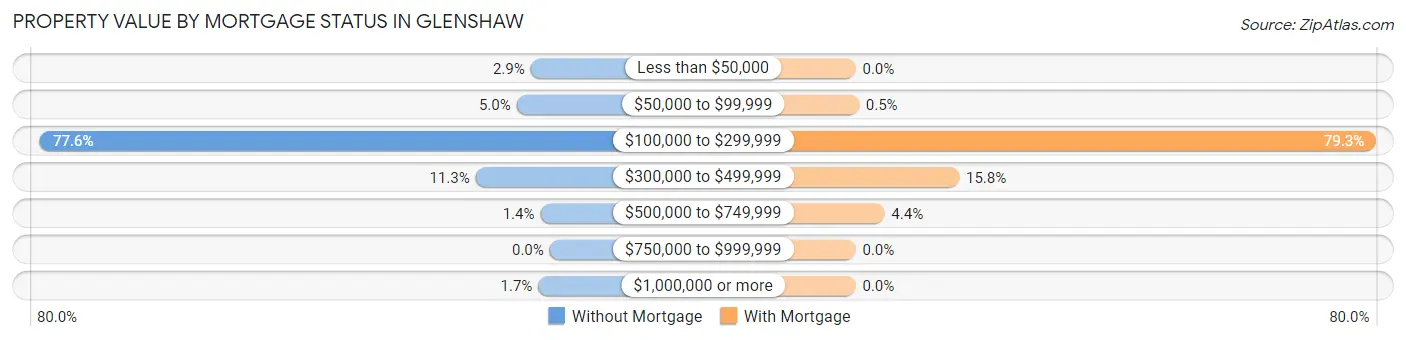
| Property Value | Without Mortgage | With Mortgage |
| Less than $50,000 | 45 (2.9%) | 0 (0.0%) |
| $50,000 to $99,999 | 78 (5.0%) | 10 (0.5%) |
| $100,000 to $299,999 | 1,205 (77.6%) | 1,585 (79.3%) |
| $300,000 to $499,999 | 175 (11.3%) | 315 (15.8%) |
| $500,000 to $749,999 | 22 (1.4%) | 88 (4.4%) |
| $750,000 to $999,999 | 0 (0.0%) | 0 (0.0%) |
| $1,000,000 or more | 27 (1.7%) | 0 (0.0%) |
| Total | 1,552 (100.0%) | 1,998 (100.0%) |
Household Income by Mortgage Status in Glenshaw
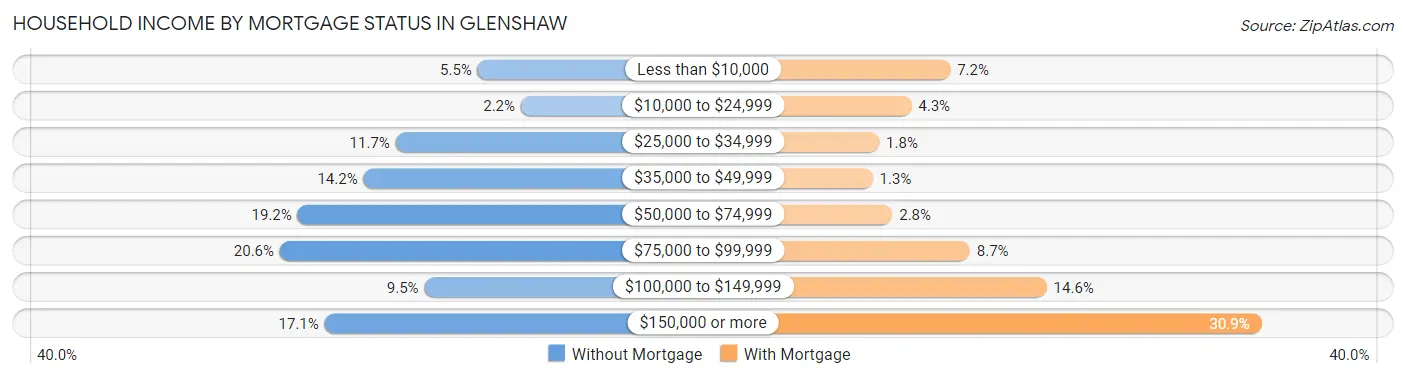
| Household Income | Without Mortgage | With Mortgage |
| Less than $10,000 | 85 (5.5%) | 144 (7.2%) |
| $10,000 to $24,999 | 34 (2.2%) | 85 (4.3%) |
| $25,000 to $34,999 | 182 (11.7%) | 36 (1.8%) |
| $35,000 to $49,999 | 220 (14.2%) | 26 (1.3%) |
| $50,000 to $74,999 | 298 (19.2%) | 56 (2.8%) |
| $75,000 to $99,999 | 319 (20.5%) | 174 (8.7%) |
| $100,000 to $149,999 | 148 (9.5%) | 291 (14.6%) |
| $150,000 or more | 266 (17.1%) | 618 (30.9%) |
| Total | 1,552 (100.0%) | 1,998 (100.0%) |
Property Value to Household Income Ratio in Glenshaw
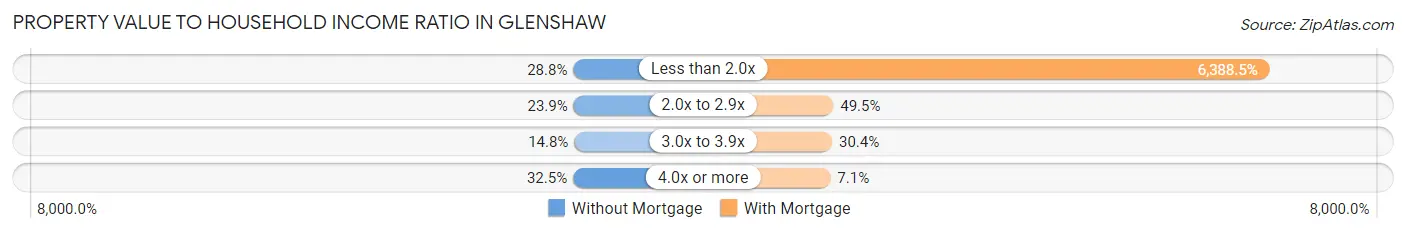
| Value-to-Income Ratio | Without Mortgage | With Mortgage |
| Less than 2.0x | 447 (28.8%) | 127,643 (6,388.5%) |
| 2.0x to 2.9x | 371 (23.9%) | 989 (49.5%) |
| 3.0x to 3.9x | 230 (14.8%) | 608 (30.4%) |
| 4.0x or more | 504 (32.5%) | 141 (7.1%) |
| Total | 1,552 (100.0%) | 1,998 (100.0%) |
Real Estate Taxes by Mortgage Status in Glenshaw
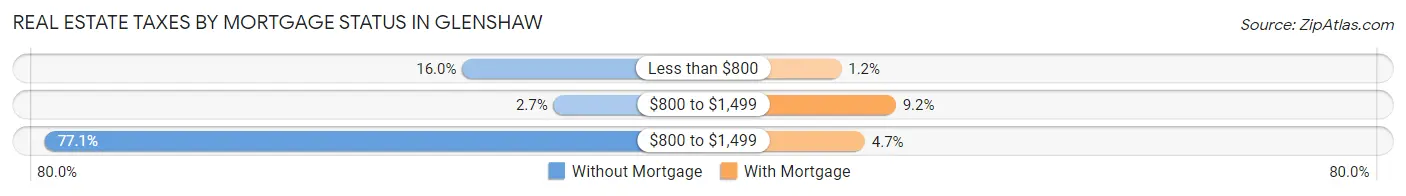
| Property Taxes | Without Mortgage | With Mortgage |
| Less than $800 | 249 (16.0%) | 24 (1.2%) |
| $800 to $1,499 | 42 (2.7%) | 183 (9.2%) |
| $800 to $1,499 | 1,196 (77.1%) | 93 (4.6%) |
| Total | 1,552 (100.0%) | 1,998 (100.0%) |
Health & Disability in Glenshaw
Health Insurance Coverage by Age in Glenshaw
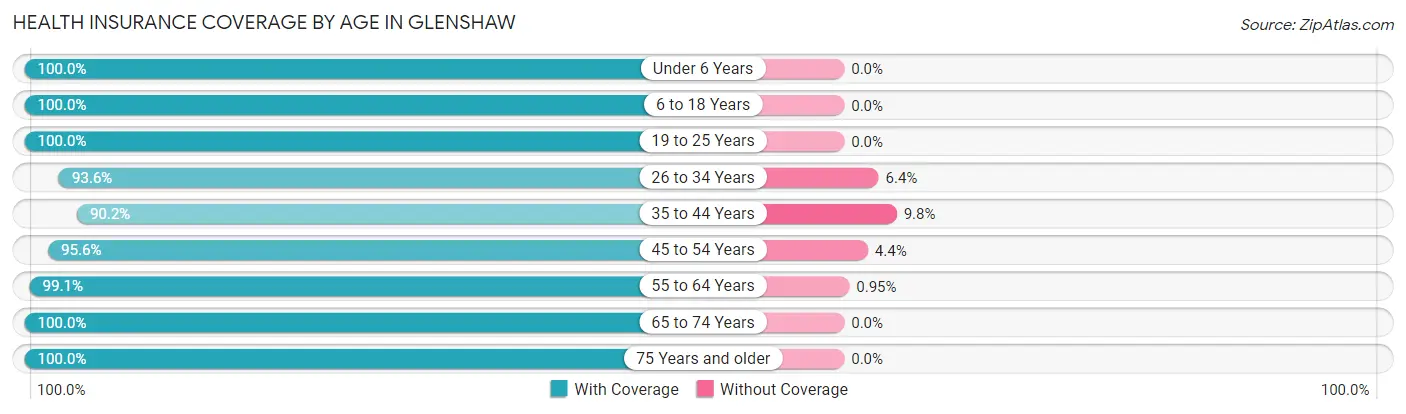
| Age Bracket | With Coverage | Without Coverage |
| Under 6 Years | 664 (100.0%) | 0 (0.0%) |
| 6 to 18 Years | 1,342 (100.0%) | 0 (0.0%) |
| 19 to 25 Years | 350 (100.0%) | 0 (0.0%) |
| 26 to 34 Years | 936 (93.6%) | 64 (6.4%) |
| 35 to 44 Years | 1,155 (90.2%) | 125 (9.8%) |
| 45 to 54 Years | 782 (95.6%) | 36 (4.4%) |
| 55 to 64 Years | 1,456 (99.1%) | 14 (0.9%) |
| 65 to 74 Years | 1,549 (100.0%) | 0 (0.0%) |
| 75 Years and older | 945 (100.0%) | 0 (0.0%) |
| Total | 9,179 (97.5%) | 239 (2.5%) |
Health Insurance Coverage by Citizenship Status in Glenshaw
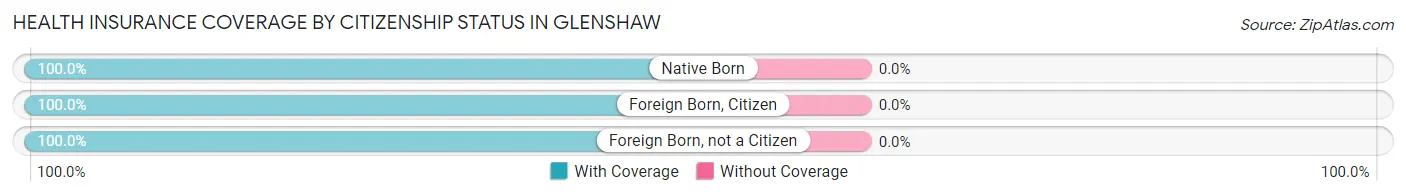
| Citizenship Status | With Coverage | Without Coverage |
| Native Born | 664 (100.0%) | 0 (0.0%) |
| Foreign Born, Citizen | 1,342 (100.0%) | 0 (0.0%) |
| Foreign Born, not a Citizen | 350 (100.0%) | 0 (0.0%) |
Health Insurance Coverage by Household Income in Glenshaw
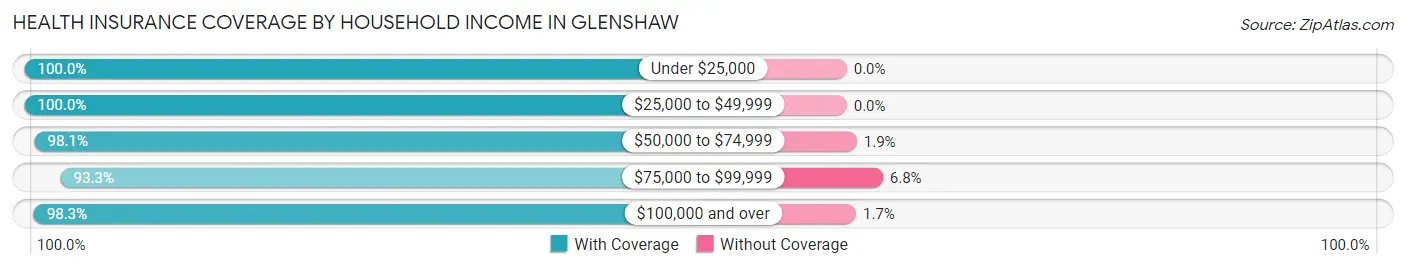
| Household Income | With Coverage | Without Coverage |
| Under $25,000 | 423 (100.0%) | 0 (0.0%) |
| $25,000 to $49,999 | 665 (100.0%) | 0 (0.0%) |
| $50,000 to $74,999 | 1,143 (98.1%) | 22 (1.9%) |
| $75,000 to $99,999 | 1,726 (93.2%) | 125 (6.8%) |
| $100,000 and over | 5,202 (98.3%) | 92 (1.7%) |
Public vs Private Health Insurance Coverage by Age in Glenshaw
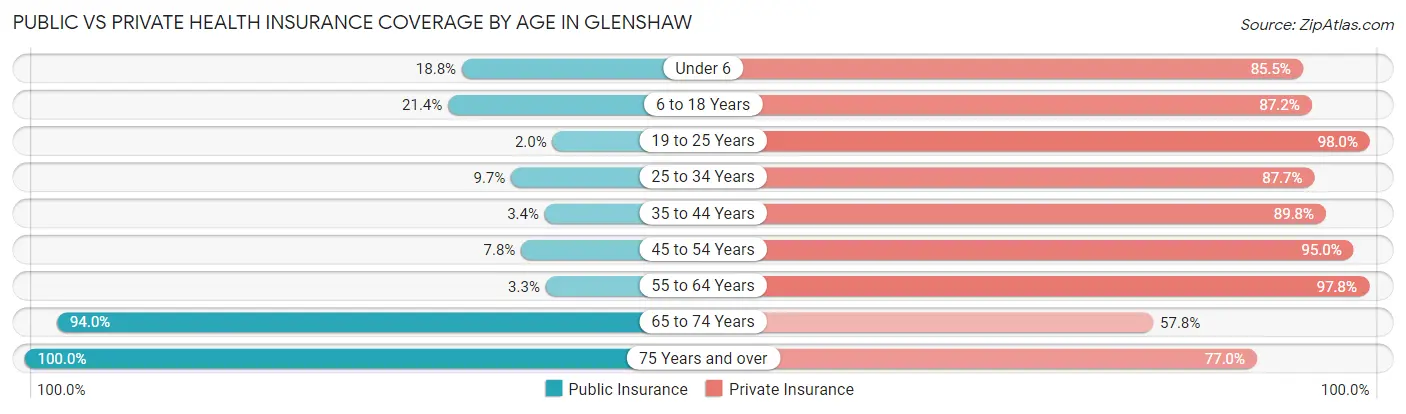
| Age Bracket | Public Insurance | Private Insurance |
| Under 6 | 125 (18.8%) | 568 (85.5%) |
| 6 to 18 Years | 287 (21.4%) | 1,170 (87.2%) |
| 19 to 25 Years | 7 (2.0%) | 343 (98.0%) |
| 25 to 34 Years | 97 (9.7%) | 877 (87.7%) |
| 35 to 44 Years | 44 (3.4%) | 1,150 (89.8%) |
| 45 to 54 Years | 64 (7.8%) | 777 (95.0%) |
| 55 to 64 Years | 48 (3.3%) | 1,438 (97.8%) |
| 65 to 74 Years | 1,456 (94.0%) | 895 (57.8%) |
| 75 Years and over | 945 (100.0%) | 728 (77.0%) |
| Total | 3,073 (32.6%) | 7,946 (84.4%) |
Disability Status by Sex by Age in Glenshaw
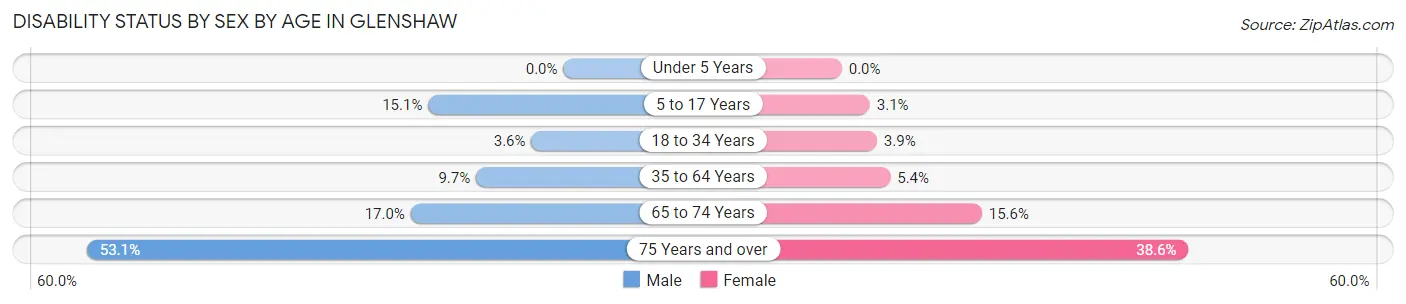
| Age Bracket | Male | Female |
| Under 5 Years | 0 (0.0%) | 0 (0.0%) |
| 5 to 17 Years | 116 (15.0%) | 20 (3.1%) |
| 18 to 34 Years | 32 (3.6%) | 22 (3.9%) |
| 35 to 64 Years | 183 (9.7%) | 91 (5.4%) |
| 65 to 74 Years | 127 (17.0%) | 125 (15.6%) |
| 75 Years and over | 199 (53.1%) | 220 (38.6%) |
Disability Class by Sex by Age in Glenshaw
Disability Class: Hearing Difficulty
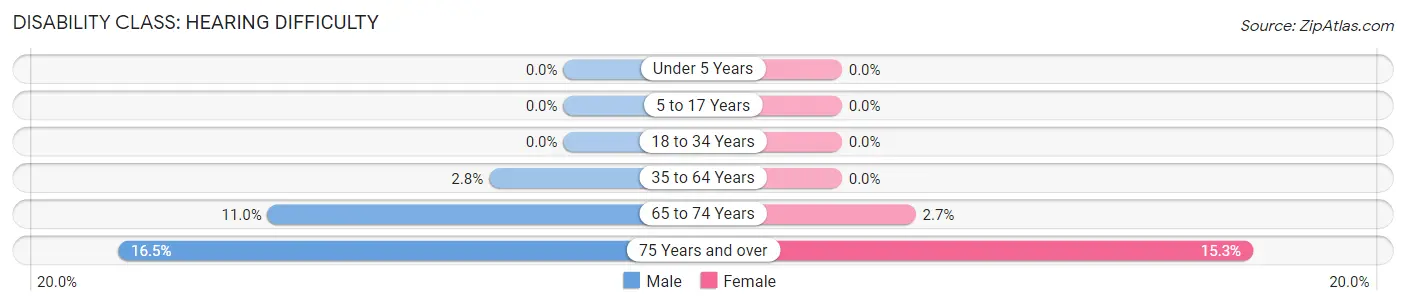
| Age Bracket | Male | Female |
| Under 5 Years | 0 (0.0%) | 0 (0.0%) |
| 5 to 17 Years | 0 (0.0%) | 0 (0.0%) |
| 18 to 34 Years | 0 (0.0%) | 0 (0.0%) |
| 35 to 64 Years | 52 (2.8%) | 0 (0.0%) |
| 65 to 74 Years | 82 (11.0%) | 22 (2.7%) |
| 75 Years and over | 62 (16.5%) | 87 (15.3%) |
Disability Class: Vision Difficulty
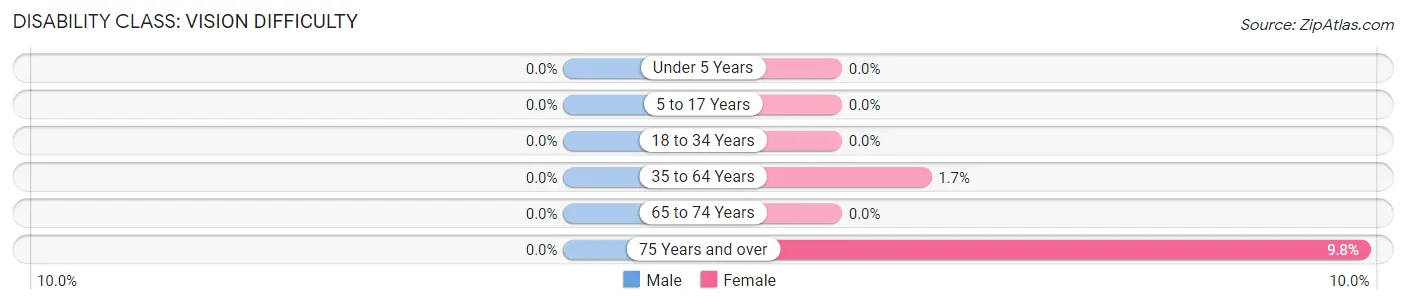
| Age Bracket | Male | Female |
| Under 5 Years | 0 (0.0%) | 0 (0.0%) |
| 5 to 17 Years | 0 (0.0%) | 0 (0.0%) |
| 18 to 34 Years | 0 (0.0%) | 0 (0.0%) |
| 35 to 64 Years | 0 (0.0%) | 28 (1.7%) |
| 65 to 74 Years | 0 (0.0%) | 0 (0.0%) |
| 75 Years and over | 0 (0.0%) | 56 (9.8%) |
Disability Class: Cognitive Difficulty
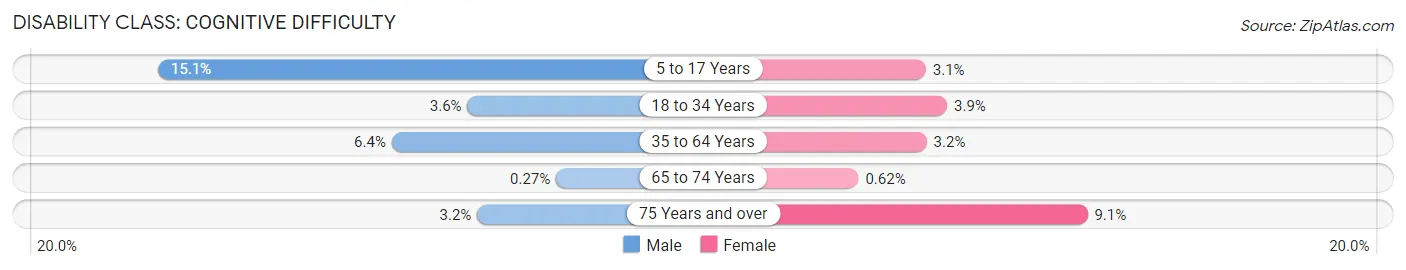
| Age Bracket | Male | Female |
| 5 to 17 Years | 116 (15.0%) | 20 (3.1%) |
| 18 to 34 Years | 32 (3.6%) | 22 (3.9%) |
| 35 to 64 Years | 120 (6.4%) | 53 (3.2%) |
| 65 to 74 Years | 2 (0.3%) | 5 (0.6%) |
| 75 Years and over | 12 (3.2%) | 52 (9.1%) |
Disability Class: Ambulatory Difficulty
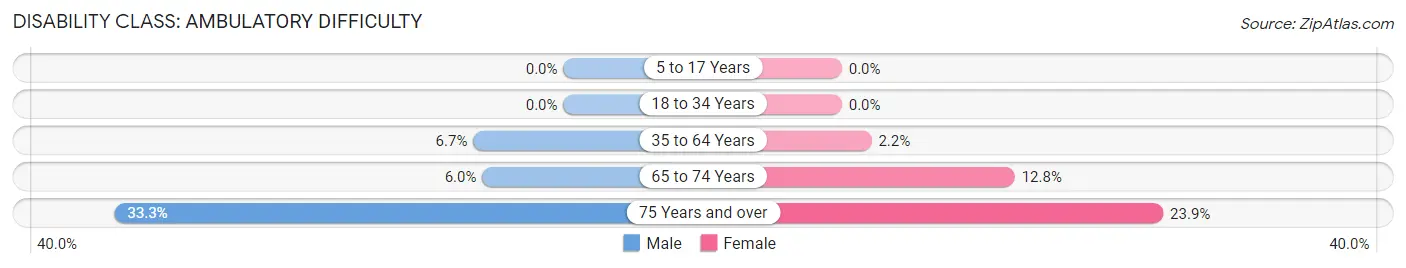
| Age Bracket | Male | Female |
| 5 to 17 Years | 0 (0.0%) | 0 (0.0%) |
| 18 to 34 Years | 0 (0.0%) | 0 (0.0%) |
| 35 to 64 Years | 126 (6.7%) | 37 (2.2%) |
| 65 to 74 Years | 45 (6.0%) | 103 (12.8%) |
| 75 Years and over | 125 (33.3%) | 136 (23.9%) |
Disability Class: Self-Care Difficulty
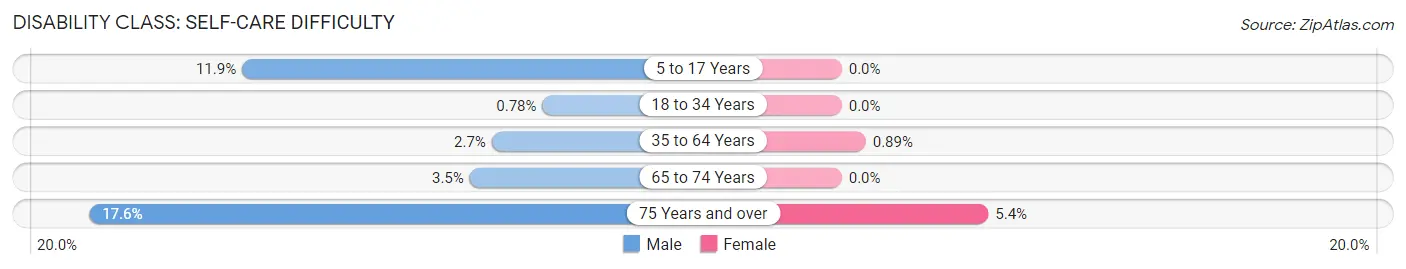
| Age Bracket | Male | Female |
| 5 to 17 Years | 92 (11.9%) | 0 (0.0%) |
| 18 to 34 Years | 7 (0.8%) | 0 (0.0%) |
| 35 to 64 Years | 50 (2.7%) | 15 (0.9%) |
| 65 to 74 Years | 26 (3.5%) | 0 (0.0%) |
| 75 Years and over | 66 (17.6%) | 31 (5.4%) |
Technology Access in Glenshaw
Computing Device Access in Glenshaw
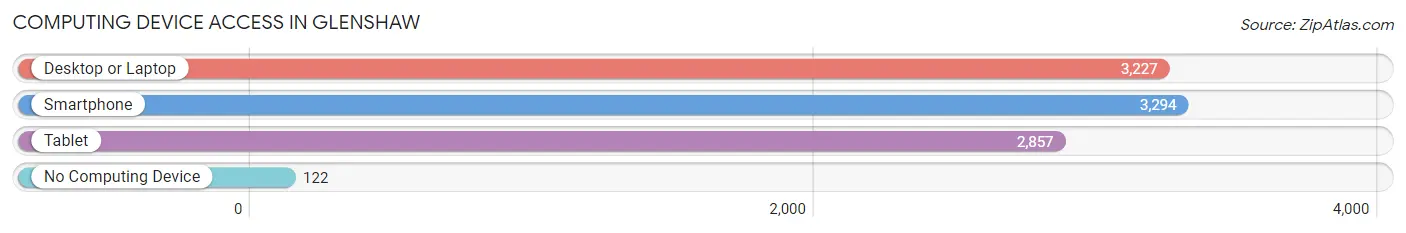
| Device Type | # Households | % Households |
| Desktop or Laptop | 3,227 | 85.0% |
| Smartphone | 3,294 | 86.8% |
| Tablet | 2,857 | 75.3% |
| No Computing Device | 122 | 3.2% |
| Total | 3,796 | 100.0% |
Internet Access in Glenshaw
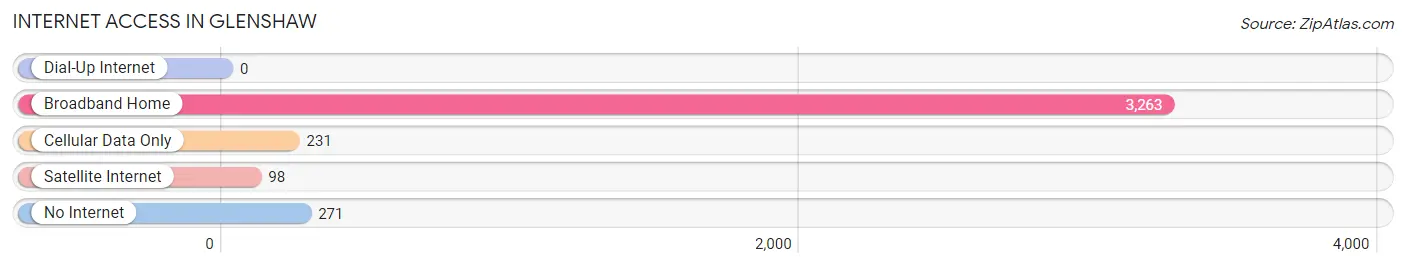
| Internet Type | # Households | % Households |
| Dial-Up Internet | 0 | 0.0% |
| Broadband Home | 3,263 | 86.0% |
| Cellular Data Only | 231 | 6.1% |
| Satellite Internet | 98 | 2.6% |
| No Internet | 271 | 7.1% |
| Total | 3,796 | 100.0% |
Glenshaw Summary
Glenshaw is a small borough located in Allegheny County, Pennsylvania. It is situated about 10 miles northeast of Pittsburgh and is part of the North Hills region of the county. The population of Glenshaw was 2,717 at the 2010 census.
History
Glenshaw was originally part of Shaler Township, which was established in 1845. The area was first settled in the early 1800s by German and Irish immigrants. The first post office in the area was established in 1851 and was called Glenshaw Station. The name was derived from the nearby Glenshaw Creek. In 1872, the area was incorporated as a borough and the name was changed to Glenshaw.
Geography
Glenshaw is located at 40°31'17" North, 79°59'45" West (40.5214, -79.9958). According to the United States Census Bureau, the borough has a total area of 0.7 square miles, all of it land. Glenshaw is bordered by Shaler Township to the north, Ross Township to the east, Etna to the south, and Reserve Township to the west.
Economy
The economy of Glenshaw is largely based on small businesses and retail. The borough is home to several small shops and restaurants, as well as a few larger businesses such as a grocery store and a hardware store. Glenshaw is also home to a number of professional services, such as doctors, lawyers, and accountants.
Demographics
As of the 2010 census, there were 2,717 people, 1,093 households, and 745 families residing in the borough. The population density was 3,890.7 people per square mile. The racial makeup of the borough was 94.2% White, 2.2% African American, 0.3% Native American, 0.9% Asian, 0.1% Pacific Islander, 0.7% from other races, and 1.6% from two or more races. Hispanic or Latino of any race were 2.2% of the population.
The median age in Glenshaw was 43.2 years. 22.2% of residents were under the age of 18; 6.2% were between the ages of 18 and 24; 24.2% were from 25 to 44; 30.2% were from 45 to 64; and 17.2% were 65 years of age or older. The gender makeup of the borough was 48.2% male and 51.8% female.
The median income for a household in Glenshaw was $54,917, and the median income for a family was $63,958. Males had a median income of $45,938 versus $35,938 for females. The per capita income for the borough was $25,917. About 4.2% of families and 5.2% of the population were below the poverty line, including 6.2% of those under age 18 and 4.2% of those age 65 or over.
Common Questions
What is Per Capita Income in Glenshaw?
Per Capita income in Glenshaw is $47,951.
What is the Median Family Income in Glenshaw?
Median Family Income in Glenshaw is $118,036.
What is the Median Household income in Glenshaw?
Median Household Income in Glenshaw is $92,028.
What is Income or Wage Gap in Glenshaw?
Income or Wage Gap in Glenshaw is 19.2%.
Women in Glenshaw earn 80.8 cents for every dollar earned by a man.
What is Inequality or Gini Index in Glenshaw?
Inequality or Gini Index in Glenshaw is 0.40.
What is the Total Population of Glenshaw?
Total Population of Glenshaw is 9,418.
What is the Total Male Population of Glenshaw?
Total Male Population of Glenshaw is 4,895.
What is the Total Female Population of Glenshaw?
Total Female Population of Glenshaw is 4,523.
What is the Ratio of Males per 100 Females in Glenshaw?
There are 108.22 Males per 100 Females in Glenshaw.
What is the Ratio of Females per 100 Males in Glenshaw?
There are 92.40 Females per 100 Males in Glenshaw.
What is the Median Population Age in Glenshaw?
Median Population Age in Glenshaw is 46.3 Years.
What is the Average Family Size in Glenshaw
Average Family Size in Glenshaw is 2.9 People.
What is the Average Household Size in Glenshaw
Average Household Size in Glenshaw is 2.5 People.
How Large is the Labor Force in Glenshaw?
There are 5,076 People in the Labor Forcein in Glenshaw.
What is the Percentage of People in the Labor Force in Glenshaw?
65.5% of People are in the Labor Force in Glenshaw.
What is the Unemployment Rate in Glenshaw?
Unemployment Rate in Glenshaw is 6.5%.