Ambler borough, PA Map & Demographics
Ambler borough Overview
$40,556
PER CAPITA INCOME
$100,294
AVG FAMILY INCOME
$84,303
AVG HOUSEHOLD INCOME
7.7%
WAGE / INCOME GAP [ % ]
92.3¢/ $1
WAGE / INCOME GAP [ $ ]
0.40
INEQUALITY / GINI INDEX
6,775
TOTAL POPULATION
3,344
MALE POPULATION
3,431
FEMALE POPULATION
97.46
MALES / 100 FEMALES
102.60
FEMALES / 100 MALES
35.9
MEDIAN AGE
3.1
AVG FAMILY SIZE
2.5
AVG HOUSEHOLD SIZE
3,838
LABOR FORCE [ PEOPLE ]
73.0%
PERCENT IN LABOR FORCE
5.0%
UNEMPLOYMENT RATE
Income in Ambler borough
Income Overview in Ambler borough
Per Capita Income in Ambler borough is $40,556, while median incomes of families and households are $100,294 and $84,303 respectively.
| Characteristic | Number | Measure |
| Per Capita Income | 6,775 | $40,556 |
| Median Family Income | 1,694 | $100,294 |
| Mean Family Income | 1,694 | $120,656 |
| Median Household Income | 2,655 | $84,303 |
| Mean Household Income | 2,655 | $100,848 |
| Income Deficit | 1,694 | $0 |
| Wage / Income Gap (%) | 6,775 | 7.69% |
| Wage / Income Gap ($) | 6,775 | 92.31¢ per $1 |
| Gini / Inequality Index | 6,775 | 0.40 |
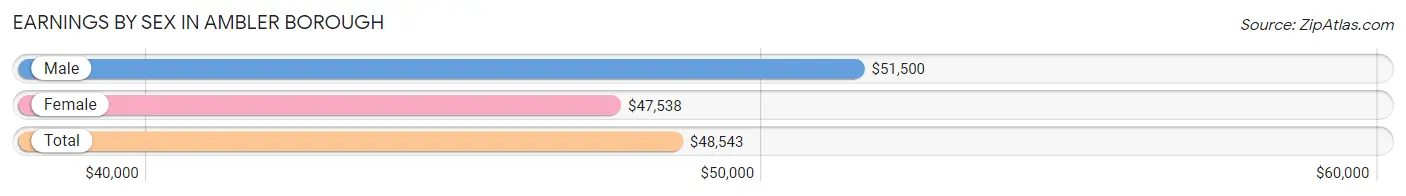
Earnings by Sex in Ambler borough
Average Earnings in Ambler borough are $48,543, $51,500 for men and $47,538 for women, a difference of 7.7%.
| Sex | Number | Average Earnings |
| Male | 2,024 (49.9%) | $51,500 |
| Female | 2,032 (50.1%) | $47,538 |
| Total | 4,056 (100.0%) | $48,543 |
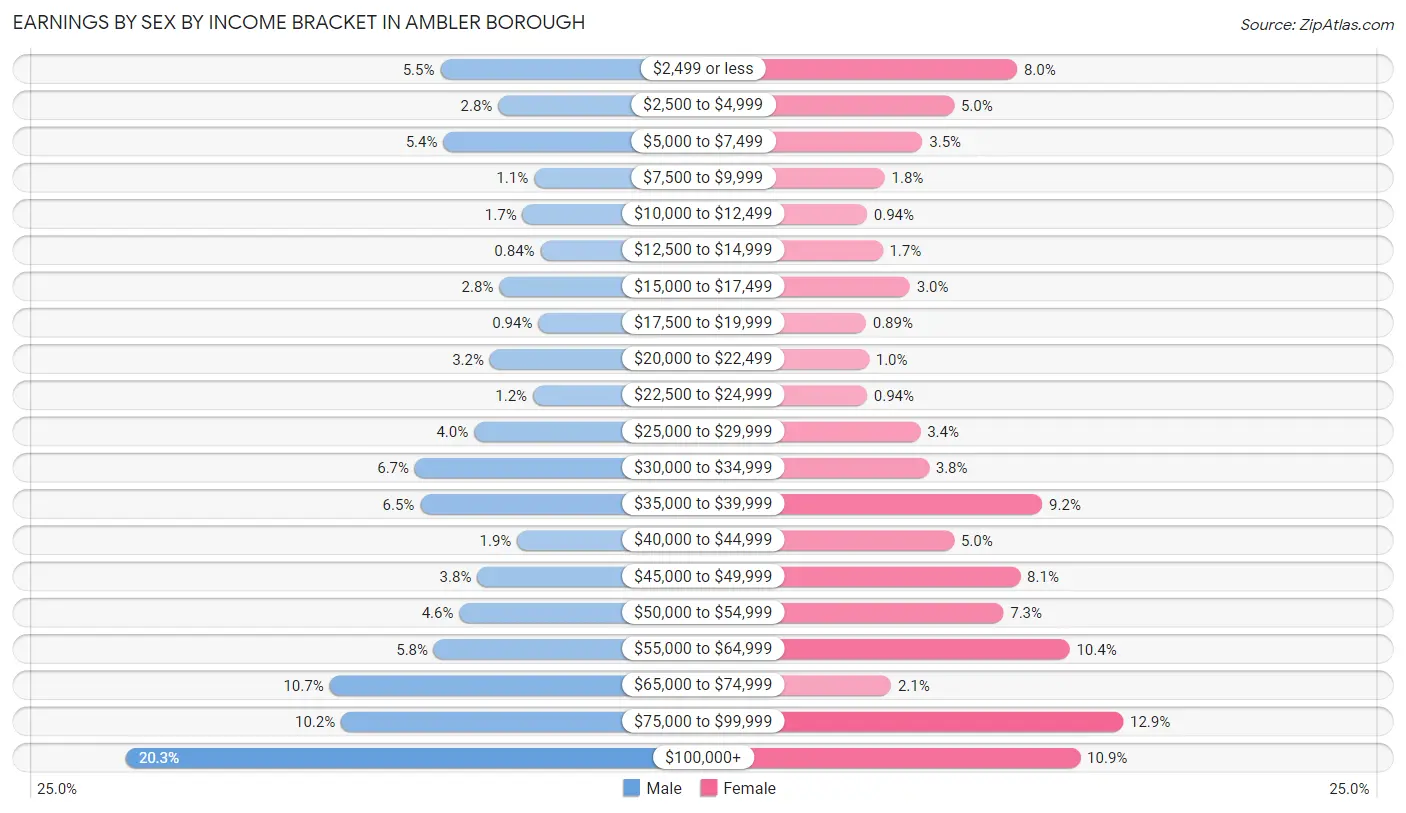
Earnings by Sex by Income Bracket in Ambler borough
The most common earnings brackets in Ambler borough are $100,000+ for men (410 | 20.3%) and $75,000 to $99,999 for women (263 | 12.9%).
| Income | Male | Female |
| $2,499 or less | 112 (5.5%) | 162 (8.0%) |
| $2,500 to $4,999 | 57 (2.8%) | 102 (5.0%) |
| $5,000 to $7,499 | 109 (5.4%) | 72 (3.5%) |
| $7,500 to $9,999 | 23 (1.1%) | 36 (1.8%) |
| $10,000 to $12,499 | 34 (1.7%) | 19 (0.9%) |
| $12,500 to $14,999 | 17 (0.8%) | 34 (1.7%) |
| $15,000 to $17,499 | 56 (2.8%) | 60 (2.9%) |
| $17,500 to $19,999 | 19 (0.9%) | 18 (0.9%) |
| $20,000 to $22,499 | 65 (3.2%) | 21 (1.0%) |
| $22,500 to $24,999 | 24 (1.2%) | 19 (0.9%) |
| $25,000 to $29,999 | 80 (4.0%) | 70 (3.4%) |
| $30,000 to $34,999 | 136 (6.7%) | 78 (3.8%) |
| $35,000 to $39,999 | 131 (6.5%) | 186 (9.1%) |
| $40,000 to $44,999 | 39 (1.9%) | 102 (5.0%) |
| $45,000 to $49,999 | 77 (3.8%) | 165 (8.1%) |
| $50,000 to $54,999 | 94 (4.6%) | 149 (7.3%) |
| $55,000 to $64,999 | 118 (5.8%) | 212 (10.4%) |
| $65,000 to $74,999 | 217 (10.7%) | 42 (2.1%) |
| $75,000 to $99,999 | 206 (10.2%) | 263 (12.9%) |
| $100,000+ | 410 (20.3%) | 222 (10.9%) |
| Total | 2,024 (100.0%) | 2,032 (100.0%) |
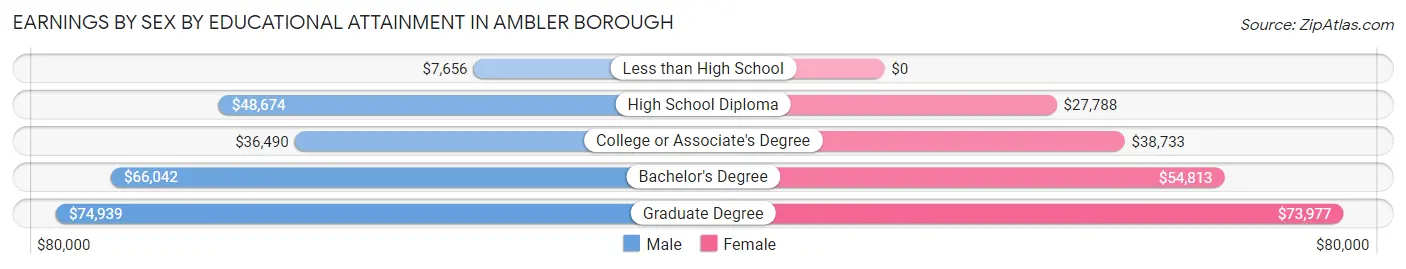
Earnings by Sex by Educational Attainment in Ambler borough
Average earnings in Ambler borough are $56,332 for men and $48,990 for women, a difference of 13.0%. Men with an educational attainment of graduate degree enjoy the highest average annual earnings of $74,939, while those with less than high school education earn the least with $7,656. Women with an educational attainment of graduate degree earn the most with the average annual earnings of $73,977, while those with high school diploma education have the smallest earnings of $27,788.
| Educational Attainment | Male Income | Female Income |
| Less than High School | $7,656 | $0 |
| High School Diploma | $48,674 | $27,788 |
| College or Associate's Degree | $36,490 | $38,733 |
| Bachelor's Degree | $66,042 | $54,813 |
| Graduate Degree | $74,939 | $73,977 |
| Total | $56,332 | $48,990 |
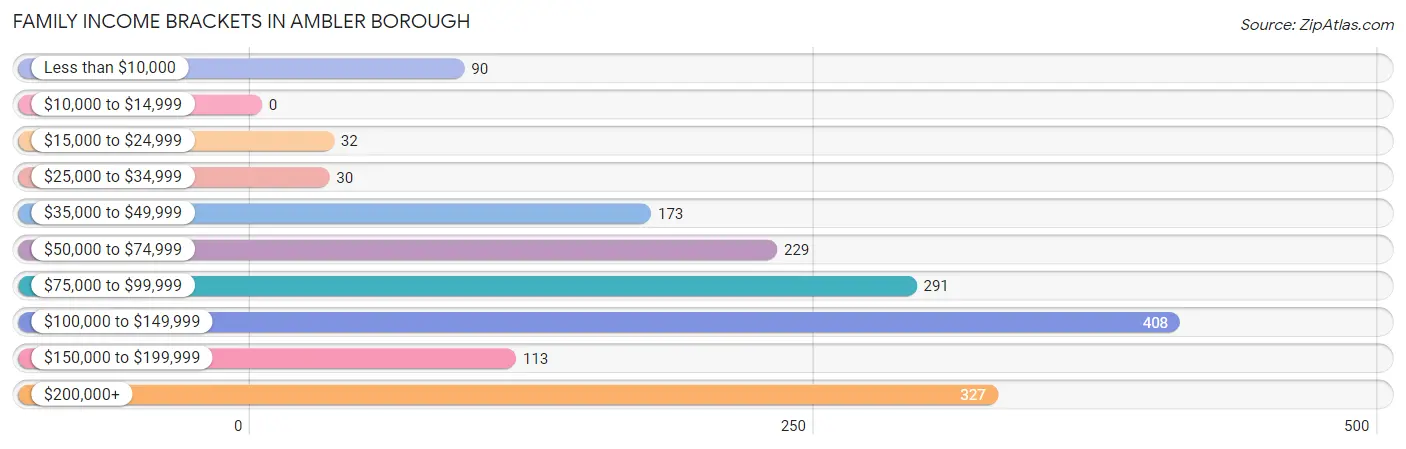
Family Income in Ambler borough
Family Income Brackets in Ambler borough
According to the Ambler borough family income data, there are 408 families falling into the $100,000 to $149,999 income range, which is the most common income bracket and makes up 24.1% of all families.
| Income Bracket | # Families | % Families |
| Less than $10,000 | 90 | 5.3% |
| $10,000 to $14,999 | 0 | 0.0% |
| $15,000 to $24,999 | 32 | 1.9% |
| $25,000 to $34,999 | 30 | 1.8% |
| $35,000 to $49,999 | 173 | 10.2% |
| $50,000 to $74,999 | 229 | 13.5% |
| $75,000 to $99,999 | 291 | 17.2% |
| $100,000 to $149,999 | 408 | 24.1% |
| $150,000 to $199,999 | 113 | 6.7% |
| $200,000+ | 327 | 19.3% |
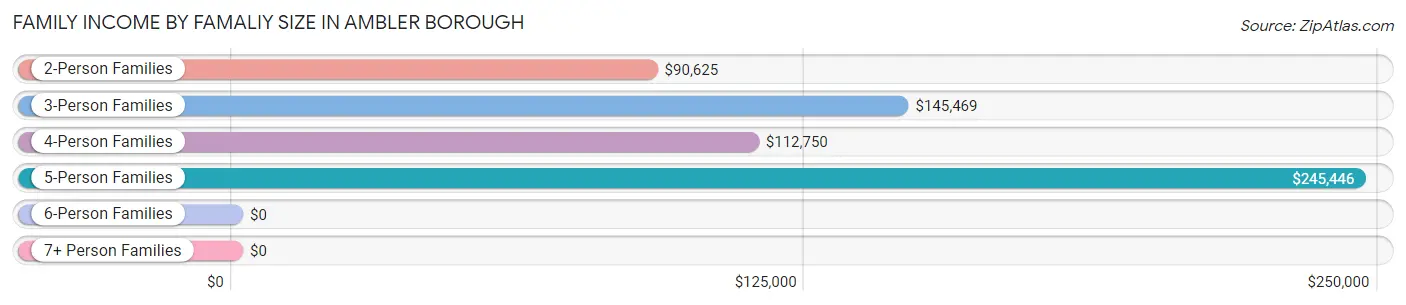
Family Income by Famaliy Size in Ambler borough
5-person families (68 | 4.0%) account for the highest median family income in Ambler borough with $245,446 per family, while 5-person families (68 | 4.0%) have the highest median income of $49,089 per family member.
| Income Bracket | # Families | Median Income |
| 2-Person Families | 751 (44.3%) | $90,625 |
| 3-Person Families | 274 (16.2%) | $145,469 |
| 4-Person Families | 535 (31.6%) | $112,750 |
| 5-Person Families | 68 (4.0%) | $245,446 |
| 6-Person Families | 62 (3.7%) | $0 |
| 7+ Person Families | 4 (0.2%) | $0 |
| Total | 1,694 (100.0%) | $100,294 |
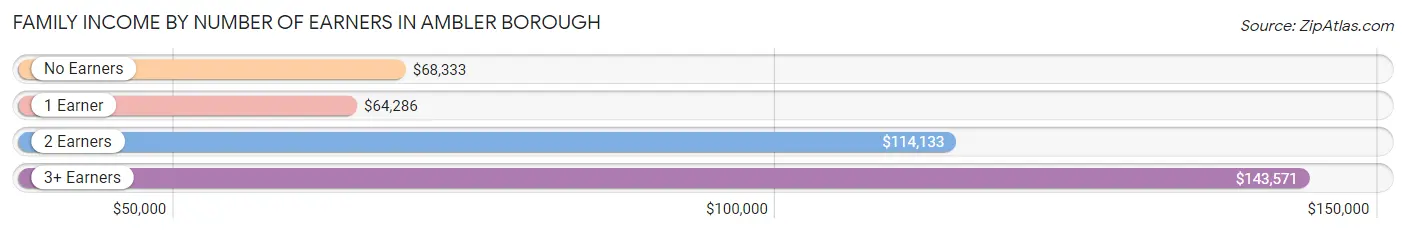
Family Income by Number of Earners in Ambler borough
The median family income in Ambler borough is $100,294, with families comprising 3+ earners (218) having the highest median family income of $143,571, while families with 1 earner (432) have the lowest median family income of $64,286, accounting for 12.9% and 25.5% of families, respectively.
| Number of Earners | # Families | Median Income |
| No Earners | 88 (5.2%) | $68,333 |
| 1 Earner | 432 (25.5%) | $64,286 |
| 2 Earners | 956 (56.4%) | $114,133 |
| 3+ Earners | 218 (12.9%) | $143,571 |
| Total | 1,694 (100.0%) | $100,294 |
Household Income in Ambler borough
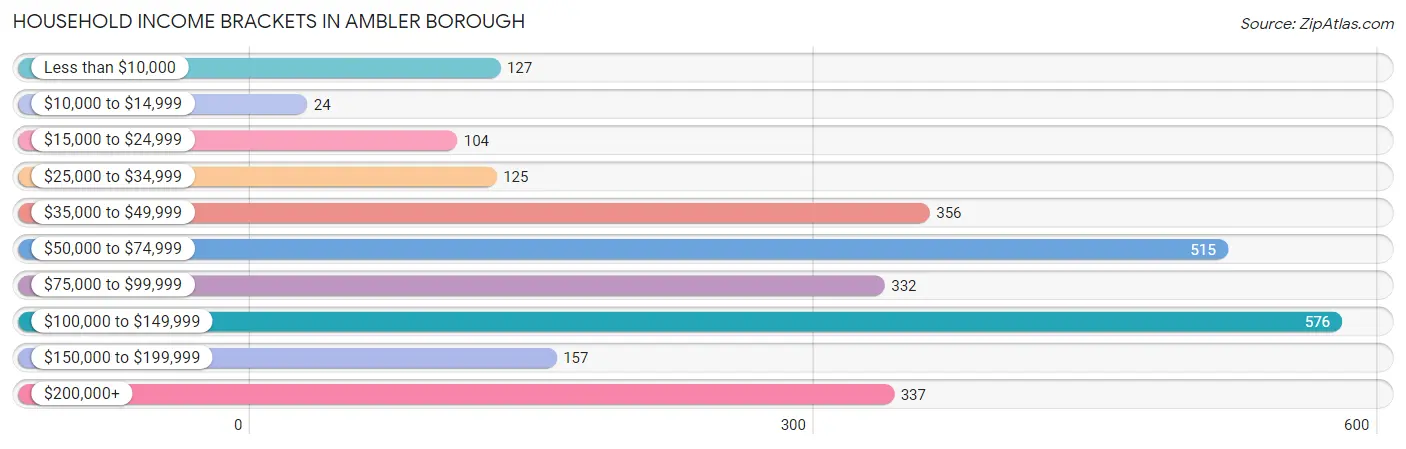
Household Income Brackets in Ambler borough
With 576 households falling in the category, the $100,000 to $149,999 income range is the most frequent in Ambler borough, accounting for 21.7% of all households. In contrast, only 24 households (0.9%) fall into the $10,000 to $14,999 income bracket, making it the least populous group.
| Income Bracket | # Households | % Households |
| Less than $10,000 | 127 | 4.8% |
| $10,000 to $14,999 | 24 | 0.9% |
| $15,000 to $24,999 | 104 | 3.9% |
| $25,000 to $34,999 | 125 | 4.7% |
| $35,000 to $49,999 | 356 | 13.4% |
| $50,000 to $74,999 | 515 | 19.4% |
| $75,000 to $99,999 | 332 | 12.5% |
| $100,000 to $149,999 | 576 | 21.7% |
| $150,000 to $199,999 | 157 | 5.9% |
| $200,000+ | 337 | 12.7% |
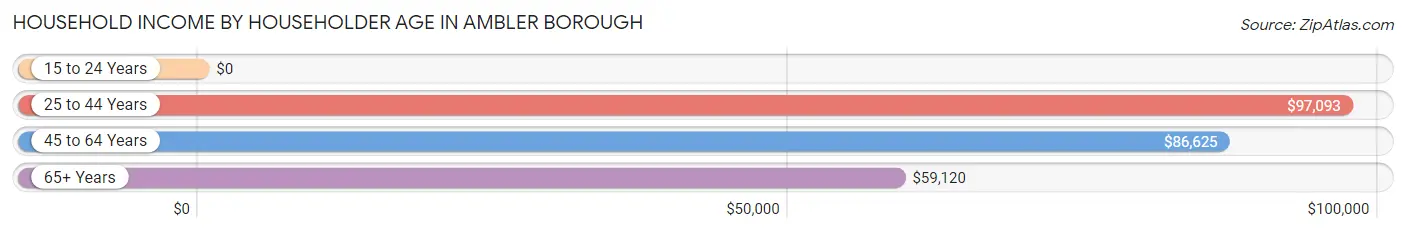
Household Income by Householder Age in Ambler borough
The median household income in Ambler borough is $84,303, with the highest median household income of $97,093 found in the 25 to 44 years age bracket for the primary householder. A total of 1,004 households (37.8%) fall into this category. Meanwhile, the 15 to 24 years age bracket for the primary householder has the lowest median household income of $0, with 51 households (1.9%) in this group.
| Income Bracket | # Households | Median Income |
| 15 to 24 Years | 51 (1.9%) | $0 |
| 25 to 44 Years | 1,004 (37.8%) | $97,093 |
| 45 to 64 Years | 1,043 (39.3%) | $86,625 |
| 65+ Years | 557 (21.0%) | $59,120 |
| Total | 2,655 (100.0%) | $84,303 |
Poverty in Ambler borough
Income Below Poverty by Sex and Age in Ambler borough
With 6.6% poverty level for males and 9.6% for females among the residents of Ambler borough, 75 year old and over males and 15 year old females are the most vulnerable to poverty, with 23 males (17.7%) and 40 females (61.5%) in their respective age groups living below the poverty level.
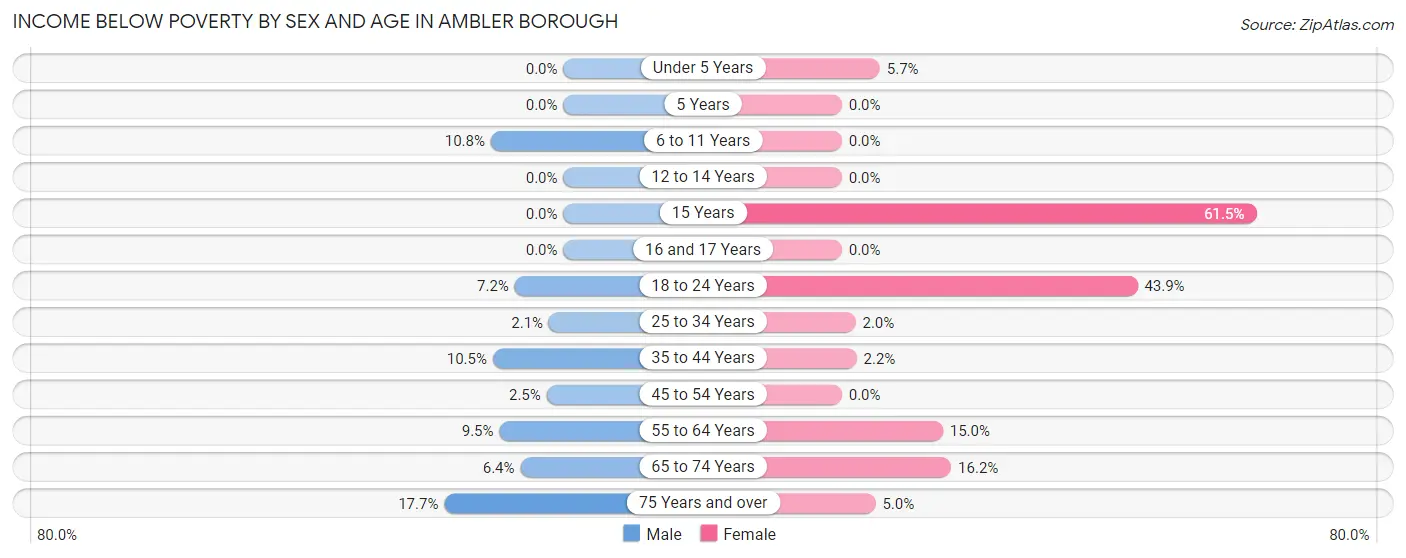
| Age Bracket | Male | Female |
| Under 5 Years | 0 (0.0%) | 17 (5.7%) |
| 5 Years | 0 (0.0%) | 0 (0.0%) |
| 6 to 11 Years | 65 (10.8%) | 0 (0.0%) |
| 12 to 14 Years | 0 (0.0%) | 0 (0.0%) |
| 15 Years | 0 (0.0%) | 40 (61.5%) |
| 16 and 17 Years | 0 (0.0%) | 0 (0.0%) |
| 18 to 24 Years | 12 (7.2%) | 108 (43.9%) |
| 25 to 34 Years | 15 (2.1%) | 11 (2.0%) |
| 35 to 44 Years | 45 (10.5%) | 8 (2.2%) |
| 45 to 54 Years | 10 (2.5%) | 0 (0.0%) |
| 55 to 64 Years | 32 (9.5%) | 69 (15.0%) |
| 65 to 74 Years | 12 (6.4%) | 51 (16.2%) |
| 75 Years and over | 23 (17.7%) | 9 (5.0%) |
| Total | 214 (6.6%) | 313 (9.6%) |
Income Above Poverty by Sex and Age in Ambler borough
According to the poverty statistics in Ambler borough, males aged under 5 years and females aged 6 to 11 years are the age groups that are most secure financially, with 100.0% of males and 100.0% of females in these age groups living above the poverty line.
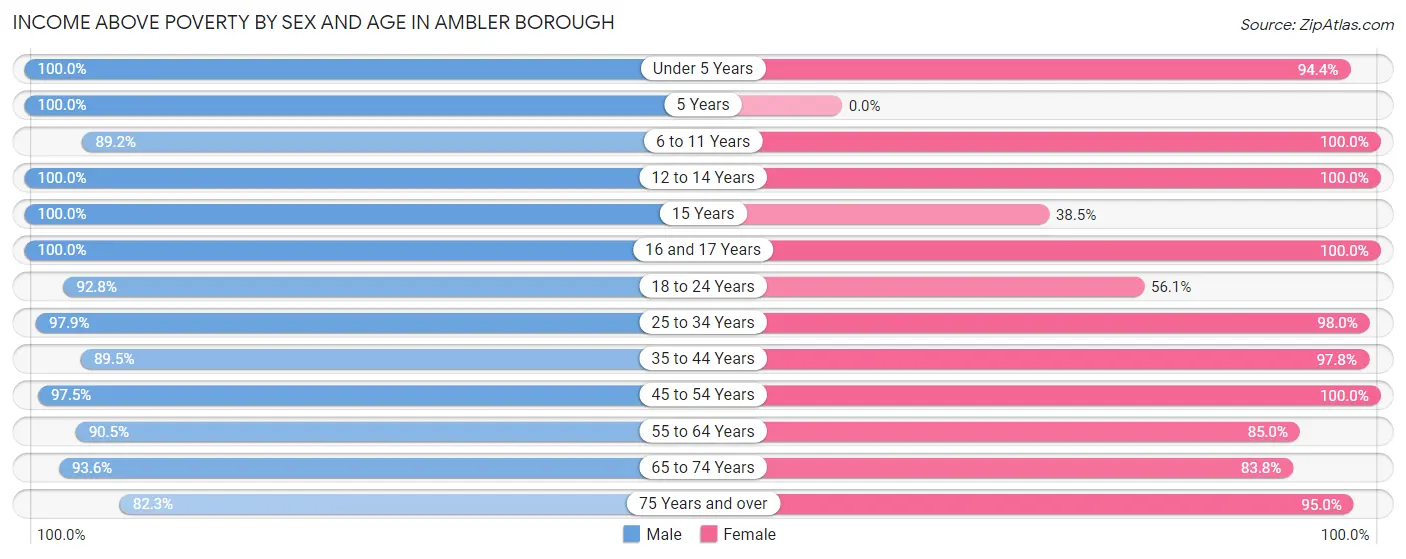
| Age Bracket | Male | Female |
| Under 5 Years | 79 (100.0%) | 284 (94.4%) |
| 5 Years | 42 (100.0%) | 0 (0.0%) |
| 6 to 11 Years | 538 (89.2%) | 160 (100.0%) |
| 12 to 14 Years | 119 (100.0%) | 80 (100.0%) |
| 15 Years | 54 (100.0%) | 25 (38.5%) |
| 16 and 17 Years | 15 (100.0%) | 38 (100.0%) |
| 18 to 24 Years | 154 (92.8%) | 138 (56.1%) |
| 25 to 34 Years | 686 (97.9%) | 529 (98.0%) |
| 35 to 44 Years | 385 (89.5%) | 355 (97.8%) |
| 45 to 54 Years | 394 (97.5%) | 515 (100.0%) |
| 55 to 64 Years | 305 (90.5%) | 391 (85.0%) |
| 65 to 74 Years | 176 (93.6%) | 263 (83.8%) |
| 75 Years and over | 107 (82.3%) | 171 (95.0%) |
| Total | 3,054 (93.4%) | 2,949 (90.4%) |
Income Below Poverty Among Married-Couple Families in Ambler borough
The poverty statistics for married-couple families in Ambler borough show that 1.8% or 23 of the total 1,248 families live below the poverty line. Families with no children have the highest poverty rate of 2.9%, comprising of 19 families. On the other hand, families with 3 or 4 children have the lowest poverty rate of 0.0%, which includes 0 families.
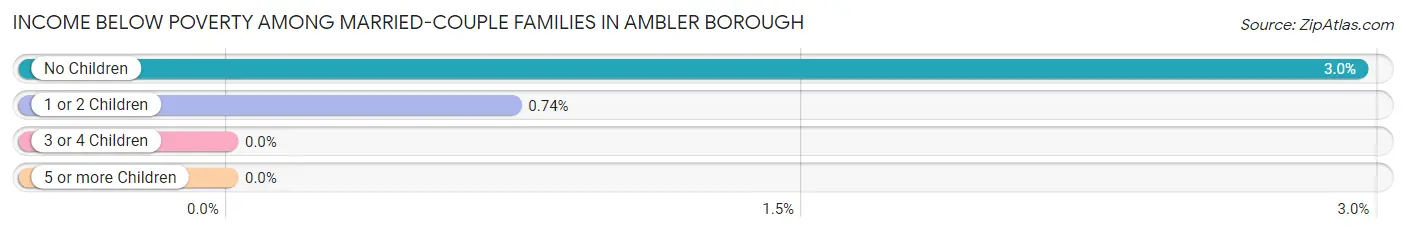
| Children | Above Poverty | Below Poverty |
| No Children | 624 (97.1%) | 19 (2.9%) |
| 1 or 2 Children | 537 (99.3%) | 4 (0.7%) |
| 3 or 4 Children | 64 (100.0%) | 0 (0.0%) |
| 5 or more Children | 0 (0.0%) | 0 (0.0%) |
| Total | 1,225 (98.2%) | 23 (1.8%) |
Income Below Poverty Among Single-Parent Households in Ambler borough
According to the poverty data in Ambler borough, 49.4% or 41 single-father households and 11.6% or 42 single-mother households are living below the poverty line. Among single-father households, those with 1 or 2 children have the highest poverty rate, with 41 households (58.6%) experiencing poverty. Likewise, among single-mother households, those with 1 or 2 children have the highest poverty rate, with 26 households (12.2%) falling below the poverty line.
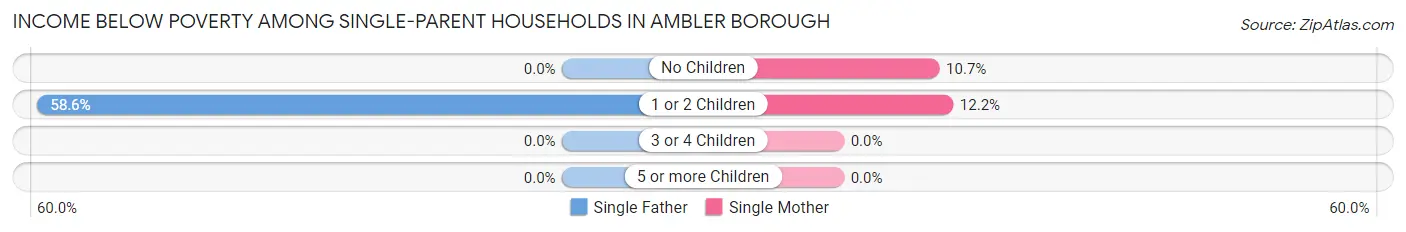
| Children | Single Father | Single Mother |
| No Children | 0 (0.0%) | 16 (10.7%) |
| 1 or 2 Children | 41 (58.6%) | 26 (12.2%) |
| 3 or 4 Children | 0 (0.0%) | 0 (0.0%) |
| 5 or more Children | 0 (0.0%) | 0 (0.0%) |
| Total | 41 (49.4%) | 42 (11.6%) |
Income Below Poverty Among Married-Couple vs Single-Parent Households in Ambler borough
The poverty data for Ambler borough shows that 23 of the married-couple family households (1.8%) and 83 of the single-parent households (18.6%) are living below the poverty level. Within the married-couple family households, those with no children have the highest poverty rate, with 19 households (2.9%) falling below the poverty line. Among the single-parent households, those with 1 or 2 children have the highest poverty rate, with 67 household (23.7%) living below poverty.
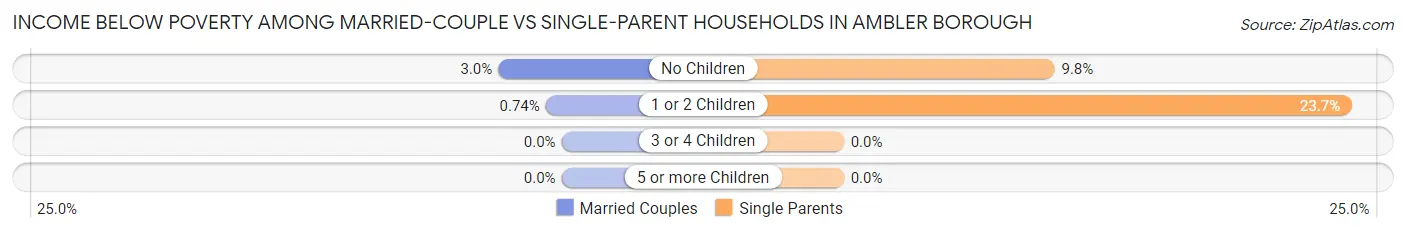
| Children | Married-Couple Families | Single-Parent Households |
| No Children | 19 (2.9%) | 16 (9.8%) |
| 1 or 2 Children | 4 (0.7%) | 67 (23.7%) |
| 3 or 4 Children | 0 (0.0%) | 0 (0.0%) |
| 5 or more Children | 0 (0.0%) | 0 (0.0%) |
| Total | 23 (1.8%) | 83 (18.6%) |
Race in Ambler borough
The most populous races in Ambler borough are White / Caucasian (4,879 | 72.0%), Black / African American (1,070 | 15.8%), and Hispanic or Latino (537 | 7.9%).
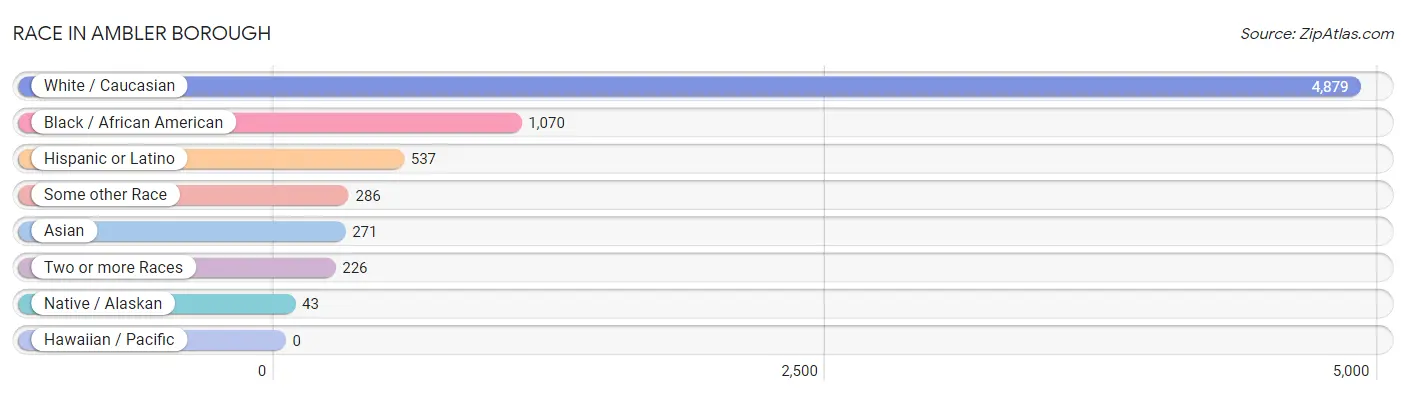
| Race | # Population | % Population |
| Asian | 271 | 4.0% |
| Black / African American | 1,070 | 15.8% |
| Hawaiian / Pacific | 0 | 0.0% |
| Hispanic or Latino | 537 | 7.9% |
| Native / Alaskan | 43 | 0.6% |
| White / Caucasian | 4,879 | 72.0% |
| Two or more Races | 226 | 3.3% |
| Some other Race | 286 | 4.2% |
| Total | 6,775 | 100.0% |
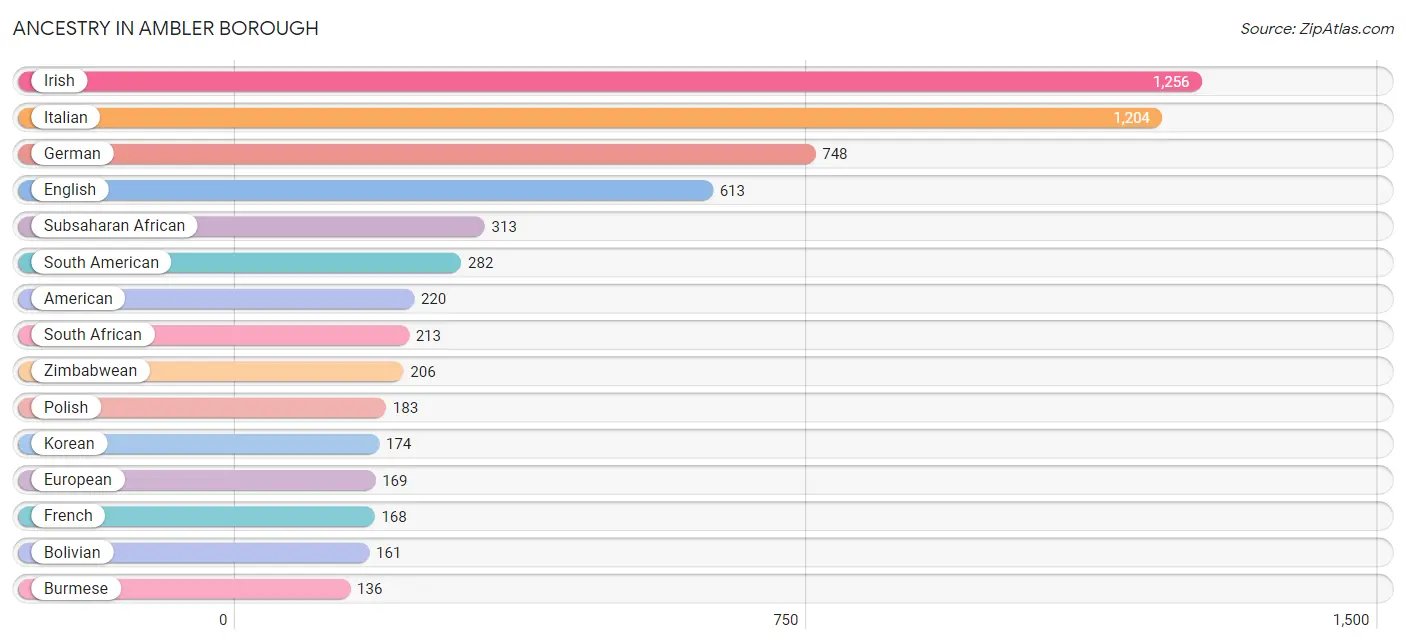
Ancestry in Ambler borough
The most populous ancestries reported in Ambler borough are Irish (1,256 | 18.5%), Italian (1,204 | 17.8%), German (748 | 11.0%), English (613 | 9.0%), and Subsaharan African (313 | 4.6%), together accounting for 61.0% of all Ambler borough residents.
| Ancestry | # Population | % Population |
| African | 5 | 0.1% |
| American | 220 | 3.3% |
| Austrian | 8 | 0.1% |
| Bolivian | 161 | 2.4% |
| Burmese | 136 | 2.0% |
| Canadian | 10 | 0.2% |
| Celtic | 16 | 0.2% |
| Central American | 97 | 1.4% |
| Central American Indian | 43 | 0.6% |
| Colombian | 111 | 1.6% |
| Costa Rican | 60 | 0.9% |
| Cuban | 5 | 0.1% |
| Czech | 17 | 0.3% |
| Danish | 52 | 0.8% |
| Dutch | 68 | 1.0% |
| Eastern European | 52 | 0.8% |
| Ecuadorian | 10 | 0.2% |
| English | 613 | 9.0% |
| Ethiopian | 20 | 0.3% |
| European | 169 | 2.5% |
| Finnish | 3 | 0.0% |
| French | 168 | 2.5% |
| French Canadian | 8 | 0.1% |
| German | 748 | 11.0% |
| Guatemalan | 37 | 0.5% |
| Hungarian | 76 | 1.1% |
| Indian (Asian) | 16 | 0.2% |
| Irish | 1,256 | 18.5% |
| Italian | 1,204 | 17.8% |
| Korean | 174 | 2.6% |
| Lithuanian | 57 | 0.8% |
| Macedonian | 9 | 0.1% |
| Mexican | 8 | 0.1% |
| Northern European | 12 | 0.2% |
| Pennsylvania German | 16 | 0.2% |
| Polish | 183 | 2.7% |
| Puerto Rican | 122 | 1.8% |
| Russian | 129 | 1.9% |
| Scotch-Irish | 15 | 0.2% |
| Scottish | 48 | 0.7% |
| Slovak | 74 | 1.1% |
| Slovene | 6 | 0.1% |
| South African | 213 | 3.1% |
| South American | 282 | 4.2% |
| Spaniard | 8 | 0.1% |
| Subsaharan African | 313 | 4.6% |
| Swedish | 52 | 0.8% |
| Swiss | 6 | 0.1% |
| Ukrainian | 14 | 0.2% |
| Welsh | 83 | 1.2% |
| West Indian | 1 | 0.0% |
| Zimbabwean | 206 | 3.0% | View All 52 Rows |
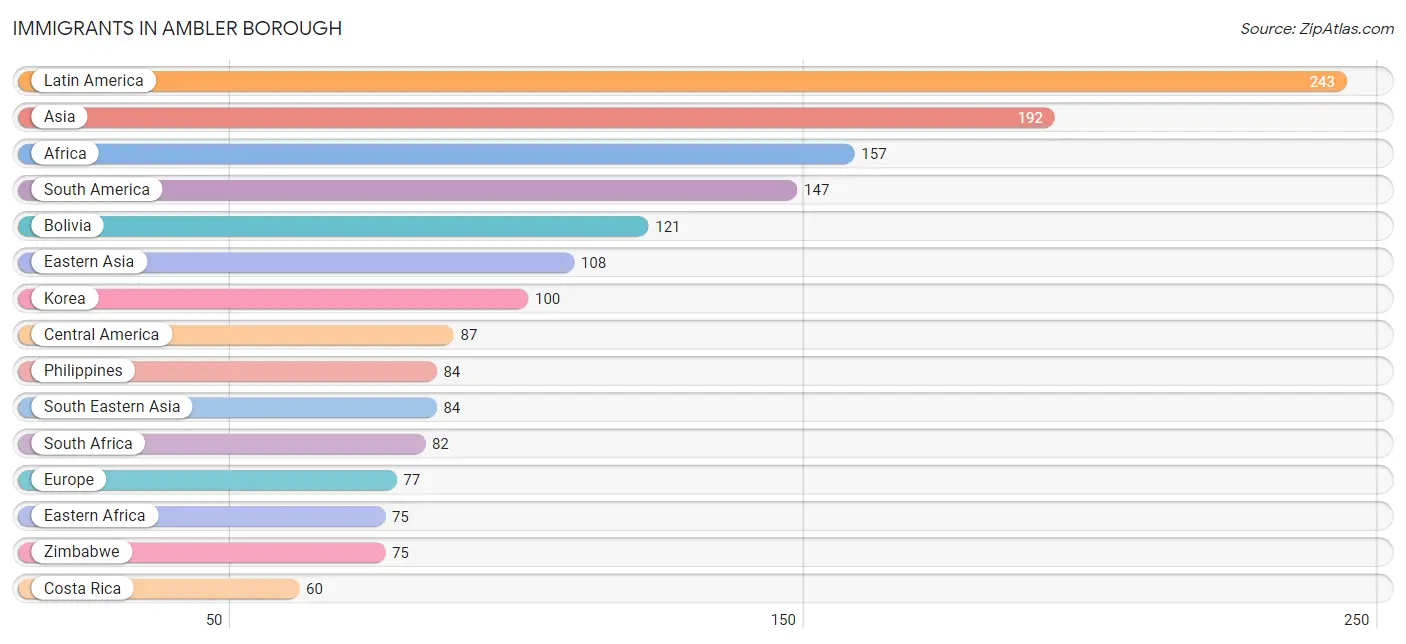
Immigrants in Ambler borough
The most numerous immigrant groups reported in Ambler borough came from Latin America (243 | 3.6%), Asia (192 | 2.8%), Africa (157 | 2.3%), South America (147 | 2.2%), and Bolivia (121 | 1.8%), together accounting for 12.7% of all Ambler borough residents.
| Immigration Origin | # Population | % Population |
| Africa | 157 | 2.3% |
| Asia | 192 | 2.8% |
| Bolivia | 121 | 1.8% |
| Brazil | 15 | 0.2% |
| Caribbean | 9 | 0.1% |
| Central America | 87 | 1.3% |
| China | 8 | 0.1% |
| Colombia | 1 | 0.0% |
| Costa Rica | 60 | 0.9% |
| Cuba | 5 | 0.1% |
| Eastern Africa | 75 | 1.1% |
| Eastern Asia | 108 | 1.6% |
| Eastern Europe | 26 | 0.4% |
| Ecuador | 10 | 0.2% |
| Europe | 77 | 1.1% |
| Guatemala | 27 | 0.4% |
| Italy | 19 | 0.3% |
| Korea | 100 | 1.5% |
| Latin America | 243 | 3.6% |
| Northern Europe | 24 | 0.4% |
| Philippines | 84 | 1.2% |
| Russia | 16 | 0.2% |
| Scotland | 16 | 0.2% |
| South Africa | 82 | 1.2% |
| South America | 147 | 2.2% |
| South Eastern Asia | 84 | 1.2% |
| Southern Europe | 27 | 0.4% |
| Spain | 8 | 0.1% |
| Trinidad and Tobago | 4 | 0.1% |
| Ukraine | 10 | 0.2% |
| Zimbabwe | 75 | 1.1% | View All 31 Rows |
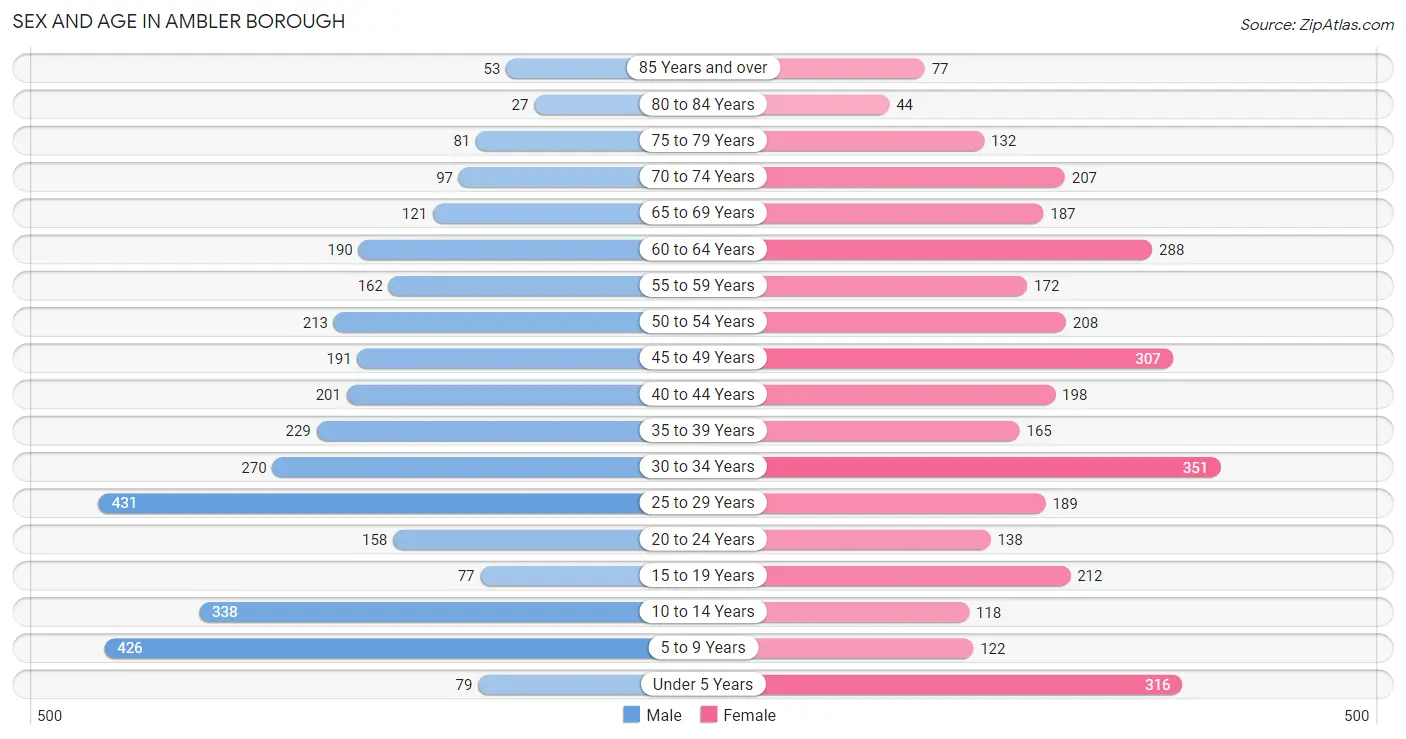
Sex and Age in Ambler borough
Sex and Age in Ambler borough
The most populous age groups in Ambler borough are 25 to 29 Years (431 | 12.9%) for men and 30 to 34 Years (351 | 10.2%) for women.
| Age Bracket | Male | Female |
| Under 5 Years | 79 (2.4%) | 316 (9.2%) |
| 5 to 9 Years | 426 (12.7%) | 122 (3.6%) |
| 10 to 14 Years | 338 (10.1%) | 118 (3.4%) |
| 15 to 19 Years | 77 (2.3%) | 212 (6.2%) |
| 20 to 24 Years | 158 (4.7%) | 138 (4.0%) |
| 25 to 29 Years | 431 (12.9%) | 189 (5.5%) |
| 30 to 34 Years | 270 (8.1%) | 351 (10.2%) |
| 35 to 39 Years | 229 (6.9%) | 165 (4.8%) |
| 40 to 44 Years | 201 (6.0%) | 198 (5.8%) |
| 45 to 49 Years | 191 (5.7%) | 307 (8.9%) |
| 50 to 54 Years | 213 (6.4%) | 208 (6.1%) |
| 55 to 59 Years | 162 (4.8%) | 172 (5.0%) |
| 60 to 64 Years | 190 (5.7%) | 288 (8.4%) |
| 65 to 69 Years | 121 (3.6%) | 187 (5.4%) |
| 70 to 74 Years | 97 (2.9%) | 207 (6.0%) |
| 75 to 79 Years | 81 (2.4%) | 132 (3.8%) |
| 80 to 84 Years | 27 (0.8%) | 44 (1.3%) |
| 85 Years and over | 53 (1.6%) | 77 (2.2%) |
| Total | 3,344 (100.0%) | 3,431 (100.0%) |
Families and Households in Ambler borough
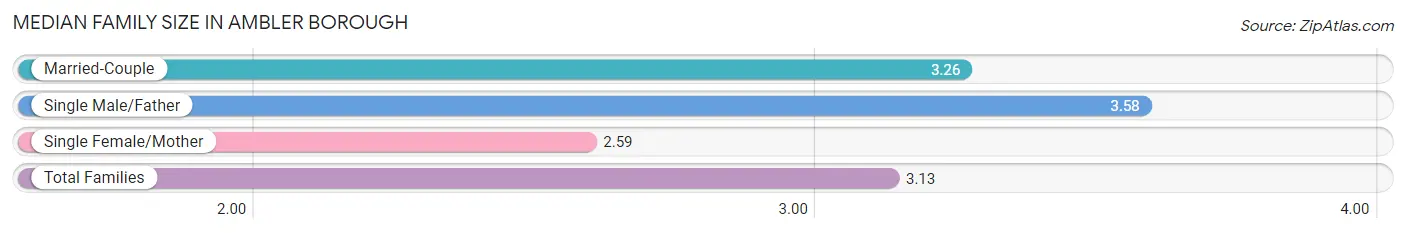
Median Family Size in Ambler borough
The median family size in Ambler borough is 3.13 persons per family, with single male/father families (83 | 4.9%) accounting for the largest median family size of 3.58 persons per family. On the other hand, single female/mother families (363 | 21.4%) represent the smallest median family size with 2.59 persons per family.
| Family Type | # Families | Family Size |
| Married-Couple | 1,248 (73.7%) | 3.26 |
| Single Male/Father | 83 (4.9%) | 3.58 |
| Single Female/Mother | 363 (21.4%) | 2.59 |
| Total Families | 1,694 (100.0%) | 3.13 |
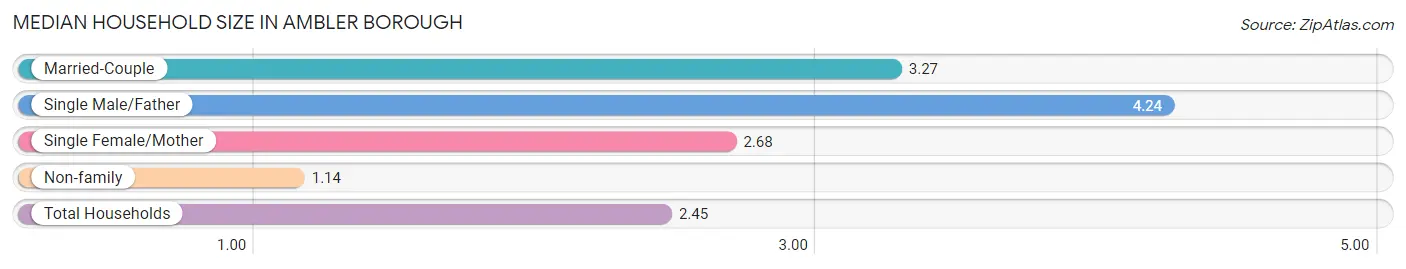
Median Household Size in Ambler borough
The median household size in Ambler borough is 2.45 persons per household, with single male/father households (83 | 3.1%) accounting for the largest median household size of 4.24 persons per household. non-family households (961 | 36.2%) represent the smallest median household size with 1.14 persons per household.
| Household Type | # Households | Household Size |
| Married-Couple | 1,248 (47.0%) | 3.27 |
| Single Male/Father | 83 (3.1%) | 4.24 |
| Single Female/Mother | 363 (13.7%) | 2.68 |
| Non-family | 961 (36.2%) | 1.14 |
| Total Households | 2,655 (100.0%) | 2.45 |
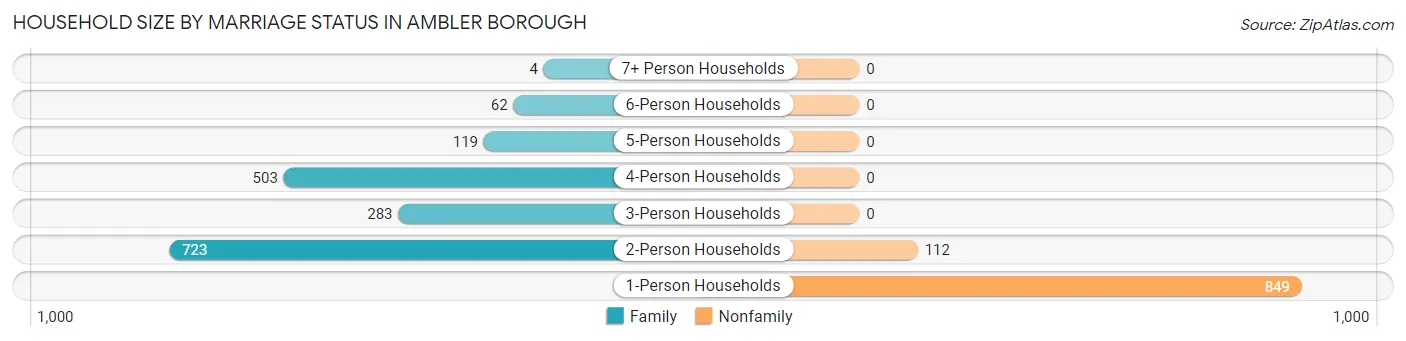
Household Size by Marriage Status in Ambler borough
Out of a total of 2,655 households in Ambler borough, 1,694 (63.8%) are family households, while 961 (36.2%) are nonfamily households. The most numerous type of family households are 2-person households, comprising 723, and the most common type of nonfamily households are 1-person households, comprising 849.
| Household Size | Family Households | Nonfamily Households |
| 1-Person Households | - | 849 (32.0%) |
| 2-Person Households | 723 (27.2%) | 112 (4.2%) |
| 3-Person Households | 283 (10.7%) | 0 (0.0%) |
| 4-Person Households | 503 (19.0%) | 0 (0.0%) |
| 5-Person Households | 119 (4.5%) | 0 (0.0%) |
| 6-Person Households | 62 (2.3%) | 0 (0.0%) |
| 7+ Person Households | 4 (0.2%) | 0 (0.0%) |
| Total | 1,694 (63.8%) | 961 (36.2%) |
Female Fertility in Ambler borough
Fertility by Age in Ambler borough
Average fertility rate in Ambler borough is 51.0 births per 1,000 women. Women in the age bracket of 20 to 34 years have the highest fertility rate with 83.0 births per 1,000 women. Women in the age bracket of 20 to 34 years acount for 70.0% of all women with births.
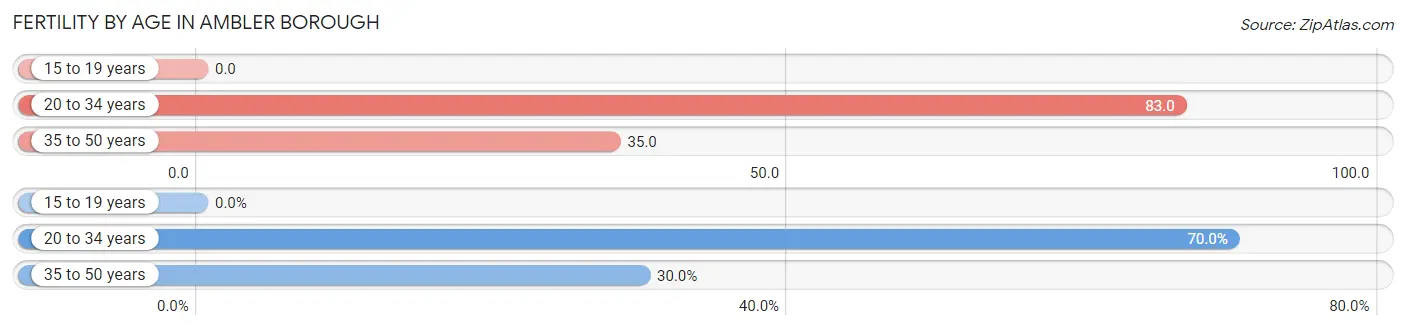
| Age Bracket | Women with Births | Births / 1,000 Women |
| 15 to 19 years | 0 (0.0%) | 0.0 |
| 20 to 34 years | 56 (70.0%) | 83.0 |
| 35 to 50 years | 24 (30.0%) | 35.0 |
| Total | 80 (100.0%) | 51.0 |
Fertility by Age by Marriage Status in Ambler borough
51.2% of women with births (80) in Ambler borough are married. The highest percentage of unmarried women with births falls into 20 to 34 years age bracket with 69.6% of them unmarried at the time of birth, while the lowest percentage of unmarried women with births belong to 35 to 50 years age bracket with 0.0% of them unmarried.
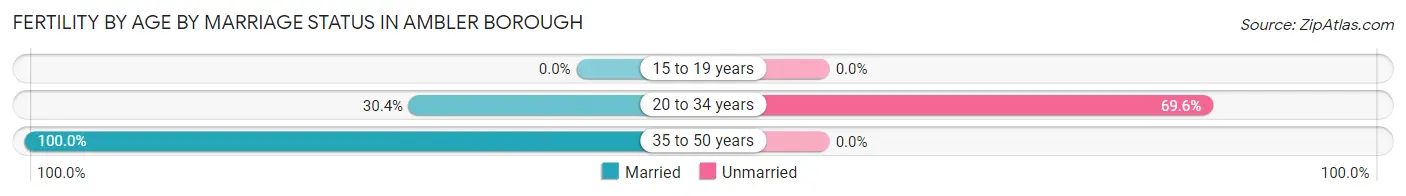
| Age Bracket | Married | Unmarried |
| 15 to 19 years | 0 (0.0%) | 0 (0.0%) |
| 20 to 34 years | 17 (30.4%) | 39 (69.6%) |
| 35 to 50 years | 24 (100.0%) | 0 (0.0%) |
| Total | 41 (51.2%) | 39 (48.7%) |
Fertility by Education in Ambler borough
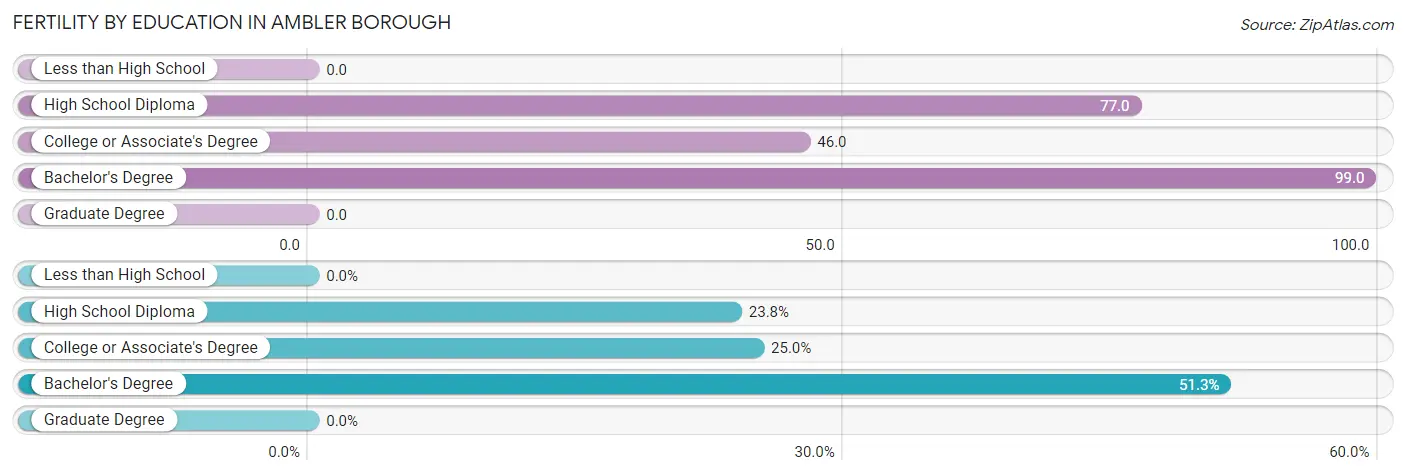
| Educational Attainment | Women with Births | Births / 1,000 Women |
| Less than High School | 0 (0.0%) | 0.0 |
| High School Diploma | 19 (23.7%) | 77.0 |
| College or Associate's Degree | 20 (25.0%) | 46.0 |
| Bachelor's Degree | 41 (51.2%) | 99.0 |
| Graduate Degree | 0 (0.0%) | 0.0 |
| Total | 80 (100.0%) | 51.0 |
Fertility by Education by Marriage Status in Ambler borough
48.7% of women with births in Ambler borough are unmarried. Women with the educational attainment of bachelor's degree are most likely to be married with 100.0% of them married at childbirth, while women with the educational attainment of high school diploma are least likely to be married with 100.0% of them unmarried at childbirth.
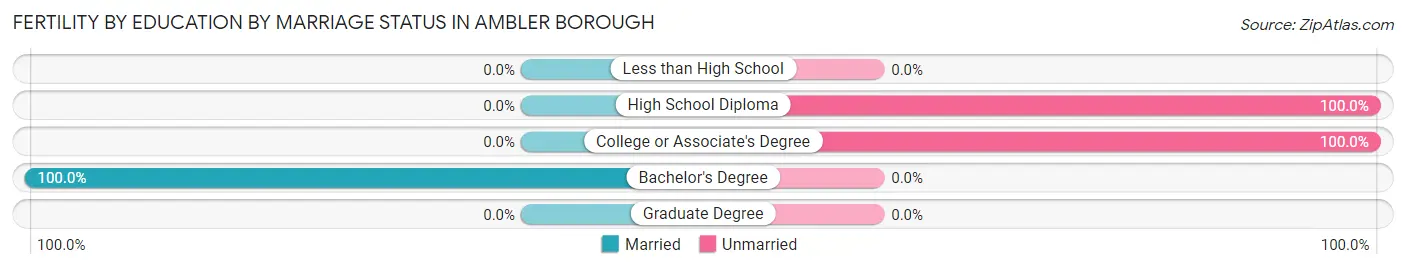
| Educational Attainment | Married | Unmarried |
| Less than High School | 0 (0.0%) | 0 (0.0%) |
| High School Diploma | 0 (0.0%) | 19 (100.0%) |
| College or Associate's Degree | 0 (0.0%) | 20 (100.0%) |
| Bachelor's Degree | 41 (100.0%) | 0 (0.0%) |
| Graduate Degree | 0 (0.0%) | 0 (0.0%) |
| Total | 41 (51.2%) | 39 (48.7%) |
Employment Characteristics in Ambler borough
Employment by Class of Employer in Ambler borough
Among the 3,527 employed individuals in Ambler borough, private company employees (2,621 | 74.3%), not-for-profit organizations (448 | 12.7%), and local government employees (179 | 5.1%) make up the most common classes of employment.
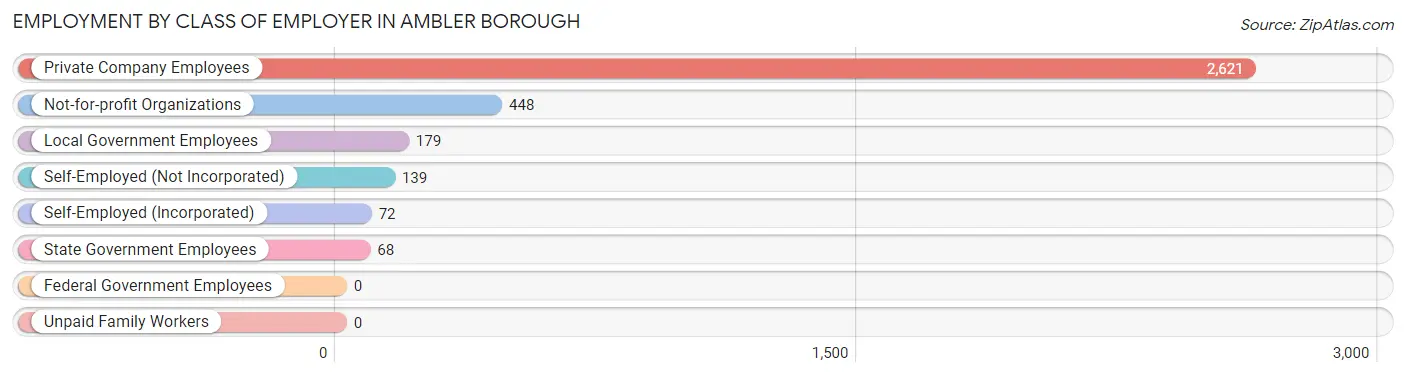
| Employer Class | # Employees | % Employees |
| Private Company Employees | 2,621 | 74.3% |
| Self-Employed (Incorporated) | 72 | 2.0% |
| Self-Employed (Not Incorporated) | 139 | 3.9% |
| Not-for-profit Organizations | 448 | 12.7% |
| Local Government Employees | 179 | 5.1% |
| State Government Employees | 68 | 1.9% |
| Federal Government Employees | 0 | 0.0% |
| Unpaid Family Workers | 0 | 0.0% |
| Total | 3,527 | 100.0% |
Employment Status by Age in Ambler borough
According to the labor force statistics for Ambler borough, out of the total population over 16 years of age (5,257), 73.0% or 3,838 individuals are in the labor force, with 5.0% or 192 of them unemployed. The age group with the highest labor force participation rate is 25 to 29 years, with 97.4% or 604 individuals in the labor force. Within the labor force, the 20 to 24 years age range has the highest percentage of unemployed individuals, with 17.1% or 40 of them being unemployed.
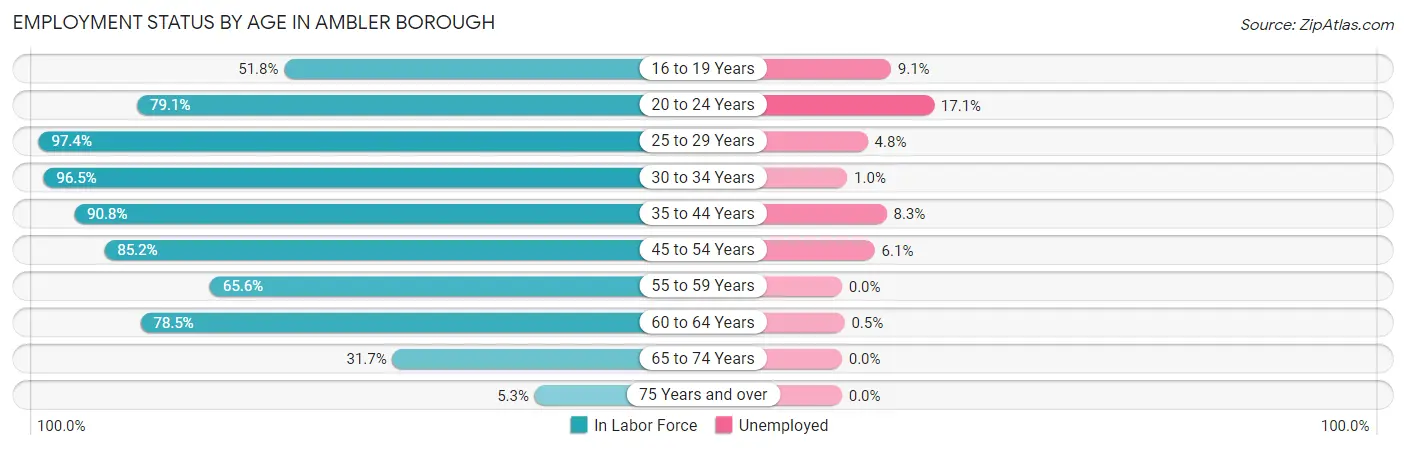
| Age Bracket | In Labor Force | Unemployed |
| 16 to 19 Years | 88 (51.8%) | 8 (9.1%) |
| 20 to 24 Years | 234 (79.1%) | 40 (17.1%) |
| 25 to 29 Years | 604 (97.4%) | 29 (4.8%) |
| 30 to 34 Years | 599 (96.5%) | 6 (1.0%) |
| 35 to 44 Years | 720 (90.8%) | 60 (8.3%) |
| 45 to 54 Years | 783 (85.2%) | 48 (6.1%) |
| 55 to 59 Years | 219 (65.6%) | 0 (0.0%) |
| 60 to 64 Years | 375 (78.5%) | 2 (0.5%) |
| 65 to 74 Years | 194 (31.7%) | 0 (0.0%) |
| 75 Years and over | 22 (5.3%) | 0 (0.0%) |
| Total | 3,838 (73.0%) | 192 (5.0%) |
Employment Status by Educational Attainment in Ambler borough
According to labor force statistics for Ambler borough, 87.6% of individuals (3,298) out of the total population between 25 and 64 years of age (3,765) are in the labor force, with 4.4% or 145 of them being unemployed. The group with the highest labor force participation rate are those with the educational attainment of bachelor's degree or higher, with 93.8% or 1,830 individuals in the labor force. Within the labor force, individuals with high school diploma education have the highest percentage of unemployment, with 15.9% or 97 of them being unemployed.
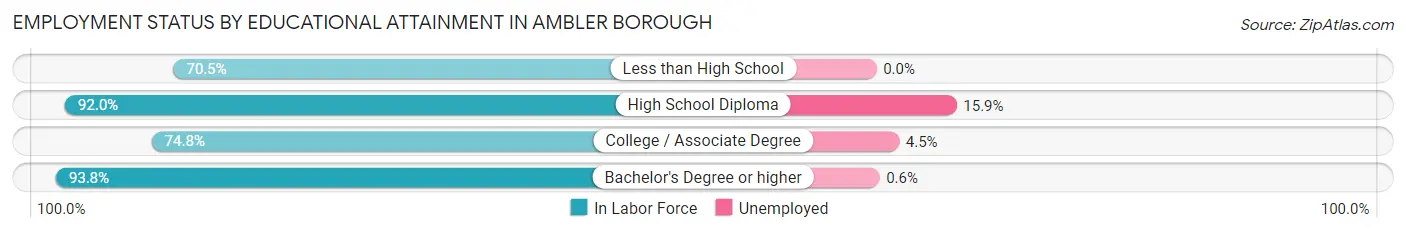
| Educational Attainment | In Labor Force | Unemployed |
| Less than High School | 43 (70.5%) | 0 (0.0%) |
| High School Diploma | 611 (92.0%) | 106 (15.9%) |
| College / Associate Degree | 815 (74.8%) | 49 (4.5%) |
| Bachelor's Degree or higher | 1,830 (93.8%) | 12 (0.6%) |
| Total | 3,298 (87.6%) | 166 (4.4%) |
Employment Occupations by Sex in Ambler borough
Management, Business, Science and Arts Occupations
The most common Management, Business, Science and Arts occupations in Ambler borough are Community & Social Service (579 | 15.9%), Management (384 | 10.5%), Computers, Engineering & Science (373 | 10.2%), Education Instruction & Library (320 | 8.8%), and Business & Financial (311 | 8.5%).
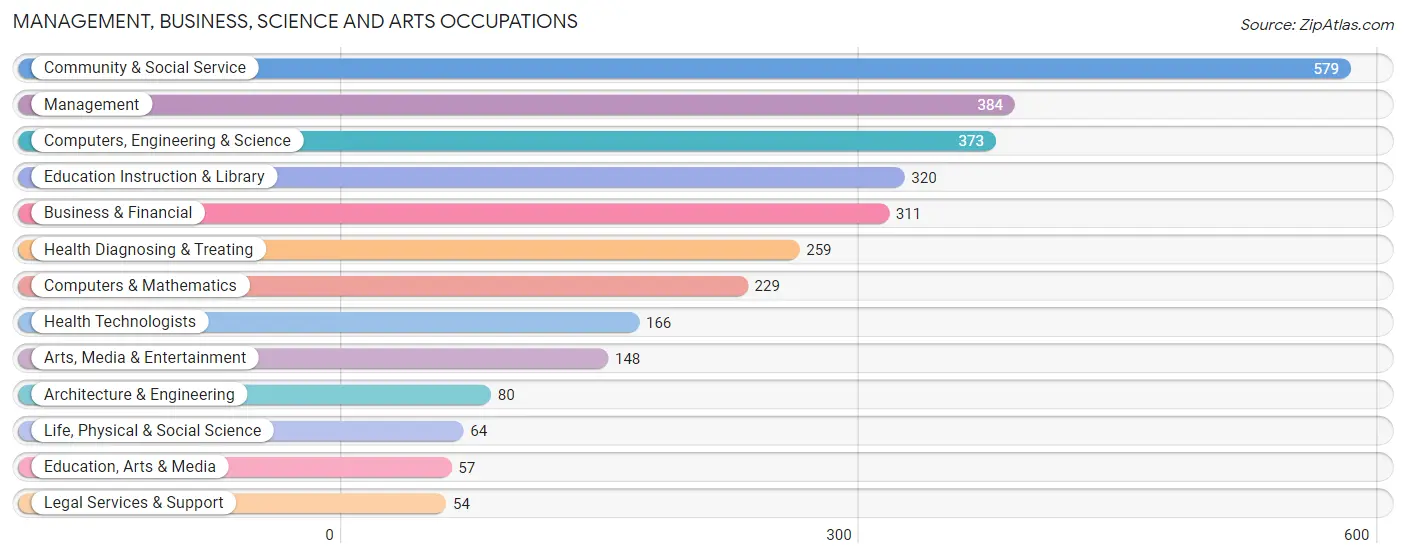
Management, Business, Science and Arts Occupations by Sex
Within the Management, Business, Science and Arts occupations in Ambler borough, the most male-oriented occupations are Computers & Mathematics (90.8%), Education, Arts & Media (73.7%), and Computers, Engineering & Science (71.3%), while the most female-oriented occupations are Health Diagnosing & Treating (89.2%), Education Instruction & Library (88.1%), and Health Technologists (87.9%).
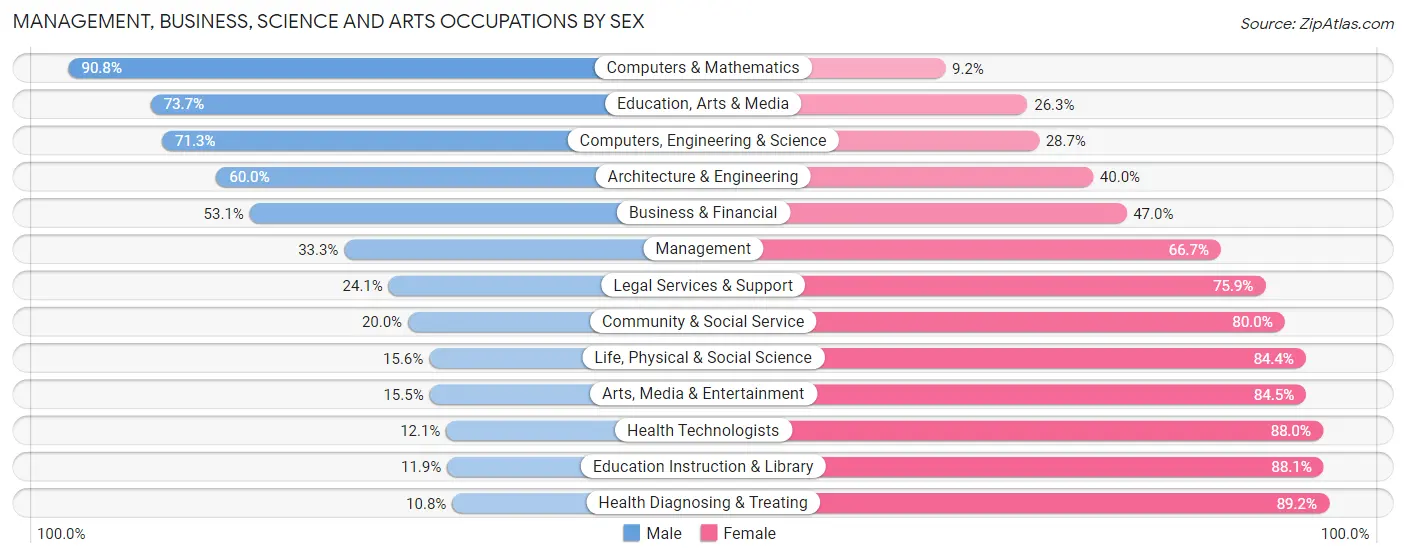
| Occupation | Male | Female |
| Management | 128 (33.3%) | 256 (66.7%) |
| Business & Financial | 165 (53.0%) | 146 (46.9%) |
| Computers, Engineering & Science | 266 (71.3%) | 107 (28.7%) |
| Computers & Mathematics | 208 (90.8%) | 21 (9.2%) |
| Architecture & Engineering | 48 (60.0%) | 32 (40.0%) |
| Life, Physical & Social Science | 10 (15.6%) | 54 (84.4%) |
| Community & Social Service | 116 (20.0%) | 463 (80.0%) |
| Education, Arts & Media | 42 (73.7%) | 15 (26.3%) |
| Legal Services & Support | 13 (24.1%) | 41 (75.9%) |
| Education Instruction & Library | 38 (11.9%) | 282 (88.1%) |
| Arts, Media & Entertainment | 23 (15.5%) | 125 (84.5%) |
| Health Diagnosing & Treating | 28 (10.8%) | 231 (89.2%) |
| Health Technologists | 20 (12.0%) | 146 (87.9%) |
| Total (Category) | 703 (36.9%) | 1,203 (63.1%) |
| Total (Overall) | 1,885 (51.7%) | 1,760 (48.3%) |
Services Occupations
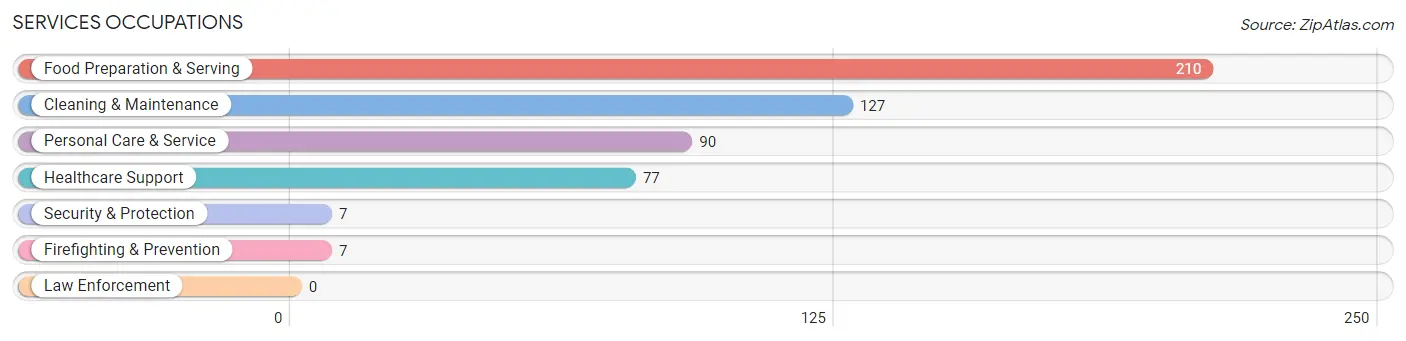
The most common Services occupations in Ambler borough are Food Preparation & Serving (210 | 5.8%), Cleaning & Maintenance (127 | 3.5%), Personal Care & Service (90 | 2.5%), Healthcare Support (77 | 2.1%), and Security & Protection (7 | 0.2%).
Services Occupations by Sex
Within the Services occupations in Ambler borough, the most male-oriented occupations are Cleaning & Maintenance (100.0%), Healthcare Support (64.9%), and Food Preparation & Serving (59.5%), while the most female-oriented occupations are Security & Protection (100.0%), Firefighting & Prevention (100.0%), and Personal Care & Service (85.6%).
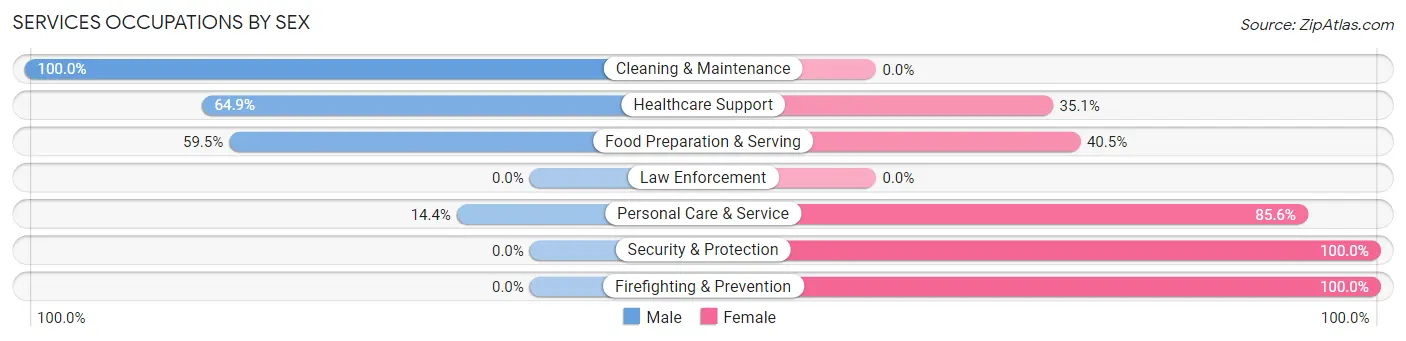
| Occupation | Male | Female |
| Healthcare Support | 50 (64.9%) | 27 (35.1%) |
| Security & Protection | 0 (0.0%) | 7 (100.0%) |
| Firefighting & Prevention | 0 (0.0%) | 7 (100.0%) |
| Law Enforcement | 0 (0.0%) | 0 (0.0%) |
| Food Preparation & Serving | 125 (59.5%) | 85 (40.5%) |
| Cleaning & Maintenance | 127 (100.0%) | 0 (0.0%) |
| Personal Care & Service | 13 (14.4%) | 77 (85.6%) |
| Total (Category) | 315 (61.6%) | 196 (38.4%) |
| Total (Overall) | 1,885 (51.7%) | 1,760 (48.3%) |
Sales and Office Occupations
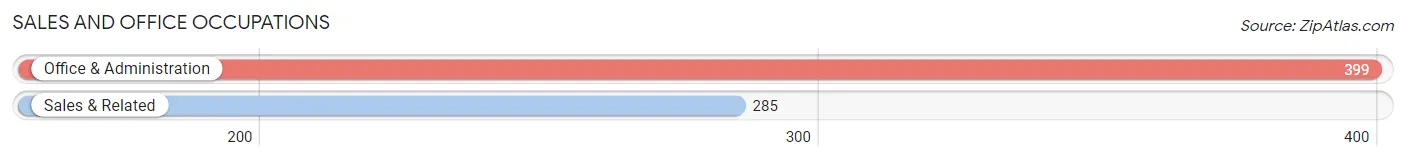
The most common Sales and Office occupations in Ambler borough are Office & Administration (399 | 11.0%), and Sales & Related (285 | 7.8%).
Sales and Office Occupations by Sex
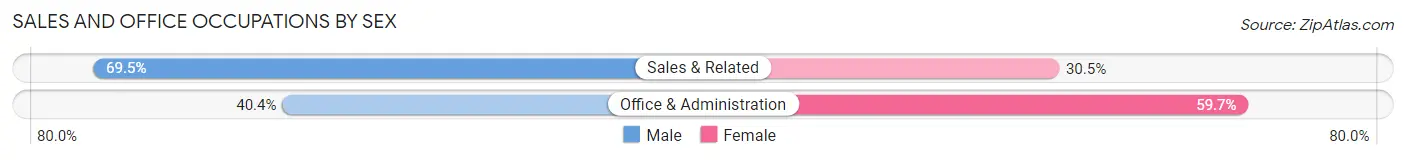
| Occupation | Male | Female |
| Sales & Related | 198 (69.5%) | 87 (30.5%) |
| Office & Administration | 161 (40.4%) | 238 (59.7%) |
| Total (Category) | 359 (52.5%) | 325 (47.5%) |
| Total (Overall) | 1,885 (51.7%) | 1,760 (48.3%) |
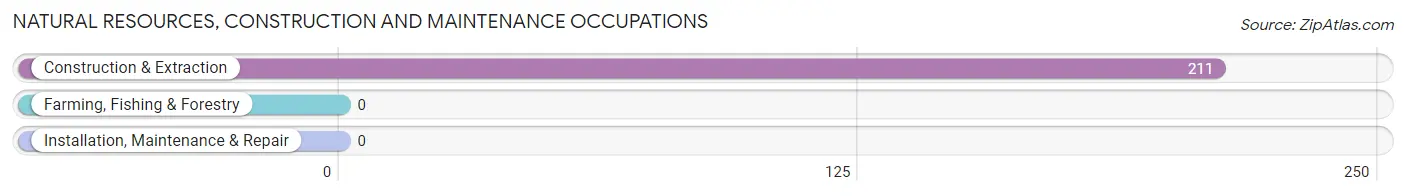
Natural Resources, Construction and Maintenance Occupations
The most common Natural Resources, Construction and Maintenance occupations in Ambler borough are , and Construction & Extraction (211 | 5.8%).
Natural Resources, Construction and Maintenance Occupations by Sex
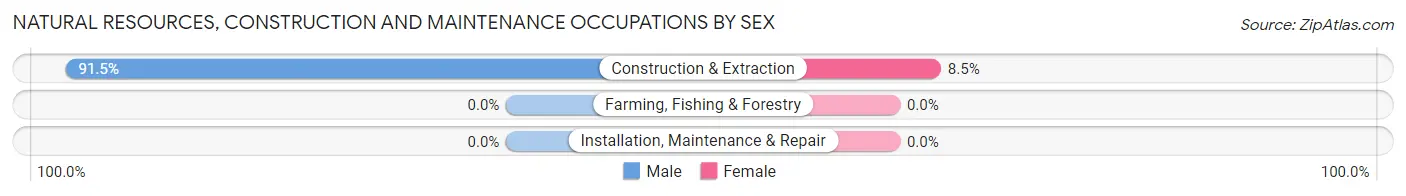
| Occupation | Male | Female |
| Farming, Fishing & Forestry | 0 (0.0%) | 0 (0.0%) |
| Construction & Extraction | 193 (91.5%) | 18 (8.5%) |
| Installation, Maintenance & Repair | 0 (0.0%) | 0 (0.0%) |
| Total (Category) | 193 (91.5%) | 18 (8.5%) |
| Total (Overall) | 1,885 (51.7%) | 1,760 (48.3%) |
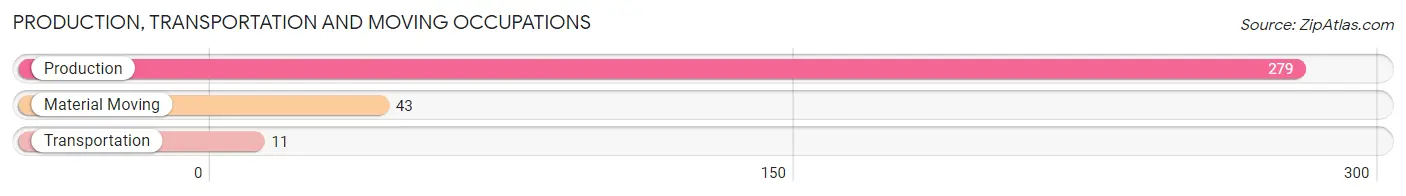
Production, Transportation and Moving Occupations
The most common Production, Transportation and Moving occupations in Ambler borough are Production (279 | 7.6%), Material Moving (43 | 1.2%), and Transportation (11 | 0.3%).
Production, Transportation and Moving Occupations by Sex
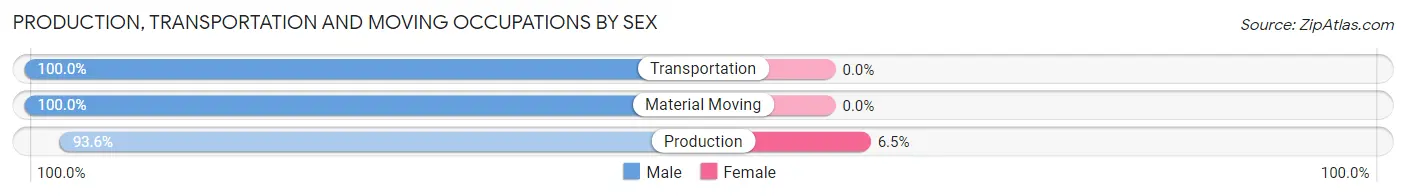
| Occupation | Male | Female |
| Production | 261 (93.5%) | 18 (6.5%) |
| Transportation | 11 (100.0%) | 0 (0.0%) |
| Material Moving | 43 (100.0%) | 0 (0.0%) |
| Total (Category) | 315 (94.6%) | 18 (5.4%) |
| Total (Overall) | 1,885 (51.7%) | 1,760 (48.3%) |
Employment Industries by Sex in Ambler borough
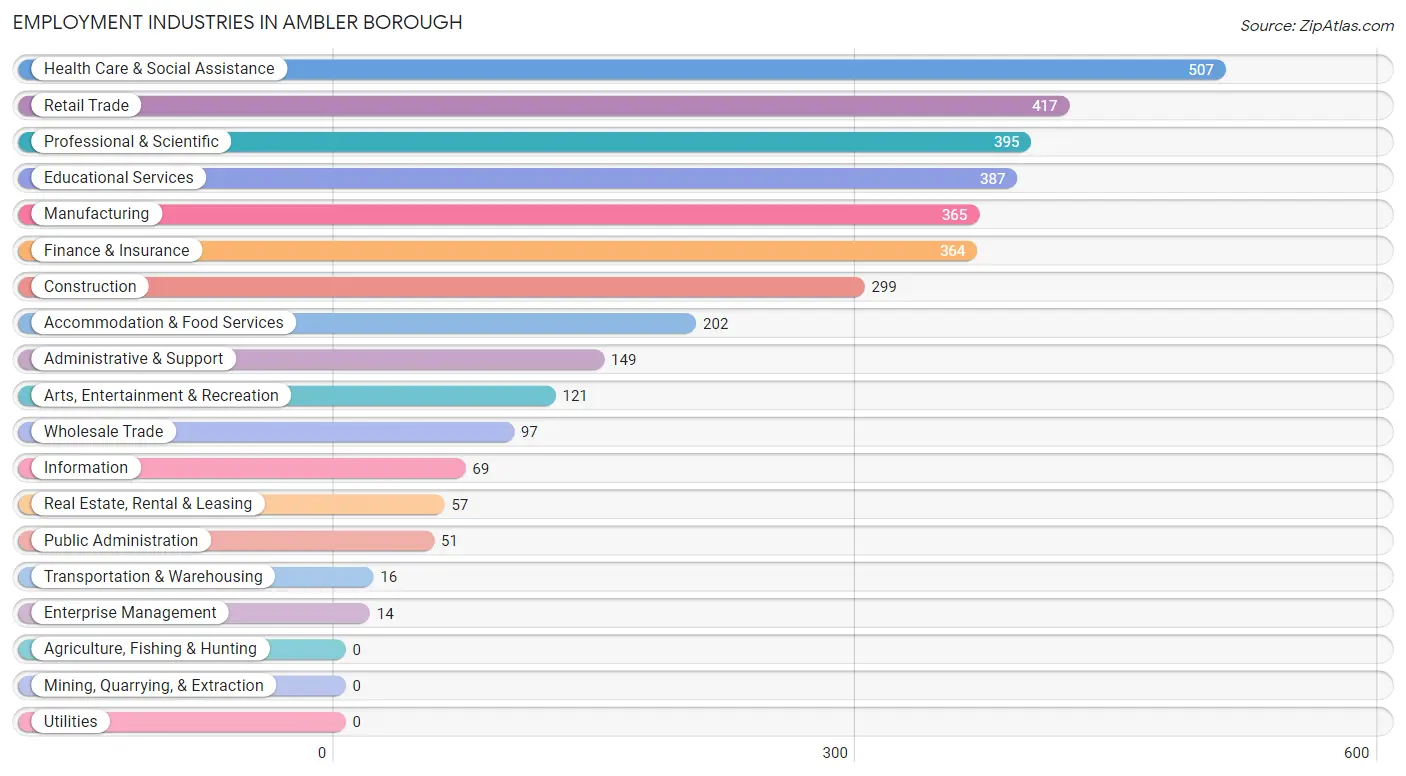
Employment Industries in Ambler borough
The major employment industries in Ambler borough include Health Care & Social Assistance (507 | 13.9%), Retail Trade (417 | 11.4%), Professional & Scientific (395 | 10.8%), Educational Services (387 | 10.6%), and Manufacturing (365 | 10.0%).
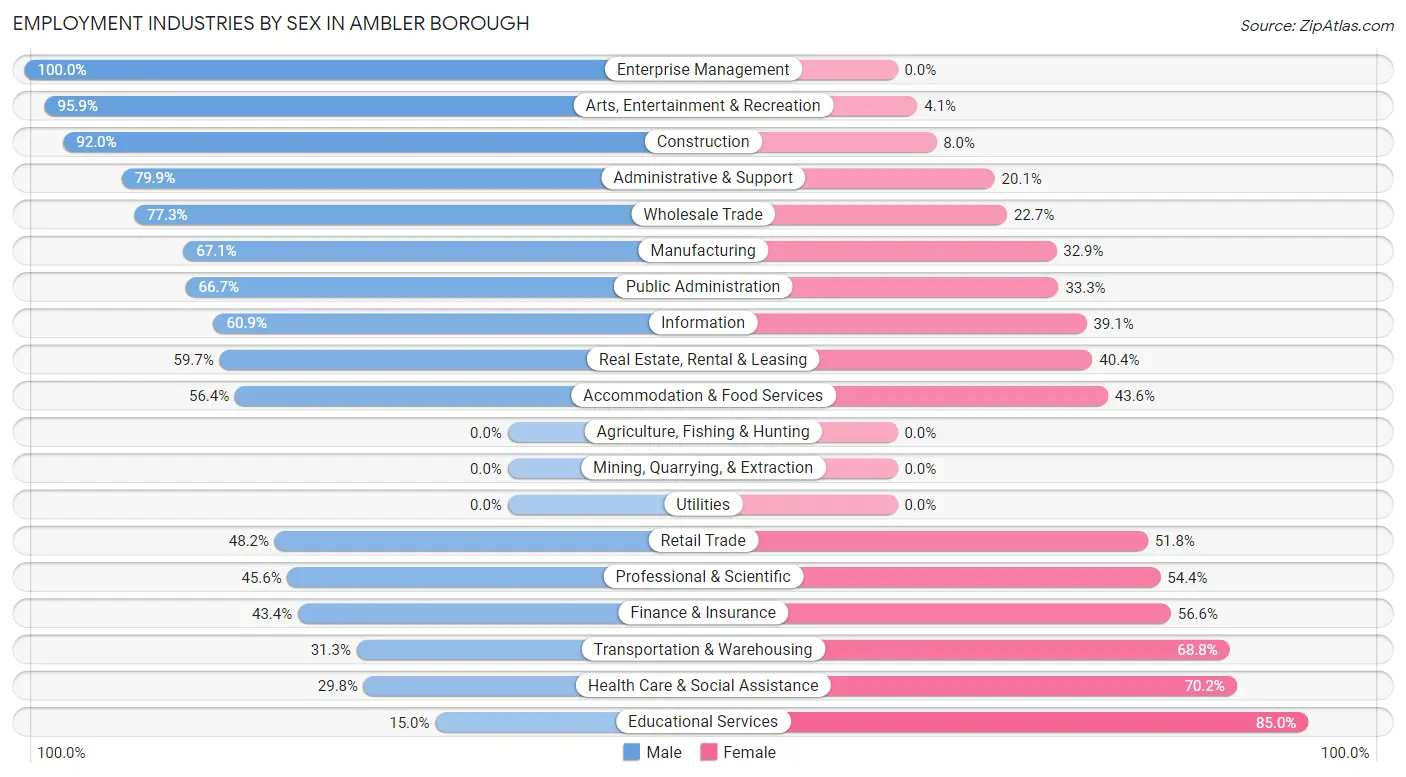
Employment Industries by Sex in Ambler borough
The Ambler borough industries that see more men than women are Enterprise Management (100.0%), Arts, Entertainment & Recreation (95.9%), and Construction (92.0%), whereas the industries that tend to have a higher number of women are Educational Services (85.0%), Health Care & Social Assistance (70.2%), and Transportation & Warehousing (68.8%).
| Industry | Male | Female |
| Agriculture, Fishing & Hunting | 0 (0.0%) | 0 (0.0%) |
| Mining, Quarrying, & Extraction | 0 (0.0%) | 0 (0.0%) |
| Construction | 275 (92.0%) | 24 (8.0%) |
| Manufacturing | 245 (67.1%) | 120 (32.9%) |
| Wholesale Trade | 75 (77.3%) | 22 (22.7%) |
| Retail Trade | 201 (48.2%) | 216 (51.8%) |
| Transportation & Warehousing | 5 (31.2%) | 11 (68.8%) |
| Utilities | 0 (0.0%) | 0 (0.0%) |
| Information | 42 (60.9%) | 27 (39.1%) |
| Finance & Insurance | 158 (43.4%) | 206 (56.6%) |
| Real Estate, Rental & Leasing | 34 (59.7%) | 23 (40.4%) |
| Professional & Scientific | 180 (45.6%) | 215 (54.4%) |
| Enterprise Management | 14 (100.0%) | 0 (0.0%) |
| Administrative & Support | 119 (79.9%) | 30 (20.1%) |
| Educational Services | 58 (15.0%) | 329 (85.0%) |
| Health Care & Social Assistance | 151 (29.8%) | 356 (70.2%) |
| Arts, Entertainment & Recreation | 116 (95.9%) | 5 (4.1%) |
| Accommodation & Food Services | 114 (56.4%) | 88 (43.6%) |
| Public Administration | 34 (66.7%) | 17 (33.3%) |
| Total | 1,885 (51.7%) | 1,760 (48.3%) |
Education in Ambler borough
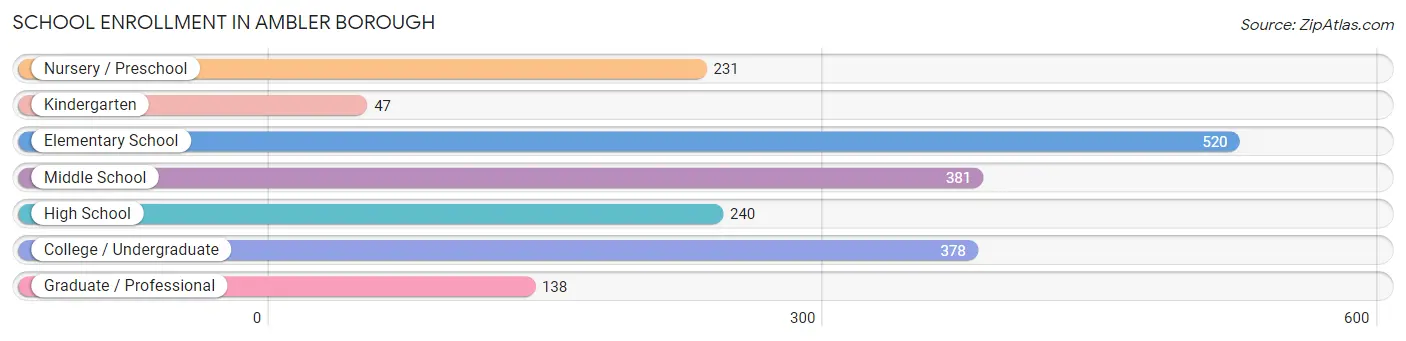
School Enrollment in Ambler borough
The most common levels of schooling among the 1,935 students in Ambler borough are elementary school (520 | 26.9%), middle school (381 | 19.7%), and college / undergraduate (378 | 19.5%).
| School Level | # Students | % Students |
| Nursery / Preschool | 231 | 11.9% |
| Kindergarten | 47 | 2.4% |
| Elementary School | 520 | 26.9% |
| Middle School | 381 | 19.7% |
| High School | 240 | 12.4% |
| College / Undergraduate | 378 | 19.5% |
| Graduate / Professional | 138 | 7.1% |
| Total | 1,935 | 100.0% |
School Enrollment by Age by Funding Source in Ambler borough
Out of a total of 1,935 students who are enrolled in schools in Ambler borough, 714 (36.9%) attend a private institution, while the remaining 1,221 (63.1%) are enrolled in public schools. The age group of 3 to 4 year olds has the highest likelihood of being enrolled in private schools, with 163 (86.2% in the age bracket) enrolled. Conversely, the age group of 15 to 17 year olds has the lowest likelihood of being enrolled in a private school, with 172 (100.0% in the age bracket) attending a public institution.
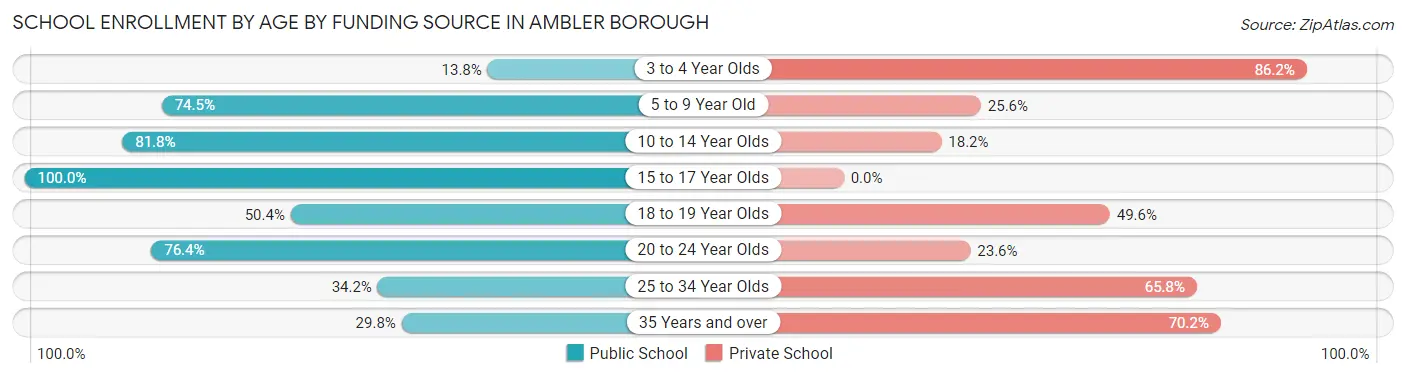
| Age Bracket | Public School | Private School |
| 3 to 4 Year Olds | 26 (13.8%) | 163 (86.2%) |
| 5 to 9 Year Old | 408 (74.5%) | 140 (25.6%) |
| 10 to 14 Year Olds | 373 (81.8%) | 83 (18.2%) |
| 15 to 17 Year Olds | 172 (100.0%) | 0 (0.0%) |
| 18 to 19 Year Olds | 59 (50.4%) | 58 (49.6%) |
| 20 to 24 Year Olds | 68 (76.4%) | 21 (23.6%) |
| 25 to 34 Year Olds | 51 (34.2%) | 98 (65.8%) |
| 35 Years and over | 64 (29.8%) | 151 (70.2%) |
| Total | 1,221 (63.1%) | 714 (36.9%) |
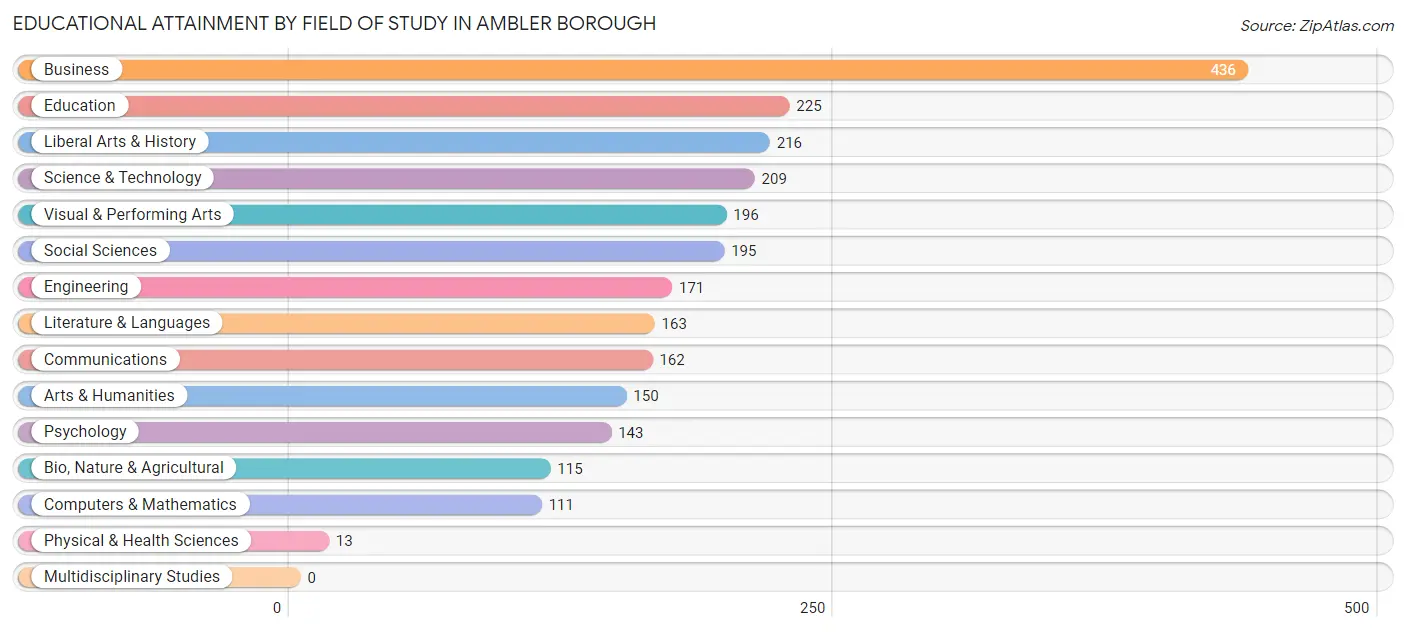
Educational Attainment by Field of Study in Ambler borough
Business (436 | 17.4%), education (225 | 9.0%), liberal arts & history (216 | 8.6%), science & technology (209 | 8.3%), and visual & performing arts (196 | 7.8%) are the most common fields of study among 2,505 individuals in Ambler borough who have obtained a bachelor's degree or higher.
| Field of Study | # Graduates | % Graduates |
| Computers & Mathematics | 111 | 4.4% |
| Bio, Nature & Agricultural | 115 | 4.6% |
| Physical & Health Sciences | 13 | 0.5% |
| Psychology | 143 | 5.7% |
| Social Sciences | 195 | 7.8% |
| Engineering | 171 | 6.8% |
| Multidisciplinary Studies | 0 | 0.0% |
| Science & Technology | 209 | 8.3% |
| Business | 436 | 17.4% |
| Education | 225 | 9.0% |
| Literature & Languages | 163 | 6.5% |
| Liberal Arts & History | 216 | 8.6% |
| Visual & Performing Arts | 196 | 7.8% |
| Communications | 162 | 6.5% |
| Arts & Humanities | 150 | 6.0% |
| Total | 2,505 | 100.0% |
Transportation & Commute in Ambler borough
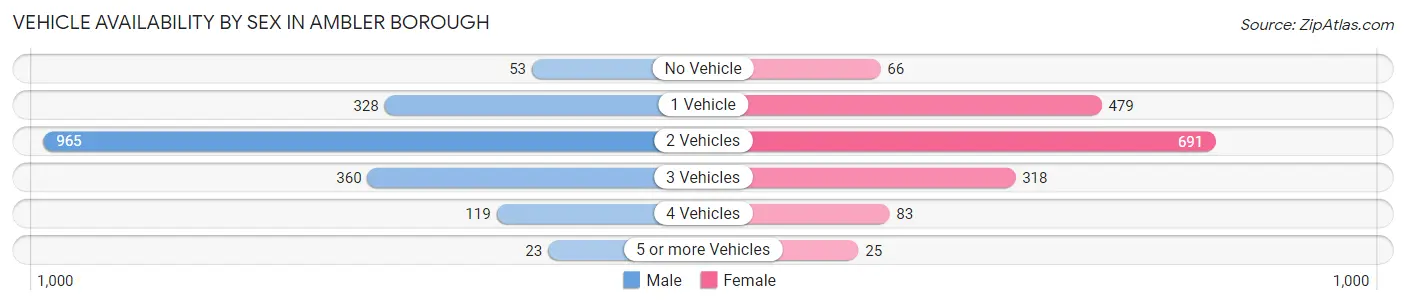
Vehicle Availability by Sex in Ambler borough
The most prevalent vehicle ownership categories in Ambler borough are males with 2 vehicles (965, accounting for 52.2%) and females with 2 vehicles (691, making up 58.1%).
| Vehicles Available | Male | Female |
| No Vehicle | 53 (2.9%) | 66 (4.0%) |
| 1 Vehicle | 328 (17.7%) | 479 (28.8%) |
| 2 Vehicles | 965 (52.2%) | 691 (41.6%) |
| 3 Vehicles | 360 (19.5%) | 318 (19.1%) |
| 4 Vehicles | 119 (6.4%) | 83 (5.0%) |
| 5 or more Vehicles | 23 (1.2%) | 25 (1.5%) |
| Total | 1,848 (100.0%) | 1,662 (100.0%) |
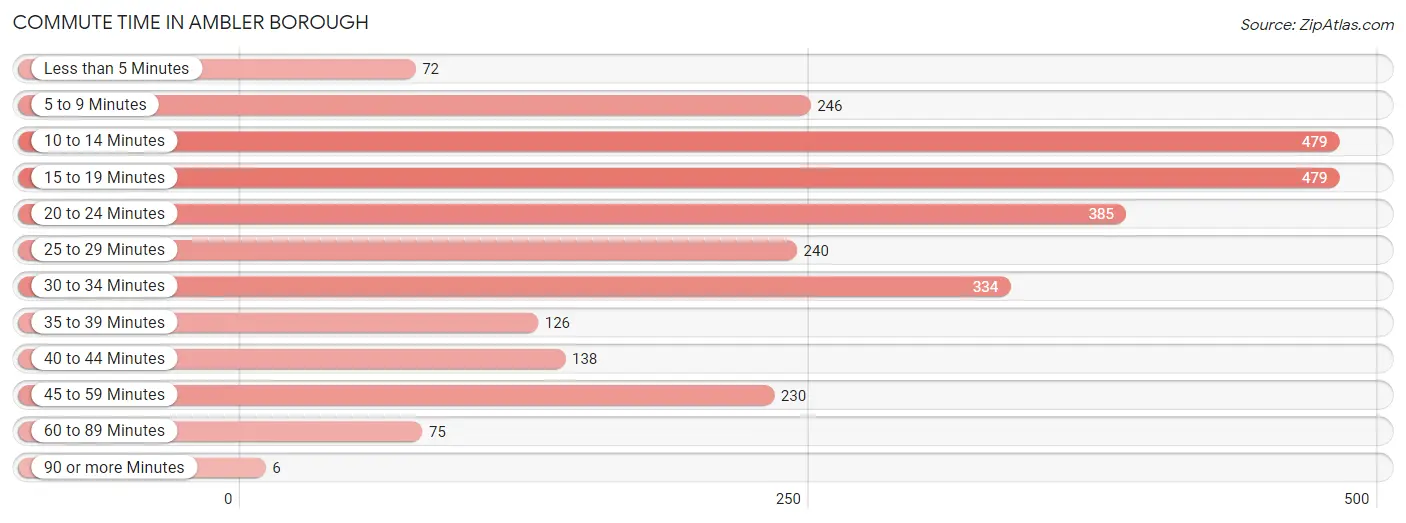
Commute Time in Ambler borough
The most frequently occuring commute durations in Ambler borough are 10 to 14 minutes (479 commuters, 17.1%), 15 to 19 minutes (479 commuters, 17.1%), and 20 to 24 minutes (385 commuters, 13.7%).
| Commute Time | # Commuters | % Commuters |
| Less than 5 Minutes | 72 | 2.6% |
| 5 to 9 Minutes | 246 | 8.7% |
| 10 to 14 Minutes | 479 | 17.1% |
| 15 to 19 Minutes | 479 | 17.1% |
| 20 to 24 Minutes | 385 | 13.7% |
| 25 to 29 Minutes | 240 | 8.5% |
| 30 to 34 Minutes | 334 | 11.9% |
| 35 to 39 Minutes | 126 | 4.5% |
| 40 to 44 Minutes | 138 | 4.9% |
| 45 to 59 Minutes | 230 | 8.2% |
| 60 to 89 Minutes | 75 | 2.7% |
| 90 or more Minutes | 6 | 0.2% |
Commute Time by Sex in Ambler borough
The most common commute times in Ambler borough are 20 to 24 minutes (279 commuters, 19.6%) for males and 10 to 14 minutes (298 commuters, 21.5%) for females.
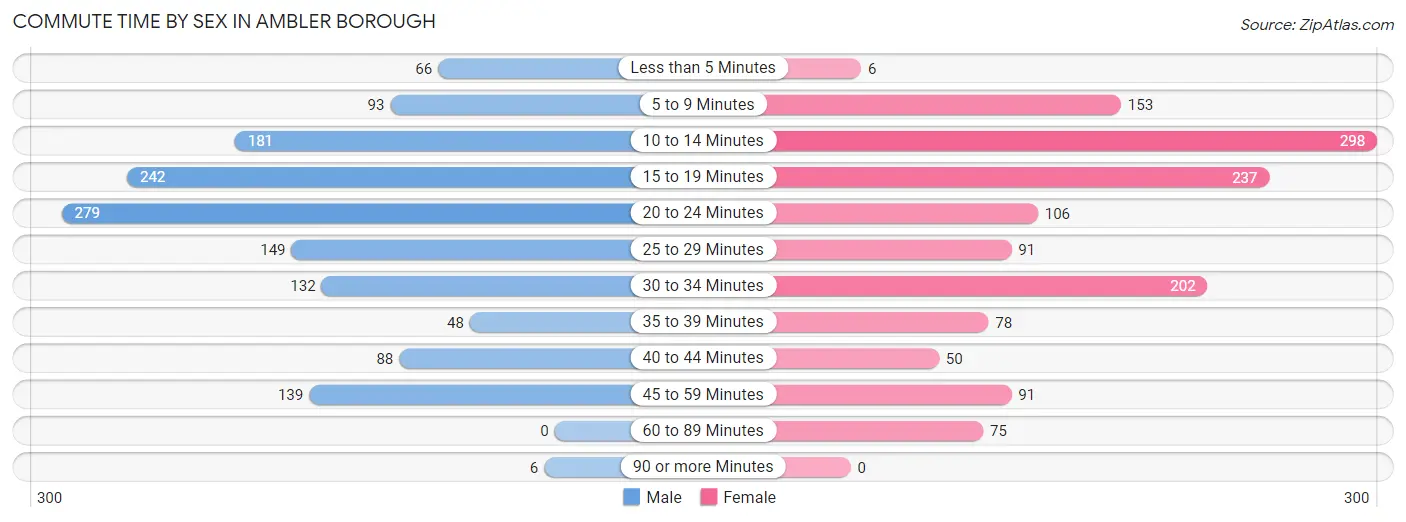
| Commute Time | Male | Female |
| Less than 5 Minutes | 66 (4.6%) | 6 (0.4%) |
| 5 to 9 Minutes | 93 (6.5%) | 153 (11.0%) |
| 10 to 14 Minutes | 181 (12.7%) | 298 (21.5%) |
| 15 to 19 Minutes | 242 (17.0%) | 237 (17.1%) |
| 20 to 24 Minutes | 279 (19.6%) | 106 (7.6%) |
| 25 to 29 Minutes | 149 (10.5%) | 91 (6.6%) |
| 30 to 34 Minutes | 132 (9.3%) | 202 (14.6%) |
| 35 to 39 Minutes | 48 (3.4%) | 78 (5.6%) |
| 40 to 44 Minutes | 88 (6.2%) | 50 (3.6%) |
| 45 to 59 Minutes | 139 (9.8%) | 91 (6.6%) |
| 60 to 89 Minutes | 0 (0.0%) | 75 (5.4%) |
| 90 or more Minutes | 6 (0.4%) | 0 (0.0%) |
Time of Departure to Work by Sex in Ambler borough
The most frequent times of departure to work in Ambler borough are 7:30 AM to 7:59 AM (272, 19.1%) for males and 7:00 AM to 7:29 AM (308, 22.2%) for females.
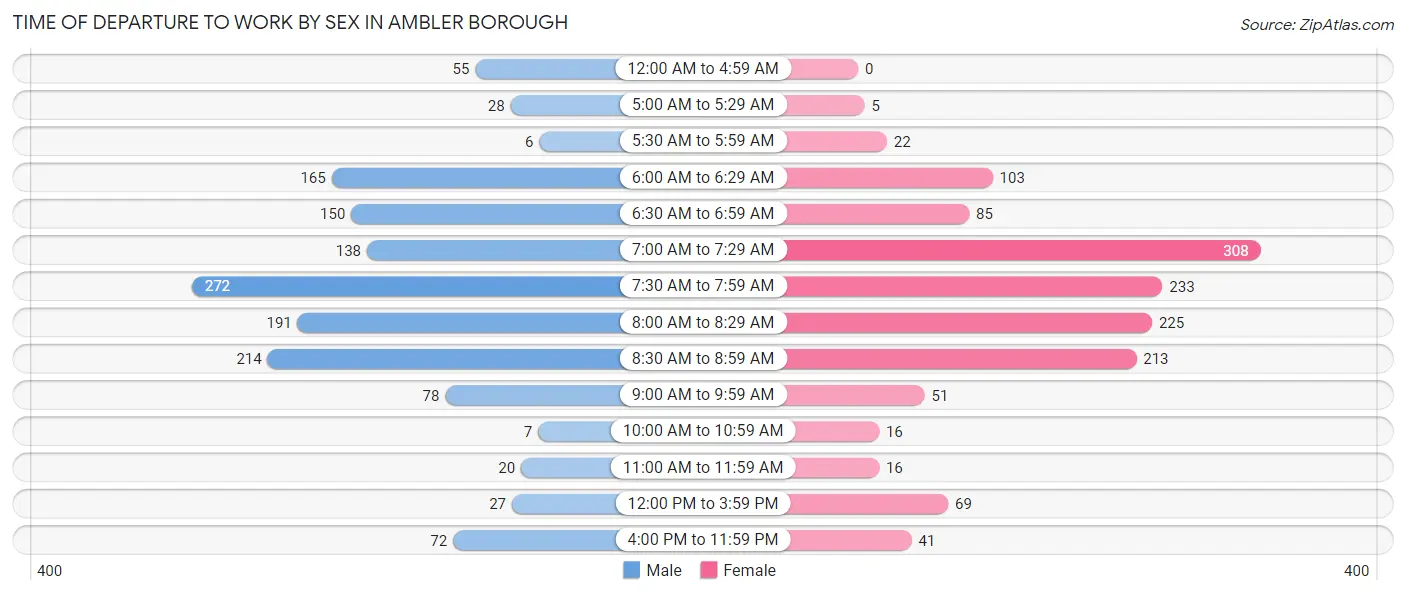
| Time of Departure | Male | Female |
| 12:00 AM to 4:59 AM | 55 (3.9%) | 0 (0.0%) |
| 5:00 AM to 5:29 AM | 28 (2.0%) | 5 (0.4%) |
| 5:30 AM to 5:59 AM | 6 (0.4%) | 22 (1.6%) |
| 6:00 AM to 6:29 AM | 165 (11.6%) | 103 (7.4%) |
| 6:30 AM to 6:59 AM | 150 (10.5%) | 85 (6.1%) |
| 7:00 AM to 7:29 AM | 138 (9.7%) | 308 (22.2%) |
| 7:30 AM to 7:59 AM | 272 (19.1%) | 233 (16.8%) |
| 8:00 AM to 8:29 AM | 191 (13.4%) | 225 (16.2%) |
| 8:30 AM to 8:59 AM | 214 (15.0%) | 213 (15.4%) |
| 9:00 AM to 9:59 AM | 78 (5.5%) | 51 (3.7%) |
| 10:00 AM to 10:59 AM | 7 (0.5%) | 16 (1.1%) |
| 11:00 AM to 11:59 AM | 20 (1.4%) | 16 (1.1%) |
| 12:00 PM to 3:59 PM | 27 (1.9%) | 69 (5.0%) |
| 4:00 PM to 11:59 PM | 72 (5.1%) | 41 (3.0%) |
| Total | 1,423 (100.0%) | 1,387 (100.0%) |
Housing Occupancy in Ambler borough
Occupancy by Ownership in Ambler borough
Of the total 2,655 dwellings in Ambler borough, owner-occupied units account for 1,353 (51.0%), while renter-occupied units make up 1,302 (49.0%).
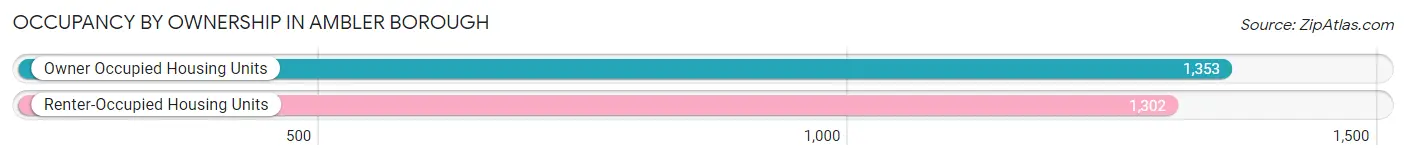
| Occupancy | # Housing Units | % Housing Units |
| Owner Occupied Housing Units | 1,353 | 51.0% |
| Renter-Occupied Housing Units | 1,302 | 49.0% |
| Total Occupied Housing Units | 2,655 | 100.0% |
Occupancy by Household Size in Ambler borough
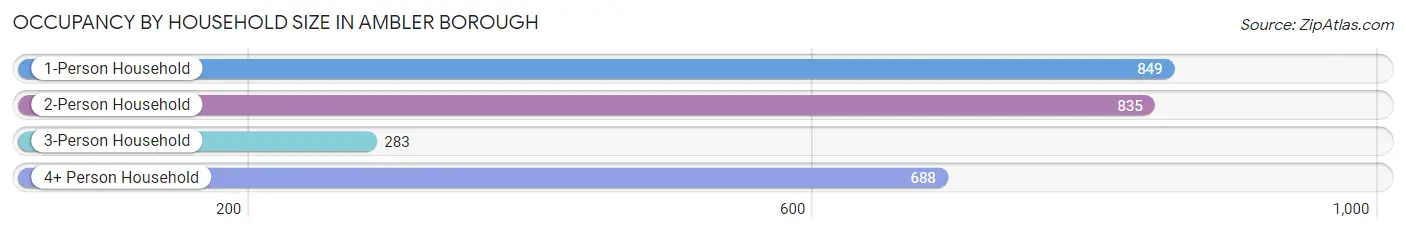
| Household Size | # Housing Units | % Housing Units |
| 1-Person Household | 849 | 32.0% |
| 2-Person Household | 835 | 31.5% |
| 3-Person Household | 283 | 10.7% |
| 4+ Person Household | 688 | 25.9% |
| Total Housing Units | 2,655 | 100.0% |
Occupancy by Ownership by Household Size in Ambler borough
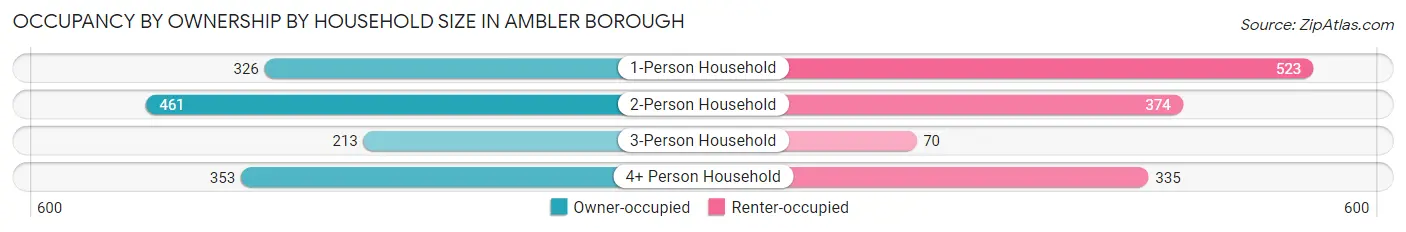
| Household Size | Owner-occupied | Renter-occupied |
| 1-Person Household | 326 (38.4%) | 523 (61.6%) |
| 2-Person Household | 461 (55.2%) | 374 (44.8%) |
| 3-Person Household | 213 (75.3%) | 70 (24.7%) |
| 4+ Person Household | 353 (51.3%) | 335 (48.7%) |
| Total Housing Units | 1,353 (51.0%) | 1,302 (49.0%) |
Occupancy by Educational Attainment in Ambler borough
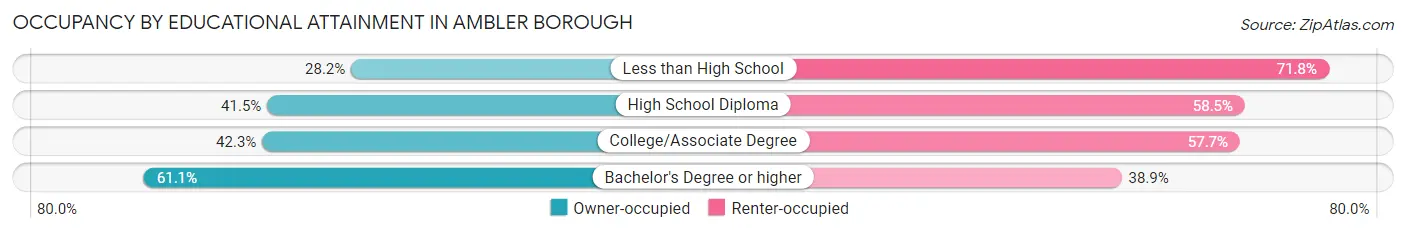
| Household Size | Owner-occupied | Renter-occupied |
| Less than High School | 11 (28.2%) | 28 (71.8%) |
| High School Diploma | 245 (41.5%) | 345 (58.5%) |
| College/Associate Degree | 317 (42.3%) | 432 (57.7%) |
| Bachelor's Degree or higher | 780 (61.1%) | 497 (38.9%) |
Occupancy by Age of Householder in Ambler borough
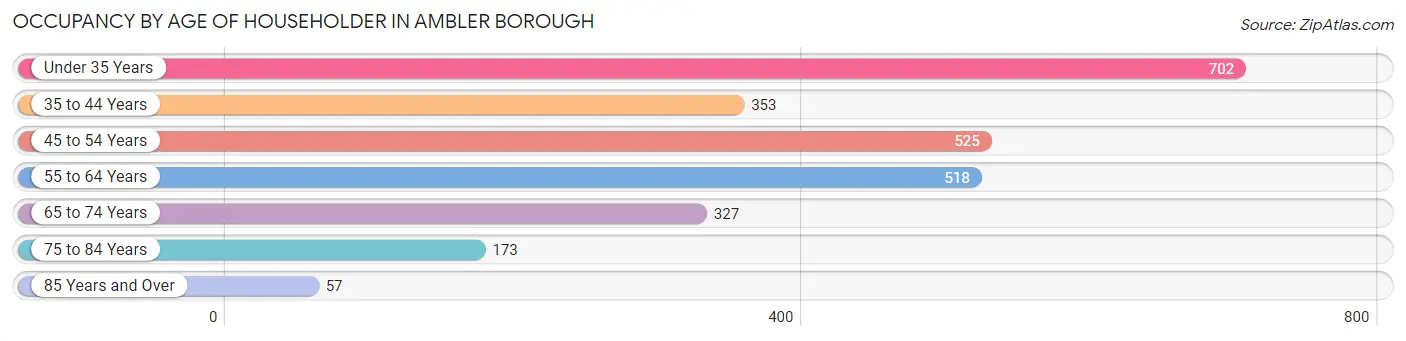
| Age Bracket | # Households | % Households |
| Under 35 Years | 702 | 26.4% |
| 35 to 44 Years | 353 | 13.3% |
| 45 to 54 Years | 525 | 19.8% |
| 55 to 64 Years | 518 | 19.5% |
| 65 to 74 Years | 327 | 12.3% |
| 75 to 84 Years | 173 | 6.5% |
| 85 Years and Over | 57 | 2.1% |
| Total | 2,655 | 100.0% |
Housing Finances in Ambler borough
Median Income by Occupancy in Ambler borough
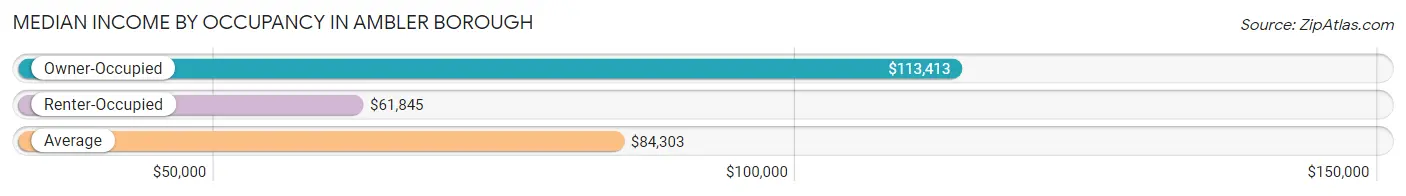
| Occupancy Type | # Households | Median Income |
| Owner-Occupied | 1,353 (51.0%) | $113,413 |
| Renter-Occupied | 1,302 (49.0%) | $61,845 |
| Average | 2,655 (100.0%) | $84,303 |
Occupancy by Householder Income Bracket in Ambler borough
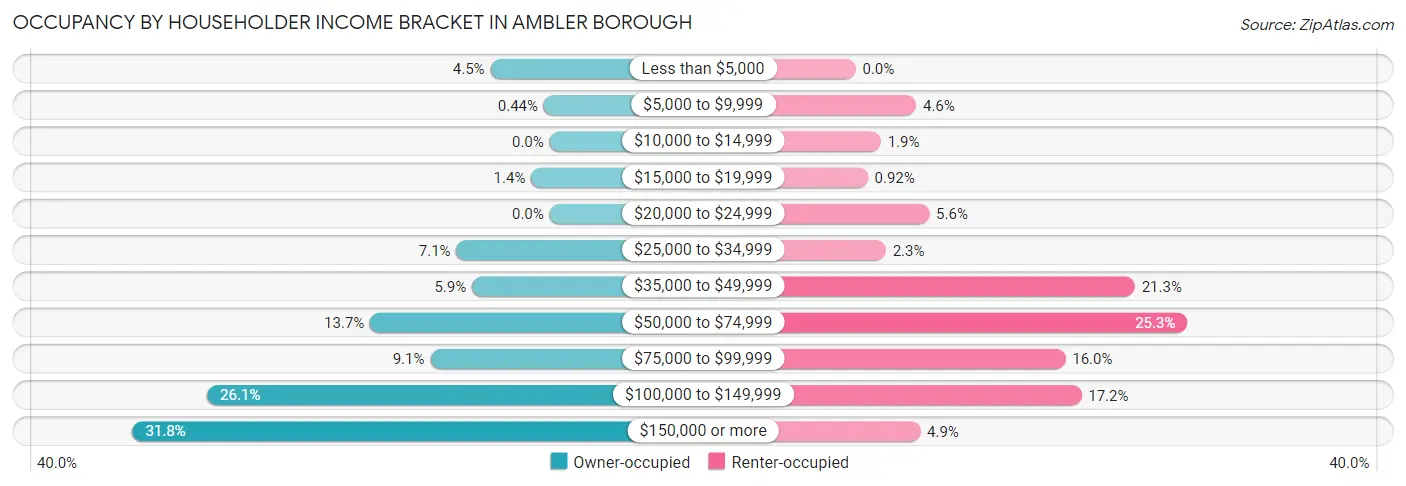
| Income Bracket | Owner-occupied | Renter-occupied |
| Less than $5,000 | 61 (4.5%) | 0 (0.0%) |
| $5,000 to $9,999 | 6 (0.4%) | 60 (4.6%) |
| $10,000 to $14,999 | 0 (0.0%) | 25 (1.9%) |
| $15,000 to $19,999 | 19 (1.4%) | 12 (0.9%) |
| $20,000 to $24,999 | 0 (0.0%) | 73 (5.6%) |
| $25,000 to $34,999 | 96 (7.1%) | 30 (2.3%) |
| $35,000 to $49,999 | 80 (5.9%) | 277 (21.3%) |
| $50,000 to $74,999 | 185 (13.7%) | 329 (25.3%) |
| $75,000 to $99,999 | 123 (9.1%) | 208 (16.0%) |
| $100,000 to $149,999 | 353 (26.1%) | 224 (17.2%) |
| $150,000 or more | 430 (31.8%) | 64 (4.9%) |
| Total | 1,353 (100.0%) | 1,302 (100.0%) |
Monthly Housing Cost Tiers in Ambler borough
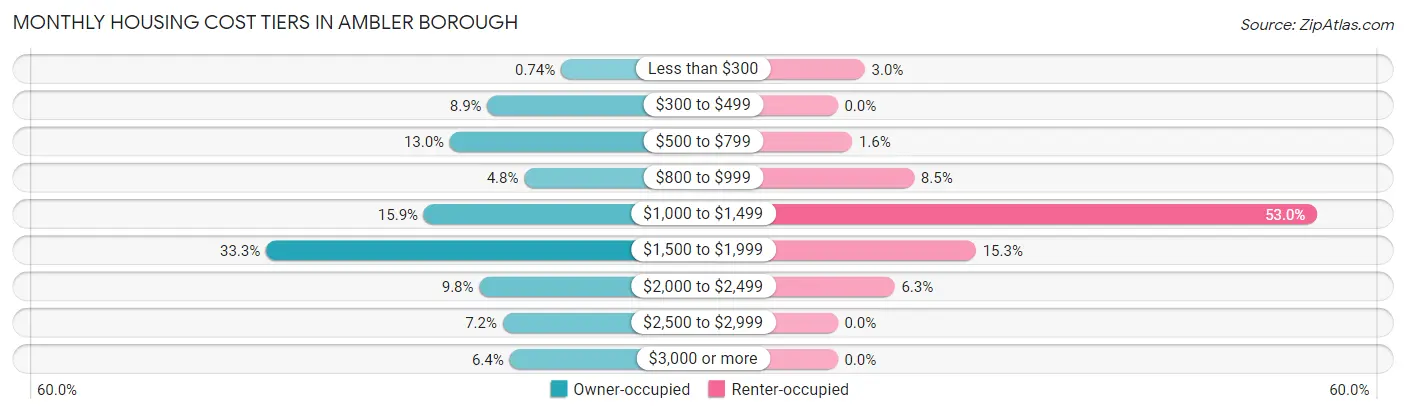
| Monthly Cost | Owner-occupied | Renter-occupied |
| Less than $300 | 10 (0.7%) | 39 (3.0%) |
| $300 to $499 | 120 (8.9%) | 0 (0.0%) |
| $500 to $799 | 176 (13.0%) | 21 (1.6%) |
| $800 to $999 | 65 (4.8%) | 110 (8.5%) |
| $1,000 to $1,499 | 215 (15.9%) | 690 (53.0%) |
| $1,500 to $1,999 | 451 (33.3%) | 199 (15.3%) |
| $2,000 to $2,499 | 132 (9.8%) | 82 (6.3%) |
| $2,500 to $2,999 | 97 (7.2%) | 0 (0.0%) |
| $3,000 or more | 87 (6.4%) | 0 (0.0%) |
| Total | 1,353 (100.0%) | 1,302 (100.0%) |
Physical Housing Characteristics in Ambler borough
Housing Structures in Ambler borough
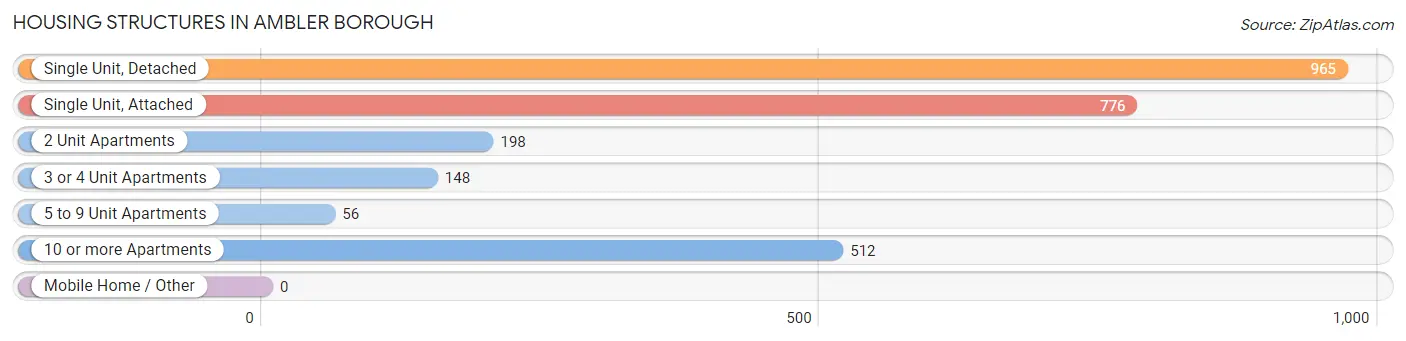
| Structure Type | # Housing Units | % Housing Units |
| Single Unit, Detached | 965 | 36.3% |
| Single Unit, Attached | 776 | 29.2% |
| 2 Unit Apartments | 198 | 7.5% |
| 3 or 4 Unit Apartments | 148 | 5.6% |
| 5 to 9 Unit Apartments | 56 | 2.1% |
| 10 or more Apartments | 512 | 19.3% |
| Mobile Home / Other | 0 | 0.0% |
| Total | 2,655 | 100.0% |
Housing Structures by Occupancy in Ambler borough
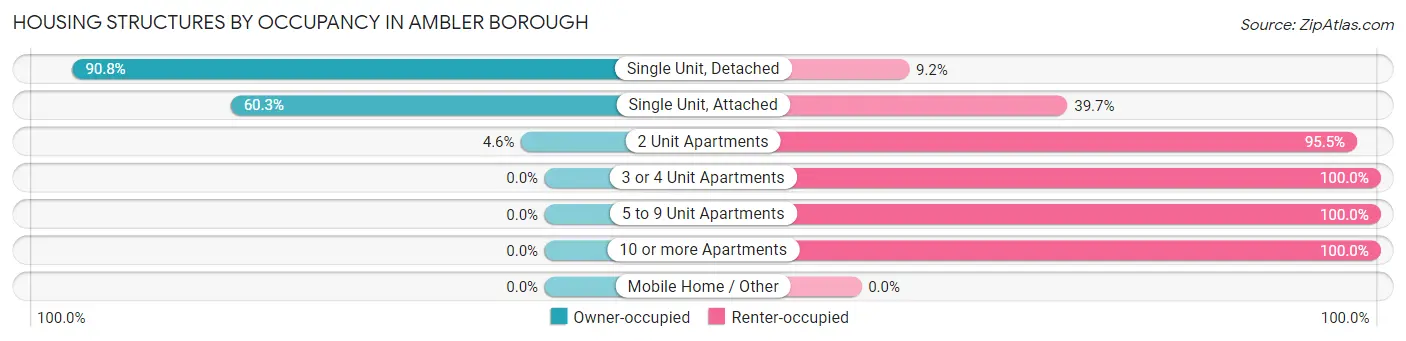
| Structure Type | Owner-occupied | Renter-occupied |
| Single Unit, Detached | 876 (90.8%) | 89 (9.2%) |
| Single Unit, Attached | 468 (60.3%) | 308 (39.7%) |
| 2 Unit Apartments | 9 (4.5%) | 189 (95.5%) |
| 3 or 4 Unit Apartments | 0 (0.0%) | 148 (100.0%) |
| 5 to 9 Unit Apartments | 0 (0.0%) | 56 (100.0%) |
| 10 or more Apartments | 0 (0.0%) | 512 (100.0%) |
| Mobile Home / Other | 0 (0.0%) | 0 (0.0%) |
| Total | 1,353 (51.0%) | 1,302 (49.0%) |
Housing Structures by Number of Rooms in Ambler borough
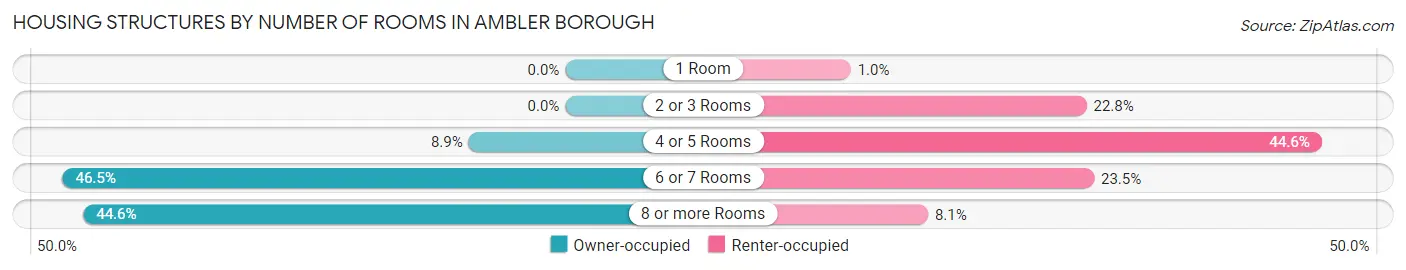
| Number of Rooms | Owner-occupied | Renter-occupied |
| 1 Room | 0 (0.0%) | 13 (1.0%) |
| 2 or 3 Rooms | 0 (0.0%) | 297 (22.8%) |
| 4 or 5 Rooms | 121 (8.9%) | 580 (44.6%) |
| 6 or 7 Rooms | 629 (46.5%) | 306 (23.5%) |
| 8 or more Rooms | 603 (44.6%) | 106 (8.1%) |
| Total | 1,353 (100.0%) | 1,302 (100.0%) |
Housing Structure by Heating Type in Ambler borough
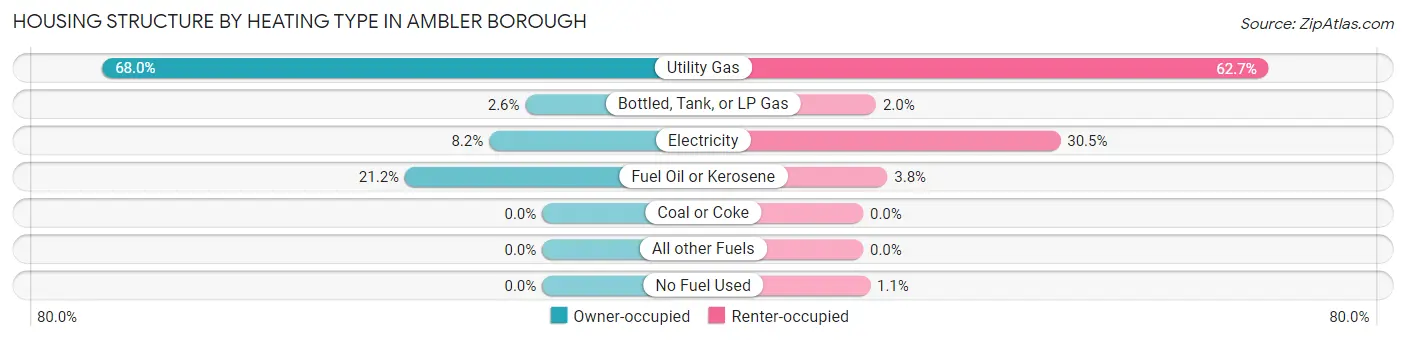
| Heating Type | Owner-occupied | Renter-occupied |
| Utility Gas | 920 (68.0%) | 816 (62.7%) |
| Bottled, Tank, or LP Gas | 35 (2.6%) | 26 (2.0%) |
| Electricity | 111 (8.2%) | 397 (30.5%) |
| Fuel Oil or Kerosene | 287 (21.2%) | 49 (3.8%) |
| Coal or Coke | 0 (0.0%) | 0 (0.0%) |
| All other Fuels | 0 (0.0%) | 0 (0.0%) |
| No Fuel Used | 0 (0.0%) | 14 (1.1%) |
| Total | 1,353 (100.0%) | 1,302 (100.0%) |
Household Vehicle Usage in Ambler borough
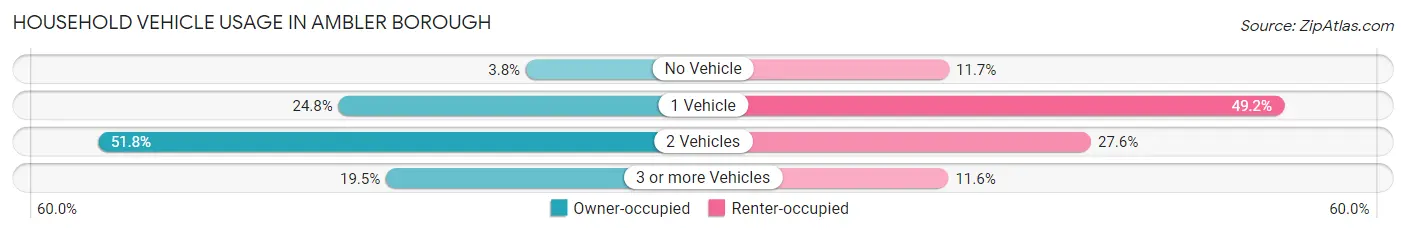
| Vehicles per Household | Owner-occupied | Renter-occupied |
| No Vehicle | 52 (3.8%) | 152 (11.7%) |
| 1 Vehicle | 336 (24.8%) | 640 (49.2%) |
| 2 Vehicles | 701 (51.8%) | 359 (27.6%) |
| 3 or more Vehicles | 264 (19.5%) | 151 (11.6%) |
| Total | 1,353 (100.0%) | 1,302 (100.0%) |
Real Estate & Mortgages in Ambler borough
Real Estate and Mortgage Overview in Ambler borough
| Characteristic | Without Mortgage | With Mortgage |
| Housing Units | 378 | 975 |
| Median Property Value | $298,100 | $334,600 |
| Median Household Income | $62,267 | $396 |
| Monthly Housing Costs | $564 | $87 |
| Real Estate Taxes | $2,508 | $18 |
Property Value by Mortgage Status in Ambler borough
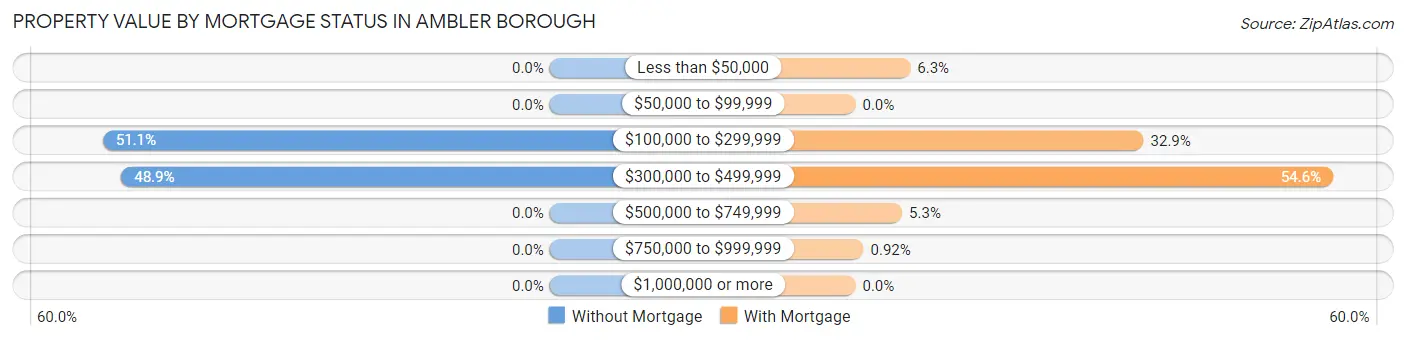
| Property Value | Without Mortgage | With Mortgage |
| Less than $50,000 | 0 (0.0%) | 61 (6.3%) |
| $50,000 to $99,999 | 0 (0.0%) | 0 (0.0%) |
| $100,000 to $299,999 | 193 (51.1%) | 321 (32.9%) |
| $300,000 to $499,999 | 185 (48.9%) | 532 (54.6%) |
| $500,000 to $749,999 | 0 (0.0%) | 52 (5.3%) |
| $750,000 to $999,999 | 0 (0.0%) | 9 (0.9%) |
| $1,000,000 or more | 0 (0.0%) | 0 (0.0%) |
| Total | 378 (100.0%) | 975 (100.0%) |
Household Income by Mortgage Status in Ambler borough
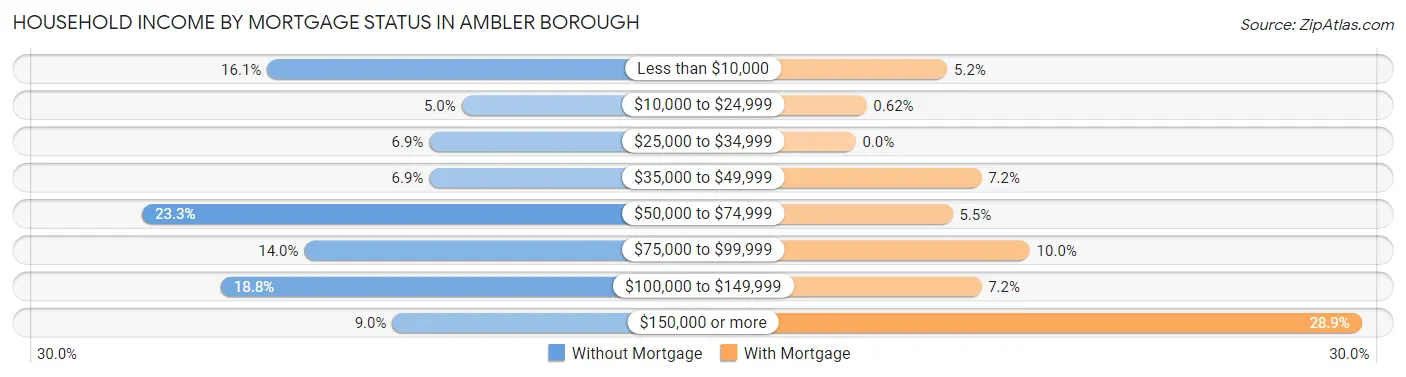
| Household Income | Without Mortgage | With Mortgage |
| Less than $10,000 | 61 (16.1%) | 51 (5.2%) |
| $10,000 to $24,999 | 19 (5.0%) | 6 (0.6%) |
| $25,000 to $34,999 | 26 (6.9%) | 0 (0.0%) |
| $35,000 to $49,999 | 26 (6.9%) | 70 (7.2%) |
| $50,000 to $74,999 | 88 (23.3%) | 54 (5.5%) |
| $75,000 to $99,999 | 53 (14.0%) | 97 (10.0%) |
| $100,000 to $149,999 | 71 (18.8%) | 70 (7.2%) |
| $150,000 or more | 34 (9.0%) | 282 (28.9%) |
| Total | 378 (100.0%) | 975 (100.0%) |
Property Value to Household Income Ratio in Ambler borough
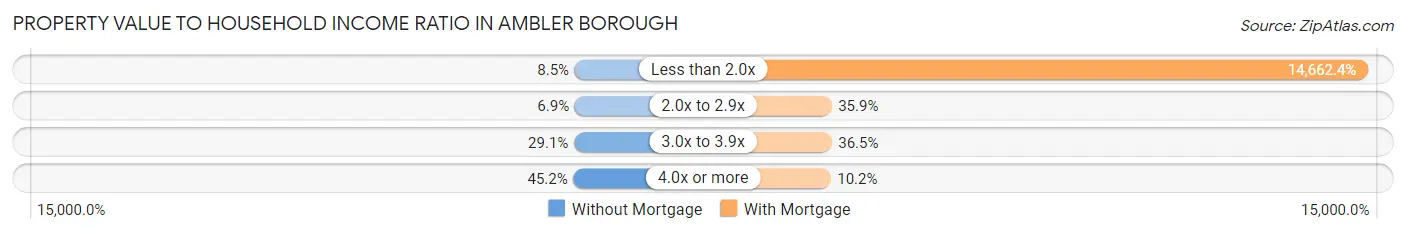
| Value-to-Income Ratio | Without Mortgage | With Mortgage |
| Less than 2.0x | 32 (8.5%) | 142,958 (14,662.4%) |
| 2.0x to 2.9x | 26 (6.9%) | 350 (35.9%) |
| 3.0x to 3.9x | 110 (29.1%) | 356 (36.5%) |
| 4.0x or more | 171 (45.2%) | 99 (10.2%) |
| Total | 378 (100.0%) | 975 (100.0%) |
Real Estate Taxes by Mortgage Status in Ambler borough
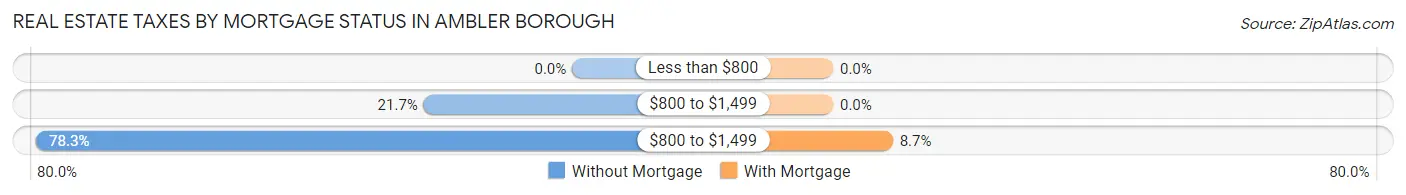
| Property Taxes | Without Mortgage | With Mortgage |
| Less than $800 | 0 (0.0%) | 0 (0.0%) |
| $800 to $1,499 | 82 (21.7%) | 0 (0.0%) |
| $800 to $1,499 | 296 (78.3%) | 85 (8.7%) |
| Total | 378 (100.0%) | 975 (100.0%) |
Health & Disability in Ambler borough
Health Insurance Coverage by Age in Ambler borough
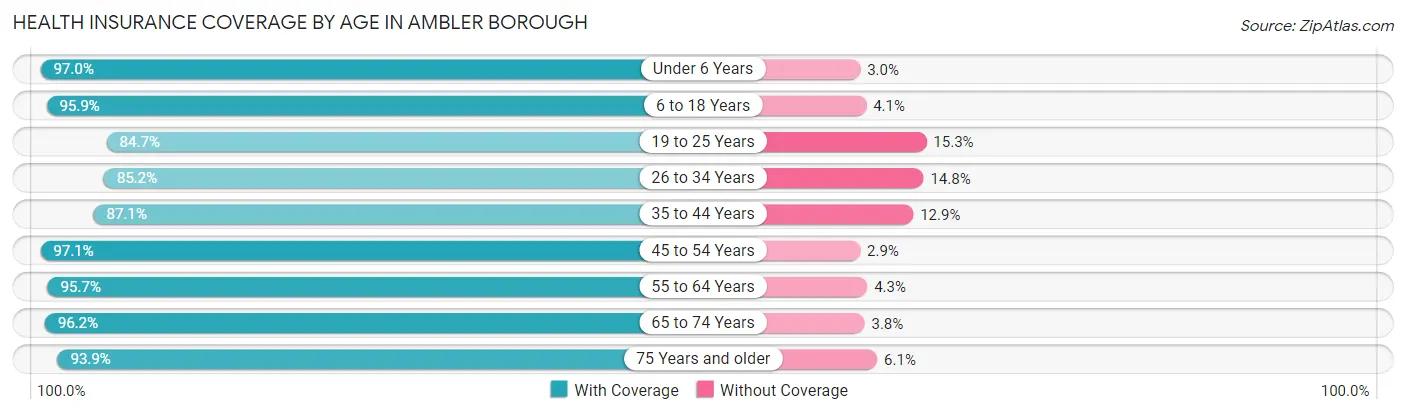
| Age Bracket | With Coverage | Without Coverage |
| Under 6 Years | 424 (97.0%) | 13 (3.0%) |
| 6 to 18 Years | 1,200 (95.9%) | 51 (4.1%) |
| 19 to 25 Years | 332 (84.7%) | 60 (15.3%) |
| 26 to 34 Years | 975 (85.2%) | 169 (14.8%) |
| 35 to 44 Years | 691 (87.1%) | 102 (12.9%) |
| 45 to 54 Years | 892 (97.1%) | 27 (2.9%) |
| 55 to 64 Years | 763 (95.7%) | 34 (4.3%) |
| 65 to 74 Years | 483 (96.2%) | 19 (3.8%) |
| 75 Years and older | 291 (93.9%) | 19 (6.1%) |
| Total | 6,051 (92.4%) | 494 (7.5%) |
Health Insurance Coverage by Citizenship Status in Ambler borough
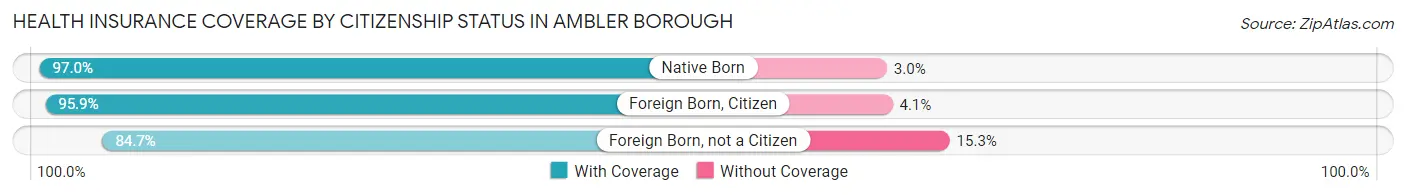
| Citizenship Status | With Coverage | Without Coverage |
| Native Born | 424 (97.0%) | 13 (3.0%) |
| Foreign Born, Citizen | 1,200 (95.9%) | 51 (4.1%) |
| Foreign Born, not a Citizen | 332 (84.7%) | 60 (15.3%) |
Health Insurance Coverage by Household Income in Ambler borough
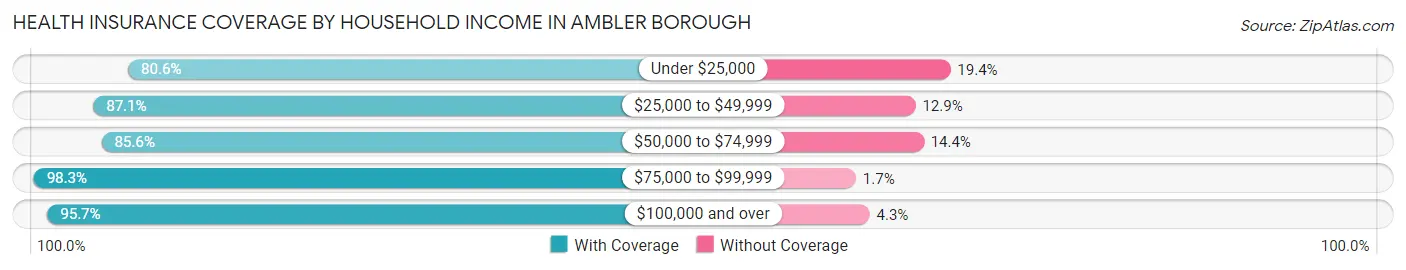
| Household Income | With Coverage | Without Coverage |
| Under $25,000 | 299 (80.6%) | 72 (19.4%) |
| $25,000 to $49,999 | 948 (87.1%) | 140 (12.9%) |
| $50,000 to $74,999 | 778 (85.6%) | 131 (14.4%) |
| $75,000 to $99,999 | 976 (98.3%) | 17 (1.7%) |
| $100,000 and over | 3,004 (95.7%) | 134 (4.3%) |
Public vs Private Health Insurance Coverage by Age in Ambler borough
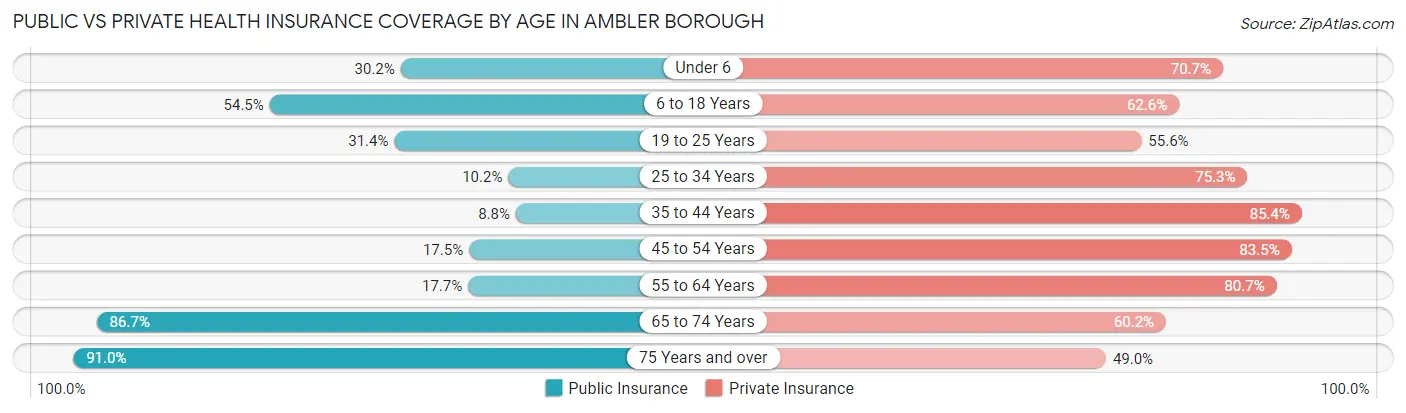
| Age Bracket | Public Insurance | Private Insurance |
| Under 6 | 132 (30.2%) | 309 (70.7%) |
| 6 to 18 Years | 682 (54.5%) | 783 (62.6%) |
| 19 to 25 Years | 123 (31.4%) | 218 (55.6%) |
| 25 to 34 Years | 117 (10.2%) | 861 (75.3%) |
| 35 to 44 Years | 70 (8.8%) | 677 (85.4%) |
| 45 to 54 Years | 161 (17.5%) | 767 (83.5%) |
| 55 to 64 Years | 141 (17.7%) | 643 (80.7%) |
| 65 to 74 Years | 435 (86.7%) | 302 (60.2%) |
| 75 Years and over | 282 (91.0%) | 152 (49.0%) |
| Total | 2,143 (32.7%) | 4,712 (72.0%) |
Disability Status by Sex by Age in Ambler borough
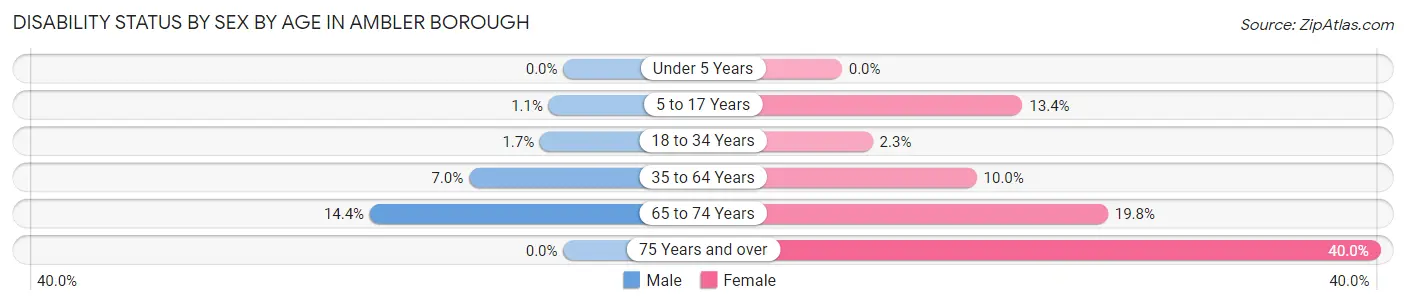
| Age Bracket | Male | Female |
| Under 5 Years | 0 (0.0%) | 0 (0.0%) |
| 5 to 17 Years | 9 (1.1%) | 46 (13.4%) |
| 18 to 34 Years | 15 (1.7%) | 18 (2.3%) |
| 35 to 64 Years | 82 (7.0%) | 134 (10.0%) |
| 65 to 74 Years | 27 (14.4%) | 62 (19.8%) |
| 75 Years and over | 0 (0.0%) | 72 (40.0%) |
Disability Class by Sex by Age in Ambler borough
Disability Class: Hearing Difficulty
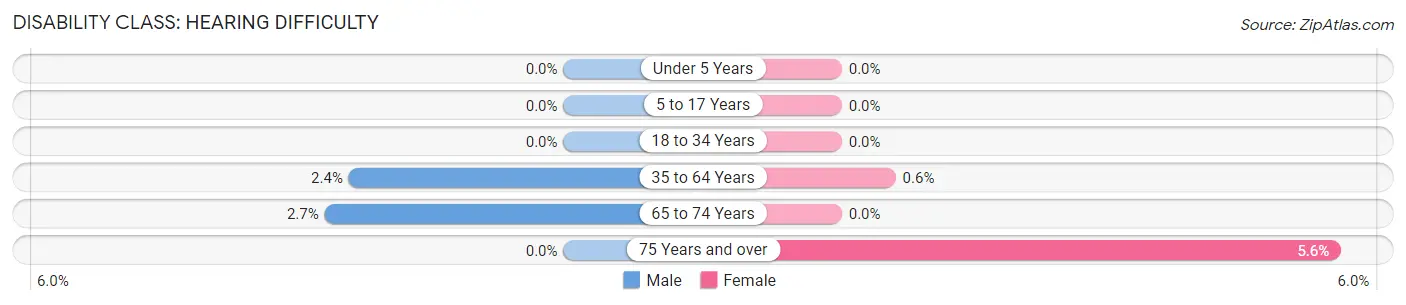
| Age Bracket | Male | Female |
| Under 5 Years | 0 (0.0%) | 0 (0.0%) |
| 5 to 17 Years | 0 (0.0%) | 0 (0.0%) |
| 18 to 34 Years | 0 (0.0%) | 0 (0.0%) |
| 35 to 64 Years | 28 (2.4%) | 8 (0.6%) |
| 65 to 74 Years | 5 (2.7%) | 0 (0.0%) |
| 75 Years and over | 0 (0.0%) | 10 (5.6%) |
Disability Class: Vision Difficulty
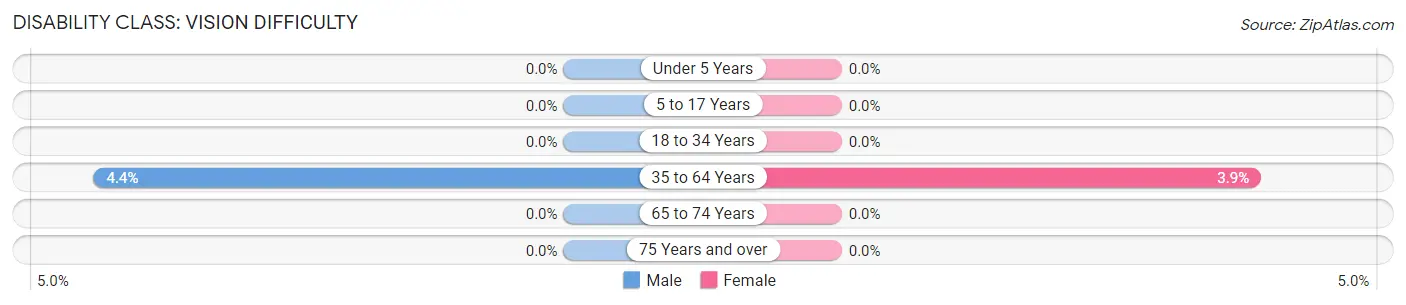
| Age Bracket | Male | Female |
| Under 5 Years | 0 (0.0%) | 0 (0.0%) |
| 5 to 17 Years | 0 (0.0%) | 0 (0.0%) |
| 18 to 34 Years | 0 (0.0%) | 0 (0.0%) |
| 35 to 64 Years | 51 (4.4%) | 52 (3.9%) |
| 65 to 74 Years | 0 (0.0%) | 0 (0.0%) |
| 75 Years and over | 0 (0.0%) | 0 (0.0%) |
Disability Class: Cognitive Difficulty
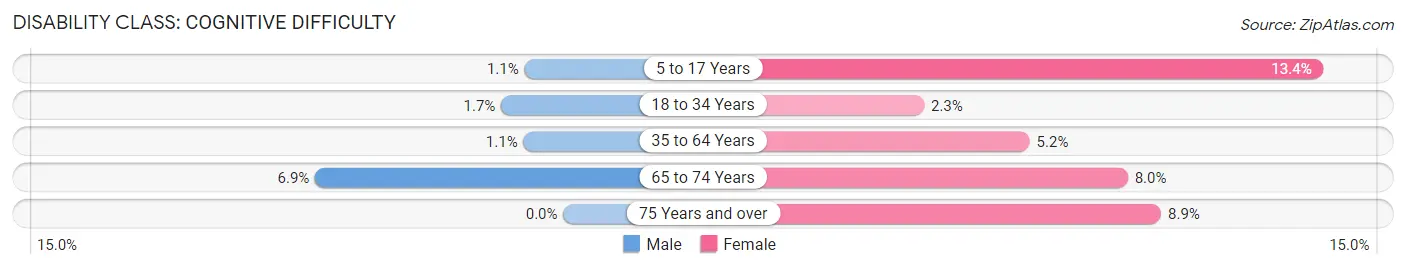
| Age Bracket | Male | Female |
| 5 to 17 Years | 9 (1.1%) | 46 (13.4%) |
| 18 to 34 Years | 15 (1.7%) | 18 (2.3%) |
| 35 to 64 Years | 13 (1.1%) | 70 (5.2%) |
| 65 to 74 Years | 13 (6.9%) | 25 (8.0%) |
| 75 Years and over | 0 (0.0%) | 16 (8.9%) |
Disability Class: Ambulatory Difficulty
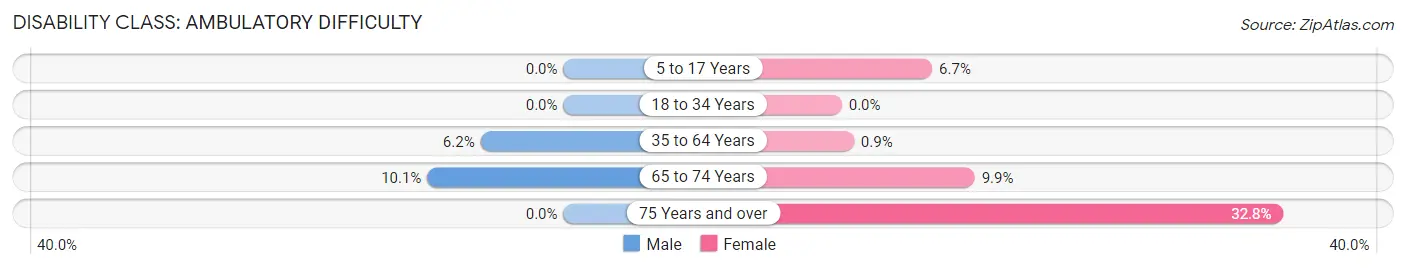
| Age Bracket | Male | Female |
| 5 to 17 Years | 0 (0.0%) | 23 (6.7%) |
| 18 to 34 Years | 0 (0.0%) | 0 (0.0%) |
| 35 to 64 Years | 72 (6.1%) | 12 (0.9%) |
| 65 to 74 Years | 19 (10.1%) | 31 (9.9%) |
| 75 Years and over | 0 (0.0%) | 59 (32.8%) |
Disability Class: Self-Care Difficulty
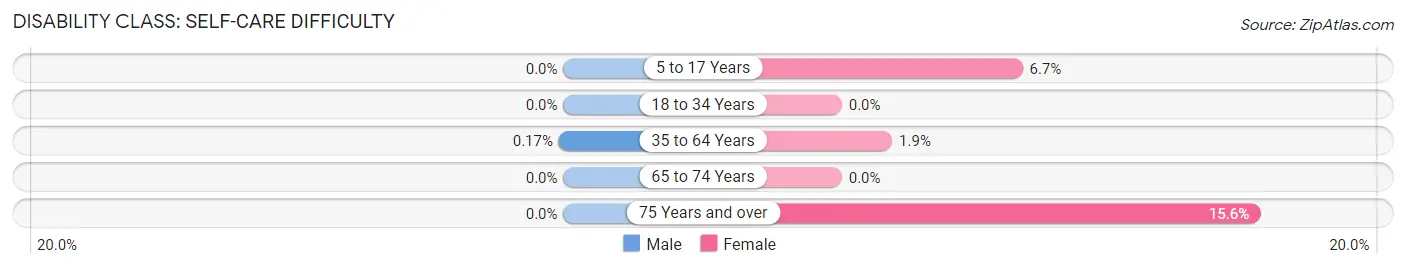
| Age Bracket | Male | Female |
| 5 to 17 Years | 0 (0.0%) | 23 (6.7%) |
| 18 to 34 Years | 0 (0.0%) | 0 (0.0%) |
| 35 to 64 Years | 2 (0.2%) | 25 (1.9%) |
| 65 to 74 Years | 0 (0.0%) | 0 (0.0%) |
| 75 Years and over | 0 (0.0%) | 28 (15.6%) |
Technology Access in Ambler borough
Computing Device Access in Ambler borough
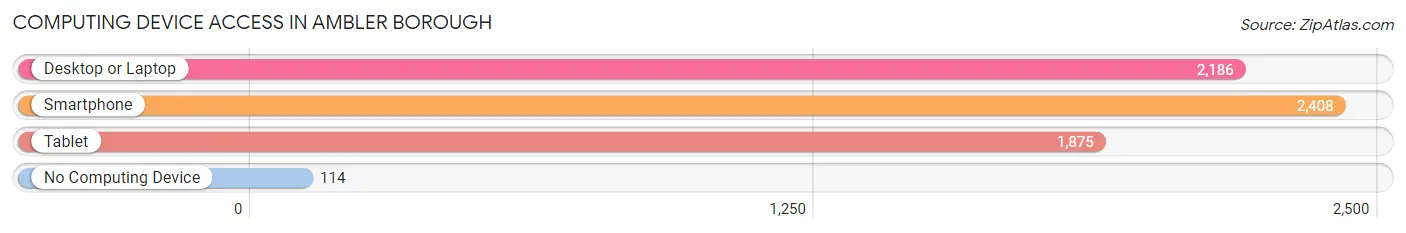
| Device Type | # Households | % Households |
| Desktop or Laptop | 2,186 | 82.3% |
| Smartphone | 2,408 | 90.7% |
| Tablet | 1,875 | 70.6% |
| No Computing Device | 114 | 4.3% |
| Total | 2,655 | 100.0% |
Internet Access in Ambler borough
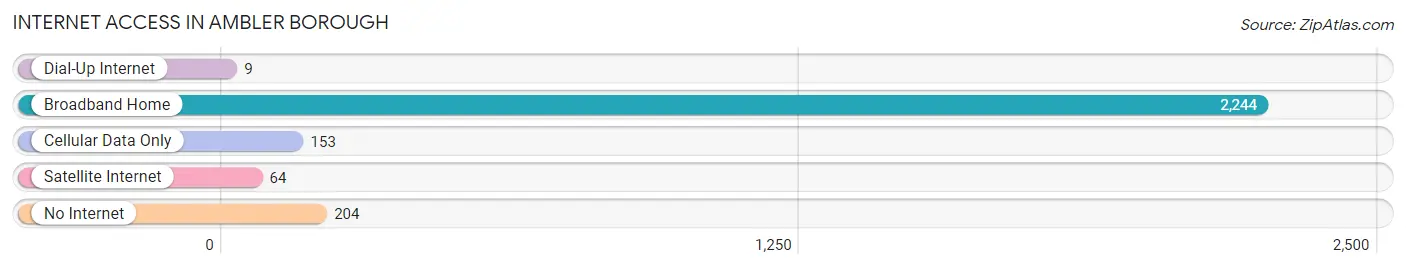
| Internet Type | # Households | % Households |
| Dial-Up Internet | 9 | 0.3% |
| Broadband Home | 2,244 | 84.5% |
| Cellular Data Only | 153 | 5.8% |
| Satellite Internet | 64 | 2.4% |
| No Internet | 204 | 7.7% |
| Total | 2,655 | 100.0% |
Ambler borough Summary
Ambler Borough is a small borough located in Montgomery County, Pennsylvania. It is situated approximately 20 miles north of Philadelphia and is part of the Philadelphia metropolitan area. The borough has a population of 6,500 people and covers an area of 1.2 square miles.
History
Ambler Borough was founded in 1869 by a group of Quakers who had moved to the area from Philadelphia. The borough was named after Mary Ambler, a Quaker woman who had been a leader in the local community. The borough was incorporated in 1887 and was the first borough in Montgomery County to be incorporated.
The borough was originally a rural farming community, but in the late 19th century, the North Pennsylvania Railroad began to run through the borough. This allowed for the development of industry and businesses in the area, and the borough began to grow. In the early 20th century, the borough was home to several factories, including a silk mill, a paper mill, and a brickyard.
Geography
Ambler Borough is located in southeastern Pennsylvania, approximately 20 miles north of Philadelphia. The borough is situated in the Wissahickon Valley, which is part of the larger Delaware Valley. The borough is bordered by Upper Dublin Township to the north, Whitpain Township to the east, Lower Gwynedd Township to the south, and Whitpain Township to the west.
The borough is mostly flat, with some rolling hills in the northern part of the borough. The borough is drained by the Wissahickon Creek, which flows through the borough from north to south. The borough is also home to several parks, including Ambler Park, which is located in the center of the borough.
Economy
Ambler Borough has a diverse economy, with a mix of businesses and industries. The borough is home to several large employers, including Merck & Co., a pharmaceutical company, and Wawa, a convenience store chain. The borough is also home to several small businesses, including restaurants, retail stores, and professional services.
The borough is also home to several educational institutions, including Ambler Campus of Temple University and Montgomery County Community College. The borough is also home to several healthcare facilities, including Abington Hospital and Holy Redeemer Hospital.
Demographics
As of the 2010 census, Ambler Borough had a population of 6,500 people. The racial makeup of the borough was 87.3% White, 5.3% African American, 0.3% Native American, 2.7% Asian, and 4.4% from other races. Hispanic or Latino of any race were 8.2% of the population.
The median household income in the borough was $60,000, and the median family income was $71,000. The per capita income in the borough was $30,000. About 8.5% of the population was below the poverty line.
The borough is served by the Wissahickon School District, which includes three elementary schools, one middle school, and one high school. The borough is also home to several private schools, including the Ambler Academy and the Ambler Montessori School.
Common Questions
What is Per Capita Income in Ambler borough?
Per Capita income in Ambler borough is $40,556.
What is the Median Family Income in Ambler borough?
Median Family Income in Ambler borough is $100,294.
What is the Median Household income in Ambler borough?
Median Household Income in Ambler borough is $84,303.
What is Income or Wage Gap in Ambler borough?
Income or Wage Gap in Ambler borough is 7.7%.
Women in Ambler borough earn 92.3 cents for every dollar earned by a man.
What is Inequality or Gini Index in Ambler borough?
Inequality or Gini Index in Ambler borough is 0.40.
What is the Total Population of Ambler borough?
Total Population of Ambler borough is 6,775.
What is the Total Male Population of Ambler borough?
Total Male Population of Ambler borough is 3,344.
What is the Total Female Population of Ambler borough?
Total Female Population of Ambler borough is 3,431.
What is the Ratio of Males per 100 Females in Ambler borough?
There are 97.46 Males per 100 Females in Ambler borough.
What is the Ratio of Females per 100 Males in Ambler borough?
There are 102.60 Females per 100 Males in Ambler borough.
What is the Median Population Age in Ambler borough?
Median Population Age in Ambler borough is 35.9 Years.
What is the Average Family Size in Ambler borough
Average Family Size in Ambler borough is 3.1 People.
What is the Average Household Size in Ambler borough
Average Household Size in Ambler borough is 2.5 People.
How Large is the Labor Force in Ambler borough?
There are 3,838 People in the Labor Forcein in Ambler borough.
What is the Percentage of People in the Labor Force in Ambler borough?
73.0% of People are in the Labor Force in Ambler borough.
What is the Unemployment Rate in Ambler borough?
Unemployment Rate in Ambler borough is 5.0%.