Hellertown borough, PA Map & Demographics
Hellertown borough Overview
$37,805
PER CAPITA INCOME
$102,273
AVG FAMILY INCOME
$76,579
AVG HOUSEHOLD INCOME
15.7%
WAGE / INCOME GAP [ % ]
84.3¢/ $1
WAGE / INCOME GAP [ $ ]
0.37
INEQUALITY / GINI INDEX
6,109
TOTAL POPULATION
2,882
MALE POPULATION
3,227
FEMALE POPULATION
89.31
MALES / 100 FEMALES
111.97
FEMALES / 100 MALES
44.8
MEDIAN AGE
3.1
AVG FAMILY SIZE
2.3
AVG HOUSEHOLD SIZE
3,234
LABOR FORCE [ PEOPLE ]
64.7%
PERCENT IN LABOR FORCE
4.3%
UNEMPLOYMENT RATE
Income in Hellertown borough
Income Overview in Hellertown borough
Per Capita Income in Hellertown borough is $37,805, while median incomes of families and households are $102,273 and $76,579 respectively.
| Characteristic | Number | Measure |
| Per Capita Income | 6,109 | $37,805 |
| Median Family Income | 1,402 | $102,273 |
| Mean Family Income | 1,402 | $108,615 |
| Median Household Income | 2,544 | $76,579 |
| Mean Household Income | 2,544 | $87,254 |
| Income Deficit | 1,402 | $0 |
| Wage / Income Gap (%) | 6,109 | 15.72% |
| Wage / Income Gap ($) | 6,109 | 84.28¢ per $1 |
| Gini / Inequality Index | 6,109 | 0.37 |
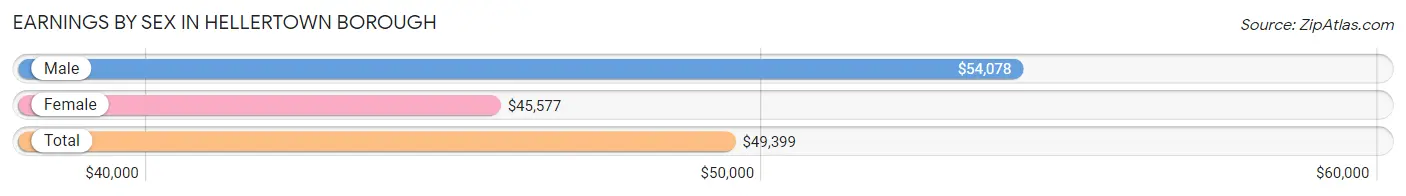
Earnings by Sex in Hellertown borough
Average Earnings in Hellertown borough are $49,399, $54,078 for men and $45,577 for women, a difference of 15.7%.
| Sex | Number | Average Earnings |
| Male | 1,725 (51.3%) | $54,078 |
| Female | 1,638 (48.7%) | $45,577 |
| Total | 3,363 (100.0%) | $49,399 |
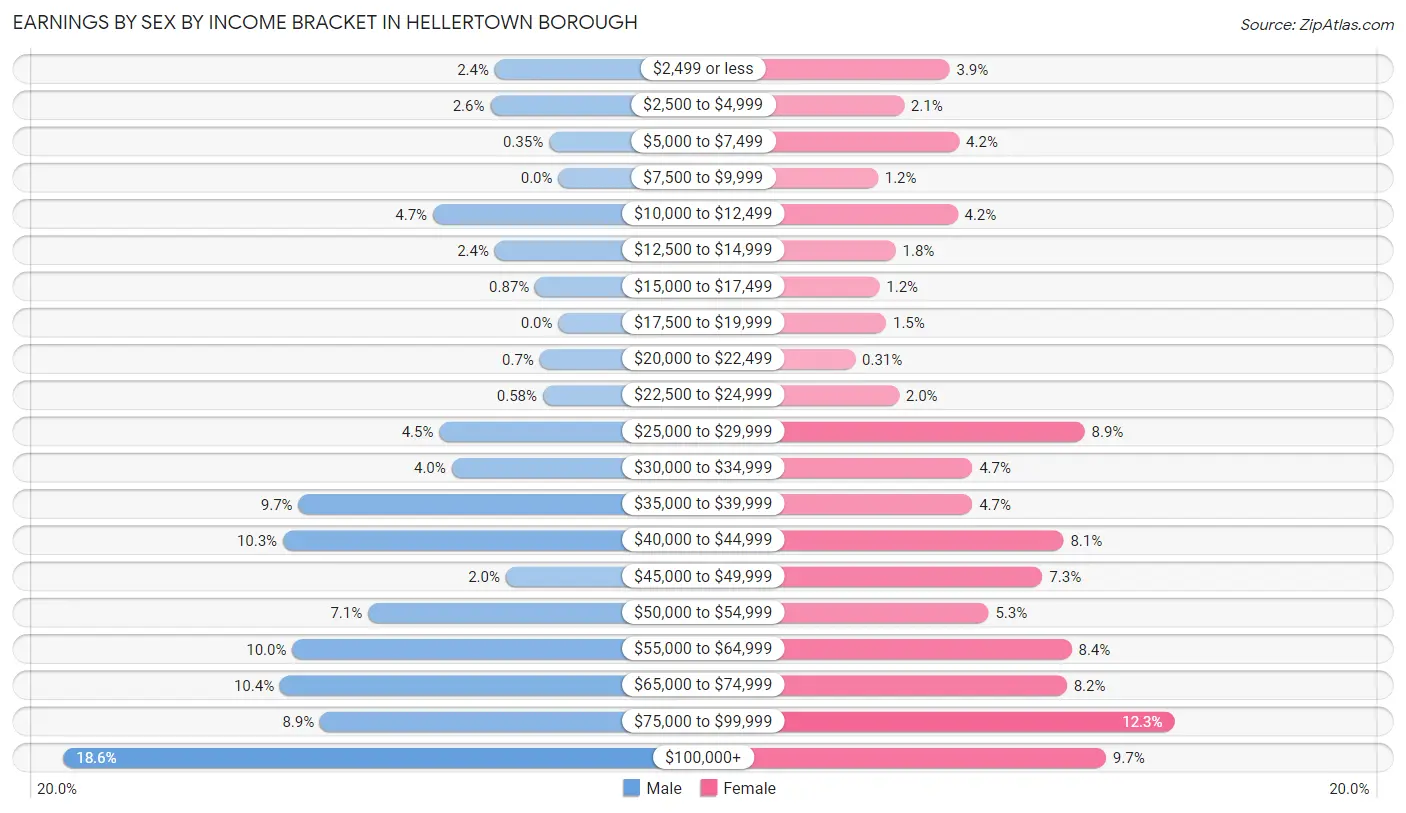
Earnings by Sex by Income Bracket in Hellertown borough
The most common earnings brackets in Hellertown borough are $100,000+ for men (320 | 18.5%) and $75,000 to $99,999 for women (201 | 12.3%).
| Income | Male | Female |
| $2,499 or less | 41 (2.4%) | 63 (3.8%) |
| $2,500 to $4,999 | 44 (2.5%) | 35 (2.1%) |
| $5,000 to $7,499 | 6 (0.4%) | 69 (4.2%) |
| $7,500 to $9,999 | 0 (0.0%) | 19 (1.2%) |
| $10,000 to $12,499 | 81 (4.7%) | 68 (4.2%) |
| $12,500 to $14,999 | 41 (2.4%) | 30 (1.8%) |
| $15,000 to $17,499 | 15 (0.9%) | 20 (1.2%) |
| $17,500 to $19,999 | 0 (0.0%) | 24 (1.5%) |
| $20,000 to $22,499 | 12 (0.7%) | 5 (0.3%) |
| $22,500 to $24,999 | 10 (0.6%) | 32 (1.9%) |
| $25,000 to $29,999 | 77 (4.5%) | 146 (8.9%) |
| $30,000 to $34,999 | 69 (4.0%) | 77 (4.7%) |
| $35,000 to $39,999 | 168 (9.7%) | 77 (4.7%) |
| $40,000 to $44,999 | 178 (10.3%) | 133 (8.1%) |
| $45,000 to $49,999 | 34 (2.0%) | 120 (7.3%) |
| $50,000 to $54,999 | 123 (7.1%) | 87 (5.3%) |
| $55,000 to $64,999 | 172 (10.0%) | 138 (8.4%) |
| $65,000 to $74,999 | 180 (10.4%) | 135 (8.2%) |
| $75,000 to $99,999 | 154 (8.9%) | 201 (12.3%) |
| $100,000+ | 320 (18.5%) | 159 (9.7%) |
| Total | 1,725 (100.0%) | 1,638 (100.0%) |
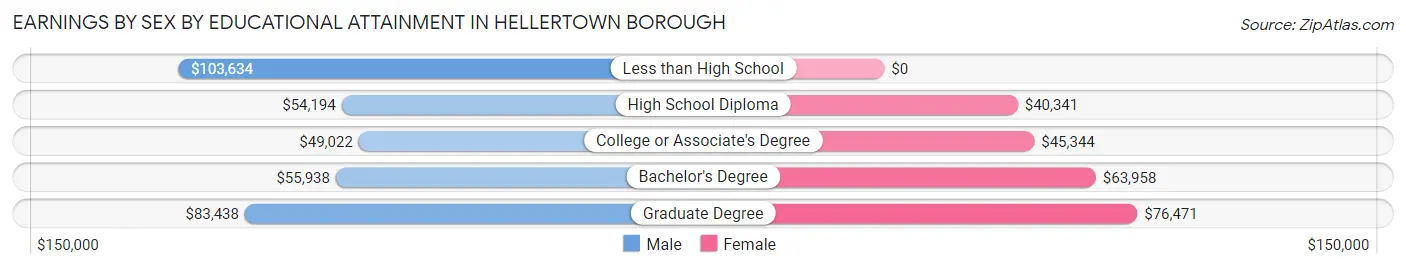
Earnings by Sex by Educational Attainment in Hellertown borough
Average earnings in Hellertown borough are $56,056 for men and $50,260 for women, a difference of 10.3%. Men with an educational attainment of less than high school enjoy the highest average annual earnings of $103,634, while those with college or associate's degree education earn the least with $49,022. Women with an educational attainment of graduate degree earn the most with the average annual earnings of $76,471, while those with high school diploma education have the smallest earnings of $40,341.
| Educational Attainment | Male Income | Female Income |
| Less than High School | $103,634 | $0 |
| High School Diploma | $54,194 | $40,341 |
| College or Associate's Degree | $49,022 | $45,344 |
| Bachelor's Degree | $55,938 | $63,958 |
| Graduate Degree | $83,438 | $76,471 |
| Total | $56,056 | $50,260 |
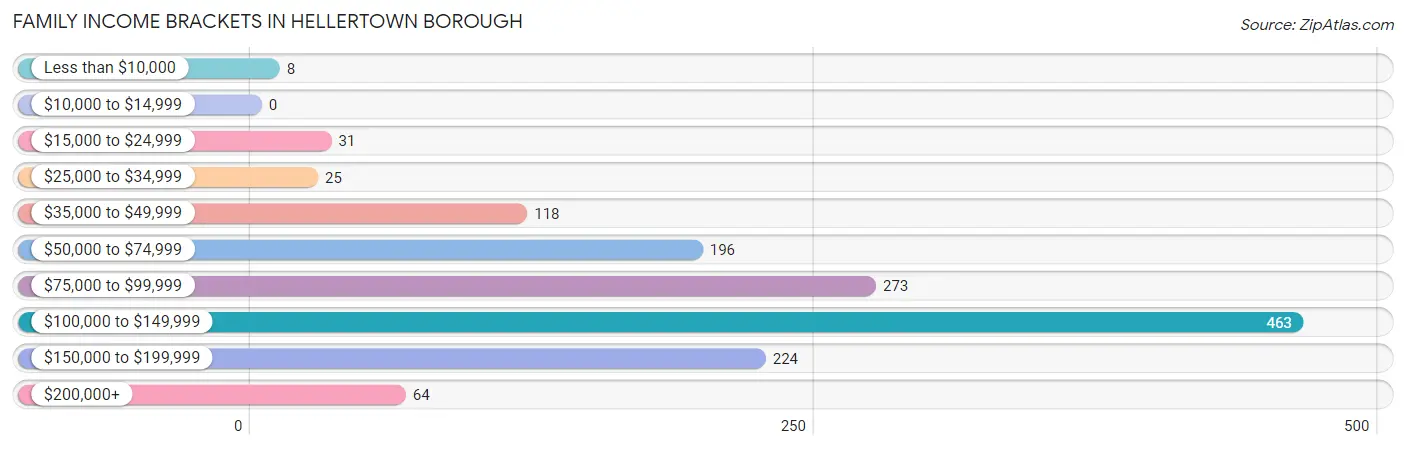
Family Income in Hellertown borough
Family Income Brackets in Hellertown borough
According to the Hellertown borough family income data, there are 463 families falling into the $100,000 to $149,999 income range, which is the most common income bracket and makes up 33.0% of all families.
| Income Bracket | # Families | % Families |
| Less than $10,000 | 8 | 0.6% |
| $10,000 to $14,999 | 0 | 0.0% |
| $15,000 to $24,999 | 31 | 2.2% |
| $25,000 to $34,999 | 25 | 1.8% |
| $35,000 to $49,999 | 118 | 8.4% |
| $50,000 to $74,999 | 196 | 14.0% |
| $75,000 to $99,999 | 273 | 19.5% |
| $100,000 to $149,999 | 463 | 33.0% |
| $150,000 to $199,999 | 224 | 16.0% |
| $200,000+ | 64 | 4.6% |
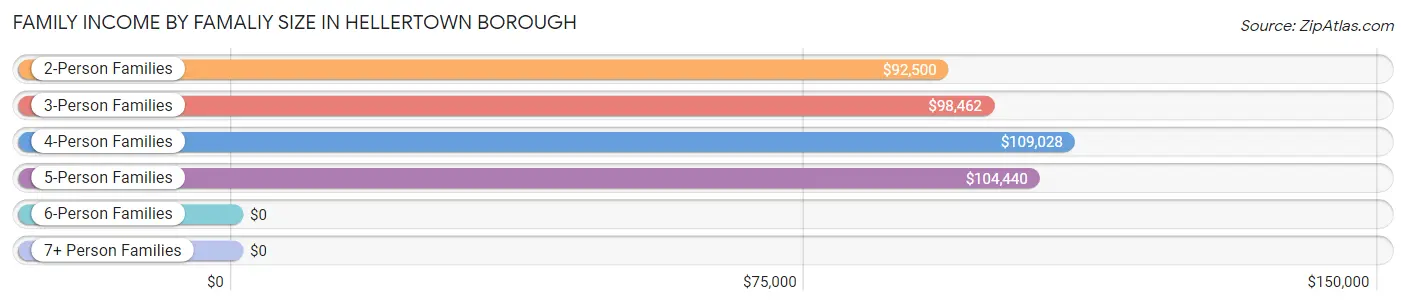
Family Income by Famaliy Size in Hellertown borough
4-person families (259 | 18.5%) account for the highest median family income in Hellertown borough with $109,028 per family, while 2-person families (648 | 46.2%) have the highest median income of $46,250 per family member.
| Income Bracket | # Families | Median Income |
| 2-Person Families | 648 (46.2%) | $92,500 |
| 3-Person Families | 348 (24.8%) | $98,462 |
| 4-Person Families | 259 (18.5%) | $109,028 |
| 5-Person Families | 127 (9.1%) | $104,440 |
| 6-Person Families | 13 (0.9%) | $0 |
| 7+ Person Families | 7 (0.5%) | $0 |
| Total | 1,402 (100.0%) | $102,273 |
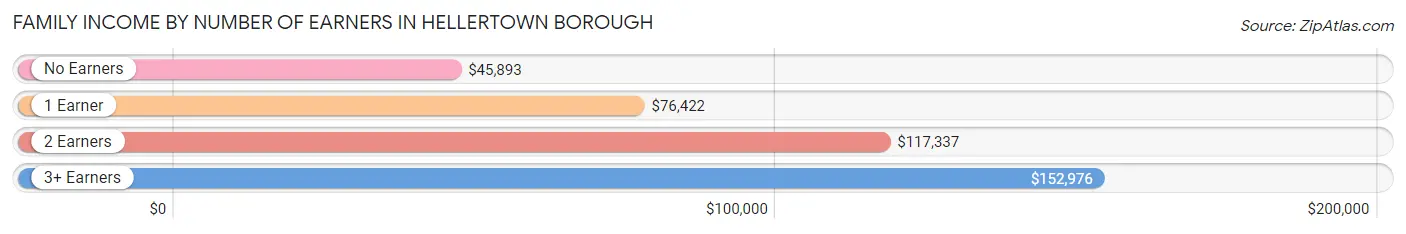
Family Income by Number of Earners in Hellertown borough
The median family income in Hellertown borough is $102,273, with families comprising 3+ earners (200) having the highest median family income of $152,976, while families with no earners (122) have the lowest median family income of $45,893, accounting for 14.3% and 8.7% of families, respectively.
| Number of Earners | # Families | Median Income |
| No Earners | 122 (8.7%) | $45,893 |
| 1 Earner | 472 (33.7%) | $76,422 |
| 2 Earners | 608 (43.4%) | $117,337 |
| 3+ Earners | 200 (14.3%) | $152,976 |
| Total | 1,402 (100.0%) | $102,273 |
Household Income in Hellertown borough
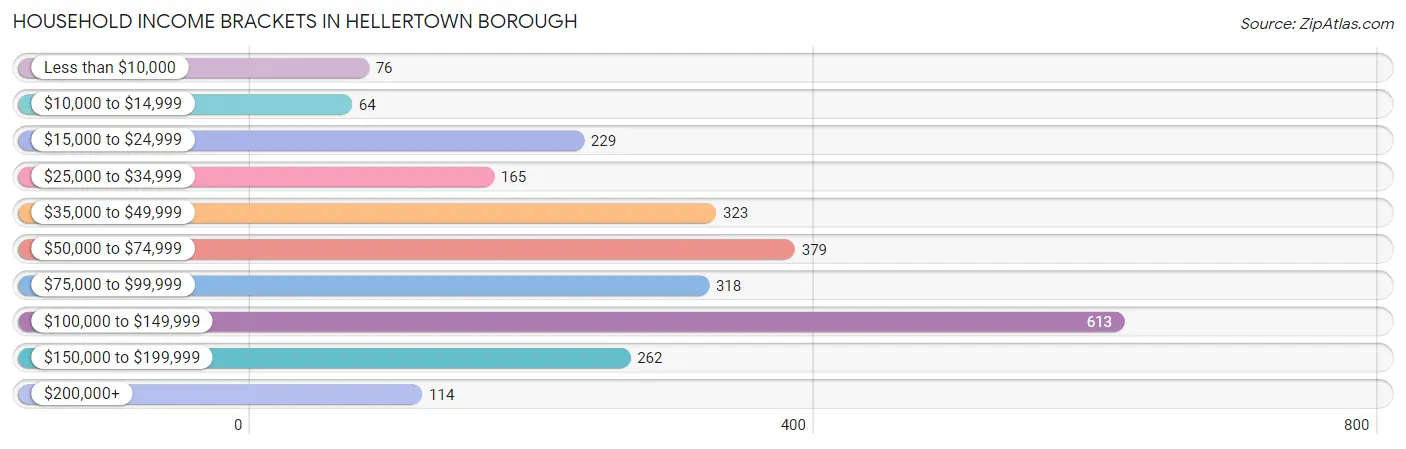
Household Income Brackets in Hellertown borough
With 613 households falling in the category, the $100,000 to $149,999 income range is the most frequent in Hellertown borough, accounting for 24.1% of all households. In contrast, only 64 households (2.5%) fall into the $10,000 to $14,999 income bracket, making it the least populous group.
| Income Bracket | # Households | % Households |
| Less than $10,000 | 76 | 3.0% |
| $10,000 to $14,999 | 64 | 2.5% |
| $15,000 to $24,999 | 229 | 9.0% |
| $25,000 to $34,999 | 165 | 6.5% |
| $35,000 to $49,999 | 323 | 12.7% |
| $50,000 to $74,999 | 379 | 14.9% |
| $75,000 to $99,999 | 318 | 12.5% |
| $100,000 to $149,999 | 613 | 24.1% |
| $150,000 to $199,999 | 262 | 10.3% |
| $200,000+ | 114 | 4.5% |
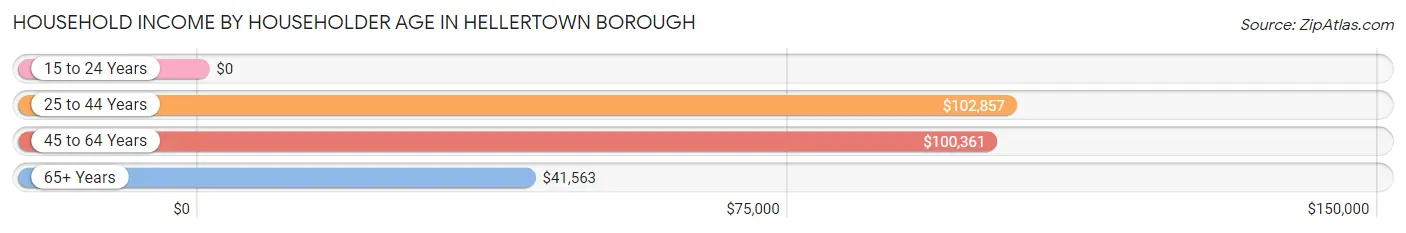
Household Income by Householder Age in Hellertown borough
The median household income in Hellertown borough is $76,579, with the highest median household income of $102,857 found in the 25 to 44 years age bracket for the primary householder. A total of 664 households (26.1%) fall into this category. Meanwhile, the 15 to 24 years age bracket for the primary householder has the lowest median household income of $0, with 8 households (0.3%) in this group.
| Income Bracket | # Households | Median Income |
| 15 to 24 Years | 8 (0.3%) | $0 |
| 25 to 44 Years | 664 (26.1%) | $102,857 |
| 45 to 64 Years | 1,095 (43.0%) | $100,361 |
| 65+ Years | 777 (30.5%) | $41,563 |
| Total | 2,544 (100.0%) | $76,579 |
Poverty in Hellertown borough
Income Below Poverty by Sex and Age in Hellertown borough
With 4.0% poverty level for males and 5.4% for females among the residents of Hellertown borough, 25 to 34 year old males and 65 to 74 year old females are the most vulnerable to poverty, with 37 males (10.8%) and 73 females (20.5%) in their respective age groups living below the poverty level.
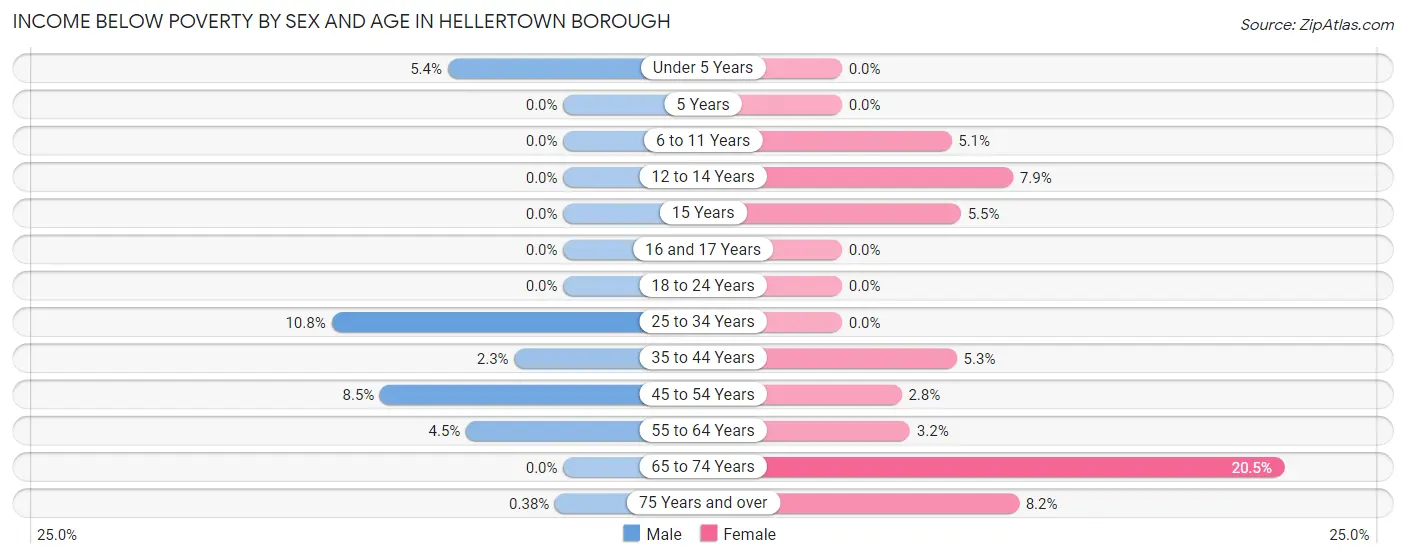
| Age Bracket | Male | Female |
| Under 5 Years | 9 (5.4%) | 0 (0.0%) |
| 5 Years | 0 (0.0%) | 0 (0.0%) |
| 6 to 11 Years | 0 (0.0%) | 9 (5.1%) |
| 12 to 14 Years | 0 (0.0%) | 15 (7.9%) |
| 15 Years | 0 (0.0%) | 8 (5.5%) |
| 16 and 17 Years | 0 (0.0%) | 0 (0.0%) |
| 18 to 24 Years | 0 (0.0%) | 0 (0.0%) |
| 25 to 34 Years | 37 (10.8%) | 0 (0.0%) |
| 35 to 44 Years | 11 (2.3%) | 16 (5.3%) |
| 45 to 54 Years | 35 (8.5%) | 13 (2.8%) |
| 55 to 64 Years | 22 (4.5%) | 13 (3.2%) |
| 65 to 74 Years | 0 (0.0%) | 73 (20.5%) |
| 75 Years and over | 1 (0.4%) | 22 (8.2%) |
| Total | 115 (4.0%) | 169 (5.4%) |
Income Above Poverty by Sex and Age in Hellertown borough
According to the poverty statistics in Hellertown borough, males aged 5 years and females aged under 5 years are the age groups that are most secure financially, with 100.0% of males and 100.0% of females in these age groups living above the poverty line.
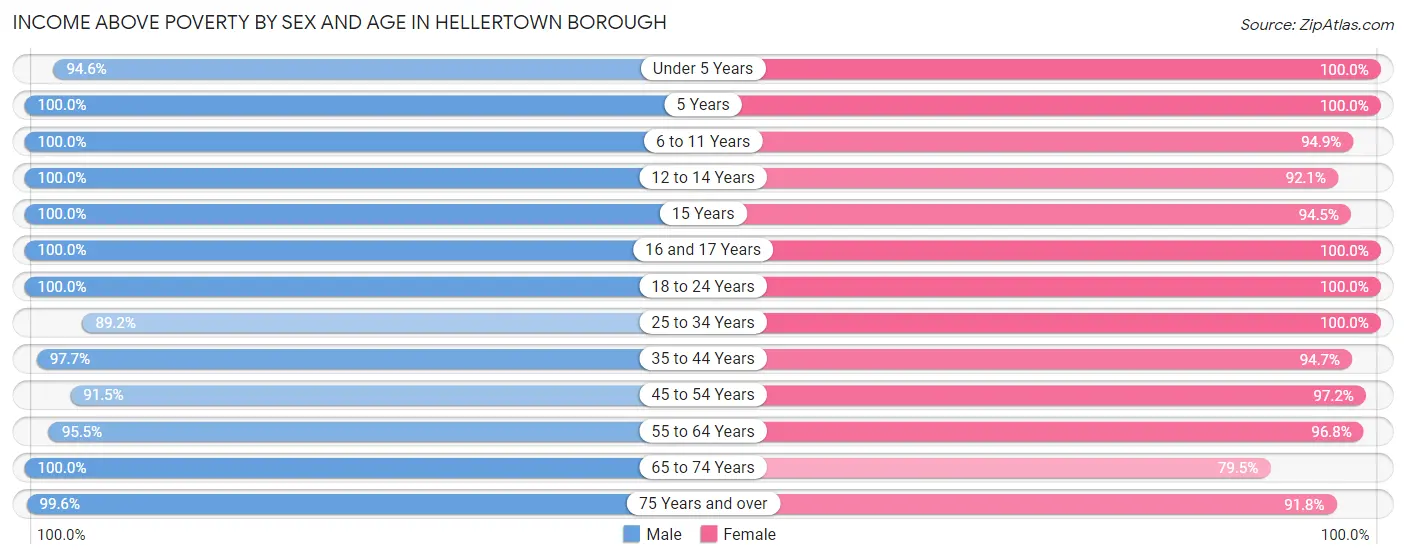
| Age Bracket | Male | Female |
| Under 5 Years | 159 (94.6%) | 160 (100.0%) |
| 5 Years | 13 (100.0%) | 22 (100.0%) |
| 6 to 11 Years | 153 (100.0%) | 168 (94.9%) |
| 12 to 14 Years | 53 (100.0%) | 174 (92.1%) |
| 15 Years | 25 (100.0%) | 137 (94.5%) |
| 16 and 17 Years | 109 (100.0%) | 31 (100.0%) |
| 18 to 24 Years | 120 (100.0%) | 191 (100.0%) |
| 25 to 34 Years | 307 (89.2%) | 381 (100.0%) |
| 35 to 44 Years | 473 (97.7%) | 284 (94.7%) |
| 45 to 54 Years | 377 (91.5%) | 457 (97.2%) |
| 55 to 64 Years | 466 (95.5%) | 399 (96.8%) |
| 65 to 74 Years | 224 (100.0%) | 283 (79.5%) |
| 75 Years and over | 263 (99.6%) | 246 (91.8%) |
| Total | 2,742 (96.0%) | 2,933 (94.6%) |
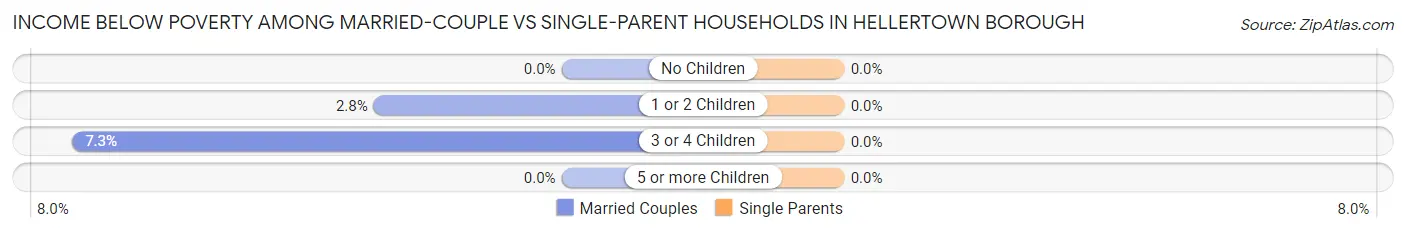
Income Below Poverty Among Married-Couple Families in Hellertown borough
The poverty statistics for married-couple families in Hellertown borough show that 1.3% or 15 of the total 1,110 families live below the poverty line. Families with 3 or 4 children have the highest poverty rate of 7.3%, comprising of 7 families. On the other hand, families with no children have the lowest poverty rate of 0.0%, which includes 0 families.
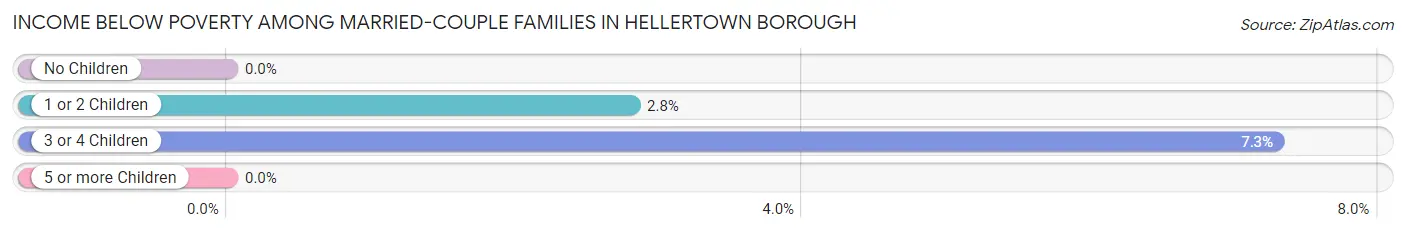
| Children | Above Poverty | Below Poverty |
| No Children | 721 (100.0%) | 0 (0.0%) |
| 1 or 2 Children | 278 (97.2%) | 8 (2.8%) |
| 3 or 4 Children | 89 (92.7%) | 7 (7.3%) |
| 5 or more Children | 7 (100.0%) | 0 (0.0%) |
| Total | 1,095 (98.7%) | 15 (1.3%) |
Income Below Poverty Among Single-Parent Households in Hellertown borough
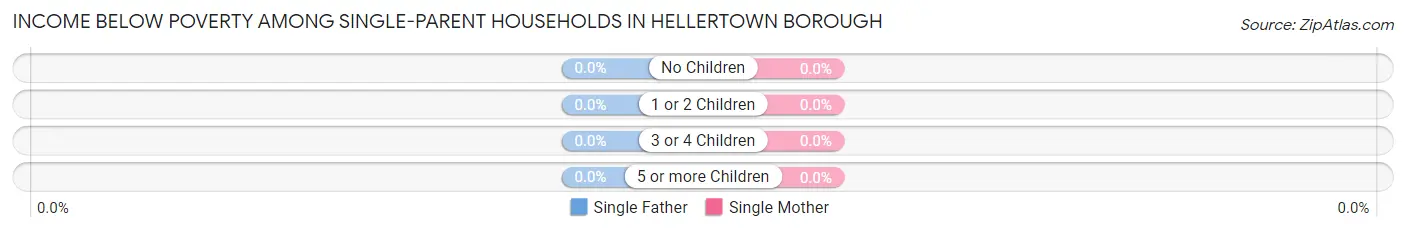
| Children | Single Father | Single Mother |
| No Children | 0 (0.0%) | 0 (0.0%) |
| 1 or 2 Children | 0 (0.0%) | 0 (0.0%) |
| 3 or 4 Children | 0 (0.0%) | 0 (0.0%) |
| 5 or more Children | 0 (0.0%) | 0 (0.0%) |
| Total | 0 (0.0%) | 0 (0.0%) |
Income Below Poverty Among Married-Couple vs Single-Parent Households in Hellertown borough
| Children | Married-Couple Families | Single-Parent Households |
| No Children | 0 (0.0%) | 0 (0.0%) |
| 1 or 2 Children | 8 (2.8%) | 0 (0.0%) |
| 3 or 4 Children | 7 (7.3%) | 0 (0.0%) |
| 5 or more Children | 0 (0.0%) | 0 (0.0%) |
| Total | 15 (1.3%) | 0 (0.0%) |
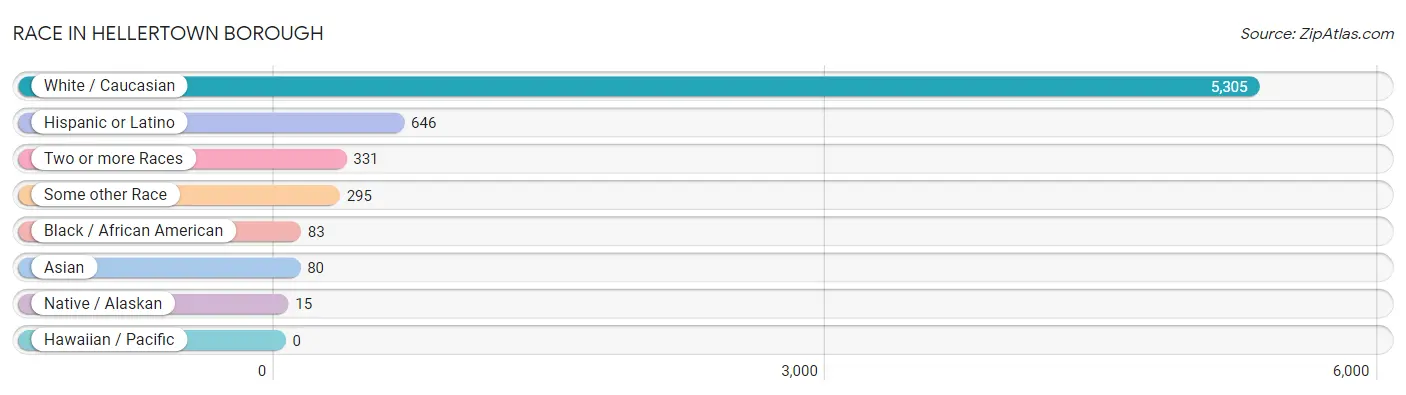
Race in Hellertown borough
The most populous races in Hellertown borough are White / Caucasian (5,305 | 86.8%), Hispanic or Latino (646 | 10.6%), and Two or more Races (331 | 5.4%).
| Race | # Population | % Population |
| Asian | 80 | 1.3% |
| Black / African American | 83 | 1.4% |
| Hawaiian / Pacific | 0 | 0.0% |
| Hispanic or Latino | 646 | 10.6% |
| Native / Alaskan | 15 | 0.3% |
| White / Caucasian | 5,305 | 86.8% |
| Two or more Races | 331 | 5.4% |
| Some other Race | 295 | 4.8% |
| Total | 6,109 | 100.0% |
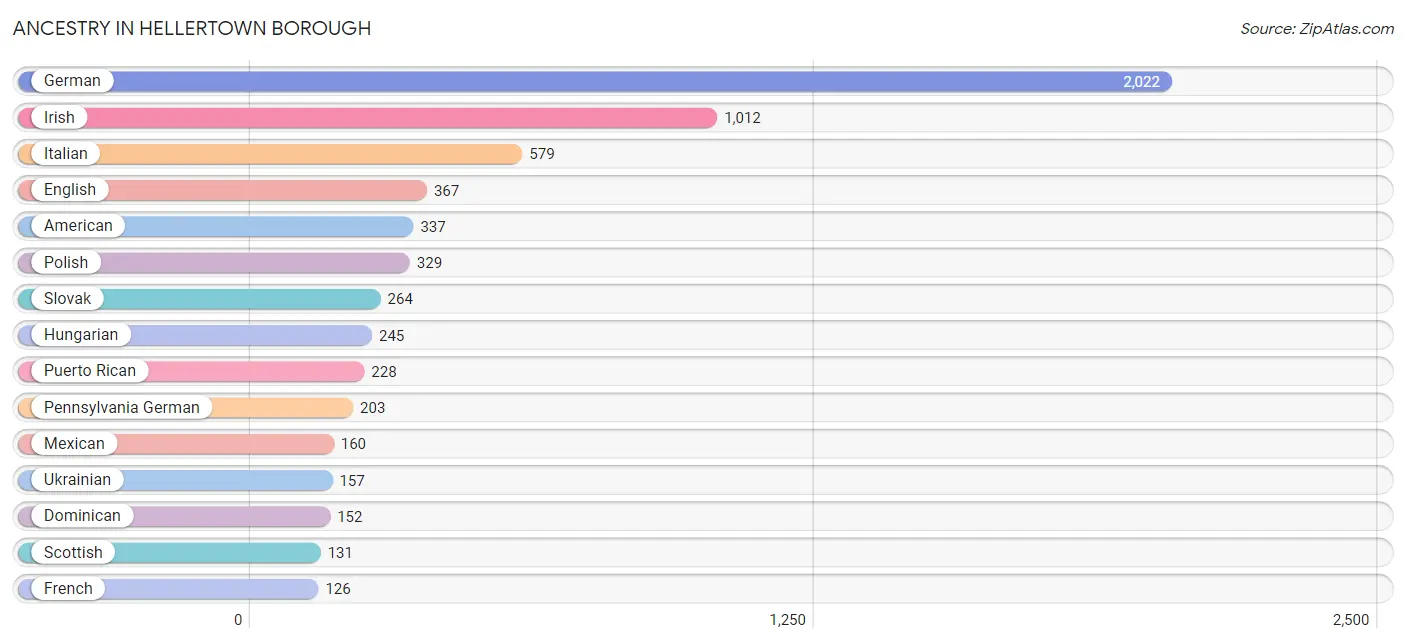
Ancestry in Hellertown borough
The most populous ancestries reported in Hellertown borough are German (2,022 | 33.1%), Irish (1,012 | 16.6%), Italian (579 | 9.5%), English (367 | 6.0%), and American (337 | 5.5%), together accounting for 70.7% of all Hellertown borough residents.
| Ancestry | # Population | % Population |
| Albanian | 7 | 0.1% |
| American | 337 | 5.5% |
| Australian | 12 | 0.2% |
| Austrian | 17 | 0.3% |
| Bolivian | 10 | 0.2% |
| British | 18 | 0.3% |
| Bulgarian | 11 | 0.2% |
| Burmese | 5 | 0.1% |
| Canadian | 12 | 0.2% |
| Central American | 49 | 0.8% |
| Chippewa | 15 | 0.3% |
| Croatian | 50 | 0.8% |
| Czechoslovakian | 19 | 0.3% |
| Danish | 33 | 0.5% |
| Dominican | 152 | 2.5% |
| Dutch | 80 | 1.3% |
| Eastern European | 17 | 0.3% |
| English | 367 | 6.0% |
| European | 36 | 0.6% |
| Filipino | 6 | 0.1% |
| French | 126 | 2.1% |
| German | 2,022 | 33.1% |
| Greek | 23 | 0.4% |
| Guatemalan | 23 | 0.4% |
| Hungarian | 245 | 4.0% |
| Indian (Asian) | 16 | 0.3% |
| Irish | 1,012 | 16.6% |
| Italian | 579 | 9.5% |
| Japanese | 20 | 0.3% |
| Lithuanian | 24 | 0.4% |
| Mexican | 160 | 2.6% |
| Northern European | 14 | 0.2% |
| Norwegian | 51 | 0.8% |
| Pennsylvania German | 203 | 3.3% |
| Polish | 329 | 5.4% |
| Portuguese | 25 | 0.4% |
| Puerto Rican | 228 | 3.7% |
| Romanian | 66 | 1.1% |
| Russian | 83 | 1.4% |
| Salvadoran | 26 | 0.4% |
| Scandinavian | 20 | 0.3% |
| Scotch-Irish | 43 | 0.7% |
| Scottish | 131 | 2.1% |
| Slavic | 6 | 0.1% |
| Slovak | 264 | 4.3% |
| Slovene | 9 | 0.2% |
| South American | 10 | 0.2% |
| Subsaharan African | 2 | 0.0% |
| Swedish | 86 | 1.4% |
| Swiss | 112 | 1.8% |
| Thai | 43 | 0.7% |
| Turkish | 31 | 0.5% |
| Ugandan | 2 | 0.0% |
| Ukrainian | 157 | 2.6% |
| Welsh | 57 | 0.9% | View All 55 Rows |
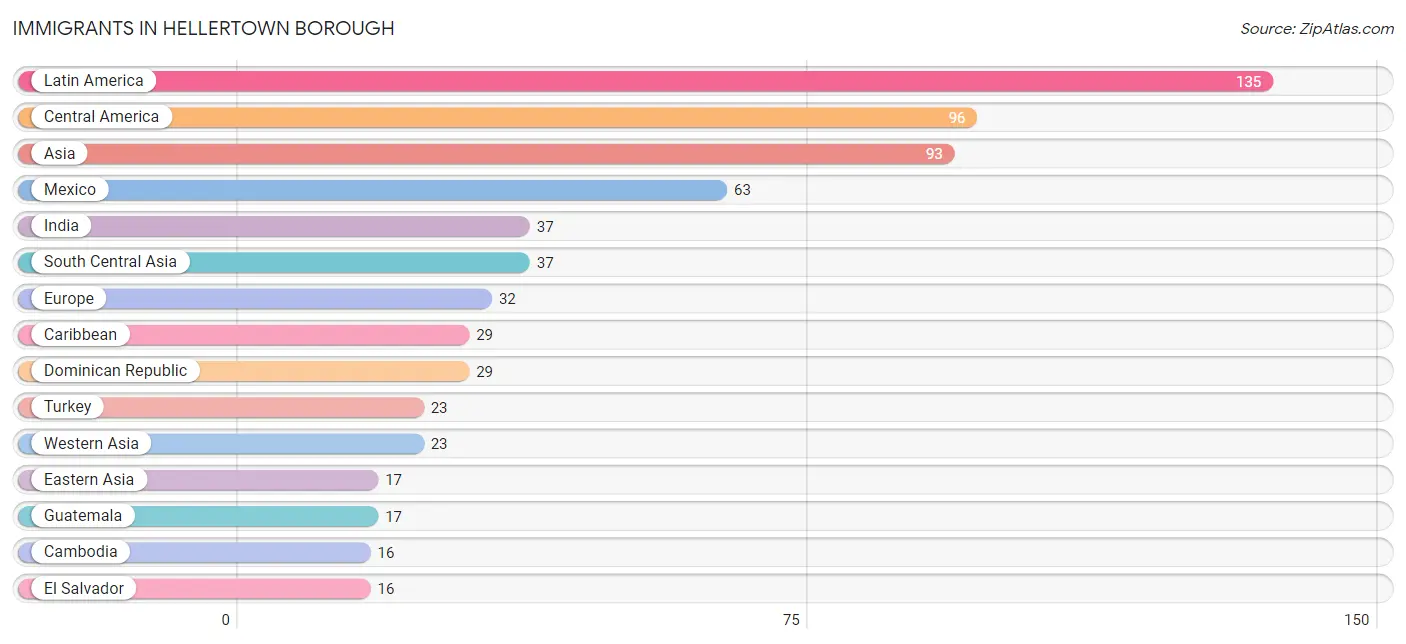
Immigrants in Hellertown borough
The most numerous immigrant groups reported in Hellertown borough came from Latin America (135 | 2.2%), Central America (96 | 1.6%), Asia (93 | 1.5%), Mexico (63 | 1.0%), and India (37 | 0.6%), together accounting for 6.9% of all Hellertown borough residents.
| Immigration Origin | # Population | % Population |
| Africa | 10 | 0.2% |
| Asia | 93 | 1.5% |
| Bolivia | 10 | 0.2% |
| Cambodia | 16 | 0.3% |
| Caribbean | 29 | 0.5% |
| Central America | 96 | 1.6% |
| China | 12 | 0.2% |
| Dominican Republic | 29 | 0.5% |
| Eastern Africa | 2 | 0.0% |
| Eastern Asia | 17 | 0.3% |
| Eastern Europe | 14 | 0.2% |
| El Salvador | 16 | 0.3% |
| Europe | 32 | 0.5% |
| Guatemala | 17 | 0.3% |
| India | 37 | 0.6% |
| Italy | 7 | 0.1% |
| Korea | 5 | 0.1% |
| Latin America | 135 | 2.2% |
| Mexico | 63 | 1.0% |
| Middle Africa | 8 | 0.1% |
| North Macedonia | 7 | 0.1% |
| Northern Europe | 11 | 0.2% |
| Poland | 7 | 0.1% |
| South America | 10 | 0.2% |
| South Central Asia | 37 | 0.6% |
| South Eastern Asia | 16 | 0.3% |
| Southern Europe | 7 | 0.1% |
| Taiwan | 6 | 0.1% |
| Turkey | 23 | 0.4% |
| Uganda | 2 | 0.0% |
| Western Asia | 23 | 0.4% | View All 31 Rows |
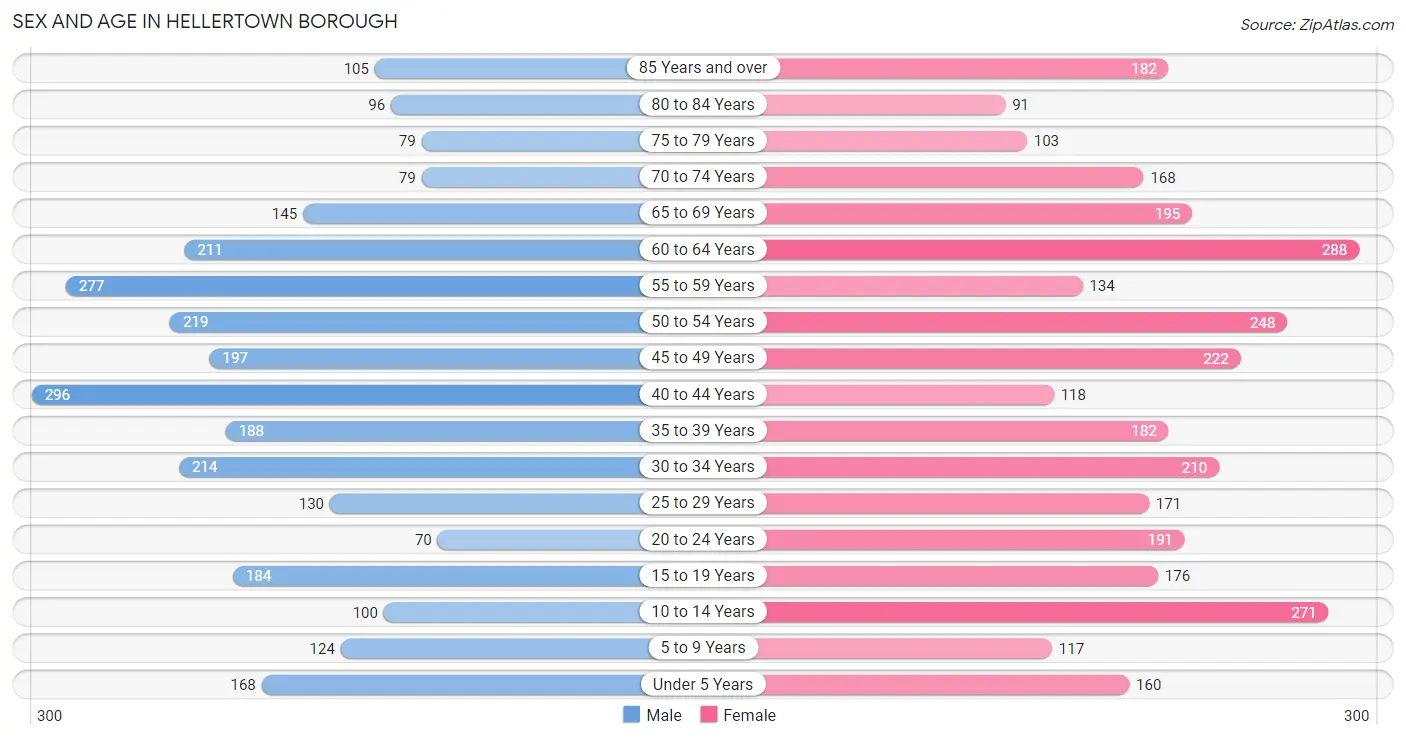
Sex and Age in Hellertown borough
Sex and Age in Hellertown borough
The most populous age groups in Hellertown borough are 40 to 44 Years (296 | 10.3%) for men and 60 to 64 Years (288 | 8.9%) for women.
| Age Bracket | Male | Female |
| Under 5 Years | 168 (5.8%) | 160 (5.0%) |
| 5 to 9 Years | 124 (4.3%) | 117 (3.6%) |
| 10 to 14 Years | 100 (3.5%) | 271 (8.4%) |
| 15 to 19 Years | 184 (6.4%) | 176 (5.4%) |
| 20 to 24 Years | 70 (2.4%) | 191 (5.9%) |
| 25 to 29 Years | 130 (4.5%) | 171 (5.3%) |
| 30 to 34 Years | 214 (7.4%) | 210 (6.5%) |
| 35 to 39 Years | 188 (6.5%) | 182 (5.6%) |
| 40 to 44 Years | 296 (10.3%) | 118 (3.7%) |
| 45 to 49 Years | 197 (6.8%) | 222 (6.9%) |
| 50 to 54 Years | 219 (7.6%) | 248 (7.7%) |
| 55 to 59 Years | 277 (9.6%) | 134 (4.2%) |
| 60 to 64 Years | 211 (7.3%) | 288 (8.9%) |
| 65 to 69 Years | 145 (5.0%) | 195 (6.0%) |
| 70 to 74 Years | 79 (2.7%) | 168 (5.2%) |
| 75 to 79 Years | 79 (2.7%) | 103 (3.2%) |
| 80 to 84 Years | 96 (3.3%) | 91 (2.8%) |
| 85 Years and over | 105 (3.6%) | 182 (5.6%) |
| Total | 2,882 (100.0%) | 3,227 (100.0%) |
Families and Households in Hellertown borough
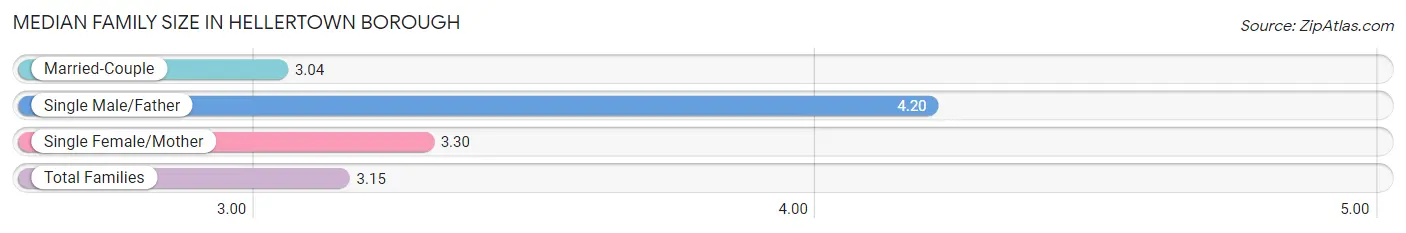
Median Family Size in Hellertown borough
The median family size in Hellertown borough is 3.15 persons per family, with single male/father families (92 | 6.6%) accounting for the largest median family size of 4.2 persons per family. On the other hand, married-couple families (1,110 | 79.2%) represent the smallest median family size with 3.04 persons per family.
| Family Type | # Families | Family Size |
| Married-Couple | 1,110 (79.2%) | 3.04 |
| Single Male/Father | 92 (6.6%) | 4.20 |
| Single Female/Mother | 200 (14.3%) | 3.30 |
| Total Families | 1,402 (100.0%) | 3.15 |
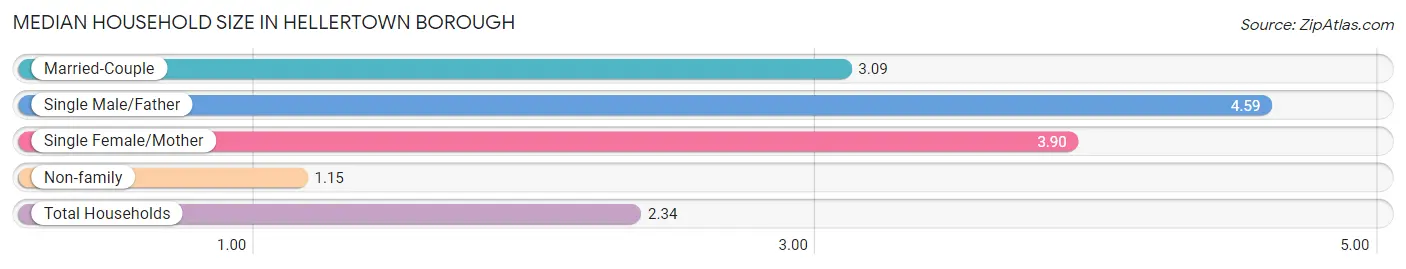
Median Household Size in Hellertown borough
The median household size in Hellertown borough is 2.34 persons per household, with single male/father households (92 | 3.6%) accounting for the largest median household size of 4.59 persons per household. non-family households (1,142 | 44.9%) represent the smallest median household size with 1.15 persons per household.
| Household Type | # Households | Household Size |
| Married-Couple | 1,110 (43.6%) | 3.09 |
| Single Male/Father | 92 (3.6%) | 4.59 |
| Single Female/Mother | 200 (7.9%) | 3.90 |
| Non-family | 1,142 (44.9%) | 1.15 |
| Total Households | 2,544 (100.0%) | 2.34 |
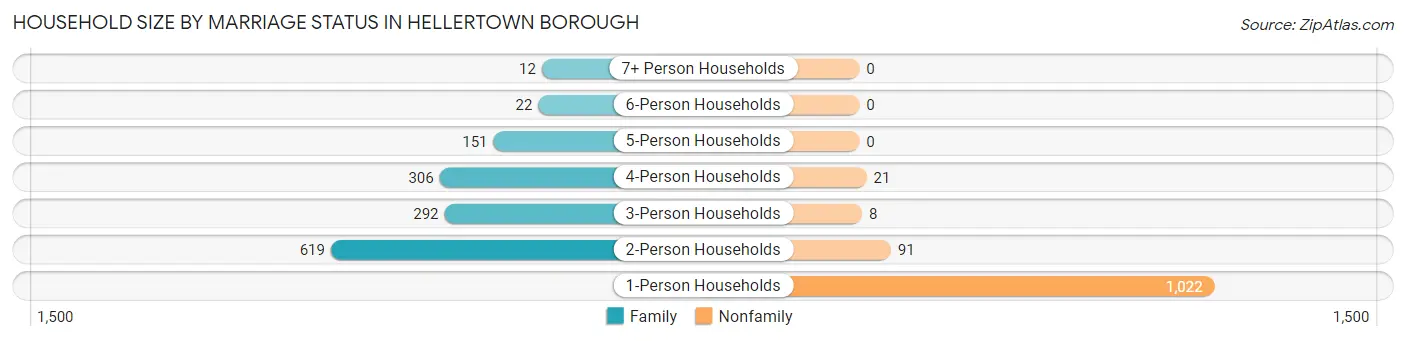
Household Size by Marriage Status in Hellertown borough
Out of a total of 2,544 households in Hellertown borough, 1,402 (55.1%) are family households, while 1,142 (44.9%) are nonfamily households. The most numerous type of family households are 2-person households, comprising 619, and the most common type of nonfamily households are 1-person households, comprising 1,022.
| Household Size | Family Households | Nonfamily Households |
| 1-Person Households | - | 1,022 (40.2%) |
| 2-Person Households | 619 (24.3%) | 91 (3.6%) |
| 3-Person Households | 292 (11.5%) | 8 (0.3%) |
| 4-Person Households | 306 (12.0%) | 21 (0.8%) |
| 5-Person Households | 151 (5.9%) | 0 (0.0%) |
| 6-Person Households | 22 (0.9%) | 0 (0.0%) |
| 7+ Person Households | 12 (0.5%) | 0 (0.0%) |
| Total | 1,402 (55.1%) | 1,142 (44.9%) |
Female Fertility in Hellertown borough
Fertility by Age in Hellertown borough
Average fertility rate in Hellertown borough is 38.0 births per 1,000 women. Women in the age bracket of 20 to 34 years have the highest fertility rate with 54.0 births per 1,000 women. Women in the age bracket of 20 to 34 years acount for 60.8% of all women with births.
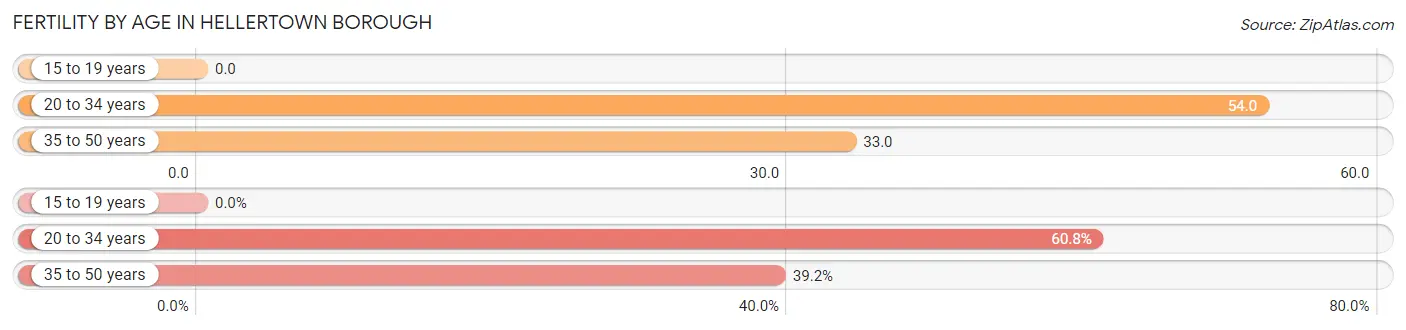
| Age Bracket | Women with Births | Births / 1,000 Women |
| 15 to 19 years | 0 (0.0%) | 0.0 |
| 20 to 34 years | 31 (60.8%) | 54.0 |
| 35 to 50 years | 20 (39.2%) | 33.0 |
| Total | 51 (100.0%) | 38.0 |
Fertility by Age by Marriage Status in Hellertown borough
64.7% of women with births (51) in Hellertown borough are married. The highest percentage of unmarried women with births falls into 20 to 34 years age bracket with 41.9% of them unmarried at the time of birth, while the lowest percentage of unmarried women with births belong to 35 to 50 years age bracket with 25.0% of them unmarried.
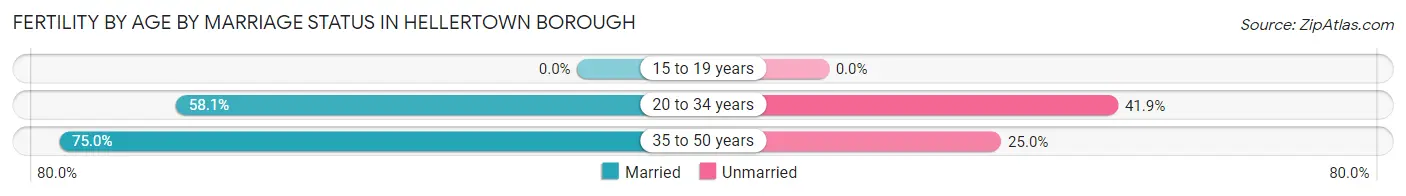
| Age Bracket | Married | Unmarried |
| 15 to 19 years | 0 (0.0%) | 0 (0.0%) |
| 20 to 34 years | 18 (58.1%) | 13 (41.9%) |
| 35 to 50 years | 15 (75.0%) | 5 (25.0%) |
| Total | 33 (64.7%) | 18 (35.3%) |
Fertility by Education in Hellertown borough
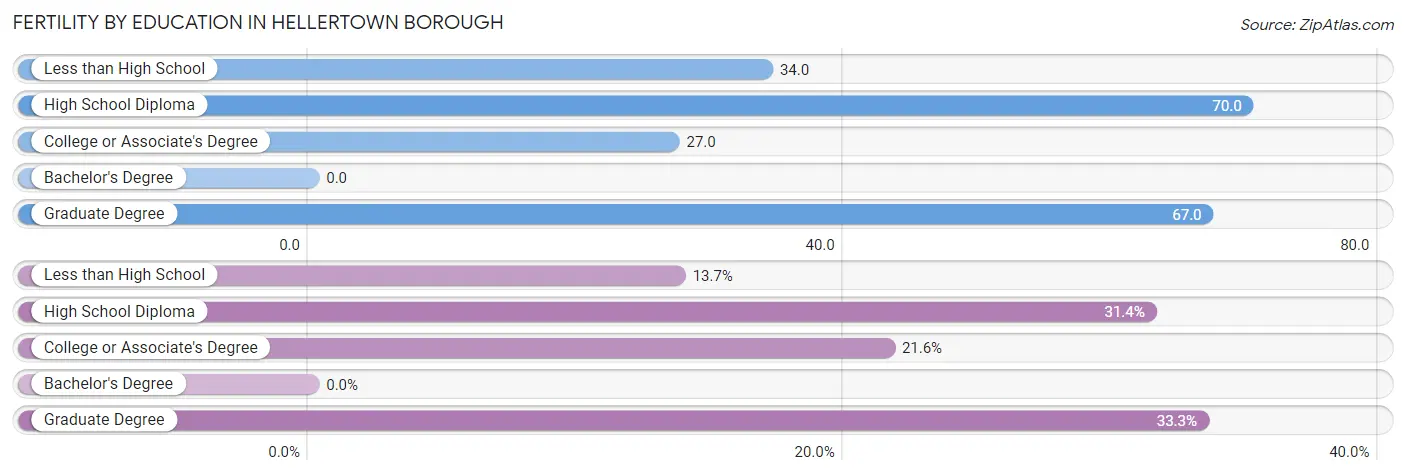
| Educational Attainment | Women with Births | Births / 1,000 Women |
| Less than High School | 7 (13.7%) | 34.0 |
| High School Diploma | 16 (31.4%) | 70.0 |
| College or Associate's Degree | 11 (21.6%) | 27.0 |
| Bachelor's Degree | 0 (0.0%) | 0.0 |
| Graduate Degree | 17 (33.3%) | 67.0 |
| Total | 51 (100.0%) | 38.0 |
Fertility by Education by Marriage Status in Hellertown borough
35.3% of women with births in Hellertown borough are unmarried. Women with the educational attainment of less than high school are most likely to be married with 100.0% of them married at childbirth, while women with the educational attainment of high school diploma are least likely to be married with 81.2% of them unmarried at childbirth.
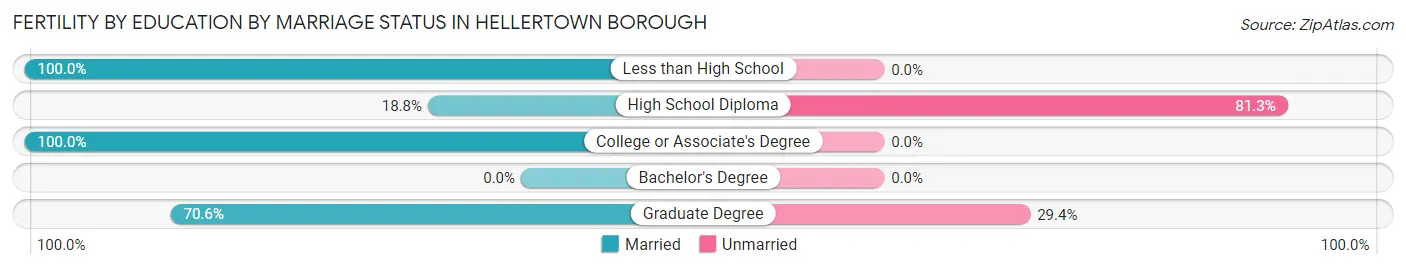
| Educational Attainment | Married | Unmarried |
| Less than High School | 7 (100.0%) | 0 (0.0%) |
| High School Diploma | 3 (18.8%) | 13 (81.2%) |
| College or Associate's Degree | 11 (100.0%) | 0 (0.0%) |
| Bachelor's Degree | 0 (0.0%) | 0 (0.0%) |
| Graduate Degree | 12 (70.6%) | 5 (29.4%) |
| Total | 33 (64.7%) | 18 (35.3%) |
Employment Characteristics in Hellertown borough
Employment by Class of Employer in Hellertown borough
Among the 2,997 employed individuals in Hellertown borough, private company employees (2,228 | 74.3%), not-for-profit organizations (298 | 9.9%), and local government employees (176 | 5.9%) make up the most common classes of employment.
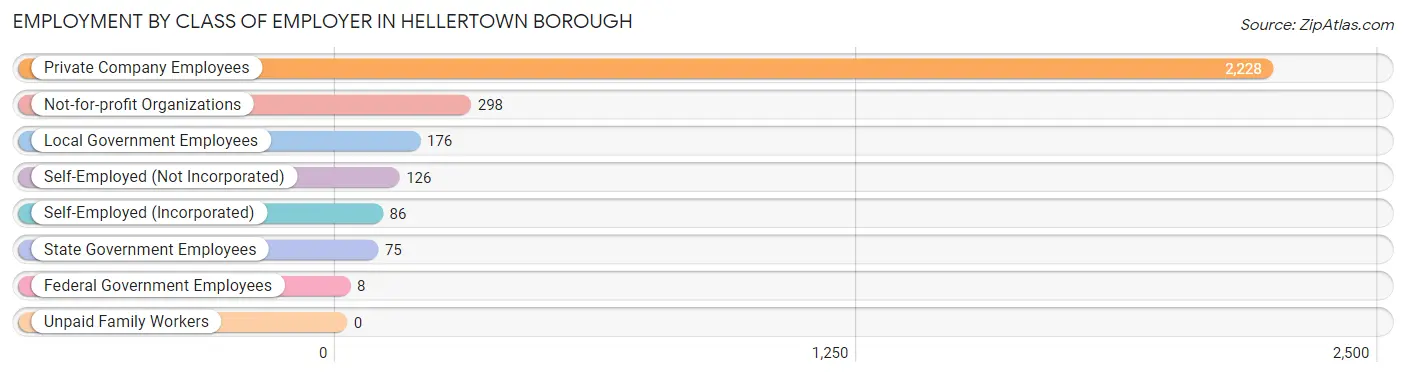
| Employer Class | # Employees | % Employees |
| Private Company Employees | 2,228 | 74.3% |
| Self-Employed (Incorporated) | 86 | 2.9% |
| Self-Employed (Not Incorporated) | 126 | 4.2% |
| Not-for-profit Organizations | 298 | 9.9% |
| Local Government Employees | 176 | 5.9% |
| State Government Employees | 75 | 2.5% |
| Federal Government Employees | 8 | 0.3% |
| Unpaid Family Workers | 0 | 0.0% |
| Total | 2,997 | 100.0% |
Employment Status by Age in Hellertown borough
According to the labor force statistics for Hellertown borough, out of the total population over 16 years of age (4,999), 64.7% or 3,234 individuals are in the labor force, with 4.3% or 139 of them unemployed. The age group with the highest labor force participation rate is 30 to 34 years, with 93.6% or 397 individuals in the labor force. Within the labor force, the 20 to 24 years age range has the highest percentage of unemployed individuals, with 13.1% or 23 of them being unemployed.
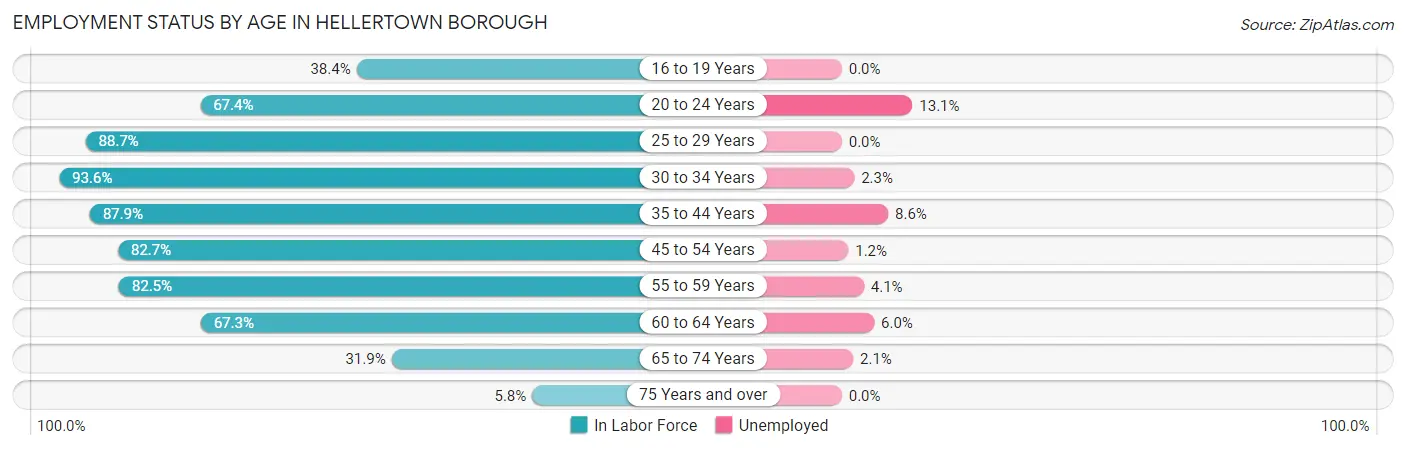
| Age Bracket | In Labor Force | Unemployed |
| 16 to 19 Years | 73 (38.4%) | 0 (0.0%) |
| 20 to 24 Years | 176 (67.4%) | 23 (13.1%) |
| 25 to 29 Years | 267 (88.7%) | 0 (0.0%) |
| 30 to 34 Years | 397 (93.6%) | 9 (2.3%) |
| 35 to 44 Years | 689 (87.9%) | 59 (8.6%) |
| 45 to 54 Years | 733 (82.7%) | 9 (1.2%) |
| 55 to 59 Years | 339 (82.5%) | 14 (4.1%) |
| 60 to 64 Years | 336 (67.3%) | 20 (6.0%) |
| 65 to 74 Years | 187 (31.9%) | 4 (2.1%) |
| 75 Years and over | 38 (5.8%) | 0 (0.0%) |
| Total | 3,234 (64.7%) | 139 (4.3%) |
Employment Status by Educational Attainment in Hellertown borough
According to labor force statistics for Hellertown borough, 83.5% of individuals (2,760) out of the total population between 25 and 64 years of age (3,305) are in the labor force, with 4.0% or 110 of them being unemployed. The group with the highest labor force participation rate are those with the educational attainment of bachelor's degree or higher, with 88.8% or 971 individuals in the labor force. Within the labor force, individuals with high school diploma education have the highest percentage of unemployment, with 6.4% or 52 of them being unemployed.
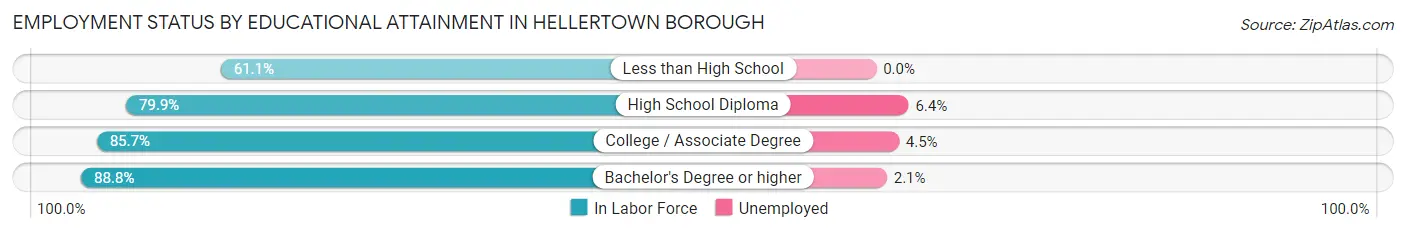
| Educational Attainment | In Labor Force | Unemployed |
| Less than High School | 118 (61.1%) | 0 (0.0%) |
| High School Diploma | 807 (79.9%) | 65 (6.4%) |
| College / Associate Degree | 864 (85.7%) | 45 (4.5%) |
| Bachelor's Degree or higher | 971 (88.8%) | 23 (2.1%) |
| Total | 2,760 (83.5%) | 132 (4.0%) |
Employment Occupations by Sex in Hellertown borough
Management, Business, Science and Arts Occupations
The most common Management, Business, Science and Arts occupations in Hellertown borough are Management (382 | 12.3%), Community & Social Service (342 | 11.0%), Health Diagnosing & Treating (267 | 8.6%), Education Instruction & Library (239 | 7.7%), and Health Technologists (191 | 6.2%).
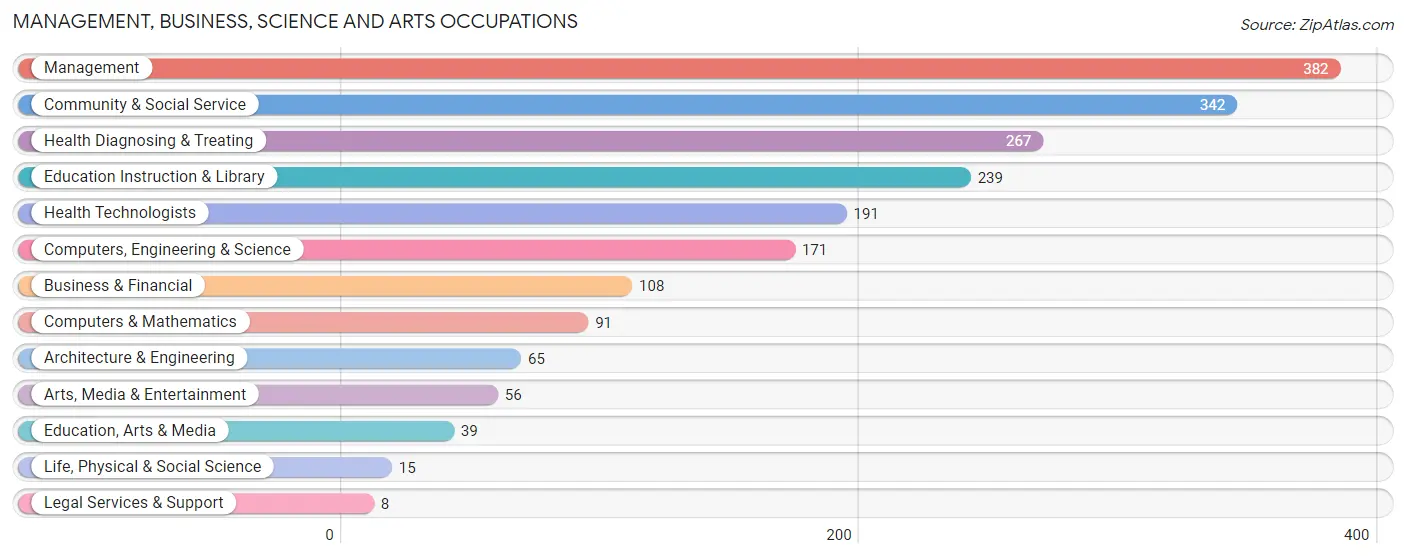
Management, Business, Science and Arts Occupations by Sex
Within the Management, Business, Science and Arts occupations in Hellertown borough, the most male-oriented occupations are Computers & Mathematics (91.2%), Arts, Media & Entertainment (91.1%), and Computers, Engineering & Science (71.9%), while the most female-oriented occupations are Legal Services & Support (100.0%), Education Instruction & Library (84.9%), and Education, Arts & Media (74.4%).
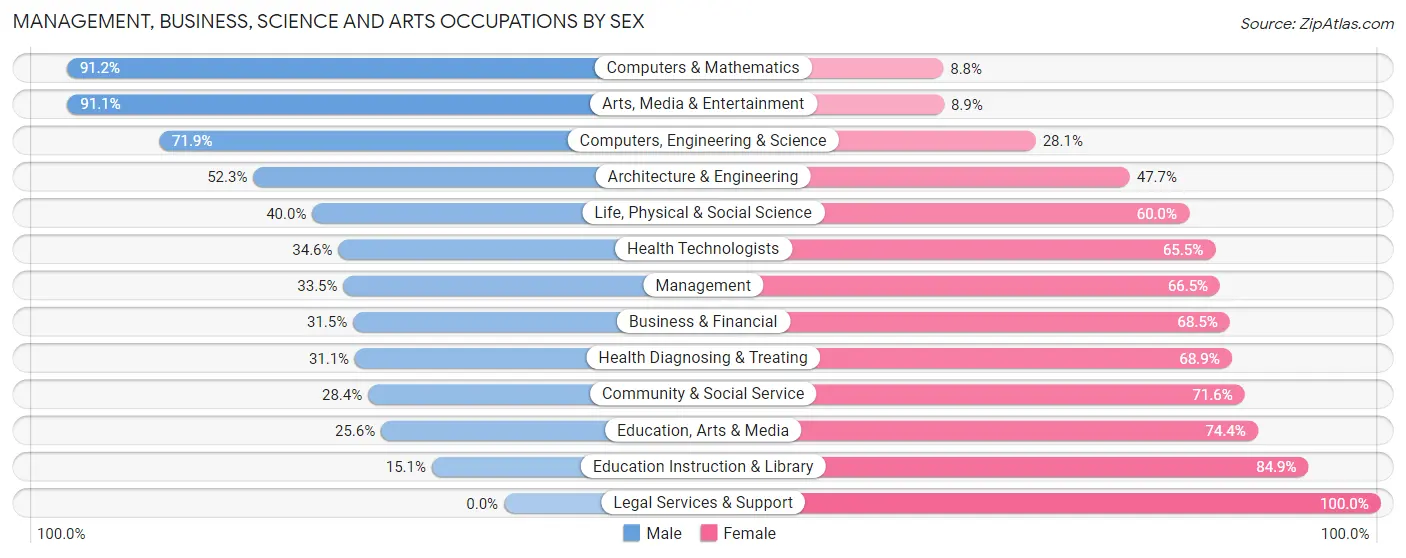
| Occupation | Male | Female |
| Management | 128 (33.5%) | 254 (66.5%) |
| Business & Financial | 34 (31.5%) | 74 (68.5%) |
| Computers, Engineering & Science | 123 (71.9%) | 48 (28.1%) |
| Computers & Mathematics | 83 (91.2%) | 8 (8.8%) |
| Architecture & Engineering | 34 (52.3%) | 31 (47.7%) |
| Life, Physical & Social Science | 6 (40.0%) | 9 (60.0%) |
| Community & Social Service | 97 (28.4%) | 245 (71.6%) |
| Education, Arts & Media | 10 (25.6%) | 29 (74.4%) |
| Legal Services & Support | 0 (0.0%) | 8 (100.0%) |
| Education Instruction & Library | 36 (15.1%) | 203 (84.9%) |
| Arts, Media & Entertainment | 51 (91.1%) | 5 (8.9%) |
| Health Diagnosing & Treating | 83 (31.1%) | 184 (68.9%) |
| Health Technologists | 66 (34.5%) | 125 (65.4%) |
| Total (Category) | 465 (36.6%) | 805 (63.4%) |
| Total (Overall) | 1,644 (53.1%) | 1,453 (46.9%) |
Services Occupations
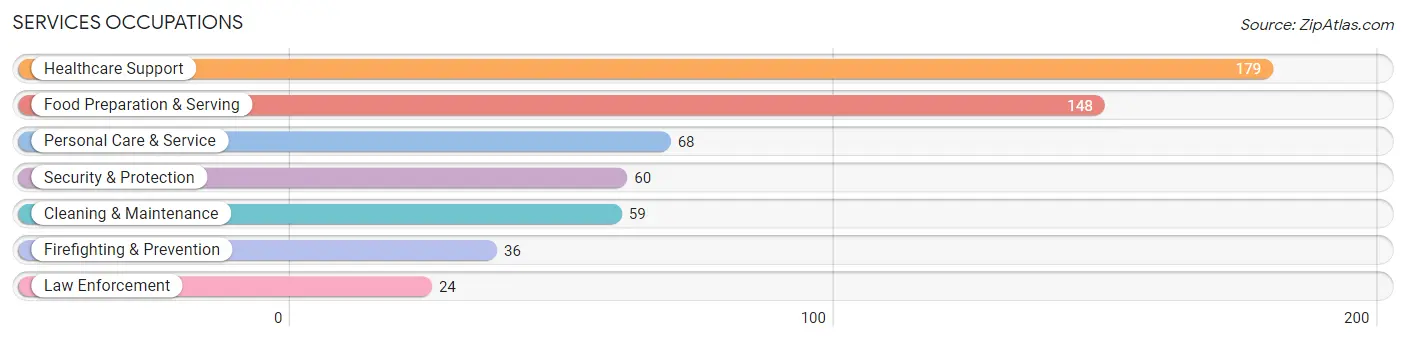
The most common Services occupations in Hellertown borough are Healthcare Support (179 | 5.8%), Food Preparation & Serving (148 | 4.8%), Personal Care & Service (68 | 2.2%), Security & Protection (60 | 1.9%), and Cleaning & Maintenance (59 | 1.9%).
Services Occupations by Sex
Within the Services occupations in Hellertown borough, the most male-oriented occupations are Cleaning & Maintenance (100.0%), Firefighting & Prevention (75.0%), and Food Preparation & Serving (64.2%), while the most female-oriented occupations are Healthcare Support (95.0%), Law Enforcement (58.3%), and Personal Care & Service (45.6%).
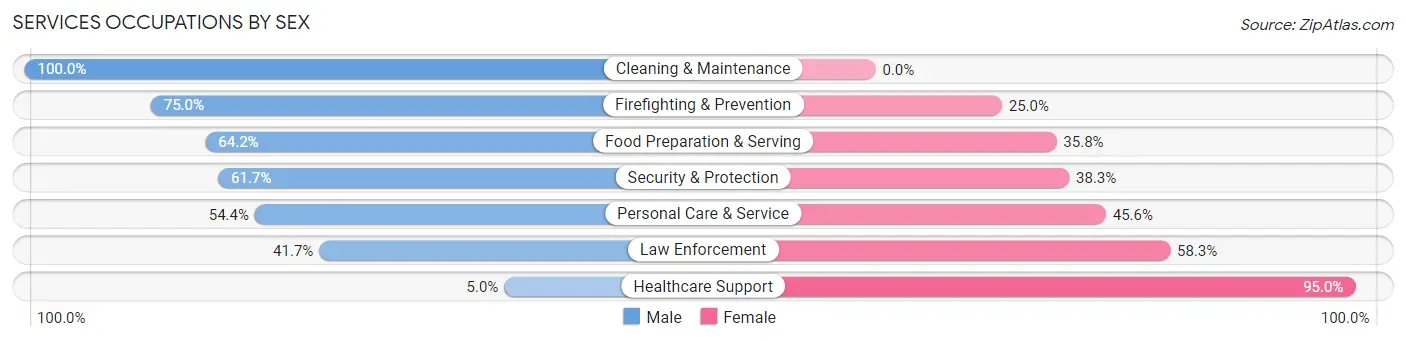
| Occupation | Male | Female |
| Healthcare Support | 9 (5.0%) | 170 (95.0%) |
| Security & Protection | 37 (61.7%) | 23 (38.3%) |
| Firefighting & Prevention | 27 (75.0%) | 9 (25.0%) |
| Law Enforcement | 10 (41.7%) | 14 (58.3%) |
| Food Preparation & Serving | 95 (64.2%) | 53 (35.8%) |
| Cleaning & Maintenance | 59 (100.0%) | 0 (0.0%) |
| Personal Care & Service | 37 (54.4%) | 31 (45.6%) |
| Total (Category) | 237 (46.1%) | 277 (53.9%) |
| Total (Overall) | 1,644 (53.1%) | 1,453 (46.9%) |
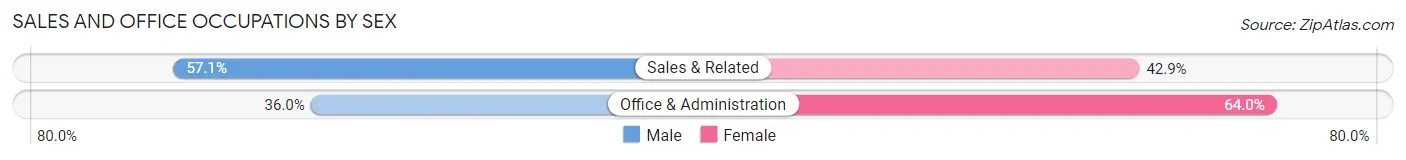
Sales and Office Occupations
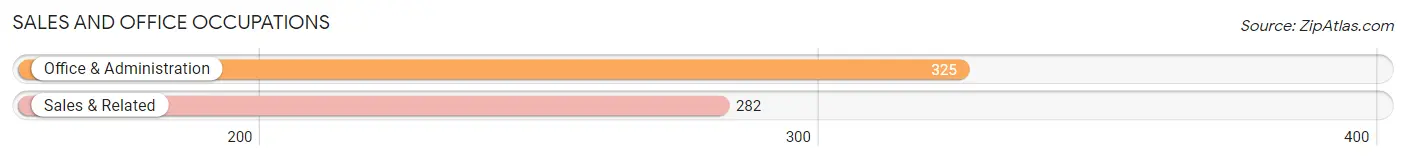
The most common Sales and Office occupations in Hellertown borough are Office & Administration (325 | 10.5%), and Sales & Related (282 | 9.1%).
Sales and Office Occupations by Sex
| Occupation | Male | Female |
| Sales & Related | 161 (57.1%) | 121 (42.9%) |
| Office & Administration | 117 (36.0%) | 208 (64.0%) |
| Total (Category) | 278 (45.8%) | 329 (54.2%) |
| Total (Overall) | 1,644 (53.1%) | 1,453 (46.9%) |
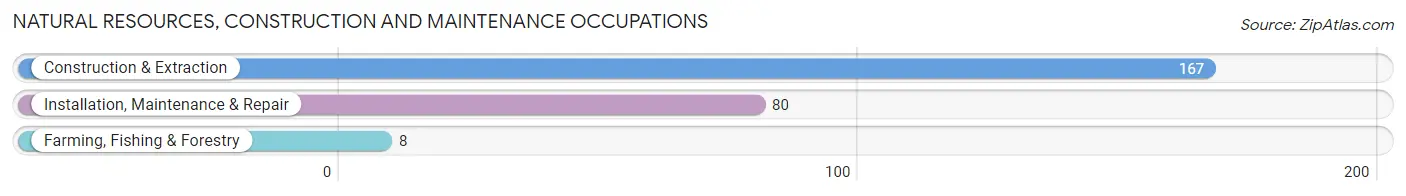
Natural Resources, Construction and Maintenance Occupations
The most common Natural Resources, Construction and Maintenance occupations in Hellertown borough are Construction & Extraction (167 | 5.4%), Installation, Maintenance & Repair (80 | 2.6%), and Farming, Fishing & Forestry (8 | 0.3%).
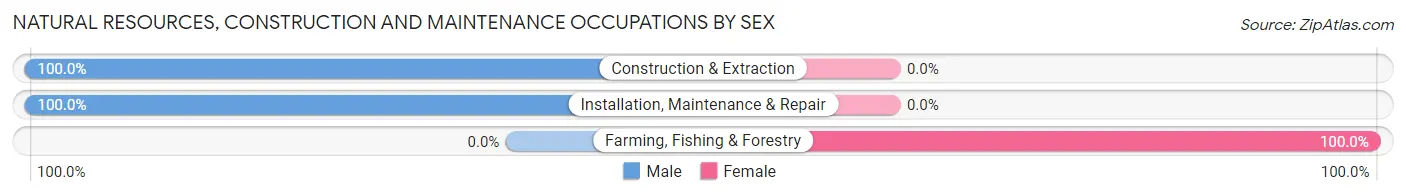
Natural Resources, Construction and Maintenance Occupations by Sex
| Occupation | Male | Female |
| Farming, Fishing & Forestry | 0 (0.0%) | 8 (100.0%) |
| Construction & Extraction | 167 (100.0%) | 0 (0.0%) |
| Installation, Maintenance & Repair | 80 (100.0%) | 0 (0.0%) |
| Total (Category) | 247 (96.9%) | 8 (3.1%) |
| Total (Overall) | 1,644 (53.1%) | 1,453 (46.9%) |
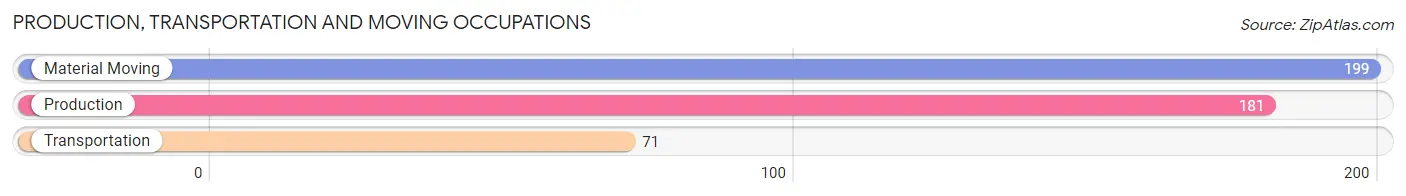
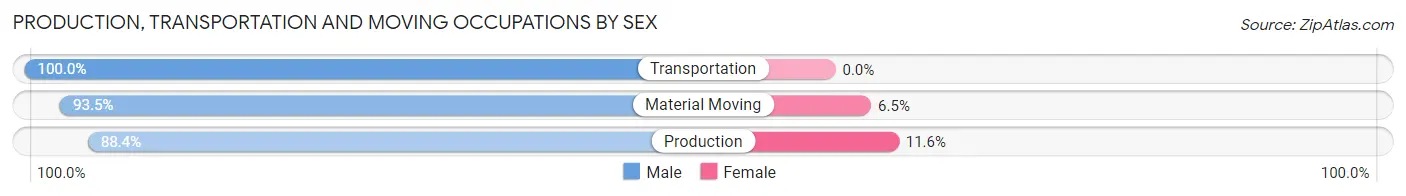
Production, Transportation and Moving Occupations
The most common Production, Transportation and Moving occupations in Hellertown borough are Material Moving (199 | 6.4%), Production (181 | 5.8%), and Transportation (71 | 2.3%).
Production, Transportation and Moving Occupations by Sex
| Occupation | Male | Female |
| Production | 160 (88.4%) | 21 (11.6%) |
| Transportation | 71 (100.0%) | 0 (0.0%) |
| Material Moving | 186 (93.5%) | 13 (6.5%) |
| Total (Category) | 417 (92.5%) | 34 (7.5%) |
| Total (Overall) | 1,644 (53.1%) | 1,453 (46.9%) |
Employment Industries by Sex in Hellertown borough
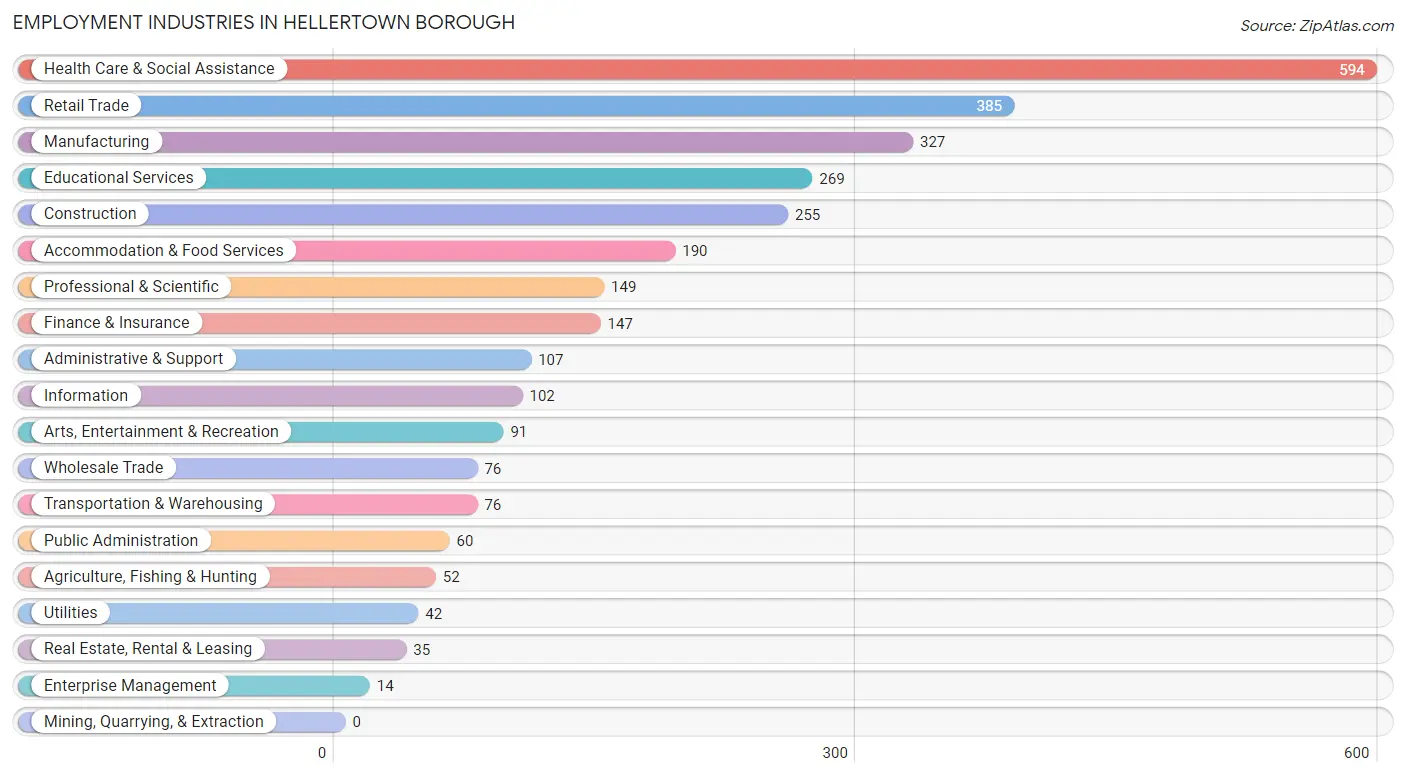
Employment Industries in Hellertown borough
The major employment industries in Hellertown borough include Health Care & Social Assistance (594 | 19.2%), Retail Trade (385 | 12.4%), Manufacturing (327 | 10.6%), Educational Services (269 | 8.7%), and Construction (255 | 8.2%).
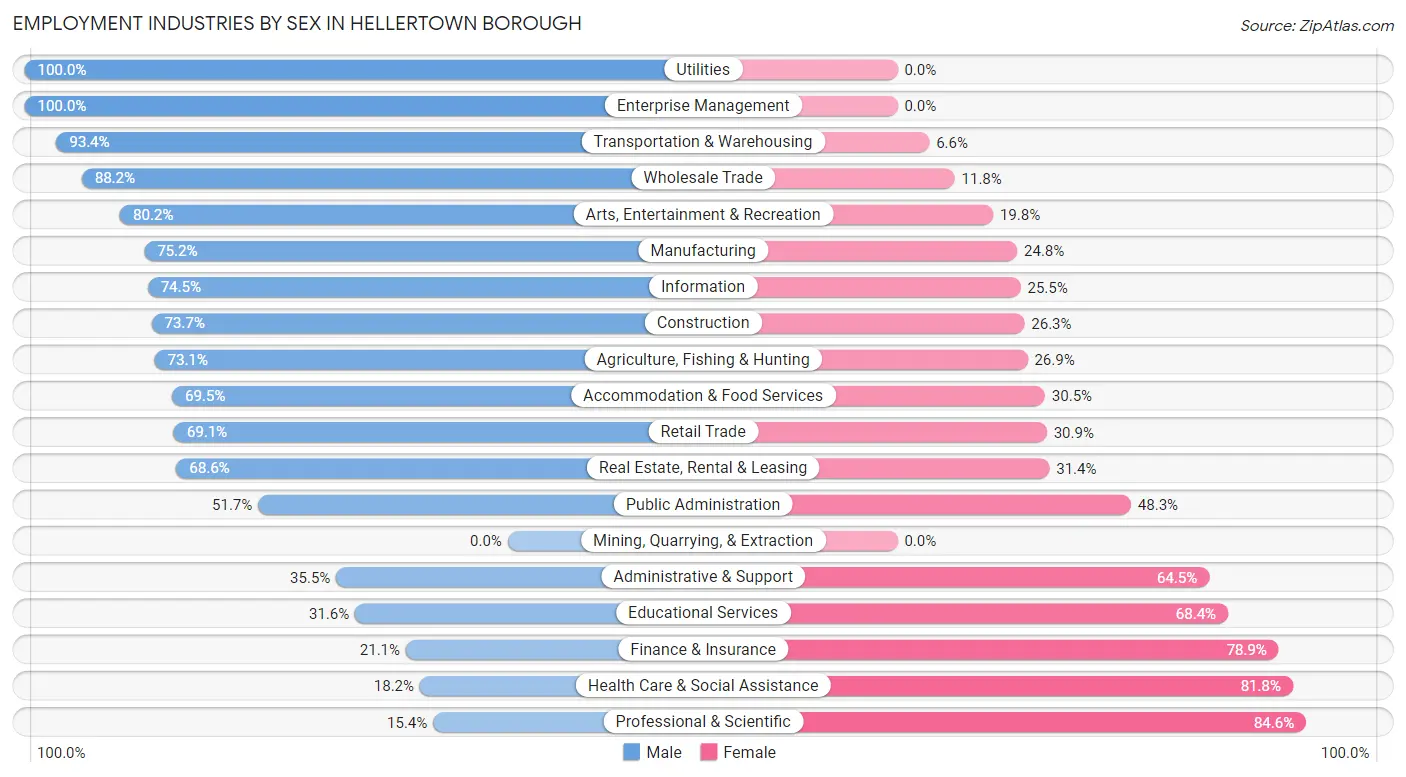
Employment Industries by Sex in Hellertown borough
The Hellertown borough industries that see more men than women are Utilities (100.0%), Enterprise Management (100.0%), and Transportation & Warehousing (93.4%), whereas the industries that tend to have a higher number of women are Professional & Scientific (84.6%), Health Care & Social Assistance (81.8%), and Finance & Insurance (78.9%).
| Industry | Male | Female |
| Agriculture, Fishing & Hunting | 38 (73.1%) | 14 (26.9%) |
| Mining, Quarrying, & Extraction | 0 (0.0%) | 0 (0.0%) |
| Construction | 188 (73.7%) | 67 (26.3%) |
| Manufacturing | 246 (75.2%) | 81 (24.8%) |
| Wholesale Trade | 67 (88.2%) | 9 (11.8%) |
| Retail Trade | 266 (69.1%) | 119 (30.9%) |
| Transportation & Warehousing | 71 (93.4%) | 5 (6.6%) |
| Utilities | 42 (100.0%) | 0 (0.0%) |
| Information | 76 (74.5%) | 26 (25.5%) |
| Finance & Insurance | 31 (21.1%) | 116 (78.9%) |
| Real Estate, Rental & Leasing | 24 (68.6%) | 11 (31.4%) |
| Professional & Scientific | 23 (15.4%) | 126 (84.6%) |
| Enterprise Management | 14 (100.0%) | 0 (0.0%) |
| Administrative & Support | 38 (35.5%) | 69 (64.5%) |
| Educational Services | 85 (31.6%) | 184 (68.4%) |
| Health Care & Social Assistance | 108 (18.2%) | 486 (81.8%) |
| Arts, Entertainment & Recreation | 73 (80.2%) | 18 (19.8%) |
| Accommodation & Food Services | 132 (69.5%) | 58 (30.5%) |
| Public Administration | 31 (51.7%) | 29 (48.3%) |
| Total | 1,644 (53.1%) | 1,453 (46.9%) |
Education in Hellertown borough
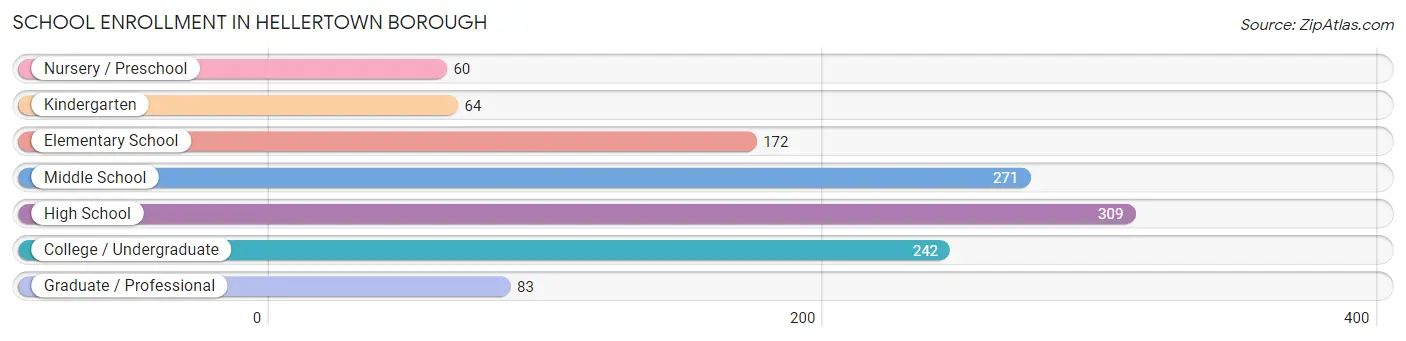
School Enrollment in Hellertown borough
The most common levels of schooling among the 1,201 students in Hellertown borough are high school (309 | 25.7%), middle school (271 | 22.6%), and college / undergraduate (242 | 20.2%).
| School Level | # Students | % Students |
| Nursery / Preschool | 60 | 5.0% |
| Kindergarten | 64 | 5.3% |
| Elementary School | 172 | 14.3% |
| Middle School | 271 | 22.6% |
| High School | 309 | 25.7% |
| College / Undergraduate | 242 | 20.2% |
| Graduate / Professional | 83 | 6.9% |
| Total | 1,201 | 100.0% |
School Enrollment by Age by Funding Source in Hellertown borough
Out of a total of 1,201 students who are enrolled in schools in Hellertown borough, 213 (17.7%) attend a private institution, while the remaining 988 (82.3%) are enrolled in public schools. The age group of 20 to 24 year olds has the highest likelihood of being enrolled in private schools, with 63 (54.3% in the age bracket) enrolled. Conversely, the age group of 15 to 17 year olds has the lowest likelihood of being enrolled in a private school, with 238 (97.9% in the age bracket) attending a public institution.
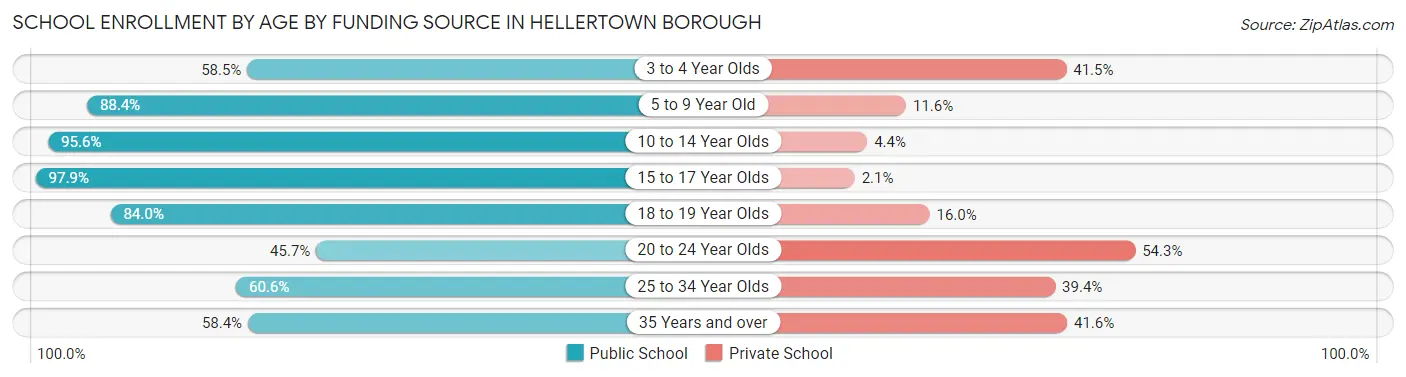
| Age Bracket | Public School | Private School |
| 3 to 4 Year Olds | 24 (58.5%) | 17 (41.5%) |
| 5 to 9 Year Old | 213 (88.4%) | 28 (11.6%) |
| 10 to 14 Year Olds | 305 (95.6%) | 14 (4.4%) |
| 15 to 17 Year Olds | 238 (97.9%) | 5 (2.1%) |
| 18 to 19 Year Olds | 42 (84.0%) | 8 (16.0%) |
| 20 to 24 Year Olds | 53 (45.7%) | 63 (54.3%) |
| 25 to 34 Year Olds | 40 (60.6%) | 26 (39.4%) |
| 35 Years and over | 73 (58.4%) | 52 (41.6%) |
| Total | 988 (82.3%) | 213 (17.7%) |
Educational Attainment by Field of Study in Hellertown borough
Education (211 | 14.7%), business (163 | 11.4%), engineering (138 | 9.6%), science & technology (135 | 9.4%), and literature & languages (129 | 9.0%) are the most common fields of study among 1,434 individuals in Hellertown borough who have obtained a bachelor's degree or higher.
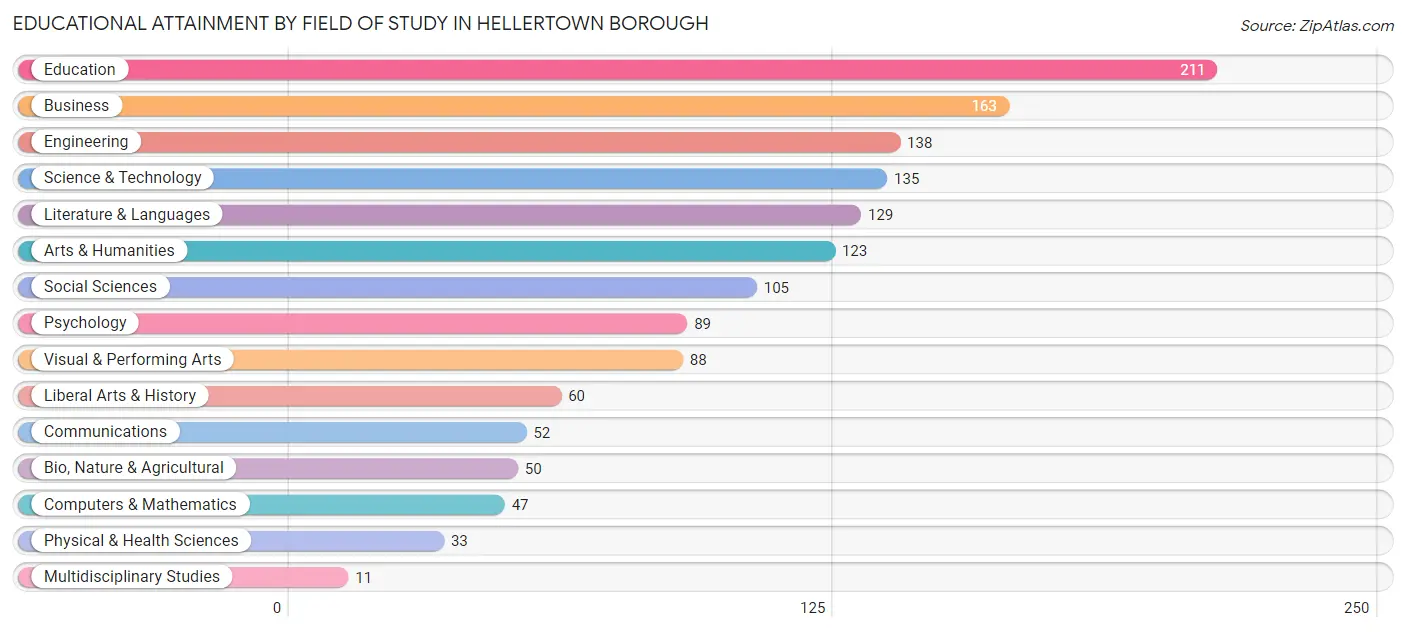
| Field of Study | # Graduates | % Graduates |
| Computers & Mathematics | 47 | 3.3% |
| Bio, Nature & Agricultural | 50 | 3.5% |
| Physical & Health Sciences | 33 | 2.3% |
| Psychology | 89 | 6.2% |
| Social Sciences | 105 | 7.3% |
| Engineering | 138 | 9.6% |
| Multidisciplinary Studies | 11 | 0.8% |
| Science & Technology | 135 | 9.4% |
| Business | 163 | 11.4% |
| Education | 211 | 14.7% |
| Literature & Languages | 129 | 9.0% |
| Liberal Arts & History | 60 | 4.2% |
| Visual & Performing Arts | 88 | 6.1% |
| Communications | 52 | 3.6% |
| Arts & Humanities | 123 | 8.6% |
| Total | 1,434 | 100.0% |
Transportation & Commute in Hellertown borough
Vehicle Availability by Sex in Hellertown borough
The most prevalent vehicle ownership categories in Hellertown borough are males with 2 vehicles (747, accounting for 46.7%) and females with 2 vehicles (437, making up 53.7%).
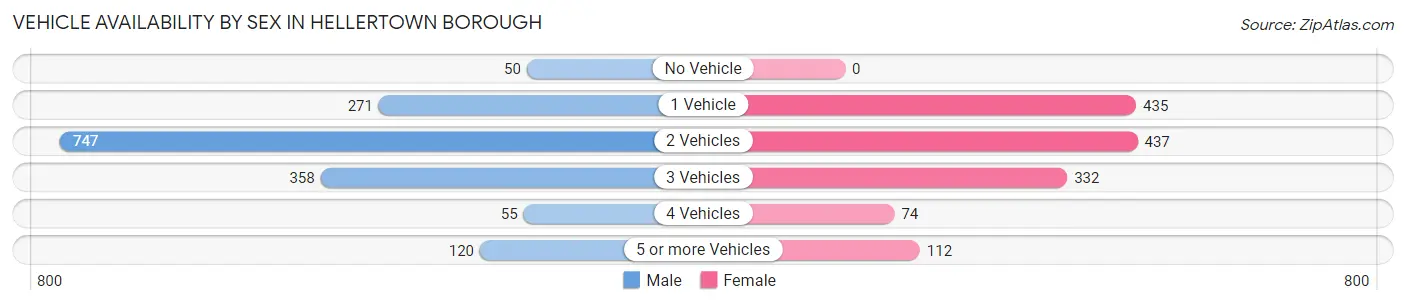
| Vehicles Available | Male | Female |
| No Vehicle | 50 (3.1%) | 0 (0.0%) |
| 1 Vehicle | 271 (16.9%) | 435 (31.3%) |
| 2 Vehicles | 747 (46.7%) | 437 (31.4%) |
| 3 Vehicles | 358 (22.4%) | 332 (23.9%) |
| 4 Vehicles | 55 (3.4%) | 74 (5.3%) |
| 5 or more Vehicles | 120 (7.5%) | 112 (8.1%) |
| Total | 1,601 (100.0%) | 1,390 (100.0%) |
Commute Time in Hellertown borough
The most frequently occuring commute durations in Hellertown borough are 15 to 19 minutes (478 commuters, 18.8%), 20 to 24 minutes (431 commuters, 16.9%), and 10 to 14 minutes (311 commuters, 12.2%).
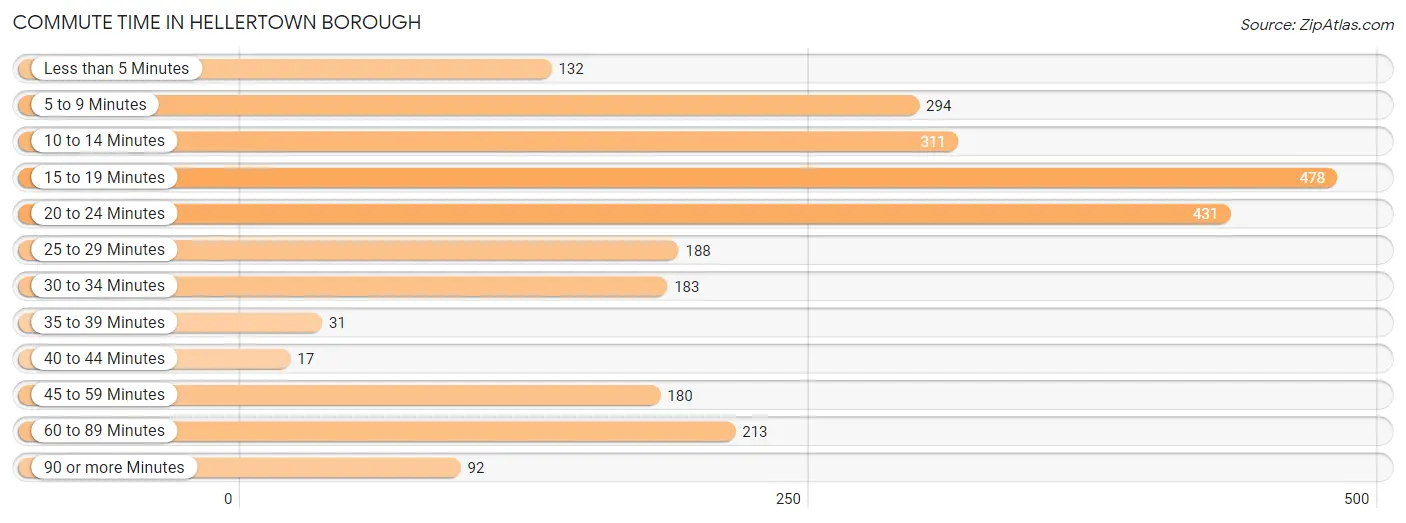
| Commute Time | # Commuters | % Commuters |
| Less than 5 Minutes | 132 | 5.2% |
| 5 to 9 Minutes | 294 | 11.5% |
| 10 to 14 Minutes | 311 | 12.2% |
| 15 to 19 Minutes | 478 | 18.8% |
| 20 to 24 Minutes | 431 | 16.9% |
| 25 to 29 Minutes | 188 | 7.4% |
| 30 to 34 Minutes | 183 | 7.2% |
| 35 to 39 Minutes | 31 | 1.2% |
| 40 to 44 Minutes | 17 | 0.7% |
| 45 to 59 Minutes | 180 | 7.1% |
| 60 to 89 Minutes | 213 | 8.4% |
| 90 or more Minutes | 92 | 3.6% |
Commute Time by Sex in Hellertown borough
The most common commute times in Hellertown borough are 15 to 19 minutes (224 commuters, 16.3%) for males and 20 to 24 minutes (258 commuters, 22.0%) for females.
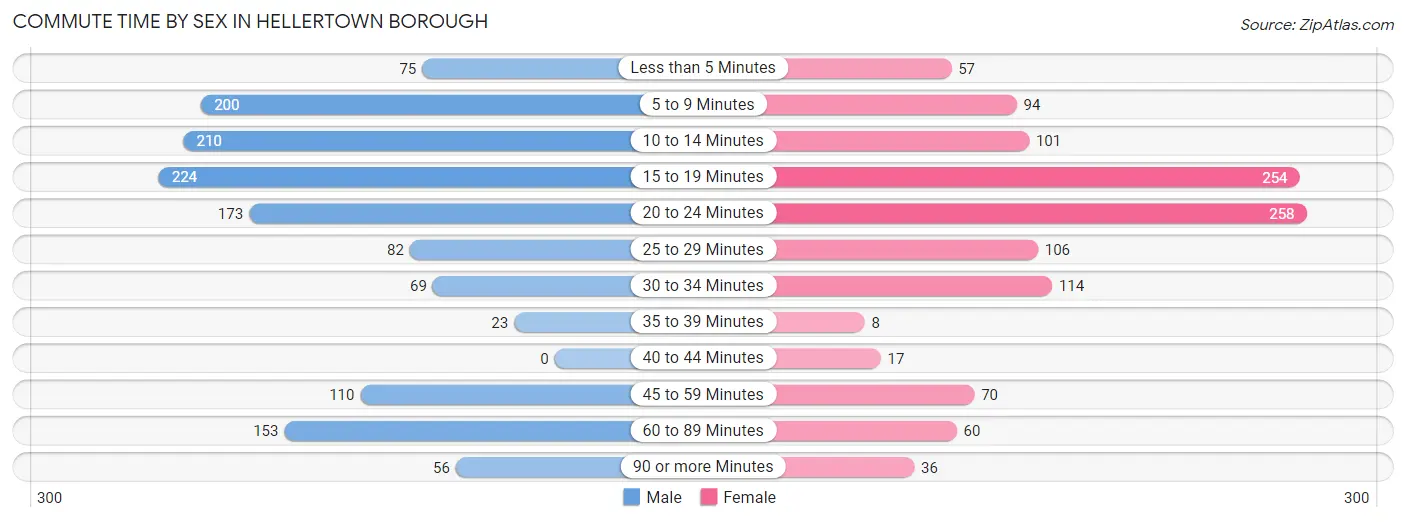
| Commute Time | Male | Female |
| Less than 5 Minutes | 75 (5.4%) | 57 (4.9%) |
| 5 to 9 Minutes | 200 (14.5%) | 94 (8.0%) |
| 10 to 14 Minutes | 210 (15.3%) | 101 (8.6%) |
| 15 to 19 Minutes | 224 (16.3%) | 254 (21.6%) |
| 20 to 24 Minutes | 173 (12.6%) | 258 (22.0%) |
| 25 to 29 Minutes | 82 (6.0%) | 106 (9.0%) |
| 30 to 34 Minutes | 69 (5.0%) | 114 (9.7%) |
| 35 to 39 Minutes | 23 (1.7%) | 8 (0.7%) |
| 40 to 44 Minutes | 0 (0.0%) | 17 (1.5%) |
| 45 to 59 Minutes | 110 (8.0%) | 70 (6.0%) |
| 60 to 89 Minutes | 153 (11.1%) | 60 (5.1%) |
| 90 or more Minutes | 56 (4.1%) | 36 (3.1%) |
Time of Departure to Work by Sex in Hellertown borough
The most frequent times of departure to work in Hellertown borough are 6:00 AM to 6:29 AM (243, 17.7%) for males and 8:00 AM to 8:29 AM (167, 14.2%) for females.
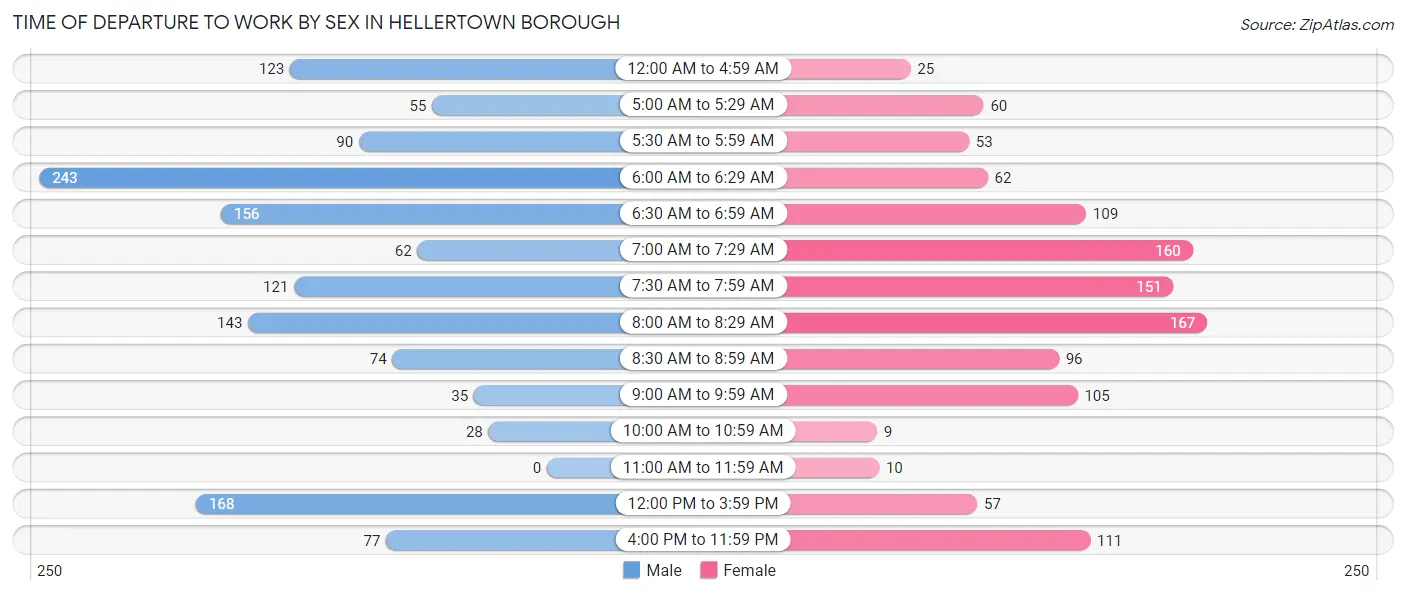
| Time of Departure | Male | Female |
| 12:00 AM to 4:59 AM | 123 (8.9%) | 25 (2.1%) |
| 5:00 AM to 5:29 AM | 55 (4.0%) | 60 (5.1%) |
| 5:30 AM to 5:59 AM | 90 (6.6%) | 53 (4.5%) |
| 6:00 AM to 6:29 AM | 243 (17.7%) | 62 (5.3%) |
| 6:30 AM to 6:59 AM | 156 (11.4%) | 109 (9.3%) |
| 7:00 AM to 7:29 AM | 62 (4.5%) | 160 (13.6%) |
| 7:30 AM to 7:59 AM | 121 (8.8%) | 151 (12.9%) |
| 8:00 AM to 8:29 AM | 143 (10.4%) | 167 (14.2%) |
| 8:30 AM to 8:59 AM | 74 (5.4%) | 96 (8.2%) |
| 9:00 AM to 9:59 AM | 35 (2.5%) | 105 (8.9%) |
| 10:00 AM to 10:59 AM | 28 (2.0%) | 9 (0.8%) |
| 11:00 AM to 11:59 AM | 0 (0.0%) | 10 (0.9%) |
| 12:00 PM to 3:59 PM | 168 (12.2%) | 57 (4.9%) |
| 4:00 PM to 11:59 PM | 77 (5.6%) | 111 (9.5%) |
| Total | 1,375 (100.0%) | 1,175 (100.0%) |
Housing Occupancy in Hellertown borough
Occupancy by Ownership in Hellertown borough
Of the total 2,544 dwellings in Hellertown borough, owner-occupied units account for 1,743 (68.5%), while renter-occupied units make up 801 (31.5%).
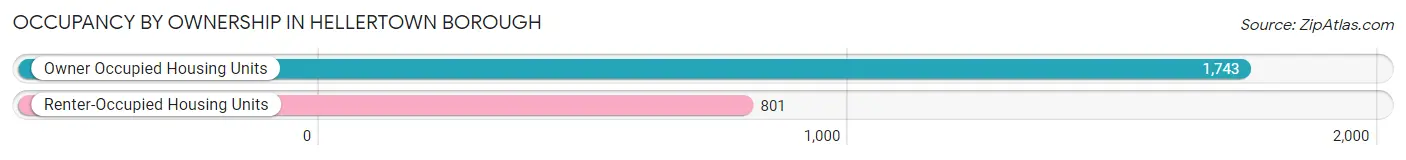
| Occupancy | # Housing Units | % Housing Units |
| Owner Occupied Housing Units | 1,743 | 68.5% |
| Renter-Occupied Housing Units | 801 | 31.5% |
| Total Occupied Housing Units | 2,544 | 100.0% |
Occupancy by Household Size in Hellertown borough
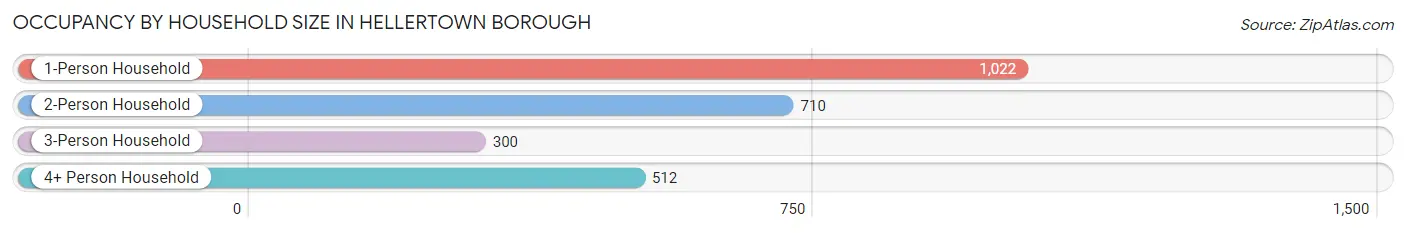
| Household Size | # Housing Units | % Housing Units |
| 1-Person Household | 1,022 | 40.2% |
| 2-Person Household | 710 | 27.9% |
| 3-Person Household | 300 | 11.8% |
| 4+ Person Household | 512 | 20.1% |
| Total Housing Units | 2,544 | 100.0% |
Occupancy by Ownership by Household Size in Hellertown borough
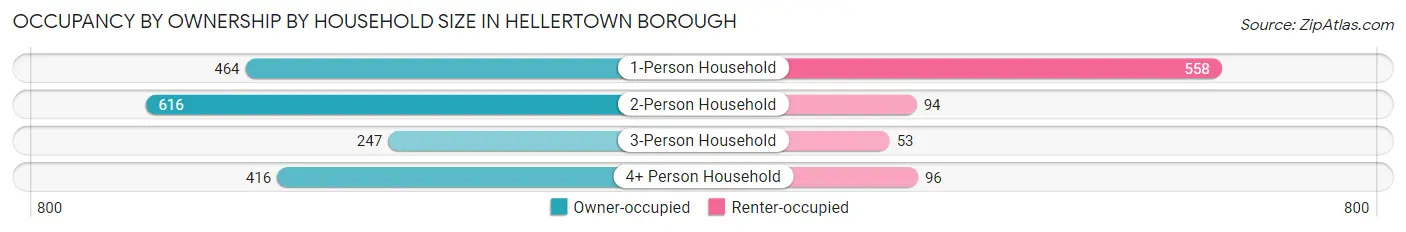
| Household Size | Owner-occupied | Renter-occupied |
| 1-Person Household | 464 (45.4%) | 558 (54.6%) |
| 2-Person Household | 616 (86.8%) | 94 (13.2%) |
| 3-Person Household | 247 (82.3%) | 53 (17.7%) |
| 4+ Person Household | 416 (81.2%) | 96 (18.8%) |
| Total Housing Units | 1,743 (68.5%) | 801 (31.5%) |
Occupancy by Educational Attainment in Hellertown borough
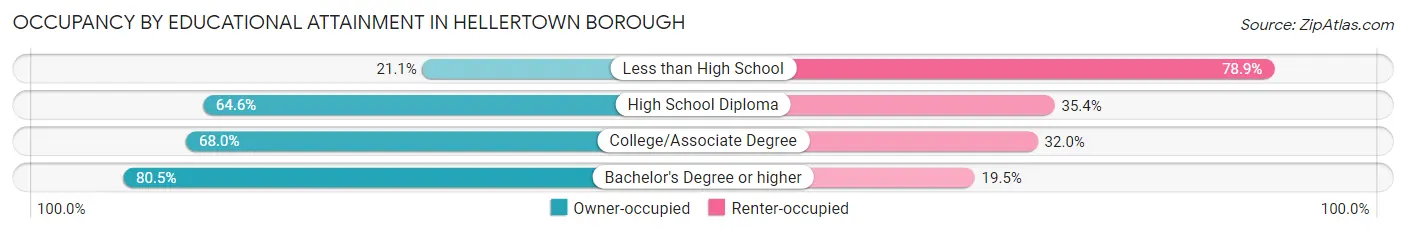
| Household Size | Owner-occupied | Renter-occupied |
| Less than High School | 27 (21.1%) | 101 (78.9%) |
| High School Diploma | 543 (64.6%) | 297 (35.4%) |
| College/Associate Degree | 518 (68.0%) | 244 (32.0%) |
| Bachelor's Degree or higher | 655 (80.5%) | 159 (19.5%) |
Occupancy by Age of Householder in Hellertown borough
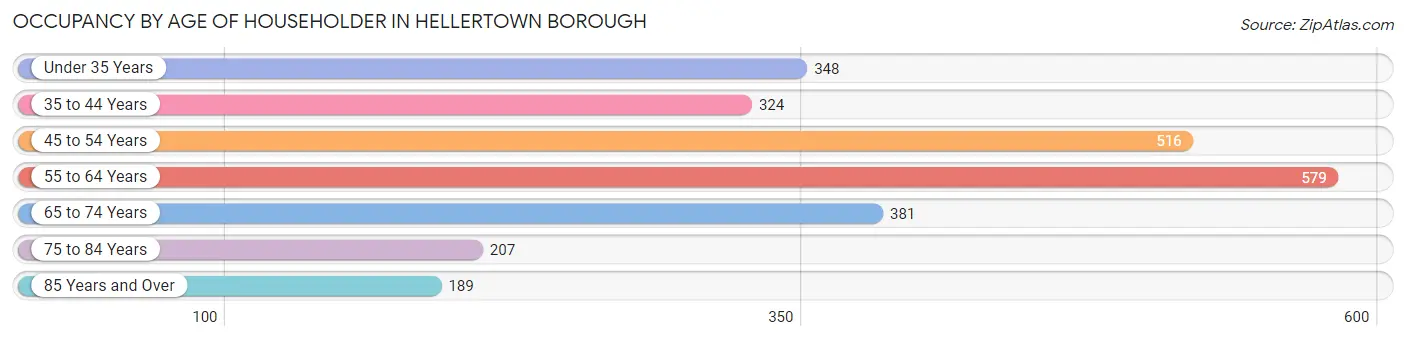
| Age Bracket | # Households | % Households |
| Under 35 Years | 348 | 13.7% |
| 35 to 44 Years | 324 | 12.7% |
| 45 to 54 Years | 516 | 20.3% |
| 55 to 64 Years | 579 | 22.8% |
| 65 to 74 Years | 381 | 15.0% |
| 75 to 84 Years | 207 | 8.1% |
| 85 Years and Over | 189 | 7.4% |
| Total | 2,544 | 100.0% |
Housing Finances in Hellertown borough
Median Income by Occupancy in Hellertown borough
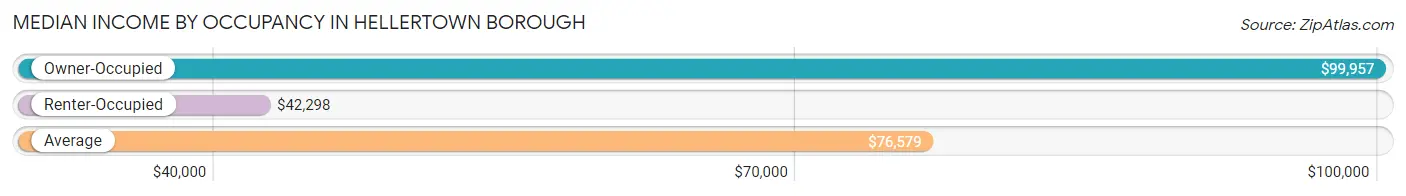
| Occupancy Type | # Households | Median Income |
| Owner-Occupied | 1,743 (68.5%) | $99,957 |
| Renter-Occupied | 801 (31.5%) | $42,298 |
| Average | 2,544 (100.0%) | $76,579 |
Occupancy by Householder Income Bracket in Hellertown borough
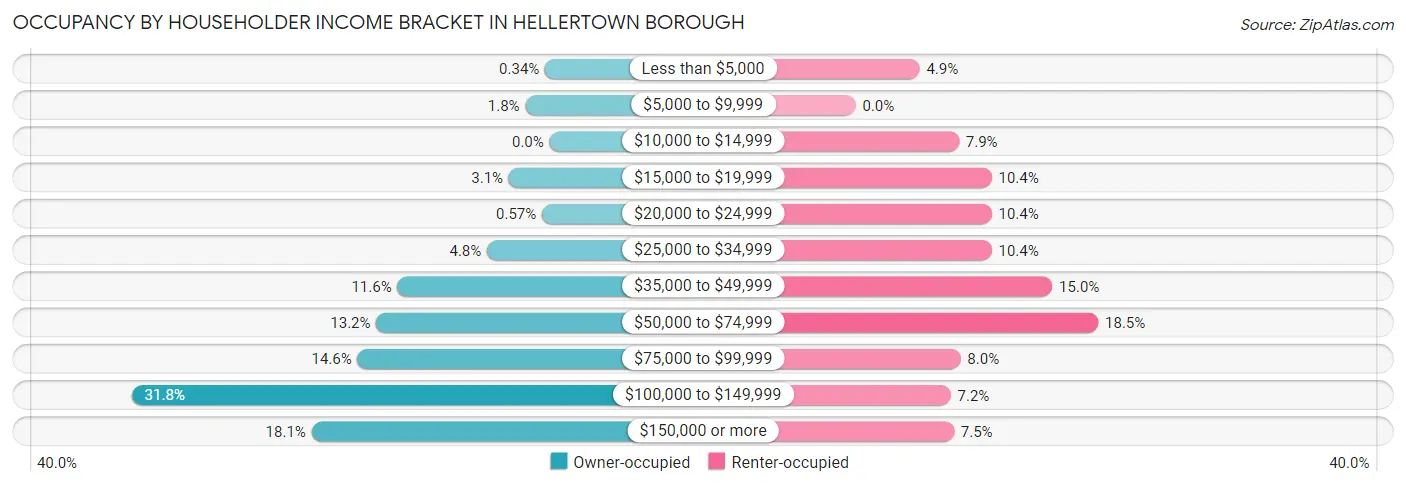
| Income Bracket | Owner-occupied | Renter-occupied |
| Less than $5,000 | 6 (0.3%) | 39 (4.9%) |
| $5,000 to $9,999 | 32 (1.8%) | 0 (0.0%) |
| $10,000 to $14,999 | 0 (0.0%) | 63 (7.9%) |
| $15,000 to $19,999 | 54 (3.1%) | 83 (10.4%) |
| $20,000 to $24,999 | 10 (0.6%) | 83 (10.4%) |
| $25,000 to $34,999 | 83 (4.8%) | 83 (10.4%) |
| $35,000 to $49,999 | 202 (11.6%) | 120 (15.0%) |
| $50,000 to $74,999 | 230 (13.2%) | 148 (18.5%) |
| $75,000 to $99,999 | 255 (14.6%) | 64 (8.0%) |
| $100,000 to $149,999 | 555 (31.8%) | 58 (7.2%) |
| $150,000 or more | 316 (18.1%) | 60 (7.5%) |
| Total | 1,743 (100.0%) | 801 (100.0%) |
Monthly Housing Cost Tiers in Hellertown borough
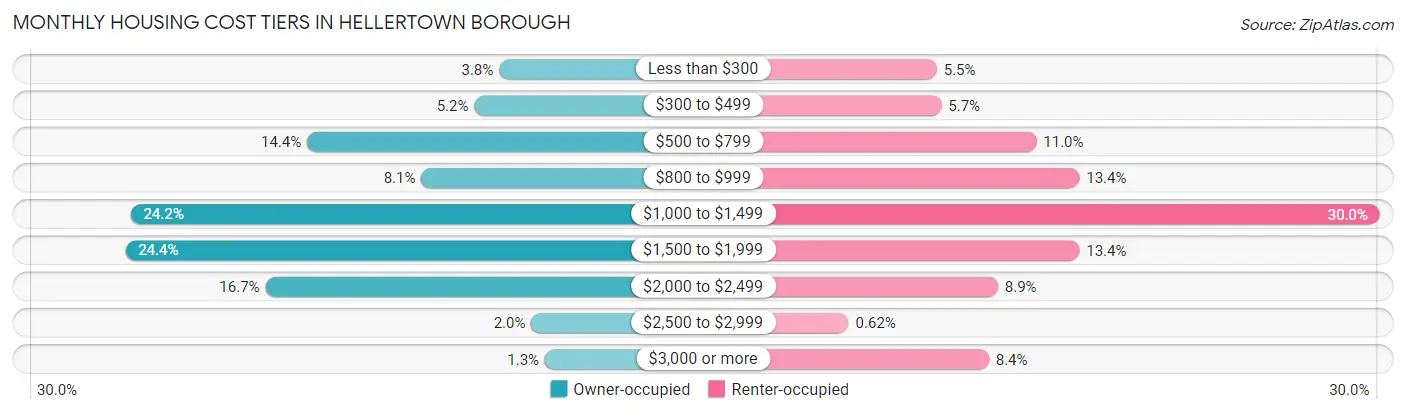
| Monthly Cost | Owner-occupied | Renter-occupied |
| Less than $300 | 66 (3.8%) | 44 (5.5%) |
| $300 to $499 | 90 (5.2%) | 46 (5.7%) |
| $500 to $799 | 251 (14.4%) | 88 (11.0%) |
| $800 to $999 | 141 (8.1%) | 107 (13.4%) |
| $1,000 to $1,499 | 421 (24.1%) | 240 (30.0%) |
| $1,500 to $1,999 | 426 (24.4%) | 107 (13.4%) |
| $2,000 to $2,499 | 291 (16.7%) | 71 (8.9%) |
| $2,500 to $2,999 | 35 (2.0%) | 5 (0.6%) |
| $3,000 or more | 22 (1.3%) | 67 (8.4%) |
| Total | 1,743 (100.0%) | 801 (100.0%) |
Physical Housing Characteristics in Hellertown borough
Housing Structures in Hellertown borough
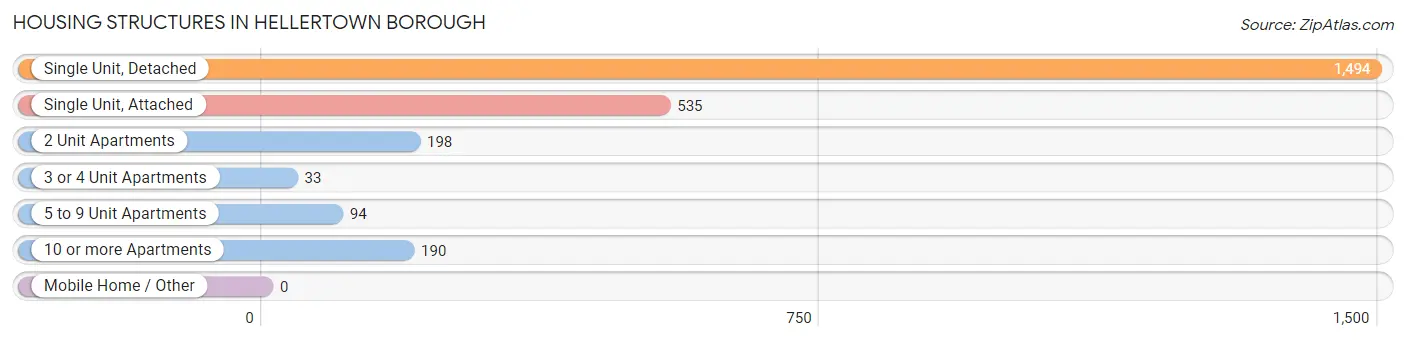
| Structure Type | # Housing Units | % Housing Units |
| Single Unit, Detached | 1,494 | 58.7% |
| Single Unit, Attached | 535 | 21.0% |
| 2 Unit Apartments | 198 | 7.8% |
| 3 or 4 Unit Apartments | 33 | 1.3% |
| 5 to 9 Unit Apartments | 94 | 3.7% |
| 10 or more Apartments | 190 | 7.5% |
| Mobile Home / Other | 0 | 0.0% |
| Total | 2,544 | 100.0% |
Housing Structures by Occupancy in Hellertown borough
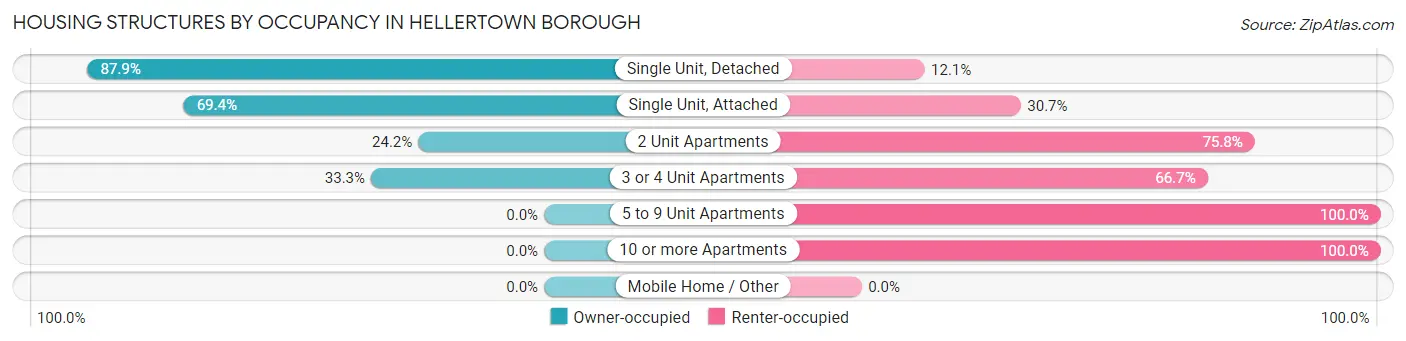
| Structure Type | Owner-occupied | Renter-occupied |
| Single Unit, Detached | 1,313 (87.9%) | 181 (12.1%) |
| Single Unit, Attached | 371 (69.4%) | 164 (30.6%) |
| 2 Unit Apartments | 48 (24.2%) | 150 (75.8%) |
| 3 or 4 Unit Apartments | 11 (33.3%) | 22 (66.7%) |
| 5 to 9 Unit Apartments | 0 (0.0%) | 94 (100.0%) |
| 10 or more Apartments | 0 (0.0%) | 190 (100.0%) |
| Mobile Home / Other | 0 (0.0%) | 0 (0.0%) |
| Total | 1,743 (68.5%) | 801 (31.5%) |
Housing Structures by Number of Rooms in Hellertown borough
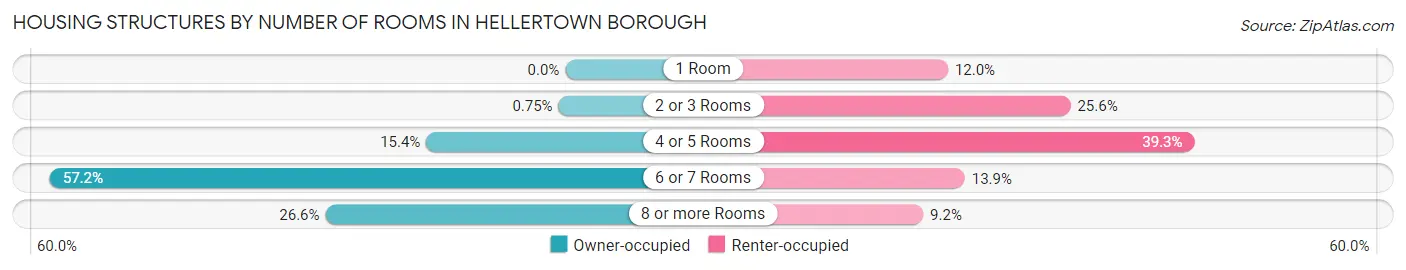
| Number of Rooms | Owner-occupied | Renter-occupied |
| 1 Room | 0 (0.0%) | 96 (12.0%) |
| 2 or 3 Rooms | 13 (0.7%) | 205 (25.6%) |
| 4 or 5 Rooms | 269 (15.4%) | 315 (39.3%) |
| 6 or 7 Rooms | 997 (57.2%) | 111 (13.9%) |
| 8 or more Rooms | 464 (26.6%) | 74 (9.2%) |
| Total | 1,743 (100.0%) | 801 (100.0%) |
Housing Structure by Heating Type in Hellertown borough
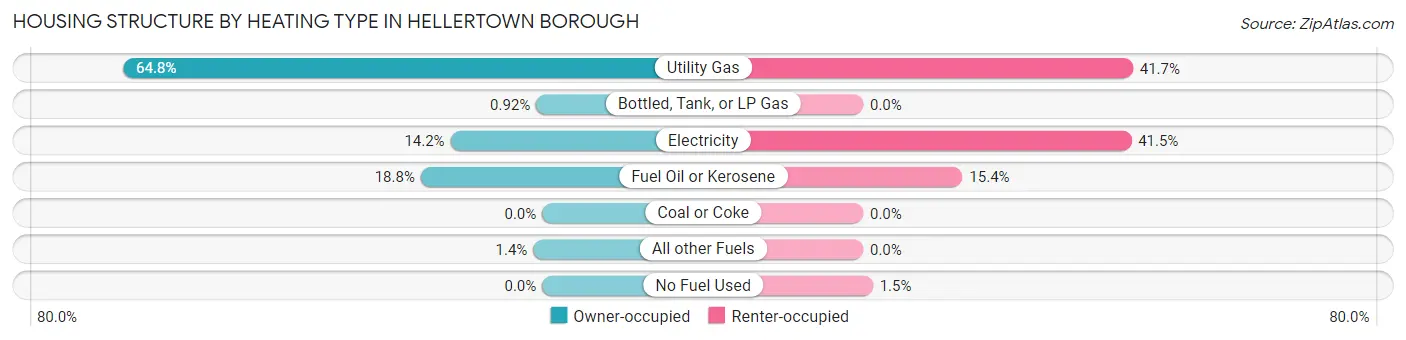
| Heating Type | Owner-occupied | Renter-occupied |
| Utility Gas | 1,129 (64.8%) | 334 (41.7%) |
| Bottled, Tank, or LP Gas | 16 (0.9%) | 0 (0.0%) |
| Electricity | 247 (14.2%) | 332 (41.4%) |
| Fuel Oil or Kerosene | 327 (18.8%) | 123 (15.4%) |
| Coal or Coke | 0 (0.0%) | 0 (0.0%) |
| All other Fuels | 24 (1.4%) | 0 (0.0%) |
| No Fuel Used | 0 (0.0%) | 12 (1.5%) |
| Total | 1,743 (100.0%) | 801 (100.0%) |
Household Vehicle Usage in Hellertown borough
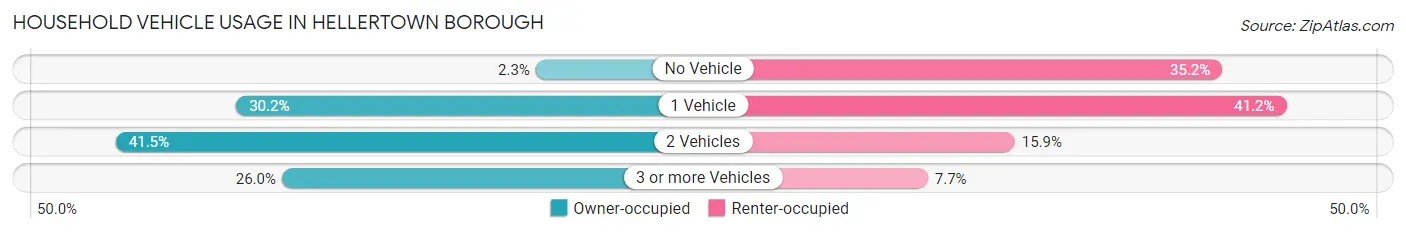
| Vehicles per Household | Owner-occupied | Renter-occupied |
| No Vehicle | 40 (2.3%) | 282 (35.2%) |
| 1 Vehicle | 527 (30.2%) | 330 (41.2%) |
| 2 Vehicles | 723 (41.5%) | 127 (15.9%) |
| 3 or more Vehicles | 453 (26.0%) | 62 (7.7%) |
| Total | 1,743 (100.0%) | 801 (100.0%) |
Real Estate & Mortgages in Hellertown borough
Real Estate and Mortgage Overview in Hellertown borough
| Characteristic | Without Mortgage | With Mortgage |
| Housing Units | 451 | 1,292 |
| Median Property Value | $219,900 | $222,800 |
| Median Household Income | $52,917 | $274 |
| Monthly Housing Costs | $608 | $22 |
| Real Estate Taxes | $3,847 | $0 |
Property Value by Mortgage Status in Hellertown borough
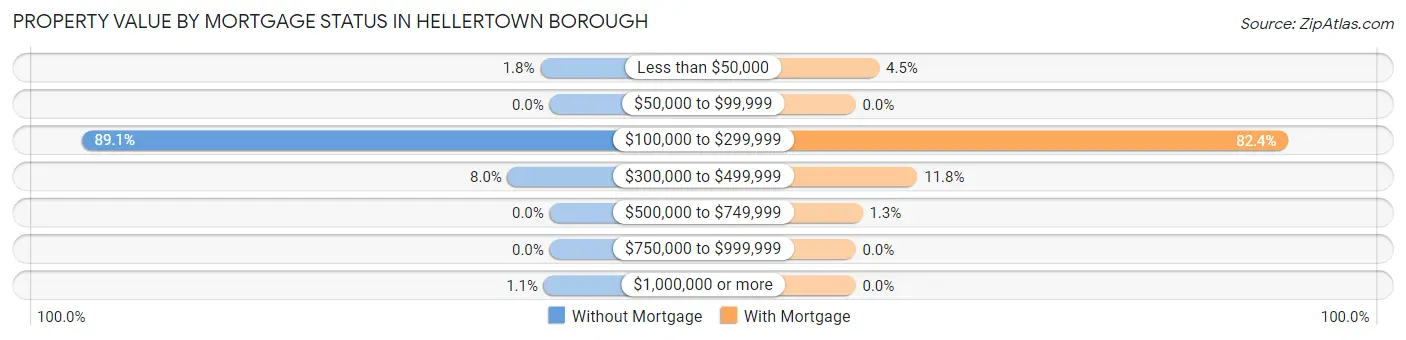
| Property Value | Without Mortgage | With Mortgage |
| Less than $50,000 | 8 (1.8%) | 58 (4.5%) |
| $50,000 to $99,999 | 0 (0.0%) | 0 (0.0%) |
| $100,000 to $299,999 | 402 (89.1%) | 1,065 (82.4%) |
| $300,000 to $499,999 | 36 (8.0%) | 152 (11.8%) |
| $500,000 to $749,999 | 0 (0.0%) | 17 (1.3%) |
| $750,000 to $999,999 | 0 (0.0%) | 0 (0.0%) |
| $1,000,000 or more | 5 (1.1%) | 0 (0.0%) |
| Total | 451 (100.0%) | 1,292 (100.0%) |
Household Income by Mortgage Status in Hellertown borough
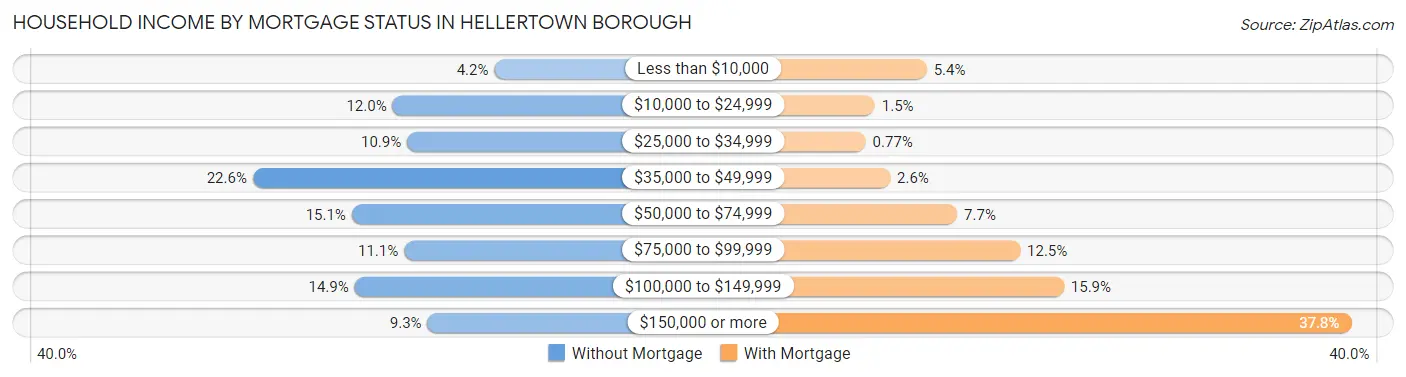
| Household Income | Without Mortgage | With Mortgage |
| Less than $10,000 | 19 (4.2%) | 70 (5.4%) |
| $10,000 to $24,999 | 54 (12.0%) | 19 (1.5%) |
| $25,000 to $34,999 | 49 (10.9%) | 10 (0.8%) |
| $35,000 to $49,999 | 102 (22.6%) | 34 (2.6%) |
| $50,000 to $74,999 | 68 (15.1%) | 100 (7.7%) |
| $75,000 to $99,999 | 50 (11.1%) | 162 (12.5%) |
| $100,000 to $149,999 | 67 (14.9%) | 205 (15.9%) |
| $150,000 or more | 42 (9.3%) | 488 (37.8%) |
| Total | 451 (100.0%) | 1,292 (100.0%) |
Property Value to Household Income Ratio in Hellertown borough
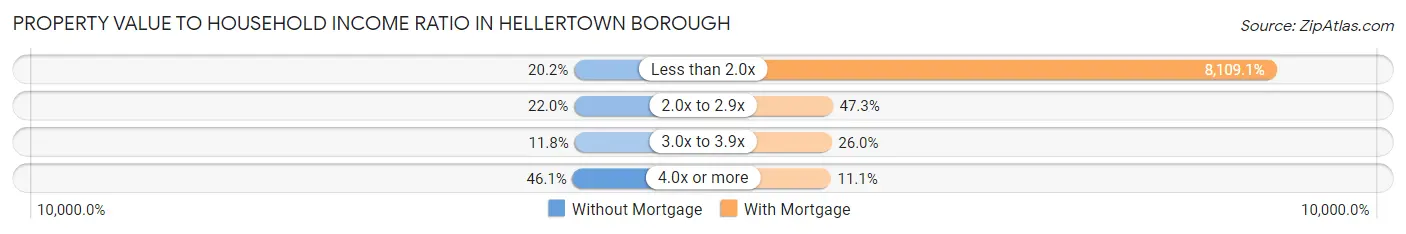
| Value-to-Income Ratio | Without Mortgage | With Mortgage |
| Less than 2.0x | 91 (20.2%) | 104,770 (8,109.1%) |
| 2.0x to 2.9x | 99 (22.0%) | 611 (47.3%) |
| 3.0x to 3.9x | 53 (11.7%) | 336 (26.0%) |
| 4.0x or more | 208 (46.1%) | 143 (11.1%) |
| Total | 451 (100.0%) | 1,292 (100.0%) |
Real Estate Taxes by Mortgage Status in Hellertown borough
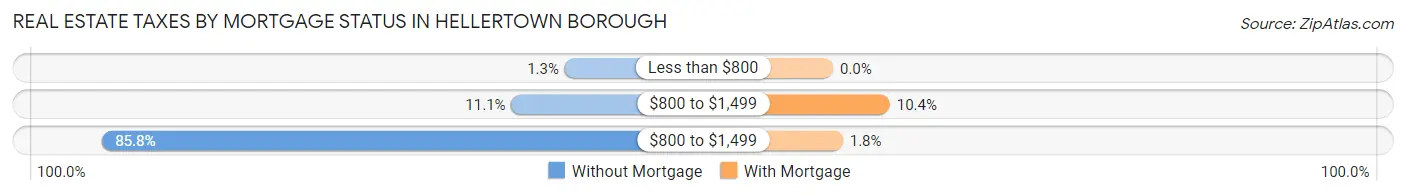
| Property Taxes | Without Mortgage | With Mortgage |
| Less than $800 | 6 (1.3%) | 0 (0.0%) |
| $800 to $1,499 | 50 (11.1%) | 134 (10.4%) |
| $800 to $1,499 | 387 (85.8%) | 23 (1.8%) |
| Total | 451 (100.0%) | 1,292 (100.0%) |
Health & Disability in Hellertown borough
Health Insurance Coverage by Age in Hellertown borough
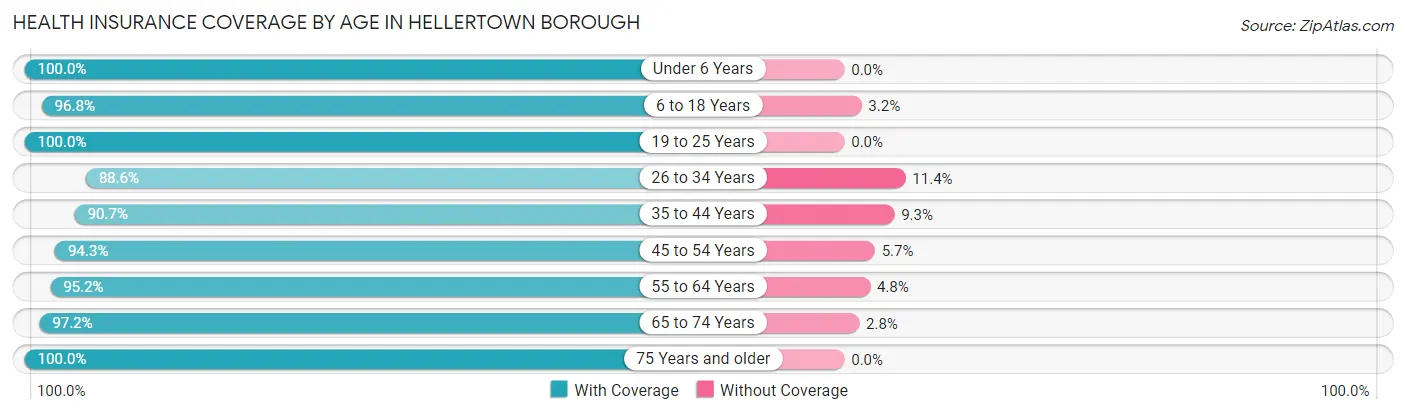
| Age Bracket | With Coverage | Without Coverage |
| Under 6 Years | 363 (100.0%) | 0 (0.0%) |
| 6 to 18 Years | 881 (96.8%) | 29 (3.2%) |
| 19 to 25 Years | 355 (100.0%) | 0 (0.0%) |
| 26 to 34 Years | 583 (88.6%) | 75 (11.4%) |
| 35 to 44 Years | 711 (90.7%) | 73 (9.3%) |
| 45 to 54 Years | 832 (94.3%) | 50 (5.7%) |
| 55 to 64 Years | 857 (95.2%) | 43 (4.8%) |
| 65 to 74 Years | 564 (97.2%) | 16 (2.8%) |
| 75 Years and older | 532 (100.0%) | 0 (0.0%) |
| Total | 5,678 (95.2%) | 286 (4.8%) |
Health Insurance Coverage by Citizenship Status in Hellertown borough
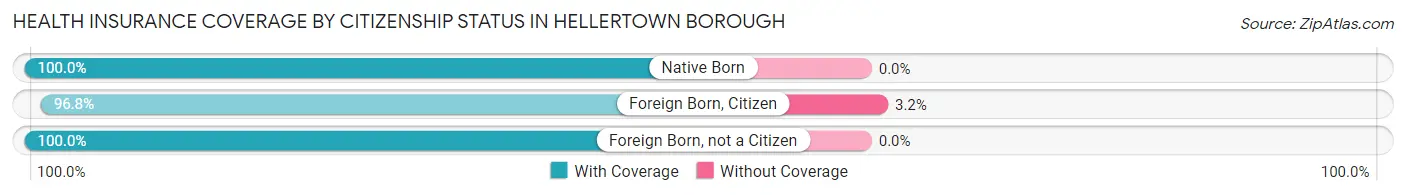
| Citizenship Status | With Coverage | Without Coverage |
| Native Born | 363 (100.0%) | 0 (0.0%) |
| Foreign Born, Citizen | 881 (96.8%) | 29 (3.2%) |
| Foreign Born, not a Citizen | 355 (100.0%) | 0 (0.0%) |
Health Insurance Coverage by Household Income in Hellertown borough
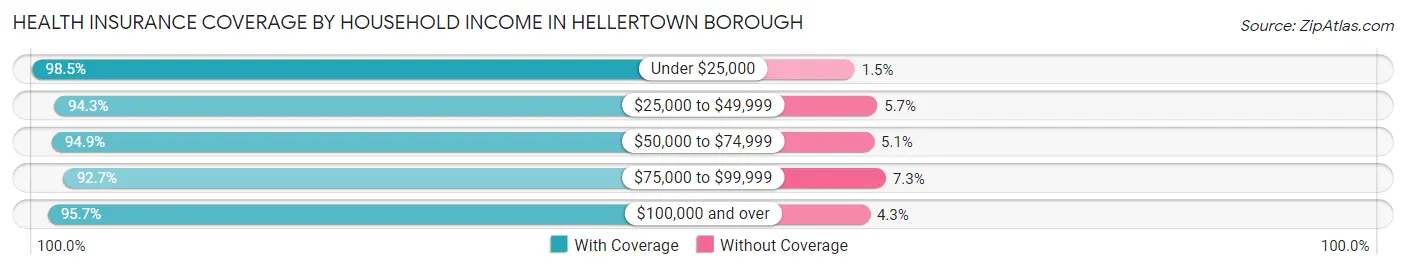
| Household Income | With Coverage | Without Coverage |
| Under $25,000 | 459 (98.5%) | 7 (1.5%) |
| $25,000 to $49,999 | 627 (94.3%) | 38 (5.7%) |
| $50,000 to $74,999 | 871 (94.9%) | 47 (5.1%) |
| $75,000 to $99,999 | 771 (92.7%) | 61 (7.3%) |
| $100,000 and over | 2,935 (95.7%) | 133 (4.3%) |
Public vs Private Health Insurance Coverage by Age in Hellertown borough
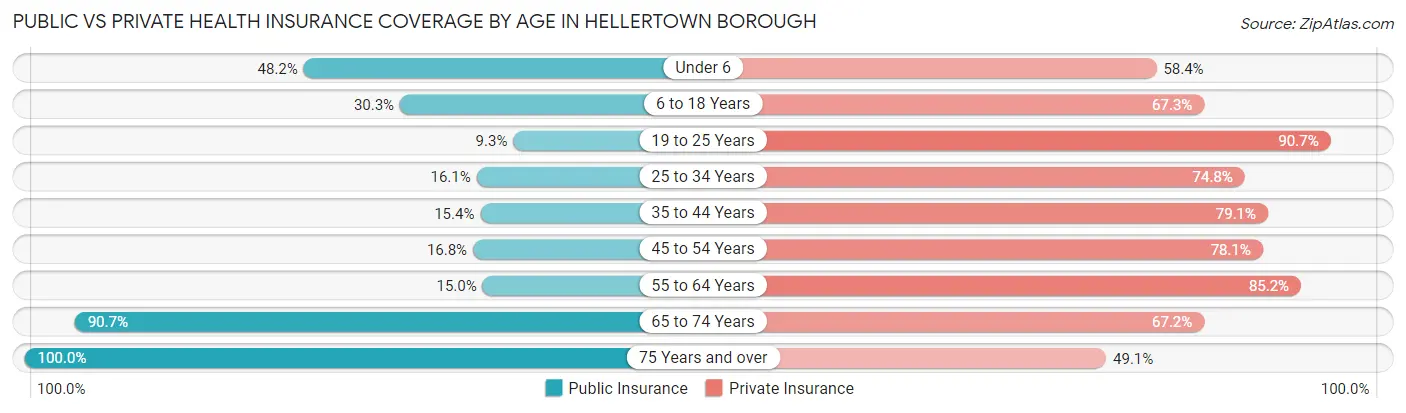
| Age Bracket | Public Insurance | Private Insurance |
| Under 6 | 175 (48.2%) | 212 (58.4%) |
| 6 to 18 Years | 276 (30.3%) | 612 (67.2%) |
| 19 to 25 Years | 33 (9.3%) | 322 (90.7%) |
| 25 to 34 Years | 106 (16.1%) | 492 (74.8%) |
| 35 to 44 Years | 121 (15.4%) | 620 (79.1%) |
| 45 to 54 Years | 148 (16.8%) | 689 (78.1%) |
| 55 to 64 Years | 135 (15.0%) | 767 (85.2%) |
| 65 to 74 Years | 526 (90.7%) | 390 (67.2%) |
| 75 Years and over | 532 (100.0%) | 261 (49.1%) |
| Total | 2,052 (34.4%) | 4,365 (73.2%) |
Disability Status by Sex by Age in Hellertown borough
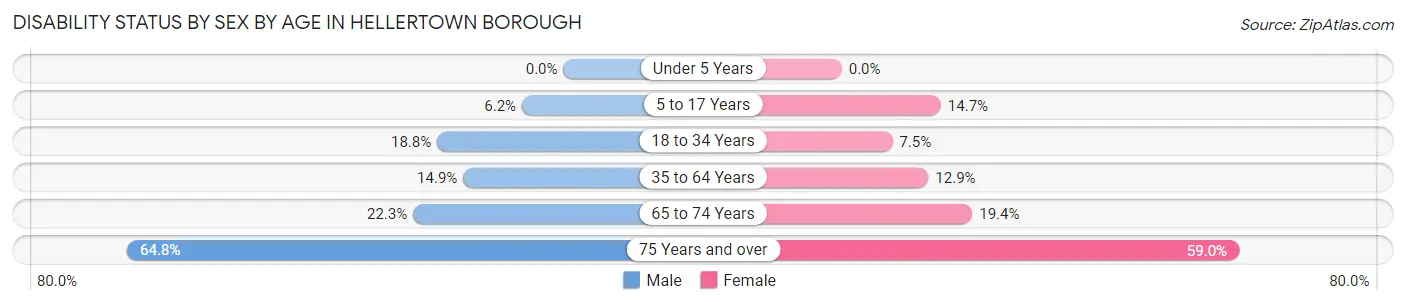
| Age Bracket | Male | Female |
| Under 5 Years | 0 (0.0%) | 0 (0.0%) |
| 5 to 17 Years | 22 (6.1%) | 83 (14.7%) |
| 18 to 34 Years | 87 (18.8%) | 43 (7.5%) |
| 35 to 64 Years | 206 (14.9%) | 152 (12.9%) |
| 65 to 74 Years | 50 (22.3%) | 69 (19.4%) |
| 75 Years and over | 171 (64.8%) | 158 (59.0%) |
Disability Class by Sex by Age in Hellertown borough
Disability Class: Hearing Difficulty
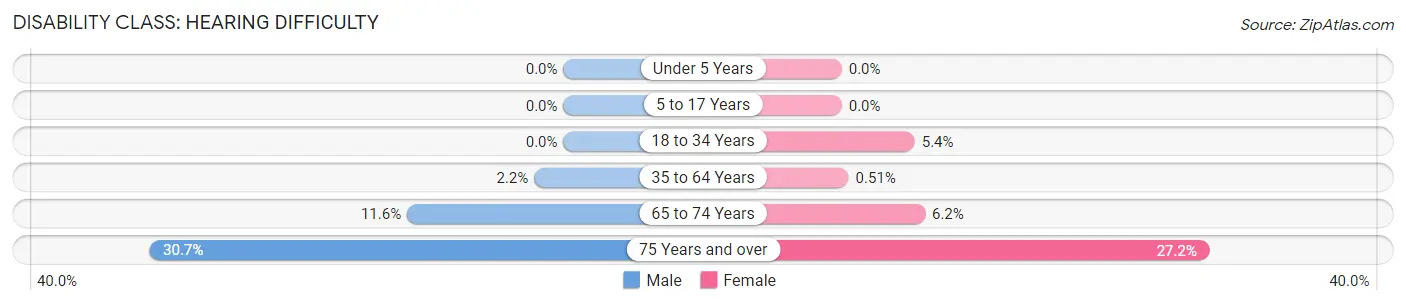
| Age Bracket | Male | Female |
| Under 5 Years | 0 (0.0%) | 0 (0.0%) |
| 5 to 17 Years | 0 (0.0%) | 0 (0.0%) |
| 18 to 34 Years | 0 (0.0%) | 31 (5.4%) |
| 35 to 64 Years | 30 (2.2%) | 6 (0.5%) |
| 65 to 74 Years | 26 (11.6%) | 22 (6.2%) |
| 75 Years and over | 81 (30.7%) | 73 (27.2%) |
Disability Class: Vision Difficulty
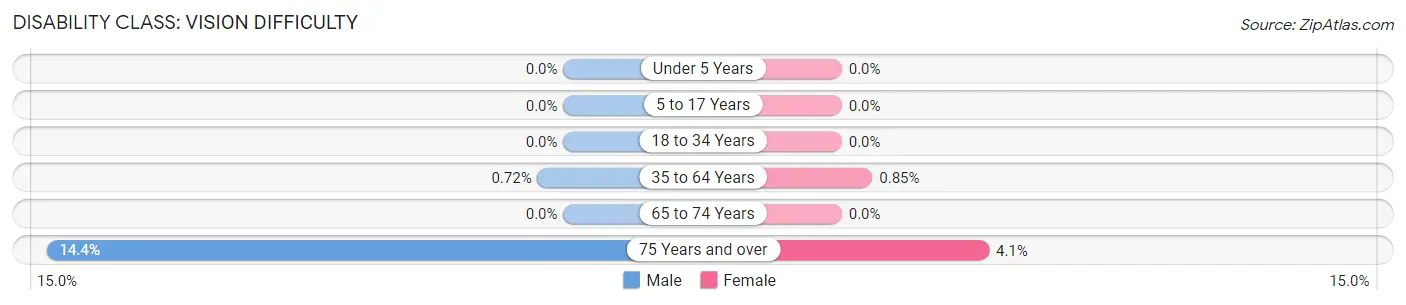
| Age Bracket | Male | Female |
| Under 5 Years | 0 (0.0%) | 0 (0.0%) |
| 5 to 17 Years | 0 (0.0%) | 0 (0.0%) |
| 18 to 34 Years | 0 (0.0%) | 0 (0.0%) |
| 35 to 64 Years | 10 (0.7%) | 10 (0.9%) |
| 65 to 74 Years | 0 (0.0%) | 0 (0.0%) |
| 75 Years and over | 38 (14.4%) | 11 (4.1%) |
Disability Class: Cognitive Difficulty
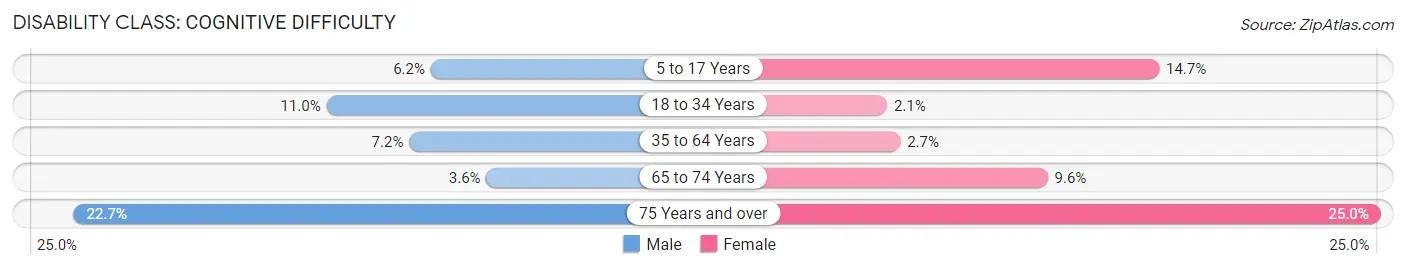
| Age Bracket | Male | Female |
| 5 to 17 Years | 22 (6.1%) | 83 (14.7%) |
| 18 to 34 Years | 51 (11.0%) | 12 (2.1%) |
| 35 to 64 Years | 99 (7.1%) | 32 (2.7%) |
| 65 to 74 Years | 8 (3.6%) | 34 (9.6%) |
| 75 Years and over | 60 (22.7%) | 67 (25.0%) |
Disability Class: Ambulatory Difficulty
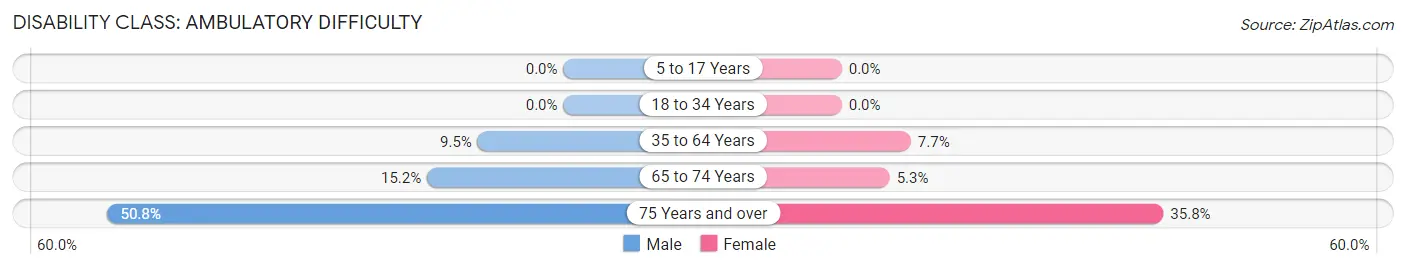
| Age Bracket | Male | Female |
| 5 to 17 Years | 0 (0.0%) | 0 (0.0%) |
| 18 to 34 Years | 0 (0.0%) | 0 (0.0%) |
| 35 to 64 Years | 132 (9.5%) | 91 (7.7%) |
| 65 to 74 Years | 34 (15.2%) | 19 (5.3%) |
| 75 Years and over | 134 (50.8%) | 96 (35.8%) |
Disability Class: Self-Care Difficulty
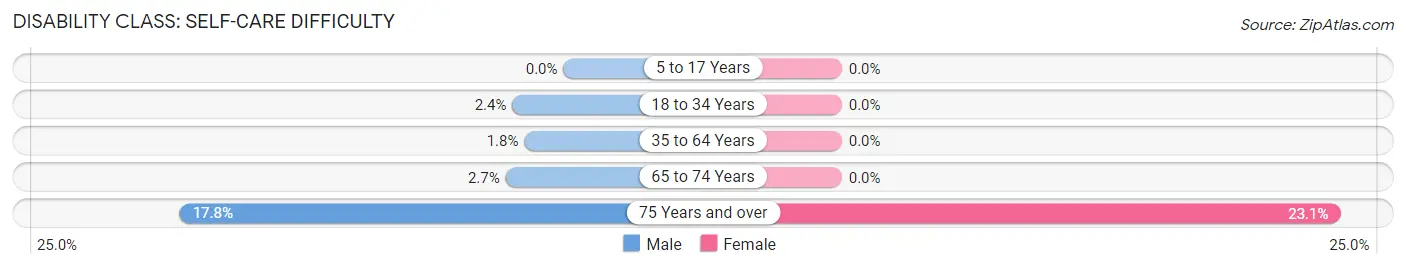
| Age Bracket | Male | Female |
| 5 to 17 Years | 0 (0.0%) | 0 (0.0%) |
| 18 to 34 Years | 11 (2.4%) | 0 (0.0%) |
| 35 to 64 Years | 25 (1.8%) | 0 (0.0%) |
| 65 to 74 Years | 6 (2.7%) | 0 (0.0%) |
| 75 Years and over | 47 (17.8%) | 62 (23.1%) |
Technology Access in Hellertown borough
Computing Device Access in Hellertown borough
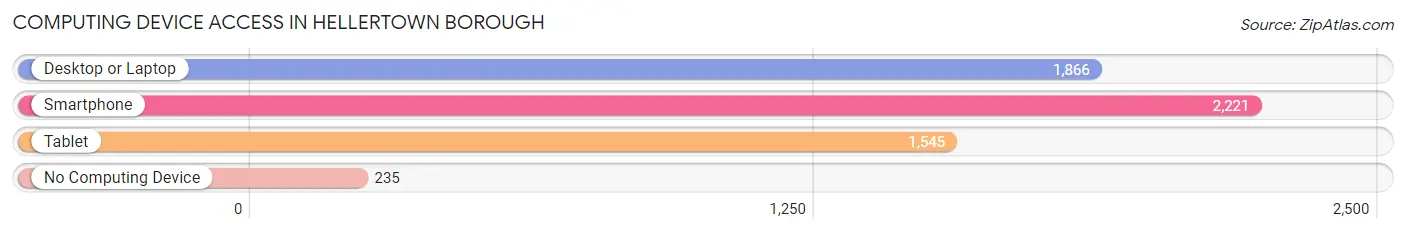
| Device Type | # Households | % Households |
| Desktop or Laptop | 1,866 | 73.4% |
| Smartphone | 2,221 | 87.3% |
| Tablet | 1,545 | 60.7% |
| No Computing Device | 235 | 9.2% |
| Total | 2,544 | 100.0% |
Internet Access in Hellertown borough
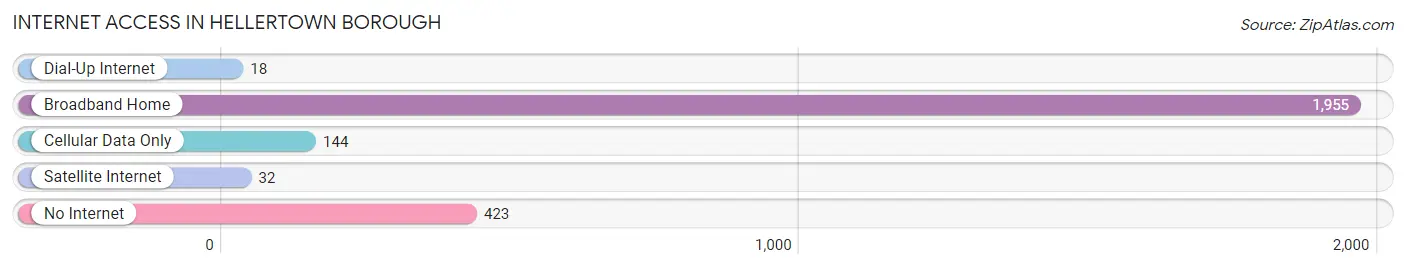
| Internet Type | # Households | % Households |
| Dial-Up Internet | 18 | 0.7% |
| Broadband Home | 1,955 | 76.8% |
| Cellular Data Only | 144 | 5.7% |
| Satellite Internet | 32 | 1.3% |
| No Internet | 423 | 16.6% |
| Total | 2,544 | 100.0% |
Hellertown borough Summary
Hellertown Borough is a small borough located in Northampton County, Pennsylvania. It is situated in the Lehigh Valley region of the state, approximately 10 miles north of Bethlehem and 8 miles south of Easton. The borough is bordered by Lower Saucon Township to the north, Upper Saucon Township to the east, and the borough of Fountain Hill to the south. The population of Hellertown Borough was 5,918 at the 2010 census.
History
Hellertown Borough was founded in 1872 by a group of German immigrants led by John F. Hellers. The group purchased a tract of land from the Saucon Land Company and named the area Hellersdorf, which was later changed to Hellertown. The borough was officially incorporated in 1874.
The borough was originally a farming community, but it soon developed into an industrial center. The Saucon Valley Railroad was built in 1872, connecting Hellertown to Bethlehem and Easton. This allowed for the transportation of goods and materials to and from the borough. The railroad also provided a means of transportation for the borough’s residents.
In the late 19th century, the borough’s economy was largely based on the production of silk and other textiles. The Saucon Silk Mill was established in 1883 and was the largest employer in the borough. The mill was destroyed by fire in 1895, but was rebuilt and continued to operate until the early 20th century.
Geography
Hellertown Borough is located at 40°41'17" North, 75°20'45" West (40.6879, -75.3458). According to the United States Census Bureau, the borough has a total area of 1.2 square miles, all of which is land.
The borough is located in the Lehigh Valley region of Pennsylvania. It is situated in the Saucon Valley, which is a narrow valley that runs along the Saucon Creek. The creek is a tributary of the Lehigh River and is the main waterway in the borough.
Economy
The economy of Hellertown Borough is largely based on manufacturing and retail. The borough is home to several manufacturing companies, including the Hellertown Manufacturing Company, which produces industrial machinery and equipment. The borough is also home to several retail stores, including a Walmart Supercenter and a Target.
The borough is also home to several restaurants and bars, as well as a movie theater. The borough is served by the Saucon Valley School District, which includes two elementary schools, a middle school, and a high school.
Demographics
As of the 2010 census, the population of Hellertown Borough was 5,918. The racial makeup of the borough was 94.3% White, 1.7% African American, 0.3% Native American, 1.2% Asian, 0.1% Pacific Islander, 1.2% from other races, and 1.4% from two or more races. Hispanic or Latino of any race were 3.7% of the population.
The median income for a household in the borough was $50,945, and the median income for a family was $60,945. The per capita income for the borough was $25,945. About 5.3% of families and 7.2% of the population were below the poverty line, including 8.3% of those under age 18 and 5.2% of those age 65 or over.
Common Questions
What is Per Capita Income in Hellertown borough?
Per Capita income in Hellertown borough is $37,805.
What is the Median Family Income in Hellertown borough?
Median Family Income in Hellertown borough is $102,273.
What is the Median Household income in Hellertown borough?
Median Household Income in Hellertown borough is $76,579.
What is Income or Wage Gap in Hellertown borough?
Income or Wage Gap in Hellertown borough is 15.7%.
Women in Hellertown borough earn 84.3 cents for every dollar earned by a man.
What is Inequality or Gini Index in Hellertown borough?
Inequality or Gini Index in Hellertown borough is 0.37.
What is the Total Population of Hellertown borough?
Total Population of Hellertown borough is 6,109.
What is the Total Male Population of Hellertown borough?
Total Male Population of Hellertown borough is 2,882.
What is the Total Female Population of Hellertown borough?
Total Female Population of Hellertown borough is 3,227.
What is the Ratio of Males per 100 Females in Hellertown borough?
There are 89.31 Males per 100 Females in Hellertown borough.
What is the Ratio of Females per 100 Males in Hellertown borough?
There are 111.97 Females per 100 Males in Hellertown borough.
What is the Median Population Age in Hellertown borough?
Median Population Age in Hellertown borough is 44.8 Years.
What is the Average Family Size in Hellertown borough
Average Family Size in Hellertown borough is 3.1 People.
What is the Average Household Size in Hellertown borough
Average Household Size in Hellertown borough is 2.3 People.
How Large is the Labor Force in Hellertown borough?
There are 3,234 People in the Labor Forcein in Hellertown borough.
What is the Percentage of People in the Labor Force in Hellertown borough?
64.7% of People are in the Labor Force in Hellertown borough.
What is the Unemployment Rate in Hellertown borough?
Unemployment Rate in Hellertown borough is 4.3%.