Castle Shannon borough, PA Map & Demographics
Castle Shannon borough Overview
$39,137
PER CAPITA INCOME
$89,974
AVG FAMILY INCOME
$65,700
AVG HOUSEHOLD INCOME
24.2%
WAGE / INCOME GAP [ % ]
75.8¢/ $1
WAGE / INCOME GAP [ $ ]
0.38
INEQUALITY / GINI INDEX
8,283
TOTAL POPULATION
3,986
MALE POPULATION
4,297
FEMALE POPULATION
92.76
MALES / 100 FEMALES
107.80
FEMALES / 100 MALES
42.0
MEDIAN AGE
3.2
AVG FAMILY SIZE
2.2
AVG HOUSEHOLD SIZE
5,059
LABOR FORCE [ PEOPLE ]
71.1%
PERCENT IN LABOR FORCE
1.4%
UNEMPLOYMENT RATE
Income in Castle Shannon borough
Income Overview in Castle Shannon borough
Per Capita Income in Castle Shannon borough is $39,137, while median incomes of families and households are $89,974 and $65,700 respectively.
| Characteristic | Number | Measure |
| Per Capita Income | 8,283 | $39,137 |
| Median Family Income | 1,807 | $89,974 |
| Mean Family Income | 1,807 | $101,355 |
| Median Household Income | 3,767 | $65,700 |
| Mean Household Income | 3,767 | $82,461 |
| Income Deficit | 1,807 | $0 |
| Wage / Income Gap (%) | 8,283 | 24.17% |
| Wage / Income Gap ($) | 8,283 | 75.83¢ per $1 |
| Gini / Inequality Index | 8,283 | 0.38 |
Earnings by Sex in Castle Shannon borough
Average Earnings in Castle Shannon borough are $45,419, $53,130 for men and $40,288 for women, a difference of 24.2%.
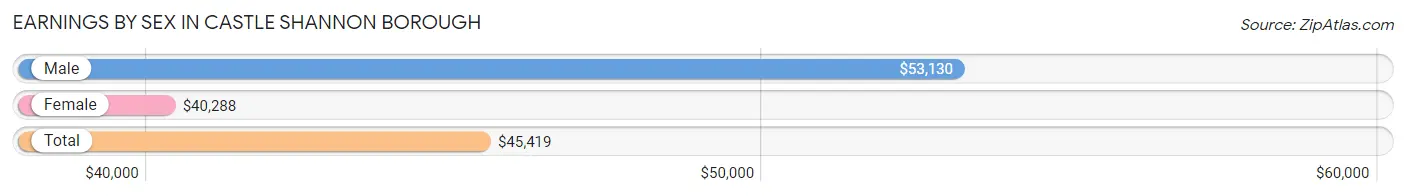
| Sex | Number | Average Earnings |
| Male | 2,695 (51.5%) | $53,130 |
| Female | 2,535 (48.5%) | $40,288 |
| Total | 5,230 (100.0%) | $45,419 |
Earnings by Sex by Income Bracket in Castle Shannon borough
The most common earnings brackets in Castle Shannon borough are $100,000+ for men (361 | 13.4%) and $55,000 to $64,999 for women (378 | 14.9%).
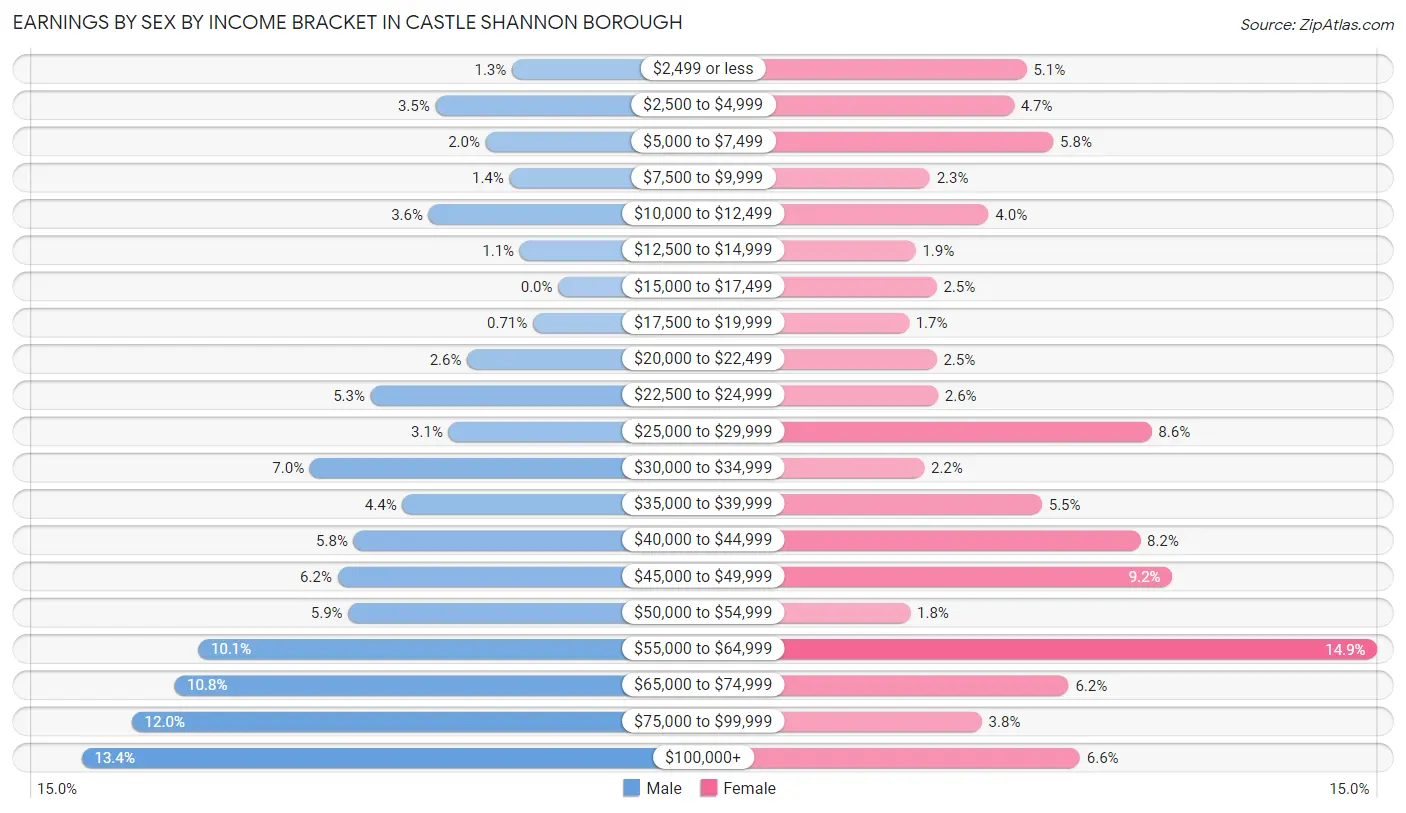
| Income | Male | Female |
| $2,499 or less | 35 (1.3%) | 128 (5.1%) |
| $2,500 to $4,999 | 93 (3.5%) | 119 (4.7%) |
| $5,000 to $7,499 | 55 (2.0%) | 147 (5.8%) |
| $7,500 to $9,999 | 37 (1.4%) | 59 (2.3%) |
| $10,000 to $12,499 | 98 (3.6%) | 101 (4.0%) |
| $12,500 to $14,999 | 29 (1.1%) | 49 (1.9%) |
| $15,000 to $17,499 | 0 (0.0%) | 64 (2.5%) |
| $17,500 to $19,999 | 19 (0.7%) | 44 (1.7%) |
| $20,000 to $22,499 | 69 (2.6%) | 64 (2.5%) |
| $22,500 to $24,999 | 142 (5.3%) | 65 (2.6%) |
| $25,000 to $29,999 | 83 (3.1%) | 217 (8.6%) |
| $30,000 to $34,999 | 188 (7.0%) | 55 (2.2%) |
| $35,000 to $39,999 | 118 (4.4%) | 139 (5.5%) |
| $40,000 to $44,999 | 155 (5.8%) | 209 (8.2%) |
| $45,000 to $49,999 | 167 (6.2%) | 232 (9.1%) |
| $50,000 to $54,999 | 159 (5.9%) | 45 (1.8%) |
| $55,000 to $64,999 | 273 (10.1%) | 378 (14.9%) |
| $65,000 to $74,999 | 291 (10.8%) | 158 (6.2%) |
| $75,000 to $99,999 | 323 (12.0%) | 96 (3.8%) |
| $100,000+ | 361 (13.4%) | 166 (6.6%) |
| Total | 2,695 (100.0%) | 2,535 (100.0%) |
Earnings by Sex by Educational Attainment in Castle Shannon borough
Average earnings in Castle Shannon borough are $56,542 for men and $41,172 for women, a difference of 27.2%. Men with an educational attainment of bachelor's degree enjoy the highest average annual earnings of $76,719, while those with less than high school education earn the least with $33,315. Women with an educational attainment of graduate degree earn the most with the average annual earnings of $57,054, while those with high school diploma education have the smallest earnings of $27,443.
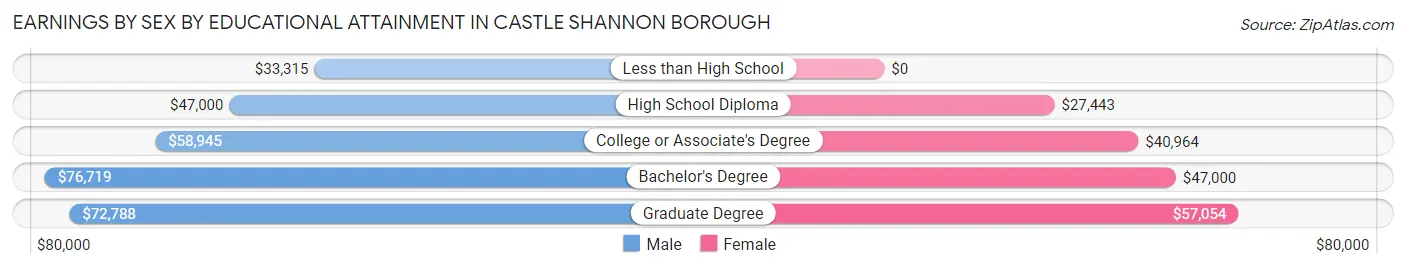
| Educational Attainment | Male Income | Female Income |
| Less than High School | $33,315 | $0 |
| High School Diploma | $47,000 | $27,443 |
| College or Associate's Degree | $58,945 | $40,964 |
| Bachelor's Degree | $76,719 | $47,000 |
| Graduate Degree | $72,788 | $57,054 |
| Total | $56,542 | $41,172 |
Family Income in Castle Shannon borough
Family Income Brackets in Castle Shannon borough
According to the Castle Shannon borough family income data, there are 481 families falling into the $100,000 to $149,999 income range, which is the most common income bracket and makes up 26.6% of all families. Conversely, the less than $10,000 income bracket is the least frequent group with only 27 families (1.5%) belonging to this category.
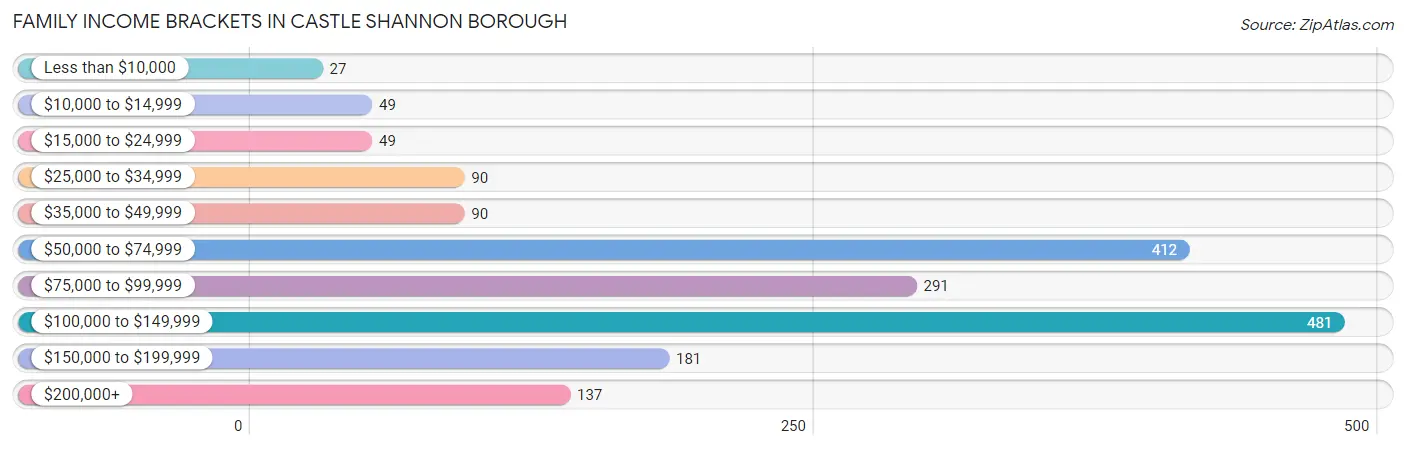
| Income Bracket | # Families | % Families |
| Less than $10,000 | 27 | 1.5% |
| $10,000 to $14,999 | 49 | 2.7% |
| $15,000 to $24,999 | 49 | 2.7% |
| $25,000 to $34,999 | 90 | 5.0% |
| $35,000 to $49,999 | 90 | 5.0% |
| $50,000 to $74,999 | 412 | 22.8% |
| $75,000 to $99,999 | 291 | 16.1% |
| $100,000 to $149,999 | 481 | 26.6% |
| $150,000 to $199,999 | 181 | 10.0% |
| $200,000+ | 137 | 7.6% |
Family Income by Famaliy Size in Castle Shannon borough
5-person families (206 | 11.4%) account for the highest median family income in Castle Shannon borough with $118,629 per family, while 2-person families (1,015 | 56.2%) have the highest median income of $42,792 per family member.
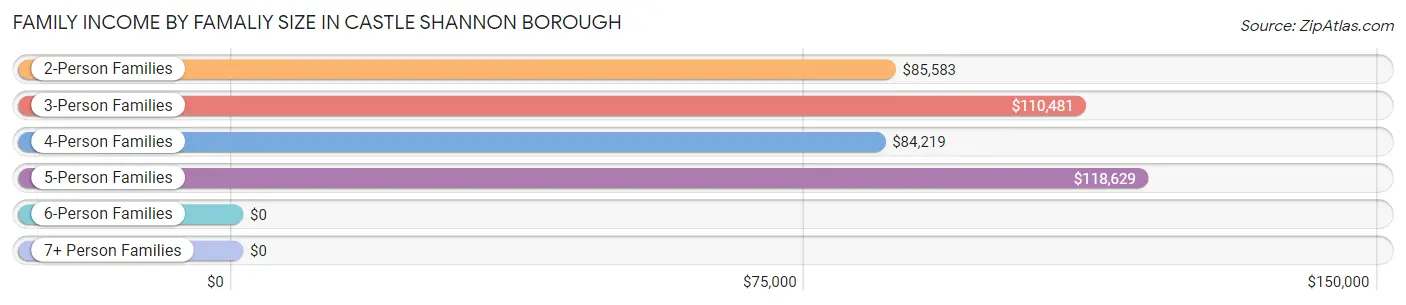
| Income Bracket | # Families | Median Income |
| 2-Person Families | 1,015 (56.2%) | $85,583 |
| 3-Person Families | 253 (14.0%) | $110,481 |
| 4-Person Families | 274 (15.2%) | $84,219 |
| 5-Person Families | 206 (11.4%) | $118,629 |
| 6-Person Families | 59 (3.3%) | $0 |
| 7+ Person Families | 0 (0.0%) | $0 |
| Total | 1,807 (100.0%) | $89,974 |
Family Income by Number of Earners in Castle Shannon borough
The median family income in Castle Shannon borough is $89,974, with families comprising 3+ earners (231) having the highest median family income of $149,821, while families with no earners (176) have the lowest median family income of $45,417, accounting for 12.8% and 9.7% of families, respectively.
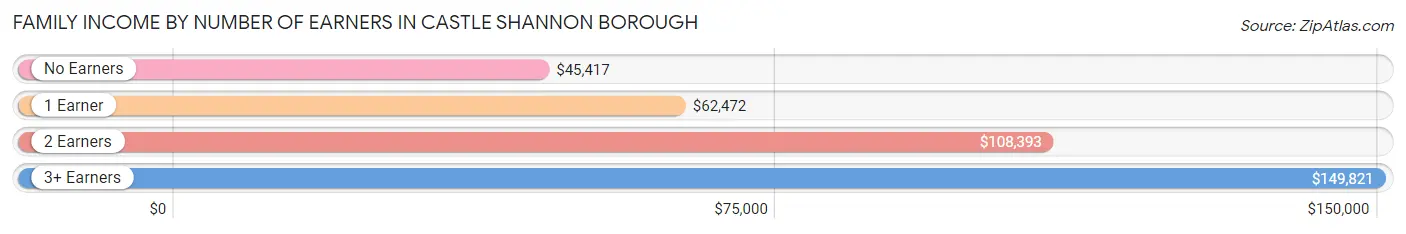
| Number of Earners | # Families | Median Income |
| No Earners | 176 (9.7%) | $45,417 |
| 1 Earner | 553 (30.6%) | $62,472 |
| 2 Earners | 847 (46.9%) | $108,393 |
| 3+ Earners | 231 (12.8%) | $149,821 |
| Total | 1,807 (100.0%) | $89,974 |
Household Income in Castle Shannon borough
Household Income Brackets in Castle Shannon borough
With 863 households falling in the category, the $50,000 to $74,999 income range is the most frequent in Castle Shannon borough, accounting for 22.9% of all households. In contrast, only 105 households (2.8%) fall into the less than $10,000 income bracket, making it the least populous group.
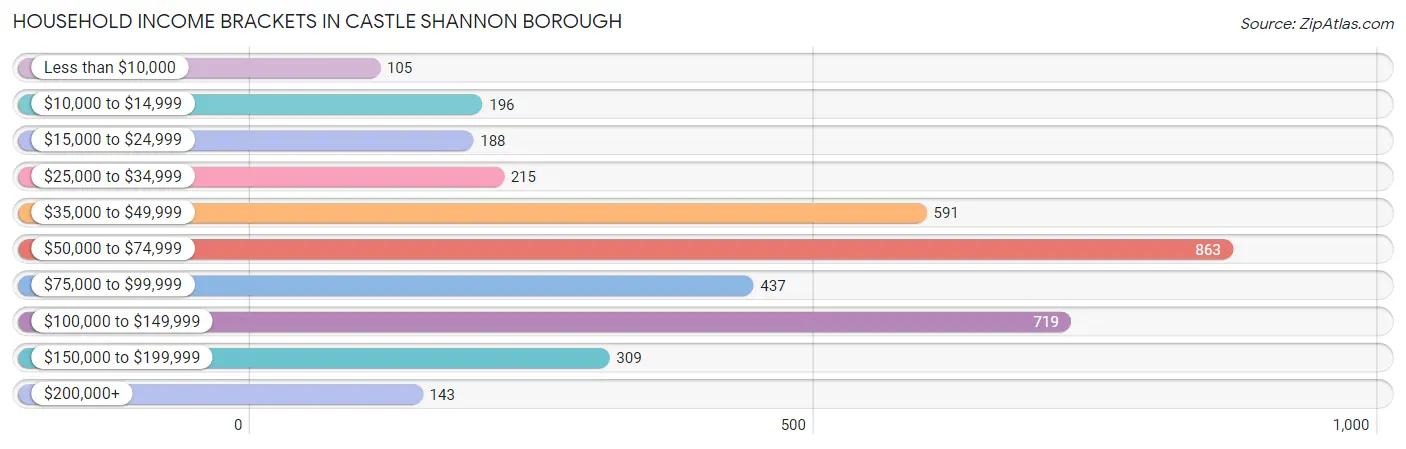
| Income Bracket | # Households | % Households |
| Less than $10,000 | 105 | 2.8% |
| $10,000 to $14,999 | 196 | 5.2% |
| $15,000 to $24,999 | 188 | 5.0% |
| $25,000 to $34,999 | 215 | 5.7% |
| $35,000 to $49,999 | 591 | 15.7% |
| $50,000 to $74,999 | 863 | 22.9% |
| $75,000 to $99,999 | 437 | 11.6% |
| $100,000 to $149,999 | 719 | 19.1% |
| $150,000 to $199,999 | 309 | 8.2% |
| $200,000+ | 143 | 3.8% |
Household Income by Householder Age in Castle Shannon borough
The median household income in Castle Shannon borough is $65,700, with the highest median household income of $83,861 found in the 25 to 44 years age bracket for the primary householder. A total of 1,313 households (34.9%) fall into this category. Meanwhile, the 15 to 24 years age bracket for the primary householder has the lowest median household income of $0, with 87 households (2.3%) in this group.
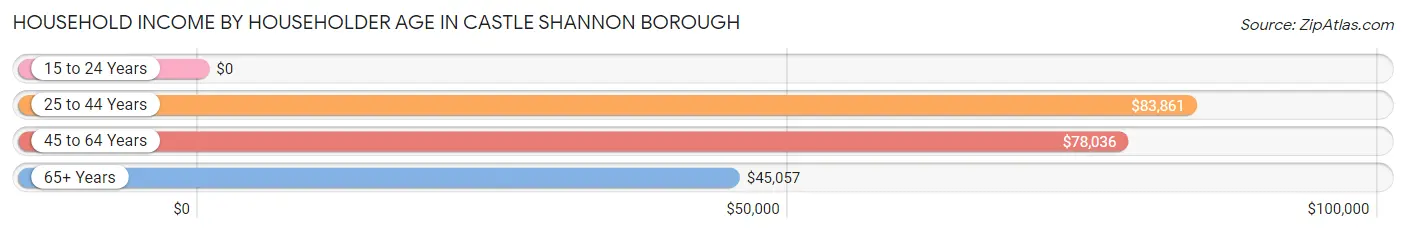
| Income Bracket | # Households | Median Income |
| 15 to 24 Years | 87 (2.3%) | $0 |
| 25 to 44 Years | 1,313 (34.9%) | $83,861 |
| 45 to 64 Years | 1,179 (31.3%) | $78,036 |
| 65+ Years | 1,188 (31.5%) | $45,057 |
| Total | 3,767 (100.0%) | $65,700 |
Poverty in Castle Shannon borough
Income Below Poverty by Sex and Age in Castle Shannon borough
With 6.8% poverty level for males and 9.7% for females among the residents of Castle Shannon borough, 16 and 17 year old males and 55 to 64 year old females are the most vulnerable to poverty, with 11 males (23.4%) and 136 females (25.5%) in their respective age groups living below the poverty level.
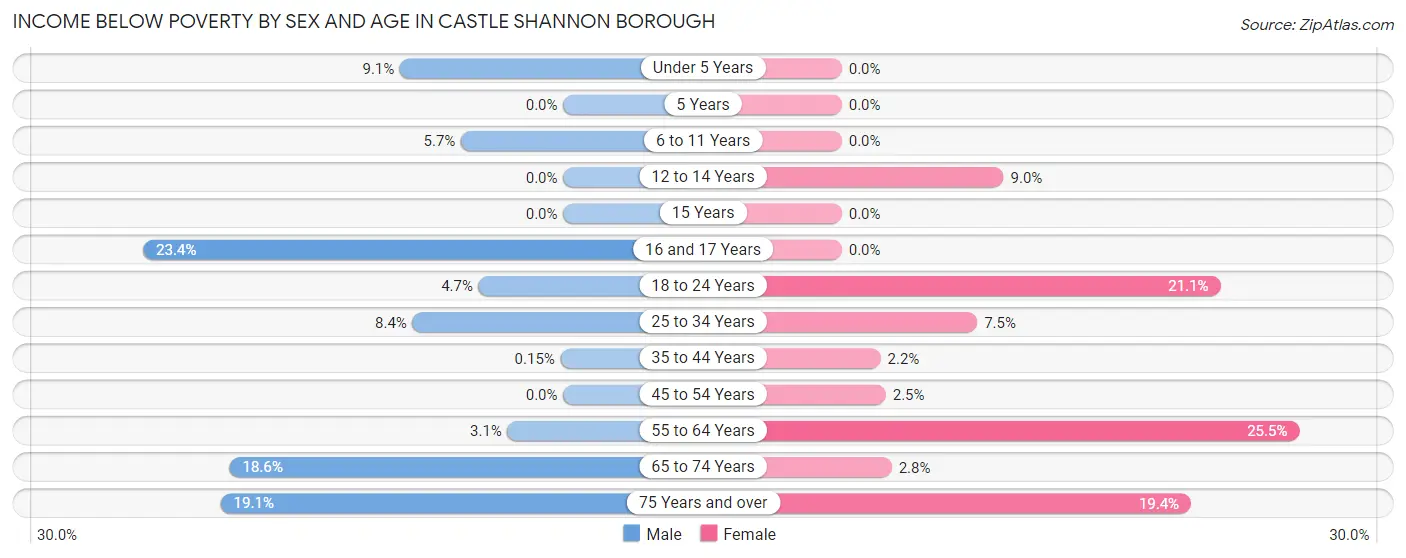
| Age Bracket | Male | Female |
| Under 5 Years | 10 (9.1%) | 0 (0.0%) |
| 5 Years | 0 (0.0%) | 0 (0.0%) |
| 6 to 11 Years | 21 (5.7%) | 0 (0.0%) |
| 12 to 14 Years | 0 (0.0%) | 10 (9.0%) |
| 15 Years | 0 (0.0%) | 0 (0.0%) |
| 16 and 17 Years | 11 (23.4%) | 0 (0.0%) |
| 18 to 24 Years | 14 (4.7%) | 70 (21.1%) |
| 25 to 34 Years | 65 (8.4%) | 68 (7.5%) |
| 35 to 44 Years | 1 (0.2%) | 12 (2.2%) |
| 45 to 54 Years | 0 (0.0%) | 10 (2.5%) |
| 55 to 64 Years | 19 (3.1%) | 136 (25.5%) |
| 65 to 74 Years | 71 (18.6%) | 13 (2.8%) |
| 75 Years and over | 58 (19.1%) | 97 (19.4%) |
| Total | 270 (6.8%) | 416 (9.7%) |
Income Above Poverty by Sex and Age in Castle Shannon borough
According to the poverty statistics in Castle Shannon borough, males aged 12 to 14 years and females aged under 5 years are the age groups that are most secure financially, with 100.0% of males and 100.0% of females in these age groups living above the poverty line.
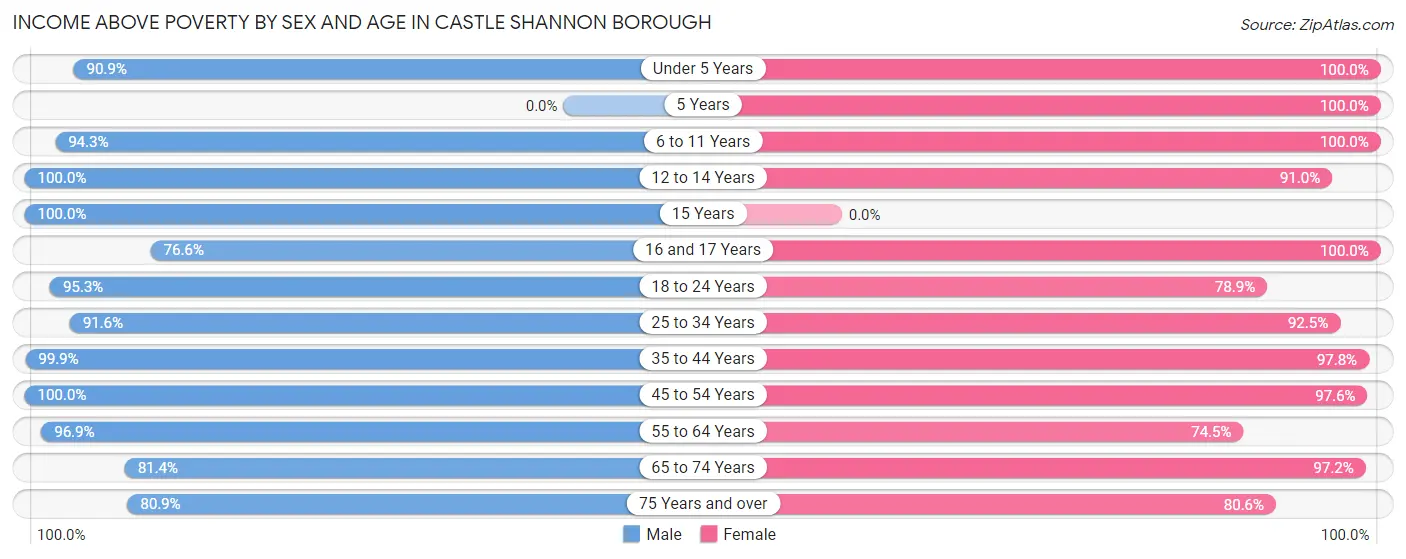
| Age Bracket | Male | Female |
| Under 5 Years | 100 (90.9%) | 211 (100.0%) |
| 5 Years | 0 (0.0%) | 61 (100.0%) |
| 6 to 11 Years | 348 (94.3%) | 202 (100.0%) |
| 12 to 14 Years | 84 (100.0%) | 101 (91.0%) |
| 15 Years | 19 (100.0%) | 0 (0.0%) |
| 16 and 17 Years | 36 (76.6%) | 14 (100.0%) |
| 18 to 24 Years | 283 (95.3%) | 262 (78.9%) |
| 25 to 34 Years | 710 (91.6%) | 834 (92.5%) |
| 35 to 44 Years | 657 (99.9%) | 544 (97.8%) |
| 45 to 54 Years | 328 (100.0%) | 398 (97.6%) |
| 55 to 64 Years | 594 (96.9%) | 398 (74.5%) |
| 65 to 74 Years | 311 (81.4%) | 454 (97.2%) |
| 75 Years and over | 246 (80.9%) | 402 (80.6%) |
| Total | 3,716 (93.2%) | 3,881 (90.3%) |
Income Below Poverty Among Married-Couple Families in Castle Shannon borough
The poverty statistics for married-couple families in Castle Shannon borough show that 3.5% or 45 of the total 1,286 families live below the poverty line. Families with no children have the highest poverty rate of 5.1%, comprising of 45 families. On the other hand, families with 1 or 2 children have the lowest poverty rate of 0.0%, which includes 0 families.
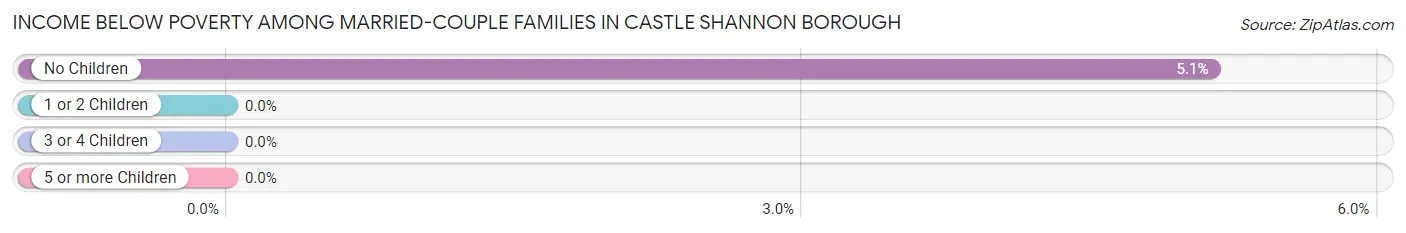
| Children | Above Poverty | Below Poverty |
| No Children | 832 (94.9%) | 45 (5.1%) |
| 1 or 2 Children | 275 (100.0%) | 0 (0.0%) |
| 3 or 4 Children | 134 (100.0%) | 0 (0.0%) |
| 5 or more Children | 0 (0.0%) | 0 (0.0%) |
| Total | 1,241 (96.5%) | 45 (3.5%) |
Income Below Poverty Among Single-Parent Households in Castle Shannon borough
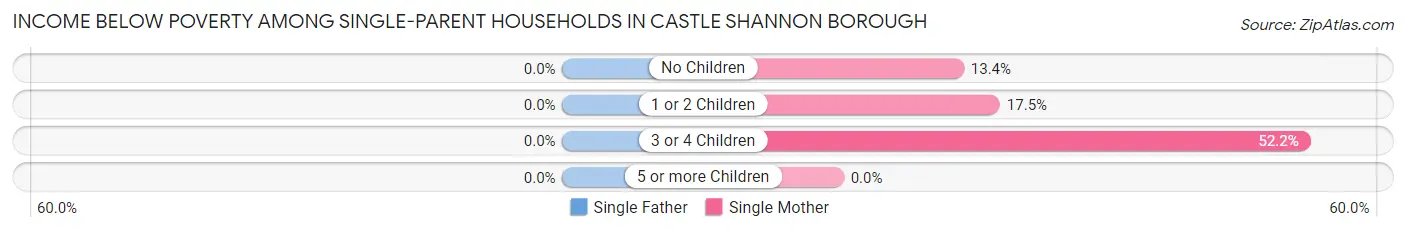
| Children | Single Father | Single Mother |
| No Children | 0 (0.0%) | 27 (13.4%) |
| 1 or 2 Children | 0 (0.0%) | 11 (17.5%) |
| 3 or 4 Children | 0 (0.0%) | 12 (52.2%) |
| 5 or more Children | 0 (0.0%) | 0 (0.0%) |
| Total | 0 (0.0%) | 50 (17.4%) |
Income Below Poverty Among Married-Couple vs Single-Parent Households in Castle Shannon borough
The poverty data for Castle Shannon borough shows that 45 of the married-couple family households (3.5%) and 50 of the single-parent households (9.6%) are living below the poverty level. Within the married-couple family households, those with no children have the highest poverty rate, with 45 households (5.1%) falling below the poverty line. Among the single-parent households, those with 3 or 4 children have the highest poverty rate, with 12 household (52.2%) living below poverty.
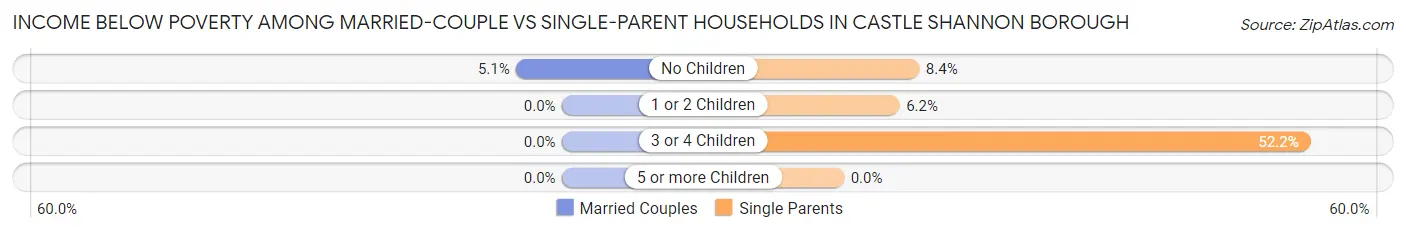
| Children | Married-Couple Families | Single-Parent Households |
| No Children | 45 (5.1%) | 27 (8.4%) |
| 1 or 2 Children | 0 (0.0%) | 11 (6.2%) |
| 3 or 4 Children | 0 (0.0%) | 12 (52.2%) |
| 5 or more Children | 0 (0.0%) | 0 (0.0%) |
| Total | 45 (3.5%) | 50 (9.6%) |
Race in Castle Shannon borough
The most populous races in Castle Shannon borough are White / Caucasian (6,899 | 83.3%), Asian (499 | 6.0%), and Two or more Races (470 | 5.7%).
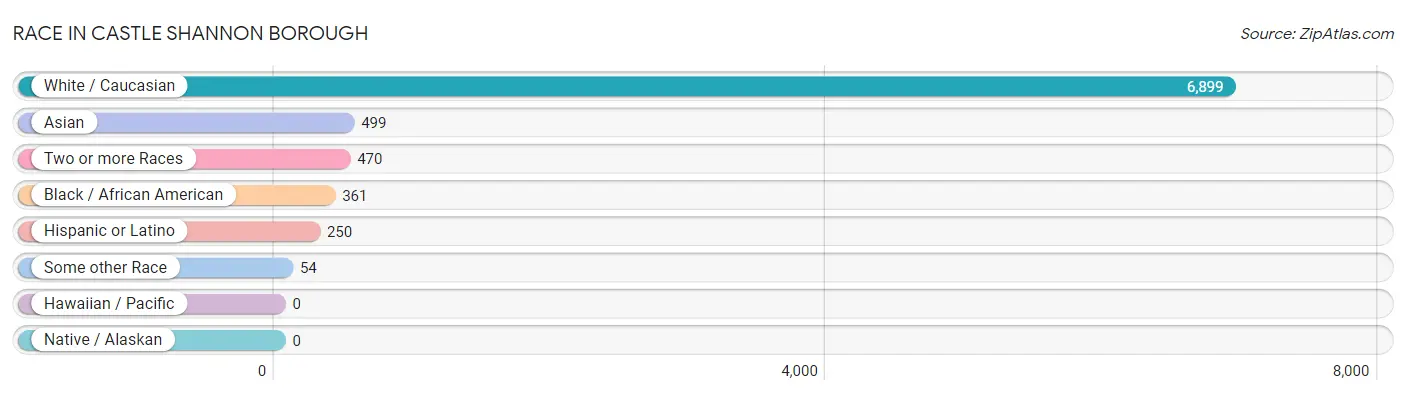
| Race | # Population | % Population |
| Asian | 499 | 6.0% |
| Black / African American | 361 | 4.4% |
| Hawaiian / Pacific | 0 | 0.0% |
| Hispanic or Latino | 250 | 3.0% |
| Native / Alaskan | 0 | 0.0% |
| White / Caucasian | 6,899 | 83.3% |
| Two or more Races | 470 | 5.7% |
| Some other Race | 54 | 0.6% |
| Total | 8,283 | 100.0% |
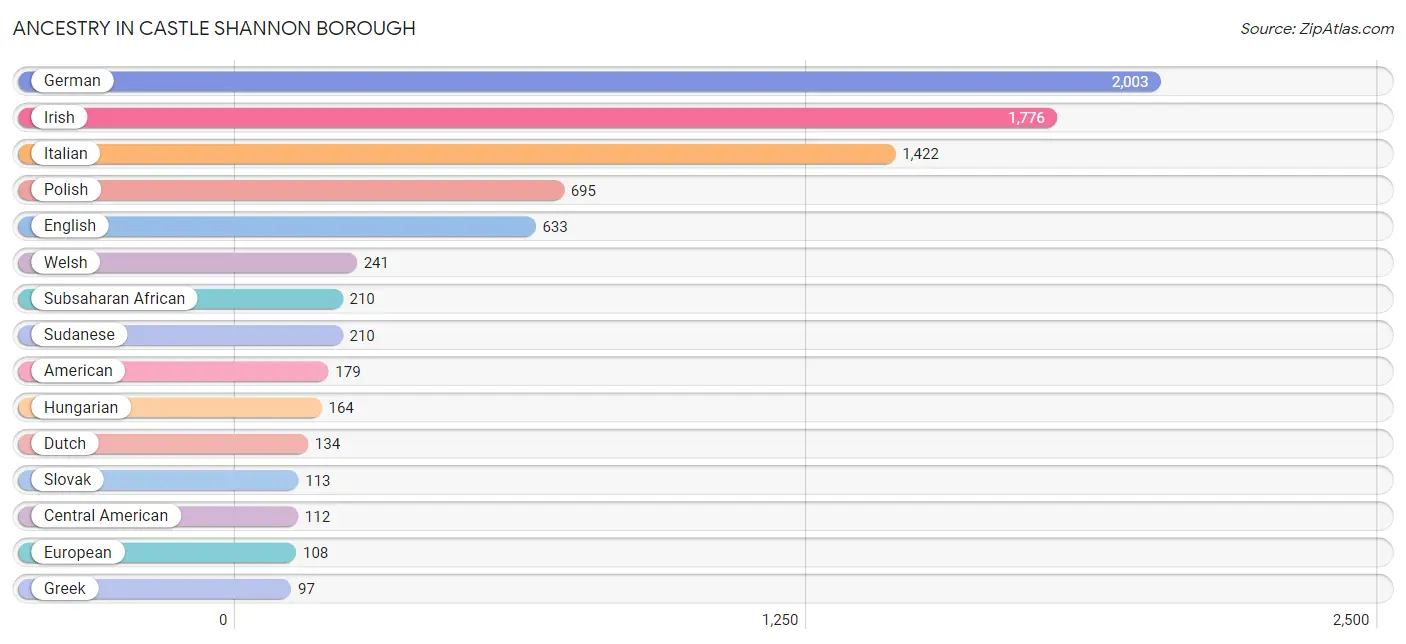
Ancestry in Castle Shannon borough
The most populous ancestries reported in Castle Shannon borough are German (2,003 | 24.2%), Irish (1,776 | 21.4%), Italian (1,422 | 17.2%), Polish (695 | 8.4%), and English (633 | 7.6%), together accounting for 78.8% of all Castle Shannon borough residents.
| Ancestry | # Population | % Population |
| American | 179 | 2.2% |
| Arab | 32 | 0.4% |
| Australian | 14 | 0.2% |
| British | 33 | 0.4% |
| Central American | 112 | 1.3% |
| Colombian | 18 | 0.2% |
| Costa Rican | 10 | 0.1% |
| Croatian | 64 | 0.8% |
| Czech | 16 | 0.2% |
| Czechoslovakian | 24 | 0.3% |
| Dutch | 134 | 1.6% |
| Eastern European | 81 | 1.0% |
| English | 633 | 7.6% |
| European | 108 | 1.3% |
| French | 40 | 0.5% |
| French Canadian | 39 | 0.5% |
| German | 2,003 | 24.2% |
| Greek | 97 | 1.2% |
| Guatemalan | 6 | 0.1% |
| Hungarian | 164 | 2.0% |
| Indian (Asian) | 85 | 1.0% |
| Irish | 1,776 | 21.4% |
| Iroquois | 5 | 0.1% |
| Italian | 1,422 | 17.2% |
| Korean | 42 | 0.5% |
| Lithuanian | 61 | 0.7% |
| Mexican | 47 | 0.6% |
| Paraguayan | 14 | 0.2% |
| Pennsylvania German | 10 | 0.1% |
| Polish | 695 | 8.4% |
| Portuguese | 19 | 0.2% |
| Puerto Rican | 28 | 0.3% |
| Russian | 18 | 0.2% |
| Salvadoran | 96 | 1.2% |
| Scandinavian | 54 | 0.6% |
| Scotch-Irish | 58 | 0.7% |
| Scottish | 72 | 0.9% |
| Serbian | 5 | 0.1% |
| Slovak | 113 | 1.4% |
| Slovene | 37 | 0.4% |
| South American | 32 | 0.4% |
| Spaniard | 31 | 0.4% |
| Subsaharan African | 210 | 2.5% |
| Sudanese | 210 | 2.5% |
| Swedish | 34 | 0.4% |
| Syrian | 20 | 0.2% |
| Thai | 22 | 0.3% |
| Ukrainian | 41 | 0.5% |
| Welsh | 241 | 2.9% |
| Yugoslavian | 58 | 0.7% | View All 50 Rows |
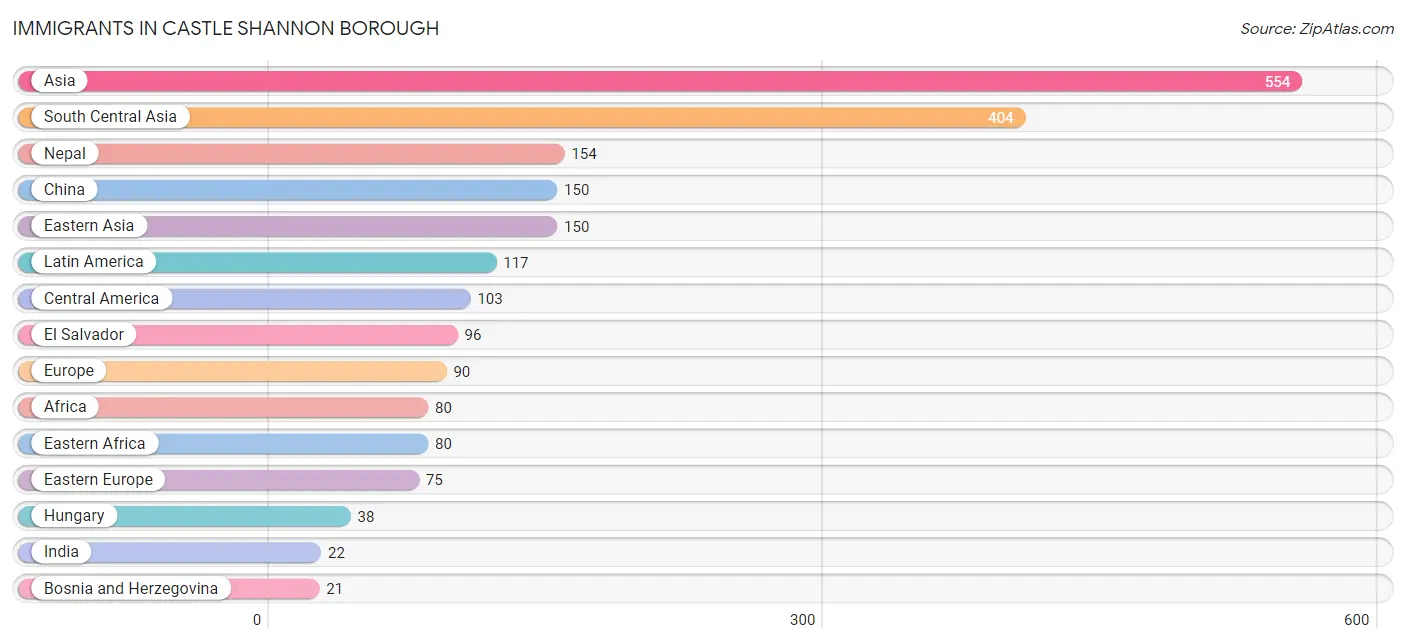
Immigrants in Castle Shannon borough
The most numerous immigrant groups reported in Castle Shannon borough came from Asia (554 | 6.7%), South Central Asia (404 | 4.9%), Nepal (154 | 1.9%), China (150 | 1.8%), and Eastern Asia (150 | 1.8%), together accounting for 17.1% of all Castle Shannon borough residents.
| Immigration Origin | # Population | % Population |
| Africa | 80 | 1.0% |
| Asia | 554 | 6.7% |
| Australia | 14 | 0.2% |
| Bosnia and Herzegovina | 21 | 0.3% |
| Central America | 103 | 1.2% |
| China | 150 | 1.8% |
| Eastern Africa | 80 | 1.0% |
| Eastern Asia | 150 | 1.8% |
| Eastern Europe | 75 | 0.9% |
| El Salvador | 96 | 1.2% |
| Europe | 90 | 1.1% |
| Germany | 5 | 0.1% |
| Guatemala | 6 | 0.1% |
| Hungary | 38 | 0.5% |
| India | 22 | 0.3% |
| Italy | 10 | 0.1% |
| Latin America | 117 | 1.4% |
| Mexico | 1 | 0.0% |
| Nepal | 154 | 1.9% |
| Oceania | 14 | 0.2% |
| Romania | 16 | 0.2% |
| South America | 14 | 0.2% |
| South Central Asia | 404 | 4.9% |
| Southern Europe | 10 | 0.1% |
| Western Europe | 5 | 0.1% | View All 25 Rows |
Sex and Age in Castle Shannon borough
Sex and Age in Castle Shannon borough
The most populous age groups in Castle Shannon borough are 30 to 34 Years (397 | 10.0%) for men and 25 to 29 Years (511 | 11.9%) for women.
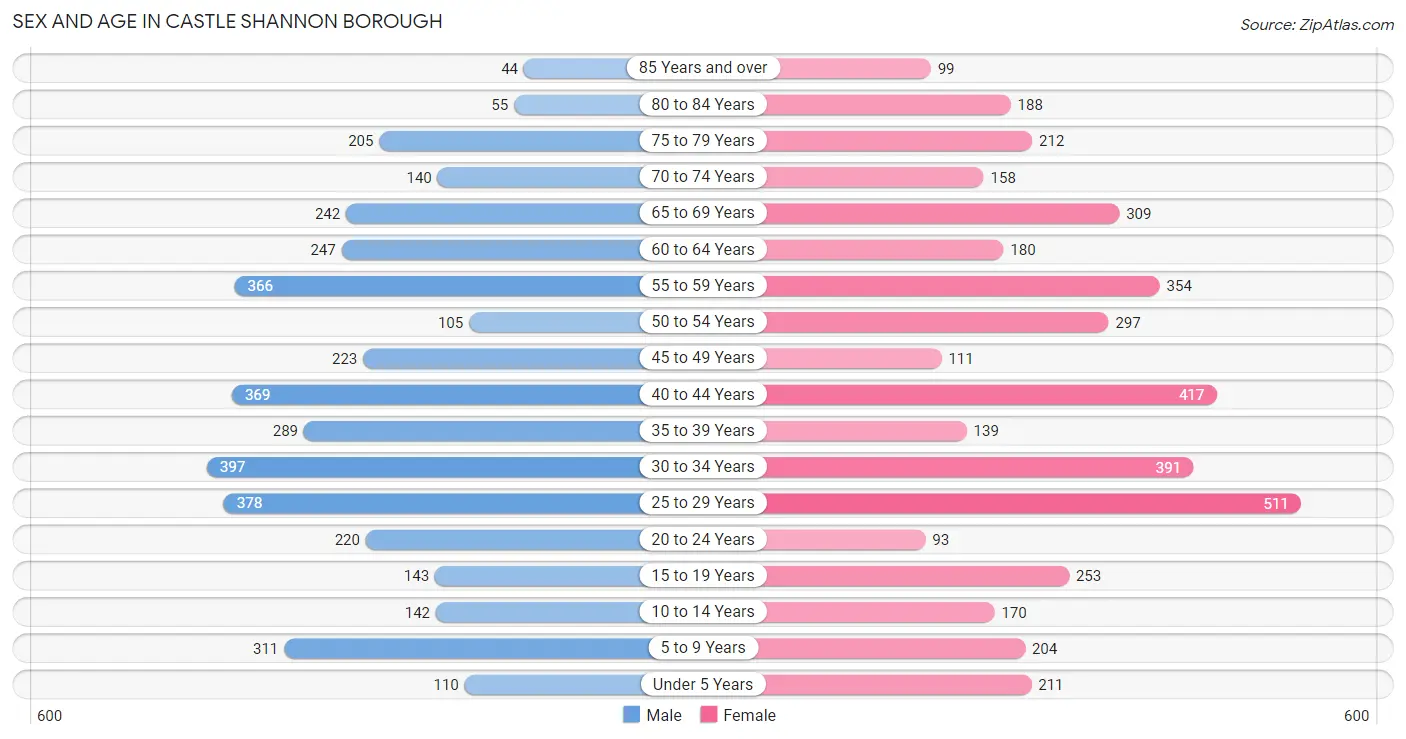
| Age Bracket | Male | Female |
| Under 5 Years | 110 (2.8%) | 211 (4.9%) |
| 5 to 9 Years | 311 (7.8%) | 204 (4.8%) |
| 10 to 14 Years | 142 (3.6%) | 170 (4.0%) |
| 15 to 19 Years | 143 (3.6%) | 253 (5.9%) |
| 20 to 24 Years | 220 (5.5%) | 93 (2.2%) |
| 25 to 29 Years | 378 (9.5%) | 511 (11.9%) |
| 30 to 34 Years | 397 (10.0%) | 391 (9.1%) |
| 35 to 39 Years | 289 (7.2%) | 139 (3.2%) |
| 40 to 44 Years | 369 (9.3%) | 417 (9.7%) |
| 45 to 49 Years | 223 (5.6%) | 111 (2.6%) |
| 50 to 54 Years | 105 (2.6%) | 297 (6.9%) |
| 55 to 59 Years | 366 (9.2%) | 354 (8.2%) |
| 60 to 64 Years | 247 (6.2%) | 180 (4.2%) |
| 65 to 69 Years | 242 (6.1%) | 309 (7.2%) |
| 70 to 74 Years | 140 (3.5%) | 158 (3.7%) |
| 75 to 79 Years | 205 (5.1%) | 212 (4.9%) |
| 80 to 84 Years | 55 (1.4%) | 188 (4.4%) |
| 85 Years and over | 44 (1.1%) | 99 (2.3%) |
| Total | 3,986 (100.0%) | 4,297 (100.0%) |
Families and Households in Castle Shannon borough
Median Family Size in Castle Shannon borough
The median family size in Castle Shannon borough is 3.18 persons per family, with single male/father families (234 | 13.0%) accounting for the largest median family size of 3.39 persons per family. On the other hand, single female/mother families (287 | 15.9%) represent the smallest median family size with 3.10 persons per family.
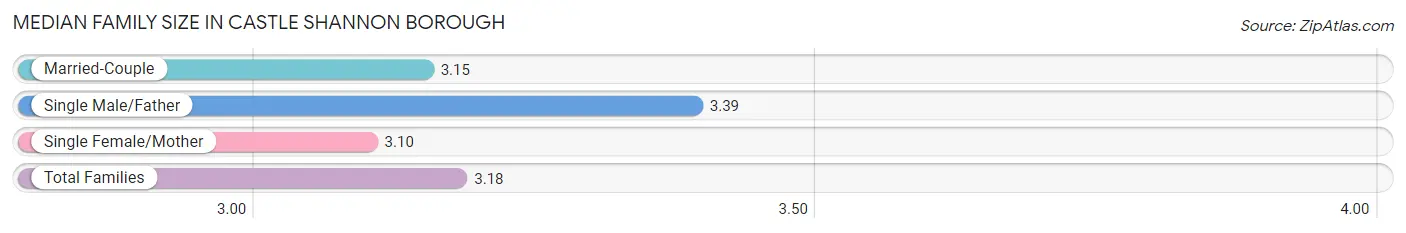
| Family Type | # Families | Family Size |
| Married-Couple | 1,286 (71.2%) | 3.15 |
| Single Male/Father | 234 (13.0%) | 3.39 |
| Single Female/Mother | 287 (15.9%) | 3.10 |
| Total Families | 1,807 (100.0%) | 3.18 |
Median Household Size in Castle Shannon borough
The median household size in Castle Shannon borough is 2.19 persons per household, with single male/father households (234 | 6.2%) accounting for the largest median household size of 3.61 persons per household. non-family households (1,960 | 52.0%) represent the smallest median household size with 1.18 persons per household.
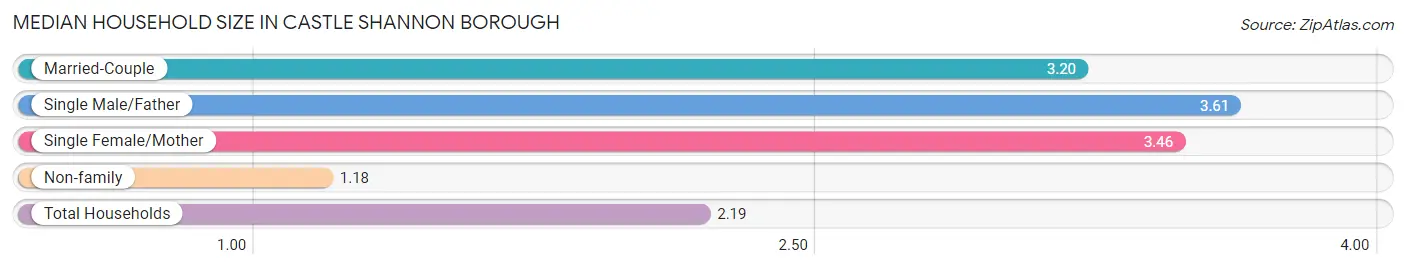
| Household Type | # Households | Household Size |
| Married-Couple | 1,286 (34.1%) | 3.20 |
| Single Male/Father | 234 (6.2%) | 3.61 |
| Single Female/Mother | 287 (7.6%) | 3.46 |
| Non-family | 1,960 (52.0%) | 1.18 |
| Total Households | 3,767 (100.0%) | 2.19 |
Household Size by Marriage Status in Castle Shannon borough
Out of a total of 3,767 households in Castle Shannon borough, 1,807 (48.0%) are family households, while 1,960 (52.0%) are nonfamily households. The most numerous type of family households are 2-person households, comprising 869, and the most common type of nonfamily households are 1-person households, comprising 1,614.

| Household Size | Family Households | Nonfamily Households |
| 1-Person Households | - | 1,614 (42.8%) |
| 2-Person Households | 869 (23.1%) | 325 (8.6%) |
| 3-Person Households | 383 (10.2%) | 21 (0.6%) |
| 4-Person Households | 278 (7.4%) | 0 (0.0%) |
| 5-Person Households | 195 (5.2%) | 0 (0.0%) |
| 6-Person Households | 82 (2.2%) | 0 (0.0%) |
| 7+ Person Households | 0 (0.0%) | 0 (0.0%) |
| Total | 1,807 (48.0%) | 1,960 (52.0%) |
Female Fertility in Castle Shannon borough
Fertility by Age in Castle Shannon borough
Average fertility rate in Castle Shannon borough is 28.0 births per 1,000 women. Women in the age bracket of 20 to 34 years have the highest fertility rate with 50.0 births per 1,000 women. Women in the age bracket of 20 to 34 years acount for 90.9% of all women with births.
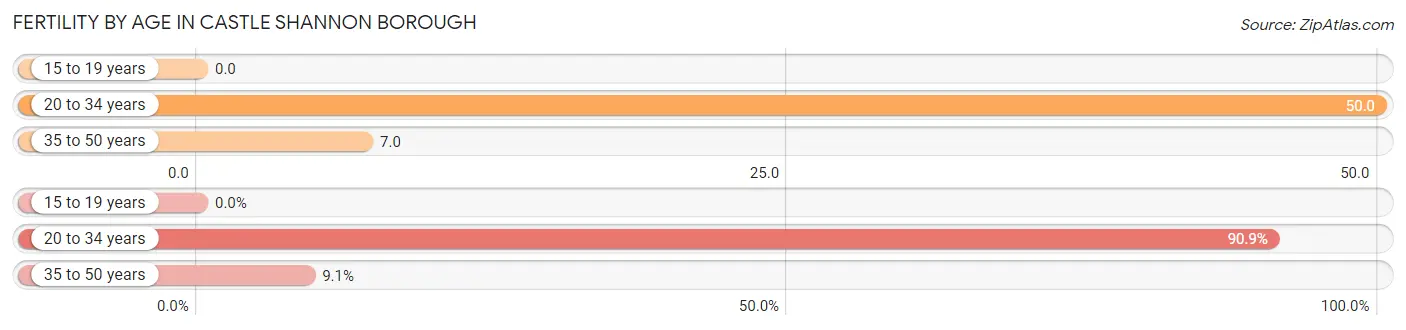
| Age Bracket | Women with Births | Births / 1,000 Women |
| 15 to 19 years | 0 (0.0%) | 0.0 |
| 20 to 34 years | 50 (90.9%) | 50.0 |
| 35 to 50 years | 5 (9.1%) | 7.0 |
| Total | 55 (100.0%) | 28.0 |
Fertility by Age by Marriage Status in Castle Shannon borough
85.5% of women with births (55) in Castle Shannon borough are married. The highest percentage of unmarried women with births falls into 20 to 34 years age bracket with 16.0% of them unmarried at the time of birth, while the lowest percentage of unmarried women with births belong to 35 to 50 years age bracket with 0.0% of them unmarried.
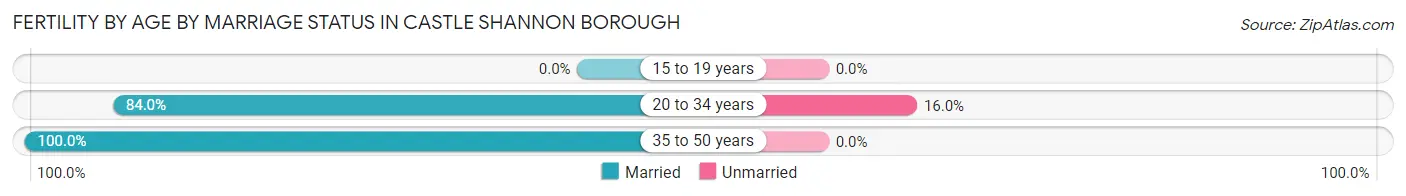
| Age Bracket | Married | Unmarried |
| 15 to 19 years | 0 (0.0%) | 0 (0.0%) |
| 20 to 34 years | 42 (84.0%) | 8 (16.0%) |
| 35 to 50 years | 5 (100.0%) | 0 (0.0%) |
| Total | 47 (85.5%) | 8 (14.5%) |
Fertility by Education in Castle Shannon borough
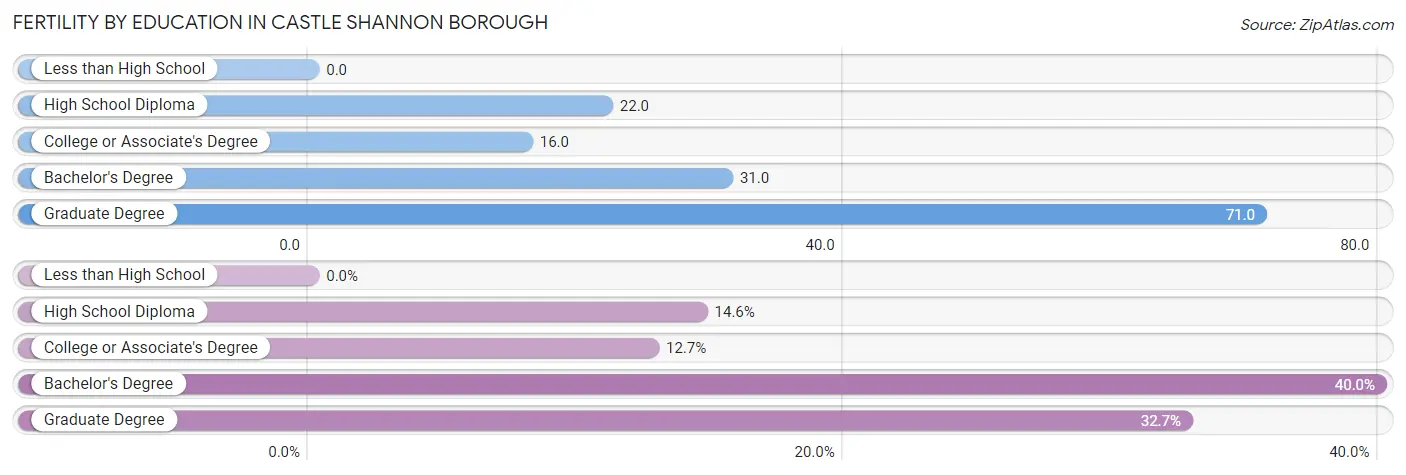
| Educational Attainment | Women with Births | Births / 1,000 Women |
| Less than High School | 0 (0.0%) | 0.0 |
| High School Diploma | 8 (14.5%) | 22.0 |
| College or Associate's Degree | 7 (12.7%) | 16.0 |
| Bachelor's Degree | 22 (40.0%) | 31.0 |
| Graduate Degree | 18 (32.7%) | 71.0 |
| Total | 55 (100.0%) | 28.0 |
Fertility by Education by Marriage Status in Castle Shannon borough
14.5% of women with births in Castle Shannon borough are unmarried. Women with the educational attainment of college or associate's degree are most likely to be married with 100.0% of them married at childbirth, while women with the educational attainment of high school diploma are least likely to be married with 100.0% of them unmarried at childbirth.
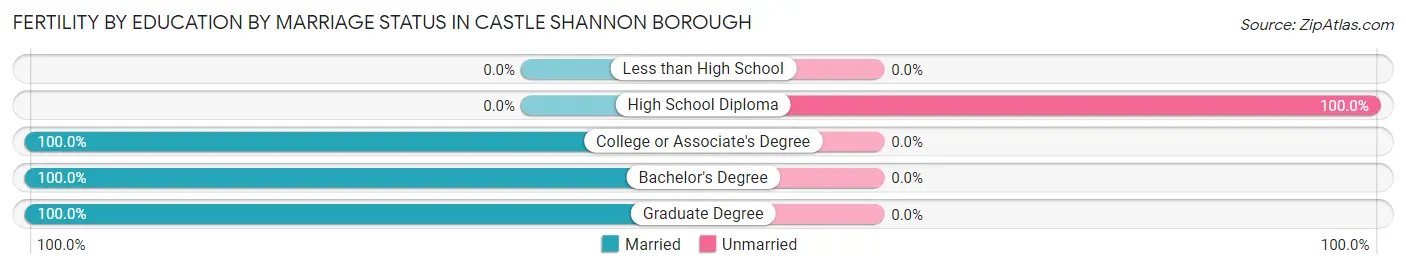
| Educational Attainment | Married | Unmarried |
| Less than High School | 0 (0.0%) | 0 (0.0%) |
| High School Diploma | 0 (0.0%) | 8 (100.0%) |
| College or Associate's Degree | 7 (100.0%) | 0 (0.0%) |
| Bachelor's Degree | 22 (100.0%) | 0 (0.0%) |
| Graduate Degree | 18 (100.0%) | 0 (0.0%) |
| Total | 47 (85.5%) | 8 (14.5%) |
Employment Characteristics in Castle Shannon borough
Employment by Class of Employer in Castle Shannon borough
Among the 4,885 employed individuals in Castle Shannon borough, private company employees (3,911 | 80.1%), not-for-profit organizations (511 | 10.5%), and self-employed (not incorporated) (120 | 2.5%) make up the most common classes of employment.
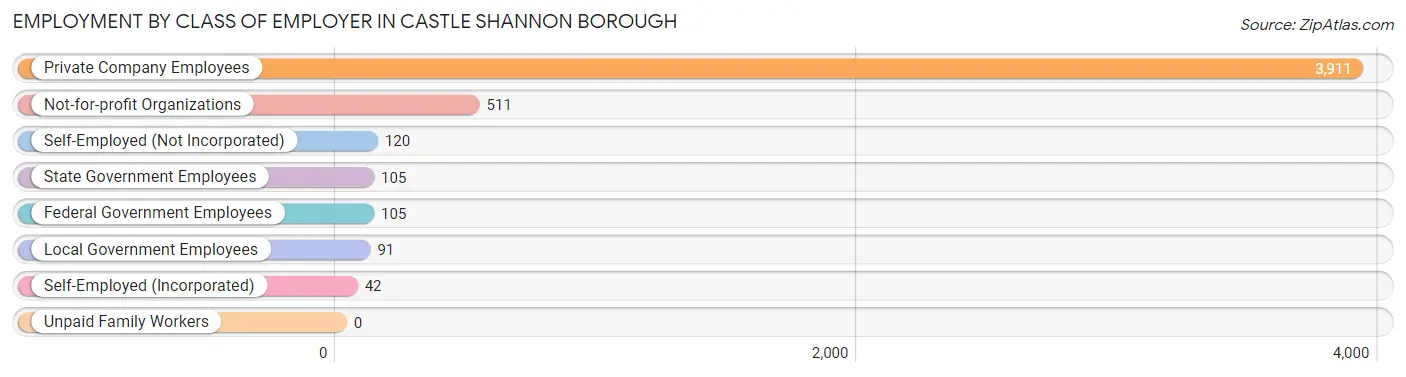
| Employer Class | # Employees | % Employees |
| Private Company Employees | 3,911 | 80.1% |
| Self-Employed (Incorporated) | 42 | 0.9% |
| Self-Employed (Not Incorporated) | 120 | 2.5% |
| Not-for-profit Organizations | 511 | 10.5% |
| Local Government Employees | 91 | 1.9% |
| State Government Employees | 105 | 2.1% |
| Federal Government Employees | 105 | 2.1% |
| Unpaid Family Workers | 0 | 0.0% |
| Total | 4,885 | 100.0% |
Employment Status by Age in Castle Shannon borough
According to the labor force statistics for Castle Shannon borough, out of the total population over 16 years of age (7,116), 71.1% or 5,059 individuals are in the labor force, with 1.4% or 71 of them unemployed. The age group with the highest labor force participation rate is 25 to 29 years, with 95.7% or 851 individuals in the labor force. Within the labor force, the 35 to 44 years age range has the highest percentage of unemployed individuals, with 5.1% or 55 of them being unemployed.
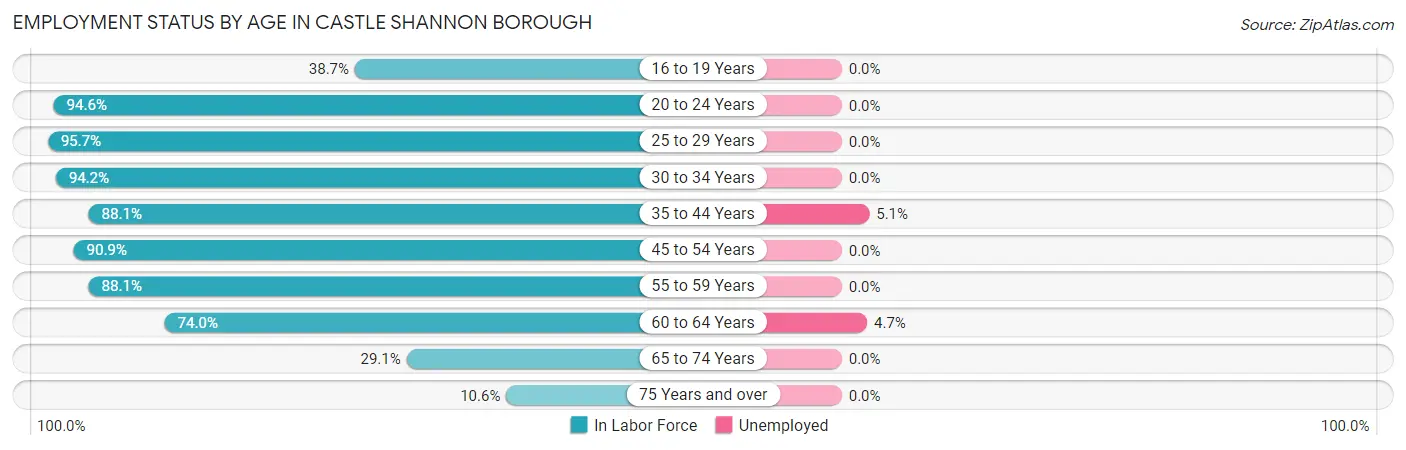
| Age Bracket | In Labor Force | Unemployed |
| 16 to 19 Years | 146 (38.7%) | 0 (0.0%) |
| 20 to 24 Years | 296 (94.6%) | 0 (0.0%) |
| 25 to 29 Years | 851 (95.7%) | 0 (0.0%) |
| 30 to 34 Years | 742 (94.2%) | 0 (0.0%) |
| 35 to 44 Years | 1,070 (88.1%) | 55 (5.1%) |
| 45 to 54 Years | 669 (90.9%) | 0 (0.0%) |
| 55 to 59 Years | 634 (88.1%) | 0 (0.0%) |
| 60 to 64 Years | 316 (74.0%) | 15 (4.7%) |
| 65 to 74 Years | 247 (29.1%) | 0 (0.0%) |
| 75 Years and over | 85 (10.6%) | 0 (0.0%) |
| Total | 5,059 (71.1%) | 71 (1.4%) |
Employment Status by Educational Attainment in Castle Shannon borough
According to labor force statistics for Castle Shannon borough, 89.7% of individuals (4,282) out of the total population between 25 and 64 years of age (4,774) are in the labor force, with 1.6% or 69 of them being unemployed. The group with the highest labor force participation rate are those with the educational attainment of bachelor's degree or higher, with 97.0% or 1,955 individuals in the labor force. Within the labor force, individuals with high school diploma education have the highest percentage of unemployment, with 6.8% or 71 of them being unemployed.
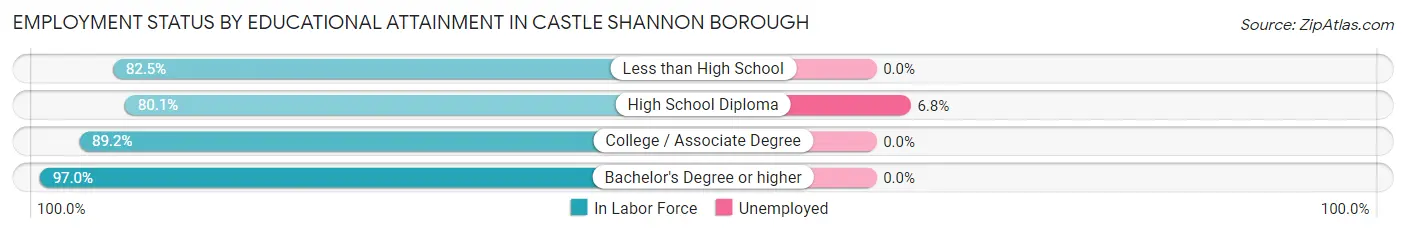
| Educational Attainment | In Labor Force | Unemployed |
| Less than High School | 188 (82.5%) | 0 (0.0%) |
| High School Diploma | 1,037 (80.1%) | 88 (6.8%) |
| College / Associate Degree | 1,103 (89.2%) | 0 (0.0%) |
| Bachelor's Degree or higher | 1,955 (97.0%) | 0 (0.0%) |
| Total | 4,282 (89.7%) | 76 (1.6%) |
Employment Occupations by Sex in Castle Shannon borough
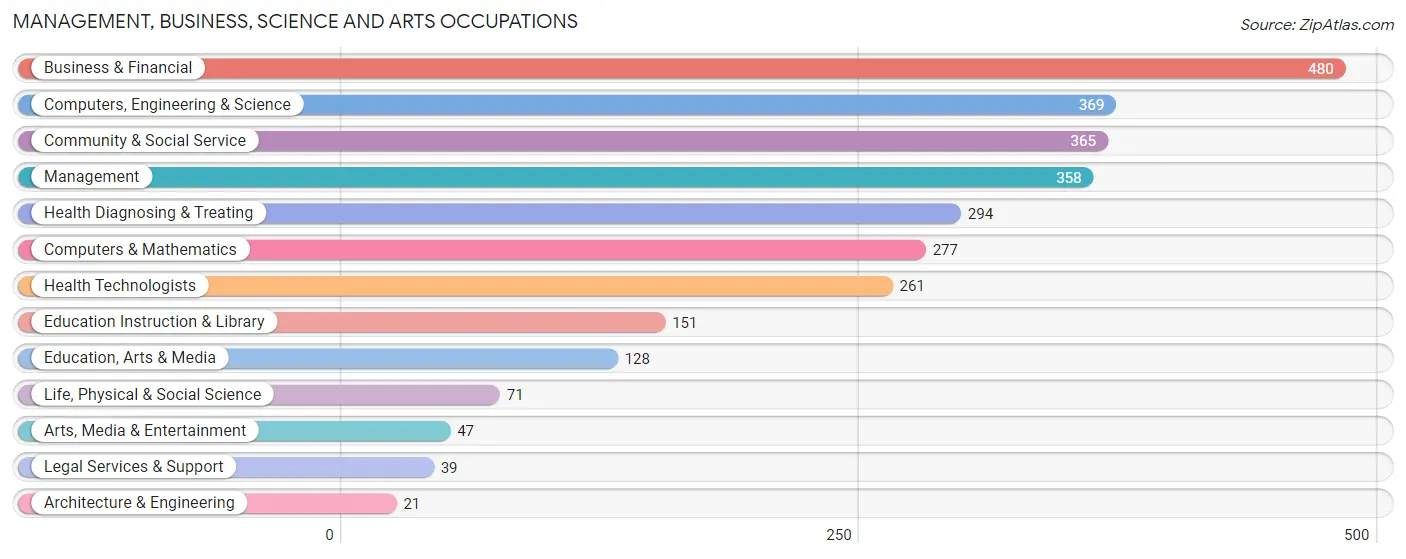
Management, Business, Science and Arts Occupations
The most common Management, Business, Science and Arts occupations in Castle Shannon borough are Business & Financial (480 | 9.6%), Computers, Engineering & Science (369 | 7.4%), Community & Social Service (365 | 7.3%), Management (358 | 7.2%), and Health Diagnosing & Treating (294 | 5.9%).
Management, Business, Science and Arts Occupations by Sex
Within the Management, Business, Science and Arts occupations in Castle Shannon borough, the most male-oriented occupations are Life, Physical & Social Science (100.0%), Computers, Engineering & Science (79.9%), and Computers & Mathematics (79.1%), while the most female-oriented occupations are Health Diagnosing & Treating (86.7%), Health Technologists (85.1%), and Education, Arts & Media (78.9%).
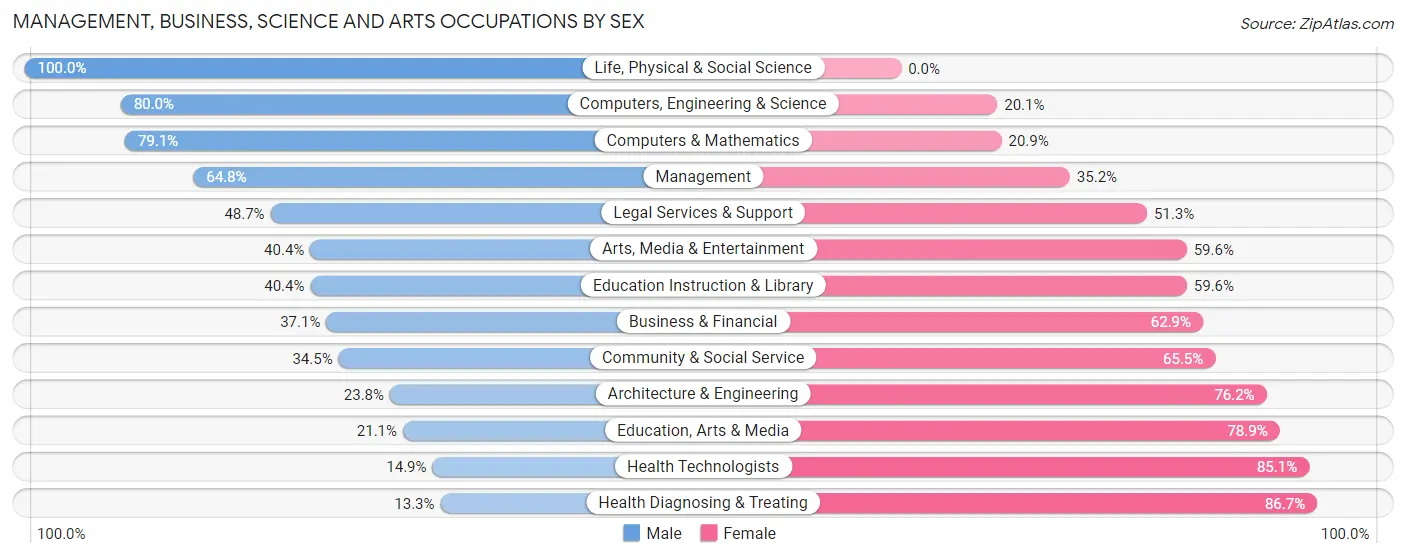
| Occupation | Male | Female |
| Management | 232 (64.8%) | 126 (35.2%) |
| Business & Financial | 178 (37.1%) | 302 (62.9%) |
| Computers, Engineering & Science | 295 (79.9%) | 74 (20.1%) |
| Computers & Mathematics | 219 (79.1%) | 58 (20.9%) |
| Architecture & Engineering | 5 (23.8%) | 16 (76.2%) |
| Life, Physical & Social Science | 71 (100.0%) | 0 (0.0%) |
| Community & Social Service | 126 (34.5%) | 239 (65.5%) |
| Education, Arts & Media | 27 (21.1%) | 101 (78.9%) |
| Legal Services & Support | 19 (48.7%) | 20 (51.3%) |
| Education Instruction & Library | 61 (40.4%) | 90 (59.6%) |
| Arts, Media & Entertainment | 19 (40.4%) | 28 (59.6%) |
| Health Diagnosing & Treating | 39 (13.3%) | 255 (86.7%) |
| Health Technologists | 39 (14.9%) | 222 (85.1%) |
| Total (Category) | 870 (46.6%) | 996 (53.4%) |
| Total (Overall) | 2,558 (51.3%) | 2,428 (48.7%) |
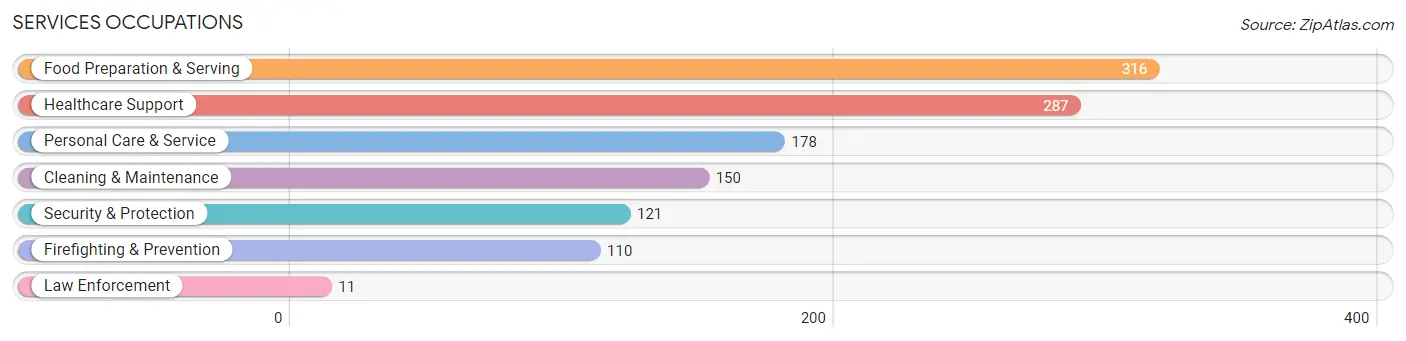
Services Occupations
The most common Services occupations in Castle Shannon borough are Food Preparation & Serving (316 | 6.3%), Healthcare Support (287 | 5.8%), Personal Care & Service (178 | 3.6%), Cleaning & Maintenance (150 | 3.0%), and Security & Protection (121 | 2.4%).
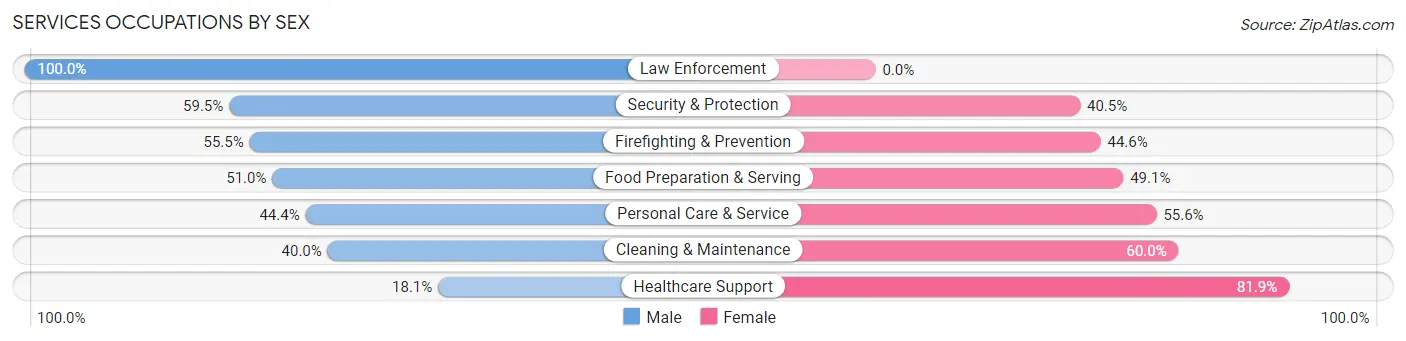
Services Occupations by Sex
Within the Services occupations in Castle Shannon borough, the most male-oriented occupations are Law Enforcement (100.0%), Security & Protection (59.5%), and Firefighting & Prevention (55.4%), while the most female-oriented occupations are Healthcare Support (81.9%), Cleaning & Maintenance (60.0%), and Personal Care & Service (55.6%).
| Occupation | Male | Female |
| Healthcare Support | 52 (18.1%) | 235 (81.9%) |
| Security & Protection | 72 (59.5%) | 49 (40.5%) |
| Firefighting & Prevention | 61 (55.4%) | 49 (44.6%) |
| Law Enforcement | 11 (100.0%) | 0 (0.0%) |
| Food Preparation & Serving | 161 (50.9%) | 155 (49.0%) |
| Cleaning & Maintenance | 60 (40.0%) | 90 (60.0%) |
| Personal Care & Service | 79 (44.4%) | 99 (55.6%) |
| Total (Category) | 424 (40.3%) | 628 (59.7%) |
| Total (Overall) | 2,558 (51.3%) | 2,428 (48.7%) |
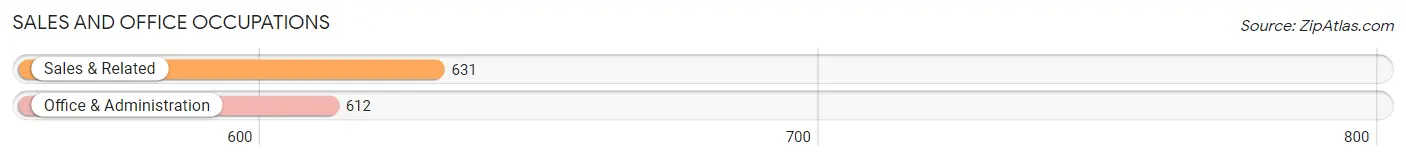
Sales and Office Occupations
The most common Sales and Office occupations in Castle Shannon borough are Sales & Related (631 | 12.7%), and Office & Administration (612 | 12.3%).
Sales and Office Occupations by Sex
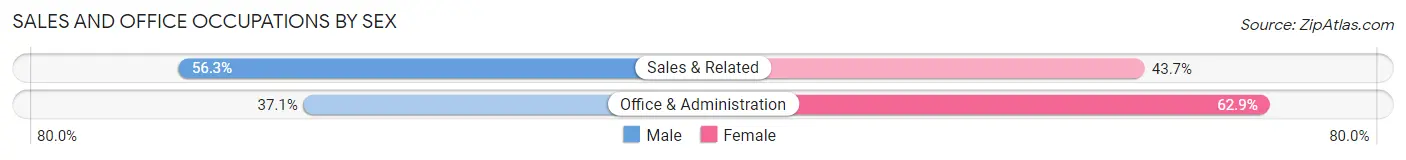
| Occupation | Male | Female |
| Sales & Related | 355 (56.3%) | 276 (43.7%) |
| Office & Administration | 227 (37.1%) | 385 (62.9%) |
| Total (Category) | 582 (46.8%) | 661 (53.2%) |
| Total (Overall) | 2,558 (51.3%) | 2,428 (48.7%) |
Natural Resources, Construction and Maintenance Occupations
The most common Natural Resources, Construction and Maintenance occupations in Castle Shannon borough are Construction & Extraction (171 | 3.4%), Installation, Maintenance & Repair (100 | 2.0%), and Farming, Fishing & Forestry (3 | 0.1%).
Natural Resources, Construction and Maintenance Occupations by Sex
| Occupation | Male | Female |
| Farming, Fishing & Forestry | 3 (100.0%) | 0 (0.0%) |
| Construction & Extraction | 171 (100.0%) | 0 (0.0%) |
| Installation, Maintenance & Repair | 100 (100.0%) | 0 (0.0%) |
| Total (Category) | 274 (100.0%) | 0 (0.0%) |
| Total (Overall) | 2,558 (51.3%) | 2,428 (48.7%) |
Production, Transportation and Moving Occupations
The most common Production, Transportation and Moving occupations in Castle Shannon borough are Production (244 | 4.9%), Material Moving (198 | 4.0%), and Transportation (109 | 2.2%).
Production, Transportation and Moving Occupations by Sex
| Occupation | Male | Female |
| Production | 165 (67.6%) | 79 (32.4%) |
| Transportation | 86 (78.9%) | 23 (21.1%) |
| Material Moving | 157 (79.3%) | 41 (20.7%) |
| Total (Category) | 408 (74.1%) | 143 (26.0%) |
| Total (Overall) | 2,558 (51.3%) | 2,428 (48.7%) |
Employment Industries by Sex in Castle Shannon borough
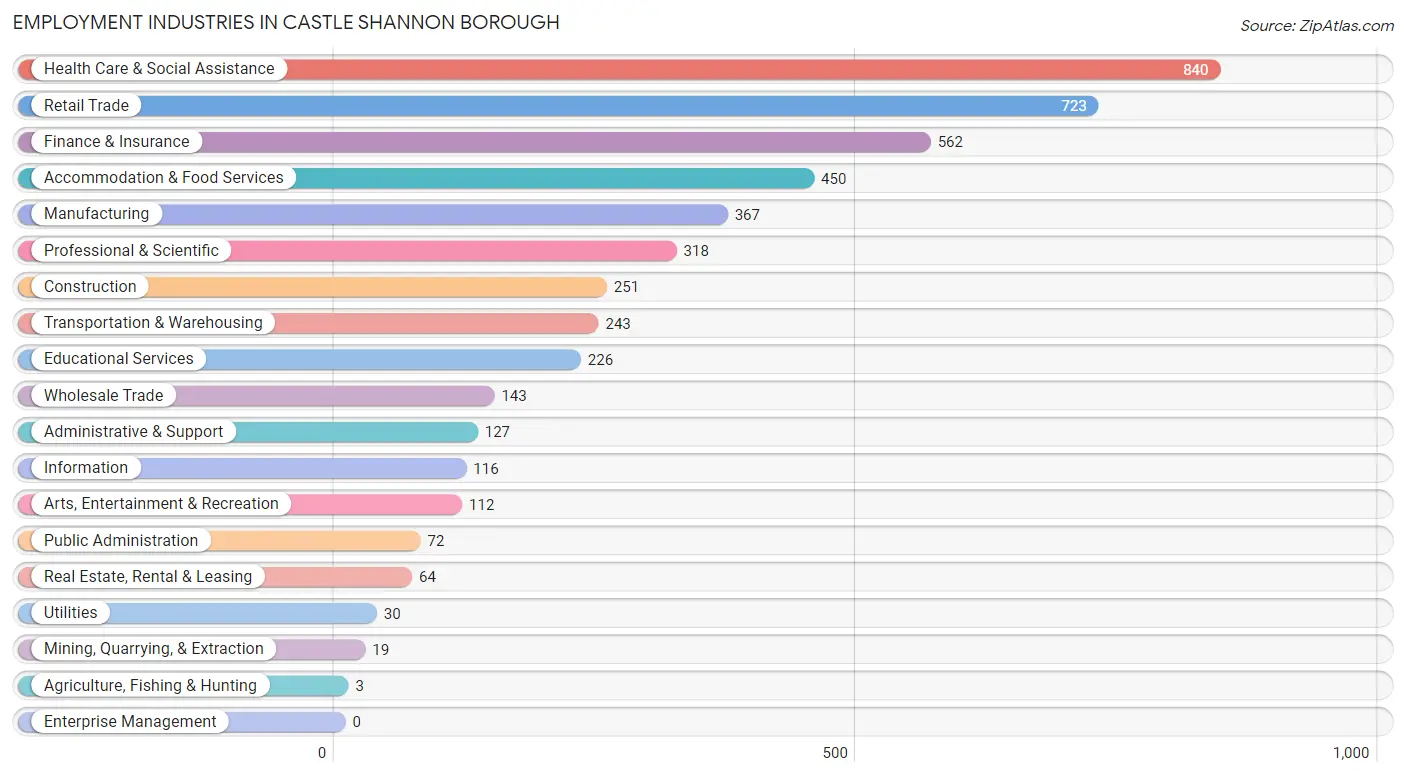
Employment Industries in Castle Shannon borough
The major employment industries in Castle Shannon borough include Health Care & Social Assistance (840 | 16.9%), Retail Trade (723 | 14.5%), Finance & Insurance (562 | 11.3%), Accommodation & Food Services (450 | 9.0%), and Manufacturing (367 | 7.4%).
Employment Industries by Sex in Castle Shannon borough
The Castle Shannon borough industries that see more men than women are Agriculture, Fishing & Hunting (100.0%), Mining, Quarrying, & Extraction (100.0%), and Construction (90.8%), whereas the industries that tend to have a higher number of women are Health Care & Social Assistance (75.6%), Accommodation & Food Services (64.2%), and Educational Services (64.2%).
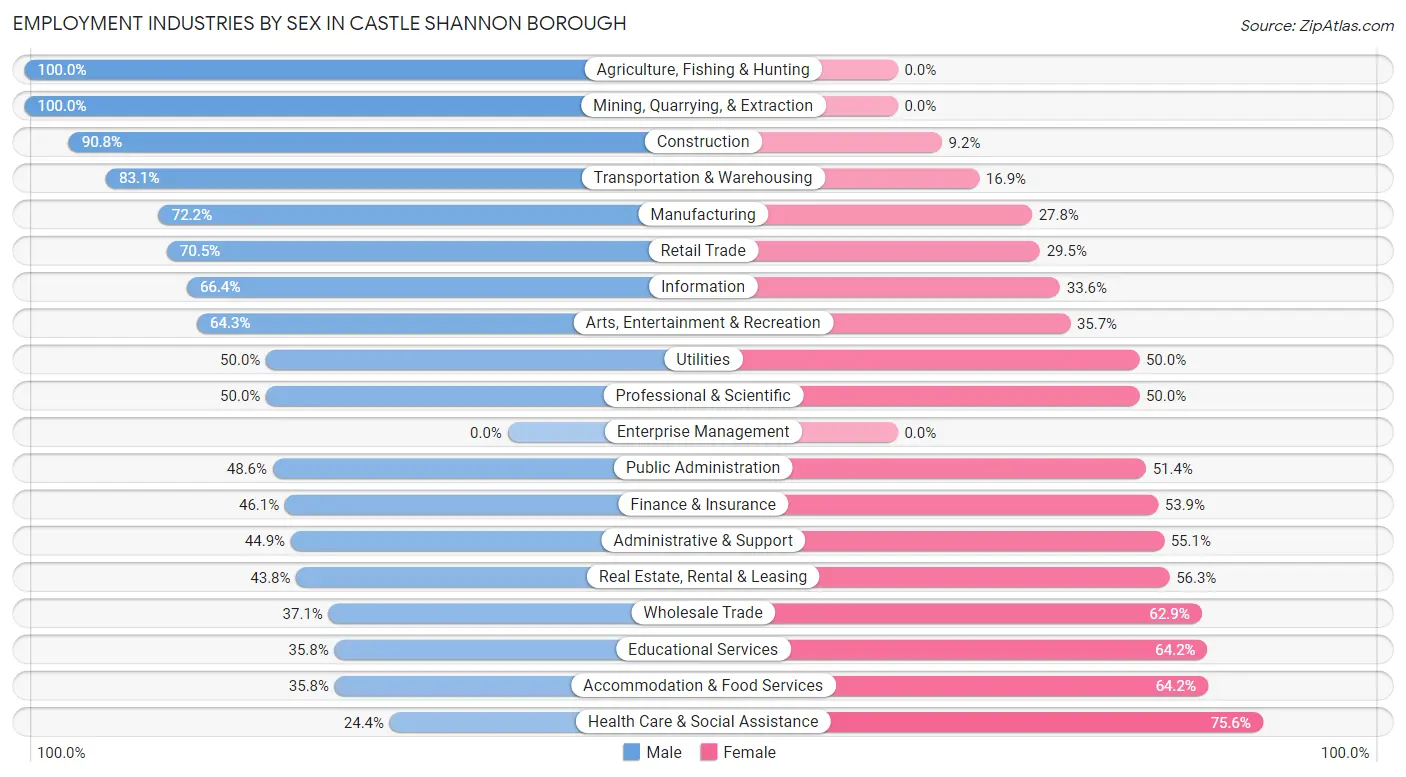
| Industry | Male | Female |
| Agriculture, Fishing & Hunting | 3 (100.0%) | 0 (0.0%) |
| Mining, Quarrying, & Extraction | 19 (100.0%) | 0 (0.0%) |
| Construction | 228 (90.8%) | 23 (9.2%) |
| Manufacturing | 265 (72.2%) | 102 (27.8%) |
| Wholesale Trade | 53 (37.1%) | 90 (62.9%) |
| Retail Trade | 510 (70.5%) | 213 (29.5%) |
| Transportation & Warehousing | 202 (83.1%) | 41 (16.9%) |
| Utilities | 15 (50.0%) | 15 (50.0%) |
| Information | 77 (66.4%) | 39 (33.6%) |
| Finance & Insurance | 259 (46.1%) | 303 (53.9%) |
| Real Estate, Rental & Leasing | 28 (43.8%) | 36 (56.2%) |
| Professional & Scientific | 159 (50.0%) | 159 (50.0%) |
| Enterprise Management | 0 (0.0%) | 0 (0.0%) |
| Administrative & Support | 57 (44.9%) | 70 (55.1%) |
| Educational Services | 81 (35.8%) | 145 (64.2%) |
| Health Care & Social Assistance | 205 (24.4%) | 635 (75.6%) |
| Arts, Entertainment & Recreation | 72 (64.3%) | 40 (35.7%) |
| Accommodation & Food Services | 161 (35.8%) | 289 (64.2%) |
| Public Administration | 35 (48.6%) | 37 (51.4%) |
| Total | 2,558 (51.3%) | 2,428 (48.7%) |
Education in Castle Shannon borough
School Enrollment in Castle Shannon borough
The most common levels of schooling among the 1,443 students in Castle Shannon borough are elementary school (386 | 26.8%), college / undergraduate (369 | 25.6%), and middle school (256 | 17.7%).
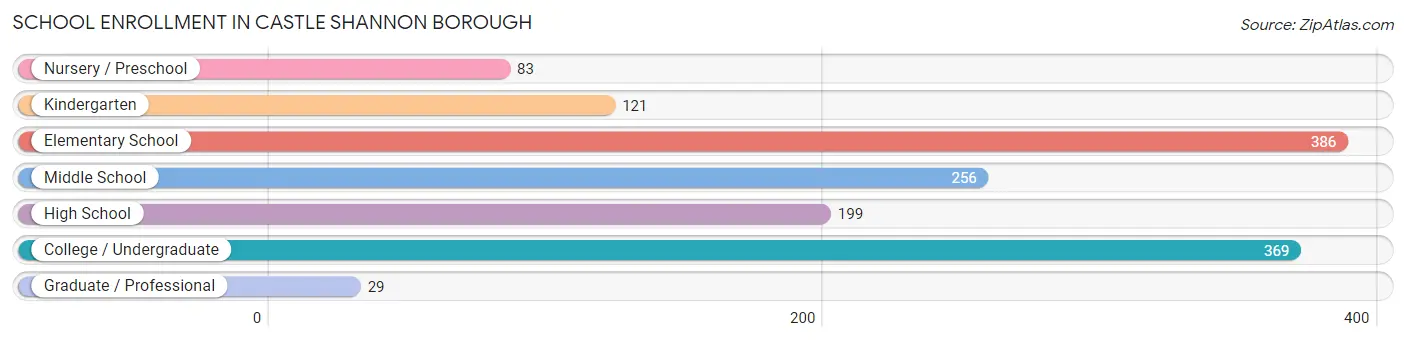
| School Level | # Students | % Students |
| Nursery / Preschool | 83 | 5.8% |
| Kindergarten | 121 | 8.4% |
| Elementary School | 386 | 26.8% |
| Middle School | 256 | 17.7% |
| High School | 199 | 13.8% |
| College / Undergraduate | 369 | 25.6% |
| Graduate / Professional | 29 | 2.0% |
| Total | 1,443 | 100.0% |
School Enrollment by Age by Funding Source in Castle Shannon borough
Out of a total of 1,443 students who are enrolled in schools in Castle Shannon borough, 274 (19.0%) attend a private institution, while the remaining 1,169 (81.0%) are enrolled in public schools. The age group of 3 to 4 year olds has the highest likelihood of being enrolled in private schools, with 51 (77.3% in the age bracket) enrolled. Conversely, the age group of 15 to 17 year olds has the lowest likelihood of being enrolled in a private school, with 80 (100.0% in the age bracket) attending a public institution.
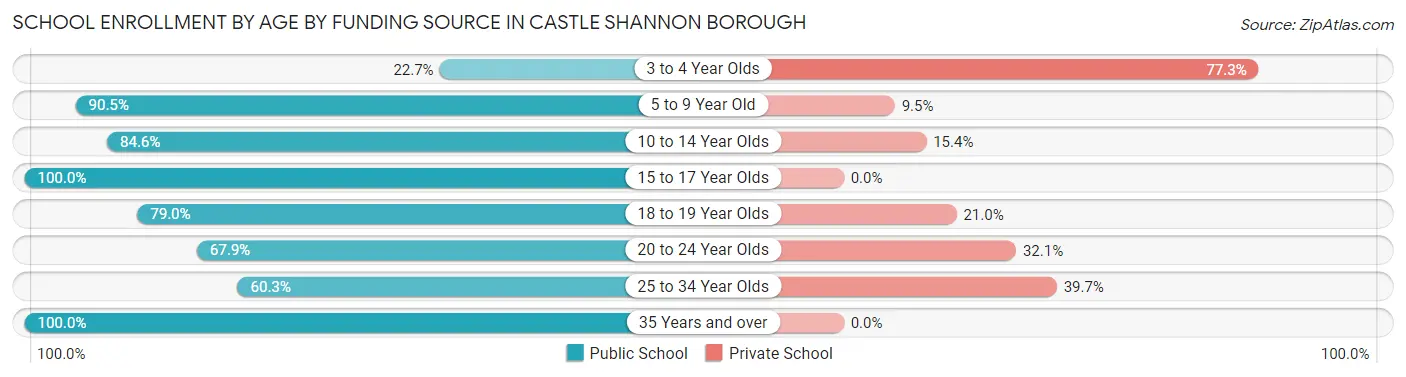
| Age Bracket | Public School | Private School |
| 3 to 4 Year Olds | 15 (22.7%) | 51 (77.3%) |
| 5 to 9 Year Old | 466 (90.5%) | 49 (9.5%) |
| 10 to 14 Year Olds | 264 (84.6%) | 48 (15.4%) |
| 15 to 17 Year Olds | 80 (100.0%) | 0 (0.0%) |
| 18 to 19 Year Olds | 188 (79.0%) | 50 (21.0%) |
| 20 to 24 Year Olds | 55 (67.9%) | 26 (32.1%) |
| 25 to 34 Year Olds | 76 (60.3%) | 50 (39.7%) |
| 35 Years and over | 25 (100.0%) | 0 (0.0%) |
| Total | 1,169 (81.0%) | 274 (19.0%) |
Educational Attainment by Field of Study in Castle Shannon borough
Business (510 | 20.6%), visual & performing arts (251 | 10.1%), communications (224 | 9.0%), science & technology (207 | 8.4%), and engineering (186 | 7.5%) are the most common fields of study among 2,480 individuals in Castle Shannon borough who have obtained a bachelor's degree or higher.

| Field of Study | # Graduates | % Graduates |
| Computers & Mathematics | 158 | 6.4% |
| Bio, Nature & Agricultural | 39 | 1.6% |
| Physical & Health Sciences | 71 | 2.9% |
| Psychology | 61 | 2.5% |
| Social Sciences | 154 | 6.2% |
| Engineering | 186 | 7.5% |
| Multidisciplinary Studies | 0 | 0.0% |
| Science & Technology | 207 | 8.4% |
| Business | 510 | 20.6% |
| Education | 185 | 7.5% |
| Literature & Languages | 149 | 6.0% |
| Liberal Arts & History | 99 | 4.0% |
| Visual & Performing Arts | 251 | 10.1% |
| Communications | 224 | 9.0% |
| Arts & Humanities | 186 | 7.5% |
| Total | 2,480 | 100.0% |
Transportation & Commute in Castle Shannon borough
Vehicle Availability by Sex in Castle Shannon borough
The most prevalent vehicle ownership categories in Castle Shannon borough are males with 2 vehicles (955, accounting for 39.0%) and females with 2 vehicles (900, making up 39.3%).
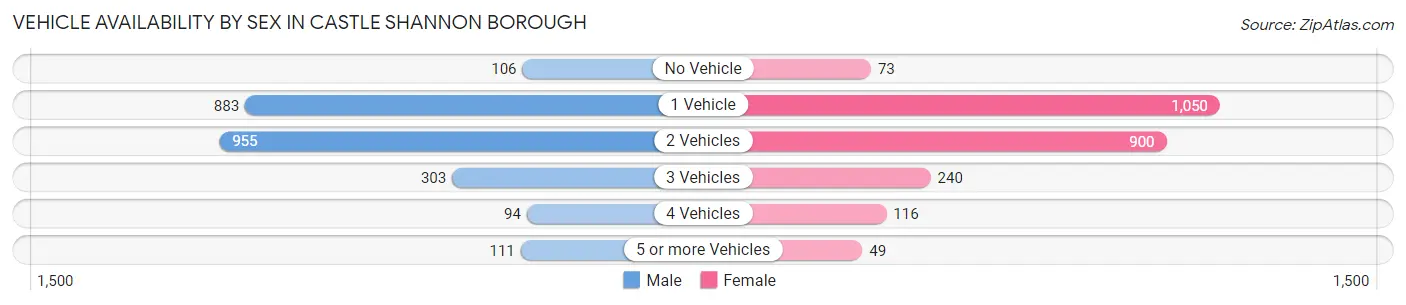
| Vehicles Available | Male | Female |
| No Vehicle | 106 (4.3%) | 73 (3.0%) |
| 1 Vehicle | 883 (36.0%) | 1,050 (43.2%) |
| 2 Vehicles | 955 (39.0%) | 900 (37.1%) |
| 3 Vehicles | 303 (12.4%) | 240 (9.9%) |
| 4 Vehicles | 94 (3.8%) | 116 (4.8%) |
| 5 or more Vehicles | 111 (4.5%) | 49 (2.0%) |
| Total | 2,452 (100.0%) | 2,428 (100.0%) |
Commute Time in Castle Shannon borough
The most frequently occuring commute durations in Castle Shannon borough are 30 to 34 minutes (842 commuters, 19.4%), 15 to 19 minutes (769 commuters, 17.7%), and 20 to 24 minutes (643 commuters, 14.8%).
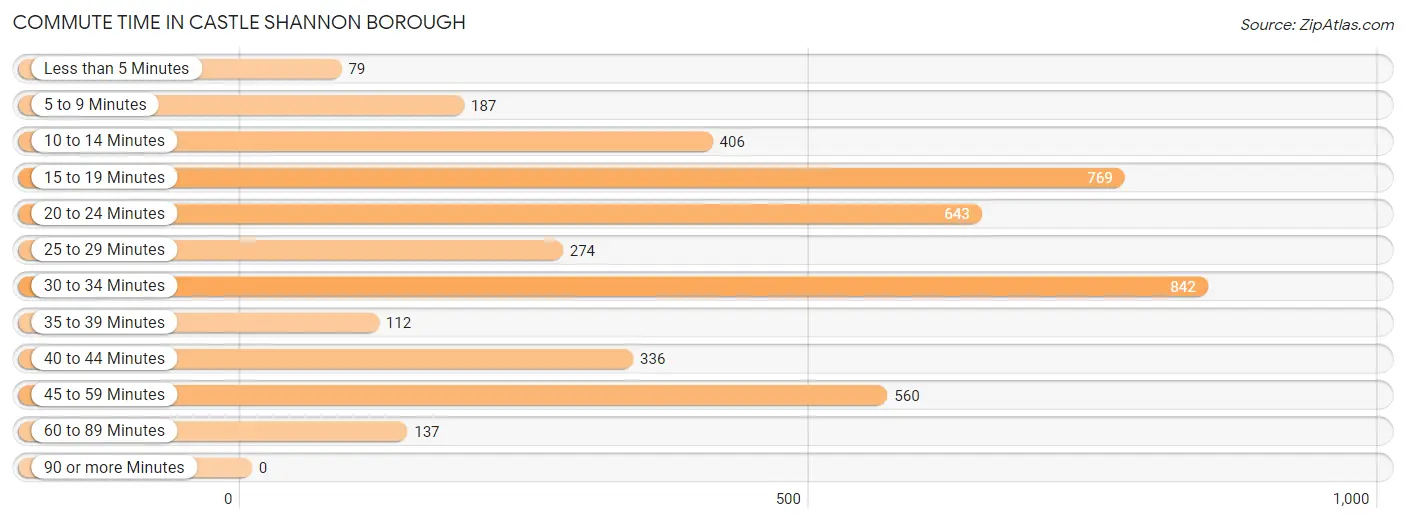
| Commute Time | # Commuters | % Commuters |
| Less than 5 Minutes | 79 | 1.8% |
| 5 to 9 Minutes | 187 | 4.3% |
| 10 to 14 Minutes | 406 | 9.3% |
| 15 to 19 Minutes | 769 | 17.7% |
| 20 to 24 Minutes | 643 | 14.8% |
| 25 to 29 Minutes | 274 | 6.3% |
| 30 to 34 Minutes | 842 | 19.4% |
| 35 to 39 Minutes | 112 | 2.6% |
| 40 to 44 Minutes | 336 | 7.7% |
| 45 to 59 Minutes | 560 | 12.9% |
| 60 to 89 Minutes | 137 | 3.2% |
| 90 or more Minutes | 0 | 0.0% |
Commute Time by Sex in Castle Shannon borough
The most common commute times in Castle Shannon borough are 30 to 34 minutes (440 commuters, 19.7%) for males and 30 to 34 minutes (402 commuters, 19.0%) for females.
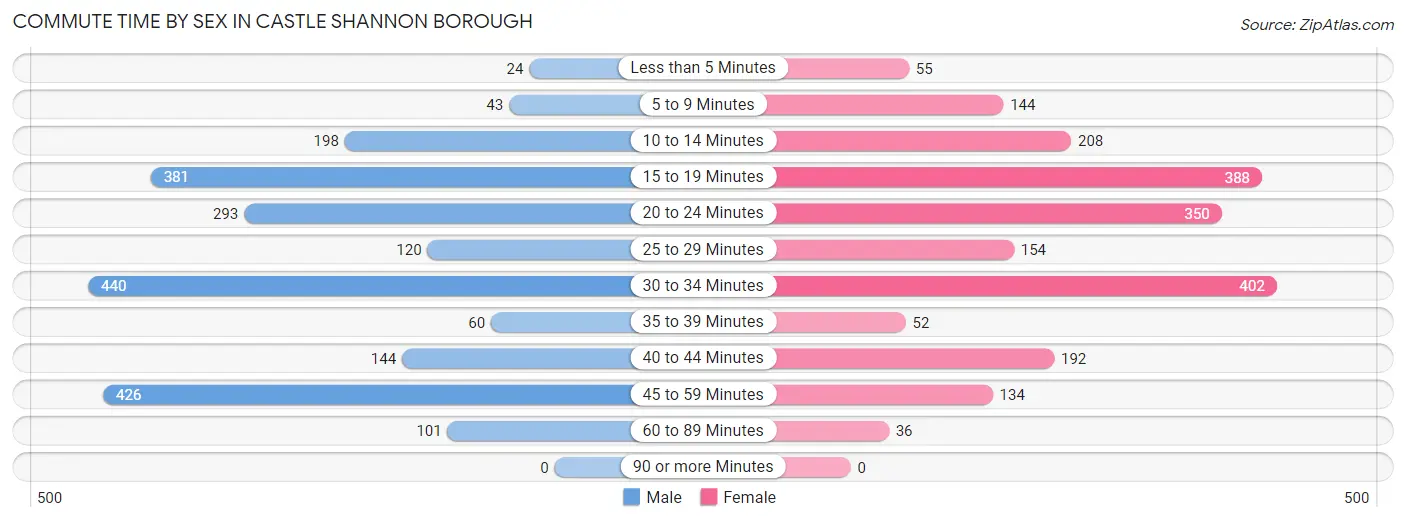
| Commute Time | Male | Female |
| Less than 5 Minutes | 24 (1.1%) | 55 (2.6%) |
| 5 to 9 Minutes | 43 (1.9%) | 144 (6.8%) |
| 10 to 14 Minutes | 198 (8.9%) | 208 (9.8%) |
| 15 to 19 Minutes | 381 (17.1%) | 388 (18.3%) |
| 20 to 24 Minutes | 293 (13.1%) | 350 (16.6%) |
| 25 to 29 Minutes | 120 (5.4%) | 154 (7.3%) |
| 30 to 34 Minutes | 440 (19.7%) | 402 (19.0%) |
| 35 to 39 Minutes | 60 (2.7%) | 52 (2.5%) |
| 40 to 44 Minutes | 144 (6.5%) | 192 (9.1%) |
| 45 to 59 Minutes | 426 (19.1%) | 134 (6.3%) |
| 60 to 89 Minutes | 101 (4.5%) | 36 (1.7%) |
| 90 or more Minutes | 0 (0.0%) | 0 (0.0%) |
Time of Departure to Work by Sex in Castle Shannon borough
The most frequent times of departure to work in Castle Shannon borough are 7:00 AM to 7:29 AM (667, 29.9%) for males and 7:00 AM to 7:29 AM (341, 16.1%) for females.
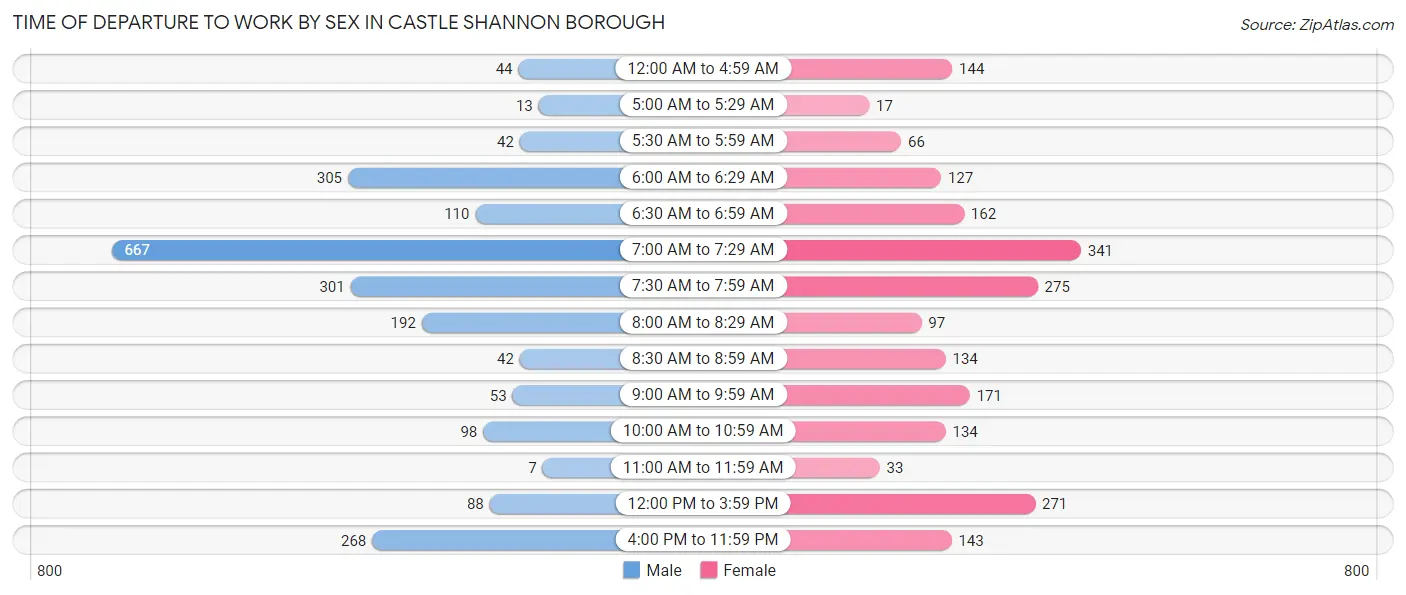
| Time of Departure | Male | Female |
| 12:00 AM to 4:59 AM | 44 (2.0%) | 144 (6.8%) |
| 5:00 AM to 5:29 AM | 13 (0.6%) | 17 (0.8%) |
| 5:30 AM to 5:59 AM | 42 (1.9%) | 66 (3.1%) |
| 6:00 AM to 6:29 AM | 305 (13.7%) | 127 (6.0%) |
| 6:30 AM to 6:59 AM | 110 (4.9%) | 162 (7.7%) |
| 7:00 AM to 7:29 AM | 667 (29.9%) | 341 (16.1%) |
| 7:30 AM to 7:59 AM | 301 (13.5%) | 275 (13.0%) |
| 8:00 AM to 8:29 AM | 192 (8.6%) | 97 (4.6%) |
| 8:30 AM to 8:59 AM | 42 (1.9%) | 134 (6.3%) |
| 9:00 AM to 9:59 AM | 53 (2.4%) | 171 (8.1%) |
| 10:00 AM to 10:59 AM | 98 (4.4%) | 134 (6.3%) |
| 11:00 AM to 11:59 AM | 7 (0.3%) | 33 (1.6%) |
| 12:00 PM to 3:59 PM | 88 (4.0%) | 271 (12.8%) |
| 4:00 PM to 11:59 PM | 268 (12.0%) | 143 (6.8%) |
| Total | 2,230 (100.0%) | 2,115 (100.0%) |
Housing Occupancy in Castle Shannon borough
Occupancy by Ownership in Castle Shannon borough
Of the total 3,767 dwellings in Castle Shannon borough, owner-occupied units account for 2,178 (57.8%), while renter-occupied units make up 1,589 (42.2%).
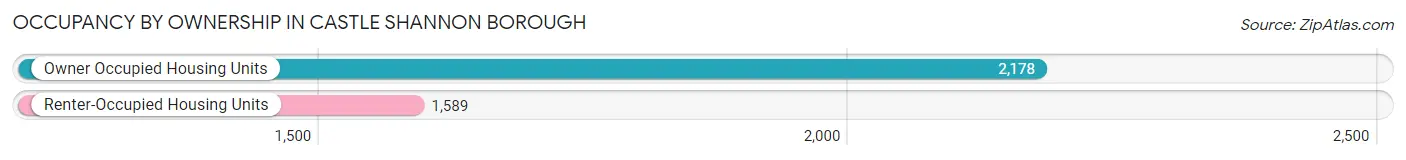
| Occupancy | # Housing Units | % Housing Units |
| Owner Occupied Housing Units | 2,178 | 57.8% |
| Renter-Occupied Housing Units | 1,589 | 42.2% |
| Total Occupied Housing Units | 3,767 | 100.0% |
Occupancy by Household Size in Castle Shannon borough
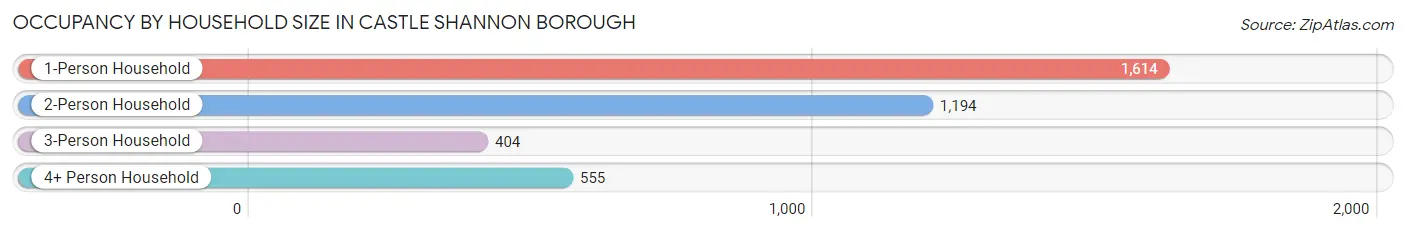
| Household Size | # Housing Units | % Housing Units |
| 1-Person Household | 1,614 | 42.8% |
| 2-Person Household | 1,194 | 31.7% |
| 3-Person Household | 404 | 10.7% |
| 4+ Person Household | 555 | 14.7% |
| Total Housing Units | 3,767 | 100.0% |
Occupancy by Ownership by Household Size in Castle Shannon borough
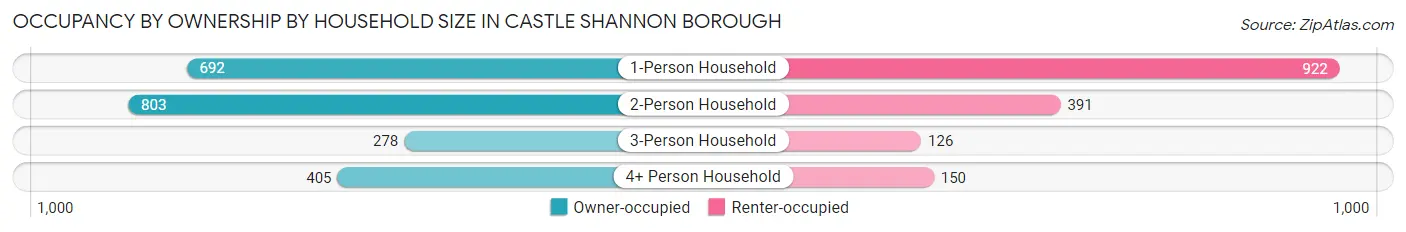
| Household Size | Owner-occupied | Renter-occupied |
| 1-Person Household | 692 (42.9%) | 922 (57.1%) |
| 2-Person Household | 803 (67.2%) | 391 (32.8%) |
| 3-Person Household | 278 (68.8%) | 126 (31.2%) |
| 4+ Person Household | 405 (73.0%) | 150 (27.0%) |
| Total Housing Units | 2,178 (57.8%) | 1,589 (42.2%) |
Occupancy by Educational Attainment in Castle Shannon borough
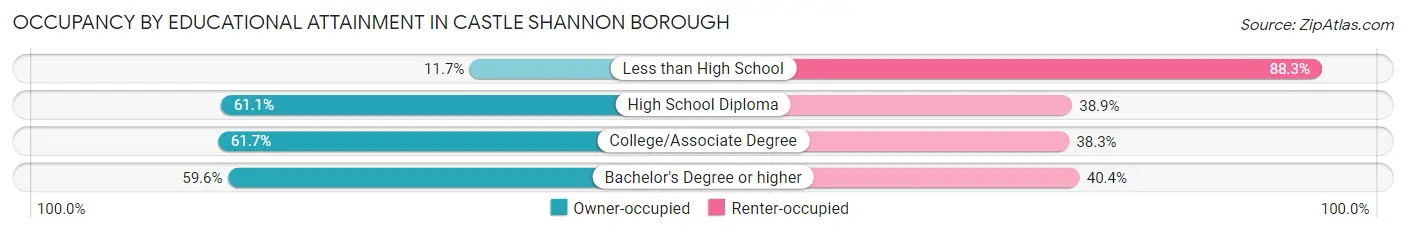
| Household Size | Owner-occupied | Renter-occupied |
| Less than High School | 26 (11.7%) | 197 (88.3%) |
| High School Diploma | 649 (61.1%) | 413 (38.9%) |
| College/Associate Degree | 697 (61.7%) | 433 (38.3%) |
| Bachelor's Degree or higher | 806 (59.6%) | 546 (40.4%) |
Occupancy by Age of Householder in Castle Shannon borough
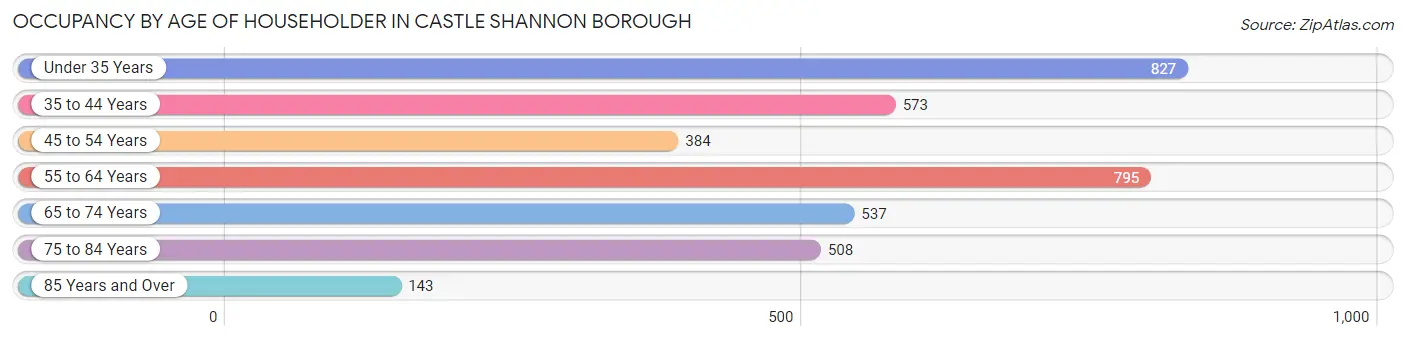
| Age Bracket | # Households | % Households |
| Under 35 Years | 827 | 22.0% |
| 35 to 44 Years | 573 | 15.2% |
| 45 to 54 Years | 384 | 10.2% |
| 55 to 64 Years | 795 | 21.1% |
| 65 to 74 Years | 537 | 14.3% |
| 75 to 84 Years | 508 | 13.5% |
| 85 Years and Over | 143 | 3.8% |
| Total | 3,767 | 100.0% |
Housing Finances in Castle Shannon borough
Median Income by Occupancy in Castle Shannon borough
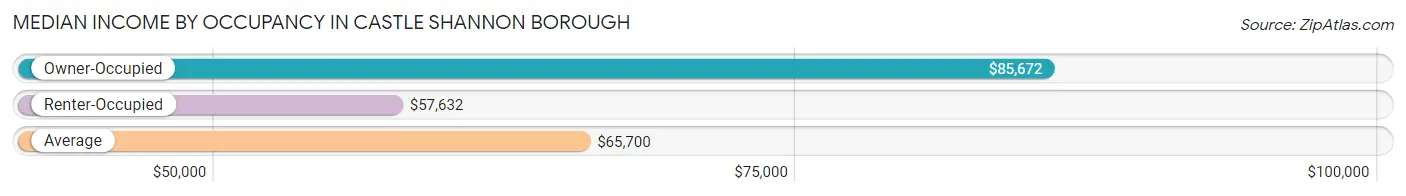
| Occupancy Type | # Households | Median Income |
| Owner-Occupied | 2,178 (57.8%) | $85,672 |
| Renter-Occupied | 1,589 (42.2%) | $57,632 |
| Average | 3,767 (100.0%) | $65,700 |
Occupancy by Householder Income Bracket in Castle Shannon borough
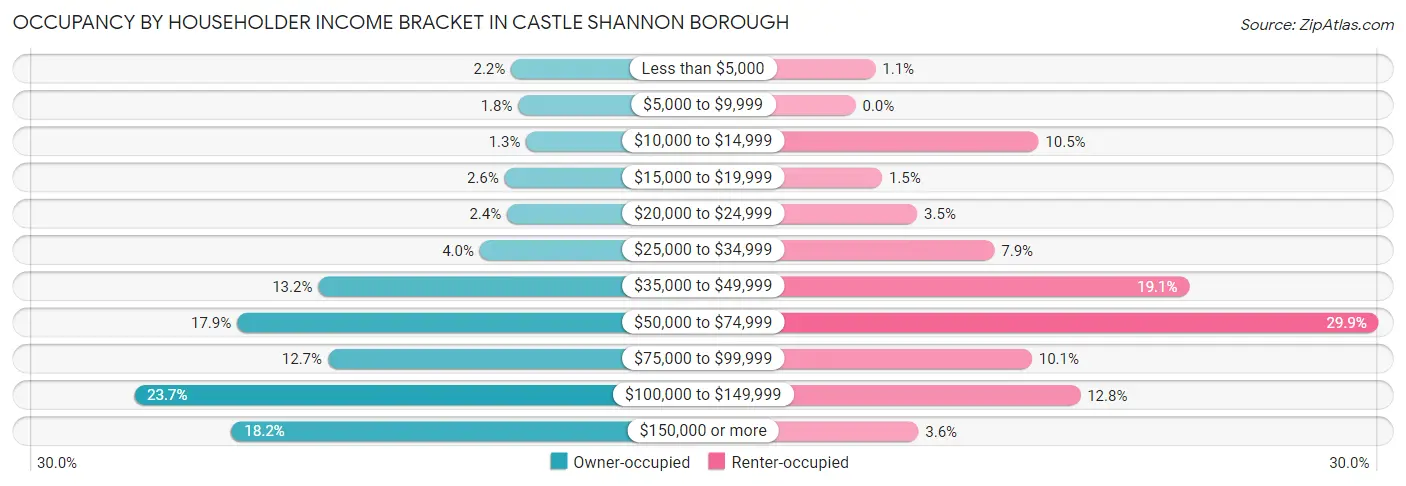
| Income Bracket | Owner-occupied | Renter-occupied |
| Less than $5,000 | 48 (2.2%) | 18 (1.1%) |
| $5,000 to $9,999 | 39 (1.8%) | 0 (0.0%) |
| $10,000 to $14,999 | 29 (1.3%) | 166 (10.4%) |
| $15,000 to $19,999 | 56 (2.6%) | 24 (1.5%) |
| $20,000 to $24,999 | 53 (2.4%) | 56 (3.5%) |
| $25,000 to $34,999 | 87 (4.0%) | 126 (7.9%) |
| $35,000 to $49,999 | 288 (13.2%) | 303 (19.1%) |
| $50,000 to $74,999 | 389 (17.9%) | 475 (29.9%) |
| $75,000 to $99,999 | 276 (12.7%) | 160 (10.1%) |
| $100,000 to $149,999 | 517 (23.7%) | 204 (12.8%) |
| $150,000 or more | 396 (18.2%) | 57 (3.6%) |
| Total | 2,178 (100.0%) | 1,589 (100.0%) |
Monthly Housing Cost Tiers in Castle Shannon borough
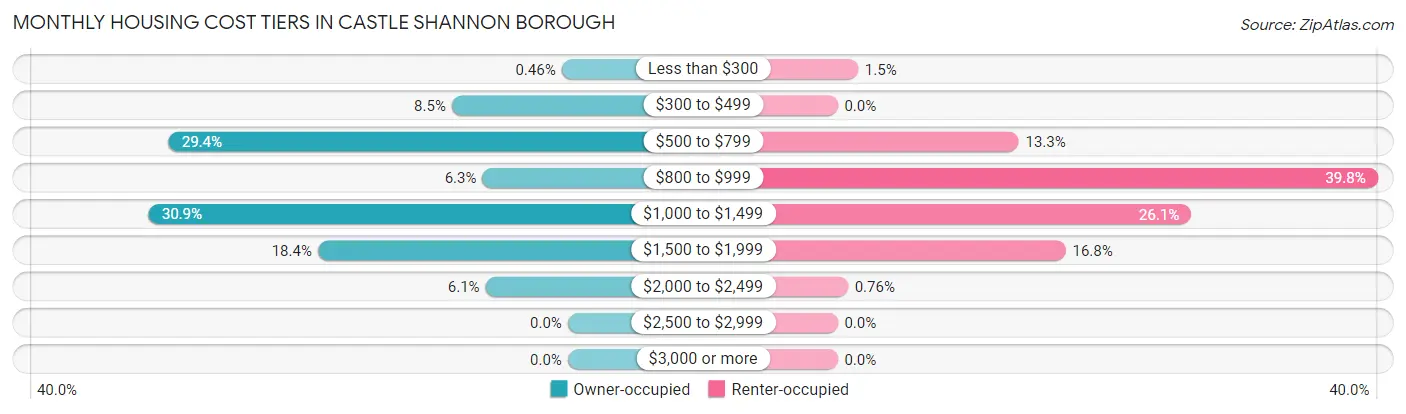
| Monthly Cost | Owner-occupied | Renter-occupied |
| Less than $300 | 10 (0.5%) | 24 (1.5%) |
| $300 to $499 | 186 (8.5%) | 0 (0.0%) |
| $500 to $799 | 640 (29.4%) | 212 (13.3%) |
| $800 to $999 | 137 (6.3%) | 632 (39.8%) |
| $1,000 to $1,499 | 672 (30.8%) | 414 (26.1%) |
| $1,500 to $1,999 | 401 (18.4%) | 267 (16.8%) |
| $2,000 to $2,499 | 132 (6.1%) | 12 (0.8%) |
| $2,500 to $2,999 | 0 (0.0%) | 0 (0.0%) |
| $3,000 or more | 0 (0.0%) | 0 (0.0%) |
| Total | 2,178 (100.0%) | 1,589 (100.0%) |
Physical Housing Characteristics in Castle Shannon borough
Housing Structures in Castle Shannon borough
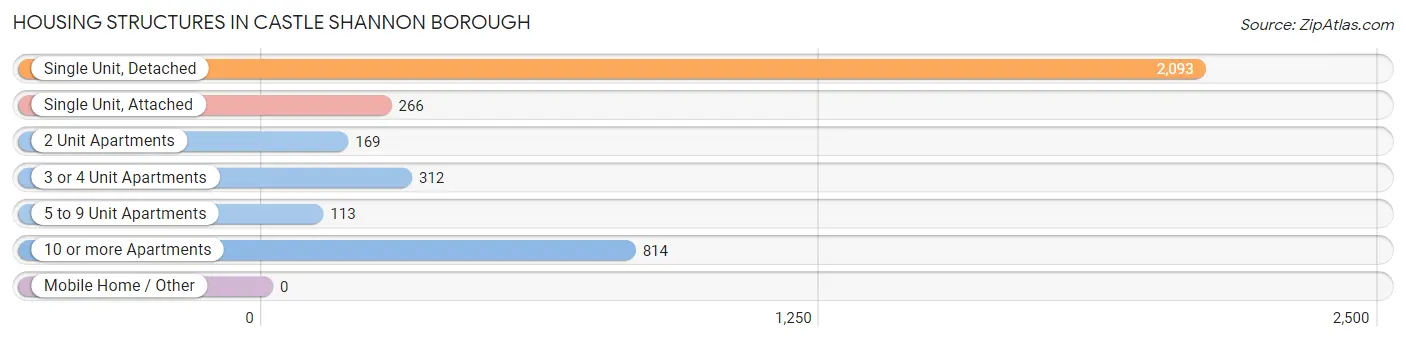
| Structure Type | # Housing Units | % Housing Units |
| Single Unit, Detached | 2,093 | 55.6% |
| Single Unit, Attached | 266 | 7.1% |
| 2 Unit Apartments | 169 | 4.5% |
| 3 or 4 Unit Apartments | 312 | 8.3% |
| 5 to 9 Unit Apartments | 113 | 3.0% |
| 10 or more Apartments | 814 | 21.6% |
| Mobile Home / Other | 0 | 0.0% |
| Total | 3,767 | 100.0% |
Housing Structures by Occupancy in Castle Shannon borough
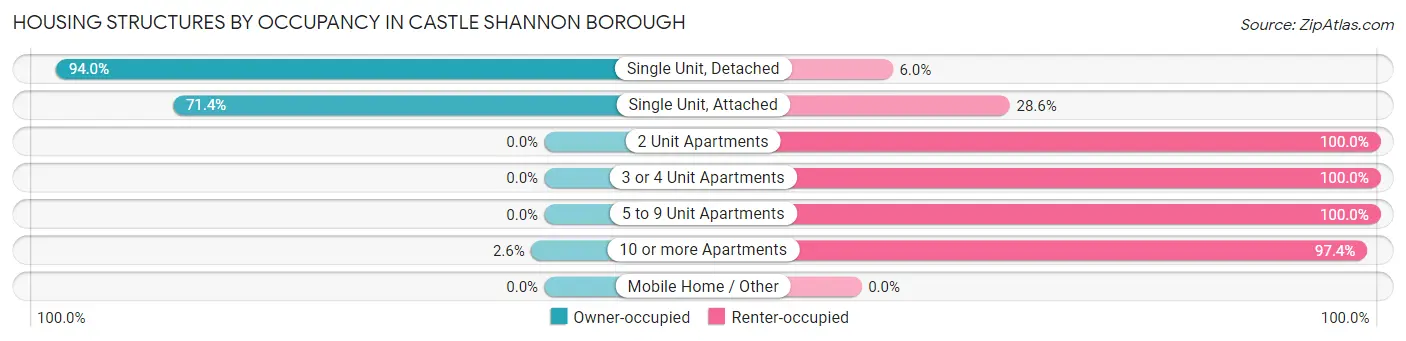
| Structure Type | Owner-occupied | Renter-occupied |
| Single Unit, Detached | 1,967 (94.0%) | 126 (6.0%) |
| Single Unit, Attached | 190 (71.4%) | 76 (28.6%) |
| 2 Unit Apartments | 0 (0.0%) | 169 (100.0%) |
| 3 or 4 Unit Apartments | 0 (0.0%) | 312 (100.0%) |
| 5 to 9 Unit Apartments | 0 (0.0%) | 113 (100.0%) |
| 10 or more Apartments | 21 (2.6%) | 793 (97.4%) |
| Mobile Home / Other | 0 (0.0%) | 0 (0.0%) |
| Total | 2,178 (57.8%) | 1,589 (42.2%) |
Housing Structures by Number of Rooms in Castle Shannon borough
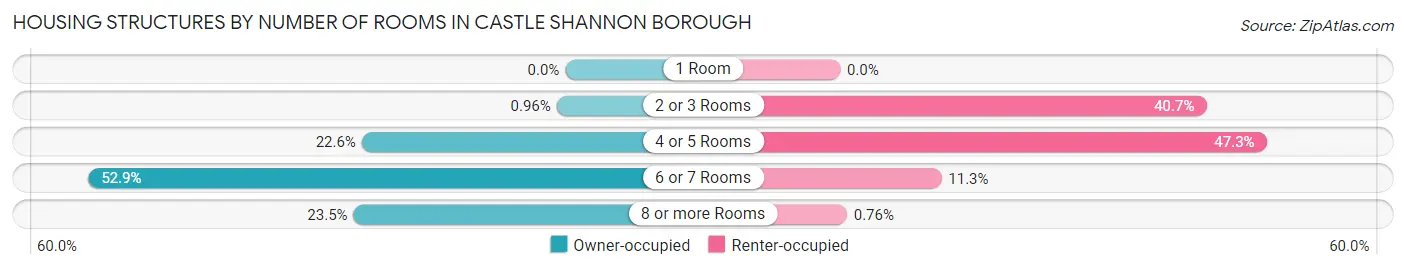
| Number of Rooms | Owner-occupied | Renter-occupied |
| 1 Room | 0 (0.0%) | 0 (0.0%) |
| 2 or 3 Rooms | 21 (1.0%) | 646 (40.6%) |
| 4 or 5 Rooms | 492 (22.6%) | 752 (47.3%) |
| 6 or 7 Rooms | 1,153 (52.9%) | 179 (11.3%) |
| 8 or more Rooms | 512 (23.5%) | 12 (0.8%) |
| Total | 2,178 (100.0%) | 1,589 (100.0%) |
Housing Structure by Heating Type in Castle Shannon borough
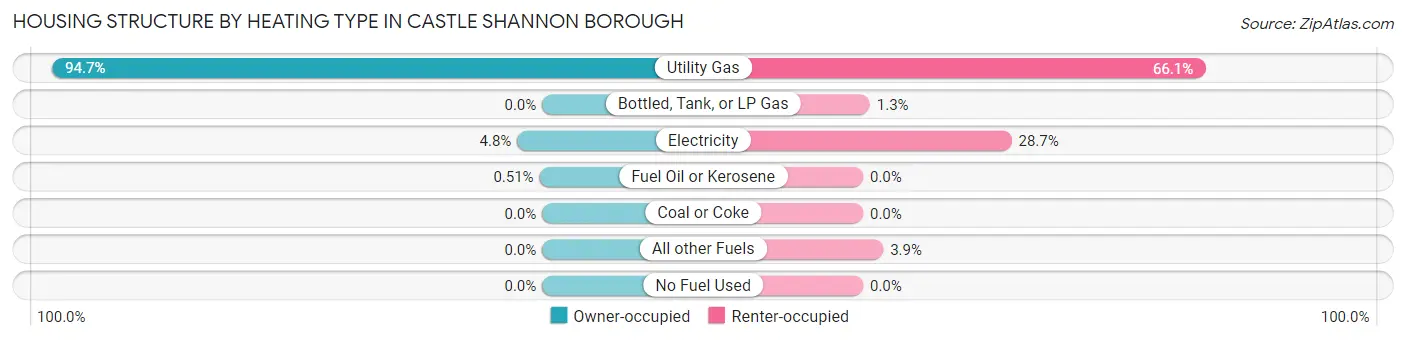
| Heating Type | Owner-occupied | Renter-occupied |
| Utility Gas | 2,062 (94.7%) | 1,050 (66.1%) |
| Bottled, Tank, or LP Gas | 0 (0.0%) | 21 (1.3%) |
| Electricity | 105 (4.8%) | 456 (28.7%) |
| Fuel Oil or Kerosene | 11 (0.5%) | 0 (0.0%) |
| Coal or Coke | 0 (0.0%) | 0 (0.0%) |
| All other Fuels | 0 (0.0%) | 62 (3.9%) |
| No Fuel Used | 0 (0.0%) | 0 (0.0%) |
| Total | 2,178 (100.0%) | 1,589 (100.0%) |
Household Vehicle Usage in Castle Shannon borough
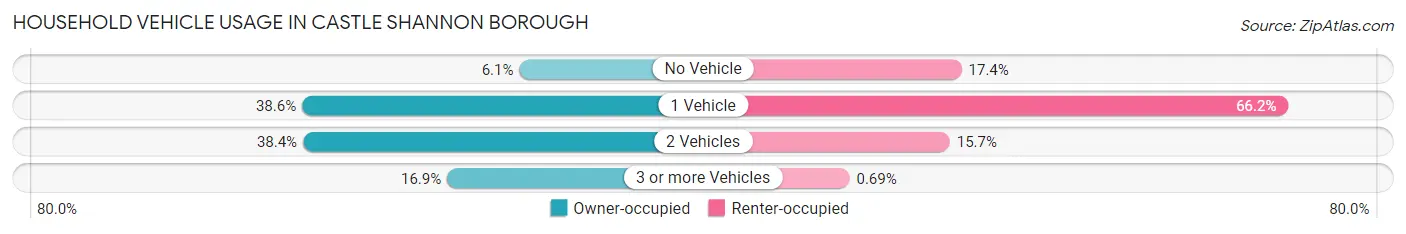
| Vehicles per Household | Owner-occupied | Renter-occupied |
| No Vehicle | 133 (6.1%) | 277 (17.4%) |
| 1 Vehicle | 840 (38.6%) | 1,052 (66.2%) |
| 2 Vehicles | 837 (38.4%) | 249 (15.7%) |
| 3 or more Vehicles | 368 (16.9%) | 11 (0.7%) |
| Total | 2,178 (100.0%) | 1,589 (100.0%) |
Real Estate & Mortgages in Castle Shannon borough
Real Estate and Mortgage Overview in Castle Shannon borough
| Characteristic | Without Mortgage | With Mortgage |
| Housing Units | 872 | 1,306 |
| Median Property Value | $155,200 | $178,400 |
| Median Household Income | $54,013 | $335 |
| Monthly Housing Costs | $626 | $0 |
| Real Estate Taxes | $2,966 | $37 |
Property Value by Mortgage Status in Castle Shannon borough
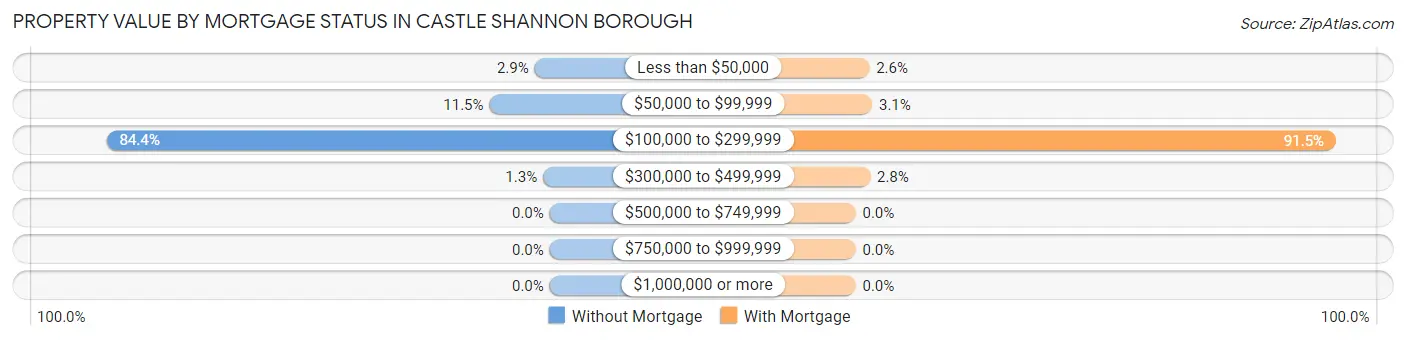
| Property Value | Without Mortgage | With Mortgage |
| Less than $50,000 | 25 (2.9%) | 34 (2.6%) |
| $50,000 to $99,999 | 100 (11.5%) | 41 (3.1%) |
| $100,000 to $299,999 | 736 (84.4%) | 1,195 (91.5%) |
| $300,000 to $499,999 | 11 (1.3%) | 36 (2.8%) |
| $500,000 to $749,999 | 0 (0.0%) | 0 (0.0%) |
| $750,000 to $999,999 | 0 (0.0%) | 0 (0.0%) |
| $1,000,000 or more | 0 (0.0%) | 0 (0.0%) |
| Total | 872 (100.0%) | 1,306 (100.0%) |
Household Income by Mortgage Status in Castle Shannon borough
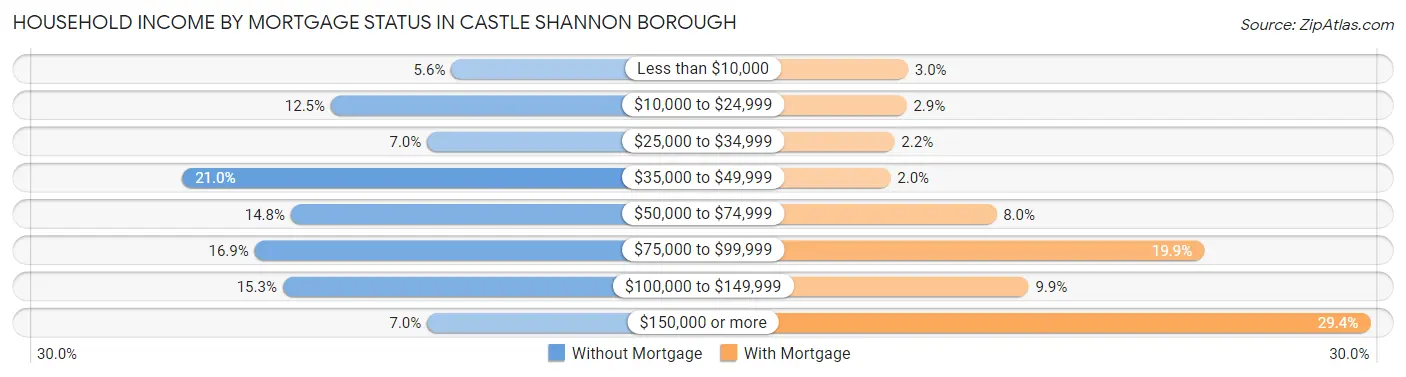
| Household Income | Without Mortgage | With Mortgage |
| Less than $10,000 | 49 (5.6%) | 39 (3.0%) |
| $10,000 to $24,999 | 109 (12.5%) | 38 (2.9%) |
| $25,000 to $34,999 | 61 (7.0%) | 29 (2.2%) |
| $35,000 to $49,999 | 183 (21.0%) | 26 (2.0%) |
| $50,000 to $74,999 | 129 (14.8%) | 105 (8.0%) |
| $75,000 to $99,999 | 147 (16.9%) | 260 (19.9%) |
| $100,000 to $149,999 | 133 (15.2%) | 129 (9.9%) |
| $150,000 or more | 61 (7.0%) | 384 (29.4%) |
| Total | 872 (100.0%) | 1,306 (100.0%) |
Property Value to Household Income Ratio in Castle Shannon borough
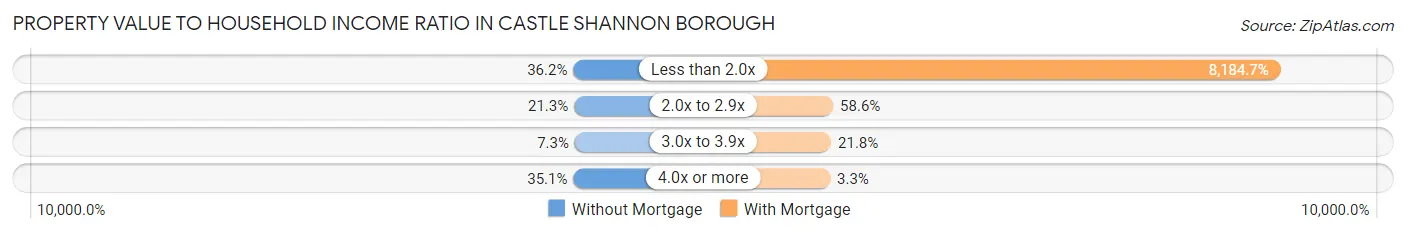
| Value-to-Income Ratio | Without Mortgage | With Mortgage |
| Less than 2.0x | 316 (36.2%) | 106,892 (8,184.7%) |
| 2.0x to 2.9x | 186 (21.3%) | 765 (58.6%) |
| 3.0x to 3.9x | 64 (7.3%) | 285 (21.8%) |
| 4.0x or more | 306 (35.1%) | 43 (3.3%) |
| Total | 872 (100.0%) | 1,306 (100.0%) |
Real Estate Taxes by Mortgage Status in Castle Shannon borough
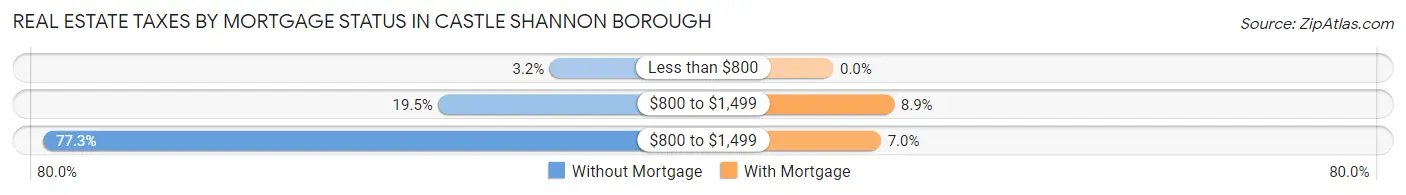
| Property Taxes | Without Mortgage | With Mortgage |
| Less than $800 | 28 (3.2%) | 0 (0.0%) |
| $800 to $1,499 | 170 (19.5%) | 116 (8.9%) |
| $800 to $1,499 | 674 (77.3%) | 91 (7.0%) |
| Total | 872 (100.0%) | 1,306 (100.0%) |
Health & Disability in Castle Shannon borough
Health Insurance Coverage by Age in Castle Shannon borough
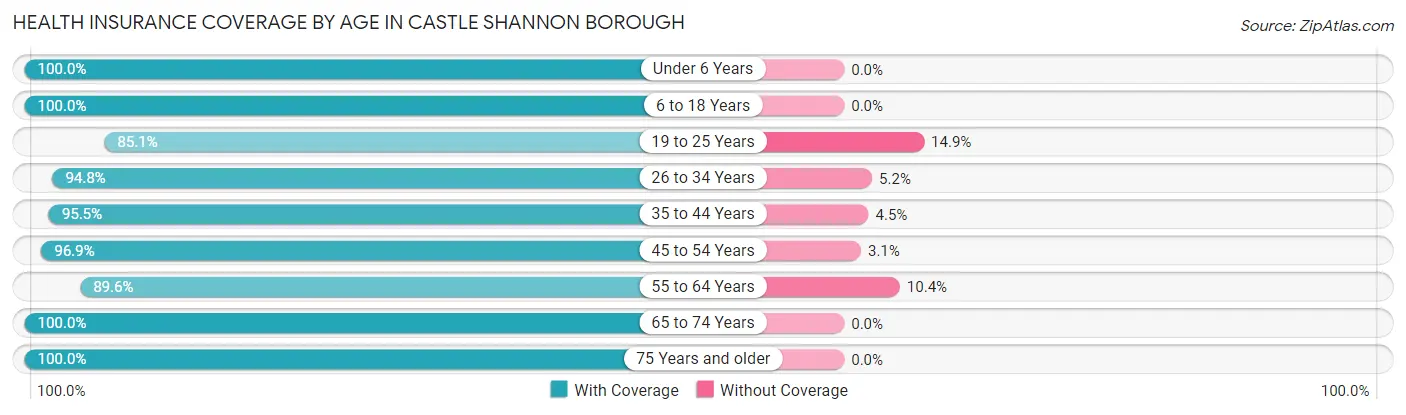
| Age Bracket | With Coverage | Without Coverage |
| Under 6 Years | 382 (100.0%) | 0 (0.0%) |
| 6 to 18 Years | 1,015 (100.0%) | 0 (0.0%) |
| 19 to 25 Years | 623 (85.1%) | 109 (14.9%) |
| 26 to 34 Years | 1,332 (94.8%) | 73 (5.2%) |
| 35 to 44 Years | 1,159 (95.5%) | 55 (4.5%) |
| 45 to 54 Years | 713 (96.9%) | 23 (3.1%) |
| 55 to 64 Years | 1,028 (89.6%) | 119 (10.4%) |
| 65 to 74 Years | 849 (100.0%) | 0 (0.0%) |
| 75 Years and older | 803 (100.0%) | 0 (0.0%) |
| Total | 7,904 (95.4%) | 379 (4.6%) |
Health Insurance Coverage by Citizenship Status in Castle Shannon borough
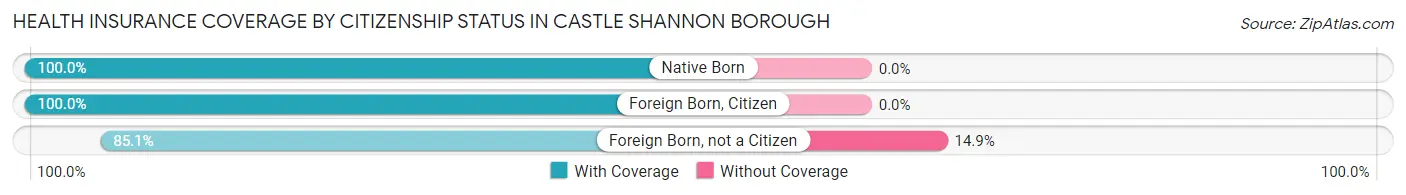
| Citizenship Status | With Coverage | Without Coverage |
| Native Born | 382 (100.0%) | 0 (0.0%) |
| Foreign Born, Citizen | 1,015 (100.0%) | 0 (0.0%) |
| Foreign Born, not a Citizen | 623 (85.1%) | 109 (14.9%) |
Health Insurance Coverage by Household Income in Castle Shannon borough
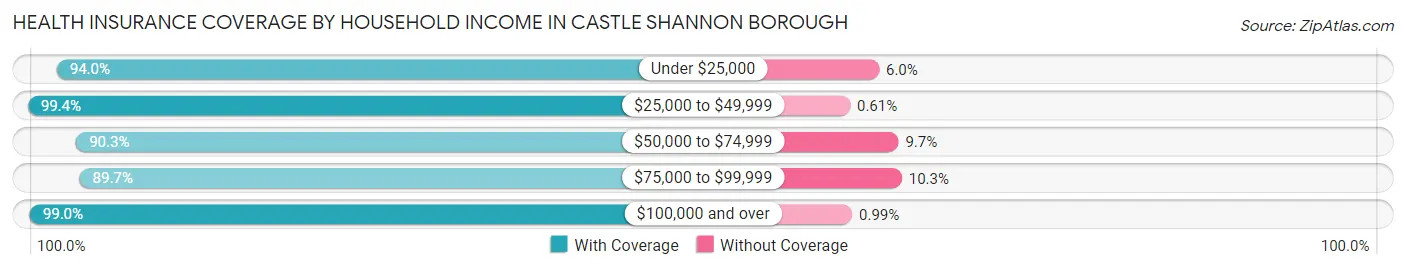
| Household Income | With Coverage | Without Coverage |
| Under $25,000 | 715 (94.0%) | 46 (6.0%) |
| $25,000 to $49,999 | 1,147 (99.4%) | 7 (0.6%) |
| $50,000 to $74,999 | 1,643 (90.3%) | 176 (9.7%) |
| $75,000 to $99,999 | 1,000 (89.7%) | 115 (10.3%) |
| $100,000 and over | 3,384 (99.0%) | 34 (1.0%) |
Public vs Private Health Insurance Coverage by Age in Castle Shannon borough
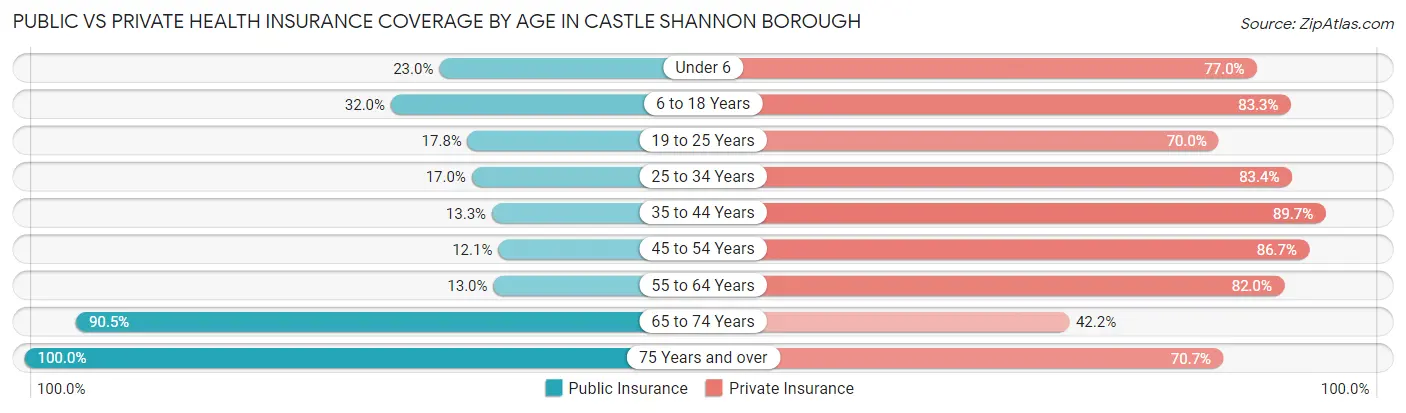
| Age Bracket | Public Insurance | Private Insurance |
| Under 6 | 88 (23.0%) | 294 (77.0%) |
| 6 to 18 Years | 325 (32.0%) | 845 (83.3%) |
| 19 to 25 Years | 130 (17.8%) | 512 (70.0%) |
| 25 to 34 Years | 239 (17.0%) | 1,172 (83.4%) |
| 35 to 44 Years | 161 (13.3%) | 1,089 (89.7%) |
| 45 to 54 Years | 89 (12.1%) | 638 (86.7%) |
| 55 to 64 Years | 149 (13.0%) | 941 (82.0%) |
| 65 to 74 Years | 768 (90.5%) | 358 (42.2%) |
| 75 Years and over | 803 (100.0%) | 568 (70.7%) |
| Total | 2,752 (33.2%) | 6,417 (77.5%) |
Disability Status by Sex by Age in Castle Shannon borough
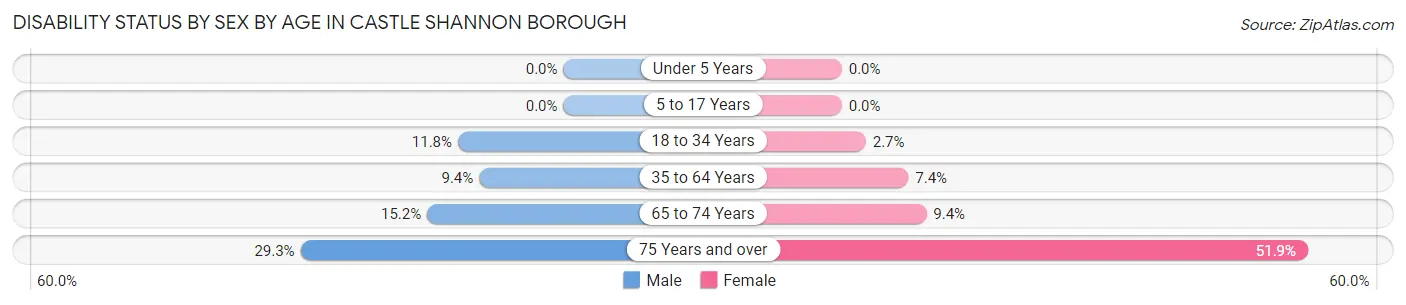
| Age Bracket | Male | Female |
| Under 5 Years | 0 (0.0%) | 0 (0.0%) |
| 5 to 17 Years | 0 (0.0%) | 0 (0.0%) |
| 18 to 34 Years | 126 (11.7%) | 33 (2.7%) |
| 35 to 64 Years | 150 (9.4%) | 111 (7.4%) |
| 65 to 74 Years | 58 (15.2%) | 44 (9.4%) |
| 75 Years and over | 89 (29.3%) | 259 (51.9%) |
Disability Class by Sex by Age in Castle Shannon borough
Disability Class: Hearing Difficulty
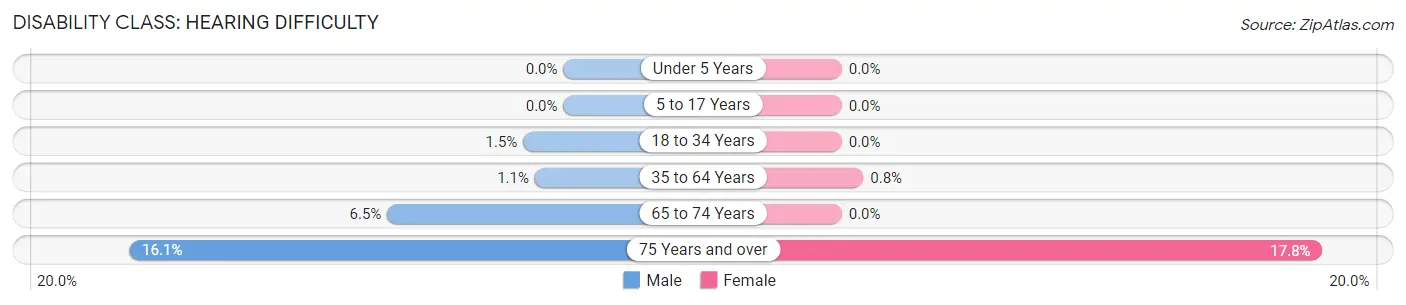
| Age Bracket | Male | Female |
| Under 5 Years | 0 (0.0%) | 0 (0.0%) |
| 5 to 17 Years | 0 (0.0%) | 0 (0.0%) |
| 18 to 34 Years | 16 (1.5%) | 0 (0.0%) |
| 35 to 64 Years | 17 (1.1%) | 12 (0.8%) |
| 65 to 74 Years | 25 (6.5%) | 0 (0.0%) |
| 75 Years and over | 49 (16.1%) | 89 (17.8%) |
Disability Class: Vision Difficulty
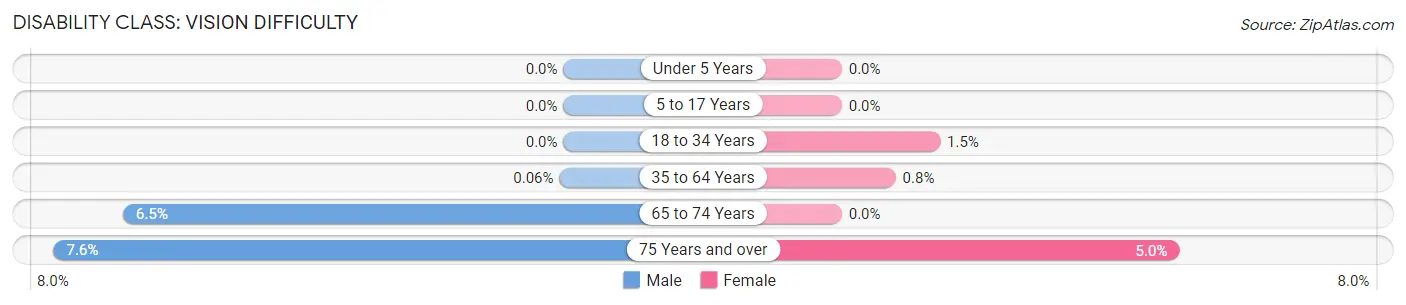
| Age Bracket | Male | Female |
| Under 5 Years | 0 (0.0%) | 0 (0.0%) |
| 5 to 17 Years | 0 (0.0%) | 0 (0.0%) |
| 18 to 34 Years | 0 (0.0%) | 18 (1.5%) |
| 35 to 64 Years | 1 (0.1%) | 12 (0.8%) |
| 65 to 74 Years | 25 (6.5%) | 0 (0.0%) |
| 75 Years and over | 23 (7.6%) | 25 (5.0%) |
Disability Class: Cognitive Difficulty
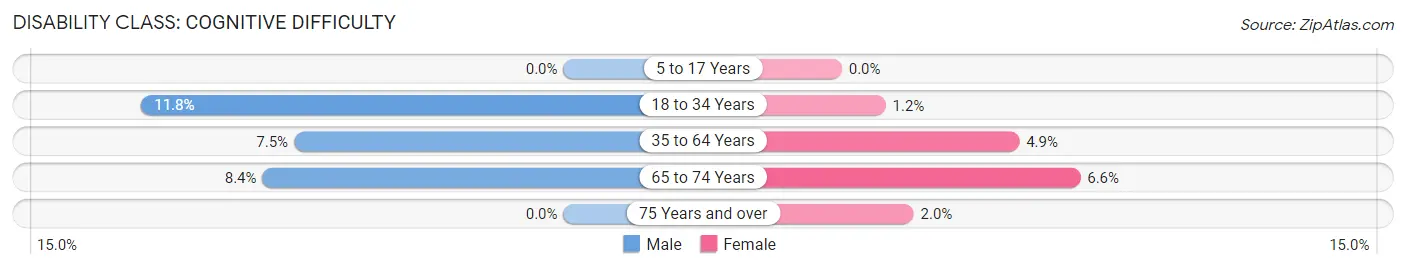
| Age Bracket | Male | Female |
| 5 to 17 Years | 0 (0.0%) | 0 (0.0%) |
| 18 to 34 Years | 126 (11.7%) | 15 (1.2%) |
| 35 to 64 Years | 120 (7.5%) | 74 (4.9%) |
| 65 to 74 Years | 32 (8.4%) | 31 (6.6%) |
| 75 Years and over | 0 (0.0%) | 10 (2.0%) |
Disability Class: Ambulatory Difficulty
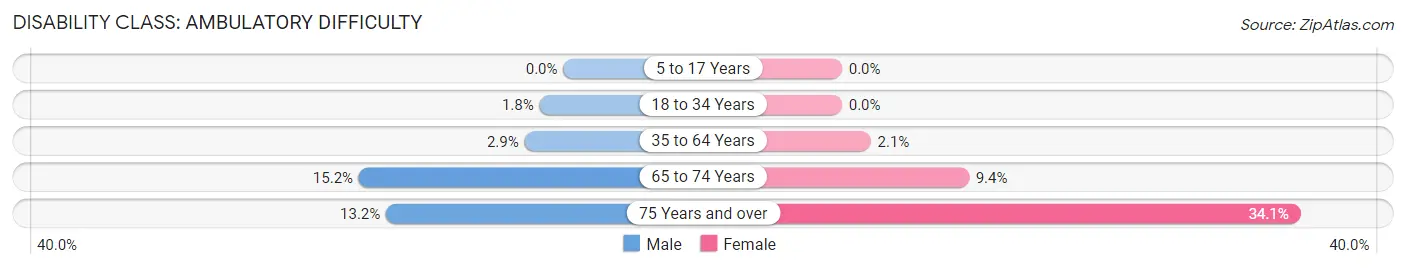
| Age Bracket | Male | Female |
| 5 to 17 Years | 0 (0.0%) | 0 (0.0%) |
| 18 to 34 Years | 19 (1.8%) | 0 (0.0%) |
| 35 to 64 Years | 46 (2.9%) | 32 (2.1%) |
| 65 to 74 Years | 58 (15.2%) | 44 (9.4%) |
| 75 Years and over | 40 (13.2%) | 170 (34.1%) |
Disability Class: Self-Care Difficulty
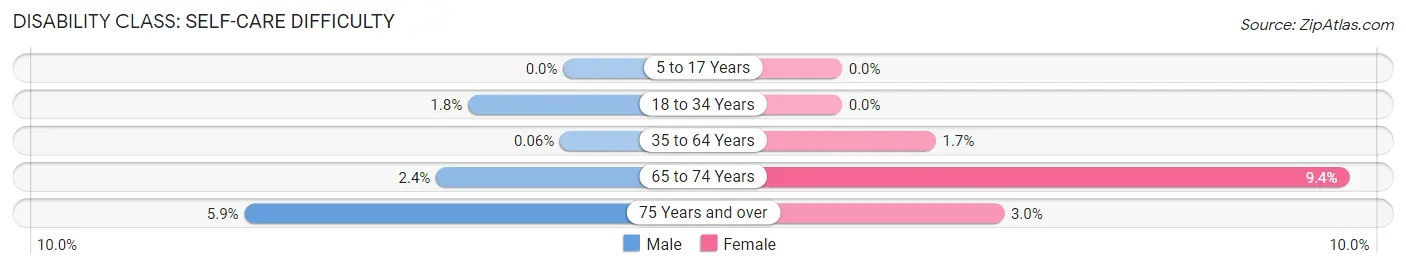
| Age Bracket | Male | Female |
| 5 to 17 Years | 0 (0.0%) | 0 (0.0%) |
| 18 to 34 Years | 19 (1.8%) | 0 (0.0%) |
| 35 to 64 Years | 1 (0.1%) | 26 (1.7%) |
| 65 to 74 Years | 9 (2.4%) | 44 (9.4%) |
| 75 Years and over | 18 (5.9%) | 15 (3.0%) |
Technology Access in Castle Shannon borough
Computing Device Access in Castle Shannon borough
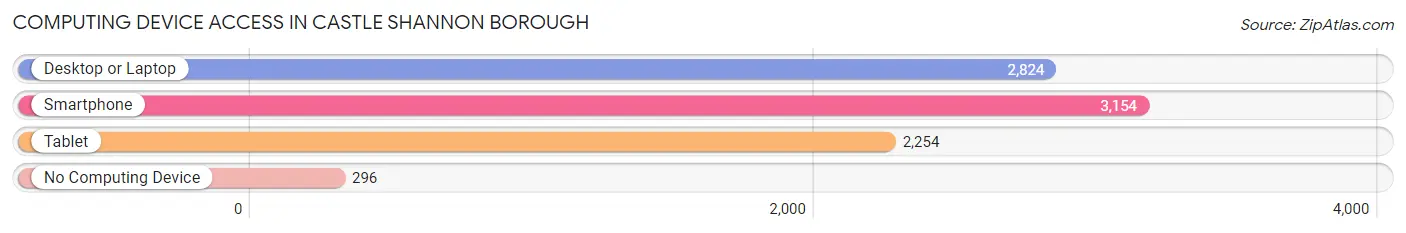
| Device Type | # Households | % Households |
| Desktop or Laptop | 2,824 | 75.0% |
| Smartphone | 3,154 | 83.7% |
| Tablet | 2,254 | 59.8% |
| No Computing Device | 296 | 7.9% |
| Total | 3,767 | 100.0% |
Internet Access in Castle Shannon borough
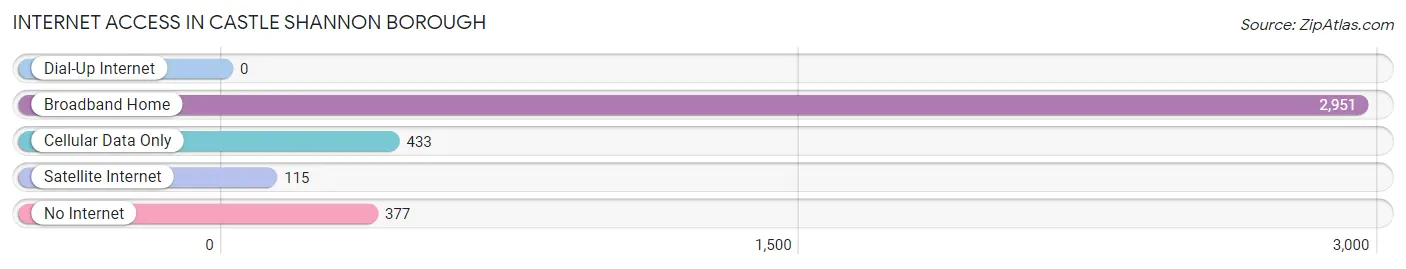
| Internet Type | # Households | % Households |
| Dial-Up Internet | 0 | 0.0% |
| Broadband Home | 2,951 | 78.3% |
| Cellular Data Only | 433 | 11.5% |
| Satellite Internet | 115 | 3.0% |
| No Internet | 377 | 10.0% |
| Total | 3,767 | 100.0% |
Castle Shannon borough Summary
Castle Shannon Borough is a small borough located in Allegheny County, Pennsylvania. It is situated approximately 10 miles south of Pittsburgh and is part of the Pittsburgh metropolitan area. The borough has a population of approximately 8,000 people and covers an area of 1.3 square miles.
History
The area that is now Castle Shannon Borough was originally inhabited by the Lenape Native Americans. The first European settlers arrived in the area in the late 1700s and early 1800s. The area was originally known as “Shannon’s Castle” after the Shannon family, who were among the first settlers. The area was officially incorporated as a borough in 1872.
In the late 1800s and early 1900s, the borough experienced a period of growth and development. The Pittsburgh and Castle Shannon Railroad was built in 1871, connecting the borough to Pittsburgh. This allowed for the development of industry and commerce in the area. The borough also became a popular summer resort destination, with many wealthy Pittsburghers building summer homes in the area.
Geography
Castle Shannon Borough is located in Allegheny County, Pennsylvania. It is situated approximately 10 miles south of Pittsburgh and is part of the Pittsburgh metropolitan area. The borough has a total area of 1.3 square miles, all of which is land. The borough is bordered by Baldwin Township to the north, Bethel Park to the east, Mt. Lebanon to the south, and Dormont to the west.
The borough is located in the Allegheny Plateau region of Pennsylvania. The terrain is generally hilly, with some flat areas. The borough is located in the watershed of the Monongahela River. The borough is also home to several creeks, including Piney Fork, Saw Mill Run, and Little Piney Creek.
Economy
The economy of Castle Shannon Borough is largely based on retail and services. The borough is home to several shopping centers, including the Castle Shannon Shopping Center and the Castle Shannon Plaza. The borough is also home to several restaurants, bars, and other businesses.
The borough is also home to several industrial and manufacturing businesses. The largest employer in the borough is the Castle Shannon Glass Company, which produces glass products for the automotive and construction industries. Other major employers in the borough include the Castle Shannon Tool and Die Company and the Castle Shannon Machine Company.
Demographics
As of the 2010 census, the population of Castle Shannon Borough was 8,316. The racial makeup of the borough was 94.3% White, 2.3% African American, 0.3% Native American, 1.2% Asian, 0.1% Pacific Islander, 0.7% from other races, and 1.2% from two or more races. Hispanic or Latino of any race were 1.9% of the population.
The median household income in the borough was $50,945, and the median family income was $60,917. The per capita income in the borough was $25,945. About 4.3% of families and 5.7% of the population were below the poverty line, including 7.2% of those under age 18 and 4.2% of those age 65 or over.
Common Questions
What is Per Capita Income in Castle Shannon borough?
Per Capita income in Castle Shannon borough is $39,137.
What is the Median Family Income in Castle Shannon borough?
Median Family Income in Castle Shannon borough is $89,974.
What is the Median Household income in Castle Shannon borough?
Median Household Income in Castle Shannon borough is $65,700.
What is Income or Wage Gap in Castle Shannon borough?
Income or Wage Gap in Castle Shannon borough is 24.2%.
Women in Castle Shannon borough earn 75.8 cents for every dollar earned by a man.
What is Inequality or Gini Index in Castle Shannon borough?
Inequality or Gini Index in Castle Shannon borough is 0.38.
What is the Total Population of Castle Shannon borough?
Total Population of Castle Shannon borough is 8,283.
What is the Total Male Population of Castle Shannon borough?
Total Male Population of Castle Shannon borough is 3,986.
What is the Total Female Population of Castle Shannon borough?
Total Female Population of Castle Shannon borough is 4,297.
What is the Ratio of Males per 100 Females in Castle Shannon borough?
There are 92.76 Males per 100 Females in Castle Shannon borough.
What is the Ratio of Females per 100 Males in Castle Shannon borough?
There are 107.80 Females per 100 Males in Castle Shannon borough.
What is the Median Population Age in Castle Shannon borough?
Median Population Age in Castle Shannon borough is 42.0 Years.
What is the Average Family Size in Castle Shannon borough
Average Family Size in Castle Shannon borough is 3.2 People.
What is the Average Household Size in Castle Shannon borough
Average Household Size in Castle Shannon borough is 2.2 People.
How Large is the Labor Force in Castle Shannon borough?
There are 5,059 People in the Labor Forcein in Castle Shannon borough.
What is the Percentage of People in the Labor Force in Castle Shannon borough?
71.1% of People are in the Labor Force in Castle Shannon borough.
What is the Unemployment Rate in Castle Shannon borough?
Unemployment Rate in Castle Shannon borough is 1.4%.